Embed Size (px)
Citation preview

3301 North Mulford Road Rockford, IL 61114
State of Illinois
Community College District 511
Ending 12/31/2009
Rock Valley College
2nd Quarter Financial Report
Including Capital Projects
Prepared by: Cynthia Haggard & staffDirector of Financial Services
Presented by: Sam E. Overton, Jr.Vice President of Administrative Services
Completed report located on the Quarry, under Administrative Services, Administrative Service, Financial Reports
Submitted: January 26, 2010
1 of 19

RVC Board Report dated January 26, 2010Prepared by: Cynthia HaggardPresented by: Sam Overton
Page #Cover Sheet 1Table of Contents 2Comparison 3Analysis 4-5Graphs
Total Operating Revenues & Expenses 6Operating Revenues 7Operating Expenses 8Operating Functional Expenses 9
Quarterly Investments Report 10 - 12Capital Projects Update 13Capital Projects 14Capital Asset Disposals 15Statement of Revenue & Expense by Year by Fund
Table of Contents
2 of 19
State e t o e e ue & pe se by ea by u dFY 2010 Budget 16 - 17FY 2010 2nd Quarter Results 18 - 19
Attachments as of 12/31/09 (Audit Apps/ Datatel)Balance Sheet (1 page)FY 10 Datatel/ICCB Budget (1 page)FY 10 2nd Qtr Actuals, Revenue / Expenditures (1 page)FY 10 2nd Qtr Actuals, ALL Funds - Actual to Budget (12 pages)
2 of 19
RVC Board Report dated January 26, 2010Prepared by: Cynthia HaggardPresented by: Sam Overton
green/go - meeting or exceeding expectationsyellow/caution - may need further actionred/wait - needs attention
Total (ALL Funds excluding 08,09) Target 50%
FY 2007 FY 2008 FY 2009 FY 2010 FY 2010 FYTD %Audited Audited Audited Budget 2nd Qtr FY 2010 Bdgt
Revenue 67,579,160 86,585,396 70,537,959 70,991,114 69,802,115 98%Expense 68,864,703 76,064,654 79,356,266 79,131,334 47,026,225 59%Contingency - - - - - 0%Net (1,285,543) 10,520,742 (8,818,307) (8,140,220) 22,775,890 -280%
Fund Balance 36,141,639 46,662,381 37,844,074 - 60,619,964 Cash 11,196,030 19,160,803 14,147,174 - 39,447,058 Investments 26,384,937 29,620,835 26,878,787 - 24,542,449
Operating (01,02,05,06,11,12)FY 2007 FY 2008 FY 2009 FY 2010 FY 2010 FYTD %Audited Audited Audited Budget 2nd Qtr FY 2010 Bdgt
Revenue 53,583,907 56,100,029 60,490,422 58,634,006 32,219,749 55%Expense 53,159,125 54,957,797 59,953,329 58,630,008 31,615,067 54%Contingency - - - - - 0%Net 424,782 1,142,232 537,093 3,998 604,682 15125%
F d B l 14 528 162 15 670 394 16 207 487 16 812 169
2nd Quarter Results (12/31/09)
Fund Balance 14,528,162 15,670,394 16,207,487 - 16,812,169 Cash 4,324,903 6,216,001 5,527,983 - 7,998,777 Investments 12,099,314 11,778,439 11,975,734 - 10,926,300
Capital (03,04) Note: Fund 08 & 09 removed. Prior years restated for comparison purposesFY 2007 FY 2008 FY 2009 FY 2010 FY 2010 FYTD %Audited Audited Audited Budget 2nd Qtr FY 2010 Bdgt
Revenue 11,524,164 29,522,232 9,632,779 10,762,193 35,935,654 334%Expense 14,107,946 19,431,849 18,154,277 18,941,685 14,473,561 76%Contingency - - - - - 0%Net (2,583,782) 10,090,383 (8,521,498) (8,179,492) 21,462,093 -262%
Fund Balance 13,284,617 23,375,000 14,853,502 - 36,315,595 Cash 6,082,785 12,035,904 7,583,394 - 30,243,492 Investments 6,729,367 11,041,729 8,980,480 - 6,940,300
Trust & Agency (10,30)FY 2007 FY 2008 FY 2009 FY 2010 FY 2010 FYTD %Audited Audited Audited Budget 2nd Qtr FY 2010 Bdgt
Revenue 2,471,089 963,135 414,758 1,594,915 1,646,712 103%Expense 1,597,632 1,675,008 1,248,660 1,559,641 937,597 60%Contingency - - - - - 0%Net 873,457 (711,873) (833,902) 35,274 709,115 2010%
Fund Balance 8,328,860 7,616,987 6,783,085 - 7,492,200 Cash 788,342 908,898 1,035,797 - 1,204,789 Investments 7,556,256 6,800,667 5,922,573 - 6,675,849
3 of 19

RVC Board Report dated January 26, 2010Prepared by: Cynthia HaggardPresented by: Sam Overton
Quarter Summary:YTD Quarter Operating Results comparison are:
1st Qtr 09/30 2nd Qtr 12/31 3rd Qtr 03/31 4th Qtr 06/30 Audited 06/30
FY 07 981,361$ 852,010$ 198,509$ 852,522$ 424,782$
FY 08 (1,033,608) 1,480,597 1,234,617 1,542,720 1,142,232
FY 09 1,560,702 2,085,385 971,206 795,407 537,093
FY 10 1,041,565 604,682 - - -
FY 08 Budget Reclassifications & Corrections
Operating (Funds 01, 02, 05, 06, 11, & 12)Revenues - Exceeding target especially Tuition & Fees & Federal (PELL)
Local Government / Property Tax - Levy Year 2008 EAV growth was 4.72% within the district,Budgeted Levy Year 2009 EAV growth is 4%, then 3% thereafterCPPRT receipts are ($299K) short of budget and expected to fall short in FY 10 ($600K)
State Government / GrantsFY 09 3rd and 4th Qtr payments (total $2,170) have been receivedState 2nd Qtr (12/31/2009) $1 million payment, not yet receivedState apportionment will be less than last year due to a smaller percentage of the same dollarsState apportionment will be less than last year due to a smaller percentage of the same dollars
Federal - consists of student loans, grants and pass-through (see Other Expenditures) over by $2,138k
Tuition & Fees Revenue - over budget by $1,449kCredit Hours are exceeding the FY 10 run rate goal of 168,894 credit hoursSummer II at $560k is included, previously deferred and fees exceeded budget
Investment revenue was short by ($80k); more invested dollars, but at lower rates and expected to fallin FY 10 by ($160k)
Expenditures - exceeding budget in some areas, Financial Aid offset by Federal Revenue
Payroll - under Budget by $362k, Cash basis shows under budget by $447k, Overload due 01/31.
Benefits - over Budget by $1,036k, Cash basis (Claims only) shows over budget by $271kReasons - aggressive budgeted line item
Contractual Services - under budget by $233k, similar to previous years.
Other - tracking with Federal Government Revenue stream over budget by $1,890k
Logical plan to spend down estimated FY 10 Surplus/Contingency, similar to prior years:
FY 2007 Surplus Expenditure list totaled $1.477 millionFY 2008 Surplus Expenditure list totaled $1.330 millionFY 2009 Surplus Expenditure list totaled $1.726 million
4 of 19

RVC Board Report dated January 26, 2010Prepared by: Cynthia HaggardPresented by: Sam Overton
Capital (Funds 03 & 04)PEC Renovation & Addition - Budgeted at $13.0 million, approved by the Board of Trustees
Unforeseen conditions (moisture & sewer pipe) utilized contingency, deleted acoustic alternateCompleting landscaping, punch list and LEED Commissioning
Parking Lot Modifications - construction May 15 through August 15, 2009Parking Lot 2 (WTC/SC/PEC) & Parking Lots 7 & 8 (CLI)
Planning for SCCE Visioning - Phase II - construction June through December 2009Science Labs, Faculty & FSO spaces
Projects (O - Operating; C - Capital)C ERC Lower Level Music renovations - Faculty offices & practice roomsC SCCE Science Labs, Faculty & FSO spacesC Support Services Bldg - Conference Rooms, Public SafetyC SCCE VAV Box Replacement (Summer 2010)
LS Areas of RescueLS Bldg F Siding ReplacementLS Entrance Door SecurityLS Entrance Door SecurityLS Foot Bridge, Dam & Pond Bank Enhancements
Karl J. Jacobs Center for Science and Mathematics - target opening August 2011Approved by ICCB as locally funded capital application 94,000 sq ft $28.6 million estimated cost2009 Bond financing meets desired expectations, with PH&S tax swapBid Documents release date February 5, 2010. Bids due March 5, 2010Based upon bids, recommendations may be forthcoming.
Planning for Arts Instructional Center (AIC), focus groups in Fall 2009State approved 2009 Capital Plan and appropriation bill includes AIC match funding.Updated RAMP document submitted June 2009Requested in 1998, limited by construction growth factors, at $45.4 million estimated costInfrastructure improvements (co-gen electrical capacity, tunnels, IT) to be planned2010 Bond financing meets desired expectations
Action Items: Reconcile Life Safety Projects to fund balance and levy years.
Other (Funds 10 & 30)
Foundation financial performance follows recent positive financial market fluctuations
The College requested $250k Capital Campaign transfer, received $125k in December 2009Major Gifts Initiative Fundraising efforts for JCSM, AIC and Planned Giving
5 of 19

Rock Valley CollegeFinancial Report
Total Operating Revenues and Expenses
GOOD1st Qtr Revenues exceed expectations2nd Qtr Revenues exceed expectations
NOT SO GOOD, BUT OK1st Qtr Expenditures exceed expectations2nd Qtr Expenditures exceed expectations
1st 2nd 3rd 4th
FY 08 Actuals 13,647,487 26,735,528 42,131,492 54,622,923
FY 09 Actuals 16,495,776 29,405,591 44,315,388 58,154,187
FY 10 Budget 14,658,502 29,317,003 43,975,505 58,634,006
FY 10 Actual 18,535,761 32,219,749
‐10,000,000
20,000,000 30,000,000
40,000,000 50,000,000
60,000,000 70,000,000
Total Operating Revenues
60 000 000
70,000,000 Total Operating Expenses
2nd Qtr Expenditures exceed expectations
Surplus by Qtr VERY GOOD:1st Quarter $1,041K Surplus2nd Quarter $605K Surplus
1st 2nd 3rd 4th
FY 08 Actuals 13,647,487 26,735,528 42,131,492 54,622,923
FY 09 Actuals 16,495,776 29,405,591 44,315,388 58,154,187
FY 10 Budget 14,658,502 29,317,003 43,975,505 58,634,006
FY 10 Actual 18,535,761 32,219,749
‐10,000,000
20,000,000 30,000,000
40,000,000 50,000,000
60,000,000
70,000,000 Total Operating Revenues
1st 2nd 3rd 4th
FY 08 Actuals 14,681,095 25,254,931 40,896,875 53,080,203
FY 09 Actuals 14,935,074 27,320,206 43,344,182 57,358,780
FY 10 Budget 14,657,502 29,315,004 43,972,506 58,630,008
FY 10 Actual 17,494,196 31,615,067
‐
10,000,000
20,000,000
30,000,000
40,000,000
50,000,000
60,000,000
70,000,000 Total Operating Expenses
6 of 19

Rock Valley CollegeFinancial Report
Operating Revenues
Includes: Summer II & III and Fall; overbudget by $1,449K Local government revenue exceeds expectation, net over budget $170K
1 2 3 4
FY 08 Actuals 4,733,955 9,495,437 14,291,154 19,882,094
FY 09 Actuals 5,308,073 10,638,700 15,725,932 22,931,065
FY 10 Budget 5,760,103 11,520,207 17,280,310 23,040,413
FY 10 Actuals 5,887,182 11,690,166
-
5,000,000
10,000,000
15,000,000
20,000,000
25,000,000
30,000,000 Local Government Revenues
30,000,000
State Government Revenues30,000,000
Federal Government Revenues
1 2 3 4
FY 08 Actuals 3,461,081 7,260,907 10,037,777 12,303,730
FY 09 Actuals 4,207,124 7,435,290 10,434,652 14,576,099
FY 10 Budget 3,521,786 7,043,572 10,565,358 14,087,144
FY 10 Actual 4,998,269 8,492,633
-
5,000,000
10,000,000
15,000,000
20,000,000
25,000,000
30,000,000 Tuition & Fees Revenues
Over budget by $1.4 million (See Operating Other Expenses) Under budget by $50k
1 2 3 4
FY 08 Actuals 4,733,955 9,495,437 14,291,154 19,882,094
FY 09 Actuals 5,308,073 10,638,700 15,725,932 22,931,065
FY 10 Budget 5,760,103 11,520,207 17,280,310 23,040,413
FY 10 Actuals 5,887,182 11,690,166
-
5,000,000
10,000,000
15,000,000
20,000,000
25,000,000
30,000,000 Local Government Revenues
1 2 3 4
FY 08 Actuals 1,429,789 4,857,524 7,504,895 9,687,027
FY 09 Actuals 2,642,931 5,003,926 6,819,823 7,194,034
FY 10 Budget 2,109,471 4,218,942 6,328,412 8,437,883
FY 10 Actuals 2,292,906 4,169,106
-
5,000,000
10,000,000
15,000,000
20,000,000
25,000,000
30,000,000
State Government Revenues
1 2 3 4
FY 08 Actuals 3,070,585 3,557,676 7,642,164 8,883,298
FY 09 Actuals 3,511,927 4,746,331 8,805,859 10,222,532
FY 10 Budget 2,421,882 4,843,763 7,265,645 9,687,526
FY 10 Actuals 4,605,028 6,247,764
-
5,000,000
10,000,000
15,000,000
20,000,000
25,000,000
30,000,000 Federal Government Revenues
1 2 3 4
FY 08 Actuals 3,461,081 7,260,907 10,037,777 12,303,730
FY 09 Actuals 4,207,124 7,435,290 10,434,652 14,576,099
FY 10 Budget 3,521,786 7,043,572 10,565,358 14,087,144
FY 10 Actual 4,998,269 8,492,633
-
5,000,000
10,000,000
15,000,000
20,000,000
25,000,000
30,000,000 Tuition & Fees Revenues
7 of 19

Rock Valley CollegeFinancial Report
Operational Expenses
Accrual basis under by $362k, Cash basis under budget $447K Accrual basis over budget by $1.0 million, Cash basis Claims over by $271K
1 2 3 4
FY 08 Actuals 6,496,351 12,956,330 20,354,095 26,505,743
FY 09 Actuals 5,934,028 13,429,412 21,457,621 28,018,540
FY 10 Budget 7,467,370 14,934,740 22,402,109 29,869,479
FY 10 Actuals 6,641,624 14,572,643
-
5,000,000
10,000,000
15,000,000
20,000,000
25,000,000
30,000,000 Operating Salaries Expenses
1 2 3 4
FY 08 Actuals 1,377,964 3,027,794 4,719,018 6,279,936
FY 09 Actuals 1,692,295 2,786,198 4,177,239 6,006,575
FY 10 Budget 1,711,808 3,423,616 5,135,424 6,847,232
FY 10 Actuals 2,402,468 4,459,903
-
5,000,000
10,000,000
15,000,000
20,000,000
25,000,000
30,000,000 Operating Benefits Expenses
30,000,000 Operating Contractual Expenses
30,000,000 Operating Other Expenses
Under budget $233K Over budget by $1.9 million (see Federal Government Revenue)
1 2 3 4
FY 08 Actuals 6,496,351 12,956,330 20,354,095 26,505,743
FY 09 Actuals 5,934,028 13,429,412 21,457,621 28,018,540
FY 10 Budget 7,467,370 14,934,740 22,402,109 29,869,479
FY 10 Actuals 6,641,624 14,572,643
-
5,000,000
10,000,000
15,000,000
20,000,000
25,000,000
30,000,000 Operating Salaries Expenses
1 2 3 4
FY 08 Actuals 1,377,964 3,027,794 4,719,018 6,279,936
FY 09 Actuals 1,692,295 2,786,198 4,177,239 6,006,575
FY 10 Budget 1,711,808 3,423,616 5,135,424 6,847,232
FY 10 Actuals 2,402,468 4,459,903
-
5,000,000
10,000,000
15,000,000
20,000,000
25,000,000
30,000,000 Operating Benefits Expenses
1 2 3 4
FY 08 Actuals 1,182,552 1,877,774 2,621,875 3,445,395
FY 09 Actuals 1,220,472 2,024,266 2,866,867 4,058,539
FY 10 Budget 984,788 1,969,577 2,954,365 3,939,153
FY 10 Actuals 1,213,628 1,736,868
-
5,000,000
10,000,000
15,000,000
20,000,000
25,000,000
30,000,000 Operating Contractual Expenses
1 2 3 4
FY 08 Actuals 3,460,748 3,664,413 7,790,332 8,529,174
FY 09 Actuals 4,017,140 5,376,974 9,248,982 10,326,368
FY 10 Budget 2,517,375 5,034,750 7,552,124 10,069,499
FY 10 Actuals 5,076,646 6,924,534
-
5,000,000
10,000,000
15,000,000
20,000,000
25,000,000
30,000,000 Operating Other Expenses
8 of 19
Rock Valley CollegeFinancial Report
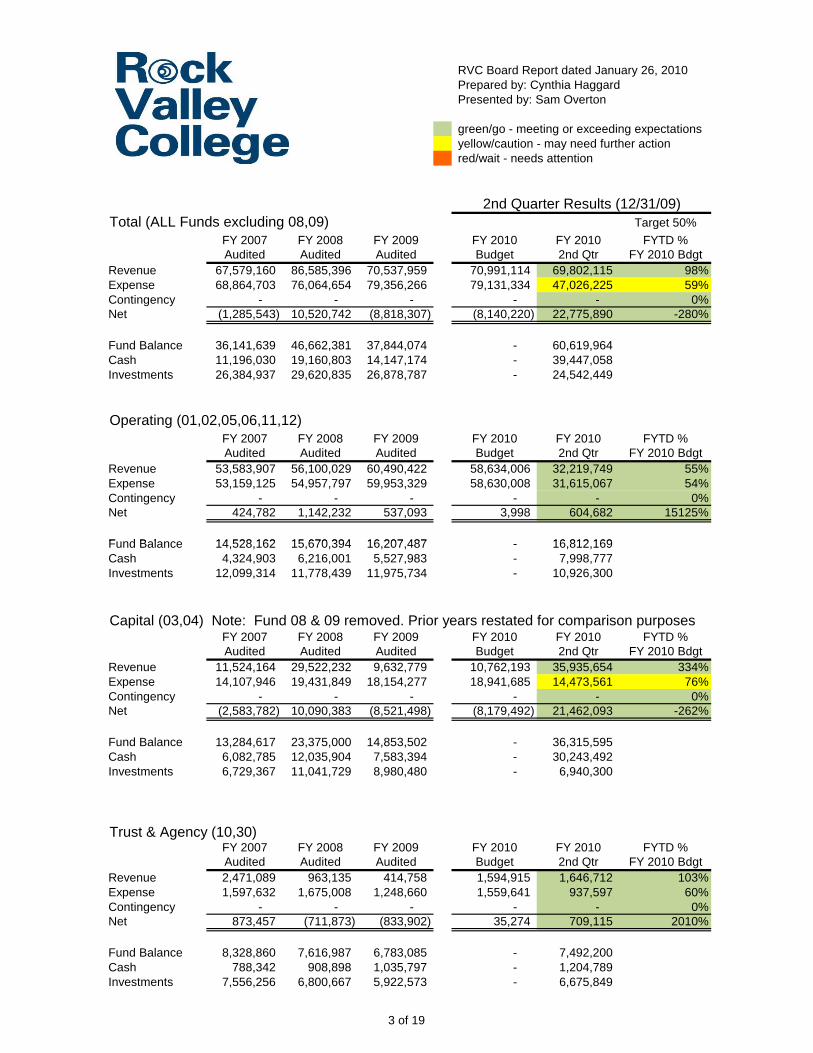
Functional Expenses
1 2 3 4
FY 08 Actuals 3,498,976 8,033,377 13,139,032 16,936,947
FY 09 Actuals 3,359,437 8,156,561 13,655,458 18,472,950
FY 10 Budget 4,821,937 9,643,874 14,465,811 19,287,748
FY 10 Actuals 4,271,591 9,763,620
-
5,000,000
10,000,000
15,000,000
20,000,000
25,000,000
30,000,000 Instructional Expenses
1 2 3 4
FY 08 Actuals 1,670,484 3,088,887 4,559,653 6,572,823
FY 09 Actuals 1,630,352 2,983,371 4,445,254 6,348,845
FY 10 Budget 1,732,602 3,465,204 5,197,805 6,930,407
FY 10 Actuals 1,814,813 3,247,747
-
5,000,000
10,000,000
15,000,000
20,000,000
25,000,000
30,000,000 Public Service Expenses
30,000,000 Institutional Support
30,000,000 Operations & Maintenance
1 2 3 4
FY 08 Actuals 3,498,976 8,033,377 13,139,032 16,936,947
FY 09 Actuals 3,359,437 8,156,561 13,655,458 18,472,950
FY 10 Budget 4,821,937 9,643,874 14,465,811 19,287,748
FY 10 Actuals 4,271,591 9,763,620
-
5,000,000
10,000,000
15,000,000
20,000,000
25,000,000
30,000,000 Instructional Expenses
1 2 3 4
FY 08 Actuals 1,670,484 3,088,887 4,559,653 6,572,823
FY 09 Actuals 1,630,352 2,983,371 4,445,254 6,348,845
FY 10 Budget 1,732,602 3,465,204 5,197,805 6,930,407
FY 10 Actuals 1,814,813 3,247,747
-
5,000,000
10,000,000
15,000,000
20,000,000
25,000,000
30,000,000 Public Service Expenses
1 2 3 4
FY 08 Actuals 2,479,389 4,000,289 5,895,911 8,128,672
FY 09 Actuals 2,556,392 4,374,975 6,185,522 8,990,309
FY 10 Budget 2,236,513 4,473,025 6,709,538 8,946,050
FY 10 Actuals 2,865,598 4,947,739
-
5,000,000
10,000,000
15,000,000
20,000,000
25,000,000
30,000,000 Institutional Support
1 2 3 4
FY 08 Actuals 1,582,865 3,032,993 4,606,739 6,646,714
FY 09 Actuals 1,638,055 3,097,836 4,935,223 6,809,575
FY 10 Budget 1,557,561 3,115,123 4,672,684 6,230,245
FY 10 Actuals 1,516,938 2,971,247
-
5,000,000
10,000,000
15,000,000
20,000,000
25,000,000
30,000,000 Operations & Maintenance
9 of 19

ROCK VALLEY COLLEGEPortfolio of Investments12/31/09 RVC Board Report dated January 26, 2010
Prepared by: Cynthia HaggardPresented by: Sam Overton
FY 08October 2007, transferred $500,000 from Operating Cash to Operating Investments.
FY 09October 2008, transferring FY 08 Surplus less Accumulated Investment Earnings retained at PMA - NONE
FY 10October 2009, transferring FY 09 Surplus less Accumulated Investment Earnings retained at PMA - NONE
The graph below represents the total cash equivalents and investments by class on 12/31/09:
32%
Cash Equivalents & Investments by Class
Certificate of Deposit, 32%
Money Markets, 68%
Conclusion: On TargetOperating Cash accounts are tracking with expectationsInvestments are tracking with expectations
32%
68%
Cash Equivalents & Investments by Class
Certificate of Deposit, 32%
Money Markets, 68%
10 of 19

ROCK VALLEY COLLEGE
Investment Account Balances
1 2 3 4 5 6 7 8 9 10 11 12
FY 07 Capital 5495656 6349449 7982603 8639825 8775611 5133720 4306127 4186918 2442872 2075776 3102060 4847601
FY 08 Capital 5536509 5710115 8776485 8742374 8861757 4544687 4485370 4472678 3911330 3701431 4862961 5917944
FY 09 Capital 6477192 6387866 8273029 9819024 9691390 3798849 4237102 4639575 3885065 223781 223781 7345767
FY 10 Capital 5658825 6825638 10142518 9244758 11012535 4600967
FY 2007 15380521 14406117 19792176 19142419 18050622 15158775 13264405 9510125 8230634 6986113 6776976 11041114
FY 2008 10391912 11859293 18638524 19139381 17086710 11645399 11670549 8342279 7959629 6146179 6838653 12410407
FY 2009 11863979 14166691 18407418 21139049 19203222 13465549 13692860 8513550 7311884 1943397 2759861 12207011
FY 2010 13138435 13519553 23748192 19121074 18653199 11067277
FY 07 Operating 8980864 6875344 11023051 9723414 8299831 9056221 7645639 4084420 4993602 4118203 2757140 5233535
FY 08 Operating 4036672 5008208 8866585 9751041 7326205 6172054 6014495 2982378 3097224 1451696 1031479 5598320
FY 09 Operating 4243676 6260449 9029213 10301098 8153774 8375383 7806504 2723805 2261907 1461701 2363805 3689816
FY 10 Operating 6298681 5035339 12043179 8916074 6429738 5266111
$0
$5,000,000
$10,000,000
$15,000,000
$20,000,000
$25,000,000 Net Cash Balances - All Funds
$0
$5,000,000
$10,000,000
$15,000,000
$20,000,000
$25,000,000
$30,000,000
$35,000,000
$40,000,000
Investment Account Balances
FY 07 Operating Investments FY 08 Operating Investments FY 09 Operating Investments FY 10 Operating Investments
FY 07 Capital Investments FY 08 Capital Investments FY 09 Capital Investments FY 10 Capital Investments
1 2 3 4 5 6 7 8 9 10 11 12
FY 07 Capital 5495656 6349449 7982603 8639825 8775611 5133720 4306127 4186918 2442872 2075776 3102060 4847601
FY 08 Capital 5536509 5710115 8776485 8742374 8861757 4544687 4485370 4472678 3911330 3701431 4862961 5917944
FY 09 Capital 6477192 6387866 8273029 9819024 9691390 3798849 4237102 4639575 3885065 223781 223781 7345767
FY 10 Capital 5658825 6825638 10142518 9244758 11012535 4600967
FY 2007 15380521 14406117 19792176 19142419 18050622 15158775 13264405 9510125 8230634 6986113 6776976 11041114
FY 2008 10391912 11859293 18638524 19139381 17086710 11645399 11670549 8342279 7959629 6146179 6838653 12410407
FY 2009 11863979 14166691 18407418 21139049 19203222 13465549 13692860 8513550 7311884 1943397 2759861 12207011
FY 2010 13138435 13519553 23748192 19121074 18653199 11067277
FY 07 Operating 8980864 6875344 11023051 9723414 8299831 9056221 7645639 4084420 4993602 4118203 2757140 5233535
FY 08 Operating 4036672 5008208 8866585 9751041 7326205 6172054 6014495 2982378 3097224 1451696 1031479 5598320
FY 09 Operating 4243676 6260449 9029213 10301098 8153774 8375383 7806504 2723805 2261907 1461701 2363805 3689816
FY 10 Operating 6298681 5035339 12043179 8916074 6429738 5266111
$0
$5,000,000
$10,000,000
$15,000,000
$20,000,000
$25,000,000 Net Cash Balances - All Funds
11 of 19

ROCK VALLEY COLLEGEPortfolio of InvestmentsDecember 31, 2009
12/31/2009 12/31/2009 FYTD12/31/09Principal Market Value InvestmentAmount Amount Income Earned
Certificates of Deposit - 32 %
PMA Operating Account (10220-102) 10,926,300$ 10,926,300$ 20,579$ PMA 2008 Bond Proceeds (10220-206) 1,284,400 1,284,400 2,758 PMA 2009 Bond Proceeds (10220-207) 5,655,900 5,655,900 12,144 Total Certificates of Deposit 17,866,600$ 17,866,600$ 35,481$
* Money Markets - 68%
PMA ISDLAF Money Market Operating (10220-102) 2,791,339$ 2,791,339$ 5,258$ PMA ISDLAF Money Market 2008 Bond Proceeds (10220-206) 70 70 - PMA ISDLAF Money Market 2009 Bond Proceeds (10220-207) 24,370,041 24,370,041 52,328 PMA ISDLAF Money Market Capital Campaign (10220-205) 1,216,854 1,216,854 2,613 Illinois Funds Money Market 10,322,523 10,322,523 19,443 Total Money Markets 38,700,827$ 38,700,827$ 79,642$
Accrued Interest Income 27,508 TOTALS 56,567,427$ 56,567,427$ 142,631$
NOTES:
* - Money Markets are classified as Cash & Cash Equivalents in the financial reports.
Detailed investment statements are available in the Financial Services department
12 of 19

RVC Board Report dated January 26, 2010Prepared by: Cynthia HaggardPresented by: Sam Overton
FY 10 2nd Quarter Summary:
Facilities Master Plan - 5 year revision completed June 2008Annual update for current year projects and updated program reviews - update January
PEC Renovation & Addition - Budgeted at $13.0 million, target opening August 15, 2009Targeting LEED Gold certification, ICECF grant $135,000 Unforeseen Conditions (moisture and replacement of sewer pipes) exceeded contingency and reversed acoustic alternate
Parking Lot Improvements - Board approved, target completion August 15, 2009Parking Lot #2 (WTC/PEC/SC) - Perimeter Road entrance alignment with WTC, designated parking for SC
Parking Lot # 7 & 8 (CLI) - additional student parking & improved storm water drainage
SCCE Visioning - Phase II - Greg Wear, Chair - Board approved Relocation Traffic Safety offices, adding 2nd Computer Lab - target completion August 15, 2009Faculty Offices & FSO Spaces, and Science Labs, target completion December 31, 2009FSO Spaces, appropriate Storage
Science and Mathematics Classroom Building - Greg Wear, Chair, target opening August 2011Conceptual Design approved, ICCB Capital application submitted, working on Schematic Design3 story building; 97,000 sq ft; $28.6 million project; LEED Gold Sustainability target
Arts Instructional Center - Design NOT yet Board approved
13 of 19
Arts Instructional Center Design NOT yet Board approved Prepared RAMP documentation for additional College input - DONE, submitted June 2009State of Illinois 2009 (6 year) Capital Plan includes final appropriation. Funding appropriation bill passed
Revisit to start Spring 2010 and adjust Conceptual Design & Schematics for current College needs
Capital Development Board project, awaiting schedule, approval and involvement
CLI & CLII Renovations - Greg Wear, Chairing - NOT a Board approved Capital ProjectPossible consolidation of programs at one location (either SCCE or MAIN campus)
13 of 19
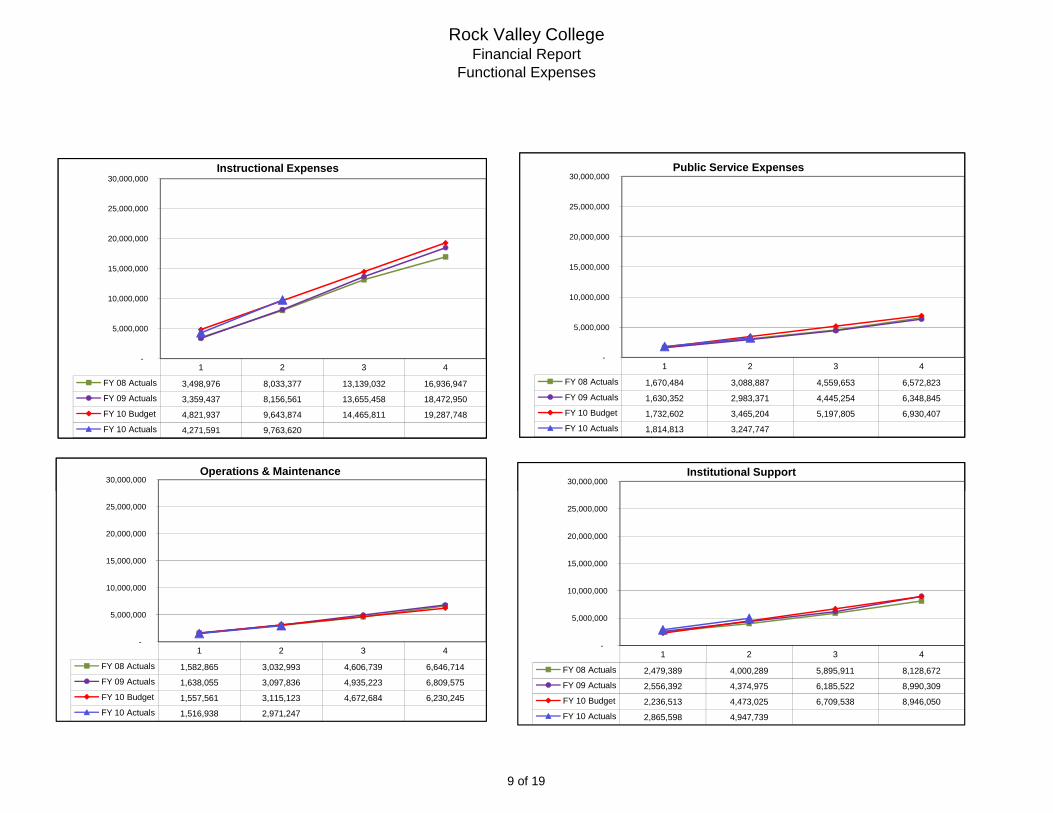
Rock Valley CollegeCapital Projects
Fund 03 - CAPITAL - 'Ops & Maint - Restricted' Budget FUTUREFundingSource FunctionProject Total Est. Cost Est. FY 10 Exp 1st Qtr 2nd Qtr 3rd Qtr 4th Qtr Totals Future Funding
RVC Bonds 79566 AIC Construction 10,500,000$ 500,000$ -$ -$ -$ -$ -$ 10,000,000$
RVC Bonds 79601 PEC Renovations & Additions 10,173,417 5,500,000 2,084,498 326,176 - - 2,410,674 750,000
RVC Bonds 79691 Parking Lot 2 Renovations (WTC/SC/PEC) 1,284,710 700,000 917,544 18,753 - - 936,297 250,000
RVC Bonds 79692 Parking Lot 7 & 8 Renovations 1,031,659 750,000 723,296 17,093 - - 740,389 250,000
GRANT 79683 Illinois Clean Energy Grant - - 45,635 16,030 - - 61,665 -
RVC Bonds 79592 SCCE Visioning - Phase III 4,000,000 - - - - - - 4,000,000
RVC Bonds 79604 AIC Tunnel Extension 2,000,000 - - - - - - 2,000,000
RVC Bonds 79606 Power House Expansion 2,500,000 - - - - - - 2,500,000
RVC Bonds 79696 ERC Practice Room Remodel 94,400 75,000 24,837 - - - 24,837 -
RVC Bonds 79697 SCCE 2009 Science Lab (990,788 + 504,360) 1,495,138 1,495,138 662,375 696,698 - - 1,359,073 1,359,073
RVC Bonds 79700 SSB 1300/DPS Expansion 100,000 90,000 41,263 37,438 - - 78,701 88,701
RVC Bonds 79699 JSCM Science & Math (26,500k + 2,084k) 28,584,000 7,500,000 524,385 680,266 - - 1,204,651 22,288,651
RVC Bonds 79703 WTC New Offices 50,000 50,000 316 1,137 - - 1,453 -
RVC Bonds 79704 IT Server Room Renovations (SCCE) 150,000 150,000 - 41,594 - - 41,594 -
RVC Bonds FY 10 TBD - New Projects (1,238,350) (6,195,138) - - - - - 4,956,788 TOTAL BOND PROJECTS 60,724,974$ 10,615,000$ 5,024,149$ 1,835,185$ -$ -$ 6,859,334$ 48,443,213$
Life Safety 79613 LS 2001 PEC ADA - Elevator 206,500$ -$ 46,399$ -$ -$ -$ 46,399$ -$
Life Safety 79630 LS 2005 Electrical Systems 302,000 - - - - - - -
Life Safety 79639 LS 2005 Building Gutters 39,796 - - - - - - -
Life Safety 79676 LS 2007 Blding F Siding 317,806 317,800 185,441 149,314 - - 334,755 334,761
Life Safety 79677 LS 2007 PEC HVAC Phase 1 340,470 - 5,692 1,647 - - 7,339 -
Life Safety 79678 LS 2007 PEC HVAC Phase 2 438,750 - - - - - - -
Life Safety 79682 LS 2007 PEC Electrical Service 276,413 - 103,069 - - - 103,069 -
Life Safety 79684 LS 2008 PEC HVAC Phase 3 1,404,000 - 84,033 - - - 84,033 -
Life Safety 79685 LS 2008 PEC Fire Protection 159,120 - 14,777 - - - 14,777 -
Life Safety 79689 LS 2008 VAV Box WTC - - 15,523 - - close 15,523 15,523
Life Safety 79690 LS 2008 Entrance Doors Sec 325,600 325,000 31,159 11,359 - - 42,518 43,118
Life Safety LS 2008 CLII Asbestos Abatement - Phase 1 847,605 - - - - - - 847,605
Life Safety LS 2008 CLI & CLII Sprinkler Heads 89,680 - - - - - - 89,680
Life Safety 79695 LS 2008 Areas of Rescue 87,934 50,000 3,567 1,534 - - 5,101 43,035
Life Safety 79698 LS 2009 SCCE VAV Box Replacement 635,510 635,000 261,067 - - - 261,067 261,577
Life Safety 79701 LS 2010 Foot Bridge Replacement 94,870 95,000 4,319 67,767 - - 72,086 71,956
Life Safety 79702 LS 2010 Dam Replace/Pond Bank 192,080 192,000 147,484 51,694 - - 199,178 199,258
Life Safety CLI & CLII Vestibules - - - - - - - -
Life Safety LS Old Monies 172,023 - - - - - - 172,023
Life Safety LS New Levy Undistributed 3,086,799 - - - - - - 3,086,799 TOTAL LIFE SAFETY PROJECTS 9,016,956$ 1,614,800$ 902,530$ 283,315$ -$ -$ 1,185,845$ 5,165,335$
TOTAL 69,741,930$ 12,229,800$ 5,926,679$ 2,118,500$ -$ -$ 8,045,179$ 53,608,548$
FY10
14 of 19

ROCK VALLEY COLLEGECapital Assets Disposal ReportJuly 1, 2009 - December 31, 2009
The following capital assets owned by the College were disposed of and removed from the financial records:
Capital AssetAcquisition
CostAccumulatedDepreciation
Loss onDisposal Disposal Method
Office Equipment -$ -$ -$ Auctioned / sold
Office Equipment 48,955 48,955 - Donated
Office Equipment 5,028 5,028 - No longer tracking
Office Equipment 7,229 7,229 - Scrapped
Office Equipment - - - Traded In
Instructional equipment - - - Auctioned / sold
Instructional equipment - - - No longer tracking
Instructional equipment 6,194 6,194 - Scrapped
Instructional equipment 61,125 61,125 - Donated
Vehicle - - - Trade In on new vehicle
Vehicle - - - Auctioned / sold
Vehicle - - - No longer tracking
Service Equipment - - - Auctioned / sold
Service Equipment 3,952 3,952 - Scrapped
Service Equipment 12,065 12,065 - Donated
Service Equipment - - - No longer tracking
Service Equipment - - - Warranty Replacement
Service Equipment - - - Traded In
TOTAL DISPOSAL AMOUNTS 144,548$ 144,548$ -$
Detailed disposal records are available in the Financial Services department.
15 of 19

RVC - FY 2010 BudgetFund 03 Fund 05 Fund 06 Fund 12
Oper & Maint Auxiliary Restricted Liability, ProtRestricted Enterprises Purposes & Settle %
Revenues by Source
41 Local Government 17,655,833$ 2,790,267$ 3,487,833$ 6,801,360$ -$ 428,300$ -$ 69,757$ 2,096,256$ -$ 33,329,606$ 47%42 State Government 4,747,645 857,496 - - 77,700 2,755,042 - - - - 8,437,883 12%43 Federal Governmental - - - - - 9,687,526 - - - - 9,687,526 14%44 Student Tuition & Fees 12,133,667 1,598,048 - - 352,129 - 242,129 - 3,300 - 14,329,273 20%45 Sales & Services Fees 64,560 - - - 1,716,900 - 22,102 - - - 1,803,562 3%46 Facilities Revenue - - - - - - - - - - - 0%47 Investment Revenue 232,000 4,000 181,000 42,000 25,000 - 20,000 2,000 74,000 298,810 878,810 1%48 Gifts, Grants, & Bequests - 2,000 250,000 - 9,500 139,600 6,900 - - 638,174 1,046,174 1%49 Other Sources 51,200 13,200 - - 819,163 161,735 366,800 - 66,182 - 1,478,280 2%
Total Budget Revenues 34,884,905$ 5,265,011$ 3,918,833$ 6,843,360$ 3,000,392$ 13,172,203$ 657,931$ 71,757$ 2,239,738$ 936,984$ 70,991,114$ 100%
Appropriations by Object
51 Salaries 24,235,798$ 1,474,778$ -$ -$ 1,187,942$ 2,177,641$ -$ -$ 793,320$ -$ 29,869,479$ 38%52 Employee Benefits 4,951,378 381,722 - - 200,790 397,847 - - 915,495 - 6,847,232 9%53 Contractual Services 1,807,541 1,080,500 - 2,400 554,278 301,897 99,872 57,087 137,850 149,700 4,191,125 5%54 General Materials & Supplies 2,372,516 454,950 - - 617,272 300,492 83,902 - 156,100 60,300 4,045,532 5%55 Travel & Conference/Mtg Exp 412,170 (6,750) - - 121,344 172,869 31,585 - 12,000 600 743,818 1%56 Fixed Charges 490,655 14,000 - 6,709,485 22,400 191,992 - - 384,000 600 7,813,132 10%57 Utilities 11,795 1,489,300 - - 3,400 4,140 - - 7,000 - 1,515,635 2%58 Capital Outlay 211,000 261,000 12,229,800 - - - - - 201,000 - 12,902,800 16% Other Expenditures 335,450 3,200 - - 102,320 9,628,529 433,057 - - 700,025 11,202,581 14%
60 Provision for Contingency - - - - - - - - - - - 0%
Total Budget Expenses 34,828,303$ 5,152,700$ 12,229,800$ 6,711,885$ 2,809,746$ 13,175,407$ 648,416$ 57,087$ 2,606,765$ 911,225$ 79,131,334$ 100%
Net by Fund 56,602$ 112,311$ (8,310,967)$ 131,475$ 190,646$ (3,204)$ 9,515$ 14,670$ (367,027)$ 25,759$ (8,140,220)$
Expenditures by Function
0 Other -$ -$ -$ -$ -$ -$ 24,168$ -$ -$ -$ 24,168$ 0%1 Instruction 18,747,912 - - - 136,448 403,388 - - - - 19,287,748 24%2 Academic Support 4,208,271 - - - 7,600 16,938 800 - - - 4,233,609 5%3 Student Services 3,230,545 - - - 22,861 39,500 270,841 - - - 3,563,747 5%4 Public Service/Continuing Ed 975,981 - - - 2,249,820 3,704,606 14,450 - - - 6,944,857 9%6 Auxiliary Services 294,401 - - - 328,047 - 38,025 - - - 660,473 1%7 Operations & Maint - 4,781,350 12,229,800 - - 1,080 - - 1,447,815 - 18,460,045 23%8 Institutional Support 7,293,693 371,350 - 6,711,885 64,970 - 125,132 57,087 1,158,950 911,225 16,694,292 21%9 Scholarships, Grants, Waivers 77,500 - - - - 9,009,896 175,000 - - - 9,262,396 12%
Total Expenses by Function 34,828,303$ 5,152,700$ 12,229,800$ 6,711,885$ 2,809,746$ 13,175,408$ 648,416$ 57,087$ 2,606,765$ 911,225$ 79,131,335$ 100%
Totals Fund 01 Education
Fund 02 Oper & Main
Fund 04 Bond & Int
Fund 10 Trust &
Agy Fund 11 Audit
Fund 30 Foundation
16 of 19

RVC - FY 2010 BudgetRevenues by Source Operating Capital Other Total
41 Local Government 23,040,413$ 10,289,193$ -$ 33,329,606$ 42 State Government 8,437,883 - - 8,437,883 43 Federal Governmental 9,687,526 - - 9,687,526 44 Student Tuition & Fees 14,087,144 - 242,129 14,329,273 45 Sales & Services Fees 1,781,460 - 22,102 1,803,562 46 Facilities Revenue - - - - 47 Investment Revenue 337,000 223,000 318,810 878,810 48 Gifts, Grants, & Bequests 151,100 250,000 645,074 1,046,174 49 Other Sources 1,111,480 - 366,800 1,478,280
Total Budget Revenues 58,634,006$ 10,762,193$ 1,594,915$ 70,991,114$
Appropriations by Object Operating Capital Other Total
51 Salaries 29,869,479$ -$ -$ 29,869,479$ 52 Employee Benefits 6,847,232 - - 6,847,232 53 Contractual Services 3,939,153 2,400 249,572 4,191,125 54 General Materials & Supplies 3,901,330 - 144,202 4,045,532 55 Travel & Conference/Mtg Exp 711,633 - 32,185 743,818 56 Fixed Charges 1,103,047 6,709,485 600 7,813,132 57 Utilities 1,515,635 - - 1,515,635 58 Capital Outlay 673,000 12,229,800 - 12,902,800 59 Other Expenditures 10,069,499 - 1,133,082 11,202,581 60 Provision for Contingency - - - -
Total Budget Expenses 58,630,008$ 18,941,685$ 1,559,641$ 79,131,334$
Net by Fund 3,998$ (8,179,492)$ 35,274$ (8,140,220)$
Expenditures by Function Operating Capital Other Total
0 Other -$ -$ 24,168$ 24,168$ 1 Instruction 19,287,748 - - 19,287,748 2 Academic Support 4,232,809 - 800 4,233,609 3 Student Services 3,292,906 - 270,841 3,563,747 4 Public Service/Continuing Ed 6,930,407 - 14,450 6,944,857 6 Auxiliary Services 622,448 - 38,025 660,473 7 Operations & Maint 6,230,245 12,229,800 - 18,460,045 8 Institutional Support 8,946,050 6,711,885 1,036,357 16,694,292 9 Scholarships, Grants, Waivers 9,087,396 - 175,000 9,262,396
Total Expenses by Function 58,630,009$ 18,941,685$ 1,559,641$ 79,131,335$
17 of 19

FY 10 - 2nd Qtr 12/31/09 - Actuals
Fund 01 Education
Fund 02 Oper & Main
Fund 03Oper & Maint
Restricted Fund 04 Bond
& Int
Fund 05Auxiliary
Enterprises
Fund 06RestrictedPurposes
Fund 10Trust & Agy
Fund 11 Audit
Fund 12Liability & Settle
Fund 30 Foundation Totals %
Revenues by Source
41 Local Government 8,708,983$ 1,466,651$ 32,275,916$ 3,463,126$ -$ 102,796$ -$ 38,511$ 1,373,225$ -$ 47,429,208$ 68%42 State Government 2,011,994 316,280 - - - 1,840,832 - - - - 4,169,106 6%43 Federal Governmental - - - - - 6,247,764 - - - - 6,247,764 9%44 Student Tuition & Fees 7,344,324 970,515 - - 177,755 - 168,159 - 39 - 8,660,792 12%45 Sales & Services Fees 31,949 - - - 674,580 2,510 200 - - - 709,239 1%46 Facilities Revenue - - - - - - - - - - - 0%47 Investment Revenue 36,399 1,276 69,526 2,086 600 - 483 77 10,152 914,952 1,035,551 1%48 Gifts, Grants, & Bequests - - 125,000 - 2,529 117,718 18 - - 316,073 561,338 1%49 Other Sources 197,989 30,562 - - 466,224 45,277 246,827 94 2,144 - 989,117 1%
Total Actual Revenues 18,331,638$ 2,785,284$ 32,470,442$ 3,465,212$ 1,321,688$ 8,356,897$ 415,687$ 38,682$ 1,385,560$ 1,231,025$ 69,802,115$ 100.0%
Appropriations by Object
51 Salaries 11,910,019$ 680,153$ -$ -$ 611,680$ 956,303$ -$ -$ 414,488$ -$ 14,572,643$ 31%52 Employee Benefits 3,021,846 242,480 - - 134,366 380,181 - - 681,030 - 4,459,903 9%53 Contractual Services 740,889 535,165 86,178 1,446 209,283 138,954 53,592 49,215 63,362 62,108 1,940,192 4%54 General Materials & Supplies 1,161,248 396,258 - - 276,370 97,956 31,877 897 50,283 10,927 2,025,816 4%55 Travel & Conference/Mtg Exp 139,626 (11,325) - - 90,068 81,385 56,803 - (31) 206 356,732 1%56 Fixed Charges 215,325 11,122 419,149 5,983,274 11,921 85,776 - - 379,726 300 7,106,593 15%57 Utilities 3,471 597,732 - - 1,362 1,032 - - 2,097 385 606,079 1%58 Capital Outlay 239,593 5,383 7,983,514 - - 83,844 - - - - 8,312,334 18%59 Other Expenditures 159,039 - - - 47,370 6,718,125 220,297 - - 501,102 7,645,933 16%60 Provision for Contingency - - - - - - - - - 0%71 Transfer to Other Funds (16,281) - - - - 16,281 - - - 0%72 Transfer from Other Funds 16,281 - - - - (16,281) - - - 0%
Total Actual Expenses 17,591,056$ 2,456,968$ 8,488,841$ 5,984,720$ 1,382,420$ 8,543,556$ 362,569$ 50,112$ 1,590,955$ 575,028$ 47,026,225$ 100.0%
Net by Fund 740,582 328,316 23,981,601 (2,519,508) (60,732) (186,659) 53,118 (11,430) (205,395) 655,997 22,775,890
Expenditures by Function
0 Other -$ -$ -$ -$ -$ -$ -$ -$ -$ -$ -$ 0%1 Instruction 9,576,726 - - - 64,899 121,994 10 - - - 9,763,630 21%2 Academic Support 1,980,117 - - - 2,970 - 58 - - - 1,983,145 4%3 Student Services 1,619,297 - - - 5,350 11,631 205,115 - - - 1,841,393 4%4 Public Service/Continuing Ed 479,411 - - - 1,066,084 1,702,252 4,681 - - - 3,252,428 7%6 Auxiliary Services 163,153 - - - 233,316 - 2,404 - - - 398,873 1%7 Operations & Maint 10 2,237,801 7,983,514 - - 61,665 - - 671,771 - 10,954,761 23%8 Institutional Support 3,738,311 219,167 505,327 5,984,720 9,801 11,164 72,448 50,112 919,184 575,028 12,085,262 26%9 Scholarships, Grants, Waivers 34,031 - - - - 6,634,850 77,853 - - - 6,746,733 14%
Total Expenses by Function 17,591,056$ 2,456,968$ 8,488,841$ 5,984,720$ 1,382,420$ 8,543,556$ 362,569$ 50,112$ 1,590,955$ 575,028$ 47,026,225$ 100%
Fund Balance 10,610,207$ 262,855$ 35,500,759$ 814,836$ 2,009,589$ (146,690)$ 880,607$ 123,479$ 3,952,729$ 6,611,593$ 60,619,964$ Cash 7,064,528$ 832,796$ 29,428,987$ 814,505$ 1,966,631$ (2,959,511)$ 1,087,095$ 123,480$ 970,853$ 117,694$ 39,447,058$
Investments 7,723,600$ 202,700$ 6,940,300$ -$ -$ -$ -$ -$ 3,000,000$ 6,675,849$ 24,542,449$
18 of 19
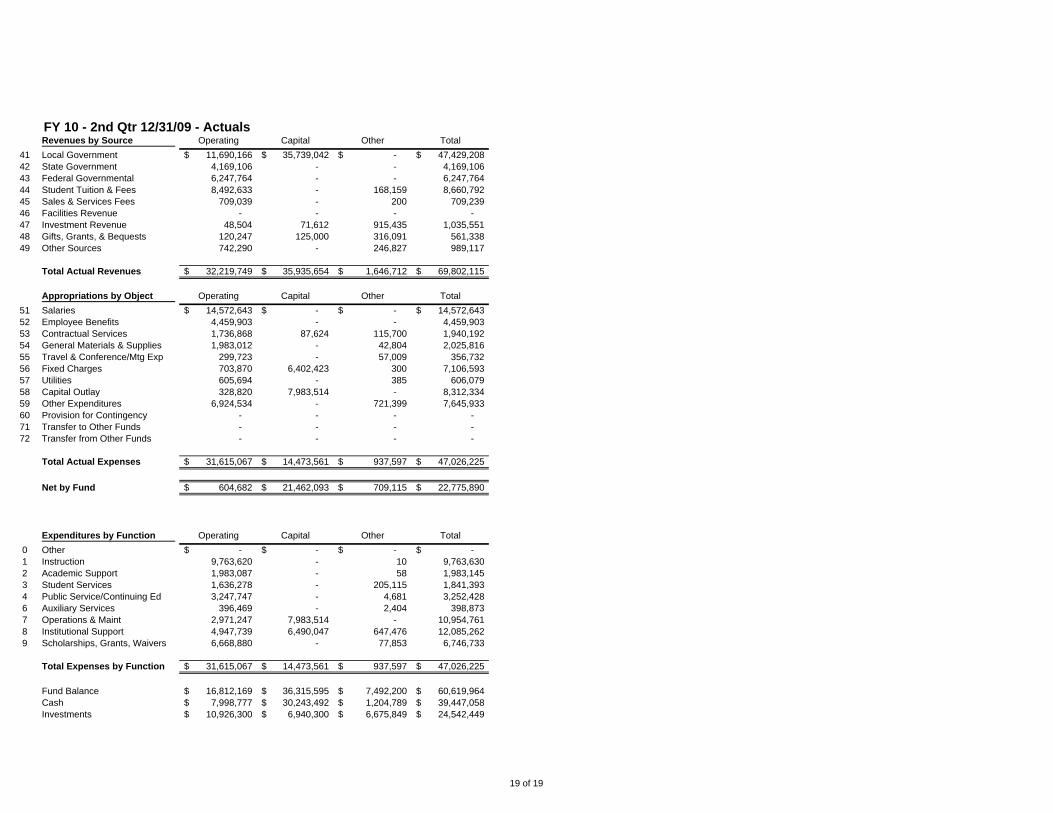
FY 10 - 2nd Qtr 12/31/09 - ActualsRevenues by Source Operating Capital Other Total
41 Local Government 11,690,166$ 35,739,042$ -$ 47,429,208$ 42 State Government 4,169,106 - - 4,169,106 43 Federal Governmental 6,247,764 - - 6,247,764 44 Student Tuition & Fees 8,492,633 - 168,159 8,660,792 45 Sales & Services Fees 709,039 - 200 709,239 46 Facilities Revenue - - - - 47 Investment Revenue 48,504 71,612 915,435 1,035,551 48 Gifts, Grants, & Bequests 120,247 125,000 316,091 561,338 49 Other Sources 742,290 - 246,827 989,117
Total Actual Revenues 32,219,749$ 35,935,654$ 1,646,712$ 69,802,115$
Appropriations by Object Operating Capital Other Total
51 Salaries 14,572,643$ -$ -$ 14,572,643$ 52 Employee Benefits 4,459,903 - - 4,459,903 53 Contractual Services 1,736,868 87,624 115,700 1,940,192 54 General Materials & Supplies 1,983,012 - 42,804 2,025,816 55 Travel & Conference/Mtg Exp 299,723 - 57,009 356,732 56 Fixed Charges 703,870 6,402,423 300 7,106,593 57 Utilities 605,694 - 385 606,079 58 Capital Outlay 328,820 7,983,514 - 8,312,334 59 Other Expenditures 6,924,534 - 721,399 7,645,933 60 Provision for Contingency - - - - 71 Transfer to Other Funds - - - - 72 Transfer from Other Funds - - - -
Total Actual Expenses 31,615,067$ 14,473,561$ 937,597$ 47,026,225$
Net by Fund 604,682$ 21,462,093$ 709,115$ 22,775,890$
Expenditures by Function Operating Capital Other Total
0 Other -$ -$ -$ -$ 1 Instruction 9,763,620 - 10 9,763,630 2 Academic Support 1,983,087 - 58 1,983,145 3 Student Services 1,636,278 - 205,115 1,841,393 4 Public Service/Continuing Ed 3,247,747 - 4,681 3,252,428 6 Auxiliary Services 396,469 - 2,404 398,873 7 Operations & Maint 2,971,247 7,983,514 - 10,954,761 8 Institutional Support 4,947,739 6,490,047 647,476 12,085,262 9 Scholarships, Grants, Waivers 6,668,880 - 77,853 6,746,733
Total Expenses by Function 31,615,067$ 14,473,561$ 937,597$ 47,026,225$
Fund Balance 16,812,169$ 36,315,595$ 7,492,200$ 60,619,964$ Cash 7,998,777$ 30,243,492$ 1,204,789$ 39,447,058$ Investments 10,926,300$ 6,940,300$ 6,675,849$ 24,542,449$
19 of 19

Data Current as of: 25-Jan-10Period: FY2010, Jul/2009 - Dec/2009Summarized by SubClass (xx-xxxxx-XXxxx), Breakdown by FundBalance Sheet, All Funds
Totals01 Education Fund
02 Operations Maintenance
Fund
03 Operations Maint‐Restricted
04 Bond and Interest Fund
05 Auxiliary Enterprises Fund
06 Restricted Purposes Fund
10 Trust and Agency Fund
11 Audit Fund
12 Liability, Protection, Settlement
30 Foundation
09 General Long‐Term
Debt
%08 General Fixed Assets
1 - Assets
0.00 39426458.05 26%11 - Cash & Cash Equivalents 7064402.78 832795.60 29428987.38 814505.24 1966755.98 (2959511.51) 1087095.16 123480.00 970853.33 97094.090.000.00 24563097.10 16%12 - Investments 7723600.00 202700.00 6940300.00 0.00 0.00 0.00 0.00 0.00 3000000.00 6696497.100.000.00 8101689.67 5%13 - Receivables 4773811.99 169738.00 0.00 0.00 33302.83 3037472.22 40231.37 0.00 0.00 47133.260.000.00 44925.48 0%14 - Accrued Revenue 13316.44 257.26 10125.57 0.00 0.00 0.00 0.00 0.00 3808.42 17417.790.00
2216886.78 2710039.59 2%17 - Prepaid Exp & Deferred C 293666.87 47834.99 0.00 856.50 79025.65 20444.32 4848.73 0.00 46475.75 0.000.000.00 74870281.87 50%18 - Fixed Assets 0.00 0.00 0.00 0.00 0.00 0.00 0.00 0.00 0.00 0.0074870281.87
149716491.7619868798.08 1253325.85 36379412.95 815361.74 2079084.46 98405.03 1132175.26 123480.00 4021137.50 6858142.24Total 1 - Assets 74870281.87 2216886.78
2 - Liabilities
0.00 (2102.15) 0%21 - Payroll Deductions Payabl (2102.15) 0.00 0.00 0.00 0.00 0.00 0.00 0.00 0.00 0.000.000.00 13265.75 0%22 - Current Obligations Payab 0.00 0.00 0.00 0.00 0.00 13265.75 0.00 0.00 0.00 0.000.000.00 2865585.77 3%23 - Accounts Payable 1552864.04 107540.86 878653.91 525.00 9809.11 34842.36 11657.52 0.00 23144.29 246548.680.000.00 1810424.41 2%24 - Accrued Expense 1604382.50 95403.96 0.00 0.00 59687.39 5686.15 0.00 0.00 45264.41 0.000.000.00 6550564.52 7%27 - Deferred Revenue 5334205.60 787525.65 0.00 0.00 0.00 191300.77 237532.50 0.00 0.00 0.000.00
78129484.95 78885931.75 88%28 - Fixed Liabilities 756446.80 0.00 0.00 0.00 0.00 0.00 0.00 0.00 0.00 0.000.000.00 15173.15 0%29 - Other Liabilities 12795.74 0.00 0.00 0.00 0.00 0.00 2377.41 0.00 0.00 0.000.00
90138843.209258592.53 990470.47 878653.91 525.00 69496.50 245095.03 251567.43 0.00 68408.70 246548.68Total 2 - Liabilities 0.00 78129484.95
3 - Fund Balances
57112837.40 96%Fund Balance 9869625.08 (65460.54) 11519158.42 3334344.43 2070320.72 39968.59 827489.04 134909.22 4158123.71 5955596.4870354922.26 (51086160.01)2464811.16 4%Revenue Over Expenses 740580.47 328315.92 23981600.62 (2519507.69) (60732.76) (186658.59) 53118.79 (11429.22) (205394.91) 655997.084515359.61 (24826438.16)
59577648.5610610205.55 262855.38 35500759.04 814836.74 2009587.96 (146690.00) 880607.83 123480.00 3952728.80 6611593.56Total 3 - Fund Balances 74870281.87 (75912598.17)
2216886.78 149716491.7619868798.08 1253325.85 36379412.95 815361.74 2079084.46 98405.03 1132175.26 123480.00 4021137.50 6858142.24Liabilities + Fund Balance 74870281.87
Date Produced: 25-Jan-10 Page 1 of 1Produced By: Financial Services Department

Data Current as of: 25-Jan-10Period: FY2010, Jul/2009 - Dec/2009Summarized by Function & Subclass (xx-Xxxxx-XXxxx), Breakdown by FundBudget Report, All Funds
Totals01 Education Fund
02 Operations Maintenance
Fund
03 Operations Maint-
Restricted
04 Bond and Interest Fund
05 Auxiliary Enterprises
Fund
06 Restricted Purposes Fund
10 Trust and Agency Fund
11 Audit Fund
12 Liability, Protection, Settlement
30 Foundation
%
Expenditures by Function
4 - Revenues33329606.00 47%41 - Local Government Source 17655833.00 2790267.00 3487833.00 6801360.00 0.00 428300.00 0.00 69757.00 2096256.00 0.008437883.00 12%42 - State Government Source 4747645.00 857496.00 0.00 0.00 77700.00 2755042.00 0.00 0.00 0.00 0.009687525.62 14%43 - Federal Government Sour 0.00 0.00 0.00 0.00 0.00 9687525.62 0.00 0.00 0.00 0.0014329273.00 20%44 - Student Tuition & Fees 12133667.00 1598048.00 0.00 0.00 352129.00 0.00 242129.00 0.00 3300.00 0.001803562.00 3%45 - Sales & Service Fees 64560.00 0.00 0.00 0.00 1716900.00 0.00 22102.00 0.00 0.00 0.00878810.00 1%47 - Investment Revenue 232000.00 4000.00 181000.00 42000.00 25000.00 0.00 20000.00 2000.00 74000.00 298810.001046174.00 1%48 - Gifts, Grants & Bequests 0.00 2000.00 250000.00 0.00 9500.00 139600.00 6900.00 0.00 0.00 638174.001478280.00 2%49 - Other Revenue 51200.00 13200.00 0.00 0.00 819163.00 161735.00 366800.00 0.00 66182.00 0.0070991113.6234884905.00 5265011.00 3918833.00 6843360.00 3000392.00 13172202.62 657931.00 71757.00 2239738.00 936984.00Total 4 - Revenues 100%
5 - Expenses29869479.42 38%51 - Salaries 24235798.41 1474777.87 0.00 0.00 1187941.87 2177641.32 0.00 0.00 793319.95 0.006847232.32 9%52 - Employee Benefits 4951378.00 381722.00 0.00 0.00 200790.00 397847.32 0.00 0.00 915495.00 0.004191125.00 5%53 - Contractual Services 1807541.00 1080500.00 0.00 2400.00 554278.00 301897.00 99872.00 57087.00 137850.00 149700.004045531.70 5%54 - General Materials & Suppl 2372516.00 454950.00 0.00 0.00 617272.00 300491.70 83902.00 0.00 156100.00 60300.00743817.73 1%55 - Travel & Conf/Meeting Ex 412170.00 (6750.00) 0.00 0.00 121344.00 172868.73 31585.00 0.00 12000.00 600.007813132.00 10%56 - Fixed Charges 490655.00 14000.00 0.00 6709485.00 22400.00 191992.00 0.00 0.00 384000.00 600.001515635.00 2%57 - Utilities 11795.00 1489300.00 0.00 0.00 3400.00 4140.00 0.00 0.00 7000.00 0.0012902800.00 16%58 - Capital Outlay 211000.00 261000.00 12229800.00 0.00 0.00 0.00 0.00 0.00 201000.00 0.0011202581.47 14%59 - Other Expenditures 335450.00 3200.00 0.00 0.00 102320.00 9628529.47 433057.00 0.00 0.00 700025.0079131334.6434828303.41 5152699.87 12229800.00 6711885.00 2809745.87 13175407.54 648416.00 57087.00 2606764.95 911225.00Total 5 - Expenses 100%
7 - Transfers0.00 0%71 - Transfers to Other Funds 0.00 0.00 0.00 0.00 0.00 0.00 0.00 0.00 0.00 0.000.00 0%72 - Transfer from Other Fund 0.00 0.00 0.00 0.00 0.00 0.00 0.00 0.00 0.00 0.000.000.00 0.00 0.00 0.00 0.00 0.00 0.00 0.00 0.00 0.00Total 7 - Transfers 100%
Net By Fund 56601.59 112311.13 (8310967.00) 131475.00 190646.13 (3204.92) 9515.00 14670.00 (367026.95) 25759.00 (8140221.02)
24168.00 0%0 ‐ Other 0.00 0.00 0.00 0.00 0.00 0.00 24168.00 0.00 0.00 0.0019287748.16 24%1 ‐ Instruction 18747912.53 0.00 0.00 0.00 136448.00 403387.63 0.00 0.00 0.00 0.004233608.36 5%2 ‐ Academic Support 4208271.36 0.00 0.00 0.00 7600.00 16937.00 800.00 0.00 0.00 0.003563746.76 5%3 ‐ Student Services 3230544.76 0.00 0.00 0.00 22861.00 39500.00 270841.00 0.00 0.00 0.006970857.21 9%4 ‐ Public Service/Continuing Ed 1001980.82 0.00 0.00 0.00 2249819.48 3704606.91 14450.00 0.00 0.00 0.00660472.95 1%6 ‐ Auxiliary Services 294400.56 0.00 0.00 0.00 328047.39 0.00 38025.00 0.00 0.00 0.00
18460044.82 23%7 ‐ Operations & Mtce of Plant 0.00 4781349.87 12229800.00 0.00 0.00 1080.00 0.00 0.00 1447814.95 0.0016668292.38 21%8 ‐ Institutional Support 7267693.38 371350.00 0.00 6711885.00 64970.00 0.00 125132.00 57087.00 1158950.00 911225.009262396.00 12%9 ‐ Scholarships, Grants, Waivers 77500.00 0.00 0.00 0.00 0.00 9009896.00 175000.00 0.00 0.00 0.00
Net By Fund 79131334.6434828303.41 5152699.87 12229800.00 6711885.00 2809745.87 13175407.54 648416.00 57087.00 2606764.95 911225.00 100%
Date Produced: 25-Jan-10 Page 1 of 1Produced By: Financial Services Department

Data Current as of: 25-Jan-10Period: FY2010, Jul/2009 - Dec/2009Summarized by Function & Subclass (xx-Xxxxx-XXxxx), Breakdown by FundActuals Report, All Funds
Totals01 Education Fund
02 Operations Maintenance
Fund
03 Operations Maint‐Restricted
04 Bond and Interest Fund
05 Auxiliary Enterprises Fund
06 Restricted Purposes Fund
10 Trust and Agency Fund
11 Audit Fund
12 Liability, Protection, Settlement
30 Foundation %
Expenditures by Function
4 - Revenues
47429208.02 68%41 - Local Government Source 8708982.51 1466651.24 32275915.85 3463125.65 0.00 102796.56 0.00 38510.76 1373225.45 0.004169106.17 6%42 - State Government Source 2011993.79 316280.61 0.00 0.00 0.00 1840831.77 0.00 0.00 0.00 0.006247764.18 9%43 - Federal Government Sour 0.00 0.00 0.00 0.00 0.00 6247764.18 0.00 0.00 0.00 0.008660792.12 12%44 - Student Tuition & Fees 7344323.66 970514.85 0.00 0.00 177755.04 0.00 168159.57 0.00 39.00 0.00709239.03 1%45 - Sales & Service Fees 31949.03 0.00 0.00 0.00 674579.90 2510.10 200.00 0.00 0.00 0.001035551.40 1%47 - Investment Revenue 36399.08 1276.01 69525.81 2086.24 600.25 0.00 483.20 77.38 10151.68 914951.75561337.66 1%48 - Gifts, Grants & Bequests 0.00 0.00 125000.00 0.00 2529.00 117717.63 18.00 0.00 0.00 316073.03989116.51 1%49 - Other Revenue 197988.77 30561.65 0.00 0.00 466223.51 45277.04 246827.46 94.39 2143.69 0.00
69802115.0918331636.84 2785284.36 32470441.66 3465211.89 1321687.70 8356897.28 415688.23 38682.53 1385559.82 1231024.78Total 4 - Revenues
5 - Expenses
14572642.92 31%51 - Salaries 11910019.09 680153.58 0.00 0.00 611680.44 956302.64 0.00 0.00 414487.17 0.004459903.22 9%52 - Employee Benefits 3021845.62 242479.88 0.00 0.00 134366.29 380181.31 0.00 0.00 681030.12 0.001940192.27 4%53 - Contractual Services 740889.05 535165.05 86178.00 1445.83 209283.08 138953.70 53592.54 49215.00 63362.17 62107.852025815.61 4%54 - General Materials & Suppl 1161247.53 396258.04 0.00 0.00 276369.52 97955.74 31877.39 896.75 50283.20 10927.44356731.53 1%55 - Travel & Conf/Meeting Ex 139626.18 (11325.38) 0.00 0.00 90067.68 81385.61 56802.82 0.00 (31.06) 205.687106592.85 15%56 - Fixed Charges 215325.05 11121.82 419149.33 5983273.75 11920.99 85776.00 0.00 0.00 379725.91 300.00606079.64 1%57 - Utilities 3471.13 597732.51 0.00 0.00 1362.09 1031.65 0.00 0.00 2097.22 385.048312333.97 18%58 - Capital Outlay 239593.15 5382.94 7983513.71 0.00 0.00 83844.17 0.00 0.00 0.00 0.007645933.37 16%59 - Other Expenditures 159039.57 0.00 0.00 0.00 47370.37 6718125.05 220296.69 0.00 0.00 501101.69
47026225.3817591056.37 2456968.44 8488841.04 5984719.58 1382420.46 8543555.87 362569.44 50111.75 1590954.73 575027.70Total 5 - Expenses
7 - Transfers
0.00 ‐‐‐‐71 - Transfers to Other Funds (16281.48) 0.00 0.00 0.00 0.00 16281.48 0.00 0.00 0.00 0.000.00 ‐‐‐‐72 - Transfer from Other Fund 16281.48 0.00 0.00 0.00 0.00 (16281.48) 0.00 0.00 0.00 0.00
0.000.00 0.00 0.00 0.00 0.00 0.00 0.00 0.00 0.00 0.00Total 7 - Transfers
Net By Fund 740580.47 328315.92 23981600.62 (2519507.69) (60732.76) (186658.59) 53118.79 (11429.22) (205394.91) 655997.08 22775889.71
0 - Other 0.000.00 0.00 0.00 0.00 0.00 0.00 0.00 0.00 0.00 0.00 0%1 - Instruction 9763630.199576726.37 0.00 0.00 0.00 64899.79 121994.03 10.00 0.00 0.00 0.00 21%2 - Academic Support 1983144.781980116.94 0.00 0.00 0.00 2969.68 0.00 58.16 0.00 0.00 0.00 4%3 - Student Services 1841392.561619296.59 0.00 0.00 0.00 5349.66 11630.74 205115.57 0.00 0.00 0.00 4%4 - Public Service/Continuing 3252428.74479411.39 0.00 0.00 0.00 1066084.23 1702252.07 4681.05 0.00 0.00 0.00 7%6 - Auxiliary Services 398873.01163152.59 0.00 0.00 0.00 233316.29 0.00 2404.13 0.00 0.00 0.00 1%7 - Operations & Mtce of Plant 10954760.869.70 2237801.30 7983513.71 0.00 0.00 61665.43 0.00 0.00 671770.72 0.00 23%8 - Institutional Support 12085261.793738311.95 219167.14 505327.33 5984719.58 9800.81 11163.63 72447.89 50111.75 919184.01 575027.70 26%9 - Scholarships, Grants, Waiv 6746733.4534030.84 0.00 0.00 0.00 0.00 6634849.97 77852.64 0.00 0.00 0.00 14%
Net By Fund 47026225.3817591056.37 2456968.44 8488841.04 5984719.58 1382420.46 8543555.87 362569.44 50111.75 1590954.73 575027.70
Date Produced: 25-Jan-10 Page 1 of 1Produced By: Financial Services Department

Data Current as of: 25-Jan-10Period: FY2010, Jul/2009 - Dec/2009Summarized by Function & Subclass (xx-Xxxxx-XXxxx), Breakdown by FundActuals Report, All Funds
Fund 01 Education Fund
Budget $ Actual $Actual as a
% of BudgetEncumbered $ Difference $
Expenditures by Function
18,747,912.53 9,576,726.37 51%182,706.69 8,988,479.471 Instruction4,208,271.36 1,980,116.94 47%114,281.49 2,113,872.932 Academic Support3,230,544.76 1,619,296.59 50%3,668.59 1,607,579.583 Student Services1,001,980.82 479,411.39 48%33,846.70 488,722.734 Public Service/Continuing Ed294,400.56 163,152.59 55%87.12 131,160.856 Auxiliary Services
0.00 9.70 ‐‐‐‐0.00 (9.70)7 Operations & Mtce of Plant7,267,693.38 3,738,311.95 51%1,108,793.58 2,420,587.858 Institutional Support
77,500.00 34,030.84 44%0.00 43,469.169 Scholarships, Grants, Waivers
Net for Fund 01 34,828,303.41 17,591,056.37 15,793,862.871,443,384.17
Revenues
41 17,655,833.00 8,708,982.51Local Government Sources 49%0.00 8,946,850.49
42 4,747,645.00 2,011,993.79State Government Sources 42%0.00 2,735,651.21
44 12,133,667.00 7,344,323.66Student Tuition & Fees 61%0.00 4,789,343.34
45 64,560.00 31,949.03Sales & Service Fees 49%0.00 32,610.97
47 232,000.00 36,399.08Investment Revenue 16%0.00 195,600.92
49 51,200.00 197,988.77Other Revenue 387%0.00 (146,788.77)
34,884,905.00Total Revenues 18,331,636.84 53%0.00 16,553,268.16
Expenses51 24,235,798.41 11,910,019.09Salaries 49%600.00 12,325,179.32
52 4,951,378.00 3,021,845.62Employee Benefits 61%11,550.00 1,917,982.38
53 1,807,541.00 740,889.05Contractual Services 41%613,225.53 453,426.42
54 2,372,516.00 1,161,247.53General Materials & Supplies 49%544,021.59 667,246.88
55 412,170.00 139,626.18Travel & Conf/Meeting Expense 34%10,015.99 262,527.83
56 490,655.00 215,325.05Fixed Charges 44%217,362.56 57,967.39
57 11,795.00 3,471.13Utilities 29%10,778.10 (2,454.23)
58 211,000.00 239,593.15Capital Outlay 114%35,777.04 (64,370.19)
59 335,450.00 159,039.57Other Expenditures 47%53.36 176,357.07
34,828,303.41Total Expenses 17,591,056.37 51%1,443,384.17 15,793,862.87
Transfers
71 0.00 (16,281.48)Transfers to Other Funds ‐‐‐‐0.00 16,281.48
72 0.00 16,281.48Transfer from Other Funds ‐‐‐‐0.00 (16,281.48)
0.00Total Transfers 0.00 ‐‐‐‐‐0.00 0.00
Net for Fund 01 56,601.59 740,580.47 759,405.29(1,443,384.17)
Date Produced: 25-Jan-10 Page 1 of 12Produced By: Financial Services Department

Data Current as of: 25-Jan-10Period: FY2010, Jul/2009 - Dec/2009Summarized by Function & Subclass (xx-Xxxxx-XXxxx), Breakdown by FundActuals Report, All Funds
Fund 02 Operations & Maintenance Fund
Budget $ Actual $Actual as a
% of BudgetEncumbered $ Difference $
Expenditures by Function
4,781,349.87 2,237,801.30 47%1,440,881.83 1,102,666.747 Operations & Mtce of Plant371,350.00 219,167.14 59%132,723.05 19,459.818 Institutional Support
Net for Fund 02 5,152,699.87 2,456,968.44 1,122,126.551,573,604.88
Revenues
41 2,790,267.00 1,466,651.24Local Government Sources 53%0.00 1,323,615.76
42 857,496.00 316,280.61State Government Sources 37%0.00 541,215.39
44 1,598,048.00 970,514.85Student Tuition & Fees 61%0.00 627,533.15
47 4,000.00 1,276.01Investment Revenue 32%0.00 2,723.99
48 2,000.00 0.00Gifts, Grants & Bequests 0%0.00 2,000.00
49 13,200.00 30,561.65Other Revenue 232%0.00 (17,361.65)
5,265,011.00Total Revenues 2,785,284.36 53%0.00 2,479,726.64
Expenses51 1,474,777.87 680,153.58Salaries 46%0.00 794,624.29
52 381,722.00 242,479.88Employee Benefits 64%0.00 139,242.12
53 1,080,500.00 535,165.05Contractual Services 50%515,327.12 30,007.83
54 454,950.00 396,258.04General Materials & Supplies 87%110,613.17 (51,921.21)
55 (6,750.00) (11,325.38)Travel & Conf/Meeting Expense 168%0.00 4,575.38
56 14,000.00 11,121.82Fixed Charges 79%6,870.46 (3,992.28)
57 1,489,300.00 597,732.51Utilities 40%862,315.76 29,251.73
58 261,000.00 5,382.94Capital Outlay 2%65,542.98 190,074.08
59 3,200.00 0.00Other Expenditures 0%12,935.39 (9,735.39)
5,152,699.87Total Expenses 2,456,968.44 48%1,573,604.88 1,122,126.55
Net for Fund 02 112,311.13 328,315.92 1,357,600.09(1,573,604.88)
Date Produced: 25-Jan-10 Page 2 of 12Produced By: Financial Services Department

Data Current as of: 25-Jan-10Period: FY2010, Jul/2009 - Dec/2009Summarized by Function & Subclass (xx-Xxxxx-XXxxx), Breakdown by FundActuals Report, All Funds
Fund 03 Operations & Maint-Restricted
Budget $ Actual $Actual as a
% of BudgetEncumbered $ Difference $
Expenditures by Function
12,229,800.00 7,983,513.71 65%691,173.14 3,555,113.157 Operations & Mtce of Plant0.00 505,327.33 ‐‐‐‐0.00 (505,327.33)8 Institutional Support
Net for Fund 03 12,229,800.00 8,488,841.04 3,049,785.82691,173.14
Revenues
41 3,487,833.00 32,275,915.85Local Government Sources 925%0.00 (28,788,082.85)
47 181,000.00 69,525.81Investment Revenue 38%0.00 111,474.19
48 250,000.00 125,000.00Gifts, Grants & Bequests 50%0.00 125,000.00
49 0.00 0.00Other Revenue ‐‐‐‐0.00 0.00
3,918,833.00Total Revenues 32,470,441.66 829%0.00 (28,551,608.66)
Expenses
53 0.00 86,178.00Contractual Services ‐‐‐‐0.00 (86,178.00)
56 0.00 419,149.33Fixed Charges ‐‐‐‐0.00 (419,149.33)
58 12,229,800.00 7,983,513.71Capital Outlay 65%691,173.14 3,555,113.15
12,229,800.00Total Expenses 8,488,841.04 69%691,173.14 3,049,785.82
Net for Fund 03 (8,310,967.00) 23,981,600.62 (31,601,394.48)(691,173.14)
Date Produced: 25-Jan-10 Page 3 of 12Produced By: Financial Services Department

Data Current as of: 25-Jan-10Period: FY2010, Jul/2009 - Dec/2009Summarized by Function & Subclass (xx-Xxxxx-XXxxx), Breakdown by FundActuals Report, All Funds
Fund 04 Bond and Interest Fund
Budget $ Actual $Actual as a
% of BudgetEncumbered $ Difference $
Expenditures by Function
6,711,885.00 5,984,719.58 89%0.00 727,165.428 Institutional Support
Net for Fund 04 6,711,885.00 5,984,719.58 727,165.420.00
Revenues
41 6,801,360.00 3,463,125.65Local Government Sources 51%0.00 3,338,234.35
47 42,000.00 2,086.24Investment Revenue 5%0.00 39,913.76
6,843,360.00Total Revenues 3,465,211.89 51%0.00 3,378,148.11
Expenses
53 2,400.00 1,445.83Contractual Services 60%0.00 954.17
56 6,709,485.00 5,983,273.75Fixed Charges 89%0.00 726,211.25
6,711,885.00Total Expenses 5,984,719.58 89%0.00 727,165.42
Net for Fund 04 131,475.00 (2,519,507.69) 2,650,982.690.00
Date Produced: 25-Jan-10 Page 4 of 12Produced By: Financial Services Department

Data Current as of: 25-Jan-10Period: FY2010, Jul/2009 - Dec/2009Summarized by Function & Subclass (xx-Xxxxx-XXxxx), Breakdown by FundActuals Report, All Funds
Fund 05 Auxiliary Enterprises Fund
Budget $ Actual $Actual as a
% of BudgetEncumbered $ Difference $
Expenditures by Function
136,448.00 64,899.79 48%50,833.59 20,714.621 Instruction7,600.00 2,969.68 39%0.00 4,630.322 Academic Support
22,861.00 5,349.66 23%209.96 17,301.383 Student Services2,249,819.48 1,066,084.23 47%158,525.37 1,025,209.884 Public Service/Continuing Ed328,047.39 233,316.29 71%27,732.98 66,998.126 Auxiliary Services64,970.00 9,800.81 15%167,246.33 (112,077.14)8 Institutional Support
Net for Fund 05 2,809,745.87 1,382,420.46 1,022,777.18404,548.23
Revenues
41 0.00 0.00Local Government Sources ‐‐‐‐0.00 0.00
42 77,700.00 0.00State Government Sources 0%0.00 77,700.00
44 352,129.00 177,755.04Student Tuition & Fees 50%0.00 174,373.96
45 1,716,900.00 674,579.90Sales & Service Fees 39%0.00 1,042,320.10
47 25,000.00 600.25Investment Revenue 2%0.00 24,399.75
48 9,500.00 2,529.00Gifts, Grants & Bequests 27%0.00 6,971.00
49 819,163.00 466,223.51Other Revenue 57%0.00 352,939.49
3,000,392.00Total Revenues 1,321,687.70 44%0.00 1,678,704.30
Expenses
51 1,187,941.87 611,680.44Salaries 51%0.00 576,261.43
52 200,790.00 134,366.29Employee Benefits 67%167,246.33 (100,822.62)
53 554,278.00 209,283.08Contractual Services 38%98,842.14 246,152.78
54 617,272.00 276,369.52General Materials & Supplies 45%109,026.54 231,875.94
55 121,344.00 90,067.68Travel & Conf/Meeting Expense 74%22,866.92 8,409.40
56 22,400.00 11,920.99Fixed Charges 53%6,566.30 3,912.71
57 3,400.00 1,362.09Utilities 40%0.00 2,037.91
59 102,320.00 47,370.37Other Expenditures 46%0.00 54,949.63
2,809,745.87Total Expenses 1,382,420.46 49%404,548.23 1,022,777.18
Net for Fund 05 190,646.13 (60,732.76) 655,927.12(404,548.23)
Date Produced: 25-Jan-10 Page 5 of 12Produced By: Financial Services Department

Data Current as of: 25-Jan-10Period: FY2010, Jul/2009 - Dec/2009Summarized by Function & Subclass (xx-Xxxxx-XXxxx), Breakdown by FundActuals Report, All Funds
Fund 06 Restricted Purposes Fund
Budget $ Actual $Actual as a
% of BudgetEncumbered $ Difference $
Expenditures by Function
403,387.63 121,994.03 30%10,197.66 271,195.941 Instruction16,937.00 0.00 0%0.00 16,937.002 Academic Support39,500.00 11,630.74 29%1.00 27,868.263 Student Services
3,704,606.91 1,702,252.07 46%257,206.23 1,745,148.614 Public Service/Continuing Ed1,080.00 61,665.43 5710%0.00 (60,585.43)7 Operations & Mtce of Plant
0.00 11,163.63 ‐‐‐‐599.50 (11,763.13)8 Institutional Support9,009,896.00 6,634,849.97 74%(1,822.45) 2,376,868.489 Scholarships, Grants, Waivers
Net for Fund 06 13,175,407.54 8,543,555.87 4,365,669.73266,181.94
Revenues
41 428,300.00 102,796.56Local Government Sources 24%0.00 325,503.44
42 2,755,042.00 1,840,831.77State Government Sources 67%0.00 914,210.23
43 9,687,525.62 6,247,764.18Federal Government Sources 64%0.00 3,439,761.44
45 0.00 2,510.10Sales & Service Fees ‐‐‐‐0.00 (2,510.10)
48 139,600.00 117,717.63Gifts, Grants & Bequests 84%0.00 21,882.37
49 161,735.00 45,277.04Other Revenue 28%0.00 116,457.96
13,172,202.62Total Revenues 8,356,897.28 63%0.00 4,815,305.34
Expenses51 2,177,641.32 956,302.64Salaries 44%0.00 1,221,338.68
52 397,847.32 380,181.31Employee Benefits 96%0.00 17,666.01
53 301,897.00 138,953.70Contractual Services 46%133,048.50 29,894.80
54 300,491.70 97,955.74General Materials & Supplies 33%7,684.55 194,851.41
55 172,868.73 81,385.61Travel & Conf/Meeting Expense 47%12,378.11 79,105.01
56 191,992.00 85,776.00Fixed Charges 45%110,305.40 (4,089.40)
57 4,140.00 1,031.65Utilities 25%0.00 3,108.35
58 0.00 83,844.17Capital Outlay ‐‐‐‐0.00 (83,844.17)
59 9,628,529.47 6,718,125.05Other Expenditures 70%2,765.38 2,907,639.04
13,175,407.54Total Expenses 8,543,555.87 65%266,181.94 4,365,669.73
Transfers
71 0.00 16,281.48Transfers to Other Funds ‐‐‐‐0.00 (16,281.48)
72 0.00 (16,281.48)Transfer from Other Funds ‐‐‐‐0.00 16,281.48
0.00Total Transfers 0.00 ‐‐‐‐‐0.00 0.00
Net for Fund 06 (3,204.92) (186,658.59) 449,635.61(266,181.94)
Date Produced: 25-Jan-10 Page 6 of 12Produced By: Financial Services Department

Data Current as of: 25-Jan-10Period: FY2010, Jul/2009 - Dec/2009Summarized by Function & Subclass (xx-Xxxxx-XXxxx), Breakdown by FundActuals Report, All Funds
Fund 08 General Fixed Assets
Budget $ Actual $Actual as a
% of BudgetEncumbered $ Difference $
Expenditures by Function
6,768,000.00 3,836,974.36 57%0.00 2,931,025.640 Other0.00 (22,178.74) ‐‐‐‐0.00 22,178.741 Instruction0.00 (8,045,179.14) ‐‐‐‐0.00 8,045,179.147 Operations & Mtce of Plant0.00 (244,976.09) ‐‐‐‐0.00 244,976.098 Institutional Support
Net for Fund 08 6,768,000.00 (4,475,359.61) 11,243,359.610.00
Revenues
49 0.00 40,000.00Other Revenue ‐‐‐‐0.00 (40,000.00)
0.00Total Revenues 40,000.00 ‐‐‐‐‐0.00 (40,000.00)
Expenses
58 6,768,000.00 (4,475,359.61)Capital Outlay ‐66%0.00 11,243,359.61
6,768,000.00Total Expenses (4,475,359.61) ‐66%0.00 11,243,359.61
Net for Fund 08 (6,768,000.00) 4,515,359.61 (11,283,359.61)0.00
Date Produced: 25-Jan-10 Page 7 of 12Produced By: Financial Services Department

Data Current as of: 25-Jan-10Period: FY2010, Jul/2009 - Dec/2009Summarized by Function & Subclass (xx-Xxxxx-XXxxx), Breakdown by FundActuals Report, All Funds
Fund 09 General Long-Term Debt
Budget $ Actual $Actual as a
% of BudgetEncumbered $ Difference $
Expenditures by Function
0.00 (405,253.34) ‐‐‐‐0.00 405,253.340 Other0.00 (5,281,019.00) ‐‐‐‐0.00 5,281,019.008 Institutional Support
Net for Fund 09 0.00 (5,686,272.34) 5,686,272.340.00
Revenues
41 0.00 (30,512,710.50)Local Government Sources ‐‐‐‐0.00 30,512,710.50
0.00Total Revenues (30,512,710.50) ‐‐‐‐‐0.00 30,512,710.50
Expenses
53 0.00 (75,678.00)Contractual Services ‐‐‐‐0.00 75,678.00
56 0.00 (5,610,594.34)Fixed Charges ‐‐‐‐0.00 5,610,594.34
0.00Total Expenses (5,686,272.34) ‐‐‐‐‐0.00 5,686,272.34
Net for Fund 09 0.00 (24,826,438.16) 24,826,438.160.00
Date Produced: 25-Jan-10 Page 8 of 12Produced By: Financial Services Department

Data Current as of: 25-Jan-10Period: FY2010, Jul/2009 - Dec/2009Summarized by Function & Subclass (xx-Xxxxx-XXxxx), Breakdown by FundActuals Report, All Funds
Fund 10 Trust and Agency Fund
Budget $ Actual $Actual as a
% of BudgetEncumbered $ Difference $
Expenditures by Function
24,168.00 0.00 0%0.00 24,168.000 Other0.00 10.00 ‐‐‐‐0.00 (10.00)1 Instruction
800.00 58.16 7%0.00 741.842 Academic Support270,841.00 205,115.57 76%5,919.67 59,805.763 Student Services14,450.00 4,681.05 32%0.00 9,768.954 Public Service/Continuing Ed38,025.00 2,404.13 6%4,166.85 31,454.026 Auxiliary Services
125,132.00 72,447.89 58%0.00 52,684.118 Institutional Support175,000.00 77,852.64 44%0.00 97,147.369 Scholarships, Grants, Waivers
Net for Fund 10 648,416.00 362,569.44 275,760.0410,086.52
Revenues
44 242,129.00 168,159.57Student Tuition & Fees 69%0.00 73,969.43
45 22,102.00 200.00Sales & Service Fees 1%0.00 21,902.00
47 20,000.00 483.20Investment Revenue 2%0.00 19,516.80
48 6,900.00 18.00Gifts, Grants & Bequests 0%0.00 6,882.00
49 366,800.00 246,827.46Other Revenue 67%0.00 119,972.54
657,931.00Total Revenues 415,688.23 63%0.00 242,242.77
Expenses
53 99,872.00 53,592.54Contractual Services 54%2,485.00 43,794.46
54 83,902.00 31,877.39General Materials & Supplies 38%6,500.40 45,524.21
55 31,585.00 56,802.82Travel & Conf/Meeting Expense 180%(193.51) (25,024.31)
59 433,057.00 220,296.69Other Expenditures 51%1,294.63 211,465.68
648,416.00Total Expenses 362,569.44 56%10,086.52 275,760.04
Net for Fund 10 9,515.00 53,118.79 (33,517.27)(10,086.52)
Date Produced: 25-Jan-10 Page 9 of 12Produced By: Financial Services Department

Data Current as of: 25-Jan-10Period: FY2010, Jul/2009 - Dec/2009Summarized by Function & Subclass (xx-Xxxxx-XXxxx), Breakdown by FundActuals Report, All Funds
Fund 11 Audit Fund
Budget $ Actual $Actual as a
% of BudgetEncumbered $ Difference $
Expenditures by Function
57,087.00 50,111.75 88%7,872.00 (896.75)8 Institutional Support
Net for Fund 11 57,087.00 50,111.75 (896.75)7,872.00
Revenues
41 69,757.00 38,510.76Local Government Sources 55%0.00 31,246.24
47 2,000.00 77.38Investment Revenue 4%0.00 1,922.62
49 0.00 94.39Other Revenue ‐‐‐‐0.00 (94.39)
71,757.00Total Revenues 38,682.53 54%0.00 33,074.47
Expenses53 57,087.00 49,215.00Contractual Services 86%7,872.00 0.00
54 0.00 896.75General Materials & Supplies ‐‐‐‐0.00 (896.75)
57,087.00Total Expenses 50,111.75 88%7,872.00 (896.75)
Net for Fund 11 14,670.00 (11,429.22) 33,971.22(7,872.00)
Date Produced: 25-Jan-10 Page 10 of 12Produced By: Financial Services Department

Data Current as of: 25-Jan-10Period: FY2010, Jul/2009 - Dec/2009Summarized by Function & Subclass (xx-Xxxxx-XXxxx), Breakdown by FundActuals Report, All Funds
Fund 12 Liability, Protection, & Settlement
Budget $ Actual $Actual as a
% of BudgetEncumbered $ Difference $
Expenditures by Function
1,447,814.95 671,770.72 46%94,061.57 681,982.667 Operations & Mtce of Plant1,158,950.00 919,184.01 79%50,897.25 188,868.748 Institutional Support
Net for Fund 12 2,606,764.95 1,590,954.73 870,851.40144,958.82
Revenues
41 2,096,256.00 1,373,225.45Local Government Sources 66%0.00 723,030.55
44 3,300.00 39.00Student Tuition & Fees 1%0.00 3,261.00
47 74,000.00 10,151.68Investment Revenue 14%0.00 63,848.32
49 66,182.00 2,143.69Other Revenue 3%0.00 64,038.31
2,239,738.00Total Revenues 1,385,559.82 62%0.00 854,178.18
Expenses
51 793,319.95 414,487.17Salaries 52%0.00 378,832.78
52 915,495.00 681,030.12Employee Benefits 74%23,057.60 211,407.28
53 137,850.00 63,362.17Contractual Services 46%63,783.06 10,704.77
54 156,100.00 50,283.20General Materials & Supplies 32%28,161.58 77,655.22
55 12,000.00 (31.06)Travel & Conf/Meeting Expense 0%582.50 11,448.56
56 384,000.00 379,725.91Fixed Charges 99%11,625.00 (7,350.91)
57 7,000.00 2,097.22Utilities 30%4,149.92 752.86
58 201,000.00 0.00Capital Outlay 0%13,599.16 187,400.84
59 0.00 0.00Other Expenditures ‐‐‐‐0.00 0.00
2,606,764.95Total Expenses 1,590,954.73 61%144,958.82 870,851.40
Net for Fund 12 (367,026.95) (205,394.91) (16,673.22)(144,958.82)
Date Produced: 25-Jan-10 Page 11 of 12Produced By: Financial Services Department
Data Current as of: 25-Jan-10Period: FY2010, Jul/2009 - Dec/2009Summarized by Function & Subclass (xx-Xxxxx-XXxxx), Breakdown by FundActuals Report, All Funds
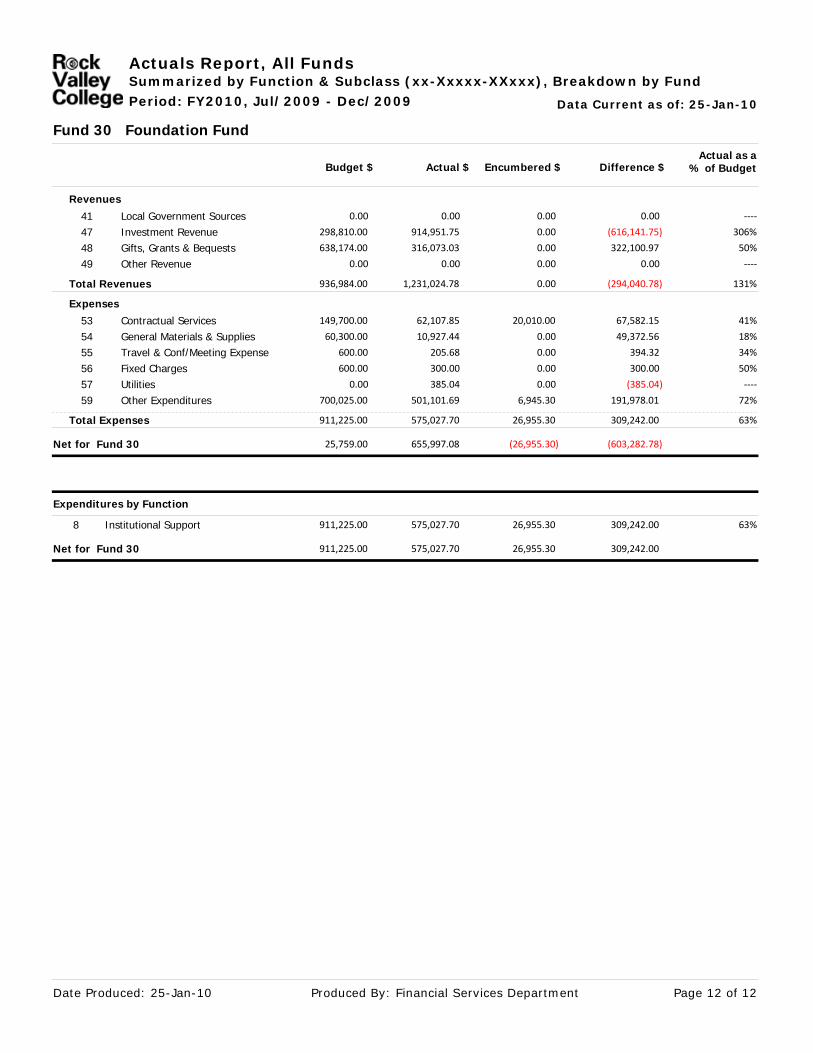
Fund 30 Foundation Fund
Budget $ Actual $Actual as a
% of BudgetEncumbered $ Difference $
Expenditures by Function
911,225.00 575,027.70 63%26,955.30 309,242.008 Institutional Support
Net for Fund 30 911,225.00 575,027.70 309,242.0026,955.30
Revenues
41 0.00 0.00Local Government Sources ‐‐‐‐0.00 0.00
47 298,810.00 914,951.75Investment Revenue 306%0.00 (616,141.75)
48 638,174.00 316,073.03Gifts, Grants & Bequests 50%0.00 322,100.97
49 0.00 0.00Other Revenue ‐‐‐‐0.00 0.00
936,984.00Total Revenues 1,231,024.78 131%0.00 (294,040.78)
Expenses
53 149,700.00 62,107.85Contractual Services 41%20,010.00 67,582.15
54 60,300.00 10,927.44General Materials & Supplies 18%0.00 49,372.56
55 600.00 205.68Travel & Conf/Meeting Expense 34%0.00 394.32
56 600.00 300.00Fixed Charges 50%0.00 300.00
57 0.00 385.04Utilities ‐‐‐‐0.00 (385.04)
59 700,025.00 501,101.69Other Expenditures 72%6,945.30 191,978.01
911,225.00Total Expenses 575,027.70 63%26,955.30 309,242.00
Net for Fund 30 25,759.00 655,997.08 (603,282.78)(26,955.30)
Date Produced: 25-Jan-10 Page 12 of 12Produced By: Financial Services Department