Embed Size (px)
Citation preview

The Built Environment Around Schools and the Lifestyle Habits of Young People
STATE OF KNOWLEDGE AND QUÉBEC OVERVIEW


The Built Environment Around Schools and the Lifestyle Habits of Young People
STATE OF KNOWLEDGE AND QUÉBEC OVERVIEW
Direction du développement des individus et des communautés
July 2014

AUTHORS
Benoît Lalonde Éric Robitaille
PROJECT COORDINATION
Johanne Laguë
LAYOUT
Souad Ouchelli
TRANSLATION
The translation of this publication was made possible with funding from the Public Health Agency of Canada.
LINGUISTIC REVISION
Michael Keeling National Collaborating Centre for Healthy Public Policy
This document is available in its entirety in electronic format (PDF) on the Institut national de santé publique du Québec Web site at: http://www.inspq.qc.ca. Reproductions for private study or research purposes are authorized by virtue of Article 29 of the Copyright Act. Any other use must be authorized by the Government of Québec, which holds the exclusive intellectual property rights for this document. Authorization may be obtained by submitting a request to the central clearing house of the Service de la gestion des droits d’auteur of Les Publications du Québec, using the online form at http://www.droitauteur.gouv.qc.ca/en/autorisation.php or by sending an e-mail to [email protected]. Information contained in the document may be cited provided that the source is mentioned. LEGAL DEPOSIT – 3rd QUARTER 2015 BIBLIOTHÈQUE ET ARCHIVES NATIONALES DU QUÉBEC LIBRARY AND ARCHIVES CANADA ISBN: 978-2-550-71425-5 (FRENCH PDF) ISBN: 978-2-550-73686-8 (PDF)
© Gouvernement du Québec (2015)

The Built Environment Around Schools and the Lifestyle Habits of Young People: State of Knowledge and Québec Overview
Institut national de santé publique du Québec I
Table of contents
List of tables .......................................................................................................................................... III
Highlights ................................................................................................................................................ 1
1 Introduction .................................................................................................................................... 3
2 Scientific literature review ............................................................................................................. 52.1 Research strategy and inclusion criteria ............................................................................... 5
2.2 Results ................................................................................................................................... 5
2.2.1 The built environment and physical activity among students .................................. 6
2.2.2 The built environment and student weight ............................................................. 10
2.2.3 The built environment and student eating habits ................................................... 11
2.2.4 Discussion ............................................................................................................... 14
3 Analysis of characteristics of the built environment around schools in Québec .................. 173.1 School databases ................................................................................................................ 17
3.2 Spatial scale ......................................................................................................................... 17
3.3 Built and service environment measurements .................................................................... 18
3.4 Food environment measurements ....................................................................................... 19
3.4.1 Accessibility of fast food restaurants ...................................................................... 19
3.4.2 Accessibility of convenience stores ........................................................................ 19
3.5 Built environment measurements related to physical activity ............................................. 19
3.5.1 Walkability ............................................................................................................... 19
3.5.2 Accessibility of recreational facilities ...................................................................... 20
3.5.3 Accessibility of bike paths ...................................................................................... 20
3.6 Schools located in urban centres or rural areas .................................................................. 20
4 Findings ......................................................................................................................................... 214.1 Fast food restaurants and convenience stores ................................................................... 21
4.2 Recreational facilities ........................................................................................................... 22
4.3 Walkability and bike paths ................................................................................................... 23
4.4 Overview of Québec and its regions ................................................................................... 24
5 Discussion ..................................................................................................................................... 29
6 Implications for future initiatives ................................................................................................ 336.1 Actions with potential to create built environments that promote a physically active
lifestyle. ................................................................................................................................ 33
6.2 Actions designed to facilitate the creation of healthy food environments .......................... 34
7 Conclusion .................................................................................................................................... 37
References ........................................................................................................................................... 39
Appendix 1 Method of calculation of the walkability index ....................................................... 47


The Built Environment Around Schools and the Lifestyle Habits of Young People: State of Knowledge and Québec Overview
Institut national de santé publique du Québec III
List of tables
Table 1 Summary of findings from studies on the built environment and physical activity among students .................................................................................................................. 9
Table 2 Summary of findings from studies on the built environment and student weight ............ 11
Table 3 Summary of findings from studies on the built environment and student eating habits ................................................................................................................................. 13
Table 4 Average number of fast food restaurants (FFRs) and proportion of schools with at least one fast food restaurant within a radius of 500 and 750 metres, by level of instruction, location (urban, rural) and lowincome cut-off (LICO) index .......................... 21
Table 5 Average number of convenience stores (CSs) and proportion of schools with at least one convenience store within a radius of 500 and 750 metres, by level of instruction, location (urban, rural) and lowincome cut-off (LICO) index .......................... 22
Table 6 Average number of recreational facilities (RFs) and proportion of schools with at least one facility within a radius of 500 and 750 metres, by level of instruction, location (urban, rural) and lowincome cut-off (LICO) index ............................................. 23
Table 7 Proportion of schools with high walkability within a radius of 500 and 750 metres, by level of instruction, location (urban, rural) and lowincome cut-off (LICO) index ........ 23
Table 8 Proportion of schools with at least one bike path (BP) within a radius of 500 and 750 metres, by level of instruction, location (urban, rural) and lowincome cut-off (LICO) index ....................................................................................................................... 24
Table 9 Proportion of schools with at least one fast food restaurant, one convenience store, one recreational facility, one bike path and high walkability within a 500-metre radius, by health region .......................................................................................... 25
Table 10 Proportion of schools located in urban centres with at least one fast food restaurant, one convenience store, one recreational facility, one bike path and high walkability within a 500-metre radius, by health region ............................................ 26
Table 11 Proportion of schools located in rural areas with at least one fast food restaurant, one convenience store, one recreational facility and one bike path within a 500-metre radius, by health region .......................................................................................... 27
Table 12 Values of variables constituting the walkability index by quartiles within a 500 m radius ................................................................................................................................. 49
Table 13 Values of variables constituting the walkability index by quartiles within a 750 m radius ................................................................................................................................. 49


The Built Environment Around Schools and the Lifestyle Habits of Young People: State of Knowledge and Québec Overview
Institut national de santé publique du Québec 1
Highlights
Most scientific studies show meaningful connections between the characteristics of the built environment and the eating habits, physical activity and body weight of young people.
The factor that appears to be most closely associated with students' weight and eating habits is the density of convenience stores and fast food restaurants in the vicinity of the school.
The characteristics of the built environment that have the greatest influence on physical activity are accessibility to recreational facilities and, to a lesser extent, the walkability of the neighbourhood.
Just over half (58.9%) of public schools in Québec are located less than 750 metres from a fast food restaurant.
Close to two-thirds (63.6%) of public schools have at least one convenience store within a radius of 750 metres.
Half (51.2%) of public schools have at least one recreational facility less than 750 metres away.
Close to two-thirds (63.3%) of the most disadvantaged public schools have a built environment characterized by high walkability.
Less than half (42.7%) of public schools have at least one bike path within a radius of 750 metres.
Actions could be initiated to establish environments more conducive to healthy lifestyle habits around schools.

The Built Environment Around Schools and the Lifestyle Habits of Young People: State of Knowledge and Québec Overview
Institut national de santé publique du Québec 3
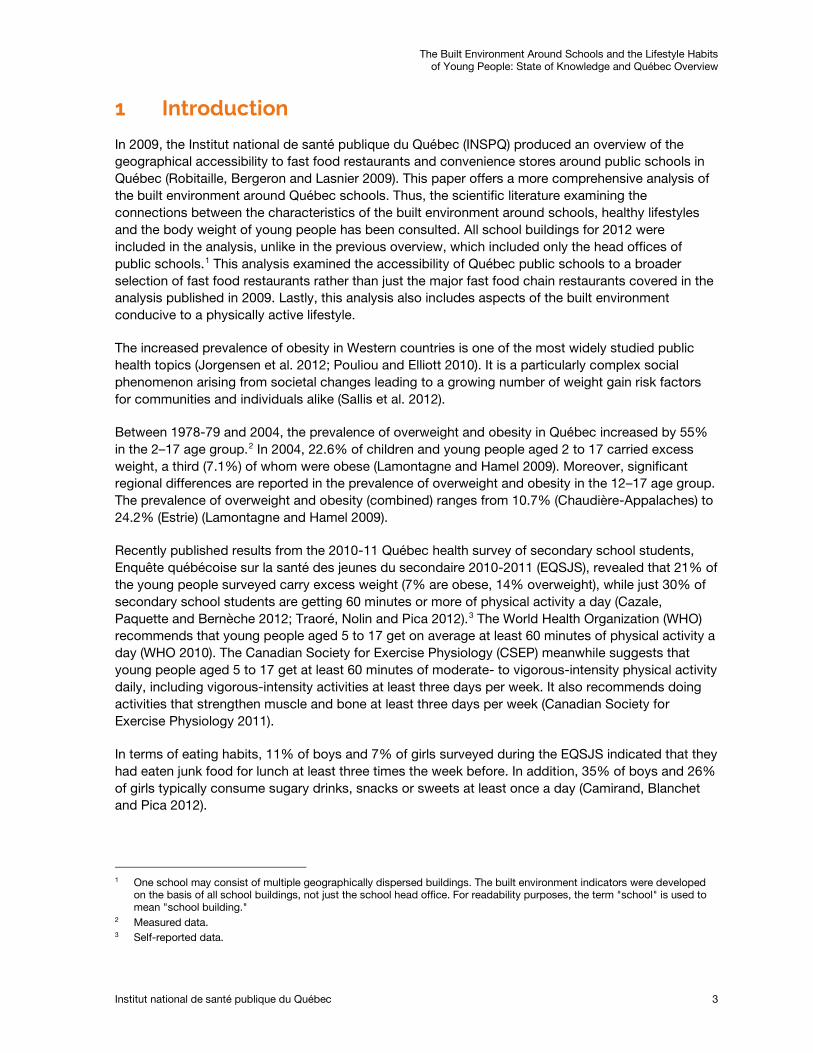
1 Introduction
In 2009, the Institut national de santé publique du Québec (INSPQ) produced an overview of the geographical accessibility to fast food restaurants and convenience stores around public schools in Québec (Robitaille, Bergeron and Lasnier 2009). This paper offers a more comprehensive analysis of the built environment around Québec schools. Thus, the scientific literature examining the connections between the characteristics of the built environment around schools, healthy lifestyles and the body weight of young people has been consulted. All school buildings for 2012 were included in the analysis, unlike in the previous overview, which included only the head offices of public schools.1
The increased prevalence of obesity in Western countries is one of the most widely studied public health topics (Jorgensen et al. 2012; Pouliou and Elliott 2010). It is a particularly complex social phenomenon arising from societal changes leading to a growing number of weight gain risk factors for communities and individuals alike (Sallis et al. 2012).
This analysis examined the accessibility of Québec public schools to a broader selection of fast food restaurants rather than just the major fast food chain restaurants covered in the analysis published in 2009. Lastly, this analysis also includes aspects of the built environment conducive to a physically active lifestyle.
Between 1978-79 and 2004, the prevalence of overweight and obesity in Québec increased by 55% in the 2–17 age group.2
Recently published results from the 2010-11 Québec health survey of secondary school students, Enquête québécoise sur la santé des jeunes du secondaire 2010-2011 (EQSJS), revealed that 21% of the young people surveyed carry excess weight (7% are obese, 14% overweight), while just 30% of secondary school students are getting 60 minutes or more of physical activity a day (Cazale, Paquette and Bernèche 2012; Traoré, Nolin and Pica 2012).
In 2004, 22.6% of children and young people aged 2 to 17 carried excess weight, a third (7.1%) of whom were obese (Lamontagne and Hamel 2009). Moreover, significant regional differences are reported in the prevalence of overweight and obesity in the 12–17 age group. The prevalence of overweight and obesity (combined) ranges from 10.7% (Chaudière-Appalaches) to 24.2% (Estrie) (Lamontagne and Hamel 2009).
3
In terms of eating habits, 11% of boys and 7% of girls surveyed during the EQSJS indicated that they had eaten junk food for lunch at least three times the week before. In addition, 35% of boys and 26% of girls typically consume sugary drinks, snacks or sweets at least once a day (Camirand, Blanchet and Pica 2012).
The World Health Organization (WHO) recommends that young people aged 5 to 17 get on average at least 60 minutes of physical activity a day (WHO 2010). The Canadian Society for Exercise Physiology (CSEP) meanwhile suggests that young people aged 5 to 17 get at least 60 minutes of moderate- to vigorous-intensity physical activity daily, including vigorous-intensity activities at least three days per week. It also recommends doing activities that strengthen muscle and bone at least three days per week (Canadian Society for Exercise Physiology 2011).
1 One school may consist of multiple geographically dispersed buildings. The built environment indicators were developed
on the basis of all school buildings, not just the school head office. For readability purposes, the term "school" is used to mean "school building."
2 Measured data. 3 Self-reported data.

The Built Environment Around Schools and the Lifestyle Habits of Young People: State of Knowledge and Québec Overview
4 Institut national de santé publique du Québec
There are multiple factors to explain these trends. Most researchers look at three categories of factors: individual, behavioural/lifestyle, and environmental (Bauman et al. 2012). For this last category of factors, the physical environment—defined, on the one hand, as natural environment and, on the other hand, as built environment—is a key actionable target. In a school context, the built environment refers to all the human-altered elements external to the individual but within the confines of the school and its neighbourhood.
The main objective of this paper is to review the scientific literature on the association between the characteristics of the built environment around schools and the lifestyle habits of young people. The second objective is to describe the characteristics of the built environment and the environment of lifestyle-related services in the vicinity of schools in Québec. More specifically, we will analyze the accessibility of fast food restaurants, convenience stores, recreational facilities and bike paths as well as walkability around schools. We will then analyze this environment based on the school's level of deprivation, its location (urban and rural, health region) and its level of instruction (primary, secondary, vocational and adult).

The Built Environment Around Schools and the Lifestyle Habits of Young People: State of Knowledge and Québec Overview
Institut national de santé publique du Québec 5
2 Scientific literature review
The purpose of this literature review is to identify studies that examine the association between objectively-measured built environment aspects in a school setting and at least one individual variable associated with lifestyle or weight. More specifically, the review aims to pinpoint the indicators used to study the influence that the built environment and services around schools have on students' weight and lifestyle habits.
2.1 Research strategy and inclusion criteria
The literature search was carried out in the bibliographic databases MEDLINE, CINAHL Plus, Academic Search Premier, SPORTDiscus, Compendex, Inspec, GEOBASE and Web of Science using an equation composed of 117 keywords or phrases. To limit the number of results, the search was restricted to English- or French-language scientific journals published since 2003. Then, certain articles were picked out of the bibliographies of relevant studies or literature reviews.
To be included in the analysis of the existing literature, the publications must have explored the association between a measure of physical activity, weight, or sedentary or food-related behaviour and at least one objectively-measured variable of the built environment and services in the vicinity of the school. This association between the dependent and independent variables must have been subject to a statistical test, affording the possibility of determining a degree of significance. Lastly, the studies must have focused on only school-age subjects (aged 5 to 18).
2.2 Results
The article selection and elimination rounds were carried out in three stages based on the title, the summary and the body of the text. During the first search, 1,206 article titles were selected. After elimination based on duplicates and titles, 308 summaries were read. Of this number, 243 were dismissed for failing to meet the aforementioned criteria. Nine articles were included in the process after having been picked out from the literature reviews. Finally, 56 articles were read, either in whole or in part, with 23 being retained in the end because they met the selection criteria.
The information extracted from the articles includes the names of the authors, the name of the publication, the year of publication, the region or country where the study was conducted, the sample size, the study design, the age of the students, the spatial scale, the objectively-measured built environment and service indicators, and individual measurements (dependent variables). Lastly, information was extracted regarding the association observed between the dependent variable and the objectively-measured variables of the built environment and services in the vicinity of the school.
Of the 23 articles selected, 1 was published in 2004, 1 in 2008, 3 in 2009, 4 in 2011, 11 in 2012, and 3 since early 2013. Twelve studies were carried out in Canada, eight in the United States, one in Great Britain, one in the Netherlands, and one in Germany. Of the 23 studies, only one had a longitudinal design.
The Built Environment Around Schools and the Lifestyle Habits of Young People: State of Knowledge and Québec Overview
6 Institut national de santé publique du Québec
The boundaries of the neighbourhoods around schools were calculated by way of a geographic information system (GIS) using buffers with a threshold distance ranging from 400 metres to 5 kilometres in network distance4
This research attempts to understand the relationship between school neighbourhood characteristics, the amount of physical activity young people get on a daily basis, the amount of reported screen time, the mode of transportation to school, the location where lunch is eaten, food consumption and body mass index (BMI).
terms. Two studies measured the characteristics of the environments along the routes from school to the places of residence. Six studies measured the shortest distance to the nearest food outlet.
The built environment characteristics analyzed include road network features, the level of urban disorder5 in the neighbourhood, the density of recreational facilities, parks and green spaces, the age of the neighbourhood, the density and mix of land uses,6
2.2.1 THE BUILT ENVIRONMENT AND PHYSICAL ACTIVITY AMONG STUDENTS
the presence of trees or sidewalks, car traffic volume and speed, the number or density of food outlets in the vicinity of schools, and the network distance between the nearest food outlet and the school.
Of the studies analyzed, eight reported a strong association between physical activity and at least one objectively measured characteristic of the built environment near schools (Table 1). This is particularly the case in the study by Tucker et al. (2009), which examined the influence that the presence of parks, mixed land uses and the density of recreational facilities has on moderate-to-vigorous physical activity (MVPA) among 811 students from 21 schools in London, Ontario. The authors concluded that, considering seasonality and demographic factors, students who have two or more recreational facilities in the vicinity of their school are 1.7 times more likely to be ranked in the highest MVPA quartile. In addition, considering only after-school physical activity, these students get on average 16.49 minutes more of physical activity a day (Tucker et al. 2009).
Reaching similar findings, the study carried out by Trilk et al. (2011) explores the influence that the school environment has on physical activity among 1,394 adolescents. The results show that girls who attend a school with five or more recreational facilities nearby are reported to get far more physical activity per day after 3 p.m. than girls who attend a school with fewer than five facilities in the vicinity. Moreover, girls who attend a school in a rural setting with five or more recreational facilities nearby are reported to get 12% more physical activity per day than girls who attend a school in a rural setting with fewer than five facilities in the vicinity (Trilk et al. 2011).
Similarly, Cradock et al. (2009) reached the conclusion that a greater density of jobs in areas of interest to young people (retail, food services, movie theatres, social services, arts and culture) is associated with more physical activity. Initially, the study attempted to determine whether there is a relationship between the MVPA of 152 Boston students (average age 13.7) and the level of car traffic, the presence of parks and green spaces, residential density and jobs in areas of interest to young people around their school (Cradock et al. 2009).
4 Network distance: Method of calculating the distance between a place of origin and a destination based on the
characteristics of the road network. 5 Graffiti, broken windows, abandoned buildings. 6 Presence of multiple land uses in a given area making destinations easily accessible.

The Built Environment Around Schools and the Lifestyle Habits of Young People: State of Knowledge and Québec Overview
Institut national de santé publique du Québec 7
Using a sample of 224 young girls attending a disadvantaged school with a high representation of African-American students, Hager et al. (2013) explored the association between physical activity and the density of food outlets, recreational facilities and urban disorder. The study found that the number of fast food restaurants and sports facilities around school is positively associated with the number of daily MVPA minutes. The authors explained this last finding by offering the hypothesis, put forth in various other studies, that the presence of mixed land uses and the density of commercial space may be a predictor of physical activity in urban centres. According to them, adolescents with access to destinations that interest them near their school may use active transportation to get there and may, in some cases, get physical activity as a result, thereby increasing their total MVPA (Hager et al. 2013).
In the city of Delmenhorst, Germany, Buck et al. (2011) analyzed the association between physical activity among 596 students aged 6 to 10 and the environment around schools. Using an estimation method to assess density, the authors developed a walkability index comprising mixed land uses and the density of sidewalks, intersections, public transit stations, public playgrounds, recreational facilities, parks and green spaces. In reporting the results, the authors identified positive and meaningful yet weak links between the density of destinations dedicated to physical activity, the degree of walkability and the duration of physical activities outside of school among the young people surveyed (Buck et al. 2011).
Some of the studies reviewed measured the association between active transportation used to get to school and the walkability of the built environment. This is notably the case in the study by Braza et al. (2004), where the authors revealed the existence of a relationship between the proportion of 2,993 students aged 9 to 11 (attending 34 California schools, who either walk or bike to school) and population and intersection density. The study shows that a 10% increase in population density in the vicinity of the school is associated with a 0.7% to 1.6% increase in students either walking or biking to school (with all other independent variables remaining constant) (Braza, Shoemaker and Seeley 2004).
The research conducted by Larsen et al. (2012) used a sample of 614 students aged 11 to 13 from 21 schools in London, Ontario. Initially, the study attempted to illustrate the existence of an association between the mode of transportation to get to school and the presence of trees along the street, intersection density, sidewalk length, residential density and mixed land uses. The probability of using active transportation to get to school is, according to the authors, related to the distance between school and the place of residence, the male gender and highly mixed land uses in the vicinity of the school.
Gropp et al. (2012) reached similar conclusions. In their study, the built environment variable most strongly associated with active transportation was the average length of streets in the vicinity of the school. This study initially attempted to measure the association between the mode of transportation used to get to school by 3,997 students living 1.6 km away or less and the presence of sidewalks, speed limits, intersection density, the proportion of three-way or multiple-way intersections out of the total number of intersections (including dead ends) and the average length of road segments in the vicinity of the school.
Three studies showed a significant relationship between physical activity or active transportation to get to school and at least one built environment characteristic, but the direction of this relationship is not as expected. This is particularly the case of a study carried out by Hobin et al. (2012), who, using a sample of 22,117 students from 76 Ontario secondary schools, attempted to measure the association between the presence of recreational facilities, parks, fast food restaurants and shopping

The Built Environment Around Schools and the Lifestyle Habits of Young People: State of Knowledge and Québec Overview
8 Institut national de santé publique du Québec
malls, mixed land uses, road network connectivity, residential density and MVPA among young people. In contrast to the previously described studies, the findings of this research show a negative association between mixed land uses, the walkability of the neighbourhood around schools and the amount of physical activity. These findings run counter to hypotheses suggesting that an environment with more mixed use and better walkability is conducive to physical activity. One explanation offered by the authors is that the measurement of MVPA, which takes into account total physical activity, may inaccurately measure physical activity related to active transportation, a component more strongly related to mixed land uses and the walkability of a neighbourhood (Hobin et al. 2012).
Using a sample of 8,535 students aged approximately 11 to 15 from 180 Canadian schools, Mecredy et al. (2011) examined the association between the time spent on physical activity outside of school and road network connectivity. The analyses show that young people attending a school with a well-connected road network in their neighbourhood report lower physical activity than young people attending a school with a less connected road network in their neighbourhood. The authors explain these findings by suggesting that schools with a more connected road network in the neighbourhood are located in urban centres where there is a lack of parks and outdoor recreational facilities and where neighbourhood road safety is not conducive to physical activity.
Lastly, Stone et al. (2012) reached similar conclusions as they attempted to determine the existence of a relationship between the year of construction (pre- or post-1946) of the neighbourhood where the school is located and physical activity among 713 Toronto students living 1.6 km or less from their school. Since neighbourhoods built after 1946 (suburbs) are less dense and more segregated in terms of land use, with a road network that is not as well connected, the hypotheses put forth by the authors suggest that they are less conducive to physical activity. Contrary to what was initially expected, boys are more active on weekdays in the suburbs, that is to say, in neighbourhoods built after 1946. Boys, but also girls, are significantly more active on weekends only in the suburbs. The authors conclude that physical activity is more strongly influenced by socioeconomic status than by the type of neighbourhood, that physical activity varies in time, and that the influence of the environment is different for boys and for girls.

The Built Environment Around Schools and the Lifestyle Habits of Young People: State of Knowledge and Québec Overview
Institut national de santé publique du Québec 9
Table 1 Summary of findings from studies on the built environment and physical activity among students
Studies Sample Measured built environment characteristics
Findings
Tucker et al. (2009)
811 students (21 schools); aged 11–13; Canada (London, Ontario)
Presence of parks Mixed land uses Density of recreational facilities
Density of recreational facilities↑ → MVPA ↑
Trilk et al. (2011) 1,394 students (22 schools); Grade 12 (girls); United States (South Carolina)
Number of recreational facilities Number of recreational facilities↑ → PA ↑
Cradock et al. (2009)
152 students; (average age 13.7); United States (Boston)
Level of car traffic Presence of parks and green spaces Residential density Density of jobs in areas of interest to young people
Job density↑ → MVPA ↑
Hager et al. (2013) 224 students (12 schools); Grades 6–7 (average age 12.1); United States
Density of food outlets Density of physical activity facilities Urban disorder
Fast food restaurants and density of facilities ↑ → MVPA ↑
Buck et al. (2011) 596 students; aged 6–10; Germany (Delmenhorst)
Walkability Density of physical activity facilities
Walkability and density of facilities ↑ → PA ↑
Braza et al. (2004) 2,993 students (34 schools); aged 9–11; United States (California)
Population density Intersection density
Population density Intersection density↑ → AT ↑
Larsen et al. (2012)
614 students (21 schools); aged 11–13; Canada (London, Ontario)
Presence of trees on street Intersection density Length of sidewalks Residential density Mixed land uses
Mixed land uses↑ → AT ↑
Gropp et al. (2012)
3,997 students (161 schools); aged 11–15; Canada
Presence of sidewalks Speed limit Intersection density Proportion of intersections Average length of road segments
Average length of streets ↑ → AT ↑
Hobin et al. (2012) 22,117 students (76 schools); Grades 9–12; Canada (Ontario)
Presence of recreational facilities Presence of parks Presence of fast food restaurants Presence of shopping malls Mixed land uses Road network connectivity Residential density
Walkability and mixed land uses ↑ → MVPA ↓
Mecredy et al. (2011)
8,535 students (180 schools); aged 11–15; Canada
Road network connectivity Road network connectivity ↑ → PA ↓
Stone et al. (2012) 713 students; average age 11; Canada (Toronto, Ontario)
Age of neighbourhood, pre- or post-1946
Age of neighbourhood, post-1946 → PA ↑
MVPA: moderate-to-vigorous physical activity. PA: physical activity. AT: active transportation. →: significant association.

The Built Environment Around Schools and the Lifestyle Habits of Young People: State of Knowledge and Québec Overview
10 Institut national de santé publique du Québec
To sum up, the findings of these studies show significant associations between a number of characteristics of the built environment around schools and physical activity among young people. These associations are in the expected direction in 8 out of 11 studies.
2.2.2 THE BUILT ENVIRONMENT AND STUDENT WEIGHT
Three studies observed a meaningful relationship between student weight and accessibility of certain food outlets (Table 2). In a study involving a sample of 926,018 students from 6,362 U.S. schools, Sanchez et al. (2012) measured the association between BMI adjusted for age and gender and the number of convenience stores and fast food restaurants in the vicinity of schools. The authors concluded that there is a weak relationship between weight and the presence of this type of food outlets near schools. Student gender, grade level and ethnic background appear to play a role in this association, according to the authors. Based on the findings, children attending a school with one or more fast food restaurants in the vicinity have a 2% greater chance of being overweight or obese than those attending a school without a fast food restaurant nearby. In the adjusted model, each additional convenience store in the vicinity of the school was associated with an estimated 1% increase in the prevalence of overweight (Sanchez et al. 2012).
Previously, Davis and Carpenter (2009) had reached similar findings by analyzing the relationship between accessibility to food outlets and weight among 500,000 U.S. students aged 12 to 17. According to the study, young people whose school was located near a fast food restaurant had a 1.06 times greater chance of being overweight and 1.07 times greater chance of being obese than children attending a school without a fast food restaurant nearby (Davis and Carpenter 2009).
Lastly, Gilliland et al. (2012) attempted to measure the association between BMI adjusted for age and gender among 1,048 students in London, Ontario, aged 10 to 14 and the number of recreational facilities, convenience stores and fast food restaurants nearby and on the way between home and school. In their analysis of the results, the authors indicate that, by controlling for the measured built environment characteristics relative to the students' place of residence, the presence of fast food restaurants along the way between home and school is positively associated with higher BMI (Gilliland et al. 2012).
Just one study shows no significant relationship between objectively measured accessibility to food outlets7
7 Small stores offering packaged foods, restaurants, grocery stores and others.
and BMI. Harris et al. (2011) initially attempted to determine the existence of a relationship between the overweight and obese status (estimated based on BMI adjusted for age and gender) of 552 students from 11 secondary schools in Maine and accessibility to food outlets (Harris et al. 2011).

The Built Environment Around Schools and the Lifestyle Habits of Young People: State of Knowledge and Québec Overview
Institut national de santé publique du Québec 11
Table 2 Summary of findings from studies on the built environment and student weight
Studies Sample Measured built environment characteristics
Findings
Sanchez et al. (2012) 926,018 students (6362 schools); aged 10–15; United States
Number of convenience stores Number of fast food restaurants
Number of fast food restaurants↑ → Overweight or obesity ↑ Number of convenience stores ↑→ Overweight ↑
Davis and Carpenter (2009)
Over 500,000 students; aged 12–17; United States (California)
Presence of fast food restaurants
Presence of fast food restaurants ↑ → Obesity ↑
Gilliland et al. (2012) 1,048 students (28 schools); aged 10–14; Canada (London, Ontario)
Number of convenience stores Number of fast food restaurants
Presence of fast food restaurants ↑ → BMI ↑
Harris et al. (2011) 552 students (11 schools); Grades 9–12; United States (Maine)
Accessibility of food outlets Accessibility ↑ ≠ Overweight/Obesity
BMI: body mass index. →: significant association. ≠: no significant association.
The results of the scientific literature review show that few studies analyzed the connection between the characteristics of the built environment around schools and students' body weight. Only four studies were reviewed. Of the four, three showed significant connections, in the expected direction, between the presence or number of fast food restaurants or convenience stores and students' body weight.
2.2.3 THE BUILT ENVIRONMENT AND STUDENT EATING HABITS
Six studies showed a significant relationship between eating habits and at least one characteristic of the food environment near schools (Table 3). In their study, van Hulst et al. (2012) measured the association between the consumption of fruits, vegetables, sugary drinks, take-out food and snacks by 512 Québec students aged 8 to 10 and the density and proximity of grocery stores, fast food restaurants and convenience stores. Using an index characterizing the food environment, the researchers reached the conclusion that a high relative density of fast food restaurants and convenience stores around school is associated with a low-nutrient diet (van Hulst et al. 2012).
In a longitudinal study, Smith et al. (2013) examined the relationship between the eating habits of 524 students from London, England, aged 11 to 12 (start of study) and 15 to 16 (end of study) and the number of fast food restaurants, grocery stores and convenience stores as well as the closest distance from their school to these food outlets. The study concluded that there is a correlation between the distance to food outlets and the indicators of eating habits. Greater accessibility to restaurants offering take-out is associated with a poorer diet, whereas greater accessibility to grocery stores is associated with a healthier diet (Smith et al. 2013).
The research by Seliske et al. (2013) measured the association between where 6,971 Canadian students aged 13 to 16 have their lunch and the number of convenience stores and fast food restaurants in the vicinity of the school. The findings confirm that there is an association between the presence of food retailers near school and the eating habits of young people during their lunch breaks (Seliske et al. 2013).

The Built Environment Around Schools and the Lifestyle Habits of Young People: State of Knowledge and Québec Overview
12 Institut national de santé publique du Québec
Lastly, van der Horst et al. (2008) analyzed the association between the eating habits (consumption of sugary drinks and snacks) of 1,263 students aged 12 to 15 from Rotterdam, Netherlands, and the shortest distance to and the presence near school of various types of food outlets. The authors concluded that there is an association between the distance to the nearest food outlet, the number of small food stores and the consumption of sugary drinks, but in the opposite direction. In other words, the greater the number of small stores, the lower the consumption of sugary drinks. The authors explain that this is due to the variety of products offered in the food environment around schools with multiple small food stores.
The existence of associations was demonstrated in two studies on the eating habits of 810 London students aged 11 to 14 (He, Tucker, Gilliland et al. 2012; He, Tucker, Irwin et al. 2012). The results of the analyses show a meaningful association between a higher number of fast food restaurants around school and the probability of buying food in this type of restaurant. The authors also discovered meaningful associations between the proximity of convenience stores, fast food options at schools and the high density of fast food restaurants around schools and a less healthy diet.
Just one study showed no significant relationship between eating habits and accessibility to food outlets. Using a survey of 2,724 students from 20 secondary schools in Minnesota, Forsyth et al. (2012) unsuccessfully attempted to show the existence of an association between eating at fast food restaurants and the number and distance of the nearest fast food restaurants in the vicinity of the school (Forsyth, Van Riper et al. 2012).

The Built Environment Around Schools and the Lifestyle Habits of Young People: State of Knowledge and Québec Overview
Institut national de santé publique du Québec 13
Table 3 Summary of findings from studies on the built environment and student eating habits
Studies Sample Measured built environment characteristics
Findings
van Hulst et al. (2012) 512 students; aged 8–10; Canada
Number of convenience stores Number of fast food restaurants (food environment index)
Relative density of fast food restaurants and convenience stores ↑ → less healthy diet
Smith et al. (2013) 524 students aged 11–12 (2001); aged 15–16 (2005); England (London)
Number and distance of nearest fast food restaurants, grocery stores and convenience stores
Distance to grocery stores ↓ → healthier diet Distance to fast food restaurants ↓ → less healthy diet
Seliske et al. (2013) 6,971 students (158 schools); aged 13–16; Canada
Presence of convenience stores Presence of fast food restaurants
Presence of convenience stores and fast food restaurants ↑ → lunch places
van der Horst et al. (2008)
1,293 students (15 schools); aged 12–15; Netherlands (Rotterdam)
Presence in neighbourhood and distance to nearest fast food restaurant, convenience store, supermarket, bakery/pastry shop, and greengrocer
Number of small food outlets ↑ → sugary drinks ↓
He, Tucker, Gilliland et al. 2012
810 students (21 schools); aged 11–14; Canada (London, Ontario)
Distance to nearest convenience store or fast food restaurant, number of fast food restaurants, mixed land uses
Presence of convenience stores and density and presence of fast food restaurants ↑ → less healthy diet
He, Tucker, Irwin et al. 2012
Density and presence of fast food restaurants
Density of fast food restaurants ↑ → purchases in fast food restaurants ↑
Forsyth et al. (2012) 2,724 students (20 schools); Grades 9–12 (average age 14.5); United States (Minneapolis/St. Paul)
Presence of fast food restaurants Presence of fast food restaurants ↑ ≠ eating at fast food restaurants
→: significant association. ≠: no significant association.
In conclusion, some studies were identified for possible links between the characteristics of the food environment around schools and the eating habits of young people. In four studies, the findings showed significant associations between exposure to fast food restaurants and convenience stores and consumption of sugary drinks and a less healthy diet, as well as significant associations between exposure to grocery stores or small food outlets and a healthier diet. The findings of two studies revealed significant associations between the presence of fast food restaurants or convenience stores and their use as places for lunch and for food purchases by young people.

The Built Environment Around Schools and the Lifestyle Habits of Young People: State of Knowledge and Québec Overview
14 Institut national de santé publique du Québec
2.2.4 DISCUSSION
Certain observations may be drawn from the scientific literature. Firstly, scientific interest in studying the influence of the environment around schools on the lifestyle habits and weight of young people appears to be growing. Moreover, there are many objective built environment measurements and a diverse set of methods to calculate them. Studies also tend to lean more towards an association between the school environment and lifestyle habits rather than weight. Lastly, the association between the indicators of the built environment around schools and lifestyle habits is not clear, given that the intensity and direction of this relationship are not always as expected. The factor that appears to be most closely associated with students' weight and eating habits is the density of convenience stores and fast food restaurants in the vicinity of the school. In turn, the characteristics of the built environment that appear to have the greatest influence on physical activity are accessibility to recreational facilities and, to a lesser extent, the walkability of the neighbourhood.
All studies present a certain number of methodological limitations that require caution in interpreting results. Firstly, there are no standards for measuring the neighbourhood around a school, since varying school neighbourhood boundaries may lead to differences in the levels of association observed. Some studies state that threshold distances imposed on neighbourhood delineation do not offer a complete picture of the facilities and services accessible to students, some of whom may have access to a car or bicycle.
In a number of studies, authors expressed frustration at not being able to characterize the environment in the vicinity of the place of residence. Moreover, since many students live close to school, it becomes difficult to distinguish the school environment from that of the place of residence.
The studies overwhelmingly used GIS to measure the environments around schools. These techniques are generally not useful for measuring the perceived environment, which may play an important part in the lifestyle habits of students. Few studies have taken the quality of urban design into account. The quality of facilities cannot be measured objectively. Focusing on the density, distance, absence or presence of facilities does not mean that their quality can be measured objectively.
Most studies used self-reported data on weight and lifestyle, which have a limited validity. This type of data is a potential source of information bias. In their responses to questions, subjects may introduce bias linked to social desirability. For example, adolescents have a tendency to overestimate their height and underestimate their weight. Moreover, using BMI adjusted for age and gender may be affected by the particular ethnic background and body shape of the person being surveyed.
Nearly all the studies adopted a cross-disciplinary design, making it impossible to determine the presence of a causal link between the characteristics of the school environment and students' weight or lifestyle habits. In addition, this type of study precludes analysis of the relationship between the length of the students' exposure to their environment and the dependent variable. Lastly, in some studies, the small size, characteristics or even geographical context of the sample make it impossible to infer results for other groups of students.
The most commonly used built environment indicators are related to the food environment around school, including the number or density of food outlets near school and the shortest distance to the nearest food outlet.

The Built Environment Around Schools and the Lifestyle Habits of Young People: State of Knowledge and Québec Overview
Institut national de santé publique du Québec 15
Many studies characterized the road network near school using mostly intersection density as an indicator. Moreover, a fairly large number of studies characterized the density and mixed nature of land uses in the vicinity of schools.
Lastly, few studies attempted to characterize the urban design or quality of the environment near schools. When they did do so, they used urban disorder, the presence of trees on the street, car traffic characteristics in school zones and the average age of buildings in the neighbourhood.


The Built Environment Around Schools and the Lifestyle Habits of Young People: State of Knowledge and Québec Overview
Institut national de santé publique du Québec 17
3 Analysis of characteristics of the built environment around schools in Québec8
The purpose of this section is to analyze the characteristics of the built and service environments around public schools in Québec. The results will be presented based on the school's level of deprivation, its location (urban and rural, health region) and its level of instruction (primary, secondary, vocational and adult). The aim is to identify schools with greater exposure to fast food restaurants and convenience stores in the surrounding area and without a high degree of walkability or easy access to recreational facilities.
3.1 School databases
For this study, two databases from the Québec ministère de l’Éducation, du Loisir et du Sport (MELS) [ministry of education, leisure and sport] were used. The first contains information on the street addresses of public schools in Québec. This database was paired with another containing data on the schools' level of deprivation (n = 3427).9
The MELS calculates the deprivation indices for schools in 69 school boards across Québec on an annual basis. It uses these indices to implement policies with a view to reducing the impact of student deprivation in primary and secondary public schools. The data used to calculate these indices are taken from the Census of Canada and focus on the situation of families with children aged 0 to 18 living in neighbourhoods in which students attend various schools. One of these indices is the low-income cut-off (LICO), which measures the proportion of families living around or below the low-income cut-off (Baillargeon 2005). The LICO index is calculated for each school, and schools are ranked from 1 (somewhat disadvantaged) to 10 (very disadvantaged). This database contains 2,123 primary schools, 498 secondary schools, 153 primary/secondary schools, and 653 adult education centres. Since they do not have deprivation measurements, special status school boards (Cree, Kativik and Littoral) and schools with fewer than 30 students or with an MELS–MSSS (MSSS is Québec’s ministry of health and social services) agreement are excluded (MELS 2014). Using MELS data to define schools' level of deprivation also meant that private schools had to be discounted. Pairing these two databases resulted in the creation of a database comprising 3,427 geolocalized schools. In this paper, a school is considered disadvantaged if it falls within the lowest three deciles of deprivation calculated by the MELS. The aim is to compare the situation of very disadvantaged schools to that of all less disadvantaged schools.
3.2 Spatial scale
An approach was used to calculate the indicators: the establishment of buffers around school buildings according to distance thresholds of 500 and 750 metres from built environment elements. A buffer10 is a surface within a predetermined Euclidean11 or network12
8 The data on built environment characteristics used in this paper can be accessed at the following Web address:
distance based on a starting location, in this case, the school (Figure 1).
http://www.inspq.qc.ca/environnement-bati. 9 Since school buildings are sometimes spread over several sites, the indicators of the built environment and services near
Québec schools were established for the neighbourhood of 3,427 school buildings, indiscriminately called "schools" in this paper.
10 Also called "radius," "catchment area," "zone of influence" or "service area."

The Built Environment Around Schools and the Lifestyle Habits of Young People: State of Knowledge and Québec Overview
18 Institut national de santé publique du Québec
Since it more closely resembles the environment experienced by children in modelling the school neighbourhood (Gilliland et al. 2012; Seliske et al. 2013), network distance (excluding the highway network and including trails) was used to establish the buffers. Easy to operationalize and reproduce, and less sensitive to variations in road network density, this sausage network buffer method for threshold distances of 500 and 750 metres was used to calculate the built and service environment measurements (Forsyth, Van Riper et al. 2012; Forsyth, Larson et al. 2012). In establishing the indicators, the buffers were used to include a number of nearby built environment elements, thereby enabling proportion, average or index calculations.
Figure 1 Radius of 500 and 750 metres around school (network distance)
3.3 Built and service environment measurements
To characterize the built and service environments around public schools in Québec, accessibility of fast food restaurants, convenience stores, bike paths and recreational facilities as well as walkability were selected on the basis of the previously conducted scientific review.
11 As the crow flies. 12 Along the road network.
The Built Environment Around Schools and the Lifestyle Habits of Young People: State of Knowledge and Québec Overview
Institut national de santé publique du Québec 19
3.4 Food environment measurements
3.4.1 ACCESSIBILITY OF FAST FOOD RESTAURANTS
Information on fast food restaurant locations was taken from the MAPAQ (Québec’s ministry of agriculture, fisheries and food) food sales licence database for 2009. This database compiles information on various food service licences. The licences are categorized according to type, which is connected to the nature of the food-related work (categories). Companies that hold a licence are also classified according to a description of their line of business. For the built environment overview, the classifications "food stand," "take-out restaurant" and "quick-service restaurant" were grouped together. Food stands are defined as motorized vehicles or establishments where light meals are prepared and served, and either eaten on the spot or taken away. This category includes food trucks. Take-out restaurants are establishments whose main business is the preparation and sale of food to be taken away or delivered. Lastly, quick-service restaurants are establishments with a service counter and occasionally tables whose main business is the preparation of a specialty menu, such as burgers, chicken and hot dogs. This process resulted in the identification of 4,826 fast food restaurants in Québec.
3.4.2 ACCESSIBILITY OF CONVENIENCE STORES
Information on convenience store locations was taken from the MAPAQ food sales licence database for 2009. This database compiles information on various retail sale licences. The licences are categorized according to type, which is connected to the nature of the food-related work (categories). Companies that hold a licence are also classified according to a description of their line of business. We grouped together all convenience stores, with and without gasoline sales. Most convenience store-type businesses are grouped in the MAPAQ database under a licence category specific to grocery stores, convenience stores and greengrocers, defined as establishments whose surface area rarely exceeds 400 square metres and where a wide variety of food products are sold. However, convenience store-type businesses are also listed in several other categories (e.g., butcher shops, delis, pastry shops, bakeries, etc.). We therefore carried out an automated and a manual search of various "convenience store" businesses. The automatic processes consisted in using certain keywords (convenience stores, accommodation, etc.) or company names (Proprio, Boni-Soir, Couche-Tard, etc.) to search in various database fields. This process resulted in the identification of 4,330 convenience stores in Québec.
3.5 Built environment measurements related to physical activity
3.5.1 WALKABILITY
Four variables comprise the walkability index used to characterize school neighbourhoods. These four components are mixed land use, intersection density, housing density and destination density. The last of these variables was calculated by dividing the total number of property assessment units related to manufacturing industry, residential, commercial, cultural, recreational and leisure functions by the number of km2 of the buffer size. A high index value suggests high walkability around the school. The location, surface area, type of use and number of assessed housing units were taken from Québec's property assessment roll (MAMROT 2007). The location of intersections was taken from the Adresses Québec (AQ) network file (Adresses Québec 2012). Distances were calculated using the AQ network file (Adresses Québec 2012) and trail segments from the regional geographic use component layer (MRNF 2010). School building locations were taken from the Québec ministère de l’Éducation, du Loisir et des Sports (MELS 2012). The walkability index was then divided into

The Built Environment Around Schools and the Lifestyle Habits of Young People: State of Knowledge and Québec Overview
20 Institut national de santé publique du Québec
quartiles, the first quartile being represented by low walkability and the last by high walkability. Calculation details and the values of the variables comprising the index are available in Appendix 1.
3.5.2 ACCESSIBILITY OF RECREATIONAL FACILITIES
Recreational facilities were located using data from the 2007 property assessment roll. Based on the land use codes that appear in the assessment roll database, various property assessment units could be selected whose main use was related to a variety of sport or leisure facilities.13
3.5.3 ACCESSIBILITY OF BIKE PATHS
This process resulted in the identification of 2,808 recreational facilities in Québec.
Biking, just like walking, helps to incorporate physical activity into students' everyday lives. The characteristics of transportation infrastructure, particularly the presence of paths, are part of the built environment attributes that influence physical activity (Frank, Engelke and Schmid 2003). The bike route network consists of specially developed trails dedicated to bicycle traffic, be it for recreational or transportation purposes, thereby increasing bicycle safety. For this type of transportation equipment, we calculated a dichotomous indicator that shows the presence or absence of bike paths in the vicinity of the school. The geometry of bike route networks was taken from the Québec City bike route network map (2013), the Montréal city bike route geolocation file (2012) and OpenStreetMap, a collaborative mapping site.14
3.6 Schools located in urban centres or rural areas
The geographic breakdown of census population centres was used to determine whether schools were located in urban centres or rural areas. "A population centre has a minimum population concentration of 1,000 persons and a population density of at least 400 persons per square kilometre, based on the current census population count" (Statistics Canada 2012). Schools located outside a population centre are considered rural. Out of the 3,427 schools, 2,480 are located in urban centres and 947 in rural areas. Based on this classification, it is possible to determine the type of environment in which schools with the greatest exposure to fast food restaurants, convenience stores, recreational facilities and walkability are located.
13 Arenas and related activities (ice skating), other recreational activities, other sports activities, other ice activities, other
sports facilities, (downhill and/or cross-country) ski resorts, shooting ranges, general recreation centres, multidisciplinary sports centres (covered), horseback riding, fitness and athletic training, outdoor pools and related activities, indoor pools and related activities, running tracks, beaches, bowling alleys, stadiums, golf courses (with or without a clubhouse and other sports amenities), sports fields and slides.
14 OpenStreetMap is a set of open data available under the Open Data Commons Open Database License (ODbL). The accuracy and validity of the location and geometry of the bike route network outside the cities of Montréal and Québec City are difficult to assess. We encourage the reader to consult the http://www.openstreetmap.org portal for more details on the data collection method and to exercise caution in interpreting the results.

The Built Environment Around Schools and the Lifestyle Habits of Young People: State of Knowledge and Québec Overview
Institut national de santé publique du Québec 21
4 Findings
4.1 Fast food restaurants and convenience stores
Overall, 40% and 59% of public schools in Québec are located less than 500 and 750 metres, respectively, from a fast food restaurant (Table 4). The proportion of schools with a fast food restaurant within a radius of 500 metres or less is higher for secondary schools (46.2%) than for primary schools (38.4%). School exposure to fast food restaurants is far greater in urban centres (46.1%) than in rural areas (23.0%). According to descriptive analyses, it appears that the proportion of schools that have a fast food restaurant within a 500-metre radius is significantly higher for more disadvantaged schools (52%) than for less disadvantaged schools (35.3%). Schools with the most disadvantaged LICO index deciles have, on average, 1.39 fast food restaurants within 500 metres, whereas the most advantaged schools have an average of 0.56 such restaurants.
Table 4 Average number of fast food restaurants (FFRs) and proportion of schools with at least one fast food restaurant within a radius of 500 and 750 metres, by level of instruction, location (urban, rural) and lowincome cut-off (LICO) index
Number of schools
Average number of FFRs within 500 m radius
% of schools with at least one FFR within 500 m radius
Average number of FFRs within 750 m radius
% of schools with at least one FFR within 750 m radius
All schools 3,427 0.78 39.7% 1.64 58.9% Level of instruction
Primary 2,276 0.77 38.4% 1.63 57.1% Secondary 651 1.03 46.2% 2.17 67.7% Vocational 214 0.77 45.8% 1.53 62.6% Adults 385 0.58 35.1% 1.15 55.1%
Location Rural 947 0.27 23.0% 0.42 33.8% Urban 2,480 0.98 46.1% 2.10 68.4%
Deprivation (LICO index) Less disadvantaged (deciles 1 to 7)
2,521 0.56 35.3% 1.11 53.2%
More disadvantaged (deciles 8 to 10)
906 1.39 52.0% 3.10 74.5%
Overall, 47% and 64% of public schools in Québec have at least one convenience store within 500 and 750 metres, respectively (Table 5). Descriptive analysis results show that the proportion of schools with at least one convenience store within a 500-metre radius does not differ significantly between primary and secondary levels of instruction. The average number of convenience stores by school is slightly higher for secondary schools (secondary: 2.08; primary: 1.90). As is the case for fast food restaurants, the proportion of schools with at least one convenience store within a 500-metre radius is far higher in urban centres (55.7%) than in rural areas (23.2%). These descriptive analyses show that the proportion of schools with at least one convenience store within a radius of 500 and 750 metres fluctuates according to the school's level of deprivation. The average number of convenience stores is higher for the most disadvantaged schools in respect of the LICO index (2.18)

The Built Environment Around Schools and the Lifestyle Habits of Young People: State of Knowledge and Québec Overview
22 Institut national de santé publique du Québec
than for the least disadvantaged schools (0.54). The proportion of schools with at least one convenience store within a 750-metre radius is 82.7% for the most disadvantaged schools.
Table 5 Average number of convenience stores (CSs) and proportion of schools with at least one convenience store within a radius of 500 and 750 metres, by level of instruction, location (urban, rural) and lowincome cut-off (LICO) index
Number of schools
Average number of CSs within 500 m radius
% of schools with at least one CS within 500 m radius
Average number of CSs within 750 m radius
% of schools with at least one CS within 750 m radius
All schools 3,427 0.97 46.7% 1.83 63.6% Level of instruction
Primary 2,276 1.04 48.6% 1.90 64.4% Secondary 651 1.00 46.9% 2.08 66.4% Vocational 214 0.71 39.3% 1.51 61.2% Adults 385 0.55 36.4% 1.04 53.2%
Location Rural 947 0.26 23.2% 0.37 32.4% Urban 2,480 1.24 55.7% 2.39 75.5%
Deprivation (LICO index) Less disadvantaged
2,521 0.54 39.0% 0.94 56.7%
More disadvantaged
906 2.18 68.3% 4.29 82.7%
4.2 Recreational facilities
Overall, 38% and 51% of public schools in Québec have at least one recreational facility within 500 and 750 metres, respectively (Table 6). Descriptive analysis results show that the proportion of schools with at least one recreational facility within a 500-metre walking radius does not differ greatly between primary and secondary levels of instruction. The average number of facilities by school is slightly higher for secondary schools (secondary: 0.51; primary: 0.49). The proportion of schools with at least one recreational facility within a 500metre walking radius is slightly higher in urban centres (38.0%) than in rural areas (36.3%). The gap is wider for a radius of 750 metres, in which case the proportion of schools in urban centres climbs to close to 54%, compared to close to 45% in rural areas. These descriptive analyses show that the proportion of schools with at least one recreational facility within a radius of 500 and 750 metres does not fluctuate greatly according to the school's level of deprivation. The average number of facilities is slightly lower for the most disadvantaged schools in respect of the LICO index (0.49) than for the least disadvantaged schools (0.53). The proportion of schools with at least one recreational facility within a 750-metre radius is 51.7% for the most disadvantaged schools and 51.1% for the least disadvantaged.

The Built Environment Around Schools and the Lifestyle Habits of Young People: State of Knowledge and Québec Overview
Institut national de santé publique du Québec 23
Table 6 Average number of recreational facilities (RFs) and proportion of schools with at least one facility within a radius of 500 and 750 metres, by level of instruction, location (urban, rural) and lowincome cut-off (LICO) index
Number of schools
Average number of RFs within 500 m radius
% of schools with at least one RF within 500 m radius
Average number of RFs within 750 m radius
% of schools with at least one RF within 750 m radius
All schools 3,427 0.52 37.5% 0.82 51.2% Level of instruction
Primary 2,276 0.49 36.2% 0.78 49.2% Secondary 651 0.51 37.0% 0.85 52.7% Vocational 214 0.62 43.0% 1.02 57.9% Adults 385 0.59 42.1% 0.90 55.3%
Location Rural 947 0.47 36.3% 0.62 44.6% Urban 2,480 0.54 38.0% 0.90 53.8%
Deprivation (LICO index) Less disadvantaged 2,521 0.53 38.3% 0.82 51.1% More disadvantaged 906 0.49 35.3% 0.85 51.7%
4.3 Walkability and bike paths
Since the walkability indicator was divided into quartiles, 25% of all public schools in Québec are de facto considered to have high walkability (Table 7). The proportion of schools with high walkability within a 500metre radius is higher for secondary schools (32.4%) than for primary schools (25.7%). School exposure to high walkability is far greater in urban centres (34.6%) than in rural areas (0%). No schools in rural areas have high walkability within a radius of 500 and 750 metres. According to descriptive analyses, it appears that the proportion of schools with high walkability within a 500-metre radius is higher for more disadvantaged schools (61.1%) than for less disadvantaged schools (12.0%).
Table 7 Proportion of schools with high walkability within a radius of 500 and 750 metres, by level of instruction, location (urban, rural) and lowincome cut-off (LICO) index
Number of schools % of schools with
high walkability within 500 m radius
% of schools with high walkability
within 750 m radius All schools 3,427 25.0% 25.0%
Level of instruction
Primary 2,276 25.7% 25.3% Secondary 651 32.4% 34.6% Vocational 214 17.3% 19.2% Adults 385 11.7% 10.9%
Location Rural 947 0.0% 0.0% Urban 2,480 34.6% 34.6%
Deprivation (LICO index) Less disadvantaged 2,521 12.0% 11.1% More disadvantaged 906 61.1% 63.7%

The Built Environment Around Schools and the Lifestyle Habits of Young People: State of Knowledge and Québec Overview
24 Institut national de santé publique du Québec
Overall, 33% and 43% of public schools in Québec have at least one bike path within 500 and 750 metres, respectively (Table 8). Descriptive analysis results show that the proportion of schools with at least one bike path within a 500-metre walking radius is slightly higher for secondary schools. As is the case for fast food restaurants and convenience stores, the proportion of schools with at least one bike path within a 500-metre walking radius is far higher in urban centres (40.0%) than in rural areas (15.1%). These descriptive analyses show that the proportion of schools with at least one bike path within a radius of 500 and 750 metres fluctuates tremendously according to the school's level of deprivation. The proportion of schools with at least one bike path within a 750-metre radius is 59.1% for the most disadvantaged schools and 28.7% for less disadvantaged schools.
Table 8 Proportion of schools with at least one bike path (BP) within a radius of 500 and 750 metres, by level of instruction, location (urban, rural) and lowincome cut-off (LICO) index
Number of schools
% of schools with at least one BP within 500 m radius
% of schools with at least one BP within 750 m radius
All schools 3,427 33.1% 42.7% Level of instruction
Primary 2,276 34.1% 42.8% Secondary 651 40.1% 51.8% Vocational 214 28.0% 41.1% Adults 385 20.5% 26.5%
Location Rural 947 15.1% 16.9% Urban 2,480 40.0% 52.5%
Deprivation (LICO index) Less disadvantaged 2,521 28.7% 36.8% More disadvantaged 906 45.4% 59.1%
4.4 Overview of Québec and its regions
The regional overviews indicate the proportions of schools with fast food restaurants, convenience stores, recreational facilities and bike paths as well as high walkability near schools (i.e., within 500 metres). These descriptive analyses were first conducted for all schools and then for schools located in urban centres and rural areas (Tables 9, 10 and 11).
For all schools combined, the results show that the Montréal health region (HR) has the highest proportions of schools with fast food restaurants (53.5%) and convenience stores (73.9%), but also bike paths (65.5%) nearby and high walkability for 84.2% of schools. The lowest proportions for fast food restaurants and convenience stores are reported in the CôteNord HR (28.6% and 29.4%, respectively). Surprisingly, recreational facilities are accessible within a 500-metre radius for 57.9% of schools in the Nord-du-Québec HR and 51.6% in the Laval HR. A bike path exists near only 9.2% of schools in the Côte-Nord HR and 8.5% in the Estrie HR. No schools in the Gaspésie–Îles-de-la-Madeleine HR are located in a built environment with high walkability.

The Built Environment Around Schools and the Lifestyle Habits of Young People: State of Knowledge and Québec Overview
Institut national de santé publique du Québec 25
Table 9 Proportion of schools with at least one fast food restaurant, one convenience store, one recreational facility, one bike path and high walkability within a 500-metre radius, by health region15
Number of schools
% of schools with at least one FFRa within 500 m radius
% of schools with at least one CSb within 500 m radius
% of schools with at least one RFc within 500 m radius
% of schools with at least one BPd within 500 m radius
% of schools with high walkability within 500 m radius
Abitibi-Témiscamingue
128 38.3% 42.2% 38.3% 45.3% 6.3%
Bas-Saint-Laurent
188 35.1% 38.3% 52.7% 27.7% 4.8%
Capitale-Nationale
221 43.9% 49.3% 57.0% 62.0% 29.0%
Chaudière-Appalaches
293 36.2% 33.4% 42.3% 16.7% 10.2%
Côte-Nord 119 28.6% 29.4% 44.5% 9.2% 2.5% Estrie 201 40.8% 43.8% 29.4% 8.5% 11.4% Gaspésie–Îles-de-la-Madeleine
105 40.0% 25.7% 47.6% 50.5% 0.0%
Lanaudière 171 32.2% 50.3% 31.6% 20.5% 18.7% Laurentides 200 40.0% 47.0% 29.0% 27.5% 22.5% Laval 95 41.1% 44.2% 51.6% 30.5% 54.7% Mauricie et Centre-du-Québec
318 37.7% 46.9% 40.9% 17.6% 17.9%
Montérégie 525 37.1% 49.5% 41.1% 23.6% 14.5% Montréal 495 53.5% 73.9% 17.8% 65.5% 84.2% Nord-du-Québec 19 No reports No reports 57.9% No reports No reports Outaouais 176 36.9% 30.7% 27.3% 46.6% 11.4% Saguenay–Lac-Saint-Jean
173 38.7% 39.3% 41.6% 30.1% 12.1%
Grand total 3,427 39.7% 46.7% 37.5% 33.1% 25.0% a FFR: fast food restaurant. b CS: convenience store. c RF: recreational facility. d BP: bike path.
For schools located in urban centres, the results show that the Abitibi-Témiscamingue (68.6%), Bas-Saint-Laurent (60.5%) and Gaspésie–Îles-de-la-Madeleine (60.5%) HRs have the highest proportions of schools with nearby fast food restaurants. For convenience stores, these HRs are Montréal (73.9%), Abitibi-Témiscamingue (66.7%) and Estrie (60.2%). For fast food restaurants, the proportions are much lower than in the rest of Québec for the Montérégie (38.5%), Lanaudière (35.5%) and Laval (41.1%) HRs. The proportion of schools with at least one convenience store nearby is much lower than in the rest of Québec for the Outaouais (36.4%), Laval (44.2%) and Chaudière-Appalaches (44.5%) HRs. Once again, a number of schools in the Nord-du-Québec (64.7%) HR have at least one recreational facility within a 500-metre radius, followed by the Capitale-
15 Dark gray boxes represent values of a less favourable environment relative to the provincial average; green boxes
represent values of a more favourable environment relative to the provincial average.

The Built Environment Around Schools and the Lifestyle Habits of Young People: State of Knowledge and Québec Overview
26 Institut national de santé publique du Québec
Nationale (61.0%) and Bas-Saint-Laurent (54.3%) HRs. A high proportion of schools are located near a bike path in the Montréal (65.5%), Outaouais (59.8%) and Capitale-Nationale (67.4%) HRs. Walkability is high near most schools in the Montréal and Laval HRs, and near many schools in the CapitaleNationale (34.2%), Laurentides (29.2%) and Mauricie et Centre-du-Québec (27.1%) HRs.
Table 10 Proportion of schools located in urban centres with at least one fast food restaurant, one convenience store, one recreational facility, one bike path and high walkability within a 500-metre radius, by health region
Number of schools
% of schools with at least one FFRa within 500 m radius
% of schools with at least one CSb within 500 m radius
% of schools with at least one RFc within 500 m radius
% of schools with at least one BPd within 500 m radius
% of schools with high walkability within 500 m radius
Abitibi-Témiscamingue
51 68.6% 66.7% 43.1% 51.0% 15.7%
Bas-Saint-Laurent
81 60.5% 53.1% 54.3% 37.0% 11.1%
Capitale-Nationale
187 47.1% 55.6% 61.0% 67.4% 34.2%
Chaudière-Appalaches
164 42.1% 44.5% 42.7% 26.2% 18.3%
Côte-Nord 64 43.8% 48.4% 50.0% 7.8% 4.7% Estrie 108 52.8% 60.2% 25.9% 13.9% 21.3% Gaspésie–Îles-de-la-Madeleine
38 60.5% 47.4% 50.0% 47.4% 0.0%
Lanaudière 138 35.5% 55.1% 32.6% 24.6% 23.2% Laurentides 154 46.8% 50.6% 30.5% 31.8% 29.2% Laval 95 41.1% 44.2% 51.6% 30.5% 54.7% Mauricie et Centre-du-Québec
210 45.2% 55.7% 43.3% 25.7% 27.1%
Montérégie 435 38.6% 53.8% 44.6% 28.0% 17.5% Montréal 495 53.5% 73.9% 17.8% 65.5% 84.2% Nord-du-Québec 17 No reports No reports 64.7% 0.0% No reports Outaouais 132 42.4% 36.4% 28.0% 59.8% 15.2% Saguenay–Lac-Saint-Jean
111 45.9% 47.7% 45.9% 33.3% 18.9%
Grand total 2,480 46.1% 55.7% 38.0% 40.0% 34.6% a FFR: fast food restaurant. b CS: convenience store. c RF: recreational facility. d BP: bike path.
For schools located in rural areas, the results indicate higher proportions than the provincial average of schools with fast food restaurants nearby in the Montérégie (30%), Chaudière-Appalaches (28.7%) and Gaspésie–Îles-de-la-Madeleine (28.4%) HRs, as shown in Table 11. The Laurentides (34.8%), Lanaudière (30.3%) and Mauricie et Centre-du-Québec (29.6%) HRs have high proportions of schools with a convenience store within a 500-metre radius. The lowest proportions are reported in the Gaspésie–Îles-de-la-Madeleine (13.4%) and Côte-Nord (7.3%) HRs. As for recreational facilities, most Bas-Saint-Laurent schools located in rural areas have a facility within a 500-metre radius (51.4%), followed by the Gaspésie–Îles-de-la-Madeleine (46.3%) and Chaudière-Appalaches (41.9%)

The Built Environment Around Schools and the Lifestyle Habits of Young People: State of Knowledge and Québec Overview
Institut national de santé publique du Québec 27
HRs. The lowest proportions are reported in the Montérégie and Outaouais HRs. More than half (52.2%) of the schools in Gaspésie–Îles-de-la-Madeleine have a bike path within a 500metre radius, whereas the same can be said of just 1.9% of schools in Mauricie et Centre-du-Québec.
Table 11 Proportion of schools located in rural areas with at least one fast food restaurant, one convenience store, one recreational facility and one bike path within a 500-metre radius, by health region
Number of schools
% of schools with at least one FFRa within 500 m radius
% of schools with at least one CSb within 500 m radius
% of schools with at least one RFc within 500 m radius
% of schools with at least one BPd within 500 m radius
Abitibi-Témiscamingue
77 18.2% 26.0% 35.1% 41.6%
Bas-Saint-Laurent 107 15.9% 27.1% 51.4% 20.6%
Capitale-Nationale 34 26.5% 14.7% 35.3% 32.4%
Chaudière-Appalaches
129 28.7% 19.4% 41.9% 4.7%
Côte-Nord 55 10.9% 7.3% 38.2% 10.9%
Estrie 93 26.9% 24.7% 33.3% 2.2%
Gaspésie–Îles-de-la-Madeleine
67 28.4% 13.4% 46.3% 52.2%
Lanaudière 33 18.2% 30.3% 27.3% 3.0%
Laurentides 46 17.4% 34.8% 23.9% 13.0%
Mauricie et Centre-du-Québec
108 23.1% 29.6% 36.1% 1.9%
Montérégie 90 30.0% 28.9% 24.4% 2.2%
Nord-du-Québec 2 No reports No reports 0.0% No reports
Outaouais 44 20.5% 13.6% 25.0% 6.8%
Saguenay–Lac-Saint-Jean
62 25.8% 24.2% 33.9% 24.2%
Grand total 947 23.0% 23.2% 36.3% 15.1% a FFR: fast food restaurant. b CS: convenience store. c RF: recreational facility. d BP: bike path.


The Built Environment Around Schools and the Lifestyle Habits of Young People: State of Knowledge and Québec Overview
Institut national de santé publique du Québec 29
5 Discussion
The results of our analyses show that many public schools in Québec are located near at least one convenience store or fast food restaurant. Approximately 63% of schools have a convenience store and close to 58% have a fast food restaurant accessible within less than 750 metres. In addition, the results show that schools attended by students from disadvantaged backgrounds in terms of income are more likely in both rural areas and urban centres to have a fast food restaurant or convenience store nearby. This gradient is also significant for a radius of 500 metres. The results also reveal that a little over half (52%) of public schools are located near a recreational facility. The urban/rural gradients and the level of deprivation are not as significant as those measured for fast food restaurants and convenience stores. Less than half (42%) of public schools in Québec have a bike path within a 750-metre radius. The presence of bike paths is greater for schools located in urban centres and for disadvantaged schools. Lastly, higher proportions of schools located in urban centres and disadvantaged areas are characterized by a built environment with high walkability.
With respect to fast food restaurants and convenience stores, the results of our analyses are, in part, consistent with a number of other research studies examining the characteristics of the food environments around schools in connection with the socioeconomic status of the neighbourhoods (Simon et al. 2008; Seliske et al. 2009; Sturm 2008; Austin et al. 2005; Walker, Block and Kawachi 2013; Kestens and Daniel 2010; Robitaille, Bergeron and Lasnier 2009). The proportions of schools with at least one fast food restaurant or one convenience store within a radius of 500 and 700 metres, as demonstrated by our study, are partially comparable to those of other studies carried out in urban centres. The results of our analysis revealed that close to 46% of schools located in urban centres have at least one fast food restaurant within a 500-metre radius. Kestens and Daniel (2010) assessed the proportion of schools with at least one fast food restaurant within a 500-metre radius in the Greater Montréal Area at 42%. In 2009, the Institut national de santé publique du Québec (INSPQ) published an analysis on the geographical accessibility to fast food restaurants and convenience stores around public schools in Québec. The results of this study show that 37% of public schools in Québec have at least one fast food restaurant within a 15-minute walk (approximately 640 metres). The results of this analysis reveal that exposure to fast food restaurants is higher (39% within a 500-metre radius and 59% within a 750-metre radius). This can be explained by the use of a database of "buildings" in our analysis instead of a database comprising just school head offices. Secondly, the analyses in this study are based on a more comprehensive review of fast food restaurants. The first study included only major fast food chain restaurants (McDonald's, Burger King, Subway, etc.), which is not the case in this analysis.
Like a number of other studies, our results show that secondary schools are significantly more likely to have at least one fast food restaurant within walking distance than schools providing other levels of instruction. Simon et al. (2008) and Zenk and Powell (2008) attempted to explain this by the large concentration of adolescents in one place, a target clientele for fast food chains. Moreover, secondary school students have far greater independent mobility than primary school students. Secondary school students can stop by these businesses before school, at lunch and after school. This greater presence of fast food restaurants around secondary schools is true for schools located in both urban centres and rural areas. However, further research will be required to determine the proportion of students who stop by these businesses. In the United States, between 5% and 15% of students are reported to stop by these businesses during lunch (Johnston LD, O'Malley P.M., Delva J, Bachman JG, Schulenberg J.E. Results on School Policies and Programs. -24. 2007. Michigan, The University of Michigan Institute for Social Research). In Québec, the EQSJS results show that 9.1% of secondary school students consume junk food three or more times a week at a food stand or in a restaurant at lunchtime during the school year. The proportion is lower for students from

The Built Environment Around Schools and the Lifestyle Habits of Young People: State of Knowledge and Québec Overview
30 Institut national de santé publique du Québec
considerably more materially advantaged backgrounds (6.7%16
As concerns the proximity of convenience stores to schools, this analysis confirms the findings of other similar research. In New York, the findings of the study by Neckerman et al. (2010) showed that 85% of public schools had access to a convenience store within an 800-metre radius. The situation appears equally disconcerting for public schools in Québec located in urban centres, as accessibility to a convenience store within a 750-metre radius is 75.5%. The proportion for all Québec schools is also higher than the results of the Canadian study by Seliske et al. (2009) (63% vs. 58%). The findings of the study by Robitaille et al. (2009) showed that 62% of public schools across all of Québec had at least one convenience store within a 15-minute walk (approximately 640 metres). The probability of having one convenience store within a radius of 500 and 700 metres is higher for schools located in urban centres and disadvantaged areas. To that end, the EQSJS results show that 31% of secondary school students consume sugary drinks, snacks or sweets at least once a day (Camirand, Blanchet and Pica 2012). This proportion is also significantly higher for students from very disadvantaged backgrounds (36.2%) than students from considerably more materially advantaged backgrounds (23.4%) (INSPQ and EQSJS 2014b).
) and significantly higher for students from highly disadvantaged backgrounds (11.5%) (INSPQ and EQSJS 2014a). In addition, the results of our study show that schools attended by students from disadvantaged backgrounds in terms of income are more likely to be near a fast food restaurant. These results are consistent with those of some other studies on the same topic (Simon et al. 2008; Kestens and Daniel 2010; Walker, Block and Kawachi 2013).
For built environment elements related to physical activity, studies on the accessibility and availability of services as well as on walkability in neighbourhoods were identified in the literature (Estabrooks, Lee and Gyurcsik 2003; Moore et al. 2008; Abercrombie et al. 2008). Only one of these studies used school as the anchoring point for the analysis. The results of the analyses conducted by Zhu and Lee (2008) show a significant association between a high level of poverty and walkability and a greater presence of sidewalks around primary schools in Austin, Texas. These results are similar to those from our research, where 63% of more disadvantaged schools are characterized by an immediate built environment with high walkability. More disadvantaged schools are often located in old (high density and mixed use) neighbourhoods with high walkability. In Québec, the EQSJS results show that 58.5% of secondary school students are considered to be sedentary during transport. Surprisingly, even though the built environment data appear to favour more disadvantaged schools, there is no significant difference between students who are sedentary during transport from considerably more materially advantaged backgrounds (56.8%17
The results of the studies have shown that there is a significant correlation between the socio-economic level of the neighbourhoods and the availability and accessibility of recreational amenities (Estabrooks et al, 2003; Moore et al, 2008). Estabrooks et al. (2003) showed for a medium-sized town (130,000 inhabitants) in the United States that the availability of recreational amenities (parks and
) and students from very disadvantaged backgrounds (58.8%) (INSPQ and EQSJS 2014c). The reason for this apparent contradiction may be the walkability measurement used in our study, as it prevents certain aspects of built environment from being qualified. Walkability may be high in disadvantaged neighbourhoods, but these neighbourhoods are probably also characterized by high traffic and by infrastructure that is less safe.
16 Proportion adjusted for age structure (12 years and under, 13 years, 14 years, 15 years, 16 years, 17 years and over),
genders combined. 17 Proportion adjusted for age structure (12 years and under, 13 years, 14 years, 15 years, 16 years, 17 years and over),
genders combined.

The Built Environment Around Schools and the Lifestyle Habits of Young People: State of Knowledge and Québec Overview
Institut national de santé publique du Québec 31
green spaces, physical activity centres, bike routes, sports grounds) is greater for neighbourhoods with a higher socio-economic status. The outcomes of the present study do not support this conclusion. The analyses have shown that the availability of recreational amenities is similar in schools in disadvantaged and advantaged areas within a radius of 500 and 750 metres (500 m: 0.53 vs. 0.49). Furthermore, the results show that bike paths are present within a radius of 500 to 750 metres of a greater proportion of disadvantaged schools (500 m: 45%). Many schools with a higher level of disadvantage are also located in environments with high walkability, high residential density and significant variation in land use. The chances of cycling infrastructure being present are possibly higher in neighbourhoods of this type. In Québec, the results of the EQSJS show that 34.3% of secondary school students are considered to be sedentary during their leisure activities. The proportion is much lower for students originating from highly materially advantaged areas (27.2%18
This study was subject to several limitations. First of all, only food outlets able to adversely affect the adoption of healthy lifestyles were taken into account. A more complete picture would have to take into account grocery stores, fruit & vegetable stores and other food outlets promoting the adoption of healthy lifestyles. Several studies have focused on the absence of these businesses in socio-economically disadvantaged neighbourhoods. These areas are characterized in English-language studies as 'nutritional wastelands' (Apparicio, Cloutier and Shearmur, 2007). Finally, the walkability factor used in this document does not reflect certain aspects of the built environment that may correlate with the use of active personal transportation, such as the perception individuals have of the built environment, criminality and aspects related to the local ambiance and safety (Zhu and Lee, 2008; Robitaille, 2014). These factors are generally less favourable in socio-economically disadvantaged environments. This document aims to provide a picture of the built environment and the service environment surrounding schools in Québec. In a future analysis, it would be useful to link these data with lifestyle and body weight data of young people in Québec. The results of several studies indicate that the accessibility of food outlets, recreational amenities, bicycle paths and the walkability of neighbourhoods correlate positively to the lifestyles and body weights of young people.
) and significantly much higher for students originating from highly disadvantaged areas (37.8%) (INSPQ and EQSJS, 2014c).
18 Proportion adjusted for age structure (12 years and under, 13 years, 14 years, 15 years, 16 years, 17 years and over),
genders combined.


The Built Environment Around Schools and the Lifestyle Habits of Young People: State of Knowledge and Québec Overview
Institut national de santé publique du Québec 33
6 Implications for future initiatives
It is important to note that the analyses in this document exclusively relate to the characteristics of the physical environment surrounding schools. Integrated analyses of the physical, economic, political and socio-cultural environments need to be performed to create a more accurate picture of the situation of schools and to identify the best courses of action. Furthermore, to ensure the greatest possible effectiveness, the establishment of new businesses or new recreational amenities promoting a healthy diet and a physically active lifestyle should be accompanied by several other measures linked to the economic environment (for example, prices and advertising) and the sociocultural environment (for example, promoting cooking skills) (MSSS, 2012).
The results of our study show that many public schools in Québec are located in the vicinity of at least one fast food restaurant and at least one convenience store. This applies in particular to schools located in disadvantaged urban neighbourhoods. Almost half of Québec's public schools offer recreational amenities and have a bike path within a 750 metre radius, regardless of the level of education provided, locality (urban/rural) and poverty level. More than half of public schools in the Bas-Saint-Laurent, Capitale-Nationale and Laval health and social services regions have a recreational facility within a radius of 500 metres. A large proportion of the most disadvantaged public schools are located in neighbourhoods with a high walkability factor. Less than half of Québec's public schools are located close to a bike path. The availability of bike paths is greatest for schools located in urban areas, and for disadvantaged schools, for secondary schools and for the Capitale-Nationale and Montréal health and social services regions. Given that the built environment around schools does not appear to be optimal in relation to promoting healthy lifestyles, actions could be prioritized to ameliorate the built environment in this regard.
6.1 Actions with potential to create built environments that promote a physically active lifestyle.
The use of zoning by-laws promoting a variety of land uses would be one management strategy for improving the walkability of a neighbourhood. This was suggested in the study of Cannon et al. (2013). The authors conclude that municipalities can promote the creation of environments that support healthy lifestyles through zoning by-laws
Municipalities can also promote the adoption of a physically active lifestyle by making use of certain regulations. Through zoning and subdivision by-laws19; regulations regarding site planning and architectural integration20, specific construction plans, the modification or occupation of a building21/ regulations on comprehensive development programs22
19 "The subdivision by-law specifies, for each zone, the surface area and dimensions of lots or land and establishes...the
manner in which streets must be plotted, in addition to the width" [Translation] (Boucher and Fontaine 2011:136).
, agreements relating to municipal works and
20 "The site planning and architectural integration by-law (PIIA) enables a municipality to set qualitative and functional evaluation criteria to ensure proper architectural integration and implementation of a building as well as land development" [Translation] (Boucher and Fontaine 2011:137).
21 "The by-law governing special construction, alteration or occupancy projects with respect to a building (PPCMOI) aims to enable a project to be carried out despite it deviating from any of the municipality's town planning by-laws. The PPCMOI technique concerns 'project zoning' and is used to guide urban development on a case-by-case basis" [Translation] (Boucher and Fontaine 2011:139).
22 "The by-law on comprehensive development plans (PAE) enables a municipality to ensure consistent and sustainable development of these portions of the territory, prior to any amendments to urban planning by-laws" [Translation] (MAMROT 2014).

The Built Environment Around Schools and the Lifestyle Habits of Young People: State of Knowledge and Québec Overview
34 Institut national de santé publique du Québec
conditional use23
For schools whose walkability, as measured in our analyses, is already high, profiles could be drawn on the basis of other tools, enabling the measurement of complementary features of the built environment, such as the quality of design of the urban environment and safety-related aspects (Robitaille, 2014). A more detailed analysis could enable actions to be identified that are likely to maximize the positive impact of these aspects of the built environment on lifestyles.
; municipalities are also able to control certain aspects of the built environment, including density, diversity, design and connectivity, which promote greater walkability and enhanced accessibility to recreational amenities and bike paths in their jurisdictions and in particular around schools (Boucher and Fontaine, 2011).
Active transportation around the school can be promoted through campaigns such as the "À pied, à vélo, ville active!" [by foot, by bike, the active city!] program targeting primary schools with the specific objective of changing the personal mobility habits of young people and their parents and creating environments favourable to the use of active transportation to and from schools (Vélo Québec, 2014). For the whole province, and especially in rural areas, where it may be difficult to increase walkability and the accessibility of recreational amenities around schools, agreements could be established between the schools and the municipal authorities to make the schools’ sporting facilities available outside school hours and during school breaks (Québec en forme, 2014).
6.2 Actions designed to facilitate the creation of healthy food environments
To this end, the Centers for Disease Control and Prevention (CDC) in the USA also proposes the use of zoning by-laws to restrict the presence of certain food outlets (e.g., fast food restaurants, convenience stores) and to create built environments that do more to promote healthy lifestyles, especially in certain neighbourhoods or around schools (CDC, 2014a, 2014b). The results of another CDC study highlight the link between zoning policies promoting healthy eating and a greater availability of stores selling fruit and vegetables in a sample of rural communities in North Carolina (Mayo, Pitts and Chriqui, 2013).
However, municipalities in Québec do not have the same powers as their counterparts in the USA. Recent studies in Québec have attempted to determine whether, under Québec legislation, it is possible to restrict the presence of food outlets that have an adverse effect on healthy lifestyles (Bourdeau and LeChasseur, 2009; Paquin, 2009). In Québec, zoning by-laws cannot discriminate between individuals or between businesses. It is therefore impossible to specifically prohibit a fast food chain or to discriminate between types of restaurants on the basis of the menu offered (ASPQ, 2012). The results of a study by Paquin (2009) show that food outlets should be more precisely defined in zoning by-laws. Bourdeau and LeChasseur (2009) argue that it is possible to restrict the presence of certain food outlets around schools qualitatively rather than quantitatively. Certain instruments exist in the present law on urban planning that empower municipalities to restrict the presence of certain businesses that are incompatible with their immediate environment (for example, in relation to architectural integrity). In the immediate vicinity of a school, such an instrument could be used to promote the establishment of businesses offering products supporting healthy eating or a physically active lifestyle. Referring back to Bourdeau et LeChasseur (2009), this type of control could require an evaluation mechanism to ensure that healthy food is offered. In 2010, in the wake of a project by the Association pour la santé publique du Québec [Québec Public Health Association], three municipalities were in the process of adopting regulations to limit the opening of fast food
23 "The by-law on conditional uses aims to allow, under certain conditions, that use be established or exercised in a zone
determined by the zoning by-law" [Translation] (MAMROT 2012).

The Built Environment Around Schools and the Lifestyle Habits of Young People: State of Knowledge and Québec Overview
Institut national de santé publique du Québec 35
restaurants around schools (Gravel, 2010; Allard, 2012a; ASPQ, 2012). One of them, the municipality of Lavaltrie, adopted a resolution in 2010 prohibiting the opening of fast food restaurants within 500 metres of schools. In the fall of 2012, the municipality of Rosemère adopt a new regulation under which restaurant services around schools were restricted to full service restaurants (Granger and Mambo, 2013; Filteau, 2013).
For existing business protected by vested rights, other approaches could be of interest,such as changes to the selection of food offered, especially in the case of convenience stores. Gittelshon et al. (2012), on behalf of the CDC, identified 16 proposed changes to the food offered by small businesses (10 employees or less and less than 1000 square feet of floor space), principally located in the USA. These projects involved the promotion of foods with increased nutritional value, an increase in their availability, the organization of tastings and promotional posters for healthy products and the reduction in the availability of products with poor nutritional value or the offer of discounts on healthier products. The results show that after these campaigns, in the majority of cases, availability and sales of the healthier products promoted increased. In 7 of the 16 campaigns, participants (consumers and/or proprietors) maintained that their knowledge of healthier products had been improved (Gittelsohn, Rowan and Gadhoke, 2012).


The Built Environment Around Schools and the Lifestyle Habits of Young People: State of Knowledge and Québec Overview
Institut national de santé publique du Québec 37
7 Conclusion
Most scientific studies show meaningful relationships between the characteristics of the built environment and the eating habits, physical activity and body weight of young people. The factor that appears to be most closely associated with students' weight and eating habits is the density of convenience stores and fast-food restaurants in the vicinity of the school. The characteristics of the built environment that have the greatest influence on physical activity are accessibility to recreational amenities and, to a lesser extent, the walkability of the school neighbourhood. Our analysis shows that many public schools in Québec are located in the vicinity of fast food restaurants, that more than half of these schools are located close to convenience stores and that the proportion of schools with bike paths or recreational amenities in their vicinity is fairly low. Finally, few schools are located in a neighbourhood with a high walkability factor. Significant variations were also noted in relation to the school's locality (poverty level, rural/urban and public health regions).
Actions can be implemented to promote the development of built environments that favour healthy lifestyles. With regard to physical activity, municipalities in Québec already possess several regulatory instruments to encourage the development of healthier environments around schools. Other initiatives such as the "À pied, à vélo, ville active!" program and the opening of school grounds outside normal school hours are also recommended. In relation to the food environment, municipalities can apply certain zoning by-laws to restrict the presence of specific businesses around schools. Campaigns to encourage changes to the food offered at certain food outlets could also be proposed.
Finally, to complete the analysis and provide better guidance for activities, other studies should be conducted to analyze the links between the characteristics of the built environments around schools and the lifestyles and body weights of young people.


The Built Environment Around Schools and the Lifestyle Habits of Young People: State of Knowledge and Québec Overview
Institut national de santé publique du Québec 39
References
Abercrombie, L. C., J. F. Sallis, T. L. Conway, L. D. Frank, B. E. Saelens, and J. E. Chapman (January 2008). Income and Racial Disparities in Access to Public Parks and Private Recreation Facilities, American Journal of Preventive Medicine, [on line], vol. 34, n° 1, p. 9‑15, <http://dx.doi.org/10.1016/j.amepre.2007.09.030> (consulted on February 11th 2014).
Adresses Québec (2012). « Adresses Québec », dans Adresses Québec : pour une géolocalisation officielle.
Allard, M. (2012a). Malbouffe et écoles : les villes peuvent agir, La Presse, [on line], <http://www.lapresse.ca/actualites/quebec-canada/sante/201210/22/01-4585575-malbouffe-et-ecoles-les-villes-peuvent-agir.php?utm_categorieinterne=trafficdrivers&utm_contenuinterne=cyberpresse_vous_suggere_4585547_article_POS1> (consulted on April 5th 2013).
Apparicio, P., M.-S. Cloutier, and R. Shearmur (2007). The case of Montreal’s missing food deserts: Evaluation of accessibility to food supermarkets, International Journal of Health Geographics, vol. 6, n° 1, p. 4.
ASPQ (2012). La zone-école et l’alimentation : des pistes d’action pour le monde municipal, [on line], <http://www.aspq.org/uploads/pdf/4e553374498cbguide-la-zone-ecole-et-l-alimentation.pdf> (consulted on April 5th 2013).
Austin, S. B., S. J. Melly, B. N. Sanchez, A. Patel, S. Buka, and S. L. Gortmaker (2005). Clustering of fast-food restaurants around schools: a novel application of spatial statistics to the study of food environments, American Journal of Public Health, [on line], vol. 95, n° 9, p. 1575.
Baillargeon, G. (2005). La carte des unités de peuplement 2003, [on line], <http://www.mels.gouv.qc.ca/fileadmin/site_web/documents/publications/SICA/DRSI/CarteUnitePeuplement2003.pdf> (consulted on April 5th 2013).
Bergeron, P., and S. Reyburn (2010). L’impact de l’environnement ba ti sur l’activite physique, l’alimentation et le poids, Montreal, Institut national de sante publique du Que bec.
Boucher, I., and N. Fontaine (2011). L’aménagement et l’écomobilité : guide de bonnes pratiques sur la planification territoriale et le développement durable /.
Bourdeau, M., and M. A. LeChasseur (2009). La malbouffe chez les jeunes, une solution municipale à un problème social, Urbanité.
Braza, M., W. Shoemaker, and A. Seeley (2004). Neighborhood Design and Rates of Walking and Biking to Elementary School in 34 California Communities, American journal of health promotion, vol. 19, n° 2, p. 128‑136.
Buck, C., H. Pohlabeln, I. Huybrechts, I. De Bourdeaudhuij, Y. Pitsiladis, L. Reisch, and I. Pigeot (November 2011). Development and application of a moveability index to quantify possibilities for physical activity in the built environment of children, Health & Place, [on line], vol. 17, n° 6, p. 1191‑1201, <http://dx.doi.org/10.1016/j.healthplace.2011.08.011> (consulted on April 5th 2013).

The Built Environment Around Schools and the Lifestyle Habits of Young People: State of Knowledge and Québec Overview
40 Institut national de santé publique du Québec
Burdette, H. L., and R. C. Whitaker (January 2004). Neighborhood playgrounds, fast food restaurants, and crime: relationships to overweight in low-income preschool children, Preventive Medicine, [on line], vol. 38, n° 1, p. 57‑63, <http://dx.doi.org/10.1016/j.ypmed.2003.09.029> (consulted on April 5th 2013).
Camirand, H., C. Blanchet, and L. A. Pica (2012). « Habitudes alimentaires », dans L’Enquête québécoise sur la santé des jeunes du secondaire 2010-2011. Le visage des jeunes d’aujourd’hui : leur santé physique et leurs habitudes de vie, Québec, Institut de la statistique du Québec, p. 71‑96.
Cannon, C. L., S. Thomas, R. D. Treffers, M. J. Paschall, L. Heumann, G. W. Mann, D. O. Dunkell, and S. Nauenberg (August 2013). Testing the results of municipal mixed-use zoning ordinances: a novel methodological approach, Journal of health politics, policy and law, vol. 38, n° 4, p. 815‑839.
Carson, V., and I. Janssen (2012). Neighborhood disorder and screen time among 10-16 year old Canadian youth: A cross-sectional study, Int J Behav Nutr Phys Act, vol. 9, n° 1, p. 66‑76.
Cazale, L., M.-C. Paquette, and F. Bernèche (2012). « Poids, apparence corporelle et actions à l’égard du poids », in L’Enquête québécoise sur la santé des jeunes du secondaire 2010-2011. Le visage des jeunes d’aujourd’hui : leur santé physique et leurs habitudes de vie, Québec, Institut de la statistique du Québec, p. 121‑147.
CDC (2014a). « CDC - Winnable Battles - Zoning to Encourage Physical Activity - Public Health Law », <http://www.cdc.gov/phlp/winnable/zoning_physical_activity.html> (consulted on April 5th 2013).
CDC (2014 b). « CDC - Zoning to Encourage Healthy Eating - Winnable Battles - Public Health Law », <http://www.cdc.gov/phlp/winnable/zoning_obesity.html> (consulted on April 5th 2014).
Cradock, A. L., S. J. Melly, J. G. Allen, J. S. Morris, and S. L. Gortmaker (September 2009). Youth Destinations Associated with Objective Measures of Physical Activity in Adolescents, Journal of Adolescent Health, vol. 45, n° 3, p. S91‑S98.
Davis, B., and C. Carpenter (2009). Proximity of fast-food restaurants to schools and adolescent obesity, Journal Information, [on line], vol. 99, n° 3, <http://ajph.aphapublications.org/doi/pdf/10.2105/AJPH.2008.137638> (consulted on April 5th 2013).
Estabrooks, P. A., R. E. Lee, and N. C. Gyurcsik (2003). Resources for physical activity participation: Does availability and accessibility differ by neighborhood socioeconomic status?, Annals of Behavioral Medicine, [on line], vol. 25, n° 2, p. 100‑104, <http://dx.doi.org/10.1207/S15324796ABM2502_05> (consulted on April 5th 2014).
Filteau, D. (2013). Rosemère ASPQ, [on line], <http://www.youtube.com/watch?v=JbnLRHPpdVo> (consulted on April 5th 2014).
Forsyth, A., N. Larson, L. Lytle, N. Mishra, D. Neumark-Sztainer, P. Noble, and D. Van Riper (2012). LEAN-GIS Protocols. Local Environment for Activity and Nutrition-Geographic Information Systems, National Institutes of Health, 2.1.
The Built Environment Around Schools and the Lifestyle Habits of Young People: State of Knowledge and Québec Overview
Institut national de santé publique du Québec 41
Forsyth, A., D. Van Riper, N. Larson, M. Wall, and D. Neumark-Sztainer (May 3thd 2012). Creating a replicable, valid cross-platform buffering technique: The sausage network buffer for measuring food and physical activity built environments, International Journal of Health Geographics, vol. 11.
Frank, L. D., P. O. Engelke, and T. L. Schmid (2003). Health and community design: The impact of the built environment on physical activity, [on line], Washington, DC: Island Press, <http://books.google.ca/books?hl=fr&lr=&id=1hG7nEznaqoC&oi=fnd&pg=PP13&dq=%22health+and+community+design%22&ots=r9fLSLlwFt&sig=i664DxPrvUvvLnwxTIqbifqcQlM> (consulted on April 5th 2012).
Gilliland, J. A., J. E. Loebach, C. Y. Rangel, P. M. Hess, M. A. Healy, M. He, P. Tucker, J. D. Irwin, and P. Wilk (2012). Linking Childhood Obesity to the Built Environment: A Multi-level Analysis of Home and School Neighbourhood Factors Associated With Body Mass Index, Can J Public Health, vol. 103, n° 3, p. S15‑S21.
Gittelsohn, J., M. Rowan, and P. Gadhoke (February 2012). « Interventions in Small Food Stores to Change the Food Environment, Improve Diet, and Reduce Risk of Chronic Disease », Preventing Chronic Disease, [on line], <http://dx.doi.org/10.5888/pcd9.110015> (consulted on April 5th 2014).
Glass, T. A., and M. J. McAtee (April 2006). Behavioral science at the crossroads in public health: extending horizons, envisioning the future, Soc Sci Med, vol. 62, n° 7, p. 1650‑71.
Granger, L., and F. Mambo (March 20 2013). Les règlements d’urbanisme : une voie possible pour améliorer l’offre alimentaire autour des écoles.
Gravel, J.-C. (October 20 2010). « Le conseil municipal prend position dans le dossier urbanisme et environnement alimentaire autour des écoles », L’action d’Autray.
Gropp, K. M., W. Pickett, and I. Janssen (October 16 2012). Multi-level examination of correlates of active transportation to school among youth living within 1 mile of their school, Int J Behav Nutr Phys Act, vol. 9, n° 1.
Hager, E. R., D. O. Witherspoon, C. Gormley, L. W. Latta, M. R. Pepper, and M. M. Black (February 2013). The perceived and built environment surrounding urban schools and physical activity among adolescent girls, Ann Behav Med, vol. 45 Suppl 1, p. S68‑75.
Harris, D. E., J. W. Blum, M. Bampton, L. M. O’Brien, C. M. Beaudoin, M. Polacsek, and K. A. O’Rourke (July 2011). Location of food stores near schools does not predict the weight status of Maine high school students, J Nutr Educ Behav, vol. 43, n° 4, p. 274‑8.
He, M., P. Tucker, J. Gilliland, J. D. Irwin, K. Larsen, and P. Hess (April 2012). The Influence of Local Food Environments on Adolescents’ Food Purchasing Behaviors, International Journal of Environmental Research and Public Health, vol. 9, n° 4, p. 1458‑1471.
He, M., P. Tucker, J. D. Irwin, J. Gilliland, K. Larsen, and P. Hess (2012). Obesogenic neighbourhoods: the impact of neighbourhood restaurants and convenience stores on adolescents’ food consumption behaviours, Public Health Nutrition, vol. 15, n° 12, p. 2331‑2339.

The Built Environment Around Schools and the Lifestyle Habits of Young People: State of Knowledge and Québec Overview
42 Institut national de santé publique du Québec
Hobin, E., S. Leatherdale, S. Manske, J. Dubin, S. Elliott, and P. Veugelers (August 2012). A multilevel examination of factors of the school environment and time spent in moderate to vigorous physical activity among a sample of secondary school students in grades 9-12 in Ontario, Canada, Int J Public Health, vol. 57, n° 4, p. 699‑709.
van der Horst, K., A. Timperio, D. Crawford, R. Roberts, J. Brug, and A. Oenema (September 2008). « The School Food Environment: Associations with Adolescent Soft Drink and Snack Consumption », American Journal of Preventive Medicine, [on line], vol. 35, n° 3, p. 217‑223, <http://dx.doi.org/10.1016/j.amepre.2008.05.022> (consulted on April 5 2013).
van Hulst, A., T. A. Barnett, L. Gauvin, Y. Kestens, M. Bird, M. Daniel, K. Gray-Donald, and M. Lambert (2012). Associations between children’s diets and features of their residential and school neighbourhood food environments, Can J Public Health, vol. 103, n° 3, p. S48‑S54.
INSPQ, and EQSJS (2014a). « Répartition des élèves du secondaire selon la fréquence de consommation de malbouffe dans un restaurant ou un casse-croûte, au cours de la dernière semaine d’école pour l’ensemble du Québec, EQSJS 2010-2011 », <https://www.infocentre.inspq.rtss.qc.ca/> (consulted on April 5 2014).
INSPQ, and EQSJS (2014b). « Proportion des élèves du secondaire consommant quotidiennement au moins une boisson sucrée, des grignotines ou des sucreries », <https://www.infocentre.inspq.rtss.qc.ca/> (consulted on April 5 2014).
INSPQ, and EQSJS (2014c). « Répartition des élèves du secondaire selon le niveau d’activité physique de transport durant l’année scolaire pour l’ensemble du Québec, EQSJS 2010-2011 », <https://www.infocentre.inspq.rtss.qc.ca/> (consulted on April 5 2014).
Johnston LD, O'Malley P.M., Delva J, Bachman JG, Schulenberg J.E. Results on School Policies and Programs. -24. 2007. Michigan, The University of Michigan Institute for Social Research.
Jorgensen, T., S. Capewell, E. Prescott, S. Allender, S. Sans, T. Zdrojewski, D. De Bacquer, J. de Sutter, O. H. Franco, S. Logstrup, M. Volpe, S. Malyutina, P. Marques-Vidal, Z. Reiner, G. S. Tell, W. M. Verschuren, and D. Vanuzzo (May 9 2012). Population-level changes to promote cardiovascular health, Eur J Prev Cardiol.
Kestens, Y., and M. Daniel (2010). Social inequalities in food exposure around schools in an urban area, American journal of preventive medicine, [on line], vol. 39, n° 1, p. 33–40.
Kipke, M. D., E. Iverson, D. Moore, C. Booker, V. Ruelas, A. L. Peters, and F. Kaufman (April 2007). Food and park environments: neighborhood-level risks for childhood obesity in east Los Angeles, J Adolesc Health, vol. 40, n° 4, p. 325‑33.
Lamichhane, A. P., R. Puett, D. E. Porter, M. Bottai, E. J. Mayer-Davis, and A. D. Liese (2012). Associations of built food environment with body mass index and waist circumference among youth with diabetes, International Journal of Behavioral Nutrition & Physical Activity, vol. 9, n° 1, p. 81‑91.
Lamontagne, P., and D. Hamel (2009). Le poids corporel chez les enfants et adolescents du Québec : de 1978 à 2005, Direction de la recherche, formation et développement, Institut national de santé publique Québec.
Larsen, K., J. Gilliland, and P. M. Hess (2012). Route-Based Analysis to Capture the Environmental Influences on a Child’s Mode of Travel between Home and School, Annals of the Association of American Geographers, vol. 102, n° 6, p. 1348‑1365.

The Built Environment Around Schools and the Lifestyle Habits of Young People: State of Knowledge and Québec Overview
Institut national de santé publique du Québec 43
MELS (2014) « Indices de défavorisation », http://www.mels.gouv.qc.ca/references/publications/resultats-de-la-recherche/detail/article/indices-de-defavorisation/ (consulted on April 5 2014).
MAMROT (2014). « Règlement sur les plans d’aménagement d’ensemble », <http://www.mamrot.gouv.qc.ca/amenagement-du-territoire/guide-la-prise-de-decision-en-urbanisme/reglementation/reglement-sur-les-plans-damenagement-densemble/> (consulted on April 5 2014).
MAMROT (2012). « Règlement sur les usages conditionnels », <http://www.mamrot.gouv.qc.ca/amenagement-du-territoire/guide-la-prise-de-decision-en-urbanisme/reglementation/reglement-sur-les-usages-conditionnels/> (consulted on April 5 2014).
MAMROT (2010). « Règlements d’urbanisme et droits acquis - Outils de réglementation - ministère des Affaires municipales et de l’Occupation du territoire », <http://www.mamrot.gouv.qc.ca/amenagement-du-territoire/guide-la-prise-de-decision-en-urbanisme/reglementation/reglements-durbanisme-et-droits-acquis/> (consulted on April 5 2014).
Mayo, M. L., S. B. J. Pitts, and J. F. Chriqui (2013). Associations Between County and Municipality Zoning Ordinances and Access to Fruit And Vegetable Outlets in Rural North Carolina, 2012, Preventing Chronic Disease, [on line], vol. 10, <http://dx.doi.org/10.5888/pcd10.130196> (consulted on April 5 2014).
Mecredy, G., W. Pickett, and I. Janssen (August 2011). Street Connectivity is Negatively Associated with Physical Activity in Canadian Youth, Int. J. Environ. Res. Public Health, vol. 8, n° 8, p. 3333‑3350.
MELS (2013). Le goût et le plaisir de bouger. Vers une politique nationale du sport, du loisir et de l’activité physique, Québec, ministère de l’Éducation, du Loisir et du Sport.
Moore, L. V., A. V. Diez Roux, K. R. Evenson, A. P. McGinn, and S. J. Brines (January 2008). Availability of Recreational Resources in Minority and Low Socioeconomic Status Areas, American Journal of Preventive Medicine, [on line], vol. 34, n° 1, p. 16‑22, <http://dx.doi.org/10.1016/j.amepre.2007.09.021> (consulted on April 5 2014).
MSSS (2012). Pour une vision commune des environnements favorables à la saine alimentation, à un mode de vie physiquement actif et à la prévention des problèmes reliés au poids.
Neckerman, K. M., M. D. M. Bader, C. A. Richards, M. Purciel, J. W. Quinn, J. S. Thomas, C. Warbelow, C. C. Weiss, G. S. Lovasi, and A. Rundle (September 2010). Disparities in the Food Environments of New York City Public Schools, American Journal of Preventive Medicine, [on line], vol. 39, n° 3, p. 195‑202, <http://dx.doi.org/10.1016/j.amepre.2010.05.004> (consulted on April 5 2014).
OMS (2010). Recommandations mondiales sur l’activité physique pour la santé, Organisation mondiale de la santé.
Paquin, S. (2009). Le zonage municipal : un outil contribuant a cre er un environnement ba ti favorable aux saines habitudes alimentaires, Montre al, Institut national de sante publique du Que bec.
Pouliou, T., and S. J. Elliott (2010). Individual and socio-environmental determinants of overweight and obesity in Urban Canada, Health & Place, vol. 16, n° 2, p. 389‑398.

The Built Environment Around Schools and the Lifestyle Habits of Young People: State of Knowledge and Québec Overview
44 Institut national de santé publique du Québec
Québec en forme (2014). « Des municipalités et des écoles s’entendent - Québec en Forme », <http://www.quebecenforme.org/que-faisons-nous/regroupements-locaux-de-partenaires/les-bons-coups-de-nos-partenaires/des-municipalites-et-des-ecoles-s-entendent.aspx> (consulted on April 5 2014).
Robitaille, É. (2014). « L’environnement bâti et la pratique d’activité physique : des outils de collecte de données pour soutenir l’intervention », p. 8.
Robitaille, É., P. Bergeron, and B. Lasnier (2009). Analyse géographique de l’accessibilité des restaurants-minute et des dépanneurs autour des écoles publiques québécoises : rapport, Institut national de santé publique du Québec.
Sallis, J. F., M. F. Floyd, D. A. Rodriguez, and B. E. Saelens (February 2012). « Role of built environments in physical activity, obesity, and cardiovascular disease », Circulation, vol. 125, n° 5, p. 729‑37.
Sanchez, B. N., E. V. Sanchez-Vaznaugh, A. Uscilka, J. Baek, and L. Zhang (June 15 2012). « Differential associations between the food environment near schools and childhood overweight across race/ethnicity, gender, and grade », Am J Epidemiol, vol. 175, n° 12, p. 1284‑93.
Seliske, L. M., W. Pickett, W. F. Boyce, and I. Janssen (September 2009). Density and type of food retailers surrounding Canadian schools: Variations across socioeconomic status, Health & Place, [on line], vol. 15, n° 3, p. 903‑907, <http://dx.doi.org/10.1016/j.healthplace.2008.11.001> (consulted on April 5 2014).
Seliske, L., W. Pickett, A. Rosu, and I. Janssen (2013). The number and type of food retailers surrounding schools and their association with lunchtime eating behaviours in students, International Journal of Behavioral Nutrition and Physical Activity, [on line], vol. 10, n° 1, p. 19, <http://dx.doi.org/10.1186/1479-5868-10-19> (consulted on April 5 2013).
Simon, P. A., D. Kwan, A. Angelescu, M. Shih, and J. E. Fielding (2008). Proximity of fast food restaurants to schools: Do neighborhood income and type of school matter?, Preventive medicine, [on line], vol. 47, n° 3, p. 284.
Smith, D., S. Cummins, C. Clark, and S. Stansfeld (2013). Does the local food environment around schools affect diet? Longitudinal associations in adolescents attending secondary schools in East London, BMC Public Health, [on line], vol. 13, n° 1, p. 70, <http://dx.doi.org/10.1186/1471-2458-13-70> (consulted on April 5 2013).
Société canadienne de physiologie de l’exercice (2011). Directives canadiennes en matière d’activité physique, Société canadienne de physiologie de l’exercice.
Spence, J. C., N. Cutumisu, J. Edwards, K. D. Raine, and K. Smoyer-Tomic (2009). « Relation between local food environments and obesity among adults, BMC Public Health, vol. 9, n° 1.
Statistique Canada (2012). « Centre de population (CTRPOP) », <http://www12.statcan.gc.ca/census-recensement/2011/ref/dict/geo049a-fra.cfm> (consulted on April 5 2014).
Stone, M. R., G. E. Faulkner, R. Mitra, and R. N. Buliung (2012). Physical Activity Patterns of Children in Toronto: The Relative Role of Neighbourhood Type and Socio-economic Status, Can J Public Health, vol. 103, n° 3, p. s9‑s14.

The Built Environment Around Schools and the Lifestyle Habits of Young People: State of Knowledge and Québec Overview
Institut national de santé publique du Québec 45
Sturm, R. (2008). Disparities in the food environment surrounding US middle and high schools, Public health, [on line], vol. 122, n° 7, p. 681–690.
Traoré, I., B. Nolin, and L. A. Pica (2012). « Activité physique de loisir et de transport », dans L’Enquête québécoise sur la santé des jeunes du secondaire 2010-2011. Le visage des jeunes d’aujourd’hui : leur santé physique et leurs habitudes de vie, Québec, Institut de la statistique du Québec, p. 97‑119.
Trilk, J. L., D. S. Ward, M. Dowda, K. A. Pfeiffer, D. E. Porter, J. Hibbert, and R. R. Pate (March 2011). Do physical activity facilities near schools affect physical activity in high school girls?, Health & Place, [on line], vol. 17, n° 2, p. 651‑657, <http://dx.doi.org/10.1016/j.healthplace.2011.01.005> (consulted on April 5 2012).
Tucker, P., J. D. Irwin, J. Gilliland, M. He, K. Larsen, and P. Hess (March 2009). Environmental influences on physical activity levels in youth, Health & Place, vol. 15, n° 1, p. 357‑363.
Vélo Québec (2014). « Vélo Québec - À pied, à vélo, ville active. », <http://www.velo.qc.ca/transport-actif/a-pied-a-velo-ville-active/> (consulted on April 5 2014).
Walker, R. E., J. Block, and I. Kawachi (2013). The Spatial Accessibility of Fast food Restaurants and Convenience Stores in Relation to Neighborhood Schools, Applied Spatial Analysis and Policy, [on line], p. 1‑14, <http://dx.doi.org/10.1007/s12061-013-9095-6> (consulted on April 5 2014).
Wang, M. C., S. Kim, A. A. Gonzalez, K. E. MacLeod, and M. A. Winkleby (June 2007). Socioeconomic and food-related physical characteristics of the neighbourhood environment are associated with body mass index, J Epidemiol Community Health, vol. 61, n° 6, p. 491‑8.
Zhu, X., and C. Lee (April 2008). Walkability and Safety Around Elementary Schools: Economic and Ethnic Disparities, American Journal of Preventive Medicine, [on line], vol. 34, n° 4, p. 282‑290, <http://dx.doi.org/10.1016/j.amepre.2008.01.024> (consulted on April 5 2014).


Appendix 1
Method of calculation of the walkability index


The Built Environment Around Schools and the Lifestyle Habits of Young People: State of Knowledge and Québec Overview
Institut national de santé publique du Québec 49
Method of calculation of the walkability index
This index has been calculated by aggregating the Z scores of the four components of the index, i.e., the index of mixed land use, intersection density, housing density and destination density. A Z score is calculated as follows:
𝑍 =𝑥 − 𝜇𝜎
Where x is the value to be standardized, µ is the population average and 𝜎 is the standard deviation of the population.
Tables 12 and 13 show the values of each variable comprising the walkability index by quartiles within a 500-metre and 750-metre radius of schools.
Table 12 Values of variables constituting the walkability index by quartiles within a 500 m radius
Quartiles Number of schools
Housing density
Intersection density
Mixed land use index
Destination density
Low walkability 855 248.18 12.19 0.31 158.66
2 858 584.84 28.62 0.50 332.90
3 857 1054.69 48.05 0.52 542.13
High walkability 857 2965.69 71.34 0.53 1151.65
Total 3427 1213.73 40.06 0.46 546.50
Table 13 Values of variables constituting the walkability index by quartiles within a 750 m radius
Quartiles Number of schools
Housing density
Intersection density
Mixed land use index
Destination density
Low walkability 856 206.16 11.04 0.31 137.29
2 857 548.26 27.88 0.51 298.95
3 857 1001.30 47.20 0.54 519.18
High walkability 857 2850.41 69.99 0.55 1141.43
Total 3427 1151.81 39.04 0.48 524.33

Publication N°: 2028

Centre d’expertise et de référence
www.inspq.qc.ca