Embed Size (px)
Citation preview
STATE OF LOUISIANA
ANNUAL TAX COLLECTION REPORT2 0 1 5 – 2 0 1 6

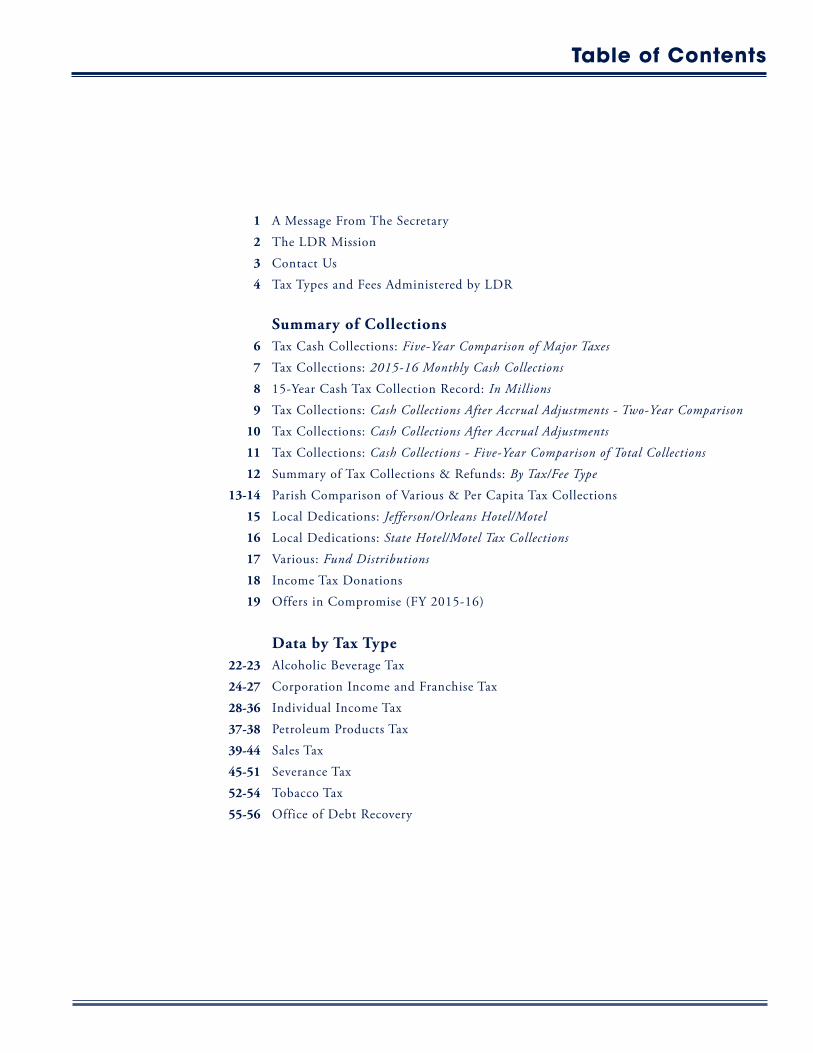
A Message From The Secretary
The LDR Mission
Contact Us
Tax Types and Fees Administered by LDR
Summary of CollectionsTax Cash Collections: Five-Year Comparison of Major Taxes
Tax Collections: 2015-16 Monthly Cash Collections
15-Year Cash Tax Collection Record: In Millions
Tax Collections: Cash Collections After Accrual Adjustments - Two-Year Comparison
Tax Collections: Cash Collections After Accrual Adjustments
Tax Collections: Cash Collections - Five-Year Comparison of Total Collections
Summary of Tax Collections & Refunds: By Tax/Fee Type
Parish Comparison of Various & Per Capita Tax Collections
Local Dedications: Jefferson/Orleans Hotel/Motel
Local Dedications: State Hotel/Motel Tax Collections
Various: Fund Distributions
Income Tax Donations
Offers in Compromise (FY 2015-16)
Data by Tax TypeAlcoholic Beverage Tax
Corporation Income and Franchise Tax
Individual Income Tax
Petroleum Products Tax
Sales Tax
Severance Tax
Tobacco Tax
Office of Debt Recovery
1
2
3
4
6
7
8
9
10
11
12
13-14
15
16
17
18
19
22-23
24-27
28-36
37-38
39-44
45-51
52-54
55-56
Table of Contents

12 0 1 5 – 2 0 1 6 A n n u a l Ta x C o l l e c t i o n R e p o r t
Annual Tax Collection Report: Fiscal Year Ending June 30, 2016
To the Honorable John Bel Edwards, Governor of Louisiana, and Members of the Louisiana Legislature:
I am pleased to present the Louisiana Department of Revenue’s Annual Tax Collection Report for the fiscal year July 1, 2015, through June 30, 2016.
During the reporting period, the Department continued to maximize its resources to achieve the strategic goals of increasing voluntary compliance, improving operational efficiency and accuracy, and providing excellent customer service to all constituent groups.
We maintained a sharp focus on the core mission of collecting revenue for vital state services, including K-12 and post-secondary education, public safety and infrastructure, and healthcare. The tax collection program brought in $7.4 billion in total net collections during the fiscal year. This figure includes:
• $2.9 billion in sales taxes • $2.8 billion in individual income taxes • $625 million in fuel taxes and inspection fees • $445 million in natural resource severance taxes
Other highlights of the reporting period include $58 million collected by the Office of Debt Recovery in its first full year of operation and a 10 percent reduction in tax return processing times in our Revenue Processing Center.
With your support and cooperation, our team of dedicated professionals will continue to build on these accomplishments for a safe, healthy and productive Louisiana.
Yours in public service,
Kimberly Lewis Robinson | Secretary of RevenueLouisiana Department of Revenue
Kimberly Lewis Robinson
Message from the Secretary
2 2 0 1 5 – 2 0 1 6 A n n u a l Ta x C o l l e c t i o n R e p o r t
To fairly and efficiently collect state tax revenues to fund public services; to regulate charitable gaming and the sale of alcoholic
beverages and tobacco; and to support state agencies in the collection of overdue debts.
The LDR Mission
32 0 1 5 – 2 0 1 6 A n n u a l Ta x C o l l e c t i o n R e p o r t
BATON ROUGE HEADQUARTERSPost Office Box 201
Baton Rouge, LA 70821-0201617 North Third Street
Baton Rouge, LA 70802
855.307.3893
Contact Us
4 2 0 1 5 – 2 0 1 6 A n n u a l Ta x C o l l e c t i o n R e p o r t
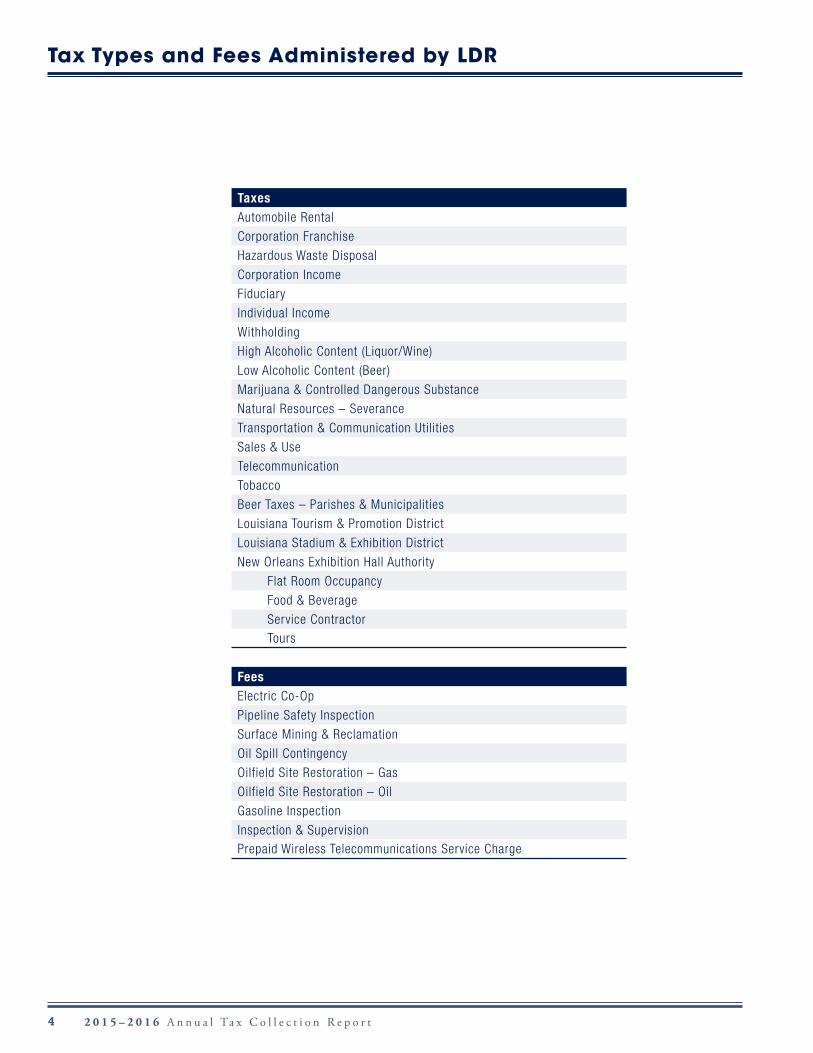
Tax Types and Fees Administered by LDR
TaxesAutomobile Rental
Corporation Franchise
Hazardous Waste Disposal
Corporation Income
Fiduciary
Individual Income
Withholding
High Alcoholic Content (Liquor/Wine)
Low Alcoholic Content (Beer)
Marijuana & Controlled Dangerous Substance
Natural Resources – Severance
Transportation & Communication Utilities
Sales & Use
Telecommunication
Tobacco
Beer Taxes – Parishes & Municipalities
Louisiana Tourism & Promotion District
Louisiana Stadium & Exhibition District
New Orleans Exhibition Hall Authority
Flat Room Occupancy
Food & Beverage
Service Contractor
Tours
FeesElectric Co-Op
Pipeline Safety Inspection
Surface Mining & Reclamation
Oil Spill Contingency
Oilfield Site Restoration – Gas
Oilfield Site Restoration – Oil
Gasoline Inspection
Inspection & Supervision
Prepaid Wireless Telecommunications Service Charge
SUMMARY OF COLLECTIONS
6 2 0 1 5 – 2 0 1 6 A n n u a l Ta x C o l l e c t i o n R e p o r t
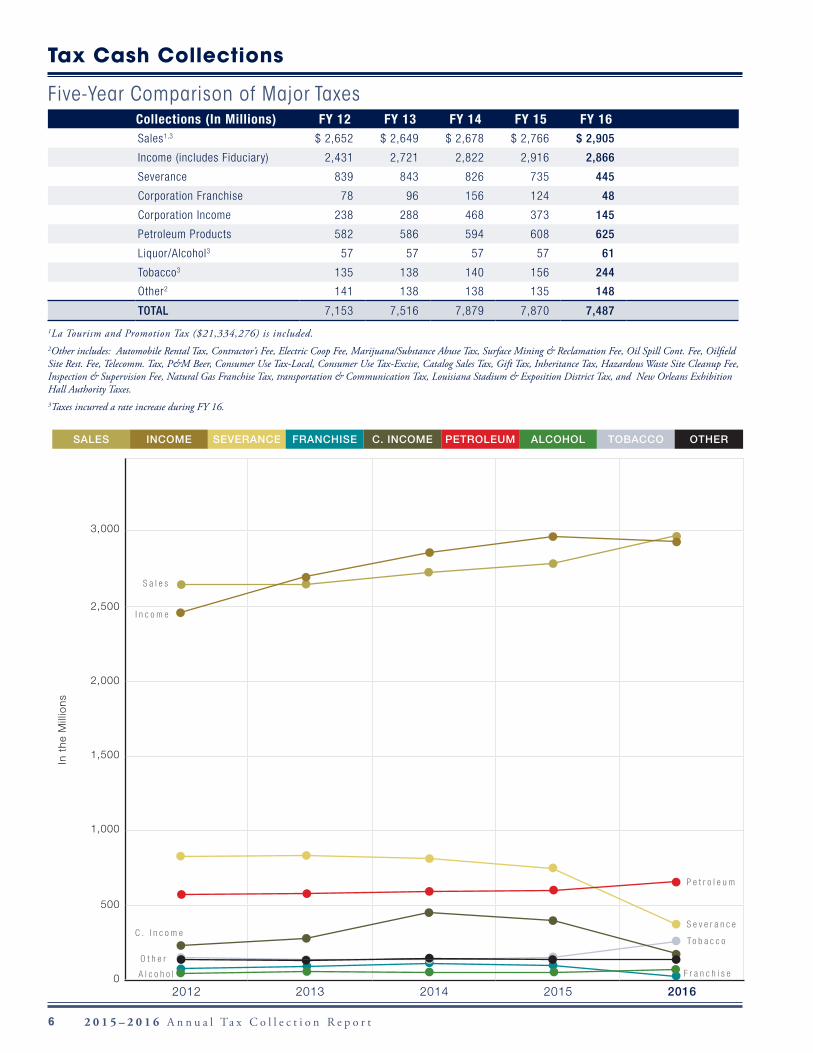
Collections (In Millions) FY 12 FY 13 FY 14 FY 15 FY 16Sales1,3 $ 2,652 $ 2,649 $ 2,678 $ 2,766 $ 2,905
Income (includes Fiduciary) 2,431 2,721 2,822 2,916 2,866
Severance 839 843 826 735 445
Corporation Franchise 78 96 156 124 48
Corporation Income 238 288 468 373 145
Petroleum Products 582 586 594 608 625
Liquor/Alcohol3 57 57 57 57 61
Tobacco3 135 138 140 156 244
Other2 141 138 138 135 148
TOTAL 7,153 7,516 7,879 7,870 7,487
1La Tourism and Promotion Tax ($21,334,276) is included. 2Other includes: Automobile Rental Tax, Contractor’s Fee, Electric Coop Fee, Marijuana/Substance Abuse Tax, Surface Mining & Reclamation Fee, Oil Spill Cont. Fee, Oilfield Site Rest. Fee, Telecomm. Tax, P&M Beer, Consumer Use Tax-Local, Consumer Use Tax-Excise, Catalog Sales Tax, Gift Tax, Inheritance Tax, Hazardous Waste Site Cleanup Fee, Inspection & Supervision Fee, Natural Gas Franchise Tax, transportation & Communication Tax, Louisiana Stadium & Exposition District Tax, and New Orleans Exhibition Hall Authority Taxes.3Taxes incurred a rate increase during FY 16.
Tax Cash Collections
Five-Year Comparison of Major Taxes
SALES INCOME SEVERANCE FRANCHISE C. INCOME PETROLEUM ALCOHOL TOBACCO OTHER
In t
he M
illio
ns
3,000
2,500
2,000
1,500
1,000
500
02012 2013 2014 2015 2016
F r a n c h i s e
T o b a c c o
A l c o h o l
S a l e s
I n c o m e
S e v e r a n c e
P e t r o l e u m
C . I n c o m e
O t h e r
72 0 1 5 – 2 0 1 6 A n n u a l Ta x C o l l e c t i o n R e p o r t
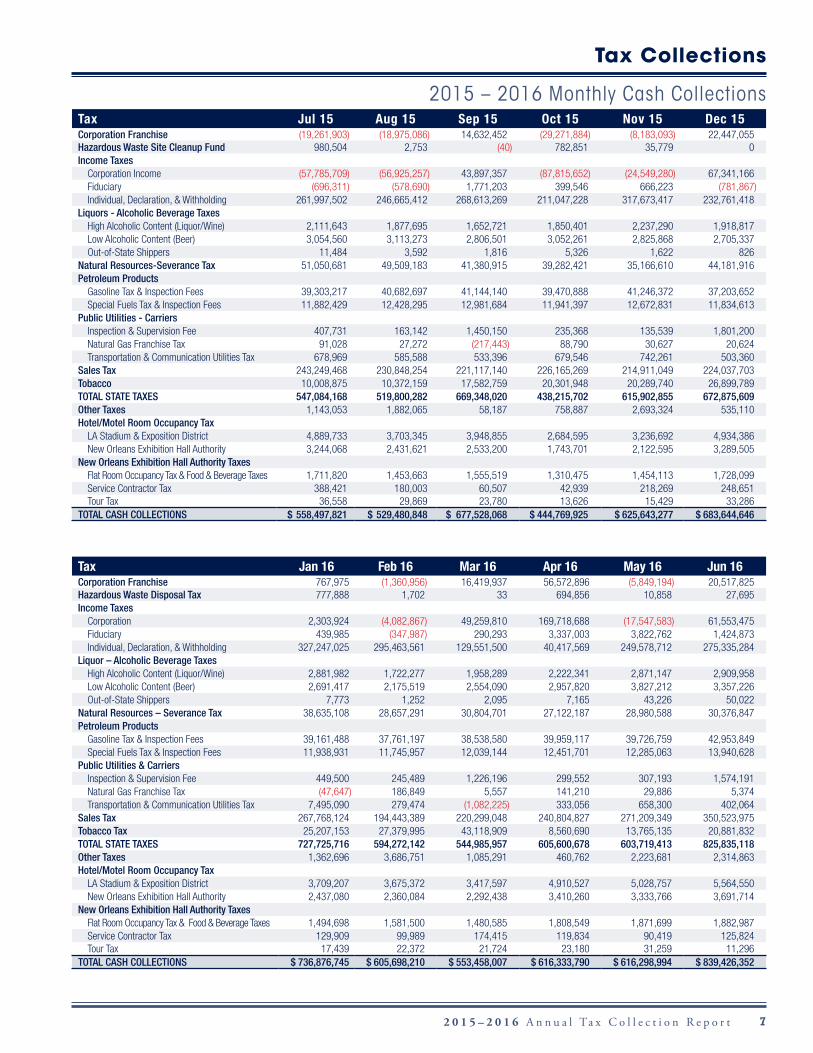
Tax Jul 15 Aug 15 Sep 15 Oct 15 Nov 15 Dec 15Corporation Franchise (19,261,903) (18,975,086) 14,632,452 (29,271,884) (8,183,093) 22,447,055 Hazardous Waste Site Cleanup Fund 980,504 2,753 (40) 782,851 35,779 0 Income Taxes
Corporation Income (57,785,709) (56,925,257) 43,897,357 (87,815,652) (24,549,280) 67,341,166 Fiduciary (696,311) (578,690) 1,771,203 399,546 666,223 (781,867)Individual, Declaration, & Withholding 261,997,502 246,665,412 268,613,269 211,047,228 317,673,417 232,761,418
Liquors - Alcoholic Beverage TaxesHigh Alcoholic Content (Liquor/Wine) 2,111,643 1,877,695 1,652,721 1,850,401 2,237,290 1,918,817 Low Alcoholic Content (Beer) 3,054,560 3,113,273 2,806,501 3,052,261 2,825,868 2,705,337 Out-of-State Shippers 11,484 3,592 1,816 5,326 1,622 826
Natural Resources-Severance Tax 51,050,681 49,509,183 41,380,915 39,282,421 35,166,610 44,181,916 Petroleum Products
Gasoline Tax & Inspection Fees 39,303,217 40,682,697 41,144,140 39,470,888 41,246,372 37,203,652 Special Fuels Tax & Inspection Fees 11,882,429 12,428,295 12,981,684 11,941,397 12,672,831 11,834,613
Public Utilities - CarriersInspection & Supervision Fee 407,731 163,142 1,450,150 235,368 135,539 1,801,200 Natural Gas Franchise Tax 91,028 27,272 (217,443) 88,790 30,627 20,624 Transportation & Communication Utilities Tax 678,969 585,588 533,396 679,546 742,261 503,360
Sales Tax 243,249,468 230,848,254 221,117,140 226,165,269 214,911,049 224,037,703 Tobacco 10,008,875 10,372,159 17,582,759 20,301,948 20,289,740 26,899,789 TOTAL STATE TAXES 547,084,168 519,800,282 669,348,020 438,215,702 615,902,855 672,875,609 Other Taxes 1,143,053 1,882,065 58,187 758,887 2,693,324 535,110 Hotel/Motel Room Occupancy Tax
LA Stadium & Exposition District 4,889,733 3,703,345 3,948,855 2,684,595 3,236,692 4,934,386 New Orleans Exhibition Hall Authority 3,244,068 2,431,621 2,533,200 1,743,701 2,122,595 3,289,505
New Orleans Exhibition Hall Authority TaxesFlat Room Occupancy Tax & Food & Beverage Taxes 1,711,820 1,453,663 1,555,519 1,310,475 1,454,113 1,728,099 Service Contractor Tax 388,421 180,003 60,507 42,939 218,269 248,651 Tour Tax 36,558 29,869 23,780 13,626 15,429 33,286
TOTAL CASH COLLECTIONS $ 558,497,821 $ 529,480,848 $ 677,528,068 $ 444,769,925 $ 625,643,277 $ 683,644,646
Tax Jan 16 Feb 16 Mar 16 Apr 16 May 16 Jun 16Corporation Franchise 767,975 (1,360,956) 16,419,937 56,572,896 (5,849,194) 20,517,825 Hazardous Waste Disposal Tax 777,888 1,702 33 694,856 10,858 27,695 Income Taxes
Corporation 2,303,924 (4,082,867) 49,259,810 169,718,688 (17,547,583) 61,553,475 Fiduciary 439,985 (347,987) 290,293 3,337,003 3,822,762 1,424,873 Individual, Declaration, & Withholding 327,247,025 295,463,561 129,551,500 40,417,569 249,578,712 275,335,284
Liquor – Alcoholic Beverage TaxesHigh Alcoholic Content (Liquor/Wine) 2,881,982 1,722,277 1,958,289 2,222,341 2,871,147 2,909,958 Low Alcoholic Content (Beer) 2,691,417 2,175,519 2,554,090 2,957,820 3,827,212 3,357,226 Out-of-State Shippers 7,773 1,252 2,095 7,165 43,226 50,022
Natural Resources – Severance Tax 38,635,108 28,657,291 30,804,701 27,122,187 28,980,588 30,376,847 Petroleum Products
Gasoline Tax & Inspection Fees 39,161,488 37,761,197 38,538,580 39,959,117 39,726,759 42,953,849 Special Fuels Tax & Inspection Fees 11,938,931 11,745,957 12,039,144 12,451,701 12,285,063 13,940,628
Public Utilities & CarriersInspection & Supervision Fee 449,500 245,489 1,226,196 299,552 307,193 1,574,191 Natural Gas Franchise Tax (47,647) 186,849 5,557 141,210 29,886 5,374 Transportation & Communication Utilities Tax 7,495,090 279,474 (1,082,225) 333,056 658,300 402,064
Sales Tax 267,768,124 194,443,389 220,299,048 240,804,827 271,209,349 350,523,975 Tobacco Tax 25,207,153 27,379,995 43,118,909 8,560,690 13,765,135 20,881,832 TOTAL STATE TAXES 727,725,716 594,272,142 544,985,957 605,600,678 603,719,413 825,835,118 Other Taxes 1,362,696 3,686,751 1,085,291 460,762 2,223,681 2,314,863 Hotel/Motel Room Occupancy Tax
LA Stadium & Exposition District 3,709,207 3,675,372 3,417,597 4,910,527 5,028,757 5,564,550 New Orleans Exhibition Hall Authority 2,437,080 2,360,084 2,292,438 3,410,260 3,333,766 3,691,714
New Orleans Exhibition Hall Authority TaxesFlat Room Occupancy Tax & Food & Beverage Taxes 1,494,698 1,581,500 1,480,585 1,808,549 1,871,699 1,882,987 Service Contractor Tax 129,909 99,989 174,415 119,834 90,419 125,824 Tour Tax 17,439 22,372 21,724 23,180 31,259 11,296
TOTAL CASH COLLECTIONS $ 736,876,745 $ 605,698,210 $ 553,458,007 $ 616,333,790 $ 616,298,994 $ 839,426,352
Tax Collections
2015 – 2016 Monthly Cash Collections
8 2 0 1 5 – 2 0 1 6 A n n u a l Ta x C o l l e c t i o n R e p o r t
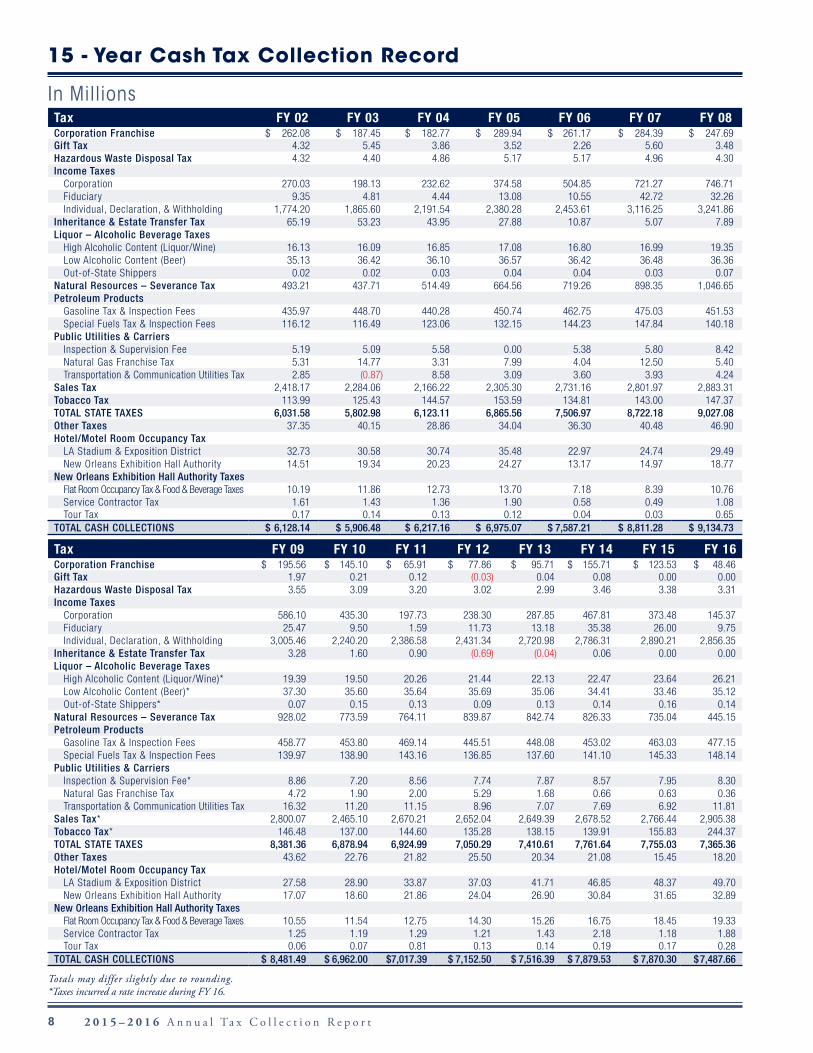
Tax FY 09 FY 10 FY 11 FY 12 FY 13 FY 14 FY 15 FY 16Corporation Franchise $ 195.56 $ 145.10 $ 65.91 $ 77.86 $ 95.71 $ 155.71 $ 123.53 $ 48.46 Gift Tax 1.97 0.21 0.12 (0.03) 0.04 0.08 0.00 0.00 Hazardous Waste Disposal Tax 3.55 3.09 3.20 3.02 2.99 3.46 3.38 3.31 Income Taxes
Corporation 586.10 435.30 197.73 238.30 287.85 467.81 373.48 145.37 Fiduciary 25.47 9.50 1.59 11.73 13.18 35.38 26.00 9.75 Individual, Declaration, & Withholding 3,005.46 2,240.20 2,386.58 2,431.34 2,720.98 2,786.31 2,890.21 2,856.35
Inheritance & Estate Transfer Tax 3.28 1.60 0.90 (0.69) (0.04) 0.06 0.00 0.00 Liquor – Alcoholic Beverage Taxes
High Alcoholic Content (Liquor/Wine)* 19.39 19.50 20.26 21.44 22.13 22.47 23.64 26.21 Low Alcoholic Content (Beer)* 37.30 35.60 35.64 35.69 35.06 34.41 33.46 35.12 Out-of-State Shippers* 0.07 0.15 0.13 0.09 0.13 0.14 0.16 0.14
Natural Resources – Severance Tax 928.02 773.59 764.11 839.87 842.74 826.33 735.04 445.15 Petroleum Products
Gasoline Tax & Inspection Fees 458.77 453.80 469.14 445.51 448.08 453.02 463.03 477.15 Special Fuels Tax & Inspection Fees 139.97 138.90 143.16 136.85 137.60 141.10 145.33 148.14
Public Utilities & CarriersInspection & Supervision Fee* 8.86 7.20 8.56 7.74 7.87 8.57 7.95 8.30 Natural Gas Franchise Tax 4.72 1.90 2.00 5.29 1.68 0.66 0.63 0.36 Transportation & Communication Utilities Tax 16.32 11.20 11.15 8.96 7.07 7.69 6.92 11.81
Sales Tax* 2,800.07 2,465.10 2,670.21 2,652.04 2,649.39 2,678.52 2,766.44 2,905.38 Tobacco Tax* 146.48 137.00 144.60 135.28 138.15 139.91 155.83 244.37 TOTAL STATE TAXES 8,381.36 6,878.94 6,924.99 7,050.29 7,410.61 7,761.64 7,755.03 7,365.36 Other Taxes 43.62 22.76 21.82 25.50 20.34 21.08 15.45 18.20 Hotel/Motel Room Occupancy Tax
LA Stadium & Exposition District 27.58 28.90 33.87 37.03 41.71 46.85 48.37 49.70 New Orleans Exhibition Hall Authority 17.07 18.60 21.86 24.04 26.90 30.84 31.65 32.89
New Orleans Exhibition Hall Authority TaxesFlat Room Occupancy Tax & Food & Beverage Taxes 10.55 11.54 12.75 14.30 15.26 16.75 18.45 19.33 Service Contractor Tax 1.25 1.19 1.29 1.21 1.43 2.18 1.18 1.88 Tour Tax 0.06 0.07 0.81 0.13 0.14 0.19 0.17 0.28
TOTAL CASH COLLECTIONS $ 8,481.49 $ 6,962.00 $ 7,017.39 $ 7,152.50 $ 7,516.39 $ 7,879.53 $ 7,870.30 $ 7,487.66
Totals may differ slightly due to rounding. *Taxes incurred a rate increase during FY 16.
Tax FY 02 FY 03 FY 04 FY 05 FY 06 FY 07 FY 08Corporation Franchise $ 262.08 $ 187.45 $ 182.77 $ 289.94 $ 261.17 $ 284.39 $ 247.69 Gift Tax 4.32 5.45 3.86 3.52 2.26 5.60 3.48 Hazardous Waste Disposal Tax 4.32 4.40 4.86 5.17 5.17 4.96 4.30 Income Taxes
Corporation 270.03 198.13 232.62 374.58 504.85 721.27 746.71 Fiduciary 9.35 4.81 4.44 13.08 10.55 42.72 32.26 Individual, Declaration, & Withholding 1,774.20 1,865.60 2,191.54 2,380.28 2,453.61 3,116.25 3,241.86
Inheritance & Estate Transfer Tax 65.19 53.23 43.95 27.88 10.87 5.07 7.89 Liquor – Alcoholic Beverage Taxes
High Alcoholic Content (Liquor/Wine) 16.13 16.09 16.85 17.08 16.80 16.99 19.35 Low Alcoholic Content (Beer) 35.13 36.42 36.10 36.57 36.42 36.48 36.36 Out-of-State Shippers 0.02 0.02 0.03 0.04 0.04 0.03 0.07
Natural Resources – Severance Tax 493.21 437.71 514.49 664.56 719.26 898.35 1,046.65 Petroleum Products
Gasoline Tax & Inspection Fees 435.97 448.70 440.28 450.74 462.75 475.03 451.53 Special Fuels Tax & Inspection Fees 116.12 116.49 123.06 132.15 144.23 147.84 140.18
Public Utilities & CarriersInspection & Supervision Fee 5.19 5.09 5.58 0.00 5.38 5.80 8.42 Natural Gas Franchise Tax 5.31 14.77 3.31 7.99 4.04 12.50 5.40 Transportation & Communication Utilities Tax 2.85 (0.87) 8.58 3.09 3.60 3.93 4.24
Sales Tax 2,418.17 2,284.06 2,166.22 2,305.30 2,731.16 2,801.97 2,883.31 Tobacco Tax 113.99 125.43 144.57 153.59 134.81 143.00 147.37 TOTAL STATE TAXES 6,031.58 5,802.98 6,123.11 6,865.56 7,506.97 8,722.18 9,027.08 Other Taxes 37.35 40.15 28.86 34.04 36.30 40.48 46.90 Hotel/Motel Room Occupancy Tax
LA Stadium & Exposition District 32.73 30.58 30.74 35.48 22.97 24.74 29.49 New Orleans Exhibition Hall Authority 14.51 19.34 20.23 24.27 13.17 14.97 18.77
New Orleans Exhibition Hall Authority TaxesFlat Room Occupancy Tax & Food & Beverage Taxes 10.19 11.86 12.73 13.70 7.18 8.39 10.76 Service Contractor Tax 1.61 1.43 1.36 1.90 0.58 0.49 1.08 Tour Tax 0.17 0.14 0.13 0.12 0.04 0.03 0.65
TOTAL CASH COLLECTIONS $ 6,128.14 $ 5,906.48 $ 6,217.16 $ 6,975.07 $ 7,587.21 $ 8,811.28 $ 9,134.73
15 - Year Cash Tax Collection Record
In Millions
92 0 1 5 – 2 0 1 6 A n n u a l Ta x C o l l e c t i o n R e p o r t
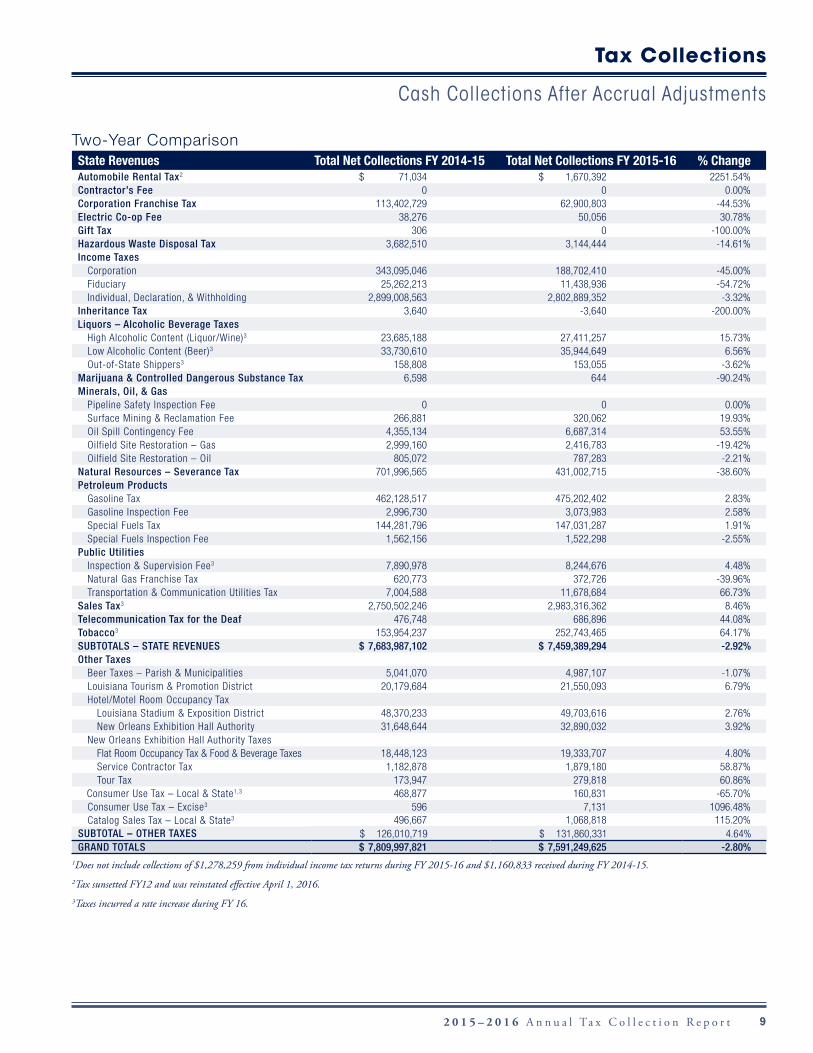
Two-Year ComparisonState Revenues Total Net Collections FY 2014-15 Total Net Collections FY 2015-16 % ChangeAutomobile Rental Tax2 $ 71,034 $ 1,670,392 2251.54%Contractor’s Fee 0 0 0.00%Corporation Franchise Tax 113,402,729 62,900,803 -44.53%Electric Co-op Fee 38,276 50,056 30.78%Gift Tax 306 0 -100.00%Hazardous Waste Disposal Tax 3,682,510 3,144,444 -14.61%Income Taxes
Corporation 343,095,046 188,702,410 -45.00%Fiduciary 25,262,213 11,438,936 -54.72%Individual, Declaration, & Withholding 2,899,008,563 2,802,889,352 -3.32%
Inheritance Tax 3,640 -3,640 -200.00%Liquors – Alcoholic Beverage Taxes
High Alcoholic Content (Liquor/Wine)3 23,685,188 27,411,257 15.73%Low Alcoholic Content (Beer)3 33,730,610 35,944,649 6.56%Out-of-State Shippers3 158,808 153,055 -3.62%
Marijuana & Controlled Dangerous Substance Tax 6,598 644 -90.24%Minerals, Oil, & Gas
Pipeline Safety Inspection Fee 0 0 0.00%Surface Mining & Reclamation Fee 266,881 320,062 19.93%Oil Spill Contingency Fee 4,355,134 6,687,314 53.55%Oilfield Site Restoration – Gas 2,999,160 2,416,783 -19.42%Oilfield Site Restoration – Oil 805,072 787,283 -2.21%
Natural Resources – Severance Tax 701,996,565 431,002,715 -38.60%Petroleum Products
Gasoline Tax 462,128,517 475,202,402 2.83%Gasoline Inspection Fee 2,996,730 3,073,983 2.58%Special Fuels Tax 144,281,796 147,031,287 1.91%Special Fuels Inspection Fee 1,562,156 1,522,298 -2.55%
Public UtilitiesInspection & Supervision Fee3 7,890,978 8,244,676 4.48%Natural Gas Franchise Tax 620,773 372,726 -39.96%Transportation & Communication Utilities Tax 7,004,588 11,678,684 66.73%
Sales Tax3 2,750,502,246 2,983,316,362 8.46%Telecommunication Tax for the Deaf 476,748 686,896 44.08%Tobacco3 153,954,237 252,743,465 64.17%SUBTOTALS – STATE REVENUES $ 7,683,987,102 $ 7,459,389,294 -2.92%Other Taxes
Beer Taxes – Parish & Municipalities 5,041,070 4,987,107 -1.07%Louisiana Tourism & Promotion District 20,179,684 21,550,093 6.79%Hotel/Motel Room Occupancy Tax
Louisiana Stadium & Exposition District 48,370,233 49,703,616 2.76%New Orleans Exhibition Hall Authority 31,648,644 32,890,032 3.92%
New Orleans Exhibition Hall Authority TaxesFlat Room Occupancy Tax & Food & Beverage Taxes 18,448,123 19,333,707 4.80%Service Contractor Tax 1,182,878 1,879,180 58.87%Tour Tax 173,947 279,818 60.86%
Consumer Use Tax – Local & State1,3 468,877 160,831 -65.70%Consumer Use Tax – Excise3 596 7,131 1096.48%Catalog Sales Tax – Local & State3 496,667 1,068,818 115.20%
SUBTOTAL – OTHER TAXES $ 126,010,719 $ 131,860,331 4.64%GRAND TOTALS $ 7,809,997,821 $ 7,591,249,625 -2.80%
1Does not include collections of $1,278,259 from individual income tax returns during FY 2015-16 and $1,160,833 received during FY 2014-15.2Tax sunsetted FY12 and was reinstated effective April 1, 2016.3Taxes incurred a rate increase during FY 16.
Tax Collections
Cash Collections After Accrual Adjustments
10 2 0 1 5 – 2 0 1 6 A n n u a l Ta x C o l l e c t i o n R e p o r t
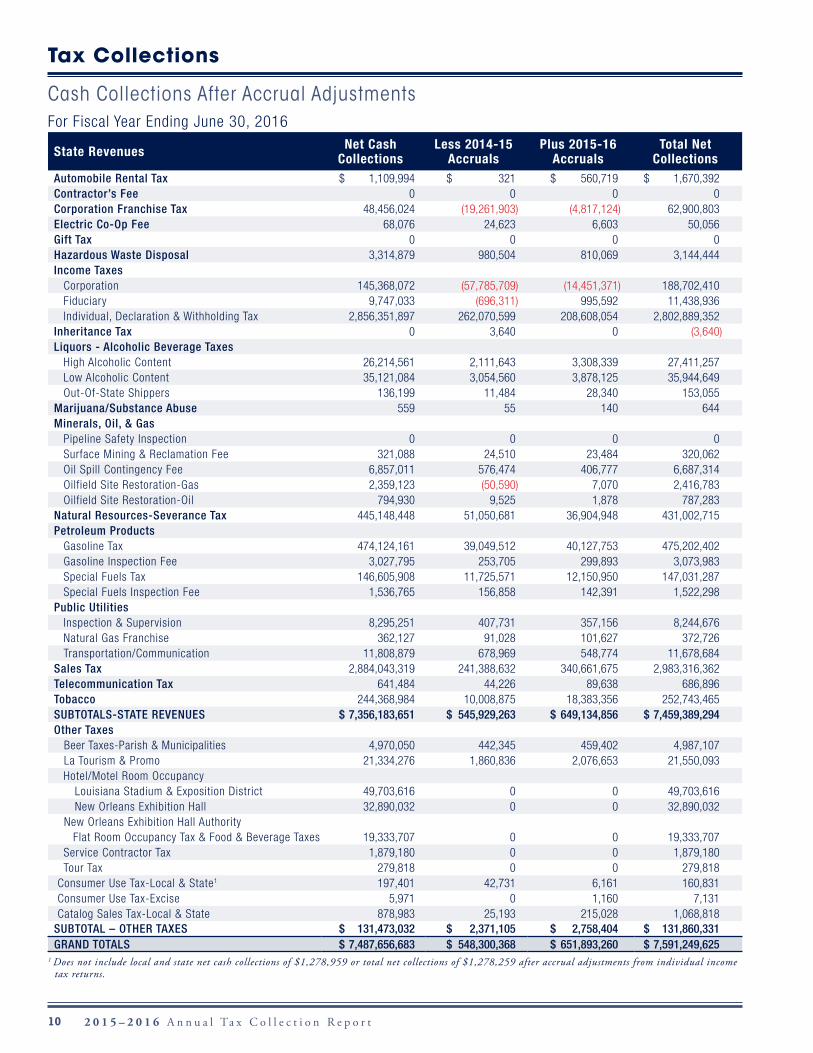
For Fiscal Year Ending June 30, 2016
State Revenues Net Cash Collections
Less 2014-15 Accruals
Plus 2015-16 Accruals
Total Net Collections
Automobile Rental Tax $ 1,109,994 $ 321 $ 560,719 $ 1,670,392 Contractor’s Fee 0 0 0 0 Corporation Franchise Tax 48,456,024 (19,261,903) (4,817,124) 62,900,803 Electric Co-Op Fee 68,076 24,623 6,603 50,056 Gift Tax 0 0 0 0 Hazardous Waste Disposal 3,314,879 980,504 810,069 3,144,444 Income Taxes
Corporation 145,368,072 (57,785,709) (14,451,371) 188,702,410 Fiduciary 9,747,033 (696,311) 995,592 11,438,936 Individual, Declaration & Withholding Tax 2,856,351,897 262,070,599 208,608,054 2,802,889,352
Inheritance Tax 0 3,640 0 (3,640)Liquors - Alcoholic Beverage Taxes
High Alcoholic Content 26,214,561 2,111,643 3,308,339 27,411,257 Low Alcoholic Content 35,121,084 3,054,560 3,878,125 35,944,649 Out-Of-State Shippers 136,199 11,484 28,340 153,055
Marijuana/Substance Abuse 559 55 140 644 Minerals, Oil, & Gas
Pipeline Safety Inspection 0 0 0 0 Surface Mining & Reclamation Fee 321,088 24,510 23,484 320,062 Oil Spill Contingency Fee 6,857,011 576,474 406,777 6,687,314 Oilfield Site Restoration-Gas 2,359,123 (50,590) 7,070 2,416,783 Oilfield Site Restoration-Oil 794,930 9,525 1,878 787,283
Natural Resources-Severance Tax 445,148,448 51,050,681 36,904,948 431,002,715 Petroleum Products
Gasoline Tax 474,124,161 39,049,512 40,127,753 475,202,402 Gasoline Inspection Fee 3,027,795 253,705 299,893 3,073,983 Special Fuels Tax 146,605,908 11,725,571 12,150,950 147,031,287 Special Fuels Inspection Fee 1,536,765 156,858 142,391 1,522,298
Public UtilitiesInspection & Supervision 8,295,251 407,731 357,156 8,244,676 Natural Gas Franchise 362,127 91,028 101,627 372,726 Transportation/Communication 11,808,879 678,969 548,774 11,678,684
Sales Tax 2,884,043,319 241,388,632 340,661,675 2,983,316,362 Telecommunication Tax 641,484 44,226 89,638 686,896 Tobacco 244,368,984 10,008,875 18,383,356 252,743,465 SUBTOTALS-STATE REVENUES $ 7,356,183,651 $ 545,929,263 $ 649,134,856 $ 7,459,389,294Other Taxes
Beer Taxes-Parish & Municipalities 4,970,050 442,345 459,402 4,987,107 La Tourism & Promo 21,334,276 1,860,836 2,076,653 21,550,093 Hotel/Motel Room Occupancy
Louisiana Stadium & Exposition District 49,703,616 0 0 49,703,616 New Orleans Exhibition Hall 32,890,032 0 0 32,890,032
New Orleans Exhibition Hall Authority Flat Room Occupancy Tax & Food & Beverage Taxes 19,333,707 0 0 19,333,707
Service Contractor Tax 1,879,180 0 0 1,879,180 Tour Tax 279,818 0 0 279,818
Consumer Use Tax-Local & State1 197,401 42,731 6,161 160,831 Consumer Use Tax-Excise 5,971 0 1,160 7,131 Catalog Sales Tax-Local & State 878,983 25,193 215,028 1,068,818
SUBTOTAL – OTHER TAXES $ 131,473,032 $ 2,371,105 $ 2,758,404 $ 131,860,331 GRAND TOTALS $ 7,487,656,683 $ 548,300,368 $ 651,893,260 $ 7,591,249,625
1 Does not include local and state net cash collections of $1,278,959 or total net collections of $1,278,259 after accrual adjustments from individual income tax returns.
Tax Collections
Cash Collections After Accrual Adjustments
112 0 1 5 – 2 0 1 6 A n n u a l Ta x C o l l e c t i o n R e p o r t
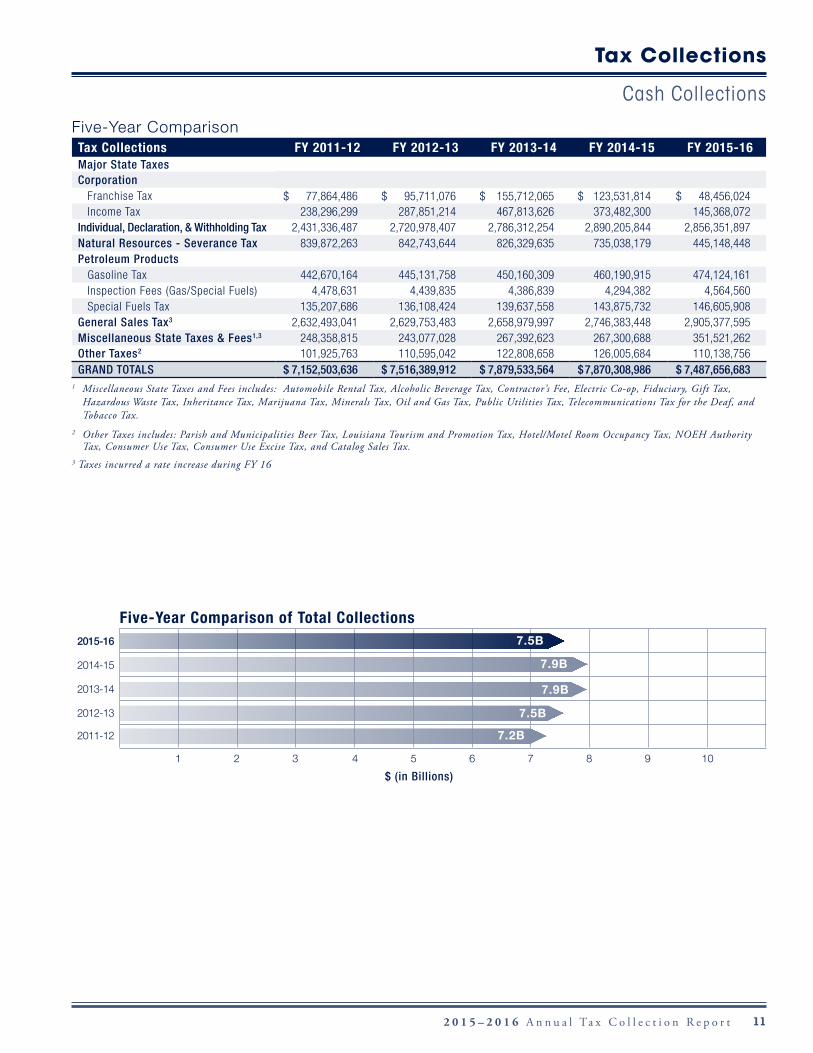
Five-Year ComparisonTax Collections FY 2011-12 FY 2012-13 FY 2013-14 FY 2014-15 FY 2015-16Major State TaxesCorporation
Franchise Tax $ 77,864,486 $ 95,711,076 $ 155,712,065 $ 123,531,814 $ 48,456,024 Income Tax 238,296,299 287,851,214 467,813,626 373,482,300 145,368,072
Individual, Declaration, & Withholding Tax 2,431,336,487 2,720,978,407 2,786,312,254 2,890,205,844 2,856,351,897 Natural Resources - Severance Tax 839,872,263 842,743,644 826,329,635 735,038,179 445,148,448 Petroleum Products
Gasoline Tax 442,670,164 445,131,758 450,160,309 460,190,915 474,124,161 Inspection Fees (Gas/Special Fuels) 4,478,631 4,439,835 4,386,839 4,294,382 4,564,560 Special Fuels Tax 135,207,686 136,108,424 139,637,558 143,875,732 146,605,908
General Sales Tax3 2,632,493,041 2,629,753,483 2,658,979,997 2,746,383,448 2,905,377,595 Miscellaneous State Taxes & Fees1,3 248,358,815 243,077,028 267,392,623 267,300,688 351,521,262 Other Taxes2 101,925,763 110,595,042 122,808,658 126,005,684 110,138,756 GRAND TOTALS $ 7,152,503,636 $ 7,516,389,912 $ 7,879,533,564 $ 7,870,308,986 $ 7,487,656,683
1 Miscellaneous State Taxes and Fees includes: Automobile Rental Tax, Alcoholic Beverage Tax, Contractor’s Fee, Electric Co-op, Fiduciary, Gift Tax, Hazardous Waste Tax, Inheritance Tax, Marijuana Tax, Minerals Tax, Oil and Gas Tax, Public Utilities Tax, Telecommunications Tax for the Deaf, and Tobacco Tax.
2 Other Taxes includes: Parish and Municipalities Beer Tax, Louisiana Tourism and Promotion Tax, Hotel/Motel Room Occupancy Tax, NOEH Authority Tax, Consumer Use Tax, Consumer Use Excise Tax, and Catalog Sales Tax.
3 Taxes incurred a rate increase during FY 16
Tax Collections
Cash Collections
Five-Year Comparison of Total Collections2015-16
2014-15
2013-14
2012-13
2011-12
1 2 3 4 5 6 7 8 9 10
$ (in Billions)
7.5B
7.9B
7.9B
7.5B
7.2B
12 2 0 1 5 – 2 0 1 6 A n n u a l Ta x C o l l e c t i o n R e p o r t
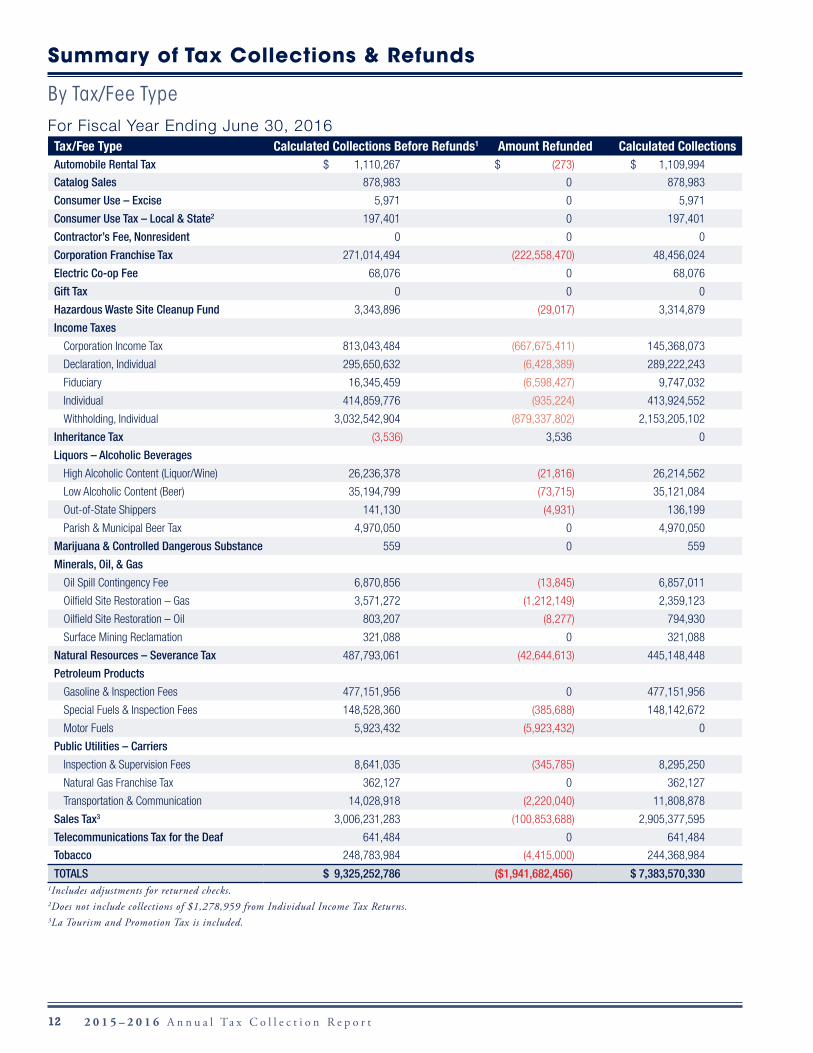
For Fiscal Year Ending June 30, 2016Tax/Fee Type Calculated Collections Before Refunds1 Amount Refunded Calculated CollectionsAutomobile Rental Tax $ 1,110,267 $ (273) $ 1,109,994
Catalog Sales 878,983 0 878,983
Consumer Use – Excise 5,971 0 5,971
Consumer Use Tax – Local & State2 197,401 0 197,401
Contractor’s Fee, Nonresident 0 0 0
Corporation Franchise Tax 271,014,494 (222,558,470) 48,456,024
Electric Co-op Fee 68,076 0 68,076
Gift Tax 0 0 0
Hazardous Waste Site Cleanup Fund 3,343,896 (29,017) 3,314,879
Income Taxes
Corporation Income Tax 813,043,484 (667,675,411) 145,368,073
Declaration, Individual 295,650,632 (6,428,389) 289,222,243
Fiduciary 16,345,459 (6,598,427) 9,747,032
Individual 414,859,776 (935,224) 413,924,552
Withholding, Individual 3,032,542,904 (879,337,802) 2,153,205,102
Inheritance Tax (3,536) 3,536 0
Liquors – Alcoholic Beverages
High Alcoholic Content (Liquor/Wine) 26,236,378 (21,816) 26,214,562
Low Alcoholic Content (Beer) 35,194,799 (73,715) 35,121,084
Out-of-State Shippers 141,130 (4,931) 136,199
Parish & Municipal Beer Tax 4,970,050 0 4,970,050
Marijuana & Controlled Dangerous Substance 559 0 559
Minerals, Oil, & Gas
Oil Spill Contingency Fee 6,870,856 (13,845) 6,857,011
Oilfield Site Restoration – Gas 3,571,272 (1,212,149) 2,359,123
Oilfield Site Restoration – Oil 803,207 (8,277) 794,930
Surface Mining Reclamation 321,088 0 321,088
Natural Resources – Severance Tax 487,793,061 (42,644,613) 445,148,448
Petroleum Products
Gasoline & Inspection Fees 477,151,956 0 477,151,956
Special Fuels & Inspection Fees 148,528,360 (385,688) 148,142,672
Motor Fuels 5,923,432 (5,923,432) 0
Public Utilities – Carriers
Inspection & Supervision Fees 8,641,035 (345,785) 8,295,250
Natural Gas Franchise Tax 362,127 0 362,127
Transportation & Communication 14,028,918 (2,220,040) 11,808,878
Sales Tax3 3,006,231,283 (100,853,688) 2,905,377,595
Telecommunications Tax for the Deaf 641,484 0 641,484
Tobacco 248,783,984 (4,415,000) 244,368,984
TOTALS $ 9,325,252,786 ($1,941,682,456) $ 7,383,570,330 1Includes adjustments for returned checks.2Does not include collections of $1,278,959 from Individual Income Tax Returns.3La Tourism and Promotion Tax is included.
Summary of Tax Collections & Refunds
By Tax/Fee Type
132 0 1 5 – 2 0 1 6 A n n u a l Ta x C o l l e c t i o n R e p o r t
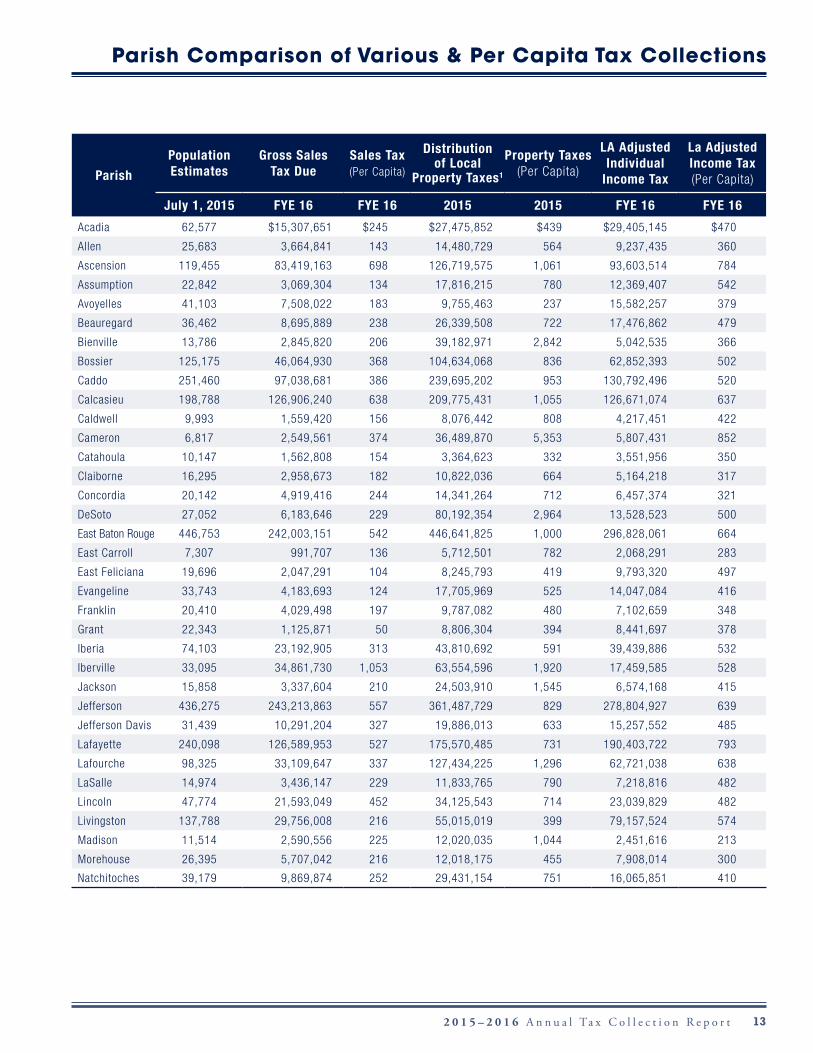
Parish
Population Estimates
Gross Sales Tax Due
Sales Tax (Per Capita)
Distribution of Local
Property Taxes1
Property Taxes(Per Capita)
LA Adjusted Individual
Income Tax
La Adjusted Income Tax(Per Capita)
July 1, 2015 FYE 16 FYE 16 2015 2015 FYE 16 FYE 16
Acadia 62,577 $15,307,651 $245 $27,475,852 $439 $29,405,145 $470
Allen 25,683 3,664,841 143 14,480,729 564 9,237,435 360
Ascension 119,455 83,419,163 698 126,719,575 1,061 93,603,514 784
Assumption 22,842 3,069,304 134 17,816,215 780 12,369,407 542
Avoyelles 41,103 7,508,022 183 9,755,463 237 15,582,257 379
Beauregard 36,462 8,695,889 238 26,339,508 722 17,476,862 479
Bienville 13,786 2,845,820 206 39,182,971 2,842 5,042,535 366
Bossier 125,175 46,064,930 368 104,634,068 836 62,852,393 502
Caddo 251,460 97,038,681 386 239,695,202 953 130,792,496 520
Calcasieu 198,788 126,906,240 638 209,775,431 1,055 126,671,074 637
Caldwell 9,993 1,559,420 156 8,076,442 808 4,217,451 422
Cameron 6,817 2,549,561 374 36,489,870 5,353 5,807,431 852
Catahoula 10,147 1,562,808 154 3,364,623 332 3,551,956 350
Claiborne 16,295 2,958,673 182 10,822,036 664 5,164,218 317
Concordia 20,142 4,919,416 244 14,341,264 712 6,457,374 321
DeSoto 27,052 6,183,646 229 80,192,354 2,964 13,528,523 500
East Baton Rouge 446,753 242,003,151 542 446,641,825 1,000 296,828,061 664
East Carroll 7,307 991,707 136 5,712,501 782 2,068,291 283
East Feliciana 19,696 2,047,291 104 8,245,793 419 9,793,320 497
Evangeline 33,743 4,183,693 124 17,705,969 525 14,047,084 416
Franklin 20,410 4,029,498 197 9,787,082 480 7,102,659 348
Grant 22,343 1,125,871 50 8,806,304 394 8,441,697 378
Iberia 74,103 23,192,905 313 43,810,692 591 39,439,886 532
Iberville 33,095 34,861,730 1,053 63,554,596 1,920 17,459,585 528
Jackson 15,858 3,337,604 210 24,503,910 1,545 6,574,168 415
Jefferson 436,275 243,213,863 557 361,487,729 829 278,804,927 639
Jefferson Davis 31,439 10,291,204 327 19,886,013 633 15,257,552 485
Lafayette 240,098 126,589,953 527 175,570,485 731 190,403,722 793
Lafourche 98,325 33,109,647 337 127,434,225 1,296 62,721,038 638
LaSalle 14,974 3,436,147 229 11,833,765 790 7,218,816 482
Lincoln 47,774 21,593,049 452 34,125,543 714 23,039,829 482
Livingston 137,788 29,756,008 216 55,015,019 399 79,157,524 574
Madison 11,514 2,590,556 225 12,020,035 1,044 2,451,616 213
Morehouse 26,395 5,707,042 216 12,018,175 455 7,908,014 300
Natchitoches 39,179 9,869,874 252 29,431,154 751 16,065,851 410
Parish Comparison of Various & Per Capita Tax Collections
14 2 0 1 5 – 2 0 1 6 A n n u a l Ta x C o l l e c t i o n R e p o r t
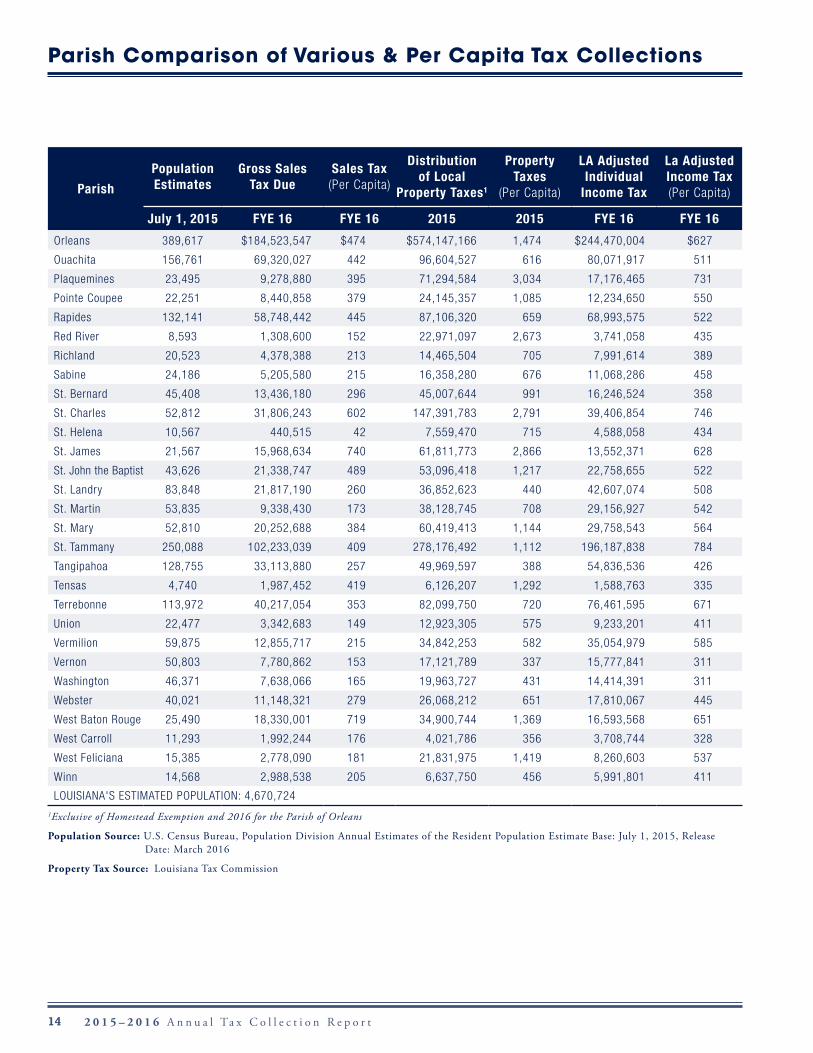
Parish
Population Estimates
Gross Sales Tax Due
Sales Tax (Per Capita)
Distribution of Local
Property Taxes1
Property Taxes
(Per Capita)
LA Adjusted Individual
Income Tax
La Adjusted Income Tax(Per Capita)
July 1, 2015 FYE 16 FYE 16 2015 2015 FYE 16 FYE 16
Orleans 389,617 $184,523,547 $474 $574,147,166 1,474 $244,470,004 $627
Ouachita 156,761 69,320,027 442 96,604,527 616 80,071,917 511
Plaquemines 23,495 9,278,880 395 71,294,584 3,034 17,176,465 731
Pointe Coupee 22,251 8,440,858 379 24,145,357 1,085 12,234,650 550
Rapides 132,141 58,748,442 445 87,106,320 659 68,993,575 522
Red River 8,593 1,308,600 152 22,971,097 2,673 3,741,058 435
Richland 20,523 4,378,388 213 14,465,504 705 7,991,614 389
Sabine 24,186 5,205,580 215 16,358,280 676 11,068,286 458
St. Bernard 45,408 13,436,180 296 45,007,644 991 16,246,524 358
St. Charles 52,812 31,806,243 602 147,391,783 2,791 39,406,854 746
St. Helena 10,567 440,515 42 7,559,470 715 4,588,058 434
St. James 21,567 15,968,634 740 61,811,773 2,866 13,552,371 628
St. John the Baptist 43,626 21,338,747 489 53,096,418 1,217 22,758,655 522
St. Landry 83,848 21,817,190 260 36,852,623 440 42,607,074 508
St. Martin 53,835 9,338,430 173 38,128,745 708 29,156,927 542
St. Mary 52,810 20,252,688 384 60,419,413 1,144 29,758,543 564
St. Tammany 250,088 102,233,039 409 278,176,492 1,112 196,187,838 784
Tangipahoa 128,755 33,113,880 257 49,969,597 388 54,836,536 426
Tensas 4,740 1,987,452 419 6,126,207 1,292 1,588,763 335
Terrebonne 113,972 40,217,054 353 82,099,750 720 76,461,595 671
Union 22,477 3,342,683 149 12,923,305 575 9,233,201 411
Vermilion 59,875 12,855,717 215 34,842,253 582 35,054,979 585
Vernon 50,803 7,780,862 153 17,121,789 337 15,777,841 311
Washington 46,371 7,638,066 165 19,963,727 431 14,414,391 311
Webster 40,021 11,148,321 279 26,068,212 651 17,810,067 445
West Baton Rouge 25,490 18,330,001 719 34,900,744 1,369 16,593,568 651
West Carroll 11,293 1,992,244 176 4,021,786 356 3,708,744 328
West Feliciana 15,385 2,778,090 181 21,831,975 1,419 8,260,603 537
Winn 14,568 2,988,538 205 6,637,750 456 5,991,801 411
LOUISIANA'S ESTIMATED POPULATION: 4,670,7241Exclusive of Homestead Exemption and 2016 for the Parish of Orleans
Population Source: U.S. Census Bureau, Population Division Annual Estimates of the Resident Population Estimate Base: July 1, 2015, Release Date: March 2016
Property Tax Source: Louisiana Tax Commission
Parish Comparison of Various & Per Capita Tax Collections
152 0 1 5 – 2 0 1 6 A n n u a l Ta x C o l l e c t i o n R e p o r t
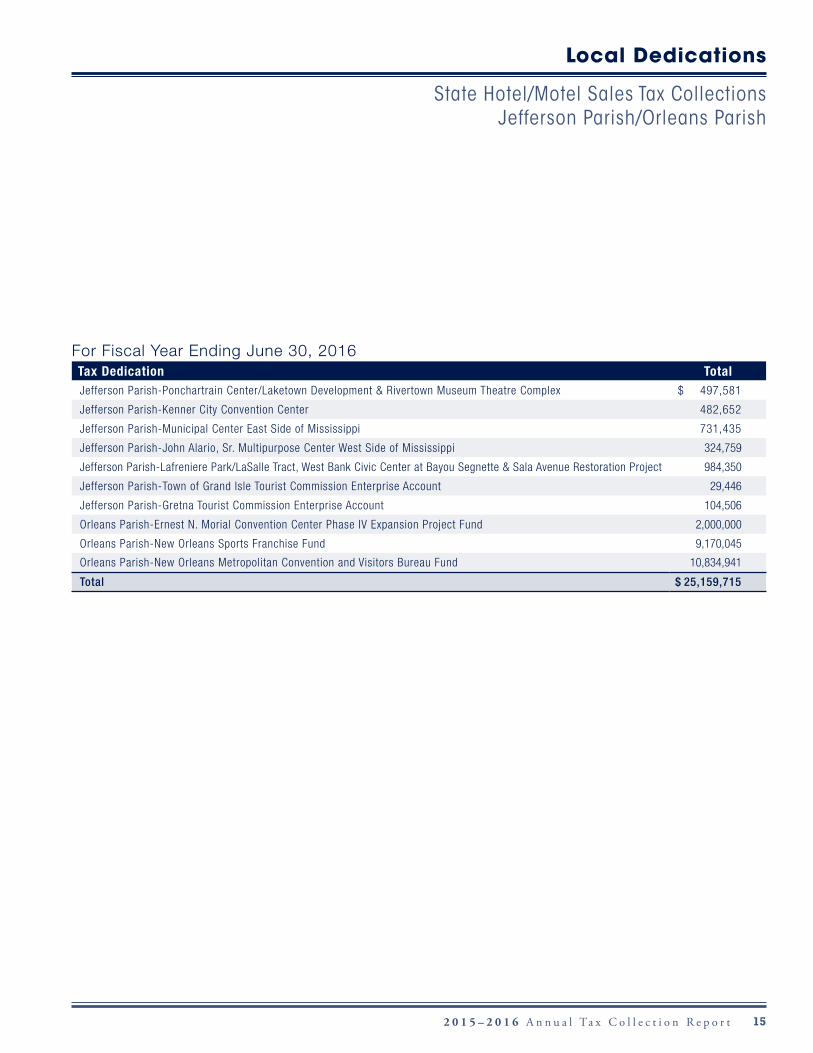
Local Dedications
State Hotel/Motel Sales Tax Collections Jefferson Parish/Orleans Parish
For Fiscal Year Ending June 30, 2016Tax Dedication TotalJefferson Parish-Ponchartrain Center/Laketown Development & Rivertown Museum Theatre Complex $ 497,581
Jefferson Parish-Kenner City Convention Center 482,652
Jefferson Parish-Municipal Center East Side of Mississippi 731,435
Jefferson Parish-John Alario, Sr. Multipurpose Center West Side of Mississippi 324,759
Jefferson Parish-Lafreniere Park/LaSalle Tract, West Bank Civic Center at Bayou Segnette & Sala Avenue Restoration Project 984,350
Jefferson Parish-Town of Grand Isle Tourist Commission Enterprise Account 29,446
Jefferson Parish-Gretna Tourist Commission Enterprise Account 104,506
Orleans Parish-Ernest N. Morial Convention Center Phase IV Expansion Project Fund 2,000,000
Orleans Parish-New Orleans Sports Franchise Fund 9,170,045
Orleans Parish-New Orleans Metropolitan Convention and Visitors Bureau Fund 10,834,941
Total $ 25,159,715
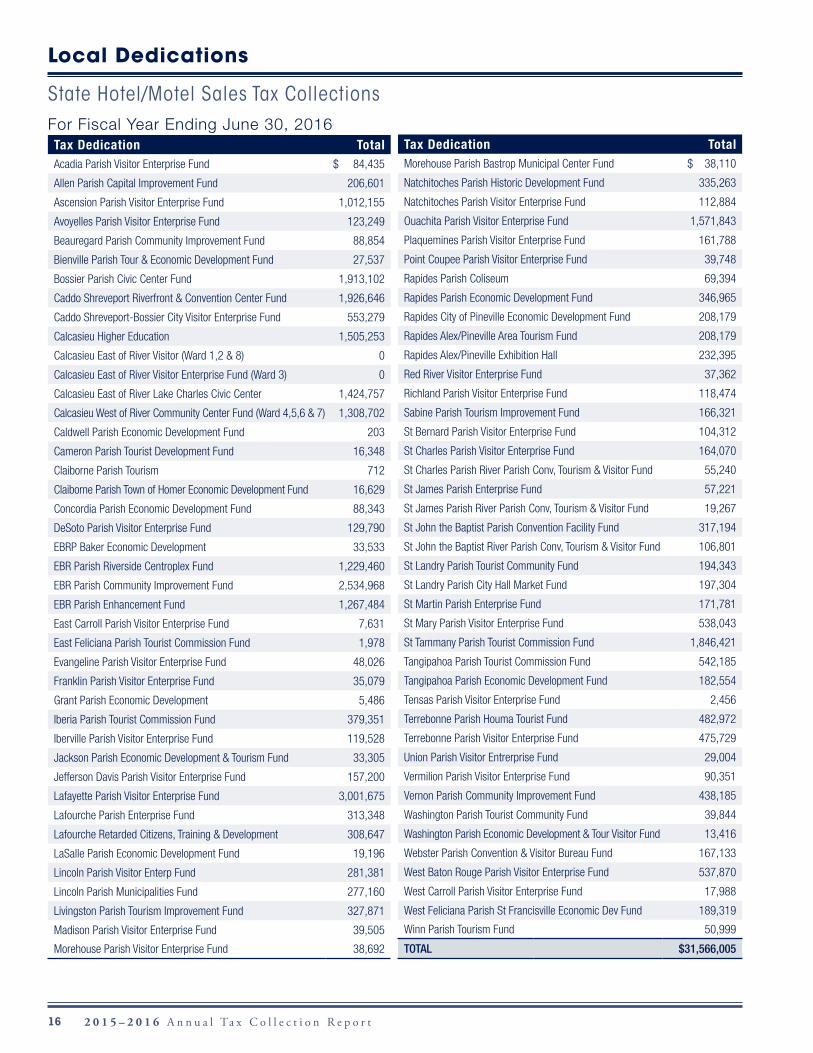
16 2 0 1 5 – 2 0 1 6 A n n u a l Ta x C o l l e c t i o n R e p o r t
For Fiscal Year Ending June 30, 2016Tax Dedication TotalAcadia Parish Visitor Enterprise Fund $ 84,435
Allen Parish Capital Improvement Fund 206,601
Ascension Parish Visitor Enterprise Fund 1,012,155
Avoyelles Parish Visitor Enterprise Fund 123,249
Beauregard Parish Community Improvement Fund 88,854
Bienville Parish Tour & Economic Development Fund 27,537
Bossier Parish Civic Center Fund 1,913,102
Caddo Shreveport Riverfront & Convention Center Fund 1,926,646
Caddo Shreveport-Bossier City Visitor Enterprise Fund 553,279
Calcasieu Higher Education 1,505,253
Calcasieu East of River Visitor (Ward 1,2 & 8) 0
Calcasieu East of River Visitor Enterprise Fund (Ward 3) 0
Calcasieu East of River Lake Charles Civic Center 1,424,757
Calcasieu West of River Community Center Fund (Ward 4,5,6 & 7) 1,308,702
Caldwell Parish Economic Development Fund 203
Cameron Parish Tourist Development Fund 16,348
Claiborne Parish Tourism 712
Claiborne Parish Town of Homer Economic Development Fund 16,629
Concordia Parish Economic Development Fund 88,343
DeSoto Parish Visitor Enterprise Fund 129,790
EBRP Baker Economic Development 33,533
EBR Parish Riverside Centroplex Fund 1,229,460
EBR Parish Community Improvement Fund 2,534,968
EBR Parish Enhancement Fund 1,267,484
East Carroll Parish Visitor Enterprise Fund 7,631
East Feliciana Parish Tourist Commission Fund 1,978
Evangeline Parish Visitor Enterprise Fund 48,026
Franklin Parish Visitor Enterprise Fund 35,079
Grant Parish Economic Development 5,486
Iberia Parish Tourist Commission Fund 379,351
Iberville Parish Visitor Enterprise Fund 119,528
Jackson Parish Economic Development & Tourism Fund 33,305
Jefferson Davis Parish Visitor Enterprise Fund 157,200
Lafayette Parish Visitor Enterprise Fund 3,001,675
Lafourche Parish Enterprise Fund 313,348
Lafourche Retarded Citizens, Training & Development 308,647
LaSalle Parish Economic Development Fund 19,196
Lincoln Parish Visitor Enterp Fund 281,381
Lincoln Parish Municipalities Fund 277,160
Livingston Parish Tourism Improvement Fund 327,871
Madison Parish Visitor Enterprise Fund 39,505
Morehouse Parish Visitor Enterprise Fund 38,692
Tax Dedication TotalMorehouse Parish Bastrop Municipal Center Fund $ 38,110
Natchitoches Parish Historic Development Fund 335,263
Natchitoches Parish Visitor Enterprise Fund 112,884
Ouachita Parish Visitor Enterprise Fund 1,571,843
Plaquemines Parish Visitor Enterprise Fund 161,788
Point Coupee Parish Visitor Enterprise Fund 39,748
Rapides Parish Coliseum 69,394
Rapides Parish Economic Development Fund 346,965
Rapides City of Pineville Economic Development Fund 208,179
Rapides Alex/Pineville Area Tourism Fund 208,179
Rapides Alex/Pineville Exhibition Hall 232,395
Red River Visitor Enterprise Fund 37,362
Richland Parish Visitor Enterprise Fund 118,474
Sabine Parish Tourism Improvement Fund 166,321
St Bernard Parish Visitor Enterprise Fund 104,312
St Charles Parish Visitor Enterprise Fund 164,070
St Charles Parish River Parish Conv, Tourism & Visitor Fund 55,240
St James Parish Enterprise Fund 57,221
St James Parish River Parish Conv, Tourism & Visitor Fund 19,267
St John the Baptist Parish Convention Facility Fund 317,194
St John the Baptist River Parish Conv, Tourism & Visitor Fund 106,801
St Landry Parish Tourist Community Fund 194,343
St Landry Parish City Hall Market Fund 197,304
St Martin Parish Enterprise Fund 171,781
St Mary Parish Visitor Enterprise Fund 538,043
St Tammany Parish Tourist Commission Fund 1,846,421
Tangipahoa Parish Tourist Commission Fund 542,185
Tangipahoa Parish Economic Development Fund 182,554
Tensas Parish Visitor Enterprise Fund 2,456
Terrebonne Parish Houma Tourist Fund 482,972
Terrebonne Parish Visitor Enterprise Fund 475,729
Union Parish Visitor Entrerprise Fund 29,004
Vermilion Parish Visitor Enterprise Fund 90,351
Vernon Parish Community Improvement Fund 438,185
Washington Parish Tourist Community Fund 39,844
Washington Parish Economic Development & Tour Visitor Fund 13,416
Webster Parish Convention & Visitor Bureau Fund 167,133
West Baton Rouge Parish Visitor Enterprise Fund 537,870
West Carroll Parish Visitor Enterprise Fund 17,988
West Feliciana Parish St Francisville Economic Dev Fund 189,319
Winn Parish Tourism Fund 50,999
TOTAL $31,566,005
Local Dedications
State Hotel/Motel Sales Tax Collections
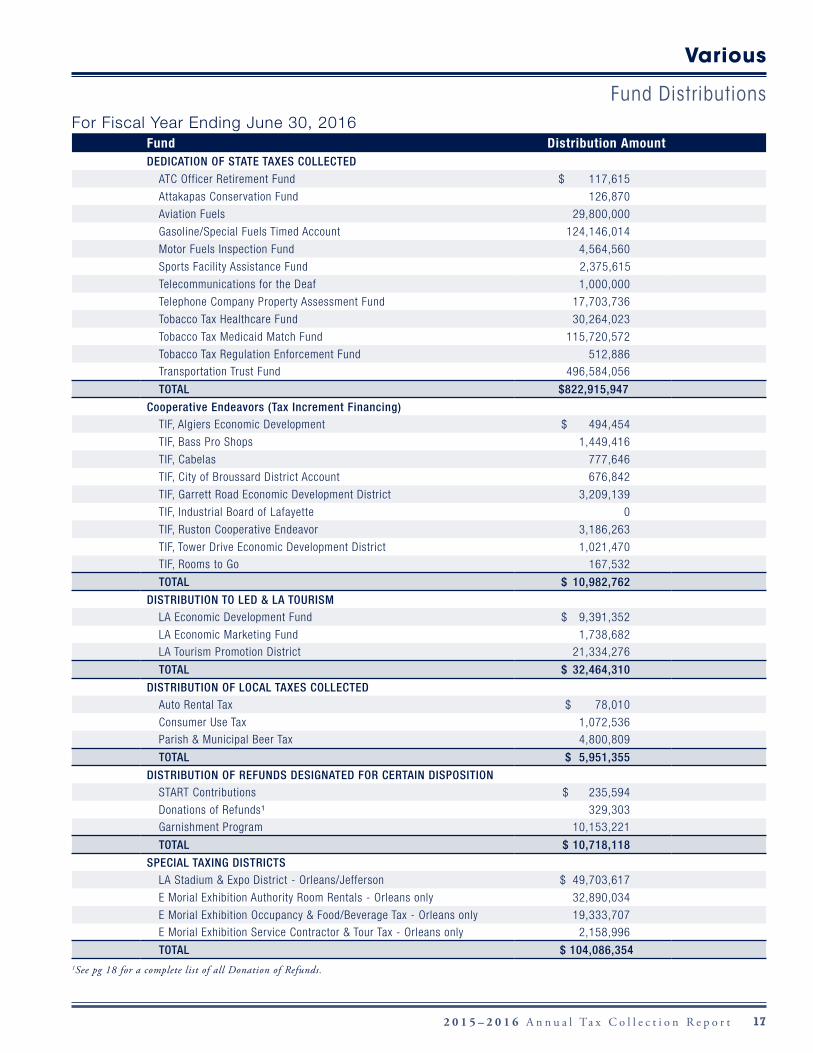
172 0 1 5 – 2 0 1 6 A n n u a l Ta x C o l l e c t i o n R e p o r t
For Fiscal Year Ending June 30, 2016Fund Distribution AmountDEDICATION OF STATE TAXES COLLECTED
ATC Officer Retirement Fund $ 117,615
Attakapas Conservation Fund 126,870
Aviation Fuels 29,800,000
Gasoline/Special Fuels Timed Account 124,146,014
Motor Fuels Inspection Fund 4,564,560
Sports Facility Assistance Fund 2,375,615
Telecommunications for the Deaf 1,000,000
Telephone Company Property Assessment Fund 17,703,736
Tobacco Tax Healthcare Fund 30,264,023
Tobacco Tax Medicaid Match Fund 115,720,572
Tobacco Tax Regulation Enforcement Fund 512,886
Transportation Trust Fund 496,584,056
TOTAL $822,915,947
Cooperative Endeavors (Tax Increment Financing)TIF, Algiers Economic Development $ 494,454
TIF, Bass Pro Shops 1,449,416
TIF, Cabelas 777,646
TIF, City of Broussard District Account 676,842
TIF, Garrett Road Economic Development District 3,209,139
TIF, Industrial Board of Lafayette 0
TIF, Ruston Cooperative Endeavor 3,186,263
TIF, Tower Drive Economic Development District 1,021,470
TIF, Rooms to Go 167,532
TOTAL $ 10,982,762
DISTRIBUTION TO LED & LA TOURISMLA Economic Development Fund $ 9,391,352
LA Economic Marketing Fund 1,738,682
LA Tourism Promotion District 21,334,276
TOTAL $ 32,464,310
DISTRIBUTION OF LOCAL TAXES COLLECTEDAuto Rental Tax $ 78,010
Consumer Use Tax 1,072,536
Parish & Municipal Beer Tax 4,800,809
TOTAL $ 5,951,355
DISTRIBUTION OF REFUNDS DESIGNATED FOR CERTAIN DISPOSITIONSTART Contributions $ 235,594
Donations of Refunds¹ 329,303
Garnishment Program 10,153,221
TOTAL $ 10,718,118
SPECIAL TAXING DISTRICTSLA Stadium & Expo District - Orleans/Jefferson $ 49,703,617
E Morial Exhibition Authority Room Rentals - Orleans only 32,890,034
E Morial Exhibition Occupancy & Food/Beverage Tax - Orleans only 19,333,707
E Morial Exhibition Service Contractor & Tour Tax - Orleans only 2,158,996
TOTAL $ 104,086,354 1See pg 18 for a complete list of all Donation of Refunds.
Various
Fund Distributions
18 2 0 1 5 – 2 0 1 6 A n n u a l Ta x C o l l e c t i o n R e p o r t
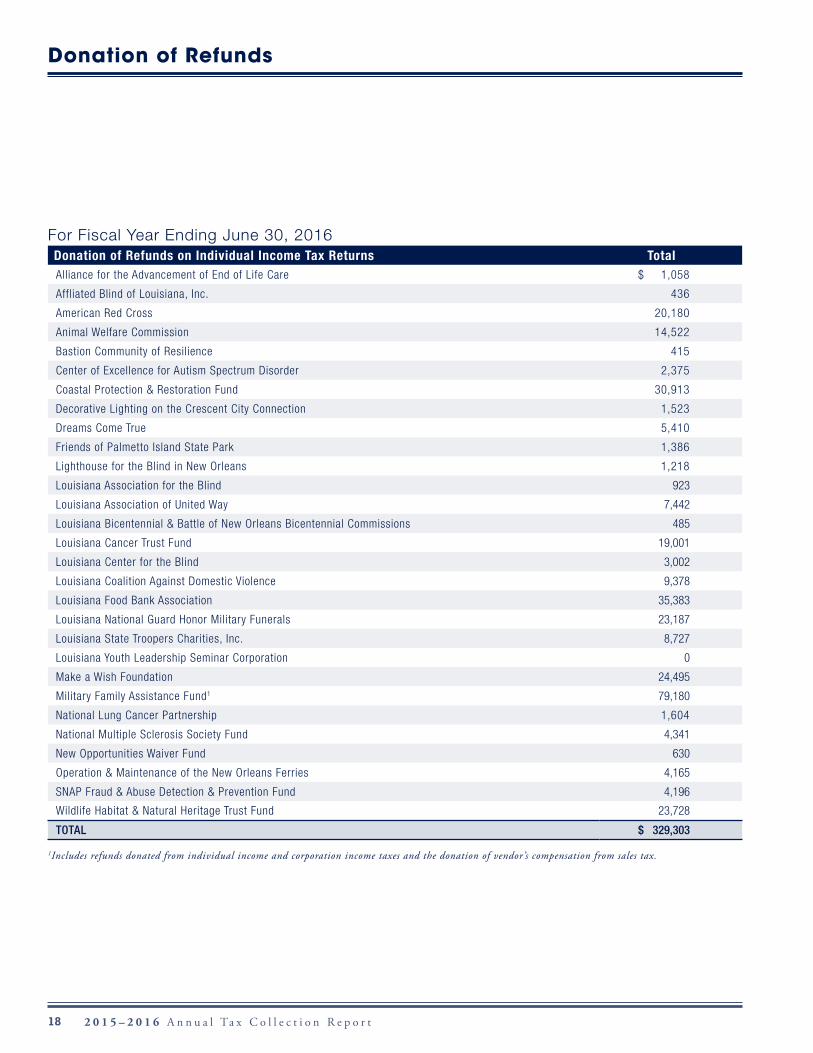
Donation of Refunds
For Fiscal Year Ending June 30, 2016Donation of Refunds on Individual Income Tax Returns TotalAlliance for the Advancement of End of Life Care $ 1,058
Affliated Blind of Louisiana, Inc. 436
American Red Cross 20,180
Animal Welfare Commission 14,522
Bastion Community of Resilience 415
Center of Excellence for Autism Spectrum Disorder 2,375
Coastal Protection & Restoration Fund 30,913
Decorative Lighting on the Crescent City Connection 1,523
Dreams Come True 5,410
Friends of Palmetto Island State Park 1,386
Lighthouse for the Blind in New Orleans 1,218
Louisiana Association for the Blind 923
Louisiana Association of United Way 7,442
Louisiana Bicentennial & Battle of New Orleans Bicentennial Commissions 485
Louisiana Cancer Trust Fund 19,001
Louisiana Center for the Blind 3,002
Louisiana Coalition Against Domestic Violence 9,378
Louisiana Food Bank Association 35,383
Louisiana National Guard Honor Military Funerals 23,187
Louisiana State Troopers Charities, Inc. 8,727
Louisiana Youth Leadership Seminar Corporation 0
Make a Wish Foundation 24,495
Military Family Assistance Fund1 79,180
National Lung Cancer Partnership 1,604
National Multiple Sclerosis Society Fund 4,341
New Opportunities Waiver Fund 630
Operation & Maintenance of the New Orleans Ferries 4,165
SNAP Fraud & Abuse Detection & Prevention Fund 4,196
Wildlife Habitat & Natural Heritage Trust Fund 23,728
TOTAL $ 329,303
1Includes refunds donated from individual income and corporation income taxes and the donation of vendor’s compensation from sales tax.
192 0 1 5 – 2 0 1 6 A n n u a l Ta x C o l l e c t i o n R e p o r t
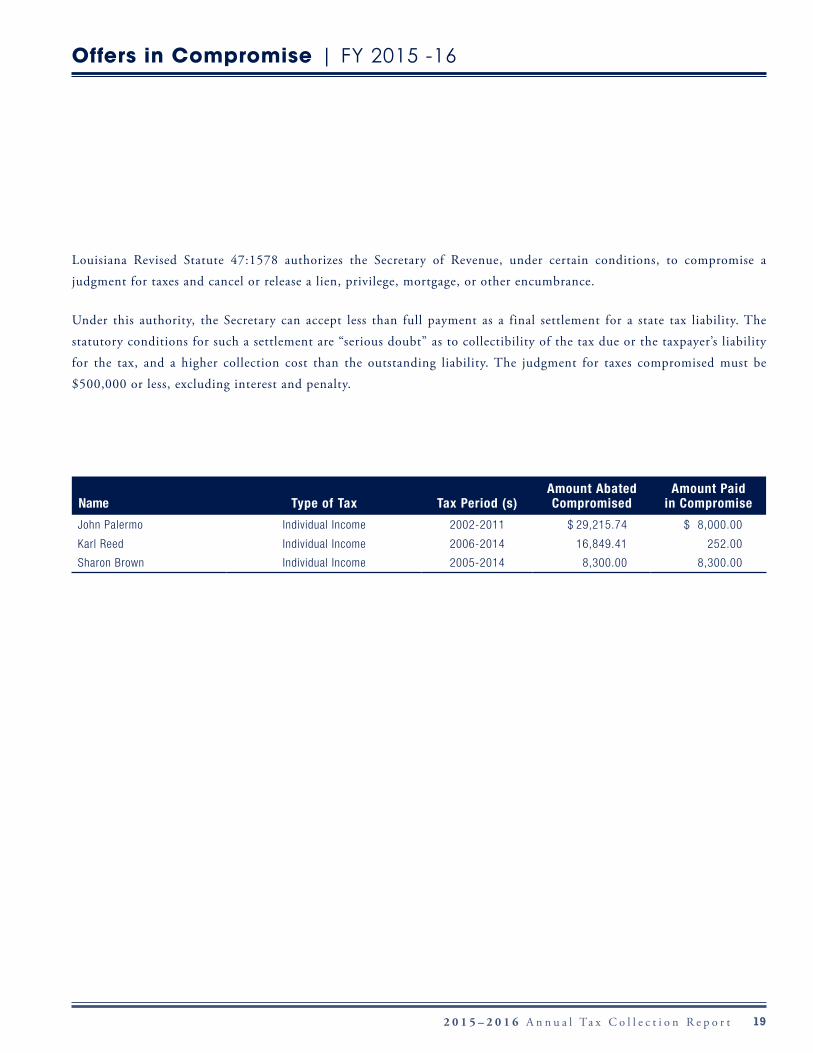
Louisiana Revised Statute 47:1578 authorizes the Secretary of Revenue, under certain conditions, to compromise a
judgment for taxes and cancel or release a lien, privilege, mortgage, or other encumbrance.
Under this authority, the Secretary can accept less than full payment as a final settlement for a state tax liability. The
statutory conditions for such a settlement are “serious doubt” as to collectibility of the tax due or the taxpayer’s liability
for the tax, and a higher collection cost than the outstanding liability. The judgment for taxes compromised must be
$500,000 or less, excluding interest and penalty.
Name Type of Tax Tax Period (s)Amount Abated Compromised
Amount Paid in Compromise
John Palermo Individual Income 2002-2011 $ 29,215.74 $ 8,000.00
Karl Reed Individual Income 2006-2014 16,849.41 252.00
Sharon Brown Individual Income 2005-2014 8,300.00 8,300.00
Offers in Compromise | FY 2015 -16

DATA BY TAX TYPE
22 2 0 1 5 – 2 0 1 6 A n n u a l Ta x C o l l e c t i o n R e p o r t
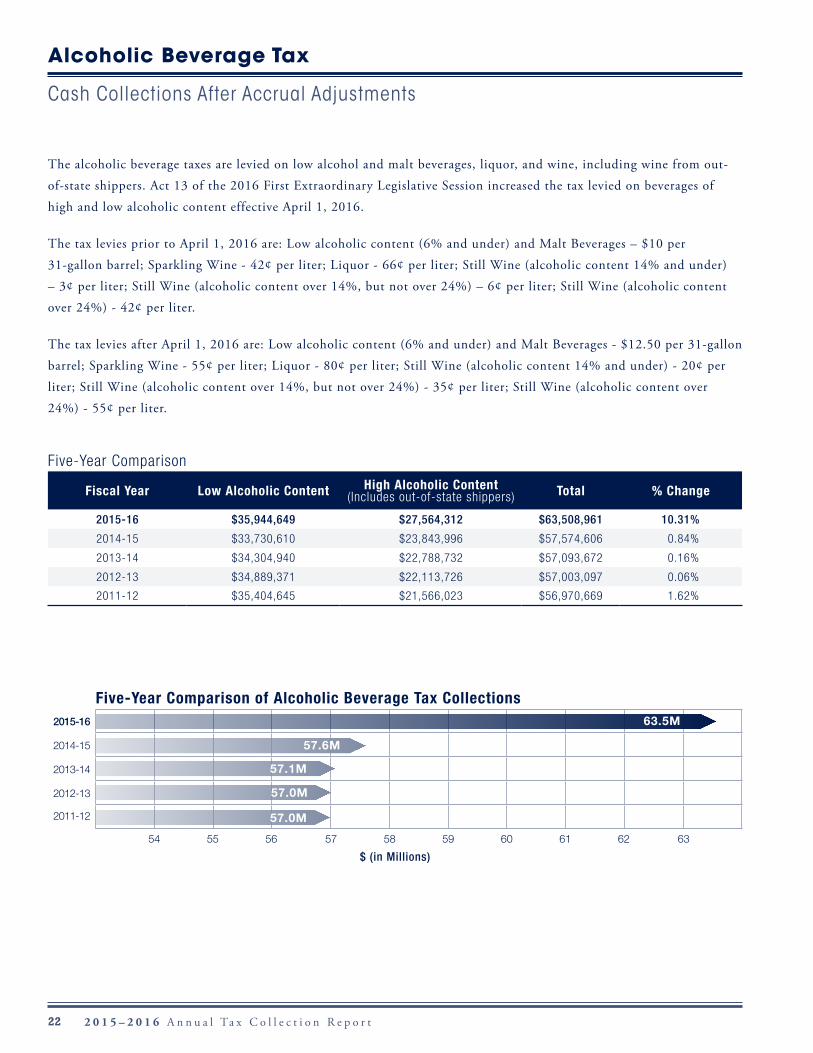
The alcoholic beverage taxes are levied on low alcohol and malt beverages, liquor, and wine, including wine from out-
of-state shippers. Act 13 of the 2016 First Extraordinary Legislative Session increased the tax levied on beverages of
high and low alcoholic content effective April 1, 2016.
The tax levies prior to April 1, 2016 are: Low alcoholic content (6% and under) and Malt Beverages – $10 per
31-gallon barrel; Sparkling Wine - 42¢ per liter; Liquor - 66¢ per liter; Still Wine (alcoholic content 14% and under)
– 3¢ per liter; Still Wine (alcoholic content over 14%, but not over 24%) – 6¢ per liter; Still Wine (alcoholic content
over 24%) - 42¢ per liter.
The tax levies after April 1, 2016 are: Low alcoholic content (6% and under) and Malt Beverages - $12.50 per 31-gallon
barrel; Sparkling Wine - 55¢ per liter; Liquor - 80¢ per liter; Still Wine (alcoholic content 14% and under) - 20¢ per
liter; Still Wine (alcoholic content over 14%, but not over 24%) - 35¢ per liter; Still Wine (alcoholic content over
24%) - 55¢ per liter.
Five-Year Comparison
Fiscal Year Low Alcoholic Content High Alcoholic Content(Includes out-of-state shippers) Total % Change
2015-16 $35,944,649 $27,564,312 $63,508,961 10.31%
2014-15 $33,730,610 $23,843,996 $57,574,606 0.84%
2013-14 $34,304,940 $22,788,732 $57,093,672 0.16%
2012-13 $34,889,371 $22,113,726 $57,003,097 0.06%
2011-12 $35,404,645 $21,566,023 $56,970,669 1.62%
Alcoholic Beverage Tax
Cash Collections After Accrual Adjustments
Five-Year Comparison of Alcoholic Beverage Tax Collections2015-16
2014-15
2013-14
2012-13
2011-12
54 55 56 57 58 59 60 61 62 63
$ (in Millions)
63.5M
57.6M
57.1M
57.0M
57.0M
232 0 1 5 – 2 0 1 6 A n n u a l Ta x C o l l e c t i o n R e p o r t
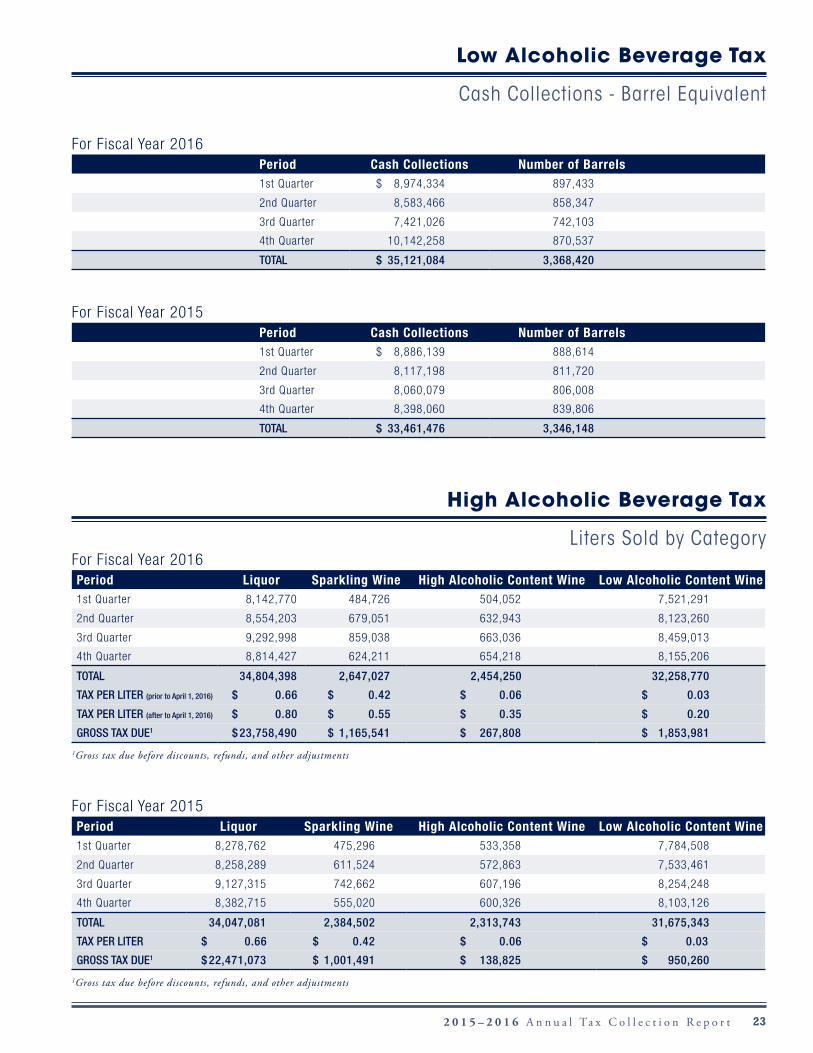
Low Alcoholic Beverage Tax
Cash Collections - Barrel Equivalent
High Alcoholic Beverage Tax
Liters Sold by Category
For Fiscal Year 2016Period Cash Collections Number of Barrels1st Quarter $ 8,974,334 897,433
2nd Quarter 8,583,466 858,347
3rd Quarter 7,421,026 742,103
4th Quarter 10,142,258 870,537
TOTAL $ 35,121,084 3,368,420
For Fiscal Year 2015Period Cash Collections Number of Barrels1st Quarter $ 8,886,139 888,614
2nd Quarter 8,117,198 811,720
3rd Quarter 8,060,079 806,008
4th Quarter 8,398,060 839,806
TOTAL $ 33,461,476 3,346,148
For Fiscal Year 2016Period Liquor Sparkling Wine High Alcoholic Content Wine Low Alcoholic Content Wine1st Quarter 8,142,770 484,726 504,052 7,521,291
2nd Quarter 8,554,203 679,051 632,943 8,123,260
3rd Quarter 9,292,998 859,038 663,036 8,459,013
4th Quarter 8,814,427 624,211 654,218 8,155,206
TOTAL 34,804,398 2,647,027 2,454,250 32,258,770
TAX PER LITER (prior to April 1, 2016) $ 0.66 $ 0.42 $ 0.06 $ 0.03
TAX PER LITER (after to April 1, 2016) $ 0.80 $ 0.55 $ 0.35 $ 0.20
GROSS TAX DUE1 $ 23,758,490 $ 1,165,541 $ 267,808 $ 1,853,981
1Gross tax due before discounts, refunds, and other adjustments
For Fiscal Year 2015Period Liquor Sparkling Wine High Alcoholic Content Wine Low Alcoholic Content Wine1st Quarter 8,278,762 475,296 533,358 7,784,508
2nd Quarter 8,258,289 611,524 572,863 7,533,461
3rd Quarter 9,127,315 742,662 607,196 8,254,248
4th Quarter 8,382,715 555,020 600,326 8,103,126
TOTAL 34,047,081 2,384,502 2,313,743 31,675,343
TAX PER LITER $ 0.66 $ 0.42 $ 0.06 $ 0.03
GROSS TAX DUE1 $ 22,471,073 $ 1,001,491 $ 138,825 $ 950,260
1Gross tax due before discounts, refunds, and other adjustments
24 2 0 1 5 – 2 0 1 6 A n n u a l Ta x C o l l e c t i o n R e p o r t
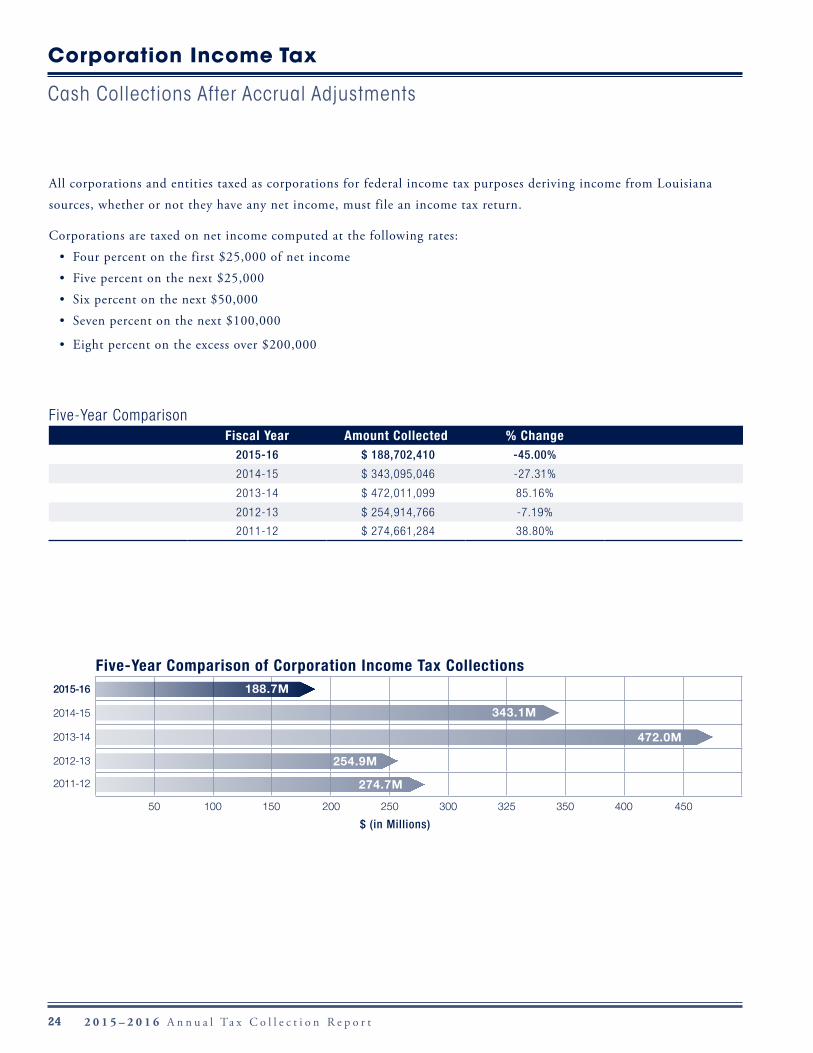
Corporation Income Tax
Cash Collections After Accrual Adjustments
All corporations and entities taxed as corporations for federal income tax purposes deriving income from Louisiana
sources, whether or not they have any net income, must file an income tax return.
Corporations are taxed on net income computed at the following rates:
• Four percent on the first $25,000 of net income
• Five percent on the next $25,000
• Six percent on the next $50,000
• Seven percent on the next $100,000
• Eight percent on the excess over $200,000
Five-Year ComparisonFiscal Year Amount Collected % Change
2015-16 $ 188,702,410 -45.00%
2014-15 $ 343,095,046 -27.31%
2013-14 $ 472,011,099 85.16%
2012-13 $ 254,914,766 -7.19%
2011-12 $ 274,661,284 38.80%
Five-Year Comparison of Corporation Income Tax Collections 2015-16
2014-15
2013-14
2012-13
2011-12
50 100 150 200 250 300 325 350 400 450
$ (in Millions)
343.1M
188.7M
472.0M
254.9M
274.7M
252 0 1 5 – 2 0 1 6 A n n u a l Ta x C o l l e c t i o n R e p o r t
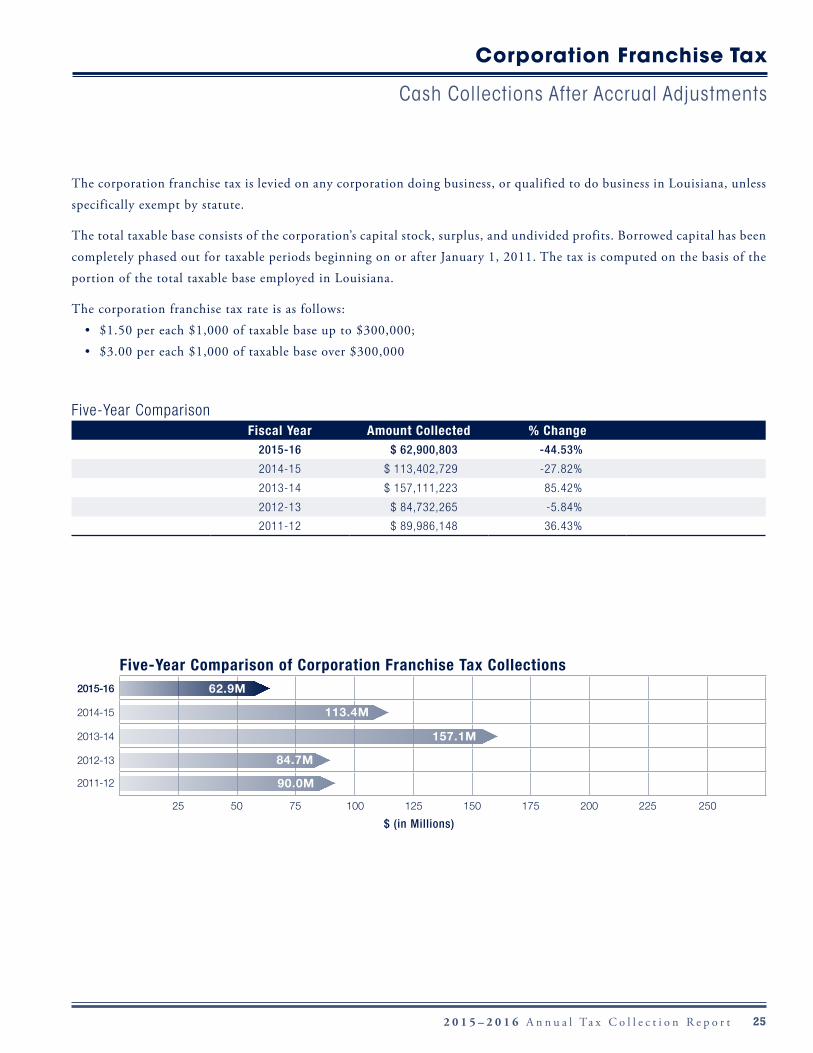
Corporation Franchise Tax
Cash Collections After Accrual Adjustments
The corporation franchise tax is levied on any corporation doing business, or qualified to do business in Louisiana, unless
specifically exempt by statute.
The total taxable base consists of the corporation’s capital stock, surplus, and undivided profits. Borrowed capital has been
completely phased out for taxable periods beginning on or after January 1, 2011. The tax is computed on the basis of the
portion of the total taxable base employed in Louisiana.
The corporation franchise tax rate is as follows:
• $1.50 per each $1,000 of taxable base up to $300,000;
• $3.00 per each $1,000 of taxable base over $300,000
Five-Year ComparisonFiscal Year Amount Collected % Change
2015-16 $ 62,900,803 -44.53%
2014-15 $ 113,402,729 -27.82%
2013-14 $ 157,111,223 85.42%
2012-13 $ 84,732,265 -5.84%
2011-12 $ 89,986,148 36.43%
Five-Year Comparison of Corporation Franchise Tax Collections 2015-16
2014-15
2013-14
2012-13
2011-12
25 50 75 100 125 150 175 200 225 250
$ (in Millions)
113.4M
62.9M
157.1M
84.7M
90.0M
26 2 0 1 5 – 2 0 1 6 A n n u a l Ta x C o l l e c t i o n R e p o r t
Taxable Income Bracket
Number of Returns
Percent of Total Returns
Taxable Income
Income Tax Liability1
Percent of Total Liability
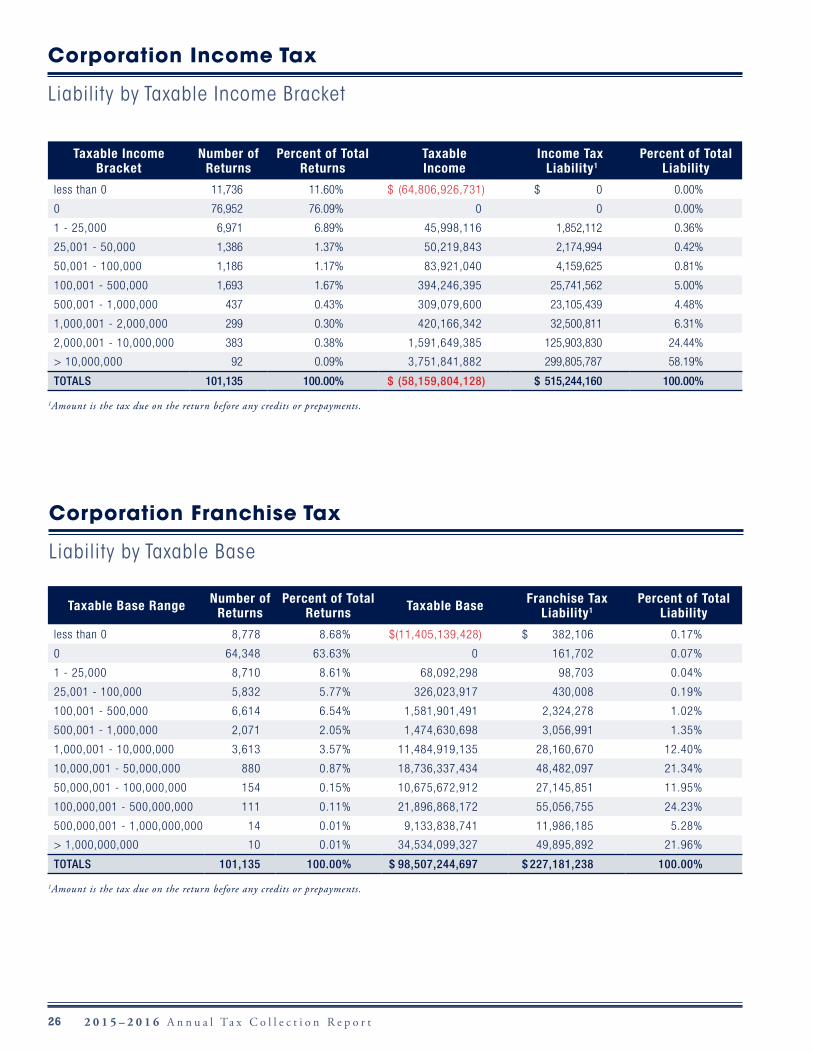
less than 0 11,736 11.60% $ (64,806,926,731) $ 0 0.00%
0 76,952 76.09% 0 0 0.00%
1 - 25,000 6,971 6.89% 45,998,116 1,852,112 0.36%
25,001 - 50,000 1,386 1.37% 50,219,843 2,174,994 0.42%
50,001 - 100,000 1,186 1.17% 83,921,040 4,159,625 0.81%
100,001 - 500,000 1,693 1.67% 394,246,395 25,741,562 5.00%
500,001 - 1,000,000 437 0.43% 309,079,600 23,105,439 4.48%
1,000,001 - 2,000,000 299 0.30% 420,166,342 32,500,811 6.31%
2,000,001 - 10,000,000 383 0.38% 1,591,649,385 125,903,830 24.44%
> 10,000,000 92 0.09% 3,751,841,882 299,805,787 58.19%
TOTALS 101,135 100.00% $ (58,159,804,128) $ 515,244,160 100.00%
1Amount is the tax due on the return before any credits or prepayments.
Taxable Base Range Number of Returns
Percent of Total Returns Taxable Base Franchise Tax
Liability1Percent of Total
Liability
less than 0 8,778 8.68% $ (11,405,139,428) $ 382,106 0.17%
0 64,348 63.63% 0 161,702 0.07%
1 - 25,000 8,710 8.61% 68,092,298 98,703 0.04%
25,001 - 100,000 5,832 5.77% 326,023,917 430,008 0.19%
100,001 - 500,000 6,614 6.54% 1,581,901,491 2,324,278 1.02%
500,001 - 1,000,000 2,071 2.05% 1,474,630,698 3,056,991 1.35%
1,000,001 - 10,000,000 3,613 3.57% 11,484,919,135 28,160,670 12.40%
10,000,001 - 50,000,000 880 0.87% 18,736,337,434 48,482,097 21.34%
50,000,001 - 100,000,000 154 0.15% 10,675,672,912 27,145,851 11.95%
100,000,001 - 500,000,000 111 0.11% 21,896,868,172 55,056,755 24.23%
500,000,001 - 1,000,000,000 14 0.01% 9,133,838,741 11,986,185 5.28%
> 1,000,000,000 10 0.01% 34,534,099,327 49,895,892 21.96%
TOTALS 101,135 100.00% $ 98,507,244,697 $ 227,181,238 100.00%
1Amount is the tax due on the return before any credits or prepayments.
Corporation Income Tax
Liability by Taxable Income Bracket
Corporation Franchise Tax
Liability by Taxable Base
272 0 1 5 – 2 0 1 6 A n n u a l Ta x C o l l e c t i o n R e p o r t
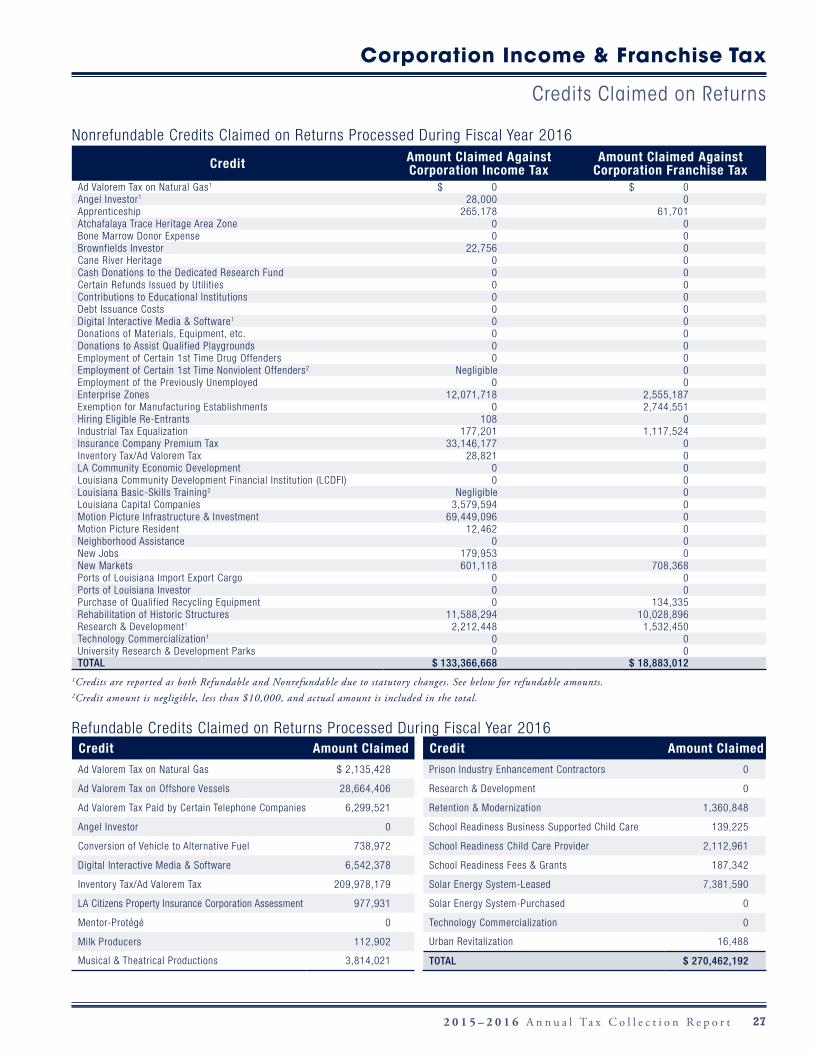
Nonrefundable Credits Claimed on Returns Processed During Fiscal Year 2016
Credit Amount Claimed Against Corporation Income Tax
Amount Claimed Against Corporation Franchise Tax
Ad Valorem Tax on Natural Gas1 $ 0 $ 0 Angel Investor1 28,000 0 Apprenticeship 265,178 61,701 Atchafalaya Trace Heritage Area Zone 0 0 Bone Marrow Donor Expense 0 0 Brownfields Investor 22,756 0 Cane River Heritage 0 0 Cash Donations to the Dedicated Research Fund 0 0 Certain Refunds Issued by Utilities 0 0 Contributions to Educational Institutions 0 0 Debt Issuance Costs 0 0 Digital Interactive Media & Software1 0 0 Donations of Materials, Equipment, etc. 0 0 Donations to Assist Qualified Playgrounds 0 0 Employment of Certain 1st Time Drug Offenders 0 0 Employment of Certain 1st Time Nonviolent Offenders2 Negligible 0 Employment of the Previously Unemployed 0 0 Enterprise Zones 12,071,718 2,555,187 Exemption for Manufacturing Establishments 0 2,744,551 Hiring Eligible Re-Entrants 108 0 Industrial Tax Equalization 177,201 1,117,524 Insurance Company Premium Tax 33,146,177 0 Inventory Tax/Ad Valorem Tax 28,821 0LA Community Economic Development 0 0 Louisiana Community Development Financial Institution (LCDFI) 0 0 Louisiana Basic-Skills Training2 Negligible 0 Louisiana Capital Companies 3,579,594 0 Motion Picture Infrastructure & Investment 69,449,096 0 Motion Picture Resident 12,462 0 Neighborhood Assistance 0 0 New Jobs 179,953 0 New Markets 601,118 708,368 Ports of Louisiana Import Export Cargo 0 0 Ports of Louisiana Investor 0 0 Purchase of Qualified Recycling Equipment 0 134,335 Rehabilitation of Historic Structures 11,588,294 10,028,896 Research & Development1 2,212,448 1,532,450 Technology Commercialization1 0 0 University Research & Development Parks 0 0 TOTAL $ 133,366,668 $ 18,883,012
1Credits are reported as both Refundable and Nonrefundable due to statutory changes. See below for refundable amounts.2Credit amount is negligible, less than $10,000, and actual amount is included in the total.
Refundable Credits Claimed on Returns Processed During Fiscal Year 2016Credit Amount Claimed
Ad Valorem Tax on Natural Gas $ 2,135,428
Ad Valorem Tax on Offshore Vessels 28,664,406
Ad Valorem Tax Paid by Certain Telephone Companies 6,299,521
Angel Investor 0
Conversion of Vehicle to Alternative Fuel 738,972
Digital Interactive Media & Software 6,542,378
Inventory Tax/Ad Valorem Tax 209,978,179
LA Citizens Property Insurance Corporation Assessment 977,931
Mentor-Protégé 0
Milk Producers 112,902
Musical & Theatrical Productions 3,814,021
Credit Amount Claimed
Prison Industry Enhancement Contractors 0
Research & Development 0
Retention & Modernization 1,360,848
School Readiness Business Supported Child Care 139,225
School Readiness Child Care Provider 2,112,961
School Readiness Fees & Grants 187,342
Solar Energy System-Leased 7,381,590
Solar Energy System-Purchased 0
Technology Commercialization 0
Urban Revitalization 16,488
TOTAL $ 270,462,192
Corporation Income & Franchise Tax
Credits Claimed on Returns
28 2 0 1 5 – 2 0 1 6 A n n u a l Ta x C o l l e c t i o n R e p o r t
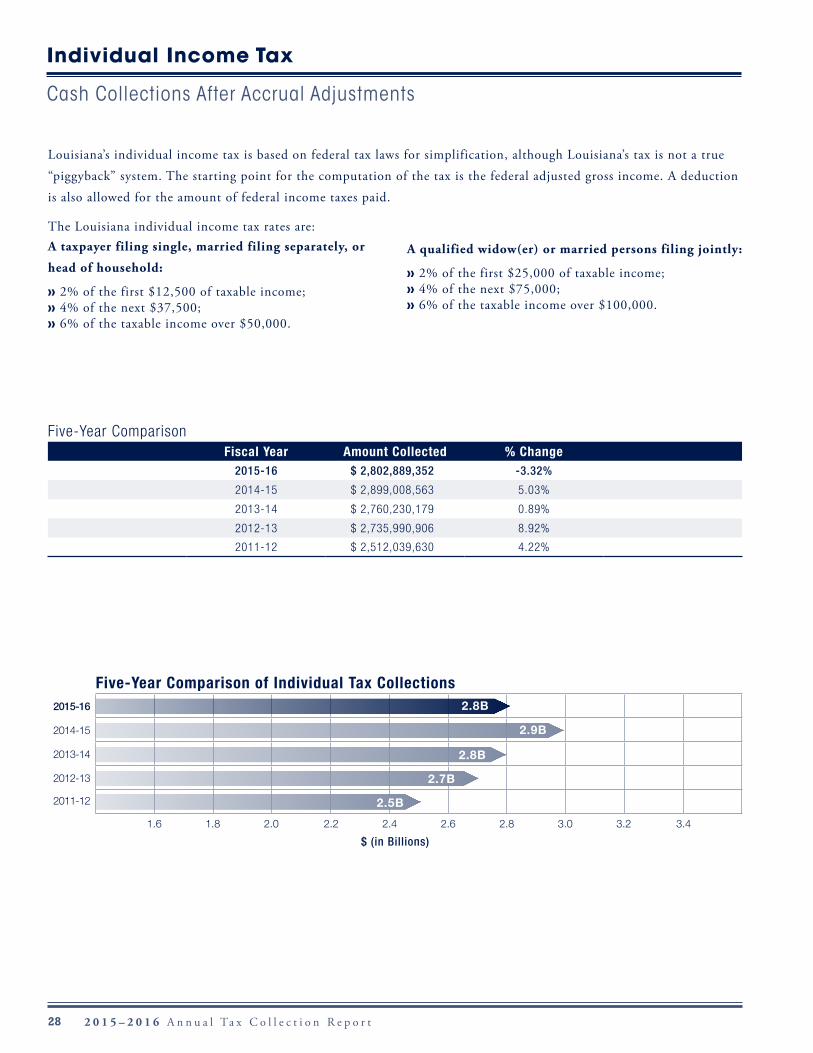
Five-Year ComparisonFiscal Year Amount Collected % Change
2015-16 $ 2,802,889,352 -3.32%
2014-15 $ 2,899,008,563 5.03%
2013-14 $ 2,760,230,179 0.89%
2012-13 $ 2,735,990,906 8.92%
2011-12 $ 2,512,039,630 4.22%
Louisiana’s individual income tax is based on federal tax laws for simplification, although Louisiana’s tax is not a true
“piggyback” system. The starting point for the computation of the tax is the federal adjusted gross income. A deduction
is also allowed for the amount of federal income taxes paid.
The Louisiana individual income tax rates are:A taxpayer filing single, married filing separately, or
head of household:
» 2% of the first $12,500 of taxable income; » 4% of the next $37,500; » 6% of the taxable income over $50,000.
A qualified widow(er) or married persons filing jointly:
» 2% of the first $25,000 of taxable income; » 4% of the next $75,000; » 6% of the taxable income over $100,000.
Individual Income Tax
Cash Collections After Accrual Adjustments
Five-Year Comparison of Individual Tax Collections2015-16
2014-15
2013-14
2012-13
2011-12
1.6 1.8 2.0 2.2 2.4 2.6 2.8 3.0 3.2 3.4
$ (in Billions)
2.8B
2.9B
2.8B
2.7B
2.5B
292 0 1 5 – 2 0 1 6 A n n u a l Ta x C o l l e c t i o n R e p o r t
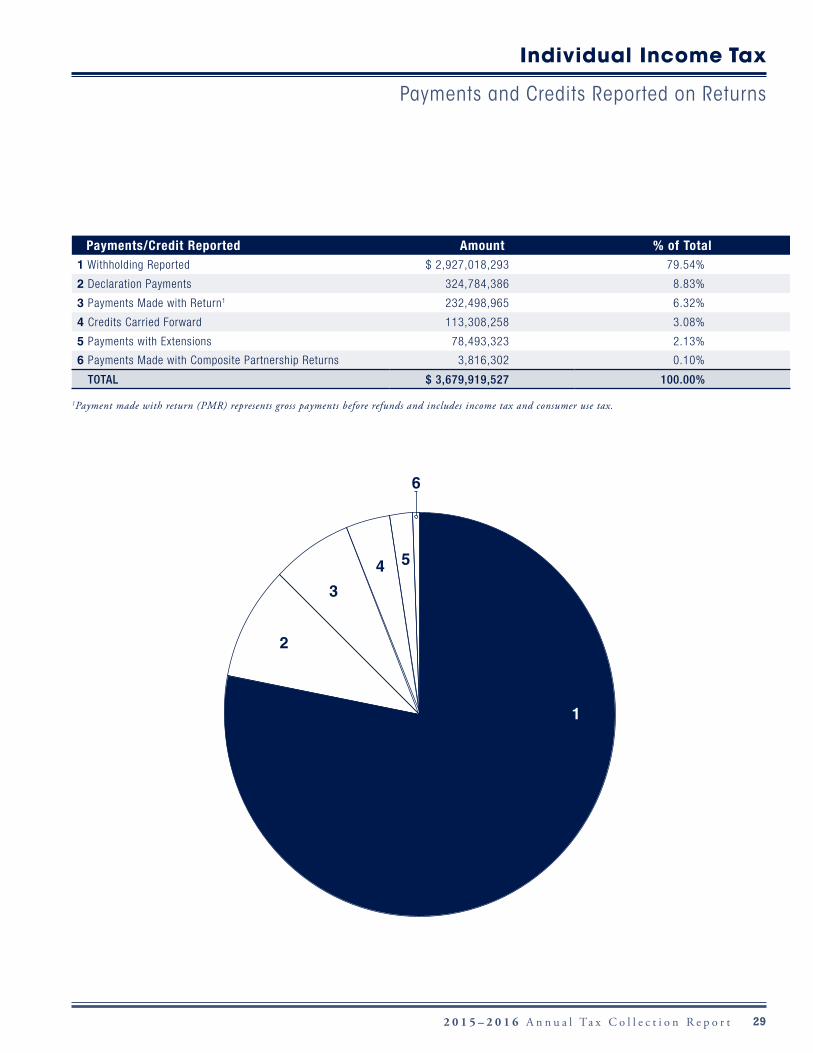
Individual Income Tax
Payments and Credits Reported on Returns
Processed During Fiscal Year 2013
Payments/Credit Reported Amount % of Total1 Withholding Reported $ 2,927,018,293 79.54%
2 Declaration Payments 324,784,386 8.83%
3 Payments Made with Return1 232,498,965 6.32%
4 Credits Carried Forward 113,308,258 3.08%
5 Payments with Extensions 78,493,323 2.13%
6 Payments Made with Composite Partnership Returns 3,816,302 0.10%
TOTAL $ 3,679,919,527 100.00%
1Payment made with return (PMR) represents gross payments before refunds and includes income tax and consumer use tax.
2
3
4 5
6
1
30 2 0 1 5 – 2 0 1 6 A n n u a l Ta x C o l l e c t i o n R e p o r t
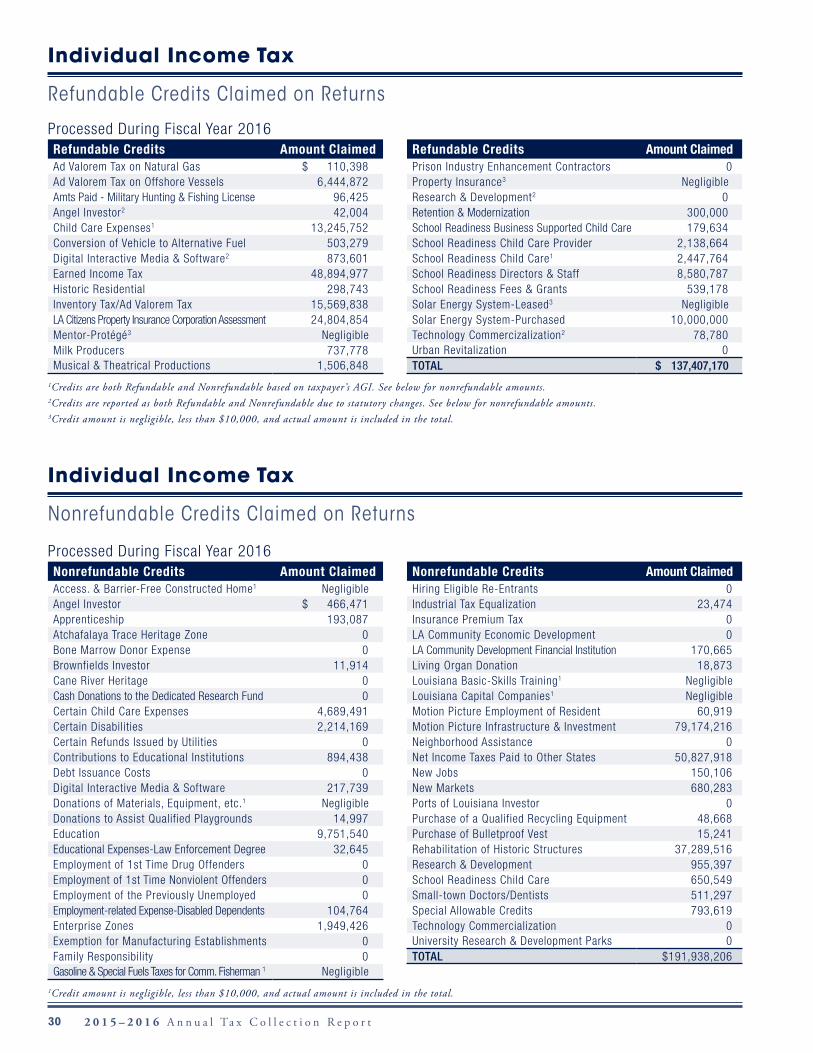
Individual Income Tax
Refundable Credits Claimed on Returns
Processed During Fiscal Year 2016Refundable Credits Amount Claimed Refundable Credits Amount ClaimedAd Valorem Tax on Natural Gas $ 110,398 Prison Industry Enhancement Contractors 0 Ad Valorem Tax on Offshore Vessels 6,444,872 Property Insurance3 NegligibleAmts Paid - Military Hunting & Fishing License 96,425 Research & Development2 0 Angel Investor2 42,004 Retention & Modernization 300,000 Child Care Expenses1 13,245,752 School Readiness Business Supported Child Care 179,634 Conversion of Vehicle to Alternative Fuel 503,279 School Readiness Child Care Provider 2,138,664 Digital Interactive Media & Software2 873,601 School Readiness Child Care1 2,447,764 Earned Income Tax 48,894,977 School Readiness Directors & Staff 8,580,787 Historic Residential 298,743 School Readiness Fees & Grants 539,178 Inventory Tax/Ad Valorem Tax 15,569,838 Solar Energy System-Leased3 Negligible LA Citizens Property Insurance Corporation Assessment 24,804,854 Solar Energy System-Purchased 10,000,000 Mentor-Protégé3 Negligible Technology Commercizalization2 78,780 Milk Producers 737,778 Urban Revitalization 0 Musical & Theatrical Productions 1,506,848 TOTAL $ 137,407,170
1Credits are both Refundable and Nonrefundable based on taxpayer’s AGI. See below for nonrefundable amounts.2Credits are reported as both Refundable and Nonrefundable due to statutory changes. See below for nonrefundable amounts.3Credit amount is negligible, less than $10,000, and actual amount is included in the total.
Individual Income Tax
Nonrefundable Credits Claimed on Returns
Processed During Fiscal Year 2016Nonrefundable Credits Amount Claimed Nonrefundable Credits Amount ClaimedAccess. & Barrier-Free Constructed Home1 Negligible Hiring Eligible Re-Entrants 0 Angel Investor $ 466,471 Industrial Tax Equalization 23,474 Apprenticeship 193,087 Insurance Premium Tax 0 Atchafalaya Trace Heritage Zone 0 LA Community Economic Development 0 Bone Marrow Donor Expense 0 LA Community Development Financial Institution 170,665 Brownfields Investor 11,914 Living Organ Donation 18,873 Cane River Heritage 0 Louisiana Basic-Skills Training1 NegligibleCash Donations to the Dedicated Research Fund 0 Louisiana Capital Companies1 NegligibleCertain Child Care Expenses 4,689,491 Motion Picture Employment of Resident 60,919 Certain Disabilities 2,214,169 Motion Picture Infrastructure & Investment 79,174,216 Certain Refunds Issued by Utilities 0 Neighborhood Assistance 0 Contributions to Educational Institutions 894,438 Net Income Taxes Paid to Other States 50,827,918 Debt Issuance Costs 0 New Jobs 150,106 Digital Interactive Media & Software 217,739 New Markets 680,283 Donations of Materials, Equipment, etc.1 Negligible Ports of Louisiana Investor 0 Donations to Assist Qualified Playgrounds 14,997 Purchase of a Qualified Recycling Equipment 48,668 Education 9,751,540 Purchase of Bulletproof Vest 15,241 Educational Expenses-Law Enforcement Degree 32,645 Rehabilitation of Historic Structures 37,289,516 Employment of 1st Time Drug Offenders 0 Research & Development 955,397 Employment of 1st Time Nonviolent Offenders 0 School Readiness Child Care 650,549 Employment of the Previously Unemployed 0 Small-town Doctors/Dentists 511,297 Employment-related Expense-Disabled Dependents 104,764 Special Allowable Credits 793,619 Enterprise Zones 1,949,426 Technology Commercialization 0 Exemption for Manufacturing Establishments 0 University Research & Development Parks 0 Family Responsibility 0 TOTAL $191,938,206 Gasoline & Special Fuels Taxes for Comm. Fisherman 1 Negligible
1Credit amount is negligible, less than $10,000, and actual amount is included in the total.
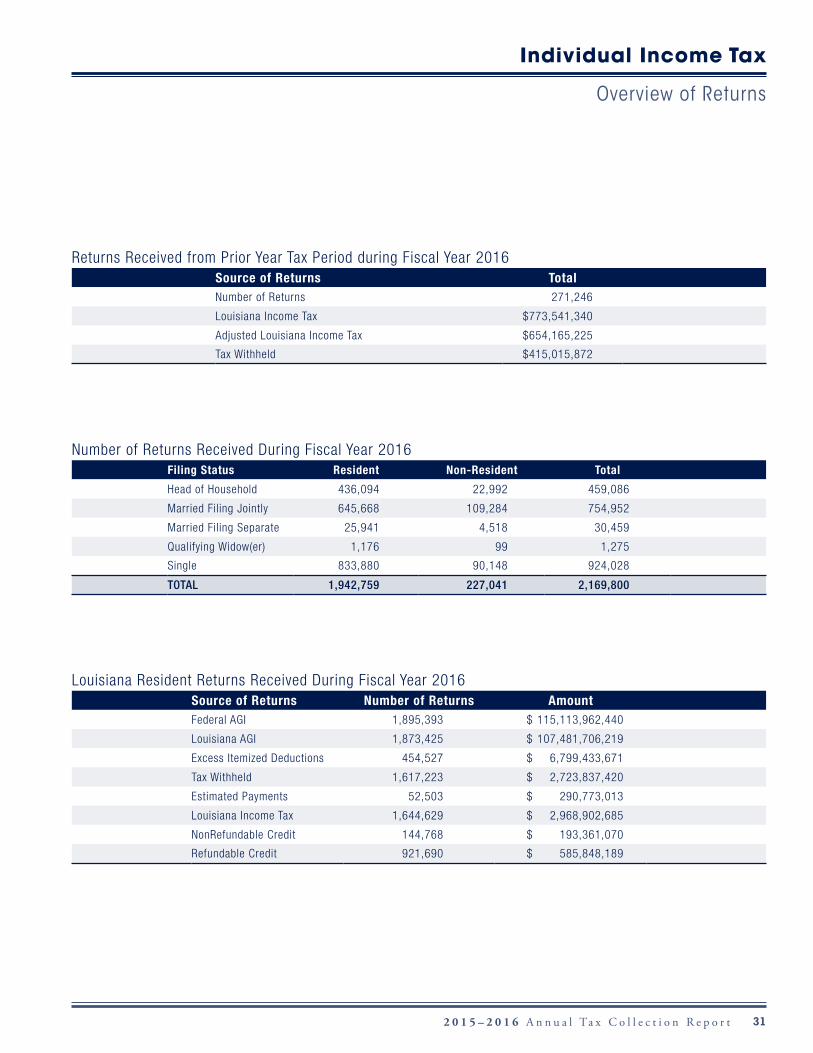
312 0 1 5 – 2 0 1 6 A n n u a l Ta x C o l l e c t i o n R e p o r t
Returns Received from Prior Year Tax Period during Fiscal Year 2016Source of Returns TotalNumber of Returns 271,246
Louisiana Income Tax $773,541,340
Adjusted Louisiana Income Tax $654,165,225
Tax Withheld $415,015,872
Number of Returns Received During Fiscal Year 2016Filing Status Resident Non-Resident Total
Head of Household 436,094 22,992 459,086
Married Filing Jointly 645,668 109,284 754,952
Married Filing Separate 25,941 4,518 30,459
Qualifying Widow(er) 1,176 99 1,275
Single 833,880 90,148 924,028
TOTAL 1,942,759 227,041 2,169,800
Louisiana Resident Returns Received During Fiscal Year 2016Source of Returns Number of Returns AmountFederal AGI 1,895,393 $ 115,113,962,440
Louisiana AGI 1,873,425 $ 107,481,706,219
Excess Itemized Deductions 454,527 $ 6,799,433,671
Tax Withheld 1,617,223 $ 2,723,837,420
Estimated Payments 52,503 $ 290,773,013
Louisiana Income Tax 1,644,629 $ 2,968,902,685
NonRefundable Credit 144,768 $ 193,361,070
Refundable Credit 921,690 $ 585,848,189
Individual Income Tax
Overview of Returns
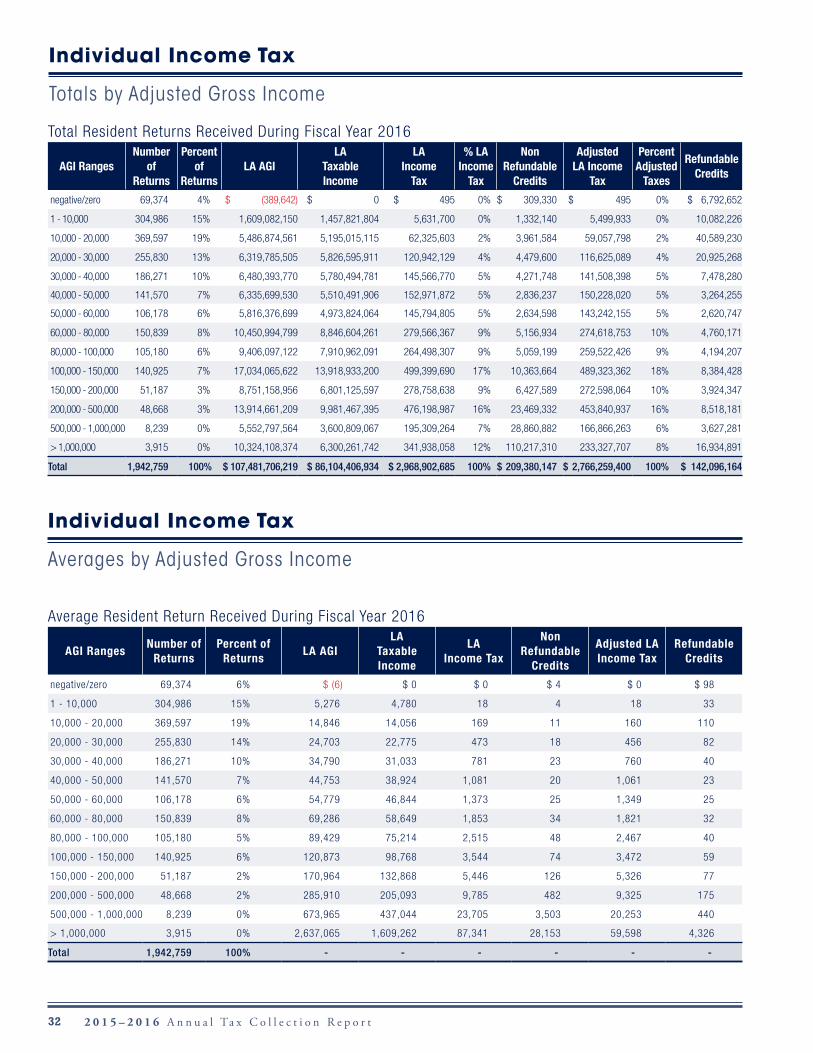
32 2 0 1 5 – 2 0 1 6 A n n u a l Ta x C o l l e c t i o n R e p o r t
Total Resident Returns Received During Fiscal Year 2016
AGI RangesNumber
of Returns
Percent of
ReturnsLA AGI
LA Taxable Income
LA Income
Tax
% LA Income
Tax
Non Refundable
Credits
Adjusted LA Income
Tax
Percent Adjusted
Taxes
Refundable Credits
negative/zero 69,374 4% $ (389,642) $ 0 $ 495 0% $ 309,330 $ 495 0% $ 6,792,652
1 - 10,000 304,986 15% 1,609,082,150 1,457,821,804 5,631,700 0% 1,332,140 5,499,933 0% 10,082,226
10,000 - 20,000 369,597 19% 5,486,874,561 5,195,015,115 62,325,603 2% 3,961,584 59,057,798 2% 40,589,230
20,000 - 30,000 255,830 13% 6,319,785,505 5,826,595,911 120,942,129 4% 4,479,600 116,625,089 4% 20,925,268
30,000 - 40,000 186,271 10% 6,480,393,770 5,780,494,781 145,566,770 5% 4,271,748 141,508,398 5% 7,478,280
40,000 - 50,000 141,570 7% 6,335,699,530 5,510,491,906 152,971,872 5% 2,836,237 150,228,020 5% 3,264,255
50,000 - 60,000 106,178 6% 5,816,376,699 4,973,824,064 145,794,805 5% 2,634,598 143,242,155 5% 2,620,747
60,000 - 80,000 150,839 8% 10,450,994,799 8,846,604,261 279,566,367 9% 5,156,934 274,618,753 10% 4,760,171
80,000 - 100,000 105,180 6% 9,406,097,122 7,910,962,091 264,498,307 9% 5,059,199 259,522,426 9% 4,194,207
100,000 - 150,000 140,925 7% 17,034,065,622 13,918,933,200 499,399,690 17% 10,363,664 489,323,362 18% 8,384,428
150,000 - 200,000 51,187 3% 8,751,158,956 6,801,125,597 278,758,638 9% 6,427,589 272,598,064 10% 3,924,347
200,000 - 500,000 48,668 3% 13,914,661,209 9,981,467,395 476,198,987 16% 23,469,332 453,840,937 16% 8,518,181
500,000 - 1,000,000 8,239 0% 5,552,797,564 3,600,809,067 195,309,264 7% 28,860,882 166,866,263 6% 3,627,281
> 1,000,000 3,915 0% 10,324,108,374 6,300,261,742 341,938,058 12% 110,217,310 233,327,707 8% 16,934,891
Total 1,942,759 100% $ 107,481,706,219 $ 86,104,406,934 $ 2,968,902,685 100% $ 209,380,147 $ 2,766,259,400 100% $ 142,096,164
Average Resident Return Received During Fiscal Year 2016
AGI RangesNumber of
ReturnsPercent of
ReturnsLA AGI
LA Taxable Income
LA Income Tax
Non Refundable
Credits
Adjusted LA Income Tax
Refundable Credits
negative/zero 69,374 6% $ (6) $ 0 $ 0 $ 4 $ 0 $ 98
1 - 10,000 304,986 15% 5,276 4,780 18 4 18 33
10,000 - 20,000 369,597 19% 14,846 14,056 169 11 160 110
20,000 - 30,000 255,830 14% 24,703 22,775 473 18 456 82
30,000 - 40,000 186,271 10% 34,790 31,033 781 23 760 40
40,000 - 50,000 141,570 7% 44,753 38,924 1,081 20 1,061 23
50,000 - 60,000 106,178 6% 54,779 46,844 1,373 25 1,349 25
60,000 - 80,000 150,839 8% 69,286 58,649 1,853 34 1,821 32
80,000 - 100,000 105,180 5% 89,429 75,214 2,515 48 2,467 40
100,000 - 150,000 140,925 6% 120,873 98,768 3,544 74 3,472 59
150,000 - 200,000 51,187 2% 170,964 132,868 5,446 126 5,326 77
200,000 - 500,000 48,668 2% 285,910 205,093 9,785 482 9,325 175
500,000 - 1,000,000 8,239 0% 673,965 437,044 23,705 3,503 20,253 440
> 1,000,000 3,915 0% 2,637,065 1,609,262 87,341 28,153 59,598 4,326
Total 1,942,759 100% - - - - - -
Individual Income Tax
Totals by Adjusted Gross Income
Individual Income Tax
Averages by Adjusted Gross Income
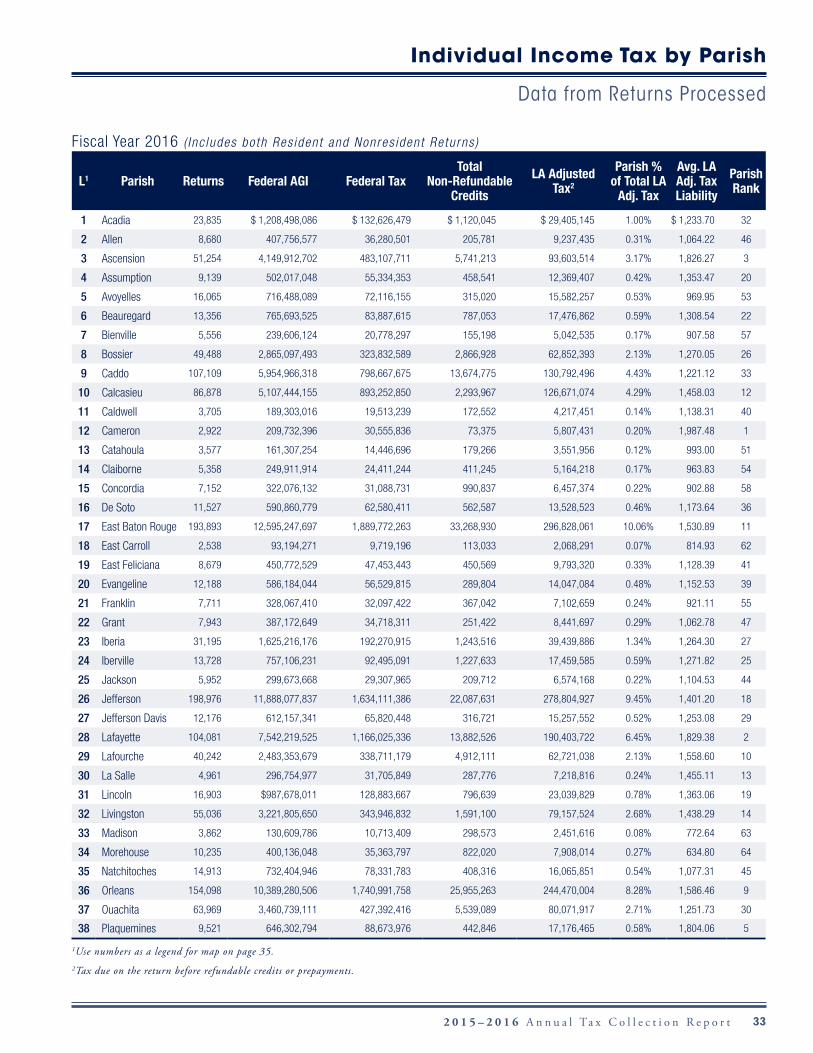
332 0 1 5 – 2 0 1 6 A n n u a l Ta x C o l l e c t i o n R e p o r t
L1 Parish Returns Federal AGI Federal TaxTotal
Non-Refundable Credits
LA Adjusted Tax2
Parish % of Total LA
Adj. Tax
Avg. LA Adj. Tax Liability
Parish Rank
1 Acadia 23,835 $ 1,208,498,086 $ 132,626,479 $ 1,120,045 $ 29,405,145 1.00% $ 1,233.70 32
2 Allen 8,680 407,756,577 36,280,501 205,781 9,237,435 0.31% 1,064.22 46
3 Ascension 51,254 4,149,912,702 483,107,711 5,741,213 93,603,514 3.17% 1,826.27 3
4 Assumption 9,139 502,017,048 55,334,353 458,541 12,369,407 0.42% 1,353.47 20
5 Avoyelles 16,065 716,488,089 72,116,155 315,020 15,582,257 0.53% 969.95 53
6 Beauregard 13,356 765,693,525 83,887,615 787,053 17,476,862 0.59% 1,308.54 22
7 Bienville 5,556 239,606,124 20,778,297 155,198 5,042,535 0.17% 907.58 57
8 Bossier 49,488 2,865,097,493 323,832,589 2,866,928 62,852,393 2.13% 1,270.05 26
9 Caddo 107,109 5,954,966,318 798,667,675 13,674,775 130,792,496 4.43% 1,221.12 33
10 Calcasieu 86,878 5,107,444,155 893,252,850 2,293,967 126,671,074 4.29% 1,458.03 12
11 Caldwell 3,705 189,303,016 19,513,239 172,552 4,217,451 0.14% 1,138.31 40
12 Cameron 2,922 209,732,396 30,555,836 73,375 5,807,431 0.20% 1,987.48 1
13 Catahoula 3,577 161,307,254 14,446,696 179,266 3,551,956 0.12% 993.00 51
14 Claiborne 5,358 249,911,914 24,411,244 411,245 5,164,218 0.17% 963.83 54
15 Concordia 7,152 322,076,132 31,088,731 990,837 6,457,374 0.22% 902.88 58
16 De Soto 11,527 590,860,779 62,580,411 562,587 13,528,523 0.46% 1,173.64 36
17 East Baton Rouge 193,893 12,595,247,697 1,889,772,263 33,268,930 296,828,061 10.06% 1,530.89 11
18 East Carroll 2,538 93,194,271 9,719,196 113,033 2,068,291 0.07% 814.93 62
19 East Feliciana 8,679 450,772,529 47,453,443 450,569 9,793,320 0.33% 1,128.39 41
20 Evangeline 12,188 586,184,044 56,529,815 289,804 14,047,084 0.48% 1,152.53 39
21 Franklin 7,711 328,067,410 32,097,422 367,042 7,102,659 0.24% 921.11 55
22 Grant 7,943 387,172,649 34,718,311 251,422 8,441,697 0.29% 1,062.78 47
23 Iberia 31,195 1,625,216,176 192,270,915 1,243,516 39,439,886 1.34% 1,264.30 27
24 Iberville 13,728 757,106,231 92,495,091 1,227,633 17,459,585 0.59% 1,271.82 25
25 Jackson 5,952 299,673,668 29,307,965 209,712 6,574,168 0.22% 1,104.53 44
26 Jefferson 198,976 11,888,077,837 1,634,111,386 22,087,631 278,804,927 9.45% 1,401.20 18
27 Jefferson Davis 12,176 612,157,341 65,820,448 316,721 15,257,552 0.52% 1,253.08 29
28 Lafayette 104,081 7,542,219,525 1,166,025,336 13,882,526 190,403,722 6.45% 1,829.38 2
29 Lafourche 40,242 2,483,353,679 338,711,179 4,912,111 62,721,038 2.13% 1,558.60 10
30 La Salle 4,961 296,754,977 31,705,849 287,776 7,218,816 0.24% 1,455.11 13
31 Lincoln 16,903 $987,678,011 128,883,667 796,639 23,039,829 0.78% 1,363.06 19
32 Livingston 55,036 3,221,805,650 343,946,832 1,591,100 79,157,524 2.68% 1,438.29 14
33 Madison 3,862 130,609,786 10,713,409 298,573 2,451,616 0.08% 772.64 63
34 Morehouse 10,235 400,136,048 35,363,797 822,020 7,908,014 0.27% 634.80 64
35 Natchitoches 14,913 732,404,946 78,331,783 408,316 16,065,851 0.54% 1,077.31 45
36 Orleans 154,098 10,389,280,506 1,740,991,758 25,955,263 244,470,004 8.28% 1,586.46 9
37 Ouachita 63,969 3,460,739,111 427,392,416 5,539,089 80,071,917 2.71% 1,251.73 30
38 Plaquemines 9,521 646,302,794 88,673,976 442,846 17,176,465 0.58% 1,804.06 5
1Use numbers as a legend for map on page 35.2Tax due on the return before refundable credits or prepayments.
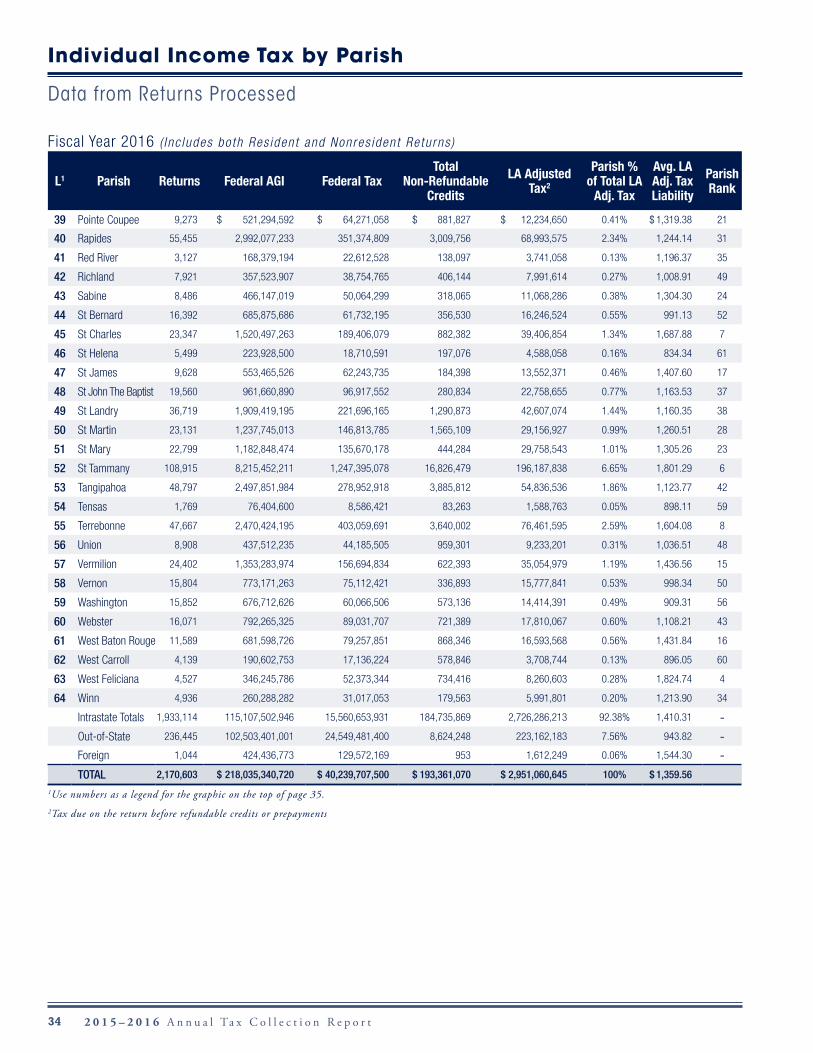
Fiscal Year 2016 ( I nc ludes bo th Res iden t and Nonres iden t Re tu rns )
Individual Income Tax by Parish
Data from Returns Processed
34 2 0 1 5 – 2 0 1 6 A n n u a l Ta x C o l l e c t i o n R e p o r t
L1 Parish Returns Federal AGI Federal TaxTotal
Non-Refundable Credits
LA Adjusted Tax2
Parish % of Total LA
Adj. Tax
Avg. LA Adj. Tax Liability
Parish Rank
39 Pointe Coupee 9,273 $ 521,294,592 $ 64,271,058 $ 881,827 $ 12,234,650 0.41% $ 1,319.38 21
40 Rapides 55,455 2,992,077,233 351,374,809 3,009,756 68,993,575 2.34% 1,244.14 31
41 Red River 3,127 168,379,194 22,612,528 138,097 3,741,058 0.13% 1,196.37 35
42 Richland 7,921 357,523,907 38,754,765 406,144 7,991,614 0.27% 1,008.91 49
43 Sabine 8,486 466,147,019 50,064,299 318,065 11,068,286 0.38% 1,304.30 24
44 St Bernard 16,392 685,875,686 61,732,195 356,530 16,246,524 0.55% 991.13 52
45 St Charles 23,347 1,520,497,263 189,406,079 882,382 39,406,854 1.34% 1,687.88 7
46 St Helena 5,499 223,928,500 18,710,591 197,076 4,588,058 0.16% 834.34 61
47 St James 9,628 553,465,526 62,243,735 184,398 13,552,371 0.46% 1,407.60 17
48 St John The Baptist 19,560 961,660,890 96,917,552 280,834 22,758,655 0.77% 1,163.53 37
49 St Landry 36,719 1,909,419,195 221,696,165 1,290,873 42,607,074 1.44% 1,160.35 38
50 St Martin 23,131 1,237,745,013 146,813,785 1,565,109 29,156,927 0.99% 1,260.51 28
51 St Mary 22,799 1,182,848,474 135,670,178 444,284 29,758,543 1.01% 1,305.26 23
52 St Tammany 108,915 8,215,452,211 1,247,395,078 16,826,479 196,187,838 6.65% 1,801.29 6
53 Tangipahoa 48,797 2,497,851,984 278,952,918 3,885,812 54,836,536 1.86% 1,123.77 42
54 Tensas 1,769 76,404,600 8,586,421 83,263 1,588,763 0.05% 898.11 59
55 Terrebonne 47,667 2,470,424,195 403,059,691 3,640,002 76,461,595 2.59% 1,604.08 8
56 Union 8,908 437,512,235 44,185,505 959,301 9,233,201 0.31% 1,036.51 48
57 Vermilion 24,402 1,353,283,974 156,694,834 622,393 35,054,979 1.19% 1,436.56 15
58 Vernon 15,804 773,171,263 75,112,421 336,893 15,777,841 0.53% 998.34 50
59 Washington 15,852 676,712,626 60,066,506 573,136 14,414,391 0.49% 909.31 56
60 Webster 16,071 792,265,325 89,031,707 721,389 17,810,067 0.60% 1,108.21 43
61 West Baton Rouge 11,589 681,598,726 79,257,851 868,346 16,593,568 0.56% 1,431.84 16
62 West Carroll 4,139 190,602,753 17,136,224 578,846 3,708,744 0.13% 896.05 60
63 West Feliciana 4,527 346,245,786 52,373,344 734,416 8,260,603 0.28% 1,824.74 4
64 Winn 4,936 260,288,282 31,017,053 179,563 5,991,801 0.20% 1,213.90 34
Intrastate Totals 1,933,114 115,107,502,946 15,560,653,931 184,735,869 2,726,286,213 92.38% 1,410.31 -Out-of-State 236,445 102,503,401,001 24,549,481,400 8,624,248 223,162,183 7.56% 943.82 -Foreign 1,044 424,436,773 129,572,169 953 1,612,249 0.06% 1,544.30 -TOTAL 2,170,603 $ 218,035,340,720 $ 40,239,707,500 $ 193,361,070 $ 2,951,060,645 100% $ 1,359.56
1Use numbers as a legend for the graphic on the top of page 35.2Tax due on the return before refundable credits or prepayments
Fiscal Year 2016 ( I nc ludes bo th Res iden t and Nonres iden t Re tu rns )
Individual Income Tax by Parish
Data from Returns Processed
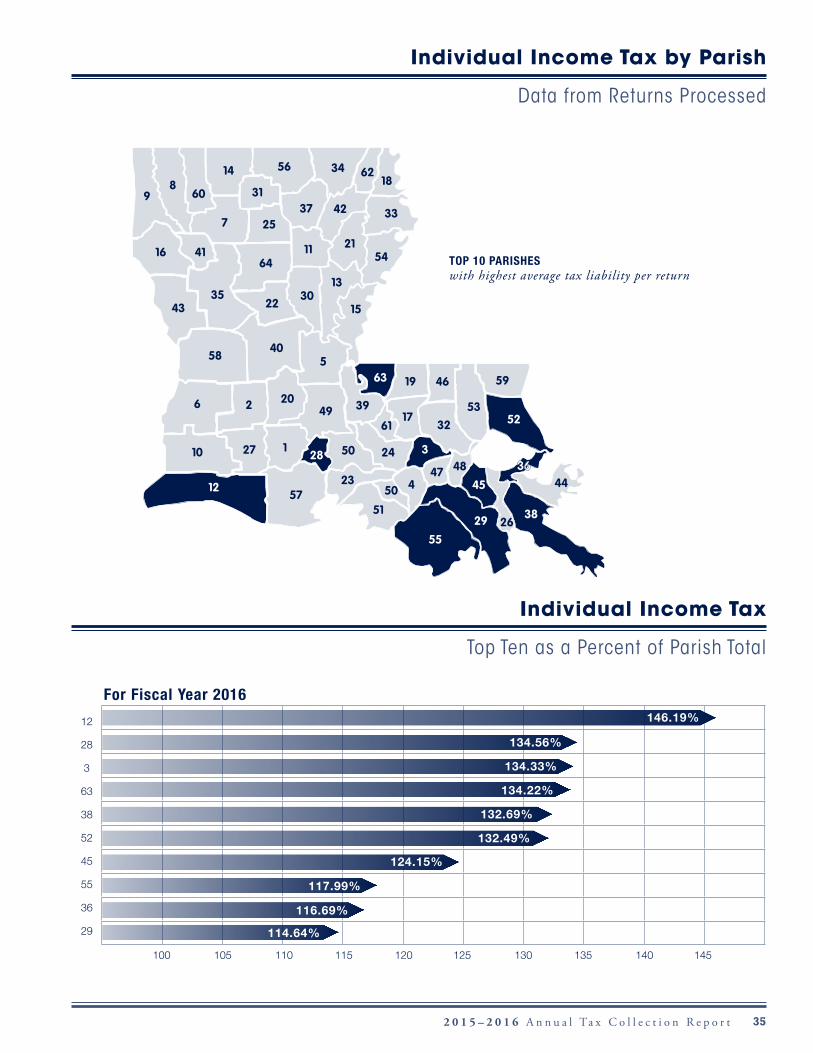
352 0 1 5 – 2 0 1 6 A n n u a l Ta x C o l l e c t i o n R e p o r t
TOP 10 PARISHESwith highest average tax liability per return
Individual Income Tax by Parish
Data from Returns Processed
Individual Income Tax
Top Ten as a Percent of Parish Total
For Fiscal Year 2016
12
28
3
63
38
52
45
55
36
29
100 105 110 115 120 125 130 135 140 145
146.19%
134.56%
134.33%
134.22%
132.69%
132.49%
124.15%
117.99%
116.69%
114.64%
36 2 0 1 5 – 2 0 1 6 A n n u a l Ta x C o l l e c t i o n R e p o r t
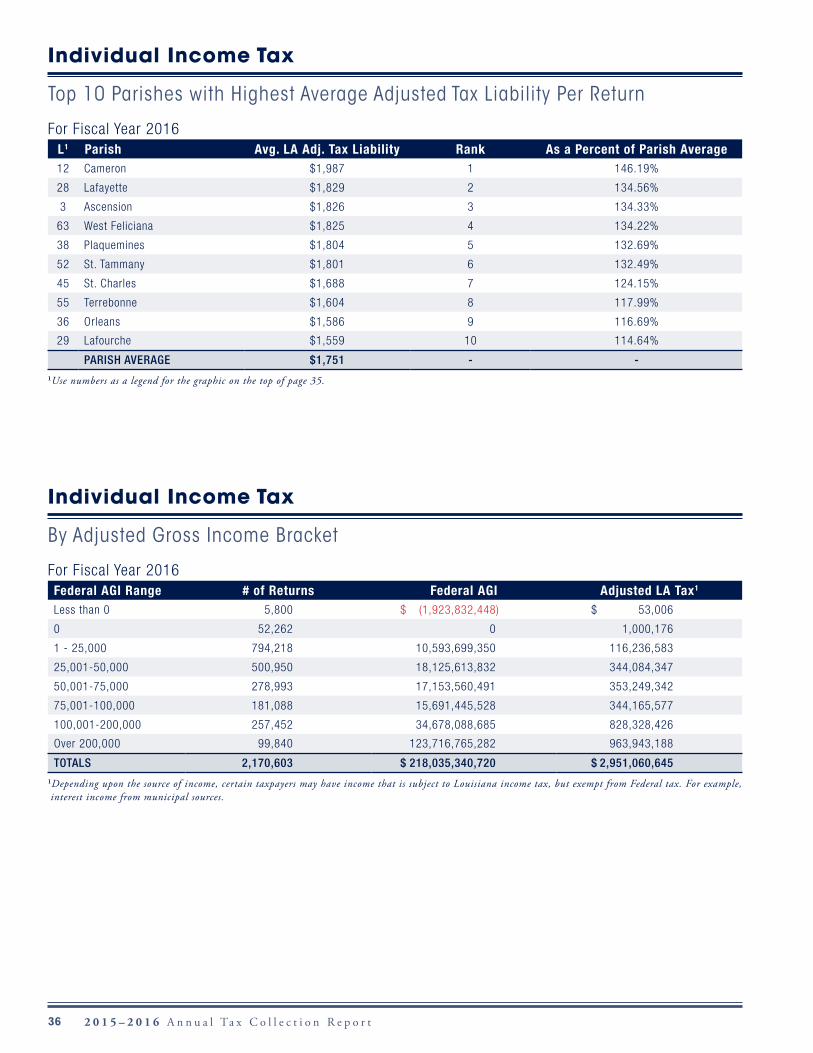
Individual Income Tax
Top 10 Parishes with Highest Average Adjusted Tax Liability Per Return
For Fiscal Year 2016L1 Parish Avg. LA Adj. Tax Liability Rank As a Percent of Parish Average12 Cameron $1,987 1 146.19%
28 Lafayette $1,829 2 134.56%
3 Ascension $1,826 3 134.33%
63 West Feliciana $1,825 4 134.22%
38 Plaquemines $1,804 5 132.69%
52 St. Tammany $1,801 6 132.49%
45 St. Charles $1,688 7 124.15%
55 Terrebonne $1,604 8 117.99%
36 Orleans $1,586 9 116.69%
29 Lafourche $1,559 10 114.64%
PARISH AVERAGE $1,751 - -1Use numbers as a legend for the graphic on the top of page 35.
Individual Income Tax
By Adjusted Gross Income Bracket
For Fiscal Year 2016Federal AGI Range # of Returns Federal AGI Adjusted LA Tax1 Less than 0 5,800 $ (1,923,832,448) $ 53,006
0 52,262 0 1,000,176
1 - 25,000 794,218 10,593,699,350 116,236,583
25,001-50,000 500,950 18,125,613,832 344,084,347
50,001-75,000 278,993 17,153,560,491 353,249,342
75,001-100,000 181,088 15,691,445,528 344,165,577
100,001-200,000 257,452 34,678,088,685 828,328,426
Over 200,000 99,840 123,716,765,282 963,943,188
TOTALS 2,170,603 $ 218,035,340,720 $ 2,951,060,6451Depending upon the source of income, certain taxpayers may have income that is subject to Louisiana income tax, but exempt from Federal tax. For example, interest income from municipal sources.
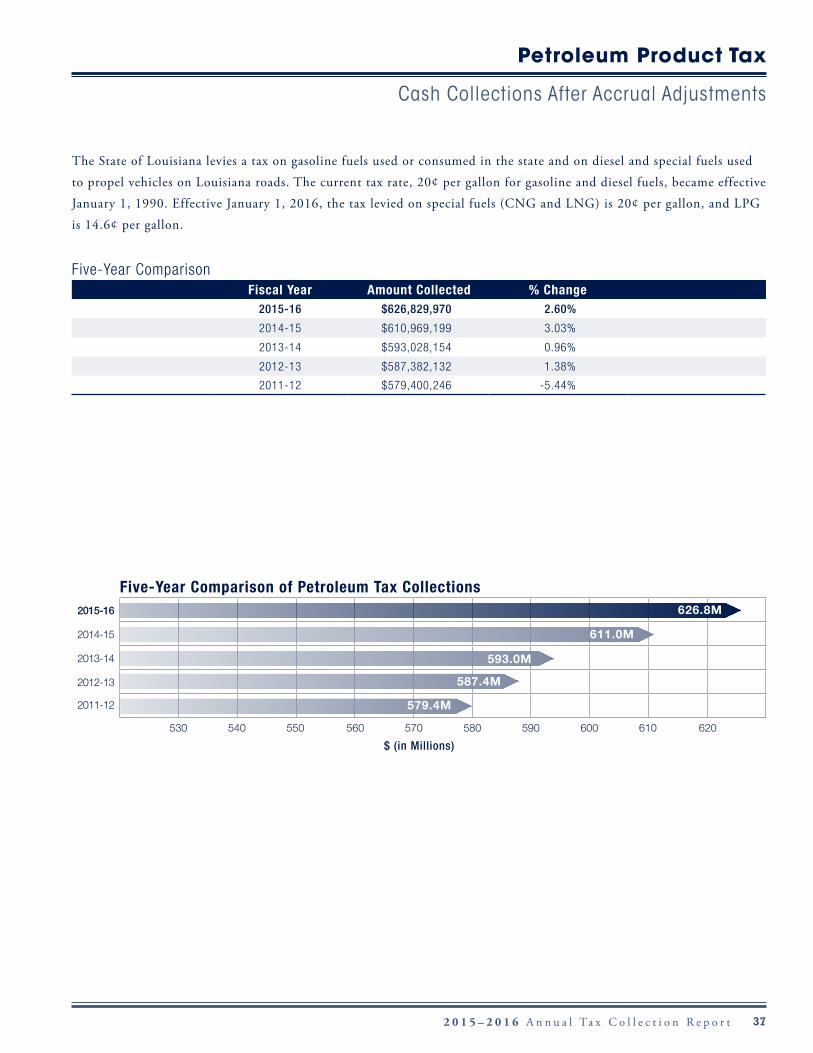
372 0 1 5 – 2 0 1 6 A n n u a l Ta x C o l l e c t i o n R e p o r t
Five-Year ComparisonFiscal Year Amount Collected % Change
2015-16 $626,829,970 2.60%
2014-15 $610,969,199 3.03%
2013-14 $593,028,154 0.96%
2012-13 $587,382,132 1.38%
2011-12 $579,400,246 -5.44%
The State of Louisiana levies a tax on gasoline fuels used or consumed in the state and on diesel and special fuels used
to propel vehicles on Louisiana roads. The current tax rate, 20¢ per gallon for gasoline and diesel fuels, became effective
January 1, 1990. Effective January 1, 2016, the tax levied on special fuels (CNG and LNG) is 20¢ per gallon, and LPG
is 14.6¢ per gallon.
Petroleum Product Tax
Cash Collections After Accrual Adjustments
Five-Year Comparison of Petroleum Tax Collections2015-16
2014-15
2013-14
2012-13
2011-12
530 540 550 560 570 580 590 600 610 620
$ (in Millions)
626.8M
611.0M
593.0M
587.4M
579.4M
38 2 0 1 5 – 2 0 1 6 A n n u a l Ta x C o l l e c t i o n R e p o r t
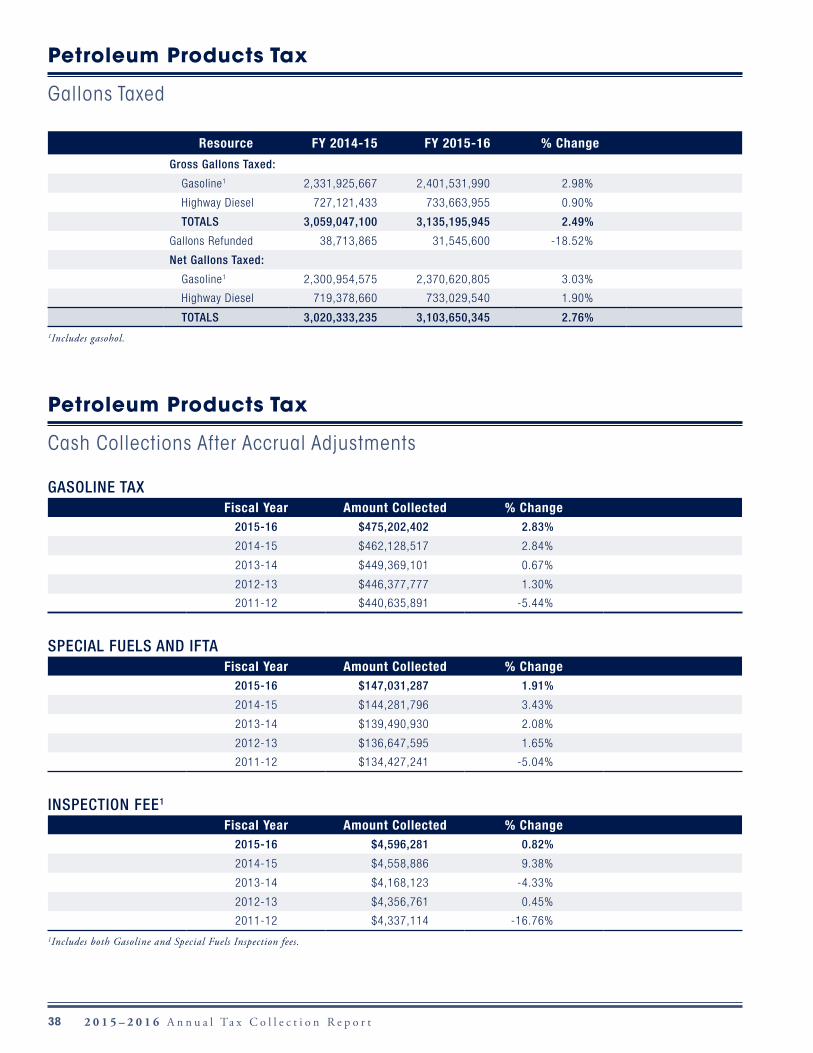
GASOLINE TAXFiscal Year Amount Collected % Change
2015-16 $475,202,402 2.83%
2014-15 $462,128,517 2.84%
2013-14 $449,369,101 0.67%
2012-13 $446,377,777 1.30%
2011-12 $440,635,891 -5.44%
SPECIAL FUELS AND IFTAFiscal Year Amount Collected % Change
2015-16 $147,031,287 1.91%
2014-15 $144,281,796 3.43%
2013-14 $139,490,930 2.08%
2012-13 $136,647,595 1.65%
2011-12 $134,427,241 -5.04%
INSPECTION FEE1
Fiscal Year Amount Collected % Change2015-16 $4,596,281 0.82%
2014-15 $4,558,886 9.38%
2013-14 $4,168,123 -4.33%
2012-13 $4,356,761 0.45%
2011-12 $4,337,114 -16.76%1Includes both Gasoline and Special Fuels Inspection fees.
Resource FY 2014-15 FY 2015-16 % Change
Gross Gallons Taxed:
Gasoline1 2,331,925,667 2,401,531,990 2.98%
Highway Diesel 727,121,433 733,663,955 0.90%
TOTALS 3,059,047,100 3,135,195,945 2.49%
Gallons Refunded 38,713,865 31,545,600 -18.52%
Net Gallons Taxed:
Gasoline1 2,300,954,575 2,370,620,805 3.03%
Highway Diesel 719,378,660 733,029,540 1.90%
TOTALS 3,020,333,235 3,103,650,345 2.76%1Includes gasohol.
Petroleum Products Tax
Gallons Taxed
Petroleum Products Tax
Cash Collections After Accrual Adjustments
392 0 1 5 – 2 0 1 6 A n n u a l Ta x C o l l e c t i o n R e p o r t
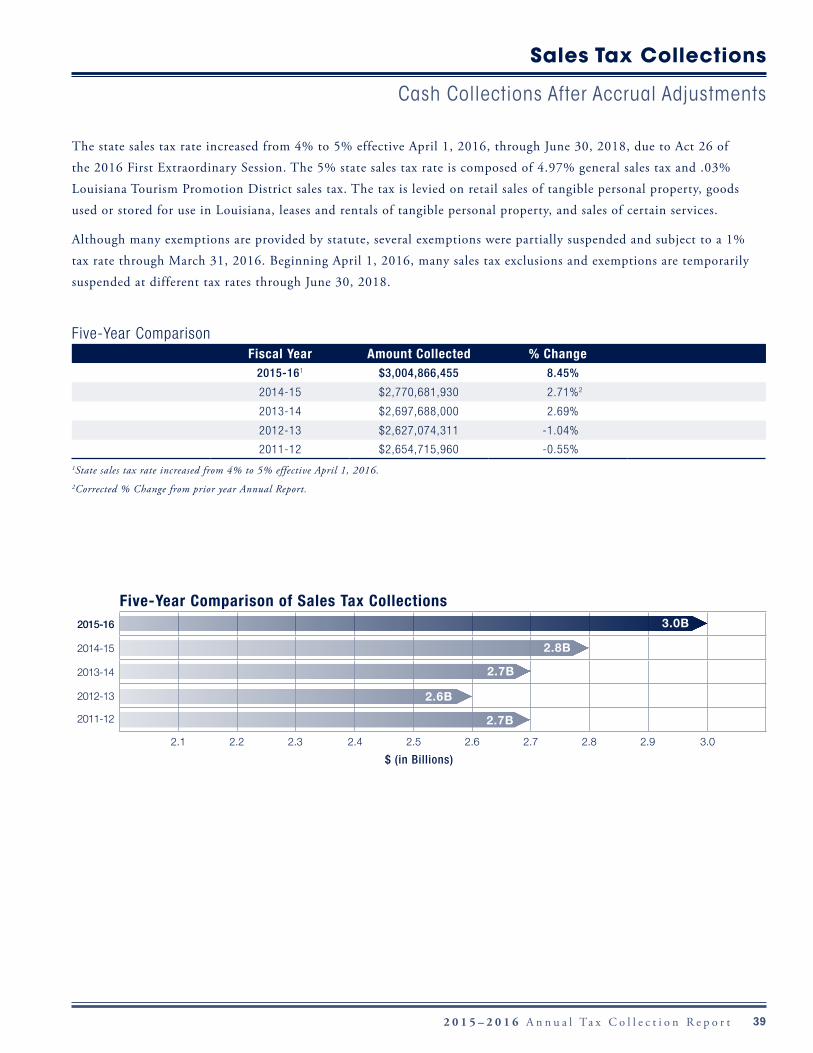
Five-Year ComparisonFiscal Year Amount Collected % Change
2015-161 $3,004,866,455 8.45%
2014-15 $2,770,681,930 2.71%2
2013-14 $2,697,688,000 2.69%
2012-13 $2,627,074,311 -1.04%
2011-12 $2,654,715,960 -0.55%1State sales tax rate increased from 4% to 5% effective April 1, 2016.2Corrected % Change from prior year Annual Report.
The state sales tax rate increased from 4% to 5% effective April 1, 2016, through June 30, 2018, due to Act 26 of
the 2016 First Extraordinary Session. The 5% state sales tax rate is composed of 4.97% general sales tax and .03%
Louisiana Tourism Promotion District sales tax. The tax is levied on retail sales of tangible personal property, goods
used or stored for use in Louisiana, leases and rentals of tangible personal property, and sales of certain services.
Although many exemptions are provided by statute, several exemptions were partially suspended and subject to a 1%
tax rate through March 31, 2016. Beginning April 1, 2016, many sales tax exclusions and exemptions are temporarily
suspended at different tax rates through June 30, 2018.
Sales Tax Collections
Cash Collections After Accrual Adjustments
Five-Year Comparison of Sales Tax Collections2015-16
2014-15
2013-14
2012-13
2011-12
2.1 2.2 2.3 2.4 2.5 2.6 2.7 2.8 2.9 3.0
$ (in Billions)
2.8B
3.0B
2.7B
2.7B
2.6B
40 2 0 1 5 – 2 0 1 6 A n n u a l Ta x C o l l e c t i o n R e p o r t
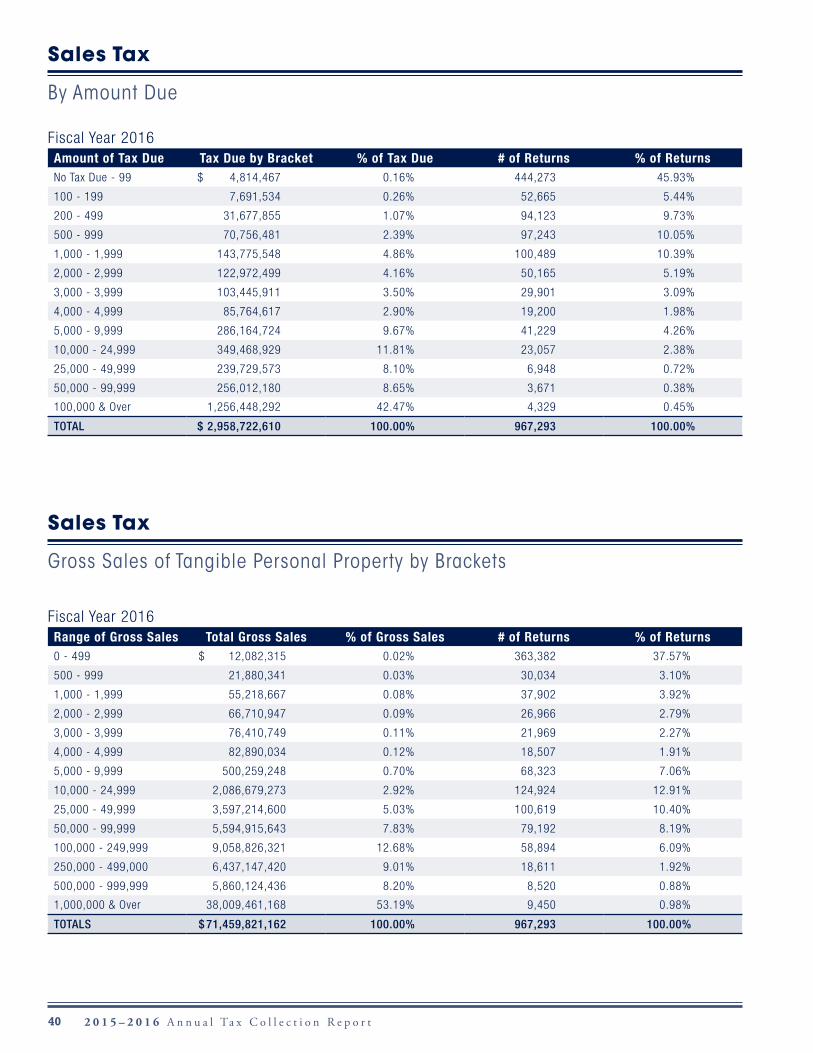
Fiscal Year 2016Amount of Tax Due Tax Due by Bracket % of Tax Due # of Returns % of ReturnsNo Tax Due - 99 $ 4,814,467 0.16% 444,273 45.93%
100 - 199 7,691,534 0.26% 52,665 5.44%
200 - 499 31,677,855 1.07% 94,123 9.73%
500 - 999 70,756,481 2.39% 97,243 10.05%
1,000 - 1,999 143,775,548 4.86% 100,489 10.39%
2,000 - 2,999 122,972,499 4.16% 50,165 5.19%
3,000 - 3,999 103,445,911 3.50% 29,901 3.09%
4,000 - 4,999 85,764,617 2.90% 19,200 1.98%
5,000 - 9,999 286,164,724 9.67% 41,229 4.26%
10,000 - 24,999 349,468,929 11.81% 23,057 2.38%
25,000 - 49,999 239,729,573 8.10% 6,948 0.72%
50,000 - 99,999 256,012,180 8.65% 3,671 0.38%
100,000 & Over 1,256,448,292 42.47% 4,329 0.45%
TOTAL $ 2,958,722,610 100.00% 967,293 100.00%
Fiscal Year 2016Range of Gross Sales Total Gross Sales % of Gross Sales # of Returns % of Returns0 - 499 $ 12,082,315 0.02% 363,382 37.57%
500 - 999 21,880,341 0.03% 30,034 3.10%
1,000 - 1,999 55,218,667 0.08% 37,902 3.92%
2,000 - 2,999 66,710,947 0.09% 26,966 2.79%
3,000 - 3,999 76,410,749 0.11% 21,969 2.27%
4,000 - 4,999 82,890,034 0.12% 18,507 1.91%
5,000 - 9,999 500,259,248 0.70% 68,323 7.06%
10,000 - 24,999 2,086,679,273 2.92% 124,924 12.91%
25,000 - 49,999 3,597,214,600 5.03% 100,619 10.40%
50,000 - 99,999 5,594,915,643 7.83% 79,192 8.19%
100,000 - 249,999 9,058,826,321 12.68% 58,894 6.09%
250,000 - 499,000 6,437,147,420 9.01% 18,611 1.92%
500,000 - 999,999 5,860,124,436 8.20% 8,520 0.88%
1,000,000 & Over 38,009,461,168 53.19% 9,450 0.98%
TOTALS $ 71,459,821,162 100.00% 967,293 100.00%
Sales Tax
By Amount Due
Sales Tax
Gross Sales of Tangible Personal Property by Brackets
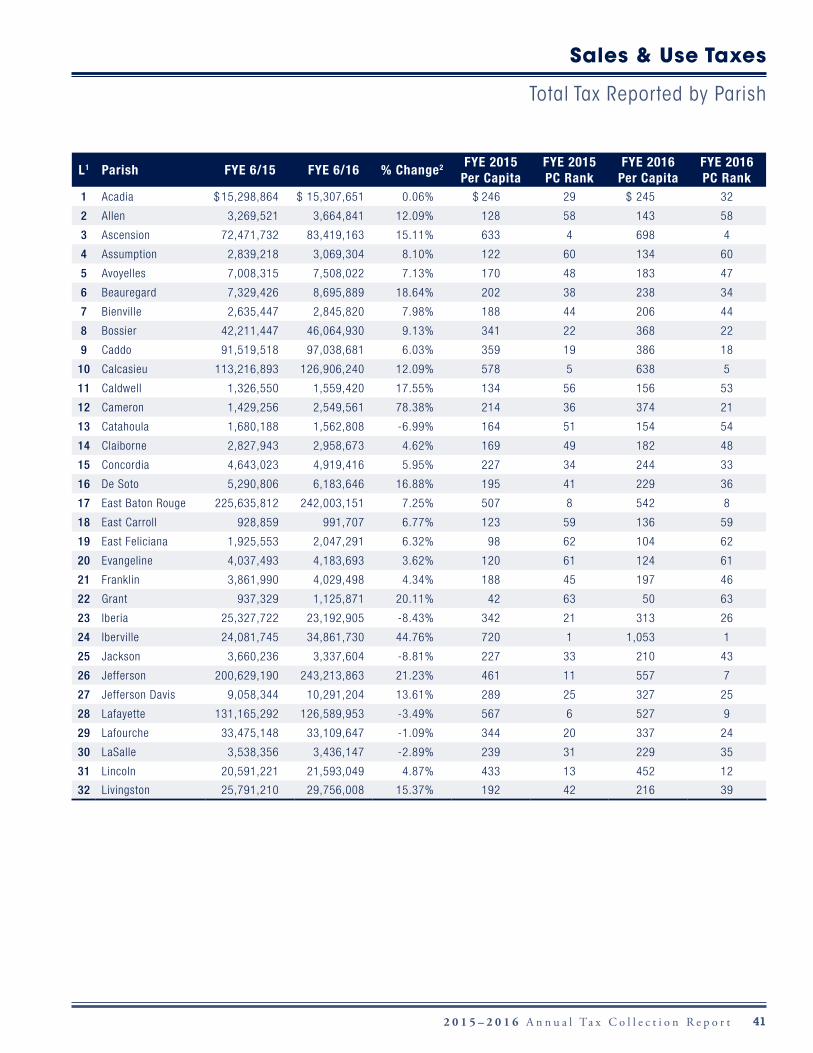
412 0 1 5 – 2 0 1 6 A n n u a l Ta x C o l l e c t i o n R e p o r t
L1 Parish FYE 6/15 FYE 6/16 % Change2 FYE 2015 Per Capita
FYE 2015 PC Rank
FYE 2016 Per Capita
FYE 2016 PC Rank
1 Acadia $ 15,298,864 $ 15,307,651 0.06% $ 246 29 $ 245 32
2 Allen 3,269,521 3,664,841 12.09% 128 58 143 58
3 Ascension 72,471,732 83,419,163 15.11% 633 4 698 4
4 Assumption 2,839,218 3,069,304 8.10% 122 60 134 60
5 Avoyelles 7,008,315 7,508,022 7.13% 170 48 183 47
6 Beauregard 7,329,426 8,695,889 18.64% 202 38 238 34
7 Bienville 2,635,447 2,845,820 7.98% 188 44 206 44
8 Bossier 42,211,447 46,064,930 9.13% 341 22 368 22
9 Caddo 91,519,518 97,038,681 6.03% 359 19 386 18
10 Calcasieu 113,216,893 126,906,240 12.09% 578 5 638 5
11 Caldwell 1,326,550 1,559,420 17.55% 134 56 156 53
12 Cameron 1,429,256 2,549,561 78.38% 214 36 374 21
13 Catahoula 1,680,188 1,562,808 -6.99% 164 51 154 54
14 Claiborne 2,827,943 2,958,673 4.62% 169 49 182 48
15 Concordia 4,643,023 4,919,416 5.95% 227 34 244 33
16 De Soto 5,290,806 6,183,646 16.88% 195 41 229 36
17 East Baton Rouge 225,635,812 242,003,151 7.25% 507 8 542 8
18 East Carroll 928,859 991,707 6.77% 123 59 136 59
19 East Feliciana 1,925,553 2,047,291 6.32% 98 62 104 62
20 Evangeline 4,037,493 4,183,693 3.62% 120 61 124 61
21 Franklin 3,861,990 4,029,498 4.34% 188 45 197 46
22 Grant 937,329 1,125,871 20.11% 42 63 50 63
23 Iberia 25,327,722 23,192,905 -8.43% 342 21 313 26
24 Iberville 24,081,745 34,861,730 44.76% 720 1 1,053 1
25 Jackson 3,660,236 3,337,604 -8.81% 227 33 210 43
26 Jefferson 200,629,190 243,213,863 21.23% 461 11 557 7
27 Jefferson Davis 9,058,344 10,291,204 13.61% 289 25 327 25
28 Lafayette 131,165,292 126,589,953 -3.49% 567 6 527 9
29 Lafourche 33,475,148 33,109,647 -1.09% 344 20 337 24
30 LaSalle 3,538,356 3,436,147 -2.89% 239 31 229 35
31 Lincoln 20,591,221 21,593,049 4.87% 433 13 452 12
32 Livingston 25,791,210 29,756,008 15.37% 192 42 216 39
Sales & Use Taxes
Total Tax Reported by Parish
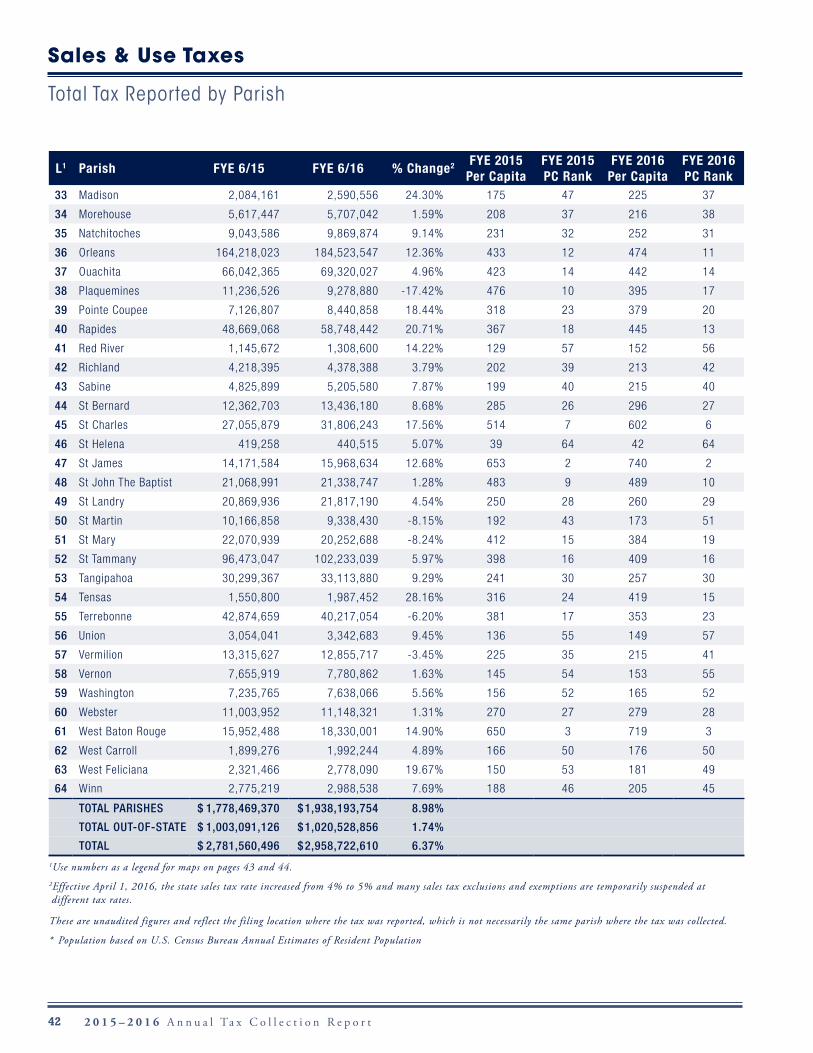
42 2 0 1 5 – 2 0 1 6 A n n u a l Ta x C o l l e c t i o n R e p o r t
L1 Parish FYE 6/15 FYE 6/16 % Change2 FYE 2015 Per Capita
FYE 2015 PC Rank
FYE 2016 Per Capita
FYE 2016 PC Rank
33 Madison 2,084,161 2,590,556 24.30% 175 47 225 37
34 Morehouse 5,617,447 5,707,042 1.59% 208 37 216 38
35 Natchitoches 9,043,586 9,869,874 9.14% 231 32 252 31
36 Orleans 164,218,023 184,523,547 12.36% 433 12 474 11
37 Ouachita 66,042,365 69,320,027 4.96% 423 14 442 14
38 Plaquemines 11,236,526 9,278,880 -17.42% 476 10 395 17
39 Pointe Coupee 7,126,807 8,440,858 18.44% 318 23 379 20
40 Rapides 48,669,068 58,748,442 20.71% 367 18 445 13
41 Red River 1,145,672 1,308,600 14.22% 129 57 152 56
42 Richland 4,218,395 4,378,388 3.79% 202 39 213 42
43 Sabine 4,825,899 5,205,580 7.87% 199 40 215 40
44 St Bernard 12,362,703 13,436,180 8.68% 285 26 296 27
45 St Charles 27,055,879 31,806,243 17.56% 514 7 602 6
46 St Helena 419,258 440,515 5.07% 39 64 42 64
47 St James 14,171,584 15,968,634 12.68% 653 2 740 2
48 St John The Baptist 21,068,991 21,338,747 1.28% 483 9 489 10
49 St Landry 20,869,936 21,817,190 4.54% 250 28 260 29
50 St Martin 10,166,858 9,338,430 -8.15% 192 43 173 51
51 St Mary 22,070,939 20,252,688 -8.24% 412 15 384 19
52 St Tammany 96,473,047 102,233,039 5.97% 398 16 409 16
53 Tangipahoa 30,299,367 33,113,880 9.29% 241 30 257 30
54 Tensas 1,550,800 1,987,452 28.16% 316 24 419 15
55 Terrebonne 42,874,659 40,217,054 -6.20% 381 17 353 23
56 Union 3,054,041 3,342,683 9.45% 136 55 149 57
57 Vermilion 13,315,627 12,855,717 -3.45% 225 35 215 41
58 Vernon 7,655,919 7,780,862 1.63% 145 54 153 55
59 Washington 7,235,765 7,638,066 5.56% 156 52 165 52
60 Webster 11,003,952 11,148,321 1.31% 270 27 279 28
61 West Baton Rouge 15,952,488 18,330,001 14.90% 650 3 719 3
62 West Carroll 1,899,276 1,992,244 4.89% 166 50 176 50
63 West Feliciana 2,321,466 2,778,090 19.67% 150 53 181 49
64 Winn 2,775,219 2,988,538 7.69% 188 46 205 45
TOTAL PARISHES $ 1,778,469,370 $ 1,938,193,754 8.98%
TOTAL OUT-OF-STATE $ 1,003,091,126 $ 1,020,528,856 1.74%
TOTAL $ 2,781,560,496 $ 2,958,722,610 6.37%1Use numbers as a legend for maps on pages 43 and 44.2Effective April 1, 2016, the state sales tax rate increased from 4% to 5% and many sales tax exclusions and exemptions are temporarily suspended at different tax rates.
These are unaudited figures and reflect the filing location where the tax was reported, which is not necessarily the same parish where the tax was collected.
* Population based on U.S. Census Bureau Annual Estimates of Resident Population
Sales & Use Taxes
Total Tax Reported by Parish
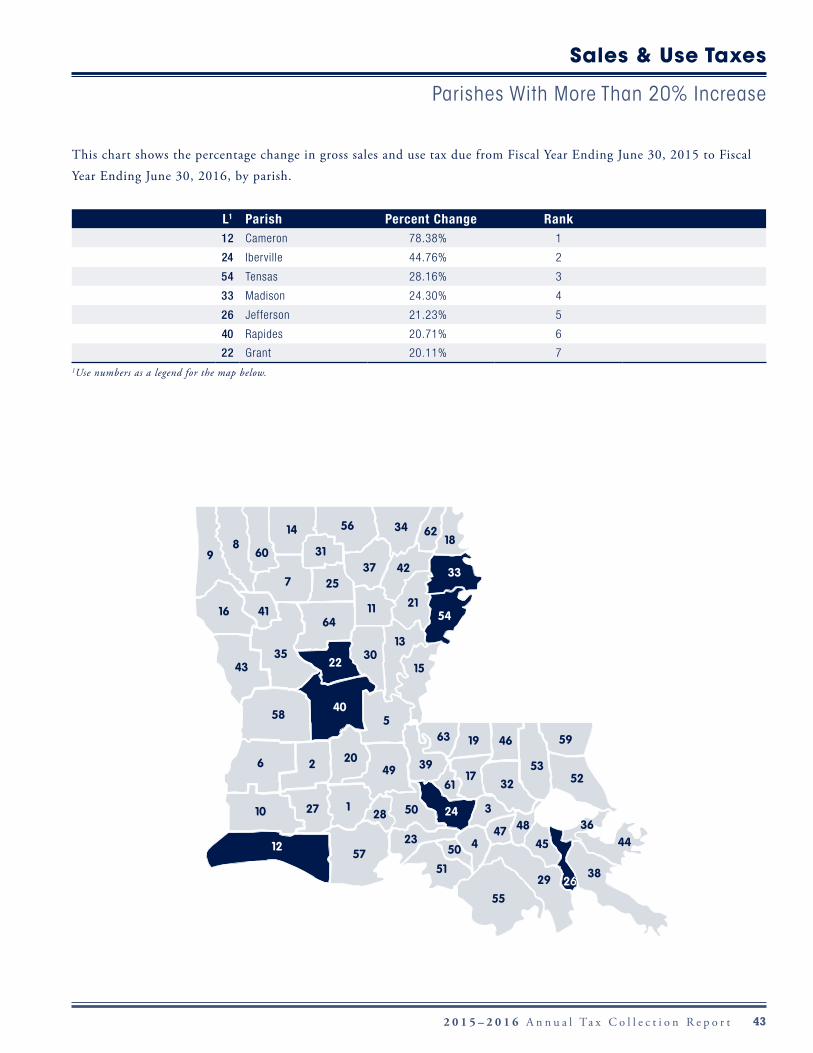
432 0 1 5 – 2 0 1 6 A n n u a l Ta x C o l l e c t i o n R e p o r t
Sales & Use Taxes
Parishes With More Than 20% Increase
This chart shows the percentage change in gross sales and use tax due from Fiscal Year Ending June 30, 2015 to Fiscal
Year Ending June 30, 2016, by parish.
L1 Parish Percent Change Rank12 Cameron 78.38% 1
24 Iberville 44.76% 2
54 Tensas 28.16% 3
33 Madison 24.30% 4
26 Jefferson 21.23% 5
40 Rapides 20.71% 6
22 Grant 20.11% 71Use numbers as a legend for the map below.
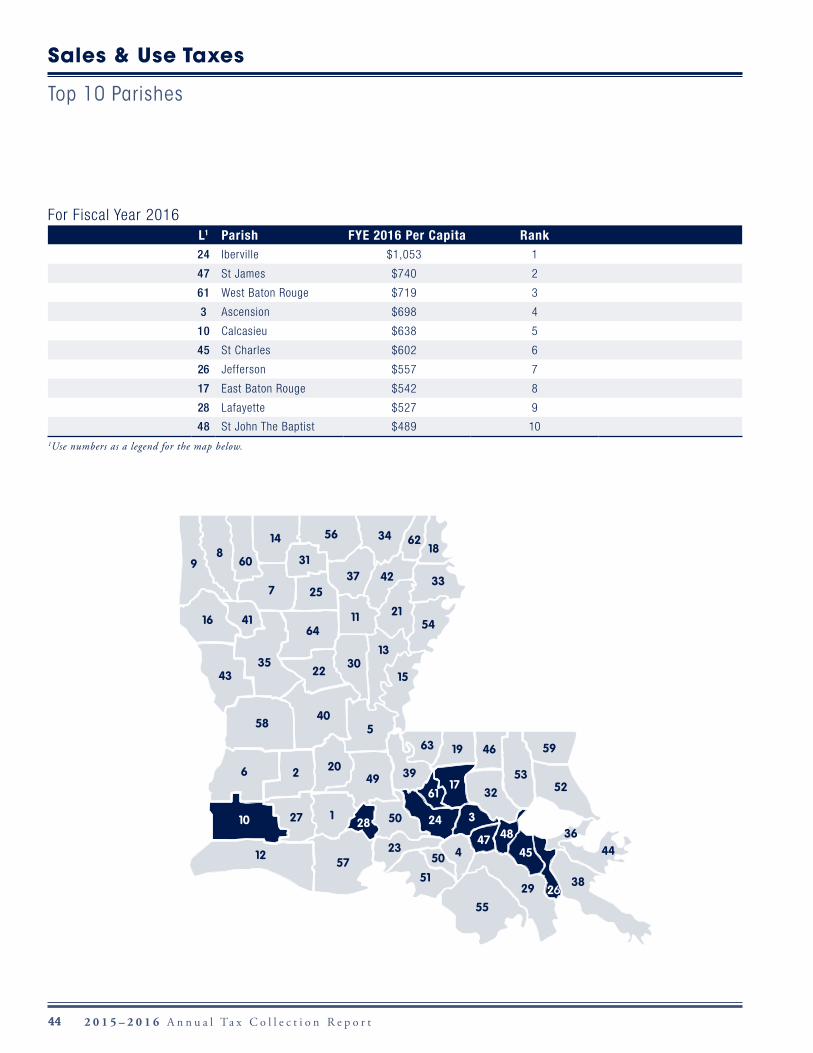
44 2 0 1 5 – 2 0 1 6 A n n u a l Ta x C o l l e c t i o n R e p o r t
For Fiscal Year 2016L1 Parish FYE 2016 Per Capita Rank24 Iberville $1,053 1
47 St James $740 2
61 West Baton Rouge $719 3
3 Ascension $698 4
10 Calcasieu $638 5
45 St Charles $602 6
26 Jefferson $557 7
17 East Baton Rouge $542 8
28 Lafayette $527 9
48 St John The Baptist $489 101Use numbers as a legend for the map below.
Sales & Use Taxes
Top 10 Parishes
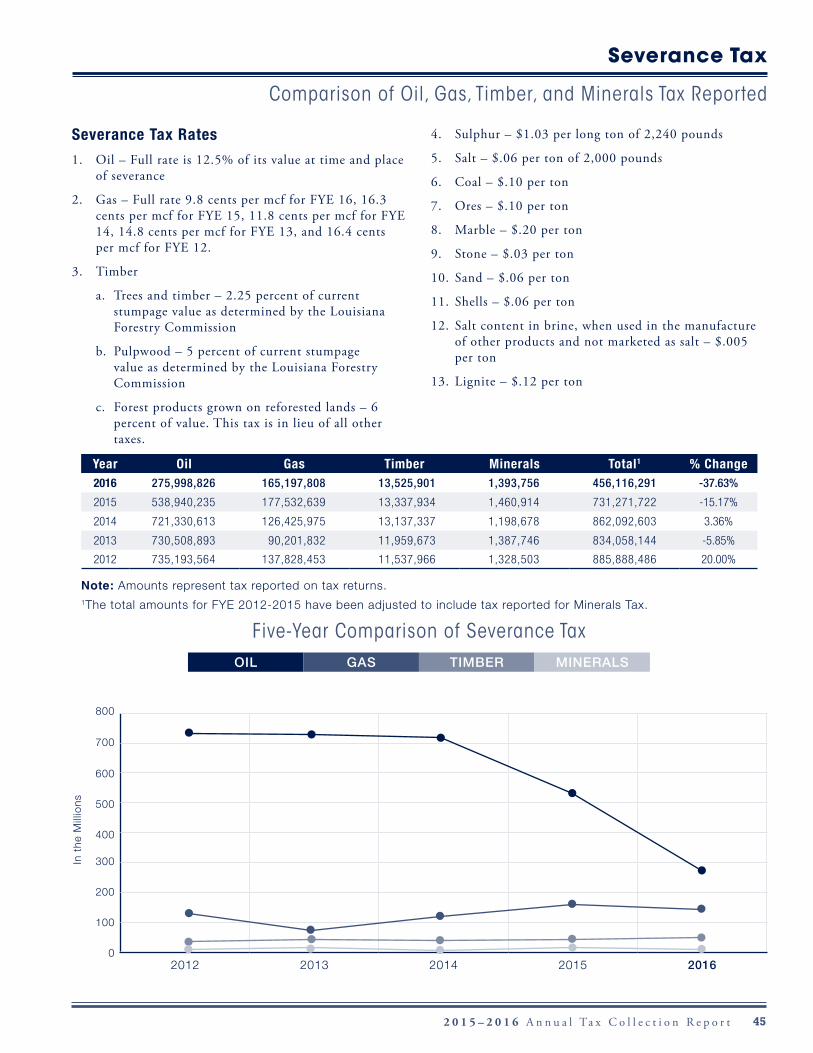
452 0 1 5 – 2 0 1 6 A n n u a l Ta x C o l l e c t i o n R e p o r t
Year Oil Gas Timber Minerals Total1 % Change2016 275,998,826 165,197,808 13,525,901 1,393,756 456,116,291 -37.63%
2015 538,940,235 177,532,639 13,337,934 1,460,914 731,271,722 -15.17%
2014 721,330,613 126,425,975 13,137,337 1,198,678 862,092,603 3.36%
2013 730,508,893 90,201,832 11,959,673 1,387,746 834,058,144 -5.85%
2012 735,193,564 137,828,453 11,537,966 1,328,503 885,888,486 20.00%
Note: Amounts represent tax reported on tax returns. 1The total amounts for FYE 2012-2015 have been adjusted to include tax reported for Minerals Tax.
Severance Tax Rates
1. Oil – Full rate is 12.5% of its value at time and place of severance
2. Gas – Full rate 9.8 cents per mcf for FYE 16, 16.3 cents per mcf for FYE 15, 11.8 cents per mcf for FYE 14, 14.8 cents per mcf for FYE 13, and 16.4 cents per mcf for FYE 12.
3. Timber
a. Trees and timber – 2.25 percent of current stumpage value as determined by the Louisiana Forestry Commission
b. Pulpwood – 5 percent of current stumpage value as determined by the Louisiana Forestry Commission
c. Forest products grown on reforested lands – 6 percent of value. This tax is in lieu of all other taxes.
4. Sulphur – $1.03 per long ton of 2,240 pounds
5. Salt – $.06 per ton of 2,000 pounds
6. Coal – $.10 per ton
7. Ores – $.10 per ton
8. Marble – $.20 per ton
9. Stone – $.03 per ton
10. Sand – $.06 per ton
11. Shells – $.06 per ton
12. Salt content in brine, when used in the manufacture of other products and not marketed as salt – $.005 per ton
13. Lignite – $.12 per ton
Severance Tax
Comparison of Oil, Gas, Timber, and Minerals Tax Reported
Five-Year Comparison of Severance TaxOIL GAS TIMBER MINERALS
In t
he M
illio
ns
800
700
600
500
400
300
200
100
02012 2013 2014 2015 2016
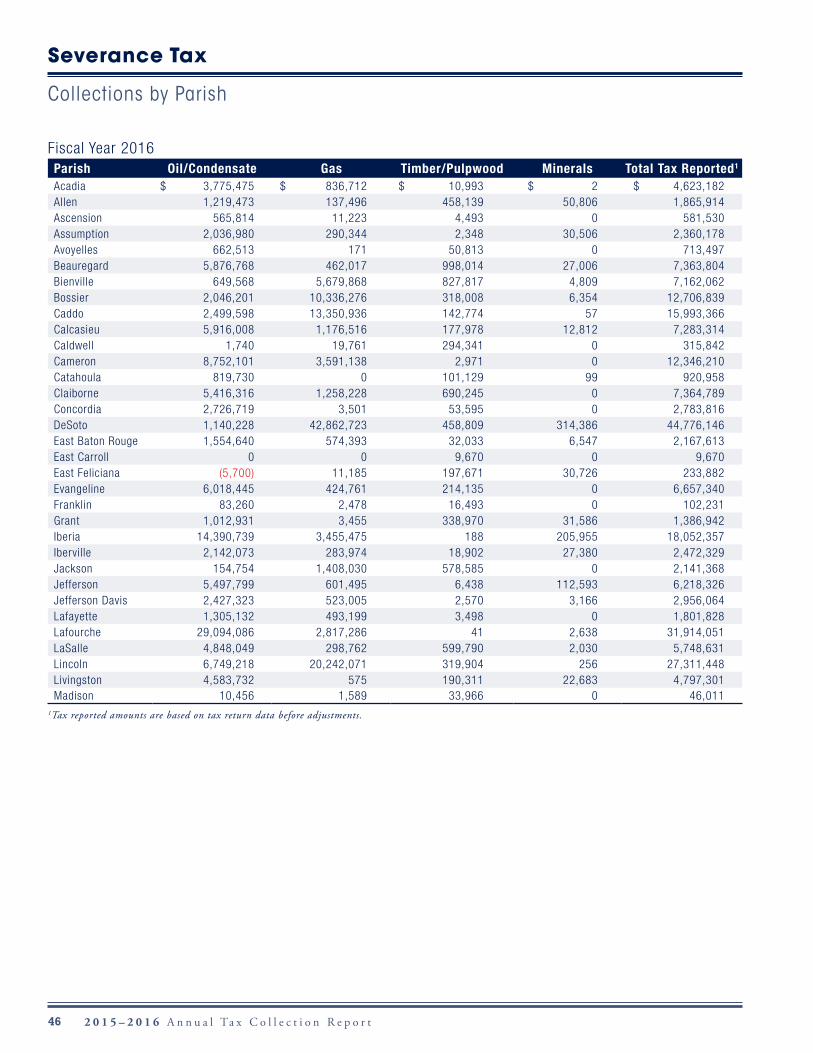
46 2 0 1 5 – 2 0 1 6 A n n u a l Ta x C o l l e c t i o n R e p o r t
Fiscal Year 2016Parish Oil/Condensate Gas Timber/Pulpwood Minerals Total Tax Reported1
Acadia $ 3,775,475 $ 836,712 $ 10,993 $ 2 $ 4,623,182Allen 1,219,473 137,496 458,139 50,806 1,865,914 Ascension 565,814 11,223 4,493 0 581,530 Assumption 2,036,980 290,344 2,348 30,506 2,360,178 Avoyelles 662,513 171 50,813 0 713,497 Beauregard 5,876,768 462,017 998,014 27,006 7,363,804 Bienville 649,568 5,679,868 827,817 4,809 7,162,062 Bossier 2,046,201 10,336,276 318,008 6,354 12,706,839 Caddo 2,499,598 13,350,936 142,774 57 15,993,366 Calcasieu 5,916,008 1,176,516 177,978 12,812 7,283,314 Caldwell 1,740 19,761 294,341 0 315,842 Cameron 8,752,101 3,591,138 2,971 0 12,346,210 Catahoula 819,730 0 101,129 99 920,958 Claiborne 5,416,316 1,258,228 690,245 0 7,364,789 Concordia 2,726,719 3,501 53,595 0 2,783,816 DeSoto 1,140,228 42,862,723 458,809 314,386 44,776,146 East Baton Rouge 1,554,640 574,393 32,033 6,547 2,167,613 East Carroll 0 0 9,670 0 9,670 East Feliciana (5,700) 11,185 197,671 30,726 233,882 Evangeline 6,018,445 424,761 214,135 0 6,657,340 Franklin 83,260 2,478 16,493 0 102,231 Grant 1,012,931 3,455 338,970 31,586 1,386,942 Iberia 14,390,739 3,455,475 188 205,955 18,052,357 Iberville 2,142,073 283,974 18,902 27,380 2,472,329 Jackson 154,754 1,408,030 578,585 0 2,141,368 Jefferson 5,497,799 601,495 6,438 112,593 6,218,326 Jefferson Davis 2,427,323 523,005 2,570 3,166 2,956,064 Lafayette 1,305,132 493,199 3,498 0 1,801,828 Lafourche 29,094,086 2,817,286 41 2,638 31,914,051 LaSalle 4,848,049 298,762 599,790 2,030 5,748,631 Lincoln 6,749,218 20,242,071 319,904 256 27,311,448 Livingston 4,583,732 575 190,311 22,683 4,797,301 Madison 10,456 1,589 33,966 0 46,011
1Tax reported amounts are based on tax return data before adjustments.
Severance Tax
Collections by Parish
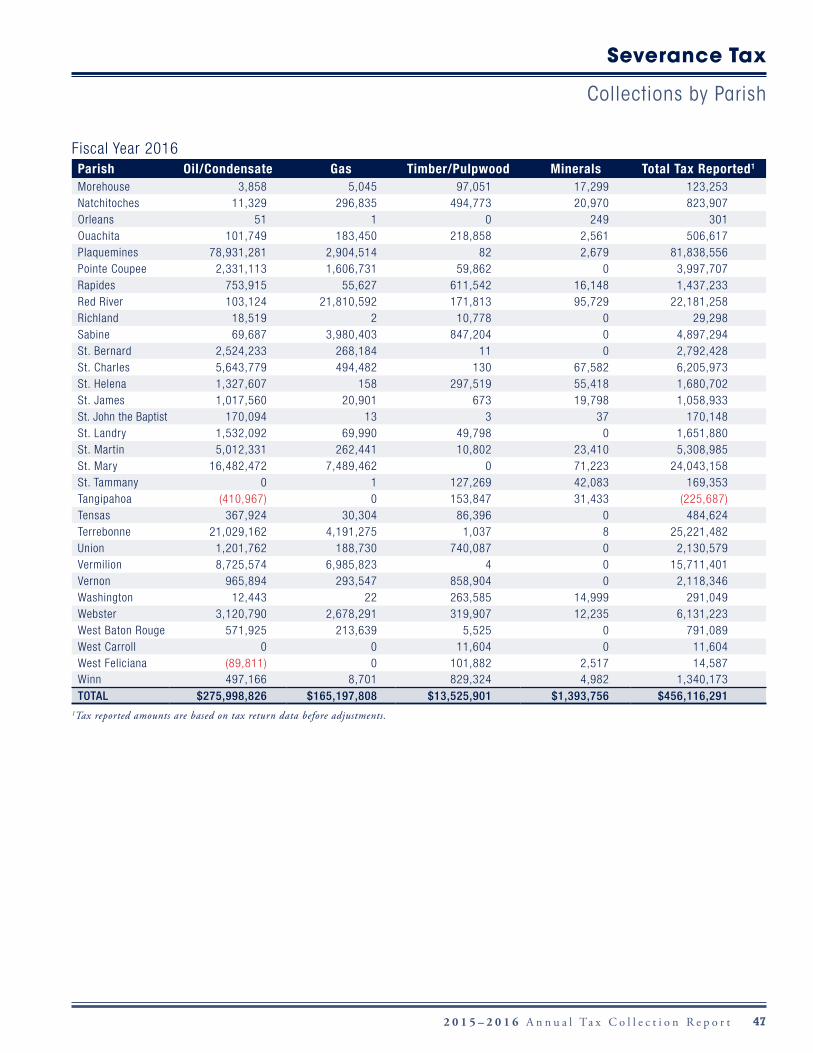
472 0 1 5 – 2 0 1 6 A n n u a l Ta x C o l l e c t i o n R e p o r t
Fiscal Year 2016Parish Oil/Condensate Gas Timber/Pulpwood Minerals Total Tax Reported1
Morehouse 3,858 5,045 97,051 17,299 123,253 Natchitoches 11,329 296,835 494,773 20,970 823,907 Orleans 51 1 0 249 301 Ouachita 101,749 183,450 218,858 2,561 506,617 Plaquemines 78,931,281 2,904,514 82 2,679 81,838,556 Pointe Coupee 2,331,113 1,606,731 59,862 0 3,997,707 Rapides 753,915 55,627 611,542 16,148 1,437,233 Red River 103,124 21,810,592 171,813 95,729 22,181,258 Richland 18,519 2 10,778 0 29,298 Sabine 69,687 3,980,403 847,204 0 4,897,294 St. Bernard 2,524,233 268,184 11 0 2,792,428 St. Charles 5,643,779 494,482 130 67,582 6,205,973 St. Helena 1,327,607 158 297,519 55,418 1,680,702 St. James 1,017,560 20,901 673 19,798 1,058,933 St. John the Baptist 170,094 13 3 37 170,148 St. Landry 1,532,092 69,990 49,798 0 1,651,880 St. Martin 5,012,331 262,441 10,802 23,410 5,308,985 St. Mary 16,482,472 7,489,462 0 71,223 24,043,158 St. Tammany 0 1 127,269 42,083 169,353 Tangipahoa (410,967) 0 153,847 31,433 (225,687)Tensas 367,924 30,304 86,396 0 484,624 Terrebonne 21,029,162 4,191,275 1,037 8 25,221,482 Union 1,201,762 188,730 740,087 0 2,130,579 Vermilion 8,725,574 6,985,823 4 0 15,711,401 Vernon 965,894 293,547 858,904 0 2,118,346 Washington 12,443 22 263,585 14,999 291,049 Webster 3,120,790 2,678,291 319,907 12,235 6,131,223 West Baton Rouge 571,925 213,639 5,525 0 791,089 West Carroll 0 0 11,604 0 11,604 West Feliciana (89,811) 0 101,882 2,517 14,587 Winn 497,166 8,701 829,324 4,982 1,340,173 TOTAL $275,998,826 $165,197,808 $13,525,901 $1,393,756 $456,116,291
1Tax reported amounts are based on tax return data before adjustments.
Severance Tax
Collections by Parish
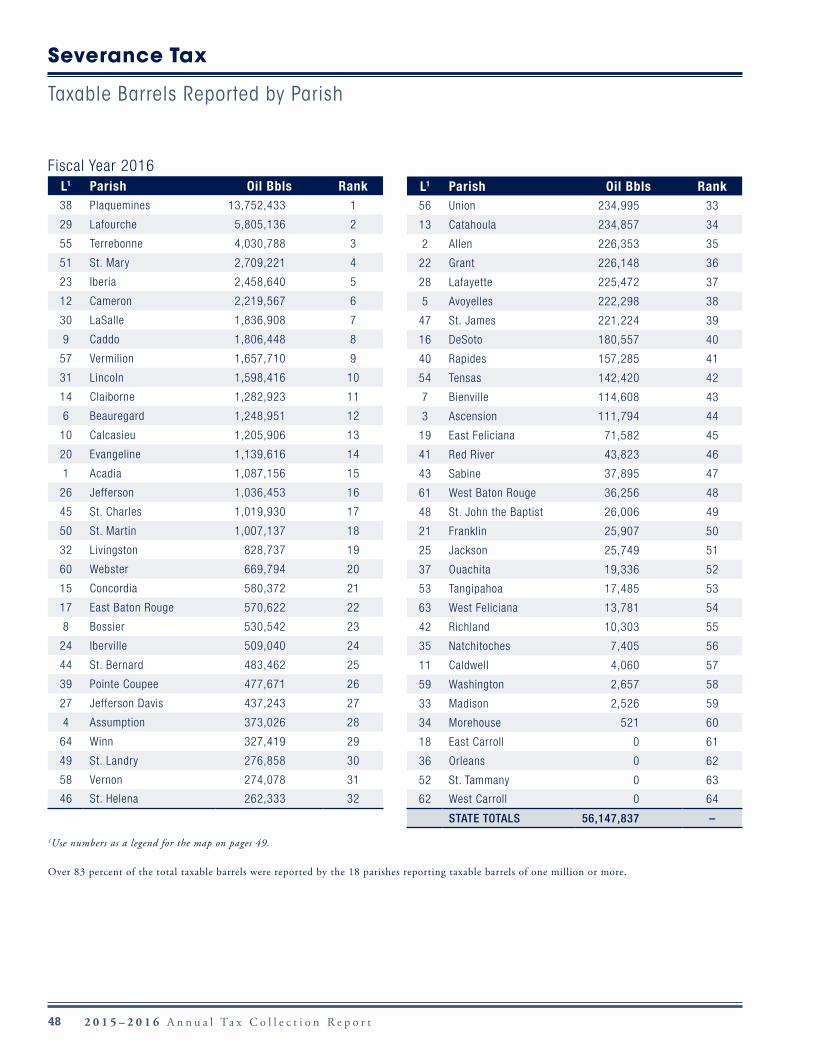
48 2 0 1 5 – 2 0 1 6 A n n u a l Ta x C o l l e c t i o n R e p o r t
Fiscal Year 2016L1 Parish Oil Bbls Rank38 Plaquemines 13,752,433 1
29 Lafourche 5,805,136 2
55 Terrebonne 4,030,788 3
51 St. Mary 2,709,221 4
23 Iberia 2,458,640 5
12 Cameron 2,219,567 6
30 LaSalle 1,836,908 7
9 Caddo 1,806,448 8
57 Vermilion 1,657,710 9
31 Lincoln 1,598,416 10
14 Claiborne 1,282,923 11
6 Beauregard 1,248,951 12
10 Calcasieu 1,205,906 13
20 Evangeline 1,139,616 14
1 Acadia 1,087,156 15
26 Jefferson 1,036,453 16
45 St. Charles 1,019,930 17
50 St. Martin 1,007,137 18
32 Livingston 828,737 19
60 Webster 669,794 20
15 Concordia 580,372 21
17 East Baton Rouge 570,622 22
8 Bossier 530,542 23
24 Iberville 509,040 24
44 St. Bernard 483,462 25
39 Pointe Coupee 477,671 26
27 Jefferson Davis 437,243 27
4 Assumption 373,026 28
64 Winn 327,419 29
49 St. Landry 276,858 30
58 Vernon 274,078 31
46 St. Helena 262,333 32
L1 Parish Oil Bbls Rank56 Union 234,995 33
13 Catahoula 234,857 34
2 Allen 226,353 35
22 Grant 226,148 36
28 Lafayette 225,472 37
5 Avoyelles 222,298 38
47 St. James 221,224 39
16 DeSoto 180,557 40
40 Rapides 157,285 41
54 Tensas 142,420 42
7 Bienville 114,608 43
3 Ascension 111,794 44
19 East Feliciana 71,582 45
41 Red River 43,823 46
43 Sabine 37,895 47
61 West Baton Rouge 36,256 48
48 St. John the Baptist 26,006 49
21 Franklin 25,907 50
25 Jackson 25,749 51
37 Ouachita 19,336 52
53 Tangipahoa 17,485 53
63 West Feliciana 13,781 54
42 Richland 10,303 55
35 Natchitoches 7,405 56
11 Caldwell 4,060 57
59 Washington 2,657 58
33 Madison 2,526 59
34 Morehouse 521 60
18 East Carroll 0 61
36 Orleans 0 62
52 St. Tammany 0 63
62 West Carroll 0 64
STATE TOTALS 56,147,837 –
1Use numbers as a legend for the map on pages 49.
Over 83 percent of the total taxable barrels were reported by the 18 parishes reporting taxable barrels of one million or more.
Severance Tax
Taxable Barrels Reported by Parish
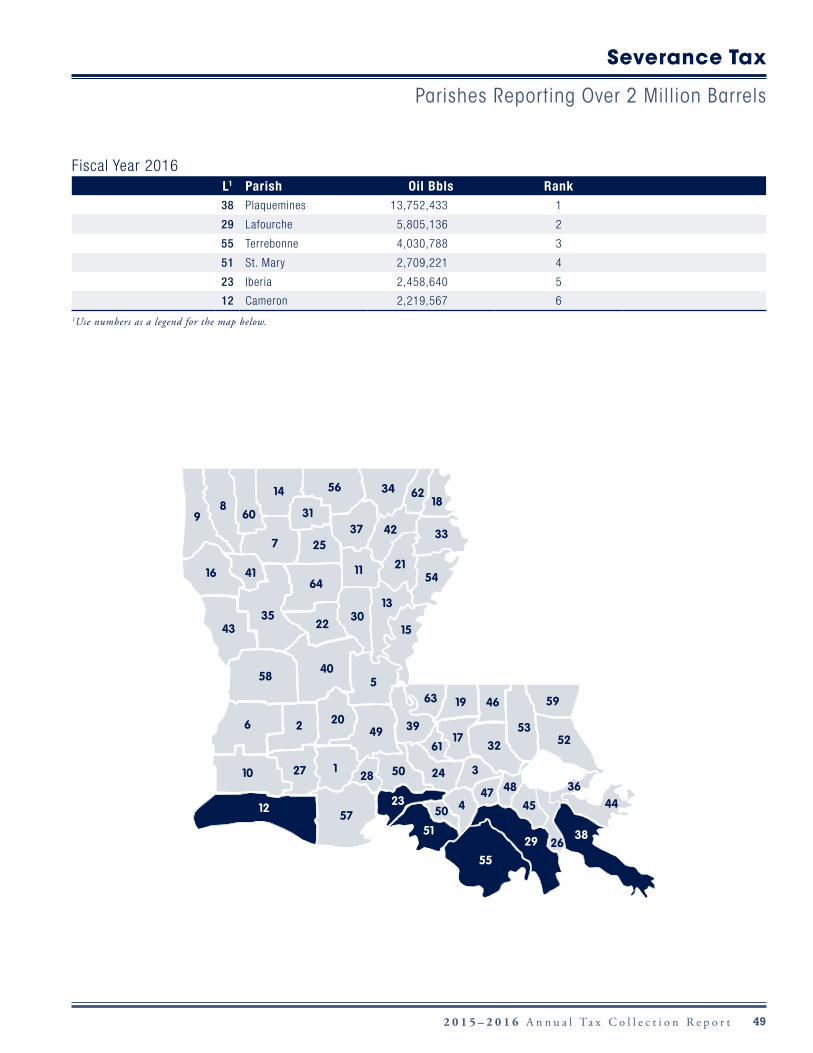
492 0 1 5 – 2 0 1 6 A n n u a l Ta x C o l l e c t i o n R e p o r t
Fiscal Year 2016L1 Parish Oil Bbls Rank38 Plaquemines 13,752,433 1
29 Lafourche 5,805,136 2
55 Terrebonne 4,030,788 3
51 St. Mary 2,709,221 4
23 Iberia 2,458,640 5
12 Cameron 2,219,567 6 1Use numbers as a legend for the map below.
Severance Tax
Parishes Reporting Over 2 Million Barrels
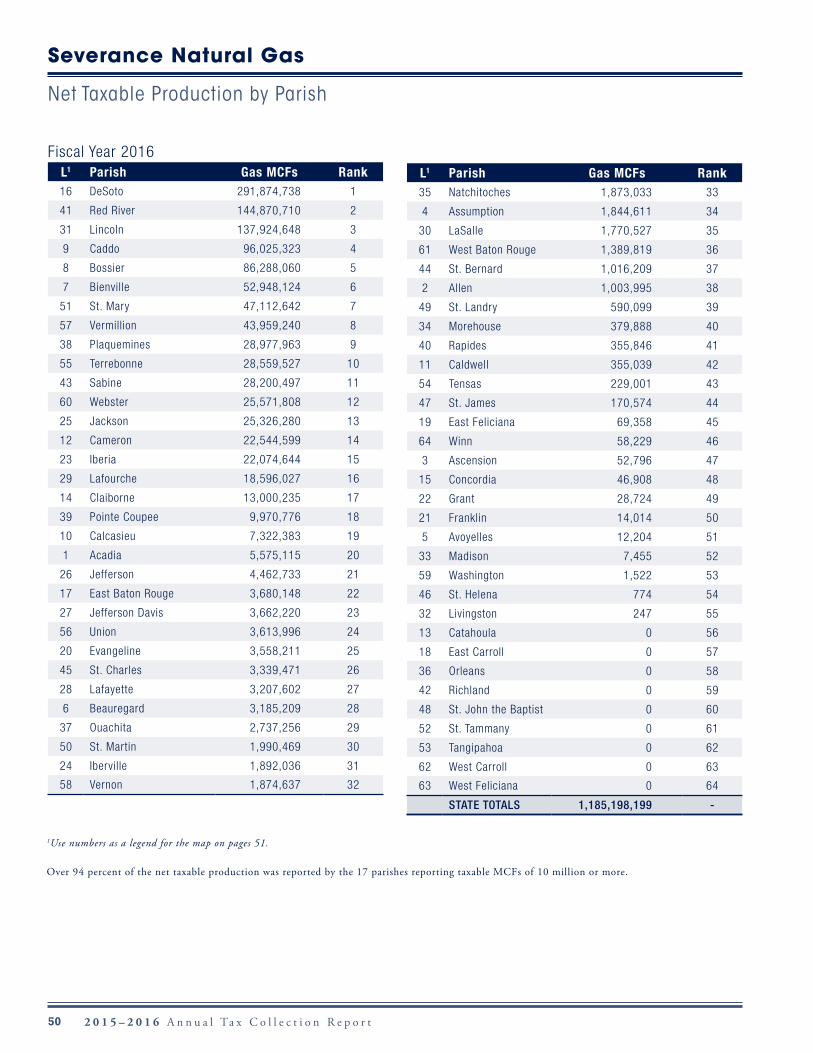
50 2 0 1 5 – 2 0 1 6 A n n u a l Ta x C o l l e c t i o n R e p o r t
Fiscal Year 2016L1 Parish Gas MCFs Rank16 DeSoto 291,874,738 1
41 Red River 144,870,710 2
31 Lincoln 137,924,648 3
9 Caddo 96,025,323 4
8 Bossier 86,288,060 5
7 Bienville 52,948,124 6
51 St. Mary 47,112,642 7
57 Vermillion 43,959,240 8
38 Plaquemines 28,977,963 9
55 Terrebonne 28,559,527 10
43 Sabine 28,200,497 11
60 Webster 25,571,808 12
25 Jackson 25,326,280 13
12 Cameron 22,544,599 14
23 Iberia 22,074,644 15
29 Lafourche 18,596,027 16
14 Claiborne 13,000,235 17
39 Pointe Coupee 9,970,776 18
10 Calcasieu 7,322,383 19
1 Acadia 5,575,115 20
26 Jefferson 4,462,733 21
17 East Baton Rouge 3,680,148 22
27 Jefferson Davis 3,662,220 23
56 Union 3,613,996 24
20 Evangeline 3,558,211 25
45 St. Charles 3,339,471 26
28 Lafayette 3,207,602 27
6 Beauregard 3,185,209 28
37 Ouachita 2,737,256 29
50 St. Martin 1,990,469 30
24 Iberville 1,892,036 31
58 Vernon 1,874,637 32
L1 Parish Gas MCFs Rank35 Natchitoches 1,873,033 33
4 Assumption 1,844,611 34
30 LaSalle 1,770,527 35
61 West Baton Rouge 1,389,819 36
44 St. Bernard 1,016,209 37
2 Allen 1,003,995 38
49 St. Landry 590,099 39
34 Morehouse 379,888 40
40 Rapides 355,846 41
11 Caldwell 355,039 42
54 Tensas 229,001 43
47 St. James 170,574 44
19 East Feliciana 69,358 45
64 Winn 58,229 46
3 Ascension 52,796 47
15 Concordia 46,908 48
22 Grant 28,724 49
21 Franklin 14,014 50
5 Avoyelles 12,204 51
33 Madison 7,455 52
59 Washington 1,522 53
46 St. Helena 774 54
32 Livingston 247 55
13 Catahoula 0 56
18 East Carroll 0 57
36 Orleans 0 58
42 Richland 0 59
48 St. John the Baptist 0 60
52 St. Tammany 0 61
53 Tangipahoa 0 62
62 West Carroll 0 63
63 West Feliciana 0 64
STATE TOTALS 1,185,198,199 -
Severance Natural Gas
Net Taxable Production by Parish
1Use numbers as a legend for the map on pages 51.
Over 94 percent of the net taxable production was reported by the 17 parishes reporting taxable MCFs of 10 million or more.
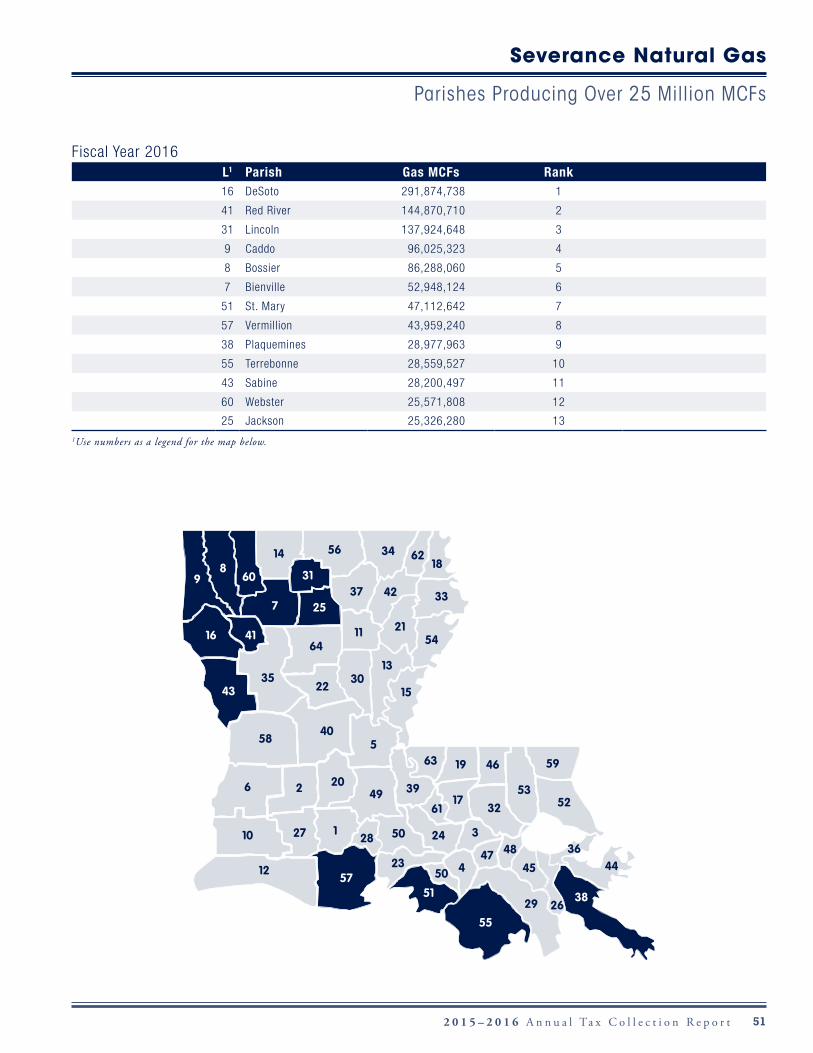
512 0 1 5 – 2 0 1 6 A n n u a l Ta x C o l l e c t i o n R e p o r t
Fiscal Year 2016L1 Parish Gas MCFs Rank16 DeSoto 291,874,738 1
41 Red River 144,870,710 2
31 Lincoln 137,924,648 3
9 Caddo 96,025,323 4
8 Bossier 86,288,060 5
7 Bienville 52,948,124 6
51 St. Mary 47,112,642 7
57 Vermillion 43,959,240 8
38 Plaquemines 28,977,963 9
55 Terrebonne 28,559,527 10
43 Sabine 28,200,497 11
60 Webster 25,571,808 12
25 Jackson 25,326,280 131Use numbers as a legend for the map below.
Severance Natural Gas
Parishes Producing Over 25 Million MCFs
52 2 0 1 5 – 2 0 1 6 A n n u a l Ta x C o l l e c t i o n R e p o r t
Tobacco Tax
Tobacco TaxThe tobacco tax is collected on the sale of stamps for cigarettes and on monthly reports on cigars, other tobacco
products, and vapor products.
Tax stamps can be purchased only from the Department of Revenue and must be affixed on the premises of the
wholesale tobacco dealer.
Every registered tobacco dealer must affix tax stamps in the required denominations and amount on the cigarette
packages immediately after receipt of any unstamped cigarettes.
Every registered tobacco dealer receiving and handling cigarettes, cigars, other tobacco products, and vapor products in
Louisiana upon which tax has not been previously paid must file a report with the Secretary of Revenue within 20 days
after the end of each calendar month.
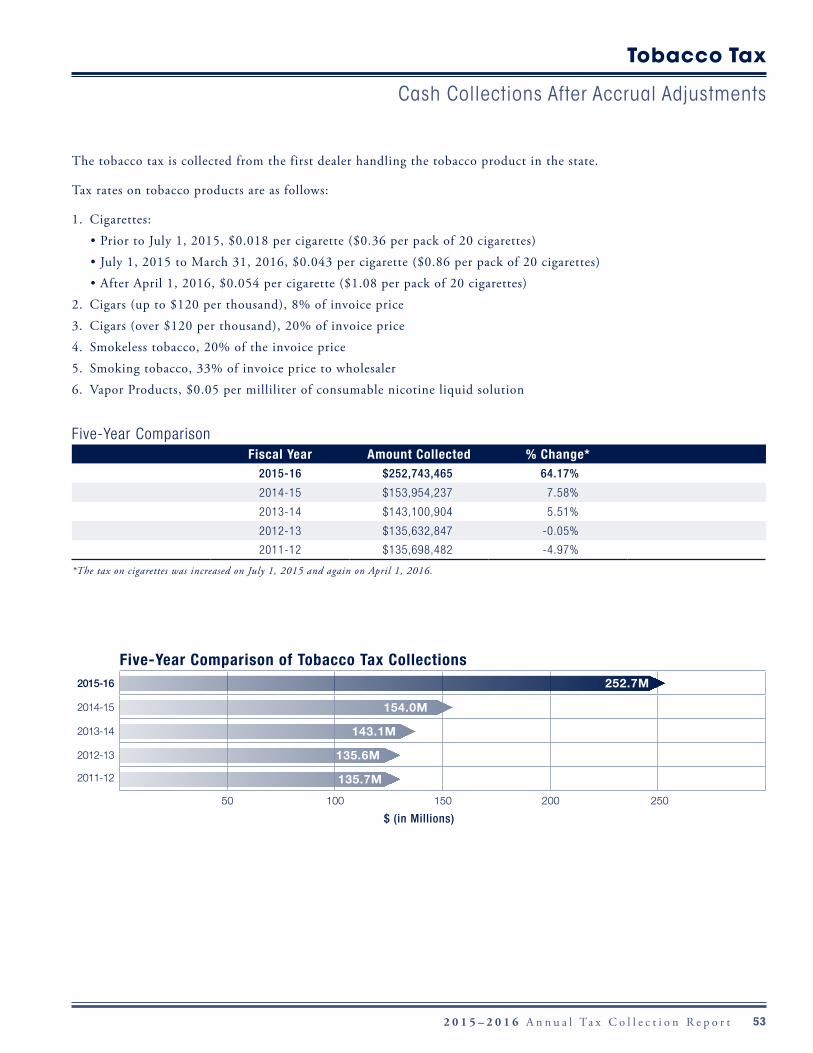
532 0 1 5 – 2 0 1 6 A n n u a l Ta x C o l l e c t i o n R e p o r t
The tobacco tax is collected from the first dealer handling the tobacco product in the state.
Tax rates on tobacco products are as follows:
1. Cigarettes:
• Prior to July 1, 2015, $0.018 per cigarette ($0.36 per pack of 20 cigarettes)
• July 1, 2015 to March 31, 2016, $0.043 per cigarette ($0.86 per pack of 20 cigarettes)
• After April 1, 2016, $0.054 per cigarette ($1.08 per pack of 20 cigarettes)
2. Cigars (up to $120 per thousand), 8% of invoice price
3. Cigars (over $120 per thousand), 20% of invoice price
4. Smokeless tobacco, 20% of the invoice price
5. Smoking tobacco, 33% of invoice price to wholesaler
6. Vapor Products, $0.05 per milliliter of consumable nicotine liquid solution
Five-Year ComparisonFiscal Year Amount Collected % Change*
2015-16 $252,743,465 64.17%
2014-15 $153,954,237 7.58%
2013-14 $143,100,904 5.51%
2012-13 $135,632,847 -0.05%
2011-12 $135,698,482 -4.97%
*The tax on cigarettes was increased on July 1, 2015 and again on April 1, 2016.
Tobacco Tax
Cash Collections After Accrual Adjustments
Five-Year Comparison of Tobacco Tax Collections2015-16
2014-15
2013-14
2012-13
2011-12
50 100 150 200 250
$ (in Millions)
143.1M
252.7M
154.0M
135.6M
135.7M
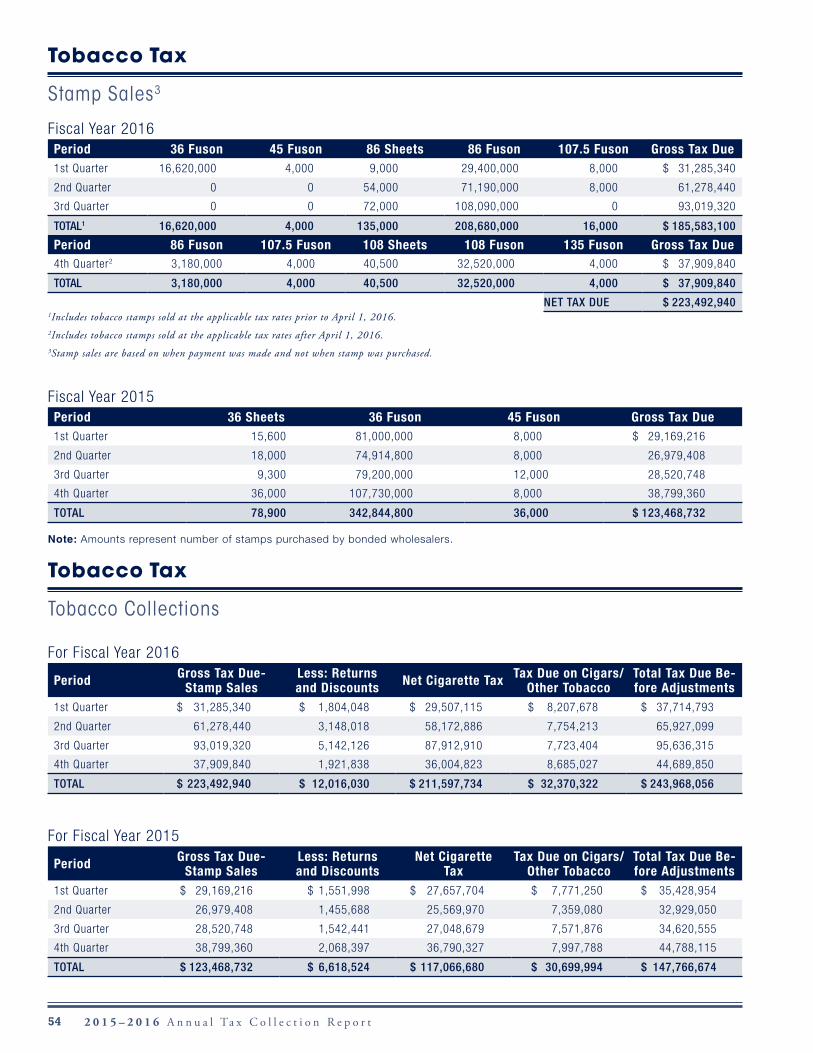
54 2 0 1 5 – 2 0 1 6 A n n u a l Ta x C o l l e c t i o n R e p o r t
Fiscal Year 2016Period 36 Fuson 45 Fuson 86 Sheets 86 Fuson 107.5 Fuson Gross Tax Due1st Quarter 16,620,000 4,000 9,000 29,400,000 8,000 $ 31,285,340
2nd Quarter 0 0 54,000 71,190,000 8,000 61,278,440
3rd Quarter 0 0 72,000 108,090,000 0 93,019,320
TOTAL1 16,620,000 4,000 135,000 208,680,000 16,000 $ 185,583,100
Period 86 Fuson 107.5 Fuson 108 Sheets 108 Fuson 135 Fuson Gross Tax Due4th Quarter2 3,180,000 4,000 40,500 32,520,000 4,000 $ 37,909,840
TOTAL 3,180,000 4,000 40,500 32,520,000 4,000 $ 37,909,840
NET TAX DUE $ 223,492,940 1Includes tobacco stamps sold at the applicable tax rates prior to April 1, 2016.2Includes tobacco stamps sold at the applicable tax rates after April 1, 2016.3Stamp sales are based on when payment was made and not when stamp was purchased.
Fiscal Year 2015Period 36 Sheets 36 Fuson 45 Fuson Gross Tax Due1st Quarter 15,600 81,000,000 8,000 $ 29,169,216
2nd Quarter 18,000 74,914,800 8,000 26,979,408
3rd Quarter 9,300 79,200,000 12,000 28,520,748
4th Quarter 36,000 107,730,000 8,000 38,799,360
TOTAL 78,900 342,844,800 36,000 $ 123,468,732
Note: Amounts represent number of stamps purchased by bonded wholesalers.
For Fiscal Year 2016
Period Gross Tax Due- Stamp Sales
Less: Returns and Discounts Net Cigarette Tax Tax Due on Cigars/
Other TobaccoTotal Tax Due Be-fore Adjustments
1st Quarter $ 31,285,340 $ 1,804,048 $ 29,507,115 $ 8,207,678 $ 37,714,793
2nd Quarter 61,278,440 3,148,018 58,172,886 7,754,213 65,927,099
3rd Quarter 93,019,320 5,142,126 87,912,910 7,723,404 95,636,315
4th Quarter 37,909,840 1,921,838 36,004,823 8,685,027 44,689,850
TOTAL $ 223,492,940 $ 12,016,030 $ 211,597,734 $ 32,370,322 $ 243,968,056
For Fiscal Year 2015
Period Gross Tax Due- Stamp Sales
Less: Returns and Discounts
Net Cigarette Tax
Tax Due on Cigars/Other Tobacco
Total Tax Due Be-fore Adjustments
1st Quarter $ 29,169,216 $ 1,551,998 $ 27,657,704 $ 7,771,250 $ 35,428,954
2nd Quarter 26,979,408 1,455,688 25,569,970 7,359,080 32,929,050
3rd Quarter 28,520,748 1,542,441 27,048,679 7,571,876 34,620,555
4th Quarter 38,799,360 2,068,397 36,790,327 7,997,788 44,788,115
TOTAL $ 123,468,732 $ 6,618,524 $ 117,066,680 $ 30,699,994 $ 147,766,674
Tobacco Tax
Stamp Sales3
Tobacco Tax
Tobacco Collections
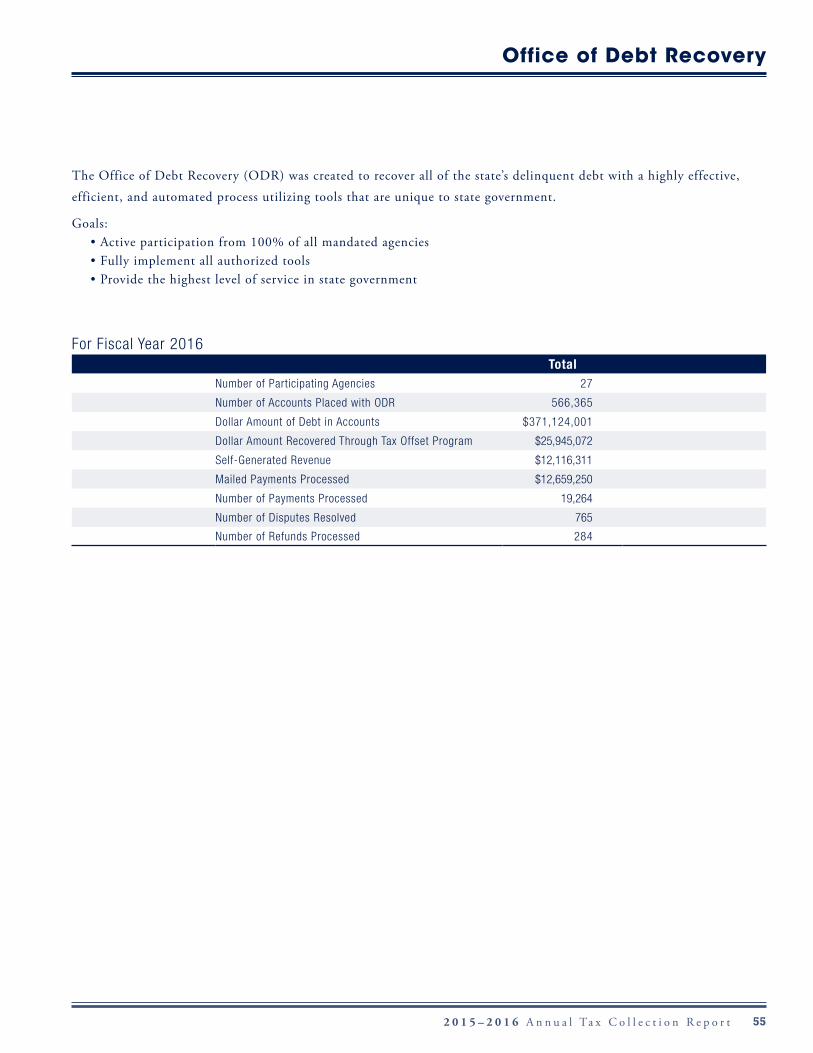
552 0 1 5 – 2 0 1 6 A n n u a l Ta x C o l l e c t i o n R e p o r t
Office of Debt Recovery
The Office of Debt Recovery (ODR) was created to recover all of the state’s delinquent debt with a highly effective,
efficient, and automated process utilizing tools that are unique to state government.
Goals: • Active participation from 100% of all mandated agencies• Fully implement all authorized tools • Provide the highest level of service in state government
For Fiscal Year 2016Total
Number of Participating Agencies 27
Number of Accounts Placed with ODR 566,365
Dollar Amount of Debt in Accounts $371,124,001
Dollar Amount Recovered Through Tax Offset Program $25,945,072
Self-Generated Revenue $12,116,311
Mailed Payments Processed $12,659,250
Number of Payments Processed 19,264
Number of Disputes Resolved 765
Number of Refunds Processed 284
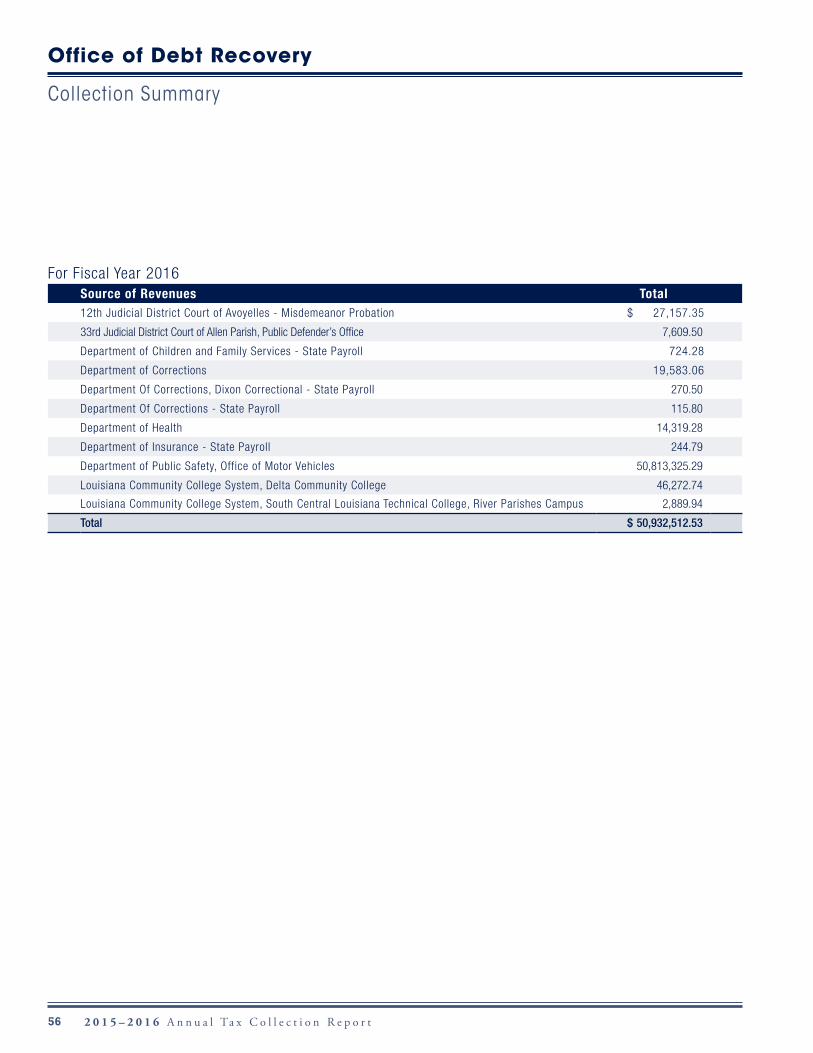
56 2 0 1 5 – 2 0 1 6 A n n u a l Ta x C o l l e c t i o n R e p o r t
Office of Debt Recovery
Collection Summary
For Fiscal Year 2016Source of Revenues Total12th Judicial District Court of Avoyelles - Misdemeanor Probation $ 27,157.35
33rd Judicial District Court of Allen Parish, Public Defender’s Office 7,609.50
Department of Children and Family Services - State Payroll 724.28
Department of Corrections 19,583.06
Department Of Corrections, Dixon Correctional - State Payroll 270.50
Department Of Corrections - State Payroll 115.80
Department of Health 14,319.28
Department of Insurance - State Payroll 244.79
Department of Public Safety, Office of Motor Vehicles 50,813,325.29
Louisiana Community College System, Delta Community College 46,272.74
Louisiana Community College System, South Central Louisiana Technical College, River Parishes Campus 2,889.94
Total $ 50,932,512.53


Louisiana Department of RevenuePost Office Box 3193 | Baton Rouge, LA 70821-3193 | TEL 855.307.3893