Embed Size (px)
Citation preview
POLISH P O L A R R E S E A R C H 14 4 407-431 1993
Józef SOSIŃSKI and Andrzej P A C I O R K O W S K I
Department of Biology and Conservation of Fish Resources, Sea Fisheries Institute Kołłątaja str., 1 81-332 Gdynia, P O L A N D
State of mackerel icefish {Champsocephalus gunnari Lonnberg, 1905) stock from South Georgia area based
on Polish biological investigations in 1975 — 1992
A B S T R A C T : Results o f Polish biological investigations and surveys on the state o f mackerel icefish {Champsocephalus gunnari Lonnberg, 1905) stock served to undertake an attempt at an independent est imation of some of its biological parameters as well as at the assessment of its biomass and fishing mortality during 1975/76—1991/92 fishing seasons with virtual population analysis (VPA) method (using M A F F V P A programme). Laurec-Shepherd and hybrid methods were applied for the V P A tuning. V o n Bertalanffy equation parameters were estimated and compared with those published earlier. F Q l and F m „ values were assessed using Beverton and Hol t model and T h o m p s o n and Bell method. Based on data from available literature the coefficient o f natural mortality (M) was assumed to be 0.5. V P A results indicate that the total stock biomass (TSB) during the last 1991/92 season amounted to 34,818 tonnes and was approximately 10 times lower than in 1975/76 season. Spawning stock biomass (SSB) declined to a minimum of 7,396 tonnes in 1989/90 season. T h e assessment results point out to the recruitment as a major factor contributing to the stock fluctuations.
K e y w o r d s : Antarctic, South Georgia, mackerel icefish, assessment, biomass.
Introduction
In the Atlantic sector of Antarctica one of the most important fisheries areas is the South Georgia shelf (Fig. 1). Polish investigations of fish resources of that area started in 1976 (Rakusa-Suszczewski 1978, Linkowski and Rembiszewski 1978), while Polish fishing vessels began their commercial operations in January 1977 (Sosiński and Kuranty 1979). The whole period of the fishing activity has been accompanied by continuous monitoring of the exploited commercial species stocks state. One of the most important commercial species in that area with respect to the size of the stock biomass is mackerel icefih {Champsocephalus gunnari Lonnberg, 1905).

408 Józef Sosiński and Andrzej Paciorkowski
Fig. 1. South Georg ia and its shelf.
This work is aimed at an assessment of the stock state changes as well as its biomass fluctuations based on results of Polish biological investigations of that species.
Material and methods
The published (Sosiński 1981, 1985a, 1985b, 1990, Ślósarczyk et al. 1984, Mucha and Ślósarczyk 1988, Sosiński and Szlakowski 1992) and unpublished (Cielniaszek, Szlakowski and Traczyk, unpubl.; Cielniaszek and Szlakowski, unpubl.) results of Polish biological and fisheries investigations on mackerel icefish from the South Georgia stock have been used. International catch statistics on icefish originate from the Statistical Bulletin of CCAMLR (Anon. 1990, 1993). Statistics of Polish icefish catches and Polish fishing vessels catch rates of that species were derived from Statlant A and B forms available from the Sea Fisheries Institute in Gdynia, as well as from unpublished data.
Biological and fishing data were collected both from Polish commercial fishing vessels cruises attended by a research team of the Sea Fisheries Institute in Gdynia as well as during surveys conducted from the Sea Fisheries Institute Research vessel R/V "Profesor Siedlecki" and from the British owned R/V "Hill Cove" and R/V "Falklands Protector".
The survey data were gathered during the following research cruises: — R/V "Profesor Siedlecki" in 1975/76, 1978/79, 1986/87, 1987/88,
1988/89. Cruises in 1986/87 and 1987/88 were carried out jointly with the Northeast Fisheries Center (National Marine Fisheries Service, NOAA), Woods Hole, USA;

Mackerel icefish from South Georgia area 409
— R/V "Hill Cove" in 1989/90; — R/V "Falklands Protector" in 1990/91 and 1991/92. Cruises in 1988/89—1991/92 were conducted in collaboration with Imperial
College of Science and Technology, University of London, UK. Commercial fishery data originated from Polish Deep Sea Fishing Com
pany "Dalmor" vessels: M/T "Gemini" in 1976/77 and 1977/78; M/T "Rekin" in 1976/77; M/T "Sirius" in 1977/78 and 1978/79; M/T "Libra" in 1980/81; M/T "Neptun" in 1981/82; M/T "Taurus" in 1983/84 and M/T "Carina" in 1985/86.
The biological data collection based on random sampling procedures comprised length (total, to one centimeter below) measurements and detailed biological analysis. Age was determined from otoliths. The transition date from one age group to another was set on 1 July. The resulting length distributions, mean weights and age — length keys calculated on year basis were used to convert total international catches, Polish catches, Polish commercial CPUE and swept area biomass estimates into numbers. Length-weight relationship was determined and mean weights at lengths were calculated. They were used subsequently to estimate overall annual mean weights by multiplying the weights and frequencies in each length-class in successive years. Since no biological data on icefish were collected by Poland both in 1979/80 and 1982/83 — the lacking age distributions have been estimated from USSR length distributions shown in Kock (1991) and applying Polish age-length key of 1983/84.
Von Bertalanffy growth function parameters were calculated with FIS-HPARM program using mean length at age from 1983/84 — 1988/89 seasons. Yield per recruit, F 0 1 and F , ^ were calculated both using Thompson and Bell method (Ricker 1985) as well as applying Beverton and Holt (1957) model. The latter served as a basis for ploting yield isoplethes.
Fishing mortality, total and spawning stock biomass changes in 1975/76 — 1991/92 were estimated using virtual population analysis (VPA). Tuning was conducted with Laurec-Shepherd and hybrid (Pope and Shepherd 1985) methods. It was decided to use two fleets for tuning: Polish catch — effort data and swept area biomass estimates (Tab. I). Since both sets were lacking data in some years (but not necessarily the same) they had to be completed using the existing information from the other set or on basis of the total catch changes. In few other instances the data in a set had to be corrected due to their departure from an expected trend seen in two other sets of data. The thumb rule accepted in this procedure was to increase or decrease the uncertain value by 75% of the change observed in one of the two other sets (Tab. I).
Separable VPA was attempted but not being able to find a rational to choose between different sets of selection factors the approach has been abandoned. Accordingly further calculations of yield per recruit with

410 Józef Sosiński and Andrzej Paciorkowski
T a b 1 e I
Data on mackerel icefish catches, C P U E and swept area biomass estimates used for assessment.
Fishing season
International catches
Polish catches
Share of Polish
catches
Polish commercial
C P U E
Survey C P U E
C P U E estimates used for tuning
Swept area b iomass
estimates
Biomass estimates used for tuning
(tonnes) (tonnes) (%) (t/d) (t/h) (t/d) (tonnes) (tonnes)
1975/76 12290 5 0.04 — 0.167 1.9 _ 49.8 1976/77 93400 3185 3.41 10.8 — 10.8 226.6 226.6 1977/78 7557 2069 27.38 1.2 — 1.2 2.4 25.2 1978/79 641 110 17.16 0.3 - 0.3 1.2 12.2 1979/80 7592 753 9.92 1.1 - 1.1 — 25.3 1980/81 29384 9166 31.19 8.9 - 8.9 88.4 88.4 1981/82 46311 4446 9.60 11.6 - 11.6 46 .2 46 .2 1982/83 128194 13 0.01 - - 24.1 — 127.9 1983/84 79997 8098 10.12 15.2 - 15.2 41.3 41.3 1984/85 14148 389 2.75 0.6 - 3.6 — 9.8 1985/86 11107 2506 22.56 12.8 - 12.8 27.5 27.5 1986/87 71151 2236 3.14 23.2 0.313 23.2 47.3 47.3 1987/88 34619 787 2.27 8.1 0.044 8.1 17.9 17.9 1988/89 21359 2.6 0.01 - 0.094 13 20.8 20.8 1989/90 8087 523 6.47 37.1 0.437 37.1 40.3 40.3 1990/91 40 40 - - 0.079 4.6 15.2 15.2 1991/92 5.3 5.3 - 0.144 6.3 28.1 28.1
Note: ID 1990/91 and 1991/92 survey catches only
Thompson and Bell method as well as catch projections were conducted applying the selection curve obtained from the tuning with Laurec—Shepherd and hybrid methods.
Following the published estimates of natural mortality (M) for mackerel icefish (Frolkina and Dorovskikh 1990) a mean level of 0.5 was assumed in all calculations.
The VPA analysis was carried out with the MAFFVPA programme developed by the UK Ministry of Agriculture, Fisheries and Foods (MAFF). Calculations of yield per recruit (Thompson and Bell model) were conducted with the YR programme received from CCAMLR commission.
Results
Stock abundance indices
— Catches and catch per unit of effort
The annual (by so called southern hemisphere split year beginning in July, called further in text — seasons) icefish mackerel catch from the South Georgia

Mackerel icefish from South Georgia area 411
shelf from 1970/71 to 1975/76 has not exceeded 10,000 tonnes a year (Kock 1991). After that time until 1991/92 three periods of the catches raise and decline have been recorded (Tab. I). In 1976/77 the catch increased threefolds up to 93,400 tonnes and next sharply decreased in the 1978/79 season to only 641 tonnes. The maximum catch level of 128,194 tonnes was reached in 1982/83. In years to follow the catches began to decline to 11,107 tonnes in 1985/86, however, raised again to 71,151 tonnes in 1986/87. A continuous decline in the following years down to 8,087 tonnes in 1989/90 has ended with a moratorium announced for seasons 1990/91 and 1991/92.
Polish fishing fleet catch changes matched approximately with the trends observed in the total international catches (Tab. I). In seasons 1976/77 and 1977/78 Polish catches totalled 3,185 and 2,069 tonnes. The declining trend continued during the next 2 years followed by a period of a substantial catch increase during 1980/81, 1981/82 and 1983/84 to the maximum of 9,166 tonnes in the former and of 8,089 tonnes in the latter case. Unfortunately, due to the Polish fishing fleet withdrawal form South Georgia area in the best hitherto recorded international fishing season 1982/83 — the Polish icefish catch in that year amounted only to 13 tonnes. During 1985/86 and 1986/87 icefish catches by Polish fishing vessels have increased, however, again to 2,506 and 2,236 tonnes, respectively. The low level of Polish icefish catches in 1984/85 as well as in 1987/88 resulted again from a decision of fishing enterprises involved not to deploy their vessels in the area.
The Polish mackerel icefish fishery in the South Georgia shelf has been carried out by few types of factory and freezing trawlers fishing with both bottom and pelagic trawls. Bulk of the vessels constituted factory trawlers B-15 and B-22 types belonging to tonnage class 2000 — 3000 GRT. The mean icefish catch per unit of effort (CPUE) expressed in tonnes per day of that tonnage class during the successive seasons is shown in Tab. I. A substantial degree of conformity between the observed CPUE trends and the swept area biomass estimates of that stock implied their application as a set of abundance indices. The lacking CPUE data in some years has been supplemented with CPUE's calculated on basis of the relative changes of CPUE resulting from research catches or from the changes observed in the total catches.
The highest mean CPUE of 37.1 t/day was recorded in 1989/90 followed by 23.2 t/day in 1986/87. The very low mean CPUE at the level of 0.3 to 1.2 t/day were observed between 1976/77-1979/80 and in 1984/85.
— Swept area biomass estimates
Standing stock biomass of icefish in the South Georgia area was estimated with swept area method using commercial fishing and survey data (Ślósarczyk et al. 1984, Mucha and Ślósarczyk 1988, Sosiński and Szlakowski 1992, and unpublished reports by Cielniaszek, Szlakowski and Traczyk, and Cielniaszek and Szlakowski). The estimates ranged from 226,606 tonnes in the first 1976/77

412 Józef Sosiński and Andrzej Paciorkowski
T a b l e n
Estimates o f standing stock b iomass with swept area method in 1 9 7 6 / 7 7 - 1 9 9 1 / 9 2 seasons
and Polish or joint P o l i s h - U S A and
Type All species Ch. gunnari Share of Season M o n t h Vessel o f trawlable trawlable Ch. gunnari
data biomass biomass biomass
(tons) (tons) (%)
1976/77 Jan . -May M.T. "GEMINI" commercial 323703 226606 70.0 1977/78 Dec . -Apr . M.T. "GEMINI" commercial 72862 2372 3.3 1978/79 Dec . -Mar . R.V. "PROF. SIEDLECKI" survey 20452 1152 5.6 1979/80 - - - - - -1980/81 Oct . -Feb. M.T. "LIBRA" commercial 123368 88414 71.7 1981/82 N o v . - F e b . M.T. "NEPTUN" commercial 133230 46192 34.7 1982/83 - - - - - -1983/84 Nov . -Jan . M.T. 'TAURUS" commercial 156000 41300 26.5 1984/85 - - - - - -1985/86 Nov . -Jan . M.T. "CARINA" commercial 66132 22476 41.5 1986/87 December R.V. "PROF. SIEDLECKI" survey 94277 47312 50.7 1987/88 Dec. -Jan. R.V. "PROF. SIEDLECKI" survey 48643 17913 36.8 1988/89 February R.V. "PROF. SIEDLECKI" survey 51533 20847 40.5 1989/90 January M.T. "HILL COVE" survey 63159 40289 63.8 1990/91 Jan. - Feb. M.T. "FALKLANDS PROT." survey 69090 15205 22.0 1991/92 January M.T. "FALKLANDS PROT." survey 95710 28099 29.4
season to 28,099 tonnes in the last 1991/92 season considered (Tab. II). The lowest estimates of 2,372 tonnes and 1,152 tonnes have resulted from Polish commercial vessel data of 1977/78 and 1978/79, respectively.
Assumption of 100% catchability of bottom trawls for icefish biomass estimation, uneven area and depth coverage both during commercial and research vessels fishing operations, the influence of a single large catch on the final estimate as well as differences in vertical opening of trawls used may cast some doubts on precision of the relative and absolute biomass estimates (Tab. II), at least in some years (Ślósarczyk et al. 1985). The uncertainties specifically refer to the swept area estimates resulting from M/T "Gemini" and R/V "Profesor Siedlecki" surveys in 1977/78 and 1978/79 fishing seasons when extremely low biomass estimates have been obtained. More pelagic occurrence of icefish shoals observed in these years could be responsible for the underestimation (Ślósarczyk et al., op.cit.). Combined with small vertical opening of the commercial trawls used it could lead to a considerably decreased catchability of bottom trawls compared to pelagic ones. On the other hand an overestimation of the icefish biomass, e.g. in 1976/77 season (and may be in other years), was also possible due to the tactics of the commercial vessel to maintain within the area of highest fish concentration.
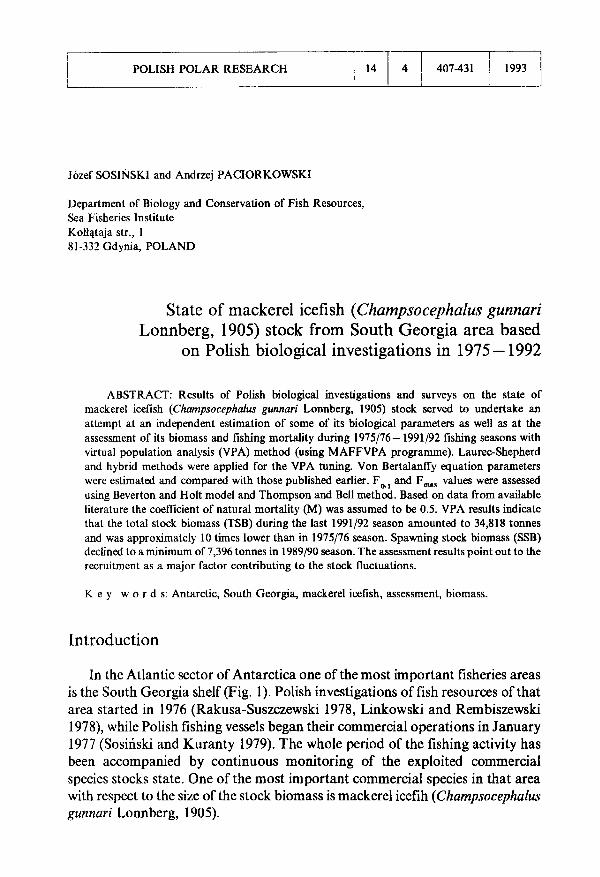
Mackerel icefish from South Georgia area 413
of makcerel icefish off South Georgia based on Polish commercial fishery data, Polish —British survey results.
Ch. gunnari Total area biomass covered
mean by survey density
Depth range
Number of
hauls
Gear type
H o n - Average zontal trawling opening speed of trawl
Source
36.6 6194 1 5 0 - 500 277 P-36/39 24.0 3.80 Ślósarczyk et al. 1984 0.3 8164 1 5 0 - 500 243 P-32/36 17.5 3.80 Ślósarczyk et al. 1984 0.2 5471 1 5 0 - 500 36 P-26/32 17.0 4.25 Ślósarczyk et al. 1984
7.9 11196 5 0 - 500 507 P-32/36 17.5 3.60 Ślósarczyk et al. 1984 9.8 4722 5 0 - 500 298 P-32/36 17.5 3.70 Ślósarczyk et al. 1984
3.4 12150 5 0 - 500 - P-32/36 17.5 - Ślósarczyk et al. 1984
4.3 6434 5 0 - 500 232 P-32/36 17.5 3.20 M u c h a and Ślósarczyk 1988 1.5 32329 5 0 - 500 109 P-32/36 17.5 3.50 Sosiński and Szlakowski 1992 0.8 23116 5 0 - 500 128 P-32/36 17.5 3.50 Sosiński and Szlakowski 1992 0.8 26742 5 0 - 500 55 P-32/36 17.5 3.50 Sosiński and Szlakowski 1992 1.3 29933 5 0 - 500 59 120 feet 20.0 3.75 Cielniaszek et al., unpubl. 0.5 28082 5 0 - 500 73 120 feet 20.0 3.50 Cielniaszek and Szlakowski,
unp. 1.0 27482 5 0 - 500 74 120 feet 20.0 3.50 Cielniaszek and Szlakowski,
unp.
Comparison of biomass estimates made with swept area method during the whole period in question with trends observed in total catches and commercial CPUE shows, however, that in general their trends match quite well (Tab. I).
The lacking swept area biomass estimates in 1979/80, 1982/83 and 1984/85, similarly to procedures followed in case of lacking CPUE data, have been calculated on the basis of relative changes in total catches or commercial CPUE's. In addition, using the same approach, the standing stock biomass estimates considered to be underestimates in 1977/78 and 1978/79 were corrected.
— Age and length distribution changes
The share of successive age groups in the stock, reflected to an extent also by the length distribution curve, depends on a number of biotic and abiotic factors. Mackerel icefish taken during 1975/76 to 1991/92 fishing seasons ranged from 10 to 60 cm in length and from 1 to 9 years in age. Only inconspicuous number of fish were older.
The composition of the exploited icefish stock in respect to length and age is presented in Fig. 2. In fishing seasons 1975/76 and 1976/77 the fishery was based on the so called accumulated stock consisting of a considerable number of year-classes. High intensity of the exploitation resulted in a decline of the stock of fish belonging to older age groups. Starting from 1977/78 until 1983/84

414 Józef Sosiński and Andrzej Paciorkowski
10 15 20 25 30 35 40 45 50
No dało
20.
15;
o' 20
15
10 5 i 0
A 10 15 20 25 30 35 40 45 50
JA. 10 15 20 25 30 35 40 45 50
No dofa
20}
15
10
5!
0 10 15 2 0 25 3 0 35 40 45 50
Length class (cm]
100 80 50 40 20
0
80 60 40 20 0
l l l l . . . .
1975/76 season
1 234 5 6 7 8 9
IULUJ 1 2 3 4 5 6 7 8 9
80 60 40 20 0
80 60 40 20
0
1 2 3 4 5 6 7 8 9
t 1 2 3 4 5 6 7 8 9
100 80 60 40 20
0
80 60
20 0
100 80 60 40 20
0
1 2 3 4 5 6 789
• 1 2 3 4 5 6 7 8 9
1 2 3 4 5 6 7 8 9 Age groups
1976/77 season
1977/78 season
1978/79 season
1979/80 season
1980/81 season
1981/82 season
1982/83 season
1983/84 season
fishing season the fishery concentrated mainly on 2 years old fish recruiting to the exploited part of the stock. The total catch and catch rates have depended on the abundance of year-classes entering the exploited stock and at the same time creating the very stock. The year-classes recruiting to the stock as age

Mackerel icefish from South Georgia area 415
10 15 20 25 30 3 5 40 45 50 Length class (cm]
% 100 80 60 40 20 0
80 60 40 20 0
1 2 3 4 5 6 7 8 9
1984/85 season
1985/86 season
1 234 5 6 7 8 9
80 60 40 20
0
80 60 40 20
0
80 60 40 20
O'
1 2 3 4 5 6 7 8 9
HE
1986/87 season
1987/88
1 2 3 4 5 6 7 8 9
80 60 40 20
0
80 60 40 20 0
80 60 40 20
0
1 2 3 4 5 6 7 89
1 2 3 4 5 6 7 89
lllu
1988/89 season
1989/90 season
1990/91 season
1 2 3 4 5 6 7 8 9
1991/92 season
1 2 3 4 5 6 7 8 9 Age groups
Fig. 2. Length and age distribution of mackerel icefish catchs from South Georgia area in 1 9 7 5 / 7 6 - 1991/92 fishing seasons.
group 2 in fishing seasons 1980/81 —1983/84 were abundant, which is reflected by the achieved fishing results (Tab. I).

416 Józef Sosiński and Andrzej Paciorkowski
In the next fishing season the exploited stock was also characterized by relatively abundant 3 years old fish, as well as juvenile fish 12 —18 cm in length belonging to age group 1.
Basic biological parameters of the stock
— Growth rate
A considerable increase of the biological data base collected during Polish investigations in the South Georgia shelf, compared to materials analysed in 1981 (Sosiński 1981), induced an attempt to reevaluate the Von Bertalanffy growth equation parameters. The results obtained may be, however, of limited value, taking into account the relatively small number of age groups included to achieve a fully reliable estimate.
2500
Kock, Duhamel and Hureau's (1985) as well as Frolkina and Dorovskikh (1989) reviews of mackerel icefish age determinations made by many authors, reveal considerable discrepancies of the estimates. The resulting differences between mean length at age, especially distinct in case of fish older than 5 — 6 years, contribute to large differentiations of the von Bertalanffy equation parameters calculated on that basis. In Tab. Ill some of those estimates are compared with parameters calculated using mean length at age derived from Polish investigations conducted in 1983/84-1988/89. The Polish data from 1989/90 — 1991/92 seasons could not be included into the length at age calculations due to the insufficient number of specimens older than age 6 to obtain reliable length at age estimates.

Mackerel icefish from South Georgia area 417
T a b l e III
Parameters o f linear growth for mackerel icefish calculated by different authors.
Parameters K t 0 L,
Olsen, 1955* 0.3878 1.3557 42 .10 cm Kock, 1981* 0.1570 0.3849 65.10 cm Sosiński, 1981 0.3542 0.4040 45.55 cm Kochkin, 1985* 0.1296 - 0 . 6 7 2 2 71.94 cm Frolkina and Dorovskikh, 1989* 0.1340 - 0 . 2 7 9 8 68.90 cm This estimation 0.1995 - 0 . 4 5 7 3 61.75 cm
* from Frolkina and Dorovskikh, 1989
Using the asymptotic length (L i n f =61.75 cm) data as well as length-weight relationship (W = 0.00021 • L3.3315) calculated on the basis of Polish data — the value of asymptotic weight (W i n f. = 2042.0 g) was determined. The weight-length relationship (Fig. 3) was based on length and weight measurements of 9875 specimens ranging from 17 to 60 cm in length.
— Natural mortality
Polish data have not comprised age distributions from the inceptive period of the fishery. On the basis of the available data a more precise estimation of natural mortality than that carried out by Frolkina & Dorovskikh (1989) was not possible. A range of natural mortality estimates of mackerel icefish obtained by several authors with different methods is presented in Tab. IV.
T a b l e IV
Mackerel icefish natural mortality (M) estimates.
N a m e of author or method Estimate of M
R i k h t e r - E f a n o v , 1976** 0.54 Kock, Duhamel & Hureau* 0.48 Baranov** 0.58 Beverton and Hold, by age** 0.60 Beverton and Holt , by length** 0.51 Alverson — Carney** 0.32
* data from Sosiński, 1981 ••calculated by Frolkina and Dorovskikh, 1989
Taking into account the considerable range (0.32—0.60) of the resulting estimates of the natural mortality coefficient (M), for purpose of this assessment it was decided to accept a single value of M = 0.5, which is approximately equal to an arithmetic mean of the values included in Tab. IV.

418 Józef Sosiński and Andrzej Paciorkowski
— Yield per recruit
Yield changes of the South Georgia mackerel icefish stock as a function of fishing mortality (F) and the age of first capture (t c) were calculated with Beverton and Holt yield per recruit model assuming "knife edge" recruitment. Maximum fishing mortality ( F m a x ) and optimum fishing mortality ( F 0 1 ) values calculated on that basis for t c ranging from 1 to 4 years at M = 0.5 are shown in Tab. V.
T a b l e V
Maximum ( F m „ ) and optimum of fishing mortality (F ) at different levels of age of first capture ( t j calculated with Beverton and Holt model.
t F F ' M « * 0 1
1 0.503 0.288 2 1.039 0.401 3 0.519 4 - 0.628
To allow for a more realistic (than the "knife edge") exploitation pattern of the year-classes recruiting to the stock, which resulted from selection factors (S) obtained from VPA, the Thompson and Bell method (Ricker 1985) was used. The plot of Y/R curve, calculated on basis of mean S's from 1975/76—1988/89 seasons using CCAMLR computer programme showing the position of respective values of F 0 1 (=0.486) and F m a x ( = 0.888), is presented in Fig. 4.
0.3
0.1
01
1 F
m a x
- +
-4 .
'+
•
' ' + . . ' • + . .
• + — + .
1 1 1 1 — l —
- + - - - + . -•+•• l
•+•
01 ' 03 ' 0 5 ' 07 ' 09 ' 1 .1 ' 1.3 ' 1.5 Fishing mortality (Fl
• • — Yield per recruit •••+--SSB per recruit
Fig. 4 . Long — term yield and spawning stock biomass calculated with T h o m p s o n and Bell method .

Mackerel icefish from South Georgia area 419
Fishing mortality
Fig. 5. Isopleths of yield per recruit.
Beverton and Holt model was applied also to calculate yield as a function of both F and t c, and thus to plot isoplethes (Fig. 5). The plot shows clearly that the largest yield can be reached when t c is at the level of 2 — 3 years. Any further increase of t c would not be profitable since it could lead to a decline in yield.
T a b I e VI
Data inputs used for V P A runs.
Data A g e
1 2 3 4 5 6 7 8 + gP
Mean weight at age (kg)* 0.02 0.08 0.18 0.31 0.50 0.66 0.81 0.89 0.96 Natural mortality (M) 0.5 0.5 0.5 0.5 0.5 0.5 0.5 0.5 0.5 Proportion mature at age 0.0 0.5 1.0 1.0 1.0 1.0 1.0 1.0 1.0 Prop, o f M before spawn. 0.75 0.75 0.75 0.75 0.75 0.75 0.75 0.75 0.75 Prop, of F before spawn. 1.0 1.0 1.0 1.0 1.0 1.0 1.0 1.0 1.0
* refers to both catch and stock
Fishing mortality and stock biomass estimates
The historical changes of fishing mortality (F) and the stock biomass have been estimated with traditional VPA developed by Gulland (1965). The analysis covered 17 years from 1991/92 back to 1975/76. The data on mean weight at

Age 2
l—i 1 1 1 1 1 1 i i i 1976 1978 1980 1982 1984 1986 1988 1990 1992
Year — • — Fleet 1 E H - F l e e t 2
' — ' 1 1 ' L 1 1 1 1 1 1 1 1 1 I 1 L_l 1976 1978 1980 1982 1984 1986 1988 1990 1992
Year • — Fleet 1 D - - Fleet 2
Fig. 6. Log calchability estimates for age groups 2 and 3.
ear 1975/76 1976/77 1977/78 1978/79 1979/80 1980/81
Mackerel icefish
1981/82 1982/83
Age 1 100 3290 2866 26 207 176 23746 3941 2 4790 3084 26135 2905 5369 148650 158309 175115 3 8803 35158 6745 1151 15558 8961 26385 257150 4 5729 34747 3119 193 7692 6150 21588 114048 5 3690 36392 1349 39 1089 6677 5277 14264 6 3075 36392 885 9 227 2987 2639 4129 7 1715 24056 422 9 148 1230 959 1689 X 1230 13775 379 22 148 527 480 1030
+ g p 3334 18710 253 22 59 351 480 563
Totalnum Tonsland
32464 12290
205602 93400
42153 7557
4376 641
30498 7592
175709 29384
239861 46311
571929 128194
Note: TONSLAND =. total catch in tonnes [420]

Mackerel icefish from South Georgia area 421
age, natural mortality (M), proportion mature of age, proportion of M before spawning and proportion of F before spawning used in VPA runs are shown in Tab. VI. Total catch at age in number matrix (Tab. VII) was calculated by applying Polish catches age distribution (Fig. 2) to the total international catches. It was decided to include into the analysis very low survey catches of 1990/91 and 1991/92 so as to arrive to as realistic stock size at the beginning of 1992/93 as possible.
VPA was tuned with Laurec—Shepherd and hybrid method using tuning module of the MAFFVPA programme. Fishing mortality in the oldest age group was taken to be the arithmetic mean of the F's of the 3 younger age groups in each year. Two fleets assumed to reflect the stock abundance indices were included in the tuning: Polish commercial fleet mean CPUE and the trawl survey biomass estimates (Tabs. I and II). Calculation option providing for log catchability was chosen. The overall mean F was calculated as the weighted mean of the F corresponding to particular fleets; weighting factor being the reciprocal of individual F's variance. Due to the trend observed in the log catchability (q) estimates for Fleet 1 (Polish commercial fleet catch and effort) as shown in Fig. 6 — the terminal q was estimated from the trend using time as explanatory variate. In Fig. 6 only ages 2 and 3 log catchability estimates are being included as example of very similar trends present in other ages as well.
Sigma (int.) coefficients resulting from tuning were in general at acceptable level below or slightly above 1 (Tab. VIII) with exception of age 1. The Sigma (int.) is a measure of a standard error of the F estimate. The Sigma (ext.) is a measure of the scatter of individual F, estimates (corresponding to different fleets) about the weighted mean F ź . The Sigma (overall) is one of the two measures above whichever is larger (Anon. 1989).
Trial runs of separable VPA has not been successful since no acceptable exploitation pattern could be reached. A single run resulting in a dome shape
T a b l e VII
catch numbers at age (Numbers • 10 — 3).
1983/84 1984/85 1985/86 1986/87 1987/88 1988/89 1989/90 1990/91 1991/92
4525 156 23897 11333 29034 28258 25535 89 10 694646 8278 32165 368305 70597 62371 13690 89 19
32432 65367 29076 236093 83722 19602 17024 81 10 17347 3671 3453 11333 11932 12856 1845 27 3 4525 156 727 1889 1193 2928 714 3 1
754 312 818 630 398 509 417 I 0 500 156 363 400 1600 764 298 0 0 100 100 91 200 300 300 200 0 0
50 30 50 40 50 100 50 0 0
754880 78227 90639 630221 198826 127688 59773 290 4 3 79997 14148 11107 71151 34619 21359 8087 4 0 5

T a b l e VIII
Summary statistics from the V P A tuning.
Age group Sigma (int.) Sigma (ext.) Sigma (overall) Variance ratio
1 1.820 1.720 1.820 0.89 2 0.765 0.997 0.997 1.699 3 0.699 1.000 1.000 2.053 4 0.699 0.810 0.810 1.342 5 1.020 0.621 1.020 0.371 6 0.959 0.591 0.959 0.380 7 1.140 0.172 1.140 0.023
1.8
- e - F B A R a g e 2-4 FBAR age 5-8 —A— FRAR age 1-8
Fig. 7. Fishing mortality (F) changes from 1975/76 to 1991/92.
Mackerel icefish fishing mortality (F) at age
Year 1975/76 1976/77 1977/78 1978/79 1979/80 1980/81 1981/82 1982/83
A g e 1 0.0008 0.0162 0.0137 0.0001 0.0002 0.0002 0.0519 0.0030 2 0.0429 0.0389 0.2378 0.0234 0.0350 0.3299 0.2891 0.9788 3 0.1084 0.7245 0.1534 0.0199 0.2317 0.1030 0.1226 1.8690 4 0.0702 1.2465 0.1733 0.0079 0.2471 0.1867 0.5498 2.0056 5 0.0381 1.2938 0.1809 0.0040 0.0765 0.5059 0.3404 1.4722 6 0.0630 0.9380 0.1179 0.0022 0.0385 0.4369 0.5588 0.7237 7 0.0553 1.56551 0.0313 0.0021 0.0614 0.4236 0.3442 1.4424 8 0.0521 1.2658 0.1100 0.0027 0.0588 0.4555 0.4145 1.2128
+ gp 0.0521 1.2658 0.1100 0.0027 0.0588 0.4555 0.4145 1.2128
F B A R 1 - 8 F B A R 2 - 4
0.0539 0.0738
0.8861 0.6700
0.1273 0.1882
0.0078 0.0170
0.0937 0.1713
0.3052 0.2065
0.3339 0.3205
1.2134 1.6178
[422]

Mackerel icefish from South Georgia area 423
S curve within age groups 1 — 5 ended up, however, with rather not realistic biomass estimate (of about 500,000 tonnes) in 1975/76 and quite high estimates (200,000-300,000 tonnes) in the intermediate years.
Mean fishing mortalities of age groups 1 — 8 resulting from VPA ranged from 0.0002 in 1991/92 to 1.2 in 1982/83 (Tab. IX, Fig. 7). The very small values observed in 1978/79 and the two last years were due to low level or absence of any commercial fishing. Durig 1975/76—1981/82 period the mean F's of older age groups 5 — 8 were greater or at the same level as F's of younger ages. From 1982/83 until 1989/90 F's of younger age groups considerably exceeded F's of older ages. Fluctuations of F coincided very closely with changes in magnitude of the total catch of mackerel icefish. During 7 out of 15 years of the mackerel icefish stock exploitation the mean F's of ages 1 — 8 exceeded F a i (0.486) estimated with Thompson and Bell method (Fig. 4); in one case (1976/77) it was at the F m a x level (0.888) and in another case (1982/83) it was by 35% above F0-1.
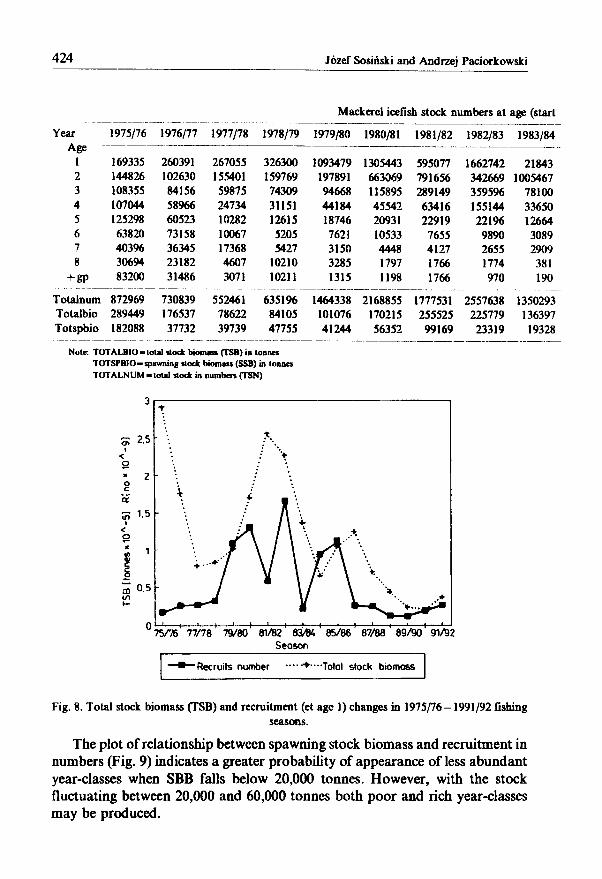
Total stock biomass estimates resulting from the VPA (Tab. X, Fig. 8) reveal three periods of the biomass increase. The first in 1975/76 when the biomass was at its highest level of 289,449 tonnes, the second in 1981/82 and 1982/83 when two relatively abundant year-classes 1979/80 and 1980/81 accumulated to increase the stock biomass to 255,525 and 225,779 tonnes, respectively, and the last period during which the biomass peaked at 124,007 tonnes in 1986/87. The spawning biomass was at its highest level of 182,088 tonnes in 1975/76. It was reduced by fishing to about 1 /4 of that level over the next 5 years and increased again to 99,169 tonnes in 1981/82.
There was a constant decrease of the spawning stock biomass (SSB) between 1985/86 and 1989/90 from 30,736 to only 7,396 tonnes. After two years duration of the fishery moratorium in 1990/91 and 1991/92 the biomass rised to around the level of 1985/86 which was still 6 fold lower than the biomass at the beginning of the whole period included in calculations.
T a b l e IX
(traditional V P A terminal F's estimated using Hybrid method) .
1983/84 1984/85 1985/86 1986/87 1987/88 1988/89 1989/90 1990/91 1991/92
0.0272 0.0002 0.0273 0.0570 0.1548 0.3246 0.3222 0.0006 0.0000 1.7214 0.0867 0.0740 1.1161 0.8743 0.8591 0.3650 0.0022 0.0002 0.7184 1.2863 0.7158 1.9919 1.4290 1.0111 0.9428 0.0044 0.0004 0.9926 0.2233 0.2710 1.0859 0.8003 1.6028 0.3270 0.0043 0.0003 0.5858 0.0266 0.0857 0.3287 0.4301 0.6895 0.4770 0.0009 0.0003 0.3648 0.0970 0.2615 0.1364 0.1463 0.4739 0.2704 0.0013 0.0001 0.2436 0.1644 0.2163 0.2756 0.9011 0.6699 0.8565 0.0001 0.0002 0.3981 0.0960 0.1878 0.2469 0.4925 0.6112 0.5348 0.0008 0.0002 0.3981 0.0960 0.1878 0.2469 0.4925 0.6112 0.5348 0.0008 0.0002
0.6315 1.1441
0.2476 0.5321
0.2299 0.3536
0.6548 1.3979
0.6535 1.0345
0.7803 1.1577
0.5120 0.5449
0.0018 0.0036
0.0002 0.0003
424 Józef Sosiński and Andrzej Paciorkowski
Mackerel icefish stock numbers at age (start
Year 1975/76 1976/77 1977/78 1978/79 1979/80 1980/81 1981/82 1982/83 1983/84 Age
1 169335 260391 267055 326300 1093479 1305443 595077 1662742 21843 2 144826 102630 155401 159769 197891 663069 791656 342669 1005467 3 108355 84156 59875 74309 94668 115895 289149 359596 78100 4 107044 58966 24734 31151 44184 45542 63416 155144 33650 5 125298 60523 10282 12615 18746 20931 22919 22196 12664 6 63820 73158 10067 5205 7621 10533 7655 9890 3089 7 403% 36345 17368 5427 3150 4448 4127 2655 2909 8 30694 23182 4607 10210 3285 1797 1766 1774 381
+ gP 83200 31486 3071 10211 1315 1198 1766 970 190
Totalnum 872969 730839 552461 635196 1464338 2168855 1777531 2557638 1350293 Totalbio 289449 176537 78622 84105 101076 170215 255525 225779 136397 Totspbio 182088 37732 39739 47755 41244 56352 99169 23319 19328
Note: TOTALBIO-total slock biomas (TSB) in tonnes TOTSPBIO-spawning Mock biomass (SSB) in tonnes TOTALNUM-total stock in numbers (TSN)
S 2.5
or 5? 1.5
0.5
-t
- \ ''i
\ \ 4-
* * I \ /* \ *•
i 1 1 i i—i * 1 1 1 1 1
75/76 77/78 79/80 81/B2 83/84 8S/86 87/88 89/90 91/92 Season
" R e c r u i t s n u m b e r • • • • • •Tota l s tock b i o m a s s
Fig. 8. Total stock biomass (TSB) and recruitment (et age 1) changes in 1975/76-1991/92 fishing seasons.
The plot of relationship between spawning stock biomass and recruitment in numbers (Fig. 9) indicates a greater probability of appearance of less abundant year-classes when SBB falls below 20,000 tonnes. However, with the stock fluctuating between 20,000 and 60,000 tonnes both poor and rich year-classes may be produced.

Mackerel icefish from South Georgia area 425
T a b l e X
of year) and overall stock weight (TSB and SSB).
1984/85 1985/86 1986/87 1987/88 1988/89 1989/90 1990/91 1991/92 1992/93
942680 1127613 259303 255581 127823 116235 197172 116235 116235 126218 571644 665535 148561 132783 56039 51079 119523 70500 109051 70198 322004 132230 37590 34111 23595 30912 72480 23095 18275 20812 26647 19213 8294 8059 14249 18742
7564 11205 8453 4262 7260 2346 3628 4867 8640 4276 4468 6238 3691 1681 2210 883 2198 2951 1301 2354 2086 3301 1934 635 1023 535 1333 1383 669 1150 961 813 600 164 620 324 415 368 230 160 271 150 164 620 376
1215983 1806794 1285811 575393 329368 220621 285766 289759 291581 65480 104336 124007 71556 44268 24587 20959 27332 34818 17036 30736 17513 14925 9078 7396 9951 20227 29673
1800
1600
1O)0
K< 1200
g 1000
I 800 3 C
w 600 3 & 400 or
200
0 10 20 30 40 50 60 70 80 90 10C Spawning stock biomass (000' tonnnes)
Fig. 9. Stock-recruitment relationship.
Catch projections
The estimated stock size in terms of number in 1990/91 and 1991/92 depends to a large extent on selection factors for age groups 1 and 2 in the terminal year resulting from the tuning procedure. Since the actual recruitment numbers of age group 1 in 1991/92 (610,911 millions) obtained from VPA were considerably higher than those estimated for a few preceding years it was decided, for the

426 Józef Sosiński and Andrzej Paciorkowski
purpose of catch prediction, to replace it with the least abundant year-class 1989/90 of 116,235 millions of specimens. The reason for adopting such conservative recruitment numbers was to avoid too optimistic stock estimates not being sufficiently supported by survey results and particularly to eliminate the effect of over-optimistic assumptions on the recommended catch levels and the stock biomass in the next year. To prepare catch projections for 1992/93 and to calculate their consequences for the stock biomass at the beginning of the split year 1993/94 two recruitment options of age group 1 were assumed: — a pessimistic one accepting recruitment of 116,235 millions of specimens as already explained (Tab. Xl , recruitment option 1), — a more optimistic one based on a long-term average recruitment of 264,000 millions from 1975/76—1990/91 period, excluding abundant year-classes exceeding 800,000 millions of specimens (Tab. XI, recruitment option 2).
To calculate predicted catches 4 levels of F (referred to the most heavily exploited in the recent years age groups 2—4) were assumed: — the same as in the last year before moratorium (1989/90), — at the level of F 0 1 as estimated with Thompson and Bell method, — at the level of F 0 1 as calculated with Beverton and Holt model, — F resulting in no change of SSB between July 1992 and July 1993 (Tab. XI). The predicted catches for recruitment option 1 range from 4,782 tonnes to 10,524 tonnes. For recruitment option 2 the predicted catches are at somewhat higher level between 9,828 and 12,638 tonnes (Tab. XI). The differences between both adopted F 0 1 reference levels in terms of catch in either recruitment option do not exceed 2,000 tonnes. Perhaps the most important conclusion to be drawn from these calculations is that should the recruitment to the stock be as poor as assumed in the option 1 then both TSB and SSB would
T a b l e X l
Projected catches of mackerel icefish in 1992/93 season.
July 1992 1992/93 July 1993
Recruitment TSB SSB Basis F B A R 2 - 4 Catch TSB SSB option (tonnes) (tonnes) (tonnes) (tonnes)
1 34818 29673 F B A R 89/90 0.545 10524 25126 22421 F (0.1)* 0.486 9615 26270 23553
F (0.1)** 0.400 8205 28055 25320 F (const .SSB) 0.215 4782 32445 29673
2 45304 33319 F B A R 89/90 0.545 12638 38644 32500 F (0.1)* 0.486 11536 40118 33946
F (0.1)** 0.400 9828 42414 36202 F (const.SSB) 0.499 11783 39787 33619
Note: Recruitment option 1 = recr. no. at age 1 = 116,235,000; Recruitment option 2 = recr. no. at age 1 = 264,000,000;
* F (0.1) calculated with Thompson and Bell method ( = 0.486); ** F (0.1) calculated with Beverton and Holt Y/R model ( = 0.400) assuming age at first capture = 2;

Mackerel icefish from South Georgia area 427
decrease in July 1993 unless the mean F is diminished to below 50% of F ^ j . If the second recruitment option is adopted then practically in all cases SSB in July 1993 remains at the same level as July 1992 or shightly increases. However even in that recruitment option the total stock biomass would decline. Overall consequences of adoption of different F levels for TSB and catch changes are easily visible from the plot in Fig. 10.
50
45 -
< 40 o
ot 35 s
t 25
8) i/i 0 » <*> 15 cn
20
T3 ai 5 >
" - C Ł - C L ,
-•
0.00 0.10 0.20 0.30 0.40 0.50 0.60 0.70 Averoge fishing mortality (ages 2-4)
• YieldlOpt.D —+—SSB(OpM) ••••*•••• Yield (Opt.2) — a- SSB(0pt.2)
Fig. 10. Short term yield and spawning b iomass .
Discussion
This work was aimed at achieving two goals; firstly to present results of 15 years of Polish investigations on the biology of mackerel icefish of the South Georgia stock with particular emphasis on length and age structure changes and secondly using the collected data with support of some vital biological information from literature to attempt to relate these findings with the fishery intensity and the stock biomass and recruitment trends. The last but not the least objective was to determine the extent to which a single country biological and fisheries data may be used to reflect the current stock state and serve as a secondary guidance for its short term predictions.
Limited value of a single country data compared to pooled information furnished to CCAMLR Fish Stock Assessment Working Group (WG-FSA) especially refers to length and age composition. The former being effected by differences in fishing gears used as well as in fishing power of various vessel

428 Józef Sosiński and Andrzej Paciorkowski
types involved, fishing ground chosen, depth of fishing and its timing within the season. Deficiency of the latter stems too from differences in intepretation of otoliths growth zones habitually followed by age readers of each country (Frolkina and Dorovskikh 1990). In case of mackerel icefish it is coupled with additional interpretation difficulties posed by less pronounced seasonality of the Southern Ocean. Differences in ageing by various authors and their influence on L^f were discussed by Kock, Duhamel and Hureau (1985). Discrepancies between Polish and Soviet icefish catch age compositions were noted by Kock (1991). Their influence on other important biological parameters of the stock, e.g. coefficients K and t 0 of von Bertalanffy growth equation obtained by various authors may be seen in Tab. III.
In spite of many above mentioned reservations as well as application of the unstandarized Polish CPUE data in the VPA tuning procedure — the resulting estimates of the fishing mortality, the optimum fishing mortality, the stock biomass and the projected catch level do not depart much from the WG-FSA estimates (Anon. 1991). Years when the total stock biomass reached its maximum and minimum match exactly. Some differences concern, however, the absolute value of the biomass estimates. According to the present estimate the maximum stock biomass in 1976/77—1990/91 (the period considered by the Working Group) amounted to 225,779 tonnes (age group 1 and older) while according to the WG-FSA estimate the stock biomass peaked at 180,000 tonnes. The successive biomass peak in 1986/87 resulting from the present estimate reached only 124,007 tonnes while the WG-FSA biomass estimate was higher and reached 140,000—160,000 tonnes depending on abundance indices used for tuning. Also the declining trend of the stock biomass in 1986/87 — 1990/91 period in both cases is similar, however, according to the WG-FSA VPA option tuned with commercial CPUE data the biomass decreased in the terminal year to only 15,000 tonnes while according to the present estimate it declined to 20,959 tonnes.
A similar convergence refers to estimate of F 0 1 and the projected catches in the year following the terminal year. The WG-FSA F estimates which assumed knife edge selection at t c = 2 range from 0.39, for the adopted M level of 0.48, to 0.44 for M assumption of 0.56 (Anon. 1991). According to the present estimate adopting the same value of t c = 2 and assuming M = 0.50, the value of F 0 1 equals 0.40. The resulting projected catch at similar age 1 recruitment levels (289,863 millions in the WG-FSA option and 264,000 millions adopted in the present option) totals 9,672 tonnes according to the WG-FSA calculations and 9,828 tonnes according to the present estimate.
Comparison of the present assessment with that carried out by the WG-FSA allows to conclude that in some cases data originated from a single country participating in a fishery can become a reliable basis of a stock assessment and result in a similar management advice.

Mackerel icefish from South Georgia area 429
Acknowledgments. The authors wish to extend their thanks to dr J. H o r b o w y for his critical review of the manuscript and useful suggestions, and to dr R. Grzebielec for his assistance in making use of M A F F V P A and C C A M L R Y R programs.
References
Anon. , 1989. Rap. ICES W G on methods o f f i s h stock assessment. — C M 1990/Assess . 15. A n o n , 1990. Stat. Bull. — C C A M L R , Vol . 1. A n o n , 1991. Report of the Tenth Meet ing of the Scientific Committee . — S C - C C A M L R - X ,
Hobart; 2 2 9 - 2 4 1 . A n o n , 1993. Stat. Bull. — C C A M L R , Vol . 5. B E V E R T O N R.J.H. and H O L T S.J., 1957. O n the dynamics of exploited fish populat ions . U K
Min. Agric. Fish. Fish Invest. (Ser. 2), 19: 1 - 5 3 3 . F R O L K I N A G A . and D O R O V S K I K H R . S , 1989. On assessment of the Bertalanffy growth
equation parameters and instantaneous natural mortality rate o f South Georg ia mackerel icefish. S C - C A M L R , Selected Scientific Papers (SSP); 2 9 - 3 6 .
F R O L K I N A G A . and D O R O V S K I K H R . S , 1990. On the instantaneous natural mortality rate o f Champsocephalus gunnari, South Georgia (Subarea 48.3) . — S C - C A M L R , Selected Scientific Papers (SSP); 3 1 3 - 3 2 6 .
G U L L A N D J A , 1965. Estimation of mortality rates. — A n n e x to Rep . Arctic Fish. Working Group, Int. Counc . Explor. Sea C M . 1965 (3); 9 pp .
K O C K K . - H , 1991. The state of exploited fish stocks in the Southern Ocean (a review). — Arch. Fish. W i s s , Stuttgart, 4 1 , 1: 1 - 6 6 .
K O C K K . - H , D U H A M E L G. and H U R E A U J . C , 1985. Bio logy and status of exploited Antarctic fish stocks: a review. — Biomass Scientific Series N o . 6, Cambridge; 143 pp.
L A U R E C A. and S H E P H E R D J . G , 1983. O n the analysis o f catch and effort data. — J . Cons . int. Explor. M e r , 41: 8 1 - 8 4 .
L I N K O W S K I T. and R E M B I S Z E W S K I J , 1978. Ichthyological observations of the South Georgia coast. — Pol. Arch. H y d r o b i o l , 25, 3: 697 - 704.
M U C H A M . and Ś L Ó S A R C Z Y K W , 1988. Analysis of changes in biomass of fish stocks in the South Georgia area in 1 9 7 6 / 7 7 - 1 9 8 6 / 8 7 . — S C - C A M L R - S S P / 4 , 1987.
POPE J.G. and S H E P H E R D J . G , 1985. A comparison of the performance of various methods of tuning V P A s using effort data. — J. Cons . int. Explor. M e r , 43: 129—151.
R A K U S A - S U S Z C Z E W S K I S , 1978. First Polish Antarctic Marine Expedit ion on R / V "Profesor Siedlecki" and M / T "Tazar" in 1975/76. — Pol. Arch. H y d r o b i o l , 25, 3: 5 0 5 - 5 1 0 .
RICKER W . E , 1985. Computat ion and interpretation of biological statistics o f f i s h populat ions . Bull. Fish. Res. Board of Canada, N o . 191; 382 pp .
SOSIŃSKI J , 1981. Biologia porównawcza kergulen z rejonów Antarktyki . — Studia i Materiały, Wyd. M I R , Gdynia, Ser. B, 48: 91 pp.
SOSIŃSKI J , 1985a. Some data on taxonomy and biology of Antarctic icefish Champsocephalus gunnari Lonnberg, 1905. — Acta Ichth. P i sca t , Szczecin, 15: 3 — 54.
SOSIŃSKI J , 1985b. Polskie rybołówstwo i badania zasobów ryb w Antarktyce. — Bull. Sea Fish. I n s t , Gdynia , 3 - 4 (89 - 90): 57 - 62.
SOSIŃSKI J , 1990. Distribution and state o f f i sh stocks on the shelf of South Georgia in February 1989. Bull. Sea Fish. I n s t , Gdynia , 5 - 6 ( 1 2 1 - 1 2 2 ) : 3 - 1 2 .
SOSIŃSKI J. and K U R A N T Y J , 1979. The Scotia Sea — a n e w fishing area of the Polish sea fisheries. — Technika i Gospodarka Morska , 29, 1 (331): 12—15.
SOSIŃSKI J. and S Z L A K O W S K I J , 1992. Biological characteristics and biomass estimates o f the fish stocks on the South Georgia shelf in the 1 9 8 6 / 8 7 - 1 9 8 8 / 8 9 seasons. Acta Ichth. Piscat , Szczecin, 22: 7 7 - 1 0 5 .

430 Józef Sosiński and Andrzej Paciorkowski
Ś L Ó S A R C Z Y K W., S O S I Ń S K I J., M U C H A M. , S K Ó R A K. and K O M P O W S K I A., 1985. A review of Polish fishery and assessment of fish stock b iomass off South Georgia.
S C - C C A M L R , Selected Scientific Papers 1 9 8 2 - 1 9 8 4 , 1: 3 9 5 - 4 2 2 .
Revised and accepted December 15, 1993
Streszczenie
Jednym z najważniejszych ga tunków wykorzystywanych przez rybo łówstwo w rejonie szelfu Georgii Południowej (Rys . 1) jest kergulena (Champsocephalus gunnari Lonnberg, 1905). Polska uczestniczy w badaniach kerguleny w omawianym rejonie od 1976 r., a polskie rybo łówstwo podjęło tutaj po łowy w styczniu 1977 r. Wysokość polskich p o ł o w ó w kerguleny n a szelfie Georgi i Południowej w sezonach p o ł o w o w y c h 1976/77 d o 1991/92 przedstawia tabela I. Polskie badania biologiczne i p o ł o w o w e (Tab. II) nad stanem z a s o b ó w omawianego stada posłużyły d o podjęcia próby niezależnego oszacowania niektórych jego parametrów biologicznych oraz zmian wielkości jego b iomasy i śmiertelności w sezonach 1976/77 — 1991 /92 , a następnie d o porównania uzyskanych wyników z rezultatami pracy Grupy Robocze j C C A M L R d/s szacowania z a s o b ó w ( W G - F S A ) .
Śmiertelność p o ł o w o w ą , zmiany b iomasy całkowitej stada i b iomasy stada tarłowgo w sezonach 1975/76—1991/92 oszacowano metodą analizy populacji wirtualnej (VPA) . Użyty d o obliczeń rozkład polskich p o ł o w ó w kerguleny pod względem długości i wieku przedstawia rys. 2.
Oszacowane na podstawie dostępnych materiałów biologicznych i wykorzystane d o dalszych obliczeń parametry wzrostu z równania von Bertalanffy'ego (k = 0.1995, t 0 = —0.4573, L i l l f = 61.75 cm) p o r ó w n a n o z ocenami innych autorów (Tab. III). Wykres oszacowanej zależności masa—długość ( W = 0 . 0 0 0 2 1 • L3.3315) użytej d o obliczenia W j n f (2042,0 g) przedstawiono n a rys. 3 . N a podstawie wybranych z literatury, wykonanych różnymi metodami ocen wielkości współczynnika śmiertelności naturalnej (M) przyjęto d o dalszych obliczeń wartość zbliżoną d o średniej (M = 0 , 5 ) (Tab. IV).
D o wyznaczenia wartości F i F m 4 x p r z y założeniu 4 p o z i o m ó w jednol i tego wieku pierwszego odłowu (t c = 1...4) (Tab. V) pos łużono się mode lem produkcji Bevertona i Hol ta . Te same parametry — uwzględniając wynikający z V P A rozkład współczynników selekcji (S) — oszacowano metodą T h o m p s o n a i Bel la (Rys . 4) . M o d e l Bevertona i Ho l ta posłużył również d o wykreślenia izoplet (Rys. 5).
D a n e wejściowe d o V P A przedstawiono w tabeli VIII . Macierz całkowitych p o ł o w ó w kerguleny w grupach wieku obliczoną n a podstawie rozkładów wiekowych polskich p o ł o w ó w — zamieszczono w tab. VII. Zestrajanie V P A przeprowadzono metodą Laureca—Shepherd a oraz metodą hybrydową przyjmując jako wskaźniki liczebności polskie p o ł o w y i polski nakład p o ł o w o w y (flota 1) oraz szacunki b iomasy (flota 2), uzyskane metodą przetrałowanej powierzchni (Tab. II). Wybrano opcję programu opierającą się n a z logarytmowanych współczynnikach łowności (q). Startową wartość q oszacowano z uwzględnieniem trendu występującego w oszacowanych wartościach q „floty 1", c o przedstawiono n a rys. 6. Uzyskane z procedury zestrajania współczynniki S igma (int.) były na ogó ł na dopuszczalnym poziomie lub tylko nieco g o przewyższały (Tab. VIII).
Oszacowane metodą V P A zmiany śmiertelności p o ł o w o w y c h w grupach wieku przedstawiono w tab. IX i n a rys. 7. Wyniki V P A wskazują, że całkowita b iomasa stada (TSB) w ostatnim rozpatrywanym sezonie 1991/92 wynosi ła 34,818 ton i była w przybliżeniu 10-krotnie niższa niż w sezonie 1975/76 (Tab. X, Rys . 5). B iomasa stada tarłowego (SSB) spadła d o minimalnego poz iomu 7,396 ton w sezonie 1989/90. P o 2-letnim okresie przerwy w po łowach w ostatnich 2 sezonach obie biomasy wzrosły d o p o z i o m u oko ło 30,000 ton. Wykres zależności pomiędzy wielkością stada tarłowego a l iczebnością rekrutacji (Rys. 9) wskazuje, że przy aktualnym poz iomie biomasy stada istnieje prawdopodobieńs two pojawiania się roczników zarówno o małej, jak i wysokiej liczebności.

Mackerel icefish from South Georgia area 4 3 1
Wysokość przewidywanych p o ł o w ó w w sezonie 1992/93 oraz wynikających stąd p o z i o m ó w biomasy na początku sezonu 1993/94 (lipiec 1993 r.) obl iczono przyjmując d w a założenia co d o wysokości uzupełnienia stada przez ryby z 1 grupy wieku w sezonach 1991/92 i 1992/93:
1) na niższym poziomie — po 116,235 mi l ionów ryb (Tab. XI , opcja 1), 2) n a poziomie średniej rekrutacji w sezonach 1975/76 — 1990/91, wynoszącej 264 mil iony ryb,
z pominięciem pokoleń o liczebności przekraczającej 600 mi l ionów o s o b n i k ó w (Tab. X I , opcja 2). D l a każdej opcji uzupełnienia przyjęło 4 arbitralnie dobrane p o z i o m y intensywności p o ł o w ó w
w sezonie 1992/93 (Tab. X l ) . Uzyskane wyniki wskazują na decydujący wpływ wielkości uzupełnienia na dalsze kształ
towanie się zmian biomasy stada. Jeśli pierwsza opcja rekrutacji jest prawdziwa, to w celu utrzymania takiej samej biomasy stada tarłowego (TSB) w lipcu 1993, jaka istniała w lipcu 1992 wysokość F w sezonie 1992/93 należałoby zmniejszyć w przybliżeniu o 5 0 % w stosunku d o któregokolwiek z dwóch p o z i o m ó w F (Tab. XI) . Po łów wyniósłby w ów czas tylko 4,872 tony. Jeśli prawdziwa jest druga opcja uzupełnienia, to dla utrzymania TSB na nie zmienionym poziomie F nie powinna przekraczać poz iomu F oszacowanego metodą T h o m p s o n a i Bel la (Tab. X I ) . Po łów wyniósłby wówczas 11,783 tony. Całość oszacowanych zmian T S B i wielkości p o ł o w ó w w funkcji śmiertelności po łowowej przedstawiono na rys. 10.
Z porównania przeprowadzonej oceny z szacunkiem d o k o n a n y m przez W G - F S A wynika, że p o m i m o zastosowania w niniejszej pracy danych biologicznych i p o ł o w o w y c h pochodzących z jednego tylko państwa uczestniczącego w po łowach uzyskane rezultaty dotyczące stanu stada są zbieżne i prowadzą d o podobnych wniosków w zakresie regulacji p o ł o w ó w .