Embed Size (px)
Citation preview
State of Mississippi Retirement Systems
Experience Investigation for the
Four-Year Period
Ending June 30, 2016

April 18, 2017
The Board of Trustees
Public Employees’ Retirement System of Mississippi
429 Mississippi Street
Jackson, MS 39201
Members of the Board:
We are pleased to submit the results of an investigation of the economic and demographic
experience for the Public Employees’ Retirement System (PERS), the Highway Safety Patrol
Retirement System (HSPRS), the Supplemental Legislative Retirement Plan (SLRP) and the
Municipal Retirement Systems (MRS) for the four-year period from July 1, 2012 to June 30, 2016.
The study was based on the data submitted by PERS for the annual valuation. In preparing this
report, we relied, without audit, on the data provided.
The purpose of the investigation was to assess the reasonability of the PERS economic
assumptions and demographic actuarial assumptions for each Retirement System. As a result of
the investigation, it is recommended that revised economic assumptions and demographic tables
be adopted by the Board for future use.
All recommended rates of separation, mortality and salary increase at each age for each division
are shown in the attached tables in Appendix D of this report. In the actuary’s judgment, the rates
recommended are suitable for use until further experience indicates that modifications are
desirable.
We hereby certify that, to the best of our knowledge and belief, this report is complete and accurate
and has been prepared in accordance with generally recognized and accepted actuarial principles
and practices which are consistent with the principles prescribed by the Actuarial Standards Board
(ASB) and the Code of Professional Conduct and Qualification Standards for Public Statements
of Actuarial Opinion of the American Academy of Actuaries.
We further certify that, in our opinion, the assumptions developed in this report satisfy Actuarial
Standards of Practice, in particular, No. 27 (Selection of Economic Assumptions for Measuring
Pension Obligations) and No. 35 (Selection of Demographic and Other Non-economic
Assumptions for Measuring Pension Obligations).
Off
Cavanaugh Macdonald CC OO NN SS UU LL TT II NN GG,, LL LL CC
The experience and dedication you deserve
3550 Busbee Pkwy, Suite 250, Kennesaw, GA 30144 Phone (678) 388-1700 • Fax (678) 388-1730
www.CavMacConsulting.com Offices in Englewood, CO • Kennesaw, GA • Bellevue, NE

April 18, 2017
Board of Trustees
Page 2
The experience investigation was performed by, and under the supervision of, independent
actuaries who are members of the American Academy of Actuaries with experience in performing
valuations for public retirement systems. The undersigned meet the Qualification Standards of the
American Academy of Actuaries to render the actuarial opinion contained herein.
Respectfully submitted,
Edward A. Macdonald, ASA, FCA, MAAA Edward J. Koebel, EA, FCA, MAAA
President Principal and Consulting Actuary
Jonathan T. Craven, ASA, EA, FCA, MAAA
Consulting Actuary
EAM/EJK/JTC:kc
S:/2016/Mississippi PERS/EXP STUDY 2012-2016/Mississippi PERS Experience Investigation Report 2016_Linked.docx
Table of Contents
PERS State of Mississippi Retirement Systems
Experience Invest igat ion for the Four-Year Period Ending June 30, 2016
Section Page
I Executive Summary 1
II Economic Assumptions 8
III Actuarial Methods 23
IV PERS Demographic Assumptions 27
Rates of Withdrawal 28
Rates of Pre-Retirement Mortality 32
Rates of Disability Retirement 35
Rates of Retirement 38
Rates of Post-Retirement Mortality 45
Rates of Salary Increase 51
Other Assumptions 53
V HSPRS Summary of Results 55
VI SLRP Summary of Results 56
VII MRS Summary of Results 57
Appendix
A Historical June CPI(U) Index 58
B Capital Market Assumptions and Asset Allocation 59
C Social Security Administration Wage Index 60
D Recommended Rates 61
Section I - Executive Summary
Mississippi Public Employees’ Retirement Systems
Experience Invest igat ion for the Four-Year Period Ending June 30, 2016
1
The purpose of an actuarial valuation is to provide a timely best estimate of the ultimate costs of a
retirement system. Actuarial valuations of the Mississippi Public Employees’ Retirement System
(PERS), the Mississippi Highway Safety Patrol Retirement System (HSPRS), the Mississippi
Supplemental Legislative Retirement Plan (SLRP) and the Mississippi Municipal Retirement
System (MRS) are prepared annually to determine the actuarial contribution rate required to fund
them on an actuarial reserve basis, (i.e. the current assets plus future contributions, along with
investment earnings will be sufficient to provide the benefits promised by the system). The
valuation requires the use of certain assumptions with respect to the occurrence of future events,
such as rates of death, termination of employment, retirement age, and salary changes to estimate
the obligations of the system.
The basic purpose of an experience study is to determine whether the actuarial assumptions
currently in use have adequately anticipated the actual emerging experience. This information,
along with the professional judgment of system personnel and advisors, is used to evaluate the
appropriateness of continued use of the current actuarial assumptions. When analyzing experience
and assumptions, it is important to recognize that actual experience is reported in the short term
while assumptions are intended to be long-term estimates of experience. Therefore, actual
experience is expected to vary from study period to study period, without necessarily indicating a
change in assumptions is needed.
Cavanaugh Macdonald Consulting, LLC (CMC) has performed a study of the experience of each
of the Plans under the PERS’ Board of Trustees purview for the four-year period ending
June 30, 2016. This report presents the results, analysis, and resulting recommendations of our
study. It is anticipated that the changes, if approved, will first be reflected in the June 30, 2017
actuarial valuations.
These assumptions have been developed in accordance with generally recognized and accepted
actuarial principles and practices that are consistent with the applicable Actuarial Standards of
Practice adopted by the Actuarial Standards Board (ASB). While the recommended assumptions
represent our best estimate of future experience, there are other reasonable assumption sets that
could be supported by the results of this experience study. Those other sets of reasonable
assumptions could produce liabilities and costs that are either higher or lower.
Our Philosophy
Similar to an actuarial valuation, the calculation of actual and expected experience is a fairly
mechanical process, and differences between actuaries in this area are generally minor. However,
the setting of assumptions differs, as it is more art than science. In this report, we have
Section I - Executive Summary
Mississippi Public Employees’ Retirement Systems
Experience Invest igat ion for the Four-Year Period Ending June 30, 2016
2
recommended changes to certain assumptions. To explain our thought process, we offer a brief
summary of our philosophy:
Do Not Overreact: When we see significant changes in experience, we generally do
not adjust our rates to reflect the entire difference. We will typically recommend rates
somewhere between the old rates and the new experience. If the experience during the
next study period shows the same result, we will probably recognize the trend at that
point in time or at least move further in the direction of the observed experience. On
the other hand, if experience returns closer to its prior level, we will not have
overreacted, possibly causing volatility in the actuarial contribution rates.
Anticipate Trends: If there is an identified trend that is expected to continue, we
believe that this should be recognized. An example is the retiree mortality assumption.
It is an established trend that people are living longer. Therefore, we believe the best
estimate of liabilities in the valuation should reflect the expected increase in life
expectancy.
Simplify: In general, we attempt to identify which factors are significant and eliminate
or ignore the ones that do not materially improve the accuracy of the liability
projections.
The following summarizes the findings and recommendations with regard to the assumptions
utilized for PERS. Detailed explanations for the recommendations are found in the sections that
follow.
Recommended Economic Assumption Changes
Economic assumptions are some of the most visible and significant assumptions used in the
valuation process. The items in the broad economy modeled by these assumptions can be very
volatile over short periods of time, as clearly seen in the economic downturn in 2008 followed by
the rebound in many financial markets in the years following. Our goal is to try to find the
emerging long-term trends in the midst of this volatility so that we can then apply reasonable
assumptions.
Most of the economic assumptions used by actuaries are developed through a building-block
approach. For example, the expected return on assets is based on the expectation for inflation plus
the expected real return on assets. At the core of the economic assumptions is the inflation
assumption. As we discuss later in the report, based on recent trends of inflation, the market
pricing of inflation, and the Chief Actuary of the Social Security Administration’s view of

Section I - Executive Summary
Mississippi Public Employees’ Retirement Systems
Experience Invest igat ion for the Four-Year Period Ending June 30, 2016
3
inflation, we are recommending a continuation of the price inflation assumption of 3.00%.
While some might argue that inflation may be lower in the future, we believe this approach is
consistent with our desire to avoid overreacting. The Board lowered the price inflation in 2015
from 3.50% to 3.00% and we feel it is not necessary for another change so quickly.
We are also recommending that the long-term expected return on assets assumption continue
at its current rate of 7.75%, reflecting the 3.00% inflation assumption. This will be discussed in
detail later in this report, but the real rate of return of 4.75% is supported by the forecasting models
developed using 35 sets of capital market assumptions included in the Horizon Actuarial Services,
LLC. Survey conducted in 2016 and the Board’s target asset allocation.
However, we are recommending that the general wage inflation (payroll growth) assumption
be decreased from 3.75% to 3.25%, reflecting historical data that shows PERS continues to
experience salary gains on the salary assumption and that the real wage growth in Mississippi has
not kept up with the current assumption.
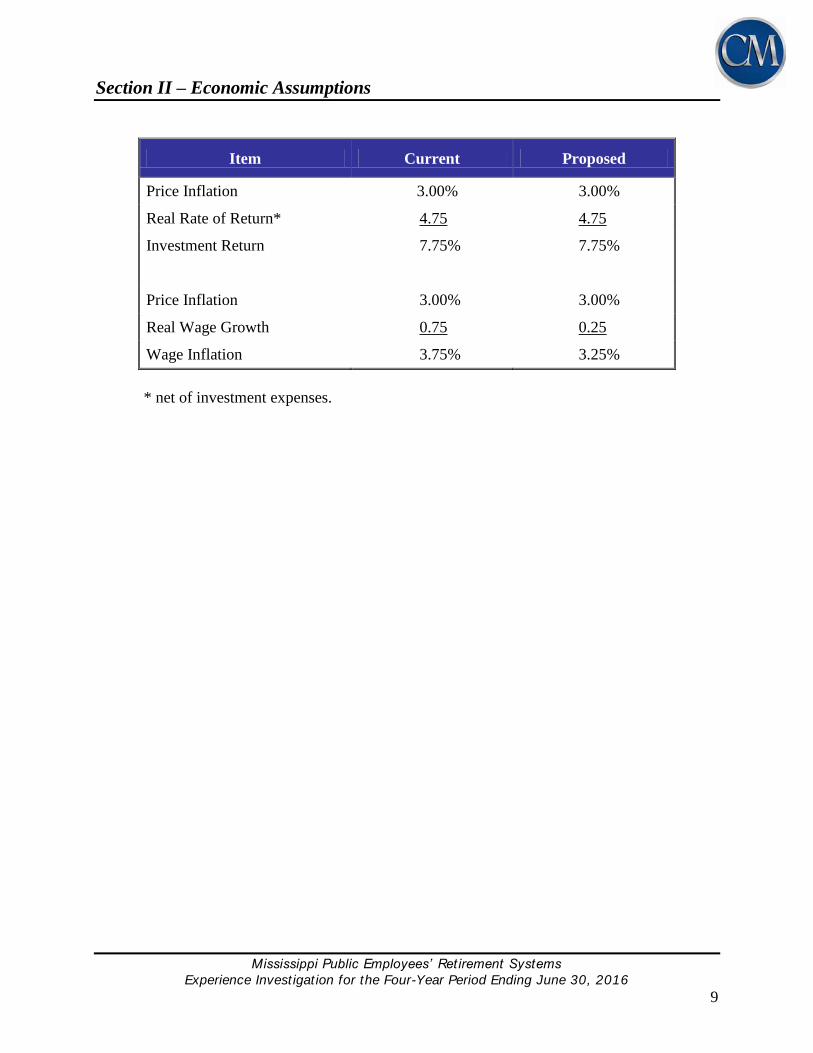
The following table summarizes the current and proposed economic assumptions:
Item Current Proposed
Price Inflation 3.00% 3.00%
Investment Return* 7.75% 7.75%
General Wage Inflation 3.75% 3.25%
* Net of investment expenses only.
Although we have recommended a change in the set of economic assumptions, we recognize there
may be other sets of economic assumptions that are also reasonable for purposes of funding PERS.
For example, we have typically reflected conservatism to the degree we would classify as
moderate. Actuarial Standards of Practice allow for this difference in approaches and perspective,
as long, as the assumptions are reasonable and consistent.

Section I - Executive Summary
Mississippi Public Employees’ Retirement Systems
Experience Invest igat ion for the Four-Year Period Ending June 30, 2016
4
Recommended Demographic Assumption Changes
In the experience study, actual experience for the study period is compared to that expected based
on the current actuarial assumption. The analysis is most commonly performed based on counts,
i.e. each member is one exposure as to the probability of the event occurring and one occurrence
if the event actually occurs. Comparing the actual incidence of the event to what was expected
(called the Actual-to-Expected ratio, or A/E ratio) then provides the basis for our analysis.
The issue of future mortality improvement is one that the actuarial profession has become
increasingly focused on studying in recent years. This has resulted in changes to the relevant
Actuarial Standard of Practice, ASOP 35, Selection of Demographic and Other Noneconomic
Assumptions for Measuring Pension Obligations. This ASOP requires the pension actuary to make
and disclose a specific recommendation with respect to future improvements in mortality after the
valuation date. There have been significant improvements in longevity in the past, although there
are different opinions about future expectations. We believe it is prudent to anticipate that the
trend will continue to some degree in the future. Therefore, we believe it is appropriate to reflect
some future mortality improvement as part of the mortality assumption.
There are two widely used approaches for reflecting future improvements in mortality:
(1) Static table with “margin”
(2) Generational mortality
The first approach to reflecting mortality improvements is through the use of a static mortality
table with “margin.” Under this approach, the A/E ratio is intentionally targeted to be over 100%
so that mortality can improve without creating actuarial losses. While there is no formal guidance
for the amount of margin required (how far above 100% is appropriate for the A/E ratio), we
typically prefer to have a margin of around 10 to 14% at the core retirement ages. The goal is still
for the general shape of the curve to be a reasonable fit to the observed experience. Depending on
the magnitude and duration of actual mortality improvements in the future, the margin may
decrease and eventually become insufficient. If and when that occurs, the assumption would need
to be updated.
Another approach, referred to as generational mortality, directly anticipates future improvements
in mortality by using a different set of mortality rates for each year of birth, with the rates for later
years of birth assuming lower mortality than the rates for earlier years of birth. The varying
mortality rates by year of birth create a series of tables that contain “built-in” mortality
improvements, e.g., a member who turns age 65 in 2035 has a longer life expectancy than a
member who turns age 65 in 2020. When using generational mortality, the A/E ratios for the
Section I - Executive Summary
Mississippi Public Employees’ Retirement Systems
Experience Invest igat ion for the Four-Year Period Ending June 30, 2016
5
observed experience are set near 100% as future mortality improvements will be taken into account
directly in the actuarial valuation process.
The current post-retirement healthy mortality assumption for PERS, which we changed in the 2014
experience study, is the RP-2014 Healthy Annuitant Blue Collar Mortality Table, projected with
Scale BB to 2016, with a one year age set-forward for males. This is a static mortality table with
margin. The results of the experience analysis indicate that this table provides a reasonable margin
for future mortality improvements. In fact, the PERS plan experienced a very small gain due to
post-retirement mortality for the 2016 valuation. So, therefore, we are only recommending a
slight adjustment to the current mortality table to accommodate a reasonable margin going
forward.
The following is a list of other recommended changes to the demographic assumptions for PERS.
Retirement: Increased rates of retirement at younger ages once a member reaches
25 years of service. Minor adjustments at other ages to better match experience.
Disability: Lowered rates of disability for most ages except between the ages of 60
and 64.
Withdrawal: Increased rates of withdrawal at all ages, especially the younger ages
and during select period (below 2 years of service).
Merit Salary Scale: No change in merit salary scale.
Section IV of this report will provide more detail to these recommended changes. Sections V-VII
will provide a summary of the recommended changes for each of the other three Systems.
Actuarial Methods
The basic actuarial methodologies used in the valuation process include the:
Actuarial Cost Method
Asset Valuation Method
Amortization Method
Based on our review, discussed in full detail in Section III of this report, we recommend no
changes in these actuarial methods but do recommend the Board adjust their funding policy
to develop an amortization method in order to determine a contribution metric to the fixed
contribution rates for each System.

Section I - Executive Summary
Mississippi Public Employees’ Retirement Systems
Experience Invest igat ion for the Four-Year Period Ending June 30, 2016
6
Other Assumptions
Another assumption that is included in the pension valuations is the determination of
administrative expense component that is added to the total normal cost each year. The current
assumption is 0.23% of payroll. After reviewing the total amount of administrative expenses for
the past four years and the percentage of payroll, we are recommending no change in this
assumption.
Financial Impact
The following tables highlight the impact of the recommended changes on the unfunded accrued
liabilities (UAL), funding ratios, amortization period and projected funding ratios for each System.
Change in 2016 Valuation Unfunded Accrued Liability
($ in Thousands)
System Before All
Changes
After
Demographic
Changes Only
After All
Changes
PERS $ 16,812,435 $17,069,969 $16,816,332
HSPRS 169,207 171,882 169,034
SLRP 4,812 5,083 4,946
MRS 171,532 172,543 172,519
Change in 2016 Valuation Funding Ratio
System Before All
Changes
After
Demographic
Changes Only
After All
Changes
PERS 60.0% 59.6% 60.0%
HSPRS 65.8% 65.4% 65.8%
SLRP 77.4% 76.4% 76.9%
MRS 48.1% 48.0% 48.0%

Section I - Executive Summary
Mississippi Public Employees’ Retirement Systems
Experience Invest igat ion for the Four-Year Period Ending June 30, 2016
7
Change in 2016 Valuation UAL Amortization Period*
System Before All
Changes
After
Demographic
Changes Only
After All
Changes
PERS 36.6 36.9 39.1
HSPRS 42.9 40.9 39.8
SLRP 22.6 27.7 25.9
* Statutory contribution rates kept constant.
Change in Projected Funding Ratio in 2042
System Before All
Changes
After
Demographic
Changes Only
After All
Changes
PERS 62.6% 59.7% 56.7%
HSPRS 51.6% 50.1% 50.2%
SLRP 92.3% 79.8% 82.0%
Section II – Economic Assumptions
Mississippi Public Employees’ Retirement Systems
Experience Invest igat ion for the Four-Year Period Ending June 30, 2016
8
There are three economic assumptions used in the actuarial valuations performed for PERS. The
same assumptions are used in all four valuations. They are:
Price Inflation
Investment Return
Wage Inflation
Note that future price inflation has an indirect impact on the results of the actuarial valuation
through the development of the assumptions for investment return and wage inflation. However,
it is not directly used in the valuation process.
Actuarial Standard of Practice (ASOP) No. 27, “Selection of Economic Assumptions for
Measuring Pension Obligations” provides guidance to actuaries in selecting economic
assumptions for measuring obligations under defined benefit plans. ASOP No. 27 was revised in
September, 2013 and no longer includes the concept of a “best estimate range”. Instead, the
revised standard now requires that each economic assumption selected by the actuary should be
reasonable which means it has the following characteristics:
It is appropriate for the purpose of the measurement;
It reflects the actuary’s professional judgment;
It takes into account historical and current economic data that is relevant as of the
measurement date;
It reflects the actuary’s estimate of future experience, the actuary’s observation of the
estimates inherent in market data, or a combination thereof; and
It has no significant bias (i.e., it is not significantly optimistic or pessimistic), except when
provisions for adverse deviation or plan provisions that are difficult to measure are included
and disclosed, or when alternative assumptions are used for the assessment of risk.
Each economic assumption should individually satisfy this standard. Furthermore, with respect to
any particular valuation, each economic assumption should be consistent with every other
economic assumption over the measurement period.
In our opinion, the economic assumptions recommended in this report have been developed in
accordance with ASOP No. 27. The following table shows our recommendations followed by
detailed discussions of each assumption.
Section II – Economic Assumptions
Mississippi Public Employees’ Retirement Systems
Experience Invest igat ion for the Four-Year Period Ending June 30, 2016
9
Item Current Proposed
Price Inflation 3.00% 3.00%
Real Rate of Return* 4.75 4.75
Investment Return 7.75% 7.75%
Price Inflation 3.00% 3.00%
Real Wage Growth 0.75 0.25
Wage Inflation 3.75% 3.25%
* net of investment expenses.
Section II – Economic Assumptions
Mississippi Public Employees’ Retirement Systems
Experience Invest igat ion for the Four-Year Period Ending June 30, 2016
10
Price Inflation
Background
As can be seen from the table on the previous page, assumed price inflation is used as the basis for
both the investment return assumption and the wage inflation assumption. These latter two
assumptions will be discussed in detail in the following sections.
It is important that the price inflation assumption be consistently applied throughout the economic
assumptions utilized in an actuarial valuation. This is called for in ASOP No. 27 and is also
required to meet the parameters for determining pension liabilities and expense under
Governmental Accounting Standards Board (GASB) Statements No. 67 and 68.
The long-term relationship between price inflation and investment return has long been recognized
by economists. The basic principle is that the investor demands a more or less level “real return”
– the excess of actual investment return over price inflation. If inflation rates are expected to be
high, investment return rates are also expected to be high, while low inflation rates are expected
to result in lower expected investment returns, at least in the long run.
The current price inflation assumption is 3.00% per year.
Past Experience
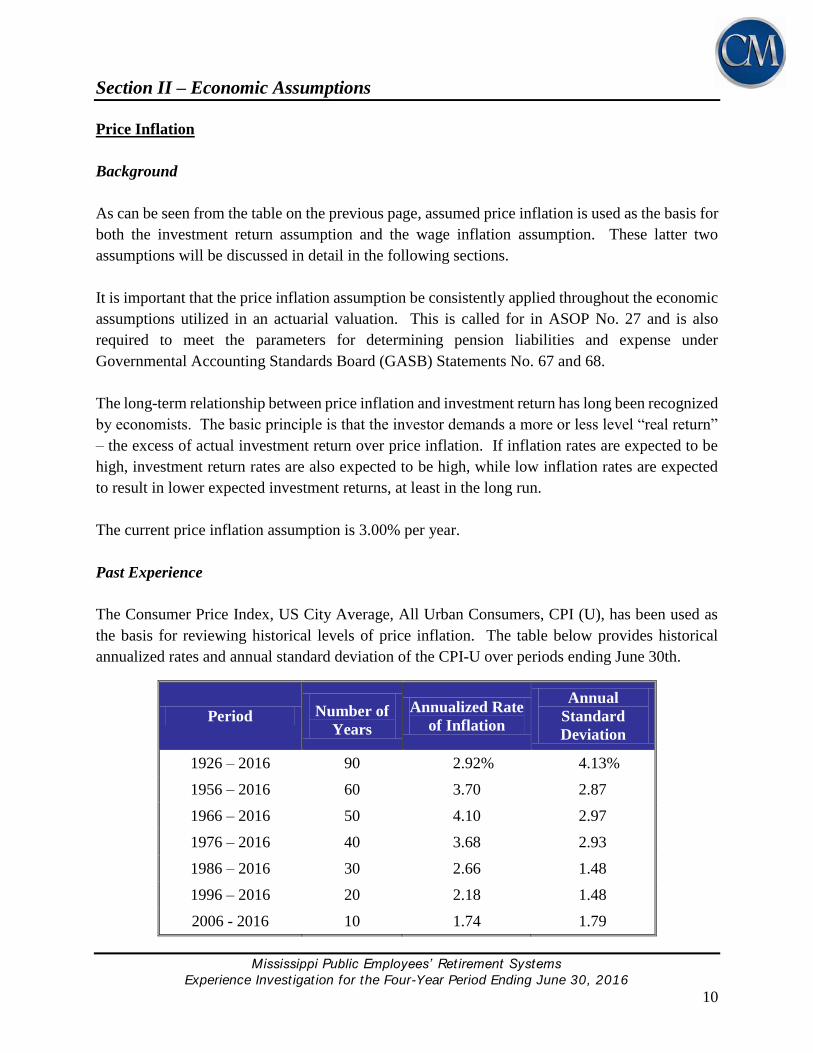
The Consumer Price Index, US City Average, All Urban Consumers, CPI (U), has been used as
the basis for reviewing historical levels of price inflation. The table below provides historical
annualized rates and annual standard deviation of the CPI-U over periods ending June 30th.
Period Number of
Years
Annualized Rate
of Inflation
Annual
Standard
Deviation
1926 – 2016 90 2.92% 4.13%
1956 – 2016 60 3.70 2.87
1966 – 2016 50 4.10 2.97
1976 – 2016 40 3.68 2.93
1986 – 2016 30 2.66 1.48
1996 – 2016 20 2.18 1.48
2006 - 2016 10 1.74 1.79
Section II – Economic Assumptions
Mississippi Public Employees’ Retirement Systems
Experience Invest igat ion for the Four-Year Period Ending June 30, 2016
11
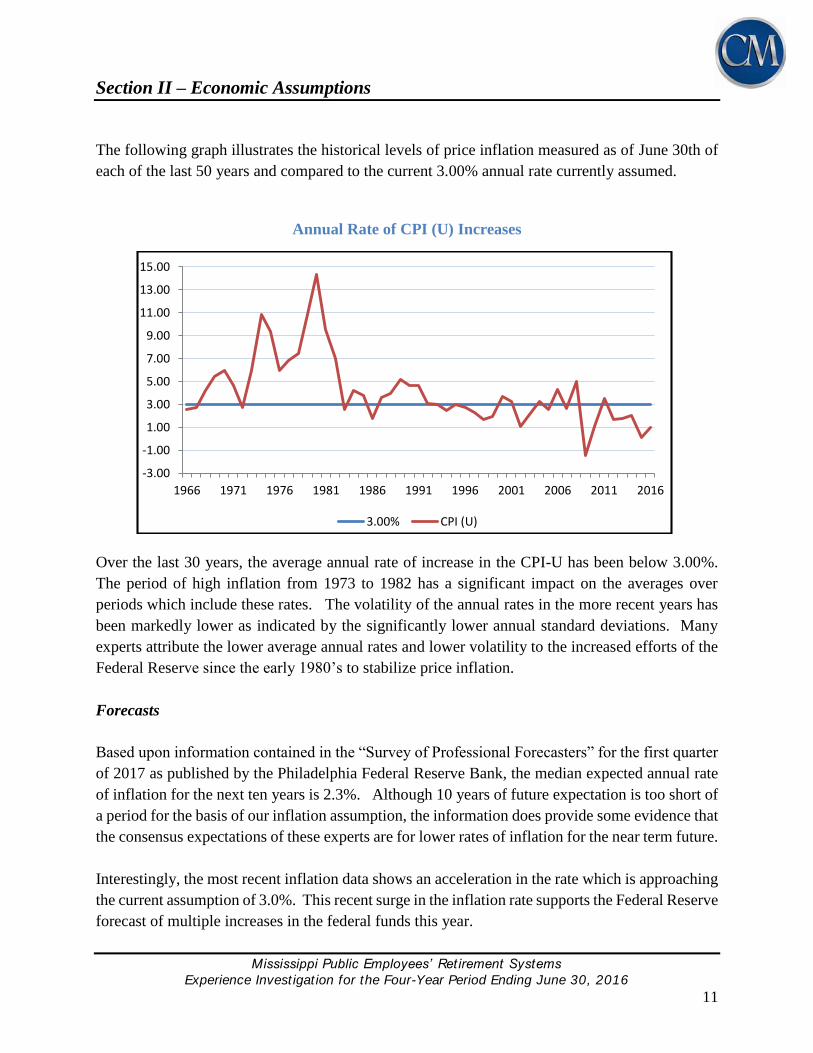
The following graph illustrates the historical levels of price inflation measured as of June 30th of
each of the last 50 years and compared to the current 3.00% annual rate currently assumed.
Annual Rate of CPI (U) Increases
Over the last 30 years, the average annual rate of increase in the CPI-U has been below 3.00%.
The period of high inflation from 1973 to 1982 has a significant impact on the averages over
periods which include these rates. The volatility of the annual rates in the more recent years has
been markedly lower as indicated by the significantly lower annual standard deviations. Many
experts attribute the lower average annual rates and lower volatility to the increased efforts of the
Federal Reserve since the early 1980’s to stabilize price inflation.
Forecasts
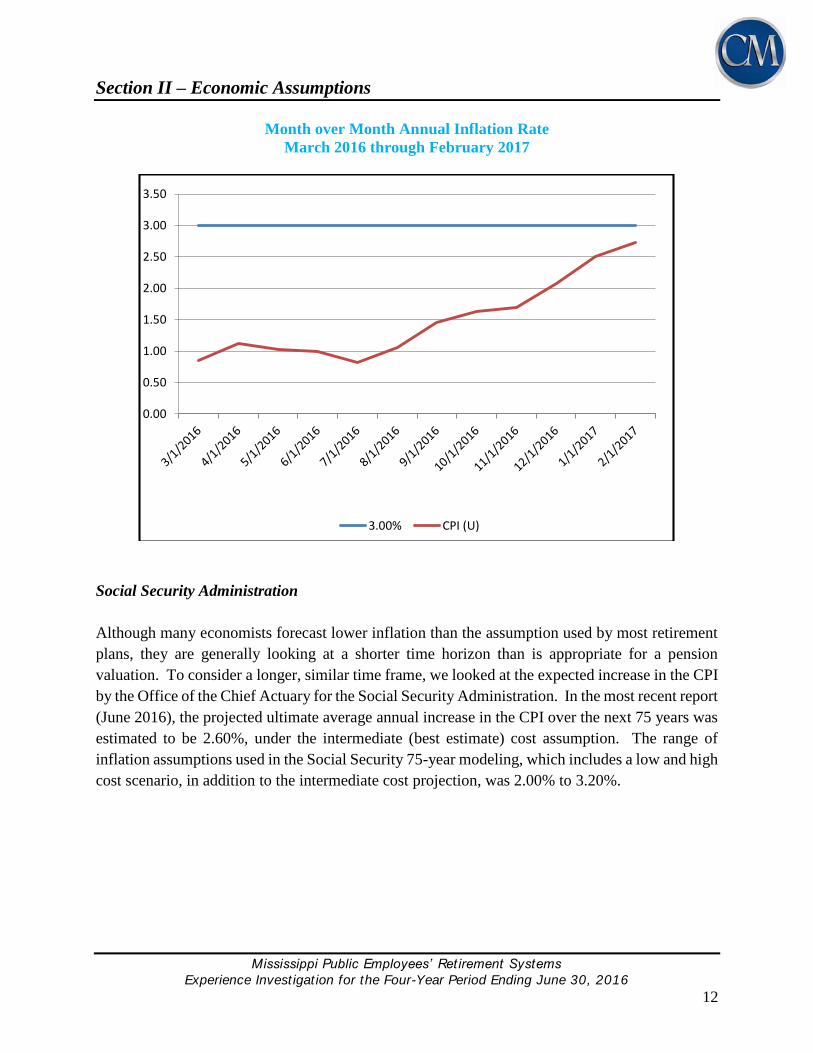
Based upon information contained in the “Survey of Professional Forecasters” for the first quarter
of 2017 as published by the Philadelphia Federal Reserve Bank, the median expected annual rate
of inflation for the next ten years is 2.3%. Although 10 years of future expectation is too short of
a period for the basis of our inflation assumption, the information does provide some evidence that
the consensus expectations of these experts are for lower rates of inflation for the near term future.
Interestingly, the most recent inflation data shows an acceleration in the rate which is approaching
the current assumption of 3.0%. This recent surge in the inflation rate supports the Federal Reserve
forecast of multiple increases in the federal funds this year.
-3.00
-1.00
1.00
3.00
5.00
7.00
9.00
11.00
13.00
15.00
1966 1971 1976 1981 1986 1991 1996 2001 2006 2011 2016
3.00% CPI (U)
Section II – Economic Assumptions
Mississippi Public Employees’ Retirement Systems
Experience Invest igat ion for the Four-Year Period Ending June 30, 2016
12
Month over Month Annual Inflation Rate
March 2016 through February 2017
Social Security Administration
Although many economists forecast lower inflation than the assumption used by most retirement
plans, they are generally looking at a shorter time horizon than is appropriate for a pension
valuation. To consider a longer, similar time frame, we looked at the expected increase in the CPI
by the Office of the Chief Actuary for the Social Security Administration. In the most recent report
(June 2016), the projected ultimate average annual increase in the CPI over the next 75 years was
estimated to be 2.60%, under the intermediate (best estimate) cost assumption. The range of
inflation assumptions used in the Social Security 75-year modeling, which includes a low and high
cost scenario, in addition to the intermediate cost projection, was 2.00% to 3.20%.
0.00
0.50
1.00
1.50
2.00
2.50
3.00
3.50
3.00% CPI (U)
Section II – Economic Assumptions
Mississippi Public Employees’ Retirement Systems
Experience Invest igat ion for the Four-Year Period Ending June 30, 2016
13
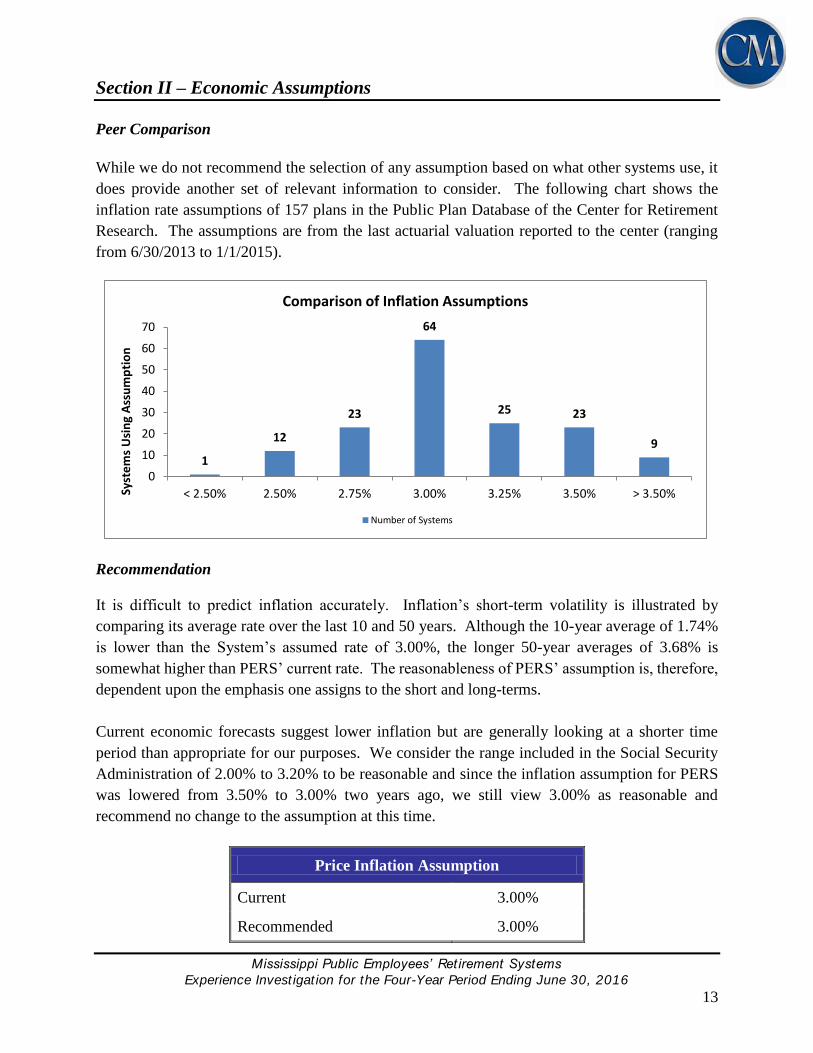
Peer Comparison
While we do not recommend the selection of any assumption based on what other systems use, it
does provide another set of relevant information to consider. The following chart shows the
inflation rate assumptions of 157 plans in the Public Plan Database of the Center for Retirement
Research. The assumptions are from the last actuarial valuation reported to the center (ranging
from 6/30/2013 to 1/1/2015).
Recommendation
It is difficult to predict inflation accurately. Inflation’s short-term volatility is illustrated by
comparing its average rate over the last 10 and 50 years. Although the 10-year average of 1.74%
is lower than the System’s assumed rate of 3.00%, the longer 50-year averages of 3.68% is
somewhat higher than PERS’ current rate. The reasonableness of PERS’ assumption is, therefore,
dependent upon the emphasis one assigns to the short and long-terms.
Current economic forecasts suggest lower inflation but are generally looking at a shorter time
period than appropriate for our purposes. We consider the range included in the Social Security
Administration of 2.00% to 3.20% to be reasonable and since the inflation assumption for PERS
was lowered from 3.50% to 3.00% two years ago, we still view 3.00% as reasonable and
recommend no change to the assumption at this time.
Price Inflation Assumption
Current 3.00%
Recommended 3.00%
1
12
23
64
25 23
9
0
10
20
30
40
50
60
70
< 2.50% 2.50% 2.75% 3.00% 3.25% 3.50% > 3.50%Syst
em
s U
sin
g A
ssu
mp
tio
n
Comparison of Inflation Assumptions
Number of Systems
Section II – Economic Assumptions
Mississippi Public Employees’ Retirement Systems
Experience Invest igat ion for the Four-Year Period Ending June 30, 2016
14
Investment Return
Background
The assumed investment return is one of the most significant assumptions in the annual actuarial
valuation process as it is used to discount the expected benefit payments for all active, inactive and
retired members. Minor changes in this assumption can have a major impact on valuation results.
The investment return assumption should reflect the asset allocation target for the funds set by the
Board of Trustees.
The current assumption is 7.75%, consisting of a price inflation assumption of 3.00% and a real
rate of return assumption of 4.75%.
Long Term Perspective
Because the economy is constantly changing, assumptions about what may occur in the near term
are volatile. Asset managers and investment consultants usually focus on this near-term horizon
in order to make prudent choices regarding how to invest the trust funds. For actuarial calculations,
we typically consider very long periods of time. For example, a newly-hired employee who is 25
years old may work for 35 years, to age 60, and live another 30 years, to age 90 (or longer). The
retirement system would receive contributions for the first 35 years and then pay out benefits for
the next 30 years. During the entire 65-year period, the system is investing assets related to the
member. For such a typical career employee, more than one-half of the investment income earned
on assets accumulated to pay benefits is received after the employee retires. In addition, in an
open, ongoing system like PERS, the stream of benefit payments is continually increasing as new
hires replace current members who leave covered employment due to death, termination of
employment, and retirement. This difference in the time horizon used by actuaries and investment
consultants is frequently a source of debate and confusion when setting economic assumptions.
Past Experience
One of the inherent problems with analyzing historical data is that the results can look significantly
different depending on the timeframe used, especially if the year-to-year results vary widely. In
addition, the asset allocation can also impact the investment returns so comparing results over long
periods when different asset allocations were in place may not be meaningful.
Section II – Economic Assumptions
Mississippi Public Employees’ Retirement Systems
Experience Invest igat ion for the Four-Year Period Ending June 30, 2016
15
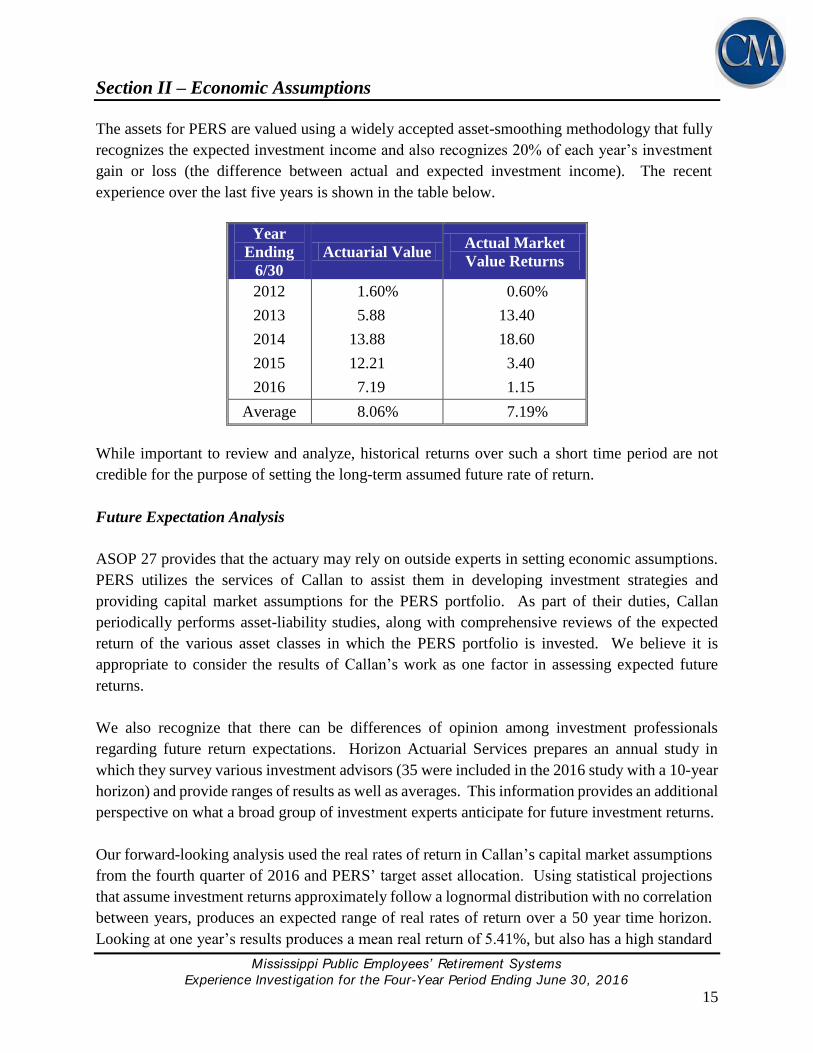
The assets for PERS are valued using a widely accepted asset-smoothing methodology that fully
recognizes the expected investment income and also recognizes 20% of each year’s investment
gain or loss (the difference between actual and expected investment income). The recent
experience over the last five years is shown in the table below.
Year
Ending
6/30
Actuarial Value Actual Market
Value Returns
2012 1.60% 0.60%
2013 5.88 13.40
2014 13.88 18.60
2015 12.21 3.40
2016 7.19 1.15
Average 8.06% 7.19%
While important to review and analyze, historical returns over such a short time period are not
credible for the purpose of setting the long-term assumed future rate of return.
Future Expectation Analysis
ASOP 27 provides that the actuary may rely on outside experts in setting economic assumptions.
PERS utilizes the services of Callan to assist them in developing investment strategies and
providing capital market assumptions for the PERS portfolio. As part of their duties, Callan
periodically performs asset-liability studies, along with comprehensive reviews of the expected
return of the various asset classes in which the PERS portfolio is invested. We believe it is
appropriate to consider the results of Callan’s work as one factor in assessing expected future
returns.
We also recognize that there can be differences of opinion among investment professionals
regarding future return expectations. Horizon Actuarial Services prepares an annual study in
which they survey various investment advisors (35 were included in the 2016 study with a 10-year
horizon) and provide ranges of results as well as averages. This information provides an additional
perspective on what a broad group of investment experts anticipate for future investment returns.
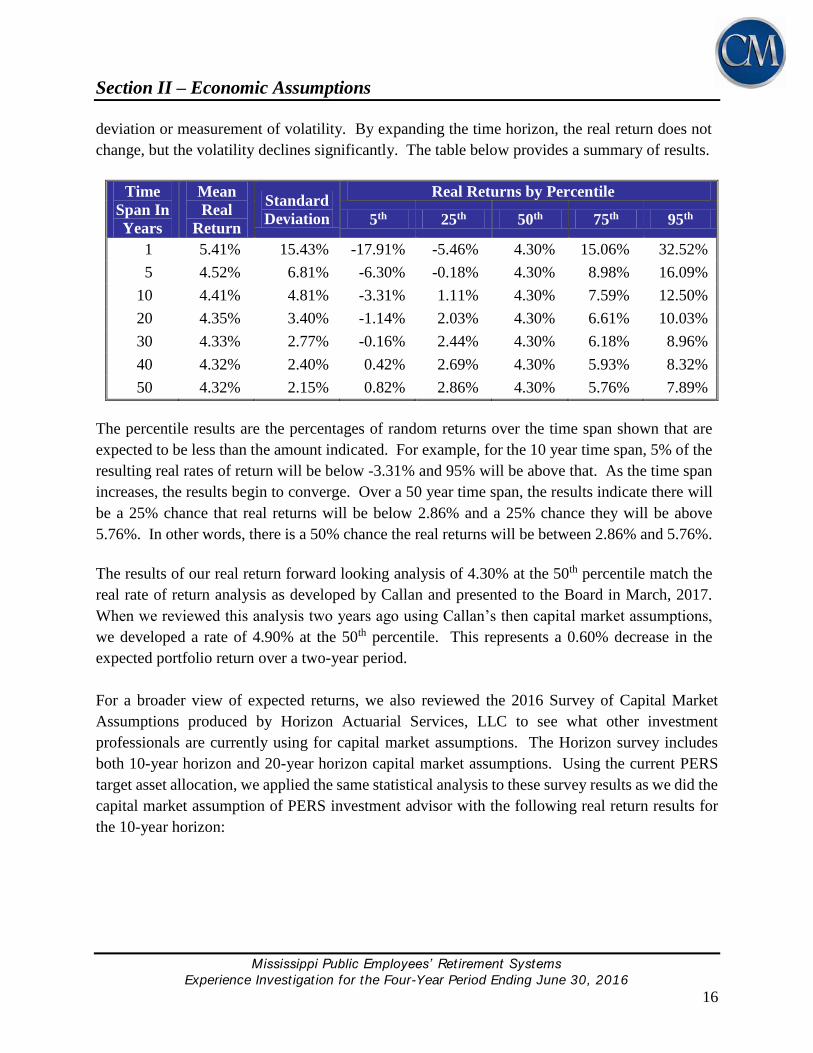
Our forward-looking analysis used the real rates of return in Callan’s capital market assumptions
from the fourth quarter of 2016 and PERS’ target asset allocation. Using statistical projections
that assume investment returns approximately follow a lognormal distribution with no correlation
between years, produces an expected range of real rates of return over a 50 year time horizon.
Looking at one year’s results produces a mean real return of 5.41%, but also has a high standard
Section II – Economic Assumptions
Mississippi Public Employees’ Retirement Systems
Experience Invest igat ion for the Four-Year Period Ending June 30, 2016
16
deviation or measurement of volatility. By expanding the time horizon, the real return does not
change, but the volatility declines significantly. The table below provides a summary of results.
Time
Span In
Years
Mean
Real
Return
Standard
Deviation
Real Returns by Percentile
5th 25th 50th 75th 95th
1 5.41% 15.43% -17.91% -5.46% 4.30% 15.06% 32.52%
5 4.52% 6.81% -6.30% -0.18% 4.30% 8.98% 16.09%
10 4.41% 4.81% -3.31% 1.11% 4.30% 7.59% 12.50%
20 4.35% 3.40% -1.14% 2.03% 4.30% 6.61% 10.03%
30 4.33% 2.77% -0.16% 2.44% 4.30% 6.18% 8.96%
40 4.32% 2.40% 0.42% 2.69% 4.30% 5.93% 8.32%
50 4.32% 2.15% 0.82% 2.86% 4.30% 5.76% 7.89%
The percentile results are the percentages of random returns over the time span shown that are
expected to be less than the amount indicated. For example, for the 10 year time span, 5% of the
resulting real rates of return will be below -3.31% and 95% will be above that. As the time span
increases, the results begin to converge. Over a 50 year time span, the results indicate there will
be a 25% chance that real returns will be below 2.86% and a 25% chance they will be above
5.76%. In other words, there is a 50% chance the real returns will be between 2.86% and 5.76%.
The results of our real return forward looking analysis of 4.30% at the 50th percentile match the
real rate of return analysis as developed by Callan and presented to the Board in March, 2017.
When we reviewed this analysis two years ago using Callan’s then capital market assumptions,
we developed a rate of 4.90% at the 50th percentile. This represents a 0.60% decrease in the
expected portfolio return over a two-year period.
For a broader view of expected returns, we also reviewed the 2016 Survey of Capital Market
Assumptions produced by Horizon Actuarial Services, LLC to see what other investment
professionals are currently using for capital market assumptions. The Horizon survey includes
both 10-year horizon and 20-year horizon capital market assumptions. Using the current PERS
target asset allocation, we applied the same statistical analysis to these survey results as we did the
capital market assumption of PERS investment advisor with the following real return results for
the 10-year horizon:

Section II – Economic Assumptions
Mississippi Public Employees’ Retirement Systems
Experience Invest igat ion for the Four-Year Period Ending June 30, 2016
17
Mean Real Return Projection based on the PERS Asset Allocation and the Capital
Market Assumptions from the 10-year Horizon Actuarial Services Survey
Time
Span In
Years
Mean
Real
Return
Standard
Deviation
Real Returns by Percentile
5th 25th 50th 75th 95th
1 5.64% 13.70% -15.29% -3.98% 4.76% 14.30% 29.57%
5 4.94% 6.07% -4.73% 0.76% 4.76% 8.93% 15.21%
10 4.85% 4.28% -2.04% 1.92% 4.76% 7.69% 12.05%
20 4.81% 3.03% -0.10% 2.74% 4.76% 6.83% 9.86%
30 4.79% 2.47% 0.78% 3.11% 4.76% 6.44% 8.91%
40 4.79% 2.14% 1.30% 3.33% 4.76% 6.22% 8.34%
50 4.78% 1.91% 1.66% 3.48% 4.76% 6.06% 7.96%
The results for the 20-year horizon are contained in the following table:
Mean Real Return Projection based on the PERS Asset Allocation and the Capital
Market Assumptions from the 20-year Horizon Actuarial Services Survey
Time
Span In
Years
Mean
Real
Return
Standard
Deviation
Real Returns by Percentile
5th 25th 50th 75th 95th
1 6.49% 13.70% -14.46% -3.13% 5.62% 15.15% 30.40%
5 5.79% 6.07% -3.89% 1.61% 5.62% 9.78% 16.06%
10 5.70% 4.28% -1.20% 2.77% 5.62% 8.54% 12.90%
20 5.66% 3.03% 0.75% 3.59% 5.62% 7.68% 10.71%
30 5.64% 2.47% 1.63% 3.96% 5.62% 7.30% 9.76%
40 5.64% 2.14% 2.15% 4.18% 5.62% 7.07% 9.20%
50 5.63% 1.91% 2.51% 4.33% 5.62% 6.91% 8.81%

Section II – Economic Assumptions
Mississippi Public Employees’ Retirement Systems
Experience Invest igat ion for the Four-Year Period Ending June 30, 2016
18
Peer Comparison
The following chart shows the nominal investment return assumptions of the 127 plans from the
National Association of State Retirement Administrators (NASRA) Issue Brief entitled, “Public
Pension Plan Investment Return Assumptions”, updated February, 2017. The median nominal
investment return from this survey is 7.50%.
11 9
52
33
19
2 1
0
10
20
30
40
50
60
< 7% 7.00% >7.00% -7.50%
>7.50% &<8.00%
8.00% >8.00% &<8.50%
> 8.50%
Syst
em
s U
sin
g A
ssu
mp
tio
n
Comparison of Investment Return Assumptions
Number of Systems
2.86%3.48%
4.33%4.30%4.76%
5.62%5.76%6.06%
6.91%
0.00%
1.00%
2.00%
3.00%
4.00%
5.00%
6.00%
7.00%
8.00%
Callan 10 Yr Horizon 10 Yr Horizon 20 Yr
Rea
l R
etu
rn
Comparison of 25th Percentile to 75th Percentile
of Real Return Distributions
Section II – Economic Assumptions
Mississippi Public Employees’ Retirement Systems
Experience Invest igat ion for the Four-Year Period Ending June 30, 2016
19
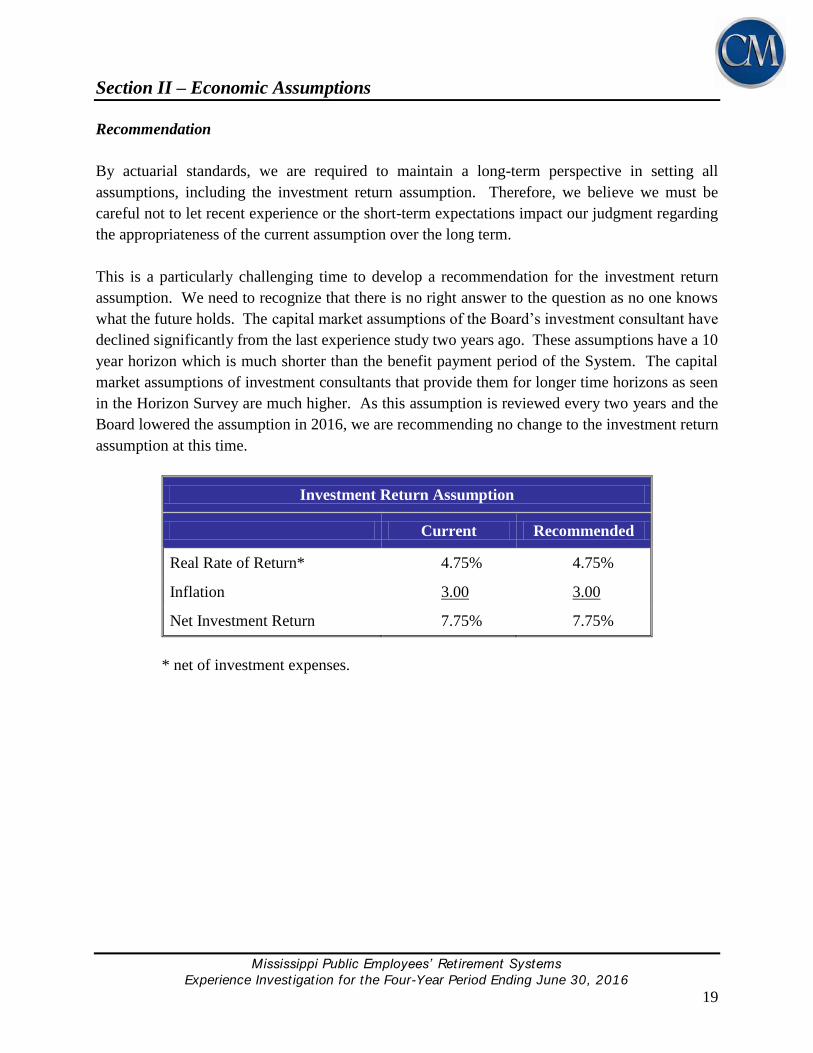
Recommendation
By actuarial standards, we are required to maintain a long-term perspective in setting all
assumptions, including the investment return assumption. Therefore, we believe we must be
careful not to let recent experience or the short-term expectations impact our judgment regarding
the appropriateness of the current assumption over the long term.
This is a particularly challenging time to develop a recommendation for the investment return
assumption. We need to recognize that there is no right answer to the question as no one knows
what the future holds. The capital market assumptions of the Board’s investment consultant have
declined significantly from the last experience study two years ago. These assumptions have a 10
year horizon which is much shorter than the benefit payment period of the System. The capital
market assumptions of investment consultants that provide them for longer time horizons as seen
in the Horizon Survey are much higher. As this assumption is reviewed every two years and the
Board lowered the assumption in 2016, we are recommending no change to the investment return
assumption at this time.
Investment Return Assumption
Current Recommended
Real Rate of Return* 4.75% 4.75%
Inflation 3.00 3.00
Net Investment Return 7.75% 7.75%
* net of investment expenses.
Section II – Economic Assumptions
Mississippi Public Employees’ Retirement Systems
Experience Invest igat ion for the Four-Year Period Ending June 30, 2016
20
Wage Inflation
Background
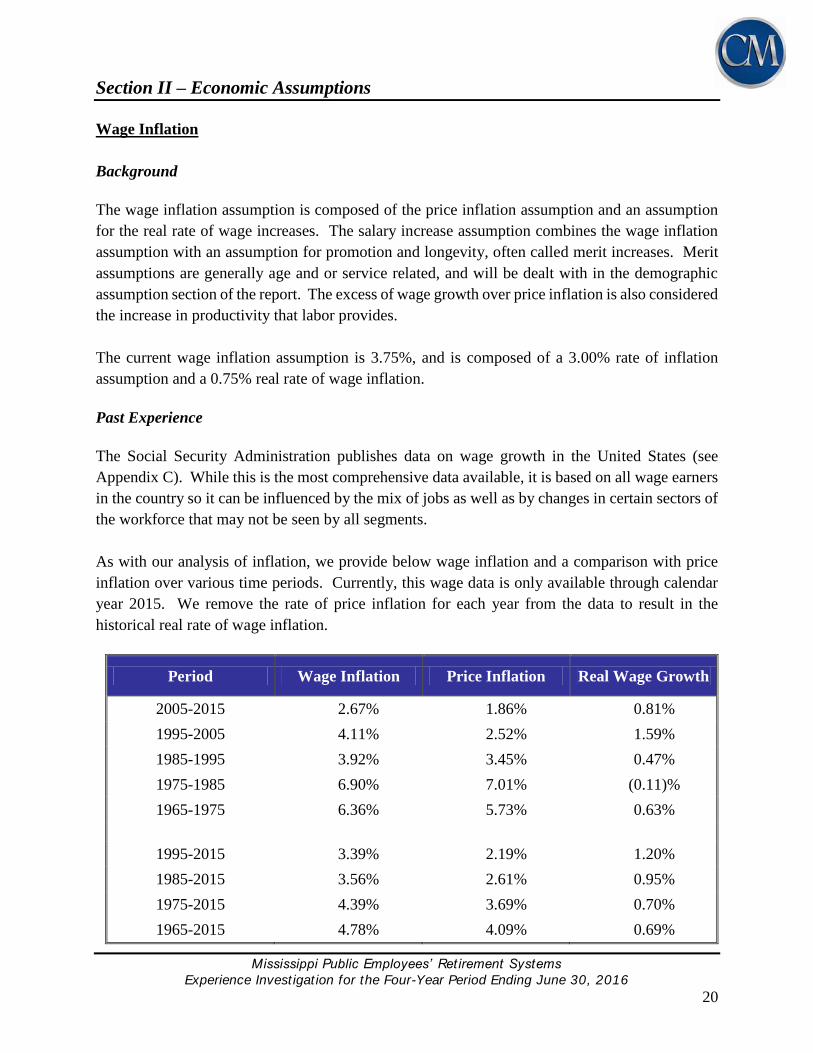
The wage inflation assumption is composed of the price inflation assumption and an assumption
for the real rate of wage increases. The salary increase assumption combines the wage inflation
assumption with an assumption for promotion and longevity, often called merit increases. Merit
assumptions are generally age and or service related, and will be dealt with in the demographic
assumption section of the report. The excess of wage growth over price inflation is also considered
the increase in productivity that labor provides.
The current wage inflation assumption is 3.75%, and is composed of a 3.00% rate of inflation
assumption and a 0.75% real rate of wage inflation.
Past Experience
The Social Security Administration publishes data on wage growth in the United States (see
Appendix C). While this is the most comprehensive data available, it is based on all wage earners
in the country so it can be influenced by the mix of jobs as well as by changes in certain sectors of
the workforce that may not be seen by all segments.
As with our analysis of inflation, we provide below wage inflation and a comparison with price
inflation over various time periods. Currently, this wage data is only available through calendar
year 2015. We remove the rate of price inflation for each year from the data to result in the
historical real rate of wage inflation.
Period Wage Inflation Price Inflation Real Wage Growth
2005-2015 2.67% 1.86% 0.81%
1995-2005 4.11% 2.52% 1.59%
1985-1995 3.92% 3.45% 0.47%
1975-1985 6.90% 7.01% (0.11)%
1965-1975 6.36% 5.73% 0.63%
1995-2015 3.39% 2.19% 1.20%
1985-2015 3.56% 2.61% 0.95%
1975-2015 4.39% 3.69% 0.70%
1965-2015 4.78% 4.09% 0.69%
Section II – Economic Assumptions
Mississippi Public Employees’ Retirement Systems
Experience Invest igat ion for the Four-Year Period Ending June 30, 2016
21
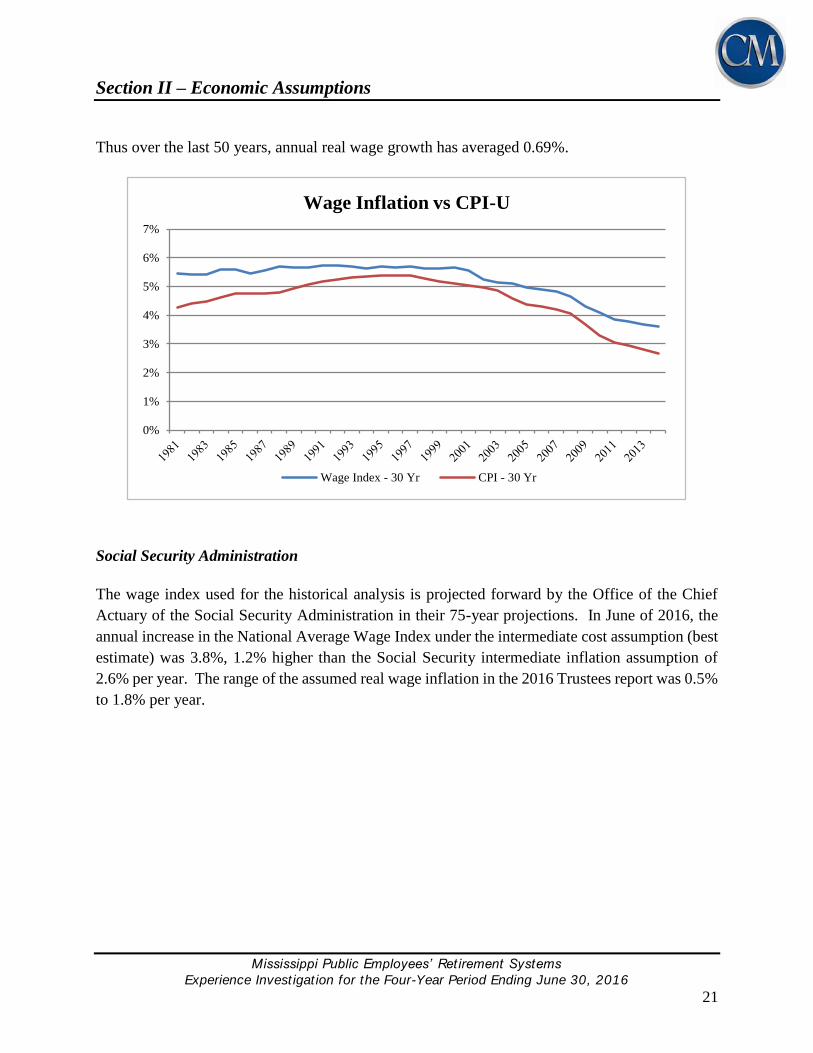
Thus over the last 50 years, annual real wage growth has averaged 0.69%.
Social Security Administration
The wage index used for the historical analysis is projected forward by the Office of the Chief
Actuary of the Social Security Administration in their 75-year projections. In June of 2016, the
annual increase in the National Average Wage Index under the intermediate cost assumption (best
estimate) was 3.8%, 1.2% higher than the Social Security intermediate inflation assumption of
2.6% per year. The range of the assumed real wage inflation in the 2016 Trustees report was 0.5%
to 1.8% per year.
0%
1%
2%
3%
4%
5%
6%
7%
Wage Inflation vs CPI-U
Wage Index - 30 Yr CPI - 30 Yr
Section II – Economic Assumptions
Mississippi Public Employees’ Retirement Systems
Experience Invest igat ion for the Four-Year Period Ending June 30, 2016
22
Recommendation
The data the Social Security Administration collects is nationwide and predominantly from the
private sector which includes many collectively bargained employees. It is questionable whether
public sector employees can match the productivity rates of the private sector. PERS continues to
experience gains on the salary assumption (i.e. actual increases in salary are less than expected)
and real wage growth has not kept up with the current assumption of 0.75%. Therefore, we
recommend a decrease in the real wage assumption from 0.75% to 0.25%. Not only will this
recommended assumption lower projected salaries in the future, but it will also lower projected
liabilities for active members.
Wage Inflation Assumption
Current Recommended
Price Inflation 3.00% 3.00%
Real Wage Growth 0.75% 0.25%
Wage Inflation 3.75% 3.25%
Section III – Actuarial Methods
Mississippi Public Employees’ Retirement Systems
Experience Invest igat ion for the Four-Year Period Ending June 30, 2016
23
Actuarial Cost Method
There are various actuarial cost methods, each of which has different characteristics, advantages
and disadvantages. However, Governmental Accounting Standard Board (GASB) Statement
Numbers 67 and 68 require that the Entry Age Normal cost method be used for financial reporting.
Most systems do not want to use a different actuarial cost method for funding and financial
reporting. In addition, the Entry Age Normal method has been the most common funding method
for public systems for many years. This is the cost method currently used by PERS.
The rationale of the Entry Age Normal (EAN) cost method is that the cost of each member’s
benefit is determined to be a level percentage of his salary from date of hire to the end of his
employment with the employer. This level percentage multiplied by the member’s annual salary
is referred to as the normal cost and is that portion of the total cost of the employee’s benefit that
is allocated to the current year. The portion of the present value of future benefits allocated to the
future is determined by multiplying this percentage times the present value of the member’s
assumed earnings for all future years including the current year. The Entry Age Normal actuarial
accrued liability is then developed by subtracting from the present value of future benefits that
portion of costs allocated to the future. To determine the unfunded actuarial accrued liability, the
value of plan assets is subtracted from the Entry Age Normal actuarial accrued liability. The
current year’s cost to amortize the unfunded actuarial accrued liability is developed by applying
an amortization factor.
It is to be expected that future events will not occur exactly as anticipated by the actuarial
assumptions in each year. Actuarial gains/losses from experience under this actuarial cost method
can be directly calculated and are reflected as a decrease/increase in the unfunded actuarial accrued
liability. Consequently, the gain/loss results in a decrease/increase in the amortization payment,
and therefore the contribution rate.
Considering that the Entry Age Normal cost method is the most commonly used cost method by
public plans, that it develops a normal cost rate that tends to be stable and less volatile, and is the
required cost method under calculations required by GASB Numbers 67 and 68, we recommend
the Entry Age Normal actuarial cost method be retained for PERS.
Actuarial Value of Assets
In preparing an actuarial valuation, the actuary must assign a value to the assets of the fund. An
adjusted market value is often used to smooth out the volatility that is reflected in the market value
of assets. This is because most employers would rather have annual costs remain relatively

Section III – Actuarial Methods
Mississippi Public Employees’ Retirement Systems
Experience Invest igat ion for the Four-Year Period Ending June 30, 2016
24
smooth, as a percentage of payroll or in actual dollars, as opposed to a cost pattern that is extremely
volatile.
The actuary does not have complete freedom in assigning this value. The Actuarial Standards
Board also has basic principles regarding the calculation of a smoothed asset value, Actuarial
Standard of Practice No. 44 (ASOP 44), Selection and Use of Asset Valuation Methods for Pension
Valuations.
ASOP 44 provides that the asset valuation method should bear a reasonable relationship to the
market value. Furthermore, the asset valuation method should be likely to satisfy both of the
following:
Produce values within a reasonable range around market value, AND
Recognize differences from market value in a reasonable amount of time.
In lieu of both of the above, the standard will be met if either of the following requirements is
satisfied:
There is a sufficiently narrow range around the market value, OR
The method recognizes differences from market value in a sufficiently short period.
These rules or principles prevent the asset valuation methodology from being used to manipulate
annual funding patterns. No matter what asset valuation method is used, it is important to note
that, like a cost method or actuarial assumptions, the asset valuation method does not affect the
true cost of the plan; it only impacts the incidence of cost.
Currently, the actuarial value of assets recognizes a portion of the difference between the market
value of assets and the expected market value of assets, based on the assumed valuation rate of
return. The amount recognized each year is 20% of the difference between market value and
expected market value. We recommend no change in this methodology.
Amortization of the Unfunded Actuarial Accrued Liability
The actuarial accrued liability is the portion of the actuarial present value of future benefits that
are not included in future normal costs. Thus, it represents the liability that, in theory, should have
been funded through normal costs for past service. Unfunded actuarial accrued liability (UAAL)
Section III – Actuarial Methods
Mississippi Public Employees’ Retirement Systems
Experience Invest igat ion for the Four-Year Period Ending June 30, 2016
25
exists when the actuarial accrued liability exceeds the actuarial value of plan assets. These
deficiencies can result from: (i) plan improvements that have not been completely paid for,
(ii) experience that is less favorable than expected,
(iii) assumption changes that increase liabilities, or
(iv) contributions that are less than the actuarial contribution rate.
There are a variety of different methods that can be used to amortize the UAAL. Each method
results in a different payment stream and, therefore, has cost implications. For each methodology,
there are three characteristics:
The period over which the UAAL is amortized,
The rate at which the amortization payment increases, and
The number of components of UAAL (separate amortization bases).
Amortization Period: The amortization period can be either closed or open. If it is a closed
amortization period, the number of years remaining in the amortization period declines by one in
each future valuation. Alternatively, if the amortization period is an open or rolling period, the
amortization period does not decline but is reset to the same number each year. This approach
essentially “refinances” the System’s debt (UAAL) every year.
Amortization Payment: The level dollar amortization method is similar to the method in which
a homeowner pays off a mortgage. The liability, once calculated, is financed by a constant fixed
dollar amount, based on the amortization period until the liability is extinguished. This results in
the liability steadily decreasing while the payments, though remaining level in dollar terms, in all
probability decrease as a percentage of payroll. (Even if a plan sponsor’s population is not
growing, inflationary salary increases will usually be sufficient to increase the aggregate covered
payroll).
The rationale behind the level percentage of payroll amortization method is that since normal costs
are calculated to be a constant percentage of pay, the unfunded actuarial accrued liability should
be paid off in the same manner. When this method of amortizing the unfunded actuarial accrued
liability is adopted, the initial amortization payments are lower than they would be under a level
dollar amortization payment method, but the payments increase at a fixed rate each year so that
ultimately the annual payment far exceeds the level dollar payment. The expectation is that total
payroll will increase at the same rate so that the amortization payments will remain constant, as a
percentage of payroll. In the initial years, the level percentage of payroll amortization payment is
often less than the interest accruing on the unfunded actuarial accrued liability meaning that even
if there are no experience losses, the dollar amount of the unfunded actuarial accrued liability will
Section III – Actuarial Methods
Mississippi Public Employees’ Retirement Systems
Experience Invest igat ion for the Four-Year Period Ending June 30, 2016
26
grow (called negative amortization). This is particularly true if the plan sponsor is paying off the
unfunded actuarial accrued liability over a long period, such as 20 or more years.
Amortization Bases: The UAAL can be amortized either as one single amount or as components
or “layers”, each with a separate amortization base, payment and period. If the UAAL is amortized
as one amount, the UAAL is recalculated each year in the valuation and experience gains/losses
or other changes in the UAAL are folded into the single UAAL amortization base. The
amortization payment is then the total UAAL divided by an amortization factor for the applicable
amortization period.
If separate amortization bases are maintained, the UAAL is composed of multiple amortization
bases, each with its own payment schedule and remaining amortization period. In each valuation,
the unexpected change in the UAAL is established as a new amortization base over the appropriate
amortization period beginning on that valuation date. The UAAL is then the sum of all of the
outstanding amortization bases on the valuation date and the UAAL payment is the sum of all of
the amortization payments on the existing amortization bases. This approach provides
transparency in that the current UAAL is paid off over a fixed period of time and the remaining
components of the UAAL are clearly identified. Adjustments to the UAAL in future years are also
separately identified in each future year. One downside of this approach is that it can create some
discontinuities in contribution rates when UAAL layers/components are fully paid off. If this
occurs, it likely would be far in the future, with adequate time to address any adjustments needed.
Current PERS Actuarial Amortization Method: Based on the current PERS Board funding
policy, contributions to the PERS System is set at 15.75% of payroll and the amortization of the
UAAL is determined by taking the difference in the 15.75% and the employer normal cost rate as
a percentage of payroll for the valuation. Then this rate is used in the development of an “open”
amortization period using the level percentage of payroll method. While the 15.75% of payroll is
the current contribution to the PERS plan, we recommend the Board consider adding to their
current funding policy criteria for a contribution metric for each System using a “closed”
amortization period, level percentage of payroll amortization payment, and separate layered
amortization bases for the current UAAL and any future gains or losses of the System. This
metric will be calculated during each valuation cycle to provide the Board with additional
information as to how the current contribution compares to a contribution aimed at reaching
a 100% funding ratio. This would replace the current Annual Required Contribution (ARC)
rate we currently show in the valuation report.

Section IV – Demographic Assumptions
Mississippi Public Employees’ Retirement Systems
Experience Invest igat ion for the Four-Year Period Ending June 30, 2016
27
There are several demographic assumptions used in the actuarial valuations performed for
Mississippi. They are:
Rates of Withdrawal
Pre-retirement Mortality
Rates of Disability Retirement
Rates of Service Retirement
Post-retirement Mortality
Rates of Salary Increase
Actuarial Standard of Practice (ASOP) No. 35, “Selection of Demographic and Other
Noneconomic Assumptions for Measuring Pension Obligations” provides guidance to actuaries in
selecting demographic assumptions for measuring obligations under defined benefit plans. In our
opinion, the demographic assumptions recommended in this report have been developed in
accordance with ASOP No. 35.
The purpose of a study of demographic experience is to compare what actually happened to the
membership during the study period (July 1, 2012 through June 30, 2016) with what was expected
to happen based on the assumptions used in the most recent Actuarial Valuations.
Detailed tabulations by age, service and/or gender are performed over the entire study period.
These tabulations look at all active and retired members during the period as well as separately
annotating those who experience a demographic event, also referred to as a decrement. In addition
the tabulation of all members together with the current assumptions permits the calculation of the
number of expected decrements during the study period.
If the actual experience differs significantly from the overall expected results, or if the pattern of
actual decrements, or rates of decrement, by age, gender, or service does not follow the expected
pattern, new assumptions are recommended. Recommended changes usually do not follow the
exact actual experience during the observation period. Judgment is required to extrapolate future
experience from past trends and current member behavior. In addition non-recurring events, such
as early retirement windows, need to be taken into account in determining the weight to give to
recent experience.
The remainder of this section presents the results of the demographic study. We have prepared
tables that show a comparison of the actual and expected decrements and the overall ratio of actual
to expected results (A/E Ratios) under the current assumptions. If a change is being proposed, the
revised A/E Ratios are shown as well. Salary adjustments, other than the economic assumption
for wage inflation discussed in the previous section, are treated as demographic assumptions.
Section IV – Demographic Assumptions
Mississippi Public Employees’ Retirement Systems
Experience Invest igat ion for the Four-Year Period Ending June 30, 2016
28
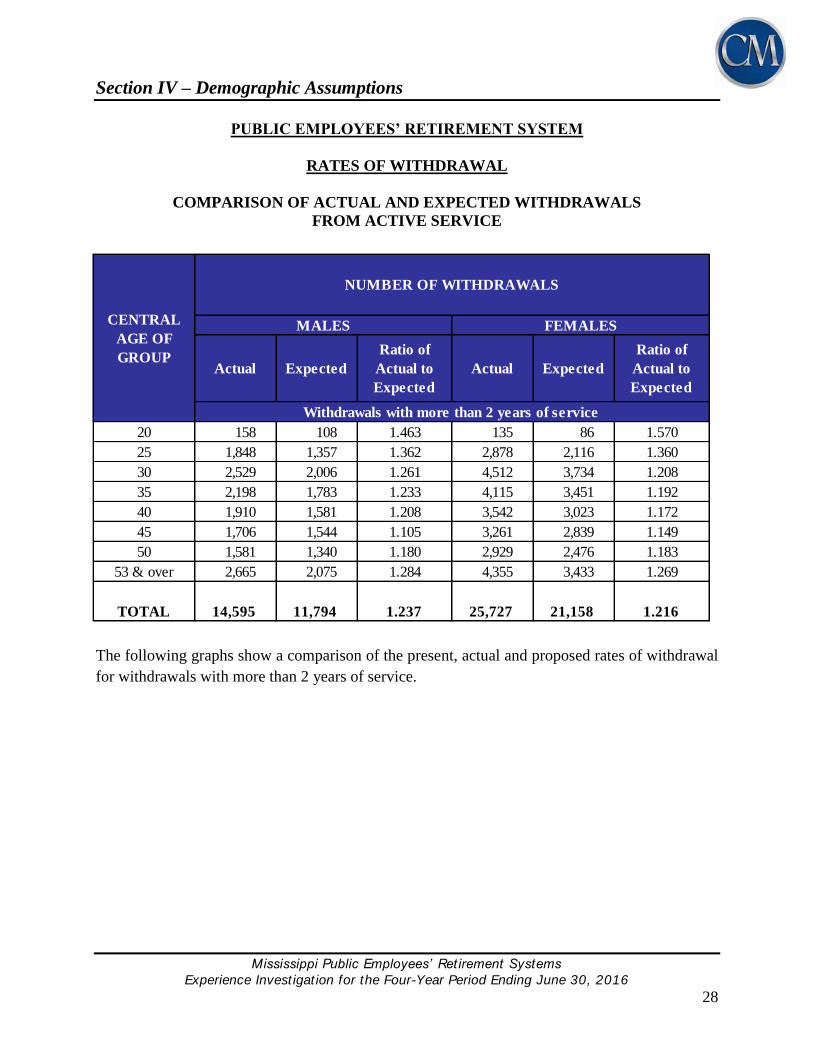
PUBLIC EMPLOYEES’ RETIREMENT SYSTEM
RATES OF WITHDRAWAL
COMPARISON OF ACTUAL AND EXPECTED WITHDRAWALS
FROM ACTIVE SERVICE
20 158 108 1.463 135 86 1.570
25 1,848 1,357 1.362 2,878 2,116 1.360
30 2,529 2,006 1.261 4,512 3,734 1.208
35 2,198 1,783 1.233 4,115 3,451 1.192
40 1,910 1,581 1.208 3,542 3,023 1.172
45 1,706 1,544 1.105 3,261 2,839 1.149
50 1,581 1,340 1.180 2,929 2,476 1.183
53 & over 2,665 2,075 1.284 4,355 3,433 1.269
14,595 11,794 1.237 25,727 21,158
Actual Expected Actual Expected
CENTRAL
AGE OF
GROUP
TOTAL 1.216
NUMBER OF WITHDRAWALS
MALES FEMALES
Ratio of
Actual to
Expected
Ratio of
Actual to
Expected
Withdrawals with more than 2 years of service
The following graphs show a comparison of the present, actual and proposed rates of withdrawal
for withdrawals with more than 2 years of service.
Section IV – Demographic Assumptions
Mississippi Public Employees’ Retirement Systems
Experience Invest igat ion for the Four-Year Period Ending June 30, 2016
29
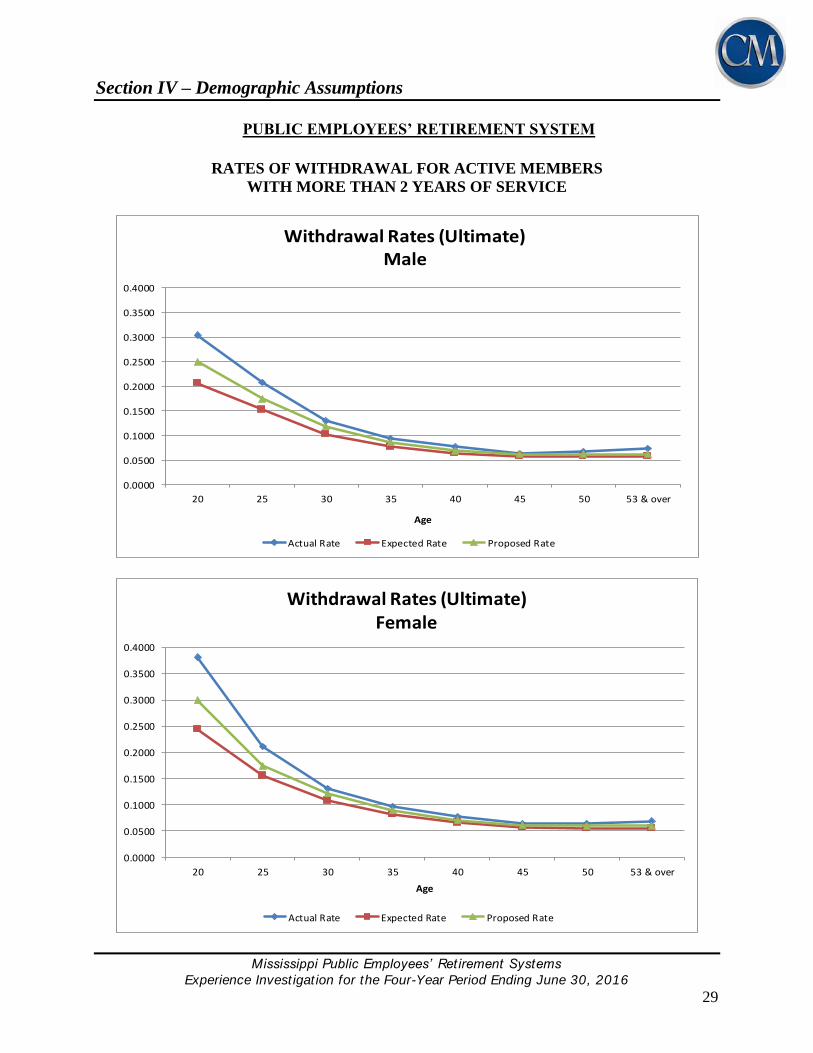
PUBLIC EMPLOYEES’ RETIREMENT SYSTEM
RATES OF WITHDRAWAL FOR ACTIVE MEMBERS
WITH MORE THAN 2 YEARS OF SERVICE
0.0000
0.0500
0.1000
0.1500
0.2000
0.2500
0.3000
0.3500
0.4000
20 25 30 35 40 45 50 53 & over
Age
Withdrawal Rates (Ultimate)Male
Actual Rate Expected Rate Proposed Rate
0.0000
0.0500
0.1000
0.1500
0.2000
0.2500
0.3000
0.3500
0.4000
20 25 30 35 40 45 50 53 & over
Age
Withdrawal Rates (Ultimate)Female
Actual Rate Expected Rate Proposed Rate
Section IV – Demographic Assumptions
Mississippi Public Employees’ Retirement Systems
Experience Invest igat ion for the Four-Year Period Ending June 30, 2016
30
The rates of withdrawal adopted by the Board are used to determine the expected number of
separations from active service which will occur as a result of resignation or dismissal. The results
of our study indicate that for members with more than 2 years of service, the actual number of
withdrawals was more at all age groups than expected over the four year period, especially at the
youngest ages. Therefore, we recommend increasing the rates for both males and females to
partially reflect the higher numbers of terminations experience over the last four years.
Furthermore the actual rates of withdrawal during the select period (first 2 years of employment)
indicate that both male and female members are withdrawing at a slightly greater rate during the
select period than currently expected. We recommend increasing the rate from 32.00% to 32.50%
during the first year of employment and from 23.00% to 23.50 % during the second year of
employment.
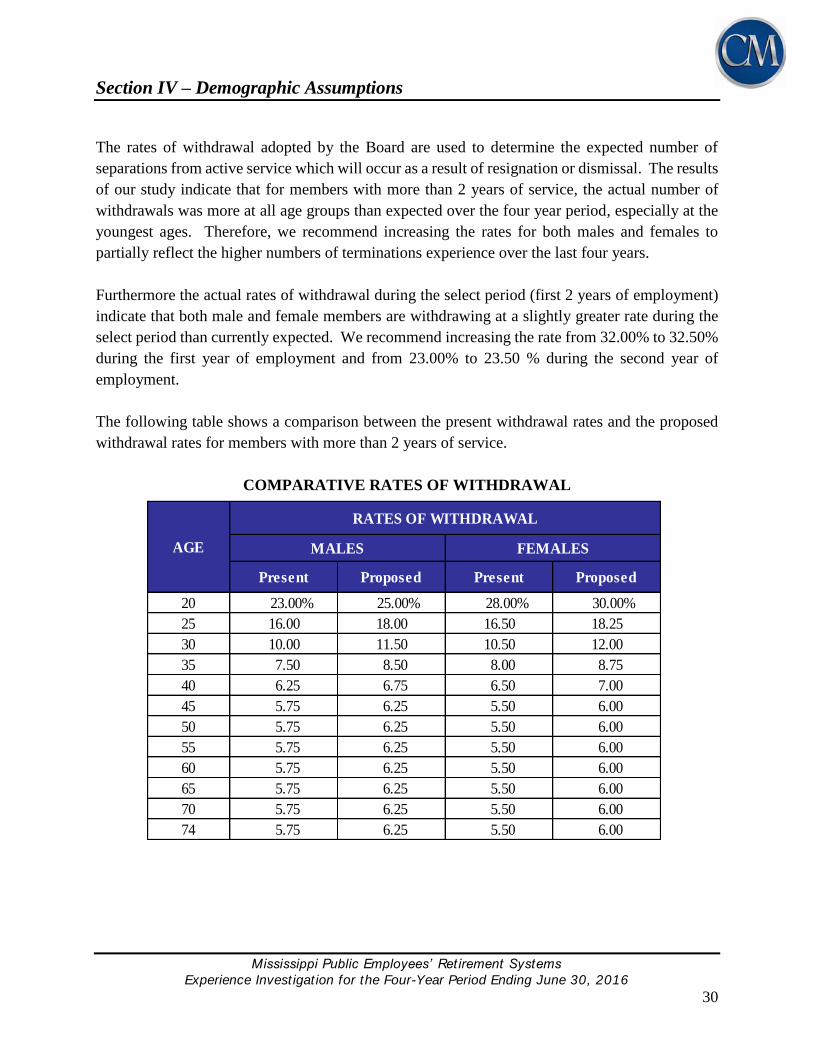
The following table shows a comparison between the present withdrawal rates and the proposed
withdrawal rates for members with more than 2 years of service.
COMPARATIVE RATES OF WITHDRAWAL
Present Proposed Present Proposed
20 23.00% 25.00% 28.00% 30.00%
25 16.00 18.00 16.50 18.25
30 10.00 11.50 10.50 12.00
35 7.50 8.50 8.00 8.75
40 6.25 6.75 6.50 7.00
45 5.75 6.25 5.50 6.00
50 5.75 6.25 5.50 6.00
55 5.75 6.25 5.50 6.00
60 5.75 6.25 5.50 6.00
65 5.75 6.25 5.50 6.00
70 5.75 6.25 5.50 6.00
74 5.75 6.25 5.50 6.00
AGE
RATES OF WITHDRAWAL
MALES FEMALES

Section IV – Demographic Assumptions
Mississippi Public Employees’ Retirement Systems
Experience Invest igat ion for the Four-Year Period Ending June 30, 2016
31
COMPARISON OF ACTUAL AND EXPECTED WITHDRAWALS
FROM ACTIVE SERVICE BASED ON PROPOSED RATES
20 158 130 1.215 135 106 1.274
25 1,848 1,558 1.186 2,878 2,357 1.221
30 2,529 2,295 1.102 4,512 4,227 1.067
35 2,198 2,016 1.090 4,115 3,795 1.084
40 1,910 1,720 1.110 3,542 3,267 1.084
45 1,706 1,677 1.017 3,261 3,091 1.055
50 1,581 1,456 1.086 2,929 2,702 1.084
53 & over 2,665 2,256 1.181 4,355 3,745 1.163
CENTRAL
AGE OF
GROUP
NUMBER OF WITHDRAWALS
MALES FEMALES
Actual Expected
Ratio of
Actual to
Expected
Actual Expected
Ratio of
Actual to
Expected
Withdrawals with more than 2 years of service
TOTAL 14,595 13,108 1.113 25,727 23,290 1.105
Section IV – Demographic Assumptions
Mississippi Public Employees’ Retirement Systems
Experience Invest igat ion for the Four-Year Period Ending June 30, 2016
32
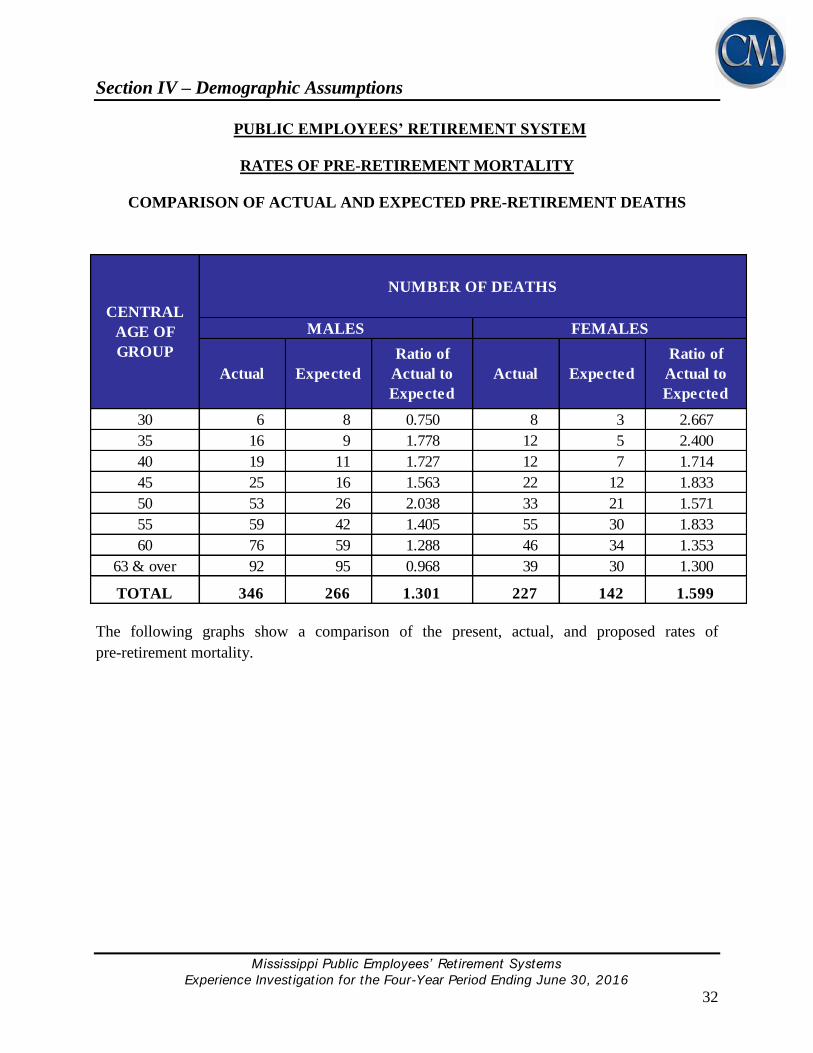
PUBLIC EMPLOYEES’ RETIREMENT SYSTEM
RATES OF PRE-RETIREMENT MORTALITY
COMPARISON OF ACTUAL AND EXPECTED PRE-RETIREMENT DEATHS
30 6 8 0.750 8 3 2.667
35 16 9 1.778 12 5 2.400
40 19 11 1.727 12 7 1.714
45 25 16 1.563 22 12 1.833
50 53 26 2.038 33 21 1.571
55 59 42 1.405 55 30 1.833
60 76 59 1.288 46 34 1.353
63 & over 92 95 0.968 39 30 1.300
TOTAL 346 266 1.301 227
CENTRAL
AGE OF
GROUP
NUMBER OF DEATHS
MALES FEMALES
Actual Expected
Ratio of
Actual to
Expected
Actual Expected
Ratio of
Actual to
Expected
142 1.599
The following graphs show a comparison of the present, actual, and proposed rates of
pre-retirement mortality.
Section IV – Demographic Assumptions
Mississippi Public Employees’ Retirement Systems
Experience Invest igat ion for the Four-Year Period Ending June 30, 2016
33
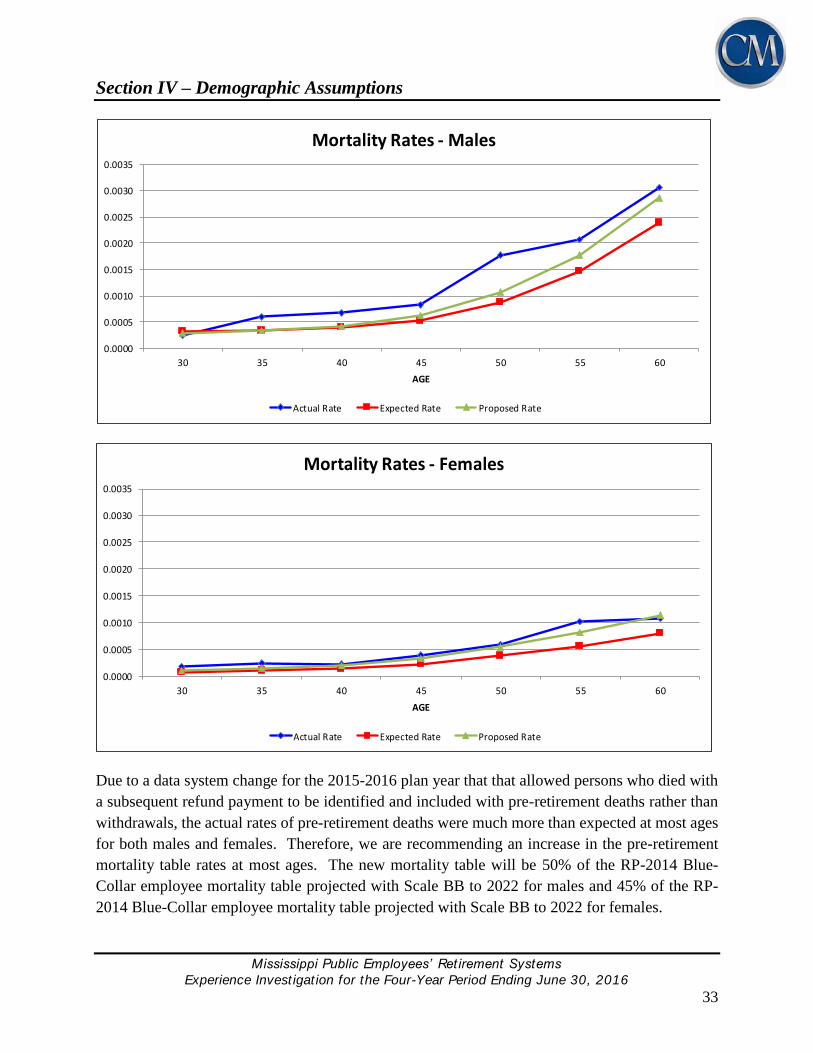
0.0000
0.0005
0.0010
0.0015
0.0020
0.0025
0.0030
0.0035
30 35 40 45 50 55 60
AGE
Mortality Rates - Males
Actual Rate Expected Rate Proposed Rate
0.0000
0.0005
0.0010
0.0015
0.0020
0.0025
0.0030
0.0035
30 35 40 45 50 55 60
AGE
Mortality Rates - Females
Actual Rate Expected Rate Proposed Rate
Due to a data system change for the 2015-2016 plan year that that allowed persons who died with
a subsequent refund payment to be identified and included with pre-retirement deaths rather than
withdrawals, the actual rates of pre-retirement deaths were much more than expected at most ages
for both males and females. Therefore, we are recommending an increase in the pre-retirement
mortality table rates at most ages. The new mortality table will be 50% of the RP-2014 Blue-
Collar employee mortality table projected with Scale BB to 2022 for males and 45% of the RP-
2014 Blue-Collar employee mortality table projected with Scale BB to 2022 for females.
Section IV – Demographic Assumptions
Mississippi Public Employees’ Retirement Systems
Experience Invest igat ion for the Four-Year Period Ending June 30, 2016
34
The following table shows a comparison between the present pre-retirement mortality rates and
the proposed rates. The proposed rates allow for some improved mortality in the future.
COMPARATIVE RATES OF PRE-RETIREMENT MORTALITY
Present Proposed Present Proposed
20 0.0159% 0.0256% 0.0054% 0.0080%
25 0.0346 0.0306 0.0058 0.0085
30 0.0318 0.0286 0.0073 0.0107
35 0.0337 0.0330 0.0096 0.0141
40 0.0390 0.0397 0.0132 0.0195
45 0.0513 0.0615 0.0220 0.0324
50 0.0859 0.1065 0.0369 0.0543
55 0.1466 0.1761 0.0557 0.0811
60 0.2391 0.2868 0.0805 0.1137
65 0.4076 0.4862 0.1214 0.1694
AGE
RATES OF DEATH
MALES FEMALES
COMPARISON OF ACTUAL AND EXPECTED PRE-RETIREMENT DEATHS
BASED ON PROPOSED RATES
30 6 7 0.857 8 5 1.600
35 16 9 1.778 12 7 1.714
40 19 11 1.727 12 10 1.200
45 25 19 1.316 22 18 1.222
50 53 32 1.656 33 31 1.065
55 59 51 1.157 55 44 1.250
60 76 71 1.070 46 48 0.958
63 & over 92 109 0.844 39 43 0.907
206 1.102TOTAL 346 309 1.120 227
CENTRAL
AGE OF
GROUP
NUMBER OF DEATHS
MALES FEMALES
Actual Expected
Ratio of
Actual to
Expected
Actual Expected
Ratio of
Actual to
Expected
Section IV – Demographic Assumptions
Mississippi Public Employees’ Retirement Systems
Experience Invest igat ion for the Four-Year Period Ending June 30, 2016
35
PUBLIC EMPLOYEES’ RETIREMENT SYSTEM
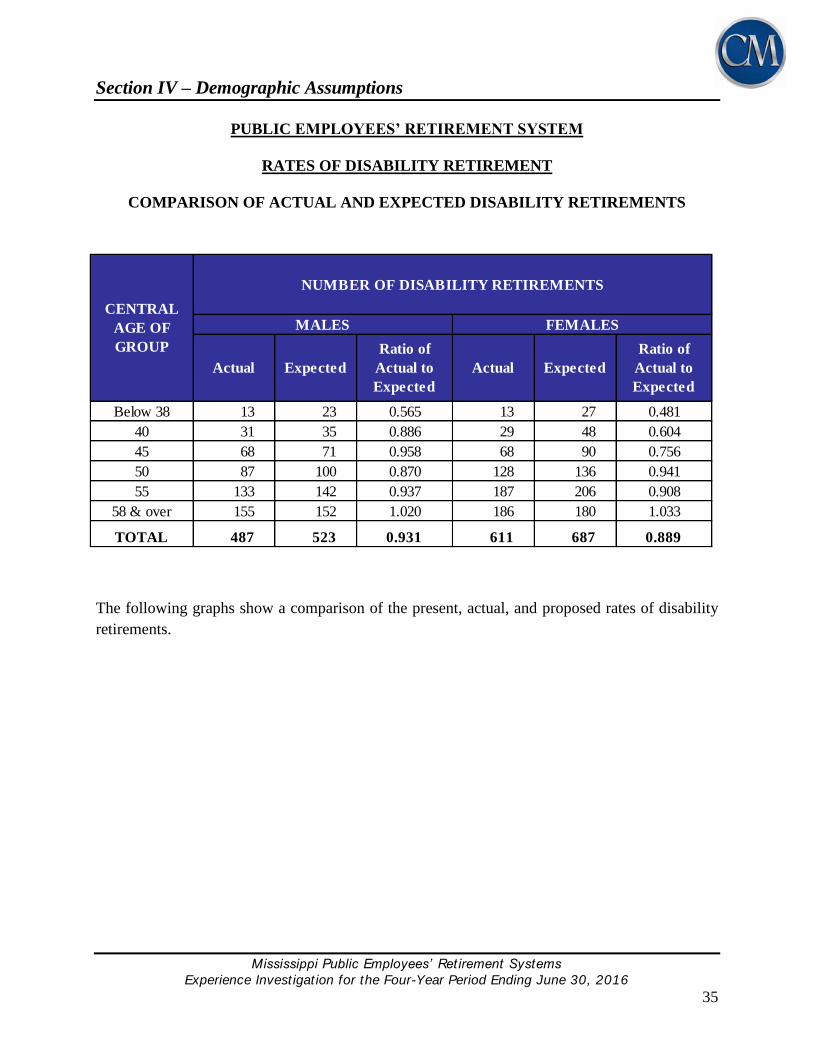
RATES OF DISABILITY RETIREMENT
COMPARISON OF ACTUAL AND EXPECTED DISABILITY RETIREMENTS
Below 38 13 23 0.565 13 27 0.481
40 31 35 0.886 29 48 0.604
45 68 71 0.958 68 90 0.756
50 87 100 0.870 128 136 0.941
55 133 142 0.937 187 206 0.908
58 & over 155 152 1.020 186 180 1.033
Actual Expected
Ratio of
Actual to
Expected
Actual Expected
Ratio of
Actual to
Expected
TOTAL 487 523 0.931 611 687 0.889
CENTRAL
AGE OF
GROUP
NUMBER OF DISABILITY RETIREMENTS
MALES FEMALES
The following graphs show a comparison of the present, actual, and proposed rates of disability
retirements.
Section IV – Demographic Assumptions
Mississippi Public Employees’ Retirement Systems
Experience Invest igat ion for the Four-Year Period Ending June 30, 2016
36
0.0000
0.0010
0.0020
0.0030
0.0040
0.0050
0.0060
Below 38 40 45 50 55 58 & Over
AGE
Disability Rates - Males
Actual Rate Expected Rate Proposed Rate
0.0000
0.0010
0.0020
0.0030
0.0040
0.0050
0.0060
Below 38 40 45 50 55 58 & Over
AGE
Disability Rates - Females
Actual Rate Expected Rate Proposed Rate
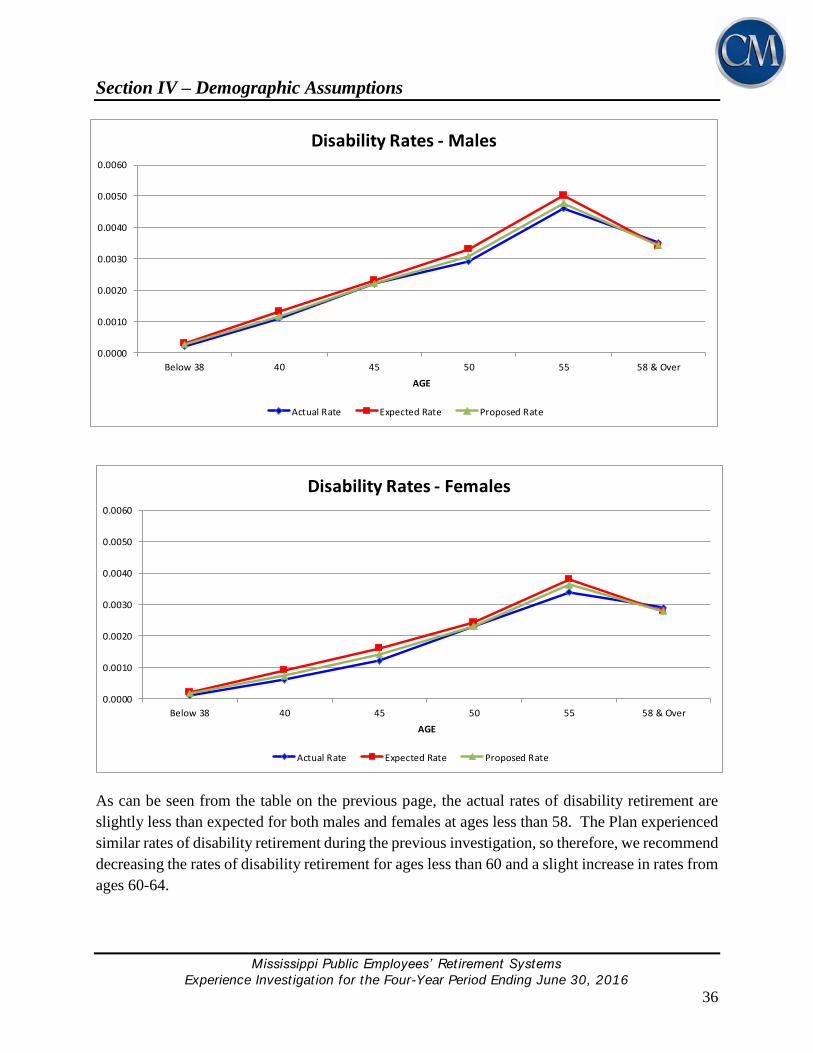
As can be seen from the table on the previous page, the actual rates of disability retirement are
slightly less than expected for both males and females at ages less than 58. The Plan experienced
similar rates of disability retirement during the previous investigation, so therefore, we recommend
decreasing the rates of disability retirement for ages less than 60 and a slight increase in rates from
ages 60-64.
Section IV – Demographic Assumptions
Mississippi Public Employees’ Retirement Systems
Experience Invest igat ion for the Four-Year Period Ending June 30, 2016
37
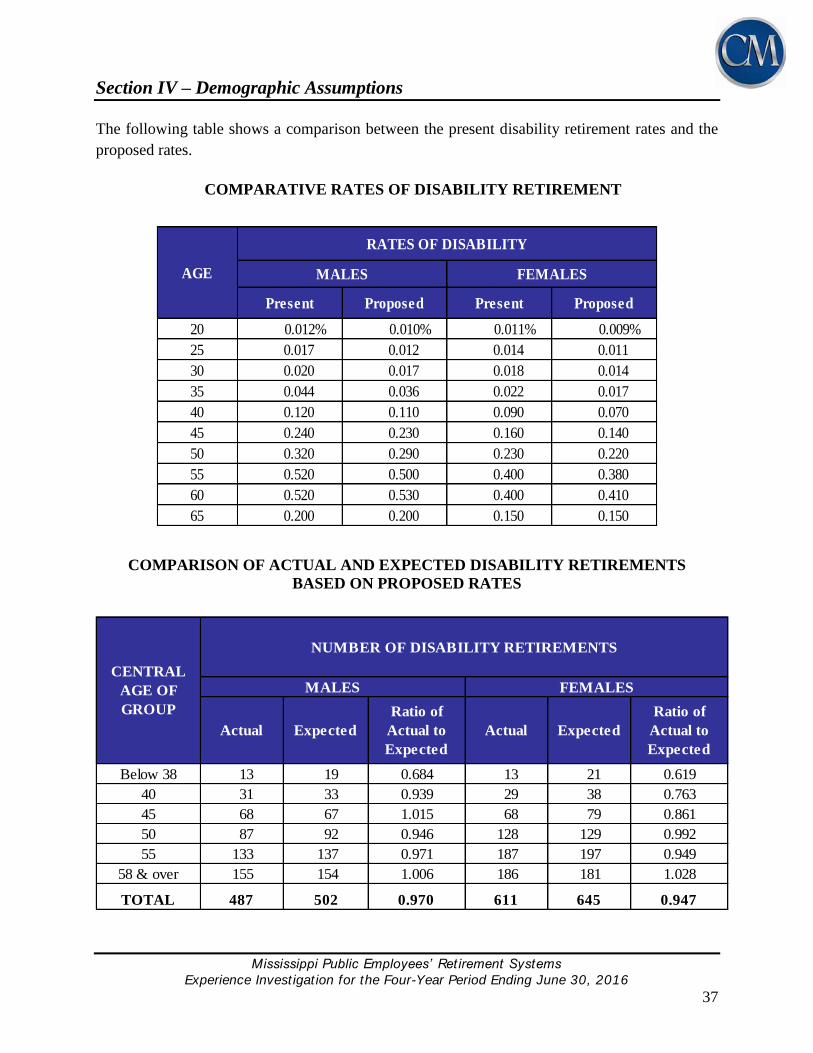
The following table shows a comparison between the present disability retirement rates and the
proposed rates.
COMPARATIVE RATES OF DISABILITY RETIREMENT
Present Proposed Present Proposed
20 0.012% 0.010% 0.011% 0.009%
25 0.017 0.012 0.014 0.011
30 0.020 0.017 0.018 0.014
35 0.044 0.036 0.022 0.017
40 0.120 0.110 0.090 0.070
45 0.240 0.230 0.160 0.140
50 0.320 0.290 0.230 0.220
55 0.520 0.500 0.400 0.380
60 0.520 0.530 0.400 0.410
65 0.200 0.200 0.150 0.150
AGE
RATES OF DISABILITY
MALES FEMALES
COMPARISON OF ACTUAL AND EXPECTED DISABILITY RETIREMENTS
BASED ON PROPOSED RATES
Below 38 13 19 0.684 13 21 0.619
40 31 33 0.939 29 38 0.763
45 68 67 1.015 68 79 0.861
50 87 92 0.946 128 129 0.992
55 133 137 0.971 187 197 0.949
58 & over 155 154 1.006 186 181 1.028
MALES FEMALES
Actual Expected
645 0.947
Ratio of
Actual to
Expected
Actual Expected
Ratio of
Actual to
Expected
TOTAL 487 502 0.970 611
CENTRAL
AGE OF
GROUP
NUMBER OF DISABILITY RETIREMENTS

Section IV – Demographic Assumptions
Mississippi Public Employees’ Retirement Systems
Experience Invest igat ion for the Four-Year Period Ending June 30, 2016
38
PUBLIC EMPLOYEES’ RETIREMENT SYSTEM
RATES OF RETIREMENT
COMPARISON OF ACTUAL AND EXPECTED RETIREMENTS
Retirements with less than 25 years of service
60 323 277 1.166 775 673 1.152
61 259 253 1.024 567 478 1.186
62 509 479 1.063 806 716 1.126
63 390 332 1.175 582 548 1.062
64 254 240 1.058 448 431 1.039
65 382 330 1.158 614 550 1.116
66 250 238 1.050 440 366 1.202
67 183 157 1.166 257 210 1.224
68 131 111 1.180 157 144 1.090
69 136 111 1.225 134 110 1.218
70 92 87 1.057 123 103 1.194
71 81 75 1.080 80 71 1.127
72 63 63 1.000 56 53 1.057
73 44 49 0.898 39 43 0.907
74 44 44 1.000 49 34 1.441
Subtotal 3,141 2,846 1.104 5,127 4,530 1.132
75 & Over 228 981 0.232 148 562 0.263
AGE OF
GROUP
NUMBER OF RETIREMENTS
MALES FEMALES
Actual Expected
Ratio of
Actual to
Expected
Actual Expected
Ratio of
Actual to
Expected
GRAND
TOTAL 3,369 3,827 0.880 5,275 5,092 1.036
Section IV – Demographic Assumptions
Mississippi Public Employees’ Retirement Systems
Experience Invest igat ion for the Four-Year Period Ending June 30, 2016
39
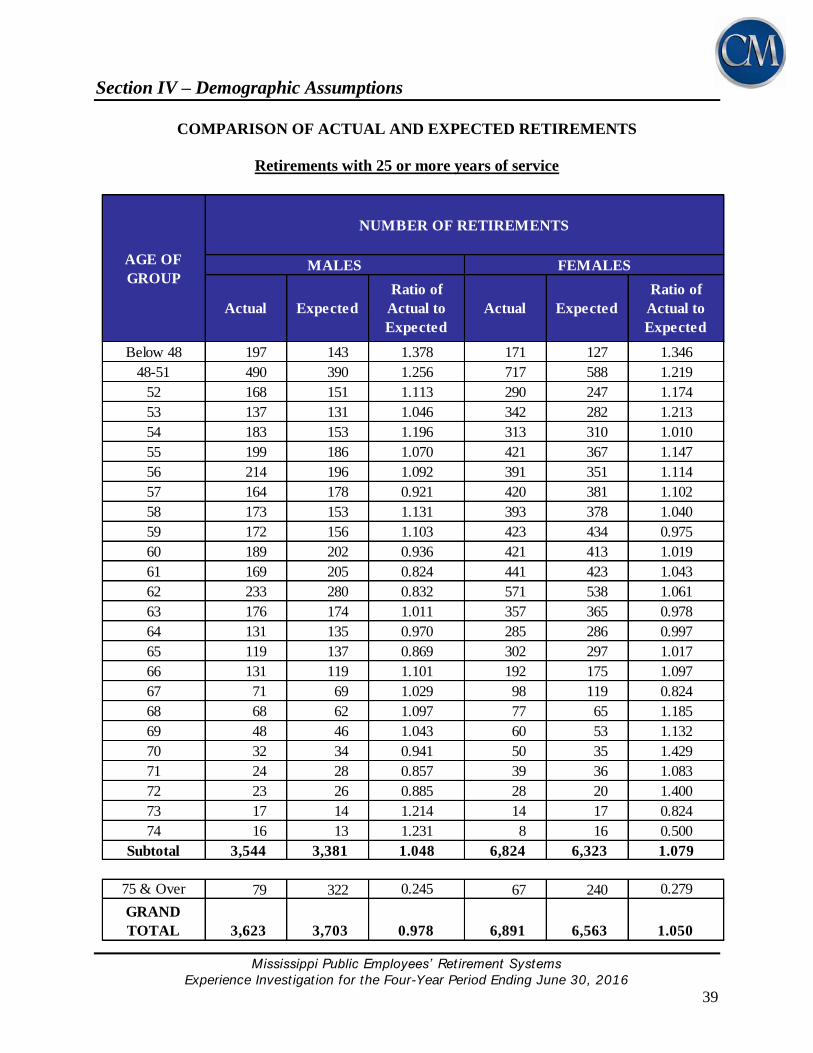
COMPARISON OF ACTUAL AND EXPECTED RETIREMENTS
Retirements with 25 or more years of service
Below 48 197 143 1.378 171 127 1.346
48-51 490 390 1.256 717 588 1.219
52 168 151 1.113 290 247 1.174
53 137 131 1.046 342 282 1.213
54 183 153 1.196 313 310 1.010
55 199 186 1.070 421 367 1.147
56 214 196 1.092 391 351 1.114
57 164 178 0.921 420 381 1.102
58 173 153 1.131 393 378 1.040
59 172 156 1.103 423 434 0.975
60 189 202 0.936 421 413 1.019
61 169 205 0.824 441 423 1.043
62 233 280 0.832 571 538 1.061
63 176 174 1.011 357 365 0.978
64 131 135 0.970 285 286 0.997
65 119 137 0.869 302 297 1.017
66 131 119 1.101 192 175 1.097
67 71 69 1.029 98 119 0.824
68 68 62 1.097 77 65 1.185
69 48 46 1.043 60 53 1.132
70 32 34 0.941 50 35 1.429
71 24 28 0.857 39 36 1.083
72 23 26 0.885 28 20 1.400
73 17 14 1.214 14 17 0.824
74 16 13 1.231 8 16 0.500
Subtotal 3,544 3,381 1.048 6,824 6,323 1.079
75 & Over 79 322 0.245 67 240 0.279
AGE OF
GROUP
NUMBER OF RETIREMENTS
MALES FEMALES
Actual Expected
Ratio of
Actual to
Expected
Actual Expected
Ratio of
Actual to
Expected
GRAND
TOTAL 3,623 3,703 0.978 6,891 6,563 1.050
Section IV – Demographic Assumptions
Mississippi Public Employees’ Retirement Systems
Experience Invest igat ion for the Four-Year Period Ending June 30, 2016
40
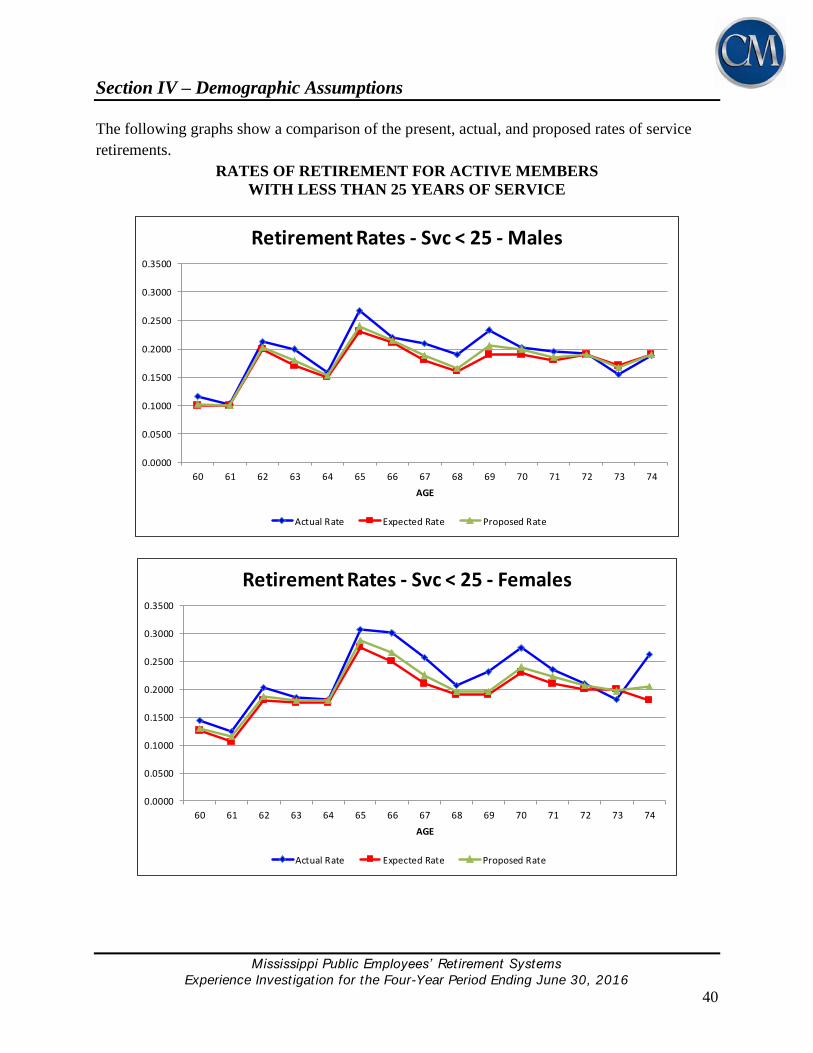
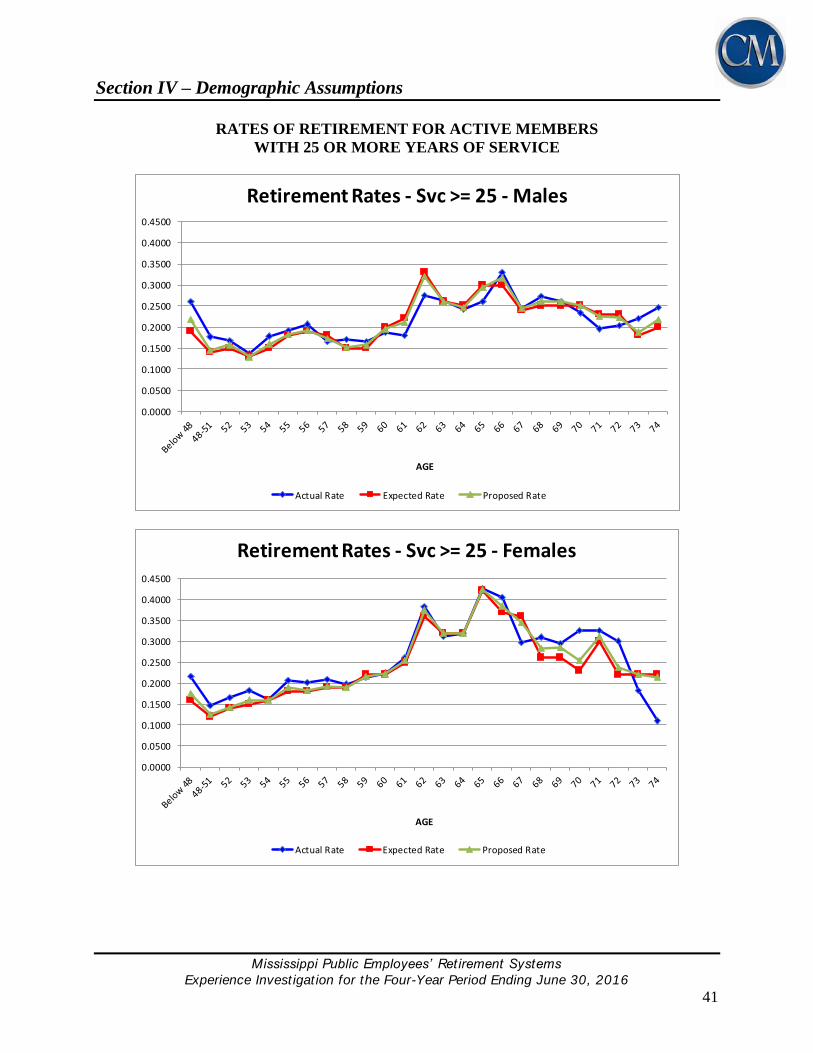
The following graphs show a comparison of the present, actual, and proposed rates of service
retirements.
RATES OF RETIREMENT FOR ACTIVE MEMBERS
WITH LESS THAN 25 YEARS OF SERVICE
0.0000
0.0500
0.1000
0.1500
0.2000
0.2500
0.3000
0.3500
60 61 62 63 64 65 66 67 68 69 70 71 72 73 74
AGE
Retirement Rates - Svc < 25 - Males
Actual Rate Expected Rate Proposed Rate
0.0000
0.0500
0.1000
0.1500
0.2000
0.2500
0.3000
0.3500
60 61 62 63 64 65 66 67 68 69 70 71 72 73 74
AGE
Retirement Rates - Svc < 25 - Females
Actual Rate Expected Rate Proposed Rate
Section IV – Demographic Assumptions
Mississippi Public Employees’ Retirement Systems
Experience Invest igat ion for the Four-Year Period Ending June 30, 2016
41
RATES OF RETIREMENT FOR ACTIVE MEMBERS
WITH 25 OR MORE YEARS OF SERVICE
0.0000
0.0500
0.1000
0.1500
0.2000
0.2500
0.3000
0.3500
0.4000
0.4500
AGE
Retirement Rates - Svc >= 25 - Males
Actual Rate Expected Rate Proposed Rate
0.0000
0.0500
0.1000
0.1500
0.2000
0.2500
0.3000
0.3500
0.4000
0.4500
AGE
Retirement Rates - Svc >= 25 - Females
Actual Rate Expected Rate Proposed Rate

Section IV – Demographic Assumptions
Mississippi Public Employees’ Retirement Systems
Experience Invest igat ion for the Four-Year Period Ending June 30, 2016
42
As can be seen from the previous 4 pages, the actual rates of service retirement, for both under 25
years and over 25 years are very close to expected at almost all ages. However, we do recommend
an increase in the rates of retirement at younger ages once a member reaches 25 years of service
for both males and females and some very minor adjustments at other ages to better reflect
experience of the System.
The following table shows a comparison between the present retirement rates and the proposed
rates.
COMPARATIVE RATES OF RETIREMENT
Present Proposed Present Proposed Present Proposed Present Proposed
45 19.00% 21.75% 16.00% 17.50%
50 14.00 14.50 12.00 12.50
55 18.00 18.25 18.00 19.00
60 10.00% 10.25% 20.00 19.50 12.50% 13.00% 22.00 22.25
62 20.00 20.25 33.00 32.00 18.00 18.75 36.00 37.50
65 23.00 24.00 30.00 29.50 27.50 28.75 42.00 42.50
70 19.00 20.00 25.00 25.00 23.00 24.00 23.00 25.50
75 100.00 100.00 100.00 100.00 100.00 100.00 100.00 100.00
Under 25 Years of
Service
25 Years of Service
and Over
AGE
RATES OF SERVICE RETIREMENT*
FEMALESMALES
25 Years of Service
and Over
Under 25 Years of
Service
* The proposed changes shown above are used for Tier 4 service retirements as well, except
the 25 years of service is 30 years of service for these members.
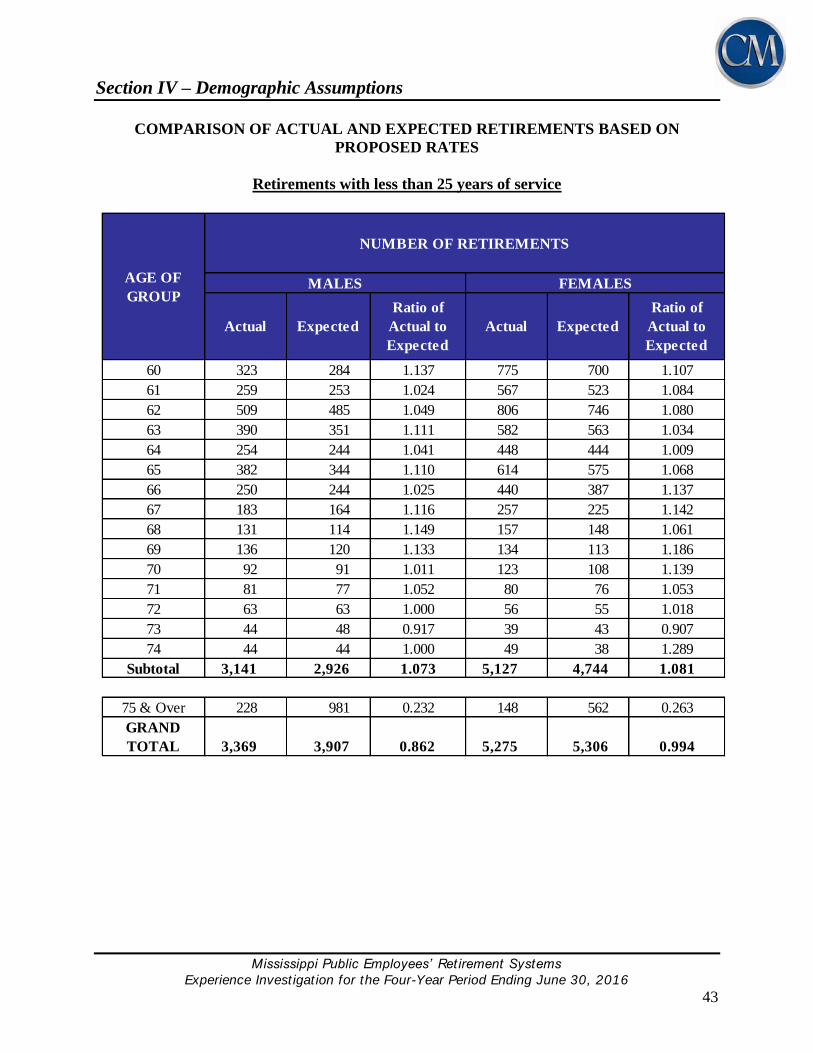
Section IV – Demographic Assumptions
Mississippi Public Employees’ Retirement Systems
Experience Invest igat ion for the Four-Year Period Ending June 30, 2016
43
COMPARISON OF ACTUAL AND EXPECTED RETIREMENTS BASED ON
PROPOSED RATES
Retirements with less than 25 years of service
60 323 284 1.137 775 700 1.107
61 259 253 1.024 567 523 1.084
62 509 485 1.049 806 746 1.080
63 390 351 1.111 582 563 1.034
64 254 244 1.041 448 444 1.009
65 382 344 1.110 614 575 1.068
66 250 244 1.025 440 387 1.137
67 183 164 1.116 257 225 1.142
68 131 114 1.149 157 148 1.061
69 136 120 1.133 134 113 1.186
70 92 91 1.011 123 108 1.139
71 81 77 1.052 80 76 1.053
72 63 63 1.000 56 55 1.018
73 44 48 0.917 39 43 0.907
74 44 44 1.000 49 38 1.289
Subtotal 3,141 2,926 1.073 5,127 4,744 1.081
75 & Over 228 981 0.232 148 562 0.263
AGE OF
GROUP
NUMBER OF RETIREMENTS
MALES FEMALES
Actual Expected
Ratio of
Actual to
Expected
Actual Expected
Ratio of
Actual to
Expected
GRAND
TOTAL 3,369 3,907 0.862 5,275 5,306 0.994
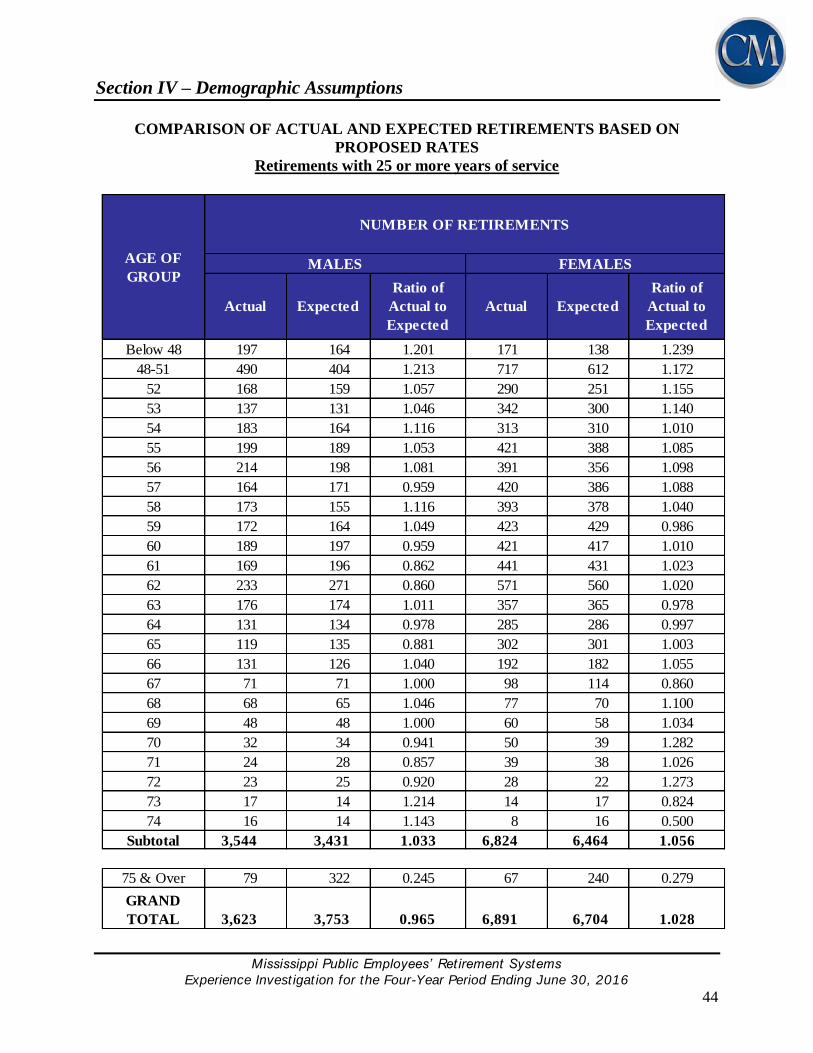
Section IV – Demographic Assumptions
Mississippi Public Employees’ Retirement Systems
Experience Invest igat ion for the Four-Year Period Ending June 30, 2016
44
COMPARISON OF ACTUAL AND EXPECTED RETIREMENTS BASED ON
PROPOSED RATES
Retirements with 25 or more years of service
Below 48 197 164 1.201 171 138 1.239
48-51 490 404 1.213 717 612 1.172
52 168 159 1.057 290 251 1.155
53 137 131 1.046 342 300 1.140
54 183 164 1.116 313 310 1.010
55 199 189 1.053 421 388 1.085
56 214 198 1.081 391 356 1.098
57 164 171 0.959 420 386 1.088
58 173 155 1.116 393 378 1.040
59 172 164 1.049 423 429 0.986
60 189 197 0.959 421 417 1.010
61 169 196 0.862 441 431 1.023
62 233 271 0.860 571 560 1.020
63 176 174 1.011 357 365 0.978
64 131 134 0.978 285 286 0.997
65 119 135 0.881 302 301 1.003
66 131 126 1.040 192 182 1.055
67 71 71 1.000 98 114 0.860
68 68 65 1.046 77 70 1.100
69 48 48 1.000 60 58 1.034
70 32 34 0.941 50 39 1.282
71 24 28 0.857 39 38 1.026
72 23 25 0.920 28 22 1.273
73 17 14 1.214 14 17 0.824
74 16 14 1.143 8 16 0.500
Subtotal 3,544 3,431 1.033 6,824 6,464 1.056
75 & Over 79 322 0.245 67 240 0.279
AGE OF
GROUP
NUMBER OF RETIREMENTS
MALES FEMALES
Actual Expected
Ratio of
Actual to
Expected
Actual Expected
Ratio of
Actual to
Expected
GRAND
TOTAL 3,623 3,753 0.965 6,891 6,704 1.028

Section IV – Demographic Assumptions
Mississippi Public Employees’ Retirement Systems
Experience Invest igat ion for the Four-Year Period Ending June 30, 2016
45
PUBLIC EMPLOYEES’ RETIREMENT SYSTEM
RATES OF POST-RETIREMENT MORTALITY
COMPARISON OF ACTUAL AND EXPECTED CASES OF
POST-RETIREMENT DEATHS
Below 53 17 16 1.063 18 14 1.286
55 33 44 0.750 34 49 0.694
60 133 117 1.137 128 161 0.795
65 343 350 0.980 365 436 0.837
70 525 511 1.027 549 589 0.932
75 706 628 1.124 688 704 0.977
80 783 715 1.095 943 847 1.113
85 797 713 1.118 1,233 1,064 1.159
90 535 465 1.151 1,095 927 1.181
95 210 173 1.214 629 512 1.229
98 & over 40 43 0.930 205 185 1.108
Below 48 14 16 0.875 22 10 2.200
50 16 25 0.640 22 19 1.158
55 47 44 1.068 53 38 1.395
60 74 72 1.028 85 61 1.393
65 93 89 1.045 63 74 0.851
70 76 68 1.118 70 66 1.061
75 59 50 1.180 35 56 0.625
80 29 30 0.967 41 44 0.932
85 24 15 1.600 19 24 0.792
88 & over 5 9 0.556 24 23 1.043
Actual Expected
Ratio of
Actual to
Expected
Actual Expected
Ratio of
Actual to
Expected
SERVICE RETIREMENTS AND BENEFICIARIES
CENTRAL
AGE OF
GROUP
DISABILITY RETIREMENTS
TOTAL 4,122 3,775 1.092 5,887 5,488 1.073
NUMBER OF POST-RETIREMENT DEATHS
MALES FEMALES
TOTAL 437 418 1.045 434 415 1.046
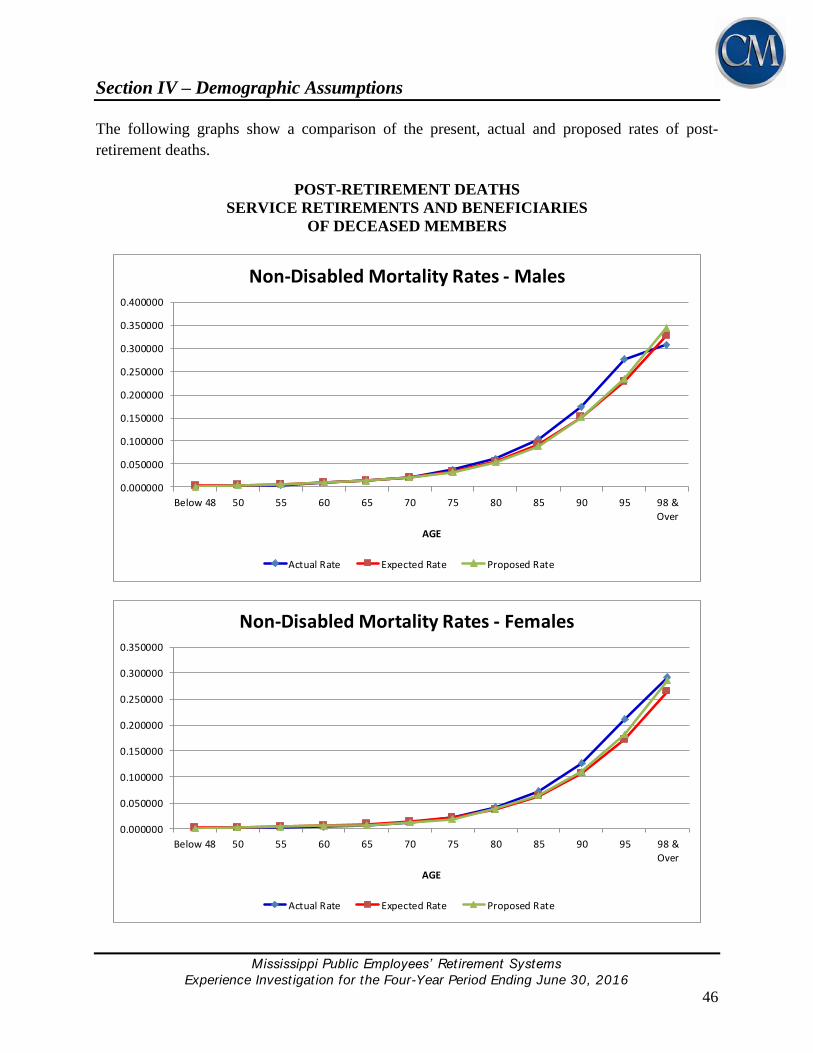
Section IV – Demographic Assumptions
Mississippi Public Employees’ Retirement Systems
Experience Invest igat ion for the Four-Year Period Ending June 30, 2016
46
The following graphs show a comparison of the present, actual and proposed rates of post-
retirement deaths.
POST-RETIREMENT DEATHS
SERVICE RETIREMENTS AND BENEFICIARIES
OF DECEASED MEMBERS
0.000000
0.050000
0.100000
0.150000
0.200000
0.250000
0.300000
0.350000
0.400000
Below 48 50 55 60 65 70 75 80 85 90 95 98 &
Over
AGE
Non-Disabled Mortality Rates - Males
Actual Rate Expected Rate Proposed Rate
0.000000
0.050000
0.100000
0.150000
0.200000
0.250000
0.300000
0.350000
Below 48 50 55 60 65 70 75 80 85 90 95 98 &
Over
AGE
Non-Disabled Mortality Rates - Females
Actual Rate Expected Rate Proposed Rate
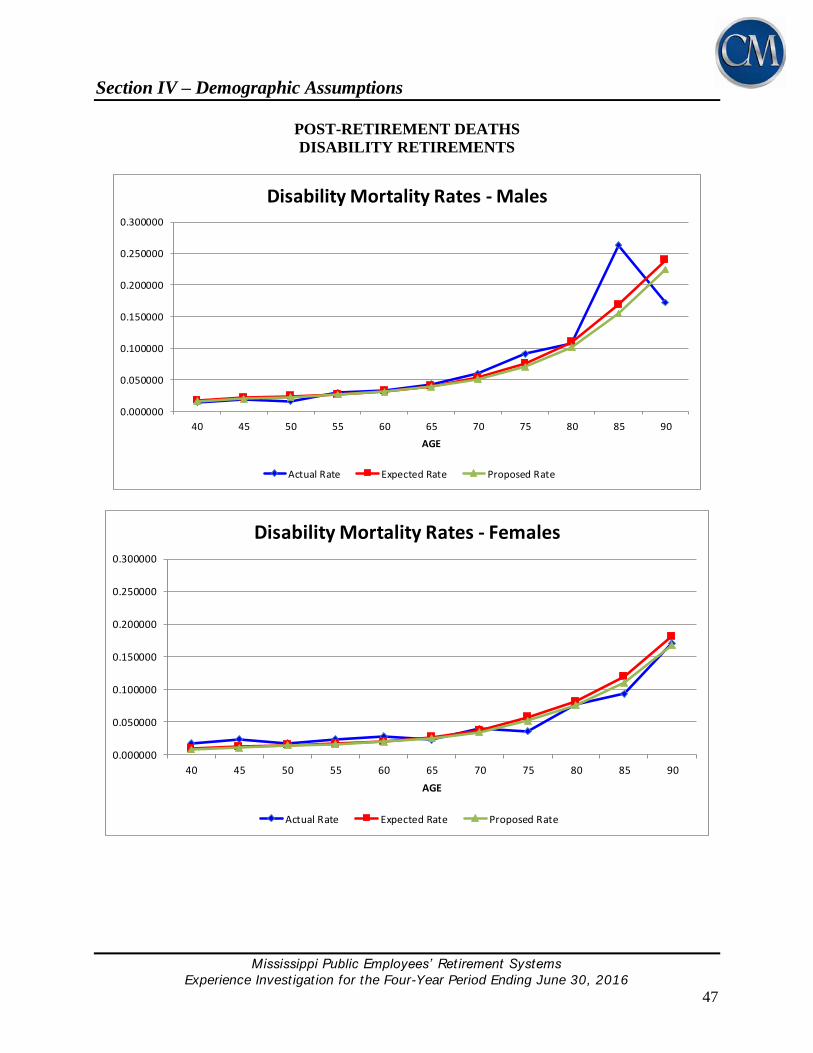
Section IV – Demographic Assumptions
Mississippi Public Employees’ Retirement Systems
Experience Invest igat ion for the Four-Year Period Ending June 30, 2016
47
POST-RETIREMENT DEATHS
DISABILITY RETIREMENTS
0.000000
0.050000
0.100000
0.150000
0.200000
0.250000
0.300000
40 45 50 55 60 65 70 75 80 85 90
AGE
Disability Mortality Rates - Males
Actual Rate Expected Rate Proposed Rate
0.000000
0.050000
0.100000
0.150000
0.200000
0.250000
0.300000
40 45 50 55 60 65 70 75 80 85 90
AGE
Disability Mortality Rates - Females
Actual Rate Expected Rate Proposed Rate

Section IV – Demographic Assumptions
Mississippi Public Employees’ Retirement Systems
Experience Invest igat ion for the Four-Year Period Ending June 30, 2016
48
The current basis for rate of post-retirement mortality for service retirees and beneficiaries is the
static mortality table, RP-2014 Healthy Annuitant Blue Collar Table projected with Scale BB to
2016 with male rates set forward one year. The current basis for post-retirement mortality for
disability retirements is the RP-2014 Disabled Retiree table set forward 5 years for males and 4
years for females.
The results of the experience analysis indicate that this table actually provides a reasonable margin
for future mortality improvements (7-9%). In fact, the PERS plan experienced a very small gain
due to post-retirement mortality for the 2016 valuation. So, therefore, we are only recommending
a slight adjustment to the current mortality table to accommodate a reasonable margin going
forward. We recommend continuation of the RP-2014 Healthy Annuitant Blue Collar Table
projected with Scale BB to 2022 with male rates set forward one year and adjusted by 106% for
males at all ages and as follows for females: 90% for ages less than 76, 95% for age 76, 105% for
age 78 and 1.10% for ages 79 and greater. These adjustments provide a better fit to expected post-
retirement deaths in the future. We also recommend adoption of the RP-2014 Disabled Retiree
Table set forward 4 years for males and 3 years for females. The following table shows a
comparison between the present and proposed rates of mortality.

Section IV – Demographic Assumptions
Mississippi Public Employees’ Retirement Systems
Experience Invest igat ion for the Four-Year Period Ending June 30, 2016
49
COMPARATIVE RATES OF POST-RETIREMENT MORTALITY
Present Proposed Present Proposed
55 0.6396% 0.6659% 0.3985% 0.3481%
60 0.8974 0.9047 0.5621 0.4763
65 1.3437 1.3141 0.8517 0.7130
70 2.0935 2.0267 1.3633 1.1412
75 3.3706 3.2631 2.2423 1.8771
80 5.5724 5.3947 3.7254 3.8115
85 9.3496 9.0513 6.3460 6.4928
90 15.8265 15.8263 10.9418 11.2631
35 1.0997% 1.0420% 0.5027% 0.4669%
40 1.7039 1.5340 0.8112 0.7286
45 2.0395 1.9757 1.1352 1.0787
50 2.3369 2.2791 1.3992 1.3494
55 2.6604 2.5868 1.6447 1.5931
60 3.1685 3.0433 1.9884 1.9028
65 4.0346 3.8253 2.6348 2.4702
70 5.4287 5.0965 3.7962 3.5148
75 7.6616 7.1235 5.6372 5.2059
80 11.3303 10.4436 8.3652 7.7357
85 17.3005 15.8714 12.2939 11.3909
90 24.7169 23.1944 18.1474 16.7890
DISABILITY RETIREMENTS
AGE
RATES OF POST-RETIREMENT DEATH
MALES FEMALES
SERVICE RETIREMENTS & BENEFICIARIES OF DECEASED MEMBERS
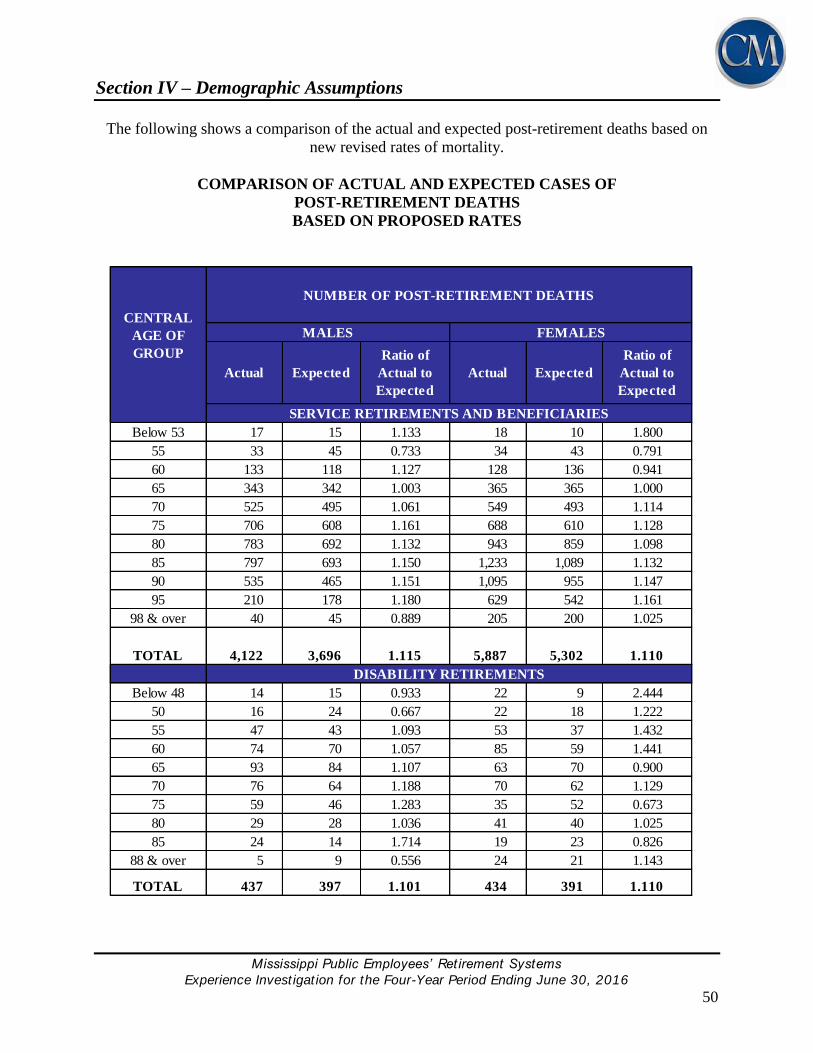
Section IV – Demographic Assumptions
Mississippi Public Employees’ Retirement Systems
Experience Invest igat ion for the Four-Year Period Ending June 30, 2016
50
The following shows a comparison of the actual and expected post-retirement deaths based on
new revised rates of mortality.
COMPARISON OF ACTUAL AND EXPECTED CASES OF
POST-RETIREMENT DEATHS
BASED ON PROPOSED RATES
Below 53 17 15 1.133 18 10 1.800
55 33 45 0.733 34 43 0.791
60 133 118 1.127 128 136 0.941
65 343 342 1.003 365 365 1.000
70 525 495 1.061 549 493 1.114
75 706 608 1.161 688 610 1.128
80 783 692 1.132 943 859 1.098
85 797 693 1.150 1,233 1,089 1.132
90 535 465 1.151 1,095 955 1.147
95 210 178 1.180 629 542 1.161
98 & over 40 45 0.889 205 200 1.025
Below 48 14 15 0.933 22 9 2.444
50 16 24 0.667 22 18 1.222
55 47 43 1.093 53 37 1.432
60 74 70 1.057 85 59 1.441
65 93 84 1.107 63 70 0.900
70 76 64 1.188 70 62 1.129
75 59 46 1.283 35 52 0.673
80 29 28 1.036 41 40 1.025
85 24 14 1.714 19 23 0.826
88 & over 5 9 0.556 24 21 1.143
MALES FEMALES
Actual Expected
Ratio of
Actual to
Expected
Actual Expected
Ratio of
Actual to
Expected
3,696 1.115 5,887 5,302 1.110
SERVICE RETIREMENTS AND BENEFICIARIES
DISABILITY RETIREMENTS
TOTAL 4,122
CENTRAL
AGE OF
GROUP
NUMBER OF POST-RETIREMENT DEATHS
397 1.101 434 391 1.110TOTAL 437
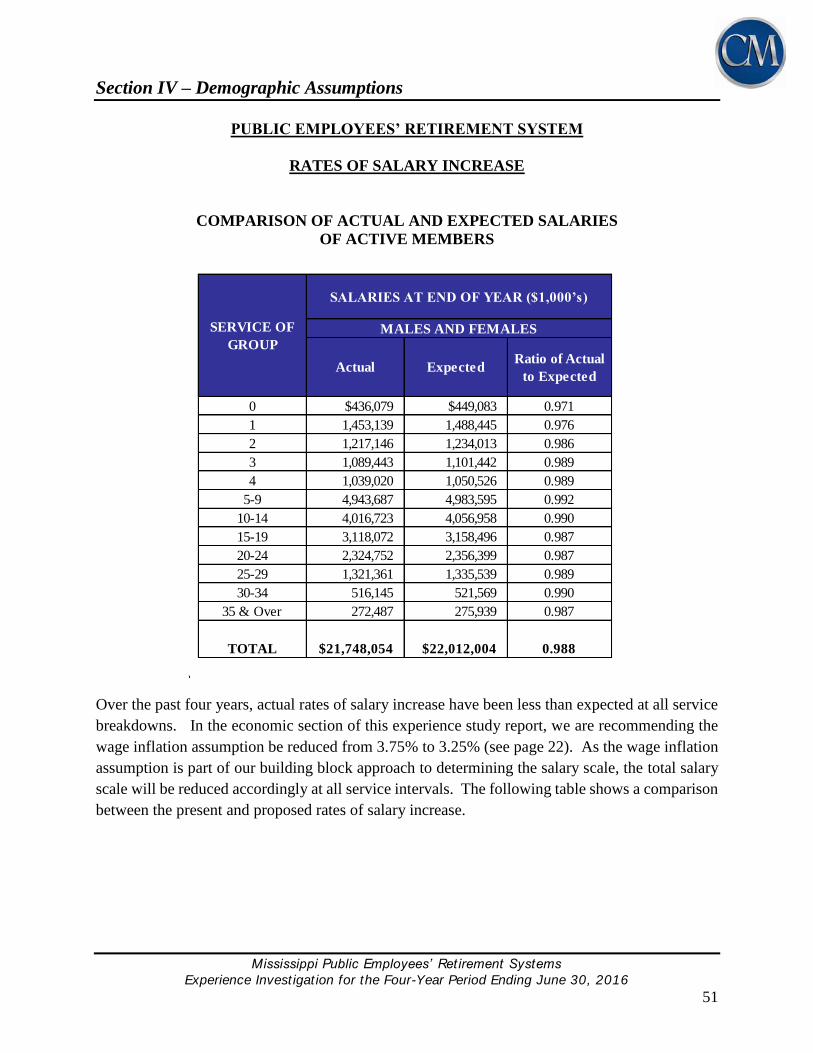
Section IV – Demographic Assumptions
Mississippi Public Employees’ Retirement Systems
Experience Invest igat ion for the Four-Year Period Ending June 30, 2016
51
PUBLIC EMPLOYEES’ RETIREMENT SYSTEM
RATES OF SALARY INCREASE
COMPARISON OF ACTUAL AND EXPECTED SALARIES
OF ACTIVE MEMBERS
0 $436,079 $449,083 0.971
1 1,453,139 1,488,445 0.976
2 1,217,146 1,234,013 0.986
3 1,089,443 1,101,442 0.989
4 1,039,020 1,050,526 0.989
5-9 4,943,687 4,983,595 0.992
10-14 4,016,723 4,056,958 0.990
15-19 3,118,072 3,158,496 0.987
20-24 2,324,752 2,356,399 0.987
25-29 1,321,361 1,335,539 0.989
30-34 516,145 521,569 0.990
35 & Over 272,487 275,939 0.987
$21,748,054 $22,012,004
SALARIES AT END OF YEAR ($1,000’s)
MALES AND FEMALES
Ratio of Actual
to Expected
0.988
SERVICE OF
GROUP
Actual Expected
TOTAL
Over the past four years, actual rates of salary increase have been less than expected at all service
breakdowns. In the economic section of this experience study report, we are recommending the
wage inflation assumption be reduced from 3.75% to 3.25% (see page 22). As the wage inflation
assumption is part of our building block approach to determining the salary scale, the total salary
scale will be reduced accordingly at all service intervals. The following table shows a comparison
between the present and proposed rates of salary increase.
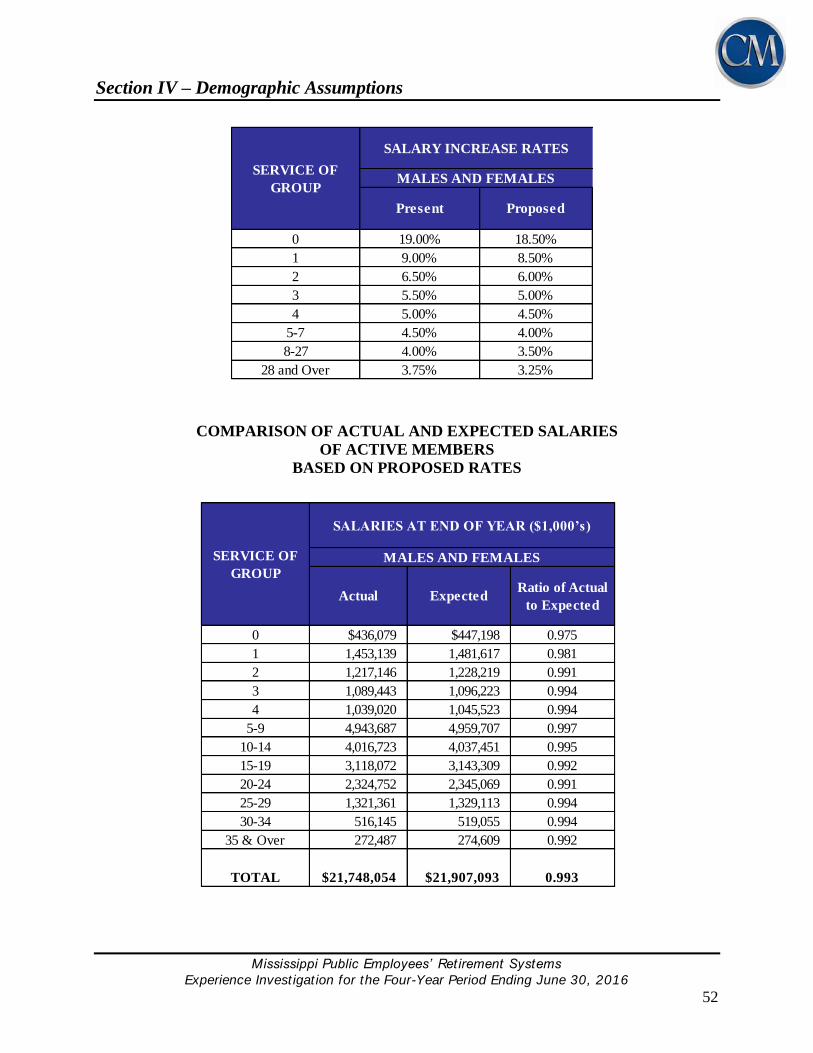
Section IV – Demographic Assumptions
Mississippi Public Employees’ Retirement Systems
Experience Invest igat ion for the Four-Year Period Ending June 30, 2016
52
0 19.00% 18.50%
1 9.00% 8.50%
2 6.50% 6.00%
3 5.50% 5.00%
4 5.00% 4.50%
5-7 4.50% 4.00%
8-27 4.00% 3.50%
28 and Over 3.75% 3.25%
Proposed
SERVICE OF
GROUP
SALARY INCREASE RATES
MALES AND FEMALES
Present
COMPARISON OF ACTUAL AND EXPECTED SALARIES
OF ACTIVE MEMBERS
BASED ON PROPOSED RATES
0 $436,079 $447,198 0.975
1 1,453,139 1,481,617 0.981
2 1,217,146 1,228,219 0.991
3 1,089,443 1,096,223 0.994
4 1,039,020 1,045,523 0.994
5-9 4,943,687 4,959,707 0.997
10-14 4,016,723 4,037,451 0.995
15-19 3,118,072 3,143,309 0.992
20-24 2,324,752 2,345,069 0.991
25-29 1,321,361 1,329,113 0.994
30-34 516,145 519,055 0.994
35 & Over 272,487 274,609 0.992
TOTAL $21,748,054 $21,907,093 0.993
SERVICE OF
GROUP
SALARIES AT END OF YEAR ($1,000’s)
MALES AND FEMALES
Actual ExpectedRatio of Actual
to Expected
Section IV – Demographic Assumptions
Mississippi Public Employees’ Retirement Systems
Experience Invest igat ion for the Four-Year Period Ending June 30, 2016
53
PUBLIC EMPLOYEES’ RETIREMENT SYSTEM
OTHER ASSUMPTIONS
DEFERRED VESTEDS: Currently, the valuation assumes 60% of participants that leave the
System as deferred vested will receive a deferred benefit upon attaining the eligibility requirements
for retirement. During this investigation period, the plan experienced an estimated 58%
assumption. Therefore, we recommend no change at this time.
DEATH ASSUMPTION: Currently, it is assumed that 6% of active member deaths are in the
line of duty and 94% of active member deaths are not in the line of duty. During the experience
investigation period, about 5.7% of active deaths each year were in the line of duty so, therefore,
we recommend no change in this assumption at this time.
DISABILITY ASSUMPTION: Currently, it is assumed that 6% of active member disabilities
are in the line of duty and 94% of active member disabilities are not in the line of duty. During
the experience investigation period, an average of about 9% of disabilities each year were in the
line of duty, but this average was largely due to an unusually high number of line of duty
disabilities in the 2015-2016 plan year. During the last experience study, the average for the period
was 7%. Therefore, we recommend that the assumption be changed so that 7% of active
member disabilities are assumed to be in the line of duty and 93% of active member
disabilities are assumed to be not in the line of duty.
PERCENT MARRIED: Currently, 85% of active members are assumed to be married and elect
a joint & survivor payment form. We are not provided with marital status on the census data so
we review this assumption based on the number of retirements that choose Joint and Survivor
Options. While not the most ideal method to develop this assumption, we believe the current
assumption is fairly conservative and recommend no change at this time.
SPOUSE AGE DIFFERENCE: Currently, for married members, it is assumed a male is three
years older than his spouse. We have reviewed this assumption and recommend no change at
this time.
UNUSED LEAVE: Currently, we assume that participants will have on average 0.50 years of
unused leave (sick and personal) at retirement. We reviewed this assumption for those participants
who retired during this four year period and the average number of years of unused leave was 0.62
years. Therefore, we recommend no change at this time.

Section IV – Demographic Assumptions
Mississippi Public Employees’ Retirement Systems
Experience Invest igat ion for the Four-Year Period Ending June 30, 2016
54
MILITARY SERVICE: Currently, we assume that participants will have on average 0.25 years
of military service at retirement. We reviewed this assumption for those participants who retired
during this four year period and the average number of years of military service was 0.25 years.
Therefore, we recommend no change at this time.
ASSUMED INTEREST RATE ON EMPLOYEE CONTRIBUTIONS: 2.00%
OTHER ASSUMPTION LOADS: Varying loads dependent on age are made for pre-retirement
dependent children option and for disability dependent children options. We recommend no
change at this time.
OPTION FACTORS: The option factors, currently in use by all of the Retirement Systems, are
based on the mortality table and investment rate of return (discount rate) used in the valuation.
We recommend that the factors be revised to be based on the proposed mortality table and
the investment rate of return recommended for the valuation.

Section V – HSPRS Summary of Results
Mississippi Public Employees’ Retirement Systems
Experience Invest igat ion for the Four-Year Period Ending June 30, 2016
55
HIGHWAY SAFETY PATROL RETIREMENT SYSTEM
SUMMARY OF RESULTS
Over the period of this investigation, we have noted the following observations:
There were 54 actual withdrawals versus 30 expected withdrawals over the four year period
of this investigation. In the prior investigation, the number of actual withdrawals was
nearly equal the number of expected withdrawals. At this time, we recommend an
increase in rates of withdrawal.
There were 63 actual retirements versus 81 expected retirements over the four-year period
of this investigation. There are numerous members eligible to retire that we expect to retire
in the next few years. Therefore, we do not recommend a change in the retirement
decrements.
There were two deaths while in active service over the four-year period of this investigation
and there was one death in the prior study. We recommend updating the mortality
assumption to be consistent with our change to PERS.
There were no disability retirements over the four-year period of this investigation
compared to 1 in the prior study. The current rates of disability expect four in the period.
We recommend lowering the disability rates by 25%.
Actual rates of salary increase were lower than expected over the four year period. Since
we recommend lowering the wage inflation assumption from 3.75% to 3.25%, total
expected salary increases will be one-half percent lower.
As mentioned in the PERS section of this report, we recommend that the rates of mortality
for service retirements be revised to match the PERS mortality table, the RP-2014 Healthy
Annuitant Blue Collar Mortality Table Projected with Scale BB to 2022 set forward one
year for males with adjustments. In addition, we recommend that the rates of mortality for
disability retirements be revised to the RP-2014 Disabled Mortality Table set back forward
four years for males and set forward three years for females. We recommend each of the
Systems have the same mortality table.
Section VI – SLRP Summary of Results
Mississippi Public Employees’ Retirement Systems
Experience Invest igat ion for the Four-Year Period Ending June 30, 2016
56
SUPPLEMENTAL LEGISLATIVE RETIREMENT PLAN
SUMMARY OF RESULTS
Over the period of this investigation, we have noted the following observations:
We have reviewed the withdrawal rates for both non-election years and election years. The
number of withdrawals during non-election years (2% of exposed) was not enough to
warrant adding withdrawal rates during these years. The actual number of withdrawals
during the election year was very close to the expected withdrawals (19 vs. 18). We
recommend no change in the rates of withdrawal.
We also reviewed the service retirements rates for both non-election years and election
years. The number of service retirements during non-election years (2% of exposed) was
not enough to warrant adding rates during those years. The actual number of service
retirements during the election year was significantly less than expected (29 vs. 50).
Therefore, we are recommending decreasing the retirement rates.
There were 6 deaths while in active service over the four-year period of this investigation
compared with 2 expected. We recommend updating the mortality assumption to be
consistent with our change to PERS.
There were no disability retirements over the four-year period of this investigation which
is close to what was expected. Therefore, we recommend no change at this time.
Actual salary increases were about 97% of what was expected. In conjunction with the
recommended decrease in the wage inflation assumption, we recommend that the salary
scale be reduced to 3.25% for all ages.
As mentioned in the PERS section of this report, we recommend that the rates of mortality
for service retirements be revised to match the PERS mortality table, the RP-2014 Healthy
Annuitant Blue Collar Mortality Table Projected with Scale BB to 2022 set forward one
year for males with adjustments. In addition, we recommend that the rates of mortality for
disability retirements be revised to the RP-2014 Disabled Mortality Table set back forward
four years for males and set forward three years for females. We recommend each of the
Systems have the same mortality table.

Section VII – MRS Summary of Results
Mississippi Public Employees’ Retirement Systems
Experience Invest igat ion for the Four-Year Period Ending June 30, 2016
57
MUNICIPAL RETIREMENT SYSTEMS
SUMMARY OF RESULTS
Since this is a closed System with very few actives remaining, we have not investigated the active
decrements but have concentrated on the economic assumptions and the post-retirement mortality
experience. Over the period of this investigation, we have found the following observations:
In conjunction with the recommended decrease in the wage inflation assumption, total
expected salary increases will be one-half percent lower.
As mentioned in the PERS section of this report, we recommend that the rates of mortality
for service retirements be revised to match the PERS mortality table, the RP-2014 Healthy
Annuitant Blue Collar Mortality Table Projected with Scale BB to 2022 set forward one
year for males with adjustments. In addition, we recommend that the rates of mortality for
disability retirements be revised to the RP-2014 Disabled Mortality Table set back forward
four years for males and set forward three years for females. We recommend each of the
Systems have the same mortality table.
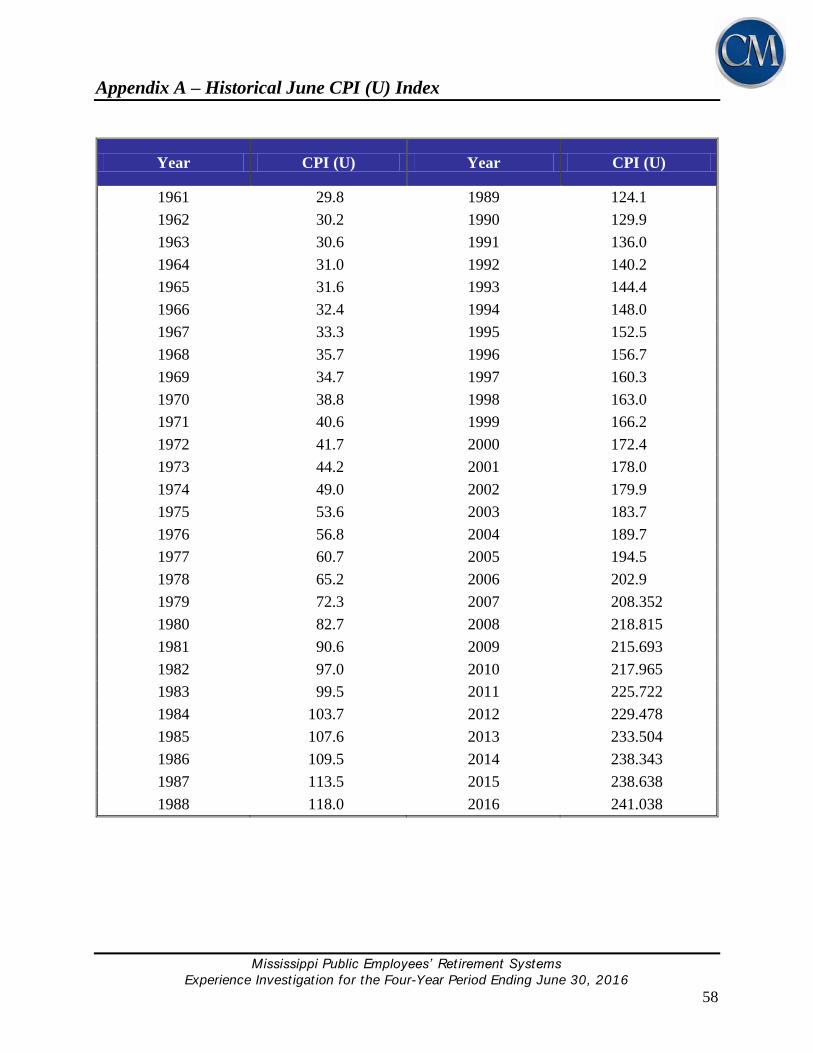
Appendix A – Historical June CPI (U) Index
Mississippi Public Employees’ Retirement Systems
Experience Invest igat ion for the Four-Year Period Ending June 30, 2016
58
Year CPI (U) Year CPI (U)
1961 29.8 1989 124.1
1962 30.2 1990 129.9
1963 30.6 1991 136.0
1964 31.0 1992 140.2
1965 31.6 1993 144.4
1966 32.4 1994 148.0
1967 33.3 1995 152.5
1968 35.7 1996 156.7
1969 34.7 1997 160.3
1970 38.8 1998 163.0
1971 40.6 1999 166.2
1972 41.7 2000 172.4
1973 44.2 2001 178.0
1974 49.0 2002 179.9
1975 53.6 2003 183.7
1976 56.8 2004 189.7
1977 60.7 2005 194.5
1978 65.2 2006 202.9
1979 72.3 2007 208.352
1980 82.7 2008 218.815
1981 90.6 2009 215.693
1982 97.0 2010 217.965
1983 99.5 2011 225.722
1984 103.7 2012 229.478
1985 107.6 2013 233.504
1986 109.5 2014 238.343
1987 113.5 2015 238.638
1988 118.0 2016 241.038
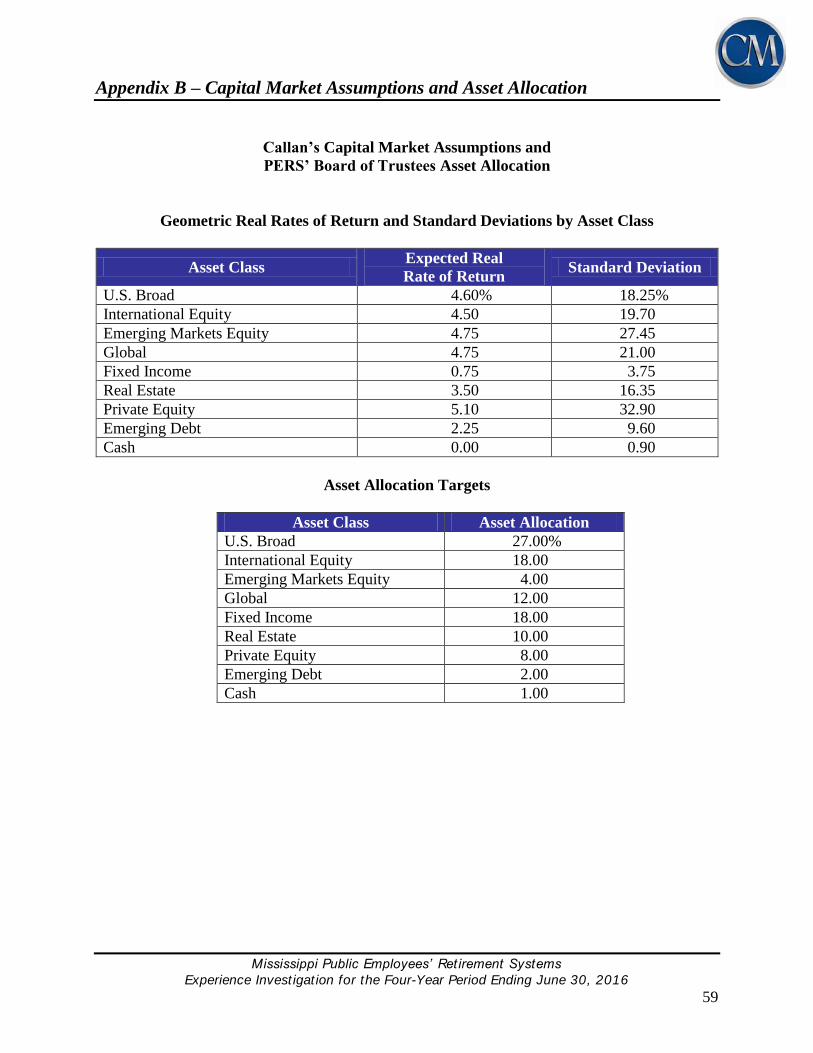
Appendix B – Capital Market Assumptions and Asset Allocation
Mississippi Public Employees’ Retirement Systems
Experience Invest igat ion for the Four-Year Period Ending June 30, 2016
59
Callan’s Capital Market Assumptions and
PERS’ Board of Trustees Asset Allocation
Geometric Real Rates of Return and Standard Deviations by Asset Class
Asset Class Expected Real
Rate of Return Standard Deviation
U.S. Broad 4.60% 18.25%
International Equity 4.50 19.70
Emerging Markets Equity 4.75 27.45
Global 4.75 21.00
Fixed Income 0.75 3.75
Real Estate 3.50 16.35
Private Equity 5.10 32.90
Emerging Debt 2.25 9.60
Cash 0.00 0.90
Asset Allocation Targets
Asset Class Asset Allocation
U.S. Broad 27.00%
International Equity 18.00
Emerging Markets Equity 4.00
Global 12.00
Fixed Income 18.00
Real Estate 10.00
Private Equity 8.00
Emerging Debt 2.00
Cash 1.00
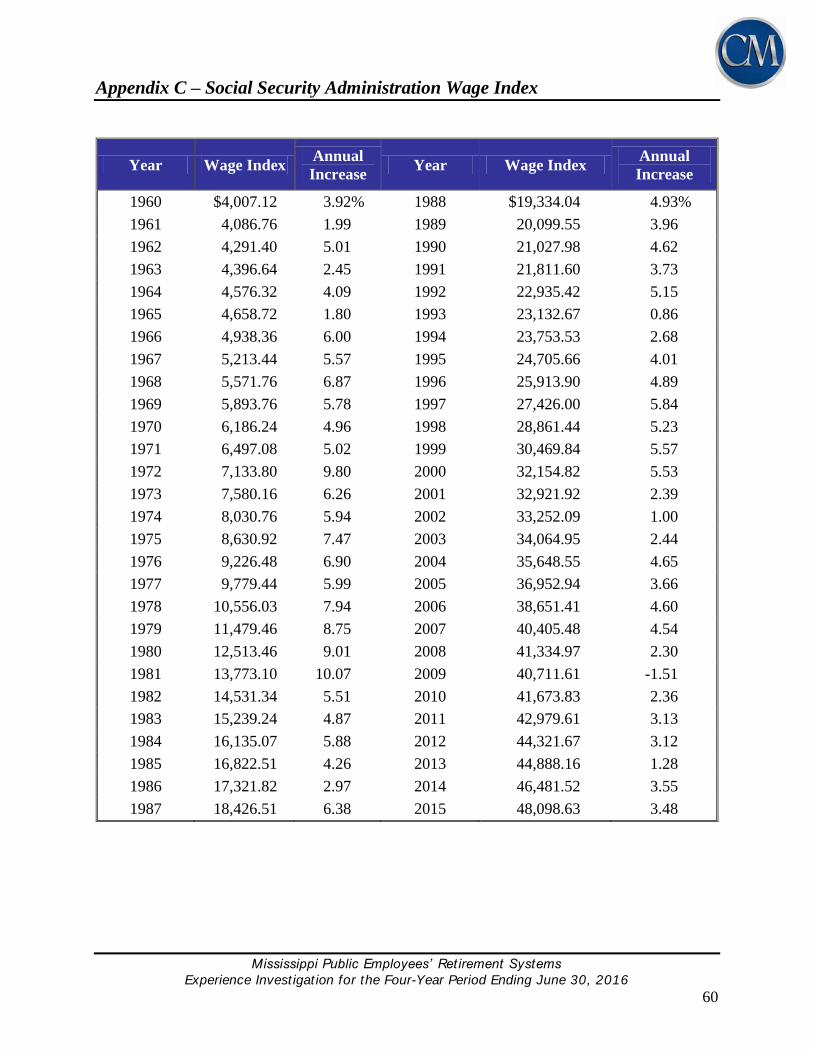
Appendix C – Social Security Administration Wage Index
Mississippi Public Employees’ Retirement Systems
Experience Invest igat ion for the Four-Year Period Ending June 30, 2016
60
Year Wage Index Annual
Increase Year Wage Index
Annual
Increase
1960 $4,007.12 3.92% 1988 $19,334.04 4.93%
1961 4,086.76 1.99 1989 20,099.55 3.96
1962 4,291.40 5.01 1990 21,027.98 4.62
1963 4,396.64 2.45 1991 21,811.60 3.73
1964 4,576.32 4.09 1992 22,935.42 5.15
1965 4,658.72 1.80 1993 23,132.67 0.86
1966 4,938.36 6.00 1994 23,753.53 2.68
1967 5,213.44 5.57 1995 24,705.66 4.01
1968 5,571.76 6.87 1996 25,913.90 4.89
1969 5,893.76 5.78 1997 27,426.00 5.84
1970 6,186.24 4.96 1998 28,861.44 5.23
1971 6,497.08 5.02 1999 30,469.84 5.57
1972 7,133.80 9.80 2000 32,154.82 5.53
1973 7,580.16 6.26 2001 32,921.92 2.39
1974 8,030.76 5.94 2002 33,252.09 1.00
1975 8,630.92 7.47 2003 34,064.95 2.44
1976 9,226.48 6.90 2004 35,648.55 4.65
1977 9,779.44 5.99 2005 36,952.94 3.66
1978 10,556.03 7.94 2006 38,651.41 4.60
1979 11,479.46 8.75 2007 40,405.48 4.54
1980 12,513.46 9.01 2008 41,334.97 2.30
1981 13,773.10 10.07 2009 40,711.61 -1.51
1982 14,531.34 5.51 2010 41,673.83 2.36
1983 15,239.24 4.87 2011 42,979.61 3.13
1984 16,135.07 5.88 2012 44,321.67 3.12
1985 16,822.51 4.26 2013 44,888.16 1.28
1986 17,321.82 2.97 2014 46,481.52 3.55
1987 18,426.51 6.38 2015 48,098.63 3.48
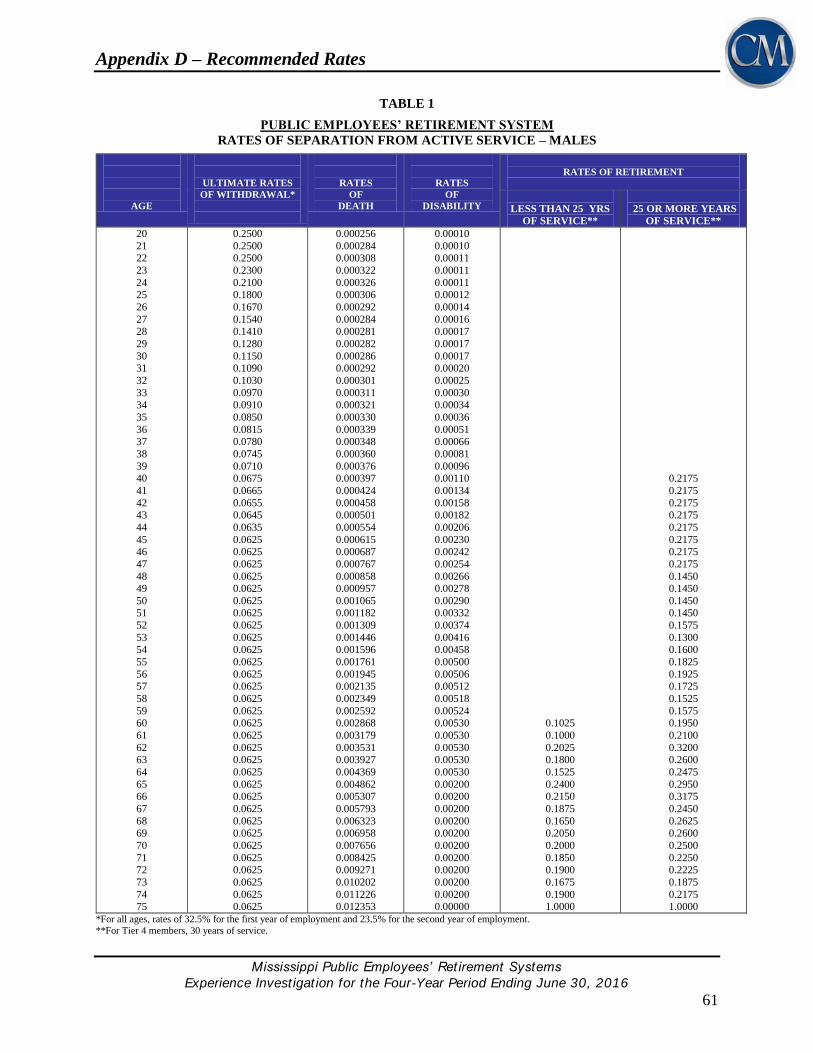
Appendix D – Recommended Rates
Mississippi Public Employees’ Retirement Systems
Experience Invest igat ion for the Four-Year Period Ending June 30, 2016
61
TABLE 1
PUBLIC EMPLOYEES’ RETIREMENT SYSTEM
RATES OF SEPARATION FROM ACTIVE SERVICE – MALES
AGE
ULTIMATE RATES
OF WITHDRAWAL*
RATES
OF
DEATH
RATES
OF
DISABILITY
RATES OF RETIREMENT
LESS THAN 25 YRS
OF SERVICE**
25 OR MORE YEARS
OF SERVICE**
20
21 22
23
24 25
26
27 28
29
30 31
32
33 34
35
36 37
38
39 40
41
42 43
44
45 46
47
48 49
50 51
52
53 54
55
56 57
58
59 60
61
62 63
64
65 66
67
68 69
70
71 72
73
74 75
0.2500
0.2500 0.2500
0.2300
0.2100 0.1800
0.1670
0.1540 0.1410
0.1280
0.1150 0.1090
0.1030
0.0970 0.0910
0.0850
0.0815 0.0780
0.0745
0.0710 0.0675
0.0665
0.0655 0.0645
0.0635
0.0625 0.0625
0.0625
0.0625 0.0625
0.0625 0.0625
0.0625
0.0625 0.0625
0.0625
0.0625 0.0625
0.0625
0.0625 0.0625
0.0625
0.0625 0.0625
0.0625
0.0625 0.0625
0.0625
0.0625 0.0625
0.0625
0.0625 0.0625
0.0625
0.0625 0.0625
0.000256
0.000284 0.000308
0.000322
0.000326 0.000306
0.000292
0.000284 0.000281
0.000282
0.000286 0.000292
0.000301
0.000311 0.000321
0.000330
0.000339 0.000348
0.000360
0.000376 0.000397
0.000424
0.000458 0.000501
0.000554
0.000615 0.000687
0.000767
0.000858 0.000957
0.001065 0.001182
0.001309
0.001446 0.001596
0.001761
0.001945 0.002135
0.002349
0.002592 0.002868
0.003179
0.003531 0.003927
0.004369
0.004862 0.005307
0.005793
0.006323 0.006958
0.007656
0.008425 0.009271
0.010202
0.011226 0.012353
0.00010
0.00010 0.00011
0.00011
0.00011 0.00012
0.00014
0.00016 0.00017
0.00017
0.00017 0.00020
0.00025
0.00030 0.00034
0.00036
0.00051 0.00066
0.00081
0.00096 0.00110
0.00134
0.00158 0.00182
0.00206
0.00230 0.00242
0.00254
0.00266 0.00278
0.00290 0.00332
0.00374
0.00416 0.00458
0.00500
0.00506 0.00512
0.00518
0.00524 0.00530
0.00530
0.00530 0.00530
0.00530
0.00200 0.00200
0.00200
0.00200 0.00200
0.00200
0.00200 0.00200
0.00200
0.00200 0.00000
0.1025
0.1000
0.2025 0.1800
0.1525
0.2400 0.2150
0.1875
0.1650 0.2050
0.2000
0.1850 0.1900
0.1675
0.1900 1.0000
0.2175
0.2175
0.2175 0.2175
0.2175
0.2175 0.2175
0.2175
0.1450 0.1450
0.1450 0.1450
0.1575
0.1300 0.1600
0.1825
0.1925 0.1725
0.1525
0.1575 0.1950
0.2100
0.3200 0.2600
0.2475
0.2950 0.3175
0.2450
0.2625 0.2600
0.2500
0.2250 0.2225
0.1875
0.2175 1.0000
*For all ages, rates of 32.5% for the first year of employment and 23.5% for the second year of employment.
**For Tier 4 members, 30 years of service.
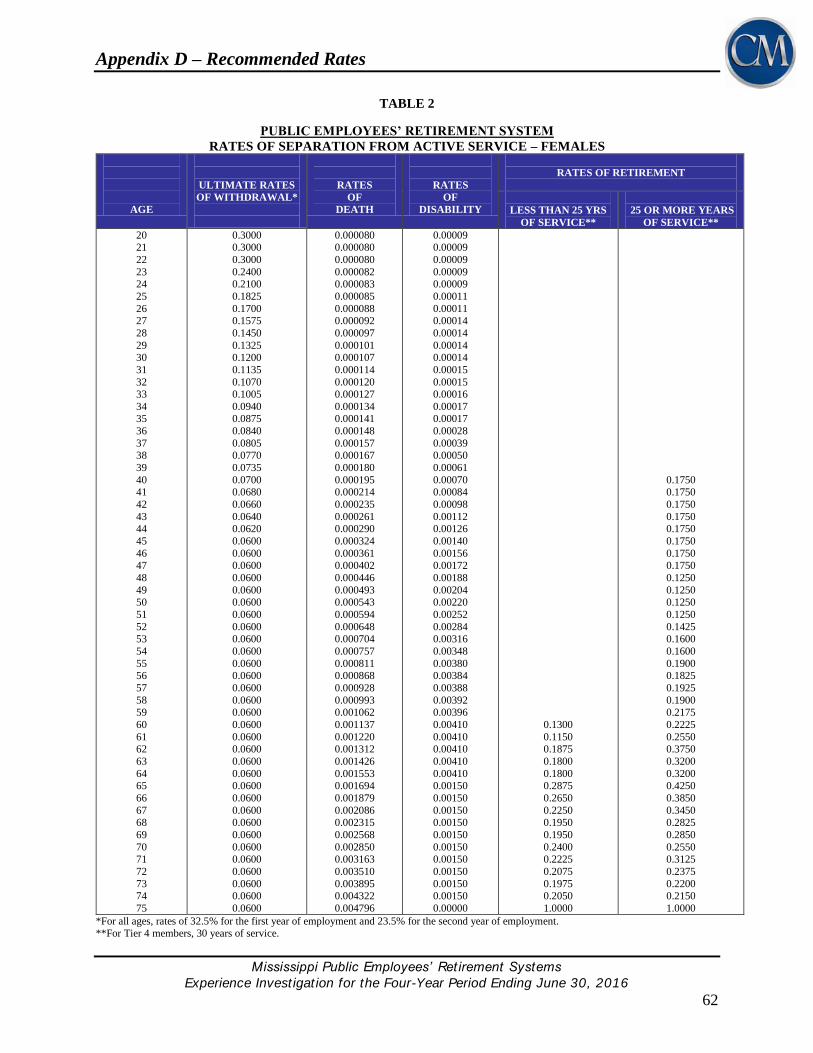
Appendix D – Recommended Rates
Mississippi Public Employees’ Retirement Systems
Experience Invest igat ion for the Four-Year Period Ending June 30, 2016
62
TABLE 2
PUBLIC EMPLOYEES’ RETIREMENT SYSTEM
RATES OF SEPARATION FROM ACTIVE SERVICE – FEMALES
AGE
ULTIMATE RATES
OF WITHDRAWAL*
RATES
OF
DEATH
RATES
OF
DISABILITY
RATES OF RETIREMENT
LESS THAN 25 YRS
OF SERVICE**
25 OR MORE YEARS
OF SERVICE**
20 21
22
23 24
25
26 27
28
29 30
31
32 33
34 35
36
37 38
39
40 41
42
43 44
45
46 47
48
49 50
51
52 53
54
55 56
57
58 59
60
61 62
63
64 65
66
67 68
69
70 71
72
73 74
75
0.3000 0.3000
0.3000
0.2400 0.2100
0.1825
0.1700 0.1575
0.1450
0.1325 0.1200
0.1135
0.1070 0.1005
0.0940 0.0875
0.0840
0.0805 0.0770
0.0735
0.0700 0.0680
0.0660
0.0640 0.0620
0.0600
0.0600 0.0600
0.0600
0.0600 0.0600
0.0600
0.0600 0.0600
0.0600
0.0600 0.0600
0.0600
0.0600 0.0600
0.0600
0.0600 0.0600
0.0600
0.0600 0.0600
0.0600
0.0600 0.0600
0.0600
0.0600 0.0600
0.0600
0.0600 0.0600
0.0600
0.000080 0.000080
0.000080
0.000082 0.000083
0.000085
0.000088 0.000092
0.000097
0.000101 0.000107
0.000114
0.000120 0.000127
0.000134 0.000141
0.000148
0.000157 0.000167
0.000180
0.000195 0.000214
0.000235
0.000261 0.000290
0.000324
0.000361 0.000402
0.000446
0.000493 0.000543
0.000594
0.000648 0.000704
0.000757
0.000811 0.000868
0.000928
0.000993 0.001062
0.001137
0.001220 0.001312
0.001426
0.001553 0.001694
0.001879
0.002086 0.002315
0.002568
0.002850 0.003163
0.003510
0.003895 0.004322
0.004796
0.00009 0.00009
0.00009
0.00009 0.00009
0.00011
0.00011 0.00014
0.00014
0.00014 0.00014
0.00015
0.00015 0.00016
0.00017 0.00017
0.00028
0.00039 0.00050
0.00061
0.00070 0.00084
0.00098
0.00112 0.00126
0.00140
0.00156 0.00172
0.00188
0.00204 0.00220
0.00252
0.00284 0.00316
0.00348
0.00380 0.00384
0.00388
0.00392 0.00396
0.00410
0.00410 0.00410
0.00410
0.00410 0.00150
0.00150
0.00150 0.00150
0.00150
0.00150 0.00150
0.00150
0.00150 0.00150
0.00000
0.1300
0.1150 0.1875
0.1800
0.1800 0.2875
0.2650
0.2250 0.1950
0.1950
0.2400 0.2225
0.2075
0.1975 0.2050
1.0000
0.1750 0.1750
0.1750
0.1750 0.1750
0.1750
0.1750 0.1750
0.1250
0.1250 0.1250
0.1250
0.1425 0.1600
0.1600
0.1900 0.1825
0.1925
0.1900 0.2175
0.2225
0.2550 0.3750
0.3200
0.3200 0.4250
0.3850
0.3450 0.2825
0.2850
0.2550 0.3125
0.2375
0.2200 0.2150
1.0000
*For all ages, rates of 32.5% for the first year of employment and 23.5% for the second year of employment. **For Tier 4 members, 30 years of service.
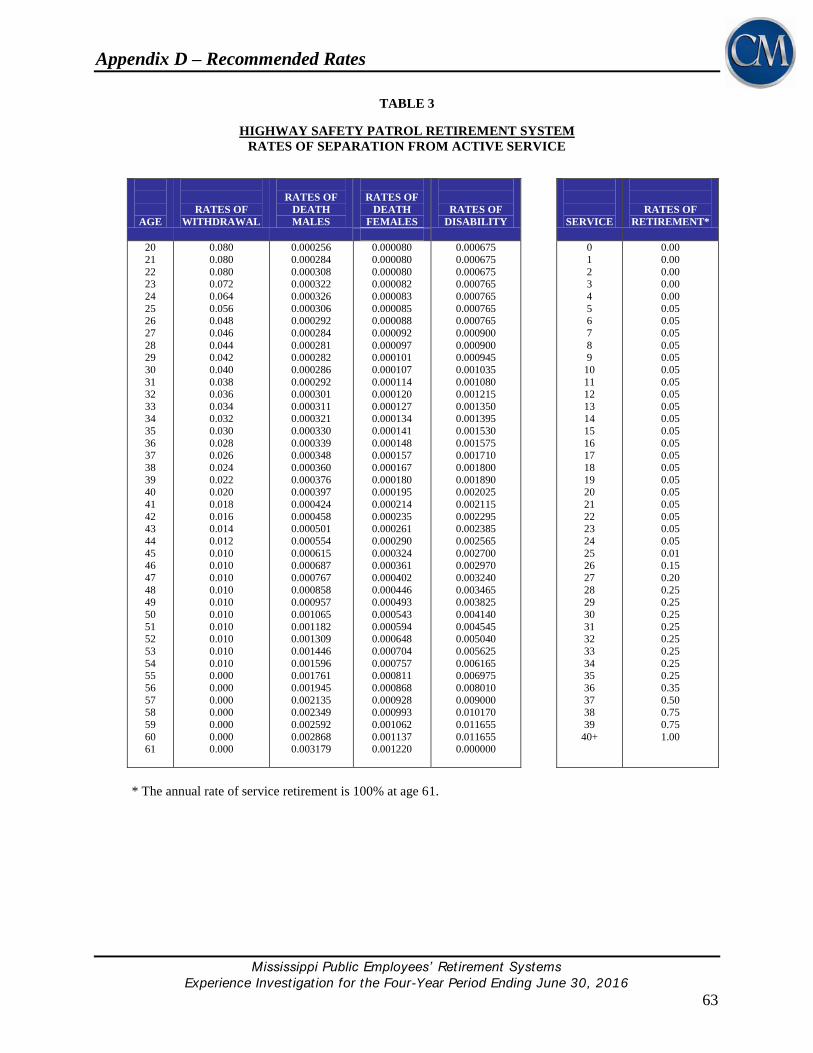
Appendix D – Recommended Rates
Mississippi Public Employees’ Retirement Systems
Experience Invest igat ion for the Four-Year Period Ending June 30, 2016
63
TABLE 3
HIGHWAY SAFETY PATROL RETIREMENT SYSTEM
RATES OF SEPARATION FROM ACTIVE SERVICE
AGE
RATES OF
WITHDRAWAL
RATES OF
DEATH
MALES
RATES OF
DEATH
FEMALES
RATES OF
DISABILITY
SERVICE
RATES OF
RETIREMENT*
20
21
22 23
24
25 26
27
28 29
30
31 32
33 34
35
36 37
38
39 40
41
42 43
44
45 46
47
48 49
50
51 52
53
54 55
56
57 58
59
60 61
0.080
0.080
0.080 0.072
0.064
0.056 0.048
0.046
0.044 0.042
0.040
0.038 0.036
0.034 0.032
0.030
0.028 0.026
0.024
0.022 0.020
0.018
0.016 0.014
0.012
0.010 0.010
0.010
0.010 0.010
0.010
0.010 0.010
0.010
0.010 0.000
0.000
0.000 0.000
0.000
0.000 0.000
0.000256
0.000284
0.000308 0.000322
0.000326
0.000306 0.000292
0.000284
0.000281 0.000282
0.000286
0.000292 0.000301
0.000311 0.000321
0.000330
0.000339 0.000348
0.000360
0.000376 0.000397
0.000424
0.000458 0.000501
0.000554
0.000615 0.000687
0.000767
0.000858 0.000957
0.001065
0.001182 0.001309
0.001446
0.001596 0.001761
0.001945
0.002135 0.002349
0.002592
0.002868 0.003179
0.000080
0.000080
0.000080 0.000082
0.000083
0.000085 0.000088
0.000092
0.000097 0.000101
0.000107
0.000114 0.000120
0.000127 0.000134
0.000141
0.000148 0.000157
0.000167
0.000180 0.000195
0.000214
0.000235 0.000261
0.000290
0.000324 0.000361
0.000402
0.000446 0.000493
0.000543
0.000594 0.000648
0.000704
0.000757 0.000811
0.000868
0.000928 0.000993
0.001062
0.001137 0.001220
0.000675
0.000675
0.000675 0.000765
0.000765
0.000765 0.000765
0.000900
0.000900 0.000945
0.001035
0.001080 0.001215
0.001350 0.001395
0.001530
0.001575 0.001710
0.001800
0.001890 0.002025
0.002115
0.002295 0.002385
0.002565
0.002700 0.002970
0.003240
0.003465 0.003825
0.004140
0.004545 0.005040
0.005625
0.006165 0.006975
0.008010
0.009000 0.010170
0.011655
0.011655 0.000000
0
1
2 3
4
5 6
7
8 9
10
11 12
13 14
15
16 17
18
19 20
21
22 23
24
25 26
27
28 29
30
31 32
33
34 35
36
37 38
39
40+
0.00
0.00
0.00 0.00
0.00
0.05 0.05
0.05
0.05 0.05
0.05
0.05 0.05
0.05 0.05
0.05
0.05 0.05
0.05
0.05 0.05
0.05
0.05 0.05
0.05
0.01 0.15
0.20
0.25 0.25
0.25
0.25 0.25
0.25
0.25 0.25
0.35
0.50 0.75
0.75
1.00
* The annual rate of service retirement is 100% at age 61.

Appendix D – Recommended Rates
Mississippi Public Employees’ Retirement Systems
Experience Invest igat ion for the Four-Year Period Ending June 30, 2016
64
TABLE 4
SUPPLEMENTAL LEGISLATIVE RETIREMENT SYSTEM
RATES OF SEPARATION FROM ACTIVE SERVICE
RATES OF DEATH RATES OF
AGE MALES FEMALES DISABILITY
20
21
22 23
24
25
26
27
28
29 30
31
32
33
34
35
36
37 38
39
40
41
42
43
44
45 46
47
48
49
50
51
52 53
54
55
56
57
58
59
60 61
62
63
64
65
66
67
68 69
70
71
72
73
74
75 76
77
78
79
80
0.000256
0.000284
0.000308 0.000322
0.000326
0.000306
0.000292
0.000284
0.000281
0.000282 0.000286
0.000292
0.000301
0.000311
0.000321
0.000330
0.000339
0.000348 0.000360
0.000376
0.000397
0.000424
0.000458
0.000501
0.000554
0.000615 0.000687
0.000767
0.000858
0.000957
0.001065
0.001182
0.001309 0.001446
0.001596
0.001761
0.001945
0.002135
0.002349
0.002592
0.002868 0.003179
0.003531
0.003927
0.004369
0.004862
0.005307
0.005793
0.006323 0.006958
0.007656
0.008425
0.009271
0.010202
0.011226
0.012353 0.013594
0.014959
0.016461
0.018114
0.019932
0.000080
0.000080
0.000080 0.000082
0.000083
0.000085
0.000088
0.000092
0.000097
0.000101 0.000107
0.000114
0.000120
0.000127
0.000134
0.000141
0.000148
0.000157 0.000167
0.000180
0.000195
0.000214
0.000235
0.000261
0.000290
0.000324 0.000361
0.000402
0.000446
0.000493
0.000543
0.000594
0.000648 0.000704
0.000757
0.000811
0.000868
0.000928
0.000993
0.001062
0.001137 0.001220
0.001312
0.001426
0.001553
0.001694
0.001879
0.002086
0.002315 0.002568
0.002850
0.003163
0.003510
0.003895
0.004322
0.004796 0.005322
0.005906
0.006554
0.007273
0.008071
0.0004
0.0004
0.0005 0.0005
0.0005
0.0005
0.0006
0.0006
0.0007
0.0007 0.0007
0.0008
0.0009
0.0010
0.0011
0.0011
0.0012
0.0013 0.0014
0.0016
0.0017
0.0018
0.0019
0.0021
0.0022
0.0023 0.0025
0.0026
0.0027
0.0028
0.0030
0.0031
0.0032 0.0033
0.0034
0.0035
0.0036
0.0037
0.0038
0.0039
0.0040 0.0041
0.0042
0.0044
0.0045
0.0000
0.0000
0.0000
0.0000 0.0000
0.0000
0.0000
0.0000
0.0000
0.0000
0.0000 0.0000
0.0000
0.0000
0.0000
0.0000
Withdrawal and Vesting: 20% in an election year, none in a non-election year.
Service Retirement: 30% in an election year, none in a non-election year. All members assumed to retire no later than age 80.

Appendix D – Recommended Rates
Mississippi Public Employees’ Retirement Systems
Experience Invest igat ion for the Four-Year Period Ending June 30, 2016
65
TABLE 5
MUNICIPAL RETIREMENT SYSTEM
RATES OF SEPARATION FROM ACTIVE SERVICE
AGE
RATES OF
WITHDRAWAL
RATES
OF
DEATH
RATES
OF
DISABILITY
RATES OF RETIREMENT
SERVICE
RATE*
20
21 22
23
24 25
26
27
28
29
30 31
32
33 34
35 36
37
38 39
40
41 42
43
44 45
46
47 48
49
50 51
52
53 54
55
56 57
58
59 60
61
62 63
64
65
0.10650
0.10248 0.09846
0.09444
0.09042 0.08640
0.08286
0.07932
0.07578
0.07224
0.06870 0.06468
0.06066
0.05664 0.05262
0.04860 0.04482
0.04104
0.03726 0.03348
0.02970
0.02664 0.02358
0.02052
0.01746 0.01440
0.01200
0.00960 0.00720
0.00480
0.00240 0.00000
0.00060
0.00064 0.00068
0.00072
0.00076 0.00080
0.00088
0.00096
0.00104
0.00112
0.00120 0.00128
0.00136
0.00144 0.00152
0.00160 0.00172
0.00184
0.00196 0.00208
0.00220
0.00238 0.00256
0.00274
0.00292 0.00310
0.00344
0.00378 0.00412
0.00446
0.00480 0.00512
0.00544
0.00576 0.00608
0.00640
0.00678 0.00716
0.00754
0.00792 0.00830
0.00870
0.00910 0.00950
0.00990
0.00000
0.00140
0.00160 0.00180
0.00200
0.00220 0.00240
0.00280
0.00320
0.00360
0.00400
0.00440 0.00504
0.00568
0.00632 0.00696
0.00760 0.00800
0.00840
0.00880 0.00920
0.00960
0.01004 0.01048
0.01092
0.01136 0.01180
0.01340
0.01500 0.01660
0.01820
0.01980 0.02136
0.02292
0.02448 0.02604
0.02760
0.02908 0.03056
0.03204
0.03352 0.03500
0.03685
0.03870 0.04055
0.04240
0.00000
20
21 22
23
24 25
26
27
28
29
30 31
32
33 34
35+
0.450
0.175 0.175
0.175
0.175 0.175
0.175
0.175
0.175
0.350
0.350 0.350
0.350
0.350 0.200
0.200
* The annual rate of service retirement is 100% at age 65.
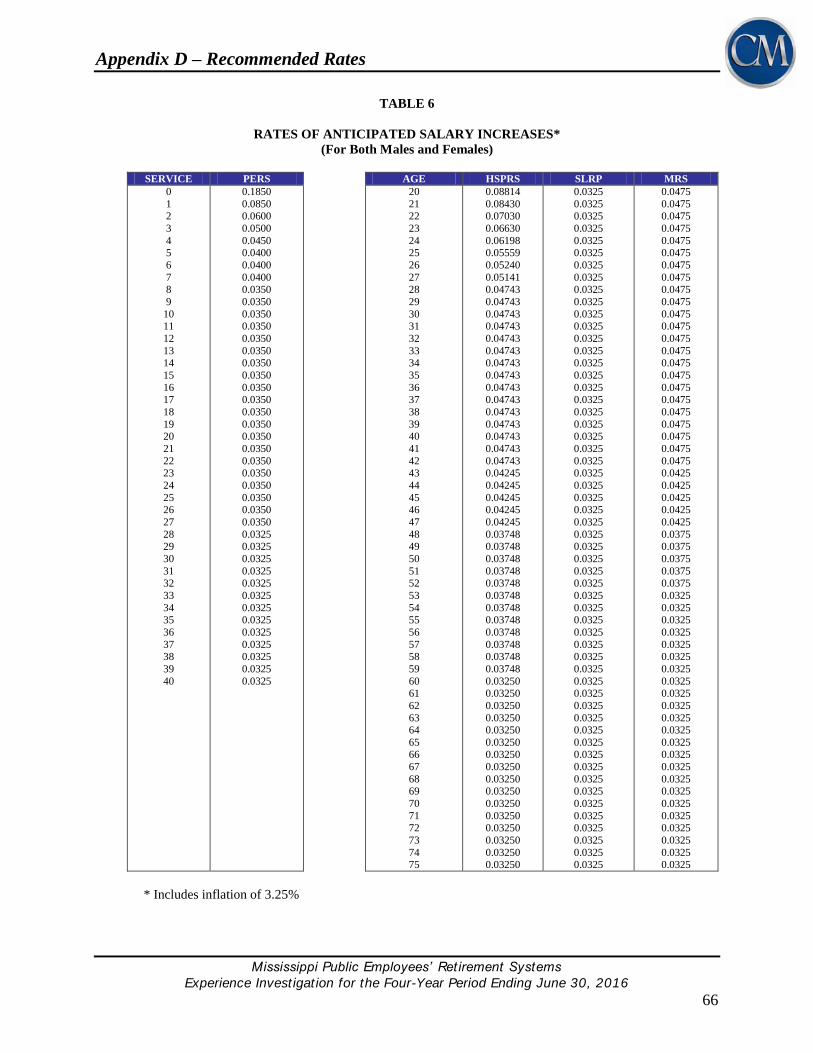
Appendix D – Recommended Rates
Mississippi Public Employees’ Retirement Systems
Experience Invest igat ion for the Four-Year Period Ending June 30, 2016
66
TABLE 6
RATES OF ANTICIPATED SALARY INCREASES*
(For Both Males and Females)
SERVICE PERS AGE HSPRS SLRP MRS
0
1 2
3
4 5
6
7 8
9
10 11
12
13 14
15
16 17
18
19 20
21
22 23
24
25 26
27
28 29
30
31
32
33
34 35
36
37 38
39
40
0.1850
0.0850 0.0600
0.0500
0.0450 0.0400
0.0400
0.0400 0.0350
0.0350
0.0350 0.0350
0.0350
0.0350 0.0350
0.0350
0.0350 0.0350
0.0350
0.0350 0.0350
0.0350
0.0350 0.0350
0.0350
0.0350 0.0350
0.0350
0.0325 0.0325
0.0325
0.0325
0.0325
0.0325
0.0325 0.0325
0.0325
0.0325 0.0325
0.0325
0.0325
20
21 22
23
24 25
26
27 28
29
30 31
32
33 34
35
36 37
38
39 40
41
42 43
44
45 46
47
48 49
50
51
52
53
54 55
56
57 58
59
60 61
62
63 64
65 66
67
68 69
70
71 72
73
74 75
0.08814
0.08430 0.07030
0.06630
0.06198 0.05559
0.05240
0.05141 0.04743
0.04743
0.04743 0.04743
0.04743
0.04743 0.04743
0.04743
0.04743 0.04743
0.04743
0.04743 0.04743
0.04743
0.04743 0.04245
0.04245
0.04245 0.04245
0.04245
0.03748 0.03748
0.03748
0.03748
0.03748
0.03748
0.03748 0.03748
0.03748
0.03748 0.03748
0.03748
0.03250 0.03250
0.03250
0.03250 0.03250
0.03250 0.03250
0.03250
0.03250 0.03250
0.03250
0.03250 0.03250
0.03250
0.03250 0.03250
0.0325
0.0325 0.0325
0.0325
0.0325 0.0325
0.0325
0.0325 0.0325
0.0325
0.0325 0.0325
0.0325
0.0325 0.0325
0.0325
0.0325 0.0325
0.0325
0.0325 0.0325
0.0325
0.0325 0.0325
0.0325
0.0325 0.0325
0.0325
0.0325 0.0325
0.0325
0.0325
0.0325
0.0325
0.0325 0.0325
0.0325
0.0325 0.0325
0.0325
0.0325 0.0325
0.0325
0.0325 0.0325
0.0325 0.0325
0.0325
0.0325 0.0325
0.0325
0.0325 0.0325
0.0325
0.0325 0.0325
0.0475
0.0475 0.0475
0.0475
0.0475 0.0475
0.0475
0.0475 0.0475
0.0475
0.0475 0.0475
0.0475
0.0475 0.0475
0.0475
0.0475 0.0475
0.0475
0.0475 0.0475
0.0475
0.0475 0.0425
0.0425
0.0425 0.0425
0.0425
0.0375 0.0375
0.0375
0.0375
0.0375
0.0325
0.0325 0.0325
0.0325
0.0325 0.0325
0.0325
0.0325 0.0325
0.0325
0.0325 0.0325
0.0325 0.0325
0.0325
0.0325 0.0325
0.0325
0.0325 0.0325
0.0325
0.0325 0.0325
* Includes inflation of 3.25%
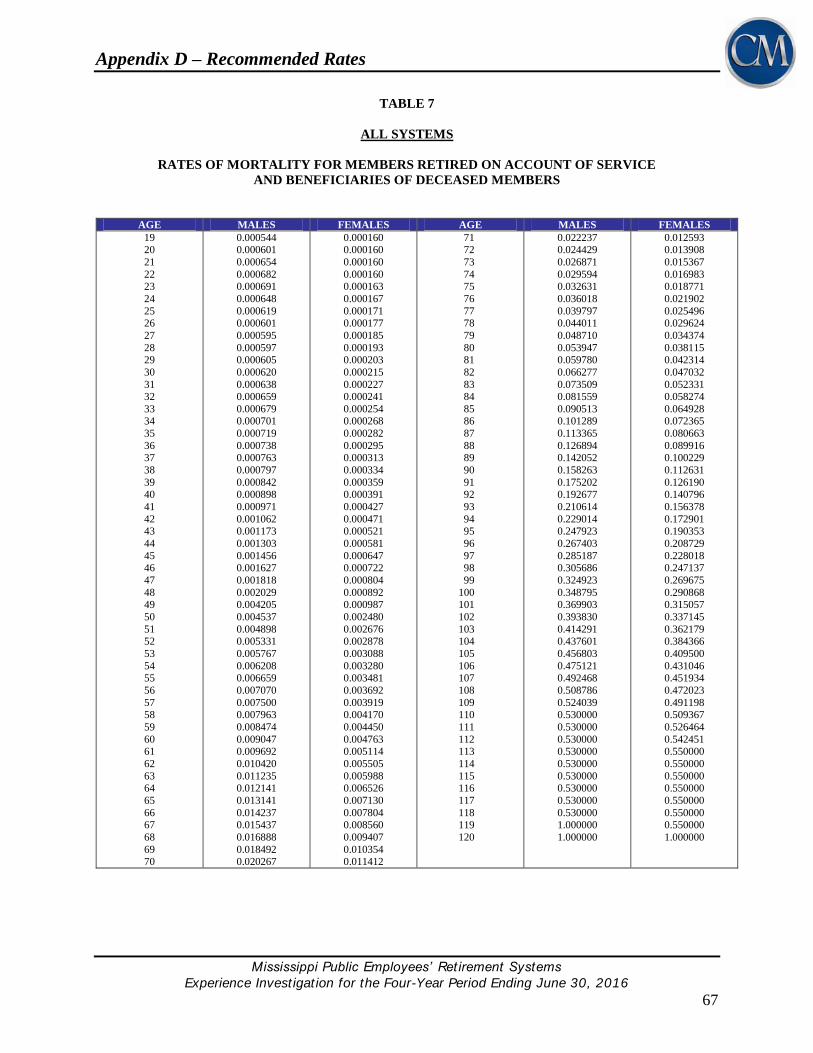
Appendix D – Recommended Rates
Mississippi Public Employees’ Retirement Systems
Experience Invest igat ion for the Four-Year Period Ending June 30, 2016
67
TABLE 7
ALL SYSTEMS
RATES OF MORTALITY FOR MEMBERS RETIRED ON ACCOUNT OF SERVICE
AND BENEFICIARIES OF DECEASED MEMBERS
AGE MALES FEMALES AGE MALES FEMALES
19 20
21
22 23
24
25 26
27
28 29
30
31 32
33 34
35
36 37
38
39 40
41
42 43
44
45 46
47
48 49
50
51 52
53
54 55
56
57 58
59
60 61
62
63 64
65
66 67
68
69 70
0.000544 0.000601
0.000654
0.000682 0.000691
0.000648
0.000619 0.000601
0.000595
0.000597 0.000605
0.000620
0.000638 0.000659
0.000679 0.000701
0.000719
0.000738 0.000763
0.000797
0.000842 0.000898
0.000971
0.001062 0.001173
0.001303
0.001456 0.001627
0.001818
0.002029 0.004205
0.004537
0.004898 0.005331
0.005767
0.006208 0.006659
0.007070
0.007500 0.007963
0.008474
0.009047 0.009692
0.010420
0.011235 0.012141
0.013141
0.014237 0.015437
0.016888
0.018492 0.020267
0.000160 0.000160
0.000160
0.000160 0.000163
0.000167
0.000171 0.000177
0.000185
0.000193 0.000203
0.000215
0.000227 0.000241
0.000254 0.000268
0.000282
0.000295 0.000313
0.000334
0.000359 0.000391
0.000427
0.000471 0.000521
0.000581
0.000647 0.000722
0.000804
0.000892 0.000987
0.002480
0.002676 0.002878
0.003088
0.003280 0.003481
0.003692
0.003919 0.004170
0.004450
0.004763 0.005114
0.005505
0.005988 0.006526
0.007130
0.007804 0.008560
0.009407
0.010354 0.011412
71 72
73
74 75
76
77 78
79
80 81
82
83 84
85 86
87
88 89
90
91 92
93
94 95
96
97 98
99
100 101
102
103 104
105
106 107
108
109 110
111
112 113
114
115 116
117
118 119
120
0.022237 0.024429
0.026871
0.029594 0.032631
0.036018
0.039797 0.044011
0.048710
0.053947 0.059780
0.066277
0.073509 0.081559
0.090513 0.101289
0.113365
0.126894 0.142052
0.158263
0.175202 0.192677
0.210614
0.229014 0.247923
0.267403
0.285187 0.305686
0.324923
0.348795 0.369903
0.393830
0.414291 0.437601
0.456803
0.475121 0.492468
0.508786
0.524039 0.530000
0.530000
0.530000 0.530000
0.530000
0.530000 0.530000
0.530000
0.530000 1.000000
1.000000
0.012593 0.013908
0.015367
0.016983 0.018771
0.021902
0.025496 0.029624
0.034374
0.038115 0.042314
0.047032
0.052331 0.058274
0.064928 0.072365
0.080663
0.089916 0.100229
0.112631
0.126190 0.140796
0.156378
0.172901 0.190353
0.208729
0.228018 0.247137
0.269675
0.290868 0.315057
0.337145
0.362179 0.384366
0.409500
0.431046 0.451934
0.472023
0.491198 0.509367
0.526464
0.542451 0.550000
0.550000
0.550000 0.550000
0.550000
0.550000 0.550000
1.000000
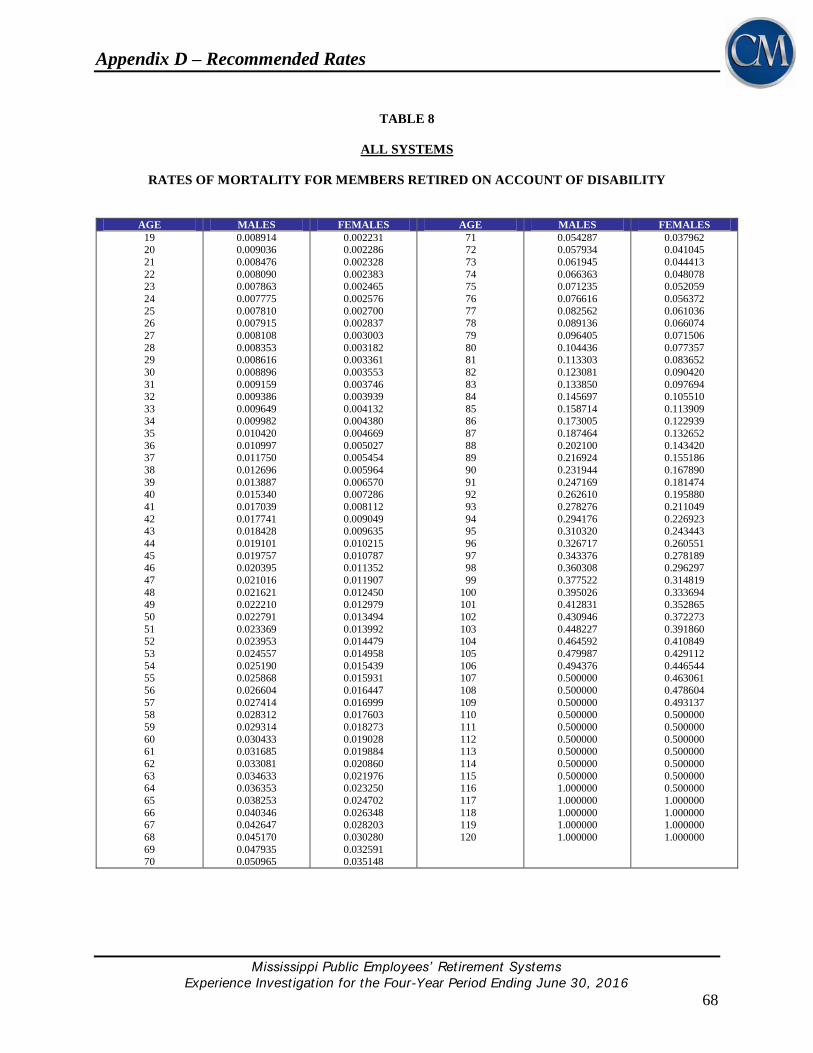
Appendix D – Recommended Rates
Mississippi Public Employees’ Retirement Systems
Experience Invest igat ion for the Four-Year Period Ending June 30, 2016
68
TABLE 8
ALL SYSTEMS
RATES OF MORTALITY FOR MEMBERS RETIRED ON ACCOUNT OF DISABILITY
AGE MALES FEMALES AGE MALES FEMALES
19 20
21
22 23
24
25 26
27
28 29
30
31 32
33 34
35
36 37
38
39 40
41
42 43
44
45 46
47
48 49
50
51 52
53
54 55
56
57 58
59
60 61
62
63 64
65
66 67
68
69 70
0.008914 0.009036
0.008476
0.008090 0.007863
0.007775
0.007810 0.007915
0.008108
0.008353 0.008616
0.008896
0.009159 0.009386
0.009649 0.009982
0.010420
0.010997 0.011750
0.012696
0.013887 0.015340
0.017039
0.017741 0.018428
0.019101
0.019757 0.020395
0.021016
0.021621 0.022210
0.022791
0.023369 0.023953
0.024557
0.025190 0.025868
0.026604
0.027414 0.028312
0.029314
0.030433 0.031685
0.033081
0.034633 0.036353
0.038253
0.040346 0.042647
0.045170
0.047935 0.050965
0.002231 0.002286
0.002328
0.002383 0.002465
0.002576
0.002700 0.002837
0.003003
0.003182 0.003361
0.003553
0.003746 0.003939
0.004132 0.004380
0.004669
0.005027 0.005454
0.005964
0.006570 0.007286
0.008112
0.009049 0.009635
0.010215
0.010787 0.011352
0.011907
0.012450 0.012979
0.013494
0.013992 0.014479
0.014958
0.015439 0.015931
0.016447
0.016999 0.017603
0.018273
0.019028 0.019884
0.020860
0.021976 0.023250
0.024702
0.026348 0.028203
0.030280
0.032591 0.035148
71 72
73
74 75
76
77 78
79
80 81
82
83 84
85 86
87
88 89
90
91 92
93
94 95
96
97 98
99
100 101
102
103 104
105
106 107
108
109 110
111
112 113
114
115 116
117
118 119
120
0.054287 0.057934
0.061945
0.066363 0.071235
0.076616
0.082562 0.089136
0.096405
0.104436 0.113303
0.123081
0.133850 0.145697
0.158714 0.173005
0.187464
0.202100 0.216924
0.231944
0.247169 0.262610
0.278276
0.294176 0.310320
0.326717
0.343376 0.360308
0.377522
0.395026 0.412831
0.430946
0.448227 0.464592
0.479987
0.494376 0.500000
0.500000
0.500000 0.500000
0.500000
0.500000 0.500000
0.500000
0.500000 1.000000
1.000000
1.000000 1.000000
1.000000
0.037962 0.041045
0.044413
0.048078 0.052059
0.056372
0.061036 0.066074
0.071506
0.077357 0.083652
0.090420
0.097694 0.105510
0.113909 0.122939
0.132652
0.143420 0.155186
0.167890
0.181474 0.195880
0.211049
0.226923 0.243443
0.260551
0.278189 0.296297
0.314819
0.333694 0.352865
0.372273
0.391860 0.410849
0.429112
0.446544 0.463061
0.478604
0.493137 0.500000
0.500000
0.500000 0.500000
0.500000
0.500000 0.500000
1.000000
1.000000 1.000000
1.000000