Embed Size (px)
Citation preview
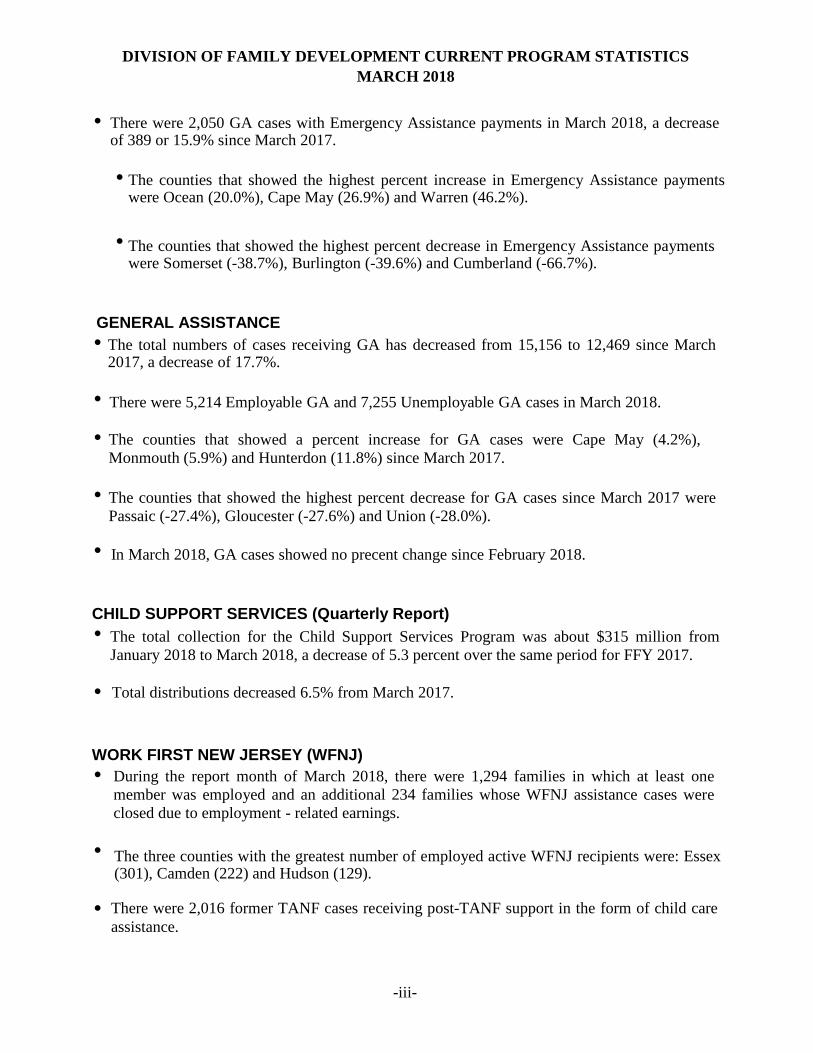
State of New Jersey Department of Human Services Division of Family Development
CURRENT PROGRAM STATISTICS
March 2018 Natasha Johnson, Director

DIVISION OF FAMILY DEVELOPMENT CURRENT PROGRAM STATISTICSMARCH 2018
-i-
TABLE OF CONTENTS
HIGHLIGHTS:WFNJ/TANF......………..…………………………………………………………………………… iiNJ SNAP…..…..........…………………………………………………………………………………iiEMERGENCY ASSISTANCE…..…....……….…………………………………………………… iiGENERAL ASSISTANCE......….………………………………………………………………… iii GA Emergency Assistance....………………………………………………………………………. iii GA Program....……………………………………………………………………………………… iiiCHILD SUPPORT SERVICES….….........…………………………………………………………iiiWORK FIRST NEW JERSEY (WFNJ)....…………………………………………………………iiiSTATISTICS- BY STATE & COUNTY.....……………………………………………………… 1 Table 1: WFNJ/TANF Families & Persons (NJ Statewide) March 2016 to 2018.....……………… 1 Table 2: WFNJ/TANF Families (by County)- March 2018......….………………………………… 2 Table 2B: WFNJ/TANF Persons, Adults, & Children (by County)- March 2018.........…………… 3 Table 3: TANF Work Participation Rates Over 12 Month Period (by County)- March 2018...…..… 4 Table 4: TANF Work Participation Rates Over 12 Month Period (NJ Statewide) March 2018....... 5 Table 5: NJ SNAP Households/Persons (NJ Statewide) March 2016 to 2018…...……..…………. 6 Table 6: NJ SNAP Recipient Trends (NJ Statewide) March 2016 to 2018….…....………………… 7 Table 7: NJ SNAP Households/Persons (by County)- March 2018….......…………..……………. 8 Table 8: Emergency Assistance Program (NJ Statewide) March 2016 to 2018.…………………… 9 Table 9: Emergency Assistance Program (by County)- March 2018.........………………………… 10 Table 10: General Assistance Program (NJ Statewide) March 2016 to 2018.....…………………… 11 Table 11: General Assistance Program (by County)- March 2018…..………………………………12 Table 12: Child Support Services Distributions (NJ Statewide) FFY 2018……......…………….. 13 Table 13: Child Support Services Paternities Established- March 2018……..……….....………… 14 Table 14: Child Support Services Cases With Orders- March 2018……..……...….……...……… 15 Table 15: Child Support Services Collections On Current Support- March 2018……..….....………16 Table 16: Child Support Services Cases With Payments On Arrears- March 2018..……..…...…… 17 Table 17: WFNJ Statistical Summary- March 2018.........….………………...………………………18ACRONYMS…..…………………………………………………………………………………… 19EXPLANATORY NOTES………………………………………………………………………… 20 WFNJ Statistical Summary (Table 17)……………………………………………………………… 20

DIVISION OF FAMILY DEVELOPMENT CURRENT PROGRAM STATISTICSMARCH 2018
-ii-
WFNJ/TANF ●
●
●
●
●
●
NJ SNAP (formerly FOOD STAMPS) ●
●
●
EMERGENCY ASSISTANCE ●
●
Each month the Division of Family Development publishes its program statistics for: WFNJ/TANF, NJ SNAP, Emergency Assistance, General Assistance, and Child Support Services. When possible, information is provided separately for children and adults. Many tables also provide trend data with information broken down by county for readers to consider. This report is compiled and prepared by The Bureau of Research & Reporting.
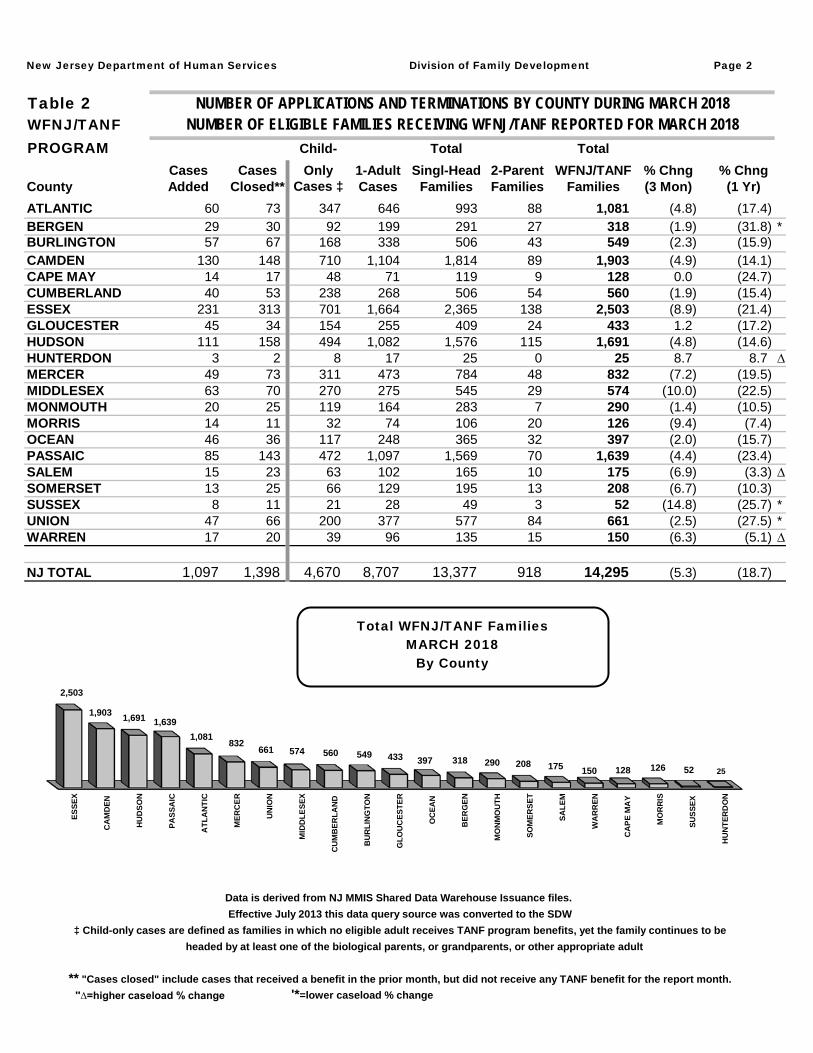
As of the end of March, the TANF caseload had decreased by 3,287 cases, from 17,582 in March 2017 to 14,295 in March 2018, a decrease of 18.7%.
The counties with caseloads that decreased the most since March 2017 were Sussex (-25.7%), Union (-27.5%) and Bergen (-31.8%).
Of the WFNJ/TANF cases, 4,670 or 32.7% were child-only in March 2018.
The counties with the most child-only cases were Camden (710), Essex (701) and Hudson (494).
Essex (6,216), Camden (4,727), Passaic (4,299), Hudson (4,137) and Atlantic (2,784) counties had the greatest number of persons receiving TANF in March 2018.
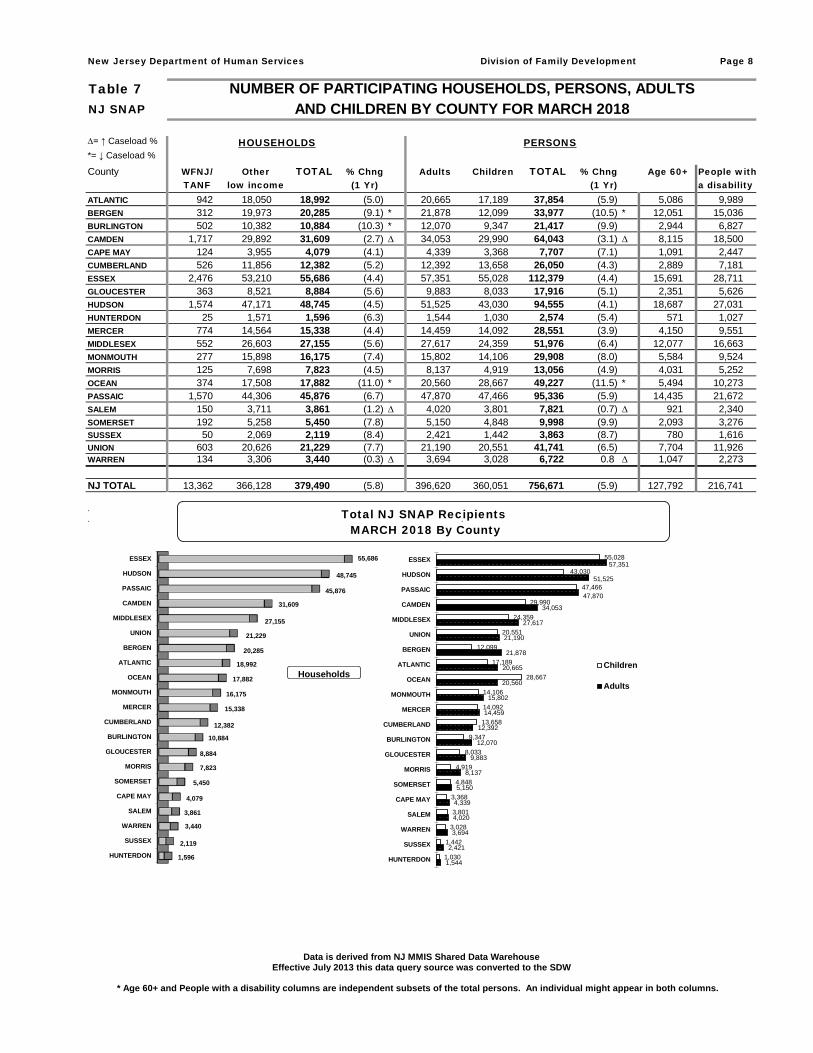
In March 2018, there were 379,490 households receiving NJ SNAP benefits. The number of NJ SNAP households decreased by 23,447 or 5.8%, since March 2017.
There were 756,671 persons receiving NJ SNAP benefits as of March 2018, a decrease of 47,620 or 5.9% since March 2017.
The counties having the highest caseload decrease since March 2017 are Bergen (-9.1%), Burlington (-10.3%) and Ocean (-11.0%).
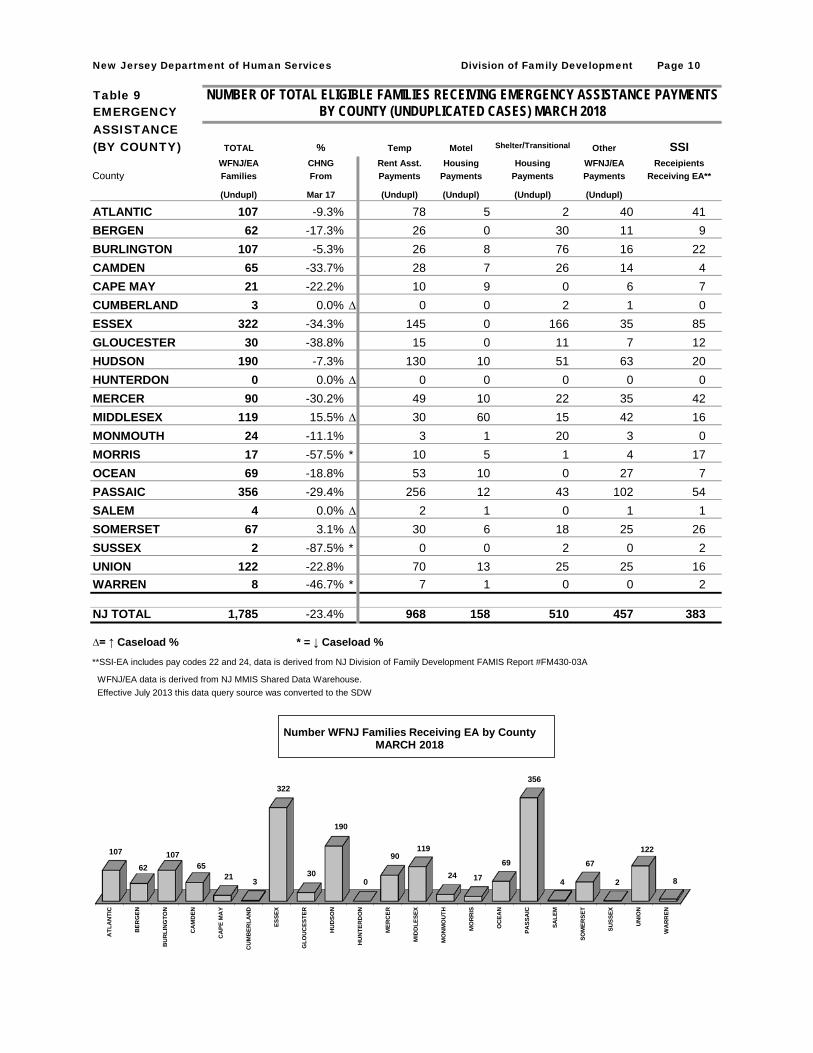
There were 1,785 TANF families receiving Emergency Assistance (EA) in March 2018, a decrease of 545 or 23.4% since March 2017.
In March 2018, EA payments were made for 383 SSI recipients.
The county where the family caseload percentage increased since March 2017 was Hunterdon (8.7%).
DIVISION OF FAMILY DEVELOPMENT CURRENT PROGRAM STATISTICSMARCH 2018
-iii-
●
●
●
GENERAL ASSISTANCE ●
●
●
●
●
CHILD SUPPORT SERVICES (Quarterly Report) ●
●
WORK FIRST NEW JERSEY (WFNJ) ●
●
●
There were 2,050 GA cases with Emergency Assistance payments in March 2018, a decrease of 389 or 15.9% since March 2017.
The total numbers of cases receiving GA has decreased from 15,156 to 12,469 since March 2017, a decrease of 17.7%.
The counties that showed the highest percent decrease for GA cases since March 2017 were Passaic (-27.4%), Gloucester (-27.6%) and Union (-28.0%).
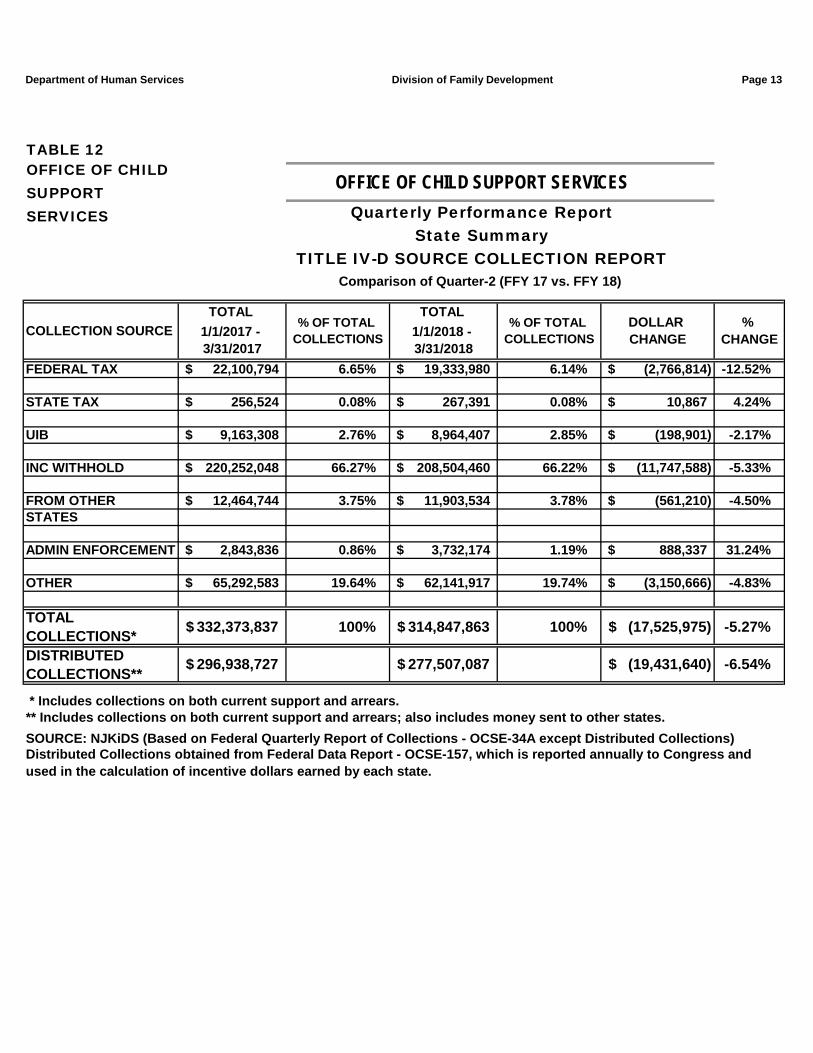
The total collection for the Child Support Services Program was about $315 million from January 2018 to March 2018, a decrease of 5.3 percent over the same period for FFY 2017.
Total distributions decreased 6.5% from March 2017.
During the report month of March 2018, there were 1,294 families in which at least one member was employed and an additional 234 families whose WFNJ assistance cases were closed due to employment - related earnings.
The three counties with the greatest number of employed active WFNJ recipients were: Essex (301), Camden (222) and Hudson (129).
There were 2,016 former TANF cases receiving post-TANF support in the form of child care assistance.
In March 2018, GA cases showed no precent change since February 2018.
The counties that showed the highest percent decrease in Emergency Assistance payments were Somerset (-38.7%), Burlington (-39.6%) and Cumberland (-66.7%).
The counties that showed the highest percent increase in Emergency Assistance payments were Ocean (20.0%), Cape May (26.9%) and Warren (46.2%).
There were 5,214 Employable GA and 7,255 Unemployable GA cases in March 2018.
The counties that showed a percent increase for GA cases were Cape May (4.2%), Monmouth (5.9%) and Hunterdon (11.8%) since March 2017.
New Jersey Department of Human Services Division of Family Development Page 1
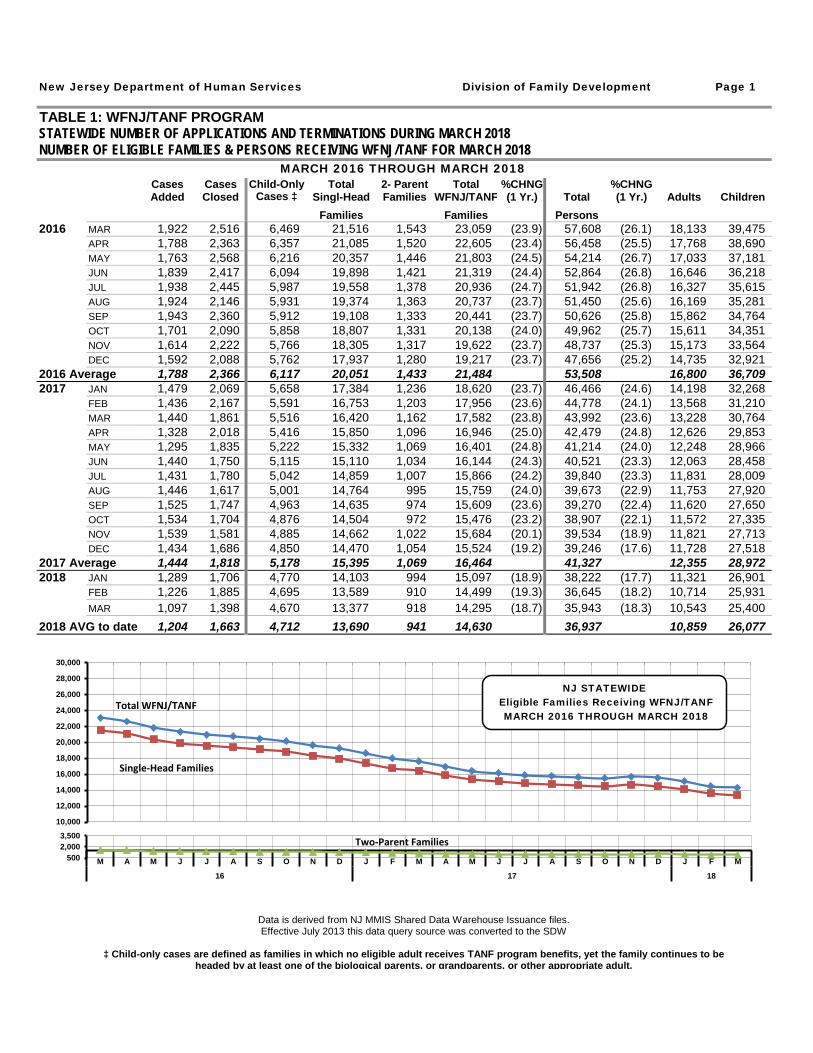
TABLE 1: WFNJ/TANF PROGRAMSTATEWIDE NUMBER OF APPLICATIONS AND TERMINATIONS DURING MARCH 2018NUMBER OF ELIGIBLE FAMILIES & PERSONS RECEIVING WFNJ/TANF FOR MARCH 2018
MARCH 2016 THROUGH MARCH 2018Cases Cases Child-Only Total 2- Parent Total %CHNG %CHNGAdded Closed Cases ‡ Singl-Head Families WFNJ/TANF (1 Yr.) Total (1 Yr.) Adults Children
Families Families Persons2016 MAR 1,922 2,516 6,469 21,516 1,543 23,059 (23.9) 57,608 (26.1) 18,133 39,475
APR 1,788 2,363 6,357 21,085 1,520 22,605 (23.4) 56,458 (25.5) 17,768 38,690 MAY 1,763 2,568 6,216 20,357 1,446 21,803 (24.5) 54,214 (26.7) 17,033 37,181 JUN 1,839 2,417 6,094 19,898 1,421 21,319 (24.4) 52,864 (26.8) 16,646 36,218 JUL 1,938 2,445 5,987 19,558 1,378 20,936 (24.7) 51,942 (26.8) 16,327 35,615 AUG 1,924 2,146 5,931 19,374 1,363 20,737 (23.7) 51,450 (25.6) 16,169 35,281 SEP 1,943 2,360 5,912 19,108 1,333 20,441 (23.7) 50,626 (25.8) 15,862 34,764 OCT 1,701 2,090 5,858 18,807 1,331 20,138 (24.0) 49,962 (25.7) 15,611 34,351 NOV 1,614 2,222 5,766 18,305 1,317 19,622 (23.7) 48,737 (25.3) 15,173 33,564 DEC 1,592 2,088 5,762 17,937 1,280 19,217 (23.7) 47,656 (25.2) 14,735 32,921
2016 Average 1,788 2,366 6,117 20,051 1,433 21,484 53,508 16,800 36,709 2017 JAN 1,479 2,069 5,658 17,384 1,236 18,620 (23.7) 46,466 (24.6) 14,198 32,268
FEB 1,436 2,167 5,591 16,753 1,203 17,956 (23.6) 44,778 (24.1) 13,568 31,210 MAR 1,440 1,861 5,516 16,420 1,162 17,582 (23.8) 43,992 (23.6) 13,228 30,764 APR 1,328 2,018 5,416 15,850 1,096 16,946 (25.0) 42,479 (24.8) 12,626 29,853 MAY 1,295 1,835 5,222 15,332 1,069 16,401 (24.8) 41,214 (24.0) 12,248 28,966 JUN 1,440 1,750 5,115 15,110 1,034 16,144 (24.3) 40,521 (23.3) 12,063 28,458 JUL 1,431 1,780 5,042 14,859 1,007 15,866 (24.2) 39,840 (23.3) 11,831 28,009 AUG 1,446 1,617 5,001 14,764 995 15,759 (24.0) 39,673 (22.9) 11,753 27,920 SEP 1,525 1,747 4,963 14,635 974 15,609 (23.6) 39,270 (22.4) 11,620 27,650 OCT 1,534 1,704 4,876 14,504 972 15,476 (23.2) 38,907 (22.1) 11,572 27,335 NOV 1,539 1,581 4,885 14,662 1,022 15,684 (20.1) 39,534 (18.9) 11,821 27,713 DEC 1,434 1,686 4,850 14,470 1,054 15,524 (19.2) 39,246 (17.6) 11,728 27,518
2017 Average 1,444 1,818 5,178 15,395 1,069 16,464 41,327 12,355 28,972 2018 JAN 1,289 1,706 4,770 14,103 994 15,097 (18.9) 38,222 (17.7) 11,321 26,901
FEB 1,226 1,885 4,695 13,589 910 14,499 (19.3) 36,645 (18.2) 10,714 25,931 MAR 1,097 1,398 4,670 13,377 918 14,295 (18.7) 35,943 (18.3) 10,543 25,400
2018 AVG to date 1,204 1,663 4,712 13,690 941 14,630 36,937 10,859 26,077
10,000
12,000
14,000
16,000
18,000
20,000
22,000
24,000
26,000
28,000
30,000
Total WFNJ/TANF
Single-Head Families
5002,0003,500
M
A
M
J
J
A
S
O
N
D
J
F
M
A
M
J
J
A
S
O
N
D
J
F
M 16 17 18
Two-Parent Families
NJ STATEWIDE Eligible Families Receiving WFNJ/TANF MARCH 2016 THROUGH MARCH 2018
Data is derived from NJ MMIS Shared Data Warehouse Issuance files. Effective July 2013 this data query source was converted to the SDW
‡ Child-only cases are defined as families in which no eligible adult receives TANF program benefits, yet the family continues to be
headed by at least one of the biological parents, or grandparents, or other appropriate adult.
New Jersey Department of Human Services Division of Family Development Page 2
Table 2WFNJ/TANFPROGRAM Child- Total Total
Cases Cases Only 1-Adult Singl-Head 2-Parent WFNJ/TANF % Chng % ChngCounty Added Closed** Cases ‡ Cases Families Families Families (3 Mon) (1 Yr)ATLANTIC 60 73 347 646 993 88 1,081 (4.8) (17.4)BERGEN 29 30 92 199 291 27 318 (1.9) (31.8) *BURLINGTON 57 67 168 338 506 43 549 (2.3) (15.9)CAMDEN 130 148 710 1,104 1,814 89 1,903 (4.9) (14.1)CAPE MAY 14 17 48 71 119 9 128 0.0 (24.7)CUMBERLAND 40 53 238 268 506 54 560 (1.9) (15.4)ESSEX 231 313 701 1,664 2,365 138 2,503 (8.9) (21.4)GLOUCESTER 45 34 154 255 409 24 433 1.2 (17.2)HUDSON 111 158 494 1,082 1,576 115 1,691 (4.8) (14.6)HUNTERDON 3 2 8 17 25 0 25 8.7 8.7 ∆MERCER 49 73 311 473 784 48 832 (7.2) (19.5)MIDDLESEX 63 70 270 275 545 29 574 (10.0) (22.5)MONMOUTH 20 25 119 164 283 7 290 (1.4) (10.5)MORRIS 14 11 32 74 106 20 126 (9.4) (7.4)OCEAN 46 36 117 248 365 32 397 (2.0) (15.7)PASSAIC 85 143 472 1,097 1,569 70 1,639 (4.4) (23.4)SALEM 15 23 63 102 165 10 175 (6.9) (3.3) ∆SOMERSET 13 25 66 129 195 13 208 (6.7) (10.3)SUSSEX 8 11 21 28 49 3 52 (14.8) (25.7) *UNION 47 66 200 377 577 84 661 (2.5) (27.5) *WARREN 17 20 39 96 135 15 150 (6.3) (5.1) ∆
NJ TOTAL 1,097 1,398 4,670 8,707 13,377 918 14,295 (5.3) (18.7)
''∆=higher caseload % change '*=lower caseload % change
NUMBER OF APPLICATIONS AND TERMINATIONS BY COUNTY DURING MARCH 2018NUMBER OF ELIGIBLE FAMILIES RECEIVING WFNJ/TANF REPORTED FOR MARCH 2018
Data is derived from NJ MMIS Shared Data Warehouse Issuance files.
‡ Child-only cases are defined as families in which no eligible adult receives TANF program benefits, yet the family continues to be headed by at least one of the biological parents, or grandparents, or other appropriate adult
** "Cases closed" include cases that received a benefit in the prior month, but did not receive any TANF benefit for the report month.
Effective July 2013 this data query source was converted to the SDW
ESSE
X
CA
MD
EN
HU
DSO
N
PASS
AIC
ATL
AN
TIC
MER
CER
UN
ION
MID
DLE
SEX
CU
MB
ERLA
ND
BU
RLI
NG
TON
GLO
UC
ESTE
R
OC
EAN
BER
GEN
MO
NM
OU
TH
SOM
ERSE
T
SALE
M
WA
RR
EN
CA
PE M
AY
MO
RR
IS
SUSS
EX
HU
NTE
RD
ON
2,503
1,903 1,691 1,639 1,081
832 661 574 560 549 433 397 318 290 208 175 150 128 126 52 25
Total WFNJ/TANF Families MARCH 2018
By County

New Jersey Department of Human Services Division of Family Development Page 3
Table 2BWFNJ/TANFPROGRAM∆= ↑ Caseload % PERSONS*= ↓ Caseload %
County Adults Children Child/Adult Total % Chng PersonsRatio Persons (1 Yr) Per Case
ATLANTIC 822 1,962 2.39 2,784 (16.6) 2.58BERGEN 253 513 2.03 766 (31.9) * 2.41BURLINGTON 424 935 2.21 1,359 (14.9) 2.48CAMDEN 1,282 3,445 2.69 4,727 (15.1) 2.48CAPE MAY 89 233 2.62 322 (26.3) * 2.52CUMBERLAND 376 1,151 3.06 1,527 (14.6) 2.73ESSEX 1,940 4,276 2.20 6,216 (20.8) 2.48GLOUCESTER 303 744 2.46 1,047 (16.8) 2.42HUDSON 1,312 2,825 2.15 4,137 (13.4) 2.45HUNTERDON 17 43 2.53 60 (13.0) 2.40MERCER 569 1,480 2.60 2,049 (18.3) 2.46MIDDLESEX 333 1,052 3.16 1,385 (21.1) 2.41MONMOUTH 178 494 2.78 672 (11.7) 2.32MORRIS 114 216 1.89 330 0.6 ∆ 2.62OCEAN 312 705 2.26 1,017 (14.1) 2.56PASSAIC 1,237 3,062 2.48 4,299 (25.1) * 2.62SALEM 122 318 2.61 440 (3.5) ∆ 2.51SOMERSET 155 354 2.28 509 (9.9) 2.45SUSSEX 34 96 2.82 130 (23.5) 2.50UNION 545 1,229 2.26 1,774 (23.5) 2.68WARREN 126 267 2.12 393 (1.0) ∆ 2.62
NJ TOTAL 10,543 25,400 2.41 35,943 (18.3) 2.51
.
. .
NUMBER OF PARTICIPATING PERSONS, ADULTS, AND CHILDRENBY COUNTY FOR MARCH 2018
Data is derived from NJ MMIS Shared Data Warehouse Issuance files.Effective July 2013 this data query source was converted to the SDW
AdultsChildren
Total…
0
1,000
2,000
3,000
4,000
5,000
6,000
7,000
ATL
ANTI
C
BER
GE
N
BU
RLI
NG
TON
CA
MD
EN
CA
PE M
AY
CU
MBE
RLA
ND
ESS
EX
GLO
UC
ES
TER
HU
DSO
N
HU
NTE
RD
ON
ME
RC
ER
MID
DLE
SEX
MO
NM
OU
TH
MO
RR
IS
OC
EAN
PAS
SAIC
SAL
EM
SO
MER
SET
SU
SSE
X
UN
ION
WAR
REN
2,78
4
766
1,35
9
4,72
7
322
1,52
7
6,21
6
1,04
7
4,13
7
60
2,04
9
1,38
5
672
330
1,01
7
4,29
9
440
509
130
1,77
4
393
PEOPLE
Page 4
TABLE 3
New Jersey Department of Human Services Division of Family Development
14.0%
19.8%
28.0%
25.7%
17.9% 19.7%
29.4%
19.0%
39.1%
11.1%
24.9%
16.1%
32.3%
11.1%
18.8%
22.1%
25.4% 26.7%
16.7%
22.7%
16.2%
25.0%
0%
5%
10%
15%
20%
25%
30%
35%
40%
45%
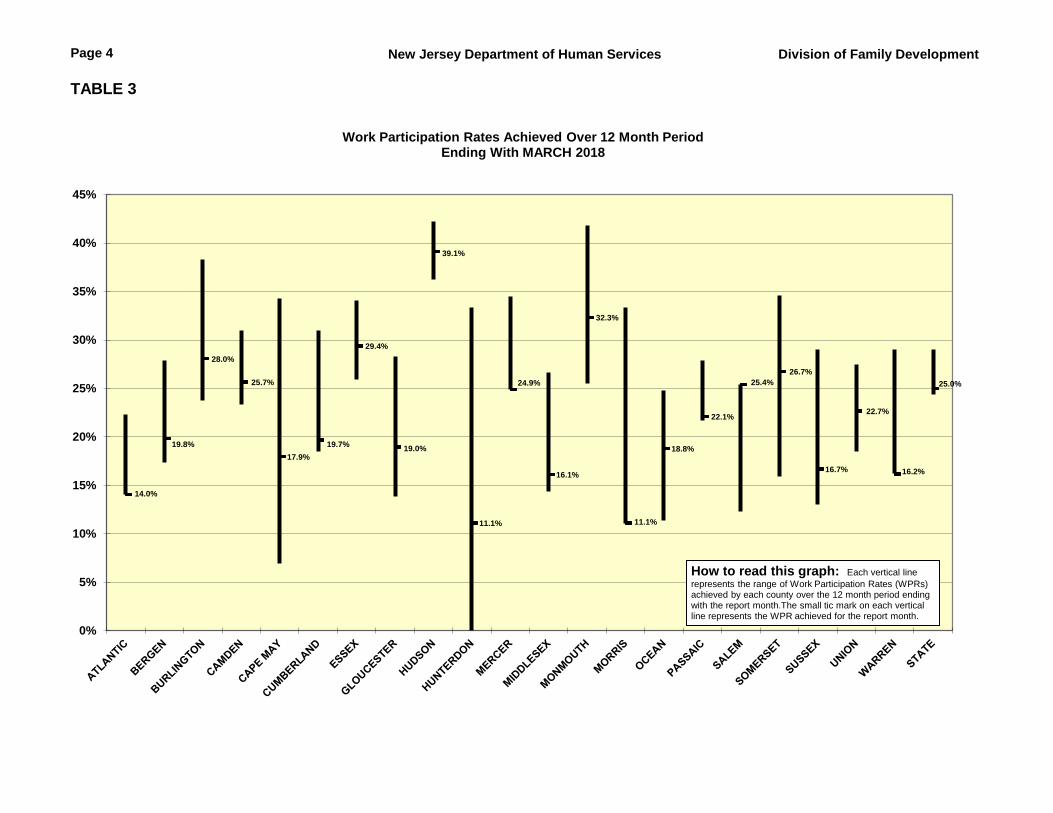
Work Participation Rates Achieved Over 12 Month Period Ending With MARCH 2018
How to read this graph: Each vertical line represents the range of Work Participation Rates (WPRs) achieved by each county over the 12 month period ending with the report month.The small tic mark on each vertical line represents the WPR achieved for the report month.
Page 5
TABLE 4
New Jersey Department of Human Services Division of Family Development
27.4%
29.0%
28.8%
27.7%
26.8%
27.3%
27.6%
27.2%
24.4% 24.7%
26.7%
25.0%
23%
24%
25%
26%
27%
28%
29%
30%
31%
Apr-17 May-17 Jun-17 Jul-17 Aug-17 Sep-17 Oct-17 Nov-17 Dec-17 Jan-18 Feb-18 Mar-18
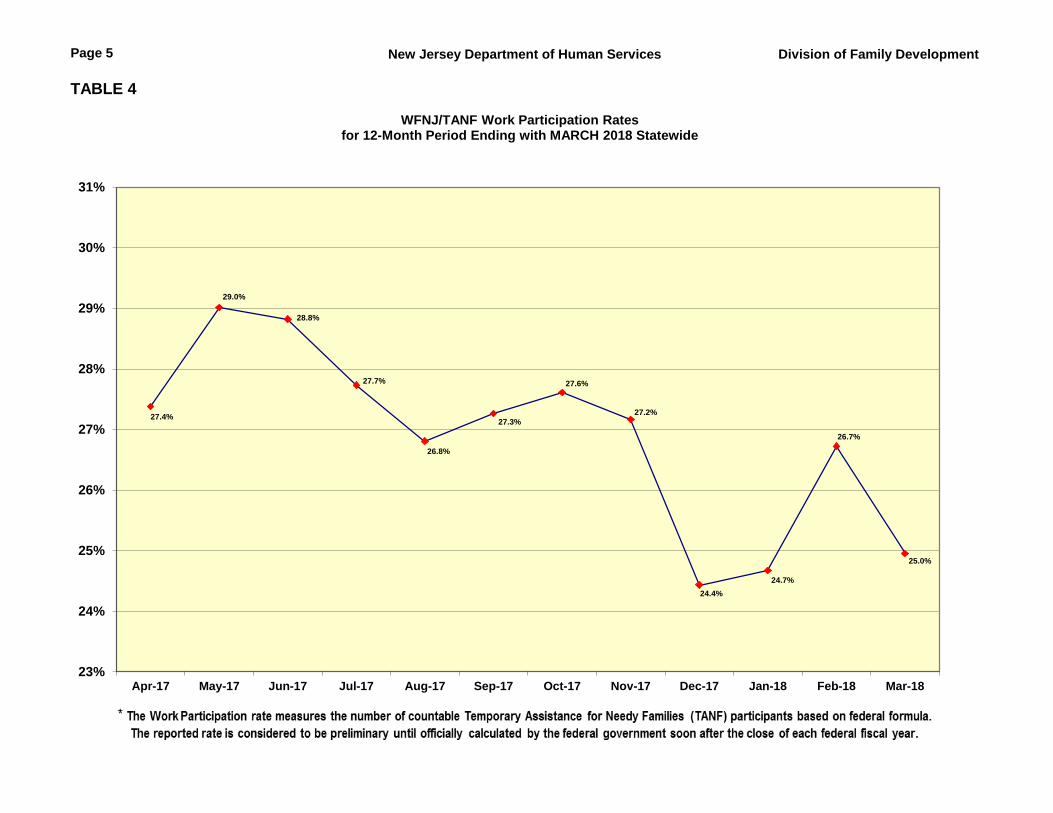
WFNJ/TANF Work Participation Rates for 12-Month Period Ending with MARCH 2018 Statewide

New Jersey Department of Human Services Division of Family Development Page 6
Table 5 NUMBER OF PARTICIPATING HOUSEHOLDS, PERSONS, ADULTSNJ SNAP AND CHILDREN FOR MARCH 2018 (STATEWIDE)
MARCH 2016 THROUGH MARCH 2018HOUSEHOLDS PERSONS
WFNJ/ Other low TOTAL % CHNG Adults Children TOTAL % CHNG Age 60+ People with
TANF income (1 Yr.) (1 Yr.) a disability2016 MAR 20,936 416,167 437,103 -2.3% 457,814 408,604 866,418 -2.6%
APR 20,886 416,683 437,569 -2.3% 458,373 411,189 869,562 -2.3%MAY 20,066 411,401 431,467 -3.5% 451,706 406,955 858,661 -3.4%JUN 19,521 409,831 429,352 -3.5% 449,541 406,259 855,800 -3.2%JUL 19,521 410,696 430,217 -3.4% 450,900 407,672 858,572 -3.1%AUG 19,335 405,719 425,054 -4.6% 445,381 402,834 848,215 -4.2%SEP 19,095 404,660 423,755 -4.6% 445,123 400,055 845,178 -4.3%OCT 18,374 401,887 420,261 -6.3% 440,110 397,229 837,339 -6.1%NOV 18,083 400,647 418,730 -5.6% 438,718 396,519 835,237 -5.2%DEC 17,706 399,542 417,248 -6.4% 436,173 396,733 832,906 -5.9%
2016 Average 19,814 409,518 429,332 449,778 404,935 854,714 2017 JAN 17,044 391,958 409,002 -7.7% 427,349 388,777 816,126 -7.3%
FEB 16,687 388,842 405,529 -7.4% 423,886 385,701 809,587 -6.7%MAR 16,158 386,779 402,937 -7.8% 421,536 382,755 804,291 -7.2%APR 15,935 385,361 401,296 -8.3% 420,390 381,088 801,478 -7.8%MAY 15,525 381,043 396,568 -8.1% 415,301 375,949 791,250 -7.9%JUN 15,348 379,341 394,689 -8.1% 413,436 373,920 787,356 -8.0%JUL 15,109 376,747 391,856 -8.9% 410,582 371,153 781,735 -8.9%AUG 15,071 375,901 390,972 -8.0% 409,795 370,000 779,795 -8.1% 132,403 221,507SEP 15,032 375,469 390,501 -7.8% 409,052 369,928 778,980 -7.8% 132,065 221,449OCT 14,762 370,462 385,224 -8.3% 403,103 363,198 766,301 -8.5% 130,948 219,170NOV 14,783 370,436 385,219 -8.0% 403,158 364,706 767,864 -8.1% 130,391 219,210DEC 14,648 371,916 386,564 -7.4% 404,418 367,199 771,617 -7.4% 130,292 222,460
2017 Average 15,509 379,521 395,030 413,501 374,531 788,032 131,220 220,7592018 JAN 13,996 366,670 380,666 -6.9% 398,026 360,502 758,528 -7.1% 128,879 218,735
FEB 13,566 364,750 378,316 -6.7% 395,314 357,938 753,252 -7.0% 128,094 217,046MAR 13,362 366,128 379,490 -5.8% 396,620 360,051 756,671 -5.9% 127,792 216,741
2018 AVG to date 13,641 365,849 379,491 396,653 359,497 756,150 128,255 217,507
* Age 60+ and People with a disability columns are independent subsets of the total persons. An individual might appear in both columns.
(FOOD STAMPS)
This Table is based on those Households & Persons that received SNAP issuances (benefits) during the month.
Data is derived from NJ MMIS Shared Data Warehouse.Effective July 2013 this data query source was converted to the SDW.

New Jersey Department of Human Services Division of Family Development Page 7
TABLE 6: NJ SNAP (FOOD STAMPS) TRENDS FOR PARTICIPATING HOUSEHOLDS & PERSONS
MARCH 2016 THROUGH MARCH 2018 (STATEWIDE)
Effective July 2013 this data query source was converted to the SDW.Data is derived from NJ MMIS Shared Data Warehouse.
Adults Adults
Children Children
Total Persons
Total Persons
300,000340,000380,000420,000460,000500,000540,000580,000620,000660,000700,000740,000780,000820,000860,000900,000940,000980,000
M
A
M
J
J
A
S
O
N
D
J
F
M
A
M
J
J
A
S
O
N
D
J
F
M 16 17 18
Statewide NJ SNAP Persons: March 2016 Through 2018
WFNJ/TANF Households
Other Low Income Households
Total Households
020,00040,00060,00080,000
100,000120,000140,000160,000180,000200,000220,000240,000260,000280,000300,000320,000340,000360,000380,000400,000420,000440,000460,000480,000
M
A
M
J
J
A
S
O
N
D
J
F
M
A
M
J
J
A
S
O
N
D
J
F
M 16 17 18
Statewide NJ SNAP Households: March 2016 Through 2018
New Jersey Department of Human Services Division of Family Development Page 8
Table 7 NUMBER OF PARTICIPATING HOUSEHOLDS, PERSONS, ADULTSNJ SNAP AND CHILDREN BY COUNTY FOR MARCH 2018
∆= ↑ Caseload % HOUSEHOLDS PERSONS*= ↓ Caseload %
County WFNJ/ Other TOTAL % Chng Adults Children TOTAL % Chng Age 60+ People withTANF low income (1 Yr) (1 Yr) a disability
ATLANTIC 942 18,050 18,992 (5.0) 20,665 17,189 37,854 (5.9) 5,086 9,989BERGEN 312 19,973 20,285 (9.1) * 21,878 12,099 33,977 (10.5) * 12,051 15,036BURLINGTON 502 10,382 10,884 (10.3) * 12,070 9,347 21,417 (9.9) 2,944 6,827CAMDEN 1,717 29,892 31,609 (2.7) ∆ 34,053 29,990 64,043 (3.1) ∆ 8,115 18,500CAPE MAY 124 3,955 4,079 (4.1) 4,339 3,368 7,707 (7.1) 1,091 2,447CUMBERLAND 526 11,856 12,382 (5.2) 12,392 13,658 26,050 (4.3) 2,889 7,181ESSEX 2,476 53,210 55,686 (4.4) 57,351 55,028 112,379 (4.4) 15,691 28,711GLOUCESTER 363 8,521 8,884 (5.6) 9,883 8,033 17,916 (5.1) 2,351 5,626HUDSON 1,574 47,171 48,745 (4.5) 51,525 43,030 94,555 (4.1) 18,687 27,031HUNTERDON 25 1,571 1,596 (6.3) 1,544 1,030 2,574 (5.4) 571 1,027MERCER 774 14,564 15,338 (4.4) 14,459 14,092 28,551 (3.9) 4,150 9,551MIDDLESEX 552 26,603 27,155 (5.6) 27,617 24,359 51,976 (6.4) 12,077 16,663MONMOUTH 277 15,898 16,175 (7.4) 15,802 14,106 29,908 (8.0) 5,584 9,524MORRIS 125 7,698 7,823 (4.5) 8,137 4,919 13,056 (4.9) 4,031 5,252OCEAN 374 17,508 17,882 (11.0) * 20,560 28,667 49,227 (11.5) * 5,494 10,273PASSAIC 1,570 44,306 45,876 (6.7) 47,870 47,466 95,336 (5.9) 14,435 21,672SALEM 150 3,711 3,861 (1.2) ∆ 4,020 3,801 7,821 (0.7) ∆ 921 2,340SOMERSET 192 5,258 5,450 (7.8) 5,150 4,848 9,998 (9.9) 2,093 3,276SUSSEX 50 2,069 2,119 (8.4) 2,421 1,442 3,863 (8.7) 780 1,616UNION 603 20,626 21,229 (7.7) 21,190 20,551 41,741 (6.5) 7,704 11,926WARREN 134 3,306 3,440 (0.3) ∆ 3,694 3,028 6,722 0.8 ∆ 1,047 2,273
NJ TOTAL 13,362 366,128 379,490 (5.8) 396,620 360,051 756,671 (5.9) 127,792 216,741
.
. .
Data is derived from NJ MMIS Shared Data WarehouseEffective July 2013 this data query source was converted to the SDW
* Age 60+ and People with a disability columns are independent subsets of the total persons. An individual might appear in both columns.
HUNTERDON
SUSSEX
WARREN
SALEM
CAPE MAY
SOMERSET
MORRIS
GLOUCESTER
BURLINGTON
CUMBERLAND
MERCER
MONMOUTH
OCEAN
ATLANTIC
BERGEN
UNION
MIDDLESEX
CAMDEN
PASSAIC
HUDSON
ESSEX
1,596
2,119
3,440
3,861
4,079
5,450
7,823
8,884
10,884
12,382
15,338
16,175
17,882
18,992
20,285
21,229
27,155
31,609
45,876
48,745
55,686
Total NJ SNAP Recipients MARCH 2018 By County
1,544
2,421
3,694
4,020
4,339
5,150
8,137
9,883
12,070
12,392
14,459
15,802
20,560
20,665
21,878
21,190
27,617
34,053
47,870
51,525
57,351
1,030
1,442
3,028
3,801
3,368
4,848
4,919
8,033
9,347
13,658
14,092
14,106
28,667
17,189
12,099
20,551
24,359
29,990
47,466
43,030
55,028
HUNTERDON
SUSSEX
WARREN
SALEM
CAPE MAY
SOMERSET
MORRIS
GLOUCESTER
BURLINGTON
CUMBERLAND
MERCER
MONMOUTH
OCEAN
ATLANTIC
BERGEN
UNION
MIDDLESEX
CAMDEN
PASSAIC
HUDSON
ESSEX
Children
AdultsHouseholds

New Jersey Department of Human Services Division of Family Development Page 9
Table 8 TOTAL NUMBER OF ELIGIBLE FAMILIES RECEIVING EMERGENCY ASSISTANCE PAYMENTSEMERGENCY MARCH 2016 THROUGH MARCH 2018 - STATEWIDE ASSISTANCE TOTAL Temp Motel Shelter/Transitional Other(STATEWIDE) WFNJ/EA Rent Asst. Housing Housing EA
Families % CHNG Payments % CHNG Payments % CHNG Payments % CHNG Payments % CHNG(Undupl) (1 YR) (Undupl) (1 YR) (Undupl) (1 YR) (Undupl) (1 YR) (Undupl) (1 YR)
2016 MAR 3,366 -41.8% 2,300 -45.5% 251 -51.3% 526 -9.6% 680 -45.6%APR 3,101 -46.1% 2,139 -49.4% 184 -58.7% 494 -20.3% 613 -49.5%MAY 3,012 -45.1% 2,081 -47.9% 173 -58.4% 490 -18.2% 581 -50.3%JUN 2,988 -43.6% 2,020 -48.3% 172 -49.6% 519 -17.5% 591 -48.6%JUL 2,766 -45.8% 1,844 -50.2% 137 -65.6% 483 -14.5% 598 -42.4%AUG 2,833 -39.5% 1,843 -45.3% 152 -52.1% 490 -7.9% 667 -37.4%SEP 2,750 -38.3% 1,764 -44.2% 237 -33.1% 476 -16.5% 591 -35.8%OCT 2,776 -34.8% 1,636 -44.1% 312 -16.8% 539 2.7% 597 -40.8%NOV 2,569 -33.2% 1,602 -37.4% 171 -46.4% 497 -15.5% 592 -27.7%DEC 2,458 -36.2% 1,548 -41.4% 165 -53.3% 491 -12.5% 587 -30.0%
2016 Average 2,959 1,960 209 506 622 2017 JAN 2,367 -32.1% 1,477 -38.5% 183 -37.5% 488 -6.7% 510 -23.5%
FEB 2,212 -35.1% 1,376 -41.1% 121 -53.3% 497 -8.5% 473 -32.0%MAR 2,330 -30.8% 1,404 -39.0% 165 -34.3% 517 -1.7% 546 -19.7%APR 2,078 -33.0% 1,322 -38.2% 135 -26.6% 446 -9.7% 435 -29.0%MAY 2,063 -31.5% 1,260 -39.5% 132 -23.7% 476 -2.9% 442 -23.9%JUN 2,057 -31.2% 1,178 -41.7% 131 -23.8% 490 -5.6% 486 -17.8%JUL 1,896 -31.5% 1,129 -38.8% 126 -8.0% 475 -1.7% 378 -36.8%AUG 1,976 -30.3% 1,089 -40.9% 115 -24.3% 539 10.0% 476 -28.6%SEP 1,878 -31.7% 1,042 -40.9% 123 -48.1% 480 0.8% 508 -14.0%OCT 1,867 -32.7% 989 -39.5% 114 -63.5% 536 -0.6% 510 -14.6%NOV 1,790 -30.3% 1,014 -36.7% 137 -19.9% 465 -6.4% 438 -26.0%DEC 1,740 -29.2% 935 -39.6% 129 -21.8% 484 -1.4% 418 -28.8%
2017 Average 2,021 1,185 134 491 468 2018 JAN 1,799 -24.0% 960 -35.0% 171 -6.6% 533 9.2% 432 -15.3%
FEB 1,754 -20.7% 955 -30.6% 154 27.3% 501 0.8% 417 -11.8%MAR 1,785 -23.4% 968 -31.1% 158 -4.2% 510 -1.4% 457 -16.3%
2018 AVG to date 1,779 961 161 515 435
WFNJ/EA data is derived from NJ MMIS Shared Data Warehouse.
* Effective Feb '11 Transitional Housing Payments were removed from "Other EA Payments" and added to "Shelter Payments."Effective July 2013 this data query source was converted to the SDW.
0
500
1,000
1,500
2,000
2,500
3,000
3,500
4,000
M
A
M
J
J
A
S
O
N
D
J
F
M
A
M
J
J
A
S
O
N
D
J
F
M 16 17 18
Total Families (Unduplicated)
TRA Payments
Other Payments
E Shelter Payments
Motel Payments
NJ STATEWIDE Families Receiving Emergency Assistance
MARCH 2016 THROUGH MARCH 2018
New Jersey Department of Human Services Division of Family Development Page 10
Table 9 NUMBER OF TOTAL ELIGIBLE FAMILIES RECEIVING EMERGENCY ASSISTANCE PAYMENTSEMERGENCY BY COUNTY (UNDUPLICATED CASES) MARCH 2018ASSISTANCE(BY COUNTY) TOTAL % Temp Motel Shelter/Transitional Other SSI
WFNJ/EA CHNG Rent Asst. Housing Housing WFNJ/EA ReceipientsCounty Families From Payments Payments Payments Payments Receiving EA**
(Undupl) Mar 17 (Undupl) (Undupl) (Undupl) (Undupl)
ATLANTIC 107 -9.3% 78 5 2 40 41BERGEN 62 -17.3% 26 0 30 11 9BURLINGTON 107 -5.3% 26 8 76 16 22CAMDEN 65 -33.7% 28 7 26 14 4CAPE MAY 21 -22.2% 10 9 0 6 7CUMBERLAND 3 0.0% ∆ 0 0 2 1 0ESSEX 322 -34.3% 145 0 166 35 85GLOUCESTER 30 -38.8% 15 0 11 7 12HUDSON 190 -7.3% 130 10 51 63 20HUNTERDON 0 0.0% ∆ 0 0 0 0 0MERCER 90 -30.2% 49 10 22 35 42MIDDLESEX 119 15.5% ∆ 30 60 15 42 16MONMOUTH 24 -11.1% 3 1 20 3 0MORRIS 17 -57.5% * 10 5 1 4 17OCEAN 69 -18.8% 53 10 0 27 7PASSAIC 356 -29.4% 256 12 43 102 54SALEM 4 0.0% ∆ 2 1 0 1 1SOMERSET 67 3.1% ∆ 30 6 18 25 26SUSSEX 2 -87.5% * 0 0 2 0 2UNION 122 -22.8% 70 13 25 25 16WARREN 8 -46.7% * 7 1 0 0 2
NJ TOTAL 1,785 -23.4% 968 158 510 457 383
∆= ↑ Caseload % * = ↓ Caseload %**SSI-EA includes pay codes 22 and 24, data is derived from NJ Division of Family Development FAMIS Report #FM430-03A
WFNJ/EA data is derived from NJ MMIS Shared Data Warehouse. Effective July 2013 this data query source was converted to the SDW
ATL
AN
TIC
BER
GEN
BU
RLI
NG
TON
CA
MD
EN
CA
PE M
AY
CU
MB
ERLA
ND
ESSE
X
GLO
UC
ESTE
R
HU
DSO
N
HU
NTE
RD
ON
MER
CER
MID
DLE
SEX
MO
NM
OU
TH
MO
RR
IS
OC
EAN
PASS
AIC
SALE
M
SOM
ERSE
T
SUSS
EX
UN
ION
WA
RR
EN
107
62 107
65 21 3
322
30
190
0
90 119
24 17
69
356
4
67
2
122
8
Number WFNJ Families Receiving EA by County MARCH 2018

Source: NJ Division of Family Development, GA Fiscal Unit
New Jersey Department of Human Services Division of Family Development Page 11
Table 10 NUMBER OF EMPLOYABLE AND UNEMPLOYABLE RECIPIENTSGENERAL AND EMERGENCY ASSISTANCE PAYMENTS FOR MARCH 2018 - STATEWIDEASSISTANCE MARCH 2016 THROUGH MARCH 2018PROGRAM Total Cases Emergency Assistance Cases
Temporary Other Employable % Chng Unemployable % Chng Total % Chng Rental Assistance GA-EA Total % Chng
(1 Yr) (1 Yr) (1 Yr) (1 Yr)2016 MAR 10,449 -35.2% 9,585 -15.7% 20,034 -27.2% 1,698 1,654 3,352 -36.8%
APR 9,977 -35.2% 9,620 -14.2% 19,597 -26.3% 1,627 1,612 3,239 -36.9%MAY 9,257 -38.7% 9,596 -12.8% 18,853 -27.8% 1,559 1,163 2,722 -43.8%JUN 8,816 -39.9% 9,607 -12.2% 18,423 -28.0% 1,556 1,365 2,921 -38.3%JUL 8,126 -42.1% 9,324 -13.4% 17,450 -29.6% 1,459 1,236 2,695 -41.5%AUG 7,978 -41.1% 9,360 -11.5% 17,338 -28.1% 1,473 1,389 2,862 -30.1%SEP 7,545 -42.3% 9,156 -12.2% 16,701 -28.9% 1,423 1,209 2,632 -31.9%OCT 7,432 -41.2% 9,169 -11.0% 16,601 -27.7% 1,375 1,427 2,802 -28.5%NOV 7,084 -40.5% 9,093 -9.6% 16,177 -26.4% 1,369 1,328 2,697 -21.2%DEC 6,823 -42.3% 8,938 -10.2% 15,761 -27.6% 1,300 1,251 2,551 -31.6%
2016 Average 8,779 9,387 18,166 1,534 1,393 2,9272017 JAN 6,551 -41.1% 8,773 -8.7% 15,324 -26.1% 1,323 1,190 2,513 -24.4%
FEB 6,433 -40.1% 8,669 -9.7% 15,102 -25.7% 1,262 1,111 2,373 -28.7%MAR 6,455 -38.2% 8,701 -9.2% 15,156 -24.3% 1,254 1,185 2,439 -27.2%APR 6,273 -37.1% 8,483 -11.8% 14,756 -24.7% 1,237 1,174 2,411 -25.6%MAY 6,105 -34.0% 8,407 -12.4% 14,512 -23.0% 1,227 1,180 2,407 -11.6%JUN 6,029 -31.6% 8,352 -13.1% 14,381 -21.9% 1,214 1,192 2,406 -17.6%JUL 5,672 -30.2% 8,178 -12.3% 13,850 -20.6% 1,167 1,011 2,178 -19.2%AUG 5,754 -27.9% 8,120 -13.2% 13,874 -20.0% 1,139 1,196 2,335 -18.4%SEP 5,458 -27.7% 7,902 -13.7% 13,360 -20.0% 1,095 1,039 2,134 -18.9%OCT 5,461 -26.5% 7,878 -14.1% 13,339 -19.6% 1,117 1,148 2,265 -19.2%NOV 5,382 -24.0% 7,646 -15.9% 13,028 -19.5% 1,055 936 1,991 -26.2%DEC 5,606 -17.8% 7,524 -15.8% 13,130 -16.7% 1,045 1,059 2,104 -17.5%
2017 Average 5,932 8,219 14,151 1,178 1,118 2,2962018 JAN 5,411 -17.4% 7,428 -15.3% 12,839 -16.2% 984 1,113 2,097 -16.6%
FEB 5,157 -19.8% 7,314 -15.6% 12,471 -17.4% 999 1,069 2,068 -12.9%MAR 5,214 -19.2% 7,255 -16.6% 12,469 -17.7% 995 1,055 2,050 -15.9%
2018 AVG to date 5,261 7,332 12,593 993 1,079 2,072
0
5,000
10,000
15,000
20,000
25,000
30,000
M
A
M
J
J
A
S
O
N
D
J
F
M
A
M
J
J
A
S
O
N
D
J
F
M 16 17 18
TOTAL PERSONS AIDED
NJ Statewide General Assistance Cases
MARCH 2016 THROUGH MARCH 2018
Unemployable Persons Aided
Employable Persons Aided
Total Emergency Assist Payments

New Jersey Department of Human Services Division of Family Development Page 12TABLE 11 GENERAL EMPLOYABLE AND UNEMPLOYABLE CASESASSISTANCE AND EMERGENCY ASSISTANCE CASES RECEIVING PAYMENTS BY COUNTYPROGRAM MARCH 2018
Total Cases Emergency Assistance CasesCounty Employable % Chng Unemployable % Chng Total % Chng Temporary Other Total % Chng
(From Mar 17 ) (From Mar 17 ) (From Mar 17 ) Rental Assist. GA-EA (From Mar 17 )
ATLANTIC 638 -18.8% 358 -19.4% 996 -19.0% 126 32 158 -12.7%BERGEN 248 -40.5% 544 -14.7% 792 -24.9% 134 29 163 -16.4%BURLINGTON 266 -24.2% 434 -27.3% 700 -26.2% 40 85 125 -39.6% *CAMDEN 598 -9.5% 838 -17.9% 1,436 -14.6% 51 87 138 -10.4%CAPE MAY 72 16.1% 100 -2.9% 172 4.2% ∆ 30 55 85 26.9% ∆CUMBERLAND 213 -27.1% 325 -7.4% 538 -16.3% 1 5 6 -66.7% *ESSEX 870 -5.1% 507 -19.3% 1,377 -10.9% 49 164 213 -14.1%GLOUCESTER 154 -36.6% 264 -21.0% 418 -27.6% * 17 35 52 -17.5%HUDSON 462 -25.5% 982 -15.3% 1,444 -18.9% 87 42 129 -15.1%HUNTERDON 52 8.3% 71 14.5% 123 11.8% ∆ 19 13 32 -8.6%MERCER 235 -7.1% 472 -11.3% 707 -9.9% 41 45 86 -36.3%MIDDLESEX 203 -36.2% 381 1.6% 584 -15.7% 54 102 156 0.0%MONMOUTH 74 32.1% 178 -2.2% 252 5.9% ∆ 0 15 15 -6.3%MORRIS 151 0.0% 234 -17.0% 385 -11.1% 59 35 94 -27.1%OCEAN 197 -11.7% 326 0.0% 523 -4.7% 75 81 156 20.0% ∆PASSAIC 229 -38.8% 615 -22.1% 844 -27.4% * 92 38 130 -27.4%SALEM 43 48.3% 87 -37.9% 130 -23.1% 6 6 12 9.1%SOMERSET 73 -6.4% 60 -34.1% 133 -21.3% 23 23 46 -38.7% *SUSSEX 55 -38.2% 48 26.3% 103 -18.9% 5 28 33 17.9%UNION 294 -23.4% 335 -31.6% 629 -28.0% * 79 104 183 -21.8%WARREN 87 -15.5% 96 -18.6% 183 -17.2% 7 31 38 46.2% ∆NJ TOTAL 5,214 -19.2% 7,255 -16.6% 12,469 -17.7% 995 1,055 2,050 -15.9%
∆= ↑ Caseload % * = ↓ Caseload %
Source: NJ Division of Family Development, GA Fiscal Unit
Department of Human Services Division of Family Development Page 13
TABLE 12
OFFICE OF CHILD SUPPORT SERVICESQuarterly Performance Report
State SummaryTITLE IV-D SOURCE COLLECTION REPORT
Comparison of Quarter-2 (FFY 17 vs. FFY 18)
TOTAL TOTAL
FEDERAL TAX 22,100,794$ 6.65% 19,333,980$ 6.14% (2,766,814)$ -12.52%
STATE TAX 256,524$ 0.08% 267,391$ 0.08% 10,867$ 4.24%
UIB 9,163,308$ 2.76% 8,964,407$ 2.85% (198,901)$ -2.17%
INC WITHHOLD 220,252,048$ 66.27% 208,504,460$ 66.22% (11,747,588)$ -5.33%
FROM OTHER 12,464,744$ 3.75% 11,903,534$ 3.78% (561,210)$ -4.50%STATES
ADMIN ENFORCEMENT 2,843,836$ 0.86% 3,732,174$ 1.19% 888,337$ 31.24%
OTHER 65,292,583$ 19.64% 62,141,917$ 19.74% (3,150,666)$ -4.83%
DISTRIBUTED COLLECTIONS**
* Includes collections on both current support and arrears.** Includes collections on both current support and arrears; also includes money sent to other states.SOURCE: NJKiDS (Based on Federal Quarterly Report of Collections - OCSE-34A except Distributed Collections) Distributed Collections obtained from Federal Data Report - OCSE-157, which is reported annually to Congress and used in the calculation of incentive dollars earned by each state.
-5.27%
296,938,727$ 277,507,087$
332,373,837$
1/1/2018 - 3/31/2018
% OF TOTAL COLLECTIONS
DOLLAR CHANGE
(17,525,975)$ 314,847,863$ 100%
OFFICE OF CHILD SUPPORT SERVICES
COLLECTION SOURCE % OF TOTAL COLLECTIONS
% CHANGE1/1/2017 -
3/31/2017
(19,431,640)$ -6.54%
TOTAL COLLECTIONS* 100%
Department of Human Services Division of Family Development Page 14
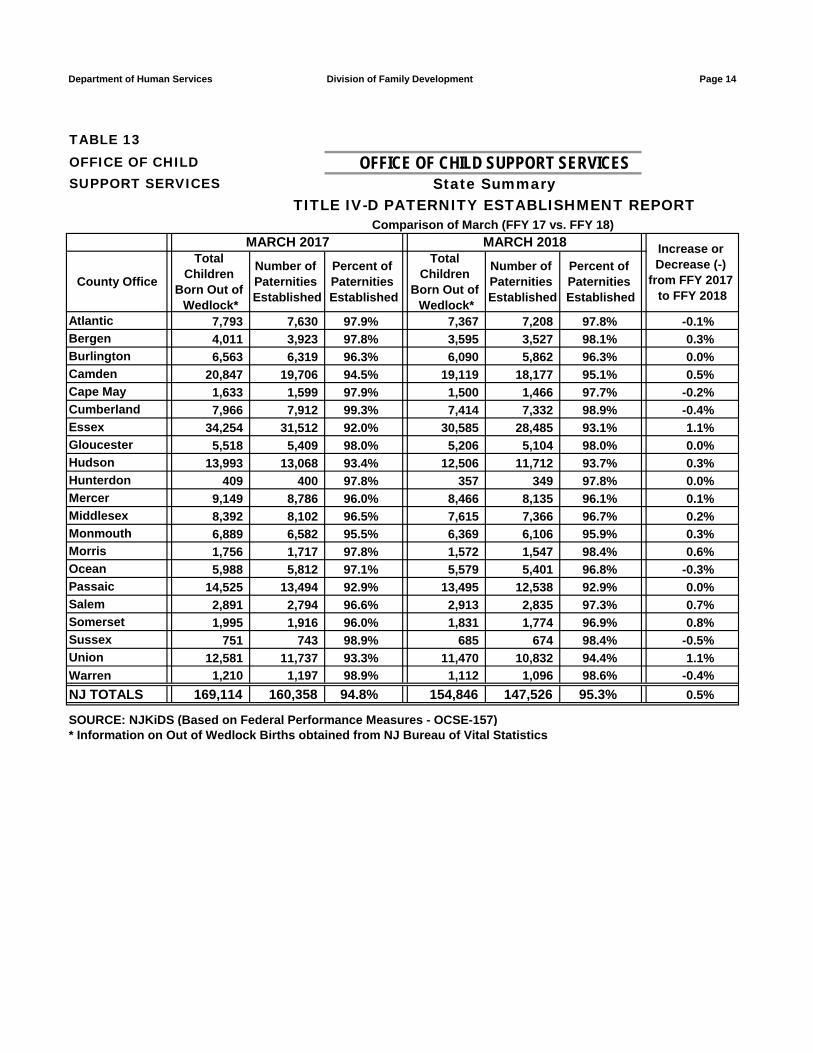
TABLE 13
OFFICE OF CHILD SUPPORT SERVICESState Summary
TITLE IV-D PATERNITY ESTABLISHMENT REPORTComparison of March (FFY 17 vs. FFY 18)
County Office
Total Children
Born Out of Wedlock*
Number of Paternities Established
Percent of Paternities Established
Total Children
Born Out of Wedlock*
Number of Paternities Established
Percent of Paternities Established
Atlantic 7,793 7,630 97.9% 7,367 7,208 97.8% -0.1%Bergen 4,011 3,923 97.8% 3,595 3,527 98.1% 0.3%Burlington 6,563 6,319 96.3% 6,090 5,862 96.3% 0.0%Camden 20,847 19,706 94.5% 19,119 18,177 95.1% 0.5%Cape May 1,633 1,599 97.9% 1,500 1,466 97.7% -0.2%Cumberland 7,966 7,912 99.3% 7,414 7,332 98.9% -0.4%Essex 34,254 31,512 92.0% 30,585 28,485 93.1% 1.1%Gloucester 5,518 5,409 98.0% 5,206 5,104 98.0% 0.0%Hudson 13,993 13,068 93.4% 12,506 11,712 93.7% 0.3%Hunterdon 409 400 97.8% 357 349 97.8% 0.0%Mercer 9,149 8,786 96.0% 8,466 8,135 96.1% 0.1%Middlesex 8,392 8,102 96.5% 7,615 7,366 96.7% 0.2%Monmouth 6,889 6,582 95.5% 6,369 6,106 95.9% 0.3%Morris 1,756 1,717 97.8% 1,572 1,547 98.4% 0.6%Ocean 5,988 5,812 97.1% 5,579 5,401 96.8% -0.3%Passaic 14,525 13,494 92.9% 13,495 12,538 92.9% 0.0%Salem 2,891 2,794 96.6% 2,913 2,835 97.3% 0.7%Somerset 1,995 1,916 96.0% 1,831 1,774 96.9% 0.8%Sussex 751 743 98.9% 685 674 98.4% -0.5%Union 12,581 11,737 93.3% 11,470 10,832 94.4% 1.1%Warren 1,210 1,197 98.9% 1,112 1,096 98.6% -0.4%NJ TOTALS 169,114 160,358 94.8% 154,846 147,526 95.3% 0.5%
SOURCE: NJKiDS (Based on Federal Performance Measures - OCSE-157) * Information on Out of Wedlock Births obtained from NJ Bureau of Vital Statistics
OFFICE OF CHILD SUPPORT SERVICES
MARCH 2017 MARCH 2018 Increase or Decrease (-)
from FFY 2017 to FFY 2018

Department of Human Services Division of Family Development Page 15
TABLE 14
OFFICE OF CHILD SUPPORT SERVICESState Summary
TITLE IV-D REPORT OF CASES WITH ORDERSComparison of March (FFY 17 vs. FFY 18)
March 2017 March 2018
County Office TOTAL CASES
CASES WITH
ORDERS
% OF CASES WITH ORDERS
TOTAL CASES
CASES WITH
ORDERS
% OF CASES WITH ORDERS
Atlantic 13,723 12,033 87.7% 13,226 11,444 86.5% -1.2%Bergen 13,312 12,723 95.6% 12,405 11,935 96.2% 0.6%Burlington 15,558 13,621 87.5% 14,875 13,004 87.4% -0.1%Camden 34,540 28,427 82.3% 32,642 27,488 84.2% 1.9%Cape May 3,633 3,215 88.5% 3,339 3,032 90.8% 2.3%Cumberland 13,148 12,401 94.3% 12,683 11,926 94.0% -0.3%Essex 52,254 40,387 77.3% 47,883 37,698 78.7% 1.4%Gloucester 11,667 11,075 94.9% 11,200 10,677 95.3% 0.4%Hudson 26,285 20,920 79.6% 24,022 19,130 79.6% 0.0%Hunterdon 1,692 1,636 96.7% 1,541 1,482 96.2% -0.5%Mercer 16,269 14,195 87.3% 15,212 13,374 87.9% 0.7%Middlesex 19,990 18,484 92.5% 18,616 17,224 92.5% 0.1%Monmouth 16,141 15,222 94.3% 15,276 14,409 94.3% 0.0%Morris 6,688 6,407 95.8% 6,217 5,981 96.2% 0.4%Ocean 16,552 15,690 94.8% 15,615 14,974 95.9% 1.1%Passaic 25,982 18,992 73.1% 24,837 18,129 73.0% -0.1%Salem 4,726 4,513 95.5% 4,575 4,392 96.0% 0.5%Somerset 5,722 5,207 91.0% 5,233 4,928 94.2% 3.2%Sussex 3,010 2,892 96.1% 2,872 2,747 95.6% -0.4%Union 21,270 19,283 90.7% 19,481 18,081 92.8% 2.2%Warren 3,357 3,048 90.8% 3,184 2,903 91.2% 0.4%NJ TOTALS 325,519 280,371 86.1% 304,934 264,958 86.9% 0.8%
SOURCE: NJKiDS (Based on Federal Performance Measures - OCSE-157)
OFFICE OF CHILD SUPPORT SERVICES
Increase or Decrease (-)
from FFY 2017 to FFY 2018

Department of Human Services Division of Family Development Page 16
OFFICE OF CHILD SUPPORT SERVICESState Summary
TITLE IV-D COLLECTIONS ON CURRENT SUPPORTComparison of March (FFY 17 vs. FFY 18)
County Office
Total Current Support Due
Total Current Support
Distributed
Total Collection
Rate
Total Current Support Due
Total Current Support
Distributed
Total Collection
Rate
Atlantic $4,305,717 $2,851,769 66.2% $3,775,498 $2,490,516 66.0% -0.3%Bergen $9,756,009 $7,316,923 75.0% $8,693,115 $6,639,145 76.4% 1.4%Burlington $6,821,707 $4,742,898 69.5% $6,039,421 $4,241,871 70.2% 0.7%Camden $8,976,548 $5,410,640 60.3% $8,135,429 $4,828,757 59.4% -0.9%Cape May $1,261,357 $878,937 69.7% $1,146,680 $791,600 69.0% -0.6%Cumberland $3,431,688 $2,034,730 59.3% $3,096,770 $1,839,321 59.4% 0.1%Essex $13,865,764 $7,893,973 56.9% $11,064,448 $6,583,823 59.5% 2.6%Gloucester $4,940,818 $3,182,571 64.4% $4,430,721 $2,837,658 64.0% -0.4%Hudson $8,540,658 $5,725,300 67.0% $7,186,865 $4,951,420 68.9% 1.9%Hunterdon $1,548,520 $1,241,751 80.2% $1,323,250 $1,050,528 79.4% -0.8%Mercer $5,158,283 $3,119,411 60.5% $4,315,884 $2,654,318 61.5% 1.0%Middlesex $9,356,758 $6,303,742 67.4% $7,926,829 $5,454,607 68.8% 1.4%Monmouth $8,736,354 $6,211,916 71.1% $7,616,832 $5,431,029 71.3% 0.2%Morris $5,182,067 $3,775,722 72.9% $4,609,321 $3,337,711 72.4% -0.4%Ocean $7,944,771 $5,798,160 73.0% $6,933,873 $4,977,457 71.8% -1.2%Passaic $7,806,103 $4,841,336 62.0% $6,616,666 $4,238,696 64.1% 2.0%Salem $1,388,415 $809,073 58.3% $1,192,867 $699,559 58.6% 0.4%Somerset $3,654,464 $2,865,425 78.4% $3,294,411 $2,531,780 76.9% -1.6%Sussex $2,074,179 $1,560,271 75.2% $1,864,948 $1,427,177 76.5% 1.3%Union $8,189,697 $5,395,687 65.9% $6,918,988 $4,732,592 68.4% 2.5%Warren $1,546,734 $1,122,537 72.6% $1,379,928 $1,026,387 74.4% 1.8%NJ TOTALS $124,486,610 $83,082,772 66.7% $107,562,743 $72,765,953 67.6% 0.9%
SOURCE: NJKiDS (Based on Federal Performance Measures - OCSE-157)
TABLE 15
OFFICE OF CHILD SUPPORT SERVICES
March 2017 March 2018 Increase or Decrease (-)
from FFY 2017 to FFY
2018

Department of Human Services Division of Family Development Page 17
OFFICE OF CHILD SUPPORT SERVICESState Summary
TITLE IV-D CASES ARREARS COLLECTION REPORTComparison of March (FFY 17 vs. FFY 18)
County OfficeTotal
Cases with Arrears
Total Amount Collected
Average Arrears
Collection per Case
Total Cases with
Arrears
Total Amount Collected
Average Arrears
Collection per Case
Atlantic 8,249 $1,248,544 $151.36 7,536 $1,201,455 $159.43 $8.07Bergen 8,519 $1,592,589 $186.95 7,703 $1,289,073 $167.35 -$19.60Burlington 9,254 $1,580,735 $170.82 8,534 $1,326,322 $155.42 -$15.40Camden 18,383 $2,883,830 $156.87 17,588 $2,692,312 $153.08 -$3.80Cape May 2,243 $296,352 $132.12 2,079 $311,136 $149.66 $17.53Cumberland 8,465 $1,190,454 $140.63 7,888 $1,097,104 $139.09 -$1.55Essex 28,043 $4,066,332 $145.00 23,825 $3,950,121 $165.80 $20.79Gloucester 7,695 $1,213,971 $157.76 7,182 $1,112,626 $154.92 -$2.84Hudson 15,012 $2,474,325 $164.82 12,991 $2,027,675 $156.08 -$8.74Hunterdon 1,022 $213,361 $208.77 943 $169,770 $180.03 -$28.74Mercer 9,715 $1,554,207 $159.98 8,800 $1,410,482 $160.28 $0.30Middlesex 12,828 $2,299,479 $179.25 11,502 $1,806,551 $157.06 -$22.19Monmouth 10,291 $1,760,311 $171.05 9,307 $1,604,928 $172.44 $1.39Morris 4,414 $785,878 $178.04 4,008 $749,539 $187.01 $8.97Ocean 10,630 $1,764,776 $166.02 9,702 $1,498,831 $154.49 -$11.53Passaic 13,605 $2,180,438 $160.27 12,098 $1,973,387 $163.12 $2.85Salem 2,991 $343,765 $114.93 2,732 $320,653 $117.37 $2.44Somerset 3,520 $692,542 $196.74 3,291 $642,543 $195.24 -$1.50Sussex 2,019 $411,163 $203.65 1,828 $314,360 $171.97 -$31.68Union 13,510 $2,217,033 $164.10 11,898 $1,912,351 $160.73 -$3.37Warren 2,087 $390,700 $187.21 1,924 $319,862 $166.25 -$20.96NJ TOTALS 192,495 $31,160,785 $161.88 173,359 $27,731,081 $159.96 -$1.92
SOURCE:OCSE-157 Child Support Enforcement Annual Data Report
TABLE 16
OFFICE OF CHILD SUPPORT SERVICES
March 2017 March 2018 Increase or Decrease (-)
from FFY 2017 to FFY 2018

New Jersey Department of Human Services Page 18
Table 17 WORK FIRST NEW JERSEY STATISTICAL SUMMARYWFNJ MARCH 2018
EMPLOYMENT DIRECTED ACTIVITIES EMPLOYED CLOSED POST
CWEP ALL JOB OPEN FOR ASSISTANCE
COUNTY OTHER SEARCH (WFNJ CHILD TRAINING REL. EMPLOYMENT CHILD
TRAINING RECIPIENT) CARE EXPENSES THIS MONTH CARE
ATLANTIC 103 130 47 90 47 197 20 66BERGEN 55 2 46 15 31 24 6 54BURLINGTON 60 24 56 72 70 68 10 117CAMDEN 196 126 20 222 179 349 22 208CAPE MAY 14 5 8 10 2 14 1 16CUMBERLAND 45 57 41 24 25 65 9 43ESSEX 437 499 17 301 339 535 53 518GLOUCESTER 13 18 7 32 5 14 5 41HUDSON 118 225 9 129 197 347 32 281HUNTERDON 0 0 9 3 0 0 0 4MERCER 137 41 65 71 91 70 7 111MIDDLESEX 31 32 53 44 32 45 10 86MONMOUTH 22 39 30 39 52 39 7 56MORRIS 2 3 9 15 11 11 2 16OCEAN 4 108 0 19 24 35 6 83PASSAIC 250 216 15 90 159 177 22 148SALEM 1 16 16 9 10 12 3 6SOMERSET 53 11 11 44 25 29 6 30SUSSEX 8 0 6 5 2 1 2 6UNION 237 93 5 38 71 110 8 105WARREN 15 7 6 22 13 1 3 21
STATE 1,801 1,652 476 1,294 1,385 2,143 234 2,016Data is derived from NJ Division of Family Development's FAMIS Reports RM064-01 & RM703-51, AdHoc Reports 5549 & 5598 and SDW Report WR00022WZ_CC
SUPPORT SERVICES
ON ACTIVE CASE
DIVISION OF FAMILY DEVELOPMENT CURRENT PROGRAM STATISTICSMARCH 2018
-19-
ACRONYMS
FAMIS: Family Assistance Management Information System
GAAS: General Assistance Automated System
NJKiDS: New Jersey Kids Deserve Support (Child Support Information Management System)
OMEGA: Online Management of Economic Goal Achievement
SSI-EA: Supplemental Security Income-Emergency Assistance
EMERGENCY ASSISTANCE (EA) - Payments to those eligible for WFNJ/TANF or WFNJ/GA, authorized during the 30 consecutive days immediately following the emergency (defined as a substantial loss of shelter, food, clothing, or household furnishings by fire, flood or other similar disaster) or if eligible individual or family is an imminent or actual state of homelessness.
NJ SNAP - Formerly the Food Stamp Program, now known as NJ SNAP (NJ Supplemental Nutrition Assistance Program) authorized by Congress as a nutritional supplement program to provide low income households with more food of greater variety and better nutrition. Program eligibility is based on household income, resources, and expenses for medical, shelter, and dependent care. CWA staff refers certain recipients to the New Jersey Department of Labor for participation in the Food Stamp Employment and Training Program.
NJ MMIS SHARED DATA WAREHOUSE: The Shared Data Warehouse (SDW) is the repository for New Jersey's DFD and Medicaid data. Since 2003, OptumInsight has administered the SDW and provided access to the data through a reporting tool known as Business Objects.
WFNJ: Work First New Jersey - Fully implemented July 1, 1997, this is New Jersey's welfare reform program which responds to the requirements of the Federal Personal Responsibility and Work Opportunity Reconciliation Act (PRWORA) of 1996. PRWORA established Temporary Assistance for Needy Families (TANF) as the replacement for AFDC cash assistance. WFNJ includes two segments, WFNJ/TANF for families with children, and WFNJ/GA (General Assistance) for single adults and couples without dependent children. WFNJ emphasizes achieving self-sufficiency and limits lifetime receipt of financial assistance to a total of five years.

DIVISION OF FAMILY DEVELOPMENT CURRENT PROGRAM STATISTICSMARCH 2018
-20-
WFNJ Statistical Summary (Table 17)
EXPLANATORY NOTES The Department of Human Services Division of Family Development provides basic income and an opportunity to achieve self-sufficiency for individuals and families served by the Division's programs. The Division provides leadership, direction and supervision to those public agencies responsible for administering those programs and plans for and develops policies to promote self-sufficiency.
Employment Directed Activities (EDA) - From Activities Summary Report (OMEGA report # RM064). Unduplicated count of persons participating in Community Work Experience Program (CWEP), All Other Training, or Job Search.
Number of Persons Employed This Month, Still Receiving TANF Individuals with open "empl" activity on OMEGA. Ad hoc report.
Participants Receiving Child Care Services - From Issuance Disbursement Summary (OMEGA report # RM703). Total number of active participants who show receipt of Child Care.
Number of Persons Closed on FAMIS Due to Employment - From FAMIS report #5549-RM-2.
Post TANF and Receiving Child Care - Persons no longer in receipt of TANF but still receiving child care. From Share Data Warehouse Child Care case count based on Child Care payments (SDW report WR00022WZ_CC ).