Embed Size (px)
Citation preview

STATE OF NEW JERSEY TEACHERS’ PENSION AND ANNUITY FUND
Schedules of Employer and Nonemployer Allocations and Schedules of Pension Amounts by Employer and Nonemployer
June 30, 2014 and 2013
(With Independent Auditors’ Report Thereon)
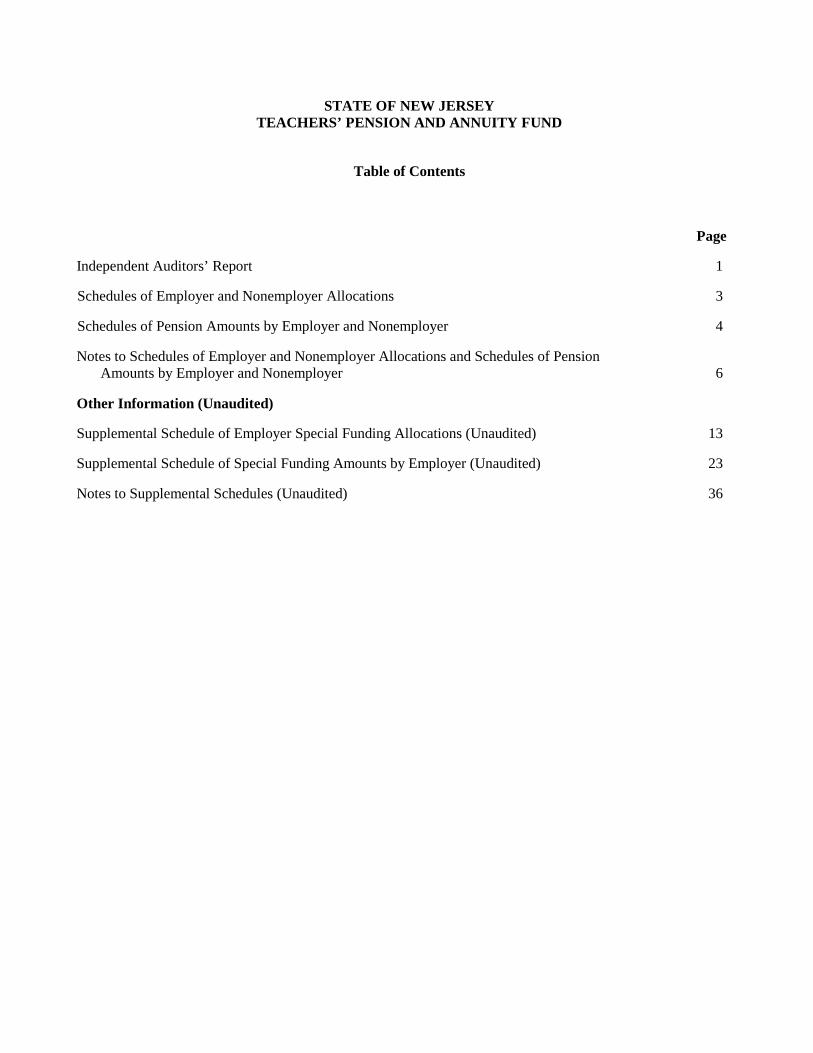
STATE OF NEW JERSEY TEACHERS’ PENSION AND ANNUITY FUND
Table of Contents
Page
Independent Auditors’ Report 1
Schedules of Employer and Nonemployer Allocations 3
Schedules of Pension Amounts by Employer and Nonemployer 4
Notes to Schedules of Employer and Nonemployer Allocations and Schedules of Pension Amounts by Employer and Nonemployer 6
Other Information (Unaudited)
Supplemental Schedule of Employer Special Funding Allocations (Unaudited) 13
Supplemental Schedule of Special Funding Amounts by Employer (Unaudited) 23
Notes to Supplemental Schedules (Unaudited) 36

Independent Auditors’ Report
The Treasurer State of New Jersey:
We have audited the accompanying schedules of employer and nonemployer allocations of the State of New Jersey Teachers’ Pension and Annuity Fund as of and for the years ended June 30, 2014 and 2013, and the related notes. We have also audited the columns titled net pension liability, total deferred outflows of resources, total deferred inflows of resources, and total pension expense excluding that attributable to employer-paid member contributions (specified column totals) included in the accompanying schedule of pension amounts by employer and nonemployer of the State of New Jersey Teachers’ Pension and Annuity Fund as of and for the year ended June 30, 2014, the column titled net pension liability (specified column total) included in the accompanying schedule of pension amounts by employer and nonemployer of the State of New Jersey Teachers’ Pension and Annuity Fund as of June 30, 2013, and the related notes.
Management’s Responsibility for the Schedules
Management is responsible for the preparation and fair presentation of these schedules in accordance with U.S. generally accepted accounting principles; this includes the design, implementation, and maintenance of internal control relevant to the preparation and fair presentation of the schedules that are free from material misstatement, whether due to fraud or error.
Auditors’ Responsibility
Our responsibility is to express opinions on the schedules of employer and nonemployer allocations and the specified column totals included in the schedules of pension amounts by employer and nonemployer based on our audits. We conducted our audits in accordance with auditing standards generally accepted in the United States of America. Those standards require that we plan and perform the audit to obtain reasonable assurance about whether the schedules of employer and nonemployer allocations and specified column totals included in the schedules of pension amounts by employer and nonemployer are free from material misstatement.
An audit involves performing procedures to obtain audit evidence about the amounts and disclosures in the schedule of employer and nonemployer allocations and specified column totals included in the schedule of pension amounts by employer and nonemployer. The procedures selected depend on the auditors’ judgment, including the assessment of the risks of material misstatement of the schedule of employer and nonemployer allocations and specified column totals included in the schedule of pension amounts by employer and nonemployer, whether due to fraud or error. In making those risk assessments, the auditor considers internal control relevant to the entity’s preparation and fair presentation of the schedule of employer and nonemployer allocations and specified column totals included in the schedule of pension amounts by employer and nonemployer in order to design audit procedures that are appropriate in the circumstances, but not for the purpose of expressing an opinion on the effectiveness of the entity’s internal control. Accordingly, we express no such opinion. An audit also includes evaluating the appropriateness of accounting policies used and the reasonableness of significant accounting estimates made by management, as well as evaluating the
KPMG LLP New Jersey Headquarters 51 John F. Kennedy Parkway Short Hills, NJ 07078-2702
KPMG LLP is a Delaware limited liability partnership, the U.S. member firm of KPMG International Cooperative (“KPMG International”), a Swiss entity.

2
overall presentation of the schedule of employer and nonemployer allocations and specified column totals included in the schedule of pension amounts by employer and nonemployer.
We believe that the audit evidence we have obtained is sufficient and appropriate to provide a basis for our audit opinions.
Opinions
In our opinion, the schedules referred to above present fairly, in all material respects, the employer and nonemployer allocations and net pension liability, total deferred outflows of resources, total deferred inflows of resources, and total pension expense excluding that attributable to employer-paid member contributions for the total of all participating entities for the State of New Jersey Teachers’ Pension and Annuity Fund as of and for the year ended June 30, 2014, and the employer and nonemployer allocations and net pension liability for the total of all participating entities for the State of New Jersey Teachers’ Pension and Annuity Fund as of and for the year ended June 30, 2013 in accordance with U. S. generally accepted accounting principles.
Other Matters
We have audited, in accordance with auditing standards generally accepted in the United States of America, the financial statements of the State of New Jersey, Division of Pensions and Benefits, which includes the Teachers’ Pension and Annuity Fund, as of and for the year ended June 30, 2014, and our report thereon, dated April 1, 2015, expressed an unmodified opinion on those financial statements.
Other Information
The supplemental schedule of employer special funding allocations and supplemental schedule of special funding amounts by employer on pages 13 through 35 have not been subject to the auditing procedures applied in the audits of the schedules of employer and nonemployer allocations and the schedules of pension amounts by employer and nonemployer and accordingly, we do not express an opinion or provide any assurance on them.
Restriction on Use
Our report is intended solely for the information and use of the State of New Jersey, Division of Pensions and Benefits management, the Treasurer of the State of New Jersey, State of New Jersey, Teachers’ Pension and Annuity Fund employers, and their auditors, and is not intended to be and should not be used by anyone other than these specified parties.
Short Hills, New Jersey November 13, 2015

3
STATE OF NEW JERSEY DIVISION OF PENSIONS AND BENEFITSTEACHERS' PENSION AND ANNUITY FUND
Schedules of Employer and Nonemployer Allocations
As of and for Years ended June 30, 2014 and 2013
Employer/ Employer/nonemployer Allocation nonemployer Allocation
Employer/ Nonemployer contributions percentage contributions percentage
Employer - State of New Jersey $ 2,911,487 0.6807308876% 3,220,434 0.4947777227%Nonemployer - State of New Jersey 424,788,659 99.3192691124 647,664,570 99.5052222773%
Total $ 427,700,146 100.0000000000% 650,885,004 100.0000000000%
See accompanying notes to schedules of employer and nonemployer allocations and schedules of pension amounts by employer and nonemployer.
2014 2013

4
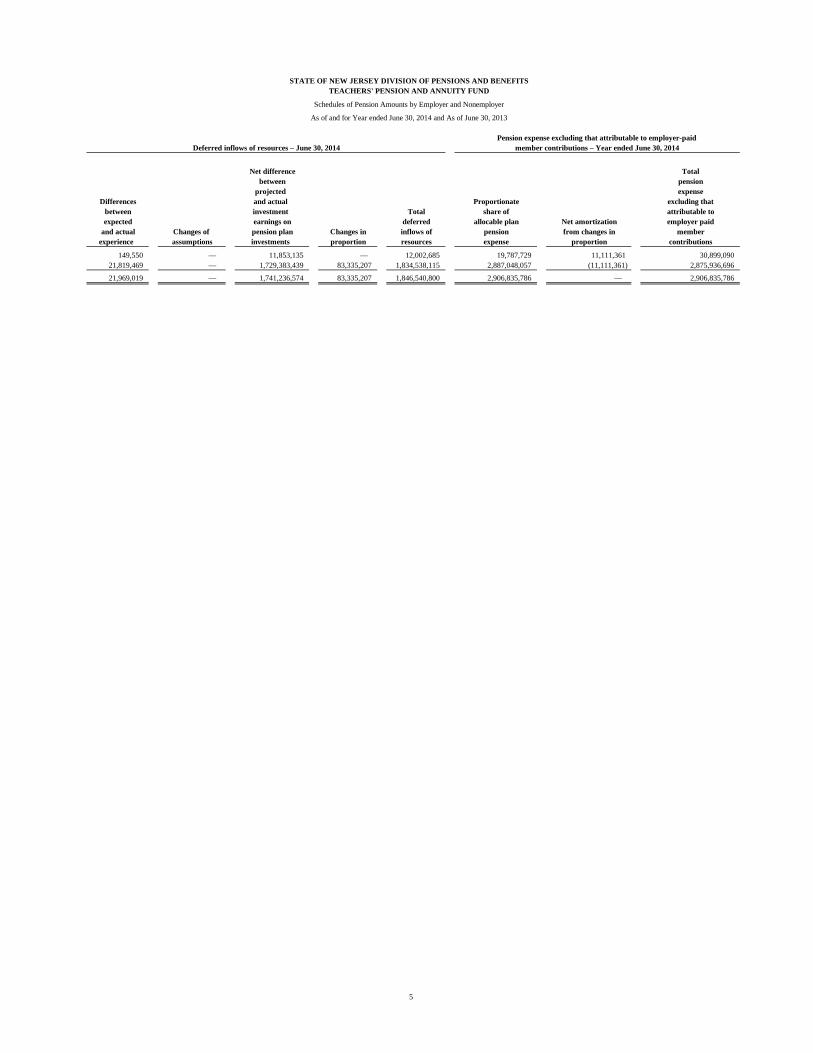
STATE OF NEW JERSEY DIVISION OF PENSIONS AND BENEFITSTEACHERS' PENSION AND ANNUITY FUND
Schedules of Pension Amounts by Employer and Nonemployer
As of and for Year ended June 30, 2014 and As of June 30, 2013
Deferred outflows of resources – June 30, 2014
Differencesbetween Total
Net pension liability expected deferredJune 30, June 30, and actual Changes of Changes in outflows of
Employer/ Nonemployer 2013 2014 experience assumptions proportion resources
Employers - State of New Jersey $ 251,300,147 366,322,172 — 15,701,901 83,335,207 99,037,108 Nonemployer - State of New Jersey 50,539,213,484 53,446,745,367 — 2,290,921,960 — 2,290,921,960
Total $ 50,790,513,631 53,813,067,539 — 2,306,623,861 83,335,207 2,389,959,068
See accompanying notes to schedules of employer and nonemployer allocations and schedules of pension amounts by employer and nonemployer.
5
Deferred inflows of resources – June 30, 2014
Net difference Totalbetween pension
projected expenseDifferences and actual Proportionate excluding that
between investment Total share of attributable toexpected earnings on deferred allocable plan Net amortization employer paid
and actual Changes of pension plan Changes in inflows of pension from changes in memberexperience assumptions investments proportion resources expense proportion contributions
149,550 — 11,853,135 — 12,002,685 19,787,729 11,111,361 30,899,090 21,819,469 — 1,729,383,439 83,335,207 1,834,538,115 2,887,048,057 (11,111,361) 2,875,936,696
21,969,019 — 1,741,236,574 83,335,207 1,846,540,800 2,906,835,786 — 2,906,835,786
member contributions – Year ended June 30, 2014
STATE OF NEW JERSEY DIVISION OF PENSIONS AND BENEFITSTEACHERS' PENSION AND ANNUITY FUND
Schedules of Pension Amounts by Employer and Nonemployer
As of and for Year ended June 30, 2014 and As of June 30, 2013
Pension expense excluding that attributable to employer-paid

STATE OF NEW JERSEY TEACHERS’ PENSION AND ANNUITY FUND
Notes to Schedules of Employer and Nonemployer Allocations and Schedules of Pension Amounts by Employer and Nonemployer
June 30, 2014 and 2013
6 (Continued)
(1) Plan Description
The State of New Jersey, Teachers’ Pension and Annuity Fund (TPAF) is a cost sharing multiple-employer defined benefit pension plan with a special-funding situation, by which the State of New Jersey (the State) is responsible to fund 100% of the employer contributions, excluding any local employer early retirement incentive (ERI) contributions. TPAF is administered by the State of New Jersey, Division of Pensions and Benefits (the Division). For additional information about TPAF, please refer to Division’s Comprehensive Annual Financial Report (CAFR) which can be found at www.state.nj.us/treasury/pensions/annrprts.shtml.
The vesting and benefit provisions are set by N.J.S.A. 18A:66. TPAF provides retirement, death and disability benefits. All benefits vest after ten years of service, except for medical benefits, which vest after 25 years of service or under the disability provisions of TPAF. Members are always fully vested for their own contributions and, after three years of service credit, become vested for 2% of related interest earned on the contributions. In the case of death before retirement, members’ beneficiaries are entitled to full interest credited to the members’ accounts.
The following represents the membership tiers for TPAF:
Tier Definition
1 Members who were enrolled prior to July 1, 20072 Members who were eligible to enroll on or after July 1, 2007 and prior to November 2, 20083 Members who were eligible to enroll on or after November 2, 2008 and prior to May 22, 20104 Members who were eligible to enroll on or after May 22, 2010 and prior to June 28, 20115 Members who were eligible to enroll on or after June 28, 2011
Service retirement benefits of 1/55th of final average salary for each year of service credit is available to tiers 1 and 2 members upon reaching age 60 and to tier 3 members upon reaching age 62. Service retirement benefits of 1/60th of final average salary for each year of service credit is available to tier 4 members upon reaching age 62 and tier 5 members upon reaching age 65. Early retirement benefits are available to tiers 1 and 2 members before reaching age 60, tiers 3 and 4 before age 62 with 25 or more years of service credit, and tier 5 before age 65 with 30 or more years of service credit. Benefits are reduced by a fraction of a percent for each month that a member retires prior to the retirement age for his/her respective tier. Deferred retirement is available to members who have at least 10 years of service credit and have not reached the service retirement age for the respective tier.
STATE OF NEW JERSEY TEACHERS’ PENSION AND ANNUITY FUND
Notes to Schedules of Employer and Nonemployer Allocations and Schedules of Pension Amounts by Employer and Nonemployer
June 30, 2014 and 2013
7 (Continued)
(2) Basis of Presentation
The schedules of employer and nonemployer allocations and the schedules of pension amounts by employer and nonemployer (collectively, the Schedules) present amounts that are considered elements of the financial statements of TPAF and the State as an employer/nonemployer entity. Accordingly, they do not purport to be a complete presentation of the financial position or changes in financial position of TPAF or the State. The amounts presented in the Schedules were prepared in accordance with U.S. generally accepted accounting principles. Such preparation requires management of TPAF to make a number of estimates and assumptions relating to the reported amounts. Due to the inherent nature of these estimates, actual results could differ from those estimates.
(3) Allocation Methodology
GASB Statement No. 68, Accounting and Financial Reporting for Pensions, requires participating employers in TPAF to recognize their proportionate share of the collective net pension liability, collective deferred outflows of resources, collective deferred inflows of resources and collective pension expense excluding that attributable to employer-paid member contributions. The employer and nonemployer allocation percentages presented in the schedules of employer and nonemployer allocations and applied to amounts presented in the schedules of pension amounts by employer and nonemployer are based on the ratio of the State’s contributions made as an employer and nonemployer towards the actuarially determined contribution amount adjusted by locations who participated in the State early retirement incentives to total contributions to TPAF during the years ended June 30, 2014 and 2013. Employer and nonemployer allocation percentages have been rounded for presentation purposes, therefore amounts presented in the schedules of pension amounts by employer and nonemployer may result in immaterial differences.
A reconciliation of total contributions presented in the schedules of employer and nonemployer allocations and additions from employer and nonemployer contributions for TPAF pursuant to its statements of changes in fiduciary net position for the years ended June 30, 2014 and 2013, respectively, is as follows:
2014 2013
Total contributions per schedules of employerand nonemployer allocations $ 427,700,146 650,885,004
Reconciling items:State Early Retirement Incentive revenue (a) — 1,734,356 Recoveries from local employers (b) — 2,819,598
Total employer and nonemployer contributions $ per audited financial statements 427,700,146 655,438,958
(a) Contributions revenue related to State early retirement incentives recorded in the Division’s financial statements for the fiscal year ended June 30, 2013.
(b) Contributions received from local employers that were related to terminations of benefits in prior years for members that were subsequently reinstated.

STATE OF NEW JERSEY TEACHERS’ PENSION AND ANNUITY FUND
Notes to Schedules of Employer and Nonemployer Allocations and Schedules of Pension Amounts by Employer and Nonemployer
June 30, 2014 and 2013
8 (Continued)
(4) Contributions
The contribution policy for TPAF is set by N.J.S.A 18A:66 and requires contributions by active members and contributing employers. State legislation has modified the amount that is contributed by the State. The State’s pension contribution is based on an actuarially determined amount which includes the employer portion of the normal cost and an amortization of the unfunded accrued liability. Funding for noncontributory group insurance benefits is based on actual claims paid. For Fiscal year 2014 and 2013, the State’s pension contribution was less than the actuarial determined amount.
(5) Special Funding Situation
The employer contributions for local participating employers are legally required to be funded by the State in accordance with N.J.S.A 18:66-33. Therefore, these local participating employers are considered to be in a special funding situation as defined by GASB Statement No. 68 and the State is treated as a nonemployer contributing entity. Since the local participating employers do not contribute directly to the plan (except for employer specific financed amounts), there is no net pension liability or deferred outflows or inflows to report in the financial statements of the local participating employers. However, the notes to the financial statements of the local participating employers must disclose the portion of the nonemployer contributing entities’ total proportionate share of the net pension liability that is associated with the local participating employer.
(6) Collective Net Pension Liability
Components of Net Pension Liability
The components of the net pension liability of the State as of June 30, 2014 and 2013 are as follows:
2014 2013
Total pension liability $ 81,095,320,000 76,678,639,671 Plan fiduciary net position 27,282,252,461 25,888,126,040
Net pension liability $ 53,813,067,539 50,790,513,631
Plan fiduciary net position as a percentage of the total pension liability 33.64% 33.76%
STATE OF NEW JERSEY TEACHERS’ PENSION AND ANNUITY FUND
Notes to Schedules of Employer and Nonemployer Allocations and Schedules of Pension Amounts by Employer and Nonemployer
June 30, 2014 and 2013
9 (Continued)
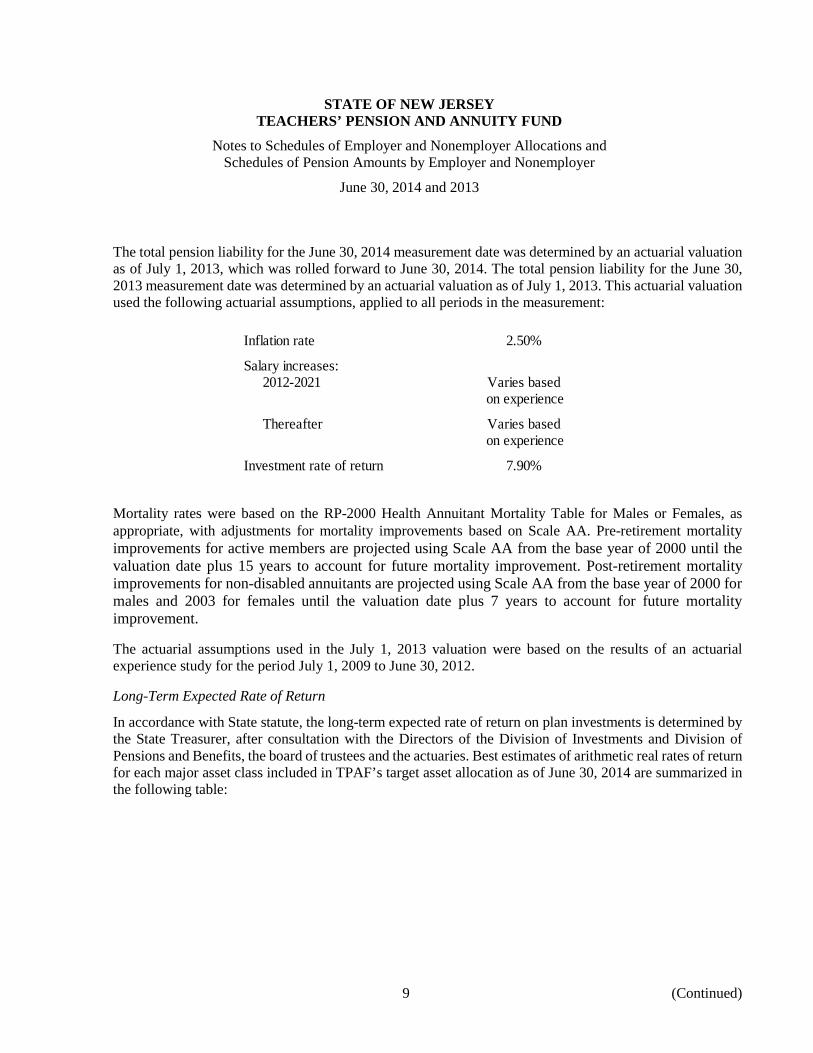
The total pension liability for the June 30, 2014 measurement date was determined by an actuarial valuation as of July 1, 2013, which was rolled forward to June 30, 2014. The total pension liability for the June 30, 2013 measurement date was determined by an actuarial valuation as of July 1, 2013. This actuarial valuation used the following actuarial assumptions, applied to all periods in the measurement:
Inflation rate 2.50%
Salary increases: 2012-2021 Varies based
on experience
Thereafter Varies based on experience
Investment rate of return 7.90%
Mortality rates were based on the RP-2000 Health Annuitant Mortality Table for Males or Females, as appropriate, with adjustments for mortality improvements based on Scale AA. Pre-retirement mortality improvements for active members are projected using Scale AA from the base year of 2000 until the valuation date plus 15 years to account for future mortality improvement. Post-retirement mortality improvements for non-disabled annuitants are projected using Scale AA from the base year of 2000 for males and 2003 for females until the valuation date plus 7 years to account for future mortality improvement.
The actuarial assumptions used in the July 1, 2013 valuation were based on the results of an actuarial experience study for the period July 1, 2009 to June 30, 2012.
Long-Term Expected Rate of Return
In accordance with State statute, the long-term expected rate of return on plan investments is determined by the State Treasurer, after consultation with the Directors of the Division of Investments and Division of Pensions and Benefits, the board of trustees and the actuaries. Best estimates of arithmetic real rates of return for each major asset class included in TPAF’s target asset allocation as of June 30, 2014 are summarized in the following table:

STATE OF NEW JERSEY TEACHERS’ PENSION AND ANNUITY FUND
Notes to Schedules of Employer and Nonemployer Allocations and Schedules of Pension Amounts by Employer and Nonemployer
June 30, 2014 and 2013
10 (Continued)
Long-TermTarget Expected Real
Asset Class Allocation Rate of ReturnCash 6.00% 0.50%Core Fixed Income 0.00% 2.19%Core Bonds 1.00% 1.38%Short-Term Bonds 0.00% 1.00%Intermediate-Term Bonds 11.20% 2.60%Long-Term Bonds 0.00% 3.23%Mortgages 2.50% 2.84%High Yield Bonds 5.50% 4.15%Non-US Fixed Income 0.00% 1.41%Inflation-Indexed Bonds 2.50% 1.30%Broad US Equities 25.90% 5.88%Large Cap US Equities 0.00% 5.62%Mid Cap US Equities 0.00% 6.39%Small Cap US Equities 0.00% 7.39%Developed Foreign Equities 12.70% 6.05%Emerging Market Equities 6.50% 8.90%Private Equity 8.25% 9.15%Hedge Funds / Absolute Return 12.25% 3.85%Real Estate (Property) 3.20% 4.43%Real Estate (REITS) 0.00% 5.58%Commodities 2.50% 3.60%Long Credit Bonds 0.00% 3.74%
STATE OF NEW JERSEY TEACHERS’ PENSION AND ANNUITY FUND
Notes to Schedules of Employer and Nonemployer Allocations and Schedules of Pension Amounts by Employer and Nonemployer
June 30, 2014 and 2013
11 (Continued)
Discount Rate
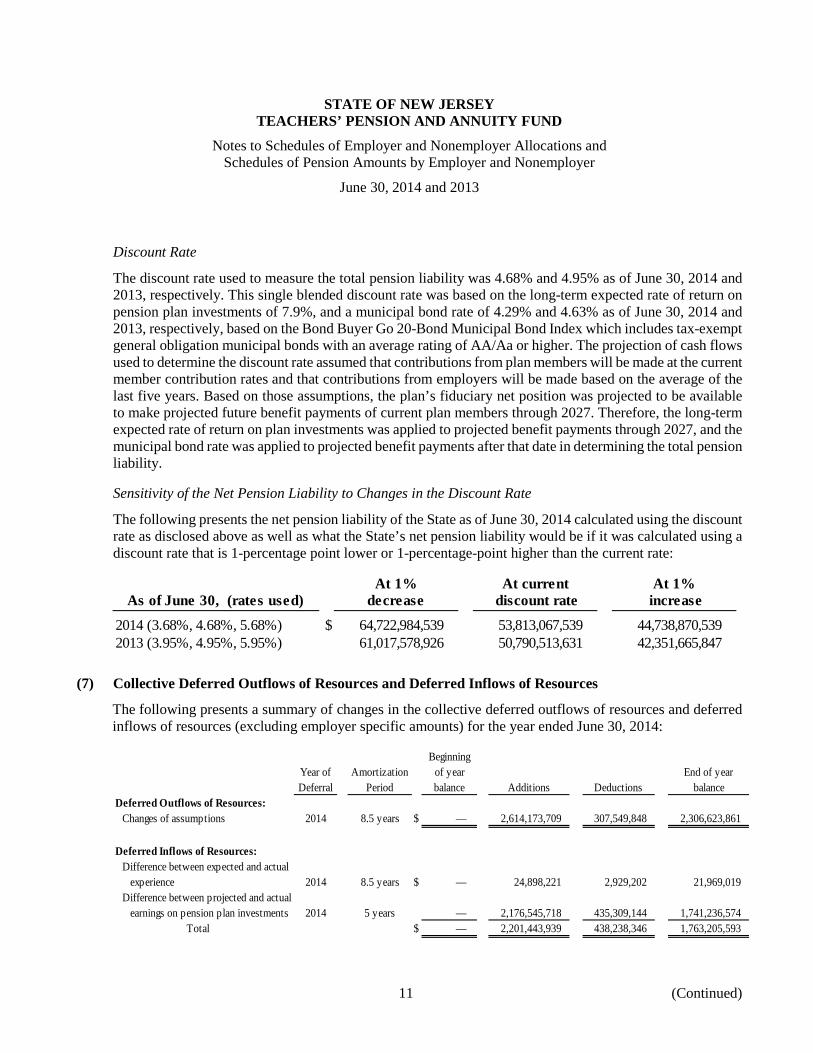
The discount rate used to measure the total pension liability was 4.68% and 4.95% as of June 30, 2014 and 2013, respectively. This single blended discount rate was based on the long-term expected rate of return on pension plan investments of 7.9%, and a municipal bond rate of 4.29% and 4.63% as of June 30, 2014 and 2013, respectively, based on the Bond Buyer Go 20-Bond Municipal Bond Index which includes tax-exempt general obligation municipal bonds with an average rating of AA/Aa or higher. The projection of cash flows used to determine the discount rate assumed that contributions from plan members will be made at the current member contribution rates and that contributions from employers will be made based on the average of the last five years. Based on those assumptions, the plan’s fiduciary net position was projected to be available to make projected future benefit payments of current plan members through 2027. Therefore, the long-term expected rate of return on plan investments was applied to projected benefit payments through 2027, and the municipal bond rate was applied to projected benefit payments after that date in determining the total pension liability.
Sensitivity of the Net Pension Liability to Changes in the Discount Rate
The following presents the net pension liability of the State as of June 30, 2014 calculated using the discount rate as disclosed above as well as what the State’s net pension liability would be if it was calculated using a discount rate that is 1-percentage point lower or 1-percentage-point higher than the current rate:
At 1% At current At 1%As of June 30, (rates used) decrease discount rate increase
2014 (3.68%, 4.68%, 5.68%) $ 64,722,984,539 53,813,067,539 44,738,870,539 2013 (3.95%, 4.95%, 5.95%) 61,017,578,926 50,790,513,631 42,351,665,847
(7) Collective Deferred Outflows of Resources and Deferred Inflows of Resources
The following presents a summary of changes in the collective deferred outflows of resources and deferred inflows of resources (excluding employer specific amounts) for the year ended June 30, 2014:
Year of Deferral
Amortization Period
Beginning of year balance Additions Deductions
End of year balance
Deferred Outflows of Resources:Changes of assumptions 2014 8.5 years $ — 2,614,173,709 307,549,848 2,306,623,861
Deferred Inflows of Resources:Difference between expected and actual
experience 2014 8.5 years $ — 24,898,221 2,929,202 21,969,019 Difference between projected and actual
earnings on pension plan investments 2014 5 years — 2,176,545,718 435,309,144 1,741,236,574 Total $ — 2,201,443,939 438,238,346 1,763,205,593

STATE OF NEW JERSEY TEACHERS’ PENSION AND ANNUITY FUND
Notes to Schedules of Employer and Nonemployer Allocations and Schedules of Pension Amounts by Employer and Nonemployer
June 30, 2014 and 2013
12
Amounts reported as deferred outflows of resources and deferred inflows of resources (excluding employer specific amounts) related to pensions will be recognized in pension expense excluding that attributable to employer-paid member contributions as follows:
Year ending June 30:2015 $ (130,688,498) 2016 (130,688,498) 2017 (130,688,498) 2018 (130,688,496) 2019 304,620,646 Thereafter 761,551,612
Total $ 543,418,268
(8) Pension Expense
The components of allocable pension expense, which exclude amounts attributable to employer paid member contributions and employer specific pension expense for change in proportion, for the year ending June 30, 2014 are as follows:
Service cost $ 1,870,901,832 Interest on total pension liability 3,794,362,523 Member contributions (716,183,306) Administrative expense 12,170,971 Expected investment return net of investment expenses (1,923,727,736) Recognition (amortization) of deferred inflows/outflows of resources:
Differences between expected and actual experience (2,929,202) Changes of assumptions 307,549,848 Difference between projected and actual investment earnings on
pension plan investments (435,309,144) Pension expense $ 2,906,835,786
(Continued) 13
Employer EmployerEmployer Nonmployer proportionate Nonmployer proportionate
Employer number County contributions share contributions share
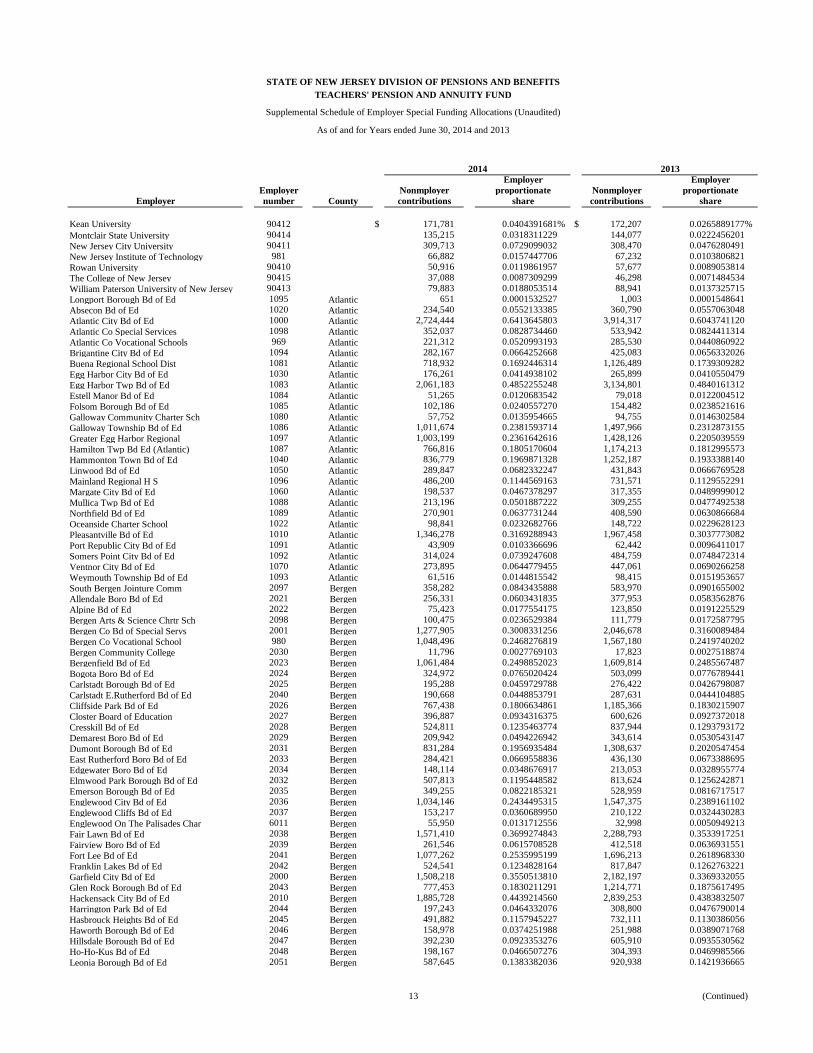
Kean University 90412 $ 171,781 0.0404391681% $ 172,207 0.0265889177%Montclair State University 90414 135,215 0.0318311229 144,077 0.0222456201New Jersey City University 90411 309,713 0.0729099032 308,470 0.0476280491New Jersey Institute of Technology 981 66,882 0.0157447706 67,232 0.0103806821Rowan University 90410 50,916 0.0119861957 57,677 0.0089053814The College of New Jersey 90415 37,088 0.0087309299 46,298 0.0071484534William Paterson University of New Jersey 90413 79,883 0.0188053514 88,941 0.0137325715Longport Borough Bd of Ed 1095 Atlantic 651 0.0001532527 1,003 0.0001548641Absecon Bd of Ed 1020 Atlantic 234,540 0.0552133385 360,790 0.0557063048Atlantic City Bd of Ed 1000 Atlantic 2,724,444 0.6413645803 3,914,317 0.6043741120Atlantic Co Special Services 1098 Atlantic 352,037 0.0828734460 533,942 0.0824411314Atlantic Co Vocational Schools 969 Atlantic 221,312 0.0520993193 285,530 0.0440860922Brigantine City Bd of Ed 1094 Atlantic 282,167 0.0664252668 425,083 0.0656332026Buena Regional School Dist 1081 Atlantic 718,932 0.1692446314 1,126,489 0.1739309282Egg Harbor City Bd of Ed 1030 Atlantic 176,261 0.0414938102 265,899 0.0410550479Egg Harbor Twp Bd of Ed 1083 Atlantic 2,061,183 0.4852255248 3,134,801 0.4840161312Estell Manor Bd of Ed 1084 Atlantic 51,265 0.0120683542 79,018 0.0122004512Folsom Borough Bd of Ed 1085 Atlantic 102,186 0.0240557270 154,482 0.0238521616Galloway Community Charter Sch 1080 Atlantic 57,752 0.0135954665 94,755 0.0146302584Galloway Township Bd of Ed 1086 Atlantic 1,011,674 0.2381593714 1,497,966 0.2312873155Greater Egg Harbor Regional 1097 Atlantic 1,003,199 0.2361642616 1,428,126 0.2205039559Hamilton Twp Bd Ed (Atlantic) 1087 Atlantic 766,816 0.1805170604 1,174,213 0.1812995573Hammonton Town Bd of Ed 1040 Atlantic 836,779 0.1969871328 1,252,187 0.1933388140Linwood Bd of Ed 1050 Atlantic 289,847 0.0682332247 431,843 0.0666769528Mainland Regional H S 1096 Atlantic 486,200 0.1144569163 731,571 0.1129552291Margate City Bd of Ed 1060 Atlantic 198,537 0.0467378297 317,355 0.0489999012Mullica Twp Bd of Ed 1088 Atlantic 213,196 0.0501887222 309,255 0.0477492538Northfield Bd of Ed 1089 Atlantic 270,901 0.0637731244 408,590 0.0630866684Oceanside Charter School 1022 Atlantic 98,841 0.0232682766 148,722 0.0229628123Pleasantville Bd of Ed 1010 Atlantic 1,346,278 0.3169288943 1,967,458 0.3037773082Port Republic City Bd of Ed 1091 Atlantic 43,909 0.0103366696 62,442 0.0096411017Somers Point City Bd of Ed 1092 Atlantic 314,024 0.0739247608 484,759 0.0748472314Ventnor City Bd of Ed 1070 Atlantic 273,895 0.0644779455 447,061 0.0690266258Weymouth Township Bd of Ed 1093 Atlantic 61,516 0.0144815542 98,415 0.0151953657South Bergen Jointure Comm 2097 Bergen 358,282 0.0843435888 583,970 0.0901655002Allendale Boro Bd of Ed 2021 Bergen 256,331 0.0603431835 377,953 0.0583562876Alpine Bd of Ed 2022 Bergen 75,423 0.0177554175 123,850 0.0191225529Bergen Arts & Science Chrtr Sch 2098 Bergen 100,475 0.0236529384 111,779 0.0172587795Bergen Co Bd of Special Servs 2001 Bergen 1,277,905 0.3008331256 2,046,678 0.3160089484Bergen Co Vocational School 980 Bergen 1,048,496 0.2468276819 1,567,180 0.2419740202Bergen Community College 2030 Bergen 11,796 0.0027769103 17,823 0.0027518874Bergenfield Bd of Ed 2023 Bergen 1,061,484 0.2498852023 1,609,814 0.2485567487Bogota Boro Bd of Ed 2024 Bergen 324,972 0.0765020424 503,099 0.0776789441Carlstadt Borough Bd of Ed 2025 Bergen 195,288 0.0459729788 276,422 0.0426798087Carlstadt E.Rutherford Bd of Ed 2040 Bergen 190,668 0.0448853791 287,631 0.0444104885Cliffside Park Bd of Ed 2026 Bergen 767,438 0.1806634861 1,185,366 0.1830215907Closter Board of Education 2027 Bergen 396,887 0.0934316375 600,626 0.0927372018Cresskill Bd of Ed 2028 Bergen 524,811 0.1235463774 837,944 0.1293793172Demarest Boro Bd of Ed 2029 Bergen 209,942 0.0494226942 343,614 0.0530543147Dumont Borough Bd of Ed 2031 Bergen 831,284 0.1956935484 1,308,637 0.2020547454East Rutherford Boro Bd of Ed 2033 Bergen 284,421 0.0669558836 436,130 0.0673388695Edgewater Boro Bd of Ed 2034 Bergen 148,114 0.0348676917 213,053 0.0328955774Elmwood Park Borough Bd of Ed 2032 Bergen 507,813 0.1195448582 813,624 0.1256242871Emerson Borough Bd of Ed 2035 Bergen 349,255 0.0822185321 528,959 0.0816717517Englewood City Bd of Ed 2036 Bergen 1,034,146 0.2434495315 1,547,375 0.2389161102Englewood Cliffs Bd of Ed 2037 Bergen 153,217 0.0360689950 210,122 0.0324430283Englewood On The Palisades Char 6011 Bergen 55,950 0.0131712556 32,998 0.0050949213Fair Lawn Bd of Ed 2038 Bergen 1,571,410 0.3699274843 2,288,793 0.3533917251Fairview Boro Bd of Ed 2039 Bergen 261,546 0.0615708528 412,518 0.0636931551Fort Lee Bd of Ed 2041 Bergen 1,077,262 0.2535995199 1,696,213 0.2618968330Franklin Lakes Bd of Ed 2042 Bergen 524,541 0.1234828164 817,847 0.1262763221Garfield City Bd of Ed 2000 Bergen 1,508,218 0.3550513810 2,182,197 0.3369332055Glen Rock Borough Bd of Ed 2043 Bergen 777,453 0.1830211291 1,214,771 0.1875617495Hackensack City Bd of Ed 2010 Bergen 1,885,728 0.4439214560 2,839,253 0.4383832507Harrington Park Bd of Ed 2044 Bergen 197,243 0.0464332076 308,800 0.0476790014Hasbrouck Heights Bd of Ed 2045 Bergen 491,882 0.1157945227 732,111 0.1130386056Haworth Borough Bd of Ed 2046 Bergen 158,978 0.0374251988 251,988 0.0389071768Hillsdale Borough Bd of Ed 2047 Bergen 392,230 0.0923353276 605,910 0.0935530562Ho-Ho-Kus Bd of Ed 2048 Bergen 198,167 0.0466507276 304,393 0.0469985566Leonia Borough Bd of Ed 2051 Bergen 587,645 0.1383382036 920,938 0.1421936665
2014 2013
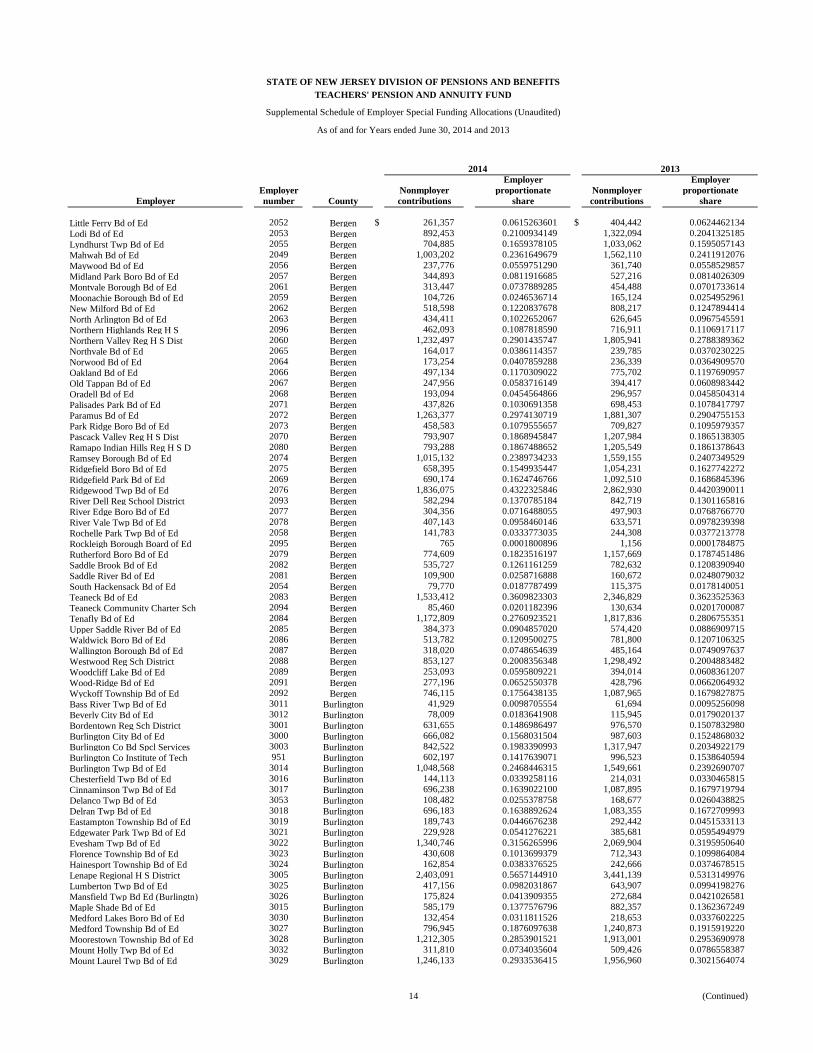
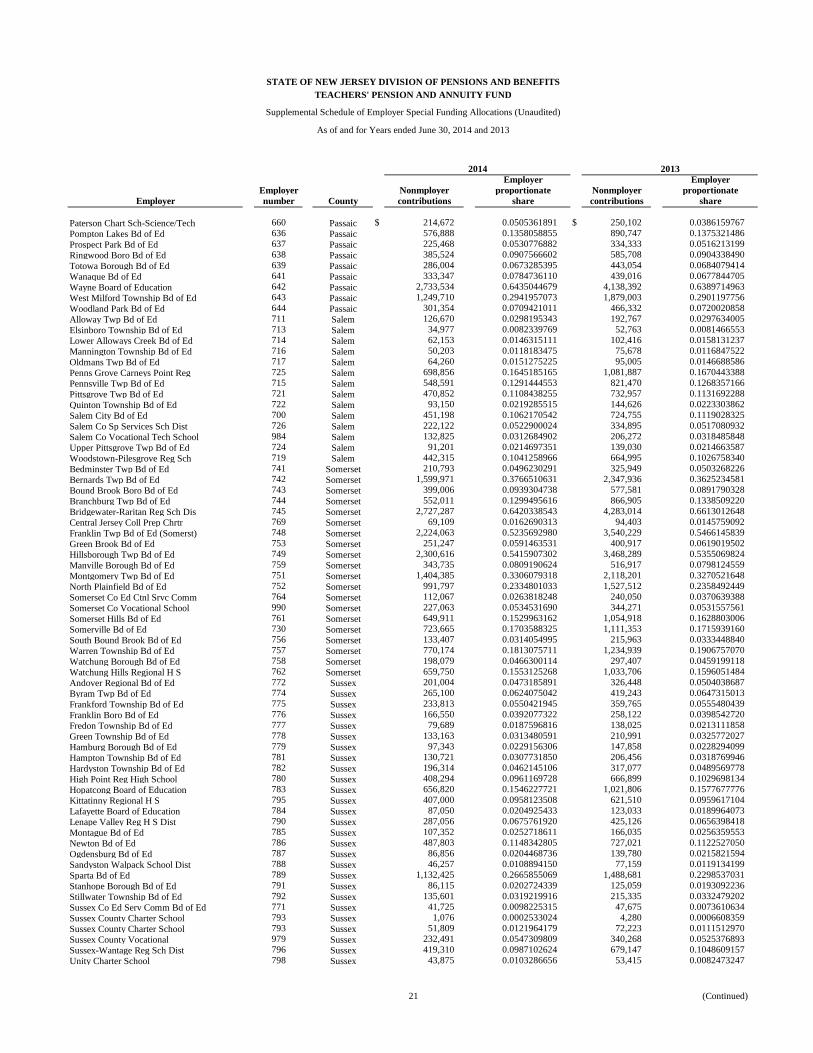
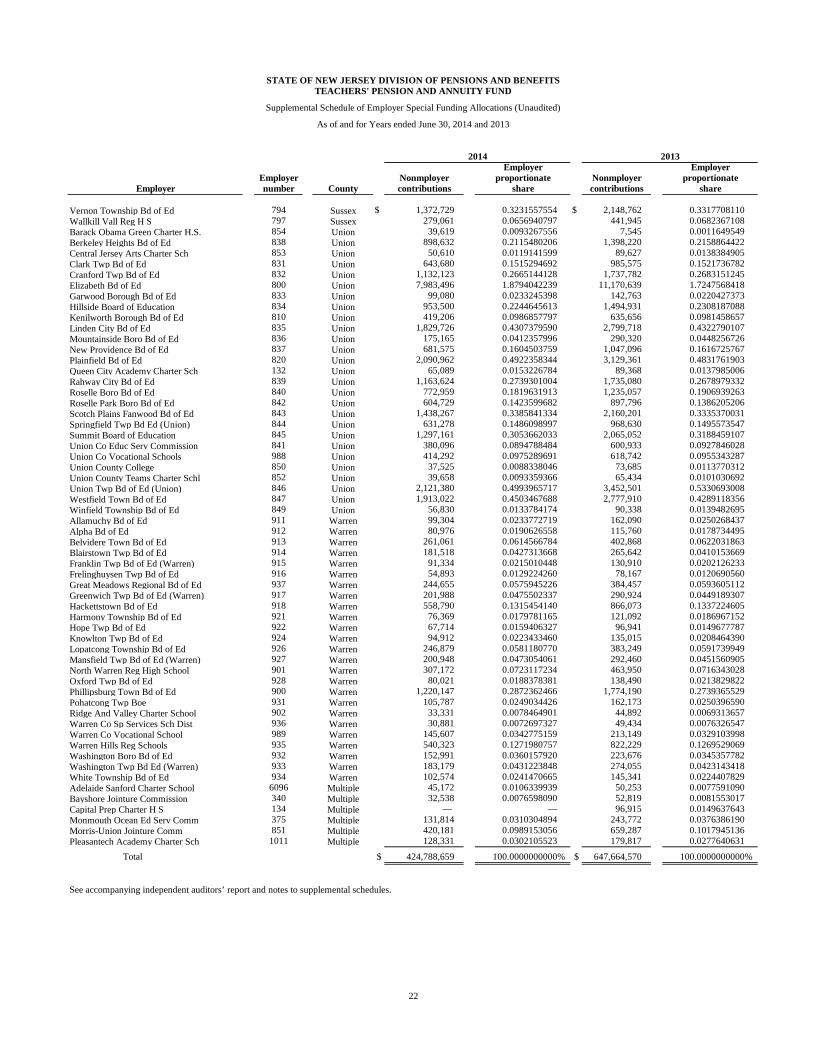
STATE OF NEW JERSEY DIVISION OF PENSIONS AND BENEFITSTEACHERS' PENSION AND ANNUITY FUND
Supplemental Schedule of Employer Special Funding Allocations (Unaudited)
As of and for Years ended June 30, 2014 and 2013
(Continued) 14
Employer EmployerEmployer Nonmployer proportionate Nonmployer proportionate
Employer number County contributions share contributions share
2014 2013
STATE OF NEW JERSEY DIVISION OF PENSIONS AND BENEFITSTEACHERS' PENSION AND ANNUITY FUND
Supplemental Schedule of Employer Special Funding Allocations (Unaudited)
As of and for Years ended June 30, 2014 and 2013
Little Ferry Bd of Ed 2052 Bergen $ 261,357 0.0615263601 $ 404,442 0.0624462134Lodi Bd of Ed 2053 Bergen 892,453 0.2100934149 1,322,094 0.2041325185Lyndhurst Twp Bd of Ed 2055 Bergen 704,885 0.1659378105 1,033,062 0.1595057143Mahwah Bd of Ed 2049 Bergen 1,003,202 0.2361649679 1,562,110 0.2411912076Maywood Bd of Ed 2056 Bergen 237,776 0.0559751290 361,740 0.0558529857Midland Park Boro Bd of Ed 2057 Bergen 344,893 0.0811916685 527,216 0.0814026309Montvale Borough Bd of Ed 2061 Bergen 313,447 0.0737889285 454,488 0.0701733614Moonachie Borough Bd of Ed 2059 Bergen 104,726 0.0246536714 165,124 0.0254952961New Milford Bd of Ed 2062 Bergen 518,598 0.1220837678 808,217 0.1247894414North Arlington Bd of Ed 2063 Bergen 434,411 0.1022652067 626,645 0.0967545591Northern Highlands Reg H S 2096 Bergen 462,093 0.1087818590 716,911 0.1106917117Northern Valley Reg H S Dist 2060 Bergen 1,232,497 0.2901435747 1,805,941 0.2788389362Northvale Bd of Ed 2065 Bergen 164,017 0.0386114357 239,785 0.0370230225Norwood Bd of Ed 2064 Bergen 173,254 0.0407859288 236,339 0.0364909570Oakland Bd of Ed 2066 Bergen 497,134 0.1170309022 775,702 0.1197690957Old Tappan Bd of Ed 2067 Bergen 247,956 0.0583716149 394,417 0.0608983442Oradell Bd of Ed 2068 Bergen 193,094 0.0454564866 296,957 0.0458504314Palisades Park Bd of Ed 2071 Bergen 437,826 0.1030691358 698,453 0.1078417797Paramus Bd of Ed 2072 Bergen 1,263,377 0.2974130719 1,881,307 0.2904755153Park Ridge Boro Bd of Ed 2073 Bergen 458,583 0.1079555657 709,827 0.1095979357Pascack Valley Reg H S Dist 2070 Bergen 793,907 0.1868945847 1,207,984 0.1865138305Ramapo Indian Hills Reg H S D 2080 Bergen 793,288 0.1867488652 1,205,549 0.1861378643Ramsey Borough Bd of Ed 2074 Bergen 1,015,132 0.2389734233 1,559,155 0.2407349529Ridgefield Boro Bd of Ed 2075 Bergen 658,395 0.1549935447 1,054,231 0.1627742272Ridgefield Park Bd of Ed 2069 Bergen 690,174 0.1624746766 1,092,510 0.1686845396Ridgewood Twp Bd of Ed 2076 Bergen 1,836,075 0.4322325846 2,862,930 0.4420390011River Dell Reg School District 2093 Bergen 582,294 0.1370785184 842,719 0.1301165816River Edge Boro Bd of Ed 2077 Bergen 304,356 0.0716488055 497,903 0.0768766770River Vale Twp Bd of Ed 2078 Bergen 407,143 0.0958460146 633,571 0.0978239398Rochelle Park Twp Bd of Ed 2058 Bergen 141,783 0.0333773035 244,308 0.0377213778Rockleigh Borough Board of Ed 2095 Bergen 765 0.0001800896 1,156 0.0001784875Rutherford Boro Bd of Ed 2079 Bergen 774,609 0.1823516197 1,157,669 0.1787451486Saddle Brook Bd of Ed 2082 Bergen 535,727 0.1261161259 782,632 0.1208390940Saddle River Bd of Ed 2081 Bergen 109,900 0.0258716888 160,672 0.0248079032South Hackensack Bd of Ed 2054 Bergen 79,770 0.0187787499 115,375 0.0178140051Teaneck Bd of Ed 2083 Bergen 1,533,412 0.3609823303 2,346,829 0.3623525363Teaneck Community Charter Sch 2094 Bergen 85,460 0.0201182396 130,634 0.0201700087Tenafly Bd of Ed 2084 Bergen 1,172,809 0.2760923521 1,817,836 0.2806755351Upper Saddle River Bd of Ed 2085 Bergen 384,373 0.0904857020 574,420 0.0886909715Waldwick Boro Bd of Ed 2086 Bergen 513,782 0.1209500275 781,800 0.1207106325Wallington Borough Bd of Ed 2087 Bergen 318,020 0.0748654639 485,164 0.0749097637Westwood Reg Sch District 2088 Bergen 853,127 0.2008356348 1,298,492 0.2004883482Woodcliff Lake Bd of Ed 2089 Bergen 253,093 0.0595809221 394,014 0.0608361207Wood-Ridge Bd of Ed 2091 Bergen 277,196 0.0652550378 428,796 0.0662064932Wyckoff Township Bd of Ed 2092 Bergen 746,115 0.1756438135 1,087,965 0.1679827875Bass River Twp Bd of Ed 3011 Burlington 41,929 0.0098705554 61,694 0.0095256098Beverly City Bd of Ed 3012 Burlington 78,009 0.0183641908 115,945 0.0179020137Bordentown Reg Sch District 3001 Burlington 631,655 0.1486986497 976,570 0.1507832980Burlington City Bd of Ed 3000 Burlington 666,082 0.1568031504 987,603 0.1524868032Burlington Co Bd Spcl Services 3003 Burlington 842,522 0.1983390993 1,317,947 0.2034922179Burlington Co Institute of Tech 951 Burlington 602,197 0.1417639071 996,523 0.1538640594Burlington Twp Bd of Ed 3014 Burlington 1,048,568 0.2468446315 1,549,661 0.2392690707Chesterfield Twp Bd of Ed 3016 Burlington 144,113 0.0339258116 214,031 0.0330465815Cinnaminson Twp Bd of Ed 3017 Burlington 696,238 0.1639022100 1,087,895 0.1679719794Delanco Twp Bd of Ed 3053 Burlington 108,482 0.0255378758 168,677 0.0260438825Delran Twp Bd of Ed 3018 Burlington 696,183 0.1638892624 1,083,355 0.1672709993Eastampton Township Bd of Ed 3019 Burlington 189,743 0.0446676238 292,442 0.0451533113Edgewater Park Twp Bd of Ed 3021 Burlington 229,928 0.0541276221 385,681 0.0595494979Evesham Twp Bd of Ed 3022 Burlington 1,340,746 0.3156265996 2,069,904 0.3195950640Florence Township Bd of Ed 3023 Burlington 430,608 0.1013699379 712,343 0.1099864084Hainesport Township Bd of Ed 3024 Burlington 162,854 0.0383376525 242,666 0.0374678515Lenape Regional H S District 3005 Burlington 2,403,091 0.5657144910 3,441,139 0.5313149976Lumberton Twp Bd of Ed 3025 Burlington 417,156 0.0982031867 643,907 0.0994198276Mansfield Twp Bd Ed (Burlingtn) 3026 Burlington 175,824 0.0413909355 272,684 0.0421026581Maple Shade Bd of Ed 3015 Burlington 585,179 0.1377576796 882,357 0.1362367249Medford Lakes Boro Bd of Ed 3030 Burlington 132,454 0.0311811526 218,653 0.0337602225Medford Township Bd of Ed 3027 Burlington 796,945 0.1876097638 1,240,873 0.1915919220Moorestown Township Bd of Ed 3028 Burlington 1,212,305 0.2853901521 1,913,001 0.2953690978Mount Holly Twp Bd of Ed 3032 Burlington 311,810 0.0734035604 509,426 0.0786558387Mount Laurel Twp Bd of Ed 3029 Burlington 1,246,133 0.2933536415 1,956,960 0.3021564074

(Continued) 15
Employer EmployerEmployer Nonmployer proportionate Nonmployer proportionate
Employer number County contributions share contributions share
2014 2013
STATE OF NEW JERSEY DIVISION OF PENSIONS AND BENEFITSTEACHERS' PENSION AND ANNUITY FUND
Supplemental Schedule of Employer Special Funding Allocations (Unaudited)
As of and for Years ended June 30, 2014 and 2013
New Hanover Twp Bd of Ed 3031 Burlington $ 56,225 0.0132359937 $ 81,138 0.0125277811North Hanover Township Bd of Ed 3033 Burlington 407,581 0.0959491247 615,568 0.0950442602Northern Burlington Co Reg 3049 Burlington 531,012 0.1250061622 781,375 0.1206450121Palmyra Borough Bd of Ed 3034 Burlington 246,986 0.0581432660 403,368 0.0622803868Pemberton Township Bd of Ed 3036 Burlington 1,888,607 0.4445992048 2,879,470 0.4445927922Rancocas Valley Regional H S 3048 Burlington 457,615 0.1077276877 740,550 0.1143415949Renaissance Reg Leadership Chtr 3057 Burlington 13,977 0.0032903421 21,661 0.0033444781Riverbank Chtr Schl of Excell. 3056 Burlington 25,289 0.0059533134 29,415 0.0045417028Riverside Township Bd of Ed 3037 Burlington 423,221 0.0996309555 628,515 0.0970432888Riverton Boro School Board 3038 Burlington 81,930 0.0192872381 121,999 0.0188367568Shamong Twp Bd of Ed 3039 Burlington 243,443 0.0573092042 376,489 0.0581302447Southampton Twp Bd of Ed 3041 Burlington 251,487 0.0592028517 380,263 0.0587129537Springfield Twp Bd of Ed (Burl) 3042 Burlington 91,026 0.0214285382 114,918 0.0177434439Tabernacle Twp Bd of Ed 3043 Burlington 238,323 0.0561038990 369,546 0.0570582392Washington Twp Bd of Ed (Burl) 3044 Burlington 14,486 0.0034101664 37,940 0.0058579706Westampton Township Bd of Ed 3055 Burlington 252,396 0.0594168405 354,501 0.0547352775Willingboro Twp Bd of Ed 3046 Burlington 1,147,022 0.2700218039 1,793,912 0.2769816476Woodland Twp Bd of Ed 3047 Burlington 38,878 0.0091523159 54,115 0.0083554053Audubon Borough Bd of Ed 4011 Camden 441,324 0.1038926042 699,704 0.1080349353Barrington Boro Bd of Ed 4012 Camden 167,485 0.0394278417 268,725 0.0414913849Bellmawr Borough Bd of Ed 4013 Camden 263,962 0.0621396062 416,740 0.0643450358Berlin Borough Bd of Ed 4014 Camden 218,100 0.0513431786 304,994 0.0470913516Berlin Township Bd of Ed 4015 Camden 218,429 0.0514206289 319,145 0.0492762788Black Horse Pike Reg Sch Dist 4025 Camden 997,578 0.2348410154 1,491,154 0.2302355365Brooklawn Boro Bd of Ed 4016 Camden 81,847 0.0192676990 119,891 0.0185112797Camden Academy Charter High Sch 4003 Camden 112,172 0.0264065430 158,178 0.0244228274Camden City Bd of Ed 4000 Camden 4,935,906 1.1619674620 7,208,152 1.1129452378Camden Co Ed Services Comm 4019 Camden 175,576 0.0413325536 273,669 0.0422547430Camden County Technical Schools 977 Camden 693,645 0.1632917888 1,110,584 0.1714751817Camden's Pride Charter School 4077 Camden 54,036 0.0127206786 59,567 0.0091971991Camdens Promise Charter School 4002 Camden 1,085 0.0002554211 1,671 0.0002580039Camdens Promise Charter School 4002 Camden 112,431 0.0264675145 155,492 0.0240081065Cherry Hill Twp Bd of Ed 4031 Camden 3,200,336 0.7533948782 4,808,213 0.7423924691Chesilhurst Boro Bd of Ed 4017 Camden 5,092 0.0011987137 8,736 0.0013488464Clementon Bd of Ed 4018 Camden 144,512 0.0340197406 223,653 0.0345322270Collingswood Borough Bd of Ed 4020 Camden 603,478 0.1420654688 909,456 0.1404208352D.U.E. Season Charter School 4021 Camden 129,195 0.0304139476 221,771 0.0342416445Eastern Camden Co Reg Sch Dist 4010 Camden 578,153 0.1361036807 855,667 0.1321157646Eco Charter School 4076 Camden 217 0.0000510842 1,247 0.0001925379Eco Charter School 4076 Camden 35,396 0.0083326142 53,359 0.0082386782Freedom Academy Charter School 4075 Camden 54,450 0.0128181388 91,151 0.0140737975Gibbsboro Borough Bd of Ed 4032 Camden 79,339 0.0186772877 113,562 0.0175340763Gloucester City Bd of Ed 4033 Camden 737,253 0.1735575996 1,079,751 0.1667145384Gloucester Twp Bd of Ed 4034 Camden 1,982,010 0.4665873154 2,962,790 0.4574574761Haddon Heights Bd of Ed 4037 Camden 413,289 0.0972928517 650,184 0.1003890021Haddon Township Bd of Ed 4035 Camden 537,934 0.1266356784 828,590 0.1279350511Haddonfield Bd of Ed 4036 Camden 653,465 0.1538329676 1,028,281 0.1587675235Institute For Excellence Ch Sch 4078 Camden 61,778 0.0145432320 1,671 0.0002580039Institute For Excellence Ch Sch 4078 Camden 64,053 0.0150787924 60,965 0.0094130516Laurel Springs Borough Bd of Ed 4038 Camden 48,950 0.0115233773 68,508 0.0105776976Lawnside Borough Bd of Ed 4039 Camden 82,447 0.0194089457 123,524 0.0190722182Leap Academy Charter School 4001 Camden 194,933 0.0458894078 262,855 0.0405850515Lindenwold Borough Bd of Ed 4068 Camden 689,349 0.1622804624 1,089,713 0.1682526803Magnolia Borough Bd of Ed 4041 Camden 129,534 0.0304937520 194,818 0.0300800767Merchantville Boro Bd of Ed 4042 Camden 100,887 0.0237499278 162,157 0.0250371886Mount Ephraim Bd of Ed 4043 Camden 107,026 0.0251951171 177,758 0.0274459972Oaklyn Borough Bd of Ed 4044 Camden 119,173 0.0280546567 178,898 0.0276220142Pennsauken Twp Bd of Ed 4050 Camden 1,518,763 0.3575337919 2,413,495 0.3726458275Pine Hill Borough Bd of Ed 4069 Camden 641,087 0.1509190480 1,013,632 0.1565057046Runnemede Borough Bd of Ed 4061 Camden 228,212 0.0537236565 331,276 0.0511493163Somerdale Boro Bd of Ed 4067 Camden 132,803 0.0312633111 195,975 0.0302587186Sterling High School District 4070 Camden 272,321 0.0641074083 428,524 0.0661644961Stratford Bd of Ed 4062 Camden 224,493 0.0528481623 325,743 0.0502950161Voorhees Twp Bd of Ed 4063 Camden 998,644 0.2350919637 1,594,032 0.2461199935Waterford Twp Bd of Ed 4064 Camden 261,194 0.0614879881 405,608 0.0626262448Winslow Township Bd of Ed 4065 Camden 1,538,895 0.3622730898 2,527,304 0.3902180408Woodlynne Bd of Ed 4066 Camden 102,541 0.0241392979 165,995 0.0256297793Avalon Borough Bd of Ed 5011 Cape May 62,006 0.0145969057 94,472 0.0145865629Cape May City Bd of Ed 5000 Cape May 64,788 0.0152518196 99,747 0.0154010277Cape May Co Special Services 5001 Cape May 249,171 0.0586576394 405,497 0.0626091063

(Continued) 16
Employer EmployerEmployer Nonmployer proportionate Nonmployer proportionate
Employer number County contributions share contributions share
2014 2013
STATE OF NEW JERSEY DIVISION OF PENSIONS AND BENEFITSTEACHERS' PENSION AND ANNUITY FUND
Supplemental Schedule of Employer Special Funding Allocations (Unaudited)
As of and for Years ended June 30, 2014 and 2013
Cape May Co Technical Sch Dist 971 Cape May $ 254,127 0.0598243373 $ 389,708 0.0601712704Charter Tech 5020 Cape May 2,502 0.0005889988 3,760 0.0005805474Charter Tech 5020 Cape May 69,151 0.0162789186 108,025 0.0166791584Dennis Twp Bd of Ed 5013 Cape May 237,174 0.0558334115 355,835 0.0549412483Lower Cape May Reg School Dist 5027 Cape May 502,491 0.1182919999 772,565 0.1192847401Lower Township Bd of Ed 5014 Cape May 506,480 0.1192310551 772,220 0.1192314717Middle Township Bd of Ed 5015 Cape May 718,489 0.1691403442 1,105,984 0.1707649375North Wildwood Bd of Ed 5016 Cape May 132,785 0.0312590737 212,574 0.0328216193Ocean City Bd of Ed 5017 Cape May 806,313 0.1898150958 1,294,684 0.1999003895Sea Isle City Bd of Ed 5018 Cape May 26,385 0.0062113240 45,391 0.0070084118Stone Harbor Bd of Ed 5019 Cape May 42,775 0.0100697133 66,122 0.0102092971Upper Township Bd of Ed 5021 Cape May 406,148 0.0956117804 630,370 0.0973297025West Cape May Boro Bd of Ed 5022 Cape May 18,832 0.0044332634 30,078 0.0046440706Wildwood City Bd of Ed 5023 Cape May 349,664 0.0823148153 524,634 0.0810039677Wildwood Crest Bd of Ed 5025 Cape May 105,071 0.0247348882 179,489 0.0277132652Woodbine Borough Bd of Ed 5024 Cape May 65,059 0.0153156160 110,522 0.0170646975Bridgeton Bd of Ed 5050 Cumberland 1,544,898 0.3636862631 2,170,595 0.3351418461Commercial Twp Bd of Ed 5081 Cumberland 165,447 0.0389480737 269,173 0.0415605565Cumberland Co Bd of Voc Ed 954 Cumberland 112,811 0.0265569708 188,405 0.0290899037Cumberland County College 5080 Cumberland 8,170 0.0019233094 19,228 0.0029688207Cumberland Regional School Dist 5089 Cumberland 342,187 0.0805546459 521,491 0.0805186857Deerfield Township Bd of Ed 5082 Cumberland 93,586 0.0220311908 126,027 0.0194586837Downe Twp Bd of Ed 5083 Cumberland 52,007 0.0122430293 83,939 0.0129602581Fairfield Twp Bd Ed (Cumberlnd) 5084 Cumberland 154,455 0.0363604340 235,068 0.0362947134Greenwich Twp Bd Ed (Cumbrland) 5085 Cumberland 20,849 0.0049080877 33,498 0.0051721217Hopewell Twp Bd Ed (Cumberland) 5086 Cumberland 152,240 0.0358389982 219,617 0.0339090649Lawrence Twp Bd Ed (Cumberland) 5087 Cumberland 133,300 0.0313803105 214,239 0.0330786968Maurice River Township Bd of Ed 5088 Cumberland 98,929 0.0232889928 149,457 0.0230762970Millville Bd of Ed 5070 Cumberland 1,777,125 0.4183550955 2,709,855 0.4184040816Stow Creek Township Bd of Ed 5091 Cumberland 30,770 0.0072436020 41,631 0.0064278643Upper Deerfield Twp Bd of Ed 5092 Cumberland 261,049 0.0614538535 413,203 0.0637989198Vineland City Bd of Ed 5060 Cumberland 3,126,833 0.7360914501 4,648,057 0.7176642367Vineland Public Charter School 5093 Cumberland 28,718 0.0067605383 32,686 0.0050467482Belleville Bd of Ed 6010 Essex 1,230,282 0.2896221389 1,929,917 0.2979809436Bloomfield Twp Bd of Ed 6020 Essex 1,655,118 0.3896332835 2,440,422 0.3768033808Burch Chtr Schl of Excellence 6097 Essex 40,491 0.0095320341 47,031 0.0072616293Caldwell West Caldwell Bd of Ed 6081 Essex 767,904 0.1807731877 1,182,285 0.1825458815Cedar Grove Twp Bd of Ed 6083 Essex 439,379 0.1034347294 666,923 0.1029735190Discovery Charter School 6009 Essex 12,834 0.0030212671 25,973 0.0040102549East Orange Community Chart Sch 204 Essex 1,577 0.0003712434 2,430 0.0003751942East Orange Community Chart Sch 204 Essex 96,564 0.0227322453 143,134 0.0221000200East Orange School District 6030 Essex 3,769,348 0.8873466653 5,858,339 0.9045328805Essex Co Educational Serv Comm 6012 Essex 336,225 0.0791511244 541,942 0.0836763387Essex Co Vocational School 950 Essex 747,528 0.1759764495 1,143,350 0.1765342820Essex Fells Bd of Ed 6084 Essex 84,690 0.0199369729 140,065 0.0216261636Fairfield Twp Bd of Ed (Essex) 6082 Essex 197,998 0.0466109431 309,314 0.0477583635Glen Ridge Bd of Ed 6085 Essex 570,541 0.1343117308 832,879 0.1285972766Gray Charter School 6015 Essex 60,315 0.0141988254 72,714 0.0112271079Great Oaks Charter School 6101 Essex 12,579 0.0029612372 — —Irvington Bd of Ed 6040 Essex 2,218,287 0.5222095630 3,421,793 0.5283279576Lady Liberty Academy Charter Sc 6018 Essex 127,968 0.0301250980 202,789 0.0313108064Livingston Bd of Ed 6086 Essex 1,833,935 0.4317288047 2,909,799 0.4492756174Maria L. Varisco-Rogers Charter 6007 Essex 92,699 0.0218223811 107,243 0.0165584169Marion P. Thomas Charter Sch 6013 Essex 127,982 0.0301283938 159,469 0.0246221589Millburn Twp Public Schools 6087 Essex 1,667,893 0.3926406613 2,706,670 0.4179123147Montclair Bd of Ed 6050 Essex 2,213,679 0.5211247883 3,442,703 0.5315564806New Horizon Comm Charter School 6014 Essex 83,702 0.0197043867 179,384 0.0276970531Newark Charter School 6016 Essex 42,600 0.0100285163 69,549 0.0107384290Newark Educators' Comm Chtr Sch 6099 Essex 55,931 0.0131667828 91,745 0.0141655116Newark Legacy Charter School 6100 Essex 40,272 0.0094804791 — —Newark Public Schools 6000 Essex 13,724,897 3.2309942153 21,821,276 3.3692249008North Caldwell Bd of Ed 6088 Essex 195,952 0.0461292918 294,617 0.0454891333North Star Academy Charter Sch 6006 Essex 395,861 0.0931901056 418,574 0.0646282071Nutley Bd of Ed 6089 Essex 1,165,767 0.2744345865 1,783,264 0.2753375867Orange City Bd of Ed 6060 Essex 1,609,382 0.3788665177 2,313,476 0.3572028027Peoples Preparatory Charter Sch 6102 Essex 29,014 0.0068302200 — —Pride Academy Charter School 6098 Essex 85,634 0.0201592011 100,837 0.0155693247Robert Treat Academy Charter Sc 6005 Essex 113,456 0.0267088110 151,362 0.0233704307Roseland Bd of Ed 6091 Essex 155,909 0.0367027219 227,378 0.0351073704Roseville Community Charter Sch 6103 Essex 29,569 0.0069608732 — —

(Continued) 17
Employer EmployerEmployer Nonmployer proportionate Nonmployer proportionate
Employer number County contributions share contributions share
2014 2013
STATE OF NEW JERSEY DIVISION OF PENSIONS AND BENEFITSTEACHERS' PENSION AND ANNUITY FUND
Supplemental Schedule of Employer Special Funding Allocations (Unaudited)
As of and for Years ended June 30, 2014 and 2013
South Orange-Maplewood Bd of Ed 6070 Essex $ 2,070,285 0.4873682374 $ 3,061,080 0.4726335417Team Academy Charter School 6017 Essex 420,248 0.0989310781 602,954 0.0930966471University Heights Charter Schl 6095 Essex 74,026 0.0174265481 105,164 0.0162374174Verona Bd of Ed 6092 Essex 667,739 0.1571932268 996,178 0.1538107910Visions Academy Charter H.S. 6104 Essex 43,469 0.0102330886 — —West Essex Regional Sch Dist 6094 Essex 543,129 0.1278586395 883,619 0.1364315789West Orange Township Bd of Ed 6093 Essex 2,506,660 0.5900957916 3,823,715 0.5903850807Clayton Borough Bd of Ed 7011 Gloucester 335,832 0.0790586078 504,645 0.0779176479Clearview Regional Bd of Ed 7036 Gloucester 579,261 0.1363645163 878,750 0.1356798008Delsea Reg High Sch District 7035 Gloucester 459,900 0.1082656023 741,088 0.1144246626Deptford Twp Bd of Ed 7012 Gloucester 1,196,383 0.2816419353 1,788,964 0.2762176719East Greenwich Bd of Education 7013 Gloucester 255,664 0.0601861642 371,353 0.0573372416Ed Information & Resource Ctr 4006 Gloucester 19,442 0.0045768642 30,496 0.0047086102Elk Twp Bd of Ed 7014 Gloucester 94,244 0.0221860914 146,666 0.0226453641Franklin Twp Bd of Ed (Glocstr) 7015 Gloucester 318,505 0.0749796383 486,981 0.0751903102Gateway Regional High School 7038 Gloucester 331,936 0.0781414459 506,960 0.0782750860Glassboro Bd of Ed 7016 Gloucester 617,510 0.1453687585 966,973 0.1493015124Gloucester Co Sp Serv Sch Dist 7010 Gloucester 568,764 0.1338934051 851,723 0.1315068074Gloucester Co Vo-Tech Sch Dist 957 Gloucester 314,987 0.0741514618 457,005 0.0705619885Greenwich Twp Bd Ed (Gloucster) 7017 Gloucester 153,461 0.0361264353 239,623 0.0369980096Harrison Twp Bd Ed (Gloucester) 7018 Gloucester 334,329 0.0787047848 531,402 0.0820489531Kingsway Regional School Dist 7037 Gloucester 476,868 0.1122600592 742,134 0.1145861659Logan Township Bd of Ed 7019 Gloucester 261,605 0.0615847421 385,507 0.0595226321Mantua Township Bd of Ed 7021 Gloucester 356,286 0.0838737081 541,596 0.0836229160Monroe Twp Bd of Ed (Gloucestr) 7022 Gloucester 1,401,686 0.3299725570 2,070,661 0.3197119455National Park Board of Educ 7023 Gloucester 73,486 0.0172994261 111,533 0.0172207968Paulsboro Boro Bd of Ed 7025 Gloucester 400,905 0.0943775196 621,183 0.0959112213Pitman Bd of Ed 7026 Gloucester 463,819 0.1091881787 737,686 0.1138993907South Harrison Twp Bd of Ed 7027 Gloucester 77,883 0.0183345290 110,630 0.0170813728Swedesboro Woolwich Bd of Ed 7028 Gloucester 368,175 0.0866725117 540,933 0.0835205482Washington Twp Bd of Ed (Glouc) 7029 Gloucester 2,371,811 0.5583508292 3,733,967 0.5765279077Wenonah Borough Bd of Ed 7031 Gloucester 59,767 0.0140698201 90,840 0.0140257788West Deptford Twp Bd of Ed 7032 Gloucester 758,467 0.1785516124 1,149,572 0.1774949644Westville Board of Ed 7033 Gloucester 111,907 0.0263441591 171,977 0.0265534055Woodbury City Bd of Ed 7000 Gloucester 452,449 0.1065115535 697,081 0.1076299417Woodbury Heights Board of Ed 7034 Gloucester 63,581 0.0149676783 97,634 0.0150747786Bayonne Board of Ed 8010 Hudson 2,475,651 0.5827959263 3,826,471 0.5908106096Dr Lena Edwards Acad Chrtr Schl 8096 Hudson 2,351 0.0005534517 — —East Newark Borough Bd of Ed 8081 Hudson 43,409 0.0102189640 65,090 0.0100499553Elysian Charter Sch of Hoboken 8085 Hudson 77,875 0.0183326457 128,004 0.0197639343Ethical Comm Chrtr Schl - J.C. 8093 Hudson 19,151 0.0045083595 23,581 0.0036409279Guttenberg Boro Bd of Ed 8082 Hudson 196,666 0.0462973754 296,843 0.0458328297Harrison Town Bd of Ed (Hudson) 8083 Hudson 684,291 0.1610897526 1,010,605 0.1560383330Hoboken Board of Education 8020 Hudson 781,430 0.1839573594 1,255,817 0.1938992893Hoboken Charter School 8021 Hudson 72,011 0.0169521946 112,542 0.0173765874Hoboken Dual Language Ch School 8094 Hudson 14,920 0.0035123348 16,148 0.0024932659Hudson Co Schools of Technology 956 Hudson 819,092 0.1928234153 1,235,042 0.1906916103Jersey City Comm Charter School 8088 Hudson 96,876 0.0228056936 141,744 0.0218854028Jersey City Golden Door Charter 8089 Hudson 101,358 0.0238608065 160,369 0.0247611197Jersey City Public Schools 8000 Hudson 10,936,763 2.5746362969 16,538,287 2.5535265847Kearny Town Bd of Ed 8030 Hudson 1,610,921 0.3792288155 2,521,659 0.3893464477Learning Comm. Charter School 8086 Hudson 102,576 0.0241475373 133,371 0.0205926039Liberty Academy Charter School 8022 Hudson 57,004 0.0134193790 89,827 0.0138693707Mets Charter School 8095 Hudson 52,619 0.0123871009 — —North Bergen Bd of Ed 8040 Hudson 2,290,465 0.5392010713 3,411,188 0.5266905359Schomburg Charter School 8092 Hudson 51,658 0.0121608708 81,838 0.0126358618Secaucus Town Bd of Ed 8084 Hudson 609,883 0.1435732775 979,915 0.1512997690Soaring Heights Charter School 8087 Hudson 45,931 0.0108126710 66,786 0.0103118193Union City Bd of Ed 8050 Hudson 2,833,042 0.6669297638 4,627,704 0.7145217150University Academy Charter Hs 8091 Hudson 99,733 0.0234782633 148,728 0.0229637387Weehawken Twp Bd of Ed 8060 Hudson 383,948 0.0903856522 600,610 0.0927347314West New York Bd of Ed 8070 Hudson 2,384,373 0.5613080645 3,517,061 0.5430374236Alexandria Twp Bd of Ed 9011 Hunterdon 216,374 0.0509368589 338,242 0.0522248731Bethlehem Twp Bd of Ed 9012 Hunterdon 161,597 0.0380417407 262,000 0.0404530388Bloomsbury Borough Bd of Ed 9013 Hunterdon 40,415 0.0095141429 68,840 0.0106289587Califon Boro Bd of Ed 9014 Hunterdon 42,708 0.0100539407 67,663 0.0104472289Clinton Town Bd of Ed 9015 Hunterdon 150,875 0.0355176620 239,219 0.0369356316Clinton Twp Bd of Ed 9016 Hunterdon 509,258 0.1198850273 715,921 0.1105388548Delaware Twp Bd of Ed 9017 Hunterdon 165,845 0.0390417674 259,098 0.0400049673Delaware Valley Reg H S Dist 9040 Hunterdon 267,595 0.0629948550 403,228 0.0622587707
(Continued) 18
Employer EmployerEmployer Nonmployer proportionate Nonmployer proportionate
Employer number County contributions share contributions share
2014 2013
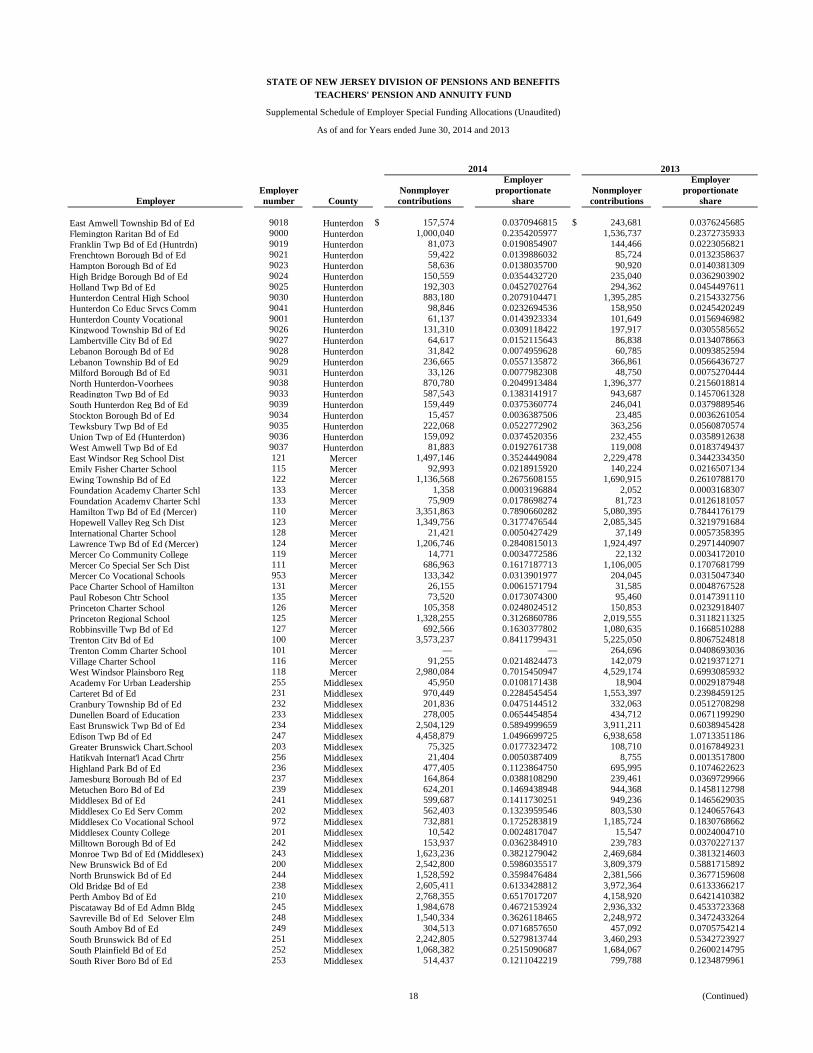
STATE OF NEW JERSEY DIVISION OF PENSIONS AND BENEFITSTEACHERS' PENSION AND ANNUITY FUND
Supplemental Schedule of Employer Special Funding Allocations (Unaudited)
As of and for Years ended June 30, 2014 and 2013
East Amwell Township Bd of Ed 9018 Hunterdon $ 157,574 0.0370946815 $ 243,681 0.0376245685Flemington Raritan Bd of Ed 9000 Hunterdon 1,000,040 0.2354205977 1,536,737 0.2372735933Franklin Twp Bd of Ed (Huntrdn) 9019 Hunterdon 81,073 0.0190854907 144,466 0.0223056821Frenchtown Borough Bd of Ed 9021 Hunterdon 59,422 0.0139886032 85,724 0.0132358637Hampton Borough Bd of Ed 9023 Hunterdon 58,636 0.0138035700 90,920 0.0140381309High Bridge Borough Bd of Ed 9024 Hunterdon 150,559 0.0354432720 235,040 0.0362903902Holland Twp Bd of Ed 9025 Hunterdon 192,303 0.0452702764 294,362 0.0454497611Hunterdon Central High School 9030 Hunterdon 883,180 0.2079104471 1,395,285 0.2154332756Hunterdon Co Educ Srvcs Comm 9041 Hunterdon 98,846 0.0232694536 158,950 0.0245420249Hunterdon County Vocational 9001 Hunterdon 61,137 0.0143923334 101,649 0.0156946982Kingwood Township Bd of Ed 9026 Hunterdon 131,310 0.0309118422 197,917 0.0305585652Lambertville City Bd of Ed 9027 Hunterdon 64,617 0.0152115643 86,838 0.0134078663Lebanon Borough Bd of Ed 9028 Hunterdon 31,842 0.0074959628 60,785 0.0093852594Lebanon Township Bd of Ed 9029 Hunterdon 236,665 0.0557135872 366,861 0.0566436727Milford Borough Bd of Ed 9031 Hunterdon 33,126 0.0077982308 48,750 0.0075270444North Hunterdon-Voorhees 9038 Hunterdon 870,780 0.2049913484 1,396,377 0.2156018814Readington Twp Bd of Ed 9033 Hunterdon 587,543 0.1383141917 943,687 0.1457061328South Hunterdon Reg Bd of Ed 9039 Hunterdon 159,449 0.0375360774 246,041 0.0379889546Stockton Borough Bd of Ed 9034 Hunterdon 15,457 0.0036387506 23,485 0.0036261054Tewksbury Twp Bd of Ed 9035 Hunterdon 222,068 0.0522772902 363,256 0.0560870574Union Twp of Ed (Hunterdon) 9036 Hunterdon 159,092 0.0374520356 232,455 0.0358912638West Amwell Twp Bd of Ed 9037 Hunterdon 81,883 0.0192761738 119,008 0.0183749437East Windsor Reg School Dist 121 Mercer 1,497,146 0.3524449084 2,229,478 0.3442334350Emily Fisher Charter School 115 Mercer 92,993 0.0218915920 140,224 0.0216507134Ewing Township Bd of Ed 122 Mercer 1,136,568 0.2675608155 1,690,915 0.2610788170Foundation Academy Charter Schl 133 Mercer 1,358 0.0003196884 2,052 0.0003168307Foundation Academy Charter Schl 133 Mercer 75,909 0.0178698274 81,723 0.0126181057Hamilton Twp Bd of Ed (Mercer) 110 Mercer 3,351,863 0.7890660282 5,080,395 0.7844176179Hopewell Valley Reg Sch Dist 123 Mercer 1,349,756 0.3177476544 2,085,345 0.3219791684International Charter School 128 Mercer 21,421 0.0050427429 37,149 0.0057358395Lawrence Twp Bd of Ed (Mercer) 124 Mercer 1,206,746 0.2840815013 1,924,497 0.2971440907Mercer Co Community College 119 Mercer 14,771 0.0034772586 22,132 0.0034172010Mercer Co Special Ser Sch Dist 111 Mercer 686,963 0.1617187713 1,106,005 0.1707681799Mercer Co Vocational Schools 953 Mercer 133,342 0.0313901977 204,045 0.0315047340Pace Charter School of Hamilton 131 Mercer 26,155 0.0061571794 31,585 0.0048767528Paul Robeson Chtr School 135 Mercer 73,520 0.0173074300 95,460 0.0147391110Princeton Charter School 126 Mercer 105,358 0.0248024512 150,853 0.0232918407Princeton Regional School 125 Mercer 1,328,255 0.3126860786 2,019,555 0.3118211325Robbinsville Twp Bd of Ed 127 Mercer 692,566 0.1630377802 1,080,635 0.1668510288Trenton City Bd of Ed 100 Mercer 3,573,237 0.8411799431 5,225,050 0.8067524818Trenton Comm Charter School 101 Mercer — — 264,696 0.0408693036Village Charter School 116 Mercer 91,255 0.0214824473 142,079 0.0219371271West Windsor Plainsboro Reg 118 Mercer 2,980,084 0.7015450947 4,529,174 0.6993085932Academy For Urban Leadership 255 Middlesex 45,950 0.0108171438 18,904 0.0029187948Carteret Bd of Ed 231 Middlesex 970,449 0.2284545454 1,553,397 0.2398459125Cranbury Township Bd of Ed 232 Middlesex 201,836 0.0475144512 332,063 0.0512708298Dunellen Board of Education 233 Middlesex 278,005 0.0654454854 434,712 0.0671199290East Brunswick Twp Bd of Ed 234 Middlesex 2,504,129 0.5894999659 3,911,211 0.6038945428Edison Twp Bd of Ed 247 Middlesex 4,458,879 1.0496699725 6,938,658 1.0713351186Greater Brunswick Chart.School 203 Middlesex 75,325 0.0177323472 108,710 0.0167849231Hatikvah Internat'l Acad Chrtr 256 Middlesex 21,404 0.0050387409 8,755 0.0013517800Highland Park Bd of Ed 236 Middlesex 477,405 0.1123864750 695,995 0.1074622623Jamesburg Borough Bd of Ed 237 Middlesex 164,864 0.0388108290 239,461 0.0369729966Metuchen Boro Bd of Ed 239 Middlesex 624,201 0.1469438948 944,368 0.1458112798Middlesex Bd of Ed 241 Middlesex 599,687 0.1411730251 949,236 0.1465629035Middlesex Co Ed Serv Comm 202 Middlesex 562,403 0.1323959546 803,530 0.1240657643Middlesex Co Vocational School 972 Middlesex 732,881 0.1725283819 1,185,724 0.1830768662Middlesex County College 201 Middlesex 10,542 0.0024817047 15,547 0.0024004710Milltown Borough Bd of Ed 242 Middlesex 153,937 0.0362384910 239,783 0.0370227137Monroe Twp Bd of Ed (Middlesex) 243 Middlesex 1,623,236 0.3821279042 2,469,684 0.3813214603New Brunswick Bd of Ed 200 Middlesex 2,542,800 0.5986035517 3,809,379 0.5881715892North Brunswick Bd of Ed 244 Middlesex 1,528,592 0.3598476484 2,381,566 0.3677159608Old Bridge Bd of Ed 238 Middlesex 2,605,411 0.6133428812 3,972,364 0.6133366217Perth Amboy Bd of Ed 210 Middlesex 2,768,355 0.6517017207 4,158,920 0.6421410382Piscataway Bd of Ed Admn Bldg 245 Middlesex 1,984,678 0.4672153924 2,936,332 0.4533723368Sayreville Bd of Ed Selover Elm 248 Middlesex 1,540,334 0.3626118465 2,248,972 0.3472433264South Amboy Bd of Ed 249 Middlesex 304,513 0.0716857650 457,092 0.0705754214South Brunswick Bd of Ed 251 Middlesex 2,242,805 0.5279813744 3,460,293 0.5342723927South Plainfield Bd of Ed 252 Middlesex 1,068,382 0.2515090687 1,684,067 0.2600214795South River Boro Bd of Ed 253 Middlesex 514,437 0.1211042219 799,788 0.1234879961
(Continued) 19
Employer EmployerEmployer Nonmployer proportionate Nonmployer proportionate
Employer number County contributions share contributions share
2014 2013
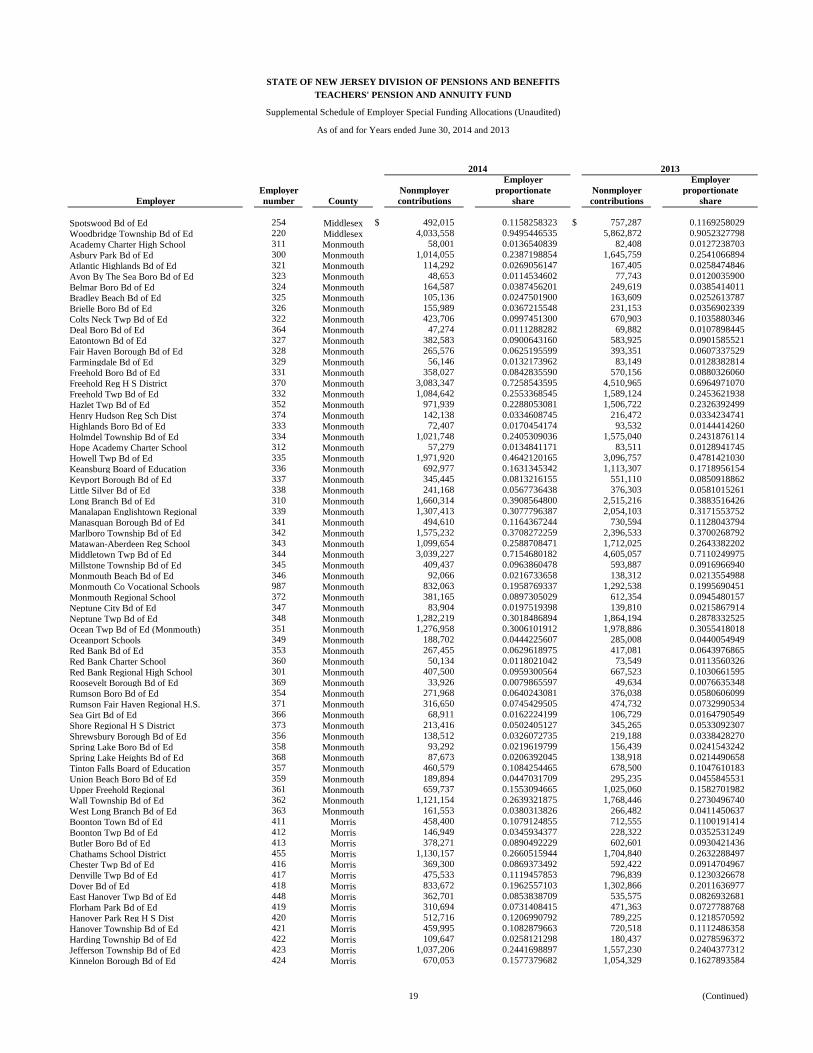
STATE OF NEW JERSEY DIVISION OF PENSIONS AND BENEFITSTEACHERS' PENSION AND ANNUITY FUND
Supplemental Schedule of Employer Special Funding Allocations (Unaudited)
As of and for Years ended June 30, 2014 and 2013
Spotswood Bd of Ed 254 Middlesex $ 492,015 0.1158258323 $ 757,287 0.1169258029Woodbridge Township Bd of Ed 220 Middlesex 4,033,558 0.9495446535 5,862,872 0.9052327798Academy Charter High School 311 Monmouth 58,001 0.0136540839 82,408 0.0127238703Asbury Park Bd of Ed 300 Monmouth 1,014,055 0.2387198854 1,645,759 0.2541066894Atlantic Highlands Bd of Ed 321 Monmouth 114,292 0.0269056147 167,405 0.0258474846Avon By The Sea Boro Bd of Ed 323 Monmouth 48,653 0.0114534602 77,743 0.0120035900Belmar Boro Bd of Ed 324 Monmouth 164,587 0.0387456201 249,619 0.0385414011Bradley Beach Bd of Ed 325 Monmouth 105,136 0.0247501900 163,609 0.0252613787Brielle Boro Bd of Ed 326 Monmouth 155,989 0.0367215548 231,153 0.0356902339Colts Neck Twp Bd of Ed 322 Monmouth 423,706 0.0997451300 670,903 0.1035880346Deal Boro Bd of Ed 364 Monmouth 47,274 0.0111288282 69,882 0.0107898445Eatontown Bd of Ed 327 Monmouth 382,583 0.0900643160 583,925 0.0901585521Fair Haven Borough Bd of Ed 328 Monmouth 265,576 0.0625195599 393,351 0.0607337529Farmingdale Bd of Ed 329 Monmouth 56,146 0.0132173962 83,149 0.0128382814Freehold Boro Bd of Ed 331 Monmouth 358,027 0.0842835590 570,156 0.0880326060Freehold Reg H S District 370 Monmouth 3,083,347 0.7258543595 4,510,965 0.6964971070Freehold Twp Bd of Ed 332 Monmouth 1,084,642 0.2553368545 1,589,124 0.2453621938Hazlet Twp Bd of Ed 352 Monmouth 971,939 0.2288053081 1,506,722 0.2326392499Henry Hudson Reg Sch Dist 374 Monmouth 142,138 0.0334608745 216,472 0.0334234741Highlands Boro Bd of Ed 333 Monmouth 72,407 0.0170454174 93,532 0.0144414260Holmdel Township Bd of Ed 334 Monmouth 1,021,748 0.2405309036 1,575,040 0.2431876114Hope Academy Charter School 312 Monmouth 57,279 0.0134841171 83,511 0.0128941745Howell Twp Bd of Ed 335 Monmouth 1,971,920 0.4642120165 3,096,757 0.4781421030Keansburg Board of Education 336 Monmouth 692,977 0.1631345342 1,113,307 0.1718956154Keyport Borough Bd of Ed 337 Monmouth 345,445 0.0813216155 551,110 0.0850918862Little Silver Bd of Ed 338 Monmouth 241,168 0.0567736438 376,303 0.0581015261Long Branch Bd of Ed 310 Monmouth 1,660,314 0.3908564800 2,515,216 0.3883516426Manalapan Englishtown Regional 339 Monmouth 1,307,413 0.3077796387 2,054,103 0.3171553752Manasquan Borough Bd of Ed 341 Monmouth 494,610 0.1164367244 730,594 0.1128043794Marlboro Township Bd of Ed 342 Monmouth 1,575,232 0.3708272259 2,396,533 0.3700268792Matawan-Aberdeen Reg School 343 Monmouth 1,099,654 0.2588708471 1,712,025 0.2643382202Middletown Twp Bd of Ed 344 Monmouth 3,039,227 0.7154680182 4,605,057 0.7110249975Millstone Township Bd of Ed 345 Monmouth 409,437 0.0963860478 593,887 0.0916966940Monmouth Beach Bd of Ed 346 Monmouth 92,066 0.0216733658 138,312 0.0213554988Monmouth Co Vocational Schools 987 Monmouth 832,063 0.1958769337 1,292,538 0.1995690451Monmouth Regional School 372 Monmouth 381,165 0.0897305029 612,354 0.0945480157Neptune City Bd of Ed 347 Monmouth 83,904 0.0197519398 139,810 0.0215867914Neptune Twp Bd of Ed 348 Monmouth 1,282,219 0.3018486894 1,864,194 0.2878332525Ocean Twp Bd of Ed (Monmouth) 351 Monmouth 1,276,958 0.3006101912 1,978,886 0.3055418018Oceanport Schools 349 Monmouth 188,702 0.0444225607 285,008 0.0440054949Red Bank Bd of Ed 353 Monmouth 267,455 0.0629618975 417,081 0.0643976865Red Bank Charter School 360 Monmouth 50,134 0.0118021042 73,549 0.0113560326Red Bank Regional High School 301 Monmouth 407,500 0.0959300564 667,523 0.1030661595Roosevelt Borough Bd of Ed 369 Monmouth 33,926 0.0079865597 49,634 0.0076635348Rumson Boro Bd of Ed 354 Monmouth 271,968 0.0640243081 376,038 0.0580606099Rumson Fair Haven Regional H.S. 371 Monmouth 316,650 0.0745429505 474,732 0.0732990534Sea Girt Bd of Ed 366 Monmouth 68,911 0.0162224199 106,729 0.0164790549Shore Regional H S District 373 Monmouth 213,416 0.0502405127 345,265 0.0533092307Shrewsbury Borough Bd of Ed 356 Monmouth 138,512 0.0326072735 219,188 0.0338428270Spring Lake Boro Bd of Ed 358 Monmouth 93,292 0.0219619799 156,439 0.0241543242Spring Lake Heights Bd of Ed 368 Monmouth 87,673 0.0206392045 138,918 0.0214490658Tinton Falls Board of Education 357 Monmouth 460,579 0.1084254465 678,500 0.1047610183Union Beach Boro Bd of Ed 359 Monmouth 189,894 0.0447031709 295,235 0.0455845531Upper Freehold Regional 361 Monmouth 659,737 0.1553094665 1,025,060 0.1582701982Wall Township Bd of Ed 362 Monmouth 1,121,154 0.2639321875 1,768,446 0.2730496740West Long Branch Bd of Ed 363 Monmouth 161,553 0.0380313826 266,482 0.0411450637Boonton Town Bd of Ed 411 Morris 458,400 0.1079124855 712,555 0.1100191414Boonton Twp Bd of Ed 412 Morris 146,949 0.0345934377 228,322 0.0352531249Butler Boro Bd of Ed 413 Morris 378,271 0.0890492229 602,601 0.0930421436Chathams School District 455 Morris 1,130,157 0.2660515944 1,704,840 0.2632288497Chester Twp Bd of Ed 416 Morris 369,300 0.0869373492 592,422 0.0914704967Denville Twp Bd of Ed 417 Morris 475,533 0.1119457853 796,839 0.1230326678Dover Bd of Ed 418 Morris 833,672 0.1962557103 1,302,866 0.2011636977East Hanover Twp Bd of Ed 448 Morris 362,701 0.0853838709 535,575 0.0826932681Florham Park Bd of Ed 419 Morris 310,694 0.0731408415 471,363 0.0727788768Hanover Park Reg H S Dist 420 Morris 512,716 0.1206990792 789,225 0.1218570592Hanover Township Bd of Ed 421 Morris 459,995 0.1082879663 720,518 0.1112486358Harding Township Bd of Ed 422 Morris 109,647 0.0258121298 180,437 0.0278596372Jefferson Township Bd of Ed 423 Morris 1,037,206 0.2441698897 1,557,230 0.2404377312Kinnelon Borough Bd of Ed 424 Morris 670,053 0.1577379682 1,054,329 0.1627893584
(Continued) 20
Employer EmployerEmployer Nonmployer proportionate Nonmployer proportionate
Employer number County contributions share contributions share
2014 2013
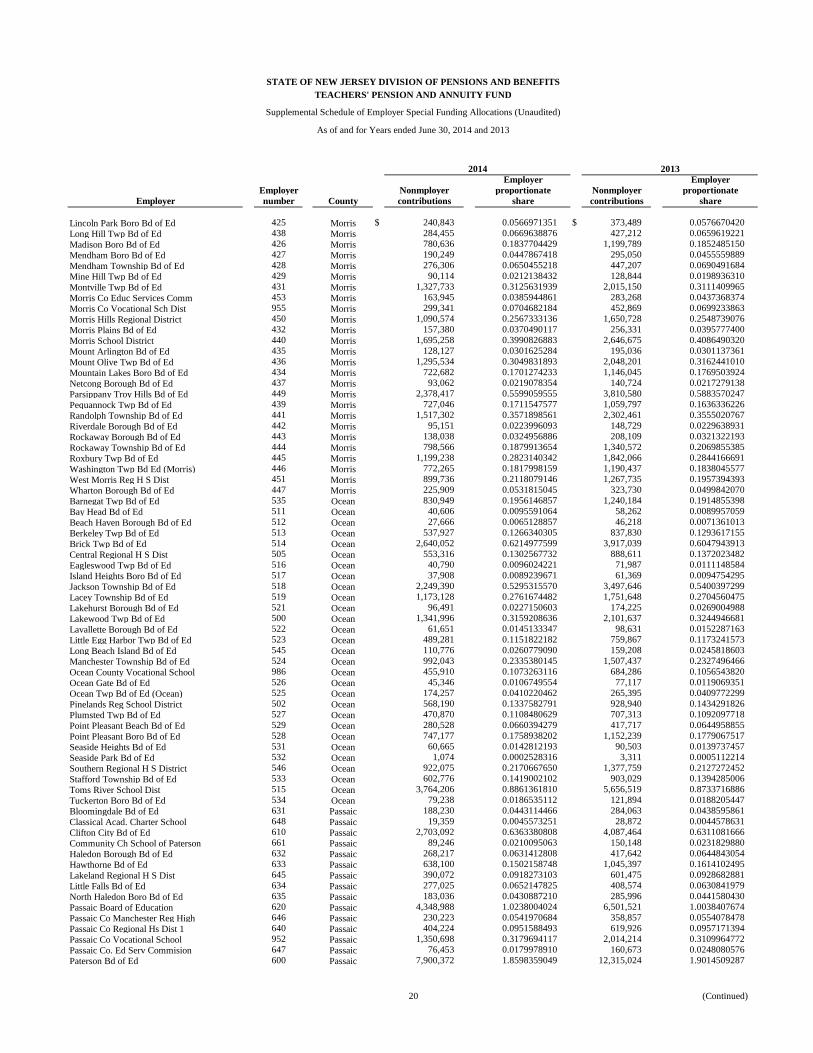
STATE OF NEW JERSEY DIVISION OF PENSIONS AND BENEFITSTEACHERS' PENSION AND ANNUITY FUND
Supplemental Schedule of Employer Special Funding Allocations (Unaudited)
As of and for Years ended June 30, 2014 and 2013
Lincoln Park Boro Bd of Ed 425 Morris $ 240,843 0.0566971351 $ 373,489 0.0576670420Long Hill Twp Bd of Ed 438 Morris 284,455 0.0669638876 427,212 0.0659619221Madison Boro Bd of Ed 426 Morris 780,636 0.1837704429 1,199,789 0.1852485150Mendham Boro Bd of Ed 427 Morris 190,249 0.0447867418 295,050 0.0455559889Mendham Township Bd of Ed 428 Morris 276,306 0.0650455218 447,207 0.0690491684Mine Hill Twp Bd of Ed 429 Morris 90,114 0.0212138432 128,844 0.0198936310Montville Twp Bd of Ed 431 Morris 1,327,733 0.3125631939 2,015,150 0.3111409965Morris Co Educ Services Comm 453 Morris 163,945 0.0385944861 283,268 0.0437368374Morris Co Vocational Sch Dist 955 Morris 299,341 0.0704682184 452,869 0.0699233863Morris Hills Regional District 450 Morris 1,090,574 0.2567333136 1,650,728 0.2548739076Morris Plains Bd of Ed 432 Morris 157,380 0.0370490117 256,331 0.0395777400Morris School District 440 Morris 1,695,258 0.3990826883 2,646,675 0.4086490320Mount Arlington Bd of Ed 435 Morris 128,127 0.0301625284 195,036 0.0301137361Mount Olive Twp Bd of Ed 436 Morris 1,295,534 0.3049831893 2,048,201 0.3162441010Mountain Lakes Boro Bd of Ed 434 Morris 722,682 0.1701274233 1,146,045 0.1769503924Netcong Borough Bd of Ed 437 Morris 93,062 0.0219078354 140,724 0.0217279138Parsippany Troy Hills Bd of Ed 449 Morris 2,378,417 0.5599059555 3,810,580 0.5883570247Pequannock Twp Bd of Ed 439 Morris 727,046 0.1711547577 1,059,797 0.1636336226Randolph Township Bd of Ed 441 Morris 1,517,302 0.3571898561 2,302,461 0.3555020767Riverdale Borough Bd of Ed 442 Morris 95,151 0.0223996093 148,729 0.0229638931Rockaway Borough Bd of Ed 443 Morris 138,038 0.0324956886 208,109 0.0321322193Rockaway Township Bd of Ed 444 Morris 798,566 0.1879913654 1,340,572 0.2069855385Roxbury Twp Bd of Ed 445 Morris 1,199,238 0.2823140342 1,842,066 0.2844166691Washington Twp Bd Ed (Morris) 446 Morris 772,265 0.1817998159 1,190,437 0.1838045577West Morris Reg H S Dist 451 Morris 899,736 0.2118079146 1,267,735 0.1957394393Wharton Borough Bd of Ed 447 Morris 225,909 0.0531815045 323,730 0.0499842070Barnegat Twp Bd of Ed 535 Ocean 830,949 0.1956146857 1,240,184 0.1914855398Bay Head Bd of Ed 511 Ocean 40,606 0.0095591064 58,262 0.0089957059Beach Haven Borough Bd of Ed 512 Ocean 27,666 0.0065128857 46,218 0.0071361013Berkeley Twp Bd of Ed 513 Ocean 537,927 0.1266340305 837,830 0.1293617155Brick Twp Bd of Ed 514 Ocean 2,640,052 0.6214977599 3,917,039 0.6047943913Central Regional H S Dist 505 Ocean 553,316 0.1302567732 888,611 0.1372023482Eagleswood Twp Bd of Ed 516 Ocean 40,790 0.0096024221 71,987 0.0111148584Island Heights Boro Bd of Ed 517 Ocean 37,908 0.0089239671 61,369 0.0094754295Jackson Township Bd of Ed 518 Ocean 2,249,390 0.5295315570 3,497,646 0.5400397299Lacey Township Bd of Ed 519 Ocean 1,173,128 0.2761674482 1,751,648 0.2704560475Lakehurst Borough Bd of Ed 521 Ocean 96,491 0.0227150603 174,225 0.0269004988Lakewood Twp Bd of Ed 500 Ocean 1,341,996 0.3159208636 2,101,637 0.3244946681Lavallette Borough Bd of Ed 522 Ocean 61,651 0.0145133347 98,631 0.0152287163Little Egg Harbor Twp Bd of Ed 523 Ocean 489,281 0.1151822182 759,867 0.1173241573Long Beach Island Bd of Ed 545 Ocean 110,776 0.0260779090 159,208 0.0245818603Manchester Township Bd of Ed 524 Ocean 992,043 0.2335380145 1,507,437 0.2327496466Ocean County Vocational School 986 Ocean 455,910 0.1073263116 684,286 0.1056543820Ocean Gate Bd of Ed 526 Ocean 45,346 0.0106749554 77,117 0.0119069351Ocean Twp Bd of Ed (Ocean) 525 Ocean 174,257 0.0410220462 265,395 0.0409772299Pinelands Reg School District 502 Ocean 568,190 0.1337582791 928,940 0.1434291826Plumsted Twp Bd of Ed 527 Ocean 470,870 0.1108480629 707,313 0.1092097718Point Pleasant Beach Bd of Ed 529 Ocean 280,528 0.0660394279 417,717 0.0644958855Point Pleasant Boro Bd of Ed 528 Ocean 747,177 0.1758938202 1,152,239 0.1779067517Seaside Heights Bd of Ed 531 Ocean 60,665 0.0142812193 90,503 0.0139737457Seaside Park Bd of Ed 532 Ocean 1,074 0.0002528316 3,311 0.0005112214Southern Regional H S District 546 Ocean 922,075 0.2170667650 1,377,759 0.2127272452Stafford Township Bd of Ed 533 Ocean 602,776 0.1419002102 903,029 0.1394285006Toms River School Dist 515 Ocean 3,764,206 0.8861361810 5,656,519 0.8733716886Tuckerton Boro Bd of Ed 534 Ocean 79,238 0.0186535112 121,894 0.0188205447Bloomingdale Bd of Ed 631 Passaic 188,230 0.0443114466 284,063 0.0438595861Classical Acad. Charter School 648 Passaic 19,359 0.0045573251 28,872 0.0044578631Clifton City Bd of Ed 610 Passaic 2,703,092 0.6363380808 4,087,464 0.6311081666Community Ch School of Paterson 661 Passaic 89,246 0.0210095063 150,148 0.0231829880Haledon Borough Bd of Ed 632 Passaic 268,217 0.0631412808 417,642 0.0644843054Hawthorne Bd of Ed 633 Passaic 638,100 0.1502158748 1,045,397 0.1614102495Lakeland Regional H S Dist 645 Passaic 390,072 0.0918273103 601,475 0.0928682881Little Falls Bd of Ed 634 Passaic 277,025 0.0652147825 408,574 0.0630841979North Haledon Boro Bd of Ed 635 Passaic 183,036 0.0430887210 285,996 0.0441580430Passaic Board of Education 620 Passaic 4,348,988 1.0238004024 6,501,521 1.0038407674Passaic Co Manchester Reg High 646 Passaic 230,223 0.0541970684 358,857 0.0554078478Passaic Co Regional Hs Dist 1 640 Passaic 404,224 0.0951588493 619,926 0.0957171394Passaic Co Vocational School 952 Passaic 1,350,698 0.3179694117 2,014,214 0.3109964772Passaic Co. Ed Serv Commision 647 Passaic 76,453 0.0179978910 160,673 0.0248080576Paterson Bd of Ed 600 Passaic 7,900,372 1.8598359049 12,315,024 1.9014509287
(Continued) 21
Employer EmployerEmployer Nonmployer proportionate Nonmployer proportionate
Employer number County contributions share contributions share
2014 2013
STATE OF NEW JERSEY DIVISION OF PENSIONS AND BENEFITSTEACHERS' PENSION AND ANNUITY FUND
Supplemental Schedule of Employer Special Funding Allocations (Unaudited)
As of and for Years ended June 30, 2014 and 2013
Paterson Chart Sch-Science/Tech 660 Passaic $ 214,672 0.0505361891 $ 250,102 0.0386159767Pompton Lakes Bd of Ed 636 Passaic 576,888 0.1358058855 890,747 0.1375321486Prospect Park Bd of Ed 637 Passaic 225,468 0.0530776882 334,333 0.0516213199Ringwood Boro Bd of Ed 638 Passaic 385,524 0.0907566602 585,708 0.0904338490Totowa Borough Bd of Ed 639 Passaic 286,004 0.0673285395 443,054 0.0684079414Wanaque Bd of Ed 641 Passaic 333,347 0.0784736110 439,016 0.0677844705Wayne Board of Education 642 Passaic 2,733,534 0.6435044679 4,138,392 0.6389714963West Milford Township Bd of Ed 643 Passaic 1,249,710 0.2941957073 1,879,003 0.2901197756Woodland Park Bd of Ed 644 Passaic 301,354 0.0709421011 466,332 0.0720020858Alloway Twp Bd of Ed 711 Salem 126,670 0.0298195343 192,767 0.0297634005Elsinboro Township Bd of Ed 713 Salem 34,977 0.0082339769 52,763 0.0081466553Lower Alloways Creek Bd of Ed 714 Salem 62,153 0.0146315111 102,416 0.0158131237Mannington Township Bd of Ed 716 Salem 50,203 0.0118183475 75,678 0.0116847522Oldmans Twp Bd of Ed 717 Salem 64,260 0.0151275225 95,005 0.0146688586Penns Grove Carneys Point Reg 725 Salem 698,856 0.1645185165 1,081,887 0.1670443388Pennsville Twp Bd of Ed 715 Salem 548,591 0.1291444553 821,470 0.1268357166Pittsgrove Twp Bd of Ed 721 Salem 470,852 0.1108438255 732,957 0.1131692288Quinton Township Bd of Ed 722 Salem 93,150 0.0219285515 144,626 0.0223303862Salem City Bd of Ed 700 Salem 451,198 0.1062170542 724,755 0.1119028325Salem Co Sp Services Sch Dist 726 Salem 222,122 0.0522900024 334,895 0.0517080932Salem Co Vocational Tech School 984 Salem 132,825 0.0312684902 206,272 0.0318485848Upper Pittsgrove Twp Bd of Ed 724 Salem 91,201 0.0214697351 139,030 0.0214663587Woodstown-Pilesgrove Reg Sch 719 Salem 442,315 0.1041258966 664,995 0.1026758340Bedminster Twp Bd of Ed 741 Somerset 210,793 0.0496230291 325,949 0.0503268226Bernards Twp Bd of Ed 742 Somerset 1,599,971 0.3766510631 2,347,936 0.3625234581Bound Brook Boro Bd of Ed 743 Somerset 399,006 0.0939304738 577,581 0.0891790328Branchburg Twp Bd of Ed 744 Somerset 552,011 0.1299495616 866,905 0.1338509220Bridgewater-Raritan Reg Sch Dis 745 Somerset 2,727,287 0.6420338543 4,283,014 0.6613012648Central Jersey Coll Prep Chrtr 769 Somerset 69,109 0.0162690313 94,403 0.0145759092Franklin Twp Bd of Ed (Somerst) 748 Somerset 2,224,063 0.5235692980 3,540,229 0.5466145839Green Brook Bd of Ed 753 Somerset 251,247 0.0591463531 400,917 0.0619019502Hillsborough Twp Bd of Ed 749 Somerset 2,300,616 0.5415907302 3,468,289 0.5355069824Manville Borough Bd of Ed 759 Somerset 343,735 0.0809190624 516,917 0.0798124559Montgomery Twp Bd of Ed 751 Somerset 1,404,385 0.3306079318 2,118,201 0.3270521648North Plainfield Bd of Ed 752 Somerset 991,797 0.2334801033 1,527,512 0.2358492449Somerset Co Ed Ctnl Srvc Comm 764 Somerset 112,067 0.0263818248 240,050 0.0370639388Somerset Co Vocational School 990 Somerset 227,063 0.0534531690 344,271 0.0531557561Somerset Hills Bd of Ed 761 Somerset 649,911 0.1529963162 1,054,918 0.1628803006Somerville Bd of Ed 730 Somerset 723,665 0.1703588325 1,111,353 0.1715939160South Bound Brook Bd of Ed 756 Somerset 133,407 0.0314054995 215,963 0.0333448840Warren Township Bd of Ed 757 Somerset 770,174 0.1813075711 1,234,939 0.1906757070Watchung Borough Bd of Ed 758 Somerset 198,079 0.0466300114 297,407 0.0459199118Watchung Hills Regional H S 762 Somerset 659,750 0.1553125268 1,033,706 0.1596051484Andover Regional Bd of Ed 772 Sussex 201,004 0.0473185891 326,448 0.0504038687Byram Twp Bd of Ed 774 Sussex 265,100 0.0624075042 419,243 0.0647315013Frankford Township Bd of Ed 775 Sussex 233,813 0.0550421945 359,765 0.0555480439Franklin Boro Bd of Ed 776 Sussex 166,550 0.0392077322 258,122 0.0398542720Fredon Township Bd of Ed 777 Sussex 79,689 0.0187596816 138,025 0.0213111858Green Township Bd of Ed 778 Sussex 133,163 0.0313480591 210,991 0.0325772027Hamburg Borough Bd of Ed 779 Sussex 97,343 0.0229156306 147,858 0.0228294099Hampton Township Bd of Ed 781 Sussex 130,721 0.0307731850 206,456 0.0318769946Hardyston Township Bd of Ed 782 Sussex 196,314 0.0462145106 317,077 0.0489569778High Point Reg High School 780 Sussex 408,294 0.0961169728 666,899 0.1029698134Hopatcong Board of Education 783 Sussex 656,820 0.1546227721 1,021,806 0.1577677776Kittatinny Regional H S 795 Sussex 407,000 0.0958123508 621,510 0.0959617104Lafayette Board of Education 784 Sussex 87,050 0.0204925433 123,033 0.0189964073Lenape Valley Reg H S Dist 790 Sussex 287,056 0.0675761920 425,126 0.0656398418Montague Bd of Ed 785 Sussex 107,352 0.0252718611 166,035 0.0256359553Newton Bd of Ed 786 Sussex 487,803 0.1148342805 727,021 0.1122527050Ogdensburg Bd of Ed 787 Sussex 86,856 0.0204468736 139,780 0.0215821594Sandyston Walpack School Dist 788 Sussex 46,257 0.0108894150 77,159 0.0119134199Sparta Bd of Ed 789 Sussex 1,132,425 0.2665855069 1,488,681 0.2298537031Stanhope Borough Bd of Ed 791 Sussex 86,115 0.0202724339 125,059 0.0193092236Stillwater Township Bd of Ed 792 Sussex 135,601 0.0319219916 215,335 0.0332479202Sussex Co Ed Serv Comm Bd of Ed 771 Sussex 41,725 0.0098225315 47,675 0.0073610634Sussex County Charter School 793 Sussex 1,076 0.0002533024 4,280 0.0006608359Sussex County Charter School 793 Sussex 51,809 0.0121964179 72,223 0.0111512970Sussex County Vocational 979 Sussex 232,491 0.0547309809 340,268 0.0525376893Sussex-Wantage Reg Sch Dist 796 Sussex 419,310 0.0987102624 679,147 0.1048609157Unity Charter School 798 Sussex 43,875 0.0103286656 53,415 0.0082473247
22
Employer EmployerEmployer Nonmployer proportionate Nonmployer proportionate
Employer number County contributions share contributions share
Vernon Township Bd of Ed 794 Sussex $ 1,372,729 0.3231557554 $ 2,148,762 0.3317708110Wallkill Vall Reg H S 797 Sussex 279,061 0.0656940797 441,945 0.0682367108Barack Obama Green Charter H.S. 854 Union 39,619 0.0093267556 7,545 0.0011649549Berkeley Heights Bd of Ed 838 Union 898,632 0.2115480206 1,398,220 0.2158864422Central Jersey Arts Charter Sch 853 Union 50,610 0.0119141599 89,627 0.0138384905Clark Twp Bd of Ed 831 Union 643,680 0.1515294692 985,575 0.1521736782Cranford Twp Bd of Ed 832 Union 1,132,123 0.2665144128 1,737,782 0.2683151245Elizabeth Bd of Ed 800 Union 7,983,496 1.8794042239 11,170,639 1.7247568418Garwood Borough Bd of Ed 833 Union 99,080 0.0233245398 142,763 0.0220427373Hillside Board of Education 834 Union 953,500 0.2244645613 1,494,931 0.2308187088Kenilworth Borough Bd of Ed 810 Union 419,206 0.0986857797 635,656 0.0981458657Linden City Bd of Ed 835 Union 1,829,726 0.4307379590 2,799,718 0.4322790107Mountainside Boro Bd of Ed 836 Union 175,165 0.0412357996 290,320 0.0448256726New Providence Bd of Ed 837 Union 681,575 0.1604503759 1,047,096 0.1616725767Plainfield Bd of Ed 820 Union 2,090,962 0.4922358344 3,129,361 0.4831761903Queen City Academy Charter Sch 132 Union 65,089 0.0153226784 89,368 0.0137985006Rahway City Bd of Ed 839 Union 1,163,624 0.2739301004 1,735,080 0.2678979332Roselle Boro Bd of Ed 840 Union 772,959 0.1819631913 1,235,057 0.1906939263Roselle Park Boro Bd of Ed 842 Union 604,729 0.1423599682 897,796 0.1386205206Scotch Plains Fanwood Bd of Ed 843 Union 1,438,267 0.3385841334 2,160,201 0.3335370031Springfield Twp Bd Ed (Union) 844 Union 631,278 0.1486098997 968,630 0.1495573547Summit Board of Education 845 Union 1,297,161 0.3053662033 2,065,052 0.3188459107Union Co Educ Serv Commission 841 Union 380,096 0.0894788484 600,933 0.0927846028Union Co Vocational Schools 988 Union 414,292 0.0975289691 618,742 0.0955343287Union County College 850 Union 37,525 0.0088338046 73,685 0.0113770312Union County Teams Charter Schl 852 Union 39,658 0.0093359366 65,434 0.0101030692Union Twp Bd of Ed (Union) 846 Union 2,121,380 0.4993965717 3,452,501 0.5330693008Westfield Town Bd of Ed 847 Union 1,913,022 0.4503467688 2,777,910 0.4289118356Winfield Township Bd of Ed 849 Union 56,830 0.0133784174 90,338 0.0139482695Allamuchy Bd of Ed 911 Warren 99,304 0.0233772719 162,090 0.0250268437Alpha Bd of Ed 912 Warren 80,976 0.0190626558 115,760 0.0178734495Belvidere Town Bd of Ed 913 Warren 261,061 0.0614566784 402,868 0.0622031863Blairstown Twp Bd of Ed 914 Warren 181,518 0.0427313668 265,642 0.0410153669Franklin Twp Bd of Ed (Warren) 915 Warren 91,334 0.0215010448 130,910 0.0202126233Frelinghuysen Twp Bd of Ed 916 Warren 54,893 0.0129224260 78,167 0.0120690560Great Meadows Regional Bd of Ed 937 Warren 244,655 0.0575945226 384,457 0.0593605112Greenwich Twp Bd of Ed (Warren) 917 Warren 201,988 0.0475502337 290,924 0.0449189307Hackettstown Bd of Ed 918 Warren 558,790 0.1315454140 866,073 0.1337224605Harmony Township Bd of Ed 921 Warren 76,369 0.0179781165 121,092 0.0186967152Hope Twp Bd of Ed 922 Warren 67,714 0.0159406327 96,941 0.0149677787Knowlton Twp Bd of Ed 924 Warren 94,912 0.0223433460 135,015 0.0208464390Lopatcong Township Bd of Ed 926 Warren 246,879 0.0581180770 383,249 0.0591739949Mansfield Twp Bd of Ed (Warren) 927 Warren 200,948 0.0473054061 292,460 0.0451560905North Warren Reg High School 901 Warren 307,172 0.0723117234 463,950 0.0716343028Oxford Twp Bd of Ed 928 Warren 80,021 0.0188378381 138,490 0.0213829822Phillipsburg Town Bd of Ed 900 Warren 1,220,147 0.2872362466 1,774,190 0.2739365529Pohatcong Twp Boe 931 Warren 105,787 0.0249034426 162,173 0.0250396590Ridge And Valley Charter School 902 Warren 33,331 0.0078464901 44,892 0.0069313657Warren Co Sp Services Sch Dist 936 Warren 30,881 0.0072697327 49,434 0.0076326547Warren Co Vocational School 989 Warren 145,607 0.0342775159 213,149 0.0329103998Warren Hills Reg Schools 935 Warren 540,323 0.1271980757 822,229 0.1269529069Washington Boro Bd of Ed 932 Warren 152,991 0.0360157920 223,676 0.0345357782Washington Twp Bd Ed (Warren) 933 Warren 183,179 0.0431223848 274,055 0.0423143418White Township Bd of Ed 934 Warren 102,574 0.0241470665 145,341 0.0224407829Adelaide Sanford Charter School 6096 Multiple 45,172 0.0106339939 50,253 0.0077591090Bayshore Jointure Commission 340 Multiple 32,538 0.0076598090 52,819 0.0081553017Capital Prep Charter H S 134 Multiple — — 96,915 0.0149637643Monmouth Ocean Ed Serv Comm 375 Multiple 131,814 0.0310304894 243,772 0.0376386190Morris-Union Jointure Comm 851 Multiple 420,181 0.0989153056 659,287 0.1017945136Pleasantech Academy Charter Sch 1011 Multiple 128,331 0.0302105523 179,817 0.0277640631
Total $ 424,788,659 100.0000000000% $ 647,664,570 100.0000000000%
See accompanying independent auditors’ report and notes to supplemental schedules.
STATE OF NEW JERSEY DIVISION OF PENSIONS AND BENEFITSTEACHERS' PENSION AND ANNUITY FUND
Supplemental Schedule of Employer Special Funding Allocations (Unaudited)
As of and for Years ended June 30, 2014 and 2013
2014 2013

(Continued) 23
STATE OF NEW JERSEY DIVISION OF PENSIONS AND BENEFITSTEACHERS' PENSION AND ANNUITY FUND
Supplemental Schedule of Special Funding Amounts by Employer (Unaudited)
As of and for Year ended June 30, 2014 and As of June 30, 2013
Employerpensionexpense
andrelated
Employer revenueEmployer number County 2013 2014 2014
Kean University 90412 $ 13,437,830 21,613,419 1,163,005 Montclair State University 90414 11,242,761 17,012,699 915,443 New Jersey City University 90411 24,070,841 38,967,970 2,096,843 New Jersey Institute of Technology 981 5,246,315 8,415,067 452,810 Rowan University 90410 4,500,710 6,406,231 344,715 The College of New Jersey 90415 3,612,772 4,666,398 251,096 William Paterson University of New Jersey 90413 6,940,334 10,050,848 540,830 Longport Borough Bd of Ed 1095 Atlantic 78,267 81,909 4,407 Absecon Bd of Ed 1020 Atlantic 28,153,528 29,509,732 1,587,901 Atlantic City Bd of Ed 1000 Atlantic 305,445,923 342,788,494 18,445,239 Atlantic Co Special Services 1098 Atlantic 41,665,099 44,293,160 2,383,388 Atlantic Co Vocational Schools 969 Atlantic 22,280,764 27,845,391 1,498,343 Brigantine City Bd of Ed 1094 Atlantic 33,170,504 35,502,143 1,910,349 Buena Regional School Dist 1081 Atlantic 87,903,323 90,455,747 4,867,368 Egg Harbor City Bd of Ed 1030 Atlantic 20,748,898 22,177,091 1,193,336 Egg Harbor Twp Bd of Ed 1083 Atlantic 244,617,946 259,337,251 13,954,779 Estell Manor Bd of Ed 1084 Atlantic 6,166,012 6,450,143 347,078 Folsom Borough Bd of Ed 1085 Atlantic 12,054,695 12,857,003 691,827 Galloway Community Charter Sch 1080 Atlantic 7,394,018 7,266,334 390,997 Galloway Township Bd of Ed 1086 Atlantic 116,890,790 127,288,433 6,849,313 Greater Egg Harbor Regional 1097 Atlantic 111,440,965 126,222,112 6,791,935 Hamilton Twp Bd Ed (Atlantic) 1087 Atlantic 91,627,370 96,480,494 5,191,556 Hammonton Town Bd of Ed 1040 Atlantic 97,711,916 105,283,211 5,665,225 Linwood Bd of Ed 1050 Atlantic 33,698,008 36,468,438 1,962,344 Mainland Regional H S 1096 Atlantic 57,086,684 61,173,497 3,291,708 Margate City Bd of Ed 1060 Atlantic 24,764,165 24,979,849 1,344,150 Mullica Twp Bd of Ed 1088 Atlantic 24,132,097 26,824,239 1,443,396 Northfield Bd of Ed 1089 Atlantic 31,883,506 34,084,659 1,834,075 Oceanside Charter School 1022 Atlantic 11,605,225 12,436,137 669,181 Pleasantville Bd of Ed 1010 Atlantic 153,526,662 169,388,179 9,114,674 Port Republic City Bd of Ed 1091 Atlantic 4,872,537 5,524,613 297,276 Somers Point City Bd of Ed 1092 Atlantic 37,827,202 39,510,379 2,126,029 Ventnor City Bd of Ed 1070 Atlantic 34,885,514 34,461,363 1,854,345 Weymouth Township Bd of Ed 1093 Atlantic 7,679,618 7,739,919 416,480 South Bergen Jointure Comm 2097 Bergen 45,568,935 45,078,903 2,425,668 Allendale Boro Bd of Ed 2021 Bergen 29,492,809 32,251,468 1,735,432 Alpine Bd of Ed 2022 Bergen 9,664,388 9,489,693 510,635 Bergen Arts & Science Chrtr Sch 2098 Bergen 8,722,451 12,641,726 680,244 Bergen Co Bd of Special Servs 2001 Bergen 159,708,437 160,785,515 8,651,770 Bergen Co Vocational School 980 Bergen 122,291,767 131,921,363 7,098,608 Bergen Community College 2030 Bergen 1,390,782 1,484,168 79,862 Bergenfield Bd of Ed 2023 Bergen 125,618,626 133,555,508 7,186,540 Bogota Boro Bd of Ed 2024 Bergen 39,258,327 40,887,852 2,200,150 Carlstadt Borough Bd of Ed 2025 Bergen 21,570,040 24,571,061 1,322,154 Carlstadt E.Rutherford Bd of Ed 2040 Bergen 22,444,712 23,989,774 1,290,875 Cliffside Park Bd of Ed 2026 Bergen 92,497,672 96,558,753 5,195,767 Closter Board of Education 2027 Bergen 46,868,652 49,936,169 2,687,035 Cresskill Bd of Ed 2028 Bergen 65,387,289 66,031,518 3,553,116 Demarest Boro Bd of Ed 2029 Bergen 26,813,233 26,414,822 1,421,365 Dumont Borough Bd of Ed 2031 Bergen 102,116,879 104,591,833 5,628,023 East Rutherford Boro Bd of Ed 2033 Bergen 34,032,535 35,785,741 1,925,609 Edgewater Boro Bd of Ed 2034 Bergen 16,625,166 18,635,646 1,002,773 Elmwood Park Borough Bd of Ed 2032 Bergen 63,489,527 63,892,836 3,438,034 Emerson Borough Bd of Ed 2035 Bergen 41,276,261 43,943,129 2,364,553 Englewood City Bd of Ed 2036 Bergen 120,746,323 130,115,851 7,001,454 Englewood Cliffs Bd of Ed 2037 Bergen 16,396,451 19,277,704 1,037,321 Englewood On The Palisades Char 6011 Bergen 2,574,933 7,039,607 378,797
State proportionate share ofnet pension liability
attributable to employer
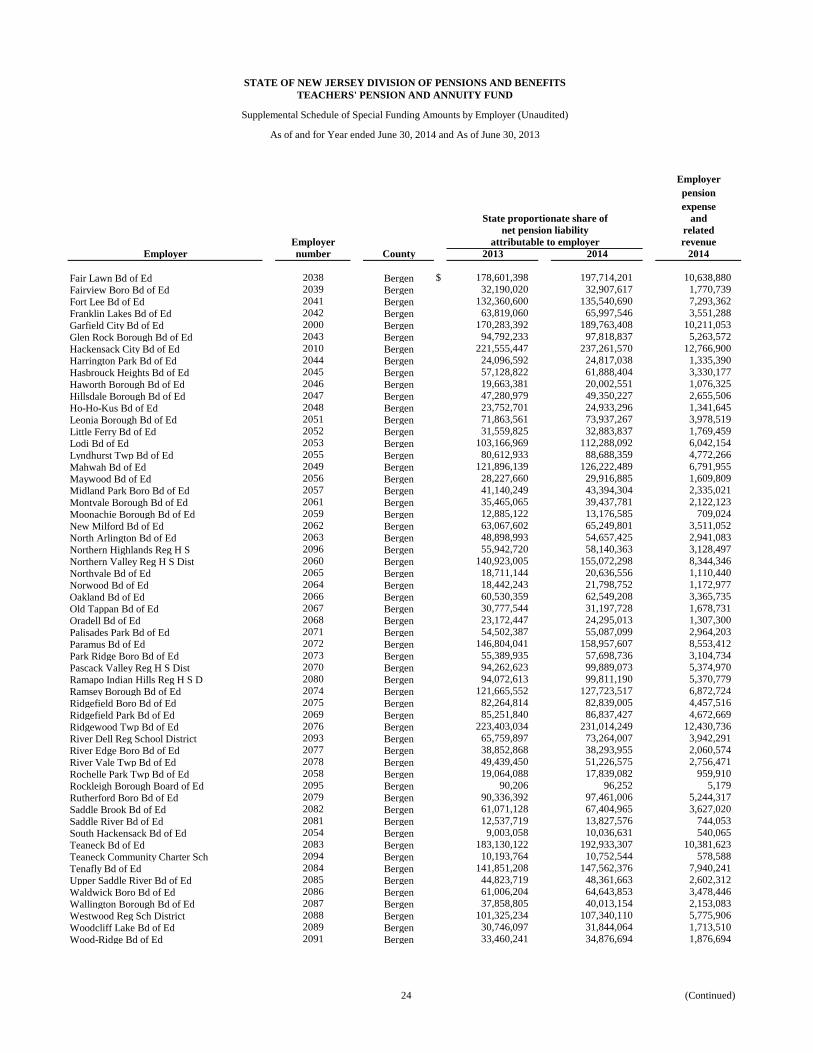
(Continued) 24
STATE OF NEW JERSEY DIVISION OF PENSIONS AND BENEFITSTEACHERS' PENSION AND ANNUITY FUND
Supplemental Schedule of Special Funding Amounts by Employer (Unaudited)
As of and for Year ended June 30, 2014 and As of June 30, 2013
Employerpensionexpense
andrelated
Employer revenueEmployer number County 2013 2014 2014
State proportionate share ofnet pension liability
attributable to employer
Fair Lawn Bd of Ed 2038 Bergen $ 178,601,398 197,714,201 10,638,880 Fairview Boro Bd of Ed 2039 Bergen 32,190,020 32,907,617 1,770,739 Fort Lee Bd of Ed 2041 Bergen 132,360,600 135,540,690 7,293,362 Franklin Lakes Bd of Ed 2042 Bergen 63,819,060 65,997,546 3,551,288 Garfield City Bd of Ed 2000 Bergen 170,283,392 189,763,408 10,211,053 Glen Rock Borough Bd of Ed 2043 Bergen 94,792,233 97,818,837 5,263,572 Hackensack City Bd of Ed 2010 Bergen 221,555,447 237,261,570 12,766,900 Harrington Park Bd of Ed 2044 Bergen 24,096,592 24,817,038 1,335,390 Hasbrouck Heights Bd of Ed 2045 Bergen 57,128,822 61,888,404 3,330,177 Haworth Borough Bd of Ed 2046 Bergen 19,663,381 20,002,551 1,076,325 Hillsdale Borough Bd of Ed 2047 Bergen 47,280,979 49,350,227 2,655,506 Ho-Ho-Kus Bd of Ed 2048 Bergen 23,752,701 24,933,296 1,341,645 Leonia Borough Bd of Ed 2051 Bergen 71,863,561 73,937,267 3,978,519 Little Ferry Bd of Ed 2052 Bergen 31,559,825 32,883,837 1,769,459 Lodi Bd of Ed 2053 Bergen 103,166,969 112,288,092 6,042,154 Lyndhurst Twp Bd of Ed 2055 Bergen 80,612,933 88,688,359 4,772,266 Mahwah Bd of Ed 2049 Bergen 121,896,139 126,222,489 6,791,955 Maywood Bd of Ed 2056 Bergen 28,227,660 29,916,885 1,609,809 Midland Park Boro Bd of Ed 2057 Bergen 41,140,249 43,394,304 2,335,021 Montvale Borough Bd of Ed 2061 Bergen 35,465,065 39,437,781 2,122,123 Moonachie Borough Bd of Ed 2059 Bergen 12,885,122 13,176,585 709,024 New Milford Bd of Ed 2062 Bergen 63,067,602 65,249,801 3,511,052 North Arlington Bd of Ed 2063 Bergen 48,898,993 54,657,425 2,941,083 Northern Highlands Reg H S 2096 Bergen 55,942,720 58,140,363 3,128,497 Northern Valley Reg H S Dist 2060 Bergen 140,923,005 155,072,298 8,344,346 Northvale Bd of Ed 2065 Bergen 18,711,144 20,636,556 1,110,440 Norwood Bd of Ed 2064 Bergen 18,442,243 21,798,752 1,172,977 Oakland Bd of Ed 2066 Bergen 60,530,359 62,549,208 3,365,735 Old Tappan Bd of Ed 2067 Bergen 30,777,544 31,197,728 1,678,731 Oradell Bd of Ed 2068 Bergen 23,172,447 24,295,013 1,307,300 Palisades Park Bd of Ed 2071 Bergen 54,502,387 55,087,099 2,964,203 Paramus Bd of Ed 2072 Bergen 146,804,041 158,957,607 8,553,412 Park Ridge Boro Bd of Ed 2073 Bergen 55,389,935 57,698,736 3,104,734 Pascack Valley Reg H S Dist 2070 Bergen 94,262,623 99,889,073 5,374,970 Ramapo Indian Hills Reg H S D 2080 Bergen 94,072,613 99,811,190 5,370,779 Ramsey Borough Bd of Ed 2074 Bergen 121,665,552 127,723,517 6,872,724 Ridgefield Boro Bd of Ed 2075 Bergen 82,264,814 82,839,005 4,457,516 Ridgefield Park Bd of Ed 2069 Bergen 85,251,840 86,837,427 4,672,669 Ridgewood Twp Bd of Ed 2076 Bergen 223,403,034 231,014,249 12,430,736 River Dell Reg School District 2093 Bergen 65,759,897 73,264,007 3,942,291 River Edge Boro Bd of Ed 2077 Bergen 38,852,868 38,293,955 2,060,574 River Vale Twp Bd of Ed 2078 Bergen 49,439,450 51,226,575 2,756,471 Rochelle Park Twp Bd of Ed 2058 Bergen 19,064,088 17,839,082 959,910 Rockleigh Borough Board of Ed 2095 Bergen 90,206 96,252 5,179 Rutherford Boro Bd of Ed 2079 Bergen 90,336,392 97,461,006 5,244,317 Saddle Brook Bd of Ed 2082 Bergen 61,071,128 67,404,965 3,627,020 Saddle River Bd of Ed 2081 Bergen 12,537,719 13,827,576 744,053 South Hackensack Bd of Ed 2054 Bergen 9,003,058 10,036,631 540,065 Teaneck Bd of Ed 2083 Bergen 183,130,122 192,933,307 10,381,623 Teaneck Community Charter Sch 2094 Bergen 10,193,764 10,752,544 578,588 Tenafly Bd of Ed 2084 Bergen 141,851,208 147,562,376 7,940,241 Upper Saddle River Bd of Ed 2085 Bergen 44,823,719 48,361,663 2,602,312 Waldwick Boro Bd of Ed 2086 Bergen 61,006,204 64,643,853 3,478,446 Wallington Borough Bd of Ed 2087 Bergen 37,858,805 40,013,154 2,153,083 Westwood Reg Sch District 2088 Bergen 101,325,234 107,340,110 5,775,906 Woodcliff Lake Bd of Ed 2089 Bergen 30,746,097 31,844,064 1,713,510 Wood-Ridge Bd of Ed 2091 Bergen 33,460,241 34,876,694 1,876,694
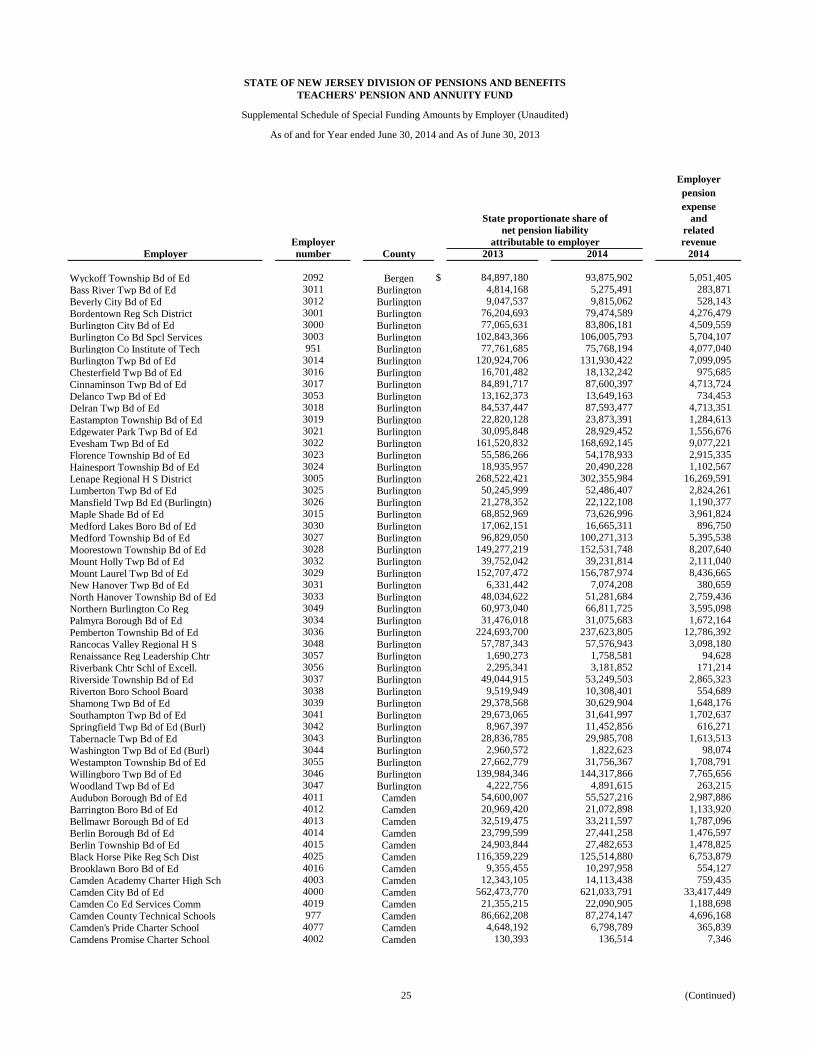
(Continued) 25
STATE OF NEW JERSEY DIVISION OF PENSIONS AND BENEFITSTEACHERS' PENSION AND ANNUITY FUND
Supplemental Schedule of Special Funding Amounts by Employer (Unaudited)
As of and for Year ended June 30, 2014 and As of June 30, 2013
Employerpensionexpense
andrelated
Employer revenueEmployer number County 2013 2014 2014
State proportionate share ofnet pension liability
attributable to employer
Wyckoff Township Bd of Ed 2092 Bergen $ 84,897,180 93,875,902 5,051,405 Bass River Twp Bd of Ed 3011 Burlington 4,814,168 5,275,491 283,871 Beverly City Bd of Ed 3012 Burlington 9,047,537 9,815,062 528,143 Bordentown Reg Sch District 3001 Burlington 76,204,693 79,474,589 4,276,479 Burlington City Bd of Ed 3000 Burlington 77,065,631 83,806,181 4,509,559 Burlington Co Bd Spcl Services 3003 Burlington 102,843,366 106,005,793 5,704,107 Burlington Co Institute of Tech 951 Burlington 77,761,685 75,768,194 4,077,040 Burlington Twp Bd of Ed 3014 Burlington 120,924,706 131,930,422 7,099,095 Chesterfield Twp Bd of Ed 3016 Burlington 16,701,482 18,132,242 975,685 Cinnaminson Twp Bd of Ed 3017 Burlington 84,891,717 87,600,397 4,713,724 Delanco Twp Bd of Ed 3053 Burlington 13,162,373 13,649,163 734,453 Delran Twp Bd of Ed 3018 Burlington 84,537,447 87,593,477 4,713,351 Eastampton Township Bd of Ed 3019 Burlington 22,820,128 23,873,391 1,284,613 Edgewater Park Twp Bd of Ed 3021 Burlington 30,095,848 28,929,452 1,556,676 Evesham Twp Bd of Ed 3022 Burlington 161,520,832 168,692,145 9,077,221 Florence Township Bd of Ed 3023 Burlington 55,586,266 54,178,933 2,915,335 Hainesport Township Bd of Ed 3024 Burlington 18,935,957 20,490,228 1,102,567 Lenape Regional H S District 3005 Burlington 268,522,421 302,355,984 16,269,591 Lumberton Twp Bd of Ed 3025 Burlington 50,245,999 52,486,407 2,824,261 Mansfield Twp Bd Ed (Burlingtn) 3026 Burlington 21,278,352 22,122,108 1,190,377 Maple Shade Bd of Ed 3015 Burlington 68,852,969 73,626,996 3,961,824 Medford Lakes Boro Bd of Ed 3030 Burlington 17,062,151 16,665,311 896,750 Medford Township Bd of Ed 3027 Burlington 96,829,050 100,271,313 5,395,538 Moorestown Township Bd of Ed 3028 Burlington 149,277,219 152,531,748 8,207,640 Mount Holly Twp Bd of Ed 3032 Burlington 39,752,042 39,231,814 2,111,040 Mount Laurel Twp Bd of Ed 3029 Burlington 152,707,472 156,787,974 8,436,665 New Hanover Twp Bd of Ed 3031 Burlington 6,331,442 7,074,208 380,659 North Hanover Township Bd of Ed 3033 Burlington 48,034,622 51,281,684 2,759,436 Northern Burlington Co Reg 3049 Burlington 60,973,040 66,811,725 3,595,098 Palmyra Borough Bd of Ed 3034 Burlington 31,476,018 31,075,683 1,672,164 Pemberton Township Bd of Ed 3036 Burlington 224,693,700 237,623,805 12,786,392 Rancocas Valley Regional H S 3048 Burlington 57,787,343 57,576,943 3,098,180 Renaissance Reg Leadership Chtr 3057 Burlington 1,690,273 1,758,581 94,628 Riverbank Chtr Schl of Excell. 3056 Burlington 2,295,341 3,181,852 171,214 Riverside Township Bd of Ed 3037 Burlington 49,044,915 53,249,503 2,865,323 Riverton Boro School Board 3038 Burlington 9,519,949 10,308,401 554,689 Shamong Twp Bd of Ed 3039 Burlington 29,378,568 30,629,904 1,648,176 Southampton Twp Bd of Ed 3041 Burlington 29,673,065 31,641,997 1,702,637 Springfield Twp Bd of Ed (Burl) 3042 Burlington 8,967,397 11,452,856 616,271 Tabernacle Twp Bd of Ed 3043 Burlington 28,836,785 29,985,708 1,613,513 Washington Twp Bd of Ed (Burl) 3044 Burlington 2,960,572 1,822,623 98,074 Westampton Township Bd of Ed 3055 Burlington 27,662,779 31,756,367 1,708,791 Willingboro Twp Bd of Ed 3046 Burlington 139,984,346 144,317,866 7,765,656 Woodland Twp Bd of Ed 3047 Burlington 4,222,756 4,891,615 263,215 Audubon Borough Bd of Ed 4011 Camden 54,600,007 55,527,216 2,987,886 Barrington Boro Bd of Ed 4012 Camden 20,969,420 21,072,898 1,133,920 Bellmawr Borough Bd of Ed 4013 Camden 32,519,475 33,211,597 1,787,096 Berlin Borough Bd of Ed 4014 Camden 23,799,599 27,441,258 1,476,597 Berlin Township Bd of Ed 4015 Camden 24,903,844 27,482,653 1,478,825 Black Horse Pike Reg Sch Dist 4025 Camden 116,359,229 125,514,880 6,753,879 Brooklawn Boro Bd of Ed 4016 Camden 9,355,455 10,297,958 554,127 Camden Academy Charter High Sch 4003 Camden 12,343,105 14,113,438 759,435 Camden City Bd of Ed 4000 Camden 562,473,770 621,033,791 33,417,449 Camden Co Ed Services Comm 4019 Camden 21,355,215 22,090,905 1,188,698 Camden County Technical Schools 977 Camden 86,662,208 87,274,147 4,696,168 Camden's Pride Charter School 4077 Camden 4,648,192 6,798,789 365,839 Camdens Promise Charter School 4002 Camden 130,393 136,514 7,346
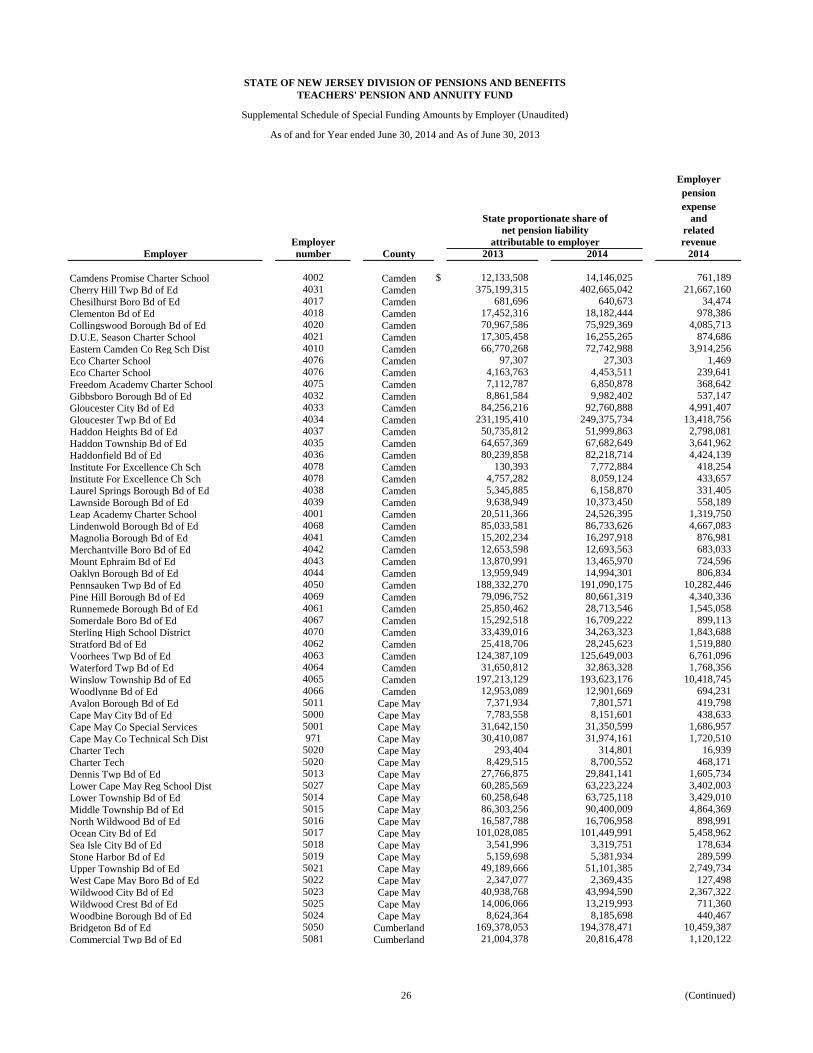
(Continued) 26
STATE OF NEW JERSEY DIVISION OF PENSIONS AND BENEFITSTEACHERS' PENSION AND ANNUITY FUND
Supplemental Schedule of Special Funding Amounts by Employer (Unaudited)
As of and for Year ended June 30, 2014 and As of June 30, 2013
Employerpensionexpense
andrelated
Employer revenueEmployer number County 2013 2014 2014
State proportionate share ofnet pension liability
attributable to employer
Camdens Promise Charter School 4002 Camden $ 12,133,508 14,146,025 761,189 Cherry Hill Twp Bd of Ed 4031 Camden 375,199,315 402,665,042 21,667,160 Chesilhurst Boro Bd of Ed 4017 Camden 681,696 640,673 34,474 Clementon Bd of Ed 4018 Camden 17,452,316 18,182,444 978,386 Collingswood Borough Bd of Ed 4020 Camden 70,967,586 75,929,369 4,085,713 D.U.E. Season Charter School 4021 Camden 17,305,458 16,255,265 874,686 Eastern Camden Co Reg Sch Dist 4010 Camden 66,770,268 72,742,988 3,914,256 Eco Charter School 4076 Camden 97,307 27,303 1,469 Eco Charter School 4076 Camden 4,163,763 4,453,511 239,641 Freedom Academy Charter School 4075 Camden 7,112,787 6,850,878 368,642 Gibbsboro Borough Bd of Ed 4032 Camden 8,861,584 9,982,402 537,147 Gloucester City Bd of Ed 4033 Camden 84,256,216 92,760,888 4,991,407 Gloucester Twp Bd of Ed 4034 Camden 231,195,410 249,375,734 13,418,756 Haddon Heights Bd of Ed 4037 Camden 50,735,812 51,999,863 2,798,081 Haddon Township Bd of Ed 4035 Camden 64,657,369 67,682,649 3,641,962 Haddonfield Bd of Ed 4036 Camden 80,239,858 82,218,714 4,424,139 Institute For Excellence Ch Sch 4078 Camden 130,393 7,772,884 418,254 Institute For Excellence Ch Sch 4078 Camden 4,757,282 8,059,124 433,657 Laurel Springs Borough Bd of Ed 4038 Camden 5,345,885 6,158,870 331,405 Lawnside Borough Bd of Ed 4039 Camden 9,638,949 10,373,450 558,189 Leap Academy Charter School 4001 Camden 20,511,366 24,526,395 1,319,750 Lindenwold Borough Bd of Ed 4068 Camden 85,033,581 86,733,626 4,667,083 Magnolia Borough Bd of Ed 4041 Camden 15,202,234 16,297,918 876,981 Merchantville Boro Bd of Ed 4042 Camden 12,653,598 12,693,563 683,033 Mount Ephraim Bd of Ed 4043 Camden 13,870,991 13,465,970 724,596 Oaklyn Borough Bd of Ed 4044 Camden 13,959,949 14,994,301 806,834 Pennsauken Twp Bd of Ed 4050 Camden 188,332,270 191,090,175 10,282,446 Pine Hill Borough Bd of Ed 4069 Camden 79,096,752 80,661,319 4,340,336 Runnemede Borough Bd of Ed 4061 Camden 25,850,462 28,713,546 1,545,058 Somerdale Boro Bd of Ed 4067 Camden 15,292,518 16,709,222 899,113 Sterling High School District 4070 Camden 33,439,016 34,263,323 1,843,688 Stratford Bd of Ed 4062 Camden 25,418,706 28,245,623 1,519,880 Voorhees Twp Bd of Ed 4063 Camden 124,387,109 125,649,003 6,761,096 Waterford Twp Bd of Ed 4064 Camden 31,650,812 32,863,328 1,768,356 Winslow Township Bd of Ed 4065 Camden 197,213,129 193,623,176 10,418,745 Woodlynne Bd of Ed 4066 Camden 12,953,089 12,901,669 694,231 Avalon Borough Bd of Ed 5011 Cape May 7,371,934 7,801,571 419,798 Cape May City Bd of Ed 5000 Cape May 7,783,558 8,151,601 438,633 Cape May Co Special Services 5001 Cape May 31,642,150 31,350,599 1,686,957 Cape May Co Technical Sch Dist 971 Cape May 30,410,087 31,974,161 1,720,510 Charter Tech 5020 Cape May 293,404 314,801 16,939 Charter Tech 5020 Cape May 8,429,515 8,700,552 468,171 Dennis Twp Bd of Ed 5013 Cape May 27,766,875 29,841,141 1,605,734 Lower Cape May Reg School Dist 5027 Cape May 60,285,569 63,223,224 3,402,003 Lower Township Bd of Ed 5014 Cape May 60,258,648 63,725,118 3,429,010 Middle Township Bd of Ed 5015 Cape May 86,303,256 90,400,009 4,864,369 North Wildwood Bd of Ed 5016 Cape May 16,587,788 16,706,958 898,991 Ocean City Bd of Ed 5017 Cape May 101,028,085 101,449,991 5,458,962 Sea Isle City Bd of Ed 5018 Cape May 3,541,996 3,319,751 178,634 Stone Harbor Bd of Ed 5019 Cape May 5,159,698 5,381,934 289,599 Upper Township Bd of Ed 5021 Cape May 49,189,666 51,101,385 2,749,734 West Cape May Boro Bd of Ed 5022 Cape May 2,347,077 2,369,435 127,498 Wildwood City Bd of Ed 5023 Cape May 40,938,768 43,994,590 2,367,322 Wildwood Crest Bd of Ed 5025 Cape May 14,006,066 13,219,993 711,360 Woodbine Borough Bd of Ed 5024 Cape May 8,624,364 8,185,698 440,467 Bridgeton Bd of Ed 5050 Cumberland 169,378,053 194,378,471 10,459,387 Commercial Twp Bd of Ed 5081 Cumberland 21,004,378 20,816,478 1,120,122

(Continued) 27
STATE OF NEW JERSEY DIVISION OF PENSIONS AND BENEFITSTEACHERS' PENSION AND ANNUITY FUND
Supplemental Schedule of Special Funding Amounts by Employer (Unaudited)
As of and for Year ended June 30, 2014 and As of June 30, 2013
Employerpensionexpense
andrelated
Employer revenueEmployer number County 2013 2014 2014
State proportionate share ofnet pension liability
attributable to employer
Cumberland Co Bd of Voc Ed 954 Cumberland $ 14,701,809 14,193,837 763,762 Cumberland County College 5080 Cumberland 1,500,419 1,027,946 55,313 Cumberland Regional School Dist 5089 Cumberland 40,693,510 43,053,836 2,316,701 Deerfield Township Bd of Ed 5082 Cumberland 9,834,266 11,774,954 633,603 Downe Twp Bd of Ed 5083 Cumberland 6,550,013 6,543,501 352,102 Fairfield Twp Bd Ed (Cumberlnd) 5084 Cumberland 18,343,063 19,433,469 1,045,703 Greenwich Twp Bd Ed (Cumbrland) 5085 Cumberland 2,613,950 2,623,213 141,153 Hopewell Twp Bd Ed (Cumberland) 5086 Cumberland 17,137,375 19,154,778 1,030,707 Lawrence Twp Bd Ed (Cumberland) 5087 Cumberland 16,717,713 16,771,755 902,478 Maurice River Township Bd of Ed 5088 Cumberland 11,662,579 12,447,209 669,777 Millville Bd of Ed 5070 Cumberland 211,458,132 223,597,183 12,031,628 Stow Creek Township Bd of Ed 5091 Cumberland 3,248,592 3,871,470 208,321 Upper Deerfield Twp Bd of Ed 5092 Cumberland 32,243,472 32,845,085 1,767,374 Vineland City Bd of Ed 5060 Cumberland 362,701,861 393,416,923 21,169,524 Vineland Public Charter School 5093 Cumberland 2,550,587 3,613,288 194,429 Belleville Bd of Ed 6010 Essex 150,597,225 154,793,607 8,329,349 Bloomfield Twp Bd of Ed 6020 Essex 190,433,465 208,246,309 11,205,607 Burch Chtr Schl of Excellence 6097 Essex 3,669,970 5,094,562 274,135 Caldwell West Caldwell Bd of Ed 6081 Essex 92,257,253 96,617,385 5,198,922 Cedar Grove Twp Bd of Ed 6083 Essex 52,042,007 55,282,496 2,974,717 Discovery Charter School 6009 Essex 2,026,751 1,614,769 86,890 East Orange Community Chart Sch 204 Essex 189,620 198,418 10,677 East Orange Community Chart Sch 204 Essex 11,169,176 12,149,645 653,765 East Orange School District 6030 Essex 457,143,804 474,257,913 25,519,528 Essex Co Educational Serv Comm 6012 Essex 42,289,363 42,303,700 2,276,336 Essex Co Vocational School 950 Essex 89,219,038 94,053,685 5,060,971 Essex Fells Bd of Ed 6084 Essex 10,929,693 10,655,663 573,375 Fairfield Twp Bd of Ed (Essex) 6082 Essex 24,136,701 24,912,032 1,340,501 Glen Ridge Bd of Ed 6085 Essex 64,992,052 71,785,249 3,862,720 Gray Charter School 6015 Essex 5,674,092 7,588,810 408,349 Great Oaks Charter School 6101 Essex — 1,582,685 85,163 Irvington Bd of Ed 6040 Essex 267,012,794 279,104,015 15,018,416 Lady Liberty Academy Charter Sc 6018 Essex 15,824,235 16,100,884 866,379 Livingston Bd of Ed 6086 Essex 227,060,363 230,744,995 12,416,247 Maria L. Varisco-Rogers Charter 6007 Essex 8,368,494 11,663,352 627,598 Marion P. Thomas Charter Sch 6013 Essex 12,443,845 16,102,646 866,474 Millburn Twp Public Schools 6087 Essex 211,209,597 209,853,654 11,292,097 Montclair Bd of Ed 6050 Essex 268,644,465 278,524,239 14,987,219 New Horizon Comm Charter School 6014 Essex 13,997,873 10,531,353 566,686 Newark Charter School 6016 Essex 5,427,118 5,359,916 288,414 Newark Educators' Comm Chtr Sch 6099 Essex 7,159,138 7,037,217 378,668 Newark Legacy Charter School 6100 Essex — 5,067,008 272,653 Newark Public Schools 6000 Essex 1,702,779,766 1,726,861,250 92,921,347 North Caldwell Bd of Ed 6088 Essex 22,989,850 24,654,605 1,326,649 North Star Academy Charter Sch 6006 Essex 32,662,588 49,807,078 2,680,088 Nutley Bd of Ed 6089 Essex 139,153,451 146,676,355 7,892,565 Orange City Bd of Ed 6060 Essex 180,527,487 202,491,823 10,895,961 Peoples Preparatory Charter Sch 6102 Essex — 3,650,530 196,433 Pride Academy Charter School 6098 Essex 7,868,614 10,774,437 579,766 Robert Treat Academy Charter Sc 6005 Essex 11,811,232 14,274,990 768,128 Roseland Bd of Ed 6091 Essex 17,742,989 19,616,410 1,055,547 Roseville Community Charter Sch 6103 Essex — 3,720,360 200,190 South Orange-Maplewood Bd of Ed 6070 Essex 238,865,275 260,482,461 14,016,402 Team Academy Charter School 6017 Essex 47,050,313 52,875,441 2,845,195 University Heights Charter Schl 6095 Essex 8,206,263 9,313,923 501,176 Verona Bd of Ed 6092 Essex 77,734,764 84,014,664 4,520,778 Visions Academy Charter H.S. 6104 Essex — 5,469,253 294,297
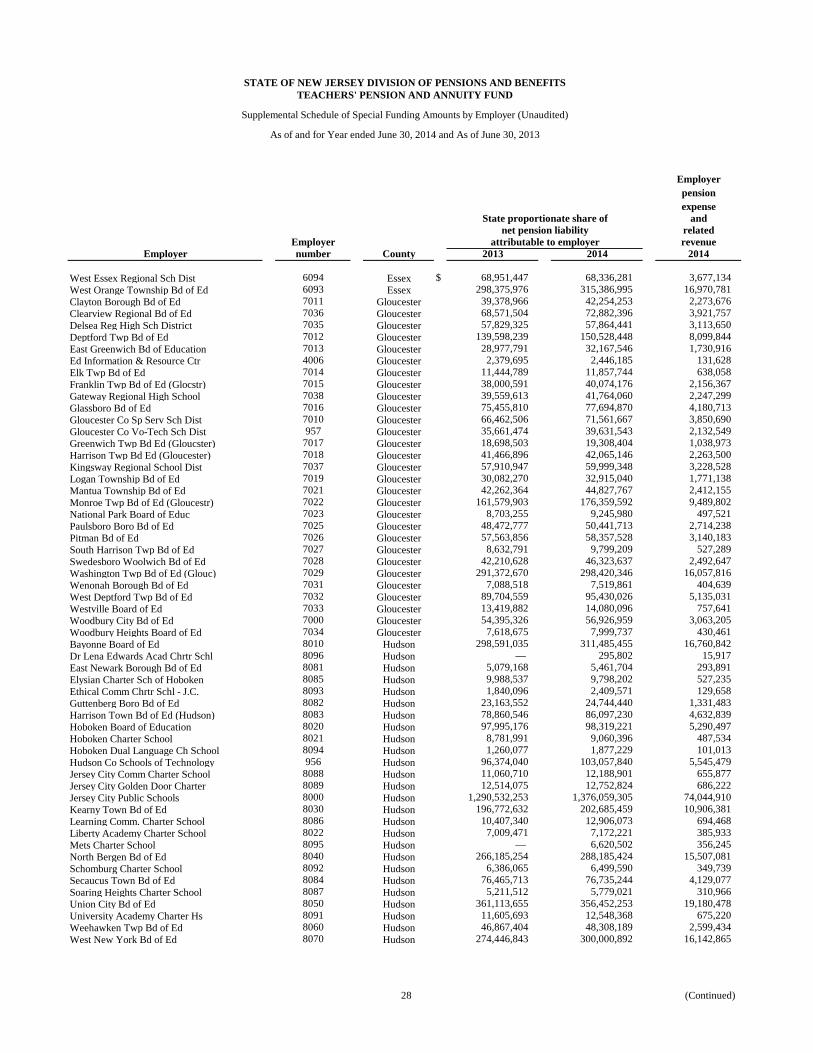
(Continued) 28
STATE OF NEW JERSEY DIVISION OF PENSIONS AND BENEFITSTEACHERS' PENSION AND ANNUITY FUND
Supplemental Schedule of Special Funding Amounts by Employer (Unaudited)
As of and for Year ended June 30, 2014 and As of June 30, 2013
Employerpensionexpense
andrelated
Employer revenueEmployer number County 2013 2014 2014
State proportionate share ofnet pension liability
attributable to employer
West Essex Regional Sch Dist 6094 Essex $ 68,951,447 68,336,281 3,677,134 West Orange Township Bd of Ed 6093 Essex 298,375,976 315,386,995 16,970,781 Clayton Borough Bd of Ed 7011 Gloucester 39,378,966 42,254,253 2,273,676 Clearview Regional Bd of Ed 7036 Gloucester 68,571,504 72,882,396 3,921,757 Delsea Reg High Sch District 7035 Gloucester 57,829,325 57,864,441 3,113,650 Deptford Twp Bd of Ed 7012 Gloucester 139,598,239 150,528,448 8,099,844 East Greenwich Bd of Education 7013 Gloucester 28,977,791 32,167,546 1,730,916 Ed Information & Resource Ctr 4006 Gloucester 2,379,695 2,446,185 131,628 Elk Twp Bd of Ed 7014 Gloucester 11,444,789 11,857,744 638,058 Franklin Twp Bd of Ed (Glocstr) 7015 Gloucester 38,000,591 40,074,176 2,156,367 Gateway Regional High School 7038 Gloucester 39,559,613 41,764,060 2,247,299 Glassboro Bd of Ed 7016 Gloucester 75,455,810 77,694,870 4,180,713 Gloucester Co Sp Serv Sch Dist 7010 Gloucester 66,462,506 71,561,667 3,850,690 Gloucester Co Vo-Tech Sch Dist 957 Gloucester 35,661,474 39,631,543 2,132,549 Greenwich Twp Bd Ed (Gloucster) 7017 Gloucester 18,698,503 19,308,404 1,038,973 Harrison Twp Bd Ed (Gloucester) 7018 Gloucester 41,466,896 42,065,146 2,263,500 Kingsway Regional School Dist 7037 Gloucester 57,910,947 59,999,348 3,228,528 Logan Township Bd of Ed 7019 Gloucester 30,082,270 32,915,040 1,771,138 Mantua Township Bd of Ed 7021 Gloucester 42,262,364 44,827,767 2,412,155 Monroe Twp Bd of Ed (Gloucestr) 7022 Gloucester 161,579,903 176,359,592 9,489,802 National Park Board of Educ 7023 Gloucester 8,703,255 9,245,980 497,521 Paulsboro Boro Bd of Ed 7025 Gloucester 48,472,777 50,441,713 2,714,238 Pitman Bd of Ed 7026 Gloucester 57,563,856 58,357,528 3,140,183 South Harrison Twp Bd of Ed 7027 Gloucester 8,632,791 9,799,209 527,289 Swedesboro Woolwich Bd of Ed 7028 Gloucester 42,210,628 46,323,637 2,492,647 Washington Twp Bd of Ed (Glouc) 7029 Gloucester 291,372,670 298,420,346 16,057,816 Wenonah Borough Bd of Ed 7031 Gloucester 7,088,518 7,519,861 404,639 West Deptford Twp Bd of Ed 7032 Gloucester 89,704,559 95,430,026 5,135,031 Westville Board of Ed 7033 Gloucester 13,419,882 14,080,096 757,641 Woodbury City Bd of Ed 7000 Gloucester 54,395,326 56,926,959 3,063,205 Woodbury Heights Board of Ed 7034 Gloucester 7,618,675 7,999,737 430,461 Bayonne Board of Ed 8010 Hudson 298,591,035 311,485,455 16,760,842 Dr Lena Edwards Acad Chrtr Schl 8096 Hudson — 295,802 15,917 East Newark Borough Bd of Ed 8081 Hudson 5,079,168 5,461,704 293,891 Elysian Charter Sch of Hoboken 8085 Hudson 9,988,537 9,798,202 527,235 Ethical Comm Chrtr Schl - J.C. 8093 Hudson 1,840,096 2,409,571 129,658 Guttenberg Boro Bd of Ed 8082 Hudson 23,163,552 24,744,440 1,331,483 Harrison Town Bd of Ed (Hudson) 8083 Hudson 78,860,546 86,097,230 4,632,839 Hoboken Board of Education 8020 Hudson 97,995,176 98,319,221 5,290,497 Hoboken Charter School 8021 Hudson 8,781,991 9,060,396 487,534 Hoboken Dual Language Ch School 8094 Hudson 1,260,077 1,877,229 101,013 Hudson Co Schools of Technology 956 Hudson 96,374,040 103,057,840 5,545,479 Jersey City Comm Charter School 8088 Hudson 11,060,710 12,188,901 655,877 Jersey City Golden Door Charter 8089 Hudson 12,514,075 12,752,824 686,222 Jersey City Public Schools 8000 Hudson 1,290,532,253 1,376,059,305 74,044,910 Kearny Town Bd of Ed 8030 Hudson 196,772,632 202,685,459 10,906,381 Learning Comm. Charter School 8086 Hudson 10,407,340 12,906,073 694,468 Liberty Academy Charter School 8022 Hudson 7,009,471 7,172,221 385,933 Mets Charter School 8095 Hudson — 6,620,502 356,245 North Bergen Bd of Ed 8040 Hudson 266,185,254 288,185,424 15,507,081 Schomburg Charter School 8092 Hudson 6,386,065 6,499,590 349,739 Secaucus Town Bd of Ed 8084 Hudson 76,465,713 76,735,244 4,129,077 Soaring Heights Charter School 8087 Hudson 5,211,512 5,779,021 310,966 Union City Bd of Ed 8050 Hudson 361,113,655 356,452,253 19,180,478 University Academy Charter Hs 8091 Hudson 11,605,693 12,548,368 675,220 Weehawken Twp Bd of Ed 8060 Hudson 46,867,404 48,308,189 2,599,434 West New York Bd of Ed 8070 Hudson 274,446,843 300,000,892 16,142,865
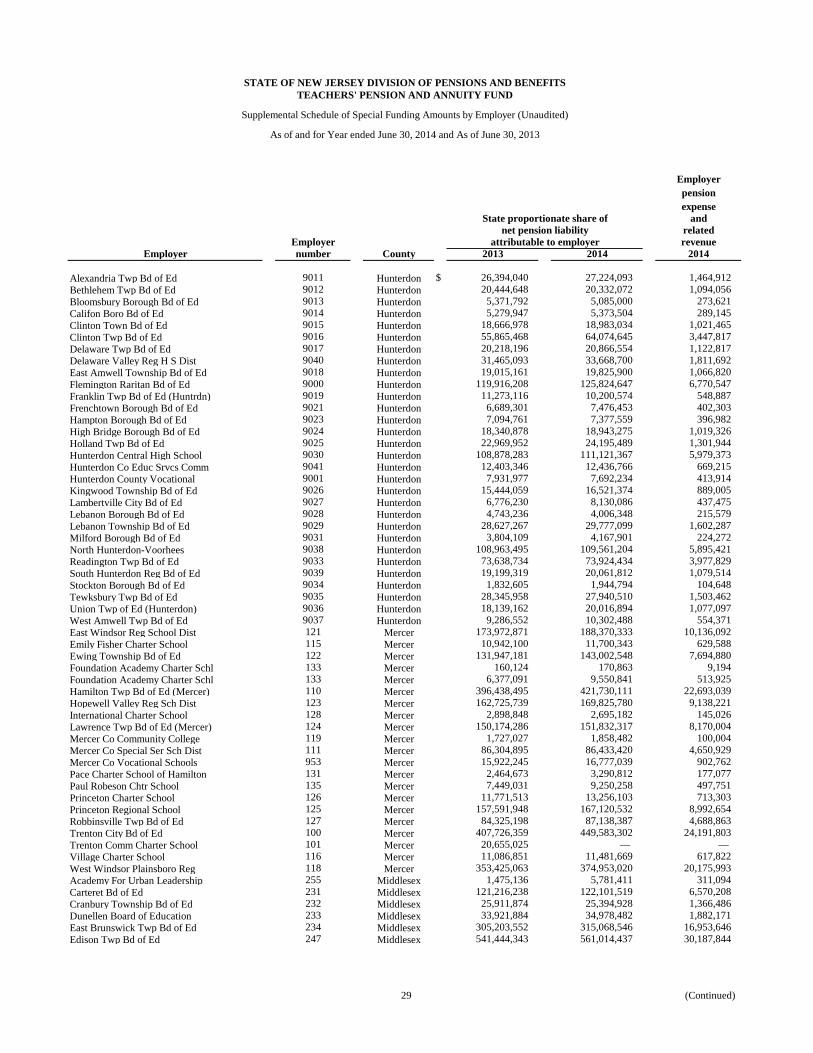
(Continued) 29
STATE OF NEW JERSEY DIVISION OF PENSIONS AND BENEFITSTEACHERS' PENSION AND ANNUITY FUND
Supplemental Schedule of Special Funding Amounts by Employer (Unaudited)
As of and for Year ended June 30, 2014 and As of June 30, 2013
Employerpensionexpense
andrelated
Employer revenueEmployer number County 2013 2014 2014
State proportionate share ofnet pension liability
attributable to employer
Alexandria Twp Bd of Ed 9011 Hunterdon $ 26,394,040 27,224,093 1,464,912 Bethlehem Twp Bd of Ed 9012 Hunterdon 20,444,648 20,332,072 1,094,056 Bloomsbury Borough Bd of Ed 9013 Hunterdon 5,371,792 5,085,000 273,621 Califon Boro Bd of Ed 9014 Hunterdon 5,279,947 5,373,504 289,145 Clinton Town Bd of Ed 9015 Hunterdon 18,666,978 18,983,034 1,021,465 Clinton Twp Bd of Ed 9016 Hunterdon 55,865,468 64,074,645 3,447,817 Delaware Twp Bd of Ed 9017 Hunterdon 20,218,196 20,866,554 1,122,817 Delaware Valley Reg H S Dist 9040 Hunterdon 31,465,093 33,668,700 1,811,692 East Amwell Township Bd of Ed 9018 Hunterdon 19,015,161 19,825,900 1,066,820 Flemington Raritan Bd of Ed 9000 Hunterdon 119,916,208 125,824,647 6,770,547 Franklin Twp Bd of Ed (Huntrdn) 9019 Hunterdon 11,273,116 10,200,574 548,887 Frenchtown Borough Bd of Ed 9021 Hunterdon 6,689,301 7,476,453 402,303 Hampton Borough Bd of Ed 9023 Hunterdon 7,094,761 7,377,559 396,982 High Bridge Borough Bd of Ed 9024 Hunterdon 18,340,878 18,943,275 1,019,326 Holland Twp Bd of Ed 9025 Hunterdon 22,969,952 24,195,489 1,301,944 Hunterdon Central High School 9030 Hunterdon 108,878,283 111,121,367 5,979,373 Hunterdon Co Educ Srvcs Comm 9041 Hunterdon 12,403,346 12,436,766 669,215 Hunterdon County Vocational 9001 Hunterdon 7,931,977 7,692,234 413,914 Kingwood Township Bd of Ed 9026 Hunterdon 15,444,059 16,521,374 889,005 Lambertville City Bd of Ed 9027 Hunterdon 6,776,230 8,130,086 437,475 Lebanon Borough Bd of Ed 9028 Hunterdon 4,743,236 4,006,348 215,579 Lebanon Township Bd of Ed 9029 Hunterdon 28,627,267 29,777,099 1,602,287 Milford Borough Bd of Ed 9031 Hunterdon 3,804,109 4,167,901 224,272 North Hunterdon-Voorhees 9038 Hunterdon 108,963,495 109,561,204 5,895,421 Readington Twp Bd of Ed 9033 Hunterdon 73,638,734 73,924,434 3,977,829 South Hunterdon Reg Bd of Ed 9039 Hunterdon 19,199,319 20,061,812 1,079,514 Stockton Borough Bd of Ed 9034 Hunterdon 1,832,605 1,944,794 104,648 Tewksbury Twp Bd of Ed 9035 Hunterdon 28,345,958 27,940,510 1,503,462 Union Twp of Ed (Hunterdon) 9036 Hunterdon 18,139,162 20,016,894 1,077,097 West Amwell Twp Bd of Ed 9037 Hunterdon 9,286,552 10,302,488 554,371 East Windsor Reg School Dist 121 Mercer 173,972,871 188,370,333 10,136,092 Emily Fisher Charter School 115 Mercer 10,942,100 11,700,343 629,588 Ewing Township Bd of Ed 122 Mercer 131,947,181 143,002,548 7,694,880 Foundation Academy Charter Schl 133 Mercer 160,124 170,863 9,194 Foundation Academy Charter Schl 133 Mercer 6,377,091 9,550,841 513,925 Hamilton Twp Bd of Ed (Mercer) 110 Mercer 396,438,495 421,730,111 22,693,039 Hopewell Valley Reg Sch Dist 123 Mercer 162,725,739 169,825,780 9,138,221 International Charter School 128 Mercer 2,898,848 2,695,182 145,026 Lawrence Twp Bd of Ed (Mercer) 124 Mercer 150,174,286 151,832,317 8,170,004 Mercer Co Community College 119 Mercer 1,727,027 1,858,482 100,004 Mercer Co Special Ser Sch Dist 111 Mercer 86,304,895 86,433,420 4,650,929 Mercer Co Vocational Schools 953 Mercer 15,922,245 16,777,039 902,762 Pace Charter School of Hamilton 131 Mercer 2,464,673 3,290,812 177,077 Paul Robeson Chtr School 135 Mercer 7,449,031 9,250,258 497,751 Princeton Charter School 126 Mercer 11,771,513 13,256,103 713,303 Princeton Regional School 125 Mercer 157,591,948 167,120,532 8,992,654 Robbinsville Twp Bd of Ed 127 Mercer 84,325,198 87,138,387 4,688,863 Trenton City Bd of Ed 100 Mercer 407,726,359 449,583,302 24,191,803 Trenton Comm Charter School 101 Mercer 20,655,025 — — Village Charter School 116 Mercer 11,086,851 11,481,669 617,822 West Windsor Plainsboro Reg 118 Mercer 353,425,063 374,953,020 20,175,993 Academy For Urban Leadership 255 Middlesex 1,475,136 5,781,411 311,094 Carteret Bd of Ed 231 Middlesex 121,216,238 122,101,519 6,570,208 Cranbury Township Bd of Ed 232 Middlesex 25,911,874 25,394,928 1,366,486 Dunellen Board of Education 233 Middlesex 33,921,884 34,978,482 1,882,171 East Brunswick Twp Bd of Ed 234 Middlesex 305,203,552 315,068,546 16,953,646 Edison Twp Bd of Ed 247 Middlesex 541,444,343 561,014,437 30,187,844
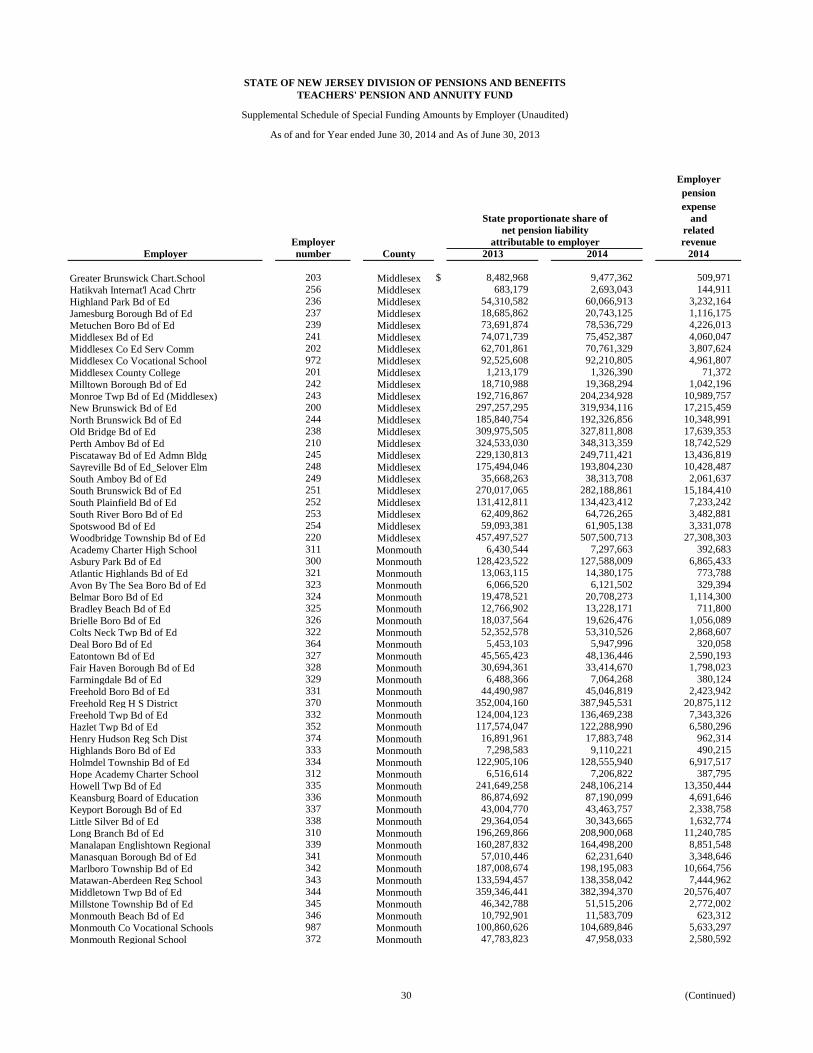
(Continued) 30
STATE OF NEW JERSEY DIVISION OF PENSIONS AND BENEFITSTEACHERS' PENSION AND ANNUITY FUND
Supplemental Schedule of Special Funding Amounts by Employer (Unaudited)
As of and for Year ended June 30, 2014 and As of June 30, 2013
Employerpensionexpense
andrelated
Employer revenueEmployer number County 2013 2014 2014
State proportionate share ofnet pension liability
attributable to employer
Greater Brunswick Chart.School 203 Middlesex $ 8,482,968 9,477,362 509,971 Hatikvah Internat'l Acad Chrtr 256 Middlesex 683,179 2,693,043 144,911 Highland Park Bd of Ed 236 Middlesex 54,310,582 60,066,913 3,232,164 Jamesburg Borough Bd of Ed 237 Middlesex 18,685,862 20,743,125 1,116,175 Metuchen Boro Bd of Ed 239 Middlesex 73,691,874 78,536,729 4,226,013 Middlesex Bd of Ed 241 Middlesex 74,071,739 75,452,387 4,060,047 Middlesex Co Ed Serv Comm 202 Middlesex 62,701,861 70,761,329 3,807,624 Middlesex Co Vocational School 972 Middlesex 92,525,608 92,210,805 4,961,807 Middlesex County College 201 Middlesex 1,213,179 1,326,390 71,372 Milltown Borough Bd of Ed 242 Middlesex 18,710,988 19,368,294 1,042,196 Monroe Twp Bd of Ed (Middlesex) 243 Middlesex 192,716,867 204,234,928 10,989,757 New Brunswick Bd of Ed 200 Middlesex 297,257,295 319,934,116 17,215,459 North Brunswick Bd of Ed 244 Middlesex 185,840,754 192,326,856 10,348,991 Old Bridge Bd of Ed 238 Middlesex 309,975,505 327,811,808 17,639,353 Perth Amboy Bd of Ed 210 Middlesex 324,533,030 348,313,359 18,742,529 Piscataway Bd of Ed Admn Bldg 245 Middlesex 229,130,813 249,711,421 13,436,819 Sayreville Bd of Ed_Selover Elm 248 Middlesex 175,494,046 193,804,230 10,428,487 South Amboy Bd of Ed 249 Middlesex 35,668,263 38,313,708 2,061,637 South Brunswick Bd of Ed 251 Middlesex 270,017,065 282,188,861 15,184,410 South Plainfield Bd of Ed 252 Middlesex 131,412,811 134,423,412 7,233,242 South River Boro Bd of Ed 253 Middlesex 62,409,862 64,726,265 3,482,881 Spotswood Bd of Ed 254 Middlesex 59,093,381 61,905,138 3,331,078 Woodbridge Township Bd of Ed 220 Middlesex 457,497,527 507,500,713 27,308,303 Academy Charter High School 311 Monmouth 6,430,544 7,297,663 392,683 Asbury Park Bd of Ed 300 Monmouth 128,423,522 127,588,009 6,865,433 Atlantic Highlands Bd of Ed 321 Monmouth 13,063,115 14,380,175 773,788 Avon By The Sea Boro Bd of Ed 323 Monmouth 6,066,520 6,121,502 329,394 Belmar Boro Bd of Ed 324 Monmouth 19,478,521 20,708,273 1,114,300 Bradley Beach Bd of Ed 325 Monmouth 12,766,902 13,228,171 711,800 Brielle Boro Bd of Ed 326 Monmouth 18,037,564 19,626,476 1,056,089 Colts Neck Twp Bd of Ed 322 Monmouth 52,352,578 53,310,526 2,868,607 Deal Boro Bd of Ed 364 Monmouth 5,453,103 5,947,996 320,058 Eatontown Bd of Ed 327 Monmouth 45,565,423 48,136,446 2,590,193 Fair Haven Borough Bd of Ed 328 Monmouth 30,694,361 33,414,670 1,798,023 Farmingdale Bd of Ed 329 Monmouth 6,488,366 7,064,268 380,124 Freehold Boro Bd of Ed 331 Monmouth 44,490,987 45,046,819 2,423,942 Freehold Reg H S District 370 Monmouth 352,004,160 387,945,531 20,875,112 Freehold Twp Bd of Ed 332 Monmouth 124,004,123 136,469,238 7,343,326 Hazlet Twp Bd of Ed 352 Monmouth 117,574,047 122,288,990 6,580,296 Henry Hudson Reg Sch Dist 374 Monmouth 16,891,961 17,883,748 962,314 Highlands Boro Bd of Ed 333 Monmouth 7,298,583 9,110,221 490,215 Holmdel Township Bd of Ed 334 Monmouth 122,905,106 128,555,940 6,917,517 Hope Academy Charter School 312 Monmouth 6,516,614 7,206,822 387,795 Howell Twp Bd of Ed 335 Monmouth 241,649,258 248,106,214 13,350,444 Keansburg Board of Education 336 Monmouth 86,874,692 87,190,099 4,691,646 Keyport Borough Bd of Ed 337 Monmouth 43,004,770 43,463,757 2,338,758 Little Silver Bd of Ed 338 Monmouth 29,364,054 30,343,665 1,632,774 Long Branch Bd of Ed 310 Monmouth 196,269,866 208,900,068 11,240,785 Manalapan Englishtown Regional 339 Monmouth 160,287,832 164,498,200 8,851,548 Manasquan Borough Bd of Ed 341 Monmouth 57,010,446 62,231,640 3,348,646 Marlboro Township Bd of Ed 342 Monmouth 187,008,674 198,195,083 10,664,756 Matawan-Aberdeen Reg School 343 Monmouth 133,594,457 138,358,042 7,444,962 Middletown Twp Bd of Ed 344 Monmouth 359,346,441 382,394,370 20,576,407 Millstone Township Bd of Ed 345 Monmouth 46,342,788 51,515,206 2,772,002 Monmouth Beach Bd of Ed 346 Monmouth 10,792,901 11,583,709 623,312 Monmouth Co Vocational Schools 987 Monmouth 100,860,626 104,689,846 5,633,297 Monmouth Regional School 372 Monmouth 47,783,823 47,958,033 2,580,592

(Continued) 31
STATE OF NEW JERSEY DIVISION OF PENSIONS AND BENEFITSTEACHERS' PENSION AND ANNUITY FUND
Supplemental Schedule of Special Funding Amounts by Employer (Unaudited)
As of and for Year ended June 30, 2014 and As of June 30, 2013
Employerpensionexpense
andrelated
Employer revenueEmployer number County 2013 2014 2014
State proportionate share ofnet pension liability
attributable to employer
Neptune City Bd of Ed 347 Monmouth $ 10,909,795 10,556,769 568,053 Neptune Twp Bd of Ed 348 Monmouth 145,468,662 161,328,300 8,680,977 Ocean Twp Bd of Ed (Monmouth) 351 Monmouth 154,418,423 160,666,363 8,645,359 Oceanport Schools 349 Monmouth 22,240,031 23,742,413 1,277,565 Red Bank Bd of Ed 353 Monmouth 32,546,084 33,651,085 1,810,744 Red Bank Charter School 360 Monmouth 5,739,250 6,307,841 339,421 Red Bank Regional High School 301 Monmouth 52,088,826 51,271,493 2,758,888 Roosevelt Borough Bd of Ed 369 Monmouth 3,873,090 4,268,556 229,688 Rumson Boro Bd of Ed 354 Monmouth 29,343,376 34,218,909 1,841,299 Rumson Fair Haven Regional H.S. 371 Monmouth 37,044,765 39,840,781 2,143,808 Sea Girt Bd of Ed 366 Monmouth 8,328,385 8,670,355 466,547 Shore Regional H S District 373 Monmouth 26,942,066 26,851,919 1,444,885 Shrewsbury Borough Bd of Ed 356 Monmouth 17,103,899 17,427,526 937,765 Spring Lake Boro Bd of Ed 358 Monmouth 12,207,405 11,737,963 631,613 Spring Lake Heights Bd of Ed 368 Monmouth 10,840,189 11,030,983 593,570 Tinton Falls Board of Education 357 Monmouth 52,945,395 57,949,872 3,118,247 Union Beach Boro Bd of Ed 359 Monmouth 23,038,075 23,892,390 1,285,635 Upper Freehold Regional 361 Monmouth 79,988,513 83,007,855 4,466,602 Wall Township Bd of Ed 362 Monmouth 137,997,158 141,063,164 7,590,523 West Long Branch Bd of Ed 363 Monmouth 20,794,392 20,326,536 1,093,758 Boonton Town Bd of Ed 411 Morris 55,602,809 57,675,711 3,103,495 Boonton Twp Bd of Ed 412 Morris 17,816,652 18,489,067 994,885 Butler Boro Bd of Ed 413 Morris 47,022,768 47,593,911 2,560,999 Chathams School District 455 Morris 133,033,790 142,195,918 7,651,475 Chester Twp Bd of Ed 416 Morris 46,228,470 46,465,184 2,500,263 Denville Twp Bd of Ed 417 Morris 62,179,743 59,831,379 3,219,490 Dover Bd of Ed 418 Morris 101,666,551 104,892,290 5,644,190 East Hanover Twp Bd of Ed 448 Morris 41,792,527 45,634,900 2,455,586 Florham Park Bd of Ed 419 Morris 36,781,872 39,091,399 2,103,484 Hanover Park Reg H S Dist 420 Morris 61,585,599 64,509,730 3,471,229 Hanover Township Bd of Ed 421 Morris 56,224,186 57,876,394 3,114,293 Harding Township Bd of Ed 422 Morris 14,080,042 13,795,743 742,341 Jefferson Township Bd of Ed 423 Morris 121,515,338 130,500,859 7,022,171 Kinnelon Borough Bd of Ed 424 Morris 82,272,461 84,305,810 4,536,444 Lincoln Park Boro Bd of Ed 425 Morris 29,144,469 30,302,773 1,630,574 Long Hill Twp Bd of Ed 438 Morris 33,336,637 35,790,018 1,925,839 Madison Boro Bd of Ed 426 Morris 93,623,142 98,219,321 5,285,122 Mendham Boro Bd of Ed 427 Morris 23,023,638 23,937,056 1,288,038 Mendham Township Bd of Ed 428 Morris 34,896,907 34,764,714 1,870,668 Mine Hill Twp Bd of Ed 429 Morris 10,054,085 11,338,109 610,097 Montville Twp Bd of Ed 431 Morris 157,248,212 167,054,854 8,989,120 Morris Co Educ Services Comm 453 Morris 22,104,254 20,627,497 1,109,953 Morris Co Vocational Sch Dist 955 Morris 35,338,729 37,662,969 2,026,621 Morris Hills Regional District 450 Morris 128,811,268 137,215,600 7,383,488 Morris Plains Bd of Ed 432 Morris 20,002,279 19,801,491 1,065,506 Morris School District 440 Morris 206,528,007 213,296,708 11,477,365 Mount Arlington Bd of Ed 435 Morris 15,219,245 16,120,890 867,455 Mount Olive Twp Bd of Ed 436 Morris 159,827,281 163,003,589 8,771,123 Mountain Lakes Boro Bd of Ed 434 Morris 89,429,337 90,927,571 4,892,757 Netcong Borough Bd of Ed 437 Morris 10,981,117 11,709,025 630,055 Parsippany Troy Hills Bd of Ed 449 Morris 297,351,013 299,251,510 16,102,541 Pequannock Twp Bd of Ed 439 Morris 82,699,146 91,476,648 4,922,302 Randolph Township Bd of Ed 441 Morris 179,667,953 190,906,353 10,272,554 Riverdale Borough Bd of Ed 442 Morris 11,605,771 11,971,862 644,199 Rockaway Borough Bd of Ed 443 Morris 16,239,371 17,367,888 934,555 Rockaway Township Bd of Ed 444 Morris 104,608,863 100,475,266 5,406,513 Roxbury Twp Bd of Ed 445 Morris 143,741,948 150,887,663 8,119,173
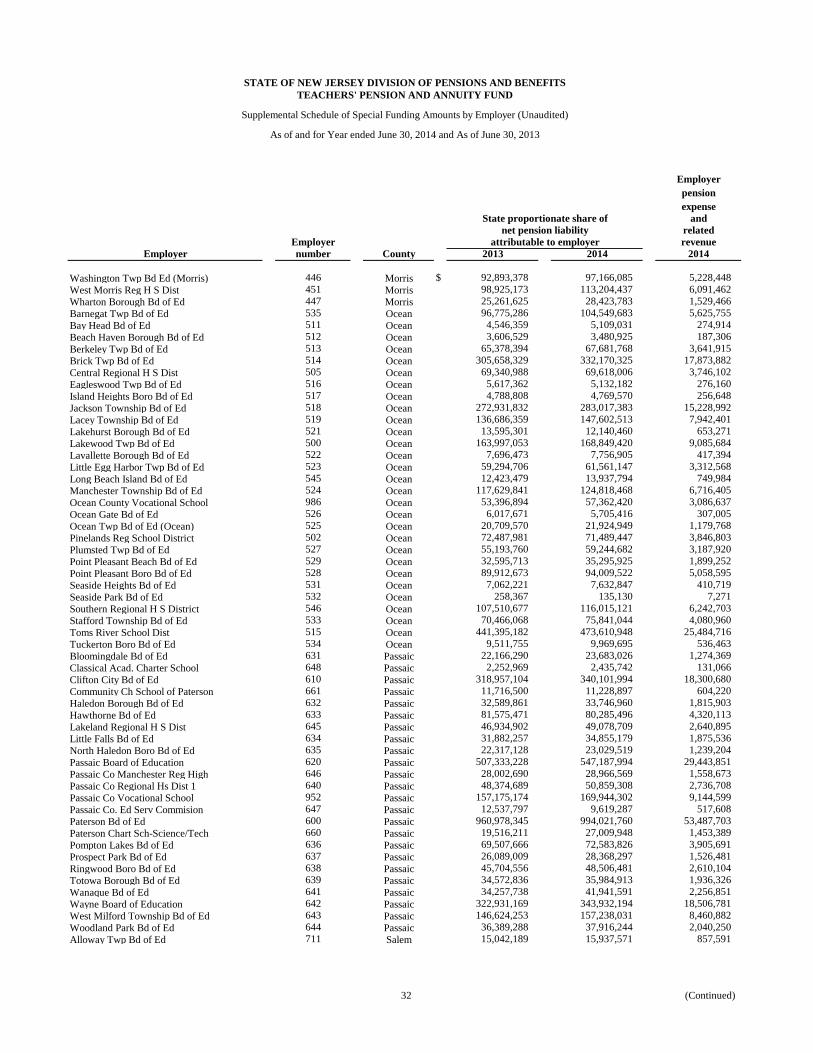
(Continued) 32
STATE OF NEW JERSEY DIVISION OF PENSIONS AND BENEFITSTEACHERS' PENSION AND ANNUITY FUND
Supplemental Schedule of Special Funding Amounts by Employer (Unaudited)
As of and for Year ended June 30, 2014 and As of June 30, 2013
Employerpensionexpense
andrelated
Employer revenueEmployer number County 2013 2014 2014
State proportionate share ofnet pension liability
attributable to employer
Washington Twp Bd Ed (Morris) 446 Morris $ 92,893,378 97,166,085 5,228,448 West Morris Reg H S Dist 451 Morris 98,925,173 113,204,437 6,091,462 Wharton Borough Bd of Ed 447 Morris 25,261,625 28,423,783 1,529,466 Barnegat Twp Bd of Ed 535 Ocean 96,775,286 104,549,683 5,625,755 Bay Head Bd of Ed 511 Ocean 4,546,359 5,109,031 274,914 Beach Haven Borough Bd of Ed 512 Ocean 3,606,529 3,480,925 187,306 Berkeley Twp Bd of Ed 513 Ocean 65,378,394 67,681,768 3,641,915 Brick Twp Bd of Ed 514 Ocean 305,658,329 332,170,325 17,873,882 Central Regional H S Dist 505 Ocean 69,340,988 69,618,006 3,746,102 Eagleswood Twp Bd of Ed 516 Ocean 5,617,362 5,132,182 276,160 Island Heights Boro Bd of Ed 517 Ocean 4,788,808 4,769,570 256,648 Jackson Township Bd of Ed 518 Ocean 272,931,832 283,017,383 15,228,992 Lacey Township Bd of Ed 519 Ocean 136,686,359 147,602,513 7,942,401 Lakehurst Borough Bd of Ed 521 Ocean 13,595,301 12,140,460 653,271 Lakewood Twp Bd of Ed 500 Ocean 163,997,053 168,849,420 9,085,684 Lavallette Borough Bd of Ed 522 Ocean 7,696,473 7,756,905 417,394 Little Egg Harbor Twp Bd of Ed 523 Ocean 59,294,706 61,561,147 3,312,568 Long Beach Island Bd of Ed 545 Ocean 12,423,479 13,937,794 749,984 Manchester Township Bd of Ed 524 Ocean 117,629,841 124,818,468 6,716,405 Ocean County Vocational School 986 Ocean 53,396,894 57,362,420 3,086,637 Ocean Gate Bd of Ed 526 Ocean 6,017,671 5,705,416 307,005 Ocean Twp Bd of Ed (Ocean) 525 Ocean 20,709,570 21,924,949 1,179,768 Pinelands Reg School District 502 Ocean 72,487,981 71,489,447 3,846,803 Plumsted Twp Bd of Ed 527 Ocean 55,193,760 59,244,682 3,187,920 Point Pleasant Beach Bd of Ed 529 Ocean 32,595,713 35,295,925 1,899,252 Point Pleasant Boro Bd of Ed 528 Ocean 89,912,673 94,009,522 5,058,595 Seaside Heights Bd of Ed 531 Ocean 7,062,221 7,632,847 410,719 Seaside Park Bd of Ed 532 Ocean 258,367 135,130 7,271 Southern Regional H S District 546 Ocean 107,510,677 116,015,121 6,242,703 Stafford Township Bd of Ed 533 Ocean 70,466,068 75,841,044 4,080,960 Toms River School Dist 515 Ocean 441,395,182 473,610,948 25,484,716 Tuckerton Boro Bd of Ed 534 Ocean 9,511,755 9,969,695 536,463 Bloomingdale Bd of Ed 631 Passaic 22,166,290 23,683,026 1,274,369 Classical Acad. Charter School 648 Passaic 2,252,969 2,435,742 131,066 Clifton City Bd of Ed 610 Passaic 318,957,104 340,101,994 18,300,680 Community Ch School of Paterson 661 Passaic 11,716,500 11,228,897 604,220 Haledon Borough Bd of Ed 632 Passaic 32,589,861 33,746,960 1,815,903 Hawthorne Bd of Ed 633 Passaic 81,575,471 80,285,496 4,320,113 Lakeland Regional H S Dist 645 Passaic 46,934,902 49,078,709 2,640,895 Little Falls Bd of Ed 634 Passaic 31,882,257 34,855,179 1,875,536 North Haledon Boro Bd of Ed 635 Passaic 22,317,128 23,029,519 1,239,204 Passaic Board of Education 620 Passaic 507,333,228 547,187,994 29,443,851 Passaic Co Manchester Reg High 646 Passaic 28,002,690 28,966,569 1,558,673 Passaic Co Regional Hs Dist 1 640 Passaic 48,374,689 50,859,308 2,736,708 Passaic Co Vocational School 952 Passaic 157,175,174 169,944,302 9,144,599 Passaic Co. Ed Serv Commision 647 Passaic 12,537,797 9,619,287 517,608 Paterson Bd of Ed 600 Passaic 960,978,345 994,021,760 53,487,703 Paterson Chart Sch-Science/Tech 660 Passaic 19,516,211 27,009,948 1,453,389 Pompton Lakes Bd of Ed 636 Passaic 69,507,666 72,583,826 3,905,691 Prospect Park Bd of Ed 637 Passaic 26,089,009 28,368,297 1,526,481 Ringwood Boro Bd of Ed 638 Passaic 45,704,556 48,506,481 2,610,104 Totowa Borough Bd of Ed 639 Passaic 34,572,836 35,984,913 1,936,326 Wanaque Bd of Ed 641 Passaic 34,257,738 41,941,591 2,256,851 Wayne Board of Education 642 Passaic 322,931,169 343,932,194 18,506,781 West Milford Township Bd of Ed 643 Passaic 146,624,253 157,238,031 8,460,882 Woodland Park Bd of Ed 644 Passaic 36,389,288 37,916,244 2,040,250 Alloway Twp Bd of Ed 711 Salem 15,042,189 15,937,571 857,591

(Continued) 33
STATE OF NEW JERSEY DIVISION OF PENSIONS AND BENEFITSTEACHERS' PENSION AND ANNUITY FUND
Supplemental Schedule of Special Funding Amounts by Employer (Unaudited)
As of and for Year ended June 30, 2014 and As of June 30, 2013
Employerpensionexpense
andrelated
Employer revenueEmployer number County 2013 2014 2014
State proportionate share ofnet pension liability
attributable to employer
Elsinboro Township Bd of Ed 713 Salem $ 4,117,256 4,400,793 236,804 Lower Alloways Creek Bd of Ed 714 Salem 7,991,828 7,820,066 420,793 Mannington Township Bd of Ed 716 Salem 5,905,382 6,316,522 339,888 Oldmans Twp Bd of Ed 717 Salem 7,413,526 8,085,168 435,058 Penns Grove Carneys Point Reg 725 Salem 84,422,895 87,929,793 4,731,448 Pennsville Twp Bd of Ed 715 Salem 64,101,774 69,023,508 3,714,113 Pittsgrove Twp Bd of Ed 721 Salem 57,194,838 59,242,417 3,187,798 Quinton Township Bd of Ed 722 Salem 11,285,602 11,720,097 630,651 Salem City Bd of Ed 700 Salem 56,554,811 56,769,558 3,054,735 Salem Co Sp Services Sch Dist 726 Salem 26,132,864 27,947,304 1,503,827 Salem Co Vocational Tech School 984 Salem 16,096,024 16,711,990 899,262 Upper Pittsgrove Twp Bd of Ed 724 Salem 10,848,929 11,474,875 617,456 Woodstown-Pilesgrove Reg Sch 719 Salem 51,891,559 55,651,903 2,994,595 Bedminster Twp Bd of Ed 741 Somerset 25,434,780 26,521,894 1,427,127 Bernards Twp Bd of Ed 742 Somerset 183,216,504 201,307,735 10,832,246 Bound Brook Boro Bd of Ed 743 Somerset 45,070,382 50,202,781 2,701,381 Branchburg Twp Bd of Ed 744 Somerset 67,647,203 69,453,811 3,737,267 Bridgewater-Raritan Reg Sch Dis 745 Somerset 334,216,458 343,146,199 18,464,487 Central Jersey Coll Prep Chrtr 769 Somerset 7,366,550 8,695,268 467,887 Franklin Twp Bd of Ed (Somerst) 748 Somerset 276,254,711 279,830,750 15,057,522 Green Brook Bd of Ed 753 Somerset 31,284,759 31,611,801 1,701,012 Hillsborough Twp Bd of Ed 749 Somerset 270,641,017 289,462,619 15,575,807 Manville Borough Bd of Ed 759 Somerset 40,336,587 43,248,605 2,327,181 Montgomery Twp Bd of Ed 751 Somerset 165,289,592 176,699,179 9,508,075 North Plainfield Bd of Ed 752 Somerset 119,196,353 124,787,516 6,714,740 Somerset Co Ed Ctnl Srvc Comm 764 Somerset 18,731,823 14,100,227 758,725 Somerset Co Vocational School 990 Somerset 26,864,501 28,568,979 1,537,279 Somerset Hills Bd of Ed 761 Somerset 82,318,423 81,771,552 4,400,077 Somerville Bd of Ed 730 Somerset 86,722,216 91,051,251 4,899,412 South Bound Brook Bd of Ed 756 Somerset 16,852,242 16,785,217 903,202 Warren Township Bd of Ed 757 Somerset 96,366,003 96,902,996 5,214,291 Watchung Borough Bd of Ed 758 Somerset 23,207,562 24,922,223 1,341,050 Watchung Hills Regional H S 762 Somerset 80,663,187 83,009,491 4,466,690 Andover Regional Bd of Ed 772 Sussex 25,473,719 25,290,246 1,360,853 Byram Twp Bd of Ed 774 Sussex 32,714,792 33,354,780 1,794,800 Frankford Township Bd of Ed 775 Sussex 28,073,544 29,418,262 1,582,979 Franklin Boro Bd of Ed 776 Sussex 20,142,036 20,955,257 1,127,590 Fredon Township Bd of Ed 777 Sussex 10,770,506 10,026,439 539,517 Green Township Bd of Ed 778 Sussex 16,464,262 16,754,517 901,550 Hamburg Borough Bd of Ed 779 Sussex 11,537,804 12,247,659 659,039 Hampton Township Bd of Ed 781 Sussex 16,110,382 16,447,266 885,017 Hardyston Township Bd of Ed 782 Sussex 24,742,472 24,700,152 1,329,100 High Point Reg High School 780 Sussex 52,040,134 51,371,394 2,764,263 Hopatcong Board of Education 783 Sussex 79,734,594 82,640,839 4,446,853 Kittatinny Regional H S 795 Sussex 48,498,294 51,208,583 2,755,503 Lafayette Board of Education 784 Sussex 9,600,635 10,952,597 589,353 Lenape Valley Reg H S Dist 790 Sussex 33,173,860 36,117,275 1,943,449 Montague Bd of Ed 785 Sussex 12,956,210 13,506,987 726,803 Newton Bd of Ed 786 Sussex 56,731,634 61,375,185 3,302,561 Ogdensburg Bd of Ed 787 Sussex 10,907,454 10,928,188 588,039 Sandyston Walpack School Dist 788 Sussex 6,020,949 5,820,038 313,173 Sparta Bd of Ed 789 Sussex 116,166,254 142,481,277 7,666,830 Stanhope Borough Bd of Ed 791 Sussex 9,758,730 10,834,956 583,022 Stillwater Township Bd of Ed 792 Sussex 16,803,237 17,061,266 918,056 Sussex Co Ed Serv Comm Bd of Ed 771 Sussex 3,720,224 5,249,823 282,490 Sussex County Charter School 793 Sussex 333,981 135,382 7,285 Sussex County Charter School 793 Sussex 5,635,778 6,518,588 350,761
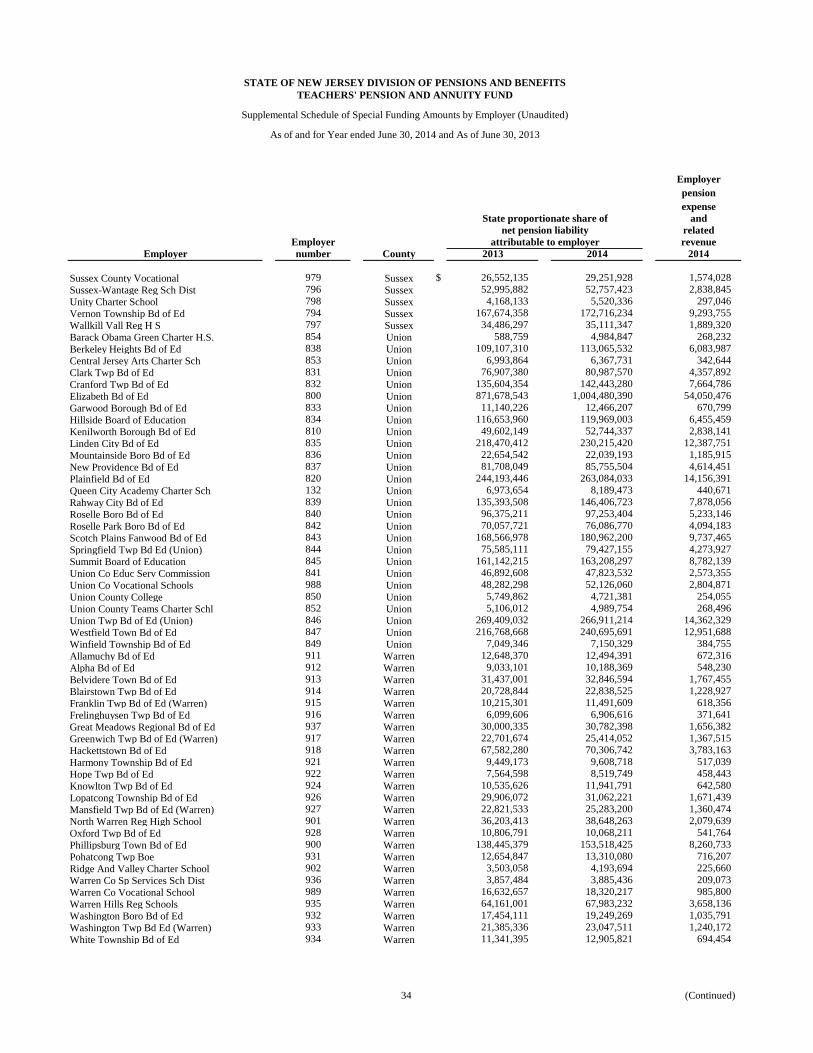
(Continued) 34
STATE OF NEW JERSEY DIVISION OF PENSIONS AND BENEFITSTEACHERS' PENSION AND ANNUITY FUND
Supplemental Schedule of Special Funding Amounts by Employer (Unaudited)
As of and for Year ended June 30, 2014 and As of June 30, 2013
Employerpensionexpense
andrelated
Employer revenueEmployer number County 2013 2014 2014
State proportionate share ofnet pension liability
attributable to employer
Sussex County Vocational 979 Sussex $ 26,552,135 29,251,928 1,574,028 Sussex-Wantage Reg Sch Dist 796 Sussex 52,995,882 52,757,423 2,838,845 Unity Charter School 798 Sussex 4,168,133 5,520,336 297,046 Vernon Township Bd of Ed 794 Sussex 167,674,358 172,716,234 9,293,755 Wallkill Vall Reg H S 797 Sussex 34,486,297 35,111,347 1,889,320 Barack Obama Green Charter H.S. 854 Union 588,759 4,984,847 268,232 Berkeley Heights Bd of Ed 838 Union 109,107,310 113,065,532 6,083,987 Central Jersey Arts Charter Sch 853 Union 6,993,864 6,367,731 342,644 Clark Twp Bd of Ed 831 Union 76,907,380 80,987,570 4,357,892 Cranford Twp Bd of Ed 832 Union 135,604,354 142,443,280 7,664,786 Elizabeth Bd of Ed 800 Union 871,678,543 1,004,480,390 54,050,476 Garwood Borough Bd of Ed 833 Union 11,140,226 12,466,207 670,799 Hillside Board of Education 834 Union 116,653,960 119,969,003 6,455,459 Kenilworth Borough Bd of Ed 810 Union 49,602,149 52,744,337 2,838,141 Linden City Bd of Ed 835 Union 218,470,412 230,215,420 12,387,751 Mountainside Boro Bd of Ed 836 Union 22,654,542 22,039,193 1,185,915 New Providence Bd of Ed 837 Union 81,708,049 85,755,504 4,614,451 Plainfield Bd of Ed 820 Union 244,193,446 263,084,033 14,156,391 Queen City Academy Charter Sch 132 Union 6,973,654 8,189,473 440,671 Rahway City Bd of Ed 839 Union 135,393,508 146,406,723 7,878,056 Roselle Boro Bd of Ed 840 Union 96,375,211 97,253,404 5,233,146 Roselle Park Boro Bd of Ed 842 Union 70,057,721 76,086,770 4,094,183 Scotch Plains Fanwood Bd of Ed 843 Union 168,566,978 180,962,200 9,737,465 Springfield Twp Bd Ed (Union) 844 Union 75,585,111 79,427,155 4,273,927 Summit Board of Education 845 Union 161,142,215 163,208,297 8,782,139 Union Co Educ Serv Commission 841 Union 46,892,608 47,823,532 2,573,355 Union Co Vocational Schools 988 Union 48,282,298 52,126,060 2,804,871 Union County College 850 Union 5,749,862 4,721,381 254,055 Union County Teams Charter Schl 852 Union 5,106,012 4,989,754 268,496 Union Twp Bd of Ed (Union) 846 Union 269,409,032 266,911,214 14,362,329 Westfield Town Bd of Ed 847 Union 216,768,668 240,695,691 12,951,688 Winfield Township Bd of Ed 849 Union 7,049,346 7,150,329 384,755 Allamuchy Bd of Ed 911 Warren 12,648,370 12,494,391 672,316 Alpha Bd of Ed 912 Warren 9,033,101 10,188,369 548,230 Belvidere Town Bd of Ed 913 Warren 31,437,001 32,846,594 1,767,455 Blairstown Twp Bd of Ed 914 Warren 20,728,844 22,838,525 1,228,927 Franklin Twp Bd of Ed (Warren) 915 Warren 10,215,301 11,491,609 618,356 Frelinghuysen Twp Bd of Ed 916 Warren 6,099,606 6,906,616 371,641 Great Meadows Regional Bd of Ed 937 Warren 30,000,335 30,782,398 1,656,382 Greenwich Twp Bd of Ed (Warren) 917 Warren 22,701,674 25,414,052 1,367,515 Hackettstown Bd of Ed 918 Warren 67,582,280 70,306,742 3,783,163 Harmony Township Bd of Ed 921 Warren 9,449,173 9,608,718 517,039 Hope Twp Bd of Ed 922 Warren 7,564,598 8,519,749 458,443 Knowlton Twp Bd of Ed 924 Warren 10,535,626 11,941,791 642,580 Lopatcong Township Bd of Ed 926 Warren 29,906,072 31,062,221 1,671,439 Mansfield Twp Bd of Ed (Warren) 927 Warren 22,821,533 25,283,200 1,360,474 North Warren Reg High School 901 Warren 36,203,413 38,648,263 2,079,639 Oxford Twp Bd of Ed 928 Warren 10,806,791 10,068,211 541,764 Phillipsburg Town Bd of Ed 900 Warren 138,445,379 153,518,425 8,260,733 Pohatcong Twp Boe 931 Warren 12,654,847 13,310,080 716,207 Ridge And Valley Charter School 902 Warren 3,503,058 4,193,694 225,660 Warren Co Sp Services Sch Dist 936 Warren 3,857,484 3,885,436 209,073 Warren Co Vocational School 989 Warren 16,632,657 18,320,217 985,800 Warren Hills Reg Schools 935 Warren 64,161,001 67,983,232 3,658,136 Washington Boro Bd of Ed 932 Warren 17,454,111 19,249,269 1,035,791 Washington Twp Bd Ed (Warren) 933 Warren 21,385,336 23,047,511 1,240,172 White Township Bd of Ed 934 Warren 11,341,395 12,905,821 694,454

35
STATE OF NEW JERSEY DIVISION OF PENSIONS AND BENEFITSTEACHERS' PENSION AND ANNUITY FUND
Supplemental Schedule of Special Funding Amounts by Employer (Unaudited)
As of and for Year ended June 30, 2014 and As of June 30, 2013
Employerpensionexpense
andrelated
Employer revenueEmployer number County 2013 2014 2014
Adelaide Sanford Charter School 6096 Multiple 3,921,393 5,683,524 305,827 Bayshore Jointure Commission 340 Multiple 4,121,625 4,093,919 220,291 Capital Prep Charter H S 134 Multiple 7,562,569 — — Monmouth Ocean Ed Serv Comm 375 Multiple 19,022,262 16,584,787 892,417 Morris-Union Jointure Comm 851 Multiple 51,446,147 52,867,012 2,844,742 Pleasantech Academy Charter Sch 1011 Multiple 14,031,739 16,146,557 868,836
Total $ 50,539,213,484 53,446,745,367 2,875,936,696
See accompanying independent auditors’ report and notes to supplemental schedules.
State proportionate share ofnet pension liability
attributable to employer
STATE OF NEW JERSEY TEACHERS’ PENSION AND ANNUITY FUND
Notes to Supplemental Schedules (Unaudited)
June 30, 2014 and 2013
36
(1) Special Funding Situation
The participating employer allocations included in the supplemental schedule of employer special funding allocations and the supplemental schedule of special funding amounts by employer for each local employer are provided as each local employer is required to record in their financial statements, as an expense and corresponding revenue, their proportionate share of the pension expense allocated to the State of New Jersey (the State) under the special- funding situation and include their proportionate share of the net pension liability in their respective notes to their financial statements. For this purpose, the proportionate share was developed based on actual contributions made to the Teachers’ Pension and Annuity Fund allocated to employers based upon covered payroll and adjusted by expected State Early Retirement Incentive contributions for the respective fiscal year.