Embed Size (px)
Citation preview
STATE OF NEW JERSEY
Department of Conservation and Economic Development
Robert A. Roe, Commissioner
Division of Resource Development
Kenneth H. Creveling, Director
WATER RESOURCES RESUME
State Atlas Sheet No. 23
Parts of Bergen, Morris and Passaic Counties
by
Kemble Widmer
State Geologist
Haig Kasabach
Geologist
Phillip Nordstrom
Assistant Geologist
Bureau of Geology & Topography
Room 709
Labor & Industry Building
John Fitch Way
Trenton, N. J. 08625
-- 1966-
Introduction
__This report is one of four prepared for that part of metropolitan north-eastern New Jersey
and covered by State Topographic Atlas Sheets No. 22, No. 23, No. 25, and No. 26. Public water
supply wells giving more than 100,000 gallons per day (70 gallons per minute), as well as all
private wells of similar capacity whose records are on file with the Department of Conservation
and Economic Development, have been plotted on an overlay for the appropriate State TopographicAtlas Sheet.
This overlay provides a generalized geologic map and indicates the location of each well
described in the accompanying tabulations. The text, when used with the overlay and appropriate
State Topographic Atlas Sheet, will provide a ready and convenient source of information as to
the availability of groundwater, major surface water supplies, topography, and other essential
factors which affect the water resources in the various counties and municipalities in the north-
eastern part of the State.
Within the area of Atlas Sheet 23, there are over 275 wells. The majority of these wells,
at the time they were drilled each had a capability of giving in excess of 300,000 gallons per
day. The area of Atlas Sheet 23 is urban in the south and east, suburban towards the New York
line, and rural in the area of the Highlands. This map covers the northern third of Service Area
3, and the northern two-thirds of Service Area 4, as described in the TAMS Water Resources
Development Report of 1955, to the New Jersey Legislature.
This report has been compiled from records available in the Bureau of Geology. If anyone
knows of any additions or corrections, their comments would be appreciated.
Area Covered
This report provides an overlay and well tabulations for that part of eastern Passaic County,
northern Bergen County, and a small part of extreme northeastern Morris County covered by
State Topographic Atlas Sheet Number 23. The map covers that part of New Jersey found
between latitudes 40 ° 56' and 41 ° 12' north, and longitudes 73° 54' and 74 ° 20' west. The ap-
proximately 240 square miles of New Jersey covered by Atlas Sheet Number 23 is bounded
on the north by the New York State line and on the east by the Hudson River. The western
boundary (Atlas Sheet Number 22) extends southward from Greenwood Lake and the New
York State line through Norven Green State Forest, Butler, and ends in Lincoln Park. The
southern boundary line (Atlas Sheet Number 26) passes through Lincoln Park, Prospect Park,
Paterson, Dumont, and Cresskill ending on the Hudson River about one mile south of Alpineor Closter Dock.
The Water Resource
The total water resource of any area in the world can be represented by the formula:
Rainfall _ Runoff + Recharge + Evaporation and Transpiration Losses.
The rainfall component is dependent upon the general weather conditions with particular
emphasis on the factors of distribution throughout the year, average rates of precipitation, the
types of precipitation, and the difference between conditions during wet and dry cycles. New
3
Jersey is particularly fortunate in that rainfall is normally distributed in nearly equal incre-
ments (3 to 5 inches) each month. New Jersey receives more rain than 90% of the rest of
the continental land masses of the world. Several periods of no rainfall for more than 10 days
can be expected in any given year. A single period of 30 days with no precipitation may
occur from time to time. Since the beginning of weather records there have been three periods
where rainfall was deficient for more than 20 successive months; 1930-1931, 1953-1955, and
1961-1966 (?). The present period (1961-1966) of deficient rainfall is more severe than any
ever recorded. Its consequences have led to the development of this report series.
The RUNOFF component in the water resource picture is more commonly understood asthe surface water increment. The specific quantity of rainfall which will collect in the streams
and move out of the area is dependent upon the rate of rainfall, the type of vegetation covering
the surface, the slope, the soil profile, the underlying rock, the immediately preceding weather
conditions, and the size of the upstream drainage basin at any particular point. The base flow
(low water flow) of any given stream consists predominantly of groundwater which is slowly
draining out of the soil and the openings in the underlying geologic formations.
The RECHARGE component, commonly referred to as groundwater, is most dependent upon
vegetation, slope, and the underlying soil and rock conditions. The other factors which also
affect runoff will affect the recharge component. What is favorable for runoff, is unfavorable
for recharge, and vice versa. Whereas, reservoirs and small dams can be built to retard runoff,
procedures necessary to encourage recharge are not as well understood. During periods of normal
or excessive rainfall, recharge is hardly a problem in New Jersey. The even distribution and
amount of precipitation immediately fills any sub-surface openings which would provide space
for recharge to take place.
The EVAPORATION-TRANSPIRATION component, while recognized as large, is not yet
fully understood and, therefore, is not yet measurable in precise terms. It is known to be equal
to nearly half and some years nearly three-fourths of New Jersey's annual rainfall. Evaporation
and transpiration depends not only upon weather conditions and the growing season, but also
upon wind velocity, humidity, air temperature, and the specific types of vegetation in the area
under study.
Once the climate and weather factors affecting rainfall, evaporation, and transpiration losses
have been evaluated, the runoff and recharge components are modified by:
(a) The Physiographic Province which is classified by the type of topography, the nature
of the drainage basins, and the types of underlying bedrock. Thus, regardless of the
underlying geology, or the specific drainage basin, areas within the same physiographic
province can be expected to have similar natural surface water (runoff) and groundwater
(recharge) parameters. In New Jersey there is a difference between the glaciated and
unglaciated portion of each province.
(b) The Drainage Basin--which has been developed in response to a number of the geologic
factors in the area. Surface water never, and groundwater hardly ever crosses drainage
divides in the rock country of northern New Jersey, unless man has intervened with
some structure. Therefore, the whole water resource must be considered as an entity
within any specific drainage basin, regardless of its size. As the area under consideration
within a drainage basin becomes larger there will be larger amounts of runoff and the
relationship of runoff to recharge may change radically.
the Pleistocene epoch. All of the area of Atlas Sheet No. 23 has been glaciated, and is well northof the Wisconsin terminal moraine.
The Highland ridges north and east of the Wisconsin terminal moraine are bare rock or
have only a thin mantle of soil. In the valleys and on the side slopes of the ridges ground
moraine, kame deposits, outwash in the valley bottoms, or deposits related to now extinct glacial
lakes cause local variations in the terrain which may modify the groundwater conditions for
better or for worse. In effect, therefore, that part of New Jersey which is north and east of
the Wisconsin terminal moraine and its outwash has, for all practical purposes, the character-
istics of an additional groundwater province separate, and distinct from, and superimposed upon
the underlying bedrock.
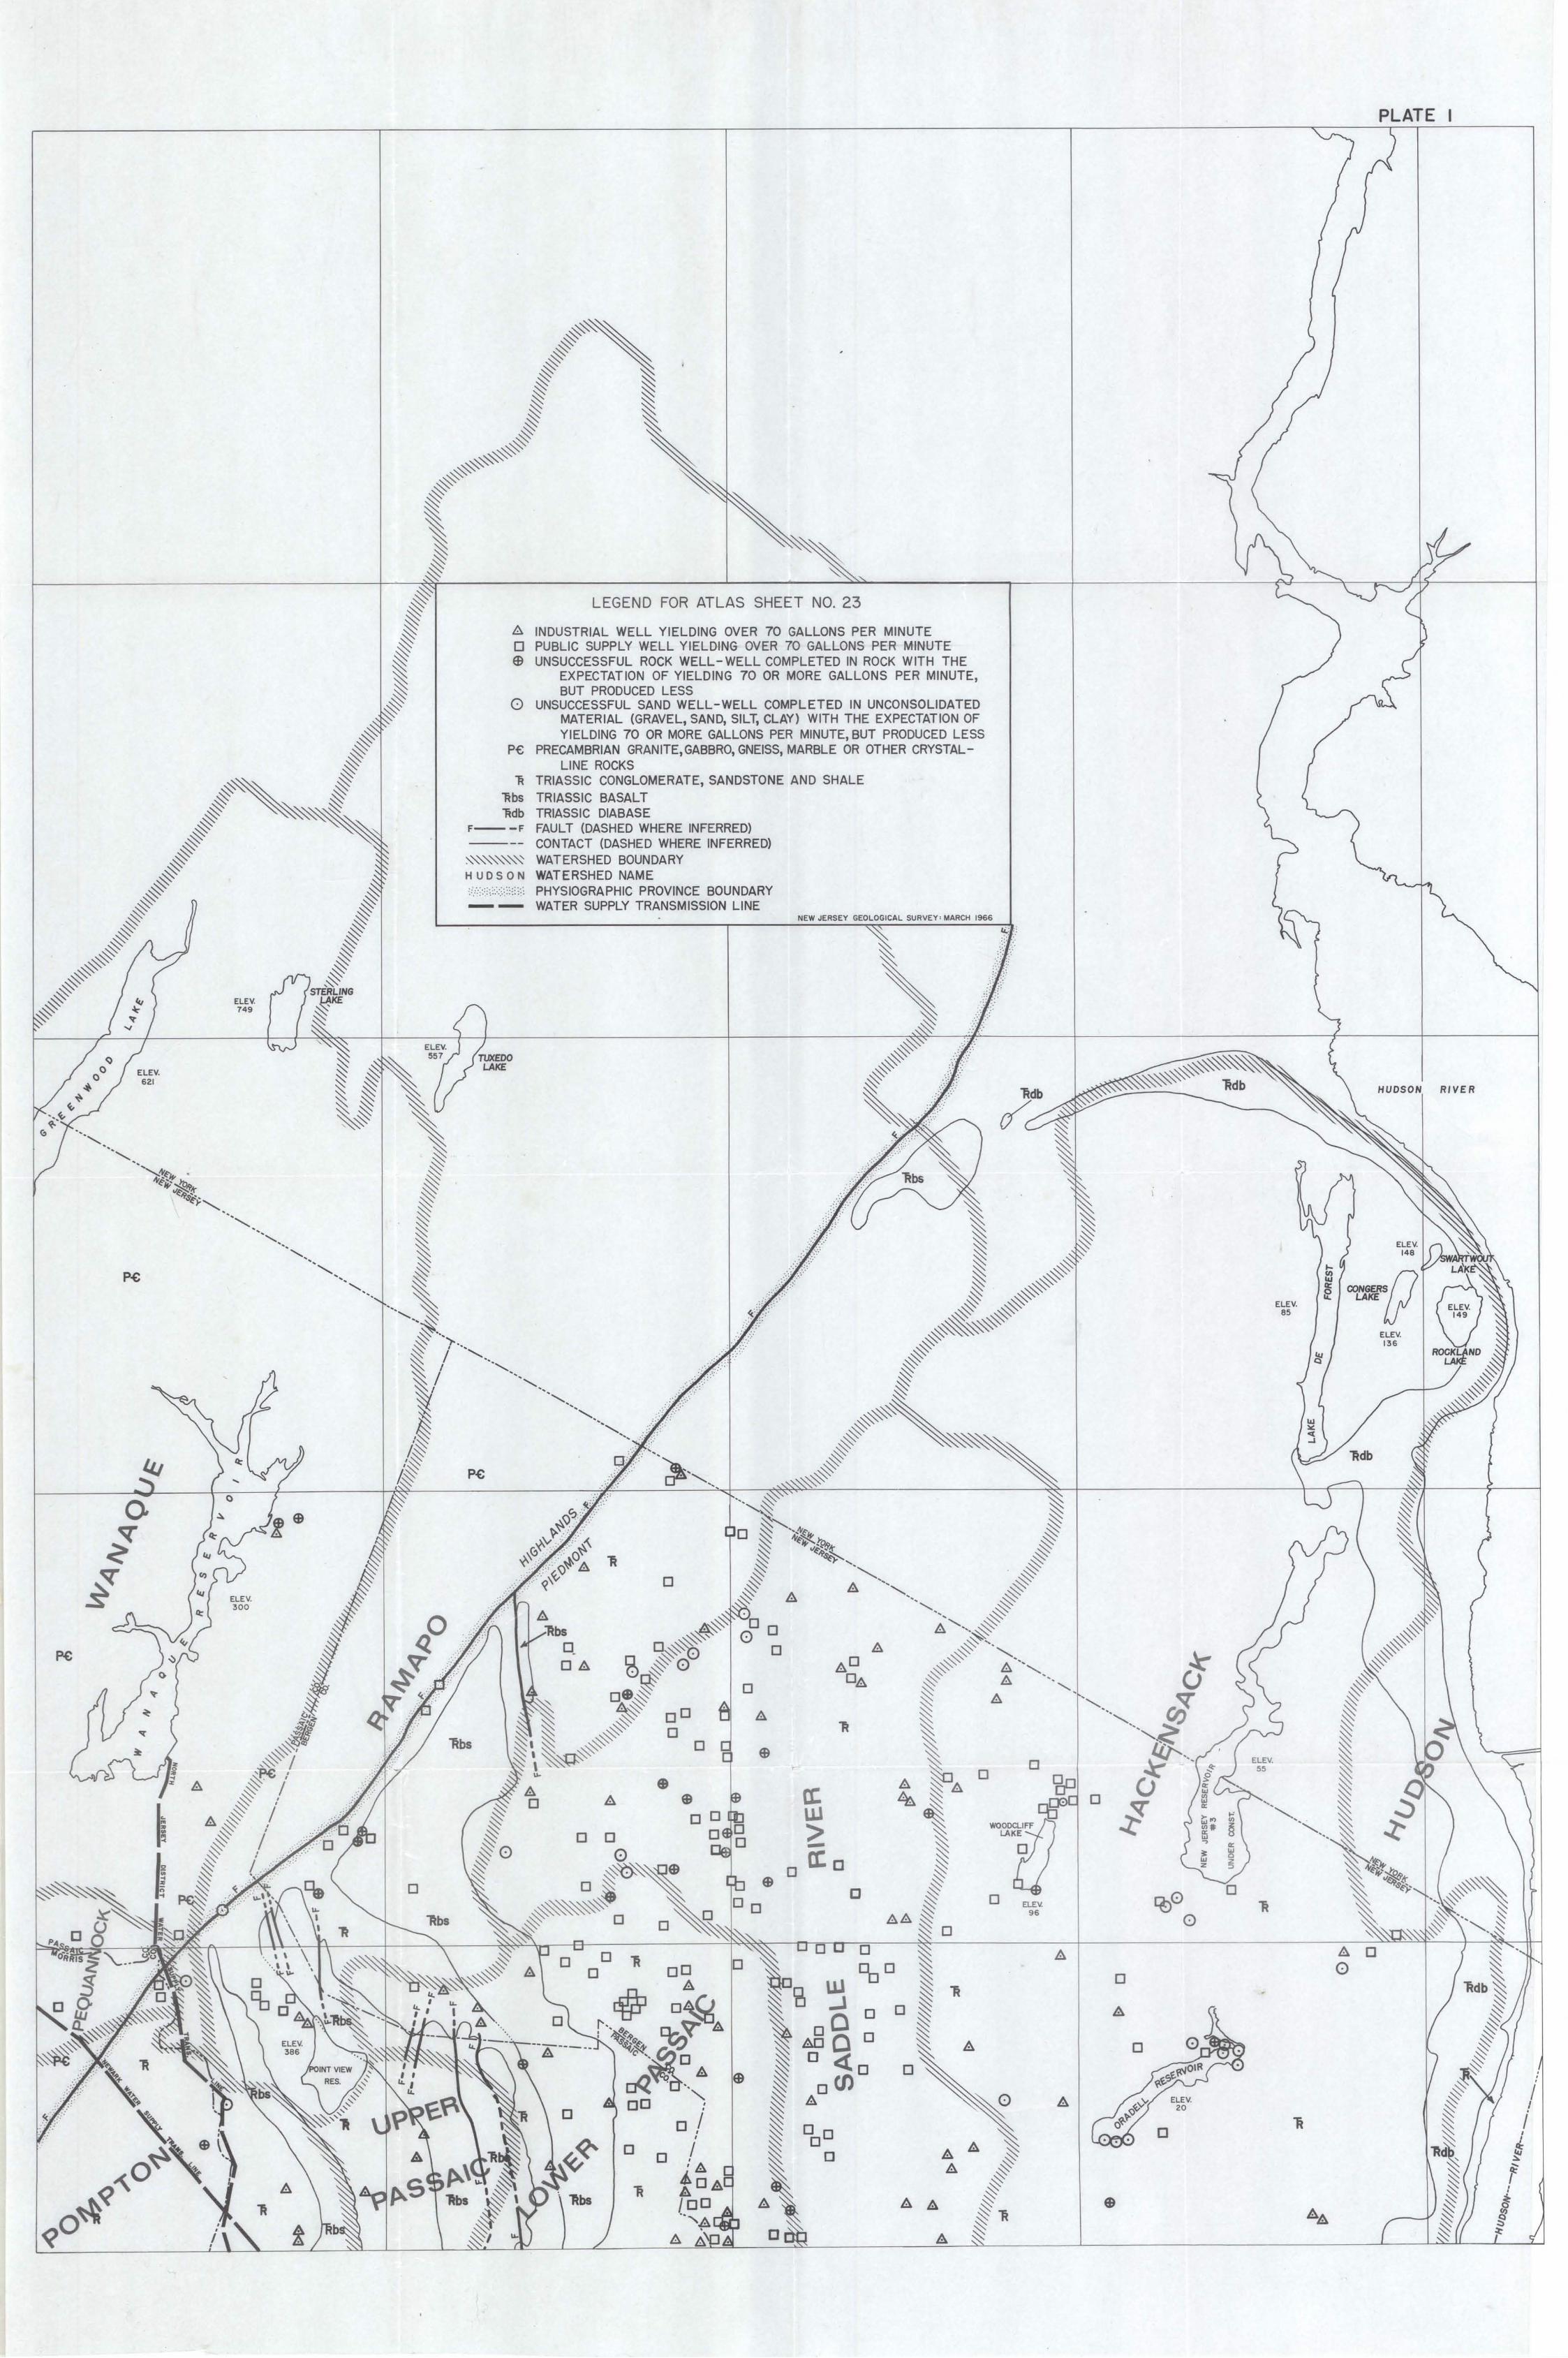
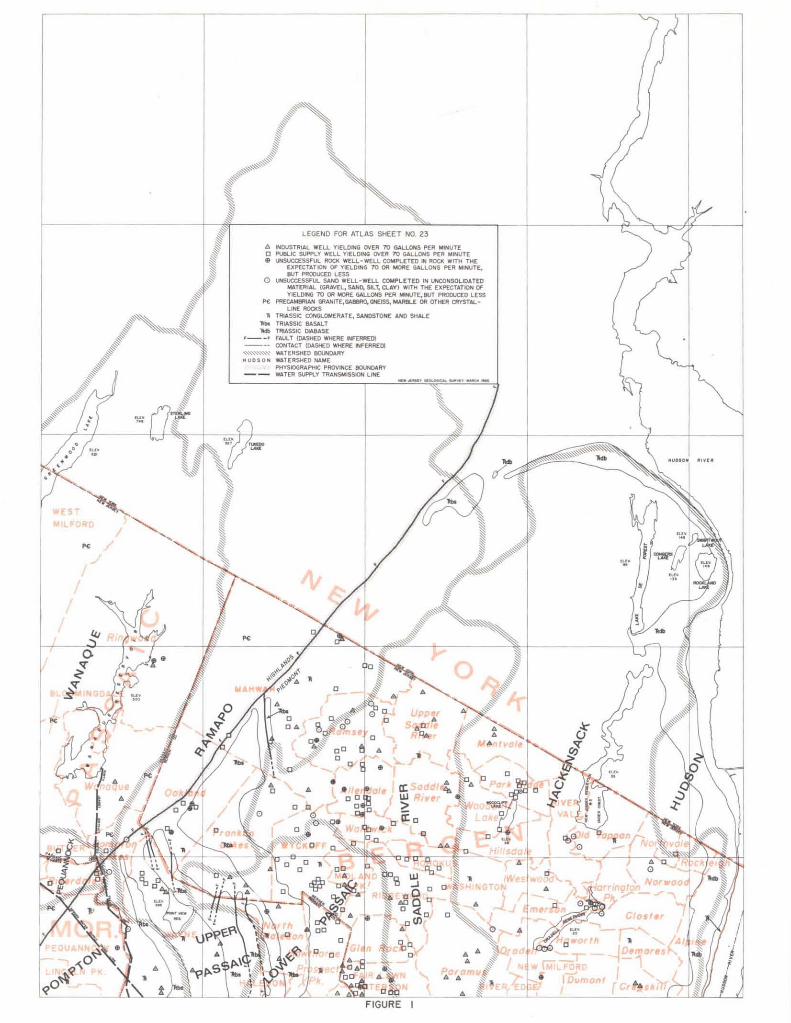
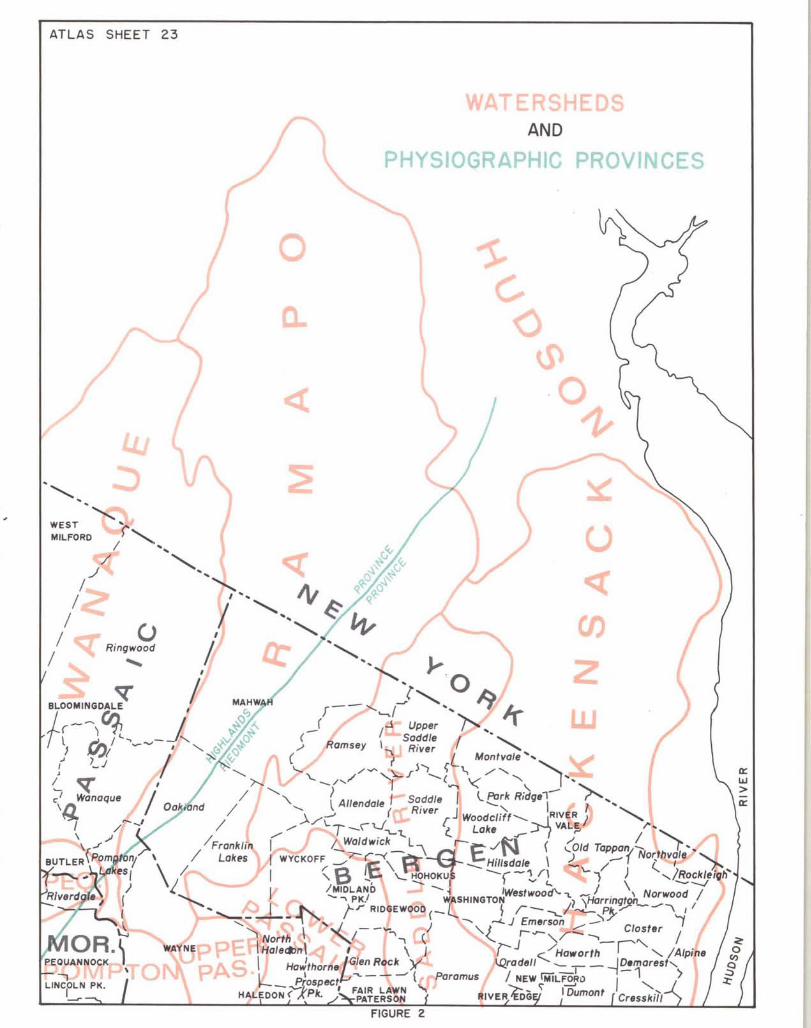
The boundaries of the Physiographic Provinces and major drainage basins of Atlas Sheet
No. 23 are shown on figure 2 and on Plate I. (Figure 1 is a reduction of Plate I.)
Drainage Basins
The most easterly drainage basin in the area of Atlas Sheet No. 23 is the Hudson River.
Opposite New Jersey it is tidal and too brackish and polluted to be used as a potable water
supply. The drainage divide, is at the top of the Palisades ridge. There are almost no water
needs within the Hudson River watershed in that part of New Jersey covered by Atlas Sheet No. 23.
About half of the 116 square miles of the Hackensack River basin is shown on Atlas Sheet
No. 23. About one-half of this is within New Jersey. The Hackensack Water Company operates
the New York and New Jersey portions of the drainage basin as a unit. Surface runoff is
stored in Lake De Forest, Oradell Reservoir and Woodcliff Lake Reservoir. The dam for a fourth
reservoir known as New Jersey Reservoir No. 3 (Rivervale) is under construction in New Jersey.
The reservoir will flood a portion of the Hackensack River valley in both New Jersey and New
York. There are no additional undeveloped reservoir sites within the basin.
The remainder of the map area is part of the Passaic River Basin. The Saddle River, which
rises in New York State about 3 miles north of the New York-New Jersey line, drains the
central part of the map area in western Bergen and eastern Passaic Counties. There are no
potential reservoirs within the Saddle River watershed. However, surface water from Saddle
River is being used to supply additional water for storage in Oradell Reservoir. The Ramapo
River which drains most of the Highlands north of New Jersey and west of the Hudson flows
into New Jersey in Mahwah Township. The New Jersey part of the drainage basin is relatively
narrow and extends southeastward through Oakland to Pompton Lakes where the Ramapo joins
the Wanaque and Pequannock tributaries of the Passaic. The eastern slope of the Highlands
in Mahwah, Ringwood, Wanaque, and Oakland Townships drains into the Ramapo watershed.
The rest of the Highlands in the western part of the map area including Greenwood Lake and
Sterling Lake, are within the Wanaque River watershed. An area of 90.4 square miles in New
York State drains into the Wanaque Reservoir which has a total storage capacity of 29.5 billion
gallons.
Most of the Morris County part of Atlas Sheet No. 23, the southwestern corner of the map
area which includes Riverdale, Pequannock, and Lincoln Park, is drained by the Pequannock and
Pompton Rivers, most of whose watersheds are on Atlas Sheet No. 22. The Pequannock drains
a large portion of the Highlands to the west of the Wanaque River.
6
Geology as it affects Groundwater
There are five geologic formations in the area of Atlas Sheet 23, which must be considered
when drilling a well. Four of these are shown on the accompanying overlay map, while the
fifth, the various Pleistocene deposits, must be considered separately as a potential source of
water in very restricted areas.
Pleistocene deposits of one kind or another are to be found at the surface over much of
the map area. They are significant from the water resource point of view only when they are
thick well-sorted accumulations of sand and gravel. Such deposits are usually restricted to the
major river valleys.
The Precambrian rocks which are found in the Highlands Physiographic Province consist
of a wide variety of hard crystalline gneisses, granites, and schists. Large capacity production
wells are the exception rather than the rule. Wells giving in excess of 50 gallons per minute are
usually considered good. With a detailed geologic analysis of the structure of a small area, it
may be possible to improve the probabilities of success, since whatever groundwater is recovered,
will come from fractures and openings in the rock resulting from jointing, faulting, or other
ancient movements of the rock body.
Shales, sandstones, and conglomerates of Triassic age underlie the Piedmont Physiographic
Province, and are collectively shown as Tr on the overlay geologic map. Most of the successful
wells in the area have been completed in these sedimentary formations or in the above mentionedthick Pleistocene deposits.
No high capacity wells have been completed in the Triassic diabase shown on Atlas Sheet
No. 23. A few wells have been drilled elsewhere in the Palisades diabase, but these have been
completely unsuccessful or have given very small yields. The diabase sill is inclined downward
to the west and southwest and has metamorphosed the overlying sediments. Any well within
a mile of the western contact of this formation can, therefore, be expected to encounter at depth
either the metamorphosed rock or the diabase sill with the resulting probability that the wellwill be unsuccessful.
The basaltic rocks of the Watchung Mountains and of the small igneous intrusions along
the border fault are most abundant in the southwestern part of the map area. Although large
capacity wells are not to be expected in basalts, there are fault zones, and in the First WatchungMountains some vesicular flow tops, which will provide sufficient openings so that some wells have
given in excess of 70 gallons per minute. It should be noted that the flow tops have not been
mapped. Some of the fracture zones resulting from faulting are shown on the map, but several
well records indicate that there are fault zones and closely spaced joint systems which are not
shown on the geologic map.
In summary, it can be said that the very restricted area of occurrence of thick Pleistocene
outwash deposits is at times a favorable geologic formation for groundwater development in the
area. Almost equally large supplies can be developed from rock wells completed in the Triassic
shales, sandstones, and conglomerates, with much less probability of unsuccessful wells. Large
capacity wells should not be expected from the area of the basalt or the Precambrian rocks,
but local geologic conditions may occasionally favor a well with a large yield. The areas under-
lain by diabase should not be considered for wells.
A study of well records in northern New Jersey suggests that successful wells in any of
the geologic formations shown on Atlas Sheet 23 are completed within 400 feet of the surface. At
11
-%
greater depths the probabilities of encountering fractures which are sufficiently open to provide
in excess of 70 gallons per minute are greatly reduced (less than a 50-50 chance), so that it
is more economical to move the well location, and start drilling a new well from the surface,
than to continue drilling below a 500 to 600 foot depth.
Topography
The topography is shown on the topographic map which forms the base for the overlay. The
Highlands Physiographic Province in the northwestern portion of the map is characterized by
hills and ridges which rise to a general elevation of 1,000 feet or more above sea level and valleyswhich are incised from 400 to 600 feet below the summit elevations.
Within the Piedmont Physiographic Province the diabase of the Palisades sill forms a ridge
on the east side of the map area which rises about 500 feet above the tidal Hudson River. In
the southwestern corner of the map area the Watchung flows and other bodies of basalt rock
rise to elevations of about 600 feet above sea level.
The areas underlain by Triassic sediments, which are frequently covered with glacial deposits,
have minor hills and ridges which crest at elevations between 400 and 600 feet. The Passaic
River in the southern part of the map area has an elevation of less than 50 feet, while the
Ramapo River, at the New York State line, has an elevation a little above 260 feet. The Hack-
ensack River crosses into New Jersey at an elevation which is a little below 50 feet.
Existing Water Sources
Nearly all of the map area east of Saddle River is within the franchise area of the Hackensack
Water Company. The surface water resources of the Hackensack Basin are considered to have
been completely developed. This development includes the completion of De Forest Reservoir
in New York and the construction at the present time of New Jersey Reservoir No. 3 (Rivervale)
between Oradell Reservoir and Lake De Forest. The surface water supply system also includes
Woodcliff Lake Reservoir. The Hackensack Water Company also has several large capacity
producing wells.
Because of the development of this predominantly surface water supply system there are
still a few areas where additional large capacity rock wells might be located.
West of the Saddle River in Bergen County, there has been extensive development and
testing of the groundwater resource. The construction of a reservoir on the Ramapo River
has been proposed since 1922. The Wanaque Reservoir of the North Jersey District Water
Supply System is foun(l in the Highlands in the western part of the map area. Some surface
water supplies are taken directly from the Ramapo and the Passaic.
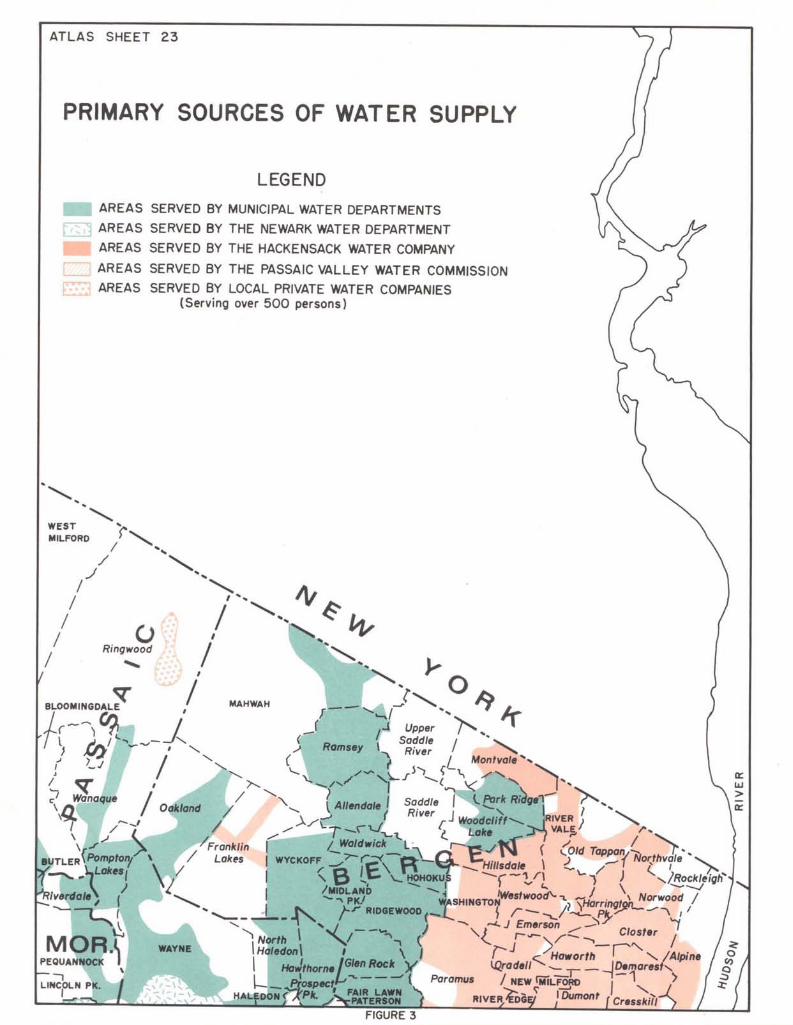
The major public water supply service areas within Atlas Sheet No. 23 are indicated below
and on Figure 3. The municipalities have been divided into several categories. Each municipality
is shown in capitals the first time it is used to provide a convenient means of determiningthe most important source of any particular water supply.
Most municipalities shown on Atlas Sheet No. 23 are served by a public water supply which
is owned either by a municipality or a large private water company. Only ROCKLEIGH,
SADDLE RIVER, and UPPER SADDLE RIVER are not supplied by a major water system.
The western portion of WEST MILFORD has several local private water companies; those
serving over 500 persons can be found in the report covering Atlas Sheet No. 22.
12
A few of the municipalities on the western half of Figure 3 have only a small portion
of their areas served by public water systems. These municipalities may have several local private
water companies which are not considered in this report if they serve less than 500 persons.
The twelve municipalities listed below have no municipally owned water supply source but
are supplied in full or in part by at least one public water system. If fewer than 500 persons
are served by a public water system, the supplier is not shown.
BLOOMINGDALE from Butler PEQUANNOCK from Newark
GLEN ROCK from Ridgewood PROSPECT PARK from Passaic Valley
LINCOLN PARK from Newark via Water Comm.
Pequannock, Wayne, and private RINGWOOD from Wanaque and private
MIDLAND PARK from Ridgewood RIVERVALE from Park Ridge
NORTH HALEDON from Haledon WOODCLIFF LAKE from Park Ridge
PATERSON from Passaic Valley Water WYCKOFF from Ridgewood
Comm. & No. Jersey Dist. Water Comm.
Sixteen municipalities rely on their own water supply systems. Many of these systems are
also interconnected with other supplies. If a substantial amount of water is usually received
from outside sources, the outside facility is shown in parenthesis. If only a few streets are
served by another system, the supplier is not shown.
ALLENDALE PARK RIDGE
BUTLER POMPTON LAKES (Butler)
FAIR LAWN (Hackensack Water Co.) RAMSEY
HALEDON (Passaic Valley Water Comm.) RIDGEWOOD
HAWTHORNE RIVERDA_,E
HOHOKUS WALDWICK
MAHWAH WANAQUE
OAKLAND WAYNE (Newark, private)
The Hackensack Water Company provides the entire public water supply for the followingtwenty-one municipalities:
ALPINE NEW MILFORD
CLOSTER NORTHVALE
CRESSKILL NORWOOD
DEMAREST OLD TAPPAN
DUMONT ORADELL
EMERSON PARAMUS
FRANKLIN LAKES RIVER EDGE
HARRINGTON PARK RIVERVALE
HAWORTH WASHINGTON
HILLSDALE WESTWOOD
MONTVALE
15
Wells
Within the area of Atlas Sheet No. 23 there are shown on the overlay over 260 well location
symbols. A number of these symbols represent two, and in a few cases even 3 wells so close
to each other that only one symbol can be used. There are about 280 wells in the alphabetical
listing. In a few instances a single listing represents a well field of several wells or a number
of attempts t_oget water at some specific location.
Only one of the 236 wells drilled in the Brunswick shale or sandstone failed to give any
water. This particular well was 364 feet deep. About 10% of the shale wells (22) were reported
as giving less than 70 gpm. This group is almost equally divided between wells with yields
from 7 to 49 gpm, and the wells yielding 50 gpm or more, but less than 70 gpm.
A little more than half of the shale wells (123 wells) gave 70 gallons or more but less
than 200 gpm. About 30% (70 wells) had reported yields of between 200 gpm and 349 gpm.
In the top 10% of the yields (22 wells), 5 wells yielded more than 350 gpm, 4 yielded
more than 400 gpm, 4 yielded more than 450 gpm, 7 yielded between 500 and 540 gpm, 1 yielded
600 gpm, and 1 well had a reported yield of 1,230 gpm.
With respect to the depths of all shale-sandstone wells only one was less than 100 feet deep.The great majority of the wells were betwehh. 250 and 350 feet deep. Only 16 wells of the 236
total were over 500 feet deep. The three deepest wells, not included in the 16 above, were drilled
to depths of 1,006, 1,080, and 1,145 feet. These three wells gave respectively 81 gpm, 20 gpm,
and 250 gpm. Once again this is an indication that for rock wells there is no correlation between
depth and yield:
In the area of Atlas Sheet No. 23 it should be noted that the glacial overburden, where
Pleistocene wells are completed, is frequently as much as 100 feet deep, and in one instance, a
Pleistocene well was completed in glacial deposits at a depth of 200 feet. Two Pleistocene wells
which each gave 700 gpm were driven through the Pleistocene outwash into the Precambrian
bedrock to depths of 103 and 140 feet. In another instance, what was apparently started as a
Pleistocene well was unsuccessful, and therefore, was continued to a depth of 561 feet. This
well gave 75 gpm, but it cannot be determined whether this was from the rock or the overlying
Pleistocene deposits. It should also be noted that those shale-sandstone wells giving the best
yields are frequently overlain by thick stratified Pleistocene deposits.
No high capacity wells were actually attempted in the diabase of the Palisades sill. Wells
completed in the basalts of the Watchung Mountains gave 0 gpm, 20 gpm, 42 gpm, 75 gpm,
and 150 gpm. Two wells were driven through a considerable thickness of shale and completed
in the basalt with yields reported as 125 gpm, and 175 gpm. It would seem probable that thiswater came from the shale near the contact with the basalt.
There are only seven wells drawing water from the Precambrian crystalline rocks. These
yielded 6, 25, 30, 30, 60, 90, and 140 gpm from depths of 160 to 505 feet. The least successful
well was the deepest.
Wells completed in the Pleistocene sands and gravels, outwash desposits as distinct from
glacial till, usually give much higher yields than rock wells. The sucaessful Pleistocene wells
are generally found along the bottom and lower slopes of the main river valleys. The largest
yield of any well on Atlas Sheet 23 is the 70 foot Pleistocene well of the Hackensack Water
16
Company which was reported as giving 1,750 gpm. Oakland Borough has two large capacity
Pleistocene wells; 1,160 gpm from 123' and 970 gpm from 112'. There are 32 other successful
Pleistocene wel!s, 31 unsuccessful Pleistocene wells, which are reported either as giving no wateror such a small amount that the test is reported as negative, in the area of Atlas Sheet 23.
Checking thick glacial deposits for water is always worth while but the one to one chance for
failure or for a greater yield than a rock well should always be considered. There are six in-
stances in which wells were completed in rock after penetrating more than 100 feet of glacial
material. Their records show 60 gpm from 375' (Precambrian) 70 gpm from 206', 75 gpm from
561', 100 gpm from 125', 100 gpm from 235' and 250 gpm from 171', all finished in Triassic shale.
Of the twenty-nine successful Pleistocene wells, in addition to the three top yields mentioned
above, nine give between 80 and 138 gpm, seven give between 200 and 210 gpm, and the re-
maining thirteen--250 gpm or more with at least two reported as giving 700 gpm.
Because of the rapid variation and change in the characteristic of grain size, sorting, porosity,
and permeability of glacial deposits they can be likened to the little girl with the curl in the
nursery rhyme. When the wells are good, they are usually very very good, .but when they are
bad, they are horrid. In this particular area, attempts to secure water from the Pleistocene
deposits have been unusually successful. Some of this success is undoubtedly because many wells
were located by geologists with an understanding of the origin of the various glacial deposits.
In most areas of thick Pleistocene deposits in other parts of the state the odds for a successful
Pleistocene well al:e not one to one,-but rather one out of four, or one out of five.
It should be recognized that within the area covered by Atlas Sheet 23, there are kame
terrace deposits of well-sorted gravels, which are topographically so high that they drain toorapidly to be considered as potential well sites. There are also other kame and moraine deposits
with poor sorting and much clay and silt which cannot be expected to result in successfulPleistocene wells.
With respect to the wells drilled for public water supplies the Hackensack Water Company
has the largest number of attempts to drill successful wells. Six wells, four of which are above
average, have been completed in the Triassic shales. One attempt was abandoned. The Bureau's
well records indicate that the Hackensack Water Company has made at least 15 attempts to
get Pleistocene wells in various communities. On the other hand, there have been four successful
Pleistocene wells, including the largest reported yield in the map area.
Oakland Borough has the second and third largest Pleistocene wells and also four others
that are successful. They are also utilizing one shale well and have made an attempt to get
water from the basalt with a well drilled 1,080 feet deep, which gave only 20 gpm. Park Ridge
has eight shale wells and four Pleistocene wells which were successful, but pulled the casing
on eight Pleistocene wells. Ramsey has 13 shale wells and made five unsuccessful efforts to
complete wells in the Pleistocene.
_. All of the remaining public water supply systems rely on wells completed in the Triassmshale. Ridgewood has 50 wells, Allendale 13, Waldwick 10, Hawthorne 8, Fair Lawn 6, andHohokus 6.
There is reason to suspect that some of the above wells may actually get some water from
Pleistocene sediments above the shale, but the well records do not indicate that screens were
set, or that any of the above wells were originally planned for completion in the Pleistocene.
17
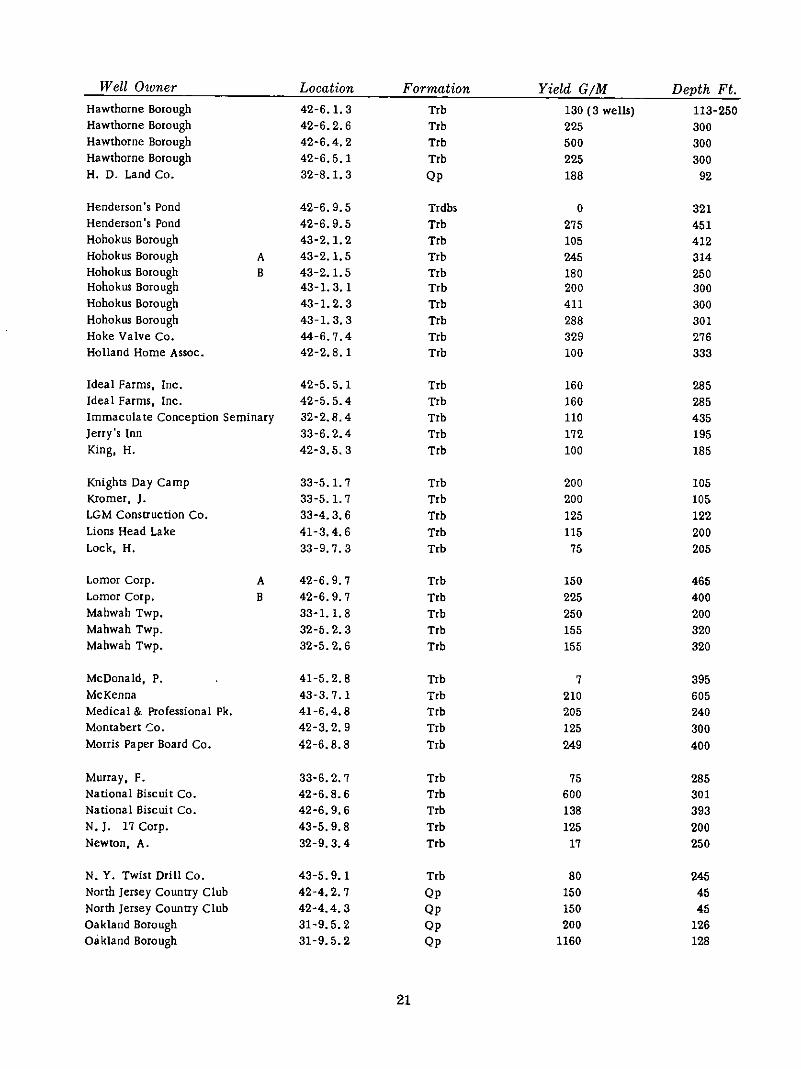
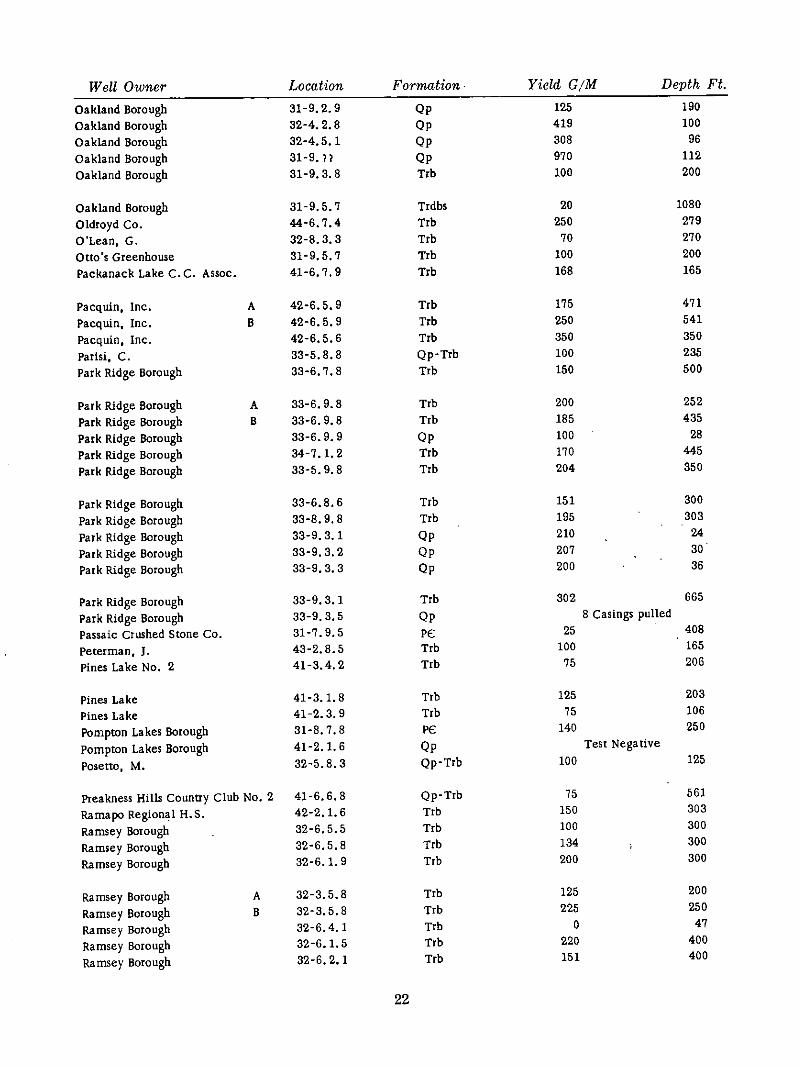
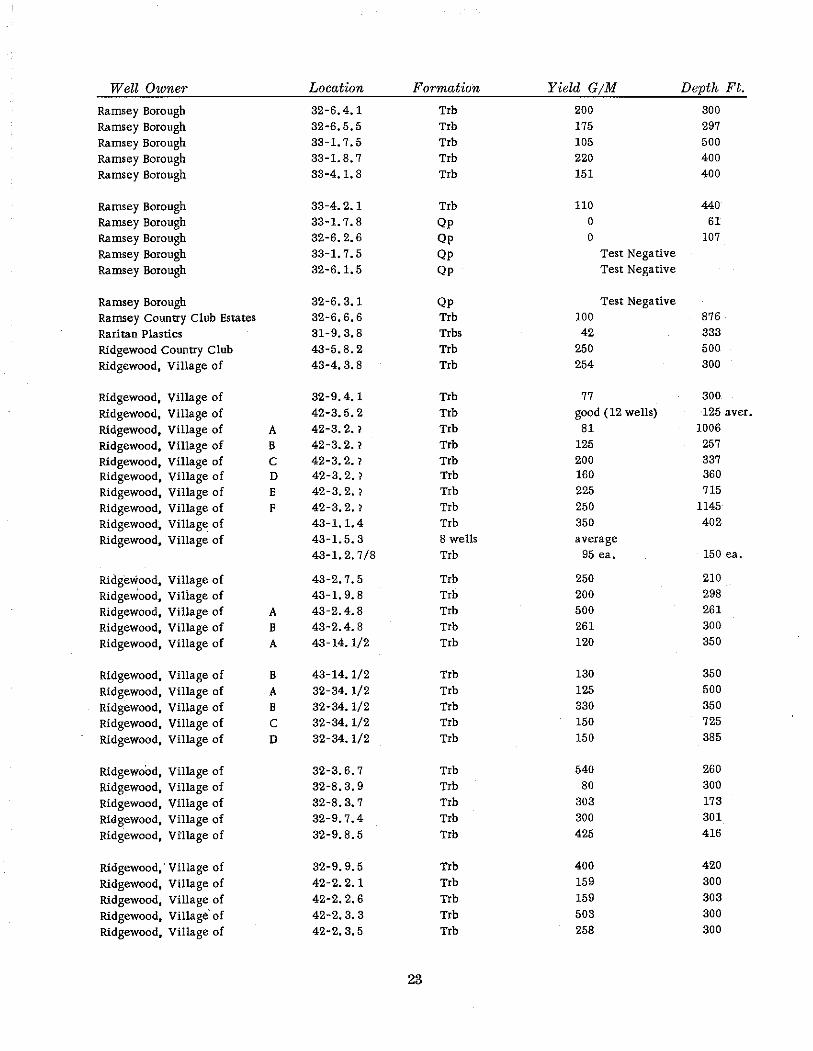
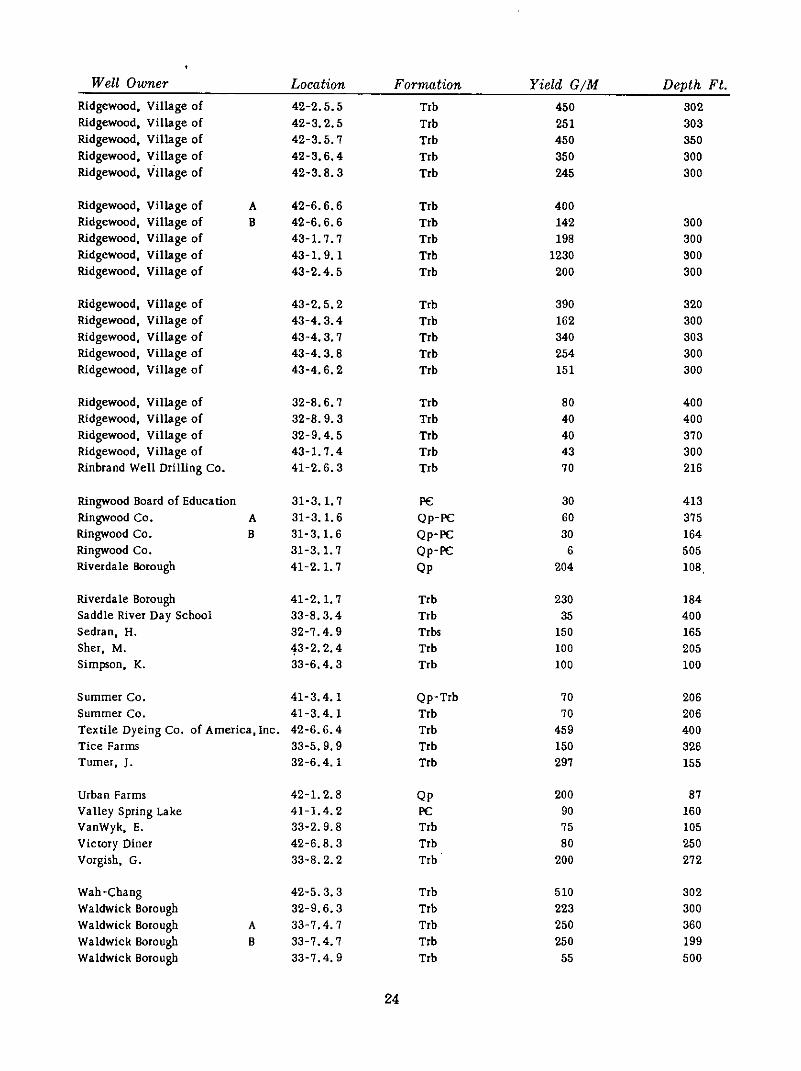
Using the Report for Well Locations
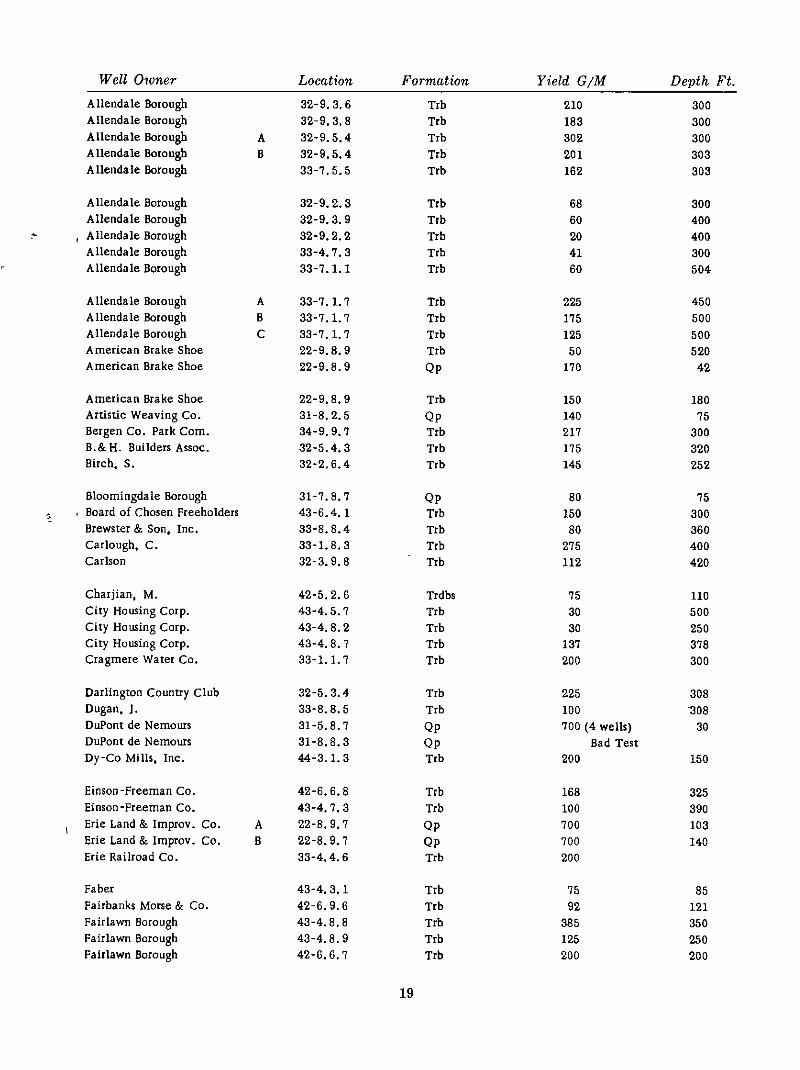
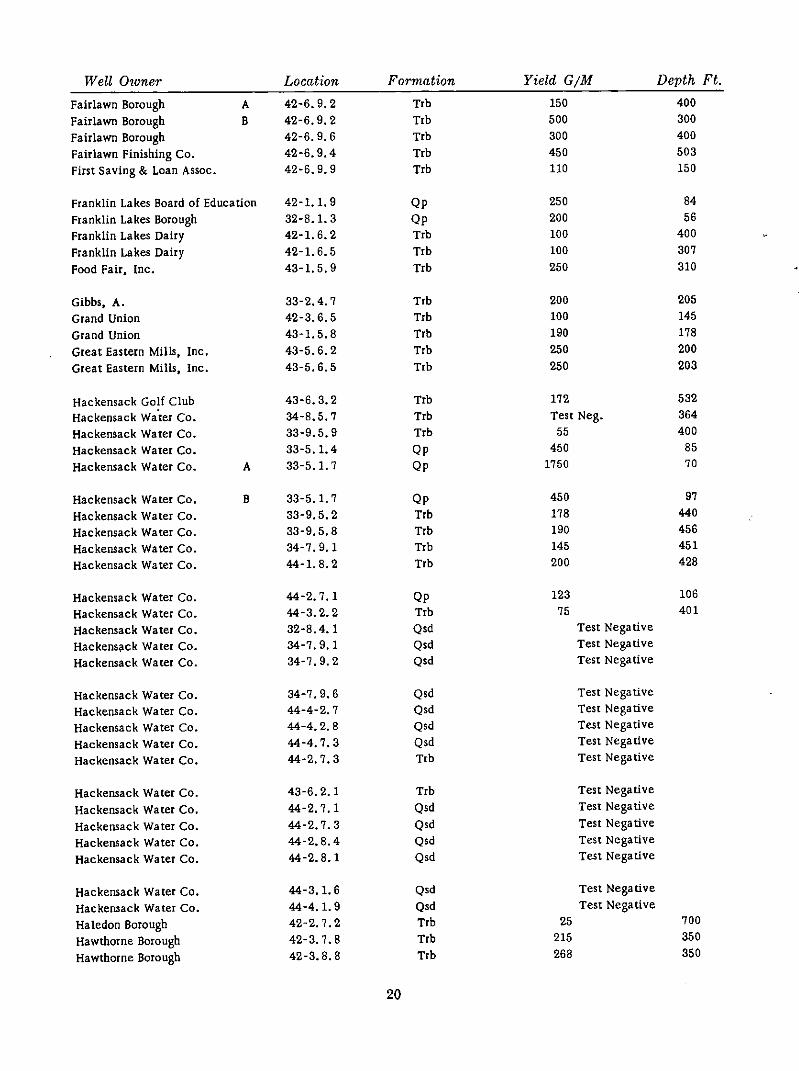
The depth in feet and the yield in gallons per minute, as reported by the driller uponcompletion of the well test, for any particular well, is provided in the alphabetical compilation.On the overlay map, wells referred to in the tabulation are shown by circles, squares, ortriangles. The report indicates the map number. The six minute block numbers are shownon the overlay map. Using the template, in the back pocket, the remaining three numbersfound in the coordinate listing in the text can be determined.
If the ownership of the well is known, look it up in the alphabetical list and secure therectangular coordinates. Follow the procedure described in appendix A explaining the rectangularcoordinate system on the overlay to determine its location. The present owner of an industrialwell may not appear on the list. In this case, it will be necessary to know the names of formerowners of the property. The owners name used in the alphabetical tabulation is that of theowner for whom the well was drilled.
If ownership is not known, or it is desired to determine the owner of a well at a particularspot, took up the location on the overlay map and determine the last five numbers of the NewJersey rectangular coordinate system. Look up the coordinates given in the coordinate summaryto secure the ownership name, and then look up the data about the well in the alphabeticallisting.
L8
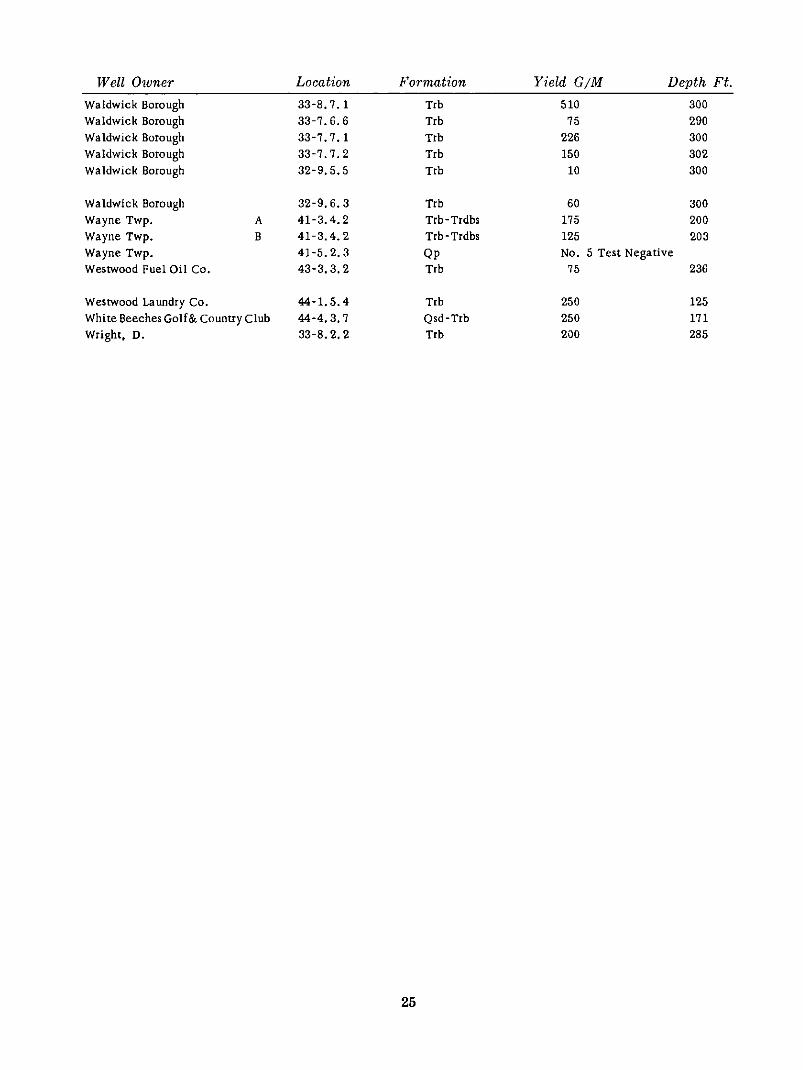
Well Owner Location Formation Yield G/M Depth Ft.
Allendale Borough 32-9.3.6 Trb 210 300
Allendale Borough 32-9.3.8 Trb 183 300
Allnndale Borough A 32-9.5.4 Trb 302 300
Allendale Borough B 32-9.5.4 Trb 201 303
Allendale Borough 33-7.5.5 Trb 162 303
Allendale Borough 32-9.2.3 Trb 68 300
Allendale Borough 32-9.3. 9 Trb 60 400
:- , Allendale Borough 32-9.2.2 Trb 20 400
Alleadale Borough 33-4.7.3 Trb 41 300
Allendale Borough 33-7.1.1 Trb 60 504
Allendale Borough A 33-7.1.3 Trb 225 450
Allendale Borough B 33-7.1.7 Trb 175 500
Allendale Borough C 33-7.1.7 Trb 125 500American Brake Shoe 22-9.8.9 Trb 50 520
American Brake Shoe 22-9.8.9 Qp 170 42
American Brake Shoe 22-9.8.9 Trb 150 180
Artistic Weaving Co. 31-8.2.5 Qp 140 76
Bergen Co. Park Com. 34-9.9. ? Trb 217 300B.&H. Builders Assoc. 32-5.4.3 Trb 175 320
Birch. S. 32-2.6.4 Trb 145 252
Bloomingdale Borough 31-7.8.7 Qp 80 75, Board of Chosen Freeholders 43-6.4.1 Trb 150 300
Brewster & Son, Inc. 33-8.8.4 Ttb 80 360
Carlough, C. 33-1.8.3 Trb 275 400Carlson 32- 3.9.8 Trb 112 420
Charjian, M. 42-5.2.6 Trdbs 75 110
City Homing Corp. 43-4.5.7 Trb 30 500
City Housing Corp. 43-4.8.2 Trb 30 250
City Homing Corp. 43-4.8.7 Trb 137 378
Cragmere Water Co. 33-1.1.7 Trb 200 300
Darlington Country Club 32-5.3.4 Trb 225 308
Dugan, J. 33-8.8.5 Trb 10O "308
DuPont de Nemours 31-5.8.7 Qp 700 (4 wells) 30
DuPont de Nemoms 31-8.8.3 Qp Bad TestDy-Co Mills. Inc. 44-3.1.3 Trb 200 150
Einson-Freeman Co. 42-6.6.8 Trb 168 325
Einson-Freeman Co. 43-4. 7.3 Trb 100 390
Erie Land & Improv. Co. A 22-8.9.7 Qp 700 103
Erie Land & Improv. Co. B 22-8.9.7 Qp 700 140Erie Railroad Co. 33-4.4.6 Trb 200
Faber 43-4. 3.1 Trb 75 85
Fairbanks Morse & Co. 42-6.9.6 Trb 92 121
Fairlawn Borough 43-4.8.8 Trb 385 350
Fairlawn Borough 43-4.8.9 Trb 125 250
Fairlawn Borough 42-6.6.7 Trb 200 200
19
Well Owner Location Formation Yield G/M Depth Ft.
FairlawnBorough A 42-6.9.2 Trb 150 400
FairlawnBorough B 42-6.9,2 Trb 500 300
Fairlawn Borough 42-6.9.6 Trb 300 400
Fairlawn Finishing Co. 42-6.9.4 Trb 450 503
First Saving & Loan Assoc. 42-6.9.9 Trb 110 150
Franklin Lakes Board of Education 42-1, 1.9 Qp 250 84
Franklin Lakes Borough 32-8.1.3 Qp 200 56
Franklin Lakes Dairy 42-1.6.2 Trb 100 400
Franklin Lakes Dairy 42-1.6.5 Trb 100 307
Food Fair. Inc. 43-1.5.9 Trb 250 310
Gibbs, A. 33-2.4.7 Trb 200 205Grand Union 42-3.6.5 Trb 100 145
Grand Union 43-1.5.8 Trb 190 178
Great £astern Mills, Inc. 43-5.6.2 Trb 250 200
Great Eastern Mills, Inc. 43-5.6.5 Trb 250 203
Hackensack Golf Club 43-6.3.2 Trb 172 532
Hackensack Wa'ter Co. 34-8.5.7 Trb Test Neg. 364
Hackensack Water Co, 33-9.5.9 Trb 55 400
Hackensaek Water Co. 33-5. i.4 Qp 450 85
Hackensaek Water Co. A 33-5.1, 7 Qp 1750 70
Hackensack Water Co, B 33-5.1.7 Qp 450 97
Hackensaek Water Co. 33-9.5.2 Trb 178 440
Hackensaek Water Co. 33-9.5.8 Trb 190 456
Hacker, sack Water Co. 34-7.9.1 Trb 145 451
Hackensack Water Co, 44-1.8.2 Trb 200 428
Hackensack Water Co. 44-2.7.1 Qp 123 106
Hackensack Water Co. 44-3.2.2 Trb 75 401
Hackensack Water Co. 32-8.4. 1 Qsd Test Negative
Haokensaek Water Co. 34-7,9.1 Qsd Test NegativeHaekensack Water Co. 34-7.9.2 Qsd Test Negative
Hackensack Water Co. 34-7.9.6 Qsd Test Negative
Hackensack Water Co. 44-4-2.7 Qsd Test Negative
Hackensaek Water Co. 44-4.2.8 Qsd Test Negative
Haekensack Water Co. 44-4. 7.3 Qsd Test Negative
Hackensack Water Co. 44-2.7.3 Trb Test Negative
Hackensack Water Co. 43-6.2.1 Trb Test Negative
Hackensaek Water Co. 44-2.7.1 Qsd Test Negative
Haokensack Water Co. 44-2.7.3 Qsd Test Negative
Haekensaek Water Co. 44-2.8.4 Qsd Test Negative
Haekensack Water Co. 44-2.8.1 Qsd Test Negative
Hackensaek Water Co. 44-3.1.6 Qsd Test Negative
Haekensack Water Co. 44-4. 1, 9 Qsd Test Negative
Haledon Borough 42-2.7.2 Trb 25 700
Hawthorne Borough 42-3.7.8 Trb 215 350
Hawthorne Borough 42-3.8.8 Trb 268 350
20
Well Owner Location Formation Yield G/M Depth Ft.
Hawthorne Borough 42-6.1.3 Trb 130 (3 wells) 113-250
Hawthorne Borough 42-6.2.6 Tth 225 300
Hawthorne Borough 42-6.4.2 Trb 500 300
Hawthorne Borough 42-6.5.1 Trb 225 300
H. D. Land Co. 32-8.1.3 Qp 188 92
Henderson's Pond 42-6, 9.5 Trdbs 0 321
Henderson's Pond 42-6.9.5 Trb 2`75 451
Hohokus Borough 43-2.1.2 Trb 105 412
Hohokus Borough A 43-2.1.5 Trb 245 314
Hohokus Borough B 43-2. 1.5 Trb 180 250
Hohokus Borough 43-1.3.1 Trb 200 300
Hohokm Borough 43-1.2.3 Trb 411 300
Hohokus Borough 43-1.3.3 Trb 288 301Hoke Valve Co. 44-6.7.4 Trb 329 276
Holland Home Assoc. 42-2, 8.1 Trb 100 333
Ideal Farms, Inc. 42-5.5, 1 Trb 160 285
Ideal Farms, Inc. 42-5.5.4 Trb 160 285
Immaculate Conception Seminary 32-2.8.4 Trb 110 435
Jerry's Inn 33-6.2.4 Trb 1'72 195
King, H. 42-3.5.3 Trb 1O0 185
Knights Day Camp 33-5.1. `7 Trb 200 105Kromer, J. 33-5.1.7 Trb 200 105
LGM Construction Co. 33-4.3. 6 Trb 125 122
Lions Head Lake 41-3.4. 6 Trb 115 200
Lock, H. 33-9.7.3 Trb 75 205
komor Corp. A 42-6.9.7 Trb 150 465
Lomor Corp. B 42-6.9.7 Trb 225 400
Mahwah Twp. 33-1.1.8 Trb 250 200
Mahwah Twp. 32-5.2.3 Trb 155 320
Mahwah Twp. 32-5.2.6 Trb 155 320
McDonald, P. 41-5.2.8 Trb 7 395
McKenna 43-3.7.1 Trb 210 605
Medical & Professional Pk. 41-6.4.8 Trb 205 240
Montabert Co. 42-3.2.9 Trb 125 300
Morris Paper Board Co. 42-6.8.8 Trb 249 400
Murray, F. 33-6.2. `7 Trb 75 285National Biscuit Co. 42-6.8.6 Trb 600 301
National Biscuit Co. 42-6, 9.6 Trb 138 393
N, J. 1`7 Corp. 43-5.9.8 Trb 125 200
Newton, A. 32-9.3.4 Trb 1"1 250
N. Y. Twist Drill Co. 43-5.9.1 Trb 80 245
North Jersey Country Club 42-4.2.7 Qp 150 45
North Jersey Country Club 42-4.4.3 Qp 150 45
Oakland Borough 31-9.5.2 Qp 200 126
O_ikland Borough 31-9.5.2 Qp 1160 128
21
Well Owner Location Formation Yield G/M Depth Ft.
Oakland Borough 31-9.2.9 Qp 125 190
Oakland Borough 32-4. 2.9 Qp 419 100
Oakland Borough 32-4.5.1 Qp 308 96
Oakland Borough 31-9. ? _ Qp 970 112
Oakland Borough 31-9.3.8 Trb 100 200
Oakland Borough 31-9.5. '/ Trdbs 20 1080
Oldroyd Co. 44-6.7.4 Trb 250 279
O'Lean, G. 32-8.3.3 Trb 70 270Otto's Greenhouse 31 - 9.5.7 Trb 1OO 200
Packanack Lake C.C. Assoc. 41-6.7.9 Trb 168 165
Paequin, Inc. A 42-6.5.9 Trb 175 471
Pacquin, Inc. B 42-6.5.9 Trb 250 541
Pacquin0 Inc. 42-6, 5.6 Trb 350 350Parisi, C. 33-5.8.8 Qp-Trb 100 235
Park Ridge Borough 33-6.7.8 Trb 150 500
Park Ridge Borough A 33-6.9.8 Trb 200 252
Park Ridge Borough B 33-6.9.8 Trb 185 435
Park Ridge Borough 33-6.9.9 Qp 100 28
Park Ridge Borough 34-7.1.2 Trb 170 445
ParkRidge Borough 33-5.9.8 Trb 204 350
Park Ridge Borough 33-6.8.6 Trb 151 300
Park Ridge Borough 33-8.9.8 Trb 195 303
Park Ridge Borough 33-9.3.1 Qp 210 24
Park Ridge Borough 33-9.3.2 Qp 207 30
Park Ridge Borough 33-9.3. 3 Qp 200 36
Park Ridge Borough 33-9.3.1 Trb 302 665
Park Ridge Borough 33-9, 3.5 Qp 8 Casings pulledpassaic Crushed Stone Co. 31-7.9.5 PE 25 408
Peterman, J. 43-2.8.5 Trb 100 165Pines Lake No. 2 41-3.4.2 Trb 75 206
Pines Lake 41-3. 1.8 Trb 125 203
Pines Lake 41-2.3.9 Trb 75 106
Pompton Lakes Borough 31-8.7.8 PE 140 250
Pompton Lakes Borough 41-2.1.6 Qp Test Negative
Posetto, M. 32-5.8.3 Qp-Trb 10O 125
Preakness Hills Country Club No. 2 41-6.6.8 Qp-Trb 75 561
Ramapo Regional H.S. 42-2.1.6 Trb 150 303
Ramsey Borough 32-6.5.5 Trb i00 300
Ramsey Borough 32-6.5.8 Trb 134 _ 300
Ramsey Borough 32-6.1.9 Trb 200 300
Ramsey Borough A 32-3.5.8 Trb 125 200
Ramsey Borough B 32-3.5.8 Trb 225 250
Ramsey Borough 32-6.4.1 Trb 0 4'I
Ramsey Borough 32-6.1.5 Trb 220 400
Ramsey Borough 32-6.2, 1 Trb 151 400
22
Well Owner Location Formation Yield G/M Depth Ft.
Ridgewood, Village of 42-2.5.5 Trb 450 302
Ridgewood, Village of 42-3.2.5 Trb 251 303
Ridgewood, Village of 42-3.5.7 Trb 450 350
Ridgewood, Village of 42-3.6.4 Trb 350 300
Ridgewood, _/illage of 42-3.8.3 Trb 245 300
Ridgewood, Village of A 42-6.6.6 Trb 400
Ridgewood, Village of B 42-6.6.6 Trb 142 300
Ridgewood, Village of 43-1.7.7 Trb 198 300
Ridgewood, Village of 43-1.9.1 Trb 1230 300
Ridgewood, Village of 43-2.4.5 Trb 200 300
Ridgewood, Village of 43-2.5.2 Trb 390 320
Ridgewood, Village of 43-4. 3.4 Trb 162 300
Ridgewood, Village of 43-4. 3, 7 Trb 340 303
Ridgewood, Village of 43-4, 3.8 Trb 254 300
Ridgewood, Village of 43-4.6.2 Trb 151 300
Ridgewood, Village of 32-8.6.7 Trb 80 400
Ridgewood, Village of 32-8.3.3 Trb 40 400
Ridgewood, Village of 32-9.4.3 Trb 40 370
Ridgewood, Village of 43-1.7.4 Trb 43 300
Rinbrand Well Drilling Co. 41-2.6.3 Trb 70 216
Ringwood Board of Education 31-3.1. '/ PE 30 413
Ringwood Co. A 31-3. 1.6 Qp-PC 60 375
Ringwood Co. B 31-3. i. 6 Qp-PC 30 164
Ringwood Co. 31-3.1. _/ Qp-PC 6 505
Riverdale Borough 41-2. 1.7 Qp 204 108
Riverdale Borough 41-2.1.7 Trb 230 184
Saddle River Day School 33-8.3.4 Trb 35 400
Sedran, H. 32-7.4. 9 Trbs 150 165
Sher, M. 4.3-2.2.4 Trb 100 205
Siml_on, K. 33-6.4.3 Trb 100 100
Summer Co. 41-3.4. 1 Qp-Trb 70 206Summer Co. 41-3.4. 1 Trb 70 206
Textile Dyeing Co. of America, Inc. 42-6.6.4 Trb 459 400Tice Farms 33-5.9.9 Trb 150 326
Tumer, J. 32-6.4.1 Trb 29"/ 155
Urban Farms 42-1.2.8 Qp 200 87
Valley Spring Lake 41-1.4.2 PC 90 160VanWyk, E. 33-2.9.8 Trb 75 105
Victory Diner 42-6.8.3 Trb 80 250
Vorgish, G. 33-8.2.2 Trb 200 272
Wah-Chang 42-5.3.3 Trb 510 302
Waldwick Borough 32-9.6.3 Trb 223 300
Waldwick Borough A 33-7,4.7 Trb 250 360
Waldwick Borough B 33-7.4.7 Trb 250 199
Waldwick Borough 33-7.4.9 Trb 55 500
24
Well Owner Location Formation Yield G/M Depth Ft.
Waldwick Borough 33-8.7.1 Trb 510 300
Waldwick Borough 33-7.6.6 Trb 75 290
Waldwick Borough 33-7.7.1 Trb 226 300
Waldwick Borough 33-q. ?. 2 Trb 150 302
Waldwick Borough 32-9.5.5 Trb 10 300
Waldwick Borough 32-9.6.3 Trb 60 300
Wayne Twp. A 41-3.4.2 Trb-Trdbs 175 200
Wayne Twl0. B 41-3.4.2 Trb-Trdbs 125 203
Wayne Twp. 41-5.2.3 Qp No. 5 Test NegativeWestwood Fuel Oil Co. 43-3.3.2 Trb 75 236
Westwood Laundry Co. 44-1.5.4 Trb 250 125
White Beeches Golf& Country Club 44-4.3.7 Qsd-Trb 250 171
Wright, D. 33-8.2.2 Trb 200 285
25
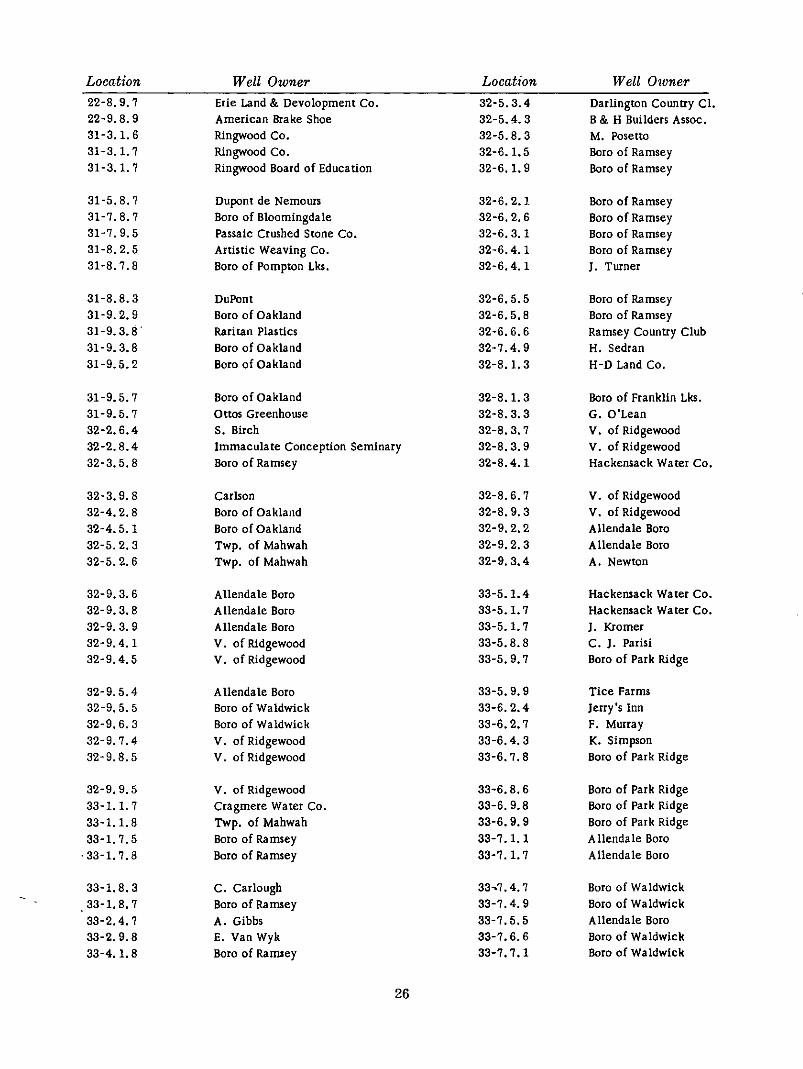
Location Well Owner Location Well Owner
22-8.9.7 Erie Land & Devolopment Co. 32-5.3.4 Darlingmn Country L,t.
22-9.8.9 American Brake Shoe 32-5.4.3 B & H BuildersAssoc.
31-3. i. 6 Ringwood Co. 3'2-5.8.3 M. Posetto
31-3. i. 7 Ringwood Co. 32-6. i. 5 Born of Ramsey
31-3, 1, 7 Ringwood Board of Education 32-6, 1.9 Boro o[ Ramsey
31-5.8.7 Dupont de Nemou_s 32°6.2. ] Boro of Ramsey31-7.8.7 Born of Bloomingdale 32-6.2.8 Born of Ramsey
31-7.9.5 PassaicCrushedStoneCo. 32°6.3.I Boro ofRamsey
31-8.2.5 ArtisticWeaving Co. 32-6.4.1 Boro ofRamsey
31-8.7.8 Boro of Pompton Lks. 32-6.4. 1 J. Turner
31-8.8.3 DuPont 32-6.5.5 Boro of Ramsey
31-9.2, 9 Boro of Oakland 32-6,5.8 Boro of Ramsey
31-9.3.3 _ Raritan Plastics 32-6.6.6 Ramsey Country Club
31-9.3.8 Boro of Oakland 32-7.4.9 H. Sedran
31-9.5..2 Boro of Oakland 32-8. i. 3 H-D Land Co.
31-9.5.7 Boro of Oakland 32-8. I. 3 Boro of Franklin Lks.
31-9.5.7 Olios Greenhouse 32-8.3.3 G. O'Lean
32-2.6.4 S, Birch 32-8.3.7 V. of Ridgewood
32°2.8.4 Immaculate Conception Seminary 32-8.3.9 V. of Ridgewood
32-3.5.8 Boro of Ramsey 32-8.4.1 Hackeusack Water Co.
32-3.9.8 Carlson 32-8.6.7 V. of Ridgewood
32-4.2.8 Boro of Oakland 32-8.9.3 V. of Ridgewood
32-4.5.1 Boro of Oakland 32- 9.2.2 Allendale Bo_o
32-5.2.3 Twp. of Ivlahwah 32-9, 2.3 Allendale Boro
32-5.2, 6 Twp. of Mahwah 32-9.3.4 A. Newton
32-9, 3.8 Atlendale Boro 33-5.1.4 Hackemack Water Co.
32-9.3.8 Allendale Born 33-5.1.7 Hackensack Water Co.
32-9.3.9 AllendaleBoro 33-5.I.7 J. Kromer
32- 9.4.1 V. of Ridgewood 33-5.8.8 C.J. Parisi32-9.4.5 V. of Ridgewood 33-5.9.7 Boro of Park Ridge
32-9.5.4 Allendale Boro 33-5.9.9 Tice Farms
32-9.5.5 Born of Waldwick 33-6.2.4 Jeny's Inn
32-9.6.3 Boro of Waldwick 33-6.2.7 F. Murray
32- 9.7.4 V. of Ridgewood 33-6.4.3 K. Simpson
32-9.8.5 V. of Ridgewood 33-6.9,8 Boro of parkRidge
32-9.9.5 V. of Ridgewood 33-8.8.6 Boro of Park Ridge
33-1.1.7 Cragmere Water Co. 33-6.9.8 Boro of park Ridge
33-1.1.8 Twp. of Mahwah 33-6.9.9 Boro of Park Ridge
33-1.7.3 Boto of Ramsey 33-'/. 1.1 Anendale Boro
• 33-1.7.8 Boro of Ramsey 33-7. i. 7 Allendale Boro
33- i. 8.3 C. Carlough 33-,7.4.7 Boro of Waldwiek
• 33-i. 8.7 Boro of Rarosey 33-7.4.9 Boro of Wa Idwick33-2.4.7 A. Gibbs 33-7.5,5 Allendale Boro
33-2. 9.8 E. Van Wyk 33-_. 6. B Boro of Waldwick
33-4.1.8 Boro of Ramsey 33-7.7.1 Boro of Waldwick
26
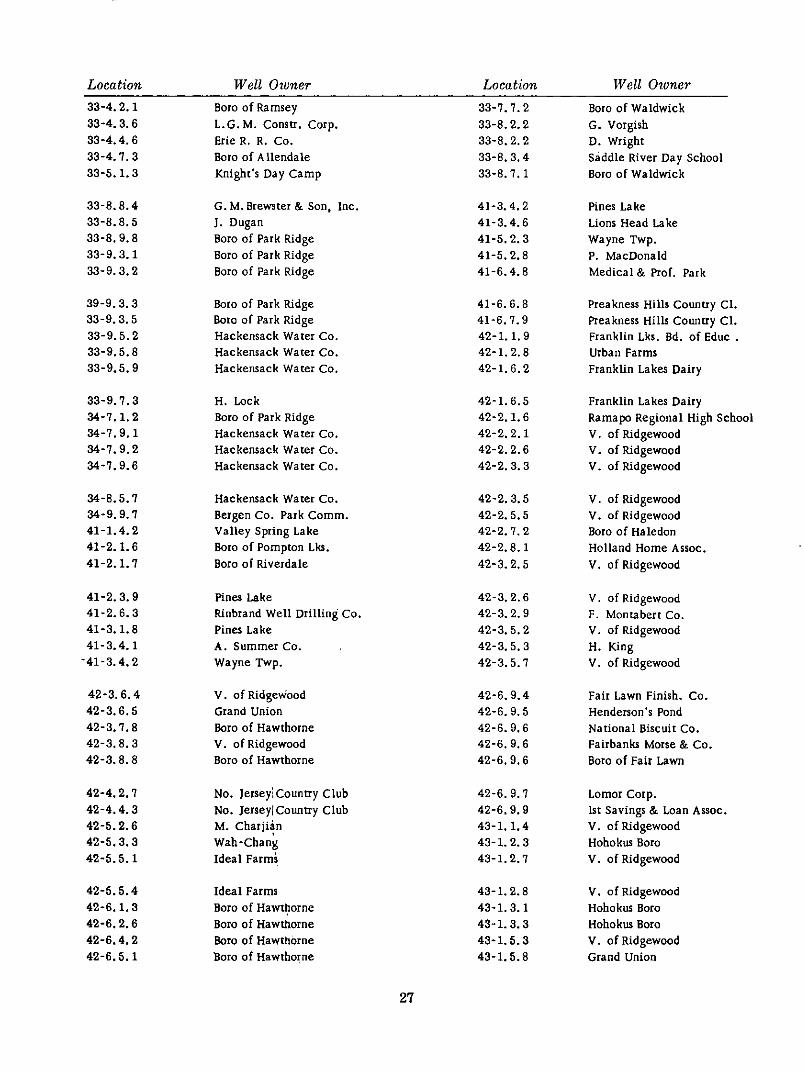
Location Well Owner Location Well Owner
33-4.2.1 Born of Ramsey 33-7.7.2 Born of Waldwick
33-4. 3.6 L.G.M. Consu. Corp. 33-8.2.2 G. Vorgish
33-4.4.6 Erie R. R. Co. 33-8.2.2 D. Wright
33-4.7.3 Born of Allendale 33-8.3.4 Saddle River Day School
33-5.1.3 Knight's Day Camp 33-8.7.1 Born of Waldwick
33-8.8.4 G.M. Brewster & Son, Inc. 41-3.4.2 Pines Lake
33-8.8.5 ]. Dugan 41-3.4.6 Lions Head Lake
33-8.9.8 Born of Park Ridge 41-5.2.3 Wayne Twp.
33-9.3.1 Born of Park Ridge 41-5.2.8 P. MacDonald
33-9.3.2 Born of Park Ridge 41-6.4.8 Medical & Prof. Park
39-9.3.3 Born of Park Ridge 41-6.6.8 Preakness Hills Country C1.
33-9.3.5 Bore of Park Ridge 41-6.7.9 Preakness Hills Counuy C1.33-9.5.2 Hackensack Water Co. 42-1.1.9 Franklin Lks. Bd. of Educ .
33-9.5.8 Hac keesack Water Co. 42-1.2.8 Urban Farms
33- 9.5.9 Hackensack Water Co. 42-1.6.2 Franklin Lakes Dairy
33-9.7.3 H. Lock 42-1.6.5 Franklin Lakes Dairy
34-7.1.2 Born of Park Ridge 42-2.1.6 Ramapo Regional High School
34-7.9.1 Hackensack Wamr Co. 42-2.2.1 V. of Ridgewood34-7.9.2 Hackensack Water Co. 42-2.2.6 V. of Ridgewood
34-7.9.6 Hackensack Water Co. 42-2.3. 3 V. of Ridgewood
34-8.5.7 Hackensack Water Co. 42-2.3.5 V. of Ridgewood
34-9. 9. ? Bergen Co. Park Comm. 42-2. 5.5 V. of Ridgewood41-1.4.2 Valley Spring Lake 42-2.7.2 Born of Haledon
41-2. I. 6 Born of Pompton Lks. 42-2.8.1 Holland Home Assoc.
41-2.1.7 Born of Riverdale 42-3.2.5 V. of Ridgewood
41-2.3.9 Pines Lake 42-3. 2.6 V. of Ridgewood
41-2.6.3 Rinbrand Well Drilling Co. 42-3. 2.9 F. Momabert Co.
41-3.1.8 Pines Lake 42-3. 5.2 V. of Ridgewood
41-3.4.1 A. Summer Co. 42-3. 5.3 H. King
"41-3.4.2 Wayne Twp. 42-3.5. "/ V. of Ridgewood
42-3.6.4 V. of Ridge_dood 42-6.9.4 Fair Lawn Finish. Co.42-3.6.5 Grand Union 42-6.9.5 Henderson's Pond
42-3. "/. 8 Born of Hawthorne 42-6.9.6 National Biscuit Co.
42-3.8.3 V. of Ridgewood 42-6.9.6 Fairbanks Morse & Co.42-3.8.8 Born of Hawthorne 42-6.9.6 Born of Fair Lawn
42-4.2.7 No. Jersey _,Country Club 42-6.9. q Lomor Corp.
42-4.4.3 No. Jerseyi Country Club 42-6.9.9 1st Savings & Loan Assoc.
42-5.2.6 M. Charjian 43-1.1.4 V. of Ridgewood42-5.3.3 Wah-Chang 43-1. 2. 3 Hohokus Born
42-5.5.1 Ideal Farm_ 43-1.2. "1 V. of Ridgewood
42-5.5.4 Ideal Farms 43-1.2.8 V. of Ridgewood
42-6.1.3 Born of Haw_. orne 43-1.3.1 Hohokus Born42-6.2.6 Born of Hawttlorne 43-1.3.3 Hohokus Born
42-6.4.2 Born of Hawrh0rne 43-1.5.3 V. of Ridgewood
42-6.5.1 Born of Hawthorne 43-1.5.8 Grand Union
27
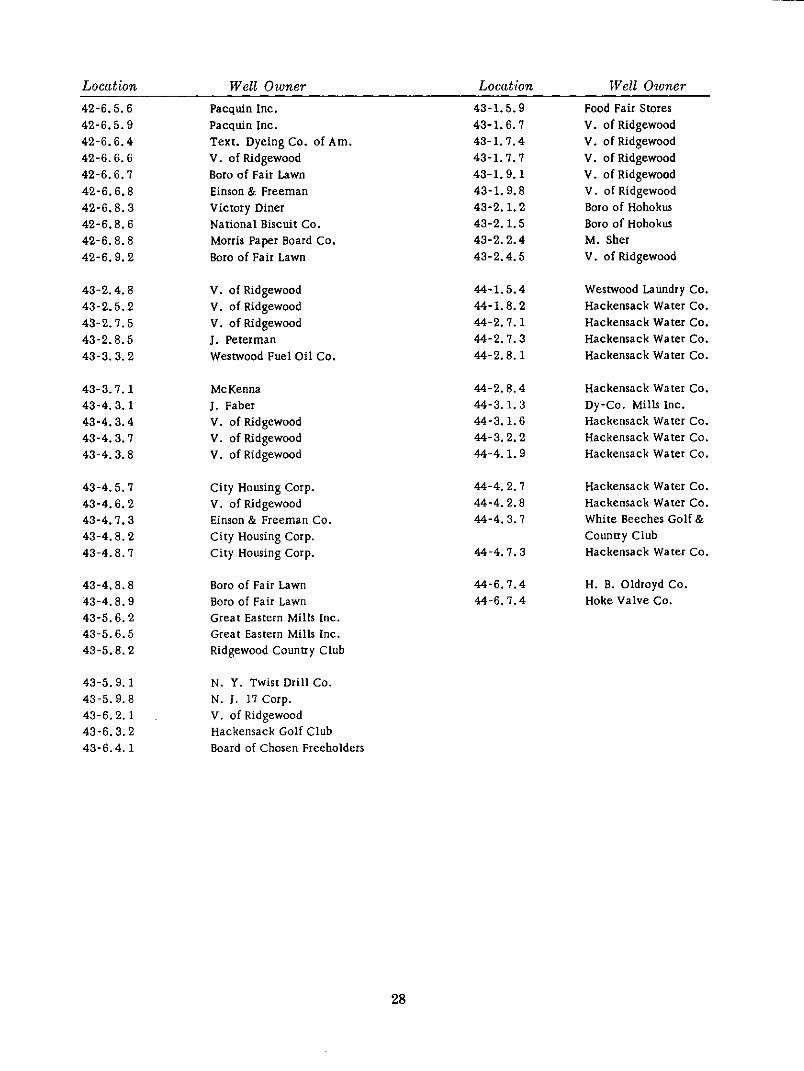
Location Well Owner Location Well Owner
42-6.5.6 Pacquin Inc. 43-1.5.9 Food Fair Stores
42-6.5.9 Pacquin Inc. 43-1.6.7 V. of Ridgewood
42-6.6.4 Text. Dyeing Co. of Am. 43-1.7.4 V. of Ridgewood
42-6.6.6 V. of Ridgewood 43-1.7.7 V. of Ridgewood
42-6.6.7 Boro of Fair Lawn 43-1.9.1 V. of Ridgewood
42-6.6.8 Einson & Freeman 43-1.9.8 V. of Ridgewood
42-6.8.3 Victory Diner 43-2.1.2 Boro of Hohokus42-6.8.6 National Biscuit Co. 43-2.1.5 Boro of Hohokus
42-6.8.8 Morris Paper Board Co. 43-2.2.4 M. Sher
42-6.9.2 Boro of Fair Lawn 43-2.4.5 V. of P,Jdgewood
43-2.4.8 V. of Ridgewood 44-1.5.4 Wear'wood Laundry Co.
43-2.5.2 V. of Ridgewood 44-1.8.2 Hackensack Water Co.
43-2.7.5 V. of Ridgewood 44-2.7.1 Hackensack Water Co.43-2.8.5 I. Peterman 44-2.7.3 Hackensack Water Co.43-3.3.2 West'wood Fuel Oil Co. 44-2.8.1 Hackensack Water Co.
43-3.7.1 McKenna 44-2.8.4 Haekemack Water Co.
43-4.3.1 J. Faber 44-3.1.3 Dy-Co. Mills Inc.
43-4.3.4 V. of Ridgewood 44-3.1.6 Haekensack Water Co.
43-4.3.7 V. of Ridgewood 44-3.2.2 Hackensack Water Co.
43-4.3.8 V. of Ridgewood 44-4. 1.9 Haekensaek Water Co.
43-4.5.7 City Homing Corp. 44-4.2.7 Haekensack Water Co.
43-4. 6.2 V. of Ridgewood 44-4.2.8 Hackemaek Water Co.43-4.7.3 Einson & Freeman Co. 44-4. 3.7 white Beeches Golf &
43-4.8.2 City Housing Corp. Country Club
43-4.8.7 City Housing Corp. 44-4.7.3 Haekemack Water Co.
43-4.8.8 Boro of Fair Lawn 44-6.7.4 H.B. Oldroyd Co.
43-4.8.9 Boro of Fair Lawn 44-6.7.4 Hoke Valve Co.
43-5.6.2 Great Eastern Mills Inc.
43-5.6.5 Great Eastern Mills Inc.
43-5.8.2 Ridgewood Country Club
43-5.9.1 N.Y. Twist Drill Co.
43-5.9.8 N.J. 17 Corp.
43-6.2.1 V. of Ridgewood43-6.3.2 Hackemaek Golf Club
43-6.4.1 Board of Chosen Freeholders
28
APPENDIX A
The New Jersey Rectangular Coordinate System
The New Jersey Atlas Sheets, on a scale of 1 inch per mile, form the basis of the New
Jersey Rectangular Coordinate System. These sheets are numbered from 21 to 37, inclusive. On
these maps lines of latitude and longitude are engraved at two minute intervals, so the sheets
are already divided into rectangles each representing two minutes of latitude and two minutes
of longitude. Since each of the atlas sheets comprise 26 degrees of longitude and 28 degreesof latitude, there are 13 of these rectangles from east to west and 14 from north to south.
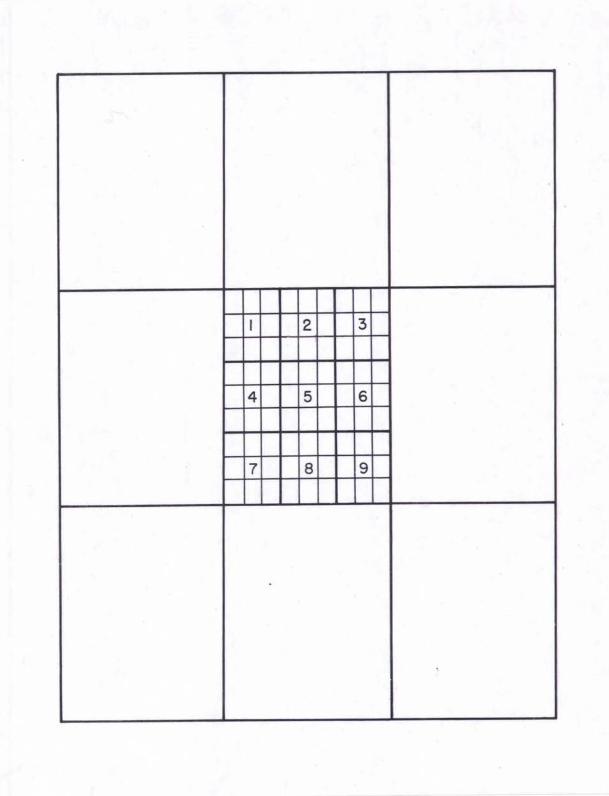
On the overlays provided with this report, every third line of longitude and of latitude
has been ruled. Thus, the sheet is divided into 16 blocks each containing nine of the smallertwo minute rectangles.
In addition to the 16 complete six minute blocks there is, along the right-hand side of the
sheet, a single row of the two minute rectangles and along the bottom a double row of rectangles.
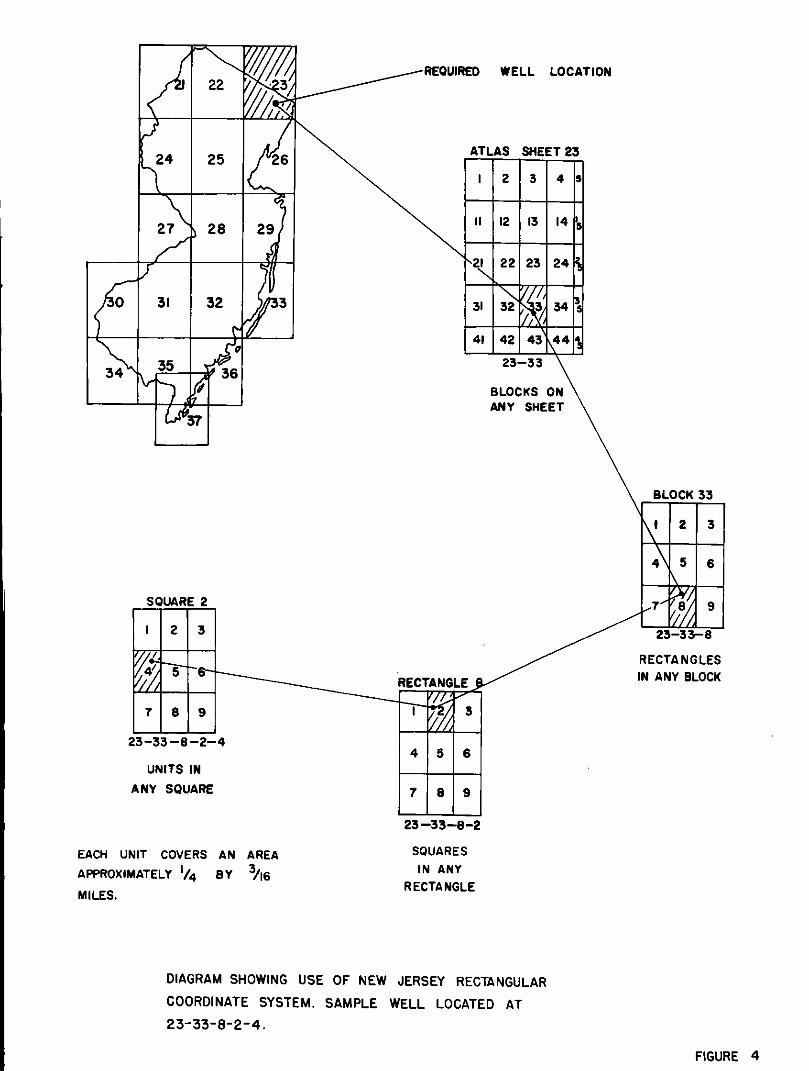
Beginning in the upper left-hand corner, these large blocks are numbered across the sheet
01 to 05, inclusive. There is a row of incomplete blocks at the right, 5, 15, 25, etc. on the right
margin of each sheet. The blocks of the second row are numbered 10 to 15, those of the thirdrow 21 to 25, of the fourth row 31 to 35. The incomplete blocks at the bottom 41 to 45 contain
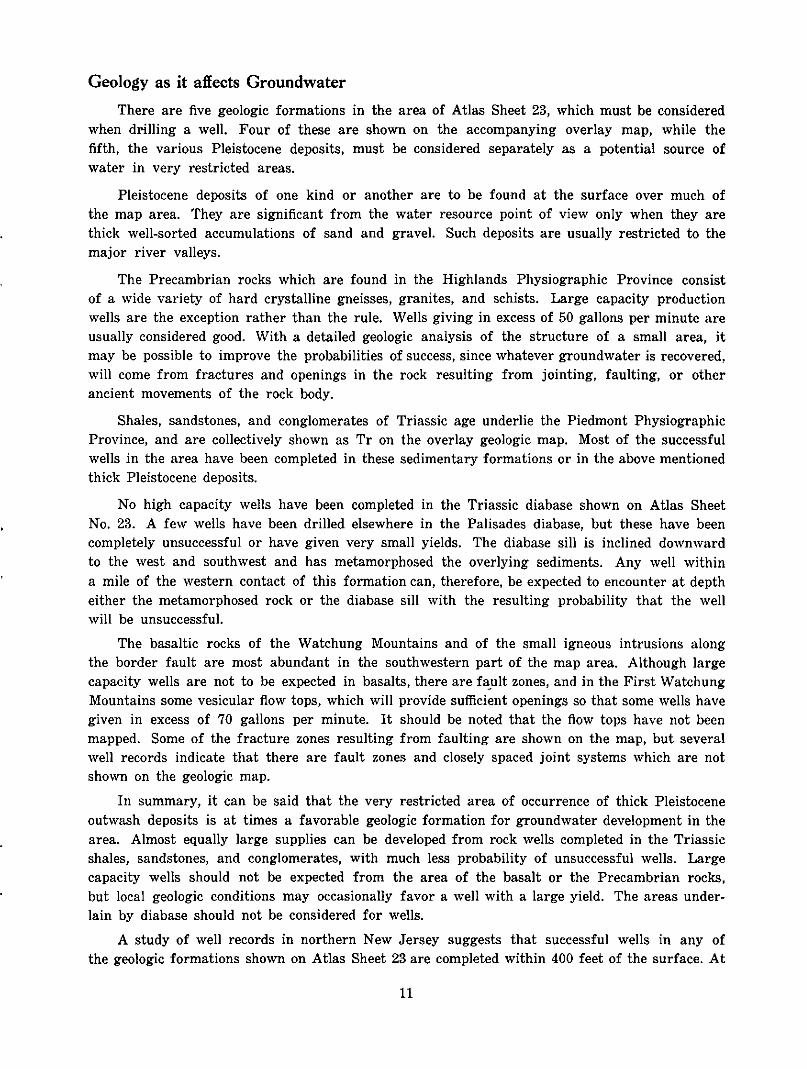
only six of the two minute rectangles. Figures 1 or 4 illustrates on a small scale the arrangementand numbering of these blocks which form the primary divisions of each atlas sheet.
The nine two minute rectangles in each of these blocks are numbered from 1 to 9, beginningin the upper left-hand corner, and numbering to the right, 4 being on the left under 1. The
subdivisions of the incomplete blocks at the right are numbered 1.4.7; and those at the bottom
1.2.3.4.5.6. and of block 45 at lower right corner 1 and 4. The manner of numbering thesesubdivisions is shown in Figure 4.
The two minute rectangles constitute the secondary subdivision of the atlas sheet. Each
of the two minute rectangles is then divided into nine tertiary subdivisions or squares. These
are numbered 1 to 9, in the same way as for the secondary divisions, or rectangles within theblock.
A further subdivision of each of these squares is necessary in order to fix locations accuratelyand these units are likewise numbered 1 to 9. Figure 4 represents a six minute block divided
into the two minute rectangles, with the tertiary subdivisions of one of these rectangles numberedand to show squares and one of these again divided into the still smaller units.
By writing first the number of the atlas sheet, and then the number of each of these smallest
divisions or units any small area of the state will have a number of its own, different from that
of any other area in the State. This number can be applied to it quickly and without difficulty.
Alternatively having been given a number, the corresponding area can be located quickly on anyatlas sheet.
The transparent guide, which is provided in the back pocket of this report, has been ruledto show the smallest subdivision, and will fit (more or less) on the boundaries of a block or
on a two minute rectangle. When properly aligned on the block, and then shifted to place the
sub-divided rectangle over the proper area, the last three digits of the rectangular coordinatecan be obtained.
29
Thus, the rectangular coordinates for any map in New Jersey consist of 7 digits. The first
two are the map numbers. In using any report keyed to an atlas sheet, such as is the case
here, the first two digits are not pertinent. The next two digits represent the six minute block.
The blocks are shown on the overlay with shaded numbers. The transparent template in the back
pocket will aid in deriving the last three digits of the coordinate number, which indicates one of
the nine rectangles, squares, and units applied to the location of the specific spot in New Jersey.
3O
/_"_ _ *ELL LOCATIO.
22
L, 24 25 _ ATLAS SHEET 25I 2 3 4
27_ 28 _!29 II 12 ,/,,,,1314
r/ 22232,
\///,
0 31 32 31 52 ,,/,_, 34
_" 41 42 43 _44
4 \
35 23--33
'_ _"_ J_ BLOCKS.i ;, ANY SHEET
BLOCK 33
! 2 3
SQUARE 2 .-7 / 9'7/zI 2 3 23-33--8
RECTANGLES
//4_/"'5" _6"- IN ANY BLOCK"_CTANGL E
7 8 9 ...T.._///_,f'l/JS
23-33 -8-2-44 5 6
UNITS IN
ANY SQUARE 7 B 9
23 --33--8-2
EACH UNIT COVERS AN AREA SQUARES
APPROXIMATELYi/4 BY 3/16 IN ANYRECTANGLEMILES.
DIAGRAM SHOWING USE OF NEW JERSEY RECTANGULAR
COORDINATE SYSTEM, SAMPLE WELL LOCATED AT
23-33-8-2-4.
FIGURE 4
APPENDIX B
Governmental Units, ATLAS SHEET 23
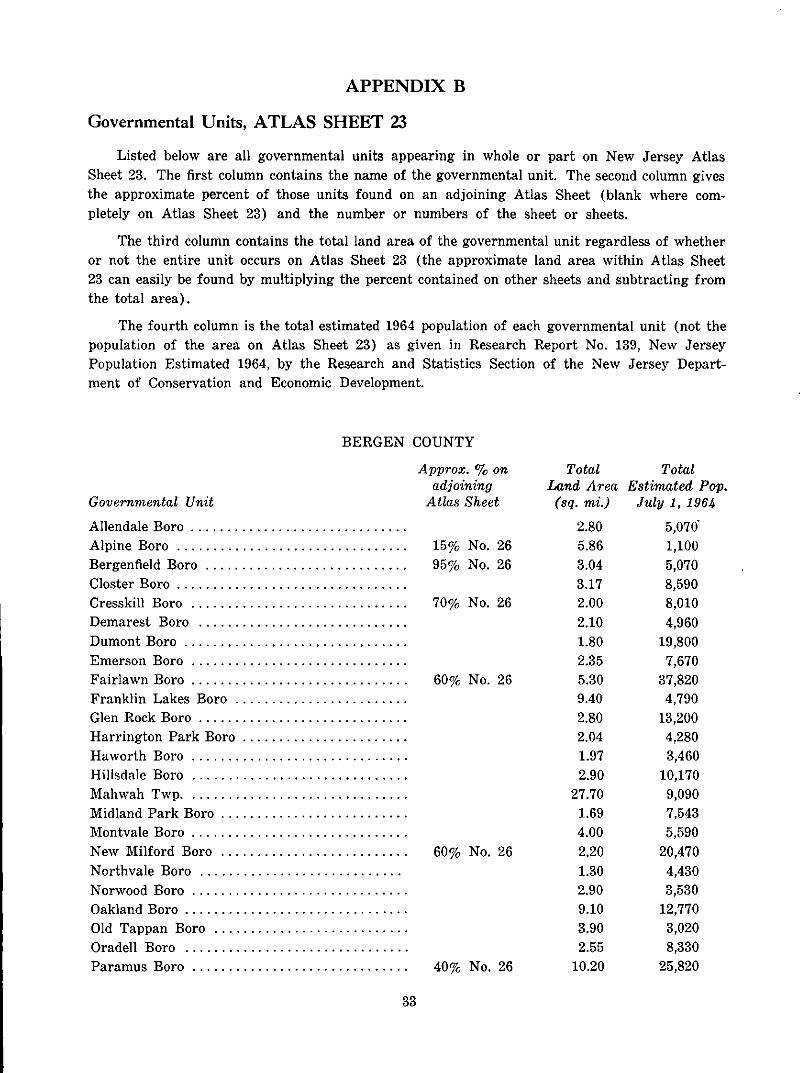
Listed below are all governmental units appearing in whole or part on New Jersey Atlas
Sheet 23. The first column contains the name of the governmental unit. The second column gives
the approximate percent of those units found on an adjoining Atlas Sheet (blank where com-
pletely on Atlas Sheet 23) and the number or numbers of the sheet or sheets.
The third column contains the total land area of the governmental unit regardless of whether
or not the entire unit occurs on Atlas Sheet 23 (the approximate land area within Atlas Sheet
23 can easily be found by multiplying the percent contained on other sheets and subtracting from
the total area).
The fourth column is the total estimated 1964 population of each governmental unit (not the
population of the area on Atlas Sheet 23) as given in Research Report No. 139, New Jersey
Population Estimated 1964, by the Research and Statistics Section of the New Jersey Depart-
ment of Conservation and Economic Development.
BERGEN COUNTY
Approx. % on Total Totaladjoining Land Area Estimated Pop.
Governmental Unit Atlas Sheet (sq. mi.) July 1, 1964
Allendale Boro .............................. 2.80 5,070"
Alpine Boro ................................ 15% No. 26 5.86 1,100
Bergenfield Boro ............................ 95% No. 26 3.04 5,070
Closter Boro ................................ 3.17 8,590
Cresskill Boro .............................. 70% No. 26 2.00 8,010
Demarest Boro ............................. 2.10 4,960
Dumont Boro ............................... 1.80 19,800
Emerson Boro .............................. 2.35 7,670
Fairlawn Boro .............................. 60% No. 26 5.30 37,820
Franklin Lakes Boro ........................ 9.40 4,790
Glen Rock Boro ............................. 2.80 13,200
Harrington Park Boro ....................... 2.04 4,280
Haworth Boro .............................. 1.97 3,460
Hillsdale Boro .............................. 2.90 10,170
Mahwah Twp ............................... 27.70 9,090
Midland Park Boro .......................... 1.69 7,543
Montvale Boro .............................. 4.00 5,590
New Milford Boro .......................... 60% No. 26 2.20 20,470
Northvale Boro ............................ 1.30 4,430
Norwood Boro .............................. 2.90 3,530
Oakland Boro ............................... 9.10 12,770
Old Tappan Boro ........................... 3.90 3,020
Oradell Boro ............................... 2.55 8,330
Paramus Boro .............................. 40% No. 26 10.20 25,820
33
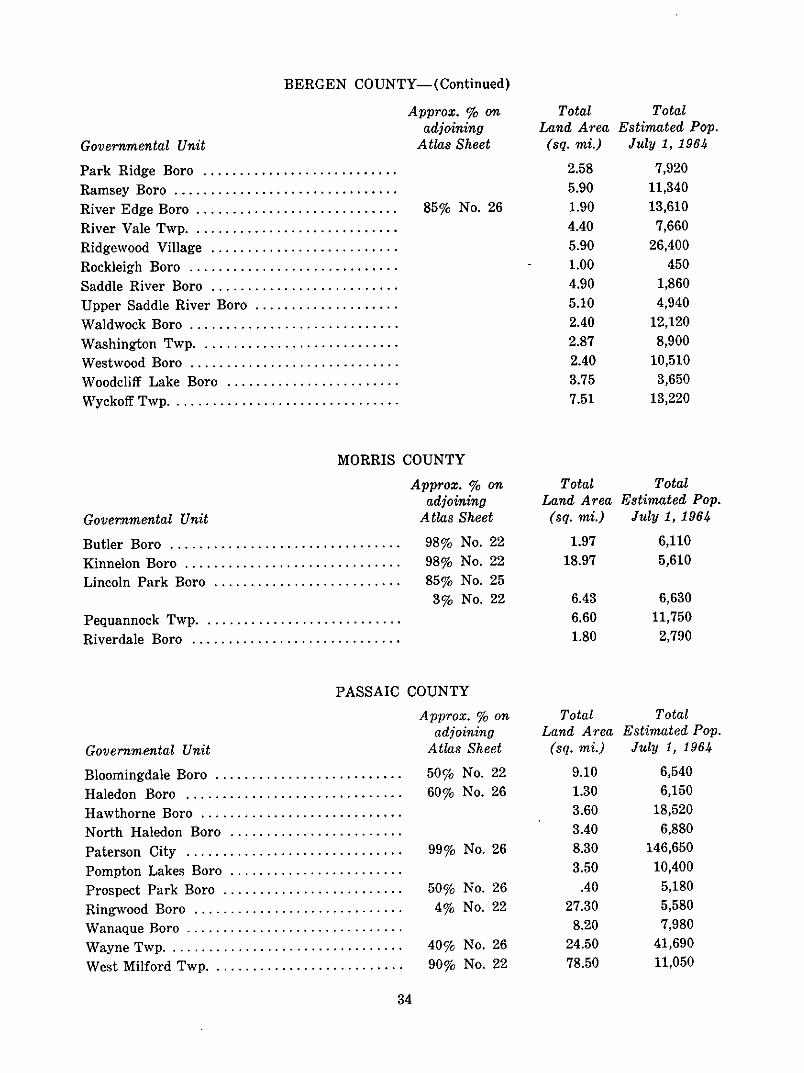
BERGEN COUNTY---(Continued)
Approx. % on Total Totaladjoining Land Area Estimated Pop.
Governmental Unit Atlas Sheet (sq. mi.) July 1, 1964
Park Ridge Boro ........................... 2.58 7,920
Ramsey Boro ............................... 5.90 11,340
River Edge Boro ............................ 85% No. 26 1.90 13,610
River Vale Twp. ............................ 4A0 7,660
Ridgewood Village .......................... 5.90 26,400
Rockleigh Boro ............................. 1.00 450Saddle River Boro .......................... 4.90 1,860
Upper Saddle River Boro .................... 5.10 4,940Waldwoek Boro ............................. 2A0 12,120
Washington Twp. ........................... 2.87 8,900Westwood Boro ............................. 2.40 10,510
Woodcliff Lake Boro ........................ 3.75 3,650
Wyckoff Twp. ............................... 7.51 13,220
MORRIS COUNTY
Approx. % on Total Totaladjoining Land Area Estimated Pop.
Governmental Unit Atlas Sheet (sq. mi.) July 1, 1964
Butler Boro ................................ 98% No. 22 1.97 6,110
Kinnelon Boro .............................. 98% No. 22 18.97 5,610
Lincoln Park Boro .......................... 85% No. 25
3% No. 22 6A3 6,630
Pequannock Twp. ........................... 6.60 llf150Riverdale Boro ............................. 1.80 2,790
PASSAIC COUNTY
Approx. % on Total Totaladjoining Land Area Estimated Pop.
Governmental Unit Atlas Sheet (sq. mi.) July 1, 1964
Bloomingdale Boro .......................... 50% No. 22 9.10 6,540Haledon Boro .............................. 60% No. 26 1.30 6,150
Hawthorne Boro ............................ 3.60 18,520
North Haledon Boro ........................ 3A0 6,880
Paterson City .............................. 99% No. 26 8.30 146,650
Pompton Lakes Boro ........................ 3.50 10,400
Prospect Park Boro ......................... 50% No. 26 A0 5,180
Ring_vood Boro ............................. 4% No. 22 27.30 5,580
Wanaque Boro .............................. 8.20 7,980
Wayne Twp ................................. 40% No. 26 24.50 41,690
West Milford Twp ........................... 90% No. 22 78.50 11,050
34