Embed Size (px)
Citation preview

State of North Carolina
Department of Administration
HISTORICALLY UNDERUTILIZED BUSINESSES (HUB)
PURCHASING (GOODS & SERVICES) AND CONSTRUCTION PROJECT REPORT
Fiscal Year 2006 - 07 (July 1, 2006 – June 30, 2007)
State of North Carolina
Michael F. Easley, Governor
N.C. Department of Administration
Britt Cobb, Secretary
Office for Historically Underutilized Businesses Bridget L. Wall, Assistant to Secretary for HUB Outreach
Rick Baskett Sr., Deputy Director Mathew Idiculla, Compliance Specialist
Prepared by:
Office for Historically Underutilized Businesses 116 West Jones Street, Suite 2109
Raleigh, NC 27603
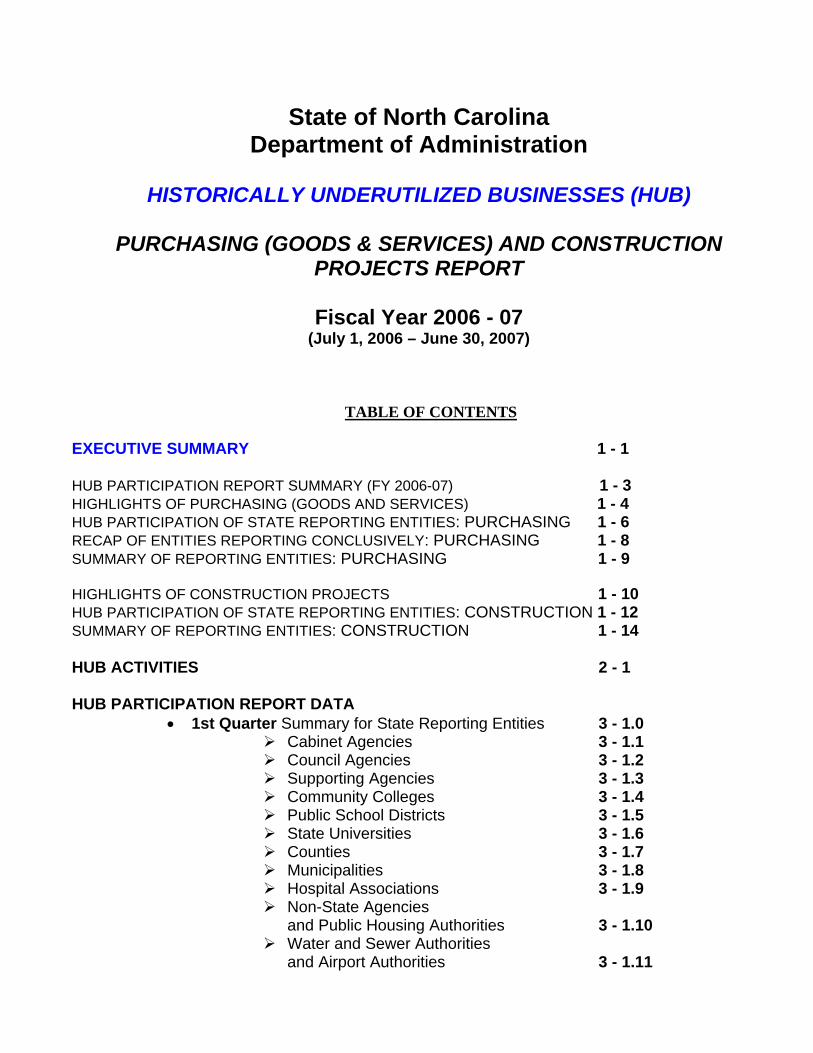
State of North Carolina Department of Administration
HISTORICALLY UNDERUTILIZED BUSINESSES (HUB)
PURCHASING (GOODS & SERVICES) AND CONSTRUCTION
PROJECTS REPORT
Fiscal Year 2006 - 07 (July 1, 2006 – June 30, 2007)
TABLE OF CONTENTS
EXECUTIVE SUMMARY 1 - 1
HUB PARTICIPATION REPORT SUMMARY (FY 2006-07) 1 - 3 HIGHLIGHTS OF PURCHASING (GOODS AND SERVICES) 1 - 4 HUB PARTICIPATION OF STATE REPORTING ENTITIES: PURCHASING 1 - 6 RECAP OF ENTITIES REPORTING CONCLUSIVELY: PURCHASING 1 - 8 SUMMARY OF REPORTING ENTITIES: PURCHASING 1 - 9 HIGHLIGHTS OF CONSTRUCTION PROJECTS 1 - 10 HUB PARTICIPATION OF STATE REPORTING ENTITIES: CONSTRUCTION 1 - 12 SUMMARY OF REPORTING ENTITIES: CONSTRUCTION 1 - 14 HUB ACTIVITIES 2 - 1
HUB PARTICIPATION REPORT DATA
1st Quarter Summary for State Reporting Entities 3 - 1.0 Cabinet Agencies 3 - 1.1 Council Agencies 3 - 1.2 Supporting Agencies 3 - 1.3 Community Colleges 3 - 1.4 Public School Districts 3 - 1.5 State Universities 3 - 1.6 Counties 3 - 1.7 Municipalities 3 - 1.8 Hospital Associations 3 - 1.9 Non-State Agencies
and Public Housing Authorities 3 - 1.10 Water and Sewer Authorities
and Airport Authorities 3 - 1.11

2nd Quarter Summary for State Reporting Entities 3 - 2.0 Cabinet Agencies 3 - 2.1 Council Agencies 3 - 2.2 Supporting Agencies 3 - 2.3 Community Colleges 3 - 2.4 Public School Districts 3 - 2.5 State Universities 3 - 2.6 Counties 3 - 2.7 Municipalities 3 - 2.8 Hospital Associations 3 - 2.9 Non-State Agencies
and Public Housing Authorities 3 - 2.10 Water and Sewer Authorities
and Airport Authorities 3 - 2.11
3rd Quarter Summary for State Reporting Entities 3 - 3.0 Cabinet Agencies 3 - 3.1 Council Agencies 3 - 3.2 Supporting Agencies 3 - 3.3 Community Colleges 3 - 3.4 Public School Districts 3 - 3.5 State Universities 3 - 3.6 Counties 3 - 3.7 Municipalities 3 - 3.8 Hospital Associations 3 - 3.9 Non-State Agencies
and Public Housing Authorities 3 - 3.10 Water and Sewer Authorities
and Airport Authorities 3 - 3.11
4th Quarter Summary for State Reporting Entities 3 - 4.0 Cabinet Agencies 3 - 4.1 Council Agencies 3 - 4.2 Supporting Agencies 3 - 4.3 Community Colleges 3 - 4.4 Public School Districts 3 - 4.5 State Universities 3 - 4.6 Counties 3 - 4.7 Municipalities 3 - 4.8 Hospital Associations 3 - 4.9 Non-State Agencies
and Public Housing Authorities 3 - 4.10 Water and Sewer Authorities
and Airport Authorities 3 - 4.11
Year-End Summary for State Reporting Entities 4

1-1
EXECUTIVE SUMMARY
Effective April 20, 1999 and as a result of Executive Order # 150, the Office for Historically Underutilized Businesses (HUB Office) was established in the Office of the Secretary of the North Carolina Department of Administration. HUB participation goals and reporting requirements for state agencies and public entities are contained in North Carolina Statute (NCGS) 143-48 for goods and services and NCGS 143-128.2, 143-128.3 and 143-131 for construction. Further discussion of these statutes is mentioned below.
PURCHASING (GOODS AND SERVICES) AND CONSTRUCTION PROJECTS
The report for the fiscal year 2006 - 07 includes purchasing (goods and services) and construction projects data submitted to the HUB Office by the state agencies and other public entities. A. PURCHASING (GOODS and SERVICES) The Office for Historically Underutilized Businesses (HUB Office) serves as an advocate for HUB vendors, which includes businesses owned by minorities, women, persons with a disability, disabled businesses, and non-profit work centers for the blind and severely disabled. The HUB Office promotes the State’s on-line vendor registration and HUB certification process, provides technical assistance, and conducts training on how to conduct business with state government. The HUB Office captures data reflecting the State’s HUB utilization and expenditures of the state agencies, community colleges, public schools and universities, while also serving as a resource to these agencies. Executive Order #150 states that North Carolina’s Historically Underutilized Business participation goal is at least ten percent (10%), by dollar amount, of the State’s purchases of goods and services, will be derived from HUB vendors. Executive Order 150 further requires the submission of quarterly HUB purchasing reports to the HUB Office. The goal for fiscal year 2006-2007 (July 1, 2006 through June 30, 2007) currently remains at 10%. The following legislation also addresses the State’s minority business goals and reporting requirements for goods and services: G.S. 143-48 (b) states “in part”…. “Every governmental entity required by statute to use the services of the Department of Administration in the purchase of goods and services, every local school administrative unit, and every private, non-profit corporation other than an institution of higher education or a hospital that receives an appropriation of five hundred thousand dollars ($500,000) or more during a fiscal year from the General Assembly shall report”. Cabinet Agencies, Council Agencies, Supporting Agencies, Community Colleges, Public School Districts and State Universities submit a quarterly HUB purchasing report to the Office for Historically Underutilized Businesses. The figures reported include multi-year contracts. Because those figures are only reported in the year that the contract is actually awarded, HUB participation numbers may be reduced in subsequent fiscal years. Total purchases and HUB participation are subject to change or differ from the submitted quarterly purchasing report data due to the “run date” of each report. Agencies reporting through NCAS (North Carolina Accounting System) provide a snap shot of its purchases quarterly. The HUB Office compiles the reported purchase transaction amounts and

1-2
generates a cumulative report. The adjustments made to the purchase orders are not recorded in the subsequent periods. Purchasing and HUB Participation Quarterly Report data include purchase orders, and service contracts awarded each quarter. Some entities include Procurement Card (P-Card) and direct pay (manual check) transactions. Reports from the state reporting entities are due no later than thirty (30) days after the end of each quarter and reflect each entity’s HUB purchases within the following categories: Term Contracts Commodity Purchases (Non-term contract purchases) Service Contracts B. CONSTRUCTION PROJECTS Construction project data is an important component of the overall HUB participation reporting requirements. On December 6, 2001, the General Assembly enacted Senate Bill 914, which made historic changes to laws governing public construction in the State of North Carolina. Senate Bill 914 signed by Governor Michael F. Easley on December 19, 2001 became effective January 1, 2002. Senate Bill 914 affords flexibility in the public construction bidding process, provides for significant new requirements for promoting the use of minority contractors, as well as documenting and reporting good faith effort to that end. All public entities, including but not limited to, state agencies, universities, community colleges, public schools, county governments, municipalities and other local governments, are required to report both formal bids (=>$300K) and informal bids (<$300K) construction project data. Note: Effective August 23, 2007, projects funded on or after July1, 2007, the formal project threshold increased to $500K. The following legislation addresses the State’s minority business goals and reporting requirements for construction: G.S. 143-128.2 states “in part”…. “The State shall have a verifiable ten percent (10%) goal for participation by minority businesses in the total value of work for each State building project, including building projects done by a private entity on a facility to be leased or purchased by the State". G.S. 143-128.3 states “in part “… “All public entities subject to G. S. 143-128.2 shall report to the Department of Administration, Office of Historically Underutilized Businesses, the following with respect to each building project: (1) The verifiable percentage goal. (2) The type and total dollar value of the project, minority business utilization by minority business category, trade, total dollar value of contracts awarded to each minority group for each project, the applicable good faith effort guidelines or rules used to recruit minority business participation, and good faith documentation accepted by the public entity from the successful bidder. (3) The utilization of minority businesses under the various construction methods under G. S. 143-128 (a1). G.S. 143-131 states “in part”…“ (b) All public entities shall solicit minority participation in contracts for the erection, construction, alteration or repair of any building awarded pursuant to this section. The public entity shall maintain a record of contractors solicited and shall document efforts to recruit minority business participation in those contracts. Construction data is captured electronically through the HUBSCO Construction Reporting System via a web-based Internet site. All public entities are required to report completed construction project data and submit it to the HUB Office. The HUBSCO system has the capability that allows each entity to generate and view its own report (http://www.hubsco.com/).

1-3
The report includes both total construction project value and HUB participation for construction projects. The design related and miscellaneous values are captured by the HUBSCO system but not reported as a part of HUB participation (not required by G.S.143-128). The HUB Office offers HUBSCO training to public entities on how to access and utilize HUBSCO Construction Reporting System. The training schedule, training request form, and system access form are available via the HUB Office website (www.doa.nc.gov/hub).
HUB PARTICIPATION REPORT SUMMARY FY 2006-07(July 1, 2006 – June 30, 2007)
Purchases (Good and Services):
Quarter Description 1st Quarter 2nd Quarter 3rd Quarter 4th Quarter Total Purchases ($M) 1,315.46 980.17 1,101.25 1,398.42 HUB ($M) 106.42 78.39 85.41 102.46 HUB Participation 8.09% 8.00% 7.76% 7.33%
At Fiscal Year-End 2006 - 07 Purchases Reported Total $4,795,305,661
At Fiscal Year-End 2006 - 07 HUB Purchases Reported Total $372,682,151
At Fiscal Year-End 2006 - 07 HUB Participation 7.77%
Source: HUB Office, Department of Administration - Quarterly HUB Reporting Database Construction Projects:
Quarter Description 1st Quarter 2nd Quarter 3rd Quarter 4th Quarter Total Construction ($M) 244.57 150.17 126.77 259.56 HUB ($M) 31.62 23.48 14.70 30.56 HUB Participation 12.93% 15.63% 11.60% 11.78%
At Fiscal Year-End 2006 - 07 Construction Reported Total $781,070,180
At Fiscal Year-End 2006 - 07 HUB Construction Reported Total $100,367,227
At Fiscal Year-End 2006 - 07 HUB Participation 12.85%
Source: HUB Office, Department of Administration - HUBSCO Construction Reporting System

1-4
HIGHLIGHTS OF PURCHASING (GOODS AND SERVICES) 1. Total Purchases and HUB participation by quarter for FY 2006-07 (July 1, 2006 - June 30, 2007)
0.00
200.00
400.00
600.00
800.00
1,000.00
1,200.00
1,400.00$Million
HUB Participation
Total Purchases ($M )
HUB ($M )
Total Purchases ($M) 1,315.46 980.17 1101.25 1398.42
HUB ($M) 106.42 78.39 85.41 102.46
1st Quarter 2nd Quarter 3rd Quarter 4th Quarter
HUB Participation 8.09% 8.00% 7.76% 7.33%
At Fiscal Year-End 2006 - 07 Purchases Reported Total $4,795,305,661
At Fiscal Year-End 2006 - 07 HUB Purchases Reported Total $372,682,151
At Fiscal Year-End 2006 - 07 HUB Participation 7.77%
Source: HUB Office, Department of Administration - Quarterly HUB Reporting Database During the 1st, 2nd, 3rd, and 4th quarter of fiscal year 2006 - 07 (July 1, 2006 – June 30, 2007), HUB purchasing (goods and service) participation for the State of North Carolina, as reported by the State Reporting Entities, is 8.09%, 8.00%, 7.55%, and 7.33% respectively. At Fiscal Year-End 2006 - 07 (July 1, 2006 – June 30, 2007), HUB purchasing participation for the State of North Carolina, as reported by the State Reporting Entities, is 7.77%. Purchases reported total $4,795,305,661 with $372,682,151 reported HUB participation.

1-5
2. HUB Purchasing Participation Percentage of the Total Purchases by Minority Category for FY 2006 - 07 (July 1, 2006 – June 30, 2007) FY 2006 - 07 Year-End HUB Participation % of $ Total Purchases
0.06%0.09%
0.25%0.22%
2.53%
4.62%
MBE
WBE
DBE-O
DBE
NPWC
Sub
Source: HUB Office, Department of Administration - Quarterly HUB Reporting Database
LEGEND: MBE - Minority Business Enterprise
WBE - Woman Business Enterprise DBE-O- Disabled - Owned Business Enterprise DBE - Disabled Business Enterprise NPWC - Non - profit Work Center for the Blind & Severely Disabled Sub - HUB Subcontractor
At Fiscal Year-End 2006-07:
Total MBE purchases $121,445,571 (2.53%), Total WBE purchases $221,650,294 (4.62%), Total DBE-O purchases $11,992,312 (0.25%), Total DBE purchases $4,251,624 (0.09%), Total NPWC purchases $2,835,910 (0.06%), Total Sub Purchases $10,506,445 (0.22%).
At Fiscal Year-End 2006 - 07 (July 1, 2006 – June 30, 2007), HUB purchasing participation for the State of North Carolina, as reported by the State Reporting Entities, is 7.77%. Purchases reported total $4,795,305,661 with $372,682,151 reported HUB participation.

1-6
HUB PARTICIPATION OF STATE REPORTING ENTITIES PURCHASING (GOODS and SERVICES)
The following highlights HUB purchasing participation by the State Reporting Entities for the fiscal year end (July 1, 2006 - June 30, 2007): The entities that do not submit HUB report conclusively on all four quarters of the fiscal year experience decrease in their overall HUB participation. Cabinet Agencies - Year-End (FY 06-07) 100% reporting conclusively for all four quarters Year-End At year-end, the Cabinet Agencies reported 8.81% HUB participation. The Agencies reported a total of $1,126,524,167 in purchases with $99,262,042 reported HUB participation. Participation for each department as reported is listed below: Cabinet Agencies Year-End Administration 5.94% Commerce 43.46% Correction 14.29% Crime Control 7.35% Cultural Resources 15.66% Environment & Natural Resources 6.77% Health & Human Services 10.63% Revenue 4.52% Transportation 2.98% Juvenile Justice 18.21%
Source: HUB Office, Department of Administration - Quarterly HUB Reporting Database Council Agencies - Year-End (FY 06-07) 100% reporting conclusively for all four quarters Year-End At year-end, the Council Agencies reported 5.66% HUB participation. The Agencies reported a total of $261,411,248 in purchases with $14,790,787 reported HUB participation. Participation for each department as reported is listed below:
1-7
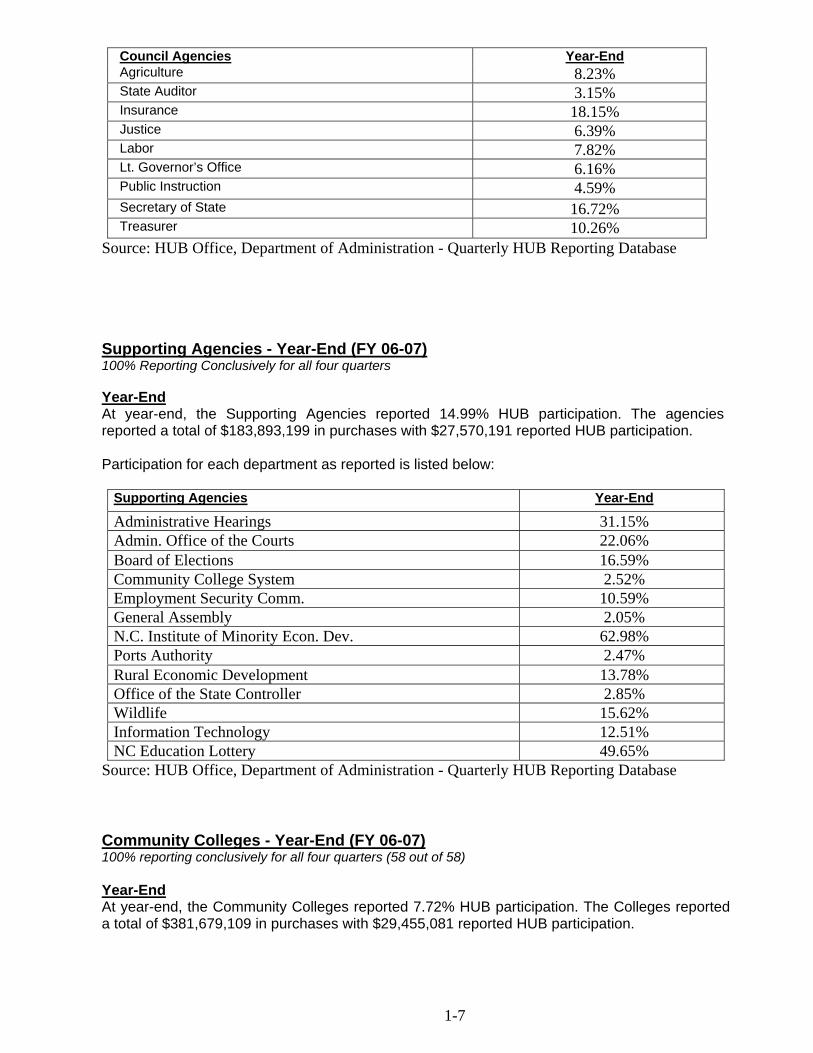
Council Agencies Year-End Agriculture 8.23% State Auditor 3.15% Insurance 18.15% Justice 6.39% Labor 7.82% Lt. Governor’s Office 6.16% Public Instruction 4.59% Secretary of State 16.72% Treasurer 10.26%
Source: HUB Office, Department of Administration - Quarterly HUB Reporting Database Supporting Agencies - Year-End (FY 06-07) 100% Reporting Conclusively for all four quarters Year-End At year-end, the Supporting Agencies reported 14.99% HUB participation. The agencies reported a total of $183,893,199 in purchases with $27,570,191 reported HUB participation. Participation for each department as reported is listed below:
Supporting Agencies Year-End
Administrative Hearings 31.15% Admin. Office of the Courts 22.06% Board of Elections 16.59% Community College System 2.52% Employment Security Comm. 10.59% General Assembly 2.05% N.C. Institute of Minority Econ. Dev. 62.98% Ports Authority 2.47% Rural Economic Development 13.78% Office of the State Controller 2.85% Wildlife 15.62% Information Technology 12.51% NC Education Lottery 49.65%
Source: HUB Office, Department of Administration - Quarterly HUB Reporting Database Community Colleges - Year-End (FY 06-07) 100% reporting conclusively for all four quarters (58 out of 58) Year-End At year-end, the Community Colleges reported 7.72% HUB participation. The Colleges reported a total of $381,679,109 in purchases with $29,455,081 reported HUB participation.

1-8
Public School Districts - Year-End (FY 06- 07) 92% Reporting Conclusively for all four quarters (106 out of 115) Year- End At year-end, the Public School Districts reported 8.30% HUB participation. The School Districts reported a total of $1,677,056,529 in purchases with $139,154,658 reported HUB participation. State Universities - Year-End (FY 06 - 07) 95% Reporting Conclusively for all four quarters (1 out of 19 not reporting for the 1st quarter) Year- End At year-end, the State Universities reported 5.36% HUB participation. The Universities reported a total of $1,164,741,409 in purchases with $62,449,393 reported HUB participation.
Recap of Entities Reporting Conclusively All Four Quarters at Year- End (FY 06-07): Purchasing (Goods and Services)
Public Agencies/Entities Number of Entities Reporting Conclusively
Number of Entities
Percentage
Cabinet Agencies 10 10 100%
Council Agencies 9 9 100%
Supporting Agencies 12 12 100%
Community Colleges 58 58 100%
Public School Districts 106 115 92%
Universities 18 19 95%
Total 213 223 95.5%
Source: HUB Office, Department of Administration - Quarterly HUB Reporting Database

1-9
SUMMARY OF REPORTING ENTITIES: Purchasing (Goods and Services) The following illustrates the State Reporting Entities that met or exceeded the State's 10% goal at fiscal year end 2006 - 2007. Cabinet Agencies: Five (5) of the ten (10), or 50% of the Cabinet Agencies, met or exceeded the State's goal, with the Department of Juvenile Justice & Delinquency Prevention at 18.21%, the Department of Cultural Resources at 15.66%, the Department of Correction at 14.29%, the Department of Health and Human Services at 10.63% and the Department of Commerce at 43.46%. Council Agencies: Four (4) of the nine (9), or 44% of the Council Agencies, met or exceeded the State's goal, with the Department of Insurance at 18.15%, the NC Office of the Lt. Governor at 25.51%, Secretary of State at 16.72%, and Department of State Treasurer at 10.26%. Supporting Agencies: Nine (9) of the twelve (12), or 75% of the Supporting Agencies, met or exceeded the State's goal, with the N.C. Institute of Minority Economic Development at 62.98%, Administrative Office of the Courts at 22.06%, Wildlife Commission at 15.62%, Rural Economic Development at 13.78%, Information Technology Services at 12.51%, Administrative Hearings at 31.15%, NC Education Lottery at 49.65 %, Employment Security Commission at 10.59, and General Assembly at 2.05 %. Community Colleges: Eleven (11) of the fifty-eight (58), or 19% of the Community Colleges, met or exceeded the State's goal. Public School Districts: (of those reporting conclusively all four quarters) Forty (40) of the one hundred fifteen (115), or 35% of the Public School Districts met or exceeded the State's goal State Universities: Six (6) of the nineteen (19), or 32% of the Universities, met or exceeded the State's goal. Fiscal Year End 2006 - 07 (FY 06-07) records seventy-three (73) of the State’s two hundred twenty-three (223) reporting entities meeting the state’s ten percent (10%) goal. The State’s Year-To-Date (July 1, 2006 - June 30, 2007) HUB participation rate, as reported by the state reporting entities, is at 7.77%. The Office for Historically Underutilized Businesses wishes to impress upon all reporting entities the need to continue to make concerted efforts to increase the total amount of goods and services acquired from HUB vendors.

1-10
HIGHLIGHTS OF CONSTRUCTION PROJECTS
1. Total Construction Projects Data and HUB participation by quarter for FY 2006 - 07 (July 1, 2006 – June 30, 2007) – Completed Projects
0.00
50.00
100.00
150.00
200.00
250.00
300.00
$MillionHUB Participation
Total Construct ion ($M )
HUB ($M )
Total Construction ($M) 244.57 150.17 126.77 259.56
HUB ($M) 31.62 23.48 14.7 30.56
1st Quarter 2nd Quarter 3rd Quarter 4th Quarter
HUB Participation 12.93% 15.63% 11.60% 11.78%
At Fiscal Year-End 2006 - 07 Construction Project Reported Total $781,070,180
At Fiscal Year-End 2006 - 07 HUB Construction Reported Total $100,367,227
At Fiscal Year-End 2006 - 07 HUB Participation 12.85%
Source: HUB Office, Department of Administration - HUBSCO Reporting System During the 1st, 2nd, 3rd, and 4th quarter of fiscal year 2006 - 07 (July 1, 2006 – June 30, 2007), HUB construction participation for the State of North Carolina, as reported by the State Reporting Entities, is 12.93%, 15.63%, 11.60%, and 11.78% respectively based on report run date. At Fiscal Year-End 2006 - 07 (July 1, 2006 – June 30, 2007), HUB construction participation for the State of North Carolina, as reported by the State Reporting Entities, is 12.85%. Construction projects reported total $781,070,180 with $100,367,227 reported HUB participation.

1-11
2. HUB Participation Percentage of $ Total Construction by Minority Category for FY 2006 - 07 (July 1, 2006 – June 30, 2007) – Completed Projects
8.10%
0.53%
0.33%
0.22% 2.29%
1.39%B
H
AA
AI
WF
SE
HUB Office, Department of Administration - HUBSCO Reporting System (Source)
LEGEND: B - Black H - Hispanic AA - Asian-American AI - American Indian WF - White Female SE - Socially and Economically Disadvantaged
At Fiscal Year-End 2006-07,
Total Black (B) Construction participation - $17,885,045 (2.29%), Total Hispanics (H) participation - $10,845,109 (1.39%), Total Asian Americans (AA) - $2,563,730 (0.33%), Total American Indians (AI) - $4,120,236 (0.53%), Total White Female (WF) - $63,237,307 (8.10%) and Total Socially and Economically Disadvantaged (SE) - $1,715,800 (0.22%).
At Fiscal Year-End 2006 - 07 (July 1, 2006 – June 30, 2007), HUB construction participation for the State of North Carolina, as reported by the State Reporting Entities, is 12.85%. Construction projects reported total $781,070,180 with $100,367,227 reported HUB participation.

1-12
HUB PARTICIPATION OF STATE REPORTING ENTITIES
CONSTRUCTION PROJECTS The following highlights HUB construction participation by the State Reporting Entities for the fiscal year end (July 1, 2006 - June 30, 2007): Cabinet Agencies - Year-End (FY 06-07)
Year-End At year-end, the Cabinet Agencies reported 17.52% HUB participation. The Agencies reported a total of $11,801,953 in construction with $2,067,495 reported HUB participation. Council Agencies - Year-End (FY 06-07) Year-End At year-end, the Council Agencies reported 0% HUB participation. The Agencies reported a total of $0 in construction with $0 reported HUB participation. Supporting Agencies - Year-End (FY 06-07) Year-End At year-end, the Supporting Agencies reported 3.34% HUB participation. The agencies reported a total of $5,575,692 in construction with $186,492 reported HUB participation. Community Colleges - Year-End (FY 06-07) Year-End At year-end, the Community Colleges reported 16.89% HUB participation. The Colleges reported a total of $65,633,699 in construction with $11,082,460 reported HUB participation. Public School Districts - Year-End (FY 06- 07) Year- End At year- end, the Public School Districts reported 11.34% HUB participation. The School Districts reported a total of $241,295,774 in construction with $27,358,912 reported HUB participation. State Universities - Year-End (FY 06 - 07) Year- End At year-end, the State Universities reported 14.43% HUB participation. The Universities reported a total of $329,117,941 in construction with $47,487,471 reported HUB participation. Counties - Year-End (FY 06 - 07) Year- End At year-end, the Counties reported 11.36% HUB participation. The Counties reported a total of $50,203,754 in construction with $5,705,406 reported HUB participation.

1-13
Municipalities - Year-End (FY 06 - 07) Year- End At year-end, the Municipalities reported 10.52% HUB participation. The Municipalities reported a total of $38,336,568 in construction with $4,031,971 reported HUB participation. Hospital Associations - Year-End (FY 06 - 07) Year- End At year-end, the Hospital Associations reported 13.43% HUB participation. The Hospital Associations reported a total of $1,524,054 in construction with $204,621 reported HUB participation. Non-State Agencies - Year-End (FY 06 - 07) Year- End At year-end, the Non-State Agencies reported 0% HUB participation. The Non-State Agencies reported a total of $0 in construction with $0 reported HUB participation. Public Housing Authorities - Year-End (FY 06 - 07) Year- End At year-end, the Public Housing Authorities reported 8.17% HUB participation. The Public Housing Authorities reported a total of $274,179 in construction with $22,400 reported HUB participation. Water and Sewer Authorities - Year-End (FY 06 - 07) Year- End At year-end, the Water and Sewer Authorities reported 0% HUB participation. The Water and Sewer Authorities reported a total of $0 in construction with $0 reported HUB participation. Airport Authorities - Year-End (FY 06 - 07) Year- End At year-end, the Airport Authorities reported 5.95% HUB participation. The Airport Authorities reported a total of $37,306,565 in construction with $2,220,000 reported HUB participation.

1-14
SUMMARY OF REPORTING ENTITIES: Construction Projects The following illustrates the State Reporting Entities that met or exceeded the State's 10% goal at fiscal year end 2006 - 07. Cabinet Agencies: NC Department of Environment and Natural Resources at 28.34% and NC Department of Health and Human Services at 12.33%. Community Colleges: Nine (9) of the fifty-eight (58), or 16% of the Community Colleges registered to HUBSCO, met or exceeded the State's goal. Public School Districts: Ten (10) of the sixty six (66), or 15% of the Public School Districts registered to HUBSCO, met or exceeded the State's goal. State Universities: Eleven (11) of the twenty-one (21), or 52% of the Universities, met or exceeded the State's goal. Counties: Seven (7) of the forty two (42), or 17% of the Counties registered to HUBSCO, met or exceeded the State's goal. Municipalities: Four (4) of the sixty-two (62), or 7% of the Municipalities registered to HUBSCO, met or exceeded the State's goal. Hospital Associations: Two (2) of the seven (7), or 29% of the Hospital Associations registered to HUBSCO, met or exceeded the State's goal. Fiscal year (FY 06-07) records forty-five (45) of the State’s two hundred ninety-five (295) reporting entities meeting the state’s ten percent (10%) goal. The State’s Year-End (July 1, 2006 - June 30, 2007) HUB Construction participation rate, as reported by the state reporting entities, is at 12.85%.

2-1
ACTIVITIES A review of highlights and significant activities of the Office for Historically Underutilized Businesses for FY 2006 - 07 include: Handled over 3065 telephone and email inquiries from HUB vendors/contractors, state agencies, other entities and the general public, providing assistance and/or information on the State’s HUB Program, HUB Certification/Verification, E-Procurement, Purchasing and Construction Opportunities, Senate Bill 914/HUB Reporting requirements (G.S. 143-128.2, 143-128.3, & 143.131) and HUB Reporting requirements. Participated in more than 55 conferences, workshops, seminars, training sessions, or presentations promoting the HUB Office, Vendor Link, E-Procurement, Higher Education Bond Program, Senate Bill 914/Minority Business Reporting Requirements – G.S. 143-128.2, 143-128.3, 143-131 (Construction) and G.S. 143-48 HUB/MWBE - Minority Business Reporting Requirements (Purchasing). 1714 vendors and contractors received HUB Designation. Since the March 2003 inception of the HUBSCO Construction Reporting System through the fiscal year ended June 30, 2007, a total of 1633 participants were granted access to the HUBSCO training site and 252 participants received access to the HUBSCO live-production site. During FY 2006/07, a total of 36 participants attended HUBSCO Training Sessions.

State of North Carolina Department of Administration
OFFICE FOR HISTORICALLY UNDERUTILIZED BUSINESSES (HUB)
PURCHASING (GOODS and SERVICES) and CONSTRUCTION REPORT
Year End Summary FY 06 - 07 (July 1, 2006 – June 30, 2007)
State of North Carolina
Michael F. Easley, Governor
N.C. Department of Administration Britt Cobb, Secretary
Office for Historically Underutilized Businesses
Bridget L. Wall, Assistant to Secretary for HUB Outreach Rick Baskett Sr., Deputy Director
Mathew Idiculla, Compliance Specialist
Prepared by: Office for Historically Underutilized Businesses 116 West Jones Street, Suite 2109 Raleigh, NC 27603

NORTH CAROLINA DEPARTMENT OF ADMINISTRATION
OFFICE FOR HISTORICALLY UNDERUTILIZED BUSINESSES
Purchasing and Construction Reports
SUMMARY - Year-End FY 2006-07(July 1, 2006 - June 30, 2007)
Year-End Summary of FY 2006-07 (July 1, 2006 - June 30,
2007)
1st Qtr
2nd Qtr
3rd Qtr
4th Qtr
1st Qtr
2ndQtr
3rd Qtr
4th Qtr
Public Entity Type
To
talH
UB
(%)
To
talH
UB
(%)
To
tal
HU
B (
%)
To
tal
HU
B (
%)
To
tal
Pu
rch
asin
g (
$)
MB
E (
$)
WB
E (
$)
DB
E-O
($)
DB
E (
$)
NP
WC
($)
Su
b (
$)
To
tal
HU
B (
$)
To
tal
HU
B (
%)
To
talH
UB
(%)
To
talH
UB
(%)
To
tal
HU
B (
%)
To
tal
HU
B (
%)
To
tal
Co
nst
ruct
ion
V
alu
e ($
)
B($
)
H($
)
AA
($)
AI(
$)
WF
($)
SE
($)
To
tal
HU
B (
$)
To
tal
HU
B (
%)
CABINET AGENCIES 9.68% 9.14% 8.16% 8.20% $1,126,524,167 $30,984,042 $65,128,088 $1,081,998 $2,067,850 $63 $0 $99,262,042 8.81% 0.00% 5.95% 14.85% 26.01% $11,801,953 $42,741 $0 $0 $19,294 $1,997,960 $7,500 $2,067,495 17.52%
COUNCIL AGENCIES 3.29% 11.56% 10.86% 3.13% $261,411,248 $7,775,095 $6,421,293 $593,983 $416 $0 $0 $14,790,787 5.66% 0.00% 0.00% 0.00% 0.00% $0 $0 $0 $0 $0 $0 $0 $0 0.00%
SUPPORTING AGENCIES 17.26% 16.40% 23.99% 10.24% $183,893,199 $4,581,116 $22,233,771 $321,115 $88,000 $346,190 $0 $27,570,191 14.99% 3.81% 0.00% 0.00% 0.00% $5,575,692 $63,155 $114,839 $0 $0 $8,498 $0 $186,492 3.34%
COMMUNITY COLLEGES 6.30% 8.49% 8.04% 7.90% $381,679,109 $7,165,528 $20,385,861 $1,201,048 $240,874 $446,934 $14,837 $29,455,081 7.72% 28.82% 21.38% 8.50% 13.16% $65,633,699 $826,699 $711,581 $0 $1,573,232 $7,162,892 $808,056 $11,082,460 16.89%
PUBLIC SCHOOLS 9.91% 7.40% 7.56% 7.39% $1,677,056,529 $42,886,451 $82,776,201 $8,110,322 $1,777,963 $1,714,013 $1,889,709 $139,154,658 8.30% 13.85% 15.99% 5.86% 10.38% $241,295,774 $4,502,047 $3,038,213 $485,274 $94,725 $19,233,612 $5,041 $27,358,912 11.34%
STATE UNIVERSITIES 4.44% 5.53% 4.45% 6.78% $1,164,741,410 $28,053,339 $24,705,079 $683,846 $76,522 $328,710 $8,601,899 $62,449,393 5.36% 12.90% 13.31% 15.89% 18.11% $329,117,941 $9,330,494 $5,939,666 $1,947,157 $1,095,814 $28,462,190 $712,150 $47,487,471 14.43%
COUNTIES X X X X X X X X X X X X X 7.77% 16.63% 6.22% 6.92% $50,203,754 $1,158,342 $166,891 $131,299 $801,347 $3,264,474 $183,053 $5,705,406 11.36%
MUNICIPALITIES X X X X X X X X X X X X X 9.84% 15.95% 9.06% 5.81% $38,336,568 $1,939,167 $303,919 $0 $121,118 $1,667,767 $0 $4,031,971 10.52%
HOSPITAL ASSOCIATIONS X X X X X X X X X X X X X 1.43% 0.00% 23.35% 0.00% $1,524,054 $0 $0 $0 $134,706 $69,915 $0 $204,621 13.43%
NON-STATE AGENCIES X X X X X X X X X X X X X 0.00% 0.00% 0.00% 0.00% $0 $0 $0 $0 $0 $0 $0 $0 0.00%
PUBLIC HOUSING AUTHORITIES X X X X X X X X X X X X X
0.00% 16.01% 100.00% 0.00% $274,179 $22,400 $0 $0 $0 $0 $0 $22,400 8.17%
WATER AND SEWER AUTHORITIES X X X X X X X X X X X X X
0.00% 0.00% 0.00% 0.00% $0 $0 $0 $0 $0 $0 $0 $0 0.00%
AIRPORT AUTHORITIES X X X X X X X X X X X X X 0.00% 0.00% 0.00% 6.16% $37,306,565 $0 $570,000 $0 $280,000 $1,370,000 $0 $2,220,000 5.95%
Grand Totals 8.09% 8.00% 7.76% 7.33% $4,795,305,661 $121,445,571 $221,650,294 $11,992,312 $4,251,624 $2,835,910 $10,506,445 $372,682,151 7.77% 12.93% 15.63% 11.60% 11.78% $781,070,180 $17,885,045 $10,845,109 $2,563,730 $4,120,236 $63,237,307 $1,715,800 $100,367,227 12.85%
% of HUB Participation 2.53% 4.62% 0.25% 0.09% 0.06% 0.22% 7.77% 2.29% 1.39% 0.33% 0.53% 8.10% 0.22% 12.85%
%of Minority Participation against Total HUB $ 32.59% 59.47% 3.22% 1.14% 0.76% 2.82% 17.82% 10.81% 2.55% 4.11% 63.01% 1.71%
MBE - Minority Business Enterprise B - Black
X - no reporting requirements WBE - Woman Business Enterprise H - Hispanic
DBE-O- Disabled - Owned Business Enterprise AA - Asian-American
DBE - Disabled Business Enterprise AI - American Indian
NPWC - Non - profit Work Center for the Blind & Severely Disabled WF - White Female
Sub - HUB Subcontractor SE - Socially and Economically Disadvantaged
Note:
1. When a construction project is finalized (submitted) by an entiity, HUBSCO system will update
to the relevant quarter when the project was completed
Year-End Summary of HUB Construction Report - Construction ProjectsYear-End Summary of HUB Purchasing Report - Goods and Services
K:\Hubrpt_Purchase and Construction\FY'06-07\Quarter and Annual\06-07summary 4 Source: HUB Purchasing Report Database and HUBSCO Construction Reporting SystemRun Date: 10/04/2005

State of North Carolina
Department of Administration
OFFICE FOR HISTORICALLY UNDERUTILIZED BUSINESSES (HUB) PURCHASING (GOODS and SERVICES) and CONSTRUCTION REPORT
1st Quarter FY 06 - 07
(July 1, 2006 – September 30, 2006)
State of North Carolina
Michael F. Easley, Governor
N.C. Department of Administration Britt Cobb, Secretary
Office for Historically Underutilized Businesses
Bridget L. Wall, Assistant to Secretary for HUB Outreach Rick Baskett Sr., Deputy Director
Mathew Idiculla, Compliance Specialist
Prepared by: Office for Historically Underutilized Businesses 116 West Jones Street, Suite 2109 Raleigh, NC 27603

NORTH CAROLINA DEPARTMENT OF ADMINISTRATION
OFFICE FOR HISTORICALLY UNDERUTILIZED BUSINESSES
Purchasing and Construction Reports
SUMMARY - 1st Quarter 2006-07(July 1, 2006 - Sept. 30, 2006)
1st Quarter 2006-07 (July 1, 2006 - Sept. 30,
2006)
Public Entity TypeT
ota
l P
urc
ha
sin
g (
$)
MB
E (
$)
WB
E (
$)
DB
E-O
($)
DB
E (
$)
NP
WC
($)
Su
b (
$)
To
tal H
UB
($)
To
tal H
UB
(%
)
To
tal
Co
ns
tru
cti
on
V
alu
e ($
)
B($
)
H($
)
AA
($)
AI(
$)
WF
($)
SE
($)
To
tal H
UB
($)
To
tal H
UB
(%
)
CABINET AGENCIES $311,626,380 $10,425,268 $17,751,731 $315,663 $1,662,534 $63 $0 $30,155,260 9.68% $953,531 $0 $0 $0 $0 $0 $0 $0 0.00%
COUNCIL AGENCIES $79,994,304 $520,332 $1,897,380 $211,707 $0 $0 $0 $2,629,419 3.29%
SUPPORTING AGENCIES $36,806,308 $1,213,272 $4,930,848 $210,372 $0 $0 $0 $6,354,492 17.26% $4,888,773 $63,155 $114,839 $0 $0 $8,498 $0 $186,492 3.81%
COMMUNITY COLLEGES $80,743,407 $1,526,857 $3,135,060 $313,545 $31,929 $77,796 $2,840 $5,088,028 6.30% $6,954,952 $90,682 $0 $0 $0 $1,913,422 $0 $2,004,104 28.82%
PUBLIC SCHOOLS $482,820,399 $17,551,893 $26,374,587 $2,211,145 $634,085 $856,361 $207,368 $47,835,438 9.91% $59,561,407 $1,102,837 $984,453 $379,264 $0 $5,781,202 $0 $8,247,756 13.85%
STATE UNIVERSITIES $323,473,593 $6,855,827 $5,074,014 $49,497 $23,619 $266,119 $2,092,276 $14,361,352 4.44% $151,007,528 $4,708,306 $1,127,215 $1,622,065 $644,767 $11,244,330 $134,873 $19,481,556 12.90%
Grand Totals $1,315,464,390 $38,093,449 $59,163,621 $3,311,929 $2,352,166 $1,200,339 $2,302,484 $106,423,988 8.09% $244,574,846 $6,386,259 $2,231,007 $2,001,329 $655,154 $20,212,057 $134,873 $31,620,679 12.93%
% of HUB Participation 2.90% 4.50% 0.25% 0.18% 0.09% 0.18% 8.09% 2.61% 0.91% 0.82% 0.27% 8.26% 0.06% 12.93%
%of Minority Participation against Total HUB $ 35.79% 55.59% 3.11% 2.21% 1.13% 2.16% 20.20% 7.06% 6.33% 2.07% 63.92% 0.43%
MBE - Minority Business Enterprise B - Black
X - no reporting requirements WBE - Woman Business Enterprise H - Hispanic
DBE-O- Disabled - Owned Business Enterprise AA - Asian-American
DBE - Disabled Business Enterprise AI - American Indian
NPWC - Non - profit Work Center for the Blind & Severely Disabled WF - White Female
Sub - HUB Subcontractor SE - Socially and Economically Disadvantaged
Notes: 1. The University of North Carolina and the State Board of Community Colleges shall report Construction Report quarterly
2. When a construction project is finalized (submitted) by an entiity, HUBSCO system will update
to the relevant quarter when the project was completed
1st Qtr HUB Construction Report - Construction Projects1st Qtr HUB Purchasing Report - Goods and Services
K:\Hubrpt_Purchase and Construction\FY'06-07\Quarter and Annual\06-07summary 3 - 1.0 Source: HUB Purchasing Report Database and HUBSCO Construction Reporting SystemRun Date:1/16/07

NORTH CAROLINA DEPARTMENT OF ADMINISTRATION
OFFICE FOR HISTORICALLY UNDERUTILIZED BUSINESSES
Purchasing and Construction Reports
CABINET AGENCIES - 1st Quarter 2006-07(July 1, 2006 - Sept. 30, 2006)
1st Quarter 2006-07 (July 1, 2006 - Sept. 30, 2006)
Public Entity Type/Entity
To
tal
Pu
rch
as
ing
($)
MB
E (
$)
WB
E (
$)
DB
E-O
($)
DB
E (
$)
NP
WC
($)
Su
b (
$)
To
tal H
UB
($)
To
tal H
UB
(%
)
To
tal
Co
ns
tru
cti
on
V
alu
e ($
)
B($
)
H($
)
AA
($)
AI(
$)
WF
($)
SE
($)
To
tal H
UB
($)
To
tal H
UB
(%
)
CABINET AGENCIESNC Department ofCrime Control & Public Safety $16,806,747 $161,722 $367,479 $0 $0 $0 $0 $529,201 3.15% $163,000 $0 $0 $0 $0 $0 $0 $0 0.00%
NC Department of Administraton $6,695,450 $281,808 $128,139 $28,169 $1,560,000 $0 $0 $1,998,116 29.84% X X X X X X X X X State Construction Office) X X X X X X X X XNC Department of Correction $83,030,585 $2,508,727 $8,689,466 $121,045 $14,047 $0 $0 $11,333,285 13.65% $552,945 $0 $0 $0 $0 $0 $0 $0 0.00%
NC Department of Commerce $7,226,756 $4,743,981 $94,759 $0 $0 $0 $0 $4,838,740 66.96% $0 $0 $0 $0 $0 $0 $0 $0 0.00%
NC Department of Cultural Resources $1,120,676 $12,823 $207,776 $69 $2,220 $0 $0 $222,888 19.89%
NC Department of Environment and Natural Resources $41,311,891 $67,958 $1,626,913 $22,836 $9,790 $0 $0 $1,727,498 4.18% $115,603 $0 $0 $0 $0 $0 $0 $0 0.00%
NC Department of Health and Human Services $46,504,314 $1,384,410 $3,259,945 $139,974 $0 $63 $0 $4,784,392 10.29% $0 $0 $0 $0 $0 $0 $0 $0 0.00%
NC Department of Juvenile Justice & Delinquency Prevention $1,626,627 $122,795 $90,171 $3,570 $0 $0 $0 $216,536 13.31%
NC Department of Revenue $1,330,529 $80,226 $124,295 $0 $0 $0 $0 $204,521 15.37%
NC Department of Transportation $105,972,805 $1,060,818 $3,162,788 $0 $76,477 $0 $0 $4,300,083 4.06%
TOTALS $311,626,380 $10,425,268 $17,751,731 $315,663 $1,662,534 $63 $0 $30,155,260 9.68% $831,548 $0 $0 $0 $0 $0 $0 $0 0.00%
% of HUB Participation 3.35% 5.70% 0.10% 0.53% 0.00% 0.00% 9.68% 0.00% 0.00% 0.00% 0.00% 0.00% 0.00% 0.00%
%of Minority Participation against Total HUB $ 34.57% 58.87% 1.05% 5.51% 0.00% 0.00% 0.00% 0.00% 0.00% 0.00% 0.00% 0.00%
DNS-C - Categories with blanks or blank space indicate MBE - Minority Business Enterprise NOTE: Semi-annual reporting required for construction projects
entity "DID NOT SUBMIT" Construction Report WBE - Woman Business Enterprise B - Black
DNS-P - Categories with blanks or blank space indicate DBE-O- Disabled - Owned Business Enterprise H - Hispanic
entity "DID NOT SUBMIT" Purchasing Report DBE - Disabled Business Enterprise AA - Asian-American
X - no reporting requirements NPWC - Non - profit Work Center for the Blind & Severely Disabled AI - American Indian
Sub - HUB Subcontractor WF - White Female
SE - Socially and Economically Disadvantaged
1. When a construction project is finalized (submitted) by an entiity, HUBSCO system will update
to the relevant quarter when the project was completed
1st Qtr HUB Construction Report - Construction Projects1st Qtr HUB Purchasing Report - Goods and Services
K:\Hubrpt_Purchase and Construction\FY'06-07\Quarter and Annual\06-07CA 3 - 1.1 Source: HUB Purchasing Report Database and HUBSCO Construction Reporting SystemRun Date:1/16/07

NORTH CAROLINA DEPARTMENT OF ADMINISTRATION
OFFICE FOR HISTORICALLY UNDERUTILIZED BUSINESSES
Purchasing and Construction Reports
COUNCIL AGENCIES - 1st Quarter 2006-07(July 1, 2006 - Sept. 30, 2006)
1st Quarter 2006-07 (July 1, 2006 - Sept. 30, 2006)
Public Entity Type/Entity
To
tal
Pu
rch
as
ing
($
)
MB
E (
$)
WB
E (
$)
DB
E-O
($
)
DB
E (
$)
NP
WC
($
)
Su
b (
$)
To
tal
HU
B (
$)
To
tal
HU
B (
%)
To
tal
Co
ns
tru
cti
on
V
alu
e (
$)
B($
)
H($
)
AA
($)
AI(
$)
WF
($)
SE
($)
To
tal
HU
B (
$)
To
tal
HU
B (
%)
COUNCIL AGENCIESNC Department of Agriculture & Consumer Services $3,673,548 $85,905 $333,451 $15,681 $0 $0 $0 $435,037 11.84%NC Department of Justice - State Bureau of Investigation $3,800,643 $121,242 $237,766 $2,052 $0 $0 $0 $361,060 9.50% $0 $0 $0 $0 $0 $0 $0 $0 0.00%
NC Office of the State Auditor $445,853 $990 $2,257 $0 $0 $0 $0 $3,247 0.73% X X X X X X X X XNC Department of Insurance $908,541 $12,550 $31,334 $1,299 $0 $0 $0 $45,183 4.97% X X X X X X X X XNC Department of Labor $190,145 $0 $23,740 $0 $0 $0 $0 $23,740 12.49% X X X X X X X X XNC Office of the Lt. Governor's Office $75 $75 $0 $0 $0 $0 $0 $75 100.00% X X X X X X X X XNC Department of Public Instruction $63,332,934 $277,363 $1,143,272 $192,585 $0 $0 $0 $1,613,220 2.55% X X X X X X X X XNC Department of Secretary of State $250,498 $17,959 $9,187 $0 $0 $0 $0 $27,146 10.84% X X X X X X X X XNC Department of State Treasurer $7,392,067 $4,248 $116,373 $90 $0 $0 $0 $120,711 1.63% X X X X X X X X X
TOTALS $79,994,304 $520,332 $1,897,380 $211,707 $0 $0 $0 $2,629,419 3.29% $0 $0 $0 $0 $0 $0 $0 $0 0.00%
% of HUB Participation 0.65% 2.37% 0.26% 0.00% 0.00% 0.00% 3.29% 0.00% 0.00% 0.00% 0.00% 0.00% 0.00% 0.00%
%of Minority Participation against Total HUB $ 19.79% 72.16% 8.05% 0.00% 0.00% 0.00% 0.00% 0.00% 0.00% 0.00% 0.00% 0.00%
LEGEND: LEGEND: LEGEND
DNS-C - Categories with blanks or blank space indicate MBE - Minority Business Enterprise B - Black
entity "DID NOT SUBMIT" Construction Report WBE - Woman Business Enterprise H - Hispanic
DNS-P - Categories with blanks or blank space indicate DBE-O- Disabled - Owned Business Enterprise AA - Asian-American
entity "DID NOT SUBMIT" Purchasing Report DBE - Disabled Business Enterprise AI - American Indian
NPWC - Non - profit Work Center for the Blind & Severely Disabled WF - White Female
X - no reporting requirements Sub - HUB Subcontractor SE - Socially and Economically Disadvantaged
Note: Council Agencies are required to submit Construction Report Semi-annually
1. When a construction project is finalized (submitted) by an entiity, HUBSCO system will update
to the relevant quarter when the project was completed
HUB Construction Report - Construction ProjectsHUB Purchasing Report - Goods and Services
K:\Hubrpt_Purchase and Construction\FY'06-07\Quarter and Annual\06-07CO 3 - 1.2 Source: HUB Purchasing Report Database and HUBSCO Construction Reporting SystemRun Date: 1/16/07

NORTH CAROLINA DEPARTMENT OF ADMINISTRATION
OFFICE FOR HISTORICALLY UNDERUTILIZED BUSINESSES
Purchasing and Construction Reports
Supporting Agencies - 1st Quarter 2006-07(July 1, 2006 - Sept. 30, 2006)
1st Quarter 2006-07 (July 1, 2006 - Sept. 30, 2006)
Public Entity Type/Entity
To
tal
Pu
rch
as
ing
($
)
MB
E (
$)
WB
E (
$)
DB
E-O
($
)
DB
E (
$)
NP
WC
($
)
Su
b (
$)
To
tal
HU
B (
$)
To
tal
HU
B (
%)
To
tal
Co
ns
tru
cti
on
V
alu
e (
$)
B($
)
H($
)
AA
($)
AI(
$)
WF
($)
SE
($)
To
tal
HU
B (
$)
To
tal
HU
B (
%)
SUPPORTING AGENCIESNC Office of Information Technology Services) $9,898,210 $164,203 $876,352 $0 $0 $0 $0 $1,040,555 10.51% $0 $0 $0 $0 $0 $0 $0 $0 0.00%
NCDENR - Wildlife Resources Commission $1,709,163 $115,063 $146,332 $0 $0 $0 $0 $261,395 15.29% $0 $0 $0 $0 $0 $0 $0 $0 0.00%
North Carolina State Ports Authority $2,805,580 $11,855 $39,120 $0 $0 $0 $0 $50,975 1.82% $0 $0 $0 $0 $0 $0 $0 $0 0.00%
Administrative Hearings $11,067 $4,817 $0 $0 $0 $0 $0 $4,817 43.53% X X X X X X X X XAdmin. Office of the Courts $7,112,835 $651,757 $2,218,507 $200,000 $0 $0 $0 $3,070,264 43.17% X X X X X X X X XBoard of Elections $723,841 $0 $241,340 $841 $0 $0 $0 $242,181 33.46% X X X X X X X X XCommunity Colleges $6,216,898 $20 $227,476 $0 $0 $0 $0 $227,496 3.66% X X X X X X X X XEmployment Security Comm. $1,376,008 $0 $142,973 $0 $0 $0 $0 $142,973 10.39% X X X X X X X X XGeneral Assembly $510,040 $1,937 $9,890 $9,531 $0 $0 $0 $21,358 4.19% X X X X X X X X XNC Institute of Min. Econ. Dev. $240,378 $167,925 $0 $0 $0 $0 $0 $167,925 69.86% X X X X X X X X XRural Economic Development $468,428 $1,436 $44,025 $0 $0 $0 $0 $45,461 9.71% X X X X X X X X XOffice of State Controller $1,261,731 $3,344 $1,953 $0 $0 $0 $0 $5,297 0.42% X X X X X X X X XNC Education Lottery $4,472,129 $90,915 $982,880 $0 $0 $0 $0 $1,073,795 24.01% X X X X X X X X X
TOTALS $36,806,308 $1,213,272 $4,930,848 $210,372 $0 $0 $0 $6,354,492 17.26% $0 $0 $0 $0 $0 $0 $0 $0 0.00%
% of HUB Participation 3.30% 13.40% 0.57% 0.00% 0.00% 0.00% 17.26% 0.00% 0.00% 0.00% #DIV/0! 0.00% 0.00% 0.00%
%of Minority Participation against Total HUB $ 19.09% 77.60% 3.31% 0.00% 0.00% 0.00% 0.00% 0.00% 0.00% 0.00% 0.00% 0.00%
LEGEND: LEGEND: LEGEND
DNS-C - Categories with blanks or blank space indicate MBE - Minority Business Enterprise B - Black
entity "DID NOT SUBMIT" Construction Report WBE - Woman Business Enterprise H - Hispanic
DNS-P - Categories with blanks or blank space indicate DBE-O- Disabled - Owned Business Enterprise AA - Asian-American
entity "DID NOT SUBMIT" Purchasing Report DBE - Disabled Business Enterprise AI - American Indian
X - no reporting requirements NPWC - Non - profit Work Center for the Blind & Severely Disabled WF - White Female
Sub - HUB Subcontractor SE - Socially and Economically Disadvantaged
Note: Support Agencies are required to submit Construction Report Semi-annually
1. When a construction project is finalized (submitted) by an entiity, HUBSCO system will update
to the relevant quarter when the project was completed
HUB Construction Report - Construction ProjectsHUB Purchasing Report - Goods and Services
K:\Hubrpt_Purchase and Construction\FY'06-07\Quarter and Annual\06-07SA 3 - 1.3 Source:HUB Purchasing Report Database and HUBSCO Construction Reporting SystemRun Date:1/16/07

NORTH CAROLINA DEPARTMENT OF ADMINISTRATION
OFFICE FOR HISTORICALLY UNDERUTILIZED BUSINESSES
Purchasing and Construction Reports - Community Colleges - 1st Quarter 2006-07(July 1, 2006 - Sept. 30, 2006)1st Quarter 2006-07
(July 1, 2006 - Sept. 30, 2006)
Public Entity Type/Entity
To
tal
Pu
rch
as
ing
($
)
MB
E (
$)
WB
E (
$)
DB
E-O
($
)
DB
E (
$)
NP
WC
($
)
Su
b (
$)
To
tal H
UB
($
)
To
tal H
UB
(%
)
To
tal
Co
ns
tru
cti
on
V
alu
e (
$)
B($
)
H($
)
AA
($)
AI(
$)
WF
($)
SE
($)
To
tal H
UB
($
)
To
tal H
UB
(%
)
COMMUNITY COLLEGESAlamance Community College(DNS-C) $1,070,459 $205 $17,498 $3,719 $1,245 $0 $0 $22,667 2.12%Anson/South Piedmont Community College (DNS-C) $896,698 $3,260 $55,297 $0 $0 $0 $0 $58,557 6.53%Asheville-Buncombe Technical Community College $2,432,948 $1,890 $59,302 $703 $0 $11,051 $0 $72,946 3.00% $0 $0 $0 $0 $0 $0 $0 $0 0.00%Beaufort County Community College $691,745 $4,519 $7,882 $92,355 $0 $0 $0 $104,756 15.14% $0 $0 $0 $0 $0 $0 $0 $0 0.00%Bladen Community College (DNS-C) $350,025 $73 $16,275 $0 $0 $0 $0 $16,347 4.67%
Blue Ridge Community College(DNS-C) $1,034,801 $31,435 $10,210 $9,948 $5,040 $0 $0 $56,633 5.47%Brunswick Community College $894,425 $9,191 $17,383 $569 $1,006 $1,519 $0 $29,668 3.32% $0 $0 $0 $0 $0 $0 $0 $0 0.00%Caldwell Community College & Technical Institute $3,346,961 $63,791 $197,323 $3,382 $0 $0 $0 $264,496 7.90% $1,401,716 $0 $0 $0 $0 $0 $0 $0 0.00%
Cape Fear Community College(DNS-C) $1,986,783 $61,062 $133,487 $3,237 $0 $40 $0 $197,826 9.96%Carteret Community College (DNS-C) $571,120 $5,171 $3,226 $0 $0 $0 $0 $8,398 1.47%Catawba Valley Community College (DNS-C) $1,549,287 $3,457 $16,271 $0 $0 $0 $0 $19,728 1.27%
Central Carolina Community College $3,164,274 $55,092 $52,984 $4,865 $0 $12,091 $0 $125,032 3.95% $0 $0 $0 $0 $0 $0 $0 $0 0.00%Central Piedmont Community College (DNS-C) $3,372,153 $315,388 $625,745 $12,516 $3,600 $2,043 $0 $959,292 28.45%Cleveland Community College (DNS-C) $520,659 $2,201 $6,619 $2,939 $0 $0 $0 $11,759 2.26%Coastal Carolina Community College $1,276,324 $6,285 $32,412 $0 $0 $0 $0 $38,697 3.03% $0 $0 $0 $0 $0 $0 $0 $0 0.00%College of The Albemarle $606,848 $4,331 $5,029 $0 $0 $0 $0 $9,360 1.54% $298,549 $0 $0 $0 $0 $0 $0 $0 0.00%Craven Community College $1,027,079 $19,971 $16,712 $395 $675 $1,044 $0 $38,797 3.78% $0 $0 $0 $0 $0 $0 $0 $0 0.00%Davidson County Community College (DNS-C) $1,193,402 $21,020 $59,341 $0 $0 $0 $873 $81,234 6.81%Durham Technical Community College $1,912,914 $95,564 $25,550 $8,895 $6,610 $9,888 $0 $146,508 7.66% $587,519 $49,332 $0 $0 $0 $1,915 $0 $51,247 8.72%Edgecombe Community College (DNS-C) $624,272 $40,297 $19,005 $1,134 $205 $136 $0 $60,777 9.74%Fayetteville Technical Community College(DNS-C) $5,498,943 $25,249 $171,979 $10,481 $0 $0 $0 $207,709 3.78%Forsyth Technical Community College $3,264,291 $46,108 $212,339 $18,020 $0 $0 $0 $276,467 8.47% $47,835 $0 $0 $0 $0 $47,835 $0 $47,835 100%Gaston College $1,504,207 $7,180 $59,714 $0 $0 $0 $0 $66,894 4.45% $89,056 $0 $0 $0 $0 $0 $0 $0 0.00%
Guilford Technical Community College $5,301,547 $158,008 $110,714 $0 $0 $20,883 $0 $289,606 5.46% $2,369,839 $0 $0 $0 $0 $343,042 $0 $343,042 14.48%
Halifax Community College(DNS-C) $389,852 $1,279 $2,902 $1,564 $0 $0 $0 $5,745 1.47%Haywood Community College (DNS-C) $678,206 $1,318 $6,536 $0 $0 $0 $0 $7,854 1.16%Isothermal Community College(DNS-C) $619,093 $1,184 $27,679 $0 $0 $0 $0 $28,863 4.66%James Sprunt Community College $372,860 $4,076 $26,504 $2,138 $210 $0 $0 $32,928 8.83% $0 $0 $0 $0 $0 $0 $0 $0 0.00%Johnston Community College $1,993,364 $10,880 $53,067 $20,804 $20 $0 $0 $84,771 4.25% $0 $0 $0 $0 $0 $0 $0 $0 0.00%Lenoir Community College $613,214 $6,048 $31,964 $302 $0 $15,658 $0 $53,972 8.80% $91,774 $0 $0 $0 $0 $0 $0 $0 0.00%
Martin Community College(DNS-C) $262,342 $257 $8,138 $783 $0 $0 $0 $9,178 3.50%
Mayland Community College(DNS-C) $104,847 $0 $3,137 $0 $0 $0 $0 $3,137 2.99%McDowell Technical Community College $745,733 $835 $21,130 $0 $0 $0 $1,530 $23,495 3.15% $0 $0 $0 $0 $0 $0 $0 $0 0.00%
Mitchell Community College $1,251,514 $2,335 $17,487 $2,941 $832 $0 $0 $23,595 1.89% $59,051 $0 $0 $0 $0 $0 $0 $0 0.00%
Montgomery Community College $271,871 $375 $7,562 $0 $0 $0 $0 $7,937 2.92% $64,475 $0 $0 $0 $0 $0 $0 $0 0.00%
Nash Community College $548,735 $39,033 $41,528 $675 $0 $0 $0 $81,236 14.80% $0 $0 $0 $0 $0 $0 $0 $0 0.00%
HUB Construction Report - Construction ProjectsHUB Purchasing Report - Goods and Services
K:\Hubrpt_Purchase and Construction\FY'06-07\Quarter and Annual\06-07CC 3-1.4.1 Source:HUB Purchasing Report Database and HUBSCO Construction reporting SystemRun Date:1/16/07

NORTH CAROLINA DEPARTMENT OF ADMINISTRATION
OFFICE FOR HISTORICALLY UNDERUTILIZED BUSINESSES
Purchasing and Construction Reports - Community Colleges - 1st Quarter 2006-07(July 1, 2006 - Sept. 30, 2006)1st Quarter 2006-07
(July 1, 2006 - Sept. 30, 2006)
Public Entity Type/Entity
To
tal
Pu
rch
as
ing
($
)
MB
E (
$)
WB
E (
$)
DB
E-O
($
)
DB
E (
$)
NP
WC
($
)
Su
b (
$)
To
tal H
UB
($
)
To
tal H
UB
(%
)
To
tal
Co
ns
tru
cti
on
V
alu
e (
$)
B($
)
H($
)
AA
($)
AI(
$)
WF
($)
SE
($)
To
tal H
UB
($
)
To
tal H
UB
(%
)
HUB Construction Report - Construction ProjectsHUB Purchasing Report - Goods and Services
COMMUNITY COLLEGES - (Contd…)Pamlico Community College $138,467 $8,370 $1,967 $102 $0 $0 $0 $10,439 7.54% $0 $0 $0 $0 $0 $0 $0 $0 0.00%Piedmont Community College $896,698 $3,260 $55,297 $0 $0 $0 $0 $58,557 6.53%Pitt Community College $1,289,786 $148,021 $47,888 $0 $240 $0 $437 $196,586 15.24% $0 $0 $0 $0 $0 $0 $0 $0 0.00%Randolph Community College $1,425,795 $4,635 $75,216 $0 $0 $75 $0 $79,926 5.61% $1,673,793 $0 $0 $0 $0 $1,481,830 $0 $1,481,830 88.53%
Richmond Community College (DNS-C) $606,709 $3,975 $9,214 $0 $0 $0 $0 $13,189 2.17%
Roanoke-Chowan Community College $278,036 $133 $10,411 $0 $0 $0 $0 $10,544 3.79% $0 $0 $0 $0 $0 $0 $0 $0 0.00%Robeson Community College $1,604,161 $17,626 $52,898 $0 $7,261 $0 $0 $77,785 4.85% $0 $0 $0 $0 $0 $0 $0 $0 0.00%Rockingham Community College $673,287 $3,047 $21,426 $0 $0 $978 $0 $25,451 3.78% $38,800 $0 $0 $0 $0 $38,800 $0 $38,800 100%
Rowan-Cabarrus Community College(DNS-C) $1,743,961 $32,105 $50,591 $2,036 $0 $1,575 $0 $86,307 4.95%Sampson Community College $469,660 $17,742 $28,540 $0 $0 $0 $0 $46,282 9.85% $0 $0 $0 $0 $0 $0 $0 $0 0.00%Sandhills Community College(DNS-C) $1,974,629 $366 $108,434 $32,661 $1,433 $0 $0 $142,894 7.24%
SouthEastern Community College(DNS-C) $733,088 $3,908 $45,414 $302 $0 $0 $0 $49,624 6.77%Southwestern Community College (DNS-C) $1,123,906 $1,980 $3,197 $0 $0 $0 $0 $5,176 0.46%Stanly Community College $742,195 $2,088 $25,026 $2,200 $0 $815 $0 $30,129 4.06% $0 $0 $0 $0 $0 $0 $0 $0 0.00%Surry Community College $237,447 $0 $39,301 $0 $3,270 $0 $0 $42,571 17.93% $0 $0 $0 $0 $0 $0 $0 $0 0.00%Tri-County Community College $249,370 $1,017 $1,439 $0 $110 $0 $0 $2,566 1.03% $0 $0 $0 $0 $0 $0 $0 $0 0.00%Vance-Granville Community College $910,033 $4,584 $27,799 $16,180 $0 $0 $0 $48,563 5.34% $20,674 $0 $0 $0 $0 $0 $0 $0 0.00%
Wake Technical Community College $9,039,132 $158,770 $273,465 $48,395 $0 $0 $0 $480,630 5.32% $211,871 $41,350 $0 $0 $0 $0 $0 $41,350 19.52%
Wayne Community College $1,551,374 $22,907 $17,695 $2,221 $0 $0 $0 $42,822 2.76% $0 $0 $0 $0 $0 $0 $0 $0 0.00%Western Piedmont Community College $443,840 $2,385 $31,581 $6,981 $173 $0 $0 $41,120 9.26% $0 $0 $0 $0 $0 $0 $0 $0 0.00%Wilkes Community College(DNS-C) $2,078,655 $18,145 $23,993 $0 $0 $0 $0 $42,139 2.03%Wilson Technical Community College $589,382 $23,425 $4,338 $102 $0 $0 $0 $27,864 4.73% $0 $0 $0 $0 $0 $0 $0 $0 $0
TOTALS $80,743,407 $1,526,857 $3,135,060 $313,545 $31,929 $77,796 $2,840 $5,088,028 6.30% $6,954,952 $90,682 $0 $0 $0 $1,913,422 $0 $2,004,104 28.82%
% of HUB Participation 1.89% 3.88% 0.39% 0.04% 0.10% 0.00% 6.30% 1.30% 0.00% 0.00% 0.00% 27.51% 0.00% 28.82%
%of Minority Participation against Total HUB $ 30.01% 61.62% 6.16% 0.63% 1.53% 0.06% 4.52% 0.00% 0.00% 0.00% 95.48% 0.00%
LEGEND: LEGEND: LEGEND
DNS-C - Categories with blanks or blank space indicate MBE - Minority Business Enterprise B - Black
entity "DID NOT SUBMIT" Construction Report WBE - Woman Business Enterprise H - Hispanic
DNS-P - Categories with blanks or blank space indicate DBE-O- Disabled - Owned Business Enterprise AA - Asian-American
entity "DID NOT SUBMIT" Purchasing Report DBE - Disabled Business Enterprise AI - American Indian
NPWC - Non - profit Work Center for the Blind & Severely Disabled WF - White Female
Sub - HUB Subcontractor SE - Socially and Economically Disadvantaged
Note:
1. When a construction project is finalized (submitted) by an entiity, HUBSCO system will update to the relevant quarter when the project was completed
K:\Hubrpt_Purchase and Construction\FY'06-07\Quarter and Annual\06-07CC 3-1.4.2 Source:HUB Purchasing Report Database and HUBSCO Construction reporting SystemRun Date:1/16/07

NORTH CAROLINA DEPARTMENT OF ADMINISTRATION
OFFICE FOR HISTORICALLY UNDERUTILIZED BUSINESSES
Purchasing and Construction Reports - Public Schools - 1st Quarter 2006-07(July 1, 2006 - Sept. 30, 2006)1st Quarter 2006-07
(July 1, 2006- Sept. 30, 2006)
Public Entity Type/Entity
To
tal
Pu
rch
as
ing
($
)
MB
E (
$)
WB
E (
$)
DB
E-O
($
)
DB
E (
$)
NP
WC
($
)
Su
b (
$)
To
tal
HU
B (
$)
To
tal
HU
B (
%)
To
tal
Co
ns
tru
cti
on
V
alu
e (
$)
B($
)
H($
)
AA
($)
AI(
$)
WF
($)
SE
($)
To
tal
HU
B (
$)
To
tal
HU
B (
%)
PUBLIC SCHOOLS
Alamance/Burlington Schools $23,328,772 $255,765 $84,610 $0 $0 $0 $0 $340,374 1.46% * * * * * * * * *Alexander County Schools $925,447 $2,040 $56,545 $0 $0 $0 $0 $58,585 6.33%
Alleghany County Schools $587,432 $0 $20,119 $0 $0 $0 $0 $20,119 3.42% * * * * * * * * *Anson County Schools $843,472 $68 $83,460 $0 $0 $0 $0 $83,528 9.90% * * * * * * * * *Ashe County Schools $1,700,892 $6,704 $46,477 $0 $0 $0 $0 $53,182 3.13%Asheboro City Schools $1,658,916 $318 $7,473 $0 $0 $0 $0 $7,791 0.47% $99,944 $2,145 $0 $0 $0 $10,700 $0 $12,845 12.85%Asheville City Schools $2,027,863 $2,444 $154,835 $100 $0 $0 $0 $157,379 7.76% $0 $0 $0 $0 $0 $0 $0 $0 0.00%
Avery Counrty Schools $923,329 $24,384 $17,264 $0 $177 $0 $0 $41,825 4.53% * * * * * * * * *Beaufort County Schools $4,941,287 $216,817 $457,276 $50,216 $0 $0 $0 $724,308 14.66% * * * * * * * * *Bertie County Board of Education (DNS-P) $0 $0 $0 $0 $0 $0 $0 $0 0.00%Bladen County Schools $493,651 $14,841 $13,076 $2,320 $0 $0 $0 $30,237 6.13% $209,440 $3,405 $0 $0 $0 $0 $0 $3,405 1.63%Brunswick County Schools $11,447,752 $48,293 $442,096 $1,000 $0 $0 $0 $491,389 4.29% $138,342 $0 $0 $0 $0 $116,700 $0 $116,700 84.36%
Buncombe County Schools $7,590,009 $28,727 $277,123 $0 $12,946 $0 $0 $318,796 4.20% * * * * * * * * *Burke County Schools $3,789,680 $4,986 $75,498 $0 $348,080 $0 $0 $428,564 11.31% * * * * * * * * *Cabarrus County Schools $5,906,754 $22,837 $387,452 $0 $1,276 $26,993 $0 $438,558 7.42%Caldwell County Schools $13,280,355 $2,987 $61,729 $0 $0 $2,055 $0 $66,771 0.50%Camden County Schools $4,846 $38 $1,836 $0 $0 $0 $0 $1,874 38.66% $0 $0 $0 $0 $0 $0 $0 $0 0.00%Carteret County Schools $5,191,233 $82,624 $217,941 $4,815 $13,117 $0 $0 $318,498 6.14%
Caswell County Schools $32,223 $17,253 $11,379 $0 $302 $0 $0 $28,934 89.79% * * * * * * * * *Catawba County Schools $1,718,328 $0 $79,651 $0 $0 $0 $0 $79,651 4.64% * * * * * * * * *Chapel Hill-Carrboro City Schools $645,403 $0 $0 $0 $0 $0 $0 $0 0.00% $0 $0 $0 $0 $0 $0 $0 $0 0.00%Charlotte-Mecklenburg Schools $46,773,620 $609,750 $3,559,189 $23,915 $0 $0 $0 $4,192,855 8.96% $10,089,242 $61,305 $50,288 $0 $0 $1,869,949 $0 $1,981,542 19.64%
Chatham County Schools $4,383,576 $497,539 $246,347 $0 $0 $0 $0 $743,886 16.97% * * * * * * * * *Cherokee County Schools $808,508 $0 $6,035 $0 $0 $0 $8,267 $14,302 1.77%
Clay County Schools $72,114 $10,210 $4,522 $0 $0 $0 $0 $14,732 20.43% * * * * * * * * *Cleveland County Schools $1,761,566 $295,726 $865,316 $143,448 $0 $70,191 $18,900 $1,393,580 79.11% $2,955,970 $45,500 $0 $0 $0 $173,000 $0 $218,500 7.39%
Clinton City Schools $2,126,102 $3,871 $22,840 $0 $0 $0 $0 $26,711 1.26% * * * * * * * * *Columbus County Schools $2,783,732 $548 $115,565 $1,646 $0 $0 $0 $117,759 4.23% * * * * * * * * *Craven County Schools $4,595,521 $229,001 $44,272 $0 $0 $0 $0 $273,273 5.95%
Cumberland County Schools $15,265,214 $406,421 $271,282 $58,326 $0 $0 $0 $736,029 4.82%
Currituck County Schools $2,735,375 $7,750 $88,148 $3,578 $590 $0 $0 $100,066 3.66% * * * * * * * * *Dare County Schools $608,381 $26,283 $111,297 $5,898 $0 $0 $0 $143,478 23.58% * * * * * * * * *Davidson County Schools $689,214 $5,370 $193,013 $20,809 $0 $332 $0 $219,524 31.85%
Davie County Schools $2,520,725 $70,265 $66,521 $0 $18,116 $4,501 $0 $159,404 6.32% $523,551 $0 $0 $0 $0 $0 $0 $0 0.00%
HUB Construction Report - Construction ProjectsHUB Purchasing Report - Goods and Services
K:\Hubrpt_Purchase and Construction\FY'06-07\Quarter and Annual\06-07PS 3 - 1.5.1 Source: HUB Purchasing Report Database and HUBSCO Construction Reporting SystemRun Date:1/16/07

NORTH CAROLINA DEPARTMENT OF ADMINISTRATION
OFFICE FOR HISTORICALLY UNDERUTILIZED BUSINESSES
Purchasing and Construction Reports - Public Schools - 1st Quarter 2006-07(July 1, 2006 - Sept. 30, 2006)1st Quarter 2006-07
(July 1, 2006- Sept. 30, 2006)
Public Entity Type/Entity
To
tal
Pu
rch
as
ing
($
)
MB
E (
$)
WB
E (
$)
DB
E-O
($
)
DB
E (
$)
NP
WC
($
)
Su
b (
$)
To
tal
HU
B (
$)
To
tal
HU
B (
%)
To
tal
Co
ns
tru
cti
on
V
alu
e (
$)
B($
)
H($
)
AA
($)
AI(
$)
WF
($)
SE
($)
To
tal
HU
B (
$)
To
tal
HU
B (
%)
HUB Construction Report - Construction ProjectsHUB Purchasing Report - Goods and Services
PUBLIC SCHOOLS - (Contd….)Duplin County Board of Educatiion $1,965,733 $21,806 $59,270 $1,822 $0 $0 $0 $82,898 4.22%
Durham Public Schools $26,938,750 $43,462 $530,420 $6,660 $37,665 $0 $0 $618,207 2.29%
Edenton Chowan Schools $609,319 $540 $32,387 $0 $0 $0 $0 $32,927 5.40% * * * * * * * * *Edgecombe County Schools $1,101,457 $3,226 $33,278 $57 $0 $0 $0 $36,561 3.32%
Elizabeth City Schools $8,159,108 $17,208 $73,669 $27 $94,244 $418,381 $0 $603,528 7.40% * * * * * * * * *Elkin City Schools $208,677 $419 $22,066 $63 $0 $0 $0 $22,548 10.81% * * * * * * * * *Franklin County Schools $8,841,846 $47,660 $366,394 $1,123 $0 $0 $0 $415,177 4.70%
Gaston County Schools $20,945,268 $67,910 $709,677 $13,948 $67 $0 $0 $791,602 3.78% * * * * * * * * *Gates County Schools $184,123 $0 $545 $0 $0 $0 $0 $545 0.30% * * * * * * * * *Graham County Schools $433,033 $17,246 $114,587 $1,038 $0 $0 $0 $132,871 30.68% $1,587,978 $0 $0 $0 $0 $242,722 $0 $242,722 15.28%
Granville County Schools $3,211,097 $3,285 $8,110 $0 $0 $1,681 $0 $13,076 0.41% * * * * * * * * *Greene County Schools $1,954,117 $6,696 $84,466 $0 $0 $0 $0 $91,162 4.67% * * * * * * * * *Guildford County Schools(DNS-P) $0 $0 $0 $0 $0 $0 $0 $0 0.00% $8,269,823 $824,028 $0 $0 $0 $940,232 $0 $1,764,260 21.33%Halifax County Schools $2,855,824 $5,178 $71,065 $20 $0 $0 $0 $76,263 2.67%Harnett County Schools $2,563,009 $29,362 $265,316 $1,112 $0 $0 $0 $295,790 11.54% * * * * * * * * *Haywood County Schools $1,173,043 $7,042 $37,445 $0 $0 $0 $0 $44,487 3.79%Henderson County Public Schools $1,231,694 $28,988 $204,161 $0 $0 $0 $0 $233,149 18.93%Hertford County Public Schools $4,204,626 $421,296 $164,289 $564 $0 $0 $0 $586,149 13.94%Hickory Public Schools $0 $0 $0 $0 $0 $0 $0 $0 0.00%
Hoke County Schools $62,816 $28,323 $34,492 $0 $0 $0 $0 $62,816 100% * * * * * * * * *Hyde County Schools $1,752,489 $9,502 $28,984 $0 $0 $0 $0 $38,486 2.20% * * * * * * * * *Iredell-Statesville Schools $2,501,865 $128,370 $471,192 $6,116 $0 $5,809 $0 $611,487 24.44% $0 $0 $0 $0 $0 $0 $0 $0 0.00%Jackson County Board of Education $355,099 $13,094 $15,188 $0 $0 $0 $0 $28,282 7.96% $0 $0 $0 $0 $0 $0 $0 $0 0.00%
Johnston County Schools $3,622,404 $19,086 $815,060 $167,448 $0 $0 $0 $1,001,594 27.65% * * * * * * * * *Jones County Public Schools $785,855 $22,055 $19,462 $0 $0 $0 $0 $41,517 5.28% $84,954 $0 $0 $0 $0 $0 $0 $0 0.00%
Kannapolis City Schools $1,875,314 $13,399 $1,321 $3,000 $0 $0 $0 $17,720 0.94% * * * * * * * * *Kings Mountain (*merged to cleveland county schools ) $0 $0 $0 $0 $0 $0 $0 $0 0.00% * * * * * * * * *Lee County Board of Education $1,005,712 $2,689 $50,964 $0 $0 $0 $0 $54,117 5.38% $385,697 $0 $0 $0 $0 $90,000 $0 $90,000 23.33%Lenoir County Public Schools $1,532,006 $16,561 $273,558 $0 $0 $0 $0 $290,119 18.94%
Lexington City Schools $815,813 $0 $20,181 $0 $0 $0 $0 $20,181 2.47% * * * * * * * * *Lincoln County Schools $4,127,878 $46,171 $201,668 $2,475 $0 $0 $0 $250,314 6.06%
Macon County Schools $1,411,133 $2,116 $16,113 $0 $0 $0 $0 $18,229 1.29% * * * * * * * * *Madison County Public Schools $933,895 $2,884 $14,867 $0 $0 $0 $0 $17,751 1.90%
Martin County Schools $230,609 $939 $40,446 $167 $0 $0 $0 $41,552 18.02% * * * * * * * * *McDowell County Schools $1,866,372 $24,258 $223,835 $930 $0 $0 $0 $249,023 13.34%
K:\Hubrpt_Purchase and Construction\FY'06-07\Quarter and Annual\06-07PS 3 - 1.5.2 Source: HUB Purchasing Report Database and HUBSCO Construction Reporting SystemRun Date:1/16/07

NORTH CAROLINA DEPARTMENT OF ADMINISTRATION
OFFICE FOR HISTORICALLY UNDERUTILIZED BUSINESSES
Purchasing and Construction Reports - Public Schools - 1st Quarter 2006-07(July 1, 2006 - Sept. 30, 2006)1st Quarter 2006-07
(July 1, 2006- Sept. 30, 2006)
Public Entity Type/Entity
To
tal
Pu
rch
as
ing
($
)
MB
E (
$)
WB
E (
$)
DB
E-O
($
)
DB
E (
$)
NP
WC
($
)
Su
b (
$)
To
tal
HU
B (
$)
To
tal
HU
B (
%)
To
tal
Co
ns
tru
cti
on
V
alu
e (
$)
B($
)
H($
)
AA
($)
AI(
$)
WF
($)
SE
($)
To
tal
HU
B (
$)
To
tal
HU
B (
%)
HUB Construction Report - Construction ProjectsHUB Purchasing Report - Goods and Services
PUBLIC SCHOOLS - (Contd….)
Mitchell County Schools $227,543 $0 $0 $0 $0 $0 $0 $0 0.00% * * * * * * * * *Montgomery County Schools $1,033,857 $0 $34,229 $0 $0 $0 $0 $34,229 3.31% * * * * * * * * *Moore County Schools $3,680,073 $2,216 $86,894 $0 $0 $0 $0 $89,109 2.42% $13,875 $0 $0 $0 $0 $0 $0 $0 0.00%
Mooresville City Schools $520,965 $30,971 $6,537 $1,347 $238 $0 $0 $39,093 7.50% * * * * * * * * *Mount Airy County Schools $391,318 $5,733 $78,904 $16,958 $0 $0 $0 $101,595 25.96% * * * * * * * * *Nash-Rocky Mount Schools $1,066,863 $3,164 $26,115 $259,618 $0 $0 $0 $288,897 27.08%
New Hanover County Schools $12,134,282 $93,307 $586,553 $0 $0 $17,368 $0 $697,228 5.75% $1,569,688 $0 $433,541 $0 $0 $259,854 $0 $693,395 44.17%Newton-Conover City Schools $56,767 $0 $7,110 $0 $151 $0 $0 $7,261 12.79%Northampton County Schools $661,367 $8,481 $14,573 $0 $0 $0 $0 $23,053 3.49%
Onslow County Schools $5,527,873 $7,591 $127,963 $14,534 $0 $0 $0 $150,088 2.72% * * * * * * * * *Orange County Schools $2,518,516 $40,374 $621,196 $15,120 $311 $0 $0 $677,000 26.88% * * * * * * * * *Pamlico County Schools $303,840 $14,365 $8,335 $0 $0 $0 $0 $22,700 7.47% $0 $0 $0 $0 $0 $0 $0 $0 0.00%
Pender County Schools $1,627,061 $6,499 $296,575 $0 $940 $0 $180,201 $484,215 29.76% * * * * * * * * *Perquimans County Schools $41,968 $0 $1,642 $0 $0 $0 $0 $1,642 3.91% * * * * * * * * *Person County Schools $936,891 $6,131 $59,009 $0 $461 $0 $0 $65,601 7.00%Pitt County Schools $6,068,198 $667,712 $562,711 $350,893 $79,768 $308,806 $0 $1,969,890 32.46%
Polk County Schools $850,002 $0 $106,089 $0 $0 $0 $0 $106,089 12.48% * * * * * * * * *Randolph County Schools $18,848,582 $58,524 $3,842 $0 $0 $0 $0 $62,366 0.33%Richmond County Schools $1,371,382 $4,885 $231,460 $196 $0 $0 $0 $236,541 17.25%Roanoke Rapids City School $757,335 $34,478 $107,720 $1,095 $0 $0 $0 $143,293 18.92%
Robeson County Schools $18,231,710 $170,138 $278 $39,683 $0 $0 $0 $210,099 1.15% $0 $0 $0 $0 $0 $0 $0 $0 0.00%
Rockingham County Schools $1,619,704 $17,426 $136,918 $8,983 $0 $0 $0 $163,327 10.08% * * * * * * * * *Rowan/Salisbury County Schools $4,211,798 $3,728 $220,418 $33,284 $0 $0 $0 $257,431 6.11% * * * * * * * * *Rutherford County Schools $3,736,516 $1,530 $61,821 $0 $0 $0 $0 $63,351 1.70%
Sampson County Schools $2,134,376 $13,836 $54,664 $0 $2,029 $0 $0 $70,530 3.30% * * * * * * * * *Scotland County Schools $908,756 $204,616 $115,170 $0 $0 $0 $0 $319,786 35.19%
Shelby City Schools (*merged to Cleveland County Schools) $0 $0 $0 $0 $0 $0 $0 $0 0.00% * * * * * * * * *Stanly County Schools $3,339,216 $39,962 $208,552 $0 $0 $0 $0 $248,515 7.44% * * * * * * * * *Stokes County Schools $1,770,762 $606 $137,257 $1,041 $0 $0 $0 $138,904 7.84% $58,466 $0 $0 $0 $0 $0 $0 $0 0.00%Surry County Board of Education $1,126,046 $60,865 $100,666 $900 $22,000 $0 $0 $184,431 16.38% $0 $0 $0 $0 $0 $0 $0 $0 0.00%
Swain County Schools $19,711 $10,647 $4,127 $0 $0 $0 $0 $14,774 74.95% * * * * * * * * *Thomasville City Schools $676,028 $56,575 $297 $570 $0 $0 $0 $57,441 8.50% * * * * * * * * *Transylvania County Schools $793,686 $29,414 $46,456 $0 $0 $0 $0 $75,870 9.56% $1,004,700 $0 $0 $0 $0 $0 $0 $0 0.00%
Tyrell County Schools $180,798 $926 $7,402 $0 $0 $0 $0 $8,328 4.61% * * * * * * * * *
K:\Hubrpt_Purchase and Construction\FY'06-07\Quarter and Annual\06-07PS 3 - 1.5.3 Source: HUB Purchasing Report Database and HUBSCO Construction Reporting SystemRun Date:1/16/07

NORTH CAROLINA DEPARTMENT OF ADMINISTRATION
OFFICE FOR HISTORICALLY UNDERUTILIZED BUSINESSES
Purchasing and Construction Reports - Public Schools - 1st Quarter 2006-07(July 1, 2006 - Sept. 30, 2006)1st Quarter 2006-07
(July 1, 2006- Sept. 30, 2006)
Public Entity Type/Entity
To
tal
Pu
rch
as
ing
($
)
MB
E (
$)
WB
E (
$)
DB
E-O
($
)
DB
E (
$)
NP
WC
($
)
Su
b (
$)
To
tal
HU
B (
$)
To
tal
HU
B (
%)
To
tal
Co
ns
tru
cti
on
V
alu
e (
$)
B($
)
H($
)
AA
($)
AI(
$)
WF
($)
SE
($)
To
tal
HU
B (
$)
To
tal
HU
B (
%)
HUB Construction Report - Construction ProjectsHUB Purchasing Report - Goods and Services
PUBLIC SCHOOLS - (Contd….)Union County Public Schools(DNS-P) $0 $0 $0 $0 $0 $0 $0 $0 0.00% $457,964 $0 $0 $0 $0 $0 $0 $0 0.00%Vance County Board of Education $2,237,739 $0 $16,011 $0 $0 $0 $0 $16,011 0.72% $1,219,764 $0 $0 $0 $0 $4,500 $0 $4,500 0.37%Wake County Public School System - Au*iliary Services $76,532,137 $11,097,806 $7,595,940 $88,235 $0 $0 $0 $18,781,982 24.54% $12,668,523 $3,387 $373,196 $0 $0 $1,022,220 $0 $1,398,803 11.04%
Warren County Schools(RI) $0 $0 $0 $0 $0 $0 $0 $0 0.00% * * * * * * * * *Washington County Schools $973,876 $0 $0 $0 $0 $0 $0 $0 0.00%
Watauga County Schools $467,988 $19,780 $42,978 $0 $0 $0 $0 $62,758 13.41% * * * * * * * * *Wayne County Public Schools $2,620,612 $26,773 $261,376 $248 $1,606 $0 $0 $290,003 11.07% $30,241 $0 $0 $0 $0 $0 $0 $0 0.00%
Weldon City Schools $73,980 $0 $0 $0 $0 $0 $0 $0 0.00% * * * * * * * * *Whiteville City Schools $837,277 $5,200 $88,782 $0 $0 $0 $0 $93,982 11.22% * * * * * * * * *Wilkes County Public Schools $460,448 $4,858 $79,584 $5,895 $0 $0 $0 $90,337 19.62% $773,614 $0 $0 $0 $0 $0 $0 $0 0.00%Wilson County Schools $1,613,635 $6,892 $64,638 $240 $0 $0 $0 $71,770 4.45% $0 $0 $0 $0 $0 $0 $0 $0 0.00%Winston-Salem/Forsyth County Schools $14,045,721 $847,145 $952,476 $846,647 $0 $0 $0 $2,646,268 18.84%Yadkin County Schools $1,135,943 $3,837 $86,587 $3,016 $0 $0 $0 $93,440 8.23% $0 $0 $0 $0 $0 $0 $0 $0 0.00%Yancey County Schools $2,825,977 $270 $30,068 $0 $0 $244 $0 $30,582 1.08%
TOTALS $482,820,399 $17,551,893 $26,374,587 $2,211,145 $634,085 $856,361 $207,368 $47,835,438 9.91% $42,141,776 $939,770 $857,025 $0 $0 $4,729,877 $0 $6,526,672 15.49%
% of HUB Participation 3.64% 5.46% 0.46% 0.13% 0.18% 0.04% 9.91% 2.23% 2.03% 0.00% 0.00% 11.22% 0.00% 15.49%
%of Minority Participation against Total HUB $ 36.69% 55.14% 4.62% 1.33% 1.79% 0.43% 14.40% 13.13% 0.00% 0.00% 72.47% 0.00%
LEGEND: LEGEND: LEGEND
DNS-C - Categories with blanks or blank space indicate MBE - Minority Business Enterprise B - Black
entity "DID NOT SUBMIT" Construction Report WBE - Woman Business Enterprise H - Hispanic
DNS-P - Categories with blanks or blank space indicate DBE-O- Disabled - Owned Business Enterprise AA - Asian-American
entity "DID NOT SUBMIT" Purchasing Report DBE - Disabled Business Enterprise AI - American Indian
* - currently do not report NPWC - Non - profit Work Center for the Blind & Severely Disabled WF - White Female
RI - Report Inconclusive Sub - HUB Subcontractor SE - Socially and Economically Disadvantaged
Note: Public School Systems are required to submit Construction Report Semi-annually
1. When a construction project is finalized (submitted) by an entiity, HUBSCO system will update
to the relevant quarter when the project was completed
K:\Hubrpt_Purchase and Construction\FY'06-07\Quarter and Annual\06-07PS 3 - 1.5.4 Source: HUB Purchasing Report Database and HUBSCO Construction Reporting SystemRun Date:1/16/07

NORTH CAROLINA DEPARTMENT OF ADMINISTRATION
OFFICE FOR HISTORICALLY UNDERUTILIZED BUSINESSES
Purchasing and Construction Reports
State Universities - 1st Quarter 2006-07(July 1, 2006 - Sept. 30, 2006)1st Quarter 2006-07
(July 1 - Sept. 30, 2006)
Public Entity Type/Entity
To
tal
Pu
rch
as
ing
($
)
MB
E (
$)
WB
E (
$)
DB
E-O
($
)
DB
E (
$)
NP
WC
($
)
Su
b (
$)
To
tal
HU
B (
$)
To
tal
HU
B (
%)
To
tal
Co
ns
tru
cti
on
V
alu
e (
$)
B($
)
H($
)
AA
($)
AI(
$)
WF
($)
SE
($)
To
tal
HU
B (
$)
To
tal
HU
B (
%)
STATE UNIVERSITIESAppalachian State University(DNS-C) $5,280,835 $16,870 $213,096 $0 $0 $102,406 $0 $332,372 6.29% $185,620 $0 $0 $0 $185,620 $0 $0 $185,620 100%East Carolina University $20,569,186 $76,888 $621,210 $11,052 $0 $0 $2,092,276 $2,801,426 13.62% $40,293,788 $552,422 $165,759 $1,983 $98,547 $3,463,269 $116,975 $4,398,955 10.92%Elizabeth City State University(DNS-C) $7,720,331 $779,804 $23,171 $0 $0 $0 $0 $802,975 10.40%Fayetteville State University (DNS-C) $20,647,350 $480,354 $103,325 $0 $0 $0 $0 $583,679 2.83%North Carolina Agr. & Tech.l State University(DNS-C) $11,846,056 $1,274,369 $52,911 $0 $0 $0 $0 $1,327,280 11.20%North Carolina Arboretum (DNS-C) X X X X X X X X XNorth Carolina Central University (DNS-P-C) $7,520,120 $2,158,052 $275,995 $0 $0 $0 $0 $2,434,047 32.37%North Carolina School of Science and Mathematics $1,638,774 $210,338 $7,414 $0 $0 $0 $0 $217,752 13.29% $0 $0 $0 $0 $0 $0 $0 $0 0.00%North Carolina School of the Arts(DNS-C) $1,532,316 $88,716 $129,074 $0 $0 $0 $0 $217,790 14.21%North Carolina State University $44,848,666 $70,868 $344,350 $2,435 $1,050 $230 $0 $418,933 0.93% $31,337,330 $1,959,580 $738,914 $34,852 $0 $1,646,295 $2,633 $4,382,274 13.98%UNC Hospitals $110,628,029 $191,470 $36,110 $0 $0 $0 $0 $227,580 0.21% $942,900 $0 $0 $0 $0 $0 $0 $0 0.00%UNC-Asheville $1,206,114 $3,825 $45,266 $0 $0 $35,975 $0 $85,066 7.05% $808,231 $0 $0 $252,000 $0 $3,404 $0 $255,404 31.60%UNC-Chapel Hill $41,885,811 $375,534 $500,086 $347 $0 $0 $0 $875,967 2.09% $41,559,589 $1,366,532 $191,642 $7,140 $360,600 $3,673,696 $15,265 $5,614,875 13.51%UNC-Charlotte $10,681,238 $246,953 $1,443,798 $4,363 $0 $89,549 $0 $1,784,663 16.71% $26,641,973 $239,688 $0 $2,315 $0 $1,786,047 $0 $2,028,050 7.61%UNC-Greensboro $6,725,709 $419,698 $355,279 $6,603 $0 $0 $0 $781,580 11.62% $5,990,876 $146,695 $30,900 $0 $0 $543,932 $0 $721,527 12.04%UNC-Office of the President (DNS-C) $9,164,837 $14,122 $164,092 $0 $0 $0 $0 $178,214 1.94%UNC-Pembroke $3,374,633 $165,283 $78,434 $24,302 $2,100 $0 $0 $270,119 8.00% $1,318,407 $0 $0 $1,318,407 $0 $0 $0 $1,318,407 100%UNC-TV X X X X X X X X X $119,592 $5,828 $0 $0 $0 $0 $0 $5,828 4.87%UNC-Wilmington $11,693,155 $34,205 $485,979 $396 $20,469 $37,960 $0 $579,007 4.95% $1,381,498 $421,261 $0 $0 $0 $127,687 $0 $548,948 39.74%Western Carolina University(DNS-P) $0 $0 $0 $0 $0 $0 $0 $0 0.00% $0 $0 $0 $0 $0 $0 $0 $0 0.00%Winston-Salem State University $6,510,433 $248,477 $194,425 $0 $0 $0 $0 $442,902 6.80% $427,725 $16,300 $0 $5,368 $0 $0 $0 $21,668 5.07%
TOTALS $323,473,593 $6,855,827 $5,074,014 $49,497 $23,619 $266,119 $2,092,276 $14,361,352 4.44% $151,007,529 $4,708,306 $1,127,215 $1,622,065 $644,767 $11,244,330 $134,873 $19,481,556 12.90%
% of HUB Participation 2.12% 1.57% 0.02% 0.01% 0.08% 0.65% 4.44% 3.12% 0.75% 1.07% 0.43% 7.45% 0.09% 12.90%
%of Minority Participation against Total HUB $ 47.74% 35.33% 0.34% 0.16% 1.85% 14.57% 24.17% 5.79% 8.33% 3.31% 57.72% 0.69%
LEGEND: LEGEND: LEGEND
DNS-C - Categories with blanks or blank space indicate MBE - Minority Business Enterprise B - Black
entity "DID NOT SUBMIT" Construction Report WBE - Woman Business Enterprise H - Hispanic
DNS-P - Categories with blanks or blank space indicate DBE-O- Disabled - Owned Business Enterprise AA - Asian-American
entity "DID NOT SUBMIT" Purchasing Report DBE - Disabled Business Enterprise AI - American Indian
X - no reporting requirements NPWC - Non - profit Work Center for the Blind & Severely Disabled WF - White Female
Sub - HUB Subcontractor SE - Socially and Economically DisadvantagedNote:
1. When a construction project is finalized (submitted) by an entiity, HUBSCO system will update
to the relevant quarter when the project was completed
HUB Construction Report - Construction ProjectsHUB Purchasing Report - Goods and Services
K:\Hubrpt_Purchase and Construction\FY'06-07\Quarter and Annual\06-07SU 3 - 1.6 Source:HUB Purchasing Report and HUBSCO Construction Reporting SystemRun Date: 1/16/07

NORTH CAROLINA DEPARTMENT OF ADMINISTRATION
OFFICE FOR HISTORICALLY UNDERUTILIZED BUSINESSES
Purchasing and Construction Reports
Counties - 1st Quarter 2006-07(July 1, 2006 - Sept. 30, 2006)1st Quarter 2006-07
(July 1, 2006 - Sept. 30, 2006)
Public Entity Type/Entity
To
tal
Pu
rch
asin
g (
$)
MB
E (
$)
WB
E (
$)
DB
E-O
($)
DB
E (
$)
NP
WC
($)
Su
b (
$)
To
tal
HU
B (
$)
To
tal
HU
B (
%)
To
tal
Co
nst
ruct
ion
V
alu
e ($
)
B($
)
H($
)
AA
($)
AI(
$)
WF
($)
SE
($)
To
tal
HU
B (
$)
To
tal
HU
B (
%)
COUNTIESCounty of Alamance X X X X X X X X X $39,939 $0 $0 $0 $0 $39,939 $0 $39,939 100%County of Alleghany(DNS-C) X X X X X X X X XCounty of Ashe (DNS-C) X X X X X X X X XCounty of Bladen X X X X X X X X X $0 $0 $0 $0 $0 $0 $0 $0 0.00%County of Buncombe(DNS-C) X X X X X X X X XCounty of Cabarrus X X X X X X X X X $27,223 $0 $0 $0 $0 $0 $0 $0 0.00%County of Camden(DNS-C) X X X X X X X X XCounty of Carteret X X X X X X X X X $499,360 $0 $0 $0 $0 $0 $0 $0 0.00%County of Caswell X X X X X X X X X $0 $0 $0 $0 $0 $0 $0 $0 0.00%County of Catawba(DNS-C) X X X X X X X X XCounty of Cleveland(DNS-C) X X X X X X X X XCounty of Columbus(DNS-C) X X X X X X X X XCounty of Cumberland(DNS-C) X X X X X X X X XCounty of Currituck(DNS-C) X X X X X X X X XCounty of Dare (DNS-C) X X X X X X X X XCounty of Davidson X X X X X X X X X $0 $0 $0 $0 $0 $0 $0 $0 0.00%County of Edgecombe X X X X X X X X X $0 $0 $0 $0 $0 $0 $0 $0 0.00%County of Gaston(DNS-C) X X X X X X X X XCounty of Graham (DNS-C) X X X X X X X X XCounty of Granville(DNS-C) X X X X X X X X XCounty of Guilford X X X X X X X X X $472,629 $14,695 $59,760 $74,455 15.75%County of Harnett X X X X X X X X X $0 $0 $0 $0 $0 $0 $0 $0 0.00%County of Hoke (DNS-C) X X X X X X X X XCounty of Iredell(DNS-C) X X X X X X X X XCounty of Lee (DNS-C) X X X X X X X X XCounty of Mecklenburg X X X X X X X X X $214,789 $375 $0 $0 $0 $58,507 $0 $58,882 27.41%County of Moore(DNS-C) X X X X X X X X XCounty of Nash (DNS-C) X X X X X X X X XCounty of Onslow (DNS-C) X X X X X X X X XCounty of Polk (DNS-C) X X X X X X X X XCounty of Randolph X X X X X X X X X $0 $0 $0 $0 $0 $0 $0 $0 0.00%County of Rockingham X X X X X X X X X $56,576 $21,275 $0 $0 $0 $0 $0 $21,275 37.60%County of Sampson(DNS-C) X X X X X X X X XCounty of Surry X X X X X X X X X $294,265 $0 $0 $0 $0 $0 $0 $0 0.00%
HUB Construction Report - Construction ProjectsHUB Purchasing Report - Goods and Services
K:\Hubrpt_Purchase and Construction\FY'06-07\Quarter and Annual\06-07Counties 3 - 1.7.1 Source: HUBSCO Construction Reporting SystemRun Date:1/16/07

NORTH CAROLINA DEPARTMENT OF ADMINISTRATION
OFFICE FOR HISTORICALLY UNDERUTILIZED BUSINESSES
Purchasing and Construction Reports
Counties - 1st Quarter 2006-07(July 1, 2006 - Sept. 30, 2006)1st Quarter 2006-07
(July 1, 2006 - Sept. 30, 2006)
Public Entity Type/Entity
To
tal
Pu
rch
asin
g (
$)
MB
E (
$)
WB
E (
$)
DB
E-O
($)
DB
E (
$)
NP
WC
($)
Su
b (
$)
To
tal
HU
B (
$)
To
tal
HU
B (
%)
To
tal
Co
nst
ruct
ion
V
alu
e ($
)
B($
)
H($
)
AA
($)
AI(
$)
WF
($)
SE
($)
To
tal
HU
B (
$)
To
tal
HU
B (
%)
HUB Construction Report - Construction ProjectsHUB Purchasing Report - Goods and Services
COUNTIES - (Contd…)County of Transylvania X X X X X X X X X $0 $0 $0 $0 $0 $0 $0 $0 0.00%County of Union(DNS-C) X X X X X X X X XCounty of Vance X X X X X X X X X $0 $0 $0 $0 $0 $0 $0 $0 0.00%County of Wake X X X X X X X X X $8,649,124 $0 $4,500 $0 $10,387 $587,218 $0 $602,105 6.96%County of Warren(DNS-C) X X X X X X X X XCounty of Washington (DNS-C) X X X X X X X X XCounty of Watauga (DNS-C) X X X X X X X X X
TOTALS - - - - - - - - - $10,253,905 $36,345 $4,500 $0 $10,387 $745,424 $0 $796,656 7.77%
% of HUB Participation 0.35% 0.04% 0.00% 0.10% 7.27% 0.00% 7.77%
%of Minority Participation against Total HUB $ 4.56% 0.56% 0.00% 1.30% 93.57% 0.00%
LEGEND: LEGEND: LEGEND
DNS-C - Categories with blanks or blank space indicate MBE - Minority Business Enterprise B - Black
entity "DID NOT SUBMIT" Construction Report WBE - Woman Business Enterprise H - Hispanic
DNS-P - Categories with blanks or blank space indicate DBE-O- Disabled - Owned Business Enterprise AA - Asian-American
entity "DID NOT SUBMIT" Purchasing Report DBE - Disabled Business Enterprise AI - American Indian
X - no reporting requirements NPWC - Non - profit Work Center for the Blind & Severely Disabled WF - White Female
Sub - HUB Subcontractor SE - Socially and Economically Disadvantaged
Note:
1. When a construction project is finalized (submitted) by an entiity, HUBSCO system will update
to the relevant quarter when the project was completed
K:\Hubrpt_Purchase and Construction\FY'06-07\Quarter and Annual\06-07Counties 3 - 1.7.2 Source: HUBSCO Construction Reporting SystemRun Date:1/16/07

NORTH CAROLINA DEPARTMENT OF ADMINISTRATION
OFFICE FOR HISTORICALLY UNDERUTILIZED BUSINESSES
Purchasing and Construction Reports - Municipalities - 1st Quarter 2006-07(July 1, 2006 - Sept. 30, 2006)1st Quarter 2006-07(July 1 -
Sept. 30, 2006)
Public Entity Type/Entity
To
tal
Pu
rch
asin
g
($)
MB
E (
$)
WB
E (
$)
DB
E-O
($)
DB
E (
$)
NP
WC
($)
Su
b (
$)
To
tal
HU
B (
$)
To
tal
HU
B (
%)
To
tal
Co
nst
ruct
ion
V
alu
e ($
)
B($
)
H($
)
AA
($)
AI(
$)
WF
($)
SE
($)
To
tal
HU
B (
$)
To
tal
HU
B (
%)
MUNICIPALITIES
City of Albemarle X X X X X X X X X $167,100 $0 $0 $0 $0 $0 $0 $0 0.00%
City of Asheboro(DNS-C) X X X X X X X X XCity of Asheville(DNS-C) X X X X X X X X XCity of Charlotte X X X X X X X X X $795,455 $33,985 $0 $0 $0 $6,392 $0 $40,377 5.08%
City of Concord(DNS-C X X X X X X X X XCity of Durham(DNS-C) X X X X X X X X XCity of Eden X X X X X X X X X $27,880 $0 $0 $0 $0 $0 $0 $0 0.00%
City of Elizabeth City X X X X X X X X X $644,935 $0 $0 $0 $0 $0 $0 $0 0.00%
City of Fayetteville X X X X X X X X X $0 $0 $0 $0 $0 $0 $0 $0 0.00%
City of Greenville (DNS-C) X X X X X X X X XCity of Hickory X X X X X X X X X $0 $0 $0 $0 $0 $0 $0 $0 0.00%
City of High Point(DNS-C) X X X X X X X X XCity of Jacksonville X X X X X X X X X $684,249 $0 $0 $0 $0 $0 $0 $0 0.00%
City of Kings Mountain X X X X X X X X X $0 $0 $0 $0 $0 $0 $0 $0 0.00%
City of Lexington(DNS-C) X X X X X X X X XCity of Raleigh (DNS-C) X X X X X X X X XCity of Reidsville X X X X X X X X X $254,338 $5,130 $0 $0 $0 $3,141 $0 $8,271 3.25%
City of Roanoke Rapids X X X X X X X X X $0 $0 $0 $0 $0 $0 $0 $0 0.00%
City of Rocky Mount X X X X X X X X X $0 $0 $0 $0 $0 $0 $0 $0 0.00%
City of Sanford(DNS-C) X X X X X X X X XCity of Southport (DNS-C) X X X X X X X X XCity of Statesville X X X X X X X X X $0 $0 $0 $0 $0 $0 $0 $0 0.00%
City of Thomasville (DNS-C) X X X X X X X X XCity of Wilmington X X X X X X X X X $0 $0 $0 $0 $0 $0 $0 $0 0.00%
City of Wilson X X X X X X X X X $0 $0 $0 $0 $0 $0 $0 $0 0.00%
City of Winston-Salem X X X X X X X X X $3,854,155 $101,459 $0 $0 $0 $177,192 $0 $278,651 7.23%
Public Works Commission - Fayetteville X X X X X X X X X $0 $0 $0 $0 $0 $0 $0 $0 0.00%
Town of Blowing Rock X X X X X X X X X $0 $0 $0 $0 $0 $0 $0 $0 0.00%
Town of Bolivia X X X X X X X X X $0 $0 $0 $0 $0 $0 $0 $0 0.00%
Town of Calabash (DNS-C) X X X X X X X X XTown of Calypso X X X X X X X X X $0 $0 $0 $0 $0 $0 $0 $0 0.00%
Town of Cape Cateret (DNS-C) X X X X X X X X XTown of Carrboro (DNS-C) X X X X X X X X XTown of Chapel Hill X X X X X X X X X $0 $0 $0 $0 $0 $0 $0 $0 0.00%
Town of Hoffman X X X X X X X X X $0 $0 $0 $0 $0 $0 $0 $0 0.00%
Town of Mills River (DNS-C) X X X X X X X X XTown of Mt. Gilead (DNS-C) X X X X X X X X XTown of Princeton (DNS-C) X X X X X X X X X
1st Quarter HUB Purchasing Report -Goods and Services 1st Quarter HUB Construction Report - Construction Projects
K:\Hubrpt_Purchase and Construction\FY'06-07\Quarter and Annual\06-07MNCPTY 3 -1.8-1Source:HUBSCO Construction Reporting System
Run Date:1/16/07

NORTH CAROLINA DEPARTMENT OF ADMINISTRATION
OFFICE FOR HISTORICALLY UNDERUTILIZED BUSINESSES
Purchasing and Construction Reports - Municipalities - 1st Quarter 2006-07(July 1, 2006 - Sept. 30, 2006)1st Quarter 2006-07(July 1 -
Sept. 30, 2006)
Public Entity Type/Entity
To
tal
Pu
rch
asin
g
($)
MB
E (
$)
WB
E (
$)
DB
E-O
($)
DB
E (
$)
NP
WC
($)
Su
b (
$)
To
tal
HU
B (
$)
To
tal
HU
B (
%)
To
tal
Co
nst
ruct
ion
V
alu
e ($
)
B($
)
H($
)
AA
($)
AI(
$)
WF
($)
SE
($)
To
tal
HU
B (
$)
To
tal
HU
B (
%)
1st Quarter HUB Purchasing Report -Goods and Services 1st Quarter HUB Construction Report - Construction Projects
MUNICIPALITIES - (Contd…)Town of Lewisville (DNS) X X X X X X X X X $0 $0 $0 $0 $0 $0 $0 0.00%Town of Mills River (DNS) X X X X X X X X X $0 $0 $0 $0 $0 $0 $0 0.00%Town of Mt. Gilead (DNS) X X X X X X X X X $0 $0 $0 $0 $0 $0 $0 0.00%Town of Princeton (DNS) X X X X X X X X X $0 $0 $0 $0 $0 $0 $0 0.00%
Town of Salemburg X X X X X X X X X $0 $0 $0 $0 $0 $0 $0 $0 0.00%
Town of Saratoga X X X X X X X X X $0 $0 $0 $0 $0 $0 $0 $0 0.00%
Town of Southern Pines X X X X X X X X X $0 $0 $0 $0 $0 $0 $0 $0 0.00%
Town of Spring Lake X X X X X X X X X $2,669,930 $244,359 $0 $0 $0 $323,642 $0 $568,001 21.27%
Town of Spruce Pine X X X X X X X X X $0 $0 $0 $0 $0 $0 $0 $0 0.00%
Town of Tarboro(DNS-C) X X X X X X X X XTown of Topsail Beach (DNS-C) X X X X X X X X XTown of Turkey X X X X X X X X X $0 $0 $0 $0 $0 $0 $0 $0 0.00%
Town of Vass(DNS-C) X X X X X X X X XTown of Wagram (DNS-C) X X X X X X X X XTown of Wentworth X X X X X X X X X $0 $0 $0 $0 $0 $0 $0 $0 0.00%
Town of White Lake X X X X X X X X X $0 $0 $0 $0 $0 $0 $0 $0 0.00%
Town of Winterville (DNS) X X X X X X X X X $0 $0 $0 $0 $0 $0 $0 $0 0.00%
Town of Zebulon (DNS) X X X X X X X X X $0 $0 $0 $0 $0 $0 $0 $0 0.00%Village of Alamance (DNS) X X X X X X X X X $0 $0 $0 $0 $0 $0 $0 $0
Village of Clemmons X X X X X X X X X $0 $0 $0 $0 $0 $0 $0 $0 0.00%
Village of Forest Hills (DNS-C) X X X X X X X X XVillage of Wesley Chapel (DNS-C) X X X X X X X X XVillage of Wesely Chapel X X X X X X X X X $0 $0 $0 $0 $0 $0 $0 $0 0.00%
TOTALS - - - - - - - - - $9,098,042 $384,933 $0 $0 $0 $510,367 $0 $895,300 9.84%
% of HUB Participation 4.23% 0.00% 0.00% 0.00% 5.61% 0.00% 9.84%
%of Minority Participation against Total HUB $ 42.99% 0.00% 0.00% 0.00% 57.01% 0.00%
LEGEND: LEGEND LEGEND:
DNS-C - Categories with blanks or blank space indicate MBE - Minority Business Enterprise B - Black
entity "DID NOT SUBMIT" Construction Report WBE - Woman Business Enterprise H - Hispanic
DNS-P - Categories with blanks or blank space indicate DBE-O- Disabled - Owned Business Enterprise AA - Asian-American
entity "DID NOT SUBMIT" Purchasing Report DBE - Disabled Business Enterprise AI - American Indian
X - no reporting requirements NPWC - Non - profit Work Center for the Blind & Severely Disabled WF - White Female
Note: Sub - HUB Subcontractor SE - Socially and Economically Disadvantaged
1. When a construction project is finalized (submitted) by an entiity, HUBSCO system will update
to the relevant quarter when the project was completed
K:\Hubrpt_Purchase and Construction\FY'06-07\Quarter and Annual\06-07MNCPTY 3 -1.8-2Source:HUBSCO Construction Reporting System
Run Date:1/16/07

NORTH CAROLINA DEPARTMENT OF ADMINISTRATION
OFFICE FOR HISTORICALLY UNDERUTILIZED BUSINESSES
Purchasing and Construction Reports
Hospital Associations - 1st Quarter 2006-07(July 1, 2006 - Sept. 30, 2006)
1st Quarter 2006-07 (July 1, 2006 - Sept. 30, 2006)
Public Entity Type/Entity
To
tal
Pu
rch
asin
g
($)
MB
E (
$)
WB
E (
$)
DB
E-O
($)
DB
E (
$)
NP
WC
($)
Su
b (
$)
To
tal H
UB
($)
To
tal H
UB
(%
)
To
tal
Co
nst
ruct
ion
V
alu
e ($
)
B($
)
H($
)
AA
($)
AI(
$)
WF
($)
SE
($)
To
tal H
UB
($)
To
tal H
UB
(%
)
HOSPITAL ASSOCIATIONSAlbemarle Hospital Authority X X X X X X X X X $313,447 $0 $0 $0 $0 $0 $0 $0 0.00%
Cape Fear Valley Health System(DNS-C) X X X X X X X X XCarteret County General Hospital Corporation (DNS-C) X X X X X X X X XGranville Medical Center X X X X X X X X X $0 $0 $0 $0 $0 $0 $0 $0 0.00%
Iredell Memorial Hospital, Incorporated (DNS-C) X X X X X X X X XNew Hanover Health Network X X X X X X X X X $303,664 $0 $0 $0 $0 $8,815 $0 $8,815 2.90%
Stokes-Reynolds Memorial Hospital, Inc. X X X X X X X X X $0 $0 $0 $0 $0 $0 $0 $0 0.00%
TOTALS - - - - - - - - - $617,111 $0 $0 $0 $0 $8,815 $0 $8,815 1.43%
% of HUB Participation 0.00% 0.00% 0.00% 0.00% 1.43% 0.00% 1.43%
%of Minority Participation against Total HUB $ 0.00% 0.00% 0.00% 0.00% 100.00% 0.00%
LEGEND
DNS-C - Categories with blanks or blank space indicate LEGEND: LEGEND
entity "DID NOT SUBMIT" Construction Report MBE - Minority Business Enterprise B - Black
DNS-P - Categories with blanks or blank space indicate WBE - Woman Business Enterprise H - Hispanic
entity "DID NOT SUBMIT" Purchasing Report DBE-O- Disabled - Owned Business Enterprise AA - Asian-American
X - no reporting requirements DBE - Disabled Business Enterprise AI - American Indian
NPWC - Non - profit Work Center for the Blind & Severely Disabled WF - White Female
Note: Sub - HUB Subcontractor SE - Socially and Economically Disadvantaged
1. When a construction project is finalized (submitted) by an entiity, HUBSCO system will update
to the relevant quarter when the project was completed
HUB Construction Report - Construction ProjectsHUB Purchasing Report - Goods and Services
K:\Hubrpt_Purchase and Construction\FY'06-07\Quarter and Annual\06-07HA 3 - 1.9 Source:HUBSCO Construction Reporting SystemRun Date:1/16/07

NORTH CAROLINA DEPARTMENT OF ADMINISTRATION
OFFICE FOR HISTORICALLY UNDERUTILIZED BUSINESSES
Purchasing and Construction Reports
Non-St. Agencies and Public H. Authorities - 1st Quarter 2006-07(July 1 - Sept. 30, 2006)
1st Quarter 2006-07 (July 1, 2006 - Sept. 30, 2006)
Public Entity Type/Entity
To
tal
Pu
rch
asin
g
($)
MB
E (
$)
WB
E (
$)
DB
E-O
($)
DB
E (
$)
NP
WC
($)
Su
b (
$)
To
tal H
UB
($)
To
tal H
UB
(%
)
To
tal
Co
nst
ruct
ion
V
alu
e ($
)
B($
)
H($
)
AA
($)
AI(
$)
WF
($)
SE
($)
To
tal H
UB
($)
To
tal H
UB
(%
)
NON-STATE AGENCIESGreenville Utilities X X X X X X X X X $0 $0 $0 $0 $0 $0 $0 $0 0.00%Johnston County Public Utilities(DNS-C) X X X X X X X X X
TOTALS - - - - - - - - - $0 $0 $0 $0 $0 $0 $0 $0 0.00%
% of HUB Participation
%of Minority Participation against Total HUB $
PUBLIC HOUSING AUTHORITIESDunn Housing Authority (DNS-C) X X X X X X X X XForest City Housing Authority (DNS-C) X X X X X X X X XHickory Public Housing Authority(DNS-C) X X X X X X X X XHigh Point Housing Authority (DNS-C) X X X X X X X X XLexington Housing Authority X X X X X X X X X $188,765 $0 $0 $0 $0 $0 $0 $0 0.00%Mooresville Housing Authority (DNS-C) X X X X X X X X XMount Olive Housing Authority (DNS-C) X X X X X X X X XNorthwestern Regional Housing Authority X X X X X X X X X $0 $0 $0 $0 $0 $0 $0 $0 0.00%Pembroke Housing Authority (DNS-C) X X X X X X X X XRandleman Housing Authority X X X X X X X X X $0 $0 $0 $0 $0 $0 $0 $0 0.00%Selma Housing Authority (DNS-C) X X X X X X X X XSmithfield Housing Authority(DNS-C) X X X X X X X X X
TOTALS - - - - - - - - - $188,765 $0 $0 $0 $0 $0 $0 $0 0.00%% of HUB Participation 0.00% 0.00% 0.00% 0.00% 0.00% 0.00% 0.00%
%of Minority Participation against Total HUB $
LEGEND: LEGEND: LEGEND
DNS-C-C - Categories with blanks or blank space indicate MBE - Minority Business Enterprise B - Black
entity "DID NOT SUBMIT" Construction Report WBE - Woman Business Enterprise H - Hispanic
DNS-C-P - Categories with blanks or blank space indicate DBE-O- Disabled - Owned Business Enterprise AA - Asian-American
entity "DID NOT SUBMIT" Purchasing Report DBE - Disabled Business Enterprise AI - American Indian
X - no reporting requirements NPWC - Non - profit Work Center for the Blind & Severely Disabled WF - White Female
Note: Sub - HUB Subcontractor SE - Socially and Economically Disadvantaged
1. When a construction project is finalized (submitted) by an entiity, HUBSCO system will update
to the relevant quarter when the project was completed
HUB Construction Report - Construction ProjectsHUB Purchasing Report - Goods and Services
K:\Hubrpt_Purchase and Construction\FY'06-07\Quarter and Annual\06-07NSA_PHA 3 - 1.10 Source: HUBSCO Construction Reporting SystemRun Date:1/16/07

NORTH CAROLINA DEPARTMENT OF ADMINISTRATION
OFFICE FOR HISTORICALLY UNDERUTILIZED BUSINESSES
Purchasing and Construction Reports
Water Sewer, and Airport Authorities - 1st Quarter 06-07(July 1 - Sept. 30, 2006)
1st Quarter 2006-07 (July 1, 2006 - Sept. 30, 2006)
Public Entity Type/Entity
To
tal
Pu
rch
asin
g
($)
MB
E (
$)
WB
E (
$)
DB
E-O
($)
DB
E (
$)
NP
WC
($)
Su
b (
$)
To
tal H
UB
($)
To
tal H
UB
(%
)
To
tal
Co
nst
ruct
ion
V
alu
e ($
)
B($
)
H($
)
AA
($)
AI(
$)
WF
($)
SE
($)
To
tal H
UB
($)
To
tal H
UB
(%
)
WATER AND SEWER AUTHORITIES Piedmont Triad Regional Water Authority (DNS-C) X X X X X X X X XSewerage District - Buncombe County Metropolitan X X X X X X X X X $0 $0 $0 $0 $0 $0 $0 $0 0.00%
Water and Sewer Authority - Cabarrus County X X X X X X X X X $0 $0 $0 $0 $0 $0 $0 $0 0.00%
Water and Sewer Authority - Orange County (DNS-C) X X X X X X X X XTOTALS - - - - - - - - - $0 $0 $0 $0 $0 $0 $0 $0 0.00%
% of HUB Participation
%of Minority Participation against Total HUB $
AIRPORT AUTHORITIES
Charlotte Douglas International Airport X X X X X X X X X $1,050,830 $0 $0 $0 $0 $0 $0 $0 0.00%
Laurinburg-Maxton Airport Commission(DNS-C) X X X X X X X X XPiedmont Triad Airport Authority (DNS) X X X X X X X X XRaleigh-Durham Airport Authority (DNS-C) X X X X X X X X X
TOTALS - - - - - - - - - $1,050,830 $0 $0 $0 $0 $0 $0 $0 0.00%
% of HUB Participation 0.00% 0.00% 0.00% 0.00% 0.00% 0.00% 0.00%
%of Minority Participation against Total HUB $
LEGEND: LEGEND: LEGEND
DNS-C - Categories with blanks or blank space indicate MBE - Minority Business Enterprise B - Black
entity "DID NOT SUBMIT" Construction Report WBE - Woman Business Enterprise H - Hispanic
DNS-P - Categories with blanks or blank space indicate DBE-O- Disabled - Owned Business Enterprise AA - Asian-American
entity "DID NOT SUBMIT" Purchasing Report DBE - Disabled Business Enterprise AI - American Indian
X - no reporting requirements NPWC - Non - profit Work Center for the Blind & Severely Disabled WF - White Female
Note: Sub - HUB Subcontractor SE - Socially and Economically Disadvantaged
1. When a construction project is finalized (submitted) by an entiity, HUBSCO system will update
to the relevant quarter when the project was completed
HUB Construction Report - Construction ProjectsHUB Purchasing Report - Goods and Services
K:\Hubrpt_Purchase and Construction\FY'06-07\Quarter and Annual\06-07WS_AA 3 - 1.11 Source: HUBSCO Construction Reporting SystemRun Date:1/16/07

State of North Carolina
State of North Carolina Department of Administration
OFFICE FOR HISTORICALLY UNDERUTILIZED BUSINESSES (HUB)
PURCHASING (GOODS and SERVICES) and CONSTRUCTION REPORT
2nd Quarter FY 06 - 07 (Oct. 1, 2006 – Dec. 31, 2006)
State of North Carolina
Michael F. Easley, Governor
N.C. Department of Administration Britt Cobb, Secretary
Office for Historically Underutilized Businesses
Bridget L. Wall, Assistant to Secretary for HUB Outreach Rick Baskett Sr., Deputy Director
Mathew Idiculla, Compliance Specialist
Prepared by: Office for Historically Underutilized Businesses 116 West Jones Street, Suite 2109 Raleigh, NC 27603

NORTH CAROLINA DEPARTMENT OF ADMINISTRATION
OFFICE FOR HISTORICALLY UNDERUTILIZED BUSINESSES
Purchasing and Construction Reports
SUMMARY - 2nd Quarter 2006-07(Oct. 1, 2006 - Dec. 31, 2006)
2nd Quarter 2006-07(Oct. 1 - Dec. 31,
2006)1st Qtr
1st Qtr
Public Entity Type
1st
Qu
arte
r T
ota
lHU
B(%
)
To
tal
Pu
rch
asin
g (
$)
MB
E (
$)
WB
E (
$)
DB
E-O
($)
DB
E (
$)
NP
WC
($)
Su
b (
$)
To
tal H
UB
($)
To
tal H
UB
(%
)
To
tal
Pu
rch
asin
g (
$)
To
tal H
UB
($)
To
tal H
UB
(%
)
1st
Qu
arte
r T
ota
lHU
B(%
)
To
tal
Co
nst
ruct
ion
V
alu
e ($
)
B($
)
H($
)
AA
($)
AI(
$)
WF
($)
SE
($)
To
tal H
UB
($)
To
tal H
UB
(%
)
To
tal
Co
nst
ruct
ion
V
alu
e ($
)
To
tal H
UB
($)
To
tal H
UB
(%
)
CABINET AGENCIES 9.68% $251,882,819 $6,688,944 $16,089,635 $168,187 $74,546 $0 $0 $23,021,312 9.14% $563,509,199 $53,176,572 9.44% 0.00% $1,526,255 $6,875 $0 $0 $0 $84,000 $0 $90,875 5.95% $2,479,786 $90,875 3.66%
COUNCIL AGENCIES 3.29% $33,751,778 $2,856,066 $977,331 $67,466 $0 $0 $0 $3,900,863 11.56% $113,746,082 $6,530,282 5.74% 0.00% $0 $0 $0 $0 $0 $0 $0 $0 0.00% $0 $0 0.00%
SUPPORTING AGENCIES 17.26% $33,144,271 $1,350,285 $4,086,397 $0 $0 $0 $0 $5,436,681 16.40% $69,950,579 $11,791,173 16.86% 3.81% $0 $0 $0 $0 $0 $0 $0 $0 0.00% $4,888,773 $186,492 3.81%
COMMUNITY COLLEGES 6.30% $78,880,067 $1,966,730 $4,431,631 $163,778 $36,451 $86,493 $9,857 $6,694,939 8.49% $159,623,474 $11,782,967 7.38% 28.82% $20,842,011 $49,662 $187,210 $0 $1,467,312 $2,743,768 $8,986 $4,456,938 21.38% $27,796,964 $6,461,043 23.24%
PUBLIC SCHOOLS 9.91% $380,174,892 $6,748,271 $18,049,255 $1,935,616 $386,908 $386,813 $633,963 $28,140,826 7.40% $862,995,291 $75,976,264 8.80% 13.85% $34,345,890 $773,506 $620,944 $24,350 $38,600 $4,035,197 $0 $5,492,597 15.99% $93,907,297 $13,740,354 14.63%
STATE UNIVERSITIES 4.44% $202,334,501 $5,455,417 $3,583,982 $179,992 $15,412 $7,027 $1,955,353 $11,197,182 5.53% $525,808,094 $25,558,534 4.86% 12.90% $60,076,258 $2,249,880 $853,373 $18,099 $4,558 $4,460,076 $412,491 $7,998,477 13.31% $211,083,787 $27,480,033 13.02%
COUNTIES X X X X X X X X X X X X X 7.77% $22,405,781 $908,864 $54,564 $0 $790,960 $1,788,695 $183,053 $3,726,136 16.63% $32,659,686 $4,522,791 13.85%
MUNICIPALITIES X X X X X X X X X X X X X 9.84% $10,670,531 $851,907 $285,546 $0 $0 $564,237 $0 $1,701,690 15.95% $19,768,573 $2,596,990 13.14%
HOSPITAL ASSOCIATIONS X X X X X X X X X X X X X 1.43% $0 $0 $0 $0 $0 $0 $0 $0 0.00% $617,111 $8,815 1.43%
NON-STATE AGENCIES X X X X X X X X X X X X X 0.00% $0 $0 $0 $0 $0 $0 $0 $0 0.00% $0 $0 0.00%
PUBLIC HOUSING AUTHORITIES X X X X X X X X X X X X X 0.00% $68,714 $11,000 $0 $0 $0 $0 $0 $11,000 16.01% $257,479 $11,000 4.27%
WATER AND SEWER AUTHORITIES X X X X X X X X X X X X X 0.00% $0 $0 $0 $0 $0 $0 $0 $0 0.00% $0 $0 0.00%
AIRPORT AUTHORITIES X X X X X X X X X X X X X 0.00% $234,182 $0 $0 $0 $0 $0 $0 $0 0.00% $1,285,012 $0 0.00%
Grand Totals 8.09% $980,168,328 $25,065,713 $47,218,231 $2,515,039 $513,317 $480,333 $2,599,173 $78,391,803 8.00% $2,295,632,718 $184,815,791 8.05% 12.93% $150,169,622 $4,851,694 $2,001,637 $42,449 $2,301,430 $13,675,973 $604,530 $23,477,713 15.63% $394,744,468 $55,098,393 13.96%
% of HUB Participation 2.56% 4.82% 0.26% 0.05% 0.05% 0.27% 8.00% 8.05% 3.23% 1.33% 0.03% 1.53% 9.11% 0.40% 15.63% 13.96%
%of Minority Participation against Total HUB $ 31.97% 60.23% 3.21% 0.65% 0.61% 3.32% 20.67% 8.53% 0.18% 9.80% 58.25% 2.57%
$28,140,826
LEGEND: LEGEND: LEGEND:
MBE - Minority Business Enterprise B - Black
X - no reporting requirements WBE - Woman Business Enterprise H - Hispanic
DBE-O- Disabled - Owned Business Enterprise AA - Asian-American
DBE - Disabled Business Enterprise AI - American Indian
NPWC - Non - profit Work Center for the Blind & Severely Disabled WF - White Female
Sub - HUB Subcontractor SE - Socially and Economically Disadvantaged
Note:
1. When a construction project is finalized (submitted) by an entiity, HUBSCO system will update
to the relevant quarter when the project was completed
Year-to-DateYear-to-Date2nd Quarter HUB Purchasing Report - Goods and Services 2nd Quarter HUB Construction Report - Construction Projects
K:\Hubrpt_Purchase and Construction\FY'06-07\Quarter and Annual\06-07summary 3-2.0 Source: HUB Purchasing Report Database and HUBSCO Construction Reporting SystemRun Date: 07/11/2007

NORTH CAROLINA DEPARTMENT OF ADMINISTRATION
OFFICE FOR HISTORICALLY UNDERUTILIZED BUSINESSES
Purchasing and Construction Reports
CABINET AGENCIES - 2nd Quarter 2006-07(Oct. 1, 2006 - Dec. 31, 2006)
2nd Quarter 2006-07(Oct. 1 - Dec. 31,
2006)1st Qtr
1st Qtr
Public Entity Type/Entity
1st
Qu
arte
r T
ota
lHU
B(%
)
To
tal
Pu
rch
asin
g (
$)
MB
E (
$)
WB
E (
$)
DB
E-O
($)
DB
E (
$)
NP
WC
($)
Su
b (
$)
To
tal
HU
B (
$)
To
tal
HU
B (
%)
To
tal
Pu
rch
asin
g (
$)
To
tal
HU
B (
$)
To
tal
HU
B (
%)
1st
Qu
arte
r T
ota
lHU
B(%
)
To
tal
Co
nst
ruct
ion
V
alu
e ($
)
B($
)
H($
)
AA
($)
AI(
$)
WF
($)
SE
($)
To
tal
HU
B (
$)
To
tal
HU
B (
%)
To
tal
Co
nst
ruct
ion
V
alu
e ($
)
To
tal
HU
B (
$)
To
tal
HU
B (
%)
CABINET AGENCIESNC Department ofCrime Control & Public Safety - Army National Guard(DNS-C) 3.15% $24,969,582 $615,129 $1,360,708 $2,700 $0 $0 $0 $1,978,537 7.92% $41,776,329 $2,507,738 6.00% 0.00% $0 $0 $0 $0 $0 $0 $0 $0 0.00% $163,000 $0 0.00%
NC Department of Administraton(DNC-C) 29.84% $12,616,505 $181,664 $110,652 $1,397 $0 $0 $0 $293,713 2.33% $19,311,955 $2,291,829 11.87% 0.00% $0 $0 $0 $0 $0 $0 $0 $0 0.00% $0 $0 0.00%
State Construction Office X X X X X X X X X X X X X X X X X X X X X X X X X X X
NC Department of Correction 13.65% $44,184,922 $3,009,913 $5,462,603 $122,662 $13,626 $0 $0 $8,608,804 19.48% $127,215,507 $19,942,089 15.68% 0.00% $0 $0 $0 $0 $0 $0 $0 $0 0.00% $552,945 $0 0.00%
NC Department of Commerce 66.96% $1,650,809 $46,736 $235,800 $0 $0 $0 $0 $282,536 17.12% $8,877,565 $5,121,276 57.69% 0.00% $0 $0 $0 $0 $0 $0 $0 $0 0.00% $0 $0 0.00%
NC Department of Cultural Resources(DNS-C) 19.89% $929,320 $115,575 $35,108 $681 $0 $0 $0 $151,364 16.29% $2,049,996 $374,252 18.26% 0.00% $0 $0 $0 $0 $0 $0 $0 $0 0.00% $0 $0 0.00%
NC Department of Environment and Natural Resources 4.18% $29,441,726 $992,924 $2,229,117 $0 $0 $0 $0 $3,222,041 10.94% $70,753,617 $4,949,539 7.00% 0.00% $1,526,255 $6,875 $0 $0 $0 $84,000 $0 $90,875 5.95% $1,763,841 $90,875 5.15%
NC Department of Health and Human Services(DNS-C) 10.29% $32,961,932 $588,022 $3,206,747 $19,561 $0 $0 $0 $3,814,330 11.57% $79,466,246 $8,598,722 10.82% 0.00% $0 $0 $0 $0 $0 $0 $0 $0 0.00% $0 $0 0.00%
NC Department of Juvenile Justice & Delinquency Prevention (DNS-C) 13.31% $17,155,267 $125,200 $85,067 $21,186 $0 $0 $0 $231,453 1.35% $18,781,894 $447,989 2.39% 0.00% $0 $0 $0 $0 $0 $0 $0 $0 0.00% $0 $0 0.00%
NC Department of Revenue (DNS-C) 15.37% $2,364,378 $119,146 $318,305 $0 $0 $0 $0 $437,451 18.50% $3,694,907 $641,972 17.37% 0.00% $0 $0 $0 $0 $0 $0 $0 $0 0.00% $0 $0 0.00%
NC Department of Transportation(DNS-C)4.06% $85,608,378 $894,634 $3,045,528 $0 $60,920 $0 $0 $4,001,082 4.67% $191,581,183 $8,301,165 4.33% 0.00% $0 $0 $0 $0 $0 $0 $0 $0 0.00% $0 $0 0.00%
TOTALS 9.68% $251,882,819 $6,688,943 $16,089,635 $168,187 $74,546 $0 $0 $23,021,311 9.14% $563,509,199 $53,176,571 9.44% 0.00% $1,526,255 $6,875 $0 $0 $0 $84,000 $0 $90,875 5.95% $2,479,786 $90,875 3.66%
% of HUB Participation 2.66% 6.39% 0.07% 0.03% 0.00% 0.00% 9.14% 9.44% 0.45% 0.00% 0.00% 0.00% 5.50% 0.00% 5.95% 3.66%
%of Minority Participation against Total HUB $ 29.06% 69.89% 0.73% 0.32% 0.00% 0.00% 7.57% 0.00% 0.00% 0.00% 92.43% 0.00%
LEGEND: LEGEND: LEGEND:
DNS-C - Categories with blanks or blank space indicate MBE - Minority Business Enterprise B - Black
entity "DID NOT SUBMIT" Construction Report WBE - Woman Business Enterprise H - Hispanic
DNS-P - Categories with blanks or blank space indicate DBE-O- Disabled - Owned Business Enterprise AA - Asian-American
entity "DID NOT SUBMIT" Purchasing Report DBE - Disabled Business Enterprise AI - American Indian
X - no reporting requirements NPWC - Non - profit Work Center for the Blind & Severely Disabled WF - White Female
Sub - HUB Subcontractor SE - Socially and Economically Disadvantaged
Note:
1. When a construction project is finalized (submitted) by an entiity, HUBSCO system will update
to the relevant quarter when the project was completed
Year-to-DateYear-to-Date2nd Quarter HUB Purchasing Report - Goods and Services2nd Quarter HUB Construction Report - Construction
Projects
K:\Hubrpt_Purchase and Construction\FY'06-07\Quarter and Annual\06-07CA 3 - 2.1 Source: HUB Purchasing Report Database and HUBSCO Construction Reporting System 0Run Date: 07/11/2007

NORTH CAROLINA DEPARTMENT OF ADMINISTRATION
OFFICE FOR HISTORICALLY UNDERUTILIZED BUSINESSES
Purchasing and Construction Reports
COUNCIL AGENCIES - 2nd Quarter 2006-07(October 1, 2006 - December 31, 2006)
2nd Quarter 2006-07(Oct. 1- Dec. 31,
2006)
1st Qtr
1st Qtr
Public Entity Type/Entity
To
talH
UB
(%)
To
tal
Pu
rch
asin
g($
)
MB
E (
$)
WB
E (
$)
DB
E-O
($)
DB
E (
$)
NP
WC
($)
Su
b (
$)
To
tal
HU
B (
$)
To
tal
HU
B (
%)
To
tal
Pu
rch
asin
g (
$)
To
tal
HU
B (
$)
To
tal
HU
B (
%)
To
talH
UB
(%)
To
tal
Co
nst
ruct
ion
V
alu
e ($
)
B($
)
H($
)
AA
($)
AI(
$)
WF
($)
SE
($)
To
tal
HU
B (
$)
To
tal
HU
B (
%)
To
tal
Co
nst
ruct
ion
V
alu
e ($
)
To
tal
HU
B (
$)
To
tal
HU
B (
%)
COUNCIL AGENCIESNC Department of Agriculture & Consumer Services(DNS-C) 11.84% $2,610,690 $61,964 $64,762 $4,919 $0 $0 $0 $131,645 5.04% $6,284,238 $566,682 9.02% 0.00% $0 $0 $0 $0 $0 $0 $0 $0 0.00% $0 $0 0.00%NC Department of Justice - State Bureau of Investigation 9.50% $3,875,468 $27,920 $90,518 $4,821 $0 $0 $0 $123,259 3.18% $7,676,111 $484,319 6.31% 0.00% $0 $0 $0 $0 $0 $0 $0 $0 0.00% $0 $0 0.00%
NC Office of the State Auditor 0.73% $191,439 $0 $15,160 $0 $0 $0 $0 $15,160 7.92% $637,292 $18,407 2.89% X X X X X X X X X X X X XNC Department of Insurance 4.97% $463,630 $7,449 $129,815 $2,095 $0 $0 $0 $139,359 30.06% $1,372,171 $184,542 13.45% X X X X X X X X X X X X XNC Department of Labor 12.49% $88,389 $0 $11,536 $0 $0 $0 $0 $11,536 13.05% $278,534 $35,276 12.66% X X X X X X X X X X X X X
NC Office of the Lt. Governor's Office 100% $3,945 $186 $0 $0 $0 $0 $0 $186 4.71% $4,020 $261 6.49% X X X X X X X X X X X X XNC Department of Public Instruction 2.55% $25,079,636 $2,726,002 $401,957 $53,087 $0 $0 $0 $3,181,046 12.68% $88,412,570 $4,794,266 5.42% X X X X X X X X X X X X X
NC Department of Secretary of State 10.84% $236,288 $8,035 $6,241 $0 $0 $0 $0 $14,276 6.04% $486,786 $41,422 8.51% X X X X X X X X X X X X XNC Department of State Treasurer 1.63% $1,202,293 $24,510 $257,342 $2,544 $0 $0 $0 $284,396 23.65% $8,594,360 $405,107 4.71% X X X X X X X X X X X X X
TOTALS 3.29% $33,751,778 $2,856,066 $977,331 $67,466 $0 $0 $0 $3,900,863 11.56% $113,746,082 $6,530,282 5.74% 0.00% $0 $0 $0 $0 $0 $0 $0 $0 0.00% $0 $0 0.00%
% of HUB Participation 3.29% 8.46% 2.90% 0.20% 0.00% 0.00% 0.00% 11.56% 5.74% 0.00% 0.00% 0.00% 0.00% 0.00% 0.00% 0.00% 0.00% 0.00%
%of Minority Participation against Total HUB $ 73.22% 25.05% 1.73% 0.00% 0.00% 0.00% 0.00% 0.00% 0.00% 0.00% 0.00% 0.00%
LEGEND: LEGEND: LEGEND:
DNS-C - Categories with blanks or blank space indicate MBE - Minority Business Enterprise B - Black
entity "DID NOT SUBMIT" Construction Report WBE - Woman Business Enterprise H - Hispanic
DNS-P - Categories with blanks or blank space indicate DBE-O- Disabled - Owned Business Enterprise AA - Asian-American
entity "DID NOT SUBMIT" Purchasing Report DBE - Disabled Business Enterprise AI - American Indian
X - no reporting requirements NPWC - Non - profit Work Center for the Blind & Severely Disabled WF - White Female
Sub - HUB Subcontractor SE - Socially and Economically Disadvantaged
Note:
1. When a construction project is finalized (submitted) by an entiity, HUBSCO system will update
to the relevant quarter when the project was completed
Year-to-Date2nd Quarter HUB Purchasing Report - Goods and Services2nd Quarter HUB Construction Report -
Construction ProjectsYear-to-Date
K:\Hubrpt_Purchase and Construction\FY'06-07\Quarter and Annual\06-07CO 3 - 2.2 Source: HUB Purchasing Report Database and HUBSCO Construction Reporting SystemRun Date: 07/11/2007

NORTH CAROLINA DEPARTMENT OF ADMINISTRATION
OFFICE FOR HISTORICALLY UNDERUTILIZED BUSINESSES
Purchasing and Construction Reports
Supporting Agencies - 2nd Quarter 2006-07(Oct. 1, 2006 - Dec. 31, 2006)
2nd Quarter 2006-07(Oct. 1 - Dec. 31,
2006)
1st Qtr
1st Qtr
Public Entity Type/Entity
To
tal H
UB
(%
)
To
tal
Pu
rch
as
ing
($)
MB
E (
$)
WB
E (
$)
DB
E-O
($)
DB
E (
$)
NP
WC
($)
Su
b (
$)
To
tal H
UB
($)
To
tal H
UB
(%
)
To
tal
Pu
rch
asin
g (
$)
To
tal H
UB
($)
To
tal H
UB
(%
)
To
tal H
UB
(%
)
To
tal
Co
nst
ruct
ion
V
alu
e ($
)
B($
)
H($
)
AA
($)
AI(
$)
WF
($)
SE
($)
To
tal H
UB
($)
To
tal H
UB
(%
)
To
tal
Co
nst
ruct
ion
V
alu
e ($
)
To
tal H
UB
($)
To
tal H
UB
(%
)
SUPPORTING AGENCIESNC Office of Information Technology Services
10.51% $9,239,236 $130,768 $1,153,116 $0 $0 $0 $0 $1,283,88413.90%
$19,137,446 $2,324,439 12.15% 0.00% $0 $0 $0 $0 $0 $0 $0 $0 0.00% $0 $0 0.00%NCDENR - Wildlife Resources Commission
15.29% $4,175,661 $13,496 $488,043 $0 $0 $0 $0 $501,53912.01%
$5,884,824 $762,934 12.96% 3.81% $0 $0 $0 $0 $0 $0 $0 $0 0.00% $4,888,773 $186,492 3.81%North Carolina State Ports Authority(DNS-P)
1.82% $2,672,271 $0 $30,233 $0 $0 $0 $0 $30,2331.13%
$5,477,851 $81,208 1.48% 0.00% $0 $0 $0 $0 $0 $0 $0 $0 0.00% $0 $0 0.00%
Administrative Hearings 43.53% $7,786 $600 $0 $0 $0 $0 $0 $600 7.71% $18,853 $5,417 28.73% X X X X X X X X X X X X XAdmin. Office of the Courts 43.17% $6,227,228 $219,747 $408,828 $0 $0 $0 $0 $628,575 10.09% $13,340,063 $3,698,839 27.73% X X X X X X X X X X X X XBoard of Elections 33.46% $176,714 $0 $9,362 $0 $0 $0 $0 $9,362 5.30% $900,555 $251,543 27.93% X X X X X X X X X X X X XCommunity Colleges 3.66% $4,038,814 $5,928 $73,033 $0 $0 $0 $0 $78,961 1.96% $10,255,712 $306,457 2.99% X X X X X X X X X X X X XEmployment Security Comm. 10.39% $1,084,745 $0 $78,581 $0 $0 $0 $0 $78,581 7.24% $2,460,753 $221,554 9.00% X X X X X X X X X X X X XGeneral Assembly 4.19% $348,296 $6,074 $5,390 $0 $0 $0 $0 $11,464 3.29% $858,336 $32,822 3.82% X X X X X X X X X X X X XNC Institute of Min. Econ. Dev. 69.86% $312,650 $227,994 $15,785 $0 $0 $0 $0 $243,779 77.97% $553,028 $411,704 74.45% X X X X X X X X X X X X XRural Economic Development 9.71% $371,907 $1,134 $62,981 $0 $0 $0 $0 $64,115 17.24% $840,335 $109,576 13.04% X X X X X X X X X X X X XOffice of State Controller 0.42% $806,818 $10,470 $4,533 $0 $0 $0 $0 $15,003 1.86% $2,068,549 $20,300 0.98% X X X X X X X X X X X X XNC Education Lottery 24.01% $3,682,144 $734,074 $1,756,511 $0 $0 $0 $0 $2,490,585 67.64% $8,154,273 $3,564,380 43.71% X X X X X X X X X X X X X
TOTALS 17.26% $33,144,270 $1,350,285 $4,086,396 $0 $0 $0 $0 $5,436,681 16.40% $69,950,578 $11,791,173 16.86% 3.81% $0 $0 $0 $0 $0 $0 $0 $0 0.00% $4,888,773 $186,492 3.81%
% of HUB Participation 17.26% 4.07% 12.33% 0.00% 0.00% 0.00% 0.00% 16.40% 16.86% 0.00% 0.00% 0.00% 0.00% 0.00% 0.00% 0.00% 0.00%%of Minority Participation against Total HUB $ 24.84% 75.16% 0.00% 0.00% 0.00% 0.00% 0.00% 0.00% 0.00% 0.00% 0.00% 0.00%
LEGEND: LEGEND: LEGEND:
DNS-C - Categories with blanks or blank space indicate MBE - Minority Business Enterprise B - Black
entity "DID NOT SUBMIT" Construction Report WBE - Woman Business Enterprise H - Hispanic
DNS-P - Categories with blanks or blank space indicate DBE-O- Disabled - Owned Business Enterprise AA - Asian-American
entity "DID NOT SUBMIT" Purchasing Report DBE - Disabled Business Enterprise AI - American Indian
X - no reporting requirements NPWC - Non - profit Work Center for the Blind & Severely Disabled WF - White Female
Sub - HUB Subcontractor SE - Socially and Economically Disadvantaged
Note:
1. When a construction project is finalized (submitted) by an entiity, HUBSCO system will update
to the relevant quarter when the project was completed
Year-to-Date2nd Quarter HUB Construction Report - Construction
Projects2nd Qtr HUB Purchasing Report - Goods and Services Year-to-Date
K:\Hubrpt_Purchase and Construction\FY'06-07\Quarter and Annual\06-07SA 3 - 2.3 Source:HUB Purchasing Report Database and HUBSCO Construction Reporting SystemRun Date: 07/11/2007

NORTH CAROLINA DEPARTMENT OF ADMINISTRATIONOFFICE FOR HISTORICALLY UNDERUTILIZED BUSINESSES
Purchasing and Construction Reports - Community Colleges - 2nd Quarter 2006-07(Oct. 1, 2006 - Dec. 31, 2006)
2nd Quarter 2006-07 (Oct. 1 - Dec. 31, 2006)
1st Qtr
1st Qtr
Public Entity Type/Entity
To
tal
HU
B (
%
To
tal
Pu
rch
asin
g(
$) MB
E (
$)
WB
E (
$)
DB
E-O
($)
DB
E (
$)
NP
WC
($)
Su
b (
$)
To
tal
HU
B (
$)
To
tal
HU
B (
%
To
tal
Pu
rch
asin
g
($)
To
tal
HU
B (
$)
To
tal
HU
B (
%
To
tal
HU
BT
ota
l H
UB
(%
)
To
tal
Co
nst
ruct
ion
Val
ue
($)
B($
)
H($
)
AA
($)
AI(
$)
WF
($)
SE
($)
To
tal
HU
B
($)
To
tal
HU
B
(%)
To
tal
Co
nst
ruct
ion
Val
ue
($)
To
tal
HU
B (
$)
To
tal
HU
B (
%
COMMUNITY COLLEGESAlamance Community College 2.12% $1,884,237 $1,122 $13,896 $30,924 $9,606 $805 $0 $56,353 3.05% $1,070,459 $79,020 7.38% 0.00% $21,406 $0 $0 $0 $0 $1,044 $0 $1,044 4.88% $21,406 $1,044 4.88%Anson/South Piedmont Community C ll (DNS)
6.53% $962,824 $1,676 $81,827 $878 $0 $0 $0 $84,381 8.76% $1,859,522 $142,938 7.69% 0.00% $0 $0 $0 $0 $0 $0 $0 $0 0.00% $0 $0 0.00%Asheville-Buncombe Technical CommunityC ll
3.00% $1,126,202 $2,118 $88,762 $1,158 $0 $1,213 $9,172 $102,423 5.93% $3,559,150 $175,369 4.93% 0.00% $2,823,241 $0 $0 $0 $0 $165,868 $8,986 $174,854 6.19% $2,823,241 $174,854 6.19%Beaufort County Community College (DNS)
15.14% $599,037 $2,183 $33,363 $0 $350 $0 $0 $35,896 5.99% $1,290,782 $140,652 10.90% 0.00% $0 $0 $0 $0 $0 $0 $0 $0 0.00% $0 $0 0.00%Bladen Community College (DNS) 4.67% $152,124 $1,405 $9,040 $0 $0 $0 $0 $10,445 1.76% $502,149 $26,792 5.34% 0.00% $0 $0 $0 $0 $0 $0 $0 $0 0.00% $0 $0 0.00%
Blue Ridge Community College 5.47% $1,866,640 $31,400 $8,058 $9,285 $0 $0 $0 $48,743 2.61% $2,901,441 $105,376 3.63% 0.00% $0 $0 $0 $0 $0 $0 $0 $0 0.00% $0 $0 0.00%Brunswick Community College 3.32% $678,786 $2,370 $23,752 $153 $90 $0 $0 $26,364 3.88% $1,573,211 $56,032 3.56% 0.00% $0 $0 $0 $0 $0 $0 $0 $0 0.00% $0 $0 0.00%Caldwell Community College & Technical I tit t (DNS)
7.90% $1,162,028 $6,990 $67,979 $1,273 $0 $0 $0 $76,242 6.77% $4,508,989 $340,738 7.56% 0.00% $0 $0 $0 $0 $0 $0 $0 $0 0.00% $1,401,716 $0 0.00%
Cape Fear Community College 9.96% $2,316,047 $32,173 $115,509 $5,187 $0 $320 $0 $153,188 6.61% $4,302,830 $351,014 8.16% 0.00% $0 $0 $0 $0 $0 $0 $0 $0 0.00% $0 $0 0.00%Carteret Community College (DNS) 1.47% $672,045 $288 $30,131 $0 $0 $0 $0 $30,419 4.53% $1,243,165 $38,817 3.12% 0.00% $0 $0 $0 $0 $0 $0 $0 $0 0.00% $0 $0 0.00%Catawba Valley Community College (DNS) 1.27% $1,344,869 $4,856 $48,998 $0 $0 $0 $0 $53,854 4.00% $2,894,156 $73,582 2.54% 0.00% $0 $0 $0 $0 $0 $0 $0 $0 0.00% $0 $0 0.00%
Central Carolina Community College 3.95% $1,933,469 $19,711 $53,181 $3,080 $0 $11,502 $5 $87,479 4.52% $5,097,743 $212,511 4.17% 0.00% $0 $0 $0 $0 $0 $0 $0 $0 0.00% $0 $0 0.00%Central Piedmont Community College (DNS)
28.45% $3,704,378 $522,018 $535,066 $9,500 $0 $0 $0 $1,066,584 28.79% $7,076,531 $2,025,876 28.63% 0.00% $0 $0 $0 $0 $0 $0 $0 $0 0.00% $0 $0 0.00%Cleveland Community College (DNS) 2.26% $782,174 $1,407 $35,682 $987 $0 $0 $0 $38,077 4.87% $1,302,833 $49,836 3.83% 0.00% $0 $0 $0 $0 $0 $0 $0 $0 0.00% $0 $0 0.00%Coastal Carolina Community College (DNS)
3.03% $888,349 $113,318 $21,406 $0 $0 $0 $0 $134,724 15.17% $2,164,673 $173,421 8.01% 0.00% $0 $0 $0 $0 $0 $0 $0 $0 0.00% $0 $0 0.00%College of The Albemarle (DNS) 1.54% $739,306 $2,360 $10,305 $0 $0 $0 $0 $12,665 1.71% $1,346,154 $22,025 1.64% 0.00% $0 $0 $0 $0 $0 $0 $0 $0 0.00% $298,549 $0 0.00%Craven Community College 3.78% $929,230 $3,696 $35,901 $1,680 $0 $0 $0 $41,277 4.44% $1,956,309 $80,074 4.09% 0.00% $0 $0 $0 $0 $0 $0 $0 $0 0.00% $0 $0 0.00%Davidson County Community College (DNS)
6.81% $1,822,672 $20,948 $104,486 $829 $0 $0 $0 $126,263 6.93% $3,016,074 $207,497 6.88% 0.00% $0 $0 $0 $0 $0 $0 $0 $0 0.00% $0 $0 0.00%Durham Technical Community College 7.66% $2,201,888 $86,881 $113,673 $5,188 $810 $0 $0 $206,551 9.38% $4,114,802 $353,059 8.58% 8.72% $0 $0 $0 $0 $0 $0 $0 $0 0.00% $587,519 $51,247 8.72%Edgecombe Community College (DNS) 9.74% $637,727 $15,810 $22,214 $2,790 $0 $0 $0 $40,814 6.40% $1,261,999 $101,591 8.05% 0.00% $0 $0 $0 $0 $0 $0 $0 $0 0.00% $0 $0 0.00%Fayetteville Technical Community College 3.78% $2,264,194 $53,727 $117,824 $0 $0 $0 $0 $171,551 7.58% $7,763,137 $379,260 4.89% 0.00% $4,173,612 $25,018 $0 $0 $71,131 $916,070 $0 $1,012,219 24.25% $4,173,612 $1,012,219 24.25%Forsyth Technical Community College 8.47% $2,792,121 $20,783 $158,933 $14,734 $0 $0 $0 $194,450 6.84% $6,056,412 $470,917 7.78% 100% $0 $0 $0 $0 $0 $0 $0 $0 0.00% $47,835 $47,835 100%Gaston College 4.45% $1,744,154 $4,042 $196,942 $669 $282 $0 $0 $201,936 11.58% $3,248,361 $268,830 8.28% 0.00% $3,122,446 $0 $0 $0 $12,300 $25,322 $0 $37,622 1.20% $3,211,502 $37,622 1.17%Guilford Technical Community College 5.46% $3,016,093 $41,425 $148,001 $0 $0 $20,441 $0 $209,866 6.96% $8,317,640 $499,472 6.00% 14.48% $918,900 $0 $0 $0 $0 $10,040 $0 $10,040 1.09% $3,288,739 $353,082 10.74%Halifa# Community College (DNS) 1.47% $367,752 $908 $11,260 $0 $0 $0 $0 $12,168 3.31% $757,604 $17,913 2.36% 0.00% $0 $0 $0 $0 $0 $0 $0 $0 0.00% $0 $0 0.00%Haywood Community College (DNS) 1.16% $1,457,021 $1,552 $15,070 $0 $0 $6,000 $0 $22,622 1.55% $2,135,227 $30,476 1.43% 0.00% $0 $0 $0 $0 $0 $0 $0 $0 0.00% $0 $0 0.00%Isothermal Community College (DNS) 4.66% $1,110,265 $291 $53,709 $0 $0 $0 $680 $54,680 5.09% $1,729,358 $83,543 4.83% 0.00% $0 $0 $0 $0 $0 $0 $0 $0 0.00% $0 $0 0.00%James Sprunt Community College 8.83% $409,200 $1,882 $26,735 $0 $0 $0 $0 $28,617 6.99% $782,060 $61,545 7.87% 0.00% $0 $0 $0 $0 $0 $0 $0 $0 0.00% $0 $0 0.00%Johnston Community College 4.25% $1,558,812 $4,065 $24,116 $8,536 $0 $0 $0 $36,717 2.36% $3,552,176 $121,488 3.42% 0.00% $0 $0 $0 $0 $0 $0 $0 $0 0.00% $0 $0 0.00%Lenoir Community College 8.80% $895,191 $6,068 $51,022 $2,962 $0 $39,719 $0 $99,771 10.69% $1,508,405 $153,743 10.19% 0.00% $0 $0 $0 $0 $0 $0 $0 $0 0.00% $91,774 $0 0.00%
Martin Community College 3.50% $323,738 $6 $35,062 $7,086 $1,025 $195 $0 $43,374 13.40% $586,080 $52,552 8.97% 0.00% $0 $0 $0 $0 $0 $0 $0 $0 0.00% $0 $0 0.00%
Mayland Community College 2.99% $295,630 $0 $20,441 $0 $0 $0 $0 $20,441 6.91% $400,477 $23,578 5.89% 0.00% $0 $0 $0 $0 $0 $0 $0 $0 0.00% $0 $0 0.00%McDowell Technical Community College 3.15% $1,174,071 $16,422 $7,114 $0 $0 $93 $0 $23,629 2.01% $1,919,804 $47,124 2.45% 0.00% $249,291 $0 $0 $0 $0 $0 $0 $0 0.00% $249,291 $0 0.00%
Mitchell Community College 1.89% $986,876 $5,752 $106,148 $3,328 $9,827 $0 $0 $125,055 12.67% $2,238,390 $148,650 6.64% 0.00% $23,097 $0 $0 $0 $0 $0 $0 $0 0.00% $82,148 $0 0.00%Montgomery Community College 2.92% $225,878 $119 $7,618 $0 $0 $0 $0 $7,737 3.43% $497,749 $15,674 3.15% 0.00% $0 $0 $0 $0 $0 $0 $0 $0 0.00% $64,475 $0 0.00%Nash Community College (DNS) 14.80% $665,729 $66,669 $24,833 $80 $0 $3 $0 $91,585 13.76% $770,576 $94,722 12.29% 0.00% $0 $0 $0 $0 $0 $0 $0 $0 0.00% $0 $0 0.00%
Year-to-Date2nd Quarter HUB Construction Report - Construction Projects2nd Quarter HUB Purchasing Report - Goods and Services Year-to-Date
K:\Hubrpt_Purchase and Construction\FY'06-07\Quarter and Annual\06-07CC3 - 2.4
Source:HUB Purchasing Report Database and HUBSCO Construction reporting SystemRun Date: 7/11/2007

NORTH CAROLINA DEPARTMENT OF ADMINISTRATIONOFFICE FOR HISTORICALLY UNDERUTILIZED BUSINESSES
Purchasing and Construction Reports - Community Colleges - 2nd Quarter 2006-07(Oct. 1, 2006 - Dec. 31, 2006)
2nd Quarter 2006-07 (Oct. 1 - Dec. 31, 2006)
1st Qtr
1st Qtr
Public Entity Type/Entity
To
tal
HU
B (
%
To
tal
Pu
rch
asin
g(
$) MB
E (
$)
WB
E (
$)
DB
E-O
($)
DB
E (
$)
NP
WC
($)
Su
b (
$)
To
tal
HU
B (
$)
To
tal
HU
B (
%
To
tal
Pu
rch
asin
g
($)
To
tal
HU
B (
$)
To
tal
HU
B (
%
To
tal
HU
BT
ota
l H
UB
(%
)
To
tal
Co
nst
ruct
ion
Val
ue
($)
B($
)
H($
)
AA
($)
AI(
$)
WF
($)
SE
($)
To
tal
HU
B
($)
To
tal
HU
B
(%)
To
tal
Co
nst
ruct
ion
Val
ue
($)
To
tal
HU
B (
$)
To
tal
HU
B (
%
Year-to-Date2nd Quarter HUB Construction Report - Construction Projects2nd Quarter HUB Purchasing Report - Goods and Services Year-to-Date
COMMUNITY COLLEGES - Contd…
Pamlico Community College 7.54% $386,784 $1,997 $31,100 $1,710 $0 $0 $0 $34,807 9.00% $658,655 $42,744 6.49% 0.00% $0 $0 $0 $0 $0 $0 $0 $0 0.00% $0 $0 0.00%Piedmont Community College 6.53% $716,229 $3,943 $48,764 $2,618 $0 $0 $0 $55,325 7.72% $1,264,964 $136,561 10.8% 0.00% $0 $0 $0 $0 $0 $0 $0 $0 0.00% $0 $0 0.00%Pitt Community College 15.24% $1,456,801 $113,572 $33,735 $0 $0 $1,469 $0 $148,776 10.21% $2,746,587 $345,362 12.57% 0.00% $0 $0 $0 $0 $0 $0 $0 $0 0.00% $0 $0 0.00%Randolph Community College 5.61% $1,929,683 $5,472 $72,254 $121 $0 $150 $0 $77,997 4.04% $3,355,478 $157,923 4.71% 88.5% $0 $0 $0 $0 $0 $0 $0 $0 0.00% $1,673,793 $1,481,830 88.53%Richmond Community College (DNS) 2.17% $879,191 $215,930 $621,321 $0 $0 $0 $0 $837,250 95.23% $1,485,900 $850,439 57.23% 0.00% $0 $0 $0 $0 $0 $0 $0 $0 0.00% $0 $0 0.00%
Roanoke-Chowan Community College 3.79% $450,246 $38,088 $21,544 $423 $0 $0 $0 $60,055 13.34% $728,282 $70,599 9.69% 0.00% $0 $0 $0 $0 $0 $0 $0 $0 0.00% $0 $0 0.00%Robeson Community College (DNS) 4.85% $1,375,825 $35,200 $135,263 $0 $4,804 $62 $0 $175,330 12.74% $2,979,986 $253,115 8.49% 0.00% $2,028,175 $0 $0 $0 $1,383,881 $0 $0 $1,383,881 68.23% $2,028,175 $1,383,881 68.23%Rockingham Community College 3.78% $1,390,839 $1,102 $229,972 $0 $0 $0 $0 $231,074 16.61% $2,064,126 $256,525 12.4% 100% $104,818 $0 $0 $0 $0 $79,043 $0 $79,043 75.41% $143,618 $117,843 82.05%Rowan-Cabarrus Community College 4.95% $2,752,304 $57,342 $33,980 $2,882 $0 $4,277 $0 $98,481 3.58% $4,496,265 $184,788 4.11% 0.00% $0 $0 $0 $0 $0 $0 $0 $0 0.00% $0 $0 0.00%Sampson Community College (DNS 9.85% $442,731 $1,151 $33,070 $332 $0 $244 $0 $34,796 7.86% $912,391 $81,078 8.89% 0.00% $0 $0 $0 $0 $0 $0 $0 $0 0.00% $0 $0 0.00%Sandhills Community College (DNS) 7.24% $2,436,356 $23,271 $46,209 $1,171 $0 $0 $0 $70,652 2.90% $4,410,985 $213,546 4.84% 0.00% $0 $0 $0 $0 $0 $0 $0 $0 0.00% $0 $0 0.00%
SouthEastern Community College 6.77% $584,415 $9,223 $27,026 $0 $0 $0 $0 $36,250 6.20% $1,317,503 $85,874 6.52% 0.00% $0 $0 $0 $0 $0 $0 $0 $0 0.00% $0 $0 0.00%Southwestern Community College (DNS) 0.46% $1,813,933 $809 $44,615 $250 $0 $0 $0 $45,674 2.52% $2,937,839 $50,850 1.73% 0.00% $0 $0 $0 $0 $0 $0 $0 $0 0.00% $0 $0 0.00%Stanly Community College 4.06% $703,854 $13,309 $39,879 $0 $0 $0 $0 $53,188 7.56% $1,446,049 $83,317 5.76% 0.00% $0 $0 $0 $0 $0 $0 $0 $0 0.00% $0 $0 0.00%Surry Community College (DNS) 17.93% $218,001 $0 $27,089 $0 $9,656 $0 $0 $36,745 16.86% $455,448 $79,316 17.41% 0.00% $0 $0 $0 $0 $0 $0 $0 $0 0.00% $0 $0 0.00%Tri-County Community College 1.03% $307,209 $3,095 $20,792 $9 $0 $0 $0 $23,896 7.78% $556,579 $26,462 4.75% 0.00% $0 $0 $0 $0 $0 $0 $0 $0 0.00% $0 $0 0.00%Vance-Granville Community College 5.34% $1,161,536 $6,803 $78,263 $12,433 $0 $0 $0 $97,499 8.39% $2,071,569 $146,062 7.05% 0.00% $0 $0 $0 $0 $0 $0 $0 $0 0.00% $20,674 $0 0.00%Wake Technical Community College 5.32% $7,851,531 $213,929 $144,674 $30,854 $0 $0 $0 $389,457 4.96% $16,890,663 $870,087 5.15% 19.52% $6,397,490 $24,644 $187,210 $0 $0 $1,402,816 $0 $1,614,670 25.24% $6,609,361 $1,656,022 25.06%Wayne Community College 2.76% $1,663,996 $11,388 $196,120 $337 $0 $0 $0 $207,845 12.49% $3,215,370 $250,667 7.80% 0.00% $979,535 $0 $0 $0 $0 $143,563 $0 $143,563 14.66% $979,535 $143,563 14.66%Western Piedmont Community College 9.26% $1,031,502 $14,014 $50,835 $0 $0 $0 $0 $64,849 6.29% $1,475,342 $105,969 7.18% 0.00% $0 $0 $0 $0 $0 $0 $0 $0 0.00% $0 $0 0.00%Wilkes Community College 2.03% $2,431,050 $88,744 $14,412 $0 $0 $0 $0 $103,156 4.24% $4,509,705 $145,295 3.22% 0.00% $0 $0 $0 $0 $0 $0 $0 $0 0.00% $0 $0 0.00%Wilson Technical Community College 4.73% $1,205,294 $11,908 $22,656 $332 $0 $0 $0 $34,895 2.90% $1,794,676 $62,759 3.50% 0.00% $0 $0 $0 $0 $0 $0 $0 $0 0.00% $0 $0 0.00%
TOTALS 6.30% $78,880,067 $1,966,731 $4,431,630 $163,779 $36,450 $86,493 $9,857 $6,694,938 8.49% $159,623,472 $11,782,967 7.38% 28.82% $20,842,011 $49,662 $187,210 $0 $1,467,312 $2,743,768 $8,986 $4,456,938 21.38% $27,796,964 $6,461,043 23.24%
% of HUB Participation 6.30% 2.49% 5.62% 0.21% 0.05% 0.11% 0.01% 8.49% 7.38% 0.24% 0.90% 0.00% 7.04% 13.16% 0.04% 21.38% 23.24%
%of Minority Participation against Total HUB $ 29.38% 66.19% 2.45% 0.54% 1.29% 0.15% 1.11% 4.20% 0.00% 32.92% 61.56% 0.20%
LEGEND: LEGEND: LEGEND:
DNS-C - Categories with blanks or blank space indicate MBE - Minority Business Enterprise B - Black
entity "DID NOT SUBMIT" Construction Report WBE - Woman Business Enterprise H - Hispanic
DNS-P - Categories with blanks or blank space indicate DBE-O- Disabled - Owned Business Enterprise AA - Asian-American
entity "DID NOT SUBMIT" Purchasing Report DBE - Disabled Business Enterprise AI - American Indian
Note: NPWC - Non - profit Work Center for the Blind & Severely Disabled WF - White Female
1. When a construction project is finalized (submitted) by an entiity, HUBSCO system will update Sub - HUB Subcontractor SE - Socially and Economically Disadvantaged to the relevant quarter when the project was completed
K:\Hubrpt_Purchase and Construction\FY'06-07\Quarter and Annual\06-07CC3 - 2.4
Source:HUB Purchasing Report Database and HUBSCO Construction reporting SystemRun Date: 7/11/2007

NORTH CAROLINA DEPARTMENT OF ADMINISTRATION
OFFICE FOR HISTORICALLY UNDERUTILIZED BUSINESSES
Purchasing and Construction Reports - Public Schools - 2nd Quarter 2006-07(Oct. 1, 2006 - Dec. 31, 2006)
2nd Quarter 2006-07(Oct. 1-Dec. 31,
2006)
1st Qtr
1st Qtr
Public Entity Type/EntityT
ota
l HU
B (
%)
To
tal
Pu
rch
asin
g($
)
MB
E (
$)
WB
E (
$)
DB
E-O
($)
DB
E (
$)
NP
WC
($)
Su
b (
$)
To
tal H
UB
($)
To
tal H
UB
(%
)
To
tal
Pu
rch
asin
g (
$)
To
tal H
UB
($)
To
tal H
UB
(%
)
To
tal H
UB
(%
)
To
tal
Co
nst
ruct
ion
V
alu
e ($
)
B($
)
H($
)
AA
($)
AI(
$)
WF
($)
SE
($)
To
tal H
UB
($)
To
tal H
UB
(%
)
To
tal
Co
nst
ruct
ion
V
alu
e ($
)
To
tal H
UB
($)
To
tal H
UB
(%
)
PUBLIC SCHOOLSAlamance/Burlington 1.46% $20,454,023 $310,262 $61,269 $90,858 $0 $0 $0 $462,389 2.26% $43,782,795 $802,763 1.83%
Alexander County Schools (DNS-C) 6.33% $1,057,377 $1,817 $49,293 $0 $1,144 $0 $0 $52,254 4.94% $1,982,824 $110,839 5.59% 0.00% $0 $0 $0 $0 $0 $0 $0 $0 0.00% $0 $0 0.00%
Alleghany County Schools 3.42% $534,028 $0 $23,015 $0 $0 $0 $0 $23,015 4.31% $1,121,460 $43,134 3.85%
Anson County Schools 9.90% $784,533 $1,028 $126,212 $0 $0 $0 $0 $127,240 16.22% $1,628,005 $210,768 12.95%Ashe County Schools (DNS-C) 3.13% $3,372,258 $6,780 $268,503 $0 $0 $0 $0 $275,283 8.16% $5,073,150 $328,465 6.47% 0.00% $0 $0 $0 $0 $0 $0 $0 $0 0.00% $0 $0 0.00%Asheboro City Schools 0.47% $1,100,006 $359 $6,598 $312 $0 $0 $0 $7,269 0.66% $2,758,922 $15,060 0.55% 12.85% $176,890 $0 $0 $0 $0 $0 $0 $0 0.00% $276,834 $12,845 4.64%Asheville City Schools 7.76% $522,077 $63 $66,911 $75 $0 $0 $0 $67,049 12.84% $2,549,940 $224,428 8.80% 0.00% $0 $0 $0 $0 $0 $0 $0 $0 0.00% $7,971,019 $0 0.00%
Avery Counrty Schools 4.53% $898,891 $282 $17,495 $185 $0 $0 $0 $17,962 2.00% $1,822,220 $59,787 3.28%
Beaufort County Schools 14.66% $0 $0 $0 $0 $0 $0 $0 $0 #DIV/0! $4,941,287 $724,308 14.66%Bertie County Board of Education (DNS-C) 0.00% $0 $0 $0 $0 $0 $0 $0 $0 #DIV/0! $0 $0 #DIV/0! 0.00% $0 $0 $0 $0 $0 $0 $0 $0 0.00% $0 $0 0.00%Bladen County Schools 6.13% $1,251,289 $8,725 $16,313 $5,547 $0 $0 $0 $30,585 2.44% $1,744,940 $60,822 3.49% 1.63% $43,695 $0 $0 $0 $0 $0 $0 $0 0.00% $253,135 $3,405 1.35%Brunswick County Schools
4.29% $14,507,441 $50,918 $507,095 $0 $0 $0 $0 $558,012 3.85% $25,955,193 $1,049,401 4.04% 84.36% $4,200 $0 $0 $0 $0 $4,200 $0 $4,200 100% $142,542 $120,900 84.82%
Buncombe County Schools 4.20% $3,308,925 $13,315 $140,463 $0 $4,199 $0 $0 $157,977 4.77% $10,898,934 $476,773 4.37%
Burke County Schools 11.31% $2,718,209 $7,740 $126,310 $254,033 $0 $25 $0 $388,108 14.28% $6,507,889 $816,672 12.55%Cabarrus County Schools 7.42% $5,383,029 $25,191 $273,574 $0 $0 $30,164 $0 $328,929 6.11% $11,289,783 $767,487 6.80% 11.13% $0 $0 $0 $0 $0 $0 $0 $0 0.00% $4,749,352 $528,775 11.13%Caldwell County Schools(DNS-C) 0.50% $13,761,987 $2,505 $25,654 $0 $198 $0 $0 $28,358 0.21% $27,042,342 $95,129 0.35% 0.00% $0 $0 $0 $0 $0 $0 $0 $0 0.00% $0 $0 0.00%Camden County Schools 38.66% $37,569 $6,797 $23,895 $0 $0 $0 $0 $30,692 81.70% $42,415 $32,566 76.78% 0.00% $0 $0 $0 $0 $0 $0 $0 $0 0.00% $0 $0 0.00%Carteret County Schools (DNS-C) 6.14% $5,563,843 $29,469 $663,246 $15,416 $6,559 $0 $0 $714,690 12.85% $10,755,076 $1,033,188 9.61% 0.00% $0 $0 $0 $0 $0 $0 $0 $0 0.00% $0 $0 0.00%
Caswell County Schools 89.79% $189,429 $12,677 $63,780 $0 $0 $0 $0 $76,457 40.36% $221,652 $105,391 47.55%
Catawba County Schools 4.64% $1,823,044 $142,751 $0 $0 $0 $0 $0 $142,751 7.83% $3,541,372 $222,402 6.28%Chapel Hill-Carrboro City Schools 0.00% $374,417 $0 $0 $0 $0 $0 $0 $0 0.00% $1,019,820 $0 0.00% 0.00% $177,237 $0 $0 $0 $0 $0 $0 $0 0.00% $177,237 $0 0.00%Charlotte-Mecklenburg Schools 8.96% $46,783,223 $1,000,215 $2,021,577 $28,086 $0 $0 $0 $3,049,878 6.52% $93,556,843 $7,242,733 7.74% 23.90% $2,258,881 $0 $17,000 $24,350 $0 $1,438,173 $0 $1,479,523 65.50% $14 $4,066,865 31.08%
Chatham County Schools 16.97% $1,706,703 $344,483 $103,726 $0 $0 $0 $0 $448,209 26.26% $6,090,279 $1,192,095 19.57%
Cherokee County Schools 1.77% $1,239,155 $0 $8,286 $0 $0 $0 $7,479 $15,765 1.27% $2,047,663 $30,067 1.47% 0.00% $0 $0 $0 $0 $0 $0 $0 $0 0.00% $0 $0 0.00%
Clay County Schools 20.43% $103,640 $10,956 $2,871 $0 $0 $0 $0 $13,827 13.34% $175,754 $28,559 16.25%Cleveland County Schools(DNS-C)
79.11% $2,765,833 $97,123 $345,462 $90,769 $14,923 $552 $0 $548,830 19.84% $4,527,399 $1,942,410 42.90% 7.39% $439,240 $0 $0 $0 $0 $0 $0 $0 0.00% $3,395,210 $218,500 6.44%
Clinton City Schools 1.26% $2,783,116 $4,107 $52,561 $24,574 $0 $0 $0 $81,242 2.92% $4,909,218 $107,953 2.20%
Columbus County Schools 4.23% $1,359,091 $861 $51,928 $0 $0 $0 $0 $52,789 3.88% $4,142,823 $170,548 4.12%Craven County Schools (DNS-C) 5.95% $5,207,758 $150,222 $6,224 $0 $0 $0 $0 $156,446 3.00% $9,803,279 $429,719 4.38% 0.00% $0 $0 $0 $0 $0 $0 $0 $0 0.00% $0 $0 0.00%
Cumberland County Schools(DNS-C) 4.82% $6,404,757 $148,893 $531,399 $70,618 $0 $0 $0 $750,910 11.72% $21,669,971 $1,486,939 6.86% 0.00% $0 $0 $0 $0 $0 $0 $0 $0 0.00% $0 $0 0.00%
Currituck County Schools 3.66% $2,541,600 $8,781 $88,700 $1,898 $0 $0 $0 $99,379 3.91% $5,276,975 $199,445 3.78%
Dare County Schools 23.58% $1,369,355 $58,359 $229,691 $11,434 $0 $0 $0 $299,484 21.87% $1,977,736 $442,962 22.40%Davidson County Schools 31.85% $823,222 $5,803 $208,182 $4,237 $0 $144 $0 $218,366 26.53% $1,512,436 $437,890 28.95% 0.00% $0 $0 $0 $0 $0 $0 $0 $0 0.00% $0 $0 0.00%Davie County Schools 6.32% $3,174,736 $294,748 $30,790 $0 $5,271 $53,991 $0 $384,800 12.12% $5,695,461 $544,204 9.56% 0.00% $193,095 $0 $0 $0 $0 $0 $0 $0 0.00% $716,646 $0 0.00%
Year-to-Date2nd Quarter HUB Construction Report - Construction
Projects2nd Quarter HUB Purchasing Report - Goods and Services Year-to-Date
K:\Hubrpt_Purchase and Construction\FY'06-07\Quarter and Annual\06-07PS 3 - 2.5 Source: HUB Purchasing Report Database and HUBSCO Construction Reporting SystemRRun Date: 07/11/2007200

NORTH CAROLINA DEPARTMENT OF ADMINISTRATION
OFFICE FOR HISTORICALLY UNDERUTILIZED BUSINESSES
Purchasing and Construction Reports - Public Schools - 2nd Quarter 2006-07(Oct. 1, 2006 - Dec. 31, 2006)
2nd Quarter 2006-07(Oct. 1-Dec. 31,
2006)
1st Qtr
1st Qtr
Public Entity Type/EntityT
ota
l HU
B (
%)
To
tal
Pu
rch
asin
g($
)
MB
E (
$)
WB
E (
$)
DB
E-O
($)
DB
E (
$)
NP
WC
($)
Su
b (
$)
To
tal H
UB
($)
To
tal H
UB
(%
)
To
tal
Pu
rch
asin
g (
$)
To
tal H
UB
($)
To
tal H
UB
(%
)
To
tal H
UB
(%
)
To
tal
Co
nst
ruct
ion
V
alu
e ($
)
B($
)
H($
)
AA
($)
AI(
$)
WF
($)
SE
($)
To
tal H
UB
($)
To
tal H
UB
(%
)
To
tal
Co
nst
ruct
ion
V
alu
e ($
)
To
tal H
UB
($)
To
tal H
UB
(%
)
Year-to-Date2nd Quarter HUB Construction Report - Construction
Projects2nd Quarter HUB Purchasing Report - Goods and Services Year-to-Date
PUBLIC SCHOOLS - Contd….Duplin County Board of Educatiion (DNS-C) 4.22% $4,164,308 $82,287 $112,003 $2,664 $0 $0 $0 $196,954 4.73% $6,130,041 $279,852 4.57% 0.00% $0 $0 $0 $0 $0 $0 $0 $0 0.00% $0 $0 0.00%
Durham City Schools 2.29% $7,308,653 $22,690 $378,316 $1,917 $0 $0 $0 $402,923 5.51% $34,247,403 $1,021,130 2.98% 0.00% $0 $0 $0 $0 $0 $0 $0 $0 0.00% $0 $0 0.00%
Edenton Chowan Schools 5.40% $756,092 $1,598 $48,712 $0 $0 $0 $0 $50,310 6.65% $1,365,411 $83,237 6.10% 0.00% $0 $0 $0 $0 $0 $0 $0 $0 0.00% $0 $0 0.00%Edgecombe County Schools(DNS-C) 3.32% $1,723,834 $36,660 $39,544 $0 $0 $0 $0 $76,204 4.42% $2,825,291 $112,765 3.99% 0.00% $0 $0 $0 $0 $0 $0 $0 $0 0.00% $202,102 $0 0.00%
Elizabeth City Schools (RI) 7.40% $3,507,255 $8,150 $45,555 $175 $10,225 $127,300 $5,029 $196,434 5.60% $11,666,363 $799,962 0.00%
Elkin City Schools 10.81% $133,220 $45 $21,477 $36 $0 $0 $0 $21,558 16.18% $341,897 $44,106 12.90%Franklin County Schools 4.70% $4,068,308 $62,209 $182,556 $107 $0 $0 $0 $244,872 6.02% $12,910,154 $660,049 5.11% 0.00% $0 $0 $0 $0 $0 $0 $0 $0 0.00% $0 $0 0.00%
Gaston County Schools 3.78% $10,833,976 $82,884 $370,692 $163,176 $123,961 $0 $0 $740,713 6.84% $31,779,244 $1,532,315 4.82%
Gates County Schools 0.30% $400,023 $2,789 $14,743 $0 $0 $0 $0 $17,532 4.38% $584,146 $18,077 3.09%Graham County Schools 30.68% $507,409 $19,917 $140,866 $2,076 $0 $0 $0 $162,858 32.10% $940,442 $295,729 31.45% 15.28% $0 $0 $0 $0 $0 $0 $0 $0 0.00% $1,587,978 $242,722 15.28%
Granville County Schools 0.41% $1,256,071 $1,028 $4,210 $0 $0 $1,281 $0 $6,519 0.52% $4,467,168 $19,595 0.44%
Greene County Schools 4.67% $0 $0 $0 $0 $0 $0 $0 $0 #DIV/0! $1,954,117 $91,162 4.67%Guildford County Schools 0.00% $12,801,938 $492,316 $857,390 $0 $31,172 $0 $0 $1,380,878 10.79% $12,801,938 $1,380,878 10.79% 20.29% $408,296 $190,450 $0 $0 $0 $61,982 $0 $252,433 61.83% $8,227,971 $1,839,338 22.35%Halifa* County Schools(DNS-C) 2.67% $633,781 $1,219 $3,986 $0 $0 $0 $0 $5,205 0.82% $3,489,605 $81,468 2.33% 0.00% $0 $0 $0 $0 $0 $0 $0 $0 0.00% $0 $0 0.00%
Harnett County Schools(DNS-C) 11.54% $0 $0 $0 $0 $0 $0 $0 $0 #DIV/0! $2,563,009 $295,790 0.00%Haywood County Schools 3.79% $463,562 $12,754 $8,677 $0 $0 $0 $0 $21,431 4.62% $1,636,605 $65,918 4.03% 0.00% $0 $0 $0 $0 $0 $0 $0 $0 0.00% $0 $0 0.00%Henderson County Public Schools (DNS-C) 18.93% $1,025,616 $23,888 $235,207 $0 $0 $0 $0 $259,095 25.26% $2,257,310 $492,244 21.81% 0.00% $0 $0 $0 $0 $0 $0 $0 $0 0.00% $0 $0 0.00%Hertford County Public Schools (DNS-C) 13.94% $4,462,947 $631,645 $95,827 $0 $0 $0 $0 $727,472 16.30% $8,667,573 $1,313,621 15.16% 0.00% $0 $0 $0 $0 $0 $0 $0 $0 0.00% $0 $0 0.00%Hickory Public Schools (DNS-C) 0.00% $162,209 $1,944 $3,710 $0 $0 $0 $0 $5,654 3.49% $162,209 $5,654 3.49% 0.00% $0 $0 $0 $0 $0 $0 $0 $0 0.00% $0 $0 0.00%
Hoke County Schools 100% $0 $0 $0 $0 $0 $0 $0 $0 #DIV/0! $62,816 $62,816 100%
Hyde County Schools 2.20% $1,946,005 $8,340 $52,922 $339 $0 $0 $0 $61,601 3.17% $3,698,494 $100,087 2.71%Iredell-Statesville Schools(DNS-C) 24.44% $2,899,833 $34,651 $982,011 $8,506 $4,427 $0 $0 $1,029,595 35.51% $5,401,698 $1,641,082 30.38% 0.00% $0 $0 $0 $0 $0 $0 $0 $0 0.00% $0 $0 0.00%Jackson County Board of Education 7.96% $518,296 $10,951 $27,252 $0 $0 $0 $0 $38,203 7.37% $873,395 $66,485 7.61% 0.00% $0 $0 $0 $0 $0 $0 $0 $0 0.00% $0 $0 0.00%
Johnston County Schools 27.65% $5,702,163 $14,644 $701,667 $17,025 $0 $0 $0 $733,336 12.86% $9,324,567 $1,734,930 18.61%Jones County Public Schools 5.28% $298,871 $7,891 $18,825 $0 $0 $0 $0 $26,716 8.94% $1,084,726 $68,233 6.29% 0.00% $0 $0 $0 $0 $0 $0 $0 $0 0.00% $84,954 $0 0.00%
Kannapolis City Schools 0.94% $1,805,324 $2,592 $15,186 $2,000 $2,000 $0 $0 $21,778 1.21% $3,680,638 $39,498 1.07%Lee County Board of Education 5.38% $546,017 $1,165 $14,758 $0 $0 $0 $0 $15,923 2.92% $1,551,729 $70,040 4.51% 23.33% $98,808 $0 $0 $0 $0 $0 $0 $0 0.00% $484,505 $90,000 18.58%Lenoir County Public Schools (DNS-C) 18.94% $2,624,460 $8,719 $424,045 $0 $1,223 $0 $0 $433,987 16.54% $4,156,466 $724,106 17.42% 0.00% $0 $0 $0 $0 $0 $0 $0 $0 0.00% $0 $0 0.00%
Le*ington City Schools 2.47% $751,980 $3,000 $16,748 $0 $0 $0 $0 $19,748 2.63% $1,567,793 $39,929 2.55%Lincoln County Schools (DNS-C) 6.06% $5,253,954 $9,919 $212,787 $2,475 $0 $0 $0 $225,181 4.29% $9,381,832 $475,495 5.07% 0.00% $0 $0 $0 $0 $0 $0 $0 $0 0.00% $0 $0 0.00%
Macon County Schools 1.29% $5,229,518 $0 $11,473 $950 $0 $0 $0 $12,423 0.24% $6,640,651 $30,652 0.46%Madison County Public Schools(DNS-C) 1.90% $1,169,824 $4,216 $27,740 $0 $0 $0 $0 $31,956 2.73% $2,103,719 $49,707 2.36% 0.00% $0 $0 $0 $0 $0 $0 $0 $0 0.00% $0 $0 0.00%
Martin County Schools 18.02% $490,639 $7,815 $97,891 $198 $0 $0 $0 $105,904 21.58% $721,248 $147,456 20.44%McDowell County Schools(DNS-C) 13.34% $1,467,565 $25,031 $332,604 $0 $0 $0 $0 $357,635 24.37% $3,333,937 $606,658 18.20% 0.00% $0 $0 $0 $0 $0 $0 $0 $0 0.00% $0 $0 0.00%
K:\Hubrpt_Purchase and Construction\FY'06-07\Quarter and Annual\06-07PS 3 - 2.5 Source: HUB Purchasing Report Database and HUBSCO Construction Reporting SystemRRun Date: 07/11/2007200

NORTH CAROLINA DEPARTMENT OF ADMINISTRATION
OFFICE FOR HISTORICALLY UNDERUTILIZED BUSINESSES
Purchasing and Construction Reports - Public Schools - 2nd Quarter 2006-07(Oct. 1, 2006 - Dec. 31, 2006)
2nd Quarter 2006-07(Oct. 1-Dec. 31,
2006)
1st Qtr
1st Qtr
Public Entity Type/EntityT
ota
l HU
B (
%)
To
tal
Pu
rch
asin
g($
)
MB
E (
$)
WB
E (
$)
DB
E-O
($)
DB
E (
$)
NP
WC
($)
Su
b (
$)
To
tal H
UB
($)
To
tal H
UB
(%
)
To
tal
Pu
rch
asin
g (
$)
To
tal H
UB
($)
To
tal H
UB
(%
)
To
tal H
UB
(%
)
To
tal
Co
nst
ruct
ion
V
alu
e ($
)
B($
)
H($
)
AA
($)
AI(
$)
WF
($)
SE
($)
To
tal H
UB
($)
To
tal H
UB
(%
)
To
tal
Co
nst
ruct
ion
V
alu
e ($
)
To
tal H
UB
($)
To
tal H
UB
(%
)
Year-to-Date2nd Quarter HUB Construction Report - Construction
Projects2nd Quarter HUB Purchasing Report - Goods and Services Year-to-Date
PUBLIC SCHOOLS - Contd….Mitchell County Schools 0.00% $261,380 $0 $0 $0 $0 $0 $0 $0 0.00% $488,923 $0 0.00%
Montgomery County Schools 3.31% $825,397 $0 $10,831 $0 $0 $0 $0 $10,831 1.31% $1,859,254 $45,060 2.42%Moore County Schools 2.42% $1,614,473 $12,536 $163,354 $306 $362 $0 $0 $176,559 10.94% $5,294,546 $265,668 5.02% 0.00% $295,800 $4,000 $11,900 $0 $0 $80,837 $0 $96,737 32.70% $309,675 $96,737 31.24%
Mooresville City Schools 7.50% $473,961 $26,170 $3,976 $1,264 $492 $0 $0 $31,902 6.73% $994,926 $70,995 7.14%
Mount Airy County Schools 25.96% $359,999 $671 $108,483 $43,852 $0 $0 $0 $153,006 42.50% $751,317 $254,601 33.89%Nash-Rocky Mount Schools(DNS-C) 27.08% $776,193 $4,441 $16,069 $45,118 $0 $0 $0 $65,628 8.46% $1,843,056 $354,525 19.24% 0.00% $0 $0 $0 $0 $0 $0 $0 $0 0.00% $0 $0 0.00%
New Hanover County Schools 5.75% $247,630 $23,838 $24,985 $0 $0 $0 $0 $48,823 19.72% $12,381,912 $746,051 6.03% 44.17% $432,460 $0 $0 $0 $0 $0 $0 $0 0.00% $2,002,149 $693,395 34.63%Newton-Conover City Schools (DNS-C) 12.79% $26,206 $103 $9,745 $0 $0 $0 $0 $9,848 37.58% $82,973 $17,109 20.62% 0.00% $0 $0 $0 $0 $0 $0 $0 $0 0.00% $0 $0 0.00%Northampton County Schools 3.49% $0 $0 $0 $0 $0 $0 $0 $0 #DIV/0! $661,367 $23,053 3.49% 0.00% $0 $0 $0 $0 $0 $0 $0 $0 0.00% $0 $0 0.00%
Onslow County Schools 2.72% $8,006,355 $5,144 $264,299 $33,954 $0 $376 $0 $303,773 3.79% $13,534,228 $453,861 3.35%
Orange County Schools 26.88% $3,931,018 $47,347 $675,067 $608 $9,761 $414 $0 $733,197 18.65% $6,449,534 $1,410,197 21.87%Pamlico County Schools (DNS-C) 7.47% $295,500 $13,358 $8,028 $0 $0 $0 $0 $21,386 7.24% $599,340 $44,086 7.36% 0.00% $0 $0 $0 $0 $0 $0 $0 $0 0.00% $0 $0 0.00%
Pender County Schools 29.76% $6,699,200 $32,409 $950,145 $0 $4,018 $97,926 $621,454 $1,705,953 25.47% $8,326,261 $2,190,168 26.30%
Perquimans County Schools 3.91% $39,841 $2,793 $1,818 $0 $0 $0 $0 $4,611 11.57% $81,809 $6,253 7.64%Person County Schools (DNS-C) 7.00% $1,351,739 $168 $42,206 $1,366 $17,721 $0 $0 $61,461 4.55% $2,288,630 $127,062 5.55% 0.00% $0 $0 $0 $0 $0 $0 $0 $0 0.00% $0 $0 0.00%Pitt County Schools (DNS-C) 32.46% $1,862,242 $164,094 $202,186 $170,863 $56,615 $74,640 $0 $668,398 35.89% $7,930,440 $2,638,288 33.27% 0.00% $0 $0 $0 $0 $0 $0 $0 $0 0.00% $0 $0 0.00%
Polk County Schools 12.48% $1,271,682 $1,054 $57,278 $0 $0 $0 $0 $58,332 4.59% $2,121,684 $164,421 7.75%Randolph County Schools(DNS-C) 0.33% $20,197,321 $36,033 $3,105 $2,287 $2,409 $0 $0 $43,834 0.22% $39,045,903 $106,200 0.27% 0.00% $0 $0 $0 $0 $0 $0 $0 $0 0.00% $0 $0 0.00%Richmond County Schools 17.25% $2,534,278 $9,607 $426,841 $2,564 $0 $0 $0 $439,012 17.32% $3,905,660 $675,553 17.30% 0.00% $0 $0 $0 $0 $0 $0 $0 $0 0.00% $0 $0 0.00%Roanoke Rapids City School (DNS-C) 18.92% $297,877 $4,218 $8,891 $174 $0 $0 $0 $13,283 4.46% $1,055,212 $156,576 14.84% 0.00% $0 $0 $0 $0 $0 $0 $0 $0 0.00% $0 $0 0.00%
Robeson County Schools 1.15% $24,027,418 $215,520 $4,576 $92,774 $0 $0 $0 $312,871 1.30% $42,259,128 $522,970 1.24% 0.00% $0 $0 $0 $0 $0 $0 $0 $0 0.00% $0 $0 0.00%
Rockingham County Schools 10.08% $2,198,058 $23,700 $311,914 $910 $0 $0 $0 $336,524 15.31% $3,817,762 $499,851 13.09%
Rowan/Salisbury County Schools 6.11% $6,449,235 $1,572 $109,544 $0 $0 $0 $0 $111,115 1.72% $10,661,033 $368,546 3.46%Rutherford County Schools (DNS-C) 1.70% $3,309,581 $64,824 $48,642 $0 $0 $0 $0 $113,466 3.43% $7,046,097 $176,817 2.51% 0.00% $0 $0 $0 $0 $0 $0 $0 $0 0.00% $0 $0 0.00%
Sampson County Schools 3.30% $2,138,192 $25,900 $47,247 $0 $1,264 $0 $0 $74,411 3.48% $4,272,568 $144,941 3.39%Scotland County Schools (DNS-C) 35.19% $934,078 $210,149 $123,242 $0 $0 $0 $0 $333,391 35.69% $1,842,834 $653,177 35.44% 0.00% $0 $0 $0 $0 $0 $0 $0 $0 0.00% $0 $0 0.00%
Stanly County Schools 7.44% $1,598,772 $16,930 $0 $0 $0 $0 $0 $16,930 1.06% $4,937,988 $265,445 5.38%
Stokes County Schools 7.84% $2,056,701 $23,276 $274,252 $0 $0 $0 $0 $297,528 14.47% $3,827,463 $436,432 11.40% 0.00% $0 $0 $0 $0 $0 $0 $0 $0 0.00% $58,466 $0 0.00%Surry County Board of Education(DNS-C) 16.38% $1,926,715 $149,562 $65,653 $812 $70,000 $0 $0 $286,027 14.85% $3,052,761 $470,458 15.41% 0.00% $0 $0 $0 $0 $0 $0 $0 $0 0.00% $0 $0 0.00%
Swain County Schools 74.95% $33,134 $13,038 $11,882 $0 $0 $0 $0 $24,920 75.21% $52,845 $39,694 75.11%
Thomasville City Schools 8.50% $970,537 $74,117 $15,347 $38 $17,205 $0 $0 $106,707 10.99% $1,646,565 $164,148 9.97%Transylvania County Schools (DNS-C) 9.56% $751,480 $32,518 $38,573 $0 $0 $0 $0 $71,091 9.46% $1,545,166 $146,961 9.51% 0.00% $0 $0 $0 $0 $0 $0 $0 $0 0.00% $1,004,700 $0 0.00%
Tyrell County Schools 4.61% $179,881 $8,775 $6,441 $0 $0 $0 $0 $15,216 8.46% $360,679 $23,544 6.53%
K:\Hubrpt_Purchase and Construction\FY'06-07\Quarter and Annual\06-07PS 3 - 2.5 Source: HUB Purchasing Report Database and HUBSCO Construction Reporting SystemRRun Date: 07/11/2007200

NORTH CAROLINA DEPARTMENT OF ADMINISTRATION
OFFICE FOR HISTORICALLY UNDERUTILIZED BUSINESSES
Purchasing and Construction Reports - Public Schools - 2nd Quarter 2006-07(Oct. 1, 2006 - Dec. 31, 2006)
2nd Quarter 2006-07(Oct. 1-Dec. 31,
2006)
1st Qtr
1st Qtr
Public Entity Type/EntityT
ota
l HU
B (
%)
To
tal
Pu
rch
asin
g($
)
MB
E (
$)
WB
E (
$)
DB
E-O
($)
DB
E (
$)
NP
WC
($)
Su
b (
$)
To
tal H
UB
($)
To
tal H
UB
(%
)
To
tal
Pu
rch
asin
g (
$)
To
tal H
UB
($)
To
tal H
UB
(%
)
To
tal H
UB
(%
)
To
tal
Co
nst
ruct
ion
V
alu
e ($
)
B($
)
H($
)
AA
($)
AI(
$)
WF
($)
SE
($)
To
tal H
UB
($)
To
tal H
UB
(%
)
To
tal
Co
nst
ruct
ion
V
alu
e ($
)
To
tal H
UB
($)
To
tal H
UB
(%
)
Year-to-Date2nd Quarter HUB Construction Report - Construction
Projects2nd Quarter HUB Purchasing Report - Goods and Services Year-to-Date
PUBLIC SCHOOLS - Contd….Union County Public Schools(DNS-C) 0.00% $0 $0 $0 $0 $0 $0 $0 $0 0.00% $0 $0 0.00% 0.00% $228,862 $0 $0 $0 $0 $0 $0 $0 0.00% $749,079 $0 0.00%Vance County Board of Education 0.72% $2,443,987 $0 $95,978 $0 $0 $0 $0 $95,978 3.93% $4,681,726 $111,989 2.39% 0.37% $531,694 $0 $0 $0 $0 $0 $0 $0 0.00% $1,751,458 $4,500 0.26%Wake County Public School System - 24.54% $12,924,921 $282,971 $782,355 $179,988 $0 $0 $0 $1,245,314 9.63% $89,457,058 $20,027,296 22.39% 13.32% $8,198,893 $87,973 $592,044 $0 $0 $623,648 $0 $1,303,665 15.90% $23,996,949 $3,408,401 14.20%
Warren County Schools 0.00% $0 $0 $0 $0 $0 $0 $0 $0 #DIV/0! $0 $0 #DIV/0!Washington County Schools 0.00% $1,190,990 $0 $0 $0 $0 $0 $0 $0 0.00% $2,164,866 $0 0.00% 0.00% $0 $0 $0 $0 $0 $0 $0 $0 0.00% $0 $0 0.00%
Watauga County Schools 13.41% $968,490 $7,848 $45,941 $0 $0 $0 $0 $53,789 5.55% $1,436,478 $116,547 8.11%Wayne County Public Schools 11.07% $2,507,367 $75,997 $388,037 $1,478 $0 $0 $0 $465,511 18.57% $5,127,979 $755,514 14.73% 0.00% $54,024 $0 $0 $0 $38,600 $0 $0 $38,600 71.45% $162,210 $38,600 23.80%
Weldon City Schools 0.00% $125,633 $0 $0 $0 $0 $0 $0 $0 0.00% $199,613 $0 0.00%
Whiteville City Schools 11.22% $971,049 $71,916 $470 $0 $0 $0 $0 $72,386 7.45% $1,808,326 $166,368 9.20%Wilkes County Public Schools(DNS-C) 19.62% $437,881 $9,489 $78,769 $19,768 $0 $0 $0 $108,026 24.67% $898,329 $198,363 22.08% 0.00% $0 $0 $0 $0 $0 $0 $0 $0 0.00% $773,614 $0 0.00%Wilson County Schools 4.45% $2,235,798 $64,936 $162,372 $559 $0 $0 $0 $227,867 10.19% $3,849,433 $299,637 7.78% 0.00% $0 $0 $0 $0 $0 $0 $0 $0 0.00% $0 $0 0.00%Winston-Salem/Forsyth County 18.84% $17,040,048 $594,008 $725,268 $536,999 $0 $0 $0 $1,856,275 10.89% $31,085,769 $4,502,543 14.48% 6.16% $14,990,823 $491,083 $0 $0 $0 $1,826,356 $0 $2,317,439 15.46% $15,931,606 $2,375,371 14.91%Yadkin County Schools 8.23% $262,621 $28,173 $73,623 $249 $1,760 $0 $0 $103,806 39.53% $1,398,564 $197,246 14.10% 0.00% $5,812,992 $0 $0 $0 $0 $0 $0 $0 0.00% $5,812,992 $0 0.00%Yancey County Schools 1.08% $2,601,818 $882 $21,417 $0 $0 $0 $0 $22,299 0.86% $5,427,795 $52,881 0.97% 0.00% $0 $0 $0 $0 $0 $0 $0 $0 0.00% $0 $0 0.00%
TOTALS 9.91% $380,174,892 $6,748,272 $18,049,253 $1,935,617 $386,909 $386,813 $633,962 $28,140,826 7.40% $862,995,291 $75,976,264 8.80% 13.85% $34,345,890 $773,506 $620,944 $24,350 $38,600 $4,035,197 $0 $5,492,597 15.99% $93,907,297 $13,740,354 14.63%
% of HUB Participation 1.78% 4.75% 0.51% 0.10% 0.10% 0.17% 7.40% 8.80% 13.85% 2.25% 1.81% 0.07% 0.11% 11.75% 0% 15.99% 14.63%
%of Minority Participation against Total HUB $ 11.90% 69.73% 9.18% 9.18% 0.00% 0.00% 14.08% 11.31% 0.44% 0.70% 73.47% 0%
LEGEND:
DNS-C - Categories with blanks or blank space indicate LEGEND: LEGEND:
entity "DID NOT SUBMIT" Construction Report MBE - Minority Business Enterprise B - Black
DNS-P - Categories with blanks or blank space indicate WBE - Woman Business Enterprise H - Hispanic
entity "DID NOT SUBMIT" Purchasing Report DBE-O- Disabled - Owned Business Enterprise AA - Asian-American
* - currently do not report DBE - Disabled Business Enterprise AI - American Indian
NPWC - Non - profit Work Center for the Blind & Severely Disabled WF - White Female
Note: Sub - HUB Subcontractor SE - Socially and Economically Disadvantaged
1. When a construction project is finalized (submitted) by an entiity, HUBSCO system will update
to the relevant quarter when the project was completed
K:\Hubrpt_Purchase and Construction\FY'06-07\Quarter and Annual\06-07PS 3 - 2.5 Source: HUB Purchasing Report Database and HUBSCO Construction Reporting SystemRRun Date: 07/11/2007200

NORTH CAROLINA DEPARTMENT OF ADMINISTRATION
OFFICE FOR HISTORICALLY UNDERUTILIZED BUSINESSES
Purchasing and Construction Reports
State Universities - 2ndQuarter 2006-07(Oct. 1, 2006 - Dec. 31, 2006)
2nd Quarter 2006-07(Oct. 1 - Dec. 31,
2006)
1st Qtr
1st Qtr
Public Entity Type/Entity
To
tal H
UB
(%
)
To
tal
Pu
rch
asin
g($
)
MB
E (
$)
WB
E (
$)
DB
E-O
($)
DB
E (
$)
NP
WC
($)
Su
b (
$)
To
tal H
UB
($)
To
tal H
UB
(%
)
To
tal
Pu
rch
asin
g (
$)
To
tal H
UB
($)
To
tal H
UB
(%
)
To
tal H
UB
(%
)
To
tal
Co
nst
ruct
ion
V
alu
e ($
)
B($
)
H($
)
AA
($)
AI(
$)
WF
($)
SE
($)
To
tal H
UB
($)
To
tal H
UB
(%
)
To
tal
Co
nst
ruct
ion
V
alu
e ($
)
To
tal H
UB
($)
To
tal H
UB
(%
)
STATE UNIVERSITIESAppalachian State University(DNS-C) 6.29% $3,899,577 $1,034 $66,225 $0 $0 $0 $0 $67,259 1.72% $9,180,412 $399,631 4.35% 100% $164,000 $0 $0 $0 $0 $0 $0 $0 0.00% $349,620 $185,620 53.1%East Carolina University(DNS-C) 13.62% $21,156,384 $55,291 $597,374 $4,838 $0 $0 $1,955,353 $2,612,856 12.35% $41,725,570 $5,414,282 12.98% 10.92% $9,039,091 $52,821 $0 $0 $4,558 $802,986 $222,106 $1,082,471 11.98% $49,332,879 $5,481,426 11.11%Elizabeth City State University (DNS-C) 10.40% $1,504,423 $474,443 $44,983 $0 $0 $0 $0 $519,426 34.53% $9,224,754 $1,322,401 14.34% 0.00% $0 $0 $0 $0 $0 $0 $0 $0 0.00% $0 $0 0.00%Fayetteville State University (DNS-C) 2.83% $3,520,010 $312,816 $63,264 $0 $0 $0 $0 $376,080 10.68% $24,167,360 $959,759 3.97% 0.00% $0 $0 $0 $0 $0 $0 $0 $0 0.00% $0 $0 0.00%North Carolina Agricultural & Technical State University(DNS-C) 11.20% $5,950,882 $613,339 $114,904 $0 $0 $0 $0 $728,243 12.24% $17,796,938 $2,055,523 11.55% 0.00% $0 $0 $0 $0 $0 $0 $0 $0 0.00% $0 $0 0.00%North Carolina Arboretum (DNS-C) X X X X X X X X X X X X X 0.00% $0 $0 $0 $0 $0 $0 $0 $0 0.00% $0 $0 0.00%North Carolina Central University(DNS-C)
32.37% $5,795,020 $1,790,816 $345,370 $0 $0 $0 $0 $2,136,186 36.86% $13,315,140 $4,570,233 34.32% 0.00% $0 $0 $0 $0 $0 $0 $0 $0 0.00% $0 $0 0.00%North Carolina School of Science and Mathematics 13.29% $175,543 $35,097 $1,281 $0 $0 $0 $0 $36,378 20.72% $1,814,317 $254,130 14.01% 0.00% $306,601 $0 $306,601 $0 $0 $0 $0 $306,601 100% $306,601 $306,601 100%North Carolina School of the Arts 14.21% $826,138 $19,144 $52,110 $0 $0 $0 $0 $71,254 8.62% $2,358,454 $289,044 12.26% 0.00% $0 $0 $0 $0 $0 $0 $0 $0 0.00% $0 $0 0.00%North Carolina State University 0.93% $43,578,552 $323,415 $512,698 $33,408 $850 $0 $0 $870,372 2.00% $88,427,218 $1,289,305 1.46% 13.98% $6,499,400 $1,204,650 $0 $0 $0 $706,962 $0 $1,911,612 29.41% $37,836,730 $6,293,886 16.63%UNC Hospitals (DNS-C) 0.21% $61,870,538 $136,945 $20,805 $0 $0 $0 $0 $157,750 0.25% $172,498,567 $385,330 0.22% 0.00% $0 $0 $0 $0 $0 $0 $0 $0 0.00% $942,900 $0 0.00%UNC-Asheville 7.05% $729,301 $2,149 $34,459 $0 $8,872 $0 $0 $45,480 6.24% $1,935,415 $130,546 6.75% 31.60% $0 $0 $0 $0 $0 $0 $0 $0 0.00% $808,231 $255,404 31.60%UNC-Chapel Hill 2.09% $21,282,480 $720,101 $293,029 $120,999 $0 $0 $0 $1,134,129 5.33% $63,168,291 $2,010,096 3.18% 13.51% $35,683,647 $728,154 $287,772 $0 $0 $2,405,141 $190,385 $3,611,452 10.12% $77,243,236 $9,226,327 11.94%UNC-Charlotte 0.00% $6,633,475 $454,792 $433,401 $0 $1,373 $7,027 $0 $896,593 13.52% $17,314,713 $2,681,256 15.49% 7.61% $0 $0 $0 $0 $0 $0 $0 $0 0.00% $26,641,973 $2,028,050 7.61%UNC-Greensboro 11.62% $4,929,713 $76,089 $142,258 $621 $0 $0 $0 $218,968 4.44% $11,655,422 $1,000,548 8.58% 12.04% $7,460,452 $111,360 $259,000 $0 $0 $509,996 $0 $880,356 11.80% $13,451,328 $1,601,883 11.91%UNC-Office of the President (DNS-C) 1.94% $2,621,206 $35,745 $61,424 $0 $0 $0 $0 $97,170 3.71% $11,786,043 $275,384 2.34% 0.00% $0 $0 $0 $0 $0 $0 $0 $0 0.00% $0 $0 0.00%UNC-Pembroke(DNS-C) 8.00% $3,870,029 $73,099 $66,079 $18,028 $0 $0 $0 $157,205 4.06% $7,244,662 $427,324 5.90% 100% $0 $0 $0 $0 $0 $0 $0 $0 0.00% $1,318,407 $1,318,407 100%UNC-TV X X X X X X X X X X X X X 4.87% $0 $0 $0 $0 $0 $0 $0 $0 0.00% $119,592 $5,828 4.87%UNC-Wilmington (DNS-C) 0.00% $5,673,513 $22,222 $214,445 $0 $4,317 $0 $0 $240,984 4.25% $17,366,668 $819,991 4.72% 39.74% $155,805 $10,290 $0 $0 $0 $0 $0 $10,290 6.60% $1,537,302 $559,238 36.38%Western Carolina University 0.00% $5,227,114 $137,064 $498,939 $2,098 $0 $0 $0 $638,101 12.21% $5,227,114 $638,101 12.21% 0.00% $0 $0 $0 $0 $0 $0 $0 $0 0.00% $0 $0 0.00%Winston-Salem State University 6.80% $3,090,603 $171,816 $20,933 $0 $0 $0 $0 $192,749 6.24% $9,601,036 $635,651 6.62% 5.07% $767,263 $142,605 $0 $18,099 $0 $34,991 $0 $195,695 25.51% $1,194,988 $217,363 18.19%
TOTALS 4.44% $202,334,501 $5,455,417 $3,583,981 $179,992 $15,412 $7,027 $1,955,353 $11,197,183 5.53% $525,808,094 $25,558,535 4.86% 12.90% $60,076,258 $2,249,880 $853,373 $18,099 $4,558 $4,460,076 $412,491 $7,998,477 13.31% $211,083,787 $27,480,033 13.02%
% of HUB Participation 2.70% 1.77% 0.09% 0.01% 0.00% 0.97% 5.53% 4.86% 3.75% 1.42% 0% 0.01% 7.42% 0.69% 13.31% 13.02%
%of Minority Participation against Total HUB $ 48.72% 32.01% 1.61% 0.14% 0.06% 17.46% 28.13% 10.67% 0% 0.06% 55.76% 5.16%
LEGEND: LEGEND: LEGEND:
DNS-C - Categories with blanks or blank space indicate MBE - Minority Business Enterprise B - Black
entity "DID NOT SUBMIT" Construction Report WBE - Woman Business Enterprise H - Hispanic
DNS-P - Categories with blanks or blank space indicate DBE-O- Disabled - Owned Business Enterprise AA - Asian-American
entity "DID NOT SUBMIT" Purchasing Report DBE - Disabled Business Enterprise AI - American Indian
X - no reporting requirements NPWC - Non - profit Work Center for the Blind & Severely Disabled WF - White Female
Sub - HUB Subcontractor SE - Socially and Economically Disadvantaged
Note:
1. When a construction project is finalized (submitted) by an entiity, HUBSCO system will update
to the relevant quarter when the project was completed
Year-to-Date2nd Quarter HUB Construction Report - Construction Projects2nd Quarter HUB Purchasing Report -Goods and Services Year-to-Date
K:\Hubrpt_Purchase and Construction\FY'06-07\Quarter and Annual\06-07SU 3 - 2.6 Source: HUB Purchasing Report Database and HUBSCO Construction Reporting SystemRun Date: 07/11/2007

NORTH CAROLINA DEPARTMENT OF ADMINISTRATION
OFFICE FOR HISTORICALLY UNDERUTILIZED BUSINESSES
Purchasing and Construction Reports
Counties - 2nd Quarter 2006-07(Oct.1, 2006 - Dec. 31, 2006)
2nd Quarter 2006-07(Oct. 1 -Dec. 31, 2006)
1st Qtr
1st Qtr
Public Entity Type/Entity
To
tal
HU
B (
%)
To
tal
Pu
rch
as
ing
($)
MB
E (
$)
WB
E (
$)
DB
E-O
($
)
DB
E (
$)
NP
WC
($
)
Su
b (
$)
To
tal
HU
B (
$)
To
tal
HU
B (
%)
To
tal
Pu
rch
as
ing
($
)
To
tal
HU
B (
$)
To
tal
HU
B (
%)
To
tal
HU
B (
%)
To
tal
Co
ns
tru
cti
on
V
alu
e (
$)
B($
)
H($
)
AA
($)
AI(
$)
WF
($)
SE
($)
To
tal
HU
B (
$)
To
tal
HU
B (
%)
To
tal
Co
ns
tru
cti
on
V
alu
e (
$)
To
tal
HU
B (
$)
To
tal
HU
B (
%)
COUNTIESCounty of Alamance X X X X X X X X X X X X X 100% $0 $0 $0 $0 $0 $0 $0 $0 0.00% $39,939 $39,939 100%
County of Alleghany X X X X X X X X X X X X X 0.00% $0 $0 $0 $0 $0 $0 $0 $0 0.00% $0 $0 0.00%
County of Ashe X X X X X X X X X X X X X 0.00% $0 $0 $0 $0 $0 $0 $0 $0 0.00% $0 $0 0.00%
County of Bladen (DNS-C) X X X X X X X X X X X X X 0.00% $0 $0 $0 $0 $0 $0 $0 $0 0.00% $0 $0 0.00%
County of Buncombe X X X X X X X X X X X X X 0.00% $0 $0 $0 $0 $0 $0 $0 $0 0.00% $0 $0 0.00%
County of Cabarrus (DNS-C) X X X X X X X X X X X X X 0.00% $27,005 $0 $0 $0 $0 $0 $0 $0 0.00% $54,228 $0 0.00%
County of Camden (DNS-C) X X X X X X X X X X X X X 0.00% $0 $0 $0 $0 $0 $0 $0 $0 0.00% $0 $0 0.00%
County of Carteret X X X X X X X X X X X X X 0.00% $202,500 $202,500 $0 $0 $0 $0 $0 $202,500 100% $701,860 $202,500 28.85%
County of Caswell X X X X X X X X X X X X X 0.00% $0 $0 $0 $0 $0 $0 $0 $0 0.00% $0 $0 0.00%
County of Catawba X X X X X X X X X X X X X 0.00% $0 $0 $0 $0 $0 $0 $0 $0 0.00% $0 $0 0.00%
County of Chatham (DNS) X X X X X X X X X X X X X 0.00% $0 $0 $0 $0 $0 $0 $0 $0 0.00% $0 $0 0.00%
County of Cleveland (DNS-C) X X X X X X X X X X X X X 0.00% $0 $0 $0 $0 $0 $0 $0 $0 0.00% $0 $0 0.00%
County of Columbus (DNS-C) X X X X X X X X X X X X X 0.00% $0 $0 $0 $0 $0 $0 $0 $0 0.00% $0 $0 0.00%
County of Cumberland X X X X X X X X X X X X X 0.00% $7,750 $0 $0 $0 $0 $0 $0 $0 0.00% $7,750 $0 0.00%
County of Currituck (DNS-C) X X X X X X X X X X X X X 0.00% $0 $0 $0 $0 $0 $0 $0 $0 0.00% $0 $0 0.00%
County of Dare X X X X X X X X X X X X X 0.00% $0 $0 $0 $0 $0 $0 $0 $0 0.00% $0 $0 0.00%
County of Davidson X X X X X X X X X X X X X 0.00% $0 $0 $0 $0 $0 $0 $0 $0 0.00% $0 $0 0.00%
County of Edgecombe X X X X X X X X X X X X X 0.00% $0 $0 $0 $0 $0 $0 $0 $0 0.00% $0 $0 0.00%
County of Gaston X X X X X X X X X X X X X 0.00% $497,430 $0 $0 $0 $0 $0 $0 $0 0.00% $497,430 $0 0.00%
County of Graham (DNS-C) X X X X X X X X X X X X X 0.00% $0 $0 $0 $0 $0 $0 $0 $0 0.00% $0 $0 0.00%
County of Granville X X X X X X X X X X X X X 0.00% $0 $0 $0 $0 $0 $0 $0 $0 0.00% $0 $0 0.00%
County of Guilford X X X X X X X X X X X X X 15.75% $0 $0 $0 $0 $0 $0 $0 $0 0.00% $472,629 $74,455 15.75%
County of Harnett X X X X X X X X X X X X X 0.00% $112,086 $16,382 $0 $0 $0 $3,503 $0 $19,885 17.74% $112,086 $19,885 17.74%
County of Hoke X X X X X X X X X X X X X 0.00% $2,772,463 $106,800 $0 $0 $200,000 $19,699 $0 $326,499 11.78% $2,772,463 $326,499 11.78%
County of Iredell X X X X X X X X X X X X X 0.00% $5,773,821 $19,085 $0 $0 $590,960 $21,404 $0 $631,449 10.94% $5,773,821 $631,449 10.94%
County of Lee (DNS-C) X X X X X X X X X X X X X 0.00% $0 $0 $0 $0 $0 $0 $0 $0 0.00% $0 $0 0.00%
County of Mecklenburg X X X X X X X X X X X X X 27.41% $904,533 $9,680 $0 $0 $0 $16,919 $0 $26,599 2.94% $1,119,323 $85,480 7.64%
County of Moore (DNS-C) X X X X X X X X X X X X X 0.00% $0 $0 $0 $0 $0 $0 $0 $0 0.00% $0 $0 0.00%
County of Nash (DNS-C) X X X X X X X X X X X X X 0.00% $0 $0 $0 $0 $0 $0 $0 $0 0.00% $0 $0 0.00%
County of Onslow (DNS-C) X X X X X X X X X X X X X 0.00% $0 $0 $0 $0 $0 $0 $0 $0 0.00% $0 $0 0.00%
County of Polk (DNS-C) X X X X X X X X X X X X X 0.00% $0 $0 $0 $0 $0 $0 $0 $0 0.00% $0 $0 0.00%
County of Randolph (DNS-C) X X X X X X X X X X X X X 0.00% $0 $0 $0 $0 $0 $0 $0 $0 0.00% $0 $0 0.00%
County of Rockingham X X X X X X X X X X X X X 37.60% $0 $0 $0 $0 $0 $0 $0 $0 0.00% $56,576 $21,275 37.60%
County of Sampson (DNS-C) X X X X X X X X X X X X X 0.00% $0 $0 $0 $0 $0 $0 $0 $0 0.00% $0 $0 0.00%
County of Surry X X X X X X X X X X X X X 0.00% $0 $0 $0 $0 $0 $0 $0 $0 0.00% $294,265 $0 0.00%
County of Transylvania X X X X X X X X X X X X X 0.00% $0 $0 $0 $0 $0 $0 $0 $0 0.00% $0 $0 0.00%
County of Union X X X X X X X X X X X X X 0.00% $0 $0 $0 $0 $0 $0 $0 $0 0.00% $0 $0 0.00%
Year-to-Date2nd Quarter HUB Construction Report - Construction Projects2nd Quarter HUB Purchasing Report -
Goods and ServicesYear-to-Date
K:\Hubrpt_Purchase and Construction\FY'06-07\Quarter and Annual\06-07Counties 3 - 2.7 Source: HUBSCO Construction Reporting SystemRun Date: 07/11/2007

NORTH CAROLINA DEPARTMENT OF ADMINISTRATION
OFFICE FOR HISTORICALLY UNDERUTILIZED BUSINESSES
Purchasing and Construction Reports
Counties - 2nd Quarter 2006-07(Oct.1, 2006 - Dec. 31, 2006)
2nd Quarter 2006-07(Oct. 1 -Dec. 31, 2006)
1st Qtr
1st Qtr
Public Entity Type/Entity
To
tal
HU
B (
%)
To
tal
Pu
rch
as
ing
($)
MB
E (
$)
WB
E (
$)
DB
E-O
($
)
DB
E (
$)
NP
WC
($
)
Su
b (
$)
To
tal
HU
B (
$)
To
tal
HU
B (
%)
To
tal
Pu
rch
as
ing
($
)
To
tal
HU
B (
$)
To
tal
HU
B (
%)
To
tal
HU
B (
%)
To
tal
Co
ns
tru
cti
on
V
alu
e (
$)
B($
)
H($
)
AA
($)
AI(
$)
WF
($)
SE
($)
To
tal
HU
B (
$)
To
tal
HU
B (
%)
To
tal
Co
ns
tru
cti
on
V
alu
e (
$)
To
tal
HU
B (
$)
To
tal
HU
B (
%)
Year-to-Date2nd Quarter HUB Construction Report - Construction Projects2nd Quarter HUB Purchasing Report -
Goods and ServicesYear-to-Date
COUNTIES - Contd…County of Vance (DNS-C)
X X X X X X X X X X X X X0.00% $0 $0 $0 $0 $0 $0 $0 $0 0.00% $0 $0 0.00%
County of Wake X X X X X X X X X X X X X 6.96% $11,497,833 $554,417 $54,564 $0 $0 $1,727,170 $183,053 $2,519,204 21.91% $20,146,957 $3,121,308 15.49%
County of Warren X X X X X X X X X X X X X 0.00% $610,360 $0 $0 $0 $0 $0 $0 $0 0.00% $610,360 $0 0.00%
County of Washington (DNS-C) X X X X X X X X X X X X X 0.00% $0 $0 $0 $0 $0 $0 $0 $0 0.00% $0 $0 0.00%
County of Watauga (DNS-C) X X X X X X X X X X X X X 0.00% $0 $0 $0 $0 $0 $0 $0 $0 0.00% $0 $0 0.00%
TOTALS - - - - - - - - - - - - - 7.77% $22,405,781 $908,864 $54,564 $0 $790,960 $1,788,695 $183,053 $3,726,136 16.63% $32,659,686 $4,522,791 13.85%
% of HUB Participation - 4.06% 0.24% 0.00% 3.53% 7.98% 0.82% 16.63% 13.85%
%of Minority Participation against Total HUB $ 24.39% 1.46% 0.00% 21.23% 48.00% 4.91%
LEGEND: LEGEND: LEGEND:
DNS-C - Categories with blanks or blank space indicate MBE - Minority Business Enterprise B - Black
entity "DID NOT SUBMIT" Construction Report WBE - Woman Business Enterprise H - Hispanic
DNS-P - Categories with blanks or blank space indicate DBE-O- Disabled - Owned Business Enterprise AA - Asian-American
entity "DID NOT SUBMIT" Purchasing Report DBE - Disabled Business Enterprise AI - American Indian
X - no reporting requirements NPWC - Non - profit Work Center for the Blind & Severely Disabled WF - White Female
Sub - HUB Subcontractor SE - Socially and Economically Disadvantaged
Note:
1. When a construction project is finalized (submitted) by an entiity, HUBSCO system will update
to the relevant quarter when the project was completed
K:\Hubrpt_Purchase and Construction\FY'06-07\Quarter and Annual\06-07Counties 3 - 2.7 Source: HUBSCO Construction Reporting SystemRun Date: 07/11/2007
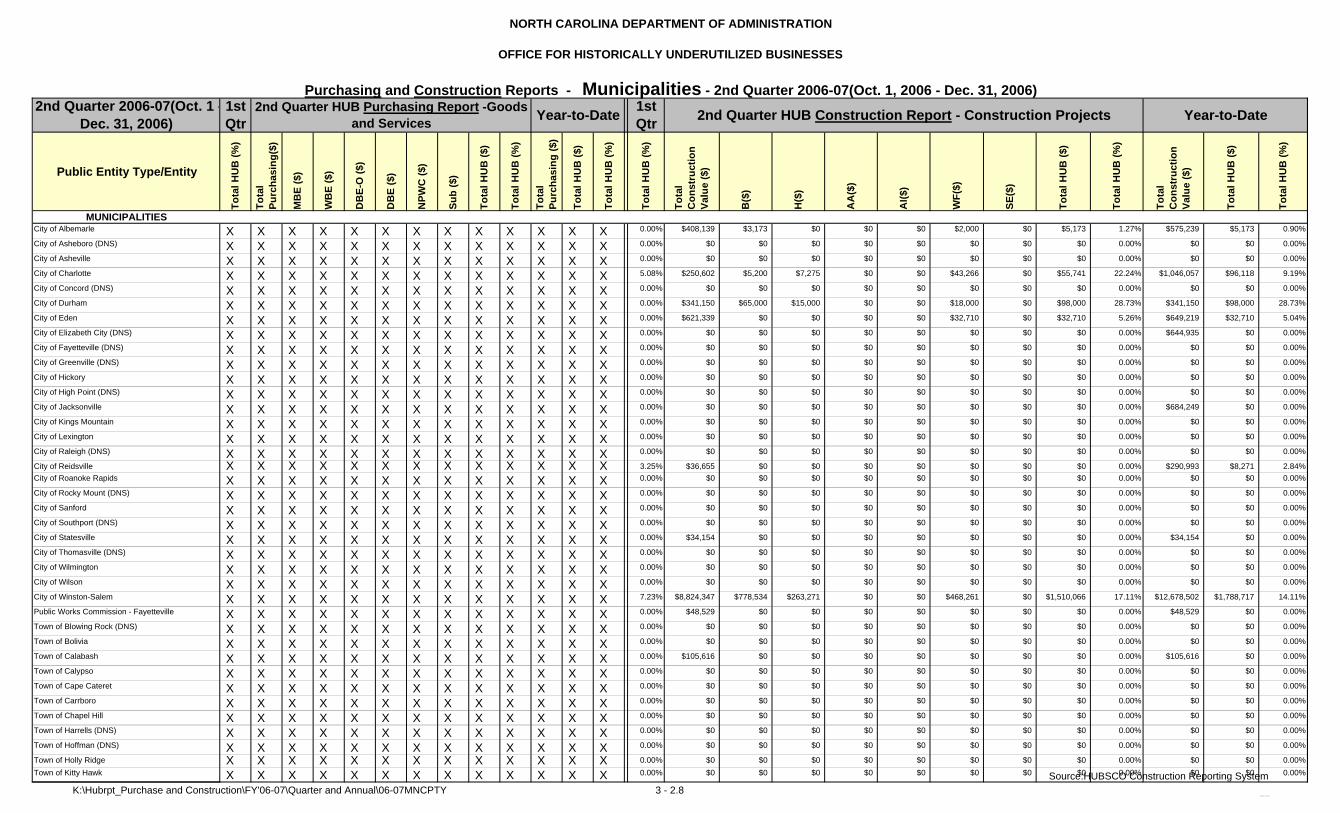
NORTH CAROLINA DEPARTMENT OF ADMINISTRATION
OFFICE FOR HISTORICALLY UNDERUTILIZED BUSINESSES
Purchasing and Construction Reports - Municipalities - 2nd Quarter 2006-07(Oct. 1, 2006 - Dec. 31, 2006)2nd Quarter 2006-07(Oct. 1 -
Dec. 31, 2006)1st Qtr
1st Qtr
Public Entity Type/Entity
To
tal
HU
B (
%)
To
tal
Pu
rch
asin
g($
)
MB
E (
$)
WB
E (
$)
DB
E-O
($)
DB
E (
$)
NP
WC
($)
Su
b (
$)
To
tal
HU
B (
$)
To
tal
HU
B (
%)
To
tal
Pu
rch
asin
g (
$)
To
tal
HU
B (
$)
To
tal
HU
B (
%)
To
tal
HU
B (
%)
To
tal
Co
nst
ruct
ion
V
alu
e ($
)
B($
)
H($
)
AA
($)
AI(
$)
WF
($)
SE
($)
To
tal
HU
B (
$)
To
tal
HU
B (
%)
To
tal
Co
nst
ruct
ion
V
alu
e ($
)
To
tal
HU
B (
$)
To
tal
HU
B (
%)
MUNICIPALITIESCity of Albemarle X X X X X X X X X X X X X 0.00% $408,139 $3,173 $0 $0 $0 $2,000 $0 $5,173 1.27% $575,239 $5,173 0.90%
City of Asheboro (DNS) X X X X X X X X X X X X X 0.00% $0 $0 $0 $0 $0 $0 $0 $0 0.00% $0 $0 0.00%
City of Asheville X X X X X X X X X X X X X 0.00% $0 $0 $0 $0 $0 $0 $0 $0 0.00% $0 $0 0.00%
City of Charlotte X X X X X X X X X X X X X 5.08% $250,602 $5,200 $7,275 $0 $0 $43,266 $0 $55,741 22.24% $1,046,057 $96,118 9.19%
City of Concord (DNS) X X X X X X X X X X X X X 0.00% $0 $0 $0 $0 $0 $0 $0 $0 0.00% $0 $0 0.00%
City of Durham X X X X X X X X X X X X X 0.00% $341,150 $65,000 $15,000 $0 $0 $18,000 $0 $98,000 28.73% $341,150 $98,000 28.73%
City of Eden X X X X X X X X X X X X X 0.00% $621,339 $0 $0 $0 $0 $32,710 $0 $32,710 5.26% $649,219 $32,710 5.04%
City of Elizabeth City (DNS) X X X X X X X X X X X X X 0.00% $0 $0 $0 $0 $0 $0 $0 $0 0.00% $644,935 $0 0.00%
City of Fayetteville (DNS) X X X X X X X X X X X X X 0.00% $0 $0 $0 $0 $0 $0 $0 $0 0.00% $0 $0 0.00%
City of Greenville (DNS) X X X X X X X X X X X X X 0.00% $0 $0 $0 $0 $0 $0 $0 $0 0.00% $0 $0 0.00%
City of Hickory X X X X X X X X X X X X X 0.00% $0 $0 $0 $0 $0 $0 $0 $0 0.00% $0 $0 0.00%
City of High Point (DNS) X X X X X X X X X X X X X 0.00% $0 $0 $0 $0 $0 $0 $0 $0 0.00% $0 $0 0.00%
City of Jacksonville X X X X X X X X X X X X X 0.00% $0 $0 $0 $0 $0 $0 $0 $0 0.00% $684,249 $0 0.00%
City of Kings Mountain X X X X X X X X X X X X X 0.00% $0 $0 $0 $0 $0 $0 $0 $0 0.00% $0 $0 0.00%
City of Lexington X X X X X X X X X X X X X 0.00% $0 $0 $0 $0 $0 $0 $0 $0 0.00% $0 $0 0.00%
City of Raleigh (DNS) X X X X X X X X X X X X X 0.00% $0 $0 $0 $0 $0 $0 $0 $0 0.00% $0 $0 0.00%
City of Reidsville X X X X X X X X X X X X X 3.25% $36,655 $0 $0 $0 $0 $0 $0 $0 0.00% $290,993 $8,271 2.84%
City of Roanoke Rapids X X X X X X X X X X X X X 0.00% $0 $0 $0 $0 $0 $0 $0 $0 0.00% $0 $0 0.00%
City of Rocky Mount (DNS) X X X X X X X X X X X X X 0.00% $0 $0 $0 $0 $0 $0 $0 $0 0.00% $0 $0 0.00%
City of Sanford X X X X X X X X X X X X X 0.00% $0 $0 $0 $0 $0 $0 $0 $0 0.00% $0 $0 0.00%
City of Southport (DNS) X X X X X X X X X X X X X 0.00% $0 $0 $0 $0 $0 $0 $0 $0 0.00% $0 $0 0.00%
City of Statesville X X X X X X X X X X X X X 0.00% $34,154 $0 $0 $0 $0 $0 $0 $0 0.00% $34,154 $0 0.00%
City of Thomasville (DNS) X X X X X X X X X X X X X 0.00% $0 $0 $0 $0 $0 $0 $0 $0 0.00% $0 $0 0.00%
City of Wilmington X X X X X X X X X X X X X 0.00% $0 $0 $0 $0 $0 $0 $0 $0 0.00% $0 $0 0.00%
City of Wilson X X X X X X X X X X X X X 0.00% $0 $0 $0 $0 $0 $0 $0 $0 0.00% $0 $0 0.00%
City of Winston-Salem X X X X X X X X X X X X X 7.23% $8,824,347 $778,534 $263,271 $0 $0 $468,261 $0 $1,510,066 17.11% $12,678,502 $1,788,717 14.11%
Public Works Commission - Fayetteville X X X X X X X X X X X X X 0.00% $48,529 $0 $0 $0 $0 $0 $0 $0 0.00% $48,529 $0 0.00%
Town of Blowing Rock (DNS) X X X X X X X X X X X X X 0.00% $0 $0 $0 $0 $0 $0 $0 $0 0.00% $0 $0 0.00%
Town of Bolivia X X X X X X X X X X X X X 0.00% $0 $0 $0 $0 $0 $0 $0 $0 0.00% $0 $0 0.00%
Town of Calabash X X X X X X X X X X X X X 0.00% $105,616 $0 $0 $0 $0 $0 $0 $0 0.00% $105,616 $0 0.00%
Town of Calypso X X X X X X X X X X X X X 0.00% $0 $0 $0 $0 $0 $0 $0 $0 0.00% $0 $0 0.00%
Town of Cape Cateret X X X X X X X X X X X X X 0.00% $0 $0 $0 $0 $0 $0 $0 $0 0.00% $0 $0 0.00%
Town of Carrboro X X X X X X X X X X X X X 0.00% $0 $0 $0 $0 $0 $0 $0 $0 0.00% $0 $0 0.00%
Town of Chapel Hill X X X X X X X X X X X X X 0.00% $0 $0 $0 $0 $0 $0 $0 $0 0.00% $0 $0 0.00%
Town of Harrells (DNS) X X X X X X X X X X X X X 0.00% $0 $0 $0 $0 $0 $0 $0 $0 0.00% $0 $0 0.00%
Town of Hoffman (DNS) X X X X X X X X X X X X X 0.00% $0 $0 $0 $0 $0 $0 $0 $0 0.00% $0 $0 0.00%
Town of Holly Ridge X X X X X X X X X X X X X 0.00% $0 $0 $0 $0 $0 $0 $0 $0 0.00% $0 $0 0.00%
Town of Kitty Hawk X X X X X X X X X X X X X 0.00% $0 $0 $0 $0 $0 $0 $0 $0 0.00% $0 $0 0.00%
Year-to-Date2nd Quarter HUB Construction Report - Construction Projects2nd Quarter HUB Purchasing Report -Goods
and ServicesYear-to-Date
K:\Hubrpt_Purchase and Construction\FY'06-07\Quarter and Annual\06-07MNCPTY 3 - 2.8
Source:HUBSCO Construction Reporting System
Run Date: 07/11/2007

NORTH CAROLINA DEPARTMENT OF ADMINISTRATION
OFFICE FOR HISTORICALLY UNDERUTILIZED BUSINESSES
Purchasing and Construction Reports - Municipalities - 2nd Quarter 2006-07(Oct. 1, 2006 - Dec. 31, 2006)2nd Quarter 2006-07(Oct. 1 -
Dec. 31, 2006)1st Qtr
1st Qtr
Public Entity Type/Entity
To
tal
HU
B (
%)
To
tal
Pu
rch
asin
g($
)
MB
E (
$)
WB
E (
$)
DB
E-O
($)
DB
E (
$)
NP
WC
($)
Su
b (
$)
To
tal
HU
B (
$)
To
tal
HU
B (
%)
To
tal
Pu
rch
asin
g (
$)
To
tal
HU
B (
$)
To
tal
HU
B (
%)
To
tal
HU
B (
%)
To
tal
Co
nst
ruct
ion
V
alu
e ($
)
B($
)
H($
)
AA
($)
AI(
$)
WF
($)
SE
($)
To
tal
HU
B (
$)
To
tal
HU
B (
%)
To
tal
Co
nst
ruct
ion
V
alu
e ($
)
To
tal
HU
B (
$)
To
tal
HU
B (
%)
Year-to-Date2nd Quarter HUB Construction Report - Construction Projects2nd Quarter HUB Purchasing Report -Goods
and ServicesYear-to-Date
MUNICIPALITIES - Contd…Town of Lewisville (DNS) X X X X X X X X X X X X X 0.00% $0 $0 $0 $0 $0 $0 $0 $0 0.00% $0 $0 0.00%
Town of Mills River (DNS) X X X X X X X X X X X X X 0.00% $0 $0 $0 $0 $0 $0 $0 $0 0.00% $0 $0 0.00%
Town of Mt. Gilead (DNS) X X X X X X X X X X X X X 0.00% $0 $0 $0 $0 $0 $0 $0 $0 0.00% $0 $0 0.00%
Town of Princeton (DNS) X X X X X X X X X X X X X 0.00% $0 $0 $0 $0 $0 $0 $0 $0 0.00% $0 $0 0.00%
Town of Salemburg X X X X X X X X X X X X X 0.00% $0 $0 $0 $0 $0 $0 $0 $0 0.00% $0 $0 0.00%
Town of Saratoga X X X X X X X X X X X X X 0.00% $0 $0 $0 $0 $0 $0 $0 $0 0.00% $0 $0 0.00%
Town of Southern Pines X X X X X X X X X X X X X 0.00% $0 $0 $0 $0 $0 $0 $0 $0 0.00% $0 $0 0.00%
Town of Spring Lake (DNS) X X X X X X X X X X X X X 21.27% $0 $0 $0 $0 $0 $0 $0 $0 0.00% $2,669,930 $568,001 21.27%
Town of Spruce Pine X X X X X X X X X X X X X 0.00% $0 $0 $0 $0 $0 $0 $0 $0 0.00% $0 $0 0.00%
Town of Tarboro (DNS) X X X X X X X X X X X X X 0.00% $0 $0 $0 $0 $0 $0 $0 $0 0.00% $0 $0 0.00%
Town of Topsail Beach (DNS) X X X X X X X X X X X X X 0.00% $0 $0 $0 $0 $0 $0 $0 $0 0.00% $0 $0 0.00%
Town of Turkey X X X X X X X X X X X X X 0.00% $0 $0 $0 $0 $0 $0 $0 $0 0.00% $0 $0 0.00%
Town of Vass (DNS) X X X X X X X X X X X X X 0.00% $0 $0 $0 $0 $0 $0 $0 $0 0.00% $0 $0 0.00%
Town of Wagram (DNS) X X X X X X X X X X X X X 0.00% $0 $0 $0 $0 $0 $0 $0 $0 0.00% $0 $0 0.00%
Town of Wentworth X X X X X X X X X X X X X 0.00% $0 $0 $0 $0 $0 $0 $0 $0 0.00% $0 $0 0.00%
Town of White Lake X X X X X X X X X X X X X 0.00% $0 $0 $0 $0 $0 $0 $0 $0 0.00% $0 $0 0.00%
Town of Winterville (DNS) X X X X X X X X X X X X X 0.00% $0 $0 $0 $0 $0 $0 $0 $0 0.00% $0 $0 0.00%
Town of Zebulon (DNS) X X X X X X X X X X X X X 0.00% $0 $0 $0 $0 $0 $0 $0 $0 0.00% $0 $0 0.00%
Village of Alamance (DNS) X X X X X X X X X X X X X 0.00% $0 $0 $0 $0 $0 $0 $0 $0 0.00% $0 $0 0.00%
Village of Clemmons (DNS) X X X X X X X X X X X X X 0.00% $0 $0 $0 $0 $0 $0 $0 $0 0.00% $0 $0 0.00%
Village of Forest Hills (DNS) X X X X X X X X X X X X X 0.00% $0 $0 $0 $0 $0 $0 $0 $0 0.00% $0 $0 0.00%
Village of Tobaccoville X X X X X X X X X X X X X 0.00% $0 $0 $0 $0 $0 $0 $0 $0 0.00% $0 $0 0.00%
Village of Wesley Chapel (DNS) X X X X X X X X X X X X X 0.00% $0 $0 $0 $0 $0 $0 $0 $0 0.00% $0 $0 0.00%
TOTALS - - - - - - - - - - - - - 9.84% $10,670,531 $851,907 $285,546 $0 $0 $564,237 $0 $1,701,690 15.95% $19,768,573 $2,596,990 13.14%
% of HUB Participation 7.98% 2.68% 0.00% 0.00% 5.29% 0.00% 15.95% 13.14%
%of Minority Participation against Total HUB $ 50.06% 16.78% 0.00% 0.00% 33.16% 0.00%
LEGEND:
DNS-C - Categories with blanks or blank space indicate LEGEND: LEGEND:
entity "DID NOT SUBMIT" Construction Report MBE - Minority Business Enterprise B - Black
DNS-P - Categories with blanks or blank space indicate WBE - Woman Business Enterprise H - Hispanic
entity "DID NOT SUBMIT" Purchasing Report DBE-O- Disabled - Owned Business Enterprise AA - Asian-American
X - no reporting requirements DBE - Disabled Business Enterprise AI - American Indian
Note: NPWC - Non - profit Work Center for the Blind & Severely Disabled WF - White Female
1. When a construction project is finalized (submitted) by an entiity, HUBSCO system will update Sub - HUB Subcontractor SE - Socially and Economically Disadvantaged
to the relevant quarter when the project was completed
K:\Hubrpt_Purchase and Construction\FY'06-07\Quarter and Annual\06-07MNCPTY 3 - 2.8
Source:HUBSCO Construction Reporting System
Run Date: 07/11/2007

DEPARTMENT OF ADMINISTRATION
OFFICE FOR HISTORICALLY UNDERUTILIZED BUSINESSES
Purchasing and Construction Reports
Hospital Associations - 2nd Quarter 2006-07(Oct.1, 2006 - Dec. 31, 2006)
2nd Quarter 2006-07(Oct. 1 - Dec. 31, 2006)
1st Qtr
1st Qtr
Public Entity Type/Entity
To
tal
HU
B (
%)
To
tal
Pu
rch
asin
g($
)
MB
E (
$)
WB
E (
$)
DB
E-O
($)
DB
E (
$)
NP
WC
($)
Su
b (
$)
To
tal
HU
B (
$)
To
tal
HU
B (
%)
To
tal
Pu
rch
asin
g
($)
To
tal
HU
B (
$)
To
tal
HU
B (
%)
To
tal
HU
B (
%)
To
tal
Co
nst
ruct
ion
V
alu
e ($
)
B($
)
H($
)
AA
($)
AI(
$)
WF
($)
SE
($)
To
tal
HU
B (
$)
To
tal
HU
B (
%)
To
tal
Co
nst
ruct
ion
V
alu
e ($
)
To
tal
HU
B (
$)
To
tal
HU
B (
%)
HOSPITAL ASSOCIATIONSAlbemarle Hospital Authority (DNS-C) X X X X X X X X X X X X X 0.00% $0 $0 $0 $0 $0 $0 $0 $0 0.00% $313,447 $0 0.00%
Cape Fear Valley Health System (DNS-C) X X X X X X X X X X X X X 0.00% $0 $0 $0 $0 $0 $0 $0 $0 0.00% $0 $0 0.00%
Carteret County General Hospital Corporation (DNS-C) X X X X X X X X X X X X X 0.00% $0 $0 $0 $0 $0 $0 $0 $0 0.00% $0 $0 0.00%
Granville Medical Center (DNS-C) X X X X X X X X X X X X X 0.00% $0 $0 $0 $0 $0 $0 $0 $0 0.00% $0 $0 0.00%
Iredell Memorial Hospital, Incorporated (DNS-C) X X X X X X X X X X X X X 0.00% $0 $0 $0 $0 $0 $0 $0 $0 0.00% $0 $0 0.00%
New Hanover Health Network (DNS-C) X X X X X X X X X X X X X 2.90% $0 $0 $0 $0 $0 $0 $0 $0 0.00% $303,664 $8,815 2.90%
Stokes-Reynolds Memorial Hospital, Inc. X X X X X X X X X X X X X 0.00% $0 $0 $0 $0 $0 $0 $0 $0 0.00% $0 $0 0.00%
TOTALS - 1.43% $0 $0 $0 $0 $0 $0 $0 $0 0.00% $617,111 $8,815 1.43%
% of HUB Participation 1.43% 1.43%
%of Minority Participation against Total HUB $
LEGEND LEGEND: LEGEND:
MBE - Minority Business Enterprise B - Black
DNS-C - Categories with blanks or blank space indicate WBE - Woman Business Enterprise H - Hispanic
entity "DID NOT SUBMIT" Construction Report DBE-O- Disabled - Owned Business Enterprise AA - Asian-American
DNS-P - Categories with blanks or blank space indicate DBE - Disabled Business Enterprise AI - American Indian
entity "DID NOT SUBMIT" Purchasing Report NPWC - Non - profit Work Center for the Blind & Severely Disabled WF - White Female
X - no reporting requirements Sub - HUB Subcontractor SE - Socially and Economically Disadvantaged
Note:
1. When a construction project is finalized (submitted) by an entiity, HUBSCO system will update
to the relevant quarter when the project was completed
Year-to-Date2nd Quarter HUB Construction Report - Construction Projects2nd Quarter HUB Purchasing Report -
Goods and ServicesYear-to-Date
K:\Hubrpt_Purchase and Construction\FY'06-07\Quarter and Annual\06-07HA 3 - 2.9 Source:HUBSCO Construction Reporting SystemRun Date: 07/11/2007

NORTH CAROLINA DEPARTMENT OF ADMINISTRATION
OFFICE FOR HISTORICALLY UNDERUTILIZED BUSINESSES
Purchasing and Construction Reports
Non-St. Agencies and Public H. Authorities - 2nd Quarter 06-07(Oct. 1 - Dec. 31,06)
2nd Quarter 2006-07(Oct. 1 - Dec. 31, 2006)
1st Qtr
1st Qtr
Public Entity Type/Entity
To
tal
HU
B (
%)
To
tal
Pu
rch
asin
g($
)
MB
E (
$)
WB
E (
$)
DB
E-O
($)
DB
E (
$)
NP
WC
($)
Su
b (
$)
To
tal
HU
B (
$)
To
tal
HU
B (
%)
To
tal
Pu
rch
asin
g
($)
To
tal
HU
B (
$)
To
tal
HU
B (
%)
To
tal
HU
B (
%)
To
tal
Co
nst
ruct
ion
V
alu
e ($
)
B($
)
H($
)
AA
($)
AI(
$)
WF
($)
SE
($)
To
tal
HU
B (
$)
To
tal
HU
B (
%)
To
tal
Co
nst
ruct
ion
V
alu
e ($
)
To
tal
HU
B (
$)
To
tal
HU
B (
%)
NON-STATE AGENCIESGreenville Utilities (DNS-C) X X X X X X X X X X X X X 0.00% $0 $0 $0 $0 $0 $0 $0 $0 0.00% $0 $0 0.00%
Johnston County Public Utilities(DNS-C) X X X X X X X X X X X X X 0.00% $0 $0 $0 $0 $0 $0 $0 $0 0.00% $0 $0 0.00%
TOTALS - 0.00% $0 $0 $0 $0 $0 $0 $0 $0 0.00% $0 $0 0.00%
% of HUB Participation
%of Minority Participation against Total HUB $
PUBLIC HOUSING AUTHORITIESBurlington Housing Authority (DNS) X X X X X X X X X X X X X 0.00% $0 $0 $0 $0 $0 $0 $0 $0 0.00% $0 $0 0.00%Dunn Housing Authority (DNS-C) X X X X X X X X X X X X X 0.00% $0 $0 $0 $0 $0 $0 $0 $0 0.00% $0 $0 0.00%Forest City Housing Authority (DNS-C) X X X X X X X X X X X X X 0.00% $0 $0 $0 $0 $0 $0 $0 $0 0.00% $0 $0 0.00%Hickory Public Housing Authority (DNS-C) X X X X X X X X X X X X X 0.00% $0 $0 $0 $0 $0 $0 $0 $0 0.00% $0 $0 0.00%High Point Housing Authority (DNS-C) X X X X X X X X X X X X X 0.00% $0 $0 $0 $0 $0 $0 $0 $0 0.00% $0 $0 0.00%Lexington Housing Authority X X X X X X X X X X X X X 0.00% $68,714 $11,000 $0 $0 $0 $0 $0 $11,000 16.01% $257,479 $11,000 4.27%Mooresville Housing Authority (DNS-C) X X X X X X X X X X X X X 0.00% $0 $0 $0 $0 $0 $0 $0 $0 0.00% $0 $0 0.00%Mount Olive Housing Authority (DNS-C) X X X X X X X X X X X X X 0.00% $0 $0 $0 $0 $0 $0 $0 $0 0.00% $0 $0 0.00%Northwestern Regional Housing Authority X X X X X X X X X X X X X 0.00% $0 $0 $0 $0 $0 $0 $0 $0 0.00% $0 $0 0.00%Pembroke Housing Authority (DNS-C) X X X X X X X X X X X X X 0.00% $0 $0 $0 $0 $0 $0 $0 $0 0.00% $0 $0 0.00%Randleman Housing Authority X X X X X X X X X X X X X 0.00% $0 $0 $0 $0 $0 $0 $0 $0 0.00% $0 $0 0.00%Selma Housing Authority (DNS-C) X X X X X X X X X X X X X 0.00% $0 $0 $0 $0 $0 $0 $0 $0 0.00% $0 $0 0.00%Smithfield Housing Authority (DNS-C) X X X X X X X X X X X X X 0.00% $0 $0 $0 $0 $0 $0 $0 $0 0.00% $0 $0 0.00%
TOTALS - 0.00% $68,714 $11,000 $0 $0 $0 $0 $0 $11,000 16.01% $257,479 $11,000 4.27%% of HUB Participation 16.01% 0.00% 0.00% 0.00% 0.00% 0.00% 16.01% 4.27%
%of Minority Participation against Total HUB $ 100% 0.00% 0.00% 0.00% 0.00% 0.00%
LEGEND: LEGEND: LEGEND:
DNS-C - Categories with blanks or blank space indicate MBE - Minority Business Enterprise B - Black
entity "DID NOT SUBMIT" Construction Report WBE - Woman Business Enterprise H - Hispanic
DNS-P - Categories with blanks or blank space indicate DBE-O- Disabled - Owned Business Enterprise AA - Asian-American
entity "DID NOT SUBMIT" Purchasing Report DBE - Disabled Business Enterprise AI - American Indian
X - no reporting requirements NPWC - Non - profit Work Center for the Blind & Severely Disabled WF - White Female
Sub - HUB Subcontractor SE - Socially and Economically Disadvantaged
Note:
1. When a construction project is finalized (submitted) by an entiity, HUBSCO system will update
to the relevant quarter when the project was completed
Year-to-Date2nd Quarter HUB Construction Report - Construction Projects2nd Quarter HUB Purchasing Report -
Goods and ServicesYear-to-Date
K:\Hubrpt_Purchase and Construction\FY'06-07\Quarter and Annual\06-07NSA_PHA 3 - 2.10Source: HUBSCO Construction Reporting System
Run Date: 07/11/2007

NORTH CAROLINA DEPARTMENT OF ADMINISTRATION
OFFICE FOR HISTORICALLY UNDERUTILIZED BUSINESSES
Purchasing and Construction Reports
Water Sewer, and Airport Authorities - 2nd Quarter 06-07(Oct. 1 - Dec. 31, 2006)
2nd Quarter 2006-07(Oct. 1 - Dec. 31, 2006)
1st Qtr
1st Qtr
Public Entity Type/EntityT
ota
l H
UB
(%
)
To
tal
Pu
rch
as
ing
($)
MB
E (
$)
WB
E (
$)
DB
E-O
($
)
DB
E (
$)
NP
WC
($
)
Su
b (
$)
To
tal
HU
B (
$)
To
tal
HU
B (
%)
To
tal
Pu
rch
as
ing
($
)
To
tal
HU
B (
$)
To
tal
HU
B (
%)
To
tal
HU
B (
%)
To
tal
Co
ns
tru
cti
on
V
alu
e (
$)
B($
)
H($
)
AA
($)
AI(
$)
WF
($)
SE
($)
To
tal
HU
B (
$)
To
tal
HU
B (
%)
To
tal
Co
ns
tru
cti
on
V
alu
e (
$)
To
tal
HU
B (
$)
To
tal
HU
B (
%)
WATER AND SEWER AUTHORITIES Onslow Water and Sewer Authority X X X X X X X X X X X X X 0.00% $0 $0 $0 $0 $0 $0 $0 $0 0.00% $0 $0 0.00%
Piedmont Triad Regional Water Authority (DNS-C) X X X X X X X X X X X X X 0.00% $0 $0 $0 $0 $0 $0 $0 $0 0.00% $0 $0 0.00%
Sewerage District - Buncombe County Metropolitan X X X X X X X X X X X X X 0.00% $0 $0 $0 $0 $0 $0 $0 $0 0.00% $0 $0 0.00%
Water and Sewer Authority - Cabarrus County(DNS-C) X X X X X X X X X X X X X 0.00% $0 $0 $0 $0 $0 $0 $0 $0 0.00% $0 $0 0.00%
Water and Sewer Authority - Orange County (DNS-C) X X X X X X X X X X X X X 0.00% $0 $0 $0 $0 $0 $0 $0 $0 0.00% $0 $0 0.00%
TOTALS - 0.00% $0 $0 $0 $0 $0 $0 $0 $0 0.00% $0 $0 0.00%
% of HUB Participation 0.00% 0.00% 0.00% 0.00% 0.00% 0.00% 0.00% 0.00%
%of Minority Participation against Total HUB $ 0.00% 0.00% 0.00% 0.00% 0.00% 0.00% 0.00%
AIRPORT AUTHORITIES
Charlotte Douglas International Airport X X X X X X X X X X X X X 0.00% $234,182 $0 $0 $0 $0 $0 $0 $0 0.00% $1,285,012 $0 0.00%
Laurinburg-Maxton Airport Commission(DNS-C) X X X X X X X X X X X X X 0.00% $0 $0 $0 $0 $0 $0 $0 $0 0.00% $0 $0 0.00%
Piedmont Triad Airport Authority (DNS) X X X X X X X X X X X X X 0.00% $0 $0 $0 $0 $0 $0 $0 $0 0.00% $0 $0 0.00%
Raleigh-Durham Airport Authority (DNS-C) X X X X X X X X X X X X X 0.00% $0 $0 $0 $0 $0 $0 $0 $0 0.00% $0 $0 0.00%
TOTALS - - - - - - - - - - - - - 0.00% $234,182 $0 $0 $0 $0 $0 $0 $0 0.00% $1,285,012 $0 0.00%
% of HUB Participation 0.00% 0.00% 0.00% 0.00% 0.00% 0.00% 0.00% 0.00% 0.00% 0.00%
%of Minority Participation against Total HUB $ 0.00% 0.00% 0.00% 0.00% 0.00% 0.00% 0.00%
LEGEND: LEGEND:
LEGEND: MBE - Minority Business Enterprise B - Black
DNS-C - Categories with blanks or blank space indicate WBE - Woman Business Enterprise H - Hispanic
entity "DID NOT SUBMIT" Construction Report DBE-O- Disabled - Owned Business Enterprise AA - Asian-American
DNS-P - Categories with blanks or blank space indicate DBE - Disabled Business Enterprise AI - American Indian
entity "DID NOT SUBMIT" Purchasing Report NPWC - Non - profit Work Center for the Blind & Severely Disabled WF - White Female
X - no reporting requirements Sub - HUB Subcontractor SE - Socially and Economically Disadvantaged
Note:
1. When a construction project is finalized (submitted) by an entiity, HUBSCO system will update
to the relevant quarter when the project was completed
Year-to-Date2nd Quarter HUB Construction Report -
Construction Projects2nd Quarter HUB Purchasing Report -Goods
and ServicesYear-to-Date
K:\Hubrpt_Purchase and Construction\FY'06-07\Quarter and Annual\06-07WS_AA 3 - 2.11 Source: HUBSCO Construction Reporting SystemRun Date: 07/11/2007

State of North Carolina Department of Administration
OFFICE FOR HISTORICALLY UNDERUTILIZED BUSINESSES (HUB)
PURCHASING (GOODS and SERVICES) and CONSTRUCTION REPORT
3rd Quarter FY 06 - 07 (January 1, 2007 – March 31, 2007)
State of North Carolina
Michael F. Easley, Governor
N.C. Department of Administration Britt Cobb, Secretary
Office for Historically Underutilized Businesses
Bridget L. Wall, Assistant to Secretary for HUB Outreach Rick Baskett Sr., Deputy Director
Mathew Idiculla, Compliance Specialist
Prepared by: Office for Historically Underutilized Businesses 116 West Jones Street, Suite 2109 Raleigh, NC 27603

NORTH CAROLINA DEPARTMENT OF ADMINISTRATION
OFFICE FOR HISTORICALLY UNDERUTILIZED BUSINESSES
Purchasing and Construction Reports
SUMMARY - 3rd Quarter 2006-07(Jan. 1, 2007 - March. 31, 2007)
3rd Quarter 2006-07(Jan.1 - March 31, 2007)
1st Qtr
2nd Qtr
1st Qtr
2ndQtr
To
talH
UB
(%)
To
talH
UB
(%)
To
tal
Pu
rch
as
ing
($)
MB
E (
$)
WB
E (
$)
DB
E-O
($
)
DB
E (
$)
NP
WC
($
)
Su
b (
$)
To
tal
HU
B (
$)
To
tal
HU
B (
%)
To
tal
Pu
rch
as
ing
($
)
To
tal
HU
B (
$)
To
tal
HU
B (
%)
To
talH
UB
(%)
To
talH
UB
(%)
To
tal
Co
ns
tru
cti
on
($
)
B($
)
H($
)
AA
($)
AI(
$)
WF
($)
SE
($)
To
tal
HU
B (
$)
To
tal
HU
B (
%)
To
tal
Co
ns
tru
cti
on
($
)
To
tal
HU
B (
$)
To
tal
HU
B (
%)
CABINET AGENCIES 9.68% 9.14% $253,461,340 $7,047,325 $13,099,158 $403,605 $144,189 $0 $0 $20,694,277 8.16% $816,970,539 $73,870,849 9.04% 0.00% 5.95% $4,012,203 $35,866 $0 $0 $0 $552,315 $7,500 $595,681 14.85% $6,491,989 $686,556 10.58%
COUNCIL AGENCIES 3.29% 11.56% $47,114,500 $3,358,114 $1,689,329 $70,483 $241 $0 $0 $5,118,167 10.86% $160,860,582 $11,648,449 7.24% 0.00% 0.00% $0 $0 0.00%
SUPPORTING AGENCIES 17.26% 16.40% $29,912,174 $1,098,259 $5,647,172 $83,829 $0 $346,190 $0 $7,175,450 23.99% $99,862,753 $18,966,623 18.99% 3.81% 0.00% $4,888,773 $186,492 3.81%
COMMUNITY COLLEGES 6.30% 8.49% $88,837,977 $1,345,623 $5,128,103 $484,216 $80,041 $104,395 $1,560 $7,143,938 8.04% $248,461,451 $18,926,905 7.62% 28.82% 21.38% $7,668,517 $26,841 $0 $0 $0 $625,214 $0 $652,055 8.50% $35,465,481 $7,113,098 20.06%
PUBLIC SCHOOLS 9.91% 7.40% $406,010,358 $10,177,811 $19,885,690 $1,775,474 $421,069 $187,737 $559,786 $33,007,567 8.13% $1,269,005,649 $108,983,831 8.59% 13.85% 15.99% $37,142,668 $247,952 $47,113 $0 $0 $1,881,032 $0 $2,176,097 5.86% $131,049,965 $15,916,451 12.15%
STATE UNIVERSITIES 4.44% 5.53% $275,912,948 $6,194,187 $4,594,876 $257,597 $4,135 $38,958 $1,181,094 $12,270,846 4.45% $801,721,042 $37,829,380 4.72% 12.90% 13.31% $61,705,567 $1,170,535 $388,821 $192,168 $27,748 $8,025,619 $0 $9,804,891 15.89% $272,789,354 $37,284,924 13.67%
Grand Totals 8.09% 8.00% $1,101,249,297 $29,221,319 $50,044,328 $3,075,204 $649,675 $677,280 $1,742,440 $85,410,245 7.76% $3,396,882,015 $270,226,036 7.96% 12.93% 15.63% $126,765,001 $1,935,630 $440,892 $323,467 $283,572 $11,713,408 $7,500 $14,704,469 11.60% $521,509,469 $69,802,861 13.38%
% of HUB Participation 2.65% 4.54% 0.28% 0.06% 0.06% 0.16% 7.76% 7.96% 1.53% 0.35% 0% 0.22% 9.24% 0.01% 11.60% 13.38%
%of Minority Participation against Total HUB $ 34.21% 58.59% 3.60% 0.76% 0.79% 2.04% 13.16% 3.00% 2% 1.93% 79.66% 0.05%
$33,007,567
LEGEND: LEGEND: LEGEND:
MBE - Minority Business Enterprise B - Black
X - no reporting requirements WBE - Woman Business Enterprise H - Hispanic
DBE-O- Disabled - Owned Business Enterprise AA - Asian-American
DBE - Disabled Business Enterprise AI - American Indian
NPWC - Non - profit Work Center for the Blind & Severely Disabled WF - White Female
Sub - HUB Subcontractor SE - Socially and Economically Disadvantaged
Note:
1. When a construction project is finalized (submitted) by an entiity, HUBSCO system will update
to the relevant quarter when the project was completed
Year-to-Date3rd Quarter HUB Construction Report - Construction Projects3rd Quarter HUB Purchasing Report - Goods and Services Year-to-Date
K:\Hubrpt_Purchase and Construction\FY'06-07\Quarter and Annual\06-07summary 3 - 3.0 Source: HUB Purchasing Report Database and HUBSCO Construction Reporting SystemRun Date: 7/12/2007

NORTH CAROLINA DEPARTMENT OF ADMINISTRATION
OFFICE FOR HISTORICALLY UNDERUTILIZED BUSINESSES
Purchasing and Construction Reports
CABINET AGENCIES - 3rd Quarter 2006-07(Jan. 1, 2007 - March. 31, 2007)
3rd Quarter 2006-07(Jan.1 - March 31, 2007)
1st Qtr
1st Qtr
2ndQtr
Public Entity Type/Entity
To
talH
UB
(%)
To
talH
UB
(%)
To
tal
Pu
rch
asin
g($
)
MB
E (
$)
WB
E (
$)
DB
E-O
($)
DB
E (
$)
NP
WC
($)
Su
b (
$)
To
tal H
UB
($)
To
tal H
UB
(%
)
To
tal
Pu
rch
asin
g (
$)
To
tal H
UB
($)
To
tal H
UB
(%
)
To
talH
UB
(%)
To
talH
UB
(%)
To
tal
Co
nst
ruct
ion
($)
B($
)
H($
)
AA
($)
AI(
$)
WF
($)
SE
($)
To
tal H
UB
($)
To
tal H
UB
(%
)
To
tal
Co
nst
ruct
ion
($)
To
tal H
UB
($)
To
tal H
UB
(%
)
CABINET AGENCIESNC Crime Control & Public Safety - Army NationalGuard(DNS-C) 3.15% 7.92% $5,517,633 $841,226 $206,904 $0 $0 $0 $0 $1,048,130 19.00% $47,293,962 $3,555,868 7.52% 0.00% 0.00% $0 $0 $0 $0 $0 $0 $0 $0 0.00% $163,000 $0 0.00%
NC Department of Administraton 29.84% 2.33% $21,969,084 $315,513 $20,865 $0 $0 $0 $0 $336,378 1.53% $41,281,039 $2,628,207 6.37% - - - - - - - - - - - - - -
State Construction Office X X X X X X X X X X X X X X X X X X X X X X X X X X X X X
NC Department of Correction(DNS-C) 13.65% 19.48% $68,259,565 $2,500,530 $4,925,425 $304,094 $18,205 $0 $0 $7,748,254 11.35% $195,475,072 $27,690,343 14.17% 0.00% 0.00% $64,480 $0 $0 $0 $0 $0 $0 $0 0.00% $617,425 $0 0.00%
NC Department of Commerce (DNS-C) 66.96% 17.12% $3,637,610 $458,681 $709,828 $0 $0 $0 $0 $1,168,509 32.12% $12,515,175 $6,289,785 50.26% 0.00% 0.00% $0 $0 $0 $0 $0 $0 $0 $0 0.00% $0 $0 0.00%
NC Department of Cultural Resources(DNS-C) 19.89% 16.29% $895,077 $49,216 $53,764 $836 $5 $0 $0 $103,821 11.60% $2,945,073 $478,073 16.23% 0.00% 0.00% $0 $0 $0 $0 $0 $0 $0 $0 0.00% $0 $0 0.00%
NC Department of Environment and Natural Resources 4.18% 10.94% $32,510,351 $1,012,602 $1,096,124 $22,162 $0 $0 $0 $2,130,888 6.55% $103,263,968 $7,080,427 6.86% 0.00% 6.90% $191,400 $35,866 $0 $0 $0 $65,981 $7,500 $109,347 57.13% $1,624,229 $200,222 12.33%
NC Department of Health and Human Services 10.29% 11.57% $35,935,783 $741,798 $2,821,304 $62,713 $364 $0 $0 $3,626,179 10.09% $115,402,029 $12,224,901 10.59% 0.00% 0.00% $1,898,381 $0 $0 $0 $0 $457,596 $0 $457,596 24.10% $1,898,381 $457,596 24.10%
NC Department of Juvenile Justice & Delinquency Prevention(DNS-C) 13.31% 1.35% $3,710,877 $94,463 $191,124 $13,800 $0 $0 $0 $299,387 8.07% $22,492,771 $747,376 3.32% 0.00% 0.00% $0 $0 $0 $0 $0 $0 $0 $0 0.00% $0 $0 0.00%
NC Department of Revenue(DNS-C) 15.37% 18.50% $1,838,880 $158,131 $113,564 $0 $0 $0 $0 $271,695 14.78% $5,533,787 $913,667 16.51% 0.00% 0.00% $0 $0 $0 $0 $0 $0 $0 $0 0.00% $0 $0 0.00%
NC Department of Transportation(DNS-C) 4.06% 4.67% $79,186,480 $875,165 $2,960,256 $0 $125,615 $0 $0 $3,961,036 5.00% $270,767,663 $12,262,201 4.53% 0.00% 0.00% $0 $0 $0 $0 $0 $0 $0 $0 0.00% $0 $0 0.00%
TOTALS 9.68% 9.14% $253,461,340 $7,047,325 $13,099,158 $403,605 $144,189 $0 $0 $20,694,277 8.16% $816,970,539 $73,870,848 9.04% 0.00% 6.90% $2,154,261 $35,866 $0 $0 $0 $523,577 $7,500 $566,943 26.32% $4,303,035 $657,818 15.29%
% of HUB Participation 2.78% 5.17% 0.16% 0.06% 0.00% 0.00% 8.16% 9.04% 1.66% 0.00% 0.00% 0.00% 24.30% 0.35% 26.32% 15.29%
%of Minority Participation against Total HUB $ 34.05% 63.30% 1.95% 0.70% 0.00% 0.00% 6.33% 0.00% 0.00% 0.00% 92.35% 1.32%
LEGEND: LEGEND: LEGEND:
DNS-C - Categories with blanks or blank space indicate MBE - Minority Business Enterprise B - Black
entity "DID NOT SUBMIT" Construction Report WBE - Woman Business Enterprise H - Hispanic
DNS-P - Categories with blanks or blank space indicate DBE-O- Disabled - Owned Business Enterprise AA - Asian-American
entity "DID NOT SUBMIT" Purchasing Report DBE - Disabled Business Enterprise AI - American Indian
X - no reporting requirements NPWC - Non - profit Work Center for the Blind & Severely Disabled WF - White Female
Sub - HUB Subcontractor SE - Socially and Economically Disadvantaged
Note:
1. When a construction project is finalized (submitted) by an entiity, HUBSCO system will update
to the relevant quarter when the project was completed
2nd Qtr
3rd Quarter HUB Purchasing Report - Goods and Services Year-to-Date Year-to-Date3rd Quarter HUB Construction Report - Construction Projects
K:\Hubrpt_Purchase and Construction\FY'06-07\Quarter and Annual\06-07CA 3 - 3.1 Source: HUB Purchasing Report Database and HUBSCO Construction Reporting SystemRun Date: 7/12/2007
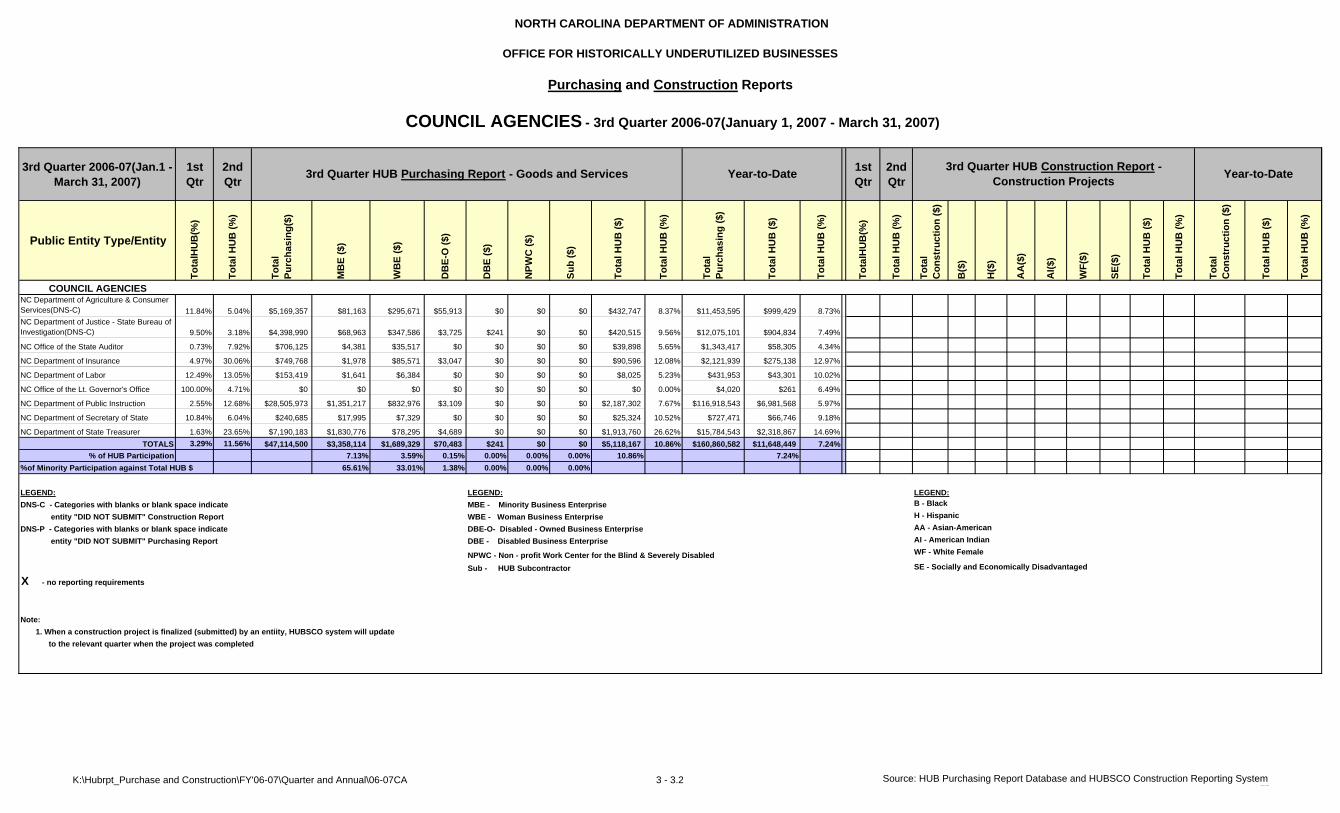
NORTH CAROLINA DEPARTMENT OF ADMINISTRATION
OFFICE FOR HISTORICALLY UNDERUTILIZED BUSINESSES
Purchasing and Construction Reports
COUNCIL AGENCIES - 3rd Quarter 2006-07(January 1, 2007 - March 31, 2007)
3rd Quarter 2006-07(Jan.1 - March 31, 2007)
1st Qtr
2nd Qtr
1st Qtr
2ndQtr
Public Entity Type/Entity
To
talH
UB
(%)
To
tal H
UB
(%
)
To
tal
Pu
rch
as
ing
($)
MB
E (
$)
WB
E (
$)
DB
E-O
($)
DB
E (
$)
NP
WC
($)
Su
b (
$)
To
tal H
UB
($)
To
tal H
UB
(%
)
To
tal
Pu
rch
asin
g (
$)
To
tal H
UB
($)
To
tal H
UB
(%
)
To
talH
UB
(%)
To
tal H
UB
(%
)
To
tal
Co
nst
ruct
ion
($)
B($
)
H($
)
AA
($)
AI(
$)
WF
($)
SE
($)
To
tal H
UB
($)
To
tal H
UB
(%
)
To
tal
Co
nst
ruct
ion
($)
To
tal H
UB
($)
To
tal H
UB
(%
)
COUNCIL AGENCIESNC Department of Agriculture & Consumer Services(DNS-C) 11.84% 5.04% $5,169,357 $81,163 $295,671 $55,913 $0 $0 $0 $432,747 8.37% $11,453,595 $999,429 8.73% 0.00% 0.00% $0 $0 $0 $0 $0 $0 $0 $0 $0 $0 $0 0.00%NC Department of Justice - State Bureau of Investigation(DNS-C) 9.50% 3.18% $4,398,990 $68,963 $347,586 $3,725 $241 $0 $0 $420,515 9.56% $12,075,101 $904,834 7.49% 0.00% 0.00% $0 $0 $0 $0 $0 $0 $0 $0 $0 $0 $0 0.00%
NC Office of the State Auditor 0.73% 7.92% $706,125 $4,381 $35,517 $0 $0 $0 $0 $39,898 5.65% $1,343,417 $58,305 4.34% X X X X X X X X X X X X X XNC Department of Insurance 4.97% 30.06% $749,768 $1,978 $85,571 $3,047 $0 $0 $0 $90,596 12.08% $2,121,939 $275,138 12.97% X X X X X X X X X X X X X XNC Department of Labor 12.49% 13.05% $153,419 $1,641 $6,384 $0 $0 $0 $0 $8,025 5.23% $431,953 $43,301 10.02% X X X X X X X X X X X X X XNC Office of the Lt. Governor's Office 100.00% 4.71% $0 $0 $0 $0 $0 $0 $0 $0 0.00% $4,020 $261 6.49% X X X X X X X X X X X X X XNC Department of Public Instruction 2.55% 12.68% $28,505,973 $1,351,217 $832,976 $3,109 $0 $0 $0 $2,187,302 7.67% $116,918,543 $6,981,568 5.97% X X X X X X X X X X X X X XNC Department of Secretary of State 10.84% 6.04% $240,685 $17,995 $7,329 $0 $0 $0 $0 $25,324 10.52% $727,471 $66,746 9.18% X X X X X X X X X X X X X XNC Department of State Treasurer 1.63% 23.65% $7,190,183 $1,830,776 $78,295 $4,689 $0 $0 $0 $1,913,760 26.62% $15,784,543 $2,318,867 14.69% X X X X X X X X X X X X X X
TOTALS 3.29% 11.56% $47,114,500 $3,358,114 $1,689,329 $70,483 $241 $0 $0 $5,118,167 10.86% $160,860,582 $11,648,449 7.24% 0.00% 0.00% $0 $0 $0 $0 $0 $0 $0 $0 0.00% $0 $0 0.00%
% of HUB Participation 7.13% 3.59% 0.15% 0.00% 0.00% 0.00% 10.86% 7.24% 0.00%
%of Minority Participation against Total HUB $ 65.61% 33.01% 1.38% 0.00% 0.00% 0.00%
LEGEND: LEGEND: LEGEND:
DNS-C - Categories with blanks or blank space indicate MBE - Minority Business Enterprise B - Black
entity "DID NOT SUBMIT" Construction Report WBE - Woman Business Enterprise H - Hispanic
DNS-P - Categories with blanks or blank space indicate DBE-O- Disabled - Owned Business Enterprise AA - Asian-American
entity "DID NOT SUBMIT" Purchasing Report DBE - Disabled Business Enterprise AI - American Indian
NPWC - Non - profit Work Center for the Blind & Severely Disabled WF - White Female
Sub - HUB Subcontractor SE - Socially and Economically Disadvantaged
X - no reporting requirements
Note:
1. When a construction project is finalized (submitted) by an entiity, HUBSCO system will update
to the relevant quarter when the project was completed
Year-to-Date3rd Quarter HUB Construction Report -
Construction Projects3rd Quarter HUB Purchasing Report - Goods and Services Year-to-Date
K:\Hubrpt_Purchase and Construction\FY'06-07\Quarter and Annual\06-07CA 3 - 3.2 Source: HUB Purchasing Report Database and HUBSCO Construction Reporting SystemRun Date: 7/11/2007

NORTH CAROLINA DEPARTMENT OF ADMINISTRATION
OFFICE FOR HISTORICALLY UNDERUTILIZED BUSINESSES
Purchasing and Construction Reports
Supporting Agencies - 3rd Quarter 2006-07(Jan. 1, 2007 - March. 31, 2007)
3rd Quarter 2006-07(Jan.1 - March 31, 2007)
1st Qtr
2nd Qtr
1st Qtr
2ndQtr
Public Entity Type/Entity
To
tal H
UB
(%
)
To
tal H
UB
(%
)
To
tal
Pu
rch
asin
g($
)
MB
E (
$)
WB
E (
$)
DB
E-O
($)
DB
E (
$)
NP
WC
($)
Su
b (
$)
To
tal H
UB
($)
To
tal H
UB
(%
)
To
tal
Pu
rch
asin
g (
$)
To
tal H
UB
($)
To
tal H
UB
(%
)
To
tal H
UB
(%
)
To
tal H
UB
(%
)
To
tal
Co
nst
ruct
ion
($
)
B($
)
H($
)
AA
($)
AI(
$)
WF
($)
SE
($)
To
tal H
UB
($)
To
tal H
UB
(%
)
To
tal
Co
nst
ruct
ion
($
)
To
tal H
UB
($)
To
tal H
UB
(%
)
SUPPORTING AGENCIESNC Office of Information Technology Services(DNS-C) 10.51% 13.90% $8,891,663 $62,199 $2,571,650 $54,251 $0 $346,190 $0 $3,034,290 34.13% $28,029,109 $5,358,729 19.12% 0.00% 0.00% $0 $0 $0 $0 $0 $0 $0 $0 0.00% $0 $0 0.00%NCDENR - Wildlife Resources Commission
15.29% 12.01% $2,716,445 $24,616 $186,489 $26,000 $0 $0 $0 $237,105 8.73% $8,601,269 $1,000,039 11.63% 3.81% 0.00% $0 $0 $0 $0 $0 $0 $0 $0 0.00% $4,888,773 $186,492 3.81%North Carolina State Ports Authority 1.82% 1.13% $716,791 $1,220 $517 $0 $0 $0 $0 $1,737 0.24% $6,194,642 $82,945 1.34% 0.00% 0.00% $0 $0 $0 $0 $0 $0 $0 $0 0.00% $0 $0 0.00%
Administrative Hearings 43.53% 7.71% $25,683 $17,036 $1,710 $0 $0 $0 $0 $18,746 72.99% $44,536 $24,163 54.25% X X X X X X X X X X X X X XAdmin. Office of the Courts 43.17% 10.09% $2,732,067 $370,276 $384,715 $0 $0 $0 $0 $754,991 27.63% $16,072,130 $4,453,830 27.71% X X X X X X X X X X X X X XBoard of Elections 33.46% 5.30% $488,454 $8,010 $462 $888 $0 $0 $0 $9,360 1.92% $1,389,009 $260,903 18.78% X X X X X X X X X X X X X XNC Community College System 3.66% 1.96% $5,261,250 $18,346 $68,492 $0 $0 $0 $0 $86,838 1.65% $15,516,962 $393,295 2.53% X X X X X X X X X X X X X XEmployment Security Comm. 10.39% 7.24% $1,929,345 $151,840 $114,862 $0 $0 $0 $0 $266,702 13.82% $4,390,098 $488,256 11.12% X X X X X X X X X X X X X XGeneral Assembly 4.19% 3.29% $667,119 $0 $6,449 $2,690 $0 $0 $0 $9,139 1.37% $1,525,455 $41,961 2.75% X X X X X X X X X X X X X XNC Institute of Min. Econ. Dev. 69.86% 77.97% $288,826 $182,228 $8,960 $0 $0 $0 $0 $191,188 66.19% $841,854 $602,892 71.61% X X X X X X X X X X X X X XRural Economic Development 9.71% 17.24% $450,188 $79,544 $2,728 $0 $0 $0 $0 $82,272 18.28% $1,290,523 $191,848 14.87% X X X X X X X X X X X X X XOffice of State Controller 0.42% 1.86% $2,651,386 $147,705 $27,165 $0 $0 $0 $0 $174,870 6.60% $4,719,935 $195,170 4.14% X X X X X X X X X X X X X XNC Education Lottery 24.01% 67.64% $3,092,958 $35,240 $2,272,973 $0 $0 $0 $0 $2,308,213 74.63% $11,247,231 $5,872,593 52.21% X X X X X X X X X X X X X X
TOTALS 17.26% 16.40% $29,912,175 $1,098,260 $5,647,172 $83,829 $0 $346,190 $0 $7,175,451 23.99% $99,862,753 $18,966,624 18.99% 3.81% 0.00% $0 $0 $0 $0 $0 $0 $0 $0 0.00% $4,888,773 $186,492 3.81%
% of HUB Participation 3.67% 18.88% 0.28% 0.00% 1.16% 0.00% 23.99% 18.99% 0.00% 0.00% 0.00% 0.00% 0.00% 0.00% 0.00% 3.81%
%of Minority Participation against Total HUB $ 15.31% 78.70% 1.17% 0.00% 4.82% 0.00% 0.00% 0.00% 0.00% 0.00% 0.00% 0.00%
LEGEND:
DNS-C - Categories with blanks or blank space indicate LEGEND: LEGEND:
entity "DID NOT SUBMIT" Construction Report MBE - Minority Business Enterprise B - Black
DNS-P - Categories with blanks or blank space indicate WBE - Woman Business Enterprise H - Hispanic
entity "DID NOT SUBMIT" Purchasing Report DBE-O- Disabled - Owned Business Enterprise AA - Asian-American
X - no reporting requirements DBE - Disabled Business Enterprise AI - American Indian
NPWC - Non - profit Work Center for the Blind & Severely Disabled WF - White Female
Note: Sub - HUB Subcontractor SE - Socially and Economically Disadvantaged
1. When a construction project is finalized (submitted) by an entiity, HUBSCO system will update
to the relevant quarter when the project was completed
Year-to-Date3rd Quarter HUB Construction Report - Construction
Projects3rd Quarter HUB Purchasing Report - Goods and Services Year-to-Date
K:\Hubrpt_Purchase and Construction\FY'06-07\Quarter and Annual\06-07SA 3 - 3.3 Source:HUB Purchasing Report Database and HUBSCO Construction Reporting SystemRun date: 7/11/2007

NORTH CAROLINA DEPARTMENT OF ADMINISTRATIONOFFICE FOR HISTORICALLY UNDERUTILIZED BUSINESSES
Purchasing and Construction Reports - Community Colleges - 3rd Quarter 2006-07(Jan. 1, 2007 - March 31, 2007)
3rd Quarter 2006-07(Jan.1 - March 31,
2007)
1st Qtr
2nd Qtr
1st Qtr
2nd Qtr
Public Entity Type/Entity
To
tal H
UB
(%
)
To
tal H
UB
(%
)
To
tal
Pu
rch
as
ing
($)
MB
E (
$)
WB
E (
$)
DB
E-O
($)
DB
E (
$)
NP
WC
($)
Su
b (
$)
To
tal H
UB
($)
To
tal H
UB
(%
)
To
tal
Pu
rch
as
ing
($)
To
tal H
UB
($)
To
tal H
UB
(%
)
To
tal H
UB
(%
)
To
tal H
UB
(%
)
To
tal
Co
ns
tru
cti
on
($
)
B($
)
H($
)
AA
($)
AI(
$)
WF
($)
SE
($)
To
tal H
UB
($)
To
tal H
UB
(%
)
To
tal
Co
ns
tru
cti
on
($
)
To
tal H
UB
($)
To
tal H
UB
(%
)
COMMUNITY COLLEGESAlamance Community College 2.12% 2.99% $2,083,267 $1,401 $35,040 $5,190 $0 $0 $0 $41,632 2.00% $5,037,964 $120,653 2.39% 0.00% 4.88% $88,092 $0 $0 $0 $0 $6,012 $0 $6,012 6.82% $109,498 $7,057 6.44%
Anson/South Piedmont Community College(DNS-C) 6.53% 8.76% $1,264,733 $308 $73,416 $0 $0 $0 $0 $73,724 5.83% $3,124,255 $216,663 6.93%
0.00% 0.00% $0 $0 $0 $0 $0 $0 $0 $0 0.00% $0 $0 0.00%
Asheville-Buncombe Technical Community College 3.00% 9.09% $2,684,356 $11,541 $148,295 $536 $0 $8,732 $0 $169,104 6.30% $6,243,506 $344,473 5.52%
0.00% 6.19% $0 $0 $0 $0 $0 $0 $0 $0 0.00% $2,823,241 $174,854 6.19%
Beaufort County Community College 15.14% 5.99% $541,905 $3,867 $33,731 $302 $206 $0 $0 $38,106 7.03% $1,832,687 $178,758 9.75% 0.00% 0.00% $0 $0 $0 $0 $0 $0 $0 $0 0.00% $0 $0 0.00%
Bladen Community College(DNS-C) 4.67% 6.87% $425,357 $2,618 $17,263 $0 $0 $0 $0 $19,881 4.67% $927,507 $46,673 5.03% 0.00% 0.00% $0 $0 $0 $0 $0 $0 $0 $0 0.00% $0 $0 0.00%
Blue Ridge Community College(DNS-C) 5.47% 2.61% $2,506,680 $1,653 $7,022 $7,172 $14,112 $0 $0 $29,958 1.20% $5,408,121 $135,334 2.50%
0.00% 0.00% $0 $0 $0 $0 $0 $0 $0 $0 0.00% $0 $0 0.00%
Brunswick Community College 3.32% 3.88% $818,738 $3,133 $18,911 $0 $62 $0 $0 $22,106 2.70% $2,391,949 $78,138 3.27% 0.00% 0.00% $0 $0 $0 $0 $0 $0 $0 $0 0.00% $0 $0 0.00%
Caldwell Community College & Technical Institute(DNS-C) 7.90% 6.56% $2,066,893 $1,931 $40,207 $596 $0 $0 $0 $42,734 2.07% $6,575,882 $383,472 5.83%
0.00% 0.00% $5,972,298 $0 $0 $0 $0 $420,525 $0 $420,525 7.04% $7,374,014 $420,525 5.70%
Cape Fear Community College 9.96% 6.61% $2,269,302 $30,313 $199,928 $2,336 $5,712 $434 $0 $238,722 10.52% $6,572,131 $589,736 8.97% 0.00% 0.00% $0 $0 $0 $0 $0 $0 $0 $0 0.00% $0 $0 0.00%
Carteret Community College(DNS-C) 1.47% 4.53% $635,179 $15,755 $12,872 $0 $0 $0 $0 $28,627 4.51% $1,878,344 $67,444 3.59% 0.00% 0.00% $0 $0 $0 $0 $0 $0 $0 $0 0.00% $0 $0 0.00%
Catawba Valley Community College(DNS-C) 1.27% 4.00% $1,769,325 $8,808 $119,936 $13,655 $0 $0 $0 $142,399 8.05% $4,663,481 $215,981 4.63%
0.00% 0.00% $0 $0 $0 $0 $0 $0 $0 $0 0.00% $0 $0 0.00%
Central Carolina Community College 3.95% 4.52% $1,539,582 $30,637 $83,094 $753 $0 $11,974 $1,560 $128,018 8.32% $6,637,325 $340,529 5.13% 0.00% 0.00% $0 $0 $0 $0 $0 $0 $0 $0 0.00% $0 $0 0.00%
Central Piedmont Community College(DNS-C) 28.45% 28.79% $4,246,091 $324,159 $904,252 $20,059 $0 $0 $0 $1,248,470 29.40% $11,322,622 $3,274,346 28.92%
0.00% 0.00% $0 $0 $0 $0 $0 $0 $0 $0 0.00% $0 $0 0.00%
Cleveland Community College(DNS-C)
2.26% 4.87% $857,007 $94 $32,897 $0 $0 $0 $0 $32,991 3.85% $2,159,840 $82,827 3.83%
0.00% 0.00% $0 $0 $0 $0 $0 $0 $0 $0 0.00% $0 $0 0.00%
Coastal Carolina Community College 3.03% 15.17% $2,006,284 $20,566 $36,888 $0 $0 $156 $0 $57,610 2.87% $4,170,957 $231,031 5.54% 0.00% 0.00% $0 $0 $0 $0 $0 $0 $0 $0 0.00% $0 $0 0.00%
College of The Albemarle(DNS-C) 1.54% 1.71% $781,727 $1,179 $10,822 $0 $0 $0 $0 $12,001 1.54% $2,127,881 $34,025 1.60% 0.00% 0.00% $0 $0 $0 $0 $0 $0 $0 $0 0.00% $298,549 $0 0.00%
Craven Community College 3.78% 4.44% $992,703 $15,529 $30,992 $603 $41,200 $0 $0 $88,324 8.90% $2,949,012 $168,398 5.71% 0.00% 0.00% $0 $0 $0 $0 $0 $0 $0 $0 0.00% $0 $0 0.00%
Davidson County Community College(DNS-C) 6.81% 6.93% $1,673,367 $3,140 $253,206 $302 $0 $185 $0 $256,833 15.35% $4,689,441 $464,330 9.90%
0.00% 0.00% $0 $0 $0 $0 $0 $0 $0 $0 0.00% $0 $0 0.00%
Durham Technical Community College
7.66% 9.38% $3,162,285 $82,772 $151,574 $6,036 $0 $0 $0 $240,382 7.60% $7,277,087 $593,441 8.15%
8.72% 0.00% $0 $0 $0 $0 $0 $0 $0 $0 0.00% $587,519 $51,247 8.72%
Edgecombe Community College(DNS-C) 9.74% 6.40% $692,378 $19,775 $69,029 $0 $0 $0 $0 $88,804 12.83% $1,954,377 $190,395 9.74%
0.00% 0.00% $0 $0 $0 $0 $0 $0 $0 $0 0.00% $0 $0 0.00%
Fayetteville Technical Community College 3.78% 7.58% $2,645,030 $87,849 $141,952 $0 $0 $0 $0 $229,801 8.69% $10,408,167 $609,061 5.85%
0.00% 24.25% $26,350 $0 $0 $0 $0 $0 $0 $0 0.00% $4,199,962 $1,012,219 24.10%
Forsyth Technical Community College
8.47% 6.96% $3,121,284 $38,051 $184,707 $44,416 $0 $0 $0 $267,174 8.56% $9,177,696 $738,091 8.04%
100% 0.00% $333,021 $0 $0 $0 $0 $0 $0 $0 0.00% $380,857 $47,835 12.56%
Gaston College(DNS-C) 4.45% 11.58% $1,844,474 $8,064 $85,168 $0 $176 $0 $0 $93,407 5.06% $5,092,835 $362,237 7.11% 0.00% 1.20% $102,000 $0 $0 $0 $0 $0 $0 $0 0.00% $3,313,502 $37,622 1.14%
Guilford Technical Community College
5.46% 6.96% $4,707,699 $83,460 $127,991 $3,344 $0 $28,672 $0 $243,468 5.17% $13,025,338 $742,940 5.70%
14.48% 1.09% $773,919 $0 $0 $0 $0 $117,997 $0 $117,997 15.25% $4,062,658 $471,079 11.60%
Halifa# Community College(DNS-C) 1.47% 3.31% $469,665 $7,025 $2,624 $0 $0 $0 $0 $9,649 2.05% $1,227,269 $27,562 2.25% 0.00% 0.00% $0 $0 $0 $0 $0 $0 $0 $0 0.00% $0 $0 0.00%
Haywood Community College(DNS-C)
1.16% 1.55% $1,348,146 $168 $34,513 $0 $0 $0 $0 $34,681 2.57% $3,483,373 $65,157 1.87%
0.00% 0.00% $0 $0 $0 $0 $0 $0 $0 $0 0.00% $0 $0 0.00%
Isothermal Community College(DNS-C)
4.66% 4.92% $1,011,158 $268 $32,031 $0 $0 $1,078 $0 $33,377 3.30% $2,740,516 $116,920 4.27%
0.00% 0.00% $0 $0 $0 $0 $0 $0 $0 $0 0.00% $0 $0 0.00%
James Sprunt Community College(DNS-C) 8.83% 6.99% $465,936 $2,552 $21,682 $0 $405 $75 $0 $24,714 5.30% $1,247,996 $86,259 6.91%
0.00% 0.00% $0 $0 $0 $0 $0 $0 $0 $0 0.00% $0 $0 0.00%
Johnston Community College(DNS-C)
4.25% 2.36% $2,336,919 $6,671 $88,892 $9,930 $0 $0 $0 $105,493 4.51% $5,889,095 $226,981 3.85%
0.00% 0.00% $0 $0 $0 $0 $0 $0 $0 $0 0.00% $0 $0 0.00%
Lenoir Community College 8.80% 11.15% $1,095,513 $6,215 $43,913 $850 $4,070 $36,968 $0 $92,016 8.40% $2,603,918 $245,759 9.44% 0.00% 0.00% $7,400 $0 $0 $0 $0 $0 $0 $0 0.00% $99,174 $0 0.00%
Martin Community College 3.50% 13.40% $417,125 $107 $71,615 $5,823 $2,428 $0 $0 $79,973 19.17% $1,003,205 $132,525 13.21% 0.00% 0.00% $0 $0 $0 $0 $0 $0 $0 $0 0.00% $0 $0 0.00%
Mayland Community College 2.99% 6.91% $249,174 $0 $23,552 $0 $0 $0 $0 $23,552 9.45% $649,650 $47,130 7.25% 0.00% 0.00% $0 $0 $0 $0 $0 $0 $0 $0 0.00% $0 $0 0.00%
McDowell Technical Community College
3.15% 2.01% $1,023,716 $1,900 $134,689 $29,282 $0 $94 $0 $165,965 16.21% $2,943,520 $213,088 7.24%
0.00% 0.00% $5,588 $0 $0 $0 $0 $0 $0 $0 0.00% $254,879 $0 0.00%
Mitchell Community College 1.89% 12.67% $803,388 $5,415 $62,550 $945 $3,356 $0 $0 $72,265 9.00% $3,041,778 $220,915 7.26% 0.00% 0.00% $27,770 $0 $0 $0 $0 $20,570 $0 $20,570 74.07% $109,918 $20,570 18.71%
Montgomery Community College 2.92% 3.43% $455,833 $10,209 $2,666 $0 $0 $0 $0 $12,875 2.82% $953,582 $28,549 2.99% 0.00% 0.00% $9,368 $0 $0 $0 $0 $9,368 $0 $9,368 100% $73,843 $9,368 12.69%
Nash Community College 14.8% 13.76% $960,861 $34,964 $27,286 $7,259 $0 $0 $0 $69,509 7.23% $1,731,437 $164,231 9.49% 0.00% 0.00% $0 $0 $0 $0 $0 $0 $0 $0 0.00% $0 $0 0.00%
Year-to-Date3rd Quarter HUB Construction Report - Construction
Projects3rd Quarter HUB Purchasing Report - Goods and Services Year-to-Date
K:\Hubrpt_Purchase and Construction\FY'06-07\Quarter and Annual\06-07CC 3-3.4.1 Source:HUB Purchasing Report Database and HUBSCO Construction reporting SystemRun Date: 7/11/2007

NORTH CAROLINA DEPARTMENT OF ADMINISTRATIONOFFICE FOR HISTORICALLY UNDERUTILIZED BUSINESSES
Purchasing and Construction Reports - Community Colleges - 3rd Quarter 2006-07(Jan. 1, 2007 - March 31, 2007)
3rd Quarter 2006-07(Jan.1 - March 31,
2007)
1st Qtr
2nd Qtr
1st Qtr
2nd Qtr
Public Entity Type/Entity
To
tal H
UB
(%
)
To
tal H
UB
(%
)
To
tal
Pu
rch
as
ing
($)
MB
E (
$)
WB
E (
$)
DB
E-O
($)
DB
E (
$)
NP
WC
($)
Su
b (
$)
To
tal H
UB
($)
To
tal H
UB
(%
)
To
tal
Pu
rch
as
ing
($)
To
tal H
UB
($)
To
tal H
UB
(%
)
To
tal H
UB
(%
)
To
tal H
UB
(%
)
To
tal
Co
ns
tru
cti
on
($
)
B($
)
H($
)
AA
($)
AI(
$)
WF
($)
SE
($)
To
tal H
UB
($)
To
tal H
UB
(%
)
To
tal
Co
ns
tru
cti
on
($
)
To
tal H
UB
($)
To
tal H
UB
(%
)
Year-to-Date3rd Quarter HUB Construction Report - Construction
Projects3rd Quarter HUB Purchasing Report - Goods and Services Year-to-Date
COMMUNITY COLLEGES - Contd…Pamlico Community College 7.5% 9.0% $808,656 $5,242 $15,495 $354 $0 $510 $0 $21,601 2.67% $1,467,311 $64,344 4.39% 0.00% 0.00% $0 $0 $0 $0 $0 $0 $0 $0 0.00% $0 $0 0.00%
Piedmont Community College 6.5% 7.7% $1,098,201 $14,716 $20,914 $236,755 $0 $0 $0 $272,385 24.80% $2,363,165 $408,946 17.3% 0.00% 0.00% $0 $0 $0 $0 $0 $0 $0 $0 0.00% $0 $0 0.00%
Pitt Community College 15.24% 10.21% $1,952,343 $134,518 $75,920 $0 $0 $7,891 $0 $218,329 11.18% $4,698,930 $563,691 12.0% 0.00% 0.00% $0 $0 $0 $0 $0 $0 $0 $0 0.00% $0 $0 0.00%
Randolph Community College 5.61% 4.04% $953,336 $22,710 $118,329 $0 $0 $0 $0 $141,039 14.79% $4,308,814 $298,962 6.94% 88.53% 0.00% $0 $0 $0 $0 $0 $0 $0 $0 0.00% $1,673,793 $1,481,830 88.53%
Richmond Community College 2.17% 95.23% $578,434 $5,696 $20,808 $1,811 $0 $0 $0 $28,315 4.90% $2,064,334 $878,754 42.6% 0.00% 0.00% $0 $0 $0 $0 $0 $0 $0 $0 0.00% $0 $0 0.00%
Roanoke-Chowan Community College 3.79% 13.34% $435,221 $16,218 $35,100 $0 $0 $0 $0 $51,318 11.79% $1,163,502 $121,917 10.5%
0.00% 0.00% $0 $0 $0 $0 $0 $0 $0 $0 0.00% $0 $0 0.00%
Robeson Community College 4.85% 12.74% $1,338,845 $30,000 $156,631 $0 $5,671 $0 $0 $192,302 14.36% $4,318,831 $445,416 10.3% 0.00% 68.2% $0 $0 $0 $0 $0 $0 $0 $0 0.00% $2,028,175 $1,383,881 68.23%
Rockingham Community College 3.78% 16.61% $748,031 $3,165 $46,055 $0 $0 $0 $0 $49,220 6.58% $2,812,157 $305,745 10.9% 100% 75.4% $43,300 $0 $0 $0 $0 $43,300 $0 $43,300 100% $186,918 $161,143 86.21%
Rowan-Cabarrus Community College(DNS-C) 4.95% 3.58% $3,494,146 $38,686 $28,469 $1,923 $0 $7,124 $0 $76,203 2.18% $7,990,410 $260,991 3.27%
0.00% 0.00% $0 $0 $0 $0 $0 $0 $0 $0 0.00% $0 $0 0.00%
Sampson Community College 9.85% 7.86% $433,852 $1,854 $12,219 $1,945 $0 $502 $0 $16,520 3.81% $1,346,243 $97,598 7.25% 0.00% 0.00% $25,156 $0 $0 $0 $0 $0 $0 $0 0.00% $25,156 $0 0.00%
Sandhills Community College(DNS-C)
7.24% 2.90% $1,585,090 $3,923 $24,798 $1,527 $0 $0 $0 $30,248 1.91% $5,996,075 $243,793 4.07%
0.00% 0.00% $0 $0 $0 $0 $0 $0 $0 $0 0.00% $0 $0 0.00%
SouthEastern Community College 6.77% 6.20% $696,165 $5,283 $29,600 $302 $0 $0 $0 $35,185 5.05% $2,013,667 $121,058 6.01% 0.00% 0.00% $0 $0 $0 $0 $0 $0 $0 $0 0.00% $0 $0 0.00%
Southwestern Community College(DNS-C) 0.46% 2.52% $1,260,529 $3,041 $7,195 $0 $0 $0 $0 $10,236 0.81% $4,198,368 $61,086 1.45%
0.00% 0.00% $0 $0 $0 $0 $0 $0 $0 $0 0.00% $0 $0 0.00%
Stanly Community College(DNS-C) 4.06% 7.56% $721,040 $7,363 $3,940 $1,000 $0 $0 $0 $12,303 1.71% $2,167,089 $95,620 4.41% 0.00% 0.00% $0 $0 $0 $0 $0 $0 $0 $0 0.00% $0 $0 0.00%
Surry Community College 17.93% 16.86% $524,857 $0 $67,152 $0 $0 $0 $0 $67,152 12.79% $980,305 $146,467 14.94% 0.00% 0.00% $0 $0 $0 $0 $0 $0 $0 $0 0.00% $0 $0 0.00%
Tri-County Community College 1.03% 7.78% $364,710 $2,588 $15,889 $0 $0 $0 $0 $18,477 5.07% $921,289 $44,939 4.88% 0.00% 0.00% $0 $0 $0 $0 $0 $0 $0 $0 0.00% $0 $0 0.00%
Vance-Granville Community College 5.34% 8.39% $1,384,783 $4,991 $465,901 $13,198 $0 $0 $0 $484,090 34.96% $3,456,352 $630,152 18.23% 0.00% 0.00% $0 $0 $0 $0 $0 $0 $0 $0 0.00% $20,674 $0 0.00%
Wake Technical Community College 5.32% 4.96% $8,862,726 $122,301 $303,021 $55,342 $0 $0 $0 $480,663 5.42% $25,753,389 $1,350,750 5.24% 19.52% 25% $254,255 $26,841 $0 $0 $0 $7,442 $0 $34,283 13.48% $6,863,616 $1,690,305 24.63%
Wayne Community College 2.76% 12.49% $1,270,980 $4,308 $65,001 $1,731 $0 $0 $0 $71,041 5.59% $4,486,350 $321,708 7.17% 0.00% 0.00% $0 $0 $0 $0 $0 $0 $0 $0 0.00% $0 $0 0.00%
Western Piedmont Community College
9.26% 6.29% $1,724,200 $20,185 $101,381 $529 $155 $0 $0 $122,250 7.09% $3,199,542 $228,219 7.13%
0.00% 0.00% $0 $0 $0 $0 $0 $0 $0 $0 0.00% $0 $0 0.00%
Wilkes Community College(DNS-C) 2.03% 4.24% $1,655,519 $17,795 $42,037 $0 $2,488 $0 $0 $62,320 3.76% $6,165,224 $207,615 3.37% 0.00% 0.00% $0 $0 $0 $0 $0 $0 $0 $0 0.00% $0 $0 0.00%
Wilson Technical Community College 4.73% 2.90% $973,231 $8,945 $107,042 $8,410 $0 $0 $0 $124,397 12.78% $2,767,907 $187,156 6.76% 0.00% 0.00% $0 $0 $0 $0 $0 $0 $0 $0 0.00% $0 $0 0.00%
TOTALS 6.30% 8.49% $88,837,976 $1,345,623 $5,128,103 $484,216 $80,041 $104,395 $1,560 $7,143,938 8.04% $248,461,450 $18,926,904 7.62% 28.82% 21.38% $7,668,517 $26,841 $0 $0 $0 $625,214 $0 $652,055 8.50% $35,465,481 $7,113,098 20.06%
% of HUB Participation 1.51% 5.77% 0.55% 0.09% 0.12% 0.00% 8.04% 7.62% 0.35% 0.00% 0.00% 0.00% 8.15% 0.00% 8.50% 20.06%
%of Minority Participation against Total HUB $ 18.84% 71.78% 6.78% 1.12% 1.46% 0.02% 4.12% 0.00% 0.00% 0.00% 95.88% 0.00%
LEGEND:
DNS-C - Categories with blanks or blank space indicate LEGEND: LEGEND:
entity "DID NOT SUBMIT" Construction Report MBE - Minority Business Enterprise B - Black
DNS-P - Categories with blanks or blank space indicate WBE - Woman Business Enterprise H - Hispanic
entity "DID NOT SUBMIT" Purchasing Report DBE-O- Disabled - Owned Business Enterprise AA - Asian-American
Note: DBE - Disabled Business Enterprise AI - American Indian
1. When a construction project is finalized (submitted) by an entiity, HUBSCO system will update NPWC - Non - profit Work Center for the Blind & Severely Disabled WF - White Female
to the relevant quarter when the project was completed Sub - HUB Subcontractor SE - Socially and Economically Disadvantaged
K:\Hubrpt_Purchase and Construction\FY'06-07\Quarter and Annual\06-07CC 3-3.4.2 Source:HUB Purchasing Report Database and HUBSCO Construction reporting SystemRun Date: 7/11/2007

NORTH CAROLINA DEPARTMENT OF ADMINISTRATION
OFFICE FOR HISTORICALLY UNDERUTILIZED BUSINESSES
Purchasing and Construction Reports - Public Schools - 3rd Quarter 2006-07(Jan. 1, 2007 - March 31, 2007)
3rd Quarter 2007-07(Jan.1 - March 31,
2007)
1st Qtr
2nd Qtr
1st Qtr
2nd Qtr
Public Entity Type/Entity
To
tal
HU
B (
%)
To
tal
HU
B (
%)
To
tal
Pu
rch
as
ing
($)
MB
E (
$)
WB
E (
$)
DB
E-O
($
)
DB
E (
$)
NP
WC
($
)
Su
b (
$)
To
tal
HU
B (
$)
To
tal
HU
B (
%)
To
tal
Pu
rch
as
ing
($
)
To
tal
HU
B (
$)
To
tal
HU
B (
%)
To
tal
HU
B (
%)
To
tal
HU
B (
%)
To
tal
Co
ns
tru
cti
on
($
)
B($
)
H($
)
AA
($)
AI(
$)
WF
($)
SE
($)
To
tal
HU
B (
$)
To
tal
HU
B (
%)
To
tal
Co
ns
tru
cti
on
($
)
To
tal
HU
B (
$)
To
tal
HU
B (
%)
PUBLIC SCHOOLS
Alamance/Burlington 1.46% 2.26% $22,650,648 $255,959 $52,982 $72,089 $0 $0 $0 $381,030 1.68% $66,433,443 $1,183,793 1.78% * * * * * * * * * * * * * *
Ale*ander County Schools (DNS-C) 6.33% 4.94% $1,020,224 $10,081 $59,374 $1,789 $0 $0 $0 $71,244 6.98% $3,003,048 $182,083 6.06%0.00% 0.00% $0 $0 $0 $0 $0 $0 $0 $0 0.00% $0 $0 0.00%
Alleghany County Schools 3.42% 4.31% $728,743 $0 $16,384 $0 $0 $0 $0 $16,384 2.25% $1,850,203 $59,518 3.22% * * * * * * * * * * * * * *
Anson County Schools 9.90% 16.22% $919,465 $484 $164,159 $0 $0 $0 $0 $164,643 17.91% $2,547,470 $375,411 14.74% * * * * * * * * * * * * * *
Ashe County Schools (DNS-C) 3.13% 8.16% $1,192,284 $321 $88,784 $0 $0 $0 $0 $89,105 7.47% $6,265,434 $417,570 6.66% 0.00% 0.00% $704,407 $0 $0 $0 $0 $0 $0 $0 0.00% $704,407 $0 0.00%
Asheboro City Schools 0.47% 0.66% $1,101,977 $383 $14,189 $0 $0 $0 $0 $14,572 1.32% $3,860,899 $29,632 0.77% 12.85% 0.00% $0 $0 $0 $0 $0 $0 $0 $0 0.00% $276,834 $12,845 4.64%
Asheville City Schools 7.76% 12.84% $626,738 $0 $67,401 $0 $0 $0 $0 $67,401 10.75% $3,176,678 $291,829 9.19% 0.00% 0.00% $0 $0 $0 $0 $0 $0 $0 $0 0.00% $0 $0 0.00%
Avery Counrty Schools 4.53% 2.00% $947,422 $345 $21,506 $0 $0 $0 $0 $21,851 2.31% $2,769,642 $81,638 2.95% * * * * * * * * * * * * * *
Beaufort CountySchools 14.66% 0.00% $1,543,412 $202,895 $100,569 $0 $0 $0 $0 $303,464 19.66% $6,484,699 $1,027,772 15.85% * * * * * * * * * * * * * *
Bertie County Board of Education(DNS-C-P) 0.00% 0.00% $0 $0 $0 $0 $0 $0 $0 $0 0.00% $0 $0 0.00%
0.00% 0.00% $0 $0 $0 $0 $0 $0 $0 $0 0.00% $0 $0 0.00%
Bladen County Schools 6.13% 2.44% $934,681 $15,432 $10,378 $4,182 $0 $0 $0 $29,991 3.21% $2,679,621 $90,813 3.39% 1.63% 0.00% $0 $0 $0 $0 $0 $0 $0 $0 0.00% $253,135 $3,405 1.35%
Brunswick County Schools 4.29% 3.85% $16,425,739 $129,481 $933,489 $1,040 $0 $0 $0 $1,064,009 6.48% $42,380,932 $2,113,410 4.99% 84.36% 100.00% $9,539 $0 $0 $0 $0 $925 $0 $925 9.70% $152,081 $121,825 80.11%
Buncombe County Schools 4.20% 4.77% $3,957,039 $33,991 $143,235 $0 $11,308 $0 $0 $188,534 4.76% $14,855,973 $665,307 4.48% * * * * * * * * * * * * * *
Burke County Schools 11.31% 14.28% $3,123,375 $4,057 $82,902 $4,835 $27,931 $0 $0 $119,725 3.83% $9,631,264 $936,397 9.72% * * * * * * * * * * * * * *
Cabarrus County Schools 7.42% 6.11% $6,695,455 $10,319 $301,814 $0 $0 $29,143 $0 $341,276 5.10% $17,985,238 $1,108,763 6.16% 0.00% 0.00% $0 $0 $0 $0 $0 $0 $0 $0 0.00% $0 $0 0.00%
Caldwell County Schools(DNS-C) 0.50% 0.21% $14,921,913 $5,801 $80,875 $0 $0 $0 $0 $86,676 0.58% $41,964,255 $181,805 0.43% 0.00% 0.00% $0 $0 $0 $0 $0 $0 $0 $0 0.00% $0 $0 0.00%
Camden County Schools 38.66% 81.70% $80,474 $3,906 $7,618 $188 $0 $0 $0 $11,712 14.55% $122,889 $44,278 36.03% 0.00% 0.00% $0 $0 $0 $0 $0 $0 $0 $0 0.00% $0 $0 0.00%
Carteret County Schools(DNS-C) 6.14% 12.85% $5,985,145 $21,844 $576,094 $2,067 $0 $0 $0 $600,005 10.02% $16,740,221 $1,633,193 9.76% 0.00% 0.00% $0 $0 $0 $0 $0 $0 $0 $0 0.00% $0 $0 0.00%
Caswell County Schools 89.79% 40.36% $95,829 $2,956 $65,860 $0 $0 $0 $0 $68,816 71.81% $317,481 $174,207 54.87% * * * * * * * * * * * * * *
Catawba County Schools 4.64% 7.83% $1,769,325 $8,808 $119,936 $13,655 $0 $0 $0 $142,399 8.05% $5,310,697 $364,801 6.87% * * * * * * * * * * * * * *
Chapel Hill-Carrboro City Schools 0.00% 0.00% $434,260 $0 $0 $0 $0 $0 $0 $0 0.00% $1,454,080 $0 0.00% 0.00% 0.00% $0 $0 $0 $0 $0 $0 $0 $0 0.00% $177,237 $0 0.00%
Charlotte-Mecklenburg Schools 8.96% 6.52% $42,264,499 $987,392 $1,670,113 $16,934 $0 $0 $0 $2,674,439 6.33% $135,821,342 $9,917,172 7.30% 23.87% 66.22% $628,821 $0 $0 $0 $0 $183,310 $0 $183,310 29.15% $13,551,756 $4,199,453 30.99%
Chatham County Schools 16.97% 26.26% $1,670,435 $444,178 $249,510 $0 $0 $0 $0 $693,688 41.53% $7,760,714 $1,885,783 24.30%* * * * * * * * * * * * * *
Cherokee County Schools(DNS-C) 1.77% 1.27% $880,585 $0 $8,734 $0 $0 $0 $9,048 $17,782 2.02% $2,928,248 $47,849 1.63% 0.00% 0.00% $0 $0 $0 $0 $0 $0 $0 $0 0.00% $0 $0 0.00%
Clay County Schools 20.43% 13.34% $0 $0 $0 $0 $0 $0 $0 $0 #DIV/0! $175,754 $28,559 16.25% * * * * * * * * * * * * * *
Cleveland County Schools 79.11% 19.84% $2,628,229 $106,296 $139,689 $68,496 $0 $0 $0 $314,481 11.97% $7,155,628 $2,256,891 31.54% 7.39% 0.00% $635,768 $0 $0 $0 $0 $18,713 $0 $18,713 2.94% $4,030,978 $237,213 5.88%
Clinton City Schools 1.26% 2.92% $0 $0 $0 $0 $0 $0 $0 $0 #DIV/0! $4,909,218 $107,953 2.20% * * * * * * * * * * * * * *
Columbus County Schools 4.23% 3.88% $1,271,331 $22,719 $67,334 $2,241 $0 $0 $0 $92,294 7.26% $5,414,154 $262,842 4.85% * * * * * * * * * * * * * *
Craven County Schools(DNS-C) 5.95% 3.00% $3,994,705 $271,666 $61,546 $0 $0 $0 $0 $333,212 8.34% $13,797,984 $762,931 5.53%0.00% 0.00% $0 $0 $0 $0 $0 $0 $0 $0 0.00% $0 $0 0.00%
Cumberland County Schools(DNS-C) 4.82% 11.72% $8,075,762 $156,696 $546,397 $139,757 $0 $0 $0 $842,850 10.44% $29,745,733 $2,329,789 7.83%
0.00% 0.00% $0 $0 $0 $0 $0 $0 $0 $0 0.00% $0 $0 0.00%
Currituck County Schools 3.66% 3.91% $2,132,875 $4,984 $89,750 $523 $0 $0 $0 $95,258 4.47% $7,409,850 $294,703 3.98% * * * * * * * * * * * * * *
Dare County Schools 23.58% 21.87% $1,136,651 $48,632 $195,576 $9,926 $0 $0 $0 $254,134 22.36% $3,114,387 $697,096 22.38% * * * * * * * * * * * * * *
Davidson County Schools(DNS-C) 31.85% 26.53% $942,569 $7,396 $254,588 $107 $0 $1,484 $0 $263,575 27.96% $2,455,005 $701,465 28.57% 0.00% 0.00% $0 $0 $0 $0 $0 $0 $0 $0 0.00% $0 $0 0.00%
Davie County Schools 6.32% 12.12% $2,445,714 $3,538 $273,012 $138 $1,500 $56,890 $0 $335,077 13.70% $8,141,175 $879,281 10.80% 0.00% 0.00% $0 $0 $0 $0 $0 $0 $0 $0 0.00% $716,646 $0 0.00%
Year-to-Date3rd Quarter HUB Construction Report - Construction Projects3rd Quarter HUB Purchasing Report -Goods and Services Year-to-Date
K:\Hubrpt_Purchase and Construction\FY'06-07\Quarter and Annual\06-07PS 3 - 3.5.1 Source: HUB Purchasing Report Database and HUBSCO Construction Reporting SystemRun Date: 7/11/2007

NORTH CAROLINA DEPARTMENT OF ADMINISTRATION
OFFICE FOR HISTORICALLY UNDERUTILIZED BUSINESSES
Purchasing and Construction Reports - Public Schools - 3rd Quarter 2006-07(Jan. 1, 2007 - March 31, 2007)
3rd Quarter 2007-07(Jan.1 - March 31,
2007)
1st Qtr
2nd Qtr
1st Qtr
2nd Qtr
Public Entity Type/Entity
To
tal
HU
B (
%)
To
tal
HU
B (
%)
To
tal
Pu
rch
as
ing
($)
MB
E (
$)
WB
E (
$)
DB
E-O
($
)
DB
E (
$)
NP
WC
($
)
Su
b (
$)
To
tal
HU
B (
$)
To
tal
HU
B (
%)
To
tal
Pu
rch
as
ing
($
)
To
tal
HU
B (
$)
To
tal
HU
B (
%)
To
tal
HU
B (
%)
To
tal
HU
B (
%)
To
tal
Co
ns
tru
cti
on
($
)
B($
)
H($
)
AA
($)
AI(
$)
WF
($)
SE
($)
To
tal
HU
B (
$)
To
tal
HU
B (
%)
To
tal
Co
ns
tru
cti
on
($
)
To
tal
HU
B (
$)
To
tal
HU
B (
%)
Year-to-Date3rd Quarter HUB Construction Report - Construction Projects3rd Quarter HUB Purchasing Report -Goods and Services Year-to-Date
PUBLIC SCHOOLS - Contd…. * * * * * * * * * * * * * *
Duplin County Board of Ed catiion(DNS C)
4.22% 4.73% $3,804,628 $20,660 $145,846 $12,422 $0 $0 $0 $178,928 4.70% $9,934,669 $458,780 4.62% 0.00% 0.00% $0 $0 $0 $0 $0 $0 $0 $0 0.00% $0 $0 0.00%
Durham City Schools 2.29% 5.51% $7,861,402 $92,756 $252,647 $1,418 $0 $0 $0 $346,821 4.41% $42,108,805 $1,367,951 3.25% 0.00% 0.00% $0 $0 $0 $0 $0 $0 $0 $0 0.00% $0 $0 0.00%
Edenton Chowan Schools 5.40% 6.65% $784,109 $1,680 $35,409 $0 $0 $0 $0 $37,089 4.73% $2,149,520 $120,326 5.60% * * * * * * * * * * * * * *
Edgecombe County Schools 3.32% 4.42% $1,203,478 $21,423 $66,663 $1,620 $0 $0 $0 $89,706 7.45% $4,028,769 $202,471 5.03% 0.00% 0.00% $0 $0 $0 $0 $0 $0 $0 $0 0.00% $0 $0 0.00%
Elizabeth City Schools (DNS-P) 7.40% 5.60% $2,575,147 $100,639 $61,127 $102,518 $683 $1,382 $100,766 $367,115 14.26% $14,241,510 $1,167,077 8.19% * * * * * * * * * * * * * *
Elkin City Schools 10.81% 16.18% $172,324 $460 $50,465 $0 $0 $0 $0 $50,925 29.55% $514,221 $95,031 18.48% * * * * * * * * * * * * * *
Franklin County Schools 4.70% 6.02% $4,240,658 $12,160 $306,365 $97 $0 $0 $0 $318,622 7.51% $17,150,812 $978,671 5.71% 0.00% 0.00% $0 $0 $0 $0 $0 $0 $0 $0 0.00% $0 $0 0.00%
Gaston County Schools 3.78% 6.84% $8,912,810 $74,517 $1,385,319 $88,609 $83,459 $0 $0 $1,631,904 18.31% $40,692,054 $3,164,219 7.78% * * * * * * * * * * * * * *
Gates County Schools 0.30% 4.38% $602,530 $656 $4,030 $0 $0 $0 $0 $4,686 0.78% $1,186,676 $22,763 1.92% * * * * * * * * * * * * * *
Graham County Schools 30.68% 32.10% $515,765 $23,483 $198,916 $0 $0 $0 $0 $222,399 43.12% $1,456,207 $518,128 35.58% 15.28% 0.00% $0 $0 $0 $0 $0 $0 $0 $0 0.00% $1,587,978 $242,722 15.28%
Granville County Schools 0.41% 0.52% $1,339,884 $2,255 $6,089 $0 $0 $1,421 $0 $9,765 0.73% $5,807,052 $29,360 0.51% * * * * * * * * * * * * * *
Greene County Schools 4.67% 0.00% $3,418,714 $15,838 $176,001 $0 $0 $0 $0 $191,839 5.61% $5,372,831 $283,001 5.27% * * * * * * * * * * * * * *
Guildford County Schools 0.00% 10.79% $12,251,402 $277,438 $1,098,347 $0 $0 $0 $0 $1,762,428 14.39% $25,053,340 $3,143,306 12.55% 20.29% 61.83% $401,594 $172,408 $0 $0 $0 $114,062 $0 $286,470 71.33% $8,629,566 $2,125,808 24.63%
Halifa* County Schools(DNS-C) 2.67% 0.82% $519,713 $559 $151,476 $0 $0 $0 $0 $152,035 29.25% $4,009,318 $233,503 5.82% 0.00% 0.00% $0 $0 $0 $0 $0 $0 $0 $0 0.00% $0 $0 0.00%
Harnett County Schools(DNS-P) 11.54% 0.00% $0 $0 $0 $0 $0 $0 $0 $0 0.00% $2,563,009 $295,790 11.54% * * * * * * * * * * * * * *
Haywood County Schools 3.79% 4.62% $1,070,080 $0 $7,537 $0 $0 $0 $0 $7,537 0.70% $2,706,685 $73,455 2.71% 0.00% 0.00% $0 $0 $0 $0 $0 $0 $0 $0 0.00% $0 $0 0.00%
Henderson County Public Schools(DNS-C) 18.93% 25.26% $1,601,251 $28,264 $295,792 $0 $0 $0 $0 $324,056 20.24% $3,858,561 $816,300 21.16%
0.00% 0.00% $0 $0 $0 $0 $0 $0 $0 $0 0.00% $0 $0 0.00%
Hertford County Public Schools(DNS-C) 13.94% 16.30% $4,213,379 $598,407 $41,479 $527 $0 $0 $0 $640,413 15.20% $12,880,952 $1,954,034 15.17%
0.00% 0.00% $0 $0 $0 $0 $0 $0 $0 $0 0.00% $0 $0 0.00%
Hickory Public Schools(DNS-C)0.00% 3.49% $289,348 $799 $7,085 $0 $0 $0 $0 $7,884 2.72% $451,557 $13,538 3.00%
0.00% 0.00% $0 $0 $0 $0 $0 $0 $0 $0 0.00% $0 $0 0.00%
Hoke County Schools (DNS-P) 100% 0.00% $0 $0 $0 $0 $0 $0 $0 $0 0.00% $62,816 $62,816 100.00% * * * * * * * * * * * * * *
Hyde County Schools 2.20% 3.17% $1,615,926 $8,292 $36,577 $952 $0 $0 $0 $45,821 2.84% $5,314,420 $145,908 2.75% * * * * * * * * * * * * * *
Iredell-Statesville Schools 24.44% 35.51% $3,680,161 $6,819 $465,228 $533 $0 $369 $0 $472,949 12.85% $9,081,859 $2,114,031 23.28% 0.00% 0.00% $0 $0 $0 $0 $0 $0 $0 $0 0.00% $0 $0 0.00%
Jackson County Board of Education
7.96% 7.37% $553,483 $137,426 $27,152 $0 $0 $0 $0 $164,578 29.73% $1,426,878 $231,063 16.19%
* * * * * * * * * * * * * *
Johnston County Schools 27.65% 12.86% $6,618,280 $11,352 $446,416 $8,822 $0 $0 $0 $466,590 7.05% $15,942,847 $2,201,520 13.81% 0.00% 0.00% $0 $0 $0 $0 $0 $0 $0 $0 0.00% $0 $0 0.00%
Jones County Public Schools 5.28% 8.94% $239,807 $7,764 $14,025 $0 $0 $0 $0 $21,789 9.09% $1,324,533 $90,022 6.80% 0.00% 0.00% $0 $0 $0 $0 $0 $0 $0 $0 0.00% $84,954 $0 0.00%
Kannapolis City Schools 0.94% 1.21% $0 $0 $0 $0 $0 $0 $0 $0 #DIV/0! $3,680,638 $39,498 1.07% * * * * * * * * * * * * * *
Lee County Board of Education 5.38% 2.92% $675,874 $1,319 $19,118 $0 $0 $0 $0 $20,437 3.02% $2,227,603 $90,477 4.06% 23.33% 0.00% $44,642 $0 $0 $0 $0 $7,675 $0 $7,675 17.19% $529,147 $97,675 18.46%
Lenoir County Public Schools(DNS-C)18.94% 16.54% $2,738,217 $9,434 $221,428 $0 $290 $0 $0 $231,152 8.44% $6,894,683 $955,258 13.85%
0.00% 0.00% $0 $0 $0 $0 $0 $0 $0 $0 0.00% $0 $0 0.00%
Le*ington City Schools 2.47% 2.63% $713,720 $3,100 $10,888 $0 $0 $0 $0 $13,987 1.96% $2,281,513 $53,916 2.36% * * * * * * * * * * * * * *
Lincoln County Schools(DNS-C) 6.06% 4.29% $3,711,966 $40,488 $126,002 $2,475 $0 $0 $0 $168,965 4.55% $13,093,798 $644,460 4.92% 0.00% 0.00% $0 $0 $0 $0 $0 $0 $0 $0 0.00% $0 $0 0.00%
Macon County Schools 1.29% 0.24% $5,316,758 $0 $6,044 $0 $0 $0 $0 $6,044 0.11% $11,957,409 $36,696 0.31% * * * * * * * * * * * * * *
Madison County Public Schools(DNS-C) 1.90% 2.73% $950,354 $9,168 $54,658 $0 $0 $0 $0 $63,826 6.72% $3,054,073 $113,533 3.72%
0.00% 0.00% $0 $0 $0 $0 $0 $0 $0 $0 0.00% $0 $0 0.00%
Martin County Schools 18.02% 21.58% $591,268 $18,609 $214,062 $0 $0 $0 $0 $232,671 39.35% $1,312,516 $380,127 28.96% * * * * * * * * * * * * * *
McDowell County Schools(DNS-C) 13.34% 24.37% $1,514,729 $15,571 $282,117 $16,519 $0 $0 $0 $314,207 20.74% $4,848,666 $920,865 18.99% 0.00% 0.00% $0 $0 $0 $0 $0 $0 $0 $0 0.00% $0 $0 0.00%
K:\Hubrpt_Purchase and Construction\FY'06-07\Quarter and Annual\06-07PS 3 - 3.5.2 Source: HUB Purchasing Report Database and HUBSCO Construction Reporting SystemRun Date: 7/11/2007

NORTH CAROLINA DEPARTMENT OF ADMINISTRATION
OFFICE FOR HISTORICALLY UNDERUTILIZED BUSINESSES
Purchasing and Construction Reports - Public Schools - 3rd Quarter 2006-07(Jan. 1, 2007 - March 31, 2007)
3rd Quarter 2007-07(Jan.1 - March 31,
2007)
1st Qtr
2nd Qtr
1st Qtr
2nd Qtr
Public Entity Type/Entity
To
tal
HU
B (
%)
To
tal
HU
B (
%)
To
tal
Pu
rch
as
ing
($)
MB
E (
$)
WB
E (
$)
DB
E-O
($
)
DB
E (
$)
NP
WC
($
)
Su
b (
$)
To
tal
HU
B (
$)
To
tal
HU
B (
%)
To
tal
Pu
rch
as
ing
($
)
To
tal
HU
B (
$)
To
tal
HU
B (
%)
To
tal
HU
B (
%)
To
tal
HU
B (
%)
To
tal
Co
ns
tru
cti
on
($
)
B($
)
H($
)
AA
($)
AI(
$)
WF
($)
SE
($)
To
tal
HU
B (
$)
To
tal
HU
B (
%)
To
tal
Co
ns
tru
cti
on
($
)
To
tal
HU
B (
$)
To
tal
HU
B (
%)
Year-to-Date3rd Quarter HUB Construction Report - Construction Projects3rd Quarter HUB Purchasing Report -Goods and Services Year-to-Date
PUBLIC SCHOOLS - Contd….
Mitchell County Schools 0.00% 0.00% $284,407 $0 $0 $0 $0 $0 $0 $0 0.00% $773,330 $0 0.00% * * * * * * * * * * * * * *
Montgomery County Schools 3.31% 1.31% $786,039 $0 $19,280 $0 $0 $0 $0 $19,280 2.45% $2,645,293 $64,340 2.43% * * * * * * * * * * * * * *
Moore County Schools 2.42% 10.94% $1,465,105 $25,287 $136,166 $0 $15,869 $0 $0 $177,322 12.10% $6,759,651 $442,990 6.55% 0.00% 32.70% $337,953 $0 $0 $0 $0 $13,854 $0 $13,854 4.10% $647,628 $110,591 17.08%
Mooresville City Schools 7.50% 6.73% $459,060 $25,896 $5,354 $1,117 $0 $0 $0 $32,367 7.05% $1,453,986 $103,362 7.11% * * * * * * * * * * * * * *
Mount Airy County Schools 25.96% 42.50% $499,719 $1,958 $175,215 $64,001 $0 $0 $0 $241,174 48.26% $1,251,036 $495,775 39.63% * * * * * * * * * * * * * *
Nash-Rocky Mount Schools(DNS-C)
27.08% 8.46% $807,818 $1,057 $4,483 $37,041 $0 $0 $0 $42,581 5.27% $2,650,874 $397,106 14.98%
0.00% 0.00% $0 $0 $0 $0 $0 $0 $0 $0 0.00% $0 $0 0.00%
New Hanover County Schools 5.75% 19.72% $15,578,774 $331,081 $384,823 $120 $0 $10,980 $0 $727,004 4.67% $27,960,686 $1,473,055 5.27% 44.17% 0.00% $0 $0 $0 $0 $0 $0 $0 $0 0.00% $2,002,149 $693,395 34.63%
Newton-Conover City Schools(DNS-C) 12.79% 37.58% $36,992 $0 $16,449 $0 $0 $0 $0 $16,449 44.47% $119,965 $33,558 27.97%
0.00% 0.00% $0 $0 $0 $0 $0 $0 $0 $0 0.00% $0 $0 0.00%
Northampton County Schools(DNS-C)
3.49% #DIV/0! $247,630 $23,838 $24,985 $0 $0 $0 $0 $48,823 19.72% $908,997 $71,876 7.91%
0.00% 0.00% $7,374,756 $0 $0 $0 $0 $530,080 $0 $530,080 7.19% $7,374,756 $530,080 7.19%
Onslow County Schools 2.72% 3.79% $7,484,365 $2,703,995 $167,530 $2,140 $0 $340 $0 $179,202 2.39% $21,018,593 $633,063 3.01% * * * * * * * * * * * * * *
Orange County Schools 26.88% 18.65% $6,233,318 $30,803 $707,981 $385 $9,761 $0 $0 $748,929 12.01% $12,682,852 $2,159,126 17.02% * * * * * * * * * * * * * *
Pamlico County Schools(DNS-C) 7.47% 7.24% $273,023 $12,254 $7,189 $0 $0 $0 $0 $19,443 7.12% $872,363 $63,529 7.28% 0.00% 0.00% $0 $0 $0 $0 $0 $0 $0 $0 0.00% $0 $0 0.00%
Pender County Schools 29.76% 25.47% $6,607,189 $9,876 $1,075,125 $0 $1,298 $24,234 $442,157 $1,552,689 23.50% $14,933,450 $3,742,857 25.06% * * * * * * * * * * * * * *
Perquimans County Schools 3.91% 11.57% $22,748 $384 $7,880 $0 $0 $0 $0 $8,264 36.33% $104,557 $14,517 13.88% * * * * * * * * * * * * * *
Person County Schools(DNS-C)
7.00% 4.55% $741,277 $2,800 $103,473 $0 $100,732 $0 $0 $207,005 27.93% $3,029,907 $334,067 11.03%
0.00% 0.00% $0 $0 $0 $0 $0 $0 $0 $0 0.00% $0 $0 0.00%
Pitt County Schools(DNS-C) 32.46% 35.89% $2,732,602 $67,402 $195,172 $116,364 $73,530 $60,323 $0 $512,791 18.77% $10,663,042 $3,151,079 29.55% 0.00% 0.00% $0 $0 $0 $0 $0 $0 $0 $0 0.00% $0 $0 0.00%
Polk County Schools 12.48% 4.59% $1,333,436 $38,165 $962 $0 $0 $0 $0 $39,127 2.93% $3,455,120 $203,548 5.89% * * * * * * * * * * * * * *
Randolph County Schools 0.33% 0.22% $21,510,623 $38,169 $3,226 $0 $0 $0 $0 $41,395 0.19% $60,556,526 $147,595 0.24% 0.00% 0.00% $0 $0 $0 $0 $0 $0 $0 $0 0.00% $0 $0 0.00%
Richmond County Schools(DNS-C) 17.25% 17.32% $2,549,197 $7,838 $401,308 $0 $0 $0 $0 $409,146 16.05% $6,454,857 $1,084,699 16.80% 0.00% 0.00% $0 $0 $0 $0 $0 $0 $0 $0 0.00% $0 $0 0.00%
Roanoke Rapids City School(DNS-C)
18.92% 4.46% $553,272 $24,029 $52,413 $255 $0 $0 $0 $76,697 13.86% $1,608,484 $233,273 14.50%
0.00% 0.00% $0 $0 $0 $0 $0 $0 $0 $0 0.00% $0 $0 0.00%
Robeson County Schools(DNS-C) 1.15% 1.30% $27,269,932 $233,025 $563 $38,766 $0 $0 $0 $272,353 1.00% $69,529,060 $795,323 1.14%0.00% 0.00% $396,087 $0 $0 $0 $0 $0 $0 $0 0.00% $396,087 $0 0.00%
Rockingham County Schools 10.08% 15.31% $2,496,431 $25,884 $190,320 $0 $0 $0 $0 $216,204 8.66% $6,314,193 $716,055 11.34% * * * * * * * * * * * * * *
Rowan/Salisbury County Schools 6.11% 1.72% $4,627,260 $1,373 $70,477 $3,565 $0 $0 $0 $75,415 1.63% $15,288,293 $443,961 2.90% * * * * * * * * * * * * * *
Rutherford County Schools(DNS-C)
1.70% 3.43% $2,707,526 $15,218 $30,727 $0 $0 $0 $0 $45,945 1.70% $9,753,623 $222,762 2.28%
0.00% 0.00% $0 $0 $0 $0 $0 $0 $0 $0 0.00% $0 $0 0.00%
Sampson County Schools 3.30% 3.48% $2,357,692 $15,382 $79,363 $0 $709 $0 $0 $95,454 4.05% $6,630,260 $240,395 3.63% * * * * * * * * * * * * * *
Scotland County Schools(DNS-C) 35.19% 35.69% $948,022 $221,383 $130,016 $0 $0 $0 $0 $351,399 37.07% $2,790,856 $1,004,576 36.00% 0.00% 0.00% $0 $0 $0 $0 $0 $0 $0 $0 0.00% $0 $0 0.00%
Stanly County Schools 7.44% 1.06% $1,635,692 $21,192 $37,849 $0 $0 $0 $0 $59,041 3.61% $6,573,680 $324,486 4.94% * * * * * * * * * * * * * *
Stokes County Schools(DNS-C) 7.84% 14.47% $2,279,582 $31,292 $243,497 $0 $0 $0 $0 $274,789 12.05% $6,107,045 $711,221 11.65% 0.00% 0.00% $0 $0 $0 $0 $0 $0 $0 $0 0.00% $58,466 $0 0.00%
Surry County Board of Education 16.38% 14.85% $1,720,966 $124,697 $42,651 $1,759 $94,000 $0 $0 $263,107 15.29% $4,773,727 $733,565 15.37% 0.00% 0.00% $0 $0 $0 $0 $0 $0 $0 $0 0.00% $0 $0 0.00%
Swain County Schools 74.95% 75.21% $20,249 $4,680 $9,438 $0 $0 $0 $0 $14,118 69.72% $73,094 $53,812 73.62% * * * * * * * * * * * * * *
Thomasville City Schools 8.50% 10.99% $661,975 $40,248 $54,799 $0 $0 $0 $0 $95,046 14.36% $2,308,540 $259,194 11.23% * * * * * * * * * * * * * *
Transylvania County Schools 9.56% 9.46% $958,519 $2,443 $40,342 $0 $0 $0 $0 $42,785 4.46% $2,503,685 $189,746 7.58% 0.00% 0.00% $0 $0 $0 $0 $0 $0 $0 $0 0.00% $1,004,700 $0 0.00%
Tyrell County Schools 4.61% 8.46% $127,903 $0 $4,768 $0 $0 $0 $0 $4,768 3.73% $488,582 $28,312 5.79% * * * * * * * * * * * * * *
K:\Hubrpt_Purchase and Construction\FY'06-07\Quarter and Annual\06-07PS 3 - 3.5.3 Source: HUB Purchasing Report Database and HUBSCO Construction Reporting SystemRun Date: 7/11/2007

NORTH CAROLINA DEPARTMENT OF ADMINISTRATION
OFFICE FOR HISTORICALLY UNDERUTILIZED BUSINESSES
Purchasing and Construction Reports - Public Schools - 3rd Quarter 2006-07(Jan. 1, 2007 - March 31, 2007)
3rd Quarter 2007-07(Jan.1 - March 31,
2007)
1st Qtr
2nd Qtr
1st Qtr
2nd Qtr
Public Entity Type/Entity
To
tal
HU
B (
%)
To
tal
HU
B (
%)
To
tal
Pu
rch
as
ing
($)
MB
E (
$)
WB
E (
$)
DB
E-O
($
)
DB
E (
$)
NP
WC
($
)
Su
b (
$)
To
tal
HU
B (
$)
To
tal
HU
B (
%)
To
tal
Pu
rch
as
ing
($
)
To
tal
HU
B (
$)
To
tal
HU
B (
%)
To
tal
HU
B (
%)
To
tal
HU
B (
%)
To
tal
Co
ns
tru
cti
on
($
)
B($
)
H($
)
AA
($)
AI(
$)
WF
($)
SE
($)
To
tal
HU
B (
$)
To
tal
HU
B (
%)
To
tal
Co
ns
tru
cti
on
($
)
To
tal
HU
B (
$)
To
tal
HU
B (
%)
Year-to-Date3rd Quarter HUB Construction Report - Construction Projects3rd Quarter HUB Purchasing Report -Goods and Services Year-to-Date
PUBLIC SCHOOLS - Contd….Union County Public Schools 0.00% 0.00% $0 $0 $0 $0 $0 $0 $0 $0 0.00% $0 $0 0.00% 0.00% 0.00% $38,800 $0 $0 $0 $0 $0 $0 $0 0.00% $725,626 $0 0.00%
Vance County Board of Education0.72% 3.93% $2,478,039 $206 $34,268 $0 $0 $0 $0 $34,474 1.39% $7,159,765 $146,463 2.05%
0.37% 0.00% $72,397 $0 $0 $0 $0 $0 $0 $0 0.00% $1,823,855 $4,500 0.25%
Wake County Public School System 24.54% 9.63% $18,648,249 $604,796 $1,113,940 $314,607 $0 $0 $0 $2,033,343 10.90% $108,105,307 $22,060,639 20.41% 13.41% 13.54% $4,971,886 $2,965 $47,113 $0 $0 $801,659 $0 $851,737 17.13% $27,400,453 $3,868,608 14.12%
Warren County Schools 0.00% 0.00% $0 $0 $0 $0 $0 $0 $0 $0 0.00% $0 $0 0.00% * * * * * * * * * * * * * *
Washington County Schools(DNS-C)0.00% 0.00% $1,267,133 $0 $0 $0 $0 $0 $0 $0 0.00% $3,431,999 $0 0.00%
0.00% 0.00% $0 $0 $0 $0 $0 $0 $0 $0 0.00% $0 $0 0.00%
Watauga County Schools 13.41% 5.55% $693,073 $18,483 $29,323 $0 $0 $0 $0 $47,806 6.90% $2,129,551 $164,353 7.72% * * * * * * * * * * * * * *
Wayne County Public Schools 11.07% 18.57% $3,033,101 $90,872 $455,929 $3,153 $0 $0 $0 $549,954 18.13% $8,161,080 $1,305,468 16.00% 0.00% 71.45% $29,500 $0 $0 $0 $0 $0 $0 $0 0.00% $191,710 $38,600 20.13%
Weldon City Schools 0.00% 0.00% $128,160 $0 $0 $0 $0 $0 $0 $0 0.00% $327,773 $0 0.00% * * * * * * * * * * * * * *
Whiteville City Schools 11.22% 7.45% $915,913 $0 $57,003 $0 $0 $0 $0 $57,003 6.22% $2,724,239 $223,371 8.20% * * * * * * * * * * * * * *
Wilkes County Public Schools 19.62% 24.67% $582,471 $30,665 $50,551 $40,282 $0 $0 $0 $121,498 20.86% $1,480,800 $319,861 21.60% 0.00% 0.00% $0 $0 $0 $0 $0 $0 $0 $0 0.00% $773,614 $0 0.00%
Wilson County Schools 4.45% 10.19% $2,455,098 $378,342 $214,033 $0 $0 $0 $0 $592,375 24.13% $6,304,531 $892,012 14.15% 0.00% 0.00% $0 $0 $0 $0 $0 $0 $0 $0 0.00% $0 $0 0.00%
Winston-Salem/Forsyth County Schools 18.84% 10.89% $18,105,180 $636,580 $775,276 $577,441 $0 $0 $0 $1,989,297 10.99% $49,190,949 $6,491,840 13.20%
8.47% 26.38% $0 $0 $0 $0 $0 $0 $0 $0 0.00% $6,587,734 $1,663,386 25.25%
Yadkin County Schools 8.23% 39.53% $258,009 $26,592 $47,728 $0 $0 $0 $7,816 $82,136 31.83% $1,656,573 $279,382 16.87% 0.00% 0.00% $0 $0 $0 $0 $0 $0 $0 $0 0.00% $5,812,992 $0 0.00%
Yancey County Schools(DNS-C) 1.08% 0.86% $2,532,919 $7,732 $5,709 $0 $0 $1,172 $0 $14,613 0.58% $7,960,714 $67,494 0.85% 0.00% 0.00% $0 $0 $0 $0 $0 $0 $0 $0 0.00% $0 $0 0.00%
TOTALS 9.91% 7.40% $406,010,358 $10,177,811 $19,885,690 $1,775,474 $421,069 $187,737 $559,786 $33,007,567 8.13% $1,269,005,649 $108,983,831 8.59% 16.74% 18.25% $15,646,151 $175,373 $47,113 $0 $0 $1,670,278 $0 $1,892,764 12.10% $85,494,489 $13,950,106 16.32%
% of HUB Participation 2.51% 4.90% 0.44% 0.10% 0.05% 0.14% 8.13% 8.59% 1.12% 0.30% 0.00% 0.00% 10.68% 0.00% 12.10% 16.32%
%of Minority Participation against Total HUB $ 30.83% 60.25% 5.38% 1.28% 0.57% 1.70% 9.27% 2.49% 0.00% 0.00% 88.25% 0.00%
LEGEND:
DNS-C - Categories with blanks or blank space indicate LEGEND: LEGEND:
entity "DID NOT SUBMIT" Construction Report MBE - Minority Business Enterprise B - Black
DNS-P - Categories with blanks or blank space indicate WBE - Woman Business Enterprise H - Hispanic
entity "DID NOT SUBMIT" Purchasing Report DBE-O- Disabled - Owned Business Enterprise AA - Asian-American
* - currently do not report DBE - Disabled Business Enterprise AI - American Indian
NPWC - Non - profit Work Center for the Blind & Severely Disabled WF - White Female
Note: Sub - HUB Subcontractor SE - Socially and Economically Disadvantaged
1. When a construction project is finalized (submitted) by an entiity, HUBSCO system will update
to the relevant quarter when the project was completed
K:\Hubrpt_Purchase and Construction\FY'06-07\Quarter and Annual\06-07PS 3 - 3.5.4 Source: HUB Purchasing Report Database and HUBSCO Construction Reporting SystemRun Date: 7/11/2007

NORTH CAROLINA DEPARTMENT OF ADMINISTRATION
OFFICE FOR HISTORICALLY UNDERUTILIZED BUSINESSES
Purchasing and Construction Reports
State Universities - 3rd Quarter 2006-07(Jan. 1, 2007 - March 31, 2007)
3rd Quarter 2006-07(Jan.1 - March 31, 2007)
1st Qtr
2nd Qtr
1st Qtr
2ndQtr
Public Entity Type/Entity
To
tal
HU
B (
%)
To
tal
HU
B (
%)
To
tal
Pu
rch
asin
g($
)
MB
E (
$)
WB
E (
$)
DB
E-O
($)
DB
E (
$)
NP
WC
($)
Su
b (
$)
To
tal
HU
B (
$)
To
tal
HU
B (
%)
To
tal
Pu
rch
asin
g (
$)
To
tal
HU
B (
$)
To
tal
HU
B (
%)
To
tal
HU
B (
%)
To
tal
HU
B (
%)
To
tal
Co
nst
ruct
ion
($
)
B($
)
H($
)
AA
($)
AI(
$)
WF
($)
SE
($)
To
tal
HU
B (
$)
To
tal
HU
B (
%)
To
tal
Co
nst
ruct
ion
($
)
To
tal
HU
B (
$)
To
tal
HU
B (
%)
STATE UNIVERSITIESAppalachian State University(DNS-C) 6.29% 1.72% $5,731,750 $8,629 $212,974 $0 $0 $0 $0 $221,603 3.87% $14,912,162 $621,234 4.17% 100% 0.00% $704,294 $0 $0 $0 $0 $0 $0 $0 0.00% $1,053,914 $185,620 17.61%East Carolina University 13.62% 12.35% $34,873,559 $275,093 $670,880 $186,659 $0 $0 $1,180,214 $2,312,846 6.63% $76,599,129 $7,727,128 10.09% 10.92% 11.98% $1,199,318 $1,590 $0 $0 $0 $17,898 $0 $19,488 1.62% $50,532,197 $5,500,914 10.89%Elizabeth City State University(DNS-C) 10.40% 34.53% $1,468,913 $688,803 $16,814 $0 $0 $0 $0 $705,617 48.04% $10,693,667 $2,028,018 18.96% 0.00% 0.00% $0 $0 $0 $0 $0 $0 $0 $0 0.00% $0 $0 0.00%Fayetteville State University(DNS-C) 2.83% 10.68% $2,471,128 $903,010 $81,073 $0 $0 $0 $0 $984,083 39.82% $26,638,488 $1,943,842 7.30% 0.00% 0.00% $0 $0 $0 $0 $0 $0 $0 $0 0.00% $0 $0 0.00%North Carolina Agricultural & Technical State University(DNS C)
11.20% 12.24% $8,470,503 $416,109 $187,969 $0 $0 $0 $0 $604,078 7.13% $26,267,441 $2,659,601 10.13% 0.00% 0.00% $0 $0 $0 $0 $0 $0 $0 $0 0.00% $0 $0 0.00%North Carolina Arboretum(DNS-C) X X X X X X X X X X X X X X 0.00% 0.00% $0 $0 $0 $0 $0 $0 $0 $0 0.00% $0 $0 0.00%North Carolina Central University(DNS-C) 32.37% 36.86% $8,589,437 $2,459,633 $530,012 $0 $0 $0 $0 $2,989,645 34.81% $21,904,577 $7,559,878 34.51% 0.00% 0.00% $0 $0 $0 $0 $0 $0 $0 $0 0.00% $0 $0 0.00%North Carolina School of Science and Mathematics
13.29% 20.72% $220,734 $31,501 $11,867 $0 $0 $0 $0 $43,368 19.65% $2,035,051 $297,498 14.62% 0.00% 100% $0 $0 $0 $0 $0 $0 $0 $0 0.00% $306,601 $306,601 100.00%North Carolina School of the Arts(DNS-C) 14.21% 8.62% $833,271 $66,780 $39,082 $0 $0 $0 $0 $105,862 12.70% $3,191,725 $394,906 12.37% 0.00% 0.00% $0 $0 $0 $0 $0 $0 $0 $0 0.00% $0 $0 0.00%North Carolina State University 0.93% 2.00% $49,982,339 $312,979 $446,087 $6,353 $0 $0 $0 $765,419 1.53% $138,409,557 $2,054,724 1.48% 13.98% 29.41% $20,070,814 $115,701 $0 $0 $0 $3,890,346 $0 $4,006,047 19.96% $57,907,544 $10,299,933 17.79%UNC Hospitals(DNS-C) 0.21% 0.25% $68,220,176 $14,193 $30,433 $0 $0 $0 $0 $44,626 0.07% $240,718,743 $429,956 0.18% 0.00% 0.00% $0 $0 $0 $0 $0 $0 $0 $0 0.00% $942,900 $0 0.00%UNC-Asheville 7.05% 6.24% $1,304,533 $3,573 $58,538 $4,940 $0 $0 $0 $67,051 5.14% $3,239,948 $197,597 6.10% 31.60% 0.00% $168,971 $0 $0 $0 $0 $0 $0 $0 0.00% $977,202 $255,404 26.14%UNC-Chapel Hill 2.09% 5.33% $53,621,546 $201,074 $302,307 $0 $0 $0 $0 $503,381 0.94% $116,789,837 $2,513,477 2.15% 13.51% 10.12% $1,982,108 $65,115 $199,900 $0 $0 $6,748 $0 $271,763 13.71% $79,225,344 $9,498,090 11.99%UNC-Charlotte 16.71% 13.52% $9,967,085 $55,559 $632,850 $2,841 $0 $900 $0 $692,150 6.94% $27,281,798 $3,373,406 12.37% 7.61% 0.00% $36,198,714 $563,919 $188,921 $192,168 $27,748 $4,106,724 $0 $5,079,480 14.03% $62,840,687 $7,107,530 11.31%UNC-Greensboro 11.62% 4.44% $4,330,484 $274,167 $87,689 $0 $0 $0 $0 $361,856 8.36% $15,985,906 $1,362,404 8.52% 12.04% 11.80% $274,570 $102,970 $0 $0 $0 $3,903 $0 $106,873 38.92% $13,725,898 $1,708,756 12.45%UNC-Office of the President (DNS-C) 1.94% 3.71% $7,107,364 $33,857 $46,970 $0 $0 $1,843 $880 $83,550 1.18% $18,893,407 $358,934 1.90% 0.00% 0.00% $0 $0 $0 $0 $0 $0 $0 $0 0.00% $0 $0 0.00%UNC-Pembroke(DNS-C) 8.00% 4.06% $4,614,092 $108,477 $64,357 $54,333 $0 $0 $0 $227,166 4.92% $11,858,754 $654,490 5.52% 100% 0.00% $0 $0 $0 $0 $0 $0 $0 $0 0.00% $1,318,407 $1,318,407 100.00%UNC-TV X X X X X X X X X X X X X X 4.87% 0.00% $28,640 $0 $0 $0 $0 $0 $0 $0 0.00% $148,232 $5,828 3.93%UNC-Wilmington(DNS-C) 4.95% 4.25% $5,438,212 $10,968 $419,174 $1,570 $4,135 $14,516 $0 $450,363 8.28% $22,804,880 $1,270,354 5.57% 39.74% 6.60% $380,108 $228,150 $0 $0 $0 $0 $0 $228,150 60.02% $1,917,410 $787,388 41.07%Western Carolina University #DIV/0! 12.21% $4,184,432 $114,235 $708,495 $900 $0 $21,699 $0 $845,329 20.20% $9,411,546 $1,483,430 15.76% 0.00% 0.00% $0 $0 $0 $0 $0 $0 $0 $0 0.00% $0 $0 0.00%Winston-Salem State University 6.80% 6.24% $4,483,390 $215,547 $47,305 $0 $0 $0 $0 $262,852 5.86% $14,084,426 $898,503 6.38% 5.07% 26% $698,030 $93,090 $0 $0 $0 $0 $0 $93,090 13.34% $1,893,018 $310,453 16.40%
TOTALS 4.44% 5.53% $275,912,948 $6,194,187 $4,594,876 $257,596 $4,135 $38,958 $1,181,094 $12,270,845 4.45% $801,721,042 $37,829,380 4.72% 12.90% 13.31% $61,705,567 $1,170,535 $388,821 $192,168 $27,748 $8,025,619 $0 $9,804,891 15.89% $272,789,354 $37,284,924 13.67%
% of HUB Participation 2.24% 1.67% 0.09% 0.00% 0.01% 0.43% 4.45% 4.72% 1.90% 1% 0% 0% 13.01% 0% 15.89% 13.67%
%of Minority Participation against Total HUB $ 50.48% 37.45% 2.10% 0.03% 0.32% 9.63% 11.94% 3.97% 1.96% 0.28% 81.85% 0.00%
LEGEND:
DNS-C - Categories with blanks or blank space indicate LEGEND: LEGEND:
entity "DID NOT SUBMIT" Construction Report MBE - Minority Business Enterprise B - Black
DNS-P - Categories with blanks or blank space indicate WBE - Woman Business Enterprise H - Hispanic
entity "DID NOT SUBMIT" Purchasing Report DBE-O- Disabled - Owned Business Enterprise AA - Asian-American
X - no reporting requirements DBE - Disabled Business Enterprise AI - American Indian
NPWC - Non - profit Work Center for the Blind & Severely Disabled WF - White Female
Note: Sub - HUB Subcontractor SE - Socially and Economically Disadvantaged
1. When a construction project is finalized (submitted) by an entiity, HUBSCO system will update
to the relevant quarter when the project was completed
Year-to-Date3rd Quarter HUB Construction Report - Construction Projects3rd Quarter HUB Purchasing Report - Goods and Services Year-to-Date
K:\Hubrpt_Purchase and Construction\FY'06-07\Quarter and Annual\06-07SU 3 - 3.6 Source: HUB Purchasing Report Database and HUBSCO Construction Reporting SystemRun Date: 7/12/2007

NORTH CAROLINA DEPARTMENT OF ADMINISTRATION
OFFICE FOR HISTORICALLY UNDERUTILIZED BUSINESSES
Purchasing and Construction Reports
Counties - 3rd Quarter 2006-07(Jan.1, 2007 - March 31, 2007)
3rd Quarter 2007-07(Jan.1 - March 31, 2007)
1st Qtr
2nd Qtr
1st Qtr
2nd Qtr
Public Entity Type/Entity
To
tal H
UB
(%
)
To
tal H
UB
(%
)
To
tal
Pu
rch
asin
g($
)
MB
E (
$)
WB
E (
$)
DB
E-O
($)
DB
E (
$)
NP
WC
($)
Su
b (
$)
To
tal H
UB
($)
To
tal H
UB
(%
)
To
tal
Pu
rch
asin
g (
$)
To
tal H
UB
($)
To
tal H
UB
(%
)
To
tal H
UB
(%
)
To
tal H
UB
(%
)
To
tal
Co
nst
ruct
ion
($
)
B($
)
H($
)
AA
($)
AI(
$)
WF
($)
SE
($)
To
tal H
UB
($)
To
tal H
UB
(%
)
To
tal
Co
ns
tru
cti
on
($
)
To
tal
HU
B (
$)
To
tal
HU
B (
%)
COUNTIESCounty of Alamance X X X X X X X X X X X X X X 100% 0.00% $0 $0 $0 $0 $0 $0 $0 $0 0.00% $39,939 $39,939 100%
County of Alleghany X X X X X X X X X X X X X X 0.00% 0.00% $0 $0 $0 $0 $0 $0 $0 $0 0.00% $0 $0 0.00%
County of Ashe X X X X X X X X X X X X X X 0.00% 0.00% $0 $0 $0 $0 $0 $0 $0 $0 0.00% $0 $0 0.00%
County of Bladen DNS-C) X X X X X X X X X X X X X X 0.00% 0.00% $0 $0 $0 $0 $0 $0 $0 $0 0.00% $0 $0 0.00%
County of Buncombe X X X X X X X X X X X X X X 0.00% 0.00% $35,410 $0 $0 $0 $0 $0 $0 $0 0.00% $35,410 $0 0.00%
County of Cabarrus DNS-C) X X X X X X X X X X X X X X 0.00% 0.00% $12,030 $0 $0 $0 $0 $0 $0 $0 0.00% $66,258 $0 0.00%
County of Camden DNS-C) X X X X X X X X X X X X X X 0.00% 0.00% $0 $0 $0 $0 $0 $0 $0 $0 0.00% $0 $0 0.00%
County of Carteret X X X X X X X X X X X X X X 0.00% 100.00% $0 $0 $0 $0 $0 $0 $0 $0 0.00% $701,860 $202,500 28.85%
County of Caswell X X X X X X X X X X X X X X 0.00% 0.00% $0 $0 $0 $0 $0 $0 $0 $0 0.00% $0 $0 0.00%
County of CatawbaDNS-C) X X X X X X X X X X X X X X 0.00% 0.00% $0 $0 $0 $0 $0 $0 $0 $0 0.00% $0 $0 0.00%
County of Chatham X X X X X X X X X X X X X X 0.00% 0.00% $0 $0 $0 $0 $0 $0 $0 $0 0.00% $0 $0 0.00%
County of Cleveland(DNS-C) X X X X X X X X X X X X X X 0.00% 0.00% $0 $0 $0 $0 $0 $0 $0 $0 0.00% $0 $0 0.00%
County of Columbus X X X X X X X X X X X X X X 0.00% 0.00% $0 $0 $0 $0 $0 $0 $0 $0 0.00% $0 $0 0.00%
County of CumberlandDNS-C) X X X X X X X X X X X X X X 0.00% 0.00% $0 $0 $0 $0 $0 $0 $0 $0 0.00% $7,750 $0 0.00%
County of CurrituckDNS-C) X X X X X X X X X X X X X X 0.00% 0.00% $0 $0 $0 $0 $0 $0 $0 $0 0.00% $0 $0 0.00%
County of Dare X X X X X X X X X X X X X X 0.00% 0.00% $0 $0 $0 $0 $0 $0 $0 $0 0.00% $0 $0 0.00%
County of Davidson X X X X X X X X X X X X X X 0.00% 0.00% $0 $0 $0 $0 $0 $0 $0 $0 0.00% $0 $0 0.00%
County of EdgecombeDNS-C) X X X X X X X X X X X X X X 0.00% 0.00% $0 $0 $0 $0 $0 $0 $0 $0 0.00% $0 $0 0.00%
County of Gaston DNS-C) X X X X X X X X X X X X X X 0.00% 0.00% $0 $0 $0 $0 $0 $0 $0 $0 0.00% $497,430 $0 0.00%
County of Graham DNS-C) X X X X X X X X X X X X X X 0.00% 0.00% $0 $0 $0 $0 $0 $0 $0 $0 0.00% $0 $0 0.00%
County of Granville X X X X X X X X X X X X X X 0.00% 0.00% $0 $0 $0 $0 $0 $0 $0 $0 0.00% $0 $0 0.00%
County of Guilford X X X X X X X X X X X X X X 15.75% 0.00% $1,044,498 $4,230 $0 $0 $0 $91,726 $0 $95,956 9.19% $1,517,127 $170,411 11.23%
County of Harnett X X X X X X X X X X X X X X 0.00% 17.74% $0 $0 $0 $0 $0 $0 $0 $0 0.00% $112,086 $19,885 17.74%
County of HokeDNS-C) X X X X X X X X X X X X X X 0.00% 11.78% $0 $0 $0 $0 $0 $0 $0 $0 0.00% $2,772,463 $326,499 11.78%
County of IredellDNS-C) X X X X X X X X X X X X X X 0.00% 10.94% $0 $0 $0 $0 $0 $0 $0 $0 0.00% $5,773,821 $631,449 10.94%
County of Lee DNS-C) X X X X X X X X X X X X X X 0.00% 0.00% $0 $0 $0 $0 $0 $0 $0 $0 0.00% $0 $0 0.00%
County of Mecklenburg X X X X X X X X X X X X X X 27.41% 2.94% $2,953,136 $47,708 $0 $0 $0 $0 $0 $47,708 1.62% $4,072,459 $133,188 3.27%
County of Moore(DNS-C) X X X X X X X X X X X X X X 0.00% 0.00% $0 $0 $0 $0 $0 $0 $0 $0 0.00% $0 $0 0.00%
County of Nash (DNS-C) X X X X X X X X X X X X X X 0.00% 0.00% $0 $0 $0 $0 $0 $0 $0 $0 0.00% $0 $0 0.00%
County of Onslow(DNS-C) X X X X X X X X X X X X X X 0.00% 0.00% $0 $0 $0 $0 $0 $0 $0 $0 0.00% $0 $0 0.00%
County of Polk (DNS-C) X X X X X X X X X X X X X X 0.00% 0.00% $0 $0 $0 $0 $0 $0 $0 $0 0.00% $0 $0 0.00%
County of Randolph(DNS-C) X X X X X X X X X X X X X X 0.00% 0.00% $0 $0 $0 $0 $0 $0 $0 $0 0.00% $0 $0 0.00%
County of Rockingham X X X X X X X X X X X X X X 37.60% 0.00% $0 $0 $0 $0 $0 $0 $0 $0 0.00% $56,576 $21,275 37.60%
County of Sampson X X X X X X X X X X X X X X 0.00% 0.00% $0 $0 $0 $0 $0 $0 $0 $0 0.00% $0 $0 0.00%
County of Surry X X X X X X X X X X X X X X 0.00% 0.00% $0 $0 $0 $0 $0 $0 $0 $0 0.00% $294,265 $0 0.00%
County of Transylvania(DNS-C) X X X X X X X X X X X X X X 0.00% 0.00% $0 $0 $0 $0 $0 $0 $0 $0 0.00% $0 $0 0.00%
County of Union(DNS-C) X X X X X X X X X X X X X X 0.00% 0.00% $0 $0 $0 $0 $0 $0 $0 $0 0.00% $0 $0 0.00%
Year-to-Date3rd Quarter HUB Construction Report - Construction Projects3rd Quarter HUB Purchasing Report - Goods
and ServicesYear-to-Date
K:\Hubrpt_Purchase and Construction\FY'05-07\Quarter and Annual\06-07Counties 3 - 3.7.1 Source: HUBSCO Construction Reporting SystemRun Date: 7/11/2007

NORTH CAROLINA DEPARTMENT OF ADMINISTRATION
OFFICE FOR HISTORICALLY UNDERUTILIZED BUSINESSES
Purchasing and Construction Reports
Counties - 3rd Quarter 2006-07(Jan.1, 2007 - March 31, 2007)
3rd Quarter 2007-07(Jan.1 - March 31, 2007)
1st Qtr
2nd Qtr
1st Qtr
2nd Qtr
Public Entity Type/Entity
To
tal H
UB
(%
)
To
tal H
UB
(%
)
To
tal
Pu
rch
asin
g($
)
MB
E (
$)
WB
E (
$)
DB
E-O
($)
DB
E (
$)
NP
WC
($)
Su
b (
$)
To
tal H
UB
($)
To
tal H
UB
(%
)
To
tal
Pu
rch
asin
g (
$)
To
tal H
UB
($)
To
tal H
UB
(%
)
To
tal H
UB
(%
)
To
tal H
UB
(%
)
To
tal
Co
nst
ruct
ion
($
)
B($
)
H($
)
AA
($)
AI(
$)
WF
($)
SE
($)
To
tal H
UB
($)
To
tal H
UB
(%
)
To
tal
Co
ns
tru
cti
on
($
)
To
tal
HU
B (
$)
To
tal
HU
B (
%)
Year-to-Date3rd Quarter HUB Construction Report - Construction Projects3rd Quarter HUB Purchasing Report - Goods
and ServicesYear-to-Date
COUNTIES - Contd…County of Vance X X X X X X X X X X X X X X 0.00% 0.00% $0 $0 $0 $0 $0 $0 $0 $0 0.00% $0 $0 0.00%
County of Wake X X X X X X X X X X X X X X 6.96% 21.91% $375,146 $0 $0 $131,299 $0 $0 $0 $131,299 35.00% $20,522,103 $3,252,607 15.85%
County of Warren(DNS-C) X X X X X X X X X X X X X X 0.00% 0.00% $0 $0 $0 $0 $0 $0 $0 $0 0.00% $610,360 $0 0.00%
County of Washington X X X X X X X X X X X X X X 0.00% 0.00% $0 $0 $0 $0 $0 $0 $0 $0 0.00% $0 $0 0.00%
County of Watauga( DNS-C) X X X X X X X X X X X X X X 0.00% 0.00% $0 $0 $0 $0 $0 $0 $0 $0 0.00% $0 $0 0.00%
TOTALS - - 7.77% 16.63% $4,420,220 $51,938 $0 $131,299 $0 $91,726 $0 $274,963 6.22% $37,079,907 $4,797,754 12.94%
% of HUB Participation 1.18% 0.00% 2.97% 0.00% 2.08% 0.00% 6.22% 12.94%
%of Minority Participation against Total HUB $ 18.89% 0.00% 47.75% 0.00% 33.36% 0.00%
LEGEND: LEGEND: LEGEND:
DNS-C - Categories with blanks or blank space indicate MBE - Minority Business Enterprise B - Black
entity "DID NOT SUBMIT" Construction Report WBE - Woman Business Enterprise H - Hispanic
DNS-P - Categories with blanks or blank space indicate DBE-O- Disabled - Owned Business Enterprise AA - Asian-American
entity "DID NOT SUBMIT" Purchasing Report DBE - Disabled Business Enterprise AI - American Indian
X - no reporting requirements NPWC - Non - profit Work Center for the Blind & Severely Disabled WF - White Female
Sub - HUB Subcontractor SE - Socially and Economically Disadvantaged
Note:
1. When a construction project is finalized (submitted) by an entiity, HUBSCO system will update
to the relevant quarter when the project was completed
K:\Hubrpt_Purchase and Construction\FY'05-07\Quarter and Annual\06-07Counties 3 - 3.7.2 Source: HUBSCO Construction Reporting SystemRun Date: 7/11/2007

NORTH CAROLINA DEPARTMENT OF ADMINISTRATION
OFFICE FOR HISTORICALLY UNDERUTILIZED BUSINESSES
Purchasing and Construction Reports - Municipalities - 3rd Quarter 2006-07(Jan. 1, 2007 - March 31, 2007)
3rd Quarter 2006-07(Jan.1 - March 31, 2007)
1st Qtr
2nd Qtr
1st Qtr
2nd Qtr
Public Entity Type/Entity
To
tal
HU
B (
%)
To
tal
HU
B (
%)
To
tal
Pu
rch
as
ing
($)
MB
E (
$)
WB
E (
$)
DB
E-O
($
)
DB
E (
$)
NP
WC
($
)
Su
b (
$)
To
tal
HU
B (
$)
To
tal
HU
B (
%)
To
tal
Pu
rch
as
ing
($
)
To
tal
HU
B (
$)
To
tal
HU
B (
%)
To
tal
HU
B (
%)
To
tal
HU
B (
%)
To
tal
Co
ns
tru
cti
on
($
)
B($
)
H($
)
AA
($)
AI(
$)
WF
($)
SE
($)
To
tal
HU
B (
$)
To
tal
HU
B (
%)
To
tal
Co
nst
ruct
ion
($
)
To
tal
HU
B (
$)
To
tal
HU
B (
%)
MUNICIPALITIES
City of Albemarle X X X X X X X X X X X X X X 0.00% 1.27% $301,573 $0 $0 $0 $0 $0 $0 $0 0.00% $876,812 $5,173 0.59%
City of Asheboro X X X X X X X X X X X X X X 0.00% 0.00% $0 $0 $0 $0 $0 $0 $0 $0 0.00% $0 $0 0.00%
City of Asheville X X X X X X X X X X X X X X 0.00% 0.00% $0 $0 $0 $0 $0 $0 $0 $0 0.00% $0 $0 0.00%
City of Charlotte X X X X X X X X X X X X X X 5.08% 22.24% $403,718 $0 $0 $0 $0 $1,060 $0 $1,060 0.26% $1,449,775 $97,178 6.70%
City of Concord(DNS-C) X X X X X X X X X X X X X X 0.00% 0.00% $0 $0 $0 $0 $0 $0 $0 $0 0.00% $0 $0 0.00%
City of Durham(DNS-C) X X X X X X X X X X X X X X 0.00% 28.73% $515,715 $3,367 $1,903 $0 $0 $10,100 $0 $15,370 2.98% $856,865 $113,370 13.23%
City of Eden X X X X X X X X X X X X X X 0.00% 5.26% $0 $0 $0 $0 $0 $0 $0 $0 0.00% $649,219 $32,710 5.04%
City of Elizabeth City X X X X X X X X X X X X X X 0.00% 0.00% $0 $0 $0 $0 $0 $0 $0 $0 0.00% $644,935 $0 0.00%
City of Fayetteville X X X X X X X X X X X X X X 0.00% 0.00% $0 $0 $0 $0 $0 $0 $0 $0 0.00% $0 $0 0.00%
City of Greenville (DNS-C) X X X X X X X X X X X X X X 0.00% 0.00% $0 $0 $0 $0 $0 $0 $0 $0 0.00% $0 $0 0.00%
City of Hickory X X X X X X X X X X X X X X 0.00% 0.00% $0 $0 $0 $0 $0 $0 $0 $0 0.00% $0 $0 0.00%
City of High Point (DNS-C) X X X X X X X X X X X X X X 0.00% 0.00% $0 $0 $0 $0 $0 $0 $0 $0 0.00% $0 $0 0.00%
City of Jacksonville X X X X X X X X X X X X X X 0.00% 0.00% $0 $0 $0 $0 $0 $0 $0 $0 0.00% $684,249 $0 0.00%
City of Kings Mountain X X X X X X X X X X X X X X 0.00% 0.00% $0 $0 $0 $0 $0 $0 $0 $0 0.00% $0 $0 0.00%
City of Lexington(DNS-C) X X X X X X X X X X X X X X 0.00% 0.00% $0 $0 $0 $0 $0 $0 $0 $0 0.00% $0 $0 0.00%
City of Raleigh (DNS-C) X X X X X X X X X X X X X X 0.00% 0.00% $0 $0 $0 $0 $0 $0 $0 $0 0.00% $0 $0 0.00%
City of Reidsville X X X X X X X X X X X X X X 3.25% 0.00% $0 $0 $0 $0 $0 $0 $0 $0 0.00% $290,993 $8,271 2.84%
City of Roanoke Rapids X X X X X X X X X X X X X X 0.00% 0.00% $0 $0 $0 $0 $0 $0 $0 $0 0.00% $0 $0 0.00%
City of Rocky Mount (DNS-C) X X X X X X X X X X X X X X 0.00% 0.00% $221,651 $0 $0 $0 $0 $0 $0 $0 0.00% $221,651 $0 0.00%
City of Sanford(DNS-C) X X X X X X X X X X X X X X 0.00% 0.00% $0 $0 $0 $0 $0 $0 $0 $0 0.00% $0 $0 0.00%
City of Southport (DNS-C) X X X X X X X X X X X X X X 0.00% 0.00% $0 $0 $0 $0 $0 $0 $0 $0 0.00% $0 $0 0.00%
City of Statesville X X X X X X X X X X X X X X 0.00% 0.00% $0 $0 $0 $0 $0 $0 $0 $0 0.00% $34,154 $0 0.00%
City of Thomasville (DNS-C) X X X X X X X X X X X X X X 0.00% 0.00% $0 $0 $0 $0 $0 $0 $0 $0 0.00% $0 $0 0.00%
City of Wilmington X X X X X X X X X X X X X X 0.00% 0.00% $0 $0 $0 $0 $0 $0 $0 $0 0.00% $0 $0 0.00%
City of Wilson X X X X X X X X X X X X X X 0.00% 0.00% $0 $0 $0 $0 $0 $0 $0 $0 0.00% $0 $0 0.00%
City of Winston-Salem X X X X X X X X X X X X X X 7.23% 17.11% $9,479,481 $387,731 $3,055 $0 $121,118 $465,242 $0 $977,146 10.31% $22,157,983 $2,765,863 12.48%
Public Works Commission - Fayetteville X X X X X X X X X X X X X X 0.00% 0.00% $0 $0 $0 $0 $0 $0 $0 $0 0.00% $48,529 $0 0.00%
Town of Blowing Rock (DNS-C) X X X X X X X X X X X X X X 0.00% 0.00% $0 $0 $0 $0 $0 $0 $0 $0 0.00% $0 $0 0.00%
Town of Bolivia (DNS-C) X X X X X X X X X X X X X X 0.00% 0.00% $0 $0 $0 $0 $0 $0 $0 $0 0.00% $0 $0 0.00%
Town of Calabash (DNS-C) X X X X X X X X X X X X X X 0.00% 0.00% $0 $0 $0 $0 $0 $0 $0 $0 0.00% $105,616 $0 0.00%
Town of Calypso (DNS-C) X X X X X X X X X X X X X X 0.00% 0.00% $0 $0 $0 $0 $0 $0 $0 $0 0.00% $0 $0 0.00%
Town of Cape Cateret (DNS-C) X X X X X X X X X X X X X X 0.00% 0.00% $0 $0 $0 $0 $0 $0 $0 $0 0.00% $0 $0 0.00%
Town of Carrboro (DNS-C) X X X X X X X X X X X X X X 0.00% 0.00% $0 $0 $0 $0 $0 $0 $0 $0 0.00% $0 $0 0.00%
Town of Chapel Hill X X X X X X X X X X X X X X 0.00% 0.00% $0 $0 $0 $0 $0 $0 $0 $0 0.00% $0 $0 0.00%
Town of Harrells (DNS) X X X X X X X X X X X X X X 0.00% 0.00% $0 $0 $0 $0 $0 $0 $0 $0 0.00% $0 $0 0.00%
Town of Hoffman (DNS-C) X X X X X X X X X X X X X X 0.00% 0.00% $0 $0 $0 $0 $0 $0 $0 $0 0.00% $0 $0 0.00%
Town of Holly Ridge X X X X X X X X X X X X X X 0.00% 0.00% $0 $0 $0 $0 $0 $0 $0 $0 0.00% $0 $0 0.00%
Town of Kitty Hawk X X X X X X X X X X X X X X 0.00% 0.00% $26,970 $0 $0 $0 $0 $0 $0 $0 0.00% $26,970 $0 0.00%
Year-to-Date3rd Quarter HUB Construction Report - Construction Projects3rd Quarter HUB Purchasing Report -
Goods and ServicesYear-to-Date
K:\Hubrpt_Purchase and Construction\FY'06-07\Quarter and Annual\06-07MNCPTY 3 - 3.8-1 Source:HUBSCO Construction Reporting SystemRun Date: 7/11/2007

NORTH CAROLINA DEPARTMENT OF ADMINISTRATION
OFFICE FOR HISTORICALLY UNDERUTILIZED BUSINESSES
Purchasing and Construction Reports - Municipalities - 3rd Quarter 2006-07(Jan. 1, 2007 - March 31, 2007)
3rd Quarter 2006-07(Jan.1 - March 31, 2007)
1st Qtr
2nd Qtr
1st Qtr
2nd Qtr
Public Entity Type/Entity
To
tal
HU
B (
%)
To
tal
HU
B (
%)
To
tal
Pu
rch
as
ing
($)
MB
E (
$)
WB
E (
$)
DB
E-O
($
)
DB
E (
$)
NP
WC
($
)
Su
b (
$)
To
tal
HU
B (
$)
To
tal
HU
B (
%)
To
tal
Pu
rch
as
ing
($
)
To
tal
HU
B (
$)
To
tal
HU
B (
%)
To
tal
HU
B (
%)
To
tal
HU
B (
%)
To
tal
Co
ns
tru
cti
on
($
)
B($
)
H($
)
AA
($)
AI(
$)
WF
($)
SE
($)
To
tal
HU
B (
$)
To
tal
HU
B (
%)
To
tal
Co
nst
ruct
ion
($
)
To
tal
HU
B (
$)
To
tal
HU
B (
%)
Year-to-Date3rd Quarter HUB Construction Report - Construction Projects3rd Quarter HUB Purchasing Report -
Goods and ServicesYear-to-Date
MUNICIPALITIES - Contd…
Town of Lewisville (DNS) X X X X X X X X X X X X X X 0.00% 0.00% $0 $0 $0 $0 $0 $0 $0 $0 0.00% $0 $0 0.00%
Town of Mills River (DNS-C) X X X X X X X X X X X X X X 0.00% 0.00% $0 $0 $0 $0 $0 $0 $0 $0 0.00% $0 $0 0.00%
Town of Mt. Gilead (DNS-C) X X X X X X X X X X X X X X 0.00% 0.00% $0 $0 $0 $0 $0 $0 $0 $0 0.00% $0 $0 0.00%
Town of Princeton (DNS-C) X X X X X X X X X X X X X X 0.00% 0.00% $0 $0 $0 $0 $0 $0 $0 $0 0.00% $0 $0 0.00%
Town of Salemburg (DNS-C) X X X X X X X X X X X X X X 0.00% 0.00% $0 $0 $0 $0 $0 $0 $0 $0 0.00% $0 $0 0.00%
Town of Saratoga (DNS-C) X X X X X X X X X X X X X X 0.00% 0.00% $0 $0 $0 $0 $0 $0 $0 $0 0.00% $0 $0 0.00%
Town of Southern Pines (DNS-C) X X X X X X X X X X X X X X 0.00% 0.00% $0 $0 $0 $0 $0 $0 $0 $0 0.00% $0 $0 0.00%
Town of Spring Lake (DNS-C) X X X X X X X X X X X X X X 21.27% 0.00% $0 $0 $0 $0 $0 $0 $0 $0 0.00% $2,669,930 $568,001 21.27%
Town of Spruce Pine (DNS-C) X X X X X X X X X X X X X X 0.00% 0.00% $0 $0 $0 $0 $0 $0 $0 $0 0.00% $0 $0 0.00%
Town of Tarboro X X X X X X X X X X X X X X 0.00% 0.00% $0 $0 $0 $0 $0 $0 $0 $0 0.00% $0 $0 0.00%
Town of Topsail Beach (DNS-C) X X X X X X X X X X X X X X 0.00% 0.00% $0 $0 $0 $0 $0 $0 $0 $0 0.00% $0 $0 0.00%
Town of Turkey (DNS-C) X X X X X X X X X X X X X X 0.00% 0.00% $0 $0 $0 $0 $0 $0 $0 $0 0.00% $0 $0 0.00%
Town of Vass (DNS) X X X X X X X X X X X X X X 0.00% 0.00% $0 $0 $0 $0 $0 $0 $0 $0 0.00% $0 $0 0.00%
Town of Wagram (DNS-C) X X X X X X X X X X X X X X 0.00% 0.00% $0 $0 $0 $0 $0 $0 $0 $0 0.00% $0 $0 0.00%
Town of Wentworth (DNS-C) X X X X X X X X X X X X X X 0.00% 0.00% $0 $0 $0 $0 $0 $0 $0 $0 0.00% $0 $0 0.00%
Town of White Lake (DNS-C) X X X X X X X X X X X X X X 0.00% 0.00% $0 $0 $0 $0 $0 $0 $0 $0 0.00% $0 $0 0.00%
Town of Winterville (DNS) X X X X X X X X X X X X X X 0.00% 0.00% $0 $0 $0 $0 $0 $0 $0 $0 0.00% $0 $0 0.00%
Town of Zebulon X X X X X X X X X X X X X X 0.00% 0.00% $16,724 $0 $0 $0 $0 $0 $0 $0 0.00% $0 $0 0.00%
Village of Alamance (DNS) X X X X X X X X X X X X X X 0.00% 0.00% $0 $0 $0 $0 $0 $0 $0 $0 0.00% $0 $0 0.00%
Village of Clemmons (DNS) X X X X X X X X X X X X X X 0.00% 0.00% $0 $0 $0 $0 $0 $0 $0 $0 0.00% $0 $0 0.00%
Village of Forest Hills (DNS-C) X X X X X X X X X X X X X X 0.00% 0.00% $0 $0 $0 $0 $0 $0 $0 $0 0.00% $0 $0 0.00%
Village of Tobaccoville X X X X X X X X X X X X X X 0.00% 0.00% $0 $0 $0 $0 $0 $0 $0 $0 0.00% $0 $0 0.00%
Village of Wesley Chapel (DNS-C) X X X X X X X X X X X X X X 0.00% 0.00% $0 $0 $0 $0 $0 $0 $0 $0 0.00% $0 $0 0.00%
TOTALS - - 9.84% 15.95% $10,965,832 $391,098 $4,958 $0 $121,118 $476,402 $0 $993,576 9.06% $30,734,405 $3,590,566 11.68%
% of HUB Participation 3.57% 0.05% 0.00% 1.10% 4.34% 0.00% 9.06% 11.68%
%of Minority Participation against Total HUB $ 39.36% 0.50% 0.00% 12.19% 47.95% 0.00%
LEGEND: LEGEND: LEGEND:
DNS-C - Categories with blanks or blank space indicate MBE - Minority Business Enterprise B - Black
entity "DID NOT SUBMIT" Construction Report WBE - Woman Business Enterprise H - Hispanic
DNS-P - Categories with blanks or blank space indicate DBE-O- Disabled - Owned Business Enterprise AA - Asian-American
entity "DID NOT SUBMIT" Purchasing Report DBE - Disabled Business Enterprise AI - American Indian
X - no reporting requirements NPWC - Non - profit Work Center for the Blind & Severely Disabled WF - White Female
Note: Sub - HUB Subcontractor SE - Socially and Economically Disadvantaged
1. When a construction project is finalized (submitted) by an entiity, HUBSCO system will update to the relevant quarter when the project was completed
K:\Hubrpt_Purchase and Construction\FY'06-07\Quarter and Annual\06-07MNCPTY 3 - 3.8-2 Source:HUBSCO Construction Reporting SystemRun Date: 7/11/2007

NORTH CAROLINA DEPARTMENT OF ADMINISTRATION
OFFICE FOR HISTORICALLY UNDERUTILIZED BUSINESSES
Purchasing and Construction Reports
Hospital Associations - 3rd Quarter 2006-07(Jan.1, 2007 - March 31, 2007)
3rd Quarter 2006-07(Jan.1 - March 31, 2007)
1st Qtr
2nd Qtr
1st Qtr
2nd Qtr
Public Entity Type/Entity
To
tal
HU
B (
%)
To
tal
HU
B (
%)
To
tal
Pu
rch
asin
g($
)
MB
E (
$)
WB
E (
$)
DB
E-O
($)
DB
E (
$)
NP
WC
($)
Su
b (
$)
To
tal
HU
B (
$)
To
tal
HU
B (
%)
To
tal
Pu
rch
asin
g
($)
To
tal
HU
B (
$)
To
tal
HU
B (
%)
To
tal
HU
B (
%)
To
tal
HU
B (
%)
To
tal
Co
nst
ruct
ion
($
)
B($
)
H($
)
AA
($)
AI(
$)
WF
($)
SE
($)
To
tal
HU
B (
$)
To
tal
HU
B (
%)
To
tal
Co
nst
ruct
ion
($
)
To
tal
HU
B (
$)
To
tal
HU
B (
%)
HOSPITAL ASSOCIATIONSAlbemarle Hospital Authority (DNS-C) X X X X X X X X X X X X X X 0.00% 0.00% $0 $0 $0 $0 $0 $0 $0 $0 0.00% $313,447 $0 0.00%
Cape Fear Valley Health System X X X X X X X X X X X X X X 0.00% 0.00% $0 $0 $0 $0 $0 $0 $0 $0 0.00% $0 $0 0.00%
Carteret County General Hospital Corporation (DNS-C) X X X X X X X X X X X X X X 0.00% 0.00% $0 $0 $0 $0 $0 $0 $0 $0 0.00% $0 $0 0.00%
Granville Medical Center X X X X X X X X X X X X X X 0.00% 0.00% $5,355 $0 $0 $0 $0 $5,355 $0 $5,355 100% $5,355 $5,355 100%
Iredell Memorial Hospital, Incorporated (DNS-C) X X X X X X X X X X X X X X 0.00% 0.00% $0 $0 $0 $0 $0 $0 $0 $0 0.00% $0 $0 0.00%
New Hanover Health Network(DNS-C) X X X X X X X X X X X X X X 2.90% 0.00% $833,238 $0 $0 $0 $134,706 $55,745 $0 $190,451 22.86% $1,136,902 $199,266 17.53%
Stokes-Reynolds Memorial Hospital, Inc. X X X X X X X X X X X X X X 0.00% 0.00% $0 $0 $0 $0 $0 $0 $0 $0 0.00% $0 $0 0.00%
TOTALS - 1.43% 0.00% $838,593 $0 $0 $0 $134,706 $61,100 $0 $195,806 23.35% $1,455,704 $204,621 14.06%
% of HUB Participation 0.00% 0.00% 0.00% 16.06% 7.29% 0.00% 23.35% 14.06%
%of Minority Participation against Total HUB $ 0.00% 0.00% 0.00% 68.80% 31.20% 0.00%
LEGEND LEGEND: LEGEND:
MBE - Minority Business Enterprise B - Black
DNS-C - Categories with blanks or blank space indicate WBE - Woman Business Enterprise H - Hispanic
entity "DID NOT SUBMIT" Construction Report DBE-O- Disabled - Owned Business Enterprise AA - Asian-American
DNS-P - Categories with blanks or blank space indicate DBE - Disabled Business Enterprise AI - American Indian
entity "DID NOT SUBMIT" Purchasing Report NPWC - Non - profit Work Center for the Blind & Severely Disabled WF - White Female
X - no reporting requirements Sub - HUB Subcontractor SE - Socially and Economically Disadvantaged
Note:
1. When a construction project is finalized (submitted) by an entiity, HUBSCO system will update
to the relevant quarter when the project was completed
Year-to-Date3rd Quarter HUB Construction Report - Construction Projects3rd Quarter HUB Purchasing Report -
Goods and ServicesYear-to-Date
K:\Hubrpt_Purchase and Construction\FY'06-07\Quarter and Annual\06-07HA 3 - 3.9 Source:HUBSCO Construction Reporting SystemRun Date: 7/11/2007
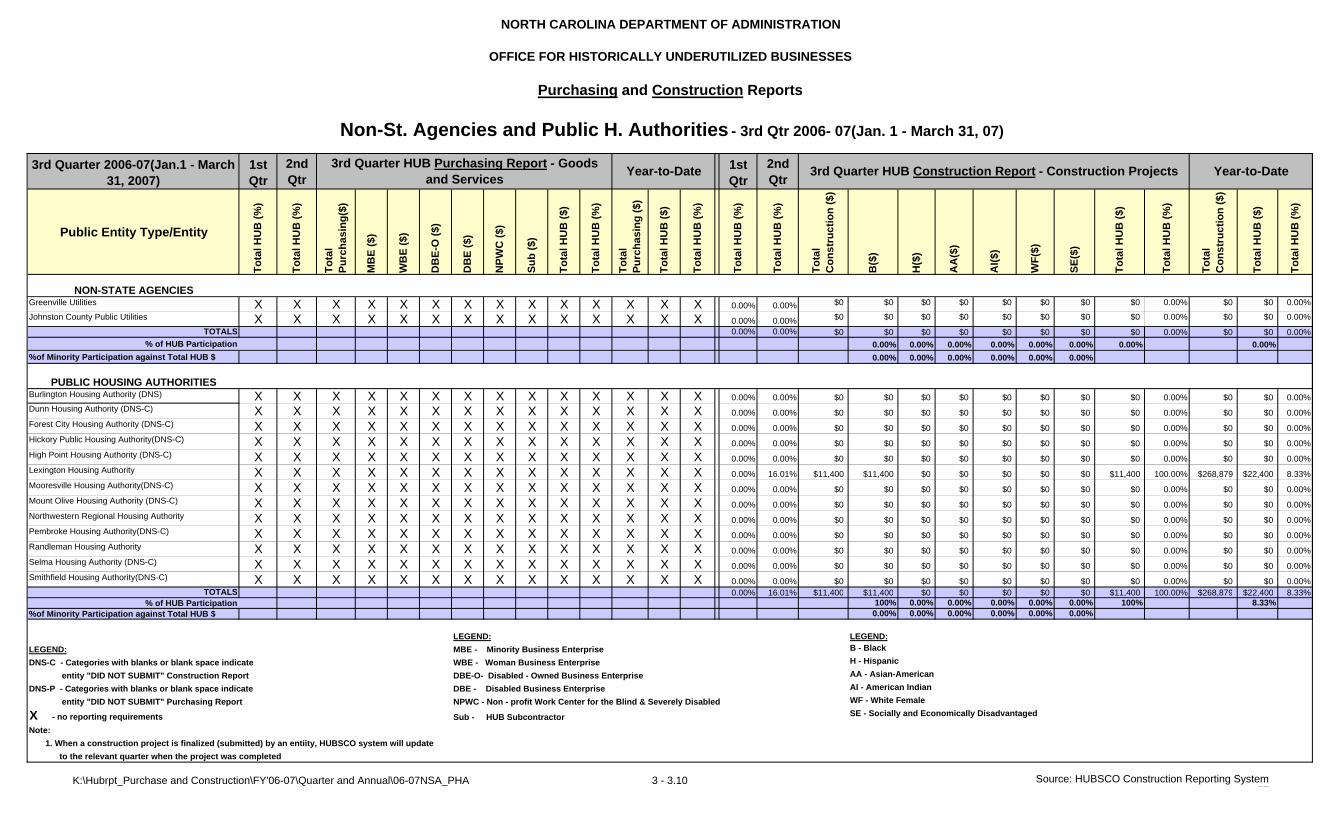
NORTH CAROLINA DEPARTMENT OF ADMINISTRATION
OFFICE FOR HISTORICALLY UNDERUTILIZED BUSINESSES
Purchasing and Construction Reports
Non-St. Agencies and Public H. Authorities - 3rd Qtr 2006- 07(Jan. 1 - March 31, 07)
3rd Quarter 2006-07(Jan.1 - March 31, 2007)
1st Qtr
2nd Qtr
1st Qtr
2nd Qtr
Public Entity Type/Entity
To
tal H
UB
(%
)
To
tal H
UB
(%
)
To
tal
Pu
rch
as
ing
($)
MB
E (
$)
WB
E (
$)
DB
E-O
($
)
DB
E (
$)
NP
WC
($
)
Su
b (
$)
To
tal H
UB
($
)
To
tal H
UB
(%
)
To
tal
Pu
rch
as
ing
($
)
To
tal H
UB
($
)
To
tal H
UB
(%
)
To
tal H
UB
(%
)
To
tal H
UB
(%
)
To
tal
Co
ns
tru
cti
on
($
)
B($
)
H($
)
AA
($)
AI(
$)
WF
($)
SE
($)
To
tal H
UB
($
)
To
tal H
UB
(%
)
To
tal
Co
ns
tru
cti
on
($
)
To
tal H
UB
($
)
To
tal H
UB
(%
)
NON-STATE AGENCIESGreenville Utilities X X X X X X X X X X X X X X 0.00% 0.00% $0 $0 $0 $0 $0 $0 $0 $0 0.00% $0 $0 0.00%
Johnston County Public Utilities X X X X X X X X X X X X X X 0.00% 0.00% $0 $0 $0 $0 $0 $0 $0 $0 0.00% $0 $0 0.00%
TOTALS - 0.00% 0.00% $0 $0 $0 $0 $0 $0 $0 $0 0.00% $0 $0 0.00%
% of HUB Participation 0.00% 0.00% 0.00% 0.00% 0.00% 0.00% 0.00% 0.00%
%of Minority Participation against Total HUB $ 0.00% 0.00% 0.00% 0.00% 0.00% 0.00%
PUBLIC HOUSING AUTHORITIESBurlington Housing Authority (DNS) X X X X X X X X X X X X X X 0.00% 0.00% $0 $0 $0 $0 $0 $0 $0 $0 0.00% $0 $0 0.00%Dunn Housing Authority (DNS-C) X X X X X X X X X X X X X X 0.00% 0.00% $0 $0 $0 $0 $0 $0 $0 $0 0.00% $0 $0 0.00%Forest City Housing Authority (DNS-C) X X X X X X X X X X X X X X 0.00% 0.00% $0 $0 $0 $0 $0 $0 $0 $0 0.00% $0 $0 0.00%Hickory Public Housing Authority(DNS-C) X X X X X X X X X X X X X X 0.00% 0.00% $0 $0 $0 $0 $0 $0 $0 $0 0.00% $0 $0 0.00%High Point Housing Authority (DNS-C) X X X X X X X X X X X X X X 0.00% 0.00% $0 $0 $0 $0 $0 $0 $0 $0 0.00% $0 $0 0.00%Lexington Housing Authority X X X X X X X X X X X X X X 0.00% 16.01% $11,400 $11,400 $0 $0 $0 $0 $0 $11,400 100.00% $268,879 $22,400 8.33%Mooresville Housing Authority(DNS-C) X X X X X X X X X X X X X X 0.00% 0.00% $0 $0 $0 $0 $0 $0 $0 $0 0.00% $0 $0 0.00%Mount Olive Housing Authority (DNS-C) X X X X X X X X X X X X X X 0.00% 0.00% $0 $0 $0 $0 $0 $0 $0 $0 0.00% $0 $0 0.00%Northwestern Regional Housing Authority X X X X X X X X X X X X X X 0.00% 0.00% $0 $0 $0 $0 $0 $0 $0 $0 0.00% $0 $0 0.00%Pembroke Housing Authority(DNS-C) X X X X X X X X X X X X X X 0.00% 0.00% $0 $0 $0 $0 $0 $0 $0 $0 0.00% $0 $0 0.00%Randleman Housing Authority X X X X X X X X X X X X X X 0.00% 0.00% $0 $0 $0 $0 $0 $0 $0 $0 0.00% $0 $0 0.00%Selma Housing Authority (DNS-C) X X X X X X X X X X X X X X 0.00% 0.00% $0 $0 $0 $0 $0 $0 $0 $0 0.00% $0 $0 0.00%Smithfield Housing Authority(DNS-C) X X X X X X X X X X X X X X 0.00% 0.00% $0 $0 $0 $0 $0 $0 $0 $0 0.00% $0 $0 0.00%
TOTALS - 0.00% 16.01% $11,400 $11,400 $0 $0 $0 $0 $0 $11,400 100.00% $268,879 $22,400 8.33%% of HUB Participation 100% 0.00% 0.00% 0.00% 0.00% 0.00% 100% 8.33%
%of Minority Participation against Total HUB $ 0.00% 0.00% 0.00% 0.00% 0.00% 0.00%
LEGEND: LEGEND:
LEGEND: MBE - Minority Business Enterprise B - Black
DNS-C - Categories with blanks or blank space indicate WBE - Woman Business Enterprise H - Hispanic
entity "DID NOT SUBMIT" Construction Report DBE-O- Disabled - Owned Business Enterprise AA - Asian-American
DNS-P - Categories with blanks or blank space indicate DBE - Disabled Business Enterprise AI - American Indian
entity "DID NOT SUBMIT" Purchasing Report NPWC - Non - profit Work Center for the Blind & Severely Disabled WF - White Female
X - no reporting requirements Sub - HUB Subcontractor SE - Socially and Economically Disadvantaged
Note:
1. When a construction project is finalized (submitted) by an entiity, HUBSCO system will update
to the relevant quarter when the project was completed
Year-to-Date3rd Quarter HUB Construction Report - Construction Projects3rd Quarter HUB Purchasing Report - Goods
and ServicesYear-to-Date
K:\Hubrpt_Purchase and Construction\FY'06-07\Quarter and Annual\06-07NSA_PHA 3 - 3.10 Source: HUBSCO Construction Reporting SystemRun Date: 7/11/2007

NORTH CAROLINA DEPARTMENT OF ADMINISTRATION
OFFICE FOR HISTORICALLY UNDERUTILIZED BUSINESSES
Purchasing and Construction Reports
Water and Sewer, and Airport Authorities - 3rd Qtr 2006-07(Jan. 1, 07 - March 31, 07)
3rd Quarter 2006-07(Jan.1 - March 31, 2007)
1st Qtr
2nd Qtr
1st Qtr
2nd Qtr
Public Entity Type/Entity
To
tal
HU
B (
%)
To
tal
HU
B (
%)
To
tal
Pu
rch
asin
g($
)
MB
E (
$)
WB
E (
$)
DB
E-O
($)
DB
E (
$)
NP
WC
($)
Su
b (
$)
To
tal
HU
B (
$)
To
tal
HU
B (
%)
To
tal
Pu
rch
asin
g (
$)
To
tal
HU
B (
$)
To
tal
HU
B (
%)
To
tal
HU
B (
%)
To
tal
HU
B (
%)
To
tal
Co
nst
ruct
ion
($
)
B($
)
H($
)
AA
($)
AI(
$)
WF
($)
SE
($)
To
tal
HU
B (
$)
To
tal
HU
B (
%)
To
tal
Co
nst
ruct
ion
($
)
To
tal
HU
B (
$)
To
tal
HU
B (
%)
WATER AND SEWER AUTHORITIES Onslow Water and Sewer Authority X X X X X X X X X X X X X X 0.00% 0.00% $0 $0 $0 $0 $0 $0 $0 $0 0.00% $0 $0 0.00%
Piedmont Triad Regional Water Authority (DNS-C) X X X X X X X X X X X X X X 0.00% 0.00% $0 $0 $0 $0 $0 $0 $0 $0 0.00% $0 $0 0.00%
Sewerage District - Buncombe County Metropolitan X X X X X X X X X X X X X X 0.00% 0.00% $0 $0 $0 $0 $0 $0 $0 $0 0.00% $0 $0 0.00%
Water and Sewer Authority - Cabarrus County X X X X X X X X X X X X X X 0.00% 0.00% $0 $0 $0 $0 $0 $0 $0 $0 0.00% $0 $0 0.00%
Water and Sewer Authority - Orange County (DNS-C) X X X X X X X X X X X X X X 0.00% 0.00% $0 $0 $0 $0 $0 $0 $0 $0 0.00% $0 $0 0.00%
TOTALS - 0.00% 0.00% $0 $0 $0 $0 $0 $0 $0 $0 0.00% $0 $0 0.00%
% of HUB Participation
%of Minority Participation against Total HUB $
AIRPORT AUTHORITIES
Charlotte Douglas International Airport (DNS-C) X X X X X X X X X X X X X X 0.00% 0.00% $0 $0 $0 $0 $0 $0 $0 $0 0.00% $1,285,012 $0 0.00%
Laurinburg-Maxton Airport Commission X X X X X X X X X X X X X X 0.00% 0.00% $0 $0 $0 $0 $0 $0 $0 $0 0.00% $0 $0 0.00%
Piedmont Triad Airport Authority (DNS) X X X X X X X X X X X X X X 0.00% 0.00% $0 $0 $0 $0 $0 $0 $0 $0 0.00% $0 $0 0.00%
Raleigh-Durham Airport Authority (DNS-C) X X X X X X X X X X X X X X 0.00% 0.00% $0 $0 $0 $0 $0 $0 $0 $0 0.00% $0 $0 0.00%
TOTALS - - 0.00% 0.00% $0 $0 $0 $0 $0 $0 $0 $0 0.00% $1,285,012 $0 0.00%
% of HUB Participation 0.00%
%of Minority Participation against Total HUB $
LEGEND: LEGEND:
LEGEND: MBE - Minority Business Enterprise B - Black
DNS-C - Categories with blanks or blank space indicate WBE - Woman Business Enterprise H - Hispanic
entity "DID NOT SUBMIT" Construction Report DBE-O- Disabled - Owned Business Enterprise AA - Asian-American
DNS-P - Categories with blanks or blank space indicate DBE - Disabled Business Enterprise AI - American Indian
entity "DID NOT SUBMIT" Purchasing Report NPWC - Non - profit Work Center for the Blind & Severely Disabled WF - White Female
X - no reporting requirements Sub - HUB Subcontractor SE - Socially and Economically Disadvantaged
Note:
1. When a construction project is finalized (submitted) by an entiity, HUBSCO system will update
to the relevant quarter when the project was completed
Year-to-Date3rd Quarter HUB Construction Report - Construction
Projects3rd Quarter HUB Purchasing Report -
Goods and ServicesYear-to-Date
K:\Hubrpt_Purchase and Construction\FY'06-07\Quarter and Annual\06-07WS_AA 3 - 3.11 Source: HUBSCO Construction Reporting SystemRun Date: 7/11/2007

State of North Carolina
Department of Administration
OFFICE FOR HISTORICALLY UNDERUTILIZED BUSINESSES (HUB) PURCHASING (GOODS and SERVICES) and CONSTRUCTION REPORT
4th Quarter FY 06 - 07 (April 1, 2007 – June 30, 2007)
State of North Carolina
Michael F. Easley, Governor
N.C. Department of Administration Britt Cobb, Secretary
Office for Historically Underutilized Businesses
Bridget L. Wall, Assistant to Secretary for HUB Outreach Rick Baskett Sr., Deputy Director
Mathew Idiculla, Compliance Specialist
Prepared by: Office for Historically Underutilized Businesses 116 West Jones Street, Suite 2109 Raleigh, NC 27603

NORTH CAROLINA DEPARTMENT OF ADMINISTRATION
OFFICE FOR HISTORICALLY UNDERUTILIZED BUSINESSES
Purchasing and Construction Reports
SUMMARY - 4th Quarter 2006-07(April 1, 2007 - June 30, 2007)
4th Quarter 2006-07(April 1 - June 30,
2007)
1st Qtr
2nd Qtr
3rd Qtr
1st Qtr
2ndQtr
3rd Qtr
Public Entity Type
To
talH
UB
(%)
To
talH
UB
(%)
To
tal
HU
B (
%)
To
tal
Pu
rch
asin
g($
)
MB
E (
$)
WB
E (
$)
DB
E-O
($)
DB
E (
$)
NP
WC
($)
Su
b (
$)
To
tal
HU
B (
$)
To
tal
HU
B (
%)
To
tal
Pu
rch
asin
g (
$)
To
tal
HU
B (
$)
To
tal
HU
B (
%)
To
talH
UB
(%)
To
talH
UB
(%)
To
tal
HU
B (
%)
To
tal
Co
nst
ruct
ion
V
alu
e ($
)
B($
)
H($
)
AA
($)
AI(
$)
WF
($)
SE
($)
To
tal
HU
B (
$)
To
tal
HU
B (
%)
To
tal
Co
nst
ruct
ion
V
alu
e ($
)
To
tal
HU
B (
$)
To
tal
HU
B (
%)
CABINET AGENCIES 9.68% 9.14% 8.16% $309,553,628 $6,822,505 $18,187,564 $194,543 $186,581 $0 $0 $25,391,193 8.20% $1,126,524,167 $99,262,042 8.81% 0.00% 5.95% 14.85% $5,309,964 $0 $0 $0 $19,294 $1,361,645 $0 $1,380,939 26.01% $11,801,953 $2,067,495 17.52%
COUNCIL AGENCIES 3.29% 11.56% 10.86% $100,550,666 $1,040,583 $1,857,253 $244,327 $175 $0 $0 $3,142,338 3.13% $261,411,248 $14,790,787 5.66% 0.00% 0.00% 0.00% $0 $0 $0 $0 $0 $0 $0 $0 0.00% $0 $0 0.00%
SUPPORTING AGENCIES 17.26% 16.40% 23.99% $84,030,446 $919,300 $7,569,354 $26,914 $88,000 $0 $0 $8,603,568 10.24% $183,893,199 $27,570,191 14.99% 3.81% 0.00% 0.00% $686,919 $0 $0 $0 $0 $0 $0 $0 0.00% $5,575,692 $186,492 3.34%
COMMUNITY COLLEGES 6.30% 8.49% 8.04% $133,217,658 $2,326,318 $7,691,067 $239,509 $92,453 $178,250 $580 $10,528,176 7.90% $381,679,107 $29,455,081 7.72% 28.82% 21.38% 8.50% $30,168,218 $659,514 $524,371 $0 $105,920 $1,880,487 $799,070 $3,969,362 13.16% $65,633,699 $11,082,460 16.89%
PUBLIC SCHOOLS 9.91% 7.40% 7.56% $408,050,880 $8,408,476 $18,466,669 $2,188,087 $335,901 $283,102 $488,592 $30,170,827 7.39% $1,677,056,529 $139,154,658 8.30% 13.85% 15.99% 5.86% $110,245,809 $2,377,750 $1,385,703 $81,660 $56,125 $7,536,181 $5,041 $11,442,461 10.38% $241,295,774 $27,358,912 11.34%STATE
UNIVERSITIES 4.44% 5.53% 4.45% $363,020,368 $9,547,908 $11,452,207 $196,760 $33,356 $16,606 $3,373,176 $24,620,013 6.78% $1,164,741,410 $62,449,394 5.36% 12.90% 13.31% 15.89% $56,328,587 $1,201,773 $3,570,257 $114,825 $418,741 $4,732,165 $164,786 $10,202,547 18.11% $329,117,941 $47,487,471 14.43%
COUNTIES X X X X X X X X X X X X X X X 7.77% 16.63% 6.22% $13,123,847 $161,195 $107,827 $0 $0 $638,630 $0 $907,652 6.92% $50,203,754 $5,705,406 11.36%
MUNICIPALITIES X X X X X X X X X X X X X X X 9.84% 15.95% 9.06% $7,602,164 $311,229 $13,415 $0 $0 $116,761 $0 $441,405 5.81% $38,336,568 $4,031,971 10.52%
HOSPITAL ASSOCIATIONS X X X X X X X X X X X X X X X 1.43% 0.00% 23.35% $68,350 $0 $0 $0 $0 $0 $0 $0 0.00% $1,524,054 $204,621 13.43%
NON-STATE AGENCIES X X X X X X X X X X X X X X X 0.00% 0.00% 0.00% $0 $0 $0 $0 $0 $0 $0 $0 0.00% $0 $0 0.00%
PUBLIC HOUSING AUTHORITIES X X X X X X X X X X X X X X X 0.00% 16.01% 100.00% $5,300 $0 $0 $0 $0 $0 $0 $0 0.00% $274,179 $22,400 8.17%
WATER & SEWER AUTHORITIES X X X X X X X X X X X X X X X 0.00% 0.00% 0.00% $0 $0 $0 $0 $0 $0 $0 $0 0.00% $0 $0 0.00%
AIRPORT AUTHORITIES X X X X X X X X X X X X X X X 0.00% 0.00% 0.00% $36,021,553 $0 $570,000 $0 $280,000 $1,370,000 $0 $2,220,000 6.16% $37,306,565 $2,220,000 5.95%
Grand Totals 8.09% 8.00% 7.76% $1,398,423,646 $29,065,090 $65,224,114 $3,090,140 $736,466 $477,958 $3,862,348 $102,456,115 7.33% $4,795,305,660 $372,682,153 7.77% 12.93% 15.63% 11.60% $259,560,711 $4,711,461 $6,171,573 $196,485 $880,080 $17,635,869 $968,897 $30,564,366 11.78% $781,070,179 $100,367,228 12.85%
% of HUB Participation 2.08% 4.66% 0.22% 0.05% 0.03% 0.28% 7.33% 7.77% 1.82% 2.38% 0.08% 0.34% 6.79% 0.37% 11.78% 12.85%
%of Minority Participation against Total HUB $ 28.37% 63.66% 3.02% 0.72% 0.47% 3.77% 15.41% 20.19% 0.64% 2.88% 57.70% 3.17%
LEGEND: LEGEND: LEGEND:
MBE - Minority Business Enterprise B - Black
X - no reporting requirements WBE - Woman Business Enterprise H - Hispanic
DBE-O- Disabled - Owned Business Enterprise AA - Asian-American
DBE - Disabled Business Enterprise AI - American Indian
NPWC - Non - profit Work Center for the Blind & Severely Disabled WF - White Female
Sub - HUB Subcontractor SE - Socially and Economically Disadvantaged
Note:
1. When a construction project is finalized (submitted) by an entiity, HUBSCO system will update
to the relevant quarter when the project was completed
Year-to-Date4th Quarter HUB Construction Report - Construction Projects4th Quarter HUB Purchasing Report -Goods and Services Year-to-Date
K:\Hubrpt_Purchase and Construction\FY'06-07\Quarter and Annual\06-07summary 3 - 4.0 Source: HUB Purchasing Report Database and HUBSCO Construction Reporting SystemRun Date:9/14/2006

NORTH CAROLINA DEPARTMENT OF ADMINISTRATION
OFFICE FOR HISTORICALLY UNDERUTILIZED BUSINESSES
Purchasing and Construction Reports
CABINET AGENCIES - 4th Quarter 2006-07(April 1, 2007 - June 30, 2007)
4th Quarter 2006-07(April 1 -June 30, 2007)
1st Qtr
2nd Qtr
3rd Qtr
1st Qtr
2ndQtr
3rd Qtr
Public Entity Type/Entity
To
talH
UB
(%)
To
talH
UB
(%)
To
tal H
UB
(%
)
To
tal
Pu
rch
asin
g($
)
MB
E (
$)
WB
E (
$)
DB
E-O
($)
DB
E (
$)
NP
WC
($)
Su
b (
$)
To
tal H
UB
($)
To
tal H
UB
(%
)
To
tal
Pu
rch
asin
g (
$)
To
tal H
UB
($)
To
tal H
UB
(%
)
To
talH
UB
(%)
To
talH
UB
(%)
To
tal H
UB
(%
)
To
tal
Co
nst
ruct
ion
V
alu
e ($
)
B($
)
H($
)
AA
($)
AI(
$)
WF
($)
SE
($)
To
tal H
UB
($)
To
tal H
UB
(%
)
To
tal
Co
nst
ruct
ion
V
alu
e ($
)
To
tal H
UB
($)
To
tal H
UB
(%
)
CABINET AGENCIES
NC Crime Control & Public Safety - Army National Guard 3.15% 7.92% 19.00% $6,275,088 $75,727 $307,900 $0 $0 $0 $0 $383,627 6.11% $53,569,050 $3,939,495 7.35% 0.00% 0.00% 0.00% $163,000NC Department of Administraton 29.84% 2.33% 1.53% $6,191,237 $49,819 $141,101 $0 $0 $0 $0 $190,920 3.08% $47,472,276 $2,819,127 5.94% X X X
X X X X X X X X X X X X
State Construction Office X X X X X X X X X X X X X X X
NC Department of Correction 13.65% 19.48% 11.35% $67,857,008 $3,161,561 $6,715,088 $7,700 $57,574 $0 $0 $9,941,923 14.65% $263,332,080 $37,632,266 14.29% 0.00% 0.00% 0.00% $172,351 $0 $0 $0 $0 $0 $0 $0 0.00% $789,776 $0 0.00%
NC Department of Commerce 66.96% 17.12% 32.12% $2,841,895 $264,096 $118,774 $900 $0 $0 $0 $383,770 13.50% $15,357,070 $6,673,555 43.46% 0.00% 0.00% 0.00%
NC Department of Cultural Resources(DNS-C) 19.89% 16.29% 11.60% $1,491,523 $68,786 $144,833 $2,921 $0 $0 $0 $216,540 14.52% $4,436,596 $694,613 15.66% 0.00% 0.00% 0.00% $0 $0 $0 $0 $0 $0 $0 $0 0.00% $0 $0 0.00%
Environment and Natural Resources 4.18% 10.94% 6.55% $38,984,517 $277,153 $2,263,978 $10,310 $0 $0 $0 $2,551,441 6.54% $142,248,485 $9,631,868 6.77% 0.00% 5.95% 11.14% $1,770,655 $0 $0 $0 $0 $1,087,220 $0 $1,087,220 61.40% $4,559,728 $1,292,279 28.34%
NC Department of Health and Human Services(DNS-C) 10.29% 11.57% 10.09% $51,324,151 $1,390,442 $3,878,731 $172,712 $48,178 $0 $0 $5,490,063 10.70% $166,726,180 $17,714,964 10.63% 0.00% 0.00% 19.95% $3,366,958 $0 $0 $0 $19,294 $274,425 $0 $293,719 8.72% $6,289,449 $775,216 12.33%
NC Department of Juvenile Justice & Delinquency Prevention (DNS-C) 13.31% 1.35% 8.07% $13,095,106 $5,016 $308,033 $0 $0 $0 $0 $313,049 2.39% $8,142,901 $1,482,797 18.21% 0.00% 0.00% 0.00% $0 $0 $0 $0 $0 $0 $0 $0 0.00% $0 $0 0.00%
NC Department of Revenue(DNS-C) 15.37% 18.50% 14.78% $2,609,114 $469,049 $100,081 $0 $0 $0 $0 $569,130 21.81% $389,651,652 $17,612,931 4.52% 0.00% 0.00% 0.00% $0 $0 $0 $0 $0 $0 $0 $0 0.00% $0 $0 0.00%
NC Department of Transportation (DNS-C) 4.06% 4.67% 5.00% $118,883,989 $1,060,856 $4,209,045 $0 $80,829 $0 $0 $5,350,730 2.39% $35,587,877 $1,060,425 2.98% 0.00% 0.00% 0.00% $0 $0 $0 $0 $0 $0 $0 $0 0.00% $0 $0 0.00%
TOTALS 9.68% 9.14% 8.16% $309,553,628 $6,822,505 $18,187,564 $194,543 $186,581 $0 $0 $25,391,193 8.20% $1,126,524,167 $99,262,042 8.81% 0.00% 5.95% 14.85% $5,309,964 $0 $0 $0 $19,294 $1,361,645 $0 $1,380,939 26.01% $11,801,953 $2,067,495 17.52%
% of HUB Participation 2.20% 5.88% 0.06% 0.06% 0% 0% 8.20% 8.81% 0% 0% 0% 0.36% 25.64% 0.00% 26.01% 17.52%
%of Minority Participation against Total HUB $ 26.87% 71.63% 0.77% 0.73% 0% 0%
LEGEND: LEGEND: LEGEND:
DNS-C - Categories with blanks or blank space indicate MBE - Minority Business Enterprise B - Black
entity "DID NOT SUBMIT" Construction Report WBE - Woman Business Enterprise H - Hispanic
DNS-P - Categories with blanks or blank space indicate DBE-O- Disabled - Owned Business Enterprise AA - Asian-American
entity "DID NOT SUBMIT" Purchasing Report DBE - Disabled Business Enterprise AI - American Indian
X - no reporting requirements NPWC - Non - profit Work Center for the Blind & Severely Disabled WF - White Female
Sub - HUB Subcontractor SE - Socially and Economically Disadvantaged
Note:
1. When a construction project is finalized (submitted) by an entiity, HUBSCO system will update
to the relevant quarter when the project was completed
Year-to-Date4th Quarter HUB Construction Report - Construction
Projects4th Quarter HUB Purchasing Report -Goods and Services Year-to-Date
K:\Hubrpt_Purchase and Construction\FY'06-07\Quarter and Annual\06-07CA 3 - 4.1 Source: HUB Purchasing Report Database and HUBSCO Construction Reporting SystemRun Date: 9/14/2006

NORTH CAROLINA DEPARTMENT OF ADMINISTRATION
OFFICE FOR HISTORICALLY UNDERUTILIZED BUSINESSES
Purchasing and Construction Reports
COUNCIL AGENCIES - 4th Quarter 2006-07(April 1, 2007 - June 30, 2007)
4th Quarter 2005-06(April 1 - June 30,
2006)
1st Qtr
2nd Qtr
3rd Qtr
1st Qtr
2ndQtr
3rd Qtr
Public Entity Type/Entity
To
talH
UB
(%)
To
tal
HU
B (
%)
To
tal
HU
B (
%)
To
tal
Pu
rch
asin
g($
)
MB
E (
$)
WB
E (
$)
DB
E-O
($)
DB
E (
$)
NP
WC
($)
Su
b (
$)
To
tal
HU
B (
$)
To
tal
HU
B (
%)
To
tal
Pu
rch
asin
g (
$)
To
tal
HU
B (
$)
To
tal
HU
B (
%)
To
talH
UB
(%)
To
tal
HU
B (
%)
To
tal
HU
B (
%)
To
tal
Co
nst
ruct
ion
B($
)
H($
)
AA
($)
AI(
$)
WF
($)
SE
($)
To
tal
HU
B (
$)
To
tal
HU
B (
%)
To
tal
Co
nst
ruct
ion
V
alu
e ($
)
To
tal
HU
B (
$)
To
tal
HU
B (
%)
COUNCIL AGENCIESNC Department of Agriculture & Consumer Services 11.84% 5.04% 8.37% $4,648,773 $122,637 $170,797 $31,605 $0 $0 $0 $325,039 6.99% $16,102,368 $1,324,468 8.23% 0.00% 0.00% 0.00% $0 $0 $0 $0 $0 $0 $0 $0 0.00% $0 $0 0.00%NC Department of Justice - State Bureau of Investigation (DNS-C) 9.50% 3.18% 9.56% $4,929,935 $54,227 $121,546 $5,778 $175 $0 $0 $181,726 3.69% $17,005,036 $1,086,560 6.39% 0.00% 0.00% 0.00% $0 $0 $0 $0 $0 $0 $0 $0 0.00% $0 $0 0.00%
NC Office of the State Auditor 0.73% 7.92% 5.65% $702,267 $0 $6,152 $0 $0 $0 $0 $6,152 0.88% $2,045,684 $64,457 3.15% X X X X X X X X X X X X X X XNC Department of Insurance 4.97% 30.06% 12.08% $1,093,105 $150,458 $153,461 $4,595 $0 $0 $0 $308,514 28.22% $3,215,044 $583,652 18.15% X X X X X X X X X X X X X X XNC Department of Labor 12.49% 13.05% 5.23% $187,783 $1,734 $3,433 $0 $0 $0 $0 $5,167 2.75% $619,736 $48,468 7.82% X X X X X X X X X X X X X X XNC Office of the Lt. Governor's Office 100.00% 4.71% 0.00% $219 $0 $0 $0 $0 $0 $0 $0 0.00% $4,239 $261 6.16% X X X X X X X X X X X X X X XNC Department of Public Instruction 2.55% 12.68% 7.67% $80,871,188 $629,633 $1,278,070 $196,681 $0 $0 $0 $2,104,384 2.60% $197,789,731 $9,085,952 4.59% X X X X X X X X X X X X X X XNC Department of Secretary of State 10.84% 6.04% 10.52% $347,525 $81,894 $31,104 $0 $0 $0 $0 $112,998 32.52% $1,074,996 $179,744 16.72% X X X X X X X X X X X X X X XNC Department of State Treasurer 1.63% 23.65% 26.62% $7,769,871 $0 $92,690 $5,668 $0 $0 $0 $98,358 1.27% $23,554,414 $2,417,225 10.26% X X X X X X X X X X X X X X X
TOTALS 3.29% 11.56% 10.86% $100,550,666 $1,040,583 $1,857,253 $244,327 $175 $0 $0 $3,142,338 3.13% $261,411,248 $14,790,787 5.66% 0.00% 0.00% 0.00% $0 $0 $0 $0 $0 $0 $0 $0 0.00% $0 $0 0.00%
% of HUB Participation 1.03% 1.85% 0.24% 0.00% 0.00% 0.00% 3.13% 5.66% 0% 0% 0% 0% 0% 0% 0% 0% 0% 0% 0%
%of Minority Participation against Total HUB $ 33.11% 59.10% 7.78% 0.01% 0.00% 0.00% 0% 0% 0% 0% 0% 0%
LEGEND: LEGEND:
LEGEND: MBE - Minority Business Enterprise B - Black
DNS-C - Categories with blanks or blank space indicate WBE - Woman Business Enterprise H - Hispanic
entity "DID NOT SUBMIT" Construction Report DBE-O- Disabled - Owned Business Enterprise AA - Asian-American
DNS-P - Categories with blanks or blank space indicate DBE - Disabled Business Enterprise AI - American Indian
entity "DID NOT SUBMIT" Purchasing Report NPWC - Non - profit Work Center for the Blind & Severely Disabled WF - White Female
Sub - HUB Subcontractor SE - Socially and Economically Disadvantaged
X - no reporting requirements
Note:
1. When a construction project is finalized (submitted) by an entiity, HUBSCO system will update
to the relevant quarter when the project was completed
4th Quarter HUB Purchasing Report -Goods and Services Year-to-Date Year-to-Date4th Quarter HUB Construction Report - Construction Projects
K:\Hubrpt_Purchase and Construction\FY'06-07\Quarter and Annual\06-07CO 3 - 4.2 Source: HUB Purchasing Report Database and HUBSCO Construction Reporting SystemRun Date: 11/15/2006

NORTH CAROLINA DEPARTMENT OF ADMINISTRATION
OFFICE FOR HISTORICALLY UNDERUTILIZED BUSINESSES
Purchasing and Construction Reports
Supporting Agencies - 4th Quarter 2006-07(April 1, 2007 - June 30, 2007)
4th Quarter 2006-07(April 1 - June 30,
2007)
1st Qtr
2nd Qtr
3rd Qtr
1st Qtr
2ndQtr
3rd Qtr
Public Entity Type/Entity
To
tal H
UB
(%
)
To
tal H
UB
(%
)
To
tal H
UB
(%
)
To
tal
Pu
rch
as
ing
($)
MB
E (
$)
WB
E (
$)
DB
E-O
($
)
DB
E (
$)
NP
WC
($
)
Su
b (
$)
To
tal H
UB
($
)
To
tal H
UB
(%
)
To
tal
Pu
rch
as
ing
($
)
To
tal H
UB
($
)
To
tal H
UB
(%
)
To
tal H
UB
(%
)
To
tal H
UB
(%
)
To
tal H
UB
(%
)
To
tal
Co
ns
tru
cti
on
V
alu
e (
$)
B($
)
H($
)
AA
($)
AI(
$)
WF
($)
SE
($)
To
tal H
UB
($
)
To
tal H
UB
(%
)
To
tal
Co
ns
tru
cti
on
V
alu
e (
$)
To
tal H
UB
($
)
To
tal H
UB
(%
)
SUPPORTING AGENCIESNC Office of Information Technology Services (DNS-C) 10.51% 13.90% 34.13% $44,839,317 $312,017 $3,443,810 $0 $0 $0 $0 $3,755,827 8.38% $72,868,426 $9,114,556 12.51% 0.00% 0.00% 0.00% $0 $0 $0 $0 $0 $0 $0 $0 0.00% $0 $0 0.00%NCDENR - Wildlife Resources Commission 15.29% 12.01% 8.73% $6,984,657 $207,630 $1,113,425 $26,000 $88,000 $0 $0 $1,435,055 20.55% $15,585,926 $2,435,094 15.62% 3.81% 0.00% 0.00% 686,919$ $0 $0 $0 $0 $0 $0 $0 0.00% $5,575,692 $186,492 3.34%North Carolina State Ports Authority (DNSC) 1.82% 1.13% 0.24% $1,840,250 $109,851 $5,510 $0 $0 $0 $0 $115,360 6.27% $8,034,892 $198,305 2.47% 0.00% 0.00% 0.00% $0 $0 $0 $0 $0 $0 $0 $0 0.00% $0 $0 0.00%
Administrative Hearings 43.53% 7.71% 72.99% $45,247 $3,807 $0 $0 $0 $0 $0 $3,807 8.41% $89,783 $27,970 31.15% X X X X X X X X X X X X X X XAdmin. Office of the Courts 43.17% 10.09% 27.63% $6,828,341 $56,323 $542,653 $0 $0 $0 $0 $598,976 8.77% $22,900,471 $5,052,806 22.06% X X X X X X X X X X X X X X XBoard of Elections 33.46% 5.30% 1.92% $452,441 $41,742 $2,921 $0 $0 $0 $0 $44,663 9.87% $1,841,450 $305,566 16.59% X X X X X X X X X X X X X X XCommunity Colleges 3.66% 1.96% 1.65% $2,520,988 $3,265 $58,313 $86 $0 $0 $0 $61,664 2.45% $18,037,950 $454,959 2.52% X X X X X X X X X X X X X X XEmployment Security Comm. 10.39% 7.24% 13.82% $1,233,353 $0 $107,160 $0 $0 $0 $0 $107,160 8.69% $5,623,452 $595,416 10.59% X X X X X X X X X X X X X X XGeneral Assembly 4.19% 3.29% 1.37% $693,529 $0 $2,605 $828 $0 $0 $0 $3,433 0.50% $2,218,984 $45,394 2.05% X X X X X X X X X X X X X X XNC Institute of Min. Econ. Dev. 69.86% 77.97% 66.19% $379,889 $165,927 $644 $0 $0 $0 $0 $166,571 43.85% $1,221,742 $769,463 62.98% X X X X X X X X X X X X X X XRural Economic Development 9.71% 17.24% 18.28% $673,571 $713 $78,159 $0 $0 $0 $0 $78,872 11.71% $1,964,094 $270,720 13.78% X X X X X X X X X X X X X X XOffice of State Controller 0.42% 1.86% 6.60% $13,094,205 $5,016 $308,033 $0 $0 $0 $0 $313,049 2.39% $17,814,140 $508,219 2.85% X X X X X X X X X X X X X X XNC Education Lottery 24.01% 67.64% 74.63% $4,444,658 $13,009 $1,906,122 $0 $0 $0 $0 $1,919,131 43.18% $15,691,889 $7,791,724 49.65% X X X X X X X X X X X X X X X
TOTALS 17.26% 16.40% 23.99% $84,030,446 $919,300 $7,569,354 $26,914 $88,000 $0 $0 $8,603,568 10.24% $183,893,199 $27,570,191 14.99% 3.81% 0.00% 0.00% $686,919 $0 $0 $0 $0 $0 $0 $0 $0 $5,575,692 $186,492 3.34%
% of HUB Participation 1.09% 9.01% 0.03% 0.10% 0.00% 0.00% 10.24% 14.99% 3.34%
%of Minority Participation against Total HUB $ 10.69% 87.98% 0.31% 1.02% 0.00% 0.00%
LEGEND:
DNS-C - Categories with blanks or blank space indicate LEGEND: LEGEND:
entity "DID NOT SUBMIT" Construction Report MBE - Minority Business Enterprise B - Black
DNS-P - Categories with blanks or blank space indicate WBE - Woman Business Enterprise H - Hispanic
entity "DID NOT SUBMIT" Purchasing Report DBE-O- Disabled - Owned Business Enterprise AA - Asian-American
X - no reporting requirements DBE - Disabled Business Enterprise AI - American Indian
NPWC - Non - profit Work Center for the Blind & Severely Disabled WF - White Female
Note: Sub - HUB Subcontractor SE - Socially and Economically Disadvantaged
1. When a construction project is finalized (submitted) by an entiity, HUBSCO system will update
to the relevant quarter when the project was completed
4th Quarter HUB Purchasing Report -Goods and Services Year-to-Date Year-to-Date4th Quarter HUB Construction Report -
Construction Projects
K:\Hubrpt_Purchase and Construction\FY'06-07\Quarter and Annual\06-07SA 3 - 4.3 Source:HUB Purchasing Report Database and HUBSCO Construction Reporting SystemRun Date: 11/18/2006

NORTH CAROLINA DEPARTMENT OF ADMINISTRATION
OFFICE FOR HISTORICALLY UNDERUTILIZED BUSINESSES
Purchasing and Construction Reports - Community Colleges - 4th Quarter 2006-07(April 1, 2007 - June 30, 2007)
4th Quarter 2006-07(April 1 - June 30, 2007)
1st Qtr
2nd Qtr
3rd Qtr
1st Qtr
2nd Qtr
3rd Qtr
Public Entity Type/EntityT
ota
l HU
B (
%)
To
tal H
UB
(%
)
To
tal H
UB
(%
)
To
tal
Pu
rch
as
ing
($)
MB
E (
$)
WB
E (
$)
DB
E-O
($)
DB
E (
$)
NP
WC
($)
Su
b (
$)
To
tal H
UB
($)
To
tal H
UB
(%
)
To
tal
Pu
rch
as
ing
($)
To
tal H
UB
($)
To
tal H
UB
(%
)
To
tal H
UB
(%
)
To
tal H
UB
(%
)
To
tal H
UB
(%
)
To
tal
Co
ns
tru
cti
on
V
alu
e (
$)
B($
)
H($
)
AA
($)
AI(
$)
WF
($)
SE
($)
To
tal H
UB
($)
To
tal H
UB
(%
)
To
tal
Co
ns
tru
cti
on
V
alu
e (
$)
To
tal H
UB
($)
To
tal H
UB
(%
)
COMMUNITY COLLEGESAlamance Community College 2.12% 2.99% 2.00% $4,114,084 $7,020 $41,707 $2,470 $0 $796 $0 $51,993 1.26% $9,152,048 $172,646 1.89% 0.00% 4.88% 6.82% $8,463 $0 $0 $0 $0 $0 $0 $0 0.00% $117,961 $7,057 5.98%Anson/South Piedmont Community College (DNS C)
6.53% 8.76% 5.83% $1,484,724 $15,065 $64,304 $0 $0 $0 $0 $79,368 5.35% $4,608,979 $296,031 6.42% 0.00% 6.19% 0.00% $489,517 $0 $0 $0 $0 $0 $489,517 $489,517 100.00% $3,312,758 $664,371 20.05%Asheville-Buncombe Technical Community College
3.00% 9.09% 6.30% $4,403,081 $9,716 $144,381 $922 $0 $22,258 $0 $177,277 4.03% $10,646,587 $521,750 4.90% 0.00% 0.00% 0.00% $0 $0 $0 $0 $0 $0 $0 $0 0.00% $0 $0 0.00%Beaufort County Community College 15.14% 5.99% 7.03% $617,748 $2,498 $84,102 $233 $0 $100 $0 $86,933 14.07% $2,450,435 $265,691 10.84% 0.00% 0.00% 0.00% $0 $0 $0 $0 $0 $0 $0 $0 0.00% $0 $0 0.00%Bladen Community College (DNS-C) 4.67% 6.87% 4.67% $451,780 $1,809 $23,807 $0 $0 $0 $0 $25,616 5.67% $1,379,287 $72,290 5.24% 0.00% 0.00% 0.00% $0 $0 $0 $0 $0 $0 $0 $0 0.00% $0 $0 0.00%
Blue Ridge Community College(DNS-C) 5.47% 2.61% 1.20% $3,977,864 $14,096 $9,267 $4,509 $15,792 $804 $0 $44,468 1.12% $9,385,985 $179,802 1.92% 0.00% 0.00% 0.00% $0 $0 $0 $0 $0 $0 $0 $0 0.00% $0 $0 0.00%Brunswick Community College 3.32% 3.88% 2.70% $993,868 $3,069 $93,222 $395 $377 $0 $0 $97,063 9.77% $3,385,817 $175,201 5.17% 0.00% 0.00% 0.00% $0 $0 $0 $0 $0 $0 $0 $0 0.00% $0 $0 0.00%Caldwell Community College & Technical Institute
7.90% 6.56% 2.07% $1,588,892 $31,209 $72,874 $0 $0 $882 $0 $104,965 6.61% $8,164,774 $488,437 5.98% 0.00% 0.00% 7.04% $0 $0 $0 $0 $0 $0 $0 $0 0.00% $7,374,014 $420,525 5.70%
Cape Fear Community College 9.96% 6.61% 10.52% $2,045,011 $52,432 $184,056 $853 $0 $40 $0 $237,381 11.61% $8,617,142 $827,118 9.60% 0.00% 0.00% 0.00% $0 $0 $0 $0 $0 $0 $0 $0 0.00% $0 $0 0.00%Carteret Community College (DNS-C) 1.47% 4.53% 4.51% $829,600 $2,248 $12,654 $333 $0 $0 $0 $15,234 1.84% $2,707,944 $82,678 3.05% 0.00% 0.00% 0.00% $0 $0 $0 $0 $0 $0 $0 $0 0.00% $0 $0 0.00%Catawba Valley Community College (DNS-C) 1.27% 4.00% 8.05% $2,877,851 $43,727 $147,885 $11,626 $43 $956 $0 $204,237 7.10% $7,541,332 $420,218 5.57% 0.00% 0.00% 0.00% $0 $0 $0 $0 $0 $0 $0 $0 0.00% $0 $0 0.00%
Central Carolina Community College(DNS-C) 3.95% 4.52% 8.32% $2,136,644 $104,989 $157,468 $897 $0 $14,289 $89 $277,732 13.00% $8,773,969 $618,261 7.05% 0.00% 0.00% 0.00% $0 $0 $0 $0 $0 $0 $0 $0 0.00% $0 $0 0.00%Central Piedmont Community College (DNS-C) 28.45% 28.79% 29.40% $7,818,097 $251,539 $621,067 $6,198 $0 $0 $0 $878,804 11.24% $19,140,719 $4,153,150 21.70% 0.00% 0.00% 0.00% $0 $0 $0 $0 $0 $0 $0 $0 0.00% $0 $0 0.00%Cleveland Community College(DNS-C) 2.26% 4.87% 3.85% $1,809,215 $4,987 $358,639 $5,932 $576 $1,162 $0 $371,297 20.52% $3,969,056 $454,124 11.44% 0.00% 0.00% 0.00% $0 $0 $0 $0 $0 $0 $0 $0 0.00% $0 $0 0.00%Coastal Carolina Community College 3.03% 15.17% 2.87% $2,011,149 $66,838 $58,225 $763 $0 $200 $0 $126,026 6.27% $6,182,106 $357,057 5.78% 0.00% 0.00% 0.00% $0 $0 $0 $0 $0 $0 $0 $0 0.00% $298,549 $0 0.00%College of The Albemarle(DNS-C) 1.54% 1.71% 1.54% $1,276,851 $25,279 $74,883 $0 $0 $810 $0 $100,972 7.91% $3,404,733 $134,997 3.96% 0.00% 0.00% 0.00% $0 $0 $0 $0 $0 $0 $0 $0 0.00% $0 $0 0.00%Craven Community College 3.78% 4.44% 8.90% $1,532,661 $14,063 $76,681 $1,149 $33,725 $0 $0 $125,618 8.20% $4,481,673 $294,016 6.56% 0.00% 0.00% 0.00% $0 $0 $0 $0 $0 $0 $0 $0 0.00% $0 $0 0.00%Davidson County Community College (DNS-C)) 6.81% 6.93% 15.35% $2,279,017 $6,987 $188,890 $0 $0 $0 $0 $195,877 8.59% $6,968,458 $660,207 9.47% 0.00% 0.00% 0.00% $0 $0 $0 $0 $0 $0 $0 $0 0.00% $587,519 $51,247 8.72%Durham Technical Community College 7.66% 9.38% 7.60% $4,252,807 $97,384 $215,566 $417 $0 $17,200 $0 $330,568 7.77% $11,529,894 $924,008 8.01% 8.72% 0.00% 0.00% $0 $0 $0 $0 $0 $0 $0 $0 0.00% $0 $0 0.00%Edgecombe Community College (DNS-C) 9.74% 6.40% 12.83% $1,204,031 $22,057 $30,269 $710 $0 $285 $0 $53,321 4.43% $3,158,408 $243,716 7.72% 0.00% 0.00% 0.00% $0 $0 $0 $0 $0 $0 $0 $0 0.00% $0 $0 0.00%Fayetteville Technical Community College 3.78% 7.58% 8.69% $4,072,404 $117,981 $493,528 $7,501 $0 $0 $0 $619,010 15.20% $14,480,571 $1,228,071 8.48% 0.00% 24.25% 0.00% $5,975 $0 $0 $0 $0 $0 $0 $0 0.00% $4,205,937 $1,012,219 24.07%Forsyth Technical Community College 8.47% 6.96% 8.56% $5,466,877 $32,470 $216,336 $62,951 $0 $0 $0 $311,757 5.70% $14,644,573 $1,049,848 7.17% 100% 0.00% 0.00% $673,018 $94,682 $0 $0 $91,416 $0 $0 $186,098 27.65% $1,053,875 $233,933 22.20%Gaston College(DNS-C) 4.45% 11.58% 5.06% $2,402,510 $17,056 $161,872 $2,297 $0 $0 $0 $181,225 7.54% $7,495,345 $543,462 7.25% 0.00% 1.20% 0.00% $0 $0 $0 $0 $0 $0 $0 $0 0.00% $3,313,502 $37,622 1.14%Guilford Technical Community College 5.46% 6.96% 5.17% $5,762,709 $281,270 $469,482 $10,282 $0 $48,256 $0 $809,290 14.04% $18,788,047 $1,552,230 8.26% 14.48% 1.09% 15.25% $23,016,520 $557,867 $439,619 $0 $0 $696,736 $344 $1,694,566 7.36% $27,079,178 $2,165,645 8.00%Halifa# Community College(DNS-C) 1.47% 3.31% 2.05% $446,534 $2,050 $5,930 $1,569 $0 $0 $0 $9,549 2.14% $1,673,803 $37,111 2.22% 0.00% 0.00% 0.00% $0 $0 $0 $0 $0 $0 $0 $0 0.00% $0 $0 0.00%Haywood Community College (DNS-C) 1.16% 1.55% 2.57% $5,277,379 $54,712 $160,483 $530 $0 $0 $0 $215,725 4.09% $8,760,752 $280,882 3.21% 0.00% 0.00% 0.00% $0 $0 $0 $0 $0 $0 $0 $0 0.00% $0 $0 0.00%Isothermal Community College(DNS-C) 4.66% 4.92% 3.30% $1,783,083 $1,919 $49,260 $1,654 $825 $0 $491 $54,149 3.04% $4,523,599 $171,069 3.78% 0.00% 0.00% 0.00% $0 $0 $0 $0 $0 $0 $0 $0 0.00% $0 $0 0.00%James Sprunt Community College 8.83% 6.99% 5.30% $635,894 $3,978 $29,887 $3,267 $3,187 $75 $0 $40,395 6.35% $1,883,890 $126,653 6.72% 0.00% 0.00% 0.00% $0 $0 $0 $0 $0 $0 $0 $0 0.00% $0 $0 0.00%Johnston Community College 4.25% 2.36% 4.51% $3,451,871 $2,849 $137,565 $0 $50 $0 $0 $140,464 4.07% $9,340,966 $367,445 3.93% 0.00% 0.00% 0.00% $0 $0 $0 $0 $0 $0 $0 $0 0.00% $0 $0 0.00%Lenoir Community College 8.80% 11.15% 8.40% $1,973,442 $35,350 $177,725 $2,132 $957 $65,952 $0 $282,116 14.30% $4,577,360 $527,875 11.53% 0.00% 0.00% 0.00% $5,075 $0 $0 $0 $0 $0 $0 $0 0.00% $104,249 $0 0.00%
Martin Community College 3.50% 13.40% 19.17% $789,655 $12,909 $119,641 $8,250 $1,424 $0 $0 $142,224 18.01% $1,792,860 $274,749 15.32% 0.00% 0.00% 0.00% $0 $0 $0 $0 $0 $0 $0 $0 0.00% $0 $0 0.00%
Mayland Community College 2.99% 6.91% 9.45% $824,562 $1,200 $28,064 $0 $0 $200 $0 $29,464 3.57% $1,474,212 $76,595 5.20% 0.00% 0.00% 0.00% $0 $0 $0 $0 $0 $0 $0 $0 0.00% $254,879 $0 0.00%McDowell Technical Community College 3.15% 2.01% 16.21% $414,732 $0 $32,262 $0 $0 $0 $0 $32,262 7.78% $3,358,252 $245,351 7.31% 0.00% 0.00% 0.00% $0 $0 $0 $0 $0 $0 $0 $0 0.00% $254,879 $0 0.00%
Mitchell Community College 1.89% 12.67% 9.00% $1,175,422 $19,980 $50,604 $5,567 $7,759 $0 $0 $83,911 7.14% $4,217,199 $304,826 7.23% 0.00% 0.00% 74.07% $18,690 $5,540 $0 $0 $0 $0 $0 $5,540 29.64% $128,608 $26,110 20.30%Montgomery Community College 2.92% 3.43% 2.82% $625,231 $14,710 $12,475 $400 $0 $0 $0 $27,585 4.41% $1,578,813 $56,134 3.56% 0.00% 0.00% 100.00% $65,313 $0 $0 $0 $0 $0 $0 $0 0.00% $139,156 $9,368 6.73%Nash Community College 14.80% 13.76% 7.23% $1,322,175 $67,307 $61,837 $0 $0 $0 $0 $129,144 9.77% $1,322,175 $129,144 9.77% 0.00% 0.00% 0.00% $0 $0 $0 $0 $0 $0 $0 $0 0.00% $0 $0 0.00%
Year-to-Date4th Quarter HUB Construction Report - Construction Projects4th Quarter HUB Purchasing Report -Goods and Services Year-to-Date
K:\Hubrpt_Purchase and Construction\FY'06-07\Quarter and Annual\06-07CC 3 - 4.4.1 Source:HUB Purchasing Report Database and HUBSCO Construction reporting SystemRun Date:11/18/2006

NORTH CAROLINA DEPARTMENT OF ADMINISTRATION
OFFICE FOR HISTORICALLY UNDERUTILIZED BUSINESSES
Purchasing and Construction Reports - Community Colleges - 4th Quarter 2006-07(April 1, 2007 - June 30, 2007)
4th Quarter 2006-07(April 1 - June 30, 2007)
1st Qtr
2nd Qtr
3rd Qtr
1st Qtr
2nd Qtr
3rd Qtr
Public Entity Type/EntityT
ota
l HU
B (
%)
To
tal H
UB
(%
)
To
tal H
UB
(%
)
To
tal
Pu
rch
as
ing
($)
MB
E (
$)
WB
E (
$)
DB
E-O
($)
DB
E (
$)
NP
WC
($)
Su
b (
$)
To
tal H
UB
($)
To
tal H
UB
(%
)
To
tal
Pu
rch
as
ing
($)
To
tal H
UB
($)
To
tal H
UB
(%
)
To
tal H
UB
(%
)
To
tal H
UB
(%
)
To
tal H
UB
(%
)
To
tal
Co
ns
tru
cti
on
V
alu
e (
$)
B($
)
H($
)
AA
($)
AI(
$)
WF
($)
SE
($)
To
tal H
UB
($)
To
tal H
UB
(%
)
To
tal
Co
ns
tru
cti
on
V
alu
e (
$)
To
tal H
UB
($)
To
tal H
UB
(%
)
Year-to-Date4th Quarter HUB Construction Report - Construction Projects4th Quarter HUB Purchasing Report -Goods and Services Year-to-Date
COMMUNITY COLLEGES - Contd…
Pamlico Community College(DNS-C) 7.54% 9.00% 2.67% $1,416,387 $3,421 $70,364 $385 $0 $1,200 $0 $75,370 5.32% $2,750,294 $142,218 5.17% 0.00% 0.00% 0.00% $0 $0 $0 $0 $0 $0 $0 $0 0.00% $0 $0 0.00%Piedmont Community College 6.53% 7.72% 24.80% $1,620,575 $7,594 $109,916 $1,378 $0 $0 $0 $118,888 7.34% $4,331,703 $505,155 11.66% 0.00% 0.00% 0.00% $1,232,449 $0 $0 $0 $0 $65,239 $0 $65,239 5.29% $1,232,449 $65,239 5.29%Pitt Community College(DNS-C) 15.24% 10.21% 11.18% $3,502,315 $286,661 $88,371 $91 $0 $349 $0 $375,472 10.72% $8,201,244 $939,163 11.45% 0.00% 0.00% 0.00% $0 $0 $0 $0 $0 $0 $0 $0 0.00% $0 $0 0.00%Randolph Community College 5.61% 4.04% 14.79% $1,714,261 $114,699 $176,357 $171 $0 $0 $0 $291,227 16.99% $6,023,075 $590,189 9.80% 88.53% 0.00% 0.00% $0 $0 $0 $0 $0 $0 $0 $0 0.00% $1,673,793 $1,481,830 88.53%Richmond Community College (DNS-C) 2.17% 95.23% 4.90% $925,740 $29,827 $197,969 $4,198 $0 $0 $0 $231,994 25.06% $2,990,074 $1,110,748 37.15% 0.00% 0.00% 0.00% $0 $0 $0 $0 $0 $0 $0 $0 0.00% $0 $0 0.00%
Roanoke-Chowan Community College(DNS-C) 3.79% 13.34% 11.79% $588,414 $1,812 $9,863 $1,375 $0 $0 $0 $13,050 2.22% $1,751,916 $134,967 7.70% 0.00% 0.00% 0.00% $0 $0 $0 $0 $0 $0 $0 $0 0.00% $0 $0 0.00%Robeson Community College 4.85% 12.74% 14.36% $1,828,511 $34,924 $316,958 $0 $2,120 $0 $0 $354,002 19.36% $6,147,343 $799,418 13.00% 0.00% 68.23% 0.00% $0 $0 $0 $0 $0 $0 $0 $0 0.00% $2,028,175 $1,383,881 68.23%Rockingham Community College 3.78% 16.61% 6.58% $1,064,444 $49 $28,588 $0 $0 $0 $0 $28,637 2.69% $3,876,601 $334,382 8.63% 100% 75.41% 100.00% $342,703 $0 $0 $0 $0 $292,066 $0 $292,066 85% $529,621 $453,209 85.57%Rowan-Cabarrus Community College(DNS-C) 4.95% 3.58% 2.18% $5,456,873 $112,901 $102,386 $8,640 $2,133 $0 $0 $226,060 4.14% $13,447,283 $487,051 3.62% 0.00% 0.00% 0.00% $0 $0 $0 $0 $0 $0 $0 $0 0.00% $0 $0 0.00%Sampson Community College(DNS-C) 9.85% 7.86% 3.81% $695,303 $15,341 $12,610 $1,568 $0 $1,600 $0 $31,119 4.48% $2,041,546 $128,717 6.30% 0.00% 0.00% 0.00% $0 $0 $0 $0 $0 $0 $0 $0 0.00% $25,156 $0 0.00%Sandhills Community College(DNS-C) 7.24% 2.90% 1.91% $2,075,852 $7,575 $70,396 $4,128 $0 $0 $0 $82,098 3.95% $8,071,928 $325,891 4.04% 0.00% 0.00% 0.00% $273,923 $0 $0 $0 $0 $0 $0 $0 0.00% $273,923 $0 0.00%
SouthEastern Community College(DNS-C) 6.77% 6.20% 5.05% $985,198 $11,761 $36,595 $0 $0 $0 $0 $48,356 4.91% $2,998,865 $169,414 5.65% 0.00% 0.00% 0.00% $122,433 $0 $0 $0 $0 $0 $0 $0 0.00% $122,433 $0 0.00%Southwestern Community College (DNS-C) 0.46% 2.52% 0.81% $1,217,294 $1,604 $31,233 $0 $0 $0 $0 $32,836 2.70% $5,415,662 $93,922 1.73% 0.00% 0.00% 0.00% $0 $0 $0 $0 $0 $0 $0 $0 0.00% $0 $0 0.00%Stanly Community College 4.06% 7.56% 1.71% $699,759 $40,814 $25,070 $0 $0 $0 $0 $65,883 9.42% $2,866,849 $161,503 5.63% 0.00% 0.00% 0.00% $0 $0 $0 $0 $0 $0 $0 $0 0.00% $0 $0 0.00%Surry Community College 17.93% 16.86% 12.79% $449,659 $105 $34,894 $0 $4,476 $0 $0 $39,475 8.78% $1,429,965 $185,942 13.00% 0.00% 0.00% 0.00% $0 $0 $0 $0 $0 $0 $0 $0 0.00% $0 $0 0.00%Tri-County Community College 1.03% 7.78% 5.07% $662,116 $11,313 $11,144 $1,448 $0 $0 $0 $23,905 3.61% $1,583,405 $68,844 4.35% 0.00% 0.00% 0.00% $0 $0 $0 $0 $0 $0 $0 $0 0.00% $0 $0 0.00%Vance-Granville Community College 5.34% 8.39% 34.96% $1,882,655 $31,054 $317,170 $9,495 $0 $0 $0 $357,719 19.00% $5,339,007 $987,871 18.50% 0.00% 0.00% 0.00% $0 $0 $0 $0 $0 $0 $0 $0 0% $20,674 $0 0.00%Wake Technical Community College 5.32% 4.96% 5.42% $12,060,144 $40,444 $391,284 $53,636 $0 $0 $0 $485,365 4.02% $37,813,533 $1,836,115 4.86% 19.52% 25.24% 13.48% $28,276 $1,425 $0 $0 $0 $26,851 $0 $28,276 100% $6,891,892 $1,718,581 24.94%Wayne Community College(DNS-C) 2.76% 12.49% 5.59% $1,452,807 $2,536 $108,417 $3,558 $0 $0 $0 $114,511 7.88% $5,939,158 $436,219 7.34% 0.00% 14.66% 0.00% $3,885,864 $0 $84,752 $0 $14,504 $799,595 $309,209 $1,208,060 31.09% $4,865,399 $1,351,623 27.78%Western Piedmont Community College 9.26% 6.29% 7.09% $3,024,658 $34,626 $350,302 $784 $109 $0 $0 $385,821 12.76% $6,224,200 $614,040 9.87% 0.00% 0.00% 0.00% $0 $0 $0 $0 $0 $0 $0 $0 0.00% $0 $0 0.00%Wilkes Community College(DNS-C) 2.03% 4.24% 3.76% $2,276,231 $2,680 $236,603 $0 $0 $836 $0 $240,120 10.55% $8,441,455 $447,734 5.30% 0.00% 0.00% 0.00% $0 $0 $0 $0 $0 $0 $0 $0 0.00% $0 $0 0.00%Wilson Technical Community College 4.73% 2.90% 12.78% $2,166,832 $24,516 $35,841 $4,847 $18,899 $0 $0 $84,103 3.88% $4,934,739 $271,259 5.50% 0.00% 0.00% 0.00% $0 $0 $0 $0 $0 $0 $0 $0 0.00% $0 $0 0.00%
TOTALS 6.30% 8.49% 8.04% $133,217,658 $2,326,318 $7,691,067 $239,509 $92,453 $178,250 $580 $10,528,176 7.90% $381,679,107 $29,455,081 7.72% 28.82% 21.38% 8.50% $30,168,218 $659,514 $524,371 $0 $105,920 $1,880,487 $799,070 $3,969,362 13.16% $65,633,699 $11,082,460 16.89%
% of HUB Participation 1.75% 5.77% 0.18% 0.07% 0.13% 0.00% 7.90% 7.72% 2.19% 1.74% 0% 0.35% 6.23% 2.65% 13.16% 16.89%
%of Minority Participation against Total HUB $ 22.10% 73.05% 2.27% 0.88% 1.69% 0.01% 16.62% 13.21% 0% 2.67% 47.38% 20.13%
LEGEND:
DNS-C - Categories with blanks or blank space indicate LEGEND: LEGEND:
entity "DID NOT SUBMIT" Construction Report MBE - Minority Business Enterprise B - Black
DNS-P - Categories with blanks or blank space indicate WBE - Woman Business Enterprise H - Hispanic
entity "DID NOT SUBMIT" Purchasing Report DBE-O- Disabled - Owned Business Enterprise AA - Asian-American
DBE - Disabled Business Enterprise AI - American Indian
NPWC - Non - profit Work Center for the Blind & Severely Disabled WF - White Female
Note: Sub - HUB Subcontractor SE - Socially and Economically Disadvantaged
1. When a construction project is finalized (submitted) by an entiity, HUBSCO system will update
to the relevant quarter when the project was completed
K:\Hubrpt_Purchase and Construction\FY'06-07\Quarter and Annual\06-07CC 3 - 4.4.2 Source:HUB Purchasing Report Database and HUBSCO Construction reporting SystemRun Date:11/18/2006

NORTH CAROLINA DEPARTMENT OF ADMINISTRATION
OFFICE FOR HISTORICALLY UNDERUTILIZED BUSINESSES
Purchasing and Construction Reports
Public Schools - 4th Quarter 2006-07(April 1, 2007 - June 30, 2007)
4th Quarter 2006-07(April 1 - June 30,
2007)
1st Qtr
2nd Qtr
3rd Qtr
1st Qtr
2ndQtr
3rd Qtr
Public Entity Type/Entity
To
tal
HU
B (
%)
To
tal
HU
B (
%)
To
tal
HU
B (
%)
To
tal
Pu
rch
asin
g($
)
MB
E (
$)
WB
E (
$)
DB
E-O
($)
DB
E (
$)
NP
WC
($)
Su
b (
$)
To
tal
HU
B (
$)
To
tal
HU
B (
%)
To
tal
Pu
rch
asin
g (
$)
To
tal
HU
B (
$)
To
tal
HU
B (
%)
To
tal
HU
B (
%)
To
tal
HU
B (
%)
To
tal
HU
B (
%)
To
tal
Co
nst
ruct
ion
V
alu
e ($
)
B($
)
H($
)
AA
($)
AI(
$)
WF
($)
SE
($)
To
tal
HU
B (
$)
To
tal
HU
B (
%)
To
tal
Co
nst
ruct
ion
V
alu
e ($
)
To
tal
HU
B (
$)
To
tal
HU
B (
%)
PUBLIC SCHOOLSAlamance/Burlington 1.46% 2.26% 1.68% $39,403,717 $256,390 $196,334 $77,402 $0 $0 $0 $530,126 1.35% $105,837,160 $1,713,920 1.62% * * * * * * * * * * * * * * *
Alexander County Schools (DNS-C) 6.33% 4.94% 6.98% $1,040,637 $14,145 $55,479 $0 $330 $200 $0 $70,154 6.74% $4,043,685 $252,237 6.24% 0.00% 0.00% 0.00% $0 $0 $0 $0 $0 $0 $0 $0 0.00% $0 $0 0.00%
Alleghany County Schools 3.42% 4.31% 2.25% $527,832 $0 $10,535 $0 $0 $0 $0 $10,535 2.00% $2,378,036 $70,053 2.95% * * * * * * * * * * * * * * *
Anson County Schools 9.90% 16.22% 17.91% $1,623,086 $0 $195,414 $0 $0 $0 $0 $195,414 12.04% $4,170,556 $570,825 13.69% * * * * * * * * * * * * * * *Ashe County Schools (DNS-C) 3.13% 8.16% 7.47% $1,384,290 $76 $199,436 $0 $0 $0 $0 $199,512 14.41% $7,649,724 $617,082 8.07% 0.00% 0.00% 0.00% $0 $0 $0 $0 $0 $0 $0 $0 0.00% $704,407 $0 0.00%Asheboro City Schools 0.47% 0.66% 1.32% $642,530 $312 $2,679 $0 $0 $0 $0 $2,991 0.47% $4,503,429 $32,623 0.72% 12.85% 0.00% 0.00% $0 $0 $0 $0 $0 $0 $0 $0 0.00% $276,834 $12,845 4.64%Asheville City Schools 7.76% 12.84% 10.75% $432,387 $63 $66,911 $75 $0 $0 $0 $67,049 15.51% $3,609,065 $358,878 9.94% 0.00% 0.00% 0.00% $0 $0 $0 $0 $0 $0 $0 $0 0.00% $7,971,019 $0 0.00%
Avery Counrty Schools 4.53% 2.00% 2.31% $779,694 $77 $12,658 $0 $0 $0 $0 $12,735 1.63% $3,549,336 $94,373 2.66% * * * * * * * * * * * * * * *
Beaufort County Schools 14.66% 0.00% 19.66% $1,007,547 $16,084 $37,764 $1,000 $0 $0 $0 $54,849 5.44% $7,492,246 $1,082,621 14.45% * * * * * * * * * * * * * * *Bertie County Board of Education (DNS-C) 0.00% 0.00% 0.00% $0 $0 $0 $0 $0 $0 $0 $0 0.00% $0 $0 0.00% 0.00% 0.00% 0.00% $0 $0 $0 $0 $0 $0 $0 $0 0.00% $0 $0 *Bladen County Schools(DNS-C) 6.13% 2.44% 3.21% $1,269,719 $27,935 $27,866 $3,931 $0 $0 $0 $59,732 4.70% $3,949,340 $150,545 3.81% 1.63% 0.00% 0.00% $0 $0 $0 $0 $0 $0 $0 $0 0.00% $253,135 $3,405 1.35%Brunswick County Schools 4.29% 3.85% 6.48% $1,330,946 $0 $38,245 $0 $0 $0 $0 $38,245 2.87% $43,711,878 $2,151,655 4.92% 84.36% 100% 9.70% $0 $0 $0 $0 $0 $0 $0 $0 0.00% $152,081 $121,825 80.1%
Buncombe County Schools 4.20% 4.77% 4.76% $3,581,507 $24,755 $187,965 $0 $8,733 $0 $0 $221,453 6.18% $18,437,480 $886,760 4.81% * * * * * * * * * * * * * * *
Burke County Schools 11.31% 14.28% 3.83% $2,972,144 $31,344 $86,959 $348,080 $0 $100 $0 $466,483 15.70% $12,603,408 $1,402,880 11.13% * * * * * * * * * * * * * * *Cabarrus County Schools 7.42% 6.11% 5.10% $8,891,935 $47,968 $281,891 $0 $0 $22,798 $0 $352,657 3.97% $26,877,173 $1,461,420 5.44% 11.13% 0.00% 0.00% $0 $0 $0 $0 $0 $0 $0 $0 0.00% $4,749,352 $528,775 11.13%Caldwell County Schools(DNS-C) 0.50% 0.21% 0.58% $13,969,329 $4,605 $268,132 $0 $0 $0 $0 $272,737 1.95% $55,933,584 $454,542 0.81% 0.00% 0.00% 0.00% $0 $0 $0 $0 $0 $0 $0 $0 0.00% $0 $0 0.00%Camden County Schools 38.66% 81.70% 14.55% $36,651 $234 $27,053 $1,352 $0 $0 $0 $28,639 78.14% $159,541 $72,917 45.70% 0.00% 0.00% 0.00% $0 $0 $0 $0 $0 $0 $0 $0 0.00% $0 $0 0.00%Carteret County Schools (DNS-C) 6.14% 12.85% 10.02% $5,320,783 $104,170 $205,124 $85 $0 $0 $0 $309,379 5.81% $22,061,004 $1,942,573 8.81% 0.00% 0.00% 0.00% $0 $0 $0 $0 $0 $0 $0 $0 0.00% $0 $0 0.00%
Caswell County Schools 89.79% 40.36% 71.81% $88,893 $10,335 $76,413 $0 $281 $0 $0 $87,029 97.90% $406,374 $261,236 64.28% * * * * * * * * * * * * * * *
Catawba County Schools 4.64% 7.83% 8.05% $1,638,466 $0 $121,585 $0 $0 $0 $0 $121,585 7.42% $6,949,163 $486,386 7.00% * * * * * * * * * * * * * * *Chapel Hill-Carrboro City Schools 0% 0.00% 0.00% $505,948 $0 $0 $0 $0 $0 $0 $0 0.00% $1,960,029 $0 0.00% 0.00% 0.00% 0.00% $1,251,117 $32,258 $0 $0 $0 $0 $0 $32,258 2.58% $1,428,354 $32,258 2.26%Charlotte-Mecklenburg Schools 8.96% 6.52% 6.33% $48,762,486 $1,702,538 $2,359,398 $1,057 $0 $0 $0 $4,062,993 8.33% $184,583,829 $13,980,165 7.57% 23.90% 65.50% 28.57% $54,224,847 $1,325,533 $470,618 $0 $32,000 $4,796,381 $0 $6,624,532 12.22% $67,951,332 $10,874,708 16.00%
Chatham County Schools 16.97% 26.26% 41.53% $3,294,720 $359,391 $28,576 $0 $0 $0 $0 $387,967 11.78% $11,055,434 $2,273,750 20.57% * * * * * * * * * * * * * * *
Cherokee County Schools(DNS-C) 1.77% 1.27% 2.02% $1,424,813 $0 $16,105 $0 $0 $0 $8,782 $24,887 1.75% $4,353,061 $72,736 1.67% 0.00% 0.00% 0.00% $0 $0 $0 $0 $0 $0 $0 $0 0.00% $0 $0 0.00%
Clay County Schools 20.43% 13.34% 0.00% $0 $0 $0 $0 $0 $0 $0 $0 0.00% $175,754 $28,559 16.25% * * * * * * * * * * * * * * *Cleveland County Schools 79.11% 19.84% 11.97% $1,927,150 $91,116 $504,610 $0 $0 $0 $5,055 $600,780 31.17% $9,082,778 $2,857,671 31.46% 7.39% 0.00% 2.94% $260,657 $0 $0 $0 $0 $0 $0 $0 0.00% $4,291,635 $237,213 5.53%
Clinton City Schools 1.26% 2.92% 0.00% $0 $0 $0 $0 $0 $0 $0 $0 0.00% $4,909,218 $107,953 2.20% * * * * * * * * * * * * * * *
Columbus County Schools 4.23% 3.88% 7.26% $687,471 $2,094 $29,164 $325 $0 $0 $0 $31,583 4.59% $6,101,625 $294,425 4.83% * * * * * * * * * * * * * * *
Craven County Schools (DNS-C) 5.95% 3.00% 8.34% $5,441,923 $228,088 $34,154 $779 $0 $0 $0 $263,021 4.83% $19,239,907 $1,025,952 5.33% 0.00% 0.00% 0.00% $0 $0 $0 $0 $0 $0 $0 $0 0.00% $0 $0 0.00%
Cumberland County Schools(DNS-C) 4.82% 11.72% 10.44% $8,716,876 $648,571 $494,817 $124,834 $0 $0 $0 $1,268,222 14.55% $38,462,609 $3,598,011 9.35% 0.00% 0.00% 0.00% $0 $0 $0 $0 $0 $0 $0 $0 0.00% $0 $0 *
Currituck County Schools 3.66% 3.91% 4.47% $1,987,653 $885 $42,153 $228 $0 $0 $0 $43,266 2.18% $9,397,503 $337,969 3.60% * * * * * * * * * * * * * * *
Dare County Schools 23.58% 21.87% 22.36% $1,630,795 $73,366 $373,925 $22,491 $0 $0 $0 $469,782 28.81% $4,745,182 $1,166,878 24.59% * * * * * * * * * * * * * * *Davidson County Schools(DNS-C) 31.85% 26.53% 27.96% $1,152,139 $19,738 $291,134 $7,709 $0 $4,625 $0 $323,206 28.05% $3,607,144 $1,024,671 28.41% 0.00% 0.00% 0.00% $0 $0 $0 $0 $0 $0 $0 $0 0.00% $0 $0 0.00%Davie County Schools(DNS-C) 6.32% 12.12% 13.70% $3,478,444 $2,593 $28,993 $283,187 $409 $77,845 $0 $393,027 11.30% $11,619,620 $1,272,308 10.95% 0.00% 0.00% 0.00% $3,500,621 $21,095 $0 $0 $0 $0 $0 $21,095 0.60% $4,217,267 $21,095 0.50%Duplin County Board of Educatiion(DNS-C) 4.22% 4.73% 4.70% $5,308,151 $15,331 $263,476 $12,719 $0 $0 $0 $291,526 5.49% $15,242,820 $750,306 4.92% 0.00% 0.00% 0.00% $0 $0 $0 $0 $0 $0 $0 $0 0.00% $0 $0 *
Year-to-Date4th Quarter HUB Construction Report - Construction Projects4th Quarter HUB Purchasing Report -Goods and Services Year-to-Date
K:\Hubrpt_Purchase and Construction\FY'06-07\Quarter and Annual\06-07PS 3 - 4.5.1 Source: HUB Purchasing Report Database and HUBSCO Construction Reporting SystemRun Date: 7/18/2008

NORTH CAROLINA DEPARTMENT OF ADMINISTRATION
OFFICE FOR HISTORICALLY UNDERUTILIZED BUSINESSES
Purchasing and Construction Reports
Public Schools - 4th Quarter 2006-07(April 1, 2007 - June 30, 2007)
4th Quarter 2006-07(April 1 - June 30,
2007)
1st Qtr
2nd Qtr
3rd Qtr
1st Qtr
2ndQtr
3rd Qtr
Public Entity Type/Entity
To
tal
HU
B (
%)
To
tal
HU
B (
%)
To
tal
HU
B (
%)
To
tal
Pu
rch
asin
g($
)
MB
E (
$)
WB
E (
$)
DB
E-O
($)
DB
E (
$)
NP
WC
($)
Su
b (
$)
To
tal
HU
B (
$)
To
tal
HU
B (
%)
To
tal
Pu
rch
asin
g (
$)
To
tal
HU
B (
$)
To
tal
HU
B (
%)
To
tal
HU
B (
%)
To
tal
HU
B (
%)
To
tal
HU
B (
%)
To
tal
Co
nst
ruct
ion
V
alu
e ($
)
B($
)
H($
)
AA
($)
AI(
$)
WF
($)
SE
($)
To
tal
HU
B (
$)
To
tal
HU
B (
%)
To
tal
Co
nst
ruct
ion
V
alu
e ($
)
To
tal
HU
B (
$)
To
tal
HU
B (
%)
Year-to-Date4th Quarter HUB Construction Report - Construction Projects4th Quarter HUB Purchasing Report -Goods and Services Year-to-Date
PUBLIC SCHOOLS - Contd….
Durham City Schools 2.29% 5.51% 4.41% $5,512,784 $30,220 $158,008 $1,756 $0 $0 $0 $189,984 3.45% $47,621,589 $1,557,935 3.27% 0.00% 0.00% 0.00% $0 $0 $0 $0 $0 $0 $0 $0 0.00% $0 $0 0.00%
Edenton Chowan Schools 5.40% 6.65% 4.73% $1,204,050 $0 $31,596 $0 $0 $0 $0 $31,596 2.62% $3,353,570 $151,922 4.53% * * * * * * * * * * * * * * *Edgecombe County Schools 3.32% 4.42% 7.45% $2,196,107 $49,858 $68,690 $767 $0 $0 $0 $119,315 5.43% $6,224,876 $321,786 5.17% 0.00% 0.00% 0.00% $0 $0 $0 $0 $0 $0 $0 $0 0.00% $202,102 $0 0.00%
Elizabeth City Schools (DNS) 7.40% 5.60% 14.26% $3,191,518 $112,595 $27,411 $103,838 $0 $1,056 $1,296 $246,195 7.71% $17,433,028 $1,413,272 8.11% * * * * * * * * * * * * * * *
Elkin City Schools 10.81% 16.18% 29.55% $318,238 $1,068 $15,939 $0 $0 $0 $0 $17,007 5.34% $832,459 $112,038 13.46% * * * * * * * * * * * * * * *Franklin County Schools (DNS-C) 4.70% 6.02% 7.51% $2,463,952 $13,967 $209,920 $0 $0 $0 $0 $223,887 9.09% $19,614,764 $1,202,558 6.13% 0.00% 0.00% 0.00% $0 $0 $0 $0 $0 $0 $0 $0 0.00% $0 $0 *
Gaston County Schools 3.78% 6.84% 18.31% $7,494,943 $65,763 $356,608 $193,183 $77,019 $0 $0 $692,573 9.24% $48,186,997 $3,856,792 8.00% * * * * * * * * * * * * * * *
Gates County Schools 0.30% 4.38% 0.78% $601,759 $9,744 $12,058 $0 $0 $0 $0 $21,802 3.62% $1,788,434 $44,565 2.49% * * * * * * * * * * * * * * *Graham County Schools 30.68% 32.10% 43.12% $635,877 $33,324 $133,491 $0 $0 $68 $0 $166,882 26.24% $2,092,085 $685,010 32.74% 15.28% 0.00% 0.00% $0 $0 $0 $0 $0 $0 $0 $0 0.00% $1,587,978 $242,722 15.28%
Granville County Schools 0.41% 0.52% 0.73% $1,008,998 $1,891 $2,042 $0 $1,099 $0 $0 $5,032 0.50% $6,816,050 $34,392 0.50% * * * * * * * * * * * * * * *
Greene County Schools 4.67% 0.00% 5.61% $0 $0 $0 $0 $0 $0 $0 $0 0.00% $5,372,831 $283,001 5.27% * * * * * * * * * * * * * * *Guildford County Schools 0.00% 10.79% 14.39% $9,732,010 $425,173 $764,179 $3,631 $0 $0 $0 $1,192,983 12.26% $34,785,350 $4,336,289 12.47% 20.29% 61.83% 71.33% $0 $0 $0 $0 $0 $0 $0 $0 0.00% $8,629,566 $2,125,808 24.63%Halifax County Schools(DNS-C) 2.67% 0.82% 29.25% $714,659 $924 $273,531 $0 $0 $0 $0 $274,455 38.40% $4,723,977 $507,958 10.75% 0.00% 0.00% 0.00% $0 $0 $0 $0 $0 $0 $0 $0 0.00% $0 $0 0.00%
Harnett County Schools 11.54% 0.00% 0.00% $0 $0 $0 $0 $0 $0 $0 $0 0.00% $2,563,009 $295,790 11.54% * * * * * * * * * * * * * * *Haywood County Schools 3.79% 4.62% 0.70% $884,440 $389 $36,908 $0 $0 $0 $0 $37,297 4.22% $3,591,125 $110,752 3.08% 0.00% 0.00% 0.00% $0 $0 $0 $0 $0 $0 $0 $0 0.00% $0 $0 0.00%Henderson County Public Schools (DNS-C) 18.93% 25.26% 20.24% $1,530,963 $52,937 $421,909 $0 $0 $0 $0 $474,846 31.02% $5,389,524 $1,291,146 23.96% 0.00% 0.00% 0.00% $0 $0 $0 $0 $0 $0 $0 $0 0.00% $0 $0 0.00%Hertford County Public Schools (DNS-C)
13.94% 16.30% 15.20% $5,245,700 $1,197,595 $31,853 $46,888 $0 $0 $0 $1,276,336 24.33% $18,126,652 $3,230,370 17.82% 0.00% 0.00% 0.00% $0 $0 $0 $0 $0 $0 $0 $0 0.00% $0 $0 0.00%Hickory Public Schools (DNS-C) 0.00% 3.49% 2.72% $368,277 $104 $8,135 $0 $0 $0 $0 $8,239 2.24% $819,834 $21,777 2.66% 0.00% 0.00% 0.00% $0 $0 $0 $0 $0 $0 $0 $0 0.00% $0 $0 0.00%
Hoke County Schools(DNS) 100% 0.00% 0.00% $1,691,259 $0 $33,553 $0 $0 $0 $0 $33,553 1.98% $1,754,075 $96,369 5.49% * * * * * * * * * * * * * * *
Hyde County Schools 2.20% 3.17% 2.84% $0 $0 $0 $0 $0 $0 $0 $0 0.00% $5,314,420 $145,908 2.75% * * * * * * * * * * * * * * *Iredell-Statesville Schools 24.44% 35.51% 12.85% $3,034,393 $126,553 $256,826 $0 $925 $267 $0 $384,571 12.67% $12,116,252 $2,498,602 20.62% 0.00% 0.00% 0.00% $2,581,681 $29,621 $0 $0 $0 $0 $0 $29,621 1.15% $2,581,681 $29,621 1.15%Jackson County Board of Education 7.96% 7.37% 29.73% $0 $0 $0 $0 $0 $0 $0 $0 0.00% $1,426,878 $231,063 16.19% 0.00% 0.00% 0.00% $0 $0 $0 $0 $0 $0 $0 $0 0.00% $0 $0 *
Johnston County Schools 27.65% 12.86% 7.05% $8,081,617 $37,954 $686,323 $49,944 $0 $0 $0 $774,221 9.58% $24,024,464 $2,975,741 12.39% * * * * * * * * * * * * * * *Jones County Public Schools (DNS-C) 5.28% 8.94% 9.09% $252,863 $17,235 $30,855 $0 $0 $0 $0 $48,090 19.02% $1,577,396 $138,112 8.76% 0.00% 0.00% 0.00% $314,065 $0 $0 $0 $0 $0 $0 $0 0.00% $399,019 $0 0.00%
Kannapolis City Schools 0.94% 1.21% 0.00% $1,191,612 $9,595 $11,655 $0 $0 $0 $0 $21,250 1.78% $4,872,250 $60,748 1.25% * * * * * * * * * * * * * * *Lee County Board of Education 5.38% 2.92% 3.02% $440,364 $666 $15,016 $0 $0 $0 $0 $15,682 3.56% $2,667,967 $106,159 3.98% 23.33% 0.00% 17.19% $38,644 $0 $0 $0 $0 $0 $0 $0 0.00% $567,791 $97,675 17.20%Lenoir County Public Schools(DNS-C) 18.94% 16.54% 8.44% $2,290,369 $10,033 $80,468 $597 $0 $0 $0 $91,098 3.98% $9,185,052 $1,046,356 11.39% 0.00% 0.00% 0.00% $0 $0 $0 $0 $0 $0 $0 $0 0.00% * * *
Lexington City Schools 2.47% 2.63% 1.96% $952,273 $9,506 $10,249 $0 $0 $0 $0 $19,754 2.07% $3,233,786 $73,670 2.28% * * * * * * * * * * * * * * *Lincoln County Schools (DNS-C)
6.06% 4.29% 4.55% $5,788,262 $13,065 $240,536 $3,300 $0 $0 $0 $256,901 4.44% $18,882,060 $901,361 4.77% 0.00% 0.00% 0.00% $0 $0 $0 $0 $0 $0 $0 $0 0.00% $0 $0 0.00%
Macon County Schools 1.29% 0.24% 0.11% $5,522,684 $11,627 $295 $11,627 $0 $0 $0 $23,549 0.43% $17,480,093 $60,245 0.34% * * * * * * * * * * * * * * *Madison County Public Schools(DNS-C)
1.90% 2.73% 6.72% $2,387,172 $6,135 $65,496 $0 $0 $0 $0 $71,631 3.00% $5,441,245 $185,163 3.40% 0.00% 0.00% 0.00% $0 $0 $0 $0 $0 $0 $0 $0 0.00% $0 $0 0.00%
Martin County Schools 18.02% 21.58% 39.35% $595,882 $20,693 $219,752 $0 $0 $0 $0 $240,445 40.35% $1,908,398 $620,572 32.52% * * * * * * * * * * * * * * *McDowell County Schools(DNS-C)
13.34% 24.37% 20.74% $2,963,601 $22,925 $303,832 $0 $0 $0 $0 $326,757 11.03% $7,812,267 $1,247,622 15.97% 0.00% 0.00% 0.00% $0 $0 $0 $0 $0 $0 $0 $0 0.00% $0 $0 0.00%
Mitchell County Schools 0.00% 0.00% 0.00% $219,498 $0 $0 $0 $0 $0 $0 $0 0.00% $992,828 $0 0.00% * * * * * * * * * * * * * * *
K:\Hubrpt_Purchase and Construction\FY'06-07\Quarter and Annual\06-07PS 3 - 4.5.2 Source: HUB Purchasing Report Database and HUBSCO Construction Reporting SystemRun Date: 7/18/2008

NORTH CAROLINA DEPARTMENT OF ADMINISTRATION
OFFICE FOR HISTORICALLY UNDERUTILIZED BUSINESSES
Purchasing and Construction Reports
Public Schools - 4th Quarter 2006-07(April 1, 2007 - June 30, 2007)
4th Quarter 2006-07(April 1 - June 30,
2007)
1st Qtr
2nd Qtr
3rd Qtr
1st Qtr
2ndQtr
3rd Qtr
Public Entity Type/Entity
To
tal
HU
B (
%)
To
tal
HU
B (
%)
To
tal
HU
B (
%)
To
tal
Pu
rch
asin
g($
)
MB
E (
$)
WB
E (
$)
DB
E-O
($)
DB
E (
$)
NP
WC
($)
Su
b (
$)
To
tal
HU
B (
$)
To
tal
HU
B (
%)
To
tal
Pu
rch
asin
g (
$)
To
tal
HU
B (
$)
To
tal
HU
B (
%)
To
tal
HU
B (
%)
To
tal
HU
B (
%)
To
tal
HU
B (
%)
To
tal
Co
nst
ruct
ion
V
alu
e ($
)
B($
)
H($
)
AA
($)
AI(
$)
WF
($)
SE
($)
To
tal
HU
B (
$)
To
tal
HU
B (
%)
To
tal
Co
nst
ruct
ion
V
alu
e ($
)
To
tal
HU
B (
$)
To
tal
HU
B (
%)
Year-to-Date4th Quarter HUB Construction Report - Construction Projects4th Quarter HUB Purchasing Report -Goods and Services Year-to-Date
PUBLIC SCHOOLS - Contd….Montgomery County Schools 3.31% 1.31% 2.45% $1,277,183 $0 $10,048 $0 $0 $0 $0 $10,048 0.79% $3,922,476 $74,388 1.90% * * * * * * * * * * * * * * *Moore County Schools
2.42% 10.94% 12.10% $1,425,475 $15,667 $183,806 $0 $0 $0 $0 $199,473 13.99% $8,185,126 $642,463 7.85% 0.00% 32.70% 4.10% $503,557 $0 $0 $0 $0 $0 $0 $0 0.00% $1,151,185 $110,591 9.61%
Mooresville City Schools 7.50% 6.73% 7.05% $422,618 $23,899 $5,280 $1,316 $99 $0 $0 $30,594 7.24% $1,876,604 $133,956 7.14% * * * * * * * * * * * * * * *
Mount Airy County Schools 25.96% 42.50% 48.26% $351,840 $7,108 $126,879 $17,019 $0 $0 $0 $151,006 42.92% $1,602,876 $646,781 40.35% * * * * * * * * * * * * * * *Nash-Rocky Mount Schools(DNS-C)
27.08% 8.46% 5.27% $630,151 $1,800 $218,850 $28,231 $0 $0 $0 $248,881 39.50% $3,281,025 $645,987 19.69% 0.00% 0.00% 0.00% $0 $0 $0 $0 $0 $0 $0 $0 0.00% $0 $0 0.00%
New Hanover County Schools 5.75% 19.72% 4.67% $16,271,376 $220,900 $612,174 $0 $0 $0 $0 $833,074 5.12% $44,232,063 $2,306,129 5.21% 44.17% 0.00% 0.00% $4,981,798 $0 $0 $0 $0 $606,989 $0 $606,989 12.18% $6,983,946 $1,300,384 18.62%Newton-Conover City Schools (DNS-C) 12.79% 37.58% 44.47% $108,357 $3,001 $58,173 $0 $0 $0 $0 $61,174 56.46% $228,322 $94,732 41.49% 0.00% 0.00% 0.00% $0 $0 $0 $0 $0 $0 $0 $0 0.00% $0 $0 0.00%Northampton County Schools 3.49% 0.00% 19.72% $0 $0 $0 $0 $0 $0 $0 $0 0.00% $908,997 $71,876 7.91% 0.00% 0.00% 7.19% $0 $0 $0 $0 $0 $0 $0 $0 0.00% $7,374,756 $530,080 7.19%
Onslow County Schools 2.72% 3.79% 2.39% $7,709,186 $24,642 $113,318 $24,568 $50 $485 $0 $163,063 2.12% $28,727,779 $796,126 2.77% * * * * * * * * * * * * * * *
Orange County Schools 26.88% 18.65% 12.01% $4,361,396 $78,591 $768,412 $2,681 $13,421 $0 $0 $863,105 19.79% $17,044,248 $3,022,231 17.73% * * * * * * * * * * * * * * *Pamlico County Schools 7.47% 7.24% 7.12% $287,393 $12,963 $7,819 $0 $0 $0 $0 $20,782 7.23% $1,159,756 $84,311 7.27% 0.00% 0.00% 0.00% $0 $0 $0 $0 $0 $0 $0 $0 0.00% $0 $0 *
Pender County Schools 29.76% 25.47% 23.50% $7,262,510 $12,070 $1,040,111 $0 $2,490 $48,467 $421,443 $1,524,581 20.99% $22,195,959 $5,267,438 23.73% * * * * * * * * * * * * * * *
Perquimans County Schools 3.91% 11.57% 36.33% $32,221 $0 $10,969 $0 $0 $0 $0 $10,969 34.04% $136,777 $25,486 18.63% * * * * * * * * * * * * * * *Person County Schools (DNS-C) 7.00% 4.55% 27.93% $745,724 $1,680 $35,506 $0 $81,312 $0 $0 $118,498 15.89% $3,775,631 $452,565 11.99% 0.00% 0.00% 0.00% $0 $0 $0 $0 $0 $0 $0 $0 0.00% $0 $0 *Pitt County Schools (DNS-C)
32.46% 35.89% 18.77% $2,268,398 $289,790 $168,027 $191,329 $67,870 $127,141 $0 $844,157 37.21% $12,931,440 $3,995,236 30.90% 0.00% 0.00% 0.00% $0 $0 $0 $0 $0 $0 $0 $0 0.00% $0 $0 *
Polk County Schools 12.48% 4.59% 2.93% $1,240,114 $1,162 $76,734 $0 $0 $0 $0 $77,896 6.28% $4,695,234 $281,444 5.99% * * * * * * * * * * * * * * *Randolph County Schools(DNS-C) 0.33% 0.22% 0.19% $21,162,069 $24,564 $5,621 $509 $0 $0 $0 $30,694 0.15% $81,718,595 $178,289 0.22% 0.00% 0.00% 0.00% $0 $0 $0 $0 $0 $0 $0 $0 0.00% $0 $0 *Richmond County Schools(DNS-C) 17.25% 17.32% 16.05% $3,245,394 $9,705 $401,136 $754 $0 $0 $0 $411,595 12.68% $9,700,251 $1,496,294 15.43% 0.00% 0.00% 0.00% $0 $0 $0 $0 $0 $0 $0 $0 0.00% $0 $0 *Roanoke Rapids City School (DNS-C) 18.92% 4.46% 13.86% $554,794 $10,673 $45,577 $0 $899 $0 $0 $57,149 10.30% $2,163,278 $290,422 13.43% 0.00% 0.00% 0.00% $0 $0 $0 $0 $0 $0 $0 $0 0.00% $0 $0 *
Robeson County Schools 1.15% 1.30% 1.00% $29,782,963 $255,362 $3,065 $88,054 $0 $0 $0 $346,481 1.16% $99,312,022 $1,141,803 1.15% 0.00% 0.00% 0.00% $617,781 $0 $0 $0 $0 $0 $0 $0 0.00% $1,013,868 $0 0.00%
Rockingham County Schools 10.08% 15.31% 8.66% $1,899,888 $21,719 $233,640 $419 $0 $0 $0 $255,778 13.46% $8,214,081 $971,833 11.83% * * * * * * * * * * * * * * *
Rowan/Salisbury County Schools 6.11% 1.72% 1.63% $5,341,931 $12,850 $17,490 $0 $0 $0 $0 $30,340 0.57% $20,630,224 $474,301 2.30% * * * * * * * * * * * * * * *Rutherford County Schools (DNS-C) 1.70% 3.43% 1.70% $3,639,667 $10,890 $86,555 $0 $0 $0 $0 $97,445 2.68% $13,393,290 $320,207 2.39% * * * * * * * * * * * * * * *
Sampson County Schools 3.30% 3.48% 4.05% $996,343 $27,609 $11,621 $0 $0 $50 $0 $39,280 3.94% $7,626,603 $279,674 3.67% * * * * * * * * * * * * * * *Scotland County Schools (DNS-C) 35.19% 35.69% 37.07% $898,147 $247,613 $150,323 $0 $0 $0 $0 $397,936 44.31% $3,689,003 $1,402,512 38.02% 0.00% 0.00% 0.00% $0 $0 $0 $0 $0 $0 $0 $0 0.00% $0 $0 0.00%
Stanly County Schools 7.44% 1.06% 3.61% $0 $0 $0 $0 $0 $0 $0 $0 0.00% $6,573,679 $324,486 4.94% * * * * * * * * * * * * * * *
Stokes County Schools(DNS-C) 7.84% 14.47% 12.05% $3,255,526 $32,302 $311,114 $0 $0 $0 $0 $343,416 10.55% $9,362,571 $1,054,637 11.26% 0.00% 0.00% 0.00% $0 $0 $0 $0 $0 $0 $0 $0 0.00% $58,466 $0 0.00%Surry County Board of Education
16.38% 14.85% 15.29% $1,579,418 $136,202 $134,944 $1,186 $75,000 $0 $0 $347,332 21.99% $6,353,145 $1,080,897 17.01% 0.00% 0.00% 0.00% $4,506,621 $0 $0 $0 $0 $0 $0 $0 0.00% $5,054,749 $0 0.00%
Swain County Schools 74.95% 75.21% 69.72% $12,238 $2,842 $1,541 $250 $0 $0 $0 $4,633 37.86% $85,332 $58,445 68.49% * * * * * * * * * * * * * * *
Thomasville City Schools 8.50% 10.99% 14.36% $612,593 $13,611 $91,032 $114 $0 $0 $0 $104,758 17.10% $2,921,133 $363,953 12.46% * * * * * * * * * * * * * * *Transylvania County Schools
9.56% 9.46% 4.46% $957,229 $0 $38,351 $0 $0 $0 $0 $38,351 4.01% $3,460,914 $228,097 6.59% 0.00% 0.00% 0.00% $0 $0 $0 $0 $0 $0 $0 $0 0.00% $1,004,700 $0 0.00%
Tyrell County Schools 4.61% 8.46% 3.73% $47,894 $398 $1,418 $0 $0 $0 $0 $1,816 3.79% $536,475 $30,128 5.62% * * * * * * * * * * * * * * *Union County Public Schools 0.00% 0.00% 0.00% $0 $0 $0 $0 $0 $0 $0 $0 0.00% $0 $0 0.00% 0.00% 0.00% 0.90% $280,800 $0 $0 $0 $0 $0 $0 $0 0.00% $12,182,874 $100,217 0.82%Vance County Board of Education 0.72% 3.93% 1.39% $2,980,786 $1,089 $53,068 $0 $0 $0 $0 $54,157 1.82% $10,140,551 $200,620 1.98% 0.37% 0.00% 0.00% $160,936 $0 $0 $0 $0 $0 $0 $0 0.00% $1,984,791 $4,500 0.23%
K:\Hubrpt_Purchase and Construction\FY'06-07\Quarter and Annual\06-07PS 3 - 4.5.3 Source: HUB Purchasing Report Database and HUBSCO Construction Reporting SystemRun Date: 7/18/2008

NORTH CAROLINA DEPARTMENT OF ADMINISTRATION
OFFICE FOR HISTORICALLY UNDERUTILIZED BUSINESSES
Purchasing and Construction Reports
Public Schools - 4th Quarter 2006-07(April 1, 2007 - June 30, 2007)
4th Quarter 2006-07(April 1 - June 30,
2007)
1st Qtr
2nd Qtr
3rd Qtr
1st Qtr
2ndQtr
3rd Qtr
Public Entity Type/Entity
To
tal
HU
B (
%)
To
tal
HU
B (
%)
To
tal
HU
B (
%)
To
tal
Pu
rch
asin
g($
)
MB
E (
$)
WB
E (
$)
DB
E-O
($)
DB
E (
$)
NP
WC
($)
Su
b (
$)
To
tal
HU
B (
$)
To
tal
HU
B (
%)
To
tal
Pu
rch
asin
g (
$)
To
tal
HU
B (
$)
To
tal
HU
B (
%)
To
tal
HU
B (
%)
To
tal
HU
B (
%)
To
tal
HU
B (
%)
To
tal
Co
nst
ruct
ion
V
alu
e ($
)
B($
)
H($
)
AA
($)
AI(
$)
WF
($)
SE
($)
To
tal
HU
B (
$)
To
tal
HU
B (
%)
To
tal
Co
nst
ruct
ion
V
alu
e ($
)
To
tal
HU
B (
$)
To
tal
HU
B (
%)
Year-to-Date4th Quarter HUB Construction Report - Construction Projects4th Quarter HUB Purchasing Report -Goods and Services Year-to-Date
PUBLIC SCHOOLS - Contd….Wake County Public School System 24.54% 9.63% 10.90% $12,062,791 $4,922 $389,385 $60,661 $0 $0 $0 $454,968 3.77% $120,168,098 $22,515,607 18.74% 13.32% 15.90% 14.17% $29,772,950 $343,955 $687,033 $81,660 $0 $2,132,811 $5,041 $3,250,500 10.92% $60,823,984 $7,658,206 12.59%
Warren County Schools 0.00% 0.00% 0.00% $0 $0 $0 $0 $0 $0 $0 $0 0.00% $0 $0 0.00% * * * * * * * * * * * * * * *Washington County Schools 0.00% 0.00% 0.00% $1,403,938 $0 $0 $0 $0 $0 $0 $0 0.00% $4,835,937 $0 0.00% 0.00% 0.00% 0.00% $0 $0 $0 $0 $0 $0 $0 $0 0.00% $0 $0 0.00%
Watauga County Schools 13.41% 5.55% 6.90% $540,162 $23,525 $40,223 $0 $0 $0 $0 $63,747 11.80% $2,669,713 $228,100 8.54% * * * * * * * * * * * * * * *Wayne County Public Schools 11.07% 18.57% 18.13% $3,797,182 $137,361 $689,242 $9,222 $0 $0 $0 $835,826 22.01% $11,958,261 $2,141,295 17.91% 0.00% 71.45% 0.00% $98,820 $0 $0 $0 $24,125 $0 $0 $24,125 24.41% $290,530 $62,725 21.59%
Weldon City Schools 0.00% 0.00% 0.00% $117,453 $0 $0 $0 $0 $0 $0 $0 0.00% $445,226 $0 0.00% * * * * * * * * * * * * * * *
Whiteville City Schools 11.22% 7.45% 6.22% $684,117 $0 $83,154 $3,678 $684 $0 $0 $87,516 12.79% $3,408,356 $310,887 9.12% * * * * * * * * * * * * * * *Wilkes County Public Schools
19.62% 24.67% 20.86% $732,545 $2,033 $219,868 $35,585 $0 $0 $0 $257,486 35.15% $2,213,345 $577,347 26.08%0.00% 0.00% 0.00% $0 $0 $0 $0 $0 $0 $0 $0 0.00% $773,614 $0
0.00%Wilson County Schools(DNS-C)
4.45% 10.19% 24.13% $2,862,859 $255,676 $312,203 $0 $0 $0 $0 $567,879 19.84% $9,167,390 $1,459,891 15.92%0.00% 0.00% 0.00% $0 $0 $0 $0 $0 $0 $0 0.00% $0 $0
*Winston-Salem/Forsyth County Schools 18.84% 10.89% 10.99% $13,034,274 $464,227 $566,521 $419,966 $0 $0 $0 $1,450,714 11.13% $62,225,223 $7,942,554 12.76% 6.16% 15.46% 0.46% $7,150,914 $625,288 $228,052 $0 $0 $0 $0 $853,340 11.93% $30,821,765 $3,264,259 10.59%Yadkin County Schools 8.23% 39.53% 31.83% $406,144 $55,890 $55,890 $1,760 $5,280 $0 $52,016 $170,836 42.06% $2,062,717 $450,218 21.83% 0.00% 0.00% 0.00% $0 $0 $0 $0 $0 $0 $0 $0 0.00% $5,812,992 $0 0.00%Yancey County Schools(DNS-C) 1.08% 0.86% 0.58% $2,271,807 $398 $15,498 $0 $0 $0 $0 $15,896 0.70% $10,232,521 $83,390 0.81% 0.00% 0.00% 0.00% $0 $0 $0 $0 $0 $0 $0 $0 0.00% $0 $0 *
TOTALS 9.91% 7.40% 7.56% $408,050,880 $8,408,477 $18,466,668 $2,188,087 $335,901 $283,102 $488,592 $30,170,827 7.39% $1,677,056,529 $139,154,658 8.30% 13.85% 15.99% 5.86% $110,245,809 $2,377,750 $1,385,703 $81,660 $56,125 $7,536,181 $5,041 $11,442,461 10.38% $241,295,774 $27,358,912 11.34%
% of HUB Participation 2.06% 4.53% 0.54% 0.08% 0.07% 0.12% 7.39% 8.30% 2.16% 1.26% 0.07% 0.05% 6.84% 0.00% 10.38% 11.34%
%of Minority Participation against Total HUB $ 27.87% 61.21% 7.25% 1.11% 0.94% 1.62% 21% 12% 1% 0% 66% 0%
LEGEND:
DNS-C - Categories with blanks or blank space indicate LEGEND: LEGEND:
entity "DID NOT SUBMIT" Construction Report MBE - Minority Business Enterprise B - Black
DNS-P - Categories with blanks or blank space indicate WBE - Woman Business Enterprise H - Hispanic
entity "DID NOT SUBMIT" Purchasing Report DBE-O- Disabled - Owned Business Enterprise AA - Asian-American
* - currently do not report DBE - Disabled Business Enterprise AI - American Indian
NPWC - Non - profit Work Center for the Blind & Severely Disabled WF - White Female
Note: Sub - HUB Subcontractor SE - Socially and Economically Disadvantaged
1. When a construction project is finalized (submitted) by an entiity, HUBSCO system will update
to the relevant quarter when the project was completed
K:\Hubrpt_Purchase and Construction\FY'06-07\Quarter and Annual\06-07PS 3 - 4.5.4 Source: HUB Purchasing Report Database and HUBSCO Construction Reporting SystemRun Date: 7/18/2008

NORTH CAROLINA DEPARTMENT OF ADMINISTRATION
OFFICE FOR HISTORICALLY UNDERUTILIZED BUSINESSES
Purchasing and Construction Reports
State Universities - 4th Quarter 2006-07(April 1, 2007 - June 30, 2007)
4th Quarter 2006-07(April 1 - June 30,
2007)
1st Qtr
2nd Qtr
3rd Qtr
1st Qtr
2ndQtr
3rd Qtr
Public Entity Type/Entity
To
tal H
UB
(%
)
To
tal H
UB
(%
)
To
tal H
UB
(%
)
To
tal
Pu
rch
as
ing
($)
MB
E (
$)
WB
E (
$)
DB
E-O
($)
DB
E (
$)
NP
WC
($
)
Su
b (
$)
To
tal H
UB
($
)
To
tal H
UB
(%
)
To
tal
Pu
rch
asin
g (
$)
To
tal H
UB
($
)
To
tal H
UB
(%
)
To
tal H
UB
($
)
To
tal H
UB
(%
)
To
tal H
UB
(%
)
To
tal H
UB
(%
)
To
tal
Co
ns
tru
cti
on
V
alu
e ($
)
B($
)
H($
)
AA
($)
AI(
$)
WF
($)
SE
($)
To
tal H
UB
($
)
To
tal H
UB
(%
)
To
tal
Co
ns
tru
cti
on
V
alu
e ($
)
To
tal H
UB
($
)
To
tal H
UB
(%
)
STATE UNIVERSITIESAppalachian State University(DNS-C) 6.29% 1.72% 3.87% $9,889,779 $170,750 $1,131,077 $0 $0 $0 $0 $435,740 4.41% $24,801,941 $1,056,974 4.26% 100.00% 0.00% 0.00% $0 $0 $0 $0 $0 $0 $0 $0 0.00% $1,053,914 $185,620 17.61%East Carolina University 13.62% 12.35% 6.63% $41,883,351 $571,794 $1,680,845 $5,030 $0 $0 $3,373,176 $2,902,137 6.93% $118,482,480 $10,629,265 8.97% 10.92% 11.98% 1.62% $774,474 $4,470 $0 $0 $0 $115,386 $0 $119,856 15.48% $51,306,671 $5,620,770 10.96%Elizabeth City State University (DNS-C) 10.40% 34.53% 48.04% $1,638,203 $543,498 $30,330 $0 $0 $11,314 $0 $302,972 18.49% $12,331,870 $2,330,990 18.90% 0.00% 0.00% 0.00% $0 $0 $0 $0 $0 $0 $0 $0 0.00% $0 $0 0.00%Fayetteville State University (DNS-C) 2.83% 10.68% 39.82% $3,847,828 $128,077 $169,017 $0 $0 $0 $0 $282,212 7.33% $30,486,316 $2,226,054 7.30% 0.00% 0.00% 0.00% $0 $0 $0 $0 $0 $0 $0 $0 0.00% $0 $0 0.00%North Carolina Agricultural & Technical State University(DNS-C) 11.20% 12.24% 7.13% $12,824,855 $1,681,684 $561,208 $0 $0 $0 $0 $770,993 6.01% $39,092,296 $3,430,594 8.78% 0.00% 0.00% 0.00% $0 $0 $0 $0 $0 $0 $0 $0 0.00% $0 $0 0.00%North Carolina Arboretum (DNS-C) X X X X X X X X X X X X X X X 0.00% 0.00% 0.00% $0 $0 $0 $0 $0 $0 $0 $0 0.00% $0 $0 0.00%North Carolina Central University(DNS-C) 32.37% 36.86% 34.81% $10,097,090 $2,642,379 $621,396 $0 $0 $0 $0 $2,688,111 26.62% $32,001,667 $10,247,989 32.02% 0.00% 0.00% 0.00% $0 $0 $0 $0 $0 $0 $0 $0 0.00% $0 $0 0.00%North Carolina School of Science and Mathematics(DNS-C) 13.29% 20.72% 19.65% $2,518,026 $184,699 $214,718 $17,910 $0 $0 $0 $766,439 30.44% $4,553,077 $1,063,937 23.37% 0.00% 100% 0.00% $328,025 $0 $0 $0 $0 $38,039 $0 $38,039 11.60% $634,626 $344,640 54.31%North Carolina School of the ArtsDNS-C) 14.21% 8.62% 12.70% $128,469 $26,232 $4,392 $0 $0 $0 $0 $3,157 2.46% $3,320,194 $398,063 11.99% 0.00% 0.00% 0.00% $0 $0 $0 $0 $0 $0 $0 $0 0.00% $0 $0 0.00%North Carolina State University 0.93% 2.00% 1.53% $66,055,903 $700,428 $900,306 $98,520 $615 $0 $0 $648,831 0.98% $204,465,460 $2,703,555 1.32% 13.98% 29.41% 19.96% $20,110,265 $437,316 $530,888 $0 $0 $1,425,772 $0 $2,393,976 11.90% $78,017,809 $12,693,909 16.27%UNC Hospitals 0.21% 0.25% 0.07% $73,521,007 $15,138 $63,631 $0 $0 $0 $0 $395,737 0.54% $314,239,750 $825,693 0.26% 0.00% 0.00% 0.00% $0 $0 $0 $0 $0 $0 $0 $0 0.00% $942,900 $0 0.00%UNC-Asheville 7.05% 6.24% 5.14% $2,890,702 $34,920 $379,568 $607 $21,229 $0 $0 $242,409 8.39% $6,130,650 $440,006 7.18% 31.60% 0.00% 0.00% $7,729,578 $0 $1,982,889 $0 $0 $50,846 $0 $2,033,735 26.31% $8,706,780 $2,289,139 26.29%UNC-Chapel Hill 2.09% 5.33% 0.94% $68,034,922 $236,103 $381,042 $0 $0 $0 $0 $294,038 0.43% $184,824,759 $2,807,515 1.52% 13.51% 10.12% 13.71% $4,928,445 $107,936 $918,370 $0 $0 $440,372 $28,798 $1,495,476 30.34% $84,153,789 $10,993,566 13.06%UNC-Charlotte(DNS-C) 16.71% 13.52% 6.94% $17,799,413 $939,942 $1,786,983 $3,250 $0 $0 $0 $4,576,631 25.71% $45,081,211 $7,950,037 17.63% 7.61% 0.00% 14.03% $18,962,014 $445,748 $138,110 $108,025 $0 $2,345,333 $135,988 $3,173,204 16.73% $81,802,701 $10,280,734 12.57%UNC-Greensboro 11.62% 4.44% 8.36% $7,619,217 $224,428 $684,044 $9,043 $0 $0 $0 $366,757 4.81% $23,605,123 $1,729,161 7.33% 12.04% 11.80% 38.92% $1,395,713 $19,179 $0 $0 $0 $102,310 $0 $121,489 8.70% $15,121,611 $1,830,245 12.10%UNC-Office of the President (DNS-C)
1.94% 3.71% 1.18% $6,268,117 $27,137 $138,262 $0 $0 $0 $0 $109,878 1.75% $25,161,524 $468,812 1.86% 0.00% 0.00% 0.00% $0 $0 $0 $0 $0 $0 $0 $0 0.00% $0 $0 0.00%UNC-Pembroke 8.00% 4.06% 4.92% $6,061,438 $272,426 $135,151 $50,451 $0 $0 $0 $17,174 0.28% $17,920,192 $671,664 3.75% 100% 0.00% 0.00% $190,569 $0 $0 $0 $190,569 $0 $0 $190,569 100.00% $1,508,976 $1,508,976 100%UNC-TV X X X X X X X X X X X X X X X 4.87% 0.00% 0.00% $56,976 $0 $0 $0 $0 $30,422 $0 $30,422 53.39% $205,208 $36,250 17.67%UNC-Wilmington (DNS-C) 4.95% 4.25% 8.28% $8,254,685 $42,898 $502,251 $901 $11,512 $0 $0 $275,450 3.34% $31,059,565 $1,545,804 4.98% 39.74% 6.60% 60.02% $969,349 $39,875 $0 $0 $228,172 $118,964 $0 $387,011 39.92% $2,886,759 $1,174,399 40.68%Western Carolina University 0.00% 12.21% 20.20% $10,321,734 $712,786 $1,742,881 $11,049 $0 $5,292 $0 $582,350 5.64% $19,733,280 $2,065,780 10.47% 0.00% 0.00% 0.00% $0 $0 $0 $0 $0 $0 $0 $0 0.00% $0 $0 0.00%Winston-Salem State University 6.80% 6.24% 5.86% $13,365,628 $392,589 $325,104 $0 $0 $0 $0 $125,975 0.94% $27,450,054 $1,024,478 3.73% 5.07% 25.51% 13% $883,179 $147,249 $0 $6,800 $0 $64,721 $0 $218,770 24.77% $2,776,197 $529,223 19.06%
TOTALS 4.44% 5.53% 4.45% $363,020,367 $9,547,908 $11,452,206 $196,761 $33,356 $16,606 $3,373,176 $24,620,013 6.78% $1,164,741,409 $62,449,393 5.36% 12.90% 13.31% 15.89% $56,328,587 $1,201,773 $3,570,257 $114,825 $418,741 $4,732,165 $164,786 $10,202,547 18.11% $329,117,941 $47,487,471 14.43%
% of HUB Participation 2.63% 3.15% 0.05% 0.01% 0.00% 0.93% 6.78% 5.36% 2.13% 6.34% 0.20% 0.74% 8.40% 0.29% 18.11% 14.43%
%of Minority Participation against Total HUB $ 38.78% 46.52% 0.80% 0.14% 0.07% 13.70% 11.78% 34.99% 1.13% 4.10% 46.38% 1.62%
LEGEND: $24,620,013
DNS-C - Categories with blanks or blank space indicate LEGEND: LEGEND:
entity "DID NOT SUBMIT" Construction Report MBE - Minority Business Enterprise B - Black
DNS-P - Categories with blanks or blank space indicate WBE - Woman Business Enterprise H - Hispanic
entity "DID NOT SUBMIT" Purchasing Report DBE-O- Disabled - Owned Business Enterprise AA - Asian-American
X - no reporting requirements DBE - Disabled Business Enterprise AI - American Indian
NPWC - Non - profit Work Center for the Blind & Severely Disabled WF - White Female
Note: Sub - HUB Subcontractor SE - Socially and Economically Disadvantaged
1. When a construction project is finalized (submitted) by an entiity, HUBSCO system will update
to the relevant quarter when the project was completed
Year-to-Date4th Quarter HUB Construction Report - Construction Projects4th Quarter HUB Purchasing Report -Goods and Services Year-to-Date
K:\Hubrpt_Purchase and Construction\FY'06-07\Quarter and Annual\06-07SU 3 - 4.6 Source: HUB Purchasing Report Database and HUBSCO Construction Reporting SystemRun date: 09/14/200

NORTH CAROLINA DEPARTMENT OF ADMINISTRATION
OFFICE FOR HISTORICALLY UNDERUTILIZED BUSINESSES
Purchasing and Construction Reports
Counties - 4th Quarter 2006-07(April 1, 2007 - June 30, 2007)
4th Quarter 2007-07(April 1 - June 30,
2007)
1st Qtr
2nd Qtr
3rd Qtr
1st Qtr
2nd Qtr
3rd Qtr
Public Entity Type/Entity
To
tal
HU
B (
%)
To
tal
HU
B (
%)
To
tal
HU
B (
%)
To
tal
Pu
rch
asin
g($
)
MB
E (
$)
WB
E (
$)
DB
E-O
($)
DB
E (
$)
NP
WC
($)
Su
b (
$)
To
tal
HU
B (
$)
To
tal
HU
B (
%)
To
tal
Pu
rch
asin
g (
$)
To
tal
HU
B (
$)
To
tal
HU
B (
%)
To
tal
HU
B (
%)
To
tal
HU
B (
%)
To
tal
HU
B (
%)
To
tal
Co
nst
ruct
ion
V
alu
e ($
)
B($
)
H($
)
AA
($)
AI(
$)
WF
($)
SE
($)
To
tal
HU
B (
$)
To
tal
HU
B (
%)
To
tal
Co
nst
ruct
ion
V
alu
e ($
)
To
tal
HU
B (
$)
To
tal
HU
B (
%)
COUNTIESCounty of Alamance X X X X X X X X X X X X X X X 100% 0.00% 0.00% $0 $0 $0 $0 $0 $0 $0 $0 0.00% $39,939 $39,939 100%
County of Alleghany X X X X X X X X X X X X X X X 0.00% 0.00% 0.00% $0 $0 $0 $0 $0 $0 $0 $0 0.00% $0 $0 0.00%
County of Ashe X X X X X X X X X X X X X X X 0.00% 0.00% 0.00% $0 $0 $0 $0 $0 $0 $0 $0 0.00% $0 $0 0.00%
County of Bladen X X X X X X X X X X X X X X X 0.00% 0.00% 0.00% $95,601 $0 $0 $0 $0 $0 $0 $0 0.00% $95,601 $0 0.00%
County of Buncombe X X X X X X X X X X X X X X X 0.00% 0.00% 0.00% $55,000 $0 $0 $0 $0 $0 $0 $0 0.00% $90,410 $0 0.00%
County of Cabarrus X X X X X X X X X X X X X X X 0.00% 0.00% 0.00% $32,639 $0 $0 $0 $0 $0 $0 $0 0.00% $98,897 $0 0.00%
County of Camden DNS-C) X X X X X X X X X X X X X X X 0.00% 0.00% 0.00% $0 $0 $0 $0 $0 $0 $0 $0 0.00% $0 $0 0.00%
County of Carteret X X X X X X X X X X X X X X X 0.00% 100.00% 0.00% $79,900 $0 $0 $0 $0 $0 $0 $0 0.00% $781,760 $202,500 25.90%
County of Caswell X X X X X X X X X X X X X X X 0.00% 0.00% 0.00% $0 $0 $0 $0 $0 $0 $0 $0 0.00% $0 $0 0.00%
County of CatawbaDNS-C) X X X X X X X X X X X X X X X 0.00% 0.00% 0.00% $0 $0 $0 $0 $0 $0 $0 $0 0.00% $0 $0 0.00%
County of Chatham X X X X X X X X X X X X X X X 0.00% 0.00% 0.00% $0 $0 $0 $0 $0 $0 $0 $0 0.00% $0 $0 0.00%
County of Cleveland X X X X X X X X X X X X X X X 0.00% 0.00% 0.00% $0 $0 $0 $0 $0 $0 $0 $0 0.00% $0 $0 0.00%
County of Columbus X X X X X X X X X X X X X X X 0.00% 0.00% 0.00% $0 $0 $0 $0 $0 $0 $0 $0 0.00% $0 $0 0.00%
County of CumberlandDNS-C) X X X X X X X X X X X X X X X 0.00% 0.00% 0.00% $0 $0 $0 $0 $0 $0 $0 $0 0.00% $7,750 $0 0.00%
County of CurrituckDNS-C) X X X X X X X X X X X X X X X 0.00% 0.00% 0.00% $0 $0 $0 $0 $0 $0 $0 $0 0.00% $0 $0 0.00%
County of Dare X X X X X X X X X X X X X X X 0.00% 0.00% 0.00% $0 $0 $0 $0 $0 $0 $0 $0 0.00% $0 $0 0.00%
County of Davidson X X X X X X X X X X X X X X X 0.00% 0.00% 0.00% $0 $0 $0 $0 $0 $0 $0 $0 0.00% $0 $0 0.00%
County of EdgecombeDNS-C) X X X X X X X X X X X X X X X 0.00% 0.00% 0.00% $0 $0 $0 $0 $0 $0 $0 $0 0.00% $0 $0 0.00%
County of Gaston DNS-C) X X X X X X X X X X X X X X X 0.00% 0.00% 0.00% $4,183,366 $0 $0 $0 $0 $0 $0 $0 0.00% $4,680,796 $0 0.00%
County of Graham DNS-C) X X X X X X X X X X X X X X X 0.00% 0.00% 0.00% $0 $0 $0 $0 $0 $0 $0 $0 0.00% $0 $0 0.00%
County of Granville X X X X X X X X X X X X X X X 0.00% 0.00% 0.00% $0 $0 $0 $0 $0 $0 $0 $0 0.00% $0 $0 0.00%
County of Guilford X X X X X X X X X X X X X X X 15.75% 0.00% 9.19% $470,211 $6,981 $12,007 $0 $0 $2,336 $0 $21,324 4.53% $1,987,338 $191,735 9.65%
County of Harnett X X X X X X X X X X X X X X X 0.00% 17.74% 0.00% $2,948,619 $0 $0 $0 $0 $0 $0 $0 0.00% $3,060,705 $19,885 0.65%
County of HokeDNS-C) X X X X X X X X X X X X X X X 0.00% 11.78% 0.00% $0 $0 $0 $0 $0 $0 $0 $0 0.00% $2,772,463 $326,499 11.78%
County of Iredell X X X X X X X X X X X X X X X 0.00% 10.94% 0.00% $339,608 $0 $0 $0 $0 $162,370 $0 $162,370 47.81% $6,113,429 $793,819 12.98%
County of Lee DNS-C) X X X X X X X X X X X X X X X 0.00% 0.00% 0.00% $0 $0 $0 $0 $0 $0 $0 $0 0.00% $0 $0 0.00%
County of Mecklenburg X X X X X X X X X X X X X X X 27.41% 2.94% 1.62% $4,239,254 $154,214 $95,820 $0 $0 $454,558 $0 $704,592 16.62% $8,311,713 $837,780 10.08%
County of MooreDNS-C) X X X X X X X X X X X X X X X 0.00% 0.00% 0.00% $0 $0 $0 $0 $0 $0 $0 $0 0.00% $0 $0 0.00%
County of Nash DNS-C) X X X X X X X X X X X X X X X 0.00% 0.00% 0.00% $0 $0 $0 $0 $0 $0 $0 $0 0.00% $0 $0 0.00%
County of OnslowDNS-C) X X X X X X X X X X X X X X X 0.00% 0.00% 0.00% $0 $0 $0 $0 $0 $0 $0 $0 0.00% $0 $0 0.00%
County of Polk DNS-C) X X X X X X X X X X X X X X X 0.00% 0.00% 0.00% $0 $0 $0 $0 $0 $0 $0 $0 0.00% $0 $0 0.00%
County of RandolphDNS-C) X X X X X X X X X X X X X X X 0.00% 0.00% 0.00% $32,000 $0 $0 $0 $0 $0 $0 $0 0.00% $32,000 $0 0.00%
County of Rockingham X X X X X X X X X X X X X X X 37.60% 0.00% 0.00% $0 $0 $0 $0 $0 $0 $0 $0 0.00% $56,576 $21,275 37.60%
County of Sampson X X X X X X X X X X X X X X X 0.00% 0.00% 0.00% $0 $0 $0 $0 $0 $0 $0 $0 0.00% $0 $0 0.00%
County of Surry X X X X X X X X X X X X X X X X 0.00% 0.00% 0.00% $0 $0 $0 $0 $0 $0 $0 $0 0.00% $294,265 $0 0.00%
County of Transylvania X X X X X X X X X X X X X X X X 0.00% 0.00% 0.00% $0 $0 $0 $0 $0 $0 $0 $0 0.00% $0 $0 0.00%
County of Union (DNS) X X X X X X X X X X X X X X X 0.00% 0.00% 0.00% $0 $0 $0 $0 $0 $0 $0 $0 0.00% $0 $0 0.00%
4th Quarter HUB Purchasing Report -Goods and Services
Year-to-Date Year-to-Date4th Quarter HUB Construction Report - Construction Projects
K:\Hubrpt_Purchase and Construction\FY'06-07\Quarter and Annual\06-07Counties 3 - 4.7.1 Source: HUBSCO Construction Reporting SystemRun Date: 9/14/2006

NORTH CAROLINA DEPARTMENT OF ADMINISTRATION
OFFICE FOR HISTORICALLY UNDERUTILIZED BUSINESSES
Purchasing and Construction Reports
Counties - 4th Quarter 2006-07(April 1, 2007 - June 30, 2007)
4th Quarter 2007-07(April 1 - June 30,
2007)
1st Qtr
2nd Qtr
3rd Qtr
1st Qtr
2nd Qtr
3rd Qtr
Public Entity Type/Entity
To
tal
HU
B (
%)
To
tal
HU
B (
%)
To
tal
HU
B (
%)
To
tal
Pu
rch
asin
g($
)
MB
E (
$)
WB
E (
$)
DB
E-O
($)
DB
E (
$)
NP
WC
($)
Su
b (
$)
To
tal
HU
B (
$)
To
tal
HU
B (
%)
To
tal
Pu
rch
asin
g (
$)
To
tal
HU
B (
$)
To
tal
HU
B (
%)
To
tal
HU
B (
%)
To
tal
HU
B (
%)
To
tal
HU
B (
%)
To
tal
Co
nst
ruct
ion
V
alu
e ($
)
B($
)
H($
)
AA
($)
AI(
$)
WF
($)
SE
($)
To
tal
HU
B (
$)
To
tal
HU
B (
%)
To
tal
Co
nst
ruct
ion
V
alu
e ($
)
To
tal
HU
B (
$)
To
tal
HU
B (
%)
4th Quarter HUB Purchasing Report -Goods and Services
Year-to-Date Year-to-Date4th Quarter HUB Construction Report - Construction Projects
COUNTIES - Contd…County of Vance (DNS) X X X X X X X X X X X X X X X 0.00% 0.00% 0.00% $0 $0 $0 $0 $0 $0 $0 $0 0.00% $0 $0 0.00%
County of Wake X X X X X X X X X X X X X X X6.96% 21.91% 35.00% $647,649 $0 $0 $0 $0 $19,366 $0 $19,366 2.99% $21,169,752 $3,271,973 15.46%
County of Warren (DNS) X X X X X X X X X X X X X X X 0.00% 0.00% 0.00% $0 $0 $0 $0 $0 $0 $0 $0 0.00% $610,360 $0 0.00%
County of Washington (DNS X X X X X X X X X X X X X X X 0.00% 0.00% 0.00% $0 $0 $0 $0 $0 $0 $0 $0 0.00% $0 $0 0.00%
County of Watauga (DNS) X X X X X X X X X X X X X X X 0.00% 0.00% 0.00% $0 $0 $0 $0 $0 $0 $0 $0 0.00% $0 $0 0.00%
TOTALS - - 7.77% 16.63% 6.22% $13,123,847 $161,195 $107,827 $0 $0 $638,630 $0 $907,652 6.92% $50,203,754 $5,705,405 11.36%
% of HUB Participation 1.23% 0.82% 0% 0% 4.87% 0% 6.92% 11.36%
%of Minority Participation against Total HUB $ 17.76% 11.88% 0% 0% 70.36% 0%
LEGEND: LEGEND: LEGEND:
DNS-C - Categories with blanks or blank space indicate MBE - Minority Business Enterprise B - Black
entity "DID NOT SUBMIT" Construction Report WBE - Woman Business Enterprise H - Hispanic
DNS-P - Categories with blanks or blank space indicate DBE-O- Disabled - Owned Business Enterprise AA - Asian-American
entity "DID NOT SUBMIT" Purchasing Report DBE - Disabled Business Enterprise AI - American Indian
X - no reporting requirements NPWC - Non - profit Work Center for the Blind & Severely Disabled WF - White Female
Sub - HUB Subcontractor SE - Socially and Economically Disadvantaged
Note:
1. When a construction project is finalized (submitted) by an entiity, HUBSCO system will update
to the relevant quarter when the project was completed
K:\Hubrpt_Purchase and Construction\FY'06-07\Quarter and Annual\06-07Counties 3 - 4.7.2 Source: HUBSCO Construction Reporting SystemRun Date: 9/14/2006

NORTH CAROLINA DEPARTMENT OF ADMINISTRATION
OFFICE FOR HISTORICALLY UNDERUTILIZED BUSINESSES
Purchasing and Construction Reports - Municipalities - 4th Quarter 2006-07(April 1, 2007 - June 30, 2007)4th Quarter 2006-
07(April 1 - June 30, 2007)
1st Qtr
2nd Qtr
3rd Qtr
1st Qtr
2nd Qtr
3rd Qtr
Public Entity Type/EntityT
ota
l H
UB
(%
)
To
tal
HU
B (
%)
To
tal
HU
B (
%)
To
tal
Pu
rch
asin
g($
)
MB
E (
$)
WB
E (
$)
DB
E-O
($)
DB
E (
$)
NP
WC
($)
Su
b (
$)
To
tal
HU
B (
$)
To
tal
HU
B (
%)
To
tal
Pu
rch
asin
g (
$)
To
tal
HU
B (
$)
To
tal
HU
B (
%)
To
tal
HU
B (
$)
To
tal
HU
B (
%)
To
tal
HU
B (
%)
To
tal
HU
B (
%)
To
tal
Co
nst
ruct
ion
V
alu
e ($
)
B($
)
H($
)
AA
($)
AI(
$)
WF
($)
SE
($)
To
tal
HU
B (
$)
To
tal
HU
B (
%)
To
tal
Co
nst
ruct
ion
V
alu
e ($
)
To
tal
HU
B (
$)
To
tal
HU
B (
%)
MUNICIPALITIESCity of Albemarle X X X X X X X X X X X X X X X 0.00% 1.27% 0.00% $744,942 $176,287 $0 $0 $0 $14,512 $0 $190,799 25.61% $1,621,754 $195,972 12.08%
City of Asheboro (DNS) X X X X X X X X X X X X X X X 0.00% 0.00% 0.00% $0 $0 $0 $0 $0 $0 $0 $0 0.00% $0 $0 0.00%
City of Asheville (DNS) X X X X X X X X X X X X X X X 0.00% 0.00% 0.00% $0 $0 $0 $0 $0 $0 $0 $0 0.00% $0 $0 0.00%
City of Charlotte X X X X X X X X X X X X X X X 5.08% 22.24% 0.26% $461,404 $0 $0 $0 $0 $0 $0 $0 0.00% $1,911,179 $97,178 5.08%
City of Concord (DNS) X X X X X X X X X X X X X X X 0.00% 0.00% 0.00% $0 $0 $0 $0 $0 $0 $0 $0 0.00% $0 $0 0.00%
City of Durham X X X X X X X X X X X X X X X 0.00% 28.73% 2.98% $98,900 $0 $0 $0 $0 $0 $0 $0 0.00% $955,765 $113,370 11.86%
City of Eden (DNS) X X X X X X X X X X X X X X X 0.00% 5.26% 0.00% $0 $0 $0 $0 $0 $0 $0 $0 0.00% $649,219 $32,710 5.04%
City of Elizabeth City (DNS) X X X X X X X X X X X X X X X 0.00% 0.00% 0.00% $0 $0 $0 $0 $0 $0 $0 $0 0.00% $644,935 $0 0.00%
City of Fayetteville (DNS) X X X X X X X X X X X X X X X 0.00% 0.00% 0.00% $0 $0 $0 $0 $0 $0 $0 $0 0.00% $0 $0 0.00%
City of Greenville (DNS) X X X X X X X X X X X X X X X 0.00% 0.00% 0.00% $0 $0 $0 $0 $0 $0 $0 $0 0.00% $0 $0 0.00%
City of Hickory X X X X X X X X X X X X X X X 0.00% 0.00% 0.00% $262,320 $0 $0 $0 $0 $0 $0 $0 0.00% $262,320 $0 0.00%
City of High Point (DNS) X X X X X X X X X X X X X X X 0.00% 0.00% 0.00% $0 $0 $0 $0 $0 $0 $0 $0 0.00% $0 $0 0.00%
City of Jacksonville (DNS) X X X X X X X X X X X X X X X 0.00% 0.00% 0.00% $0 $0 $0 $0 $0 $0 $0 $0 0.00% $684,249 $0 0.00%
City of Kings Mountain (DNS) X X X X X X X X X X X X X X X 0.00% 0.00% 0.00% $0 $0 $0 $0 $0 $0 $0 $0 0.00% $0 $0 0.00%
City of Lexington (DNS) X X X X X X X X X X X X X X X 0.00% 0.00% 0.00% $0 $0 $0 $0 $0 $0 $0 $0 0.00% $0 $0 0.00%
City of Raleigh (DNS) X X X X X X X X X X X X X X X 0.00% 0.00% 0.00% $0 $0 $0 $0 $0 $0 $0 $0 0.00% $0 $0 0.00%
City of Reidsville (DNS) X X X X X X X X X X X X X X X 3.25% 0.00% 0.00% $0 $0 $0 $0 $0 $0 $0 $0 0.00% $290,993 $8,271 2.84%
City of Roanoke Rapids (DNS) X X X X X X X X X X X X X X X 0.00% 0.00% 0.00% $0 $0 $0 $0 $0 $0 $0 $0 0.00% $0 $0 0.00%
City of Rocky Mount (DNS) X X X X X X X X X X X X X X X 0.00% 0.00% 0.00% $0 $0 $0 $0 $0 $0 $0 $0 0.00% $221,651 $0 0.00%
City of Sanford (DNS) X X X X X X X X X X X X X X X 0.00% 0.00% 0.00% $0 $0 $0 $0 $0 $0 $0 $0 0.00% $0 $0 0.00%
City of Southport (DNS) X X X X X X X X X X X X X X X 0.00% 0.00% 0.00% $0 $0 $0 $0 $0 $0 $0 $0 0.00% $0 $0 0.00%
City of Statesville X X X X X X X X X X X X X X X 0.00% 0.00% 0.00% $0 $0 $0 $0 $0 $0 $0 $0 0.00% $34,154 $0 0.00%
City of Thomasville (DNS) X X X X X X X X X X X X X X X 0.00% 0.00% 0.00% $0 $0 $0 $0 $0 $0 $0 $0 0.00% $0 $0 0.00%
City of Wilmington (DNS) X X X X X X X X X X X X X X X 0.00% 0.00% 0.00% $0 $0 $0 $0 $0 $0 $0 $0 0.00% $0 $0 0.00%
City of Wilson X X X X X X X X X X X X X X X 0.00% 0.00% 0.00% $426,773 $0 $0 $0 $0 $3,976 $0 $3,976 0.93% $426,773 $3,976 0.93%
City of Winston-Salem X X X X X X X X X X X X X X X 7.23% 17.11% 10.31% $5,104,190 $134,942 $13,415 $0 $0 $98,273 $0 $246,630 4.83% $27,262,173 $3,012,493 11.05%
Public Works Commission - Fay X X X X X X X X X X X X X X X 0.00% 0.00% 0.00% $0 $0 $0 $0 $0 $0 $0 $0 0.00% $48,529 $0 0.00%
Town of Blowing Rock (DNS) X X X X X X X X X X X X X X X 0.00% 0.00% 0.00% $0 $0 $0 $0 $0 $0 $0 $0 0.00% $0 $0 0.00%
Town of Bolivia (DNS) X X X X X X X X X X X X X X X 0.00% 0.00% 0.00% $0 $0 $0 $0 $0 $0 $0 $0 0.00% $0 $0 0.00%
Town of Calabash (DNS) X X X X X X X X X X X X X X X 0.00% 0.00% 0.00% $0 $0 $0 $0 $0 $0 $0 $0 0.00% $105,616 $0 0.00%
Town of Calypso X X X X X X X X X X X X X X X 0.00% 0.00% 0.00% $0 $0 $0 $0 $0 $0 $0 $0 0.00% $0 $0 0.00%
Town of Cape Cateret (DNS) X X X X X X X X X X X X X X X 0.00% 0.00% 0.00% $0 $0 $0 $0 $0 $0 $0 $0 0.00% $0 $0 0.00%
Town of Carrboro (DNS) X X X X X X X X X X X X X X X 0.00% 0.00% 0.00% $0 $0 $0 $0 $0 $0 $0 $0 0.00% $0 $0 0.00%
Town of Chapel Hill (DNS) X X X X X X X X X X X X X X X 0.00% 0.00% 0.00% $0 $0 $0 $0 $0 $0 $0 $0 0.00% $0 $0 0.00%
Town of Harrells (DNS) X X X X X X X X X X X X X X X 0.00% 0.00% 0.00% $0 $0 $0 $0 $0 $0 $0 $0 0.00% $0 $0 0.00%
Town of Hoffman X X X X X X X X X X X X X X X 0.00% 0.00% 0.00% $0 $0 $0 $0 $0 $0 $0 $0 0.00% $0 $0 0.00%
Year-to-Date4th Quarter HUB Construction Report - Construction
Projects4th Quarter HUB Purchasing Report -Goods and Services
Year-to-Date
K:\Hubrpt_Purchase and Construction\FY'06-07\Quarter and Annual\06-07MNCPTY 3 - 4.8-1 Source:HUBSCO Construction Reporting SystemRun Date: 9/14/2006

NORTH CAROLINA DEPARTMENT OF ADMINISTRATION
OFFICE FOR HISTORICALLY UNDERUTILIZED BUSINESSES
Purchasing and Construction Reports - Municipalities - 4th Quarter 2006-07(April 1, 2007 - June 30, 2007)4th Quarter 2006-
07(April 1 - June 30, 2007)
1st Qtr
2nd Qtr
3rd Qtr
1st Qtr
2nd Qtr
3rd Qtr
Public Entity Type/EntityT
ota
l H
UB
(%
)
To
tal
HU
B (
%)
To
tal
HU
B (
%)
To
tal
Pu
rch
asin
g($
)
MB
E (
$)
WB
E (
$)
DB
E-O
($)
DB
E (
$)
NP
WC
($)
Su
b (
$)
To
tal
HU
B (
$)
To
tal
HU
B (
%)
To
tal
Pu
rch
asin
g (
$)
To
tal
HU
B (
$)
To
tal
HU
B (
%)
To
tal
HU
B (
$)
To
tal
HU
B (
%)
To
tal
HU
B (
%)
To
tal
HU
B (
%)
To
tal
Co
nst
ruct
ion
V
alu
e ($
)
B($
)
H($
)
AA
($)
AI(
$)
WF
($)
SE
($)
To
tal
HU
B (
$)
To
tal
HU
B (
%)
To
tal
Co
nst
ruct
ion
V
alu
e ($
)
To
tal
HU
B (
$)
To
tal
HU
B (
%)
Year-to-Date4th Quarter HUB Construction Report - Construction
Projects4th Quarter HUB Purchasing Report -Goods and Services
Year-to-Date
Town of Holly Ridge X X X X X X X X X X X X X X X 0.00% 0.00% 0.00% $0 $0 $0 $0 $0 $0 $0 $0 0.00% $0 $0 0.00%
MUNICIPALITIES - Contd…
Town of Kitty Hawk X X X X X X X X X X X X X X X 0.00% 0.00% 0.00% $63,644 $0 $0 $0 $0 $0 $0 $0 0.00% $90,614 $0 0.00%
Town of Lewisville (DNS) X X X X X X X X X X X X X X X 0.00% 0.00% 0.00% $0 $0 $0 $0 $0 $0 $0 $0 0.00% $0 $0 0.00%
Town of Mills River (DNS) X X X X X X X X X X X X X X X 0.00% 0.00% 0.00% $0 $0 $0 $0 $0 $0 $0 $0 0.00% $0 $0 0.00%
Town of Mt. Gilead (DNS) X X X X X X X X X X X X X X X 0.00% 0.00% 0.00% $0 $0 $0 $0 $0 $0 $0 $0 0.00% $0 $0 0.00%
Town of Princeton (DNS) X X X X X X X X X X X X X X X 0.00% 0.00% 0.00% $0 $0 $0 $0 $0 $0 $0 $0 0.00% $0 $0 0.00%
Town of Salemburg (DNS) X X X X X X X X X X X X X X X 0.00% 0.00% 0.00% $0 $0 $0 $0 $0 $0 $0 $0 0.00% $0 $0 0.00%
Town of Saratoga (DNS) X X X X X X X X X X X X X X X 0.00% 0.00% 0.00% $0 $0 $0 $0 $0 $0 $0 $0 0.00% $0 $0 0.00%
Town of Southern Pines X X X X X X X X X X X X X X X 0.00% 0.00% 0.00% $183,427 $0 $0 $0 $0 $0 $0 $0 0.00% $183,427 $0 0.00%
Town of Spring Lake (DNS) X X X X X X X X X X X X X X X 21.27% 0.00% 0.00% $0 $0 $0 $0 $0 $0 $0 $0 0.00% $2,669,930 $568,001 21.27%
Town of Spruce Pine (DNS) X X X X X X X X X X X X X X X 0.00% 0.00% 0.00% $0 $0 $0 $0 $0 $0 $0 $0 0.00% $0 $0 0.00%
Town of Tarboro (DNS) X X X X X X X X X X X X X X X 0.00% 0.00% 0.00% $0 $0 $0 $0 $0 $0 $0 $0 0.00% $0 $0 0.00%
Town of Topsail Beach (DNS) X X X X X X X X X X X X X X X 0.00% 0.00% 0.00% $0 $0 $0 $0 $0 $0 $0 $0 0.00% $0 $0 0.00%
Town of Turkey X X X X X X X X X X X X X X X 0.00% 0.00% 0.00% $0 $0 $0 $0 $0 $0 $0 $0 0.00% $0 $0 0.00%
Town of Vass (DNS) X X X X X X X X X X X X X X X 0.00% 0.00% 0.00% $0 $0 $0 $0 $0 $0 $0 $0 0.00% $0 $0 0.00%
Town of Wagram (DNS) X X X X X X X X X X X X X X X 0.00% 0.00% 0.00% $0 $0 $0 $0 $0 $0 $0 $0 0.00% $0 $0 0.00%
Town of Wentworth X X X X X X X X X X X X X X X 0.00% 0.00% 0.00% $0 $0 $0 $0 $0 $0 $0 $0 0.00% $0 $0 0.00%
Town of White Lake (DNS) X X X X X X X X X X X X X X X 0.00% 0.00% 0.00% $0 $0 $0 $0 $0 $0 $0 $0 0.00% $0 $0 0.00%
Town of Winterville (DNS) X X X X X X X X X X X X X 0.00% 0.00% 0.00% $0 $0 $0 $0 $0 $0 $0 $0 0.00% $0 $0 0.00%
Town of Zebulon (DNS) X X X X X X X X X X X X X 0.00% 0.00% 0.00% $0 $0 $0 $0 $0 $0 $0 $0 0.00% $16,724 $0 0.00%
Village of Alamance (DNS) X X X X X X X X X X X X X X X 0.00% 0.00% 0.00% $0 $0 $0 $0 $0 $0 $0 $0 0.00% $0 $0 0.00%
Village of Clemmons X X X X X X X X X X X X X X X 0.00% 0.00% 0.00% $256,563 $0 $0 $0 $0 $0 $0 $0 0.00% $256,563 $0 0.00%
Village of Forest Hills (DNS) X X X X X X X X X X X X X X X 0.00% 0.00% 0.00% $0 $0 $0 $0 $0 $0 $0 $0 0.00% $0 $0 0.00%
Village of Tobaccoville X X X X X X X X X X X X X X X 0.00% 0.00% 0.00% $0 $0 $0 $0 $0 $0 $0 $0 0.00% $0 $0 0.00%
Village of Wesley Chapel (DNS) X X X X X X X X X X X X X X X 0.00% 0.00% 0.00% $0 $0 $0 $0 $0 $0 $0 $0 0.00% $0 $0 0.00%
TOTALS 9.84% 15.95% 9.06% $7,602,164 $311,229 $13,415 $0 $0 $116,761 $0 $441,405 5.81% $38,336,568 $4,031,971 10.52%
% of HUB Participation 4.09% 0.18% 0% 0% 1.54% 0% 5.81% 10.52%
%of Minority Participation against Total HUB $ 70.51% 3.04% 0% 0% 26.45% 0%
LEGEND: LEGEND: LEGEND:
DNS-C - Categories with blanks or blank space indicate MBE - Minority Business Enterprise B - Black
entity "DID NOT SUBMIT" Construction Report WBE - Woman Business Enterprise H - Hispanic
DNS-P - Categories with blanks or blank space indicate DBE-O- Disabled - Owned Business Enterprise AA - Asian-American
entity "DID NOT SUBMIT" Purchasing Report DBE - Disabled Business Enterprise AI - American Indian
X - no reporting requirements NPWC - Non - profit Work Center for the Blind & Severely Disabled WF - White Female
Note: Sub - HUB Subcontractor SE - Socially and Economically Disadvantaged
1. When a construction project is finalized (submitted) by an entiity, HUBSCO system will update
to the relevant quarter when the project was completed
K:\Hubrpt_Purchase and Construction\FY'06-07\Quarter and Annual\06-07MNCPTY 3 - 4.8-2 Source:HUBSCO Construction Reporting SystemRun Date: 9/14/2006

NORTH CAROLINA DEPARTMENT OF ADMINISTRATION
OFFICE FOR HISTORICALLY UNDERUTILIZED BUSINESSES
Purchasing and Construction Reports
Hospital Associations - 4th Quarter 2006-07(April 1, 2007 - June 30, 2007)
4th Quarter 2006-07(April 1 - June 30, 2007)
1st Qtr
2nd Qtr
3rd Qtr
1st Qtr
2nd Qtr
3rd Qtr
Public Entity Type/EntityT
ota
l H
UB
(%
)
To
tal
HU
B (
%)
To
tal
HU
B (
%)
To
tal
Pu
rch
asin
g($
)
MB
E (
$)
WB
E (
$)
DB
E-O
($)
DB
E (
$)
NP
WC
($)
Su
b (
$)
To
tal
HU
B (
$)
To
tal
HU
B (
%)
To
tal
Pu
rch
asin
g (
$)
To
tal
HU
B (
$)
To
tal
HU
B (
%)
To
tal
HU
B (
%)
To
tal
HU
B (
%)
To
tal
HU
B (
%)
To
tal
Co
nst
ruct
ion
V
alu
e ($
)
B($
)
H($
)
AA
($)
AI(
$)
WF
($)
SE
($)
To
tal
HU
B (
$)
To
tal
HU
B (
%)
To
tal
Co
nst
ruct
ion
V
alu
e ($
)
To
tal
HU
B (
$)
To
tal
HU
B (
%)
HOSPITAL ASSOCIATIONSAlbemarle Hospital Authority (DNS-C)) X X X X X X X X X X X X X X X 0.00% 0.00% 0.00% $0 $0 $0 $0 $0 $0 $0 $0 0.00% $313,447 $0 0.00%
Cape Fear Valley Health System(DNS_C) X X X X X X X X X X X X X X X 0.00% 0.00% 0.00% $0 $0 $0 $0 $0 $0 $0 $0 0.00% $0 $0 0.00%
Carteret County General Hospital Corporation (DNS-C X X X X X X X X X X X X X X X 0.00% 0.00% 0.00% $0 $0 $0 $0 $0 $0 $0 $0 0.00% $0 $0 0.00%
Granville Medical Center(DNS-C) X X X X X X X X X X X X X X X 0.00% 0.00% 100% $0 $0 $0 $0 $0 $0 $0 $0 0.00% $5,355 $5,355 100.00%
Iredell Memorial Hospital, Incorporated (DNS-C) X X X X X X X X X X X X X X X 0.00% 0.00% 0.00% $0 $0 $0 $0 $0 $0 $0 $0 0.00% $0 $0 0.00%
New Hanover Health Network X X X X X X X X X X X X X X X 2.90% 0.00% 22.9% $68,350 $0 $0 $0 $0 $0 $0 $0 0.00% $1,205,252 $199,266 16.53%
Stokes-Reynolds Memorial Hospital, Inc.(DNS-C) X X X X X X X X X X X X X X X 0.00% 0.00% 0.00% $0 $0 $0 $0 $0 $0 $0 $0 0.00% $0 $0 0.00%
TOTALS - 1.43% 0.00% 23.4% $68,350 $0 $0 $0 $0 $0 $0 $0 0.00% $1,524,054 $204,621 13.43%
% of HUB Participation 0.00% 0.00% 0.00% 0.00% 0.00% 0.00% 0.00% 13.43%
%of Minority Participation against Total HUB $
LEGEND: LEGEND:
LEGEND MBE - Minority Business Enterprise B - Black
WBE - Woman Business Enterprise H - Hispanic
DNS-C - Categories with blanks or blank space indicate DBE-O- Disabled - Owned Business Enterprise AA - Asian-American
entity "DID NOT SUBMIT" Construction Report DBE - Disabled Business Enterprise AI - American Indian
DNS-P - Categories with blanks or blank space indicate NPWC - Non - profit Work Center for the Blind & Severely Disabled WF - White Female
entity "DID NOT SUBMIT" Purchasing Report Sub - HUB Subcontractor SE - Socially and Economically Disadvantaged
X - no reporting requirements
Note:
1. When a construction project is finalized (submitted) by an entiity, HUBSCO system will update
to the relevant quarter when the project was completed
Year-to-Date4th Quarter HUB Construction Report - Construction
Projects4th Quarter HUB Purchasing Report -
Goods and ServicesYear-to-
Date
K:\Hubrpt_Purchase and Construction\FY'06-07\Quarter and Annual\06-07HA 3 - 4.9 Source:HUBSCO Construction Reporting SystemRun Date: 9/14/2006

NORTH CAROLINA DEPARTMENT OF ADMINISTRATION
OFFICE FOR HISTORICALLY UNDERUTILIZED BUSINESSES
Purchasing and Construction Reports
Non-St. Agencies and Public H. Authorities - 4th Quarter 06-07(April 1 - June 1, 07)
4th Quarter 2006-07(April 1 -June 30, 2007)
1st Qtr
2nd Qtr
3rd Qtr
1st Qtr
2nd Qtr
3rd Qtr
Public Entity Type/EntityT
ota
l HU
B (
%)
To
tal H
UB
(%
)
To
tal H
UB
(%
)
To
tal
Pu
rch
as
ing
($)
MB
E (
$)
WB
E (
$)
DB
E-O
($
)
DB
E (
$)
NP
WC
($
)
Su
b (
$)
To
tal H
UB
($
)
To
tal H
UB
(%
)
To
tal
Pu
rch
as
ing
($
)
To
tal H
UB
($
)
To
tal H
UB
(%
)
To
tal H
UB
(%
)
To
tal H
UB
(%
)
To
tal H
UB
(%
)
To
tal
Co
ns
tru
cti
on
V
alu
e ($
)
B($
)
H($
)
AA
($)
AI(
$)
WF
($)
SE
($)
To
tal H
UB
($
)
To
tal H
UB
(%
)
To
tal
Co
ns
tru
cti
on
V
alu
e ($
)
To
tal H
UB
($
)
To
tal H
UB
(%
)
NON-STATE AGENCIESGreenville Utilities X X X X X X X X X X X X X X X 0.00% 0.00% 0.00% $0 $0 $0 $0 $0 $0 $0 $0 0.00% $0 $0 0.00%Johnston County Public Utilities X X X X X X X X X X X X X X X 0.00% 0.00% 0.00% $0 $0 $0 $0 $0 $0 $0 $0 0.00% $0 $0 0.00%
TOTALS -
% of HUB Participation
%of Minority Participation against Total HUB $
PUBLIC HOUSING AUTHORITIESBurlington Housing Authority (DNS) X X X X X X X X X X X X X X X 0.00% 0.00% 0.00% $0 $0 $0 $0 $0 $0 $0 $0 0.00% $0 $0 0.00%Dunn Housing Authority (DNS-C) X X X X X X X X X X X X X X X 0.00% 0.00% 0.00% $0 $0 $0 $0 $0 $0 $0 $0 0.00% $0 $0 0.00%Forest City Housing Authority (DNS-C) X X X X X X X X X X X X X X X 0.00% 0.00% 0.00% $0 $0 $0 $0 $0 $0 $0 $0 0.00% $0 $0 0.00%Hickory Public Housing Authority(DNS-C) X X X X X X X X X X X X X X X 0.00% 0.00% 0.00% $0 $0 $0 $0 $0 $0 $0 $0 0.00% $0 $0 0.00%High Point Housing Authority (DNS-C) X X X X X X X X X X X X X X X 0.00% 0.00% 0.00% $0 $0 $0 $0 $0 $0 $0 $0 0.00% $0 $0 0.00%Lexington Housing Authority X X X X X X X X X X X X X X X 0.00% 16.01% 100% $5,300 $0 $0 $0 $0 $0 $0 $0 0.00% $274,179 $22,400 8.17%Mooresville Housing Authority(DNS-C) X X X X X X X X X X X X X X X 0.00% 0.00% 0.00% $0 $0 $0 $0 $0 $0 $0 $0 0.00% $0 $0 0.00%Mount Olive Housing Authority (DNS-C) X X X X X X X X X X X X X X X 0.00% 0.00% 0.00% $0 $0 $0 $0 $0 $0 $0 $0 0.00% $0 $0 0.00%Northwestern Regional Housing Authority X X X X X X X X X X X X X X X 0.00% 0.00% 0.00% $0 $0 $0 $0 $0 $0 $0 $0 0.00% $0 $0 0.00%Pembroke Housing Authority(DNS-C) X X X X X X X X X X X X X X X 0.00% 0.00% 0.00% $0 $0 $0 $0 $0 $0 $0 $0 0.00% $0 $0 0.00%Randleman Housing Authority X X X X X X X X X X X X X X X 0.00% 0.00% 0.00% $0 $0 $0 $0 $0 $0 $0 $0 0.00% $0 $0 0.00%Selma Housing Authority (DNS-C) X X X X X X X X X X X X X X X 0.00% 0.00% 0.00% $0 $0 $0 $0 $0 $0 $0 $0 0.00% $0 $0 0.00%Smithfield Housing Authority(DNS-C) X X X X X X X X X X X X X X X 0.00% 0.00% 0.00% $0 $0 $0 $0 $0 $0 $0 $0 0.00% $0 $0 0.00%
TOTALS - 0.00% 16.01% 100% $5,300 $0 $0 $0 $0 $0 $0 $0 0.00% $274,179 $22,400 8.17%% of HUB Participation 8.17%
%of Minority Participation against Total HUB $
LEGEND: LEGEND: LEGEND:
DNS-C - Categories with blanks or blank space indicate MBE - Minority Business Enterprise B - Black
entity "DID NOT SUBMIT" Construction Report WBE - Woman Business Enterprise H - Hispanic
DNS-P - Categories with blanks or blank space indicate DBE-O- Disabled - Owned Business Enterprise AA - Asian-American
entity "DID NOT SUBMIT" Purchasing Report DBE - Disabled Business Enterprise AI - American Indian
X - no reporting requirements NPWC - Non - profit Work Center for the Blind & Severely Disabled WF - White Female
Sub - HUB Subcontractor SE - Socially and Economically Disadvantaged
Note:
1. When a construction project is finalized (submitted) by an entiity, HUBSCO system will update
to the relevant quarter when the project was completed
4th Quarter HUB Purchasing Report -Goods and Services
Year-to-Date Year-to-Date4th Quarter HUB Construction Report -
Construction Projects
K:\Hubrpt_Purchase and Construction\FY'06-07\Quarter and Annual\06-07NSA_PHA 3 - 4.10 Source: HUBSCO Construction Reporting SystemRun Date: 9/14/2006

NORTH CAROLINA DEPARTMENT OF ADMINISTRATION
OFFICE FOR HISTORICALLY UNDERUTILIZED BUSINESSES
Purchasing and Construction Reports
Water Sewer, and Airport Authorities - 4th Quarter 06-07(April 1 - June 30, 2007)
4th Quarter 2006-07(April 1 - June 30, 2007)
1st Qtr
2nd Qtr
3rd Qtr
1st Qtr
2nd Qtr
3rd Qtr
Public Entity Type/Entity
To
tal
HU
B (
%)
To
tal
HU
B (
%)
To
tal
HU
B (
%)
To
tal
Pu
rch
asin
g($
)
MB
E (
$)
WB
E (
$)
DB
E-O
($)
DB
E (
$)
NP
WC
($)
Su
b (
$)
To
tal
HU
B (
$)
To
tal
HU
B (
%)
To
tal
Pu
rch
asin
g (
$)
To
tal
HU
B (
$)
To
tal
HU
B (
%)
To
tal
HU
B (
%)
To
tal
HU
B (
%)
To
tal
HU
B (
%)
To
tal
Co
nst
ruct
ion
V
alu
e ($
)
B($
)
H($
)
AA
($)
AI(
$)
WF
($)
SE
($)
To
tal
HU
B (
$)
To
tal
HU
B (
%)
To
tal
Co
nst
ruct
ion
V
alu
e ($
)
To
tal
HU
B (
$)
To
tal
HU
B (
%)
WATER AND SEWER AUTHORITIES Onslow Water and Sewer Authority X X X X X X X X X X X X X X X 0.00% 0.00% 0.00% $0 $0 $0 $0 $0 $0 $0 $0 0.00% $0 $0 0.00%Piedmont Triad Regional Water Authority (DNS-C) X X X X X X X X X X X X X X X 0.00% 0.00% 0.00% $0 $0 $0 $0 $0 $0 $0 $0 0.00% $0 $0 0.00%Sewerage District - Buncombe County Metropolitan X X X X X X X X X X X X X X X 0.00% 0.00% 0.00% $0 $0 $0 $0 $0 $0 $0 $0 0.00% $0 $0 0.00%Water and Sewer Authority - Cabarrus County(DNS-C) X X X X X X X X X X X X X X X 0.00% 0.00% 0.00% $0 $0 $0 $0 $0 $0 $0 $0 0.00% $0 $0 0.00%Water and Sewer Authority - Orange County (DNS-C) X X X X X X X X X X X X X X X 0.00% 0.00% 0.00% $0 $0 $0 $0 $0 $0 $0 $0 0.00% $0 $0 0.00%
TOTALS -
% of HUB Participation
%of Minority Participation against Total HUB $
AIRPORT AUTHORITIESCharlotte Douglas International Airport X X X X X X X X X X X X X X X 0.00% 0.00% 0.00% $36,021,553 $0 $570,000 $0 $280,000 $1,370,000 $0 $2,220,000 6.16% $37,306,565 $2,220,000 5.95%Laurinburg-Maxton Airport Commission(DNS-C) X X X X X X X X X X X X X X X 0.00% 0.00% 0.00% $0 $0 $0 $0 $0 $0 $0 $0 0.00% $0 $0 0.00%Laurinburg-Maxton Airport Commission(DNS-C) X X X X X X X X X X X X X X X 0.00% 0.00% 0.00% $0 $0 $0 $0 $0 $0 $0 $0 0.00% $0 $0 0.00%Raleigh-Durham Airport Authority (DNS-C) X X X X X X X X X X X X X X X 0.00% 0.00% 0.00% $0 $0 $0 $0 $0 $0 $0 $0 0.00% $0 $0 0.00%
TOTALS - - 0.00% 0.00% 0.00% $36,021,553 $0 $570,000 $0 $280,000 $1,370,000 $0 $2,220,000 6.16% $37,306,565 $2,220,000 5.95%
% of HUB Participation 0.00% 0.00% 0.00% 5.95%
%of Minority Participation against Total HUB $
LEGEND: LEGEND:
LEGEND: MBE - Minority Business Enterprise B - Black
DNS-C - Categories with blanks or blank space indicate WBE - Woman Business Enterprise H - Hispanic
entity "DID NOT SUBMIT" Construction Report DBE-O- Disabled - Owned Business Enterprise AA - Asian-American
DNS-P - Categories with blanks or blank space indicate DBE - Disabled Business Enterprise AI - American Indian
entity "DID NOT SUBMIT" Purchasing Report NPWC - Non - profit Work Center for the Blind & Severely Disabled WF - White Female
X - no reporting requirements Sub - HUB Subcontractor SE - Socially and Economically Disadvantaged
Note:
1. When a construction project is finalized (submitted) by an entiity, HUBSCO system will update
to the relevant quarter when the project was completed
Year-to-Date4th Quarter HUB Construction Report - Construction
Projects4th Quarter HUB Purchasing Report -
Goods and ServicesYear-to-Date
K:\Hubrpt_Purchase and Construction\FY'06-07\Quarter and Annual\06-07WS_AA 3 - 4.11 Source: HUBSCO Construction Reporting SystemRun Date: 9/14/2006