Embed Size (px)
Citation preview
Prepared By: Corona Insights © Corona Insights, 2020 CoronaInsights.com
STATE OF OUR CITIES AND TOWNS - 2020 Report for Colorado Municipal League
CONTENTS
Methodology .................................................................................... 1
Responding Municipalities ........................................................... 3
Key Findings ...................................................................................... 6
Section 1: Operational Impacts of Covid-19 ........................ 8
Section 2: Fiscal Impacts of Covid-19 Response ............... 24
Section 3: General Municipal Revenue ................................. 33

Colorado Municipal League
| 1 |
STATE OF OUR CITIES AND TOWNS
– 2020 –
REPORT FOR COLORADO MUNICIPAL LEAGUE
Corona Insights is pleased to present The State of Our Cities and Towns – 2020 report to the Colorado Municipal
League (CML). This report provides key findings from the 2020 survey of Colorado’s municipalities. Complete findings
for all closed-ended questions follow, including graphs and tables showing results on how municipalities have been
impacted by and responded to Covid-19, including revenue and fiscal challenges.
METHODOLOGY
RESEARCH DESIGN
The survey instrument was designed by Corona Insights with direction provided by CML. The 2020 survey sought to
understand the operational and fiscal impacts of Covid-19. Questions about general revenue and fiscal challenges
from previous surveys were also asked in order to track several key issues over time.
DATA COLLECTION
An invitation to participate in the survey was distributed to most municipalities by email. Prior to the survey invitation,
CML staff emailed members to announce the survey and ask for their participation. Soon after, Corona Insights
emailed one invitation to each municipality, inviting them to take the survey online. Among responding
municipalities, the vast majority completed the survey online, and we provided some small towns with the
opportunity to complete a hard copy and submit it by mail or email. To boost response rates, CML staff made several
attempts to contact non-responding municipalities.
The survey was administered from mid-August to early October.
ANALYSIS
All data entry, cleaning, and analysis were performed by Corona Insights staff. Results from survey responses are
provided for all municipalities (i.e., Overall) and are also broken down for municipalities of different sizes (i.e.,
population less than 2,000, between 2,000 and 24,999, and 25,000 or greater) and geographic regions (i.e., Western
Slope/ Mountains, Front Range, and Eastern Plains).

Colorado Municipal League
| 2 |
The municipality size categories are provided below with the response rate for each category.
Municipality
Population
Number of
municipalities in
Colorado
Number of Survey
Responses: 2020 Response Rate
Less than 2,000 159 88 55%
2,000 to 24,999 86 61 71%
25,000 or Larger 26 24 92%
Overall 271 173 64%
REPORTING NOTES
All percentages refer to the raw percentage of survey respondents giving a particular response. Percentages
have not been weighted to reflect the proportion of municipalities of each size. As a result, the overall results
are not necessarily generalizable to the population of all municipal governments in the state. Weighting was
not practical both because of the small sample size of the survey and because there is no way to determine
whether those municipalities responding are representative of all municipalities of their size.
Graphs represent all responses unless otherwise noted.
On all graphs, labels of three percent (3%) or less are sometimes removed for ease of reading.
On graphs that should sum to 100 percent, the labels occasionally may not add to 100 percent due to
rounding or non-response.
Comparing this year’s data to previous years’ data (or future years’ data) could be misleading depending on
which municipalities respond in any given year. Due to the relatively small sample size, and possible large
differences between municipalities, even a slight change in the makeup of responding municipalities could
cause the numbers to change significantly. Comparisons should be approached on a question-by-question
basis.
Colorado Municipal League
| 3 |
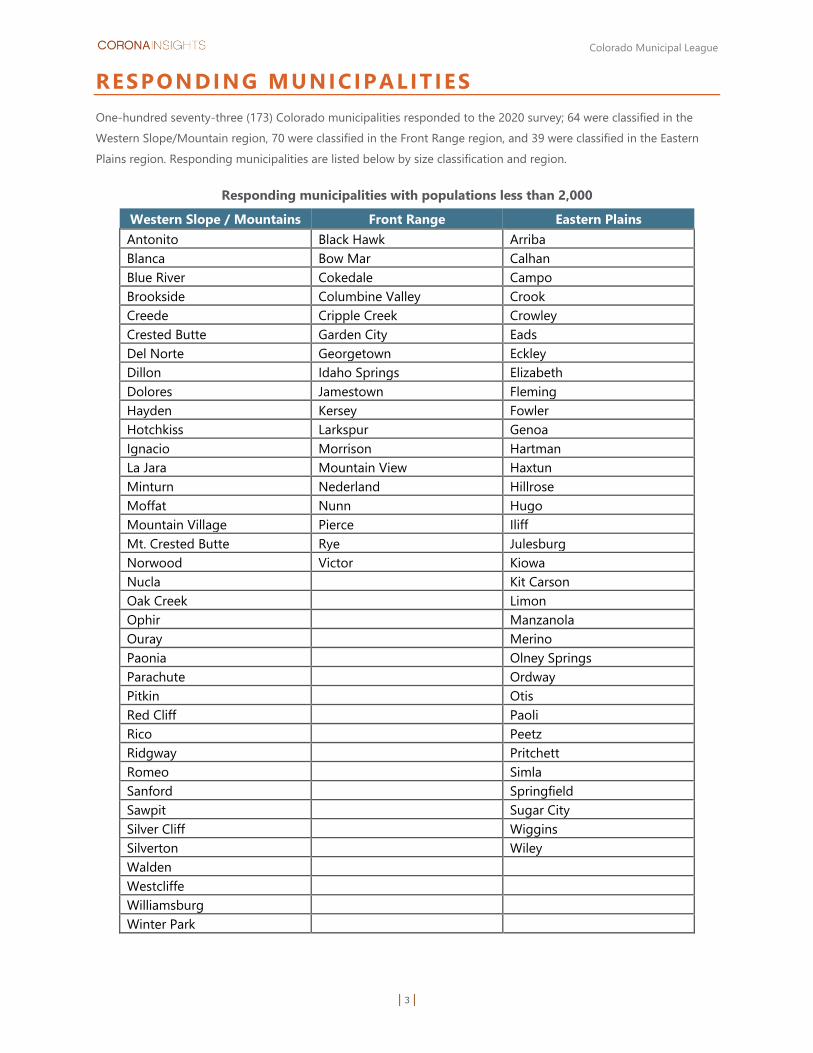
RESPONDING MUNICIPALITIES
One-hundred seventy-three (173) Colorado municipalities responded to the 2020 survey; 64 were classified in the
Western Slope/Mountain region, 70 were classified in the Front Range region, and 39 were classified in the Eastern
Plains region. Responding municipalities are listed below by size classification and region.
Responding municipalities with populations less than 2,000
Western Slope / Mountains Front Range Eastern Plains
Antonito Black Hawk Arriba
Blanca Bow Mar Calhan
Blue River Cokedale Campo
Brookside Columbine Valley Crook
Creede Cripple Creek Crowley
Crested Butte Garden City Eads
Del Norte Georgetown Eckley
Dillon Idaho Springs Elizabeth
Dolores Jamestown Fleming
Hayden Kersey Fowler
Hotchkiss Larkspur Genoa
Ignacio Morrison Hartman
La Jara Mountain View Haxtun
Minturn Nederland Hillrose
Moffat Nunn Hugo
Mountain Village Pierce Iliff
Mt. Crested Butte Rye Julesburg
Norwood Victor Kiowa
Nucla Kit Carson
Oak Creek Limon
Ophir Manzanola
Ouray Merino
Paonia Olney Springs
Parachute Ordway
Pitkin Otis
Red Cliff Paoli
Rico Peetz
Ridgway Pritchett
Romeo Simla
Sanford Springfield
Sawpit Sugar City
Silver Cliff Wiggins
Silverton Wiley
Walden
Westcliffe
Williamsburg
Winter Park
Colorado Municipal League
| 4 |
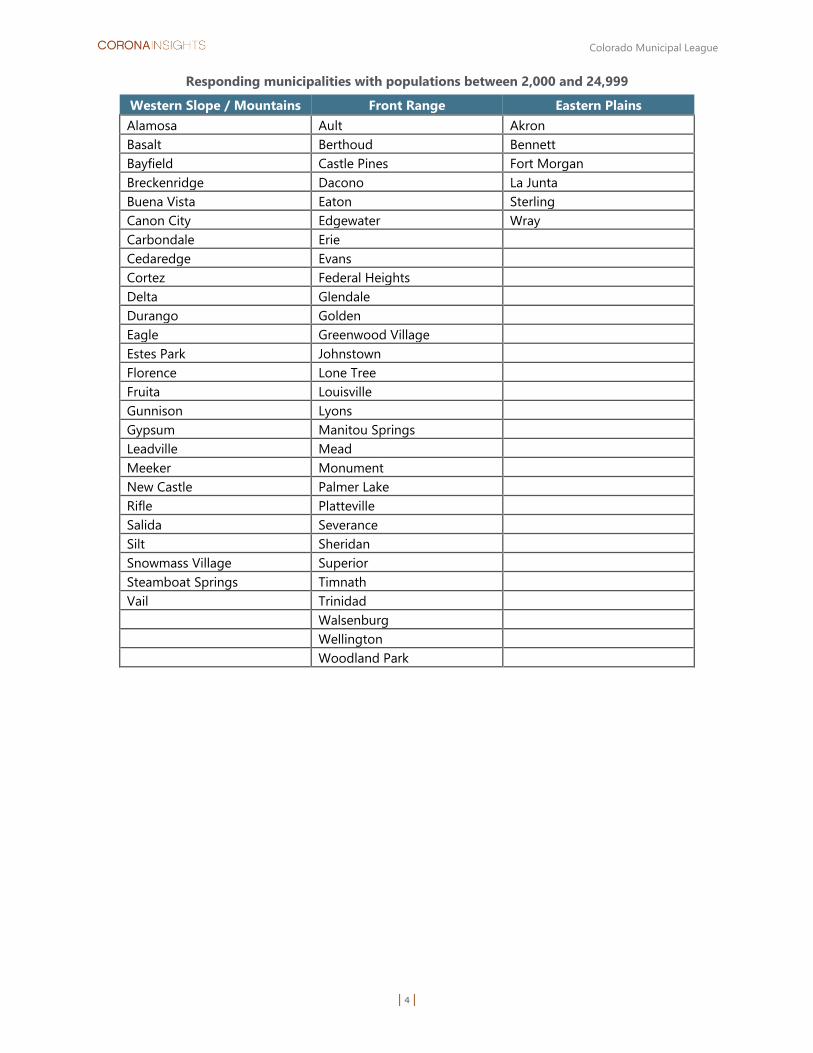
Responding municipalities with populations between 2,000 and 24,999
Western Slope / Mountains Front Range Eastern Plains
Alamosa Ault Akron
Basalt Berthoud Bennett
Bayfield Castle Pines Fort Morgan
Breckenridge Dacono La Junta
Buena Vista Eaton Sterling
Canon City Edgewater Wray
Carbondale Erie
Cedaredge Evans
Cortez Federal Heights
Delta Glendale
Durango Golden
Eagle Greenwood Village
Estes Park Johnstown
Florence Lone Tree
Fruita Louisville
Gunnison Lyons
Gypsum Manitou Springs
Leadville Mead
Meeker Monument
New Castle Palmer Lake
Rifle Platteville
Salida Severance
Silt Sheridan
Snowmass Village Superior
Steamboat Springs Timnath
Vail Trinidad
Walsenburg
Wellington
Woodland Park
Colorado Municipal League
| 5 |
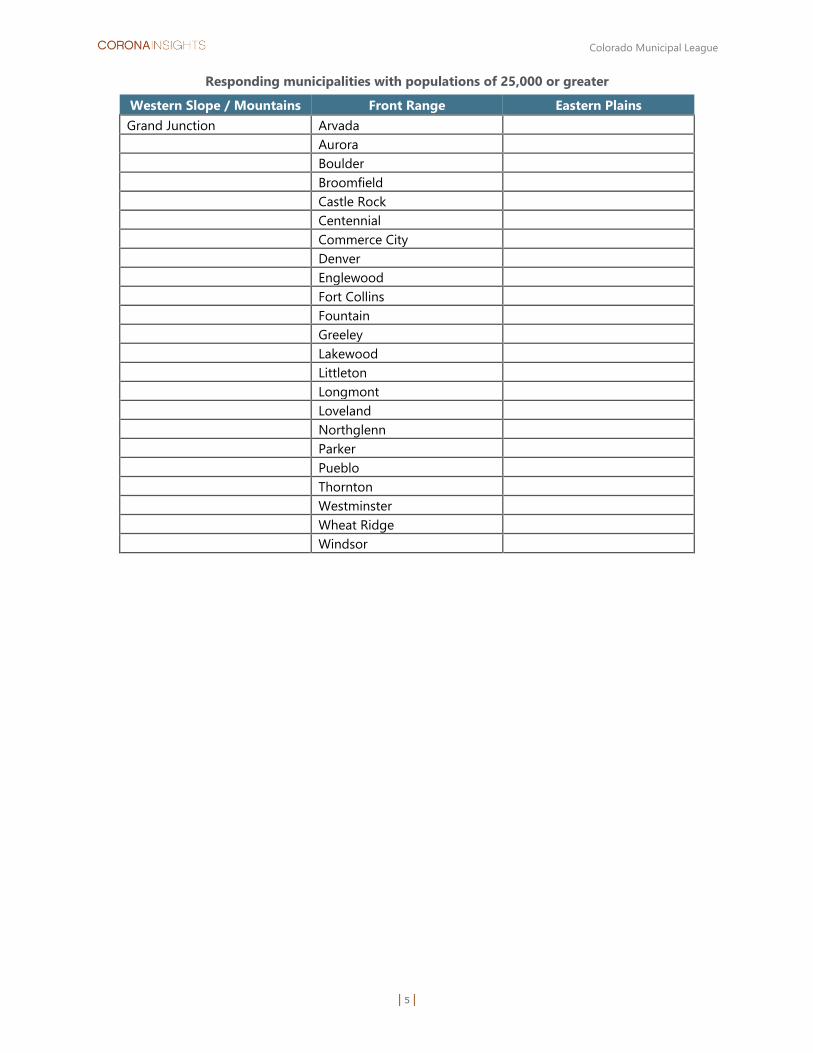
Responding municipalities with populations of 25,000 or greater
Western Slope / Mountains Front Range Eastern Plains
Grand Junction Arvada
Aurora
Boulder
Broomfield
Castle Rock
Centennial
Commerce City
Denver
Englewood
Fort Collins
Fountain
Greeley
Lakewood
Littleton
Longmont
Loveland
Northglenn
Parker
Pueblo
Thornton
Westminster
Wheat Ridge
Windsor

Colorado Municipal League
| 6 |
KEY F INDINGS
The following key findings are presented in a similar order as the questions were asked in the survey.
OPERATIONAL IMPACTS OF COVID-19
Furloughs, lay-offs, or reducing hours was not widespread. About 9% of all responding municipalities
furloughed any full-time employees due to Covid-19, 6% laid-off full-time employees, and 13% reduced
hours of full-time employees. Furloughing was more common for part-time than full-time employees. About
one-third of municipalities have not filled full-time positions due to Covid-19, including 8% of respondents
who have not filled 10 or more positions. Lastly, about 10% of municipalities completely eliminated
employee positions, with large municipalities being far more likely than small municipalities to have
eliminated positions. (Q1, Q2)
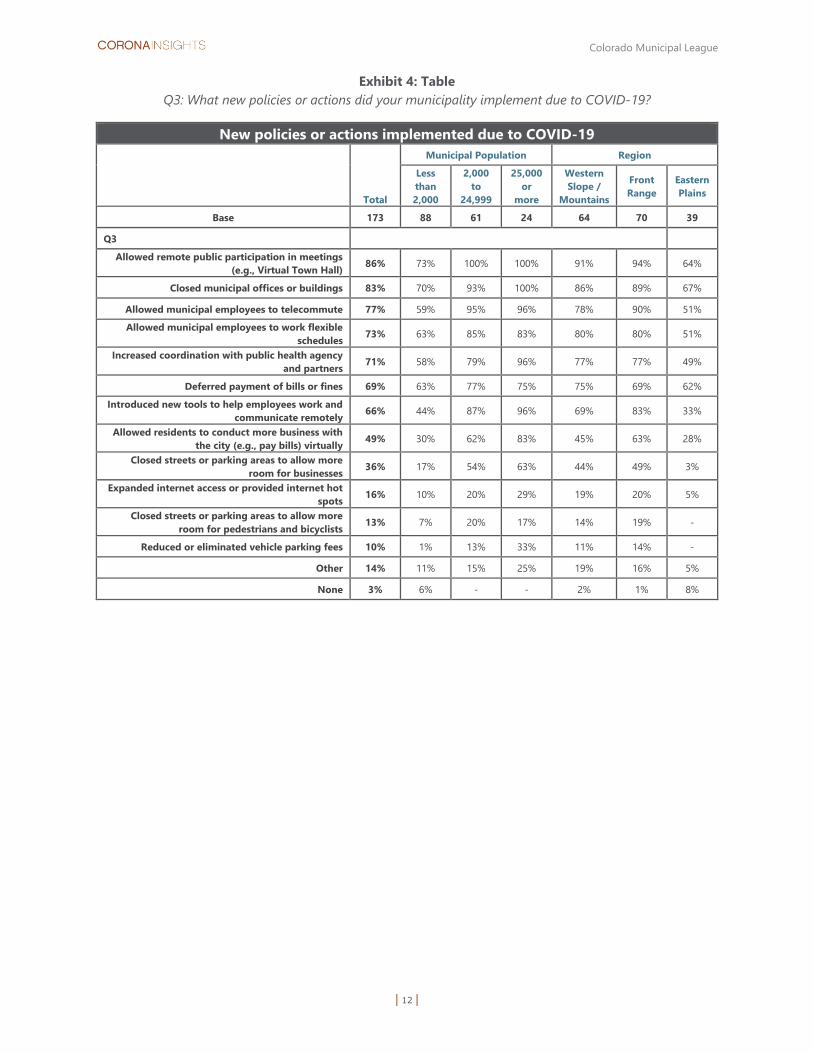
Closing municipal offices and holding public meetings virtually was very common. About two-thirds of
responding municipalities plan to permanently allow remote public participation at meetings. Municipalities
supported their employees: more than 70% allowed their employees to work from home and work flexible
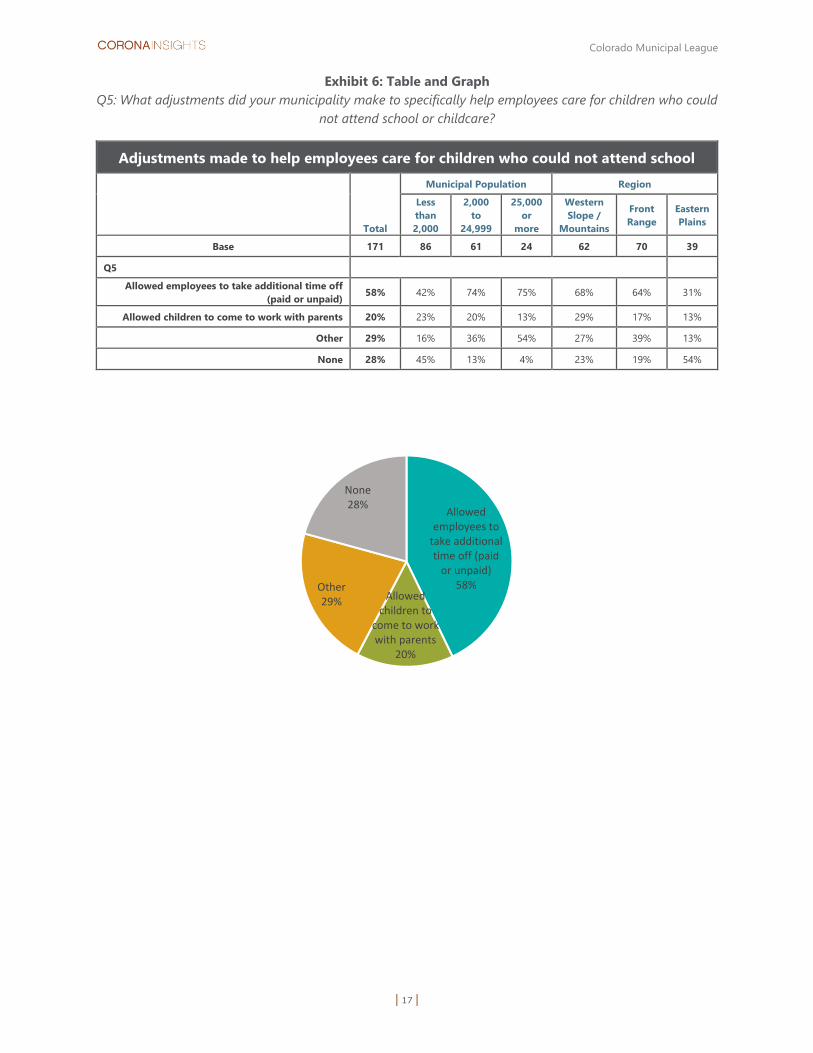
schedules, and 66% introduced tools to help employees work remotely. Additionally, 58% allowed
employees to take additional time off to care for their children, and 20% allowed parents to bring children to
work with them. Cities and towns also supported residents: 69% deferred payments of bills or fines, and
about half allowed residents to pay bill and conduct other municipal business virtually, a service that will
likely become permanent in many municipalities. (Q2, Q3, Q5)
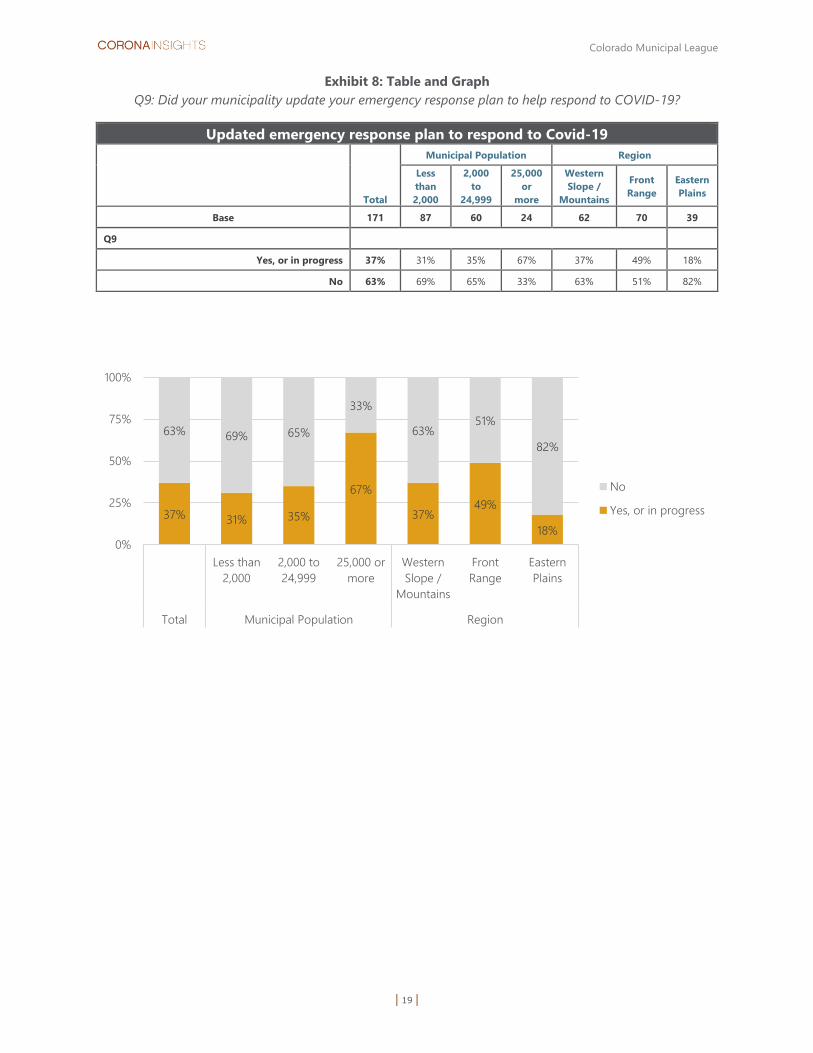
Some municipalities updated communication plans and emergency response plans. As might be
expected, larger municipalities were much more likely to update their communication plans and emergency
response plans. The average communication plan update cost nearly $4,000, but more than half of
municipalities did not pay for the update (many made the update in-house). The average emergency
response plan update cost close to $2,500, and again, more than half of municipalities did not pay for the
update. (Q7, Q9)
Large municipalities were most likely to help serve residents experiencing homelessness during the
pandemic. Providing food services was the most common action taken, followed by providing other non-
shelter services, providing rent/mortgage mediation, and providing portable toilets. (Q11)
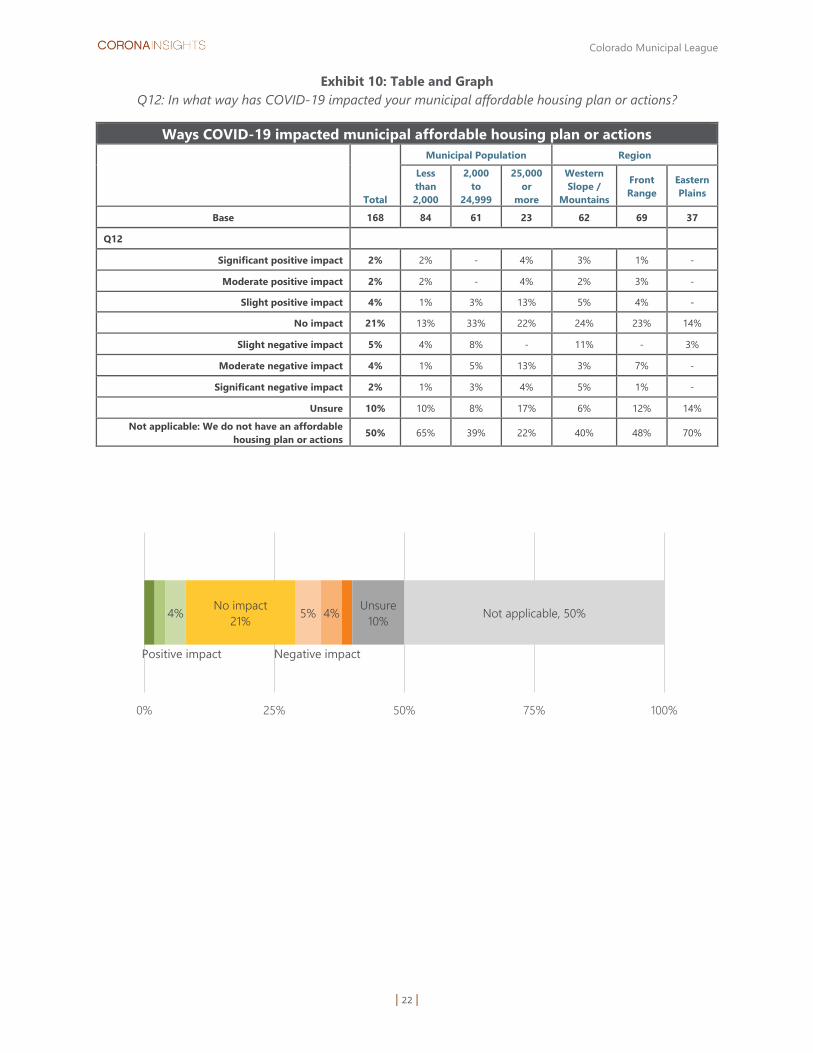
Covid had minor impact on affordable housing plans. About 10% of municipalities said Covid had a
negative impact on their housing plans, and about the same said Covid has had a positive impact. The most
common impact was cities changing or reprioritizing their affordable housing plan or actions. (Q12, Q13)
FISCAL IMPACTS OF COVID-19
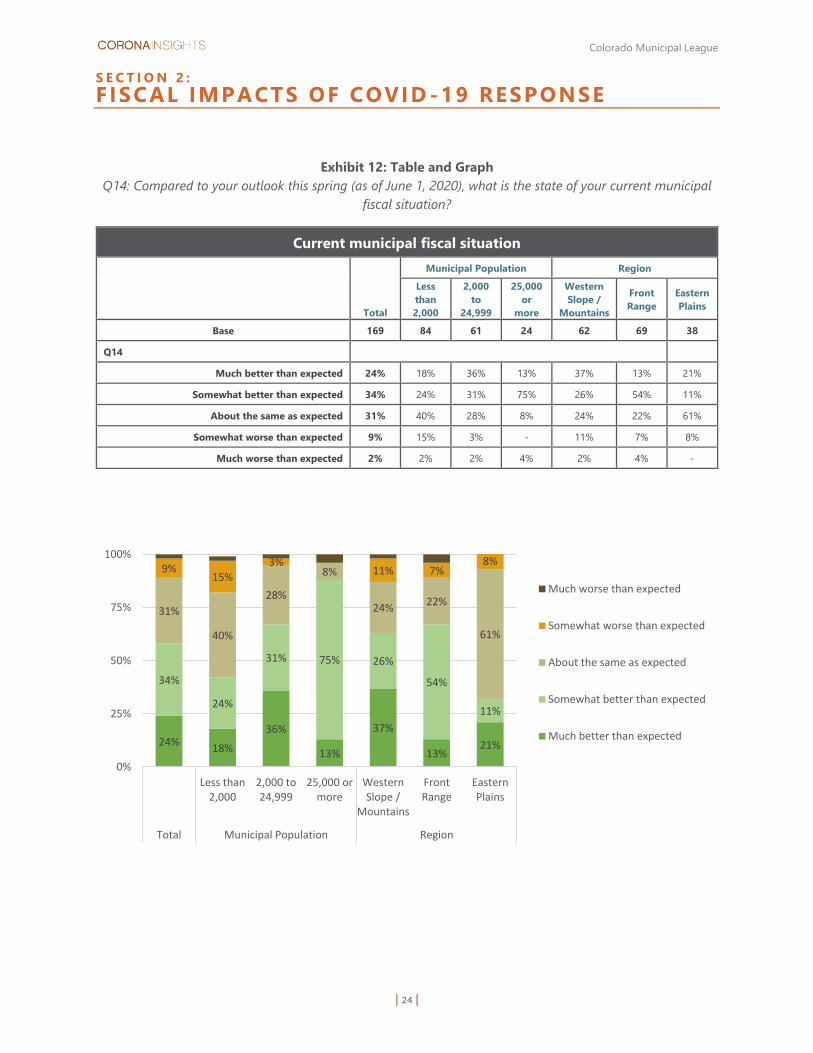
Fiscal situations are better than expected. Close to 60% of municipalities indicated their fiscal situation
was better than expected, compared to their outlook in late spring, with 24% saying “much better” than
expected. About 10% said their fiscal situation was worse than expected. Three quarters of large
municipalities were doing “somewhat better” than expected. Many of the small towns and most towns in the
Eastern Plains were doings about the same as expected. (Q14)
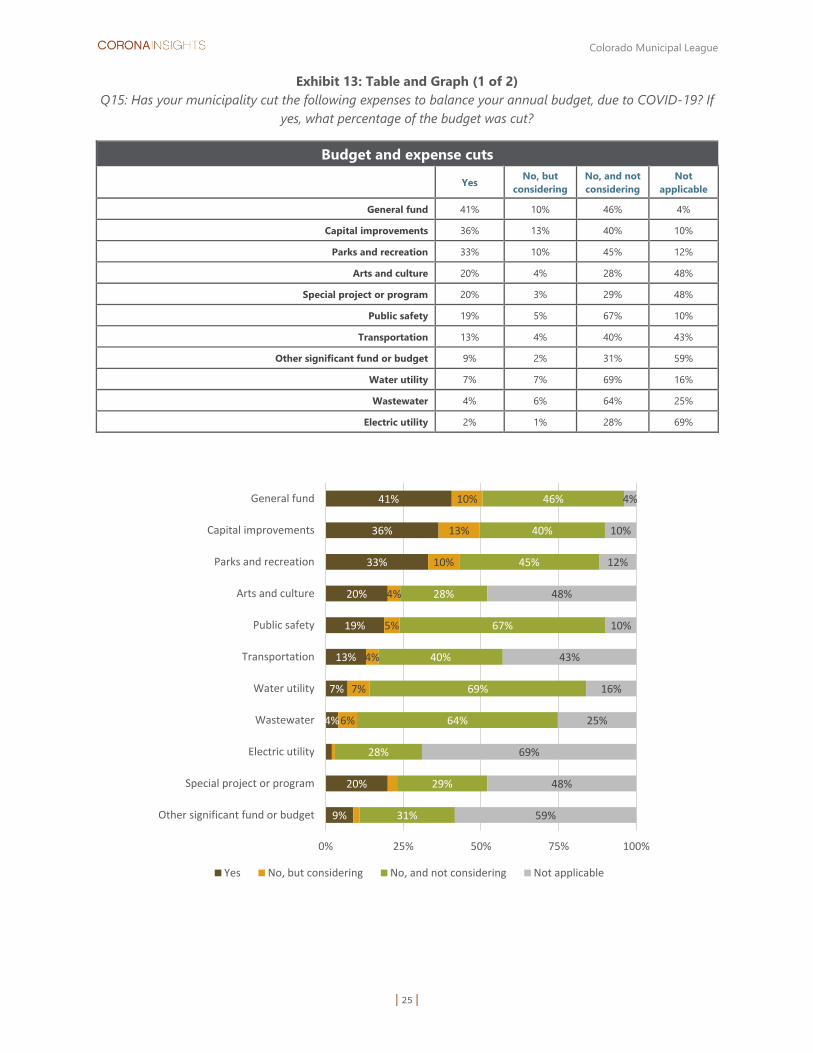
Two in five municipalities cut their general fund to balance their budget. Two percent of responding
municipalities cut their general fund by one-third or more. Additionally, 10% have not cut their general fund
but are considering it. Yet, 46% have not and are not considering cutting their general fund. Capital
improvements and parks and recreation funds were the second and third most commonly cut, followed by
arts and culture and public safety. Utilities were the least likely to experience cuts. Some of the largest cuts
by proportion of fund were special project/program funds, other significant funds, and capital improvement
budgets. About half of municipalities that cut these budgets or funds cut them by at least one-third. (Q15)

Colorado Municipal League
| 7 |
Many municipalities have frozen salaries. Nearly one-quarter of municipalities froze employee salaries
due to Covid, with nearly half of large municipalities taking this step. About 15% have considered salary
changes but did not make them yet. (Q17)
More than one-third of municipalities have fully recovered from the fiscal impacts of Covid or were
never negatively impacted. All of these fully-recovered municipalities are small or mid-sized. A majority of
all municipalities are either recovered now or expect to fully recover within 12 months, and 90% expect it
within 24 months. However, one in five large municipalities expect to take up to five years to fiscally recover,
and 7% of small towns expect to never completely recover. (Q19)
Four in five municipalities postponed utility late fees or shutoffs. Postponing late fees and utility
shutoffs was very common regardless of municipal size or region. About 55% of municipalities said these
actions had a slight negative impact on their utility, and about 30% said it had no negative fiscal impact.
(Q20, Q21)
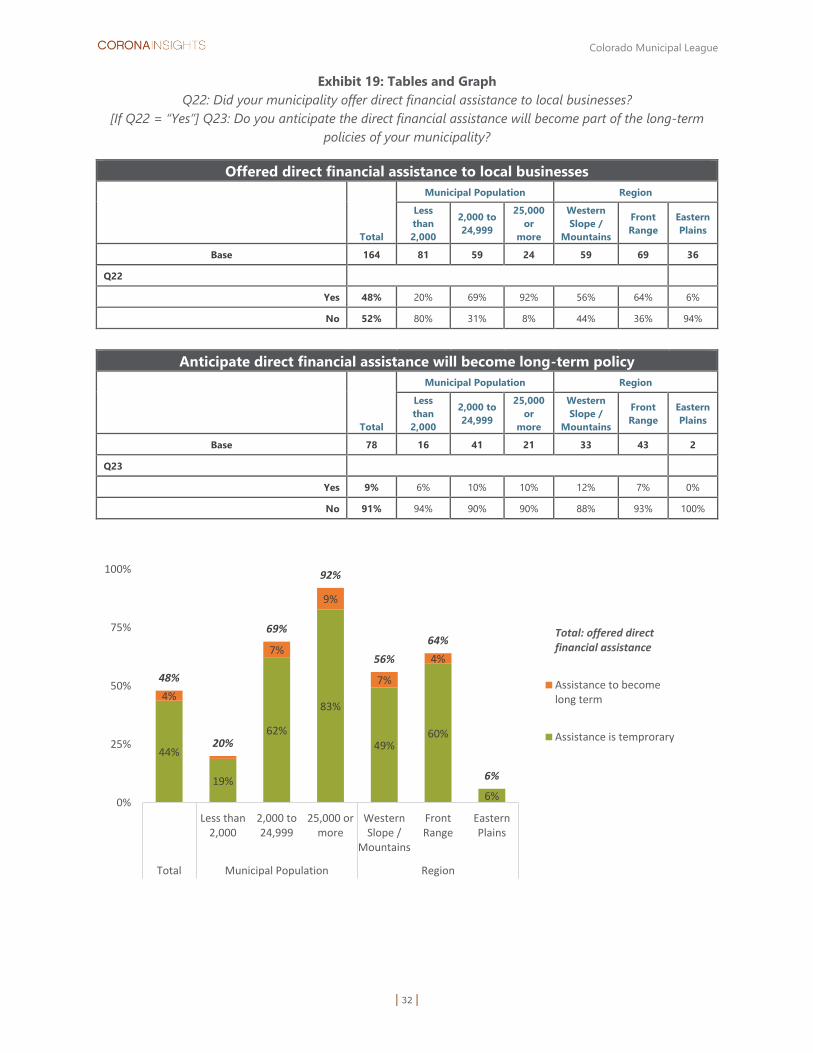
Half of municipalities offered direct financial assistance to businesses. Again, offering this assistance
was much more common in large cities (92%) compared to small towns (20%) and in Front Range
communities (64%) than Eastern Plains communities (6%). Nearly 5% of municipalities who offered
assistance expect this to become a long-term policy. (Q22, Q23)
MUNICIPAL REVENUE
Almost half of all municipalities felt their economy was worse than it was in FY 2019. Two in five large
cities felt their economy was much worse than last year, whereas small towns seemed to be more ambivalent
about their fiscal situation compared to last year, with 38% saying their economy was about the same.
Mountain and Western Slope towns saw their current economy a bit more negatively than did Eastern Plains
towns. Feelings of municipal revenue were a bit more positive, with about one quarter of respondents saying
their revenue will be at least somewhat better than last year, and more then half said revenue will at least be
the same as last year. (Q25, Q26)
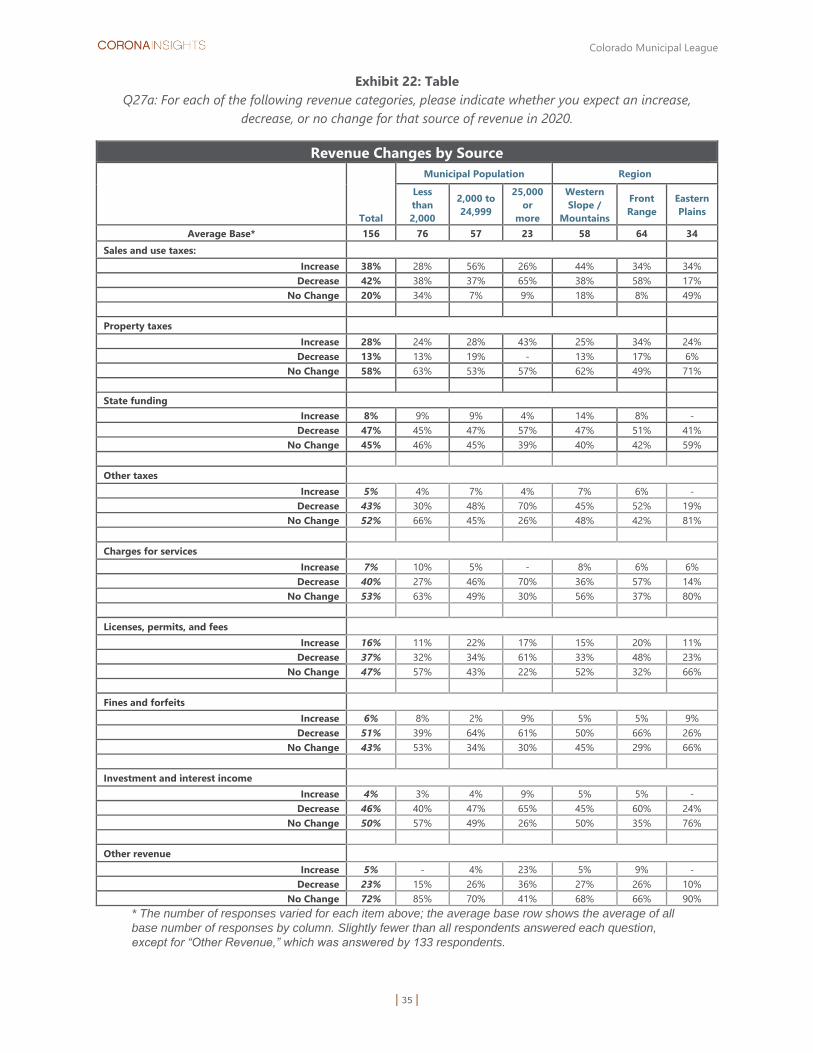
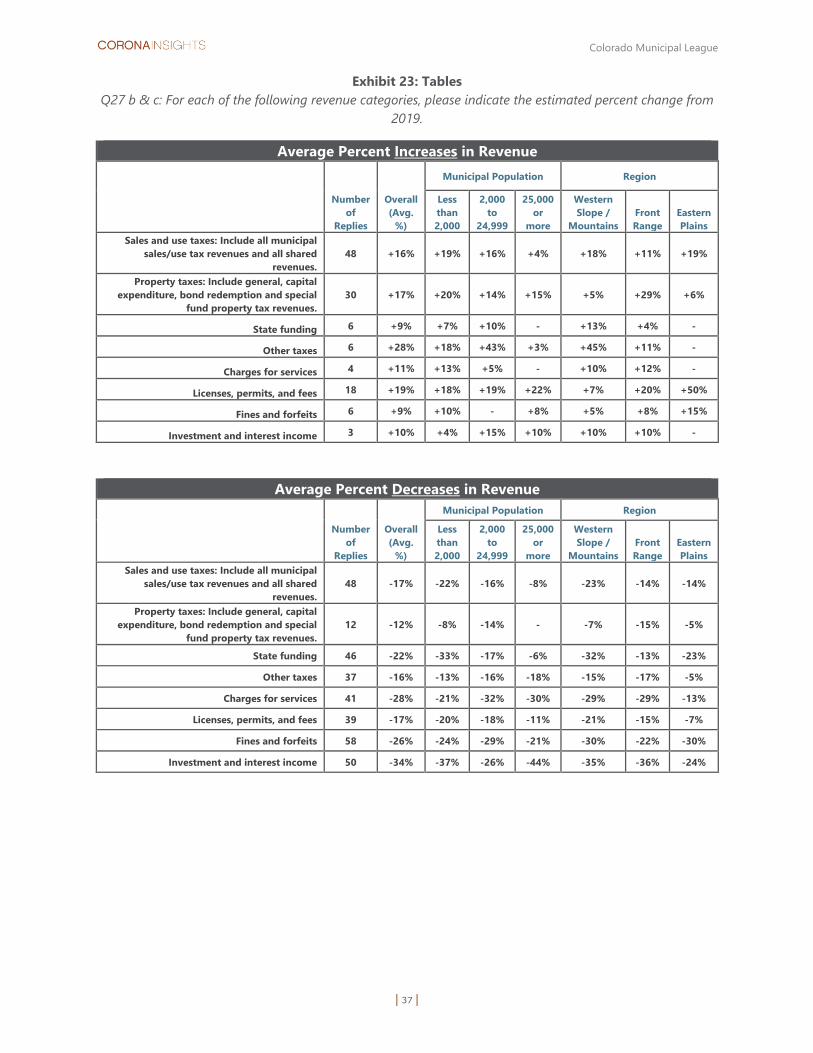
Most revenue sources are expected to decrease or stay the same next year. Few revenue categories
were expected to increase much, with the exception that 38% of municipalities expected sale and use tax to
increase, and 28% expected property taxes to increase. Half or nearly half of municipalities expected fines
and forfeits, state funding, and investment and interest income to decrease. Few municipalities (13%)
expected property taxes to decrease. (Q27)
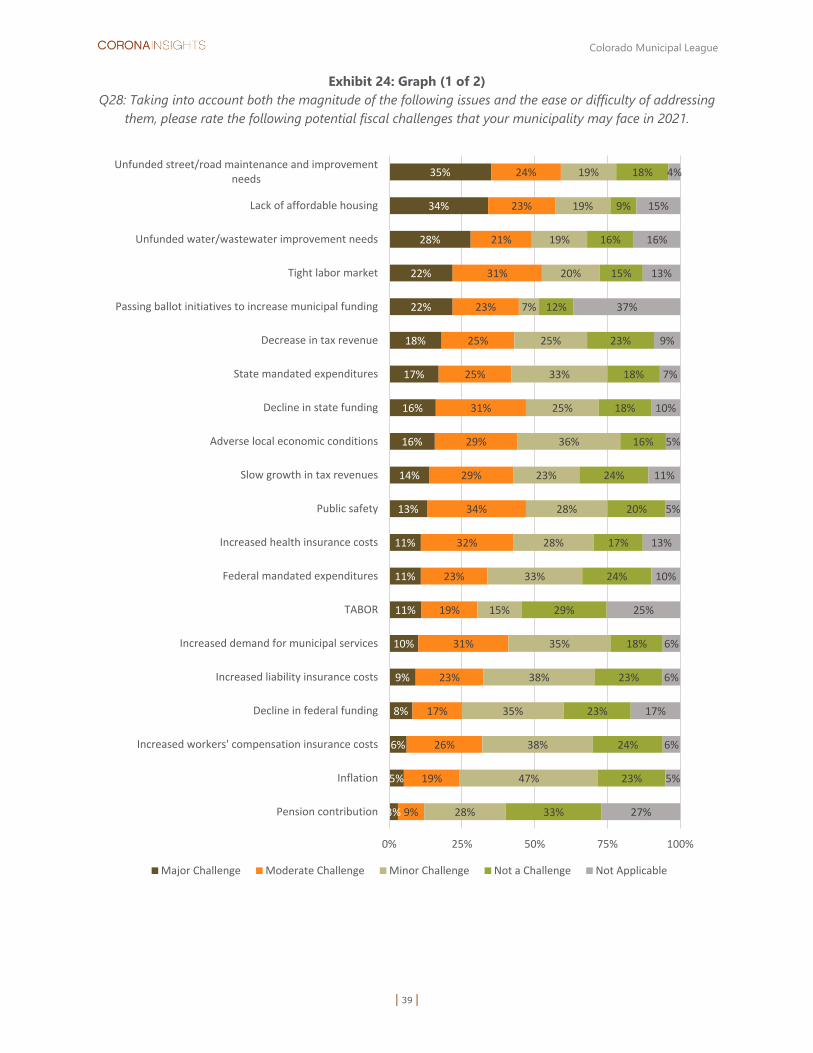
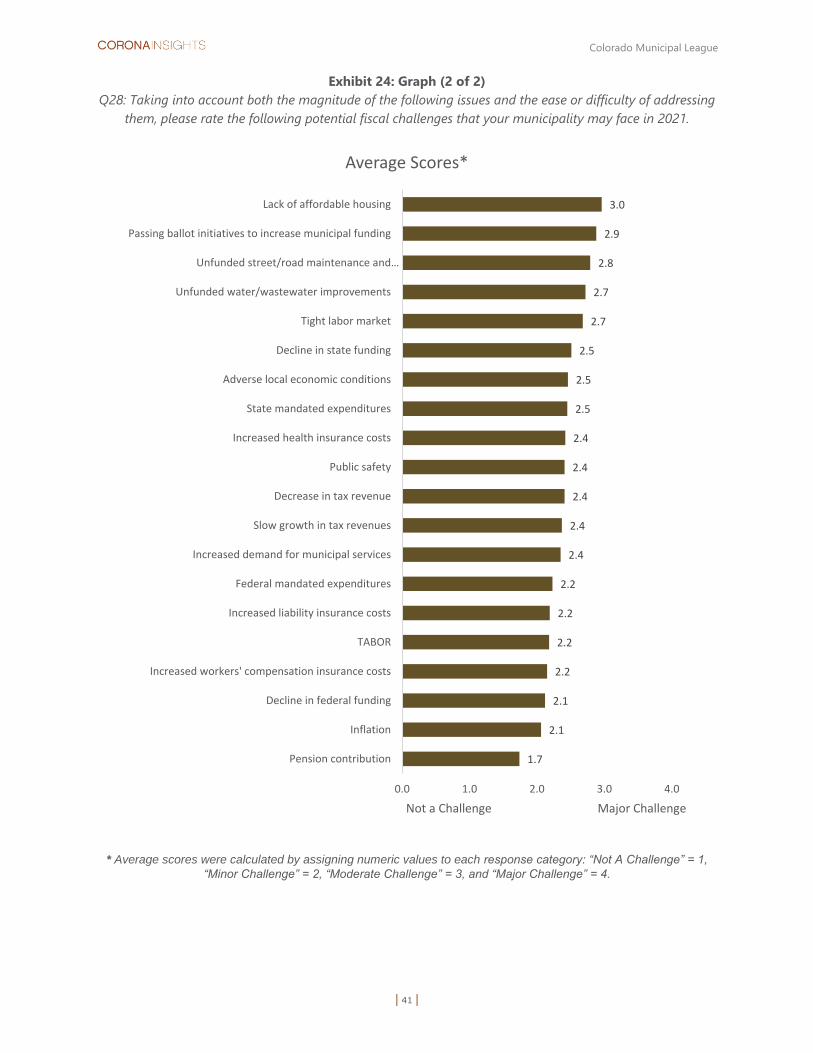
Akin to the past two years, lack of affordable housing remained a common major challenge. Likewise,
unfunded road maintenance and unfunded water projects remained major challenges. Passing ballot
initiatives to increase municipal funding ranked a bit higher in importance this year, whereas decline in state
funding and adverse economic conditions ranked much higher this year. A tight labor market ranked a bit
less important this year, but it was still a top-five issue. (Q28)
Colorado Municipal League
| 8 |
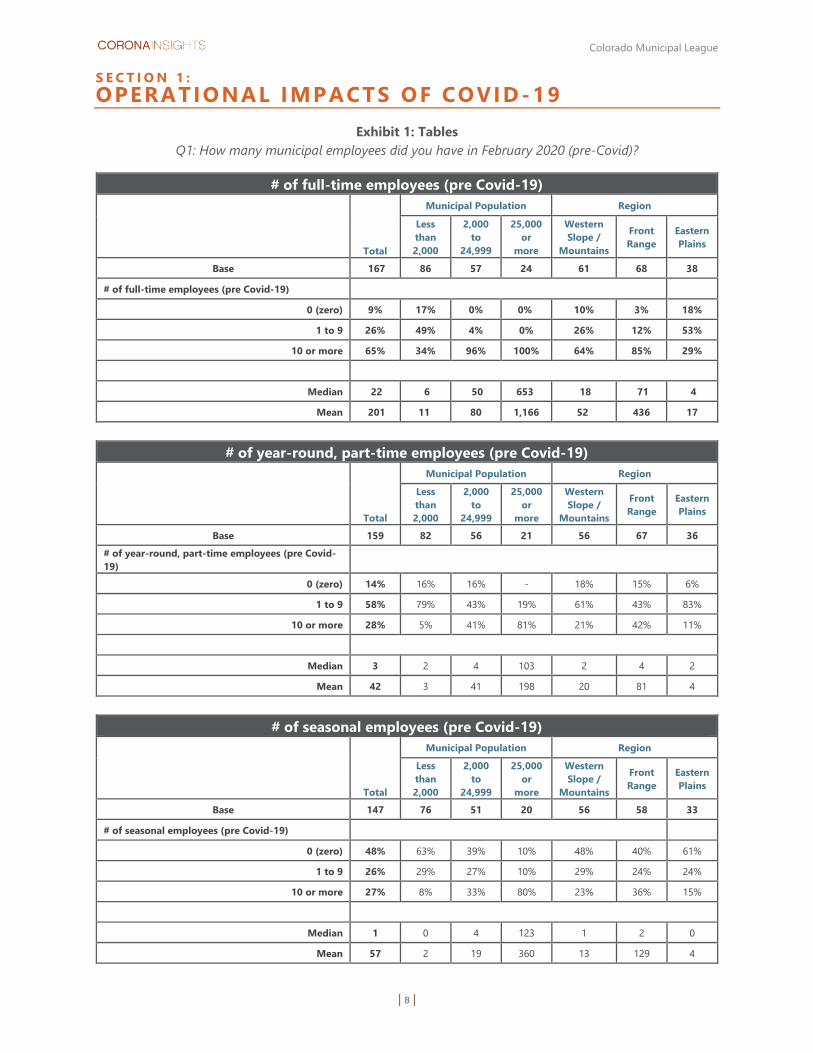
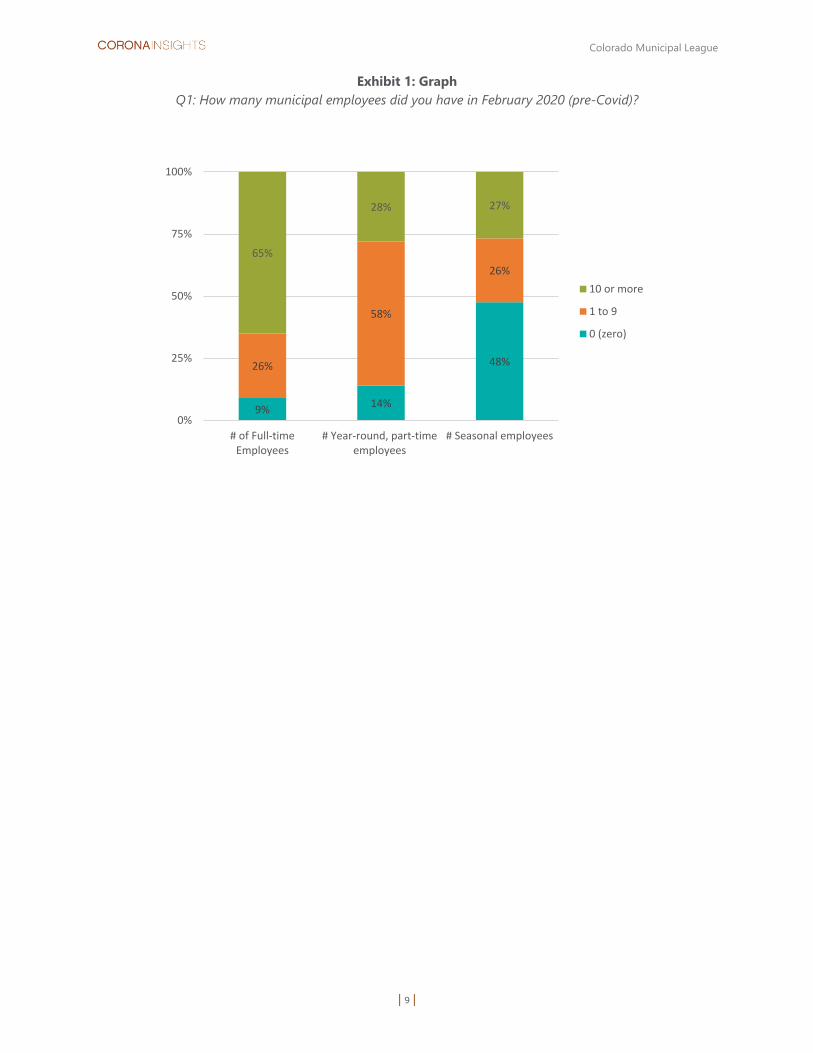
S E C T I O N 1 : OPERATIONAL IMPACTS OF COVID-19
Exhibit 1: Tables
Q1: How many municipal employees did you have in February 2020 (pre-Covid)?
# of full-time employees (pre Covid-19)
Total
Municipal Population Region
Less
than
2,000
2,000
to
24,999
25,000
or
more
Western
Slope /
Mountains
Front
Range
Eastern
Plains
Base 167 86 57 24 61 68 38
# of full-time employees (pre Covid-19)
0 (zero) 9% 17% 0% 0% 10% 3% 18%
1 to 9 26% 49% 4% 0% 26% 12% 53%
10 or more 65% 34% 96% 100% 64% 85% 29%
Median 22 6 50 653 18 71 4
Mean 201 11 80 1,166 52 436 17
# of year-round, part-time employees (pre Covid-19)
Total
Municipal Population Region
Less
than
2,000
2,000
to
24,999
25,000
or
more
Western
Slope /
Mountains
Front
Range
Eastern
Plains
Base 159 82 56 21 56 67 36
# of year-round, part-time employees (pre Covid-
19)
0 (zero) 14% 16% 16% - 18% 15% 6%
1 to 9 58% 79% 43% 19% 61% 43% 83%
10 or more 28% 5% 41% 81% 21% 42% 11%
Median 3 2 4 103 2 4 2
Mean 42 3 41 198 20 81 4
# of seasonal employees (pre Covid-19)
Total
Municipal Population Region
Less
than
2,000
2,000
to
24,999
25,000
or
more
Western
Slope /
Mountains
Front
Range
Eastern
Plains
Base 147 76 51 20 56 58 33
# of seasonal employees (pre Covid-19)
0 (zero) 48% 63% 39% 10% 48% 40% 61%
1 to 9 26% 29% 27% 10% 29% 24% 24%
10 or more 27% 8% 33% 80% 23% 36% 15%
Median 1 0 4 123 1 2 0
Mean 57 2 19 360 13 129 4
Colorado Municipal League
| 9 |
Exhibit 1: Graph
Q1: How many municipal employees did you have in February 2020 (pre-Covid)?
9%14%
48%26%
58%
26%
65%
28% 27%
0%
25%
50%
75%
100%
# of Full-timeEmployees
# Year-round, part-timeemployees
# Seasonal employees
10 or more
1 to 9
0 (zero)

Colorado Municipal League
| 10 |
Exhibit 2: Table and Graph
Q1a: Since February 2020, how many full-time, part-time, and seasonal employees were furloughed, laid-off,
or had their hours reduced due to COVID-19? How many open positions were not filled due to COVID-19?
Employment influenced by the pandemic
1 to 9 10 or
more Total
Full-time
Employees
# Furloughed 3% 6% 9%
# Laid-off 5% 1% 6%
# Hours reduced 9% 4% 13%
# Open positions not filled 26% 8% 34%
Part-time
Employees
# Furloughed 5% 12% 17%
# Laid-off 6% 2% 8%
# Hours reduced 9% 4% 13%
# Open positions not filled 10% 3% 13%
Seasonal
Employees
# Furloughed 3% 8% 11%
# Laid-off 0% 3% 3%
# Hours reduced 6% 6% 12%
# Open positions not filled 14% 8% 22%
3% 5% 9%
26%
5% 6% 9% 10%3% 6%
14%6%4%
8%
12% 4% 3%8% 6%
8%9%
6%
13%
34%
17%
8%13% 13% 11%
3%
12%
22%
0%
25%
50%
75%
100%
# Fu
rlo
ugh
ed
# La
id-o
ff
# H
ou
rs r
edu
ced
# O
pen
po
siti
on
s n
ot
fille
d
# Fu
rlo
ugh
ed
# La
id-o
ff
# H
ou
rs r
edu
ced
# O
pen
po
siti
on
s n
ot
fille
d
# Fu
rlo
ugh
ed
# La
id-o
ff
# H
ou
rs r
edu
ced
# O
pen
po
siti
on
s n
ot
fille
d
Full-time Employees Part-time Employees Seasonal Employees
Total
10 or more
1 to 9
Interpretation:
9% of all municipalities furloughed at least
some full-time employees.
6% furloughed 10 or more employees
3% furloughed 1 to 9 employees

Colorado Municipal League
| 11 |
Exhibit 3: Table and Graph
Q2: How many municipal employee positions have been completely eliminated due to COVID-19?
Positions eliminated due to COVID-19
Total
Municipal Population Region
Less
than
2,000
2,000
to
24,999
25,000
or
more
Western
Slope /
Mountains
Front
Range
Eastern
Plains
Base 165 83 58 24 60 69 36
Number of positions eliminated due to COVID-19
0 (zero) 89% 90% 97% 67% 92% 83% 97%
1 to 9 8% 8% 3% 21% 8% 12% 3%
10 or more 2% 1% - 13% - 6% -
Median 0 0 0 0 0 0 0
Mean 1 0 0 3 0 1 0
89% 90%97%
67%
92%83%
97%
8% 8%
21%
8%
12%13%
6%
0%
25%
50%
75%
100%
Less than2,000
2,000 to24,999
25,000 ormore
WesternSlope /
Mountains
FrontRange
EasternPlains
Total Municipal Population Region
10 or more
1 to 9
0 (zero)
Colorado Municipal League
| 12 |
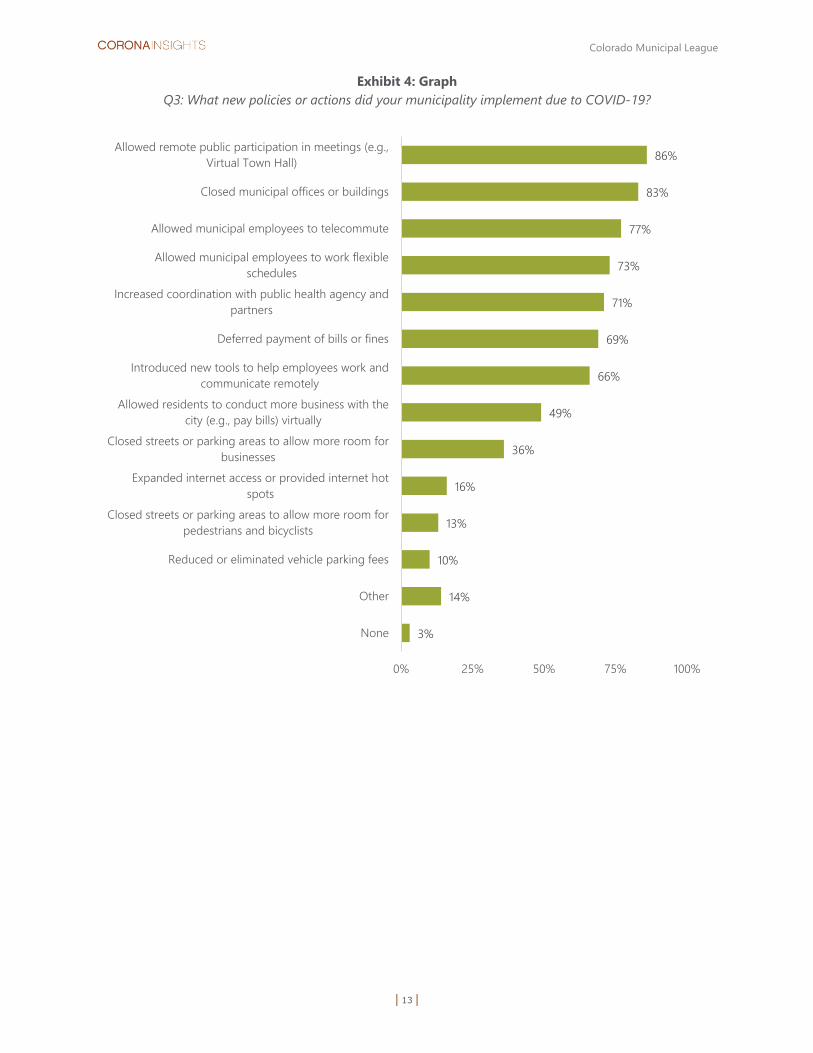
Exhibit 4: Table
Q3: What new policies or actions did your municipality implement due to COVID-19?
New policies or actions implemented due to COVID-19
Total
Municipal Population Region
Less
than
2,000
2,000
to
24,999
25,000
or
more
Western
Slope /
Mountains
Front
Range
Eastern
Plains
Base 173 88 61 24 64 70 39
Q3
Allowed remote public participation in meetings
(e.g., Virtual Town Hall) 86% 73% 100% 100% 91% 94% 64%
Closed municipal offices or buildings 83% 70% 93% 100% 86% 89% 67%
Allowed municipal employees to telecommute 77% 59% 95% 96% 78% 90% 51%
Allowed municipal employees to work flexible
schedules 73% 63% 85% 83% 80% 80% 51%
Increased coordination with public health agency
and partners 71% 58% 79% 96% 77% 77% 49%
Deferred payment of bills or fines 69% 63% 77% 75% 75% 69% 62%
Introduced new tools to help employees work and
communicate remotely 66% 44% 87% 96% 69% 83% 33%
Allowed residents to conduct more business with
the city (e.g., pay bills) virtually 49% 30% 62% 83% 45% 63% 28%
Closed streets or parking areas to allow more
room for businesses 36% 17% 54% 63% 44% 49% 3%
Expanded internet access or provided internet hot
spots 16% 10% 20% 29% 19% 20% 5%
Closed streets or parking areas to allow more
room for pedestrians and bicyclists 13% 7% 20% 17% 14% 19% -
Reduced or eliminated vehicle parking fees 10% 1% 13% 33% 11% 14% -
Other 14% 11% 15% 25% 19% 16% 5%
None 3% 6% - - 2% 1% 8%
Colorado Municipal League
| 13 |
Exhibit 4: Graph
Q3: What new policies or actions did your municipality implement due to COVID-19?
3%
14%
10%
13%
16%
36%
49%
66%
69%
71%
73%
77%
83%
86%
0% 25% 50% 75% 100%
None
Other
Reduced or eliminated vehicle parking fees
Closed streets or parking areas to allow more room for
pedestrians and bicyclists
Expanded internet access or provided internet hot
spots
Closed streets or parking areas to allow more room for
businesses
Allowed residents to conduct more business with the
city (e.g., pay bills) virtually
Introduced new tools to help employees work and
communicate remotely
Deferred payment of bills or fines
Increased coordination with public health agency and
partners
Allowed municipal employees to work flexible
schedules
Allowed municipal employees to telecommute
Closed municipal offices or buildings
Allowed remote public participation in meetings (e.g.,
Virtual Town Hall)

Colorado Municipal League
| 14 |
Exhibit 5: Table
Q4: What new policies or actions implemented due to COVID-19, do you anticipate will become
permanently adopted by your municipality?
New policies or actions that are anticipated to become permanently adopted
Total
Municipal Population Region
Less
than
2,000
2,000
to
24,999
25,000
or
more
Western
Slope /
Mountains
Front
Range
Eastern
Plains
Base 168 83 61 24 63 69 36
Q4
Allow remote public participation in meetings
(e.g., Virtual Town Hall) 60% 47% 69% 79% 63% 59% 53%
Allow municipal employees to work flexible
schedules 52% 42% 59% 71% 54% 58% 39%
Tools to help employees work and communicate
remotely 51% 31% 62% 88% 52% 61% 28%
Allow municipal employees to telecommute 49% 33% 59% 79% 51% 57% 31%
Increase coordination with public health agency
and partners 43% 35% 46% 63% 54% 41% 28%
Allow residents to conduct more business with the
city (e.g., pay bills) virtually 42% 24% 54% 75% 37% 58% 22%
Close streets or parking areas to allow more room
for businesses 13% 6% 18% 25% 21% 13% -
Expand internet access or provided internet hot
spots 13% 6% 16% 29% 14% 17% 3%
Close municipal offices or buildings 9% 12% 5% 8% 11% 6% 11%
Defer payment of bills or fines 7% 7% 7% 4% 8% 6% 6%
Close streets or parking areas to allow more room
for pedestrians and bicyclists 4% 1% 8% 4% 8% 3% -
Reduce or eliminate vehicle parking fees 0% - - - - - -
Other 4% 4% 2% 13% 5% 4% 3%
None 11% 19% 3% - 10% 4% 25%

Colorado Municipal League
| 15 |
Exhibit 5: Graph (1 of 2)
Q4: What new policies or actions implemented due to COVID-19, do you anticipate will become
permanently adopted by your municipality?
11%
4%
0%
4%
7%
9%
13%
13%
42%
43%
49%
51%
52%
60%
0% 25% 50% 75% 100%
None
Other
Reduce or eliminate vehicle parking fees
Close streets or parking areas to allow more room forpedestrians and bicyclists
Defer payment of bills or fines
Close municipal offices or buildings
Expand internet access or provided internet hot spots
Close streets or parking areas to allow more room forbusinesses
Allow residents to conduct more business with the city(e.g., pay bills) virtually
Increase coordination with public health agency andpartners
Allow municipal employees to telecommute
Tools to help employees work and communicate remotely
Allow municipal employees to work flexible schedules
Allow remote public participation in meetings (e.g., VirtualTown Hall)

Colorado Municipal League
| 16 |
Exhibit 5: Graph (2 of 2)
Q4: What new policies or actions implemented due to COVID-19, do you anticipate will become
permanently adopted by your municipality?
11%
4%
0%
4%
13%
13%
42%
51%
7%
43%
52%
49%
9%
60%
3%
14%
10%
13%
16%
36%
49%
66%
69%
71%
73%
77%
83%
86%
0% 25% 50% 75% 100%
None
Other
Reduced or eliminated vehicle parkingfees
Closed streets or parking areas to allowmore room for pedestrians and bicyclists
Expanded internet access or providedinternet hot spots
Closed streets or parking areas to allowmore room for businesses
Allowed residents to conduct morebusiness with the city (e.g., pay bills)…
Introduced new tools to help employeeswork and communicate remotely
Deferred payment of bills or fines
Increased coordination with public healthagency and partners
Allowed municipal employees to workflexible schedules
Allowed municipal employees totelecommute
Closed municipal offices or buildings
Allowed remote public participation inmeetings (e.g., Virtual Town Hall)
New policy (Q3)
Likely permenant (Q4)
Colorado Municipal League
| 17 |
Exhibit 6: Table and Graph
Q5: What adjustments did your municipality make to specifically help employees care for children who could
not attend school or childcare?
Adjustments made to help employees care for children who could not attend school
Total
Municipal Population Region
Less
than
2,000
2,000
to
24,999
25,000
or
more
Western
Slope /
Mountains
Front
Range
Eastern
Plains
Base 171 86 61 24 62 70 39
Q5
Allowed employees to take additional time off
(paid or unpaid) 58% 42% 74% 75% 68% 64% 31%
Allowed children to come to work with parents 20% 23% 20% 13% 29% 17% 13%
Other 29% 16% 36% 54% 27% 39% 13%
None 28% 45% 13% 4% 23% 19% 54%
Allowed employees to
take additional time off (paid
or unpaid)58%
Allowed children to
come to work with parents
20%
Other29%
None28%

Colorado Municipal League
| 18 |
Exhibit 7: Table and Graph
Q7: Did your municipality update your communication plan to help respond to COVID-19?
Updated communication plan to respond to COVID-19
Total
Municipal Population Region
Less
than
2,000
2,000
to
24,999
25,000
or
more
Western
Slope /
Mountains
Front
Range
Eastern
Plains
Base 172 88 60 24 63 70 39
Q7
Yes, or in progress 34% 26% 37% 58% 33% 43% 21%
No 66% 74% 63% 42% 67% 57% 79%
34%26%
37%
58%
33%43%
21%
66%74%
63%
42%
67%57%
79%
0%
25%
50%
75%
100%
Less than2,000
2,000 to24,999
25,000 ormore
WesternSlope /
Mountains
Front Range EasternPlains
Total Municipal Population Region
No
Yes, or in progress
Colorado Municipal League
| 19 |
Exhibit 8: Table and Graph
Q9: Did your municipality update your emergency response plan to help respond to COVID-19?
Updated emergency response plan to respond to Covid-19
Total
Municipal Population Region
Less
than
2,000
2,000
to
24,999
25,000
or
more
Western
Slope /
Mountains
Front
Range
Eastern
Plains
Base 171 87 60 24 62 70 39
Q9
Yes, or in progress 37% 31% 35% 67% 37% 49% 18%
No 63% 69% 65% 33% 63% 51% 82%
37% 31% 35%
67%
37%49%
18%
63% 69% 65%
33%
63%51%
82%
0%
25%
50%
75%
100%
Less than
2,000
2,000 to
24,999
25,000 or
more
Western
Slope /
Mountains
Front
Range
Eastern
Plains
Total Municipal Population Region
No
Yes, or in progress

Colorado Municipal League
| 20 |
Exhibit 9: Table
Q11: What operational changes or actions did you take to serve people experiencing homelessness or to
reduce homelessness during the pandemic?
Actions to serve people experiencing homelessness during the pandemic
Total
Municipal Population Region
Less
than
2,000
2,000
to
24,999
25,000
or
more
Western
Slope /
Mountains
Front
Range
Eastern
Plains
Base 168 84 60 24 62 68 38
Q11
We did not make and changes or take any actions 41% 45% 50% 4% 42% 38% 45%
We do not have anyone experiencing
homelessness in our community 38% 61% 18% 4% 35% 24% 66%
Provided food services (alone or in partnership
with community organizations) 16% 6% 17% 50% 13% 26% 3%
Other change or action 15% 4% 17% 54% 10% 28% 3%
Provided rent or mortgage mediation to help
people stay in their homes 14% 4% 15% 46% 13% 21% 3%
Provided other non-shelter services (alone or in
partnership with community organizations) 12% 2% 12% 46% 13% 18% -
Provided portable toilets, hand-washing stations,
and/or showers 10% 2% 8% 42% 10% 16% -
Provided supplies such as soap, tissues, or cloth
face coverings 10% 5% 8% 29% 6% 16% 3%
Partnered with hotels to provide shelter 7% - 5% 38% 2% 16% -
Changed or created new municipal policy or
ordinance 4% 1% 7% 8% 3% 6% 3%
Repurposed municipal land (outdoors) to serve
people who are homeless 3% - 2% 17% 2% 6% -
Repurposed municipal buildings to service centers
and/or shelters 2% - 2% 13% 2% 4% -
Built or bought new homeless shelters 1% - - 8% - 3% -
Partnered with school districts or library districts
to repurpose buildings as service centers and/or
shelters
1% 1% - - - - 3%

Colorado Municipal League
| 21 |
Exhibit 9: Graph
Q11: What operational changes or actions did you take to serve people experiencing homelessness or to
reduce homelessness during the pandemic?
1%
1%
2%
3%
4%
7%
10%
10%
12%
14%
15%
16%
38%
41%
0% 25% 50% 75% 100%
Built or bought new homeless shelters
Partnered with school districts or library districtsto repurpose buildings as service centers…
Repurposed municipal buildings to servicecenters and/or shelters
Repurposed municipal land (outdoors) to servepeople who are homeless
Changed or created new municipal policy orordinance
Partnered with hotels to provide shelter
Provided portable toilets, hand-washingstations, and/or showers
Provided supplies such as soap, tissues, or clothface coverings
Provided other non-shelter services (alone or inpartnership with community organizations)
Provided rent or mortgage mediation to helppeople stay in their homes
Other change or action
Provided food services (alone or in partnershipwith community organizations)
We do not have anyone experiencinghomelessness in our community
We did not make and changes or take anyactions
Colorado Municipal League
| 22 |
Exhibit 10: Table and Graph
Q12: In what way has COVID-19 impacted your municipal affordable housing plan or actions?
Ways COVID-19 impacted municipal affordable housing plan or actions
Total
Municipal Population Region
Less
than
2,000
2,000
to
24,999
25,000
or
more
Western
Slope /
Mountains
Front
Range
Eastern
Plains
Base 168 84 61 23 62 69 37
Q12
Significant positive impact 2% 2% - 4% 3% 1% -
Moderate positive impact 2% 2% - 4% 2% 3% -
Slight positive impact 4% 1% 3% 13% 5% 4% -
No impact 21% 13% 33% 22% 24% 23% 14%
Slight negative impact 5% 4% 8% - 11% - 3%
Moderate negative impact 4% 1% 5% 13% 3% 7% -
Significant negative impact 2% 1% 3% 4% 5% 1% -
Unsure 10% 10% 8% 17% 6% 12% 14%
Not applicable: We do not have an affordable
housing plan or actions 50% 65% 39% 22% 40% 48% 70%
4%No impact
21%5% 4%
Unsure
10%Not applicable, 50%
0% 25% 50% 75% 100%
Positive impact Negative impact

Colorado Municipal League
| 23 |
Exhibit 11: Table and Graph
Q13: How has COVID-19 impacted your municipal affordable housing plan or actions?
How COVID-19 impacted affordable housing plan or actions
Total
Municipal Population Region
Less
than
2,000
2,000 to
24,999
25,000 or
more
Western Slope /
Mountains
Front
Range
Eastern
Plains
Base 148 80 48 20 57 57 34
Q13
Changed or reprioritized our
affordable housing plan or actions 10% 1% 13% 40% 9% 18% -
Increased demand or applications for
affordable housing 7% 4% 2% 30% 7% 11% -
Delayed or stopped construction or
purchase of affordable housing units 5% 4% 8% 5% 11% 2% 3%
Delayed implementation of affordable
housing plan actions 5% 5% 6% 5% 11% 4% -
Sped up implementation of affordable
housing plan actions 3% 3% 2% 5% 2% 5% -
Increased current affordable housing
tenants who are delinquent on
payments
3% - 2% 15% 2% 5% -
Sped up construction or purchase of
affordable housing units 2% - 2% 10% 2% 4% -
Other 14% 6% 19% 30% 19% 12% 6%
Not applicable: We do not have an
affordable housing plan or actions 66% 81% 58% 20% 54% 61% 91%
66%
14%
2%
3%
3%
5%
5%
7%
10%
0% 25% 50% 75% 100%
Not applicable: We do not have an affordablehousing plan or actions
Other
Sped up construction or purchase of affordablehousing units
Increased current affordable housing tenants whoare delinquent on payments
Sped up implementation of affordable housing planactions
Delayed implementation of affordable housing planactions
Delayed or stopped construction or purchase ofaffordable housing units
Increased demand or applications for affordablehousing
Changed or reprioritized our affordable housing planor actions
Colorado Municipal League
| 24 |
S E C T I O N 2 : F ISCAL IMPACTS OF COVID -19 RESPONSE
Exhibit 12: Table and Graph
Q14: Compared to your outlook this spring (as of June 1, 2020), what is the state of your current municipal
fiscal situation?
Current municipal fiscal situation
Total
Municipal Population Region
Less
than
2,000
2,000
to
24,999
25,000
or
more
Western
Slope /
Mountains
Front
Range
Eastern
Plains
Base 169 84 61 24 62 69 38
Q14
Much better than expected 24% 18% 36% 13% 37% 13% 21%
Somewhat better than expected 34% 24% 31% 75% 26% 54% 11%
About the same as expected 31% 40% 28% 8% 24% 22% 61%
Somewhat worse than expected 9% 15% 3% - 11% 7% 8%
Much worse than expected 2% 2% 2% 4% 2% 4% -
24%18%
36%
13%
37%
13%21%
34%
24%
31% 75% 26%
54%
11%
31%
40%
28%
8%
24%22%
61%
9%15%
3%11% 7%
8%
0%
25%
50%
75%
100%
Less than2,000
2,000 to24,999
25,000 ormore
WesternSlope /
Mountains
FrontRange
EasternPlains
Total Municipal Population Region
Much worse than expected
Somewhat worse than expected
About the same as expected
Somewhat better than expected
Much better than expected
Colorado Municipal League
| 25 |
Exhibit 13: Table and Graph (1 of 2)
Q15: Has your municipality cut the following expenses to balance your annual budget, due to COVID-19? If
yes, what percentage of the budget was cut?
Budget and expense cuts
Yes No, but
considering
No, and not
considering
Not
applicable
General fund 41% 10% 46% 4%
Capital improvements 36% 13% 40% 10%
Parks and recreation 33% 10% 45% 12%
Arts and culture 20% 4% 28% 48%
Special project or program 20% 3% 29% 48%
Public safety 19% 5% 67% 10%
Transportation 13% 4% 40% 43%
Other significant fund or budget 9% 2% 31% 59%
Water utility 7% 7% 69% 16%
Wastewater 4% 6% 64% 25%
Electric utility 2% 1% 28% 69%
9%
20%
4%
7%
13%
19%
20%
33%
36%
41%
6%
7%
4%
5%
4%
10%
13%
10%
31%
29%
28%
64%
69%
40%
67%
28%
45%
40%
46%
59%
48%
69%
25%
16%
43%
10%
48%
12%
10%
4%
0% 25% 50% 75% 100%
Other significant fund or budget
Special project or program
Electric utility
Wastewater
Water utility
Transportation
Public safety
Arts and culture
Parks and recreation
Capital improvements
General fund
Yes No, but considering No, and not considering Not applicable
Colorado Municipal League
| 26 |
Exhibit 13: Graph (2 of 2)
Q15: Has your municipality cut the following expenses to balance your annual budget, due to COVID-19? If
yes, what percentage of the budget was cut?
2%
10%
14%
20%
30%
30%
47%
50%
56%
0% 25% 50% 75% 100%
General fund
Parks and recreation
Water utility
Wastewater
Transportation
Arts and culture
Capital improvements
Other significant fund or budget
Special project or program
Cut at least one-thirdof this budget
Interpretation:
47% of municipalities that cut their
capital improvement budget, cut it
by at least one-third.
Colorado Municipal League
| 27 |
Exhibit 14: Table and Graph
Q16: Please tell us more about your budget cuts.
Budget cut details
Permanent
fund cut
Temporary
fund cut
Funds
were
redirected
No cuts
yet
Not
applicable
General fund 7% 31% 7% 59% 4%
Parks and recreation 5% 21% 4% 60% 13%
Capital improvements 3% 27% 1% 58% 11%
Public safety 3% 12% - 75% 10%
Arts and culture 2% 11% 3% 34% 51%
Transportation 1% 7% 1% 47% 46%
Other significant fund or budget cut 1% 6% - 33% 61%
Water utility 0% 3% 1% 79% 17%
Wastewater 0% 2% 1% 72% 25%
Electric utility 0% 1% - 29% 70%
Special projects or programs 0% 14% 1% 34% 51%
5%
7%
6%
14%
7%
12%
11%
21%
27%
31%
3%
4%
7%
33%
34%
29%
72%
79%
47%
75%
34%
60%
58%
59%
61%
51%
70%
25%
17%
46%
10%
51%
13%
11%
4%
0% 26% 52% 77% 103%
Other significant fund or budget cut
Special projects or programs
Electric utility
Wastewater
Water utility
Transportation
Public safety
Arts and culture
Parks and recreation
Capital improvements
General fund
Permanent fund cut Temporary fund cut Funds were redirected No cuts yet Not applicable

Colorado Municipal League
| 28 |
Exhibit 15: Table and Graph
Q17: Has your municipality made any of the following changes to employee salaries or benefits due to
COVID-19?
Changes to employee salaries or benefits due to COVID-19
Total
Municipal Population Region
Less
than
2,000
2,000
to
24,999
25,000
or
more
Western
Slope /
Mountains
Front
Range
Eastern
Plains
Base 167 83 60 24 61 69 37
Q17
Salaries have been frozen (i.e., no raises) 23% 18% 20% 46% 21% 29% 14%
Salary changes have been considered, but no
changes have been made yet 15% 14% 17% 13% 15% 17% 11%
Employee benefit changes have been considered,
but no changes have been made yet. 4% 4% 5% 4% 7% 4% -
Salaries have been cut 3% 1% 2% 13% 3% 4% -
Health insurance coverage has decreased 2% 2% 2% 4% 3% 3% -
Health insurance employer contributions have
decreased 2% 2% 2% 4% 5% 1% -
Employer retirement contributions have decreased 1% - - 4% - 1% -
Some other change 8% 1% 12% 25% 5% 16% -
None of the above 60% 72% 57% 25% 62% 46% 81%
60%
8%
1%
2%
2%
3%
4%
15%
23%
0% 25% 50% 75% 100%
None of the above
Some other change
Employer retirement contributions have
decreased
Health insurance employer contributions have
decreased
Health insurance coverage has decreased
Salaries have been cut
Employee benefit changes have been considered,
but no changes have been made yet
Salary changes have been considered, but no
changes have been made yet
Salaries have been frozen (i.e., no raises)
Colorado Municipal League
| 29 |
Exhibit 16: Table and Graph
Q19: When do you expect your municipal revenues will fully recover from the negative fiscal impacts of
COVID-19?
Timeline for municipal revenue recovery
Total
Municipal Population Region
Less
than
2,000
2,000 to
24,999
25,000
or
more
Western
Slope /
Mountains
Front
Range
Eastern
Plains
Base 165 82 60 23 60 68 37
Q19
Now: fully recovered or not negatively impacted 35% 39% 42% 0% 32% 24% 59%
Within 12 months from now 26% 32% 17% 30% 28% 22% 30%
Within 2 years from now 28% 18% 35% 48% 30% 40% 5%
Within 5 years from now 7% 4% 5% 22% 5% 10% 3%
Never: do not expect to completely recover 4% 7% 2% 0% 5% 4% 3%
35%39% 42%
32%24%
59%
26%
32%
17%
30%
28%
22%
30%28%
18%35%
48%
30%
40%
5%7% 4%
5%
22%5% 10%
4% 7% 5% 4%
0%
25%
50%
75%
100%
Less than2,000
2,000 to24,999
25,000 ormore
WesternSlope /
Mountains
FrontRange
EasternPlains
Total Municipal Population Region
Never: do not expect tocompletely recover
Within 5 years from now
Within 2 years from now
Within 12 months from now
Now: fully recovered or notnegatively impacted
Colorado Municipal League
| 30 |
Exhibit 17: Table and Graph
Q20: Did you postpone utility late fees or shutoffs?
Postponed utility late fees or shutoffs
Total
Municipal Population Region
Less
than
2,000
2,000 to
24,999
25,000
or
more
Western
Slope /
Mountains
Front
Range
Eastern
Plains
Base 167 83 60 24 61 69 37
Q20
Yes 80% 80% 83% 75% 82% 74% 89%
No 7% 8% 5% 8% 5% 7% 11%
Not applicable: we do not provide utilities 13% 12% 12% 17% 13% 19% -
80% 80% 83%75%
82%74%
89%
7% 8% 5%8%
5%
7%
11%13% 12% 12% 17% 13%19%
0%
25%
50%
75%
100%
Less than2,000
2,000 to24,999
25,000 ormore
WesternSlope /
Mountains
Front Range EasternPlains
Total Municipal Population Region
Not applicable
No
Yes

Colorado Municipal League
| 31 |
Exhibit 18: Table and Graph
Q21: How did postponing utility late fees or shutoffs fiscally impact your utility?
Postponing utility late fees or shutoffs fiscal impact on utility
Total
Municipal Population Region
Less
than
2,000
2,000 to
24,999
25,000
or
more
Western
Slope /
Mountains
Front
Range
Eastern
Plains
Base 130 66 48 16 49 48 33
Q21
It caused an extremely negative fiscal impact 2% 3% - - 2% 2% -
It caused a moderately negative fiscal impact 14% 18% 6% 19% 12% 15% 15%
It caused a slightly negative fiscal impact 55% 52% 63% 50% 49% 56% 64%
It caused no negative fiscal impact 29% 27% 31% 31% 37% 27% 21%
No negative fiscal impact
29%
Slightly negative55%
Moderately negative
14%
Extremely negative
2%
Colorado Municipal League
| 32 |
Exhibit 19: Tables and Graph
Q22: Did your municipality offer direct financial assistance to local businesses?
[If Q22 = “Yes”] Q23: Do you anticipate the direct financial assistance will become part of the long-term
policies of your municipality?
Offered direct financial assistance to local businesses
Total
Municipal Population Region
Less
than
2,000
2,000 to
24,999
25,000
or
more
Western
Slope /
Mountains
Front
Range
Eastern
Plains
Base 164 81 59 24 59 69 36
Q22
Yes 48% 20% 69% 92% 56% 64% 6%
No 52% 80% 31% 8% 44% 36% 94%
Anticipate direct financial assistance will become long-term policy
Total
Municipal Population Region
Less
than
2,000
2,000 to
24,999
25,000
or
more
Western
Slope /
Mountains
Front
Range
Eastern
Plains
Base 78 16 41 21 33 43 2
Q23
Yes 9% 6% 10% 10% 12% 7% 0%
No 91% 94% 90% 90% 88% 93% 100%
48%
20%
69%
92%
56%
64%
6%
44%
19%
62%
83%
49%60%
6%
4%
7%
9%
7%
4%
0%
25%
50%
75%
100%
Less than2,000
2,000 to24,999
25,000 ormore
WesternSlope /
Mountains
FrontRange
EasternPlains
Total Municipal Population Region
Total: offered directfinancial assistance
Assistance to becomelong term
Assistance is temprorary

Colorado Municipal League
| 33 |
S E C T I O N 3 : GENERAL MUNICIPAL REVENUE
Exhibit 20: Table and Graph
Q25: Do you feel the overall economy in your municipality is better or worse in FY 2020 compared to FY
2019?
Overall economic health compared to FY 2019
Total
Municipal Population Region
Less
than
2,000
2,000 to
24,999
25,000
or
more
Western
Slope /
Mountains
Front
Range
Eastern
Plains
Base 163 82 58 23 60 67 36
Q25
Much better 3% 1% 5% 4% 3% 3% 3%
Somewhat better 13% 10% 22% 4% 17% 7% 19%
About the same 30% 38% 28% 9% 30% 24% 42%
Somewhat worse 42% 43% 36% 52% 42% 48% 31%
Much worse 9% 5% 9% 26% 8% 15% -
Don't know 2% 4% - 4% - 3% 6%
5%
13%10%
22%
4%
17%7%
19%
30% 38%
28%
9%
30%
24%
42%
42%43%
36%
52%
42%
48%
31%
9% 5% 9%
26%
8%
15%
4% 6%
0%
25%
50%
75%
100%
Less than2,000
2,000 to24,999
25,000 ormore
WesternSlope /
Mountains
Front Range EasternPlains
Total Municipal Population Region
Don't know
Much worse
Somewhat worse
About the same
Somewhat better
Much better

Colorado Municipal League
| 34 |
Exhibit 21: Table and Graph
Q26: Do you feel your municipality’s revenue is better or worse in FY 2020 compared to FY 2019?
Economic revenue compared to FY 2019
Total
Municipal Population Region
Less
than
2,000
2,000 to
24,999
25,000
or
more
Western
Slope /
Mountains
Front
Range
Eastern
Plains
Base 164 83 58 23 61 66 37
Q26
Much better 6% 4% 10% 4% 7% 5% 8%
Somewhat better 21% 16% 34% 4% 26% 17% 19%
About the same 26% 35% 16% 17% 25% 17% 43%
Somewhat worse 34% 36% 28% 43% 31% 41% 27%
Much worse 12% 7% 12% 26% 11% 18% -
Don't know 2% 2% - 4% - 3% 3%
6% 4%10%
4% 7% 5% 8%
21%16%
34%
4%
26%17%
19%
26% 35%
16%
17%
25%
17%
43%
34%36% 28%
43%
31%
41%
27%
12% 7% 12%
26%
11%18%
4%
0%
25%
50%
75%
100%
Less than2,000
2,000 to24,999
25,000 ormore
WesternSlope /
Mountains
Front Range EasternPlains
Total Municipal Population Region
Don't know
Much worse
Somewhat worse
About the same
Somewhat better
Much better
Colorado Municipal League
| 35 |
Exhibit 22: Table
Q27a: For each of the following revenue categories, please indicate whether you expect an increase,
decrease, or no change for that source of revenue in 2020.
Revenue Changes by Source
Total
Municipal Population Region
Less
than
2,000
2,000 to
24,999
25,000
or
more
Western
Slope /
Mountains
Front
Range
Eastern
Plains
Average Base* 156 76 57 23 58 64 34
Sales and use taxes:
Increase 38% 28% 56% 26% 44% 34% 34%
Decrease 42% 38% 37% 65% 38% 58% 17%
No Change 20% 34% 7% 9% 18% 8% 49%
Property taxes
Increase 28% 24% 28% 43% 25% 34% 24%
Decrease 13% 13% 19% - 13% 17% 6%
No Change 58% 63% 53% 57% 62% 49% 71%
State funding
Increase 8% 9% 9% 4% 14% 8% -
Decrease 47% 45% 47% 57% 47% 51% 41%
No Change 45% 46% 45% 39% 40% 42% 59%
Other taxes
Increase 5% 4% 7% 4% 7% 6% -
Decrease 43% 30% 48% 70% 45% 52% 19%
No Change 52% 66% 45% 26% 48% 42% 81%
Charges for services
Increase 7% 10% 5% - 8% 6% 6%
Decrease 40% 27% 46% 70% 36% 57% 14%
No Change 53% 63% 49% 30% 56% 37% 80%
Licenses, permits, and fees
Increase 16% 11% 22% 17% 15% 20% 11%
Decrease 37% 32% 34% 61% 33% 48% 23%
No Change 47% 57% 43% 22% 52% 32% 66%
Fines and forfeits
Increase 6% 8% 2% 9% 5% 5% 9%
Decrease 51% 39% 64% 61% 50% 66% 26%
No Change 43% 53% 34% 30% 45% 29% 66%
Investment and interest income
Increase 4% 3% 4% 9% 5% 5% -
Decrease 46% 40% 47% 65% 45% 60% 24%
No Change 50% 57% 49% 26% 50% 35% 76%
Other revenue
Increase 5% - 4% 23% 5% 9% -
Decrease 23% 15% 26% 36% 27% 26% 10%
No Change 72% 85% 70% 41% 68% 66% 90%
* The number of responses varied for each item above; the average base row shows the average of all
base number of responses by column. Slightly fewer than all respondents answered each question,
except for “Other Revenue,” which was answered by 133 respondents.

Colorado Municipal League
| 36 |
Exhibit 22: Graph
Q27a: For each of the following revenue categories, please indicate whether you expect an increase,
decrease, or no change for that source of revenue in 2020.
13%
23%
37%
40%
42%
43%
46%
47%
51%
28%
5%
16%
7%
38%
8%
6%
58%
72%
47%
53%
20%
52%
50%
45%
43%
0% 25% 50% 75% 100%
Property taxes
Other revenue
Licenses, permits, and fees
Charges for services
Sales and use taxes
Other taxes
Investment and interest income
State funding
Fines and forfeits
Decrease Increase No Change
Colorado Municipal League
| 37 |
Exhibit 23: Tables
Q27 b & c: For each of the following revenue categories, please indicate the estimated percent change from
2019.
Average Percent Increases in Revenue
Number
of
Replies
Overall
(Avg.
%)
Municipal Population Region
Less
than
2,000
2,000
to
24,999
25,000
or
more
Western
Slope /
Mountains
Front
Range
Eastern
Plains
Sales and use taxes: Include all municipal
sales/use tax revenues and all shared
revenues.
48 +16% +19% +16% +4% +18% +11% +19%
Property taxes: Include general, capital
expenditure, bond redemption and special
fund property tax revenues.
30 +17% +20% +14% +15% +5% +29% +6%
State funding 6 +9% +7% +10% - +13% +4% -
Other taxes 6 +28% +18% +43% +3% +45% +11% -
Charges for services 4 +11% +13% +5% - +10% +12% -
Licenses, permits, and fees 18 +19% +18% +19% +22% +7% +20% +50%
Fines and forfeits 6 +9% +10% - +8% +5% +8% +15%
Investment and interest income 3 +10% +4% +15% +10% +10% +10% -
Average Percent Decreases in Revenue
Number
of
Replies
Overall
(Avg.
%)
Municipal Population Region
Less
than
2,000
2,000
to
24,999
25,000
or
more
Western
Slope /
Mountains
Front
Range
Eastern
Plains
Sales and use taxes: Include all municipal
sales/use tax revenues and all shared
revenues.
48 -17% -22% -16% -8% -23% -14% -14%
Property taxes: Include general, capital
expenditure, bond redemption and special
fund property tax revenues.
12 -12% -8% -14% - -7% -15% -5%
State funding 46 -22% -33% -17% -6% -32% -13% -23%
Other taxes 37 -16% -13% -16% -18% -15% -17% -5%
Charges for services 41 -28% -21% -32% -30% -29% -29% -13%
Licenses, permits, and fees 39 -17% -20% -18% -11% -21% -15% -7%
Fines and forfeits 58 -26% -24% -29% -21% -30% -22% -30%
Investment and interest income 50 -34% -37% -26% -44% -35% -36% -24%

Colorado Municipal League
| 38 |
Exhibit 24: Table (1 of 2)
Q28: Taking into account both the magnitude of the following issues and the ease or difficulty of addressing
them, please rate the following potential fiscal challenges that your municipality may face in 2021.
Potential Fiscal Challenges for 2021 Major
Challenge
Moderate
Challenge
Minor
Challenge
Not a
Challenge
Not
Applicable
Unfunded street/road maintenance and improvement needs 35% 24% 19% 18% 4%
Lack of affordable housing 34% 23% 19% 9% 15%
Unfunded water/wastewater improvement needs 28% 21% 19% 16% 16%
Tight labor market 22% 31% 20% 15% 13%
Passing ballot initiatives to increase municipal funding 22% 23% 7% 12% 37%
Decrease in tax revenue 18% 25% 25% 23% 9%
State mandated expenditures 17% 25% 33% 18% 7%
Decline in state funding 16% 31% 25% 18% 10%
Adverse local economic conditions 16% 29% 36% 16% 5%
Slow growth in tax revenues 14% 29% 23% 24% 11%
Public safety 13% 34% 28% 20% 5%
Increased health insurance costs 11% 32% 28% 17% 13%
Federal mandated expenditures (environmental
requirements, ADA compliance, etc.) 11% 23% 33% 24% 10%
TABOR 11% 19% 15% 29% 25%
Increased demand for municipal services 10% 31% 35% 18% 6%
Increased liability insurance costs 9% 23% 38% 23% 6%
Decline in federal funding 8% 17% 35% 23% 17%
Increased workers' compensation insurance costs 6% 26% 38% 24% 6%
Inflation 5% 19% 47% 23% 5%
Pension contribution 3% 9% 28% 33% 27%
Colorado Municipal League
| 39 |
Exhibit 24: Graph (1 of 2)
Q28: Taking into account both the magnitude of the following issues and the ease or difficulty of addressing
them, please rate the following potential fiscal challenges that your municipality may face in 2021.
3%
5%
6%
8%
9%
10%
11%
11%
11%
13%
14%
16%
16%
17%
18%
22%
22%
28%
34%
35%
9%
19%
26%
17%
23%
31%
19%
23%
32%
34%
29%
29%
31%
25%
25%
23%
31%
21%
23%
24%
28%
47%
38%
35%
38%
35%
15%
33%
28%
28%
23%
36%
25%
33%
25%
7%
20%
19%
19%
19%
33%
23%
24%
23%
23%
18%
29%
24%
17%
20%
24%
16%
18%
18%
23%
12%
15%
16%
9%
18%
27%
5%
6%
17%
6%
6%
25%
10%
13%
5%
11%
5%
10%
7%
9%
37%
13%
16%
15%
4%
0% 25% 50% 75% 100%
Pension contribution
Inflation
Increased workers' compensation insurance costs
Decline in federal funding
Increased liability insurance costs
Increased demand for municipal services
TABOR
Federal mandated expenditures
Increased health insurance costs
Public safety
Slow growth in tax revenues
Adverse local economic conditions
Decline in state funding
State mandated expenditures
Decrease in tax revenue
Passing ballot initiatives to increase municipal funding
Tight labor market
Unfunded water/wastewater improvement needs
Lack of affordable housing
Unfunded street/road maintenance and improvementneeds
Major Challenge Moderate Challenge Minor Challenge Not a Challenge Not Applicable

Colorado Municipal League
| 40 |
Exhibit 24: Table (2 of 2)
Q28: Taking into account both the magnitude of the following issues and the ease or difficulty of addressing
them, please rate the following potential fiscal challenges that your municipality may face in 2021.
Average* Potential Fiscal Challenges for 2021
Total
Municipal Population Region
Less
than
2,000
2,000 to
24,999
25,000
or
more
Western
Slope /
Mountains
Front
Range
Eastern
Plains
Lack of affordable housing 3.0 2.9 3.0 3.0 3.3 2.9 2.4
Passing ballot initiatives to increase municipal
funding 2.9 2.7 2.9 3.2 2.8 3.0 2.8
Unfunded street/road maintenance and
improvement needs 2.8 2.8 2.7 2.9 3.0 2.7 2.6
Unfunded water/wastewater improvements 2.7 3.0 2.6 2.3 2.9 2.5 2.9
Tight labor market 2.7 2.7 2.7 2.5 2.9 2.4 2.8
Decline in state funding 2.5 2.6 2.5 2.4 2.7 2.3 2.6
Adverse local economic conditions 2.5 2.3 2.6 2.8 2.6 2.6 2.1
State mandated expenditures 2.5 2.5 2.4 2.6 2.5 2.5 2.4
Increased health insurance costs 2.4 2.6 2.4 2.3 2.6 2.3 2.4
Decrease in tax revenue 2.4 2.4 2.3 2.8 2.4 2.6 2.0
Public safety 2.4 2.2 2.5 2.9 2.4 2.6 2.2
Slow growth in tax revenues 2.4 2.2 2.3 3.0 2.3 2.6 2.1
Increased demand for municipal services 2.4 2.2 2.5 2.6 2.6 2.3 2.0
Federal mandated expenditures 2.2 2.3 2.1 2.3 2.1 2.3 2.3
Increased liability insurance costs 2.2 2.2 2.1 2.4 2.2 2.3 2.0
TABOR 2.2 2.1 2.2 2.4 2.3 2.0 2.3
Increased workers' compensation insurance costs 2.2 2.2 2.1 2.1 2.2 2.1 2.2
Decline in federal funding 2.1 2.2 2.1 2.0 2.3 1.9 2.5
Inflation 2.1 2.0 2.1 2.1 2.1 2.0 2.1
Pension contribution 1.7 1.6 1.8 1.9 1.7 1.8 1.6
* Average scores were calculated by assigning numeric values to each response category: “Not A Challenge” = 1,
“Minor Challenge” = 2, “Moderate Challenge” = 3, and “Major Challenge” = 4.
Colorado Municipal League
| 41 |
Exhibit 24: Graph (2 of 2)
Q28: Taking into account both the magnitude of the following issues and the ease or difficulty of addressing
them, please rate the following potential fiscal challenges that your municipality may face in 2021.
* Average scores were calculated by assigning numeric values to each response category: “Not A Challenge” = 1,
“Minor Challenge” = 2, “Moderate Challenge” = 3, and “Major Challenge” = 4.
1.7
2.1
2.1
2.2
2.2
2.2
2.2
2.4
2.4
2.4
2.4
2.4
2.5
2.5
2.5
2.7
2.7
2.8
2.9
3.0
0.0 1.0 2.0 3.0 4.0
Pension contribution
Inflation
Decline in federal funding
Increased workers' compensation insurance costs
TABOR
Increased liability insurance costs
Federal mandated expenditures
Increased demand for municipal services
Slow growth in tax revenues
Decrease in tax revenue
Public safety
Increased health insurance costs
State mandated expenditures
Adverse local economic conditions
Decline in state funding
Tight labor market
Unfunded water/wastewater improvements
Unfunded street/road maintenance and…
Passing ballot initiatives to increase municipal funding
Lack of affordable housing
Not a Challenge Major Challenge
Average Scores*

STATE OF OUT CITIES AND TOWNS
2020