Embed Size (px)
Citation preview

Santa Monica-MalibuUnified School District
STATE OF OUR SCHOOLSSTATE OF OUR SCHOOLS
2009-2010
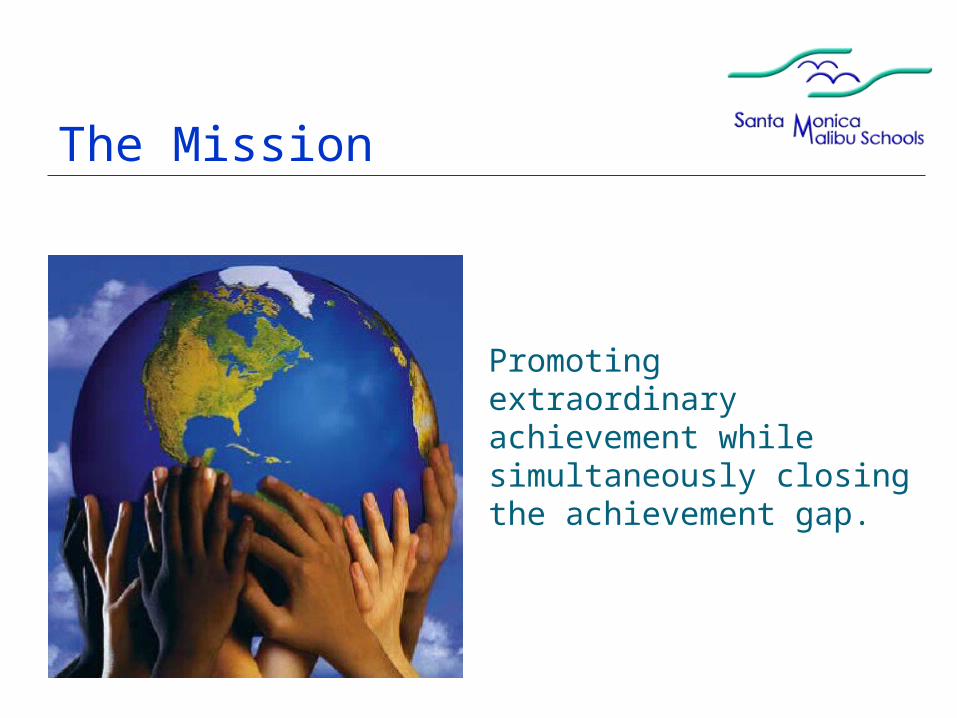
The Mission
Promoting extraordinary achievement while simultaneously closing the achievement gap.
The Vision
As a community of learners, the Santa Monica-Malibu Unified School District works together in a nurturing environment to help students be visionary, versatile
thinkers; resourceful, life-long learners; effective, multilingual communicators and global citizens. We are a
rich, culturally diverse community that values the contributions of all its members and strives to promote social justice. We exist to assist all students in their
pursuit of academic achievement, strength of character, and personal growth, and to support them in their
exploration of the intellectual, artistic, technological, physical and social expression.
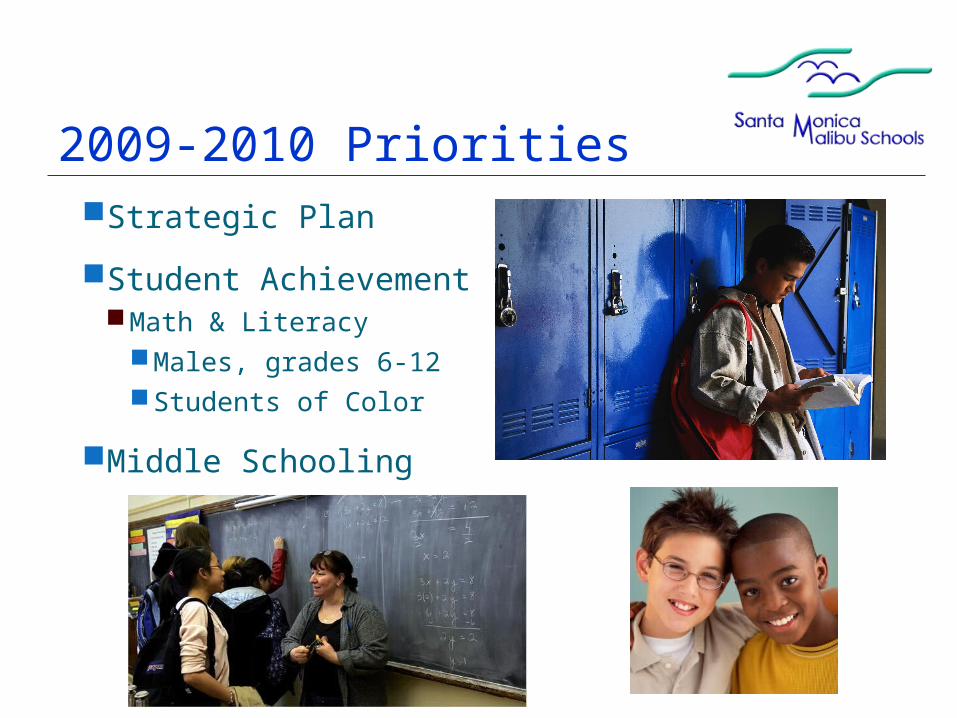
2009-2010 PrioritiesStrategic Plan
Student AchievementMath & Literacy
Males, grades 6-12Students of Color
Middle Schooling

Schools
Child Development Services
10 Elementary Schools
1 K-8 Alternative School
3 Middle Schools
2 High Schools
1 Continuation High School
Adult Education Programs
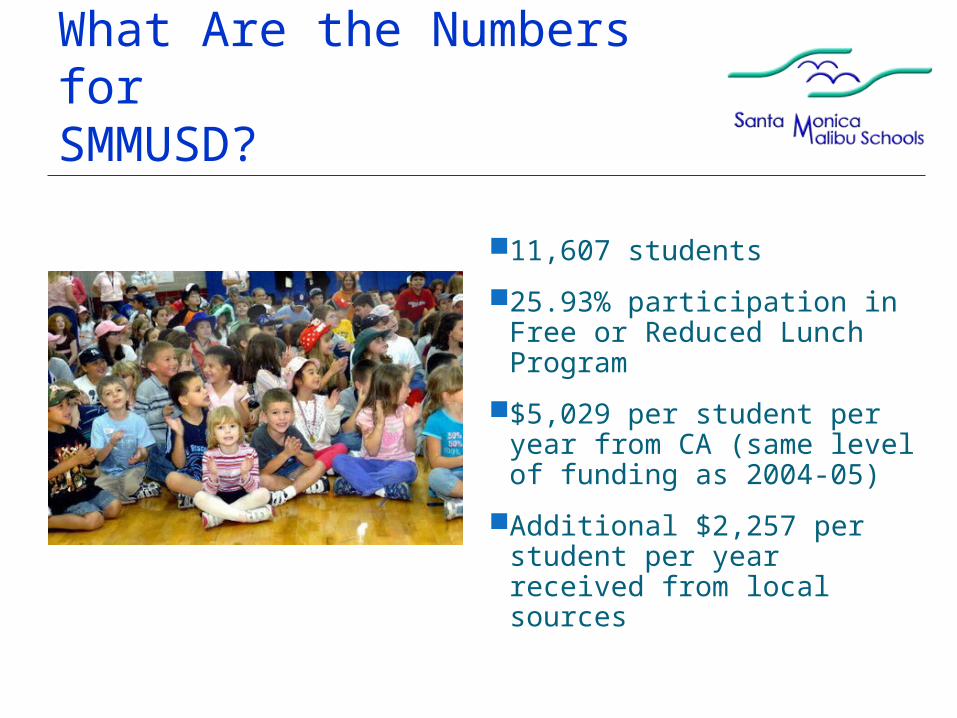
What Are the Numbers forSMMUSD?
11,607 students
25.93% participation in Free or Reduced Lunch Program
$5,029 per student per year from CA (same level of funding as 2004-05)
Additional $2,257 per student per year received from local sources

Demographics (SMMUSD)
Source: CBEDS 2008
4943
10
362
1182
302
2840
247
2702
3220
766
193
1481
39
3920
8265
1153
308
2125
61
0
500
1000
1500
2000
2500
3000
3500
4000
4500
5000
Elementary Middle Secondary
All
American Indian
Asian
Latino
African American
White
Multiple
Students (by ethnicity)Total in District: 11,565
0%
10%
20%
30%
40%
50%
60%
70%
80%
90%
100%
American Indian Asian Latino African American White
Teachers (by ethnicity)
16%
73%
5% 4%
Classified Staff (by ethnicity)
0%
10%
20%
30%
40%
50%
60%
70%
80%
90%
100%
American Indian Asian Latino African American White
5%
31%22%
39%

SMMUSD Student Achievement
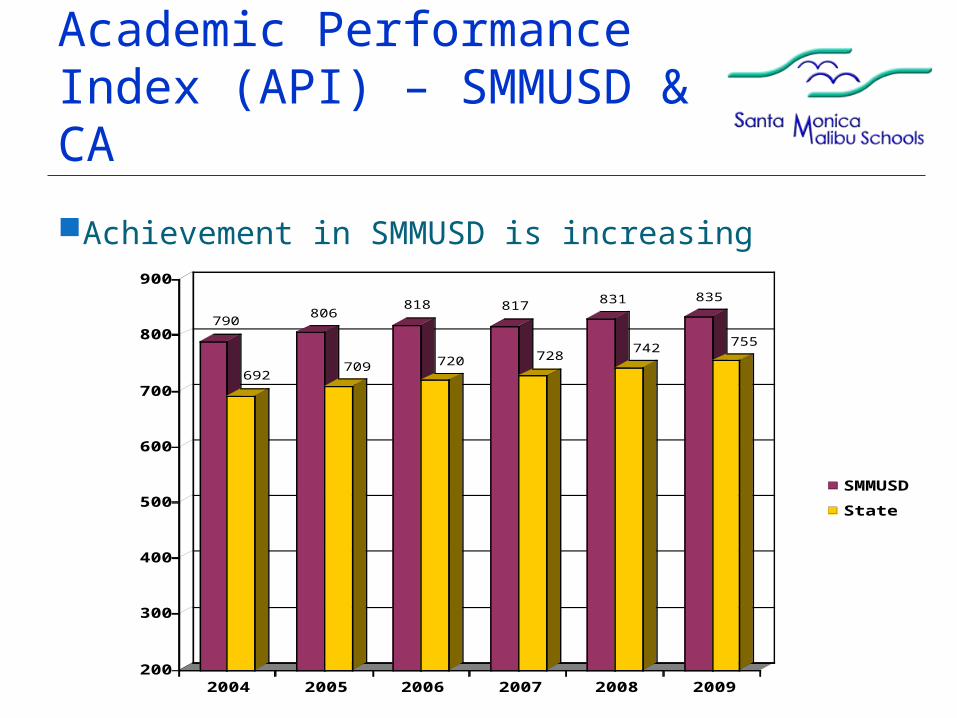
Academic Performance Index (API) – SMMUSD & CA
Achievement in SMMUSD is increasing
790
692
806
709
818
720
817
728
831
742
835
755
200
300
400
500
600
700
800
900
2004 2005 2006 2007 2008 2009
SMMUSD
State
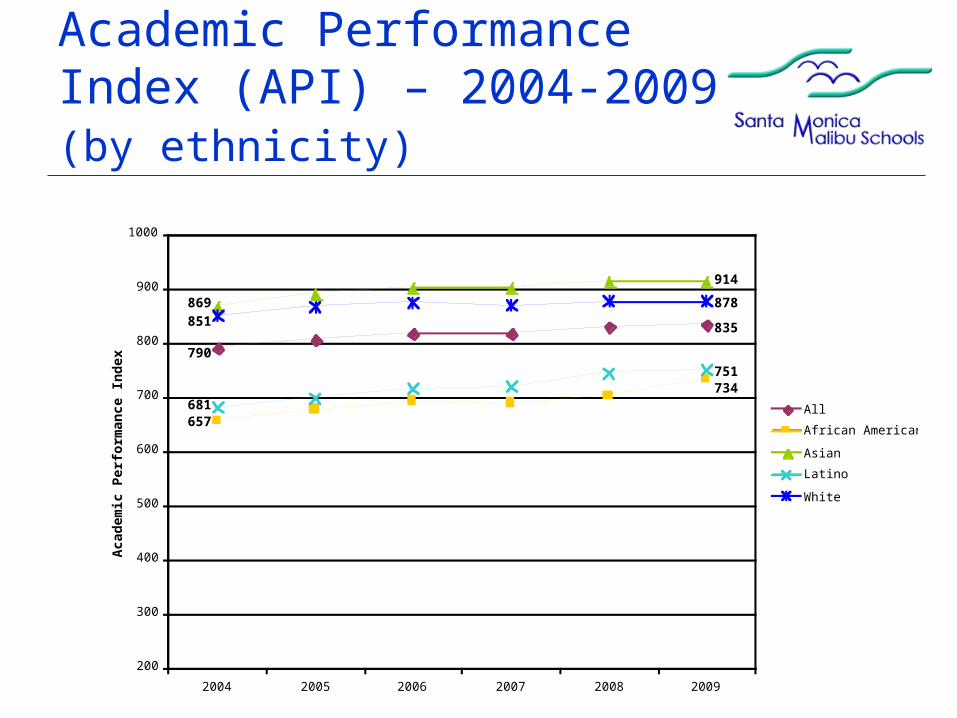
Academic Performance Index (API) – 2004-2009 (by ethnicity)
200
300
400
500
600
700
800
900
1000
2004 2005 2006 2007 2008 2009
All
African American
Asian
Latino
White
Aca
dem
ic P
erfo
rman
ce In
dex
869851
790
681657
914
878
835
751734
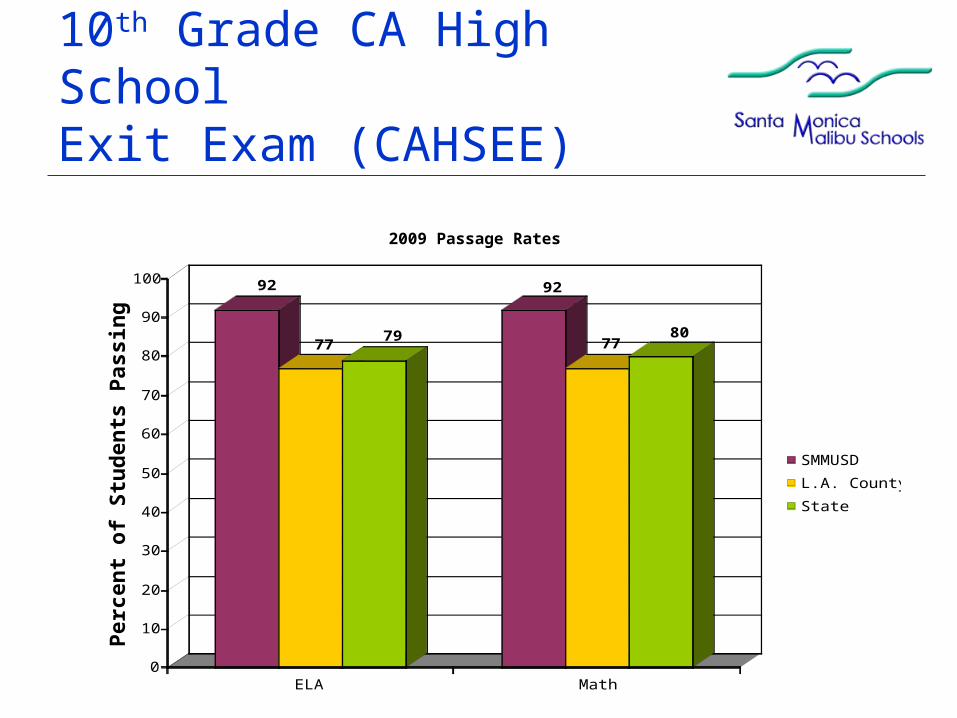
10th Grade CA High School Exit Exam (CAHSEE)
92
7779
92
7780
0
10
20
30
40
50
60
70
80
90
100
ELA Math
SMMUSD
L.A. County
State
2009 Passage Rates
Per
cen
t o
f S
tud
ents
Pas
sin
g

CAHSEE English Language Arts (ELA) – 2004-2009
9189 90 90 91 92
75 76 77 77 79 79
0
10
20
30
40
50
60
70
80
90
100
SMMUSD State
2004
2005
2006
2007
2008
2009
Per
cen
t o
f S
tud
ents
Pas
sin
g
SMMUSD 10th Grade CAHSEE ELA Passage Rates

CAHSEE (ELA)2004-2009 (by ethnicity)
0
10
20
30
40
50
60
70
80
90
100
2004 2005 2006 2007 2008 2009
All
African American
Asian
Latino
White
SMMUSD 10th Grade CAHSEE ELA Passage Ratesby Ethnicity
Per
cen
t o
f S
tud
ents
Pas
sin
g
999691
8280
97959286
74
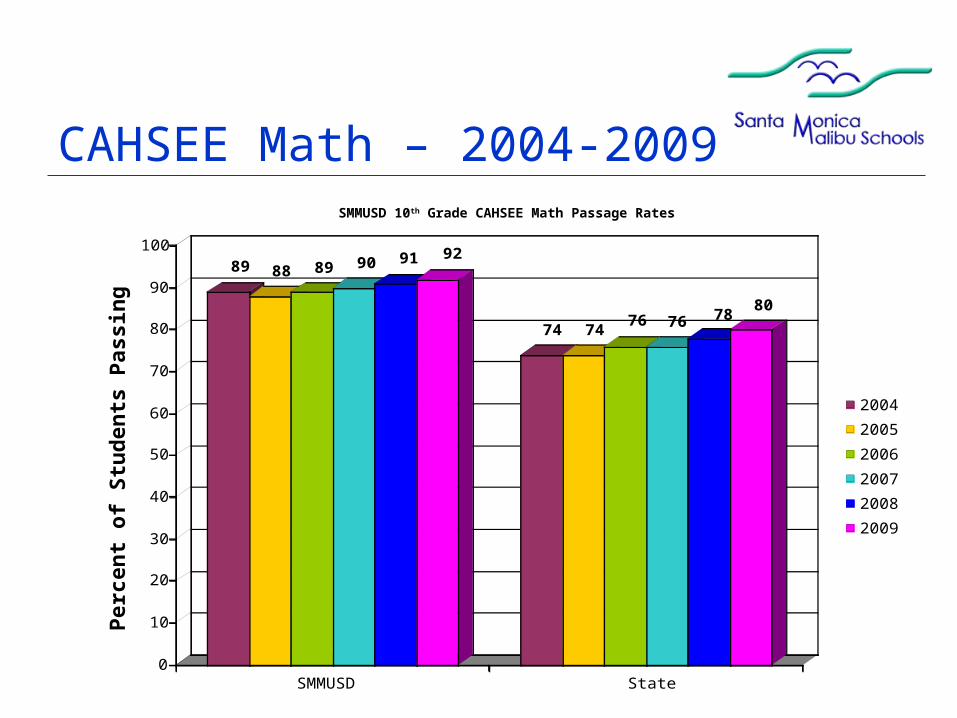
CAHSEE Math – 2004-2009
89 88 89 90 91 92
74 7476 76 78
80
0
10
20
30
40
50
60
70
80
90
100
SMMUSD State
2004
2005
2006
2007
2008
2009
Per
cen
t o
f S
tud
ents
Pas
sin
g
SMMUSD 10th Grade CAHSEE Math Passage Rates
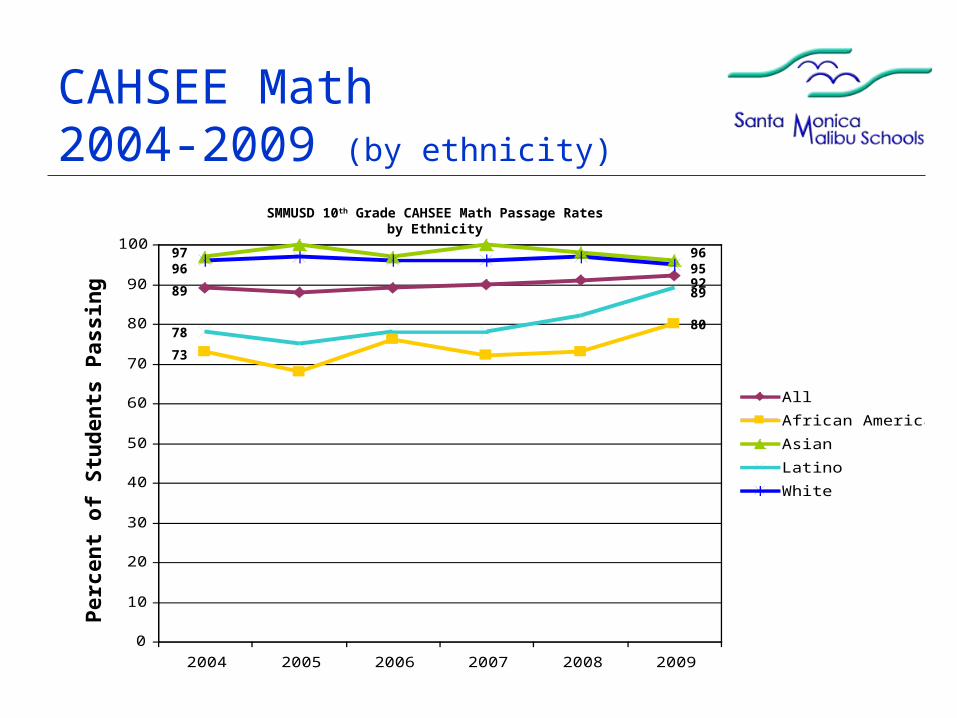
CAHSEE Math2004-2009 (by ethnicity)
0
10
20
30
40
50
60
70
80
90
100
2004 2005 2006 2007 2008 2009
All
African American
Asian
Latino
White
SMMUSD 10th Grade CAHSEE Math Passage Ratesby Ethnicity
Per
cen
t o
f S
tud
ents
Pas
sin
g
9796
89
78
73
96959289
80
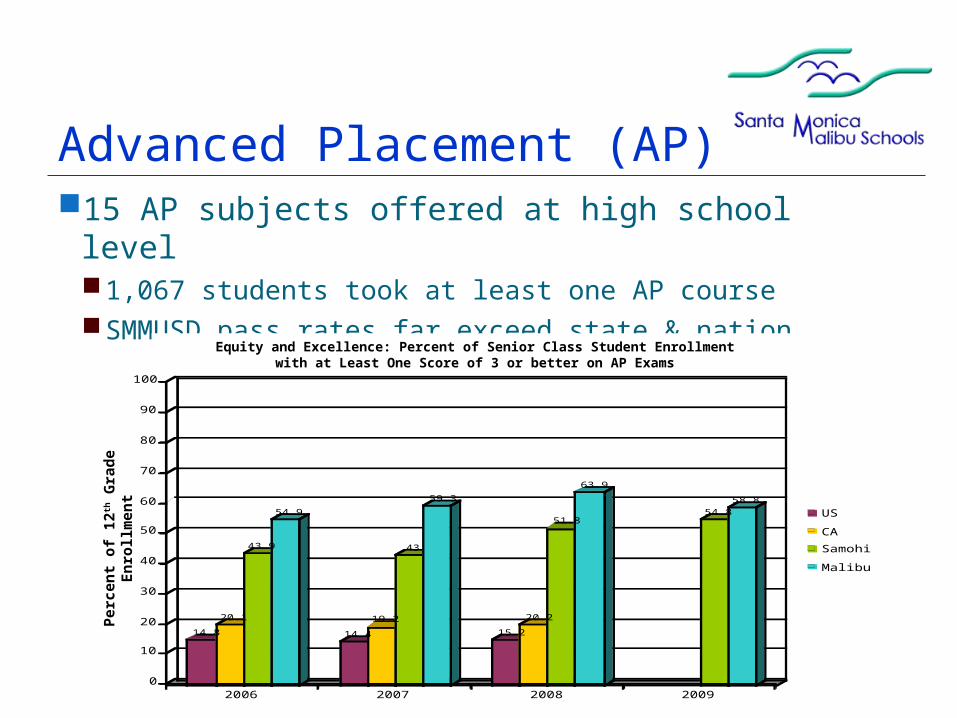
Advanced Placement (AP)15 AP subjects offered at high school level
1,067 students took at least one AP courseSMMUSD pass rates far exceed state & nation
14.8
20.1
43.9
54.9
14.4
19.2
43
59.3
15.2
20.2
51.8
63.9
54.8
58.8
0
10
20
30
40
50
60
70
80
90
100
2006 2007 2008 2009
US
CA
Samohi
Malibu
Per
cen
t o
f 12
th G
rad
e E
nro
llm
ent
Equity and Excellence: Percent of Senior Class Student Enrollmentwith at Least One Score of 3 or better on AP Exams
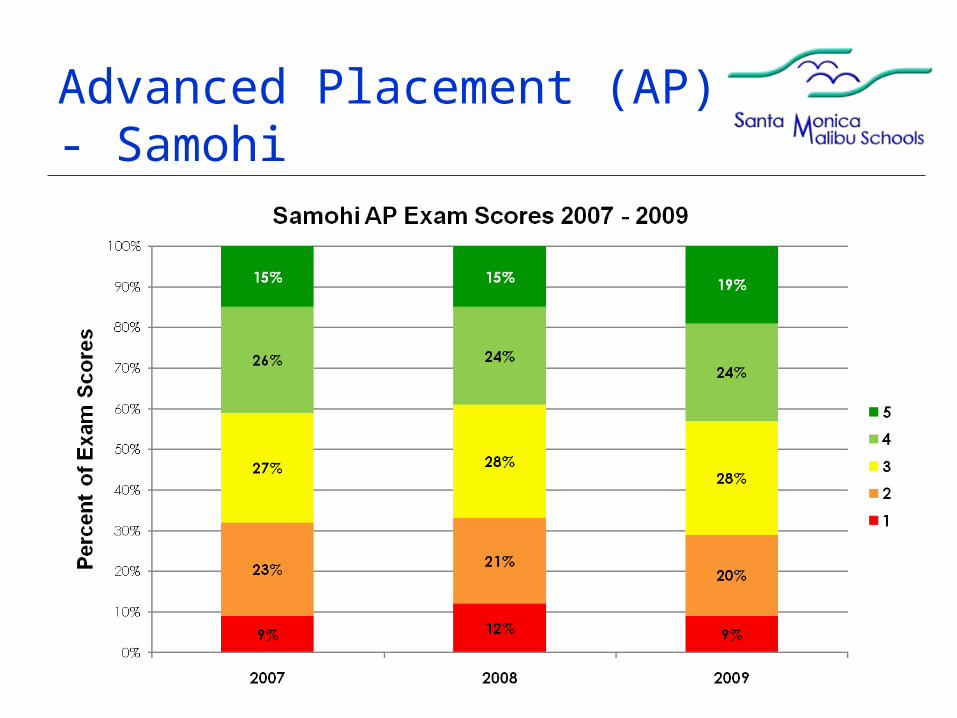
Advanced Placement (AP) - Samohi
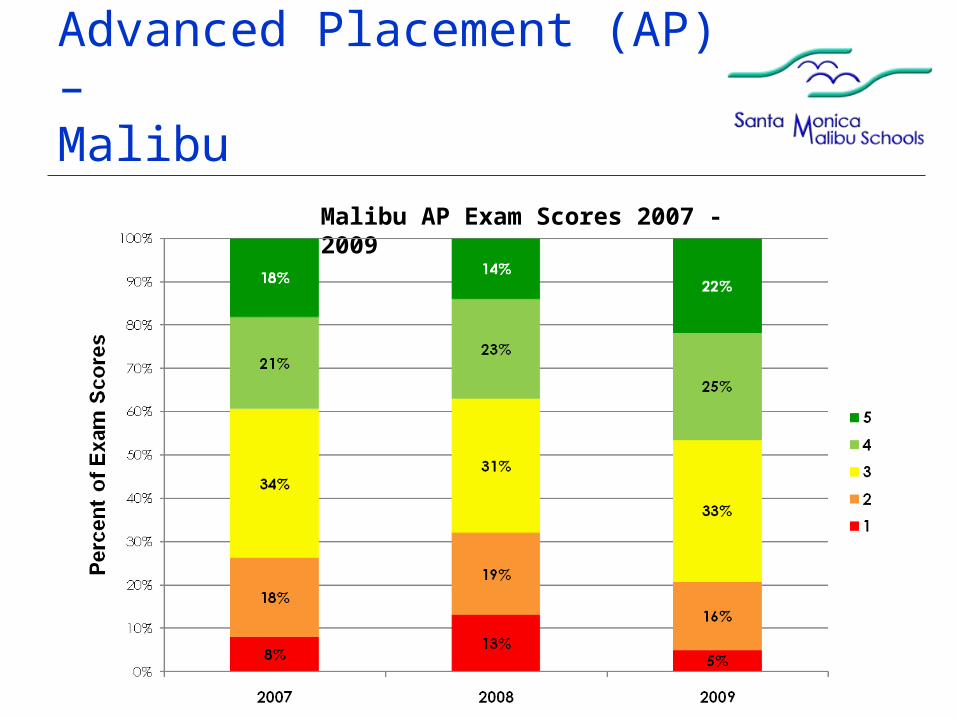
Advanced Placement (AP) – Malibu
Malibu AP Exam Scores 2007 - 2009
Samohi AP Scholars
AP Scholars146 students passed 3 AP exams
Scholars with Honors55 students passed 4 AP exams with an average score of 3.25 or
higher
Scholars with Distinction75 students passed 5 AP exams with an average score of 3.5 or
higher
National Scholars6 students scored 4 or 5 on 8 AP exams

Malibu HS AP Scholars
AP Scholars28 students passed 3 AP exams
Scholars with Honors14 students passed 4 AP exams with an average score of 3.25 or
higher
Scholars with Distinction29 students passed 5 AP exams with an average score of 3.5 or
higher
National Scholars1 student scored 4 or 5 on 8 AP exams
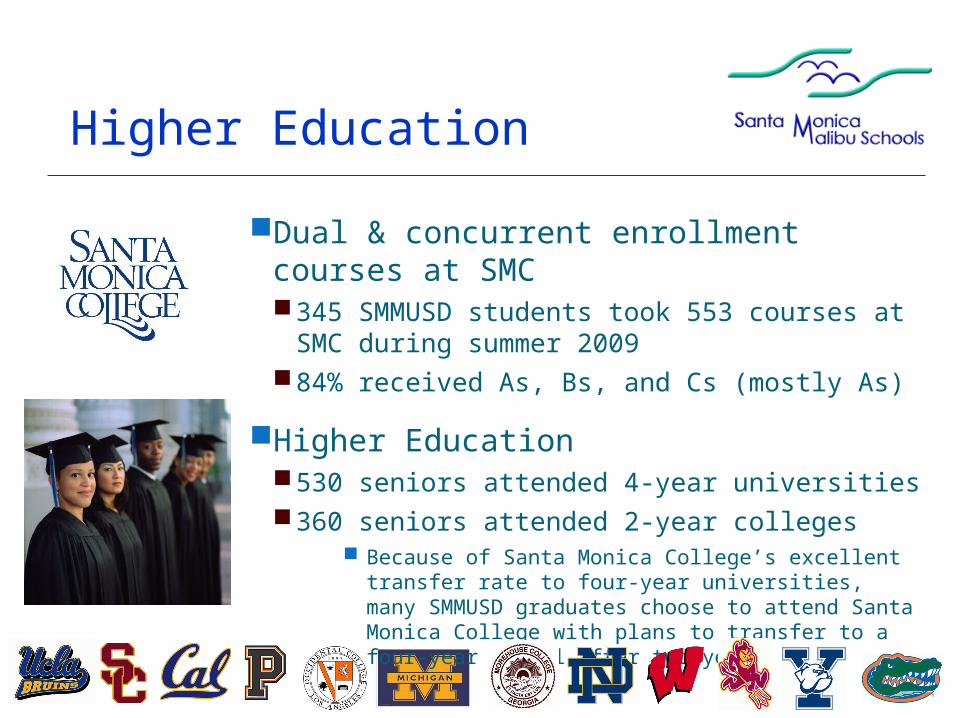
Higher Education
Dual & concurrent enrollment courses at SMC 345 SMMUSD students took 553 courses at SMC
during summer 200984% received As, Bs, and Cs (mostly As)
Higher Education530 seniors attended 4-year universities360 seniors attended 2-year colleges
Because of Santa Monica College’s excellent transfer rate to four‐year universities, many SMMUSD graduates choose to attend Santa Monica College with plans to transfer to a four‐year school after two years.
Facilities
Thank you, Santa Monica and Malibu for your support of the district’s faculties modernization program!

Facilities Improvements – Measure BBComplete
Model Technology Classrooms (complete at secondary school sites; in progress at elementary school sites)
Districtwide infrastructure upgrades for high speed Internet/Wireless access network
Demolition of modular structures & site clearing/grading at Olympic HS
In Progress New parking lot, lighting, & landscaping at John Adams Middle School Communication upgrade – Voice Over Internet Protocol Interior modernization of classrooms & admin offices at Washington West/CDS
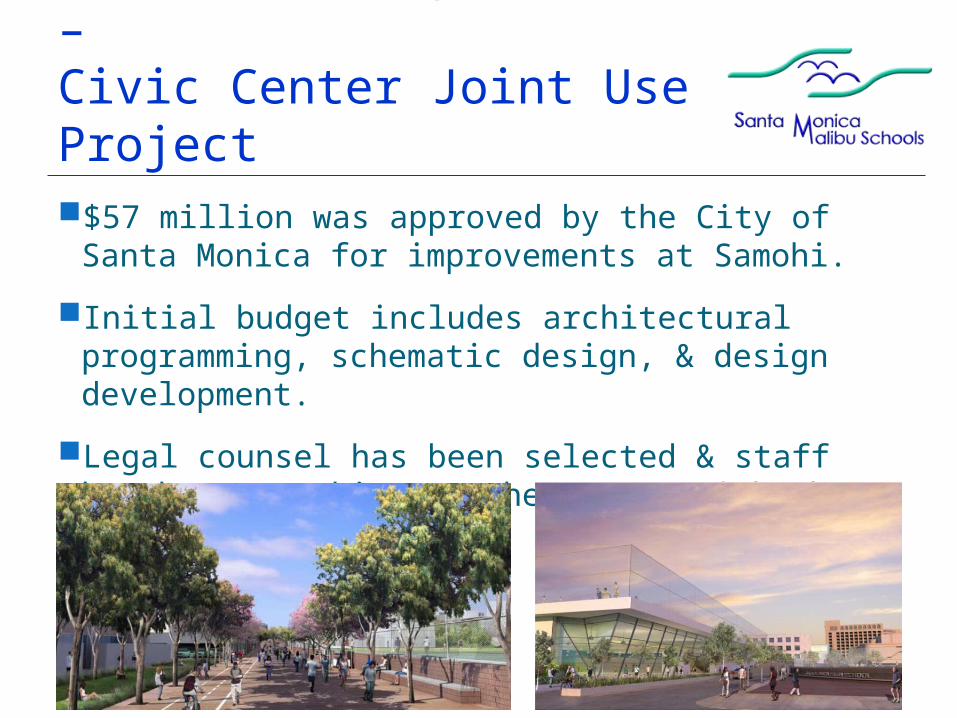
Facilities Improvements –Civic Center Joint Use Project$57 million was approved by the City of Santa Monica for
improvements at Samohi.
Initial budget includes architectural programming, schematic design, & design development.
Legal counsel has been selected & staff has begun working on the M.O.U. with the city.
School Funding

Expenditures per Pupil –CA vs. U.S. Average
$8,486
$7,935$7,745$7,580
$7,055$7,018
$6,333
$5,666$5,580$5,191
$9,100$8,717
$8,340$8,065
$7,532$7,296
$6,824$6,455
$6,174$5,949
$0
$1,000
$2,000
$3,000
$4,000
$5,000
$6,000
$7,000
$8,000
$9,000
$10,000
1996-97
1997-98
1998-99
1999-00
2000-01
2001-02
2002-03
2003-04
2004-05
2005-06
CA
US
Source: National Education Association, Rankings and Estimates 2006-07
CA % of U.S. Avg. 87% 90% 88% 93% 96% 94% 94% 93% 91% 93%
CA Rank Among the States
36 31 36 27 24 31 26 27 30 29
2008-09:US: $10,850CA: $9,921

California’s EducationFunding Crisis
Per-pupil spending in California’s schools has dropped nearly every year since the passage of Proposition 13 in 1978, and is currently well below the national average.
California’s K-12 Public Schools Per Pupil Spending Relative to the National Average, 1969-1970 to 1999-2000

California’s SchoolFinance System
Local Prop. 98
Property Taxes, 19.5%
Local Non-Prop. 98
Property Taxes, 3.5%
Federal Government, 9.5%
Local Misc.
Revenues, 7.6%
State Non-Prop. 98
Funds, 6.5%
Lottery, 1.3%
Total State Funds, 58.7%
2008-09 Revenue for K-12 Education
Source: EdSource January 2009 Report onCalifornia’s School Finance System
Total Prop. 98 Funds,
71.7%
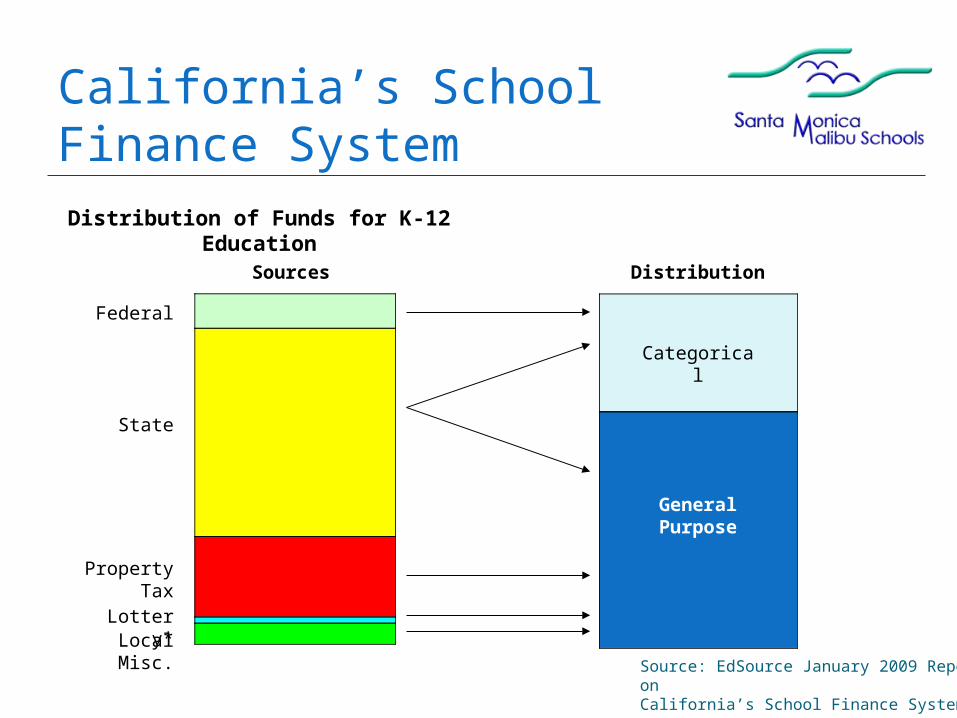
California’s SchoolFinance SystemDistribution of Funds for K-12 Education
Federal
State
Property Tax
Lottery*Local Misc.
Categorical
General Purpose
Source: EdSource January 2009 Report onCalifornia’s School Finance System
Sources Distribution

SMMUSD 7-Year Funded Revenue Limits
$4,841.98
$4,999.35
$5,272.39
$5,627.84
$5,879.84
$5,721.82
$5,029.47
$4,500.00
$4,700.00
$4,900.00
$5,100.00
$5,300.00
$5,500.00
$5,700.00
$5,900.00
$6,100.00
2003-04Actual
2004-05Actual
2005-06Actual
2006-07Actual
2007-08Actual
2008-09Actual
2009-10Projected

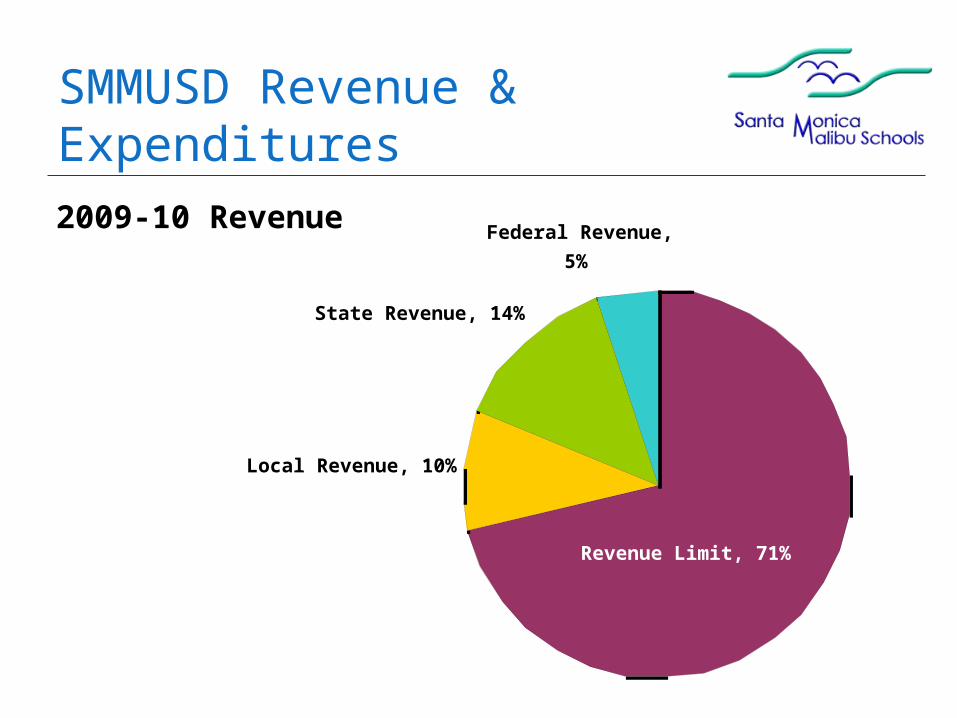
SMMUSD Revenue & Expenditures
Local Revenue, 10%
State Revenue, 14%
Federal Revenue,
5%
Revenue Limit, 71%
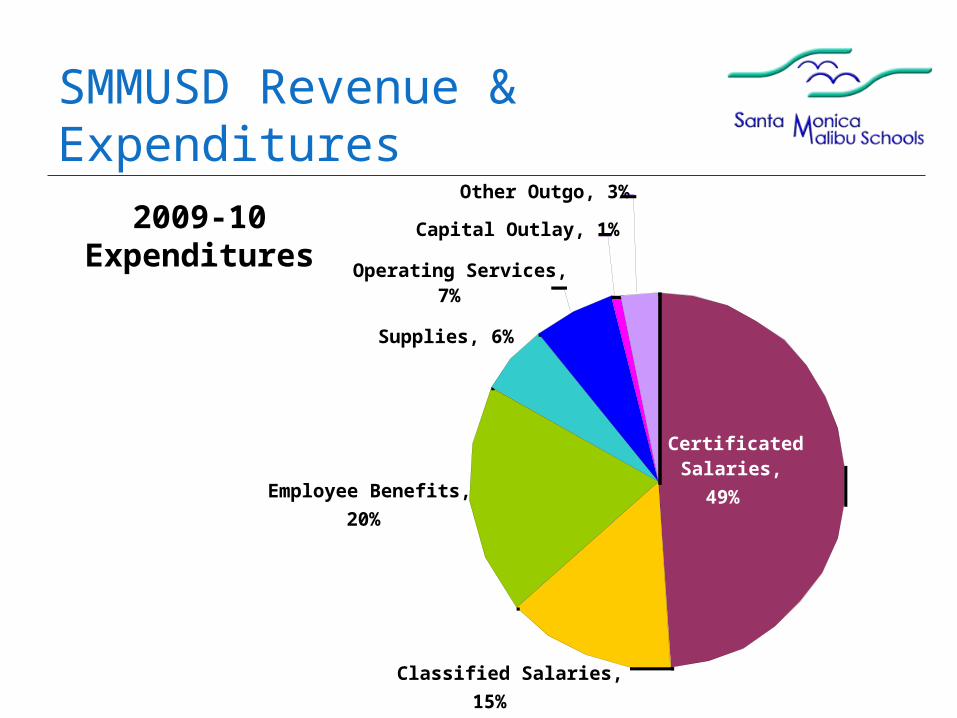
Classified Salaries,
15%
Employee Benefits,
20%
Supplies, 6%
Operating Services, 7%
Capital Outlay, 1%
Other Outgo, 3%
Certificated Salaries,
49%
2009-10 Revenue 2009-10 Expenditures
SMMUSD Revenue & Expenditures
Local Revenue, 10%
State Revenue, 14%
Federal Revenue,
5%
Revenue Limit, 71%
2009-10 Revenue
SMMUSD Revenue & Expenditures
2009-10 Expenditures
Classified Salaries,
15%
Employee Benefits,
20%
Supplies, 6%
Operating Services, 7%
Capital Outlay, 1%
Other Outgo, 3%
Certificated Salaries,
49%
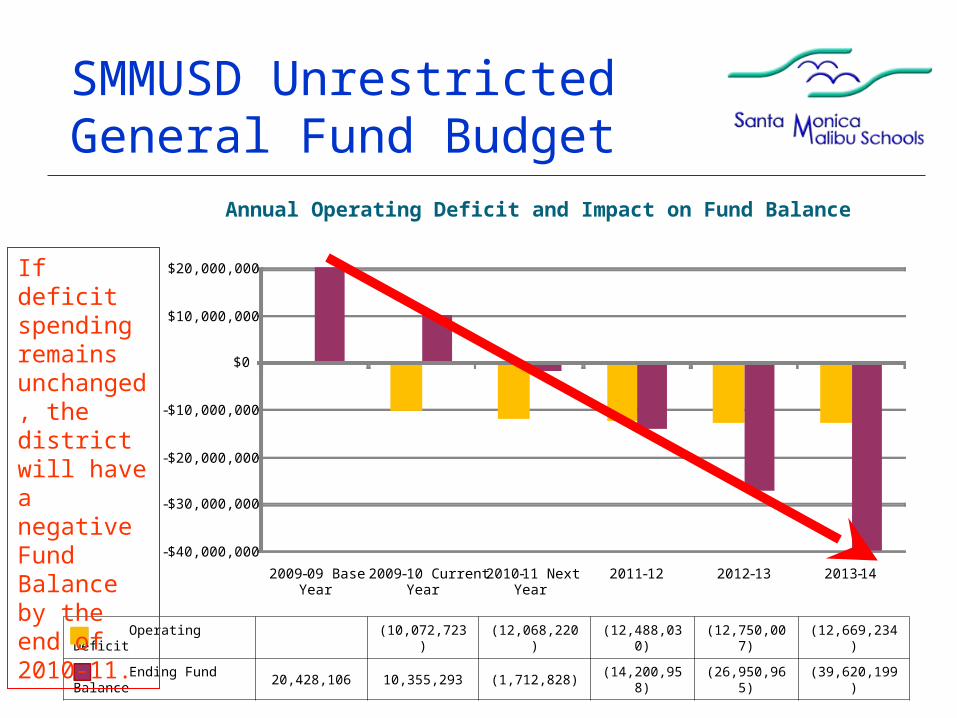
SMMUSD UnrestrictedGeneral Fund Budget
Annual Operating Deficit and Impact on Fund Balance
-$40,000,000
-$30,000,000
-$20,000,000
-$10,000,000
$0
$10,000,000
$20,000,000
2009-09 Base Year
2009-10 Current Year
2010-11 Next Year
2011 -12 2012-13 2013-14
Operating Deficit (10,072,723) (12,068,220) (12,488,030) (12,750,007) (12,669,234)
Ending Fund Balance 20,428,106 10,355,293 (1,712,828) (14,200,958) (26,950,965) (39,620,199)
If deficit spending remains unchanged, the district will have a negative Fund Balance by the end of 2010-11.

Local FundingMakes a Difference!
Visual and performing arts program, physical education, nursing, class size, library support, intervention programs, summer school, literacy support, technology
California at the Brink ofInsolvency
Contributing Factors: High foreclosure rates Increasing joblessness Loss of state revenues Relative size of budget gap Legal obstacles to balanced budget Poor money-management practices

Worst-case for California's budget deficit next year?
“Deficit next year could hit a staggering $25 billion.”
“Gov. Arnold Schwarzenegger's best-case estimate: $12.4 billion.”
The governor has already promised "across-the-board cuts."
– Source: San Jose Mercury News, Nov. 13, 2009

As of today…
L.A. Times –November 18, 2009

Loss of Funding CouldResult In…
Increased class sizes
Limited summer school
Fewer school days
Reduction Instructional materials Staff development Nursing Library services Counseling Music Athletics Other support services
We Can’t Depend on Sacramento!
The proactive steps being taken: Cut $4.5 million from the 2009-10 budget Financial Oversight Committee Superintendent’s Budget Advisory Committee Emergency/Temporary Parcel Tax Feasibility Committee Labor negotiations Revenue enhancements Energy savings

It is all at stake!