Embed Size (px)
DESCRIPTION
The report utilizes graphics and case studies to illustrate the effects of poverty in Ohio and dispel commonly held myths and misconceptions.
Citation preview
D I S P E L L I N G M Y T H S &
P R E C O N C E I V E D N O T I O N S
State of Poverty
O H I O A S S O C I A T I O N O F
C O MM U NI T Y A CT I O N A GE NCI E S
This report was funded by the Ohio Development Services Agency’s Office of Community Assistance.
The Ohio Association of Community Action Agencies Philip E. Cole, Executive Director 50 West Broad Street, Suite 1616 Columbus, OH 43215 phone: 614-224-8500 fax: 614-224-2587 www.oacaa.org
The Ohio Association of Community Action Agencies (OACAA) exists to support and strengthen the network of Community Action Agencies that serve the needs of low-income people in all of Ohio’s 88 counties. Fifty locally-governed, private non-profit Community Action Agencies make up the network, which administers over $480,000 in resources aimed at eliminating the problems of poverty in Ohio’s communities. The agencies employ more than 6,000 people and provide services to over 800,000 Ohioans. Programs include Head Start, home heating assistance, weatherization, food pantries, emergency shelters, affordable housing, transportation, meals, health clinics, and much more. The holistic approach of Community Action helps thousands of Ohioans become self-sufficient every year.
Community Research Partners Yvonne Olivares, Ph.D., Director of Research and Data Services Zach Crafton, Research Associate Max Laird, Research Associate Kenneth Green, Research Assistant 300 E. Broad Street, Suite 490 Columbus, Ohio 43215 phone: 614-224-5917 www.communityresearchpartners.org
Community Research Partners is a nonprofit research center that strengthens Ohio communities through data, information, and knowledge. CRP is a partnership of the City of Columbus, United Way of Central Ohio, The Ohio State University, and the Franklin County Commissioners. CRP is the Ohio partner in the National Neighborhood Indicators Partnership.
Editorial Partners Leah D. Hackleman-Good, Ph.D. Lancaster, Ohio 43130 Phone: 740-654-1260 www.EditorialPartnersLLC.com
Editorial Partners LLC provides information design, technical writing and training, and editing for research, education, and business.
Ohio Association of Community Action Agencies
State of
Poverty
D i s p e l l i n g m y t h s a n d p r e c o n c e i v e d n o t i o n s
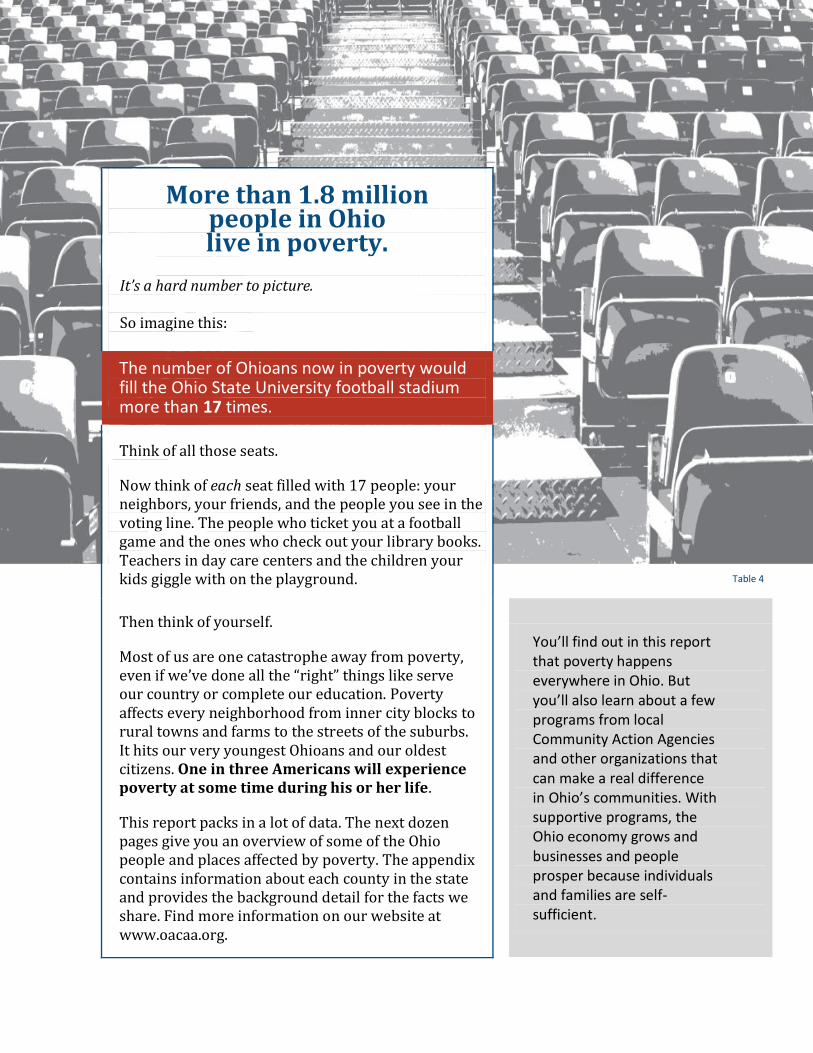
More than 1.8 million people in Ohio live in poverty.
It’s a hard number to picture. So imagine this:
The number of Ohioans now in poverty would fill the Ohio State University football stadium more than 17 times.
Think of all those seats.
Now think of each seat filled with 17 people: your neighbors, your friends, and the people you see in the voting line. The people who ticket you at a football game and the ones who check out your library books. Teachers in day care centers and the children your kids giggle with on the playground.
Then think of yourself.
Most of us are one catastrophe away from poverty, even if we’ve done all the “right” things like serve our country or complete our education. Poverty affects every neighborhood from inner city blocks to rural towns and farms to the streets of the suburbs. It hits our very youngest Ohioans and our oldest citizens. One in three Americans will experience poverty at some time during his or her life.
This report packs in a lot of data. The next dozen pages give you an overview of some of the Ohio people and places affected by poverty. The appendix contains information about each county in the state and provides the background detail for the facts we share. Find more information on our website at www.oacaa.org.
You’ll find out in this report that poverty happens everywhere in Ohio. But you’ll also learn about a few programs from local Community Action Agencies and other organizations that can make a real difference in Ohio’s communities. With supportive programs, the Ohio economy grows and businesses and people prosper because individuals and families are self-sufficient.
Table 4
Defining Poverty
Ohio Association of Community Action Agencies 1
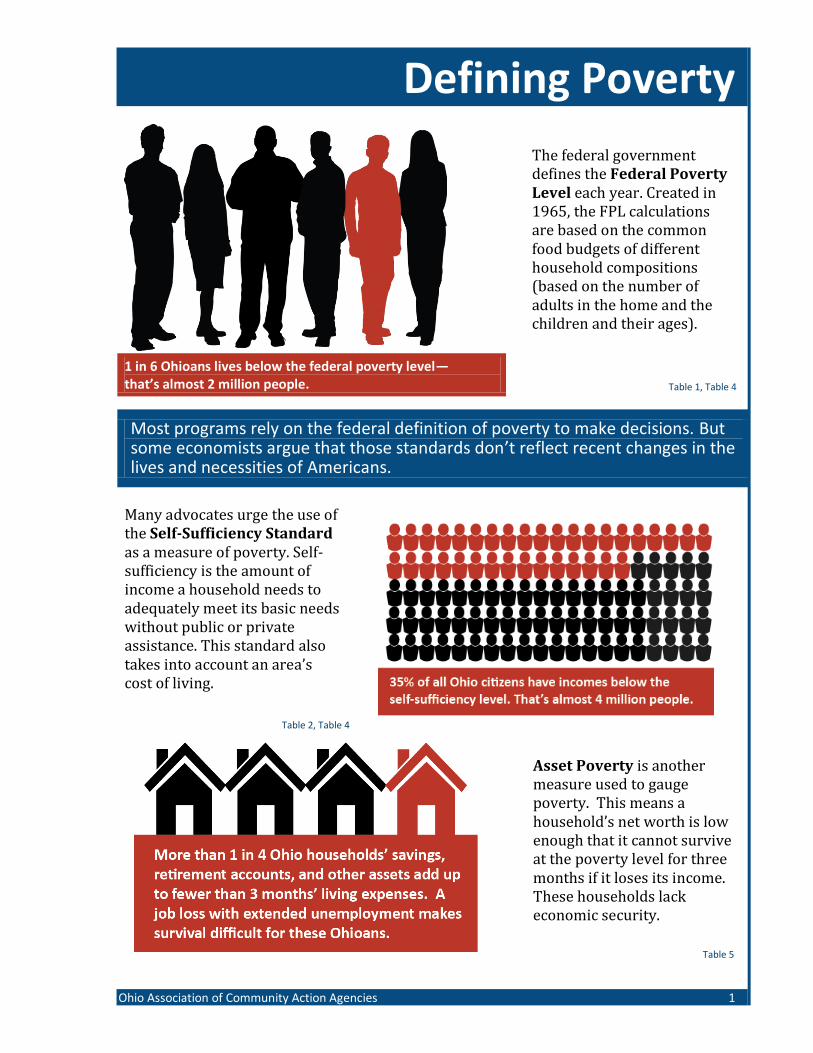
The federal government defines the Federal Poverty Level each year. Created in 1965, the FPL calculations are based on the common food budgets of different household compositions (based on the number of adults in the home and the children and their ages).
1 in 6 Ohioans lives below the federal poverty level—that’s almost 2 million people. Table 1, Table 4
Most programs rely on the federal definition of poverty to make decisions. But some economists argue that those standards don’t reflect recent changes in the lives and necessities of Americans.
Many advocates urge the use of the Self-Sufficiency Standard as a measure of poverty. Self-sufficiency is the amount of income a household needs to adequately meet its basic needs without public or private assistance. This standard also takes into account an area’s cost of living.
Table 2, Table 4
Asset Poverty is another measure used to gauge poverty. This means a household’s net worth is low enough that it cannot survive at the poverty level for three months if it loses its income. These households lack economic security.
Table 5
Ohio Poverty
2 Ohio Association of Community Action Agencies
Table 6, Table 7
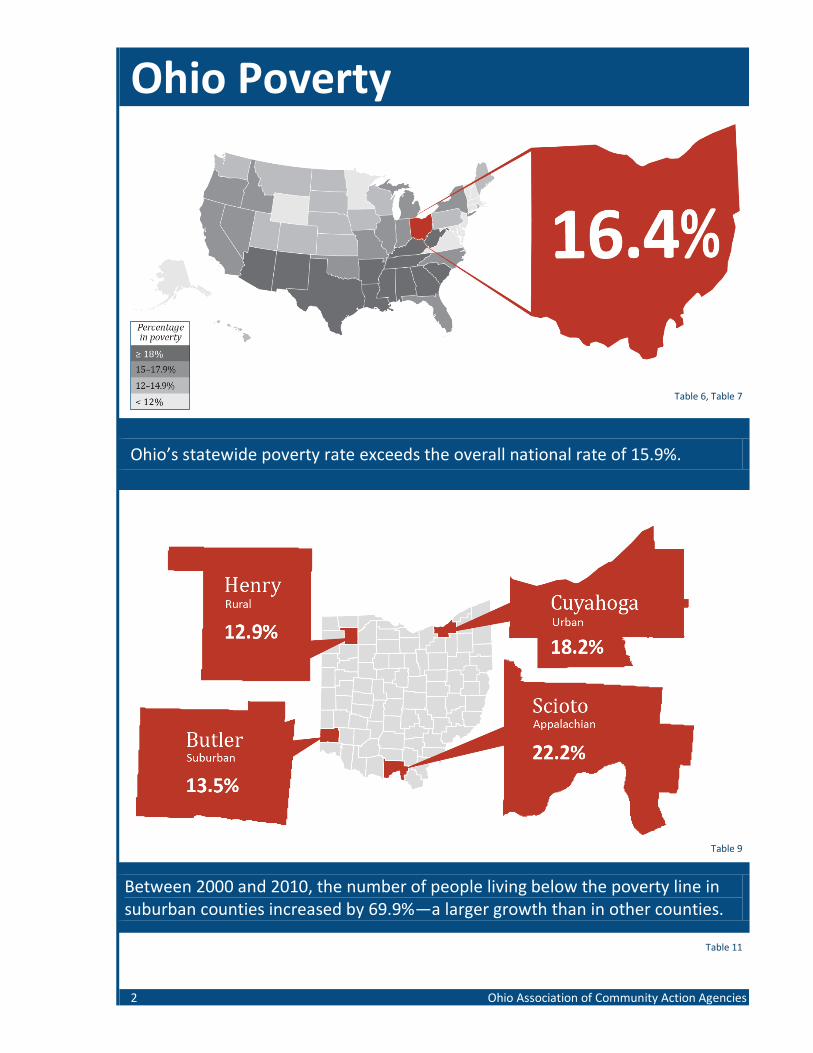
Ohio’s statewide poverty rate exceeds the overall national rate of 15.9%.
Table 9
Between 2000 and 2010, the number of people living below the poverty line in suburban counties increased by 69.9%—a larger growth than in other counties.
Table 11
Ohio Poverty
State of Poverty 2012 3
Table 8
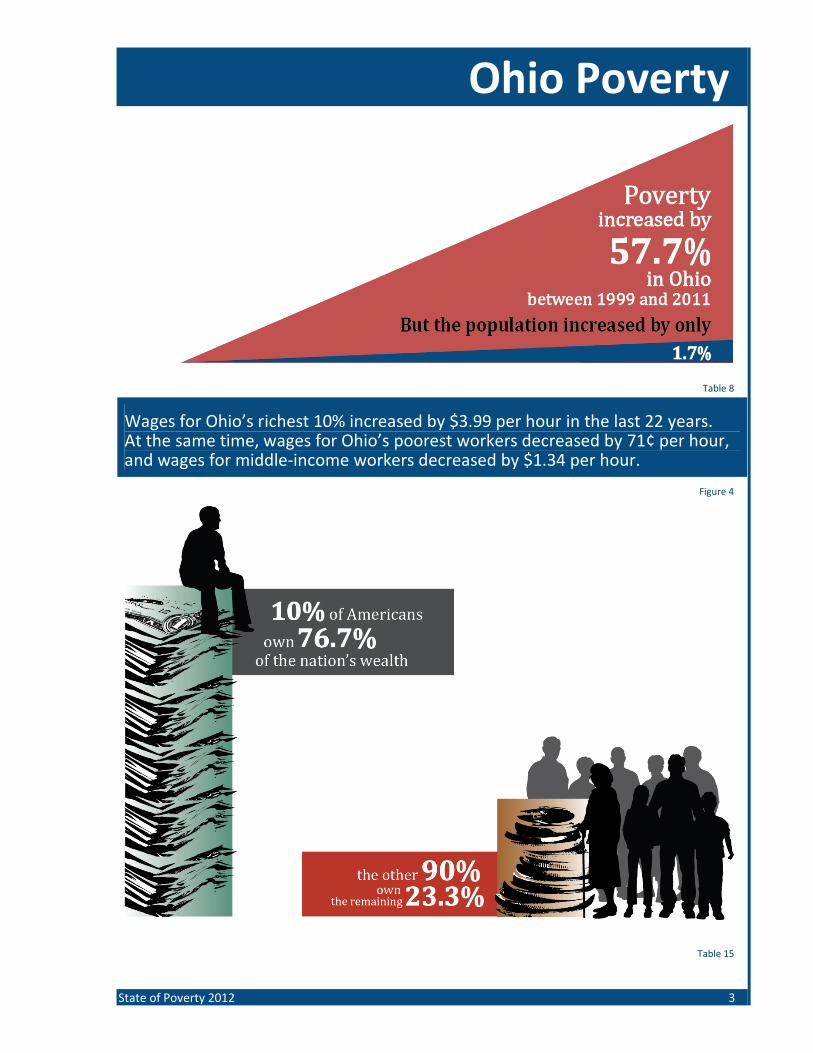
Wages for Ohio’s richest 10% increased by $3.99 per hour in the last 22 years. At the same time, wages for Ohio’s poorest workers decreased by 71¢ per hour, and wages for middle-income workers decreased by $1.34 per hour.
Figure 4
Table 15
Rising Costs
4 Ohio Association of Community Action Agencies
Table 2, Table 3
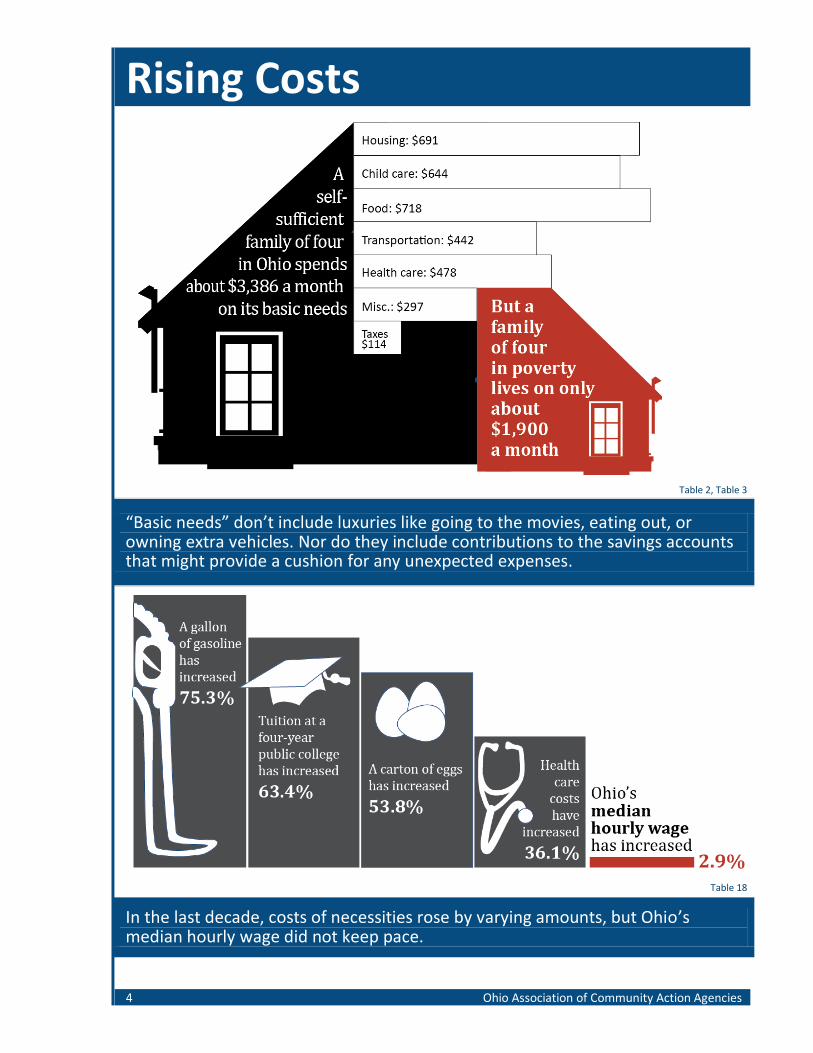
“Basic needs” don’t include luxuries like going to the movies, eating out, or owning extra vehicles. Nor do they include contributions to the savings accounts that might provide a cushion for any unexpected expenses.
Table 18
In the last decade, costs of necessities rose by varying amounts, but Ohio’s median hourly wage did not keep pace.
Wages
State of Poverty 2012 5
Nearly 1 in 6 Ohioans lives in poverty. For a family of four, that’s a household income of about $1,900 a month. Although $1,900 may sound like a livable wage, it fails to cover the costs of the basic necessities.
ebbie is a single mother of two young children, ages 3 and 6, in Georgetown, Ohio.
She has a good job at a local restaurant, but she still struggles to support her family. Debbie didn’t own a car, which forced her to rely on others to help run errands or take her children to school activities. She caught a ride to work every day, but that meant she could not work extra hours to earn more money for her bills or to save for a car of her own.
Debbie enrolled in the By-Car program at Adams/Brown Counties Economic Opportunities Inc., her local Community Action Agency. The By-Car program is a matched savings fund: for every $1 a participant saves toward the purchase of a used vehicle, the program contributes $2.
As part of the program, Debbie also enrolled in the Finance Fitness program and completed Adams/Brown’s three-day personal
financial literacy and consumer education training. Armed with the tools and knowledge she gained after she completed these requirements, Debbie purchased a used van for her family. Now Debbie can rest assured that she can get to and from work as needed, she can work extra hours to earn more money, and she can take her family to and from enriching activities.
More than 115,000 Ohio single women with children worked full or part time, yet their wages did not pull them out of poverty.
D
OHIO POVERTY
WORKING
In Ohio, 42.3% of people living below the federal poverty line are working either part time or full time. 100,159 individuals in poverty in Ohio work full time.
Table 16
Table 17
Higher Education
6 Ohio Association of Community Action Agencies
Table 19
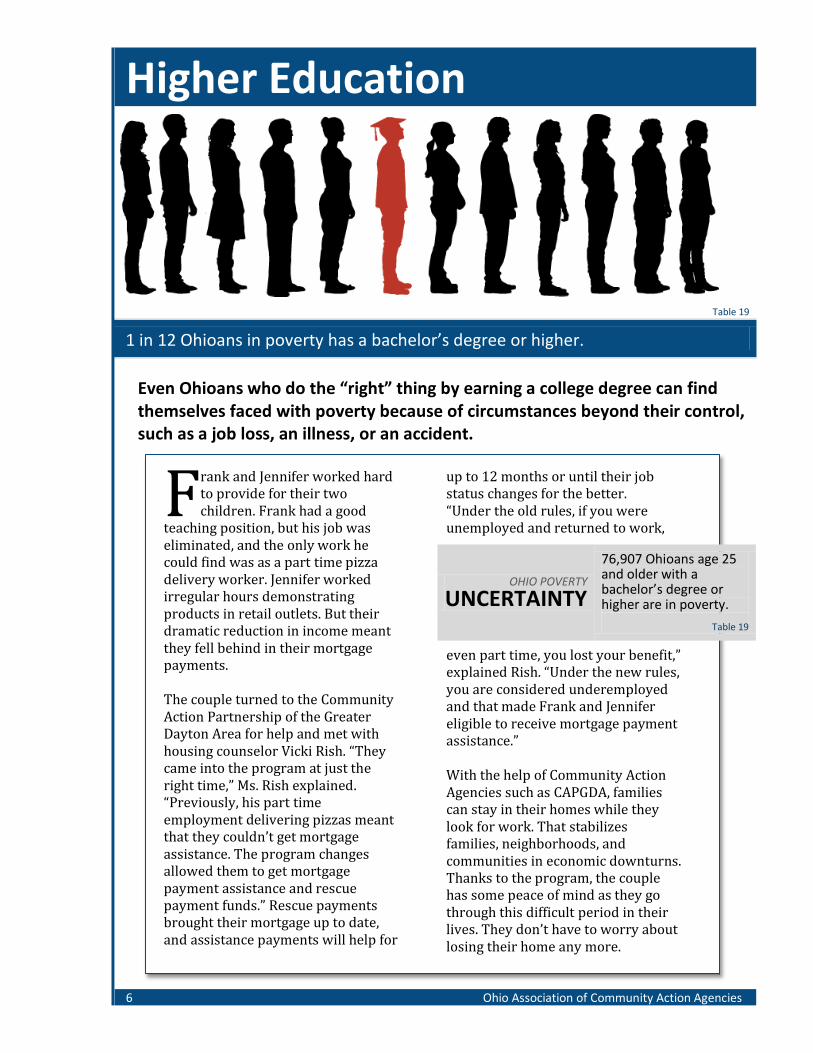
1 in 12 Ohioans in poverty has a bachelor’s degree or higher.
Even Ohioans who do the “right” thing by earning a college degree can find themselves faced with poverty because of circumstances beyond their control, such as a job loss, an illness, or an accident.
rank and Jennifer worked hard to provide for their two children. Frank had a good
teaching position, but his job was eliminated, and the only work he could find was as a part time pizza delivery worker. Jennifer worked irregular hours demonstrating products in retail outlets. But their dramatic reduction in income meant they fell behind in their mortgage payments. The couple turned to the Community Action Partnership of the Greater Dayton Area for help and met with housing counselor Vicki Rish. “They came into the program at just the right time,” Ms. Rish explained. “Previously, his part time employment delivering pizzas meant that they couldn’t get mortgage assistance. The program changes allowed them to get mortgage payment assistance and rescue payment funds.” Rescue payments brought their mortgage up to date, and assistance payments will help for
up to 12 months or until their job status changes for the better. “Under the old rules, if you were unemployed and returned to work,
even part time, you lost your benefit,” explained Rish. “Under the new rules, you are considered underemployed and that made Frank and Jennifer eligible to receive mortgage payment assistance.” With the help of Community Action Agencies such as CAPGDA, families can stay in their homes while they look for work. That stabilizes families, neighborhoods, and communities in economic downturns. Thanks to the program, the couple has some peace of mind as they go through this difficult period in their lives. They don’t have to worry about losing their home any more.
F OHIO POVERTY
UNCERTAINTY
76,907 Ohioans age 25 and older with a bachelor’s degree or higher are in poverty.
Table 19
Veterans
State of Poverty 2012 7
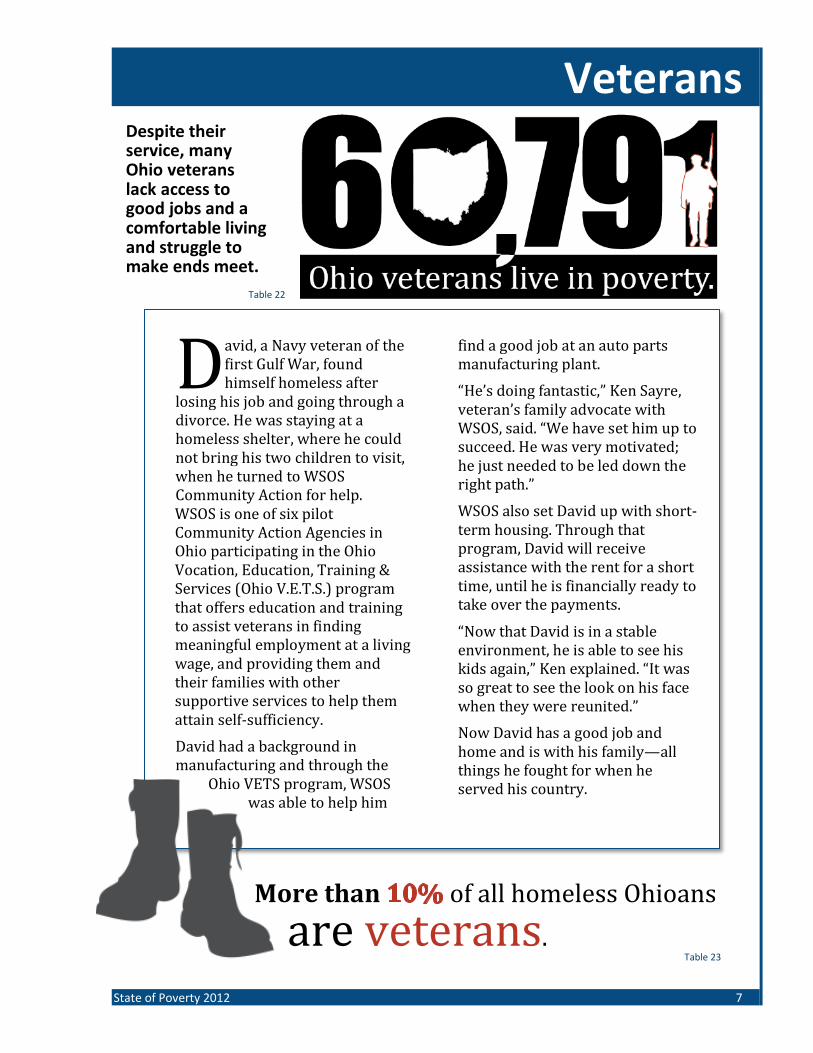
Despite their service, many Ohio veterans lack access to good jobs and a comfortable living and struggle to make ends meet.
avid, a Navy veteran of the first Gulf War, found himself homeless after
losing his job and going through a divorce. He was staying at a homeless shelter, where he could not bring his two children to visit, when he turned to WSOS Community Action for help. WSOS is one of six pilot Community Action Agencies in Ohio participating in the Ohio Vocation, Education, Training & Services (Ohio V.E.T.S.) program that offers education and training to assist veterans in finding meaningful employment at a living wage, and providing them and their families with other supportive services to help them attain self-sufficiency.
David had a background in manufacturing and through the
Ohio VETS program, WSOS was able to help him
find a good job at an auto parts manufacturing plant.
“He’s doing fantastic,” Ken Sayre, veteran’s family advocate with WSOS, said. “We have set him up to succeed. He was very motivated; he just needed to be led down the right path.”
WSOS also set David up with short-term housing. Through that program, David will receive assistance with the rent for a short time, until he is financially ready to take over the payments.
“Now that David is in a stable environment, he is able to see his kids again,” Ken explained. “It was so great to see the look on his face when they were reunited.”
Now David has a good job and home and is with his family—all things he fought for when he served his country.
More than of all homeless Ohioans
are veterans.
D Table 22
Table 23
Children
8 Ohio Association of Community Action Agencies
Table 24
Nearly one out of every four Ohio children lives in poverty.
Table 24
Almost one in three Ohio children under age 6 lives in poverty.
OHIO CONNECTION CHILDREN
From 1999 to 2010, the number of children in poverty grew by 232,199 children. But in 2010, there were actually 189,158 fewer children overall than in 1999.
Table 25
Children
State of Poverty 2012 9
Providing Ohio’s low-income children with tools to help them excel is a crucial first step in improving their lives.
hen Tristan’s parents brought him to Kno-Ho-Co-Ashland Community
Action Commission for Head Start—a free preschool class offered to low-income children—he was three years old and the staff was unable to understand one word that he tried to speak.
Tristan was given the National Reporting System Assessment Test, a standardized assessment for Head Start students. The test, instituted by the federal government, demonstrates whether a young child can recognize certain words, identify letters, recognize geometric shapes, and solve simple addition and subtraction problems. Tristan failed the picture naming test because the staff could not understand him. Kno-Ho-Co-Ashland had him tested and he qualified for speech therapy.
Tristan’s speech therapy began right away; by the middle of his first year, the staff began to understand him and realized he was an intelligent little guy. He continued with his speech therapy for that school year and the next one. At
that time he was old enough for kindergarten, but his parents decided to keep him in Head Start for another year.
Tristan excelled in his third year of Head Start, learning every letter and their sounds and counting to 100. He was ready to move on to kindergarten.
After the first parent-teacher conference for kindergarten, Tristan’s mom came back to tell the Head Start staff what his teacher had said. The teacher had told her that in all her years of teaching, she had never had a student so well prepared to start kindergarten. She also said that he was at the top of his class in all subjects and was reading at a very high level. Tristan’s mom told the teacher that it was thanks to his Head Start teachers at Kno-Ho-Co-Ashland Community Action Commission.
Community programs such as Head Start provide low-income children like Tristan with a firm foundation for primary school, forming the groundwork for their successful completion of the education that prepares them for productive lives.
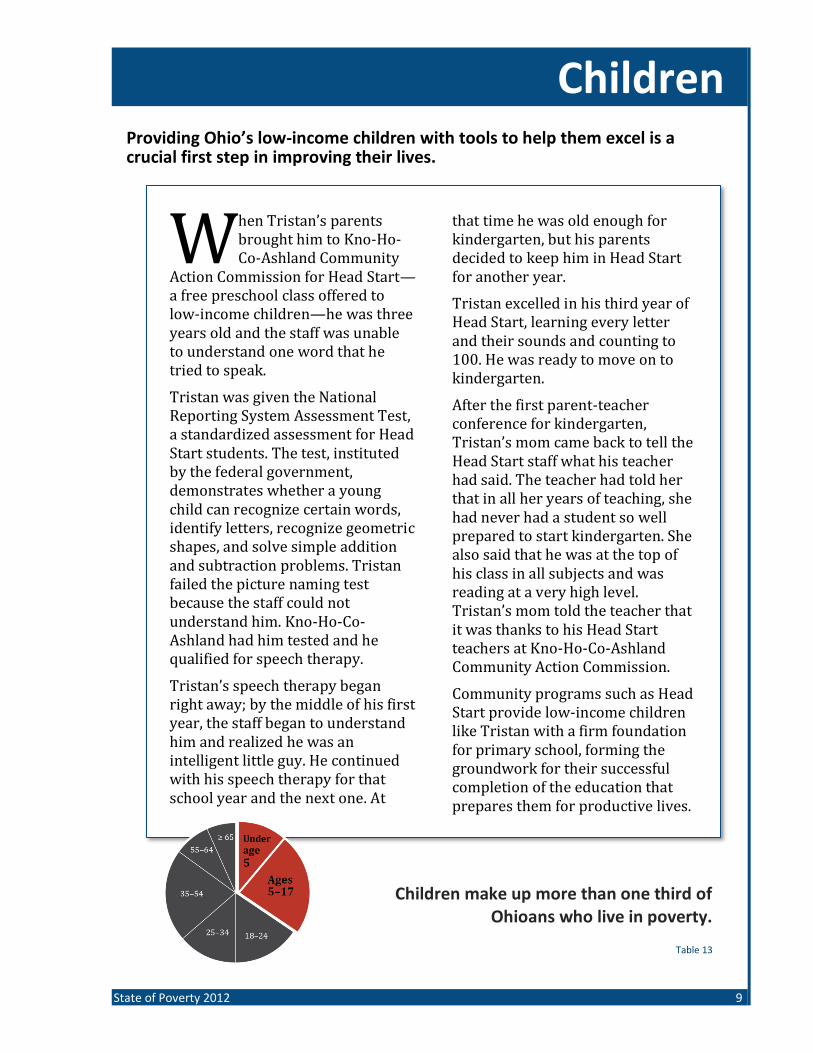
Children make up more than one third of
Ohioans who live in poverty.
Table 13
W
10 Ohio Association of Community Action Agencies
Appendix: Tables and Figures
Appendix: Tables and Figures
State of Poverty 2012 11
Defining Poverty Table 1. Federal poverty thresholds in dollars, 2011 .............................................................................. 12 Table 2. Items included in the self-sufficiency standard for Ohio, 2011 .................................................. 12 Table 3. Self-sufficiency standard, Miami County, 2011 ......................................................................... 13 Table 4. Income to poverty ratio by age group in Ohio, 2011 ................................................................. 13 Table 5. State rank by asset poverty rate, 2009 ...................................................................................... 14
Ohio Poverty Figure 1. Poverty rate trends for Ohio and United States, 1981–2011 .................................................... 15 Table 6. Poverty rates for Ohio and United States, 1981–2011 .............................................................. 15 Table 7. State rank by poverty rate, 2011............................................................................................... 16 Table 8. Change in poverty in Ohio, 1999–2011 ..................................................................................... 16
Ohio Counties Table 9. Population, poverty rates, and economic need data, Ohio counties ......................................... 17 Table 10. Ohio counties by type ............................................................................................................. 32 Table 11. Change in poverty in Ohio counties by county type, 2000–2010 ............................................. 35
Ohio Cities Table 12. Change in persons in poverty in Ohio's 10 largest cities, 1999–2011 ....................................... 36
Ohioans in Poverty Figure 2. Poverty by race/ethnicity, Ohio, 2011 ..................................................................................... 37 Table 13. Poverty by race/ethnicity and age in Ohio, 2011..................................................................... 38 Figure 3. Poverty by family type, Ohio, 2011 .......................................................................................... 38 Table 14. Poverty by race/ethnicity and family type, Ohio, 2011............................................................ 39
Wealth, Wages, and Rising Costs Table 15. Distribution of income compared with distribution of wealth, United States, 2010 ................ 40 Figure 4. Changes in Ohio wages by income percentiles, 1979–2000 ..................................................... 40 Table 16. Work experience of Ohio persons 16 years and older living
below federal poverty level, 2011 ............................................................................................ 41 Table 17. Work experience by family type, 2011 .................................................................................... 41 Figure 5. Ohio working families with incomes below federal poverty level, 2011 ................................... 42 Table 18. Rising costs of goods and services vs. growth in Ohio median hourly wage, 2000–2011 ......... 42
Education and Higher Education Table 19. Poverty by educational attainment (ages 25 and older) in Ohio, 2011 .................................... 43 Figure 6. Poverty by educational attainment (ages 25 and older) in Ohio, 2011 ..................................... 43 Table 20. Average hourly wage for young workers, 1989–2011 ............................................................. 44 Table 21. Change in average college debt school year 2000–2001 to school year 2009–2010
in the United States ................................................................................................................. 44
Veterans Table 22. Poverty among veterans and non-veterans 18 years and over, 2011 ...................................... 45 Table 23. Veteran homelessness in Ohio, 2011 ...................................................................................... 45
Children Table 24. Income to poverty ratio by age group in Ohio, 2011 ............................................................... 46 Table 25. Change in the number of children in poverty in Ohio, 1999–2011 .......................................... 46
Appendix: Tables and Figures
12 Ohio Association of Community Action Agencies
Defining Poverty
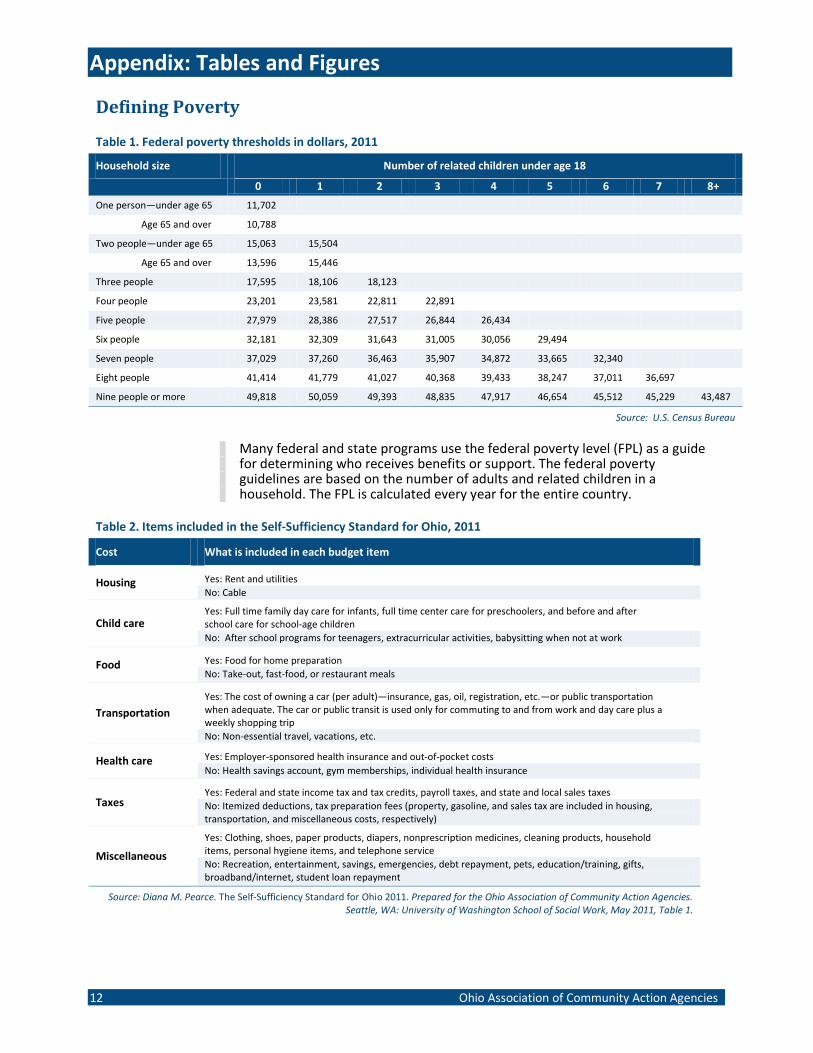
Table 1. Federal poverty thresholds in dollars, 2011
Household size Number of related children under age 18
0 1 2 3 4 5 6 7 8+
One person—under age 65 11,702
Age 65 and over 10,788
Two people—under age 65 15,063 15,504
Age 65 and over 13,596 15,446
Three people 17,595 18,106 18,123
Four people 23,201 23,581 22,811 22,891
Five people 27,979 28,386 27,517 26,844 26,434
Six people 32,181 32,309 31,643 31,005 30,056 29,494
Seven people 37,029 37,260 36,463 35,907 34,872 33,665 32,340
Eight people 41,414 41,779 41,027 40,368 39,433 38,247 37,011 36,697
Nine people or more 49,818 50,059 49,393 48,835 47,917 46,654 45,512 45,229 43,487
Source: U.S. Census Bureau
Many federal and state programs use the federal poverty level (FPL) as a guide for determining who receives benefits or support. The federal poverty guidelines are based on the number of adults and related children in a household. The FPL is calculated every year for the entire country.
Table 2. Items included in the Self-Sufficiency Standard for Ohio, 2011
Cost What is included in each budget item
Housing Yes: Rent and utilities
No: Cable
Child care Yes: Full time family day care for infants, full time center care for preschoolers, and before and after school care for school-age children
No: After school programs for teenagers, extracurricular activities, babysitting when not at work
Food Yes: Food for home preparation
No: Take-out, fast-food, or restaurant meals
Transportation
Yes: The cost of owning a car (per adult)—insurance, gas, oil, registration, etc.—or public transportation when adequate. The car or public transit is used only for commuting to and from work and day care plus a weekly shopping trip
No: Non-essential travel, vacations, etc.
Health care Yes: Employer-sponsored health insurance and out-of-pocket costs
No: Health savings account, gym memberships, individual health insurance
Taxes Yes: Federal and state income tax and tax credits, payroll taxes, and state and local sales taxes
No: Itemized deductions, tax preparation fees (property, gasoline, and sales tax are included in housing, transportation, and miscellaneous costs, respectively)
Miscellaneous
Yes: Clothing, shoes, paper products, diapers, nonprescription medicines, cleaning products, household items, personal hygiene items, and telephone service
No: Recreation, entertainment, savings, emergencies, debt repayment, pets, education/training, gifts, broadband/internet, student loan repayment
Source: Diana M. Pearce. The Self-Sufficiency Standard for Ohio 2011. Prepared for the Ohio Association of Community Action Agencies. Seattle, WA: University of Washington School of Social Work, May 2011, Table 1.
Appendix: Tables and Figures
Defining Poverty, continued
State of Poverty 2012 13
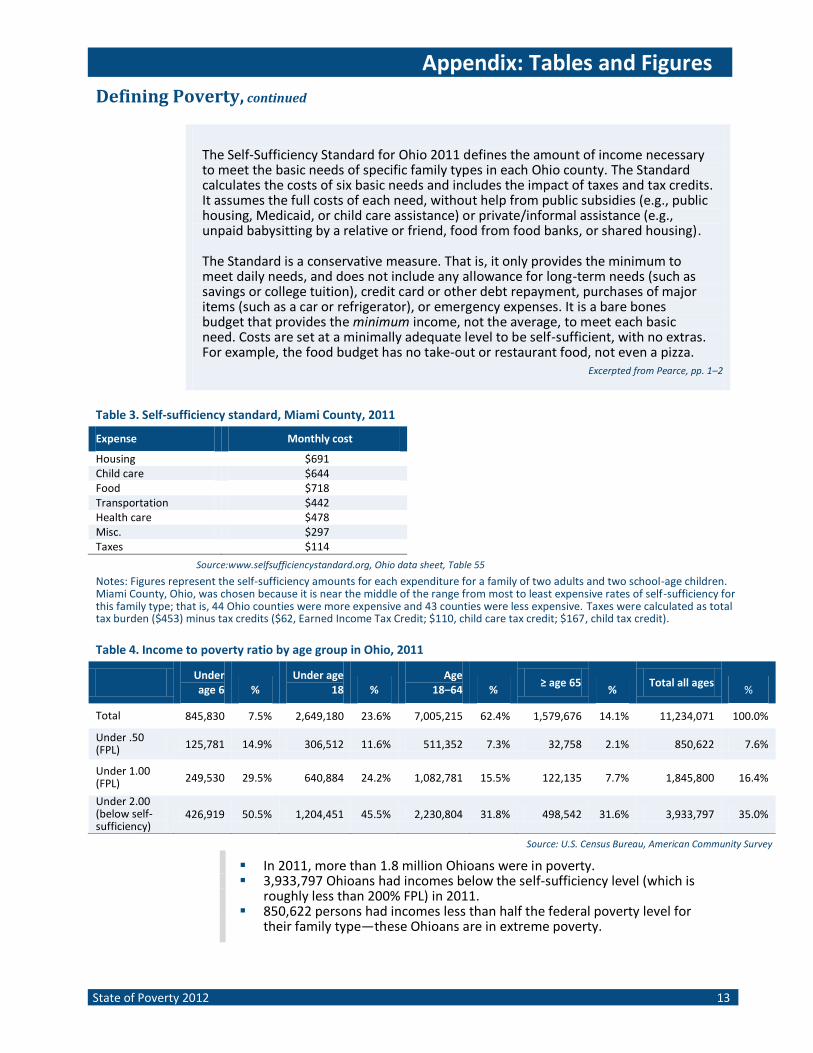
The Self-Sufficiency Standard for Ohio 2011 defines the amount of income necessary to meet the basic needs of specific family types in each Ohio county. The Standard calculates the costs of six basic needs and includes the impact of taxes and tax credits. It assumes the full costs of each need, without help from public subsidies (e.g., public housing, Medicaid, or child care assistance) or private/informal assistance (e.g., unpaid babysitting by a relative or friend, food from food banks, or shared housing). The Standard is a conservative measure. That is, it only provides the minimum to meet daily needs, and does not include any allowance for long-term needs (such as savings or college tuition), credit card or other debt repayment, purchases of major items (such as a car or refrigerator), or emergency expenses. It is a bare bones budget that provides the minimum income, not the average, to meet each basic need. Costs are set at a minimally adequate level to be self-sufficient, with no extras. For example, the food budget has no take-out or restaurant food, not even a pizza.
Excerpted from Pearce, pp. 1–2
Table 3. Self-sufficiency standard, Miami County, 2011
Expense Monthly cost
Housing $691 Child care $644 Food $718 Transportation $442 Health care $478 Misc. $297 Taxes $114
Source:www.selfsufficiencystandard.org, Ohio data sheet, Table 55
Notes: Figures represent the self-sufficiency amounts for each expenditure for a family of two adults and two school-age children. Miami County, Ohio, was chosen because it is near the middle of the range from most to least expensive rates of self-sufficiency for this family type; that is, 44 Ohio counties were more expensive and 43 counties were less expensive. Taxes were calculated as total tax burden ($453) minus tax credits ($62, Earned Income Tax Credit; $110, child care tax credit; $167, child tax credit).
Table 4. Income to poverty ratio by age group in Ohio, 2011
Under age 6 %
Under age 18 %
Age 18–64 %
≥ age 65 %
Total all ages %
Total 845,830 7.5% 2,649,180 23.6% 7,005,215 62.4% 1,579,676 14.1% 11,234,071 100.0%
Under .50 (FPL) 125,781 14.9% 306,512 11.6% 511,352 7.3% 32,758 2.1% 850,622 7.6%
Under 1.00 (FPL) 249,530 29.5% 640,884 24.2% 1,082,781 15.5% 122,135 7.7% 1,845,800 16.4%
Under 2.00 (below self-sufficiency)
426,919 50.5% 1,204,451 45.5% 2,230,804 31.8% 498,542 31.6% 3,933,797 35.0%
Source: U.S. Census Bureau, American Community Survey
In 2011, more than 1.8 million Ohioans were in poverty. 3,933,797 Ohioans had incomes below the self-sufficiency level (which is
roughly less than 200% FPL) in 2011. 850,622 persons had incomes less than half the federal poverty level for
their family type—these Ohioans are in extreme poverty.
Appendix: Tables and Figures
Defining Poverty, continued
14 Ohio Association of Community Action Agencies
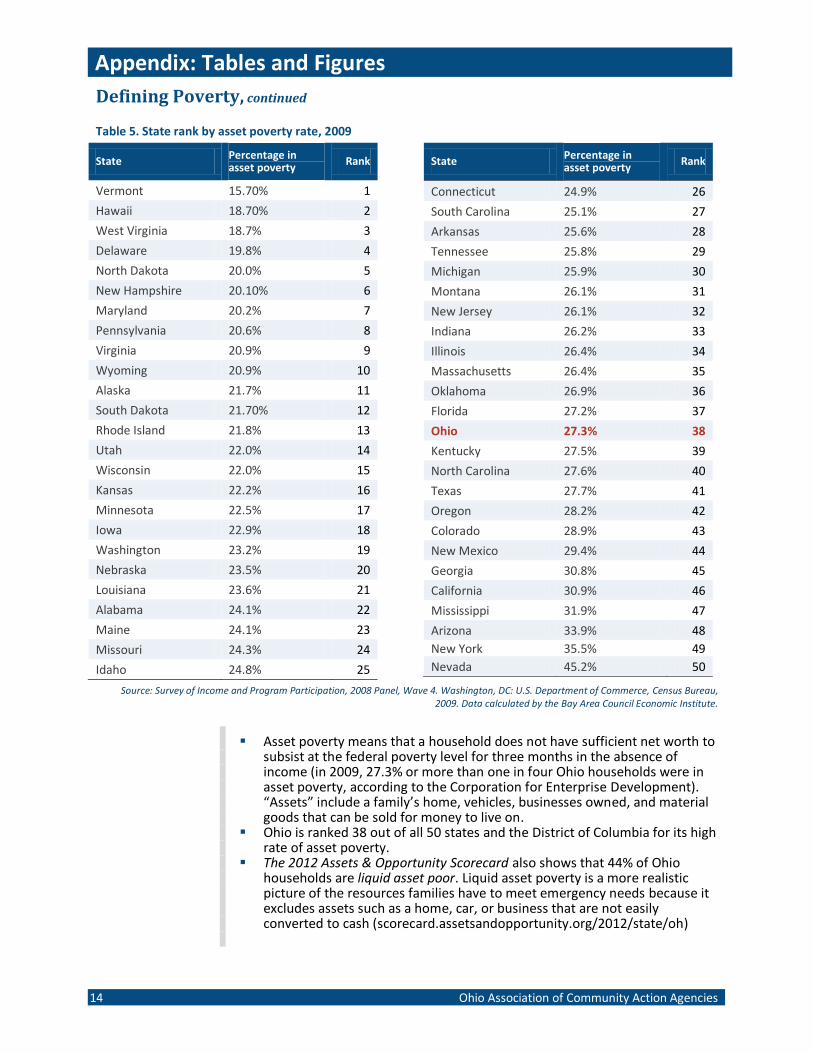
Table 5. State rank by asset poverty rate, 2009
State Percentage in asset poverty
Rank
Vermont 15.70% 1
Hawaii 18.70% 2
West Virginia 18.7% 3
Delaware 19.8% 4
North Dakota 20.0% 5
New Hampshire 20.10% 6
Maryland 20.2% 7
Pennsylvania 20.6% 8
Virginia 20.9% 9
Wyoming 20.9% 10
Alaska 21.7% 11
South Dakota 21.70% 12
Rhode Island 21.8% 13
Utah 22.0% 14
Wisconsin 22.0% 15
Kansas 22.2% 16
Minnesota 22.5% 17
Iowa 22.9% 18
Washington 23.2% 19
Nebraska 23.5% 20
Louisiana 23.6% 21
Alabama 24.1% 22
Maine 24.1% 23
Missouri 24.3% 24
Idaho 24.8% 25
State Percentage in asset poverty
Rank
Connecticut 24.9% 26
South Carolina 25.1% 27
Arkansas 25.6% 28
Tennessee 25.8% 29
Michigan 25.9% 30
Montana 26.1% 31
New Jersey 26.1% 32
Indiana 26.2% 33
Illinois 26.4% 34
Massachusetts 26.4% 35
Oklahoma 26.9% 36
Florida 27.2% 37
Ohio 27.3% 38
Kentucky 27.5% 39
North Carolina 27.6% 40
Texas 27.7% 41
Oregon 28.2% 42
Colorado 28.9% 43
New Mexico 29.4% 44
Georgia 30.8% 45
California 30.9% 46
Mississippi 31.9% 47
Arizona 33.9% 48
New York 35.5% 49
Nevada 45.2% 50
Source: Survey of Income and Program Participation, 2008 Panel, Wave 4. Washington, DC: U.S. Department of Commerce, Census Bureau, 2009. Data calculated by the Bay Area Council Economic Institute.
Asset poverty means that a household does not have sufficient net worth to subsist at the federal poverty level for three months in the absence of income (in 2009, 27.3% or more than one in four Ohio households were in asset poverty, according to the Corporation for Enterprise Development). “Assets” include a family’s home, vehicles, businesses owned, and material goods that can be sold for money to live on.
Ohio is ranked 38 out of all 50 states and the District of Columbia for its high rate of asset poverty.
The 2012 Assets & Opportunity Scorecard also shows that 44% of Ohio households are liquid asset poor. Liquid asset poverty is a more realistic picture of the resources families have to meet emergency needs because it excludes assets such as a home, car, or business that are not easily converted to cash (scorecard.assetsandopportunity.org/2012/state/oh)
Appendix: Tables and Figures
State of Poverty 2012 15
Ohio Poverty
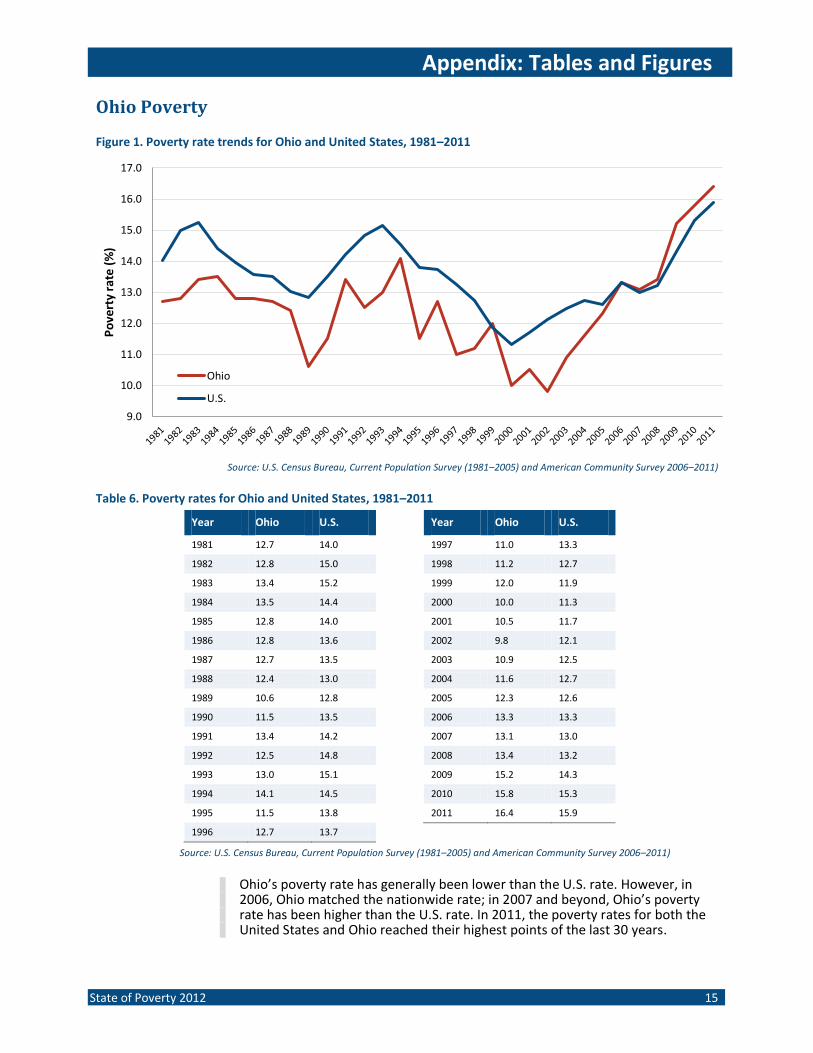
Figure 1. Poverty rate trends for Ohio and United States, 1981–2011
Source: U.S. Census Bureau, Current Population Survey (1981–2005) and American Community Survey 2006–2011)
Table 6. Poverty rates for Ohio and United States, 1981–2011
Year Ohio U.S.
1981 12.7 14.0
1982 12.8 15.0
1983 13.4 15.2
1984 13.5 14.4
1985 12.8 14.0
1986 12.8 13.6
1987 12.7 13.5
1988 12.4 13.0
1989 10.6 12.8
1990 11.5 13.5
1991 13.4 14.2
1992 12.5 14.8
1993 13.0 15.1
1994 14.1 14.5
1995 11.5 13.8
1996 12.7 13.7
Year Ohio U.S.
1997 11.0 13.3
1998 11.2 12.7
1999 12.0 11.9
2000 10.0 11.3
2001 10.5 11.7
2002 9.8 12.1
2003 10.9 12.5
2004 11.6 12.7
2005 12.3 12.6
2006 13.3 13.3
2007 13.1 13.0
2008 13.4 13.2
2009 15.2 14.3
2010 15.8 15.3
2011 16.4 15.9
Source: U.S. Census Bureau, Current Population Survey (1981–2005) and American Community Survey 2006–2011)
Ohio’s poverty rate has generally been lower than the U.S. rate. However, in 2006, Ohio matched the nationwide rate; in 2007 and beyond, Ohio’s poverty rate has been higher than the U.S. rate. In 2011, the poverty rates for both the United States and Ohio reached their highest points of the last 30 years.
9.0
10.0
11.0
12.0
13.0
14.0
15.0
16.0
17.0
Po
vert
y ra
te (
%)
Ohio
U.S.
Appendix: Tables and Figures
Ohio Poverty, continued
16 Ohio Association of Community Action Agencies
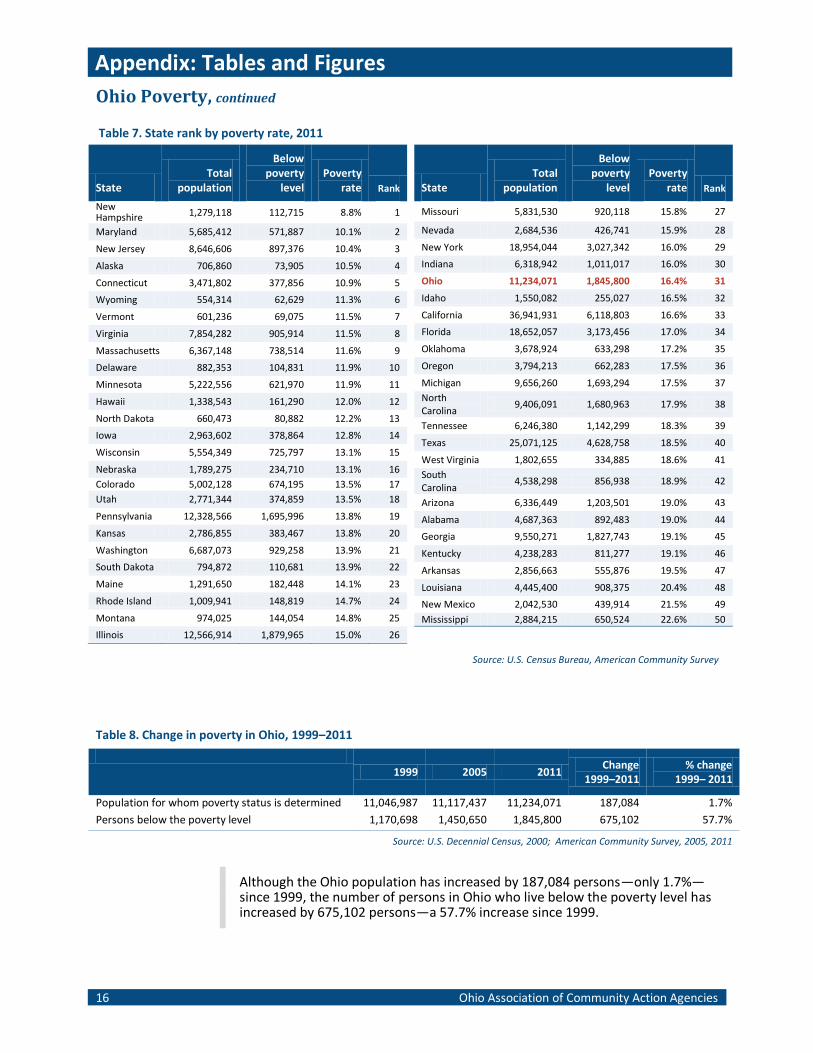
Table 7. State rank by poverty rate, 2011
State Total
population
Below poverty
level Poverty
rate Rank
New Hampshire 1,279,118 112,715 8.8% 1
Maryland 5,685,412 571,887 10.1% 2
New Jersey 8,646,606 897,376 10.4% 3
Alaska 706,860 73,905 10.5% 4
Connecticut 3,471,802 377,856 10.9% 5
Wyoming 554,314 62,629 11.3% 6
Vermont 601,236 69,075 11.5% 7
Virginia 7,854,282 905,914 11.5% 8
Massachusetts 6,367,148 738,514 11.6% 9
Delaware 882,353 104,831 11.9% 10
Minnesota 5,222,556 621,970 11.9% 11
Hawaii 1,338,543 161,290 12.0% 12
North Dakota 660,473 80,882 12.2% 13
Iowa 2,963,602 378,864 12.8% 14
Wisconsin 5,554,349 725,797 13.1% 15
Nebraska 1,789,275 234,710 13.1% 16
Colorado 5,002,128 674,195 13.5% 17
Utah 2,771,344 374,859 13.5% 18
Pennsylvania 12,328,566 1,695,996 13.8% 19
Kansas 2,786,855 383,467 13.8% 20
Washington 6,687,073 929,258 13.9% 21
South Dakota 794,872 110,681 13.9% 22
Maine 1,291,650 182,448 14.1% 23
Rhode Island 1,009,941 148,819 14.7% 24
Montana 974,025 144,054 14.8% 25
Illinois 12,566,914 1,879,965 15.0% 26
State Total
population
Below poverty
level Poverty
rate Rank
Missouri 5,831,530 920,118 15.8% 27
Nevada 2,684,536 426,741 15.9% 28
New York 18,954,044 3,027,342 16.0% 29
Indiana 6,318,942 1,011,017 16.0% 30
Ohio 11,234,071 1,845,800 16.4% 31
Idaho 1,550,082 255,027 16.5% 32
California 36,941,931 6,118,803 16.6% 33
Florida 18,652,057 3,173,456 17.0% 34
Oklahoma 3,678,924 633,298 17.2% 35
Oregon 3,794,213 662,283 17.5% 36
Michigan 9,656,260 1,693,294 17.5% 37
North Carolina
9,406,091 1,680,963 17.9% 38
Tennessee 6,246,380 1,142,299 18.3% 39
Texas 25,071,125 4,628,758 18.5% 40
West Virginia 1,802,655 334,885 18.6% 41
South Carolina
4,538,298 856,938 18.9% 42
Arizona 6,336,449 1,203,501 19.0% 43
Alabama 4,687,363 892,483 19.0% 44
Georgia 9,550,271 1,827,743 19.1% 45
Kentucky 4,238,283 811,277 19.1% 46
Arkansas 2,856,663 555,876 19.5% 47
Louisiana 4,445,400 908,375 20.4% 48
New Mexico 2,042,530 439,914 21.5% 49
Mississippi 2,884,215 650,524 22.6% 50
Source: U.S. Census Bureau, American Community Survey
Table 8. Change in poverty in Ohio, 1999–2011
1999 2005 2011 Change
1999–2011 % change
1999– 2011
Population for whom poverty status is determined 11,046,987 11,117,437 11,234,071 187,084 1.7%
Persons below the poverty level 1,170,698 1,450,650 1,845,800 675,102 57.7%
Source: U.S. Decennial Census, 2000; American Community Survey, 2005, 2011
Although the Ohio population has increased by 187,084 persons—only 1.7%—since 1999, the number of persons in Ohio who live below the poverty level has increased by 675,102 persons—a 57.7% increase since 1999.
Appendix: Tables and Figures
Ohio Counties
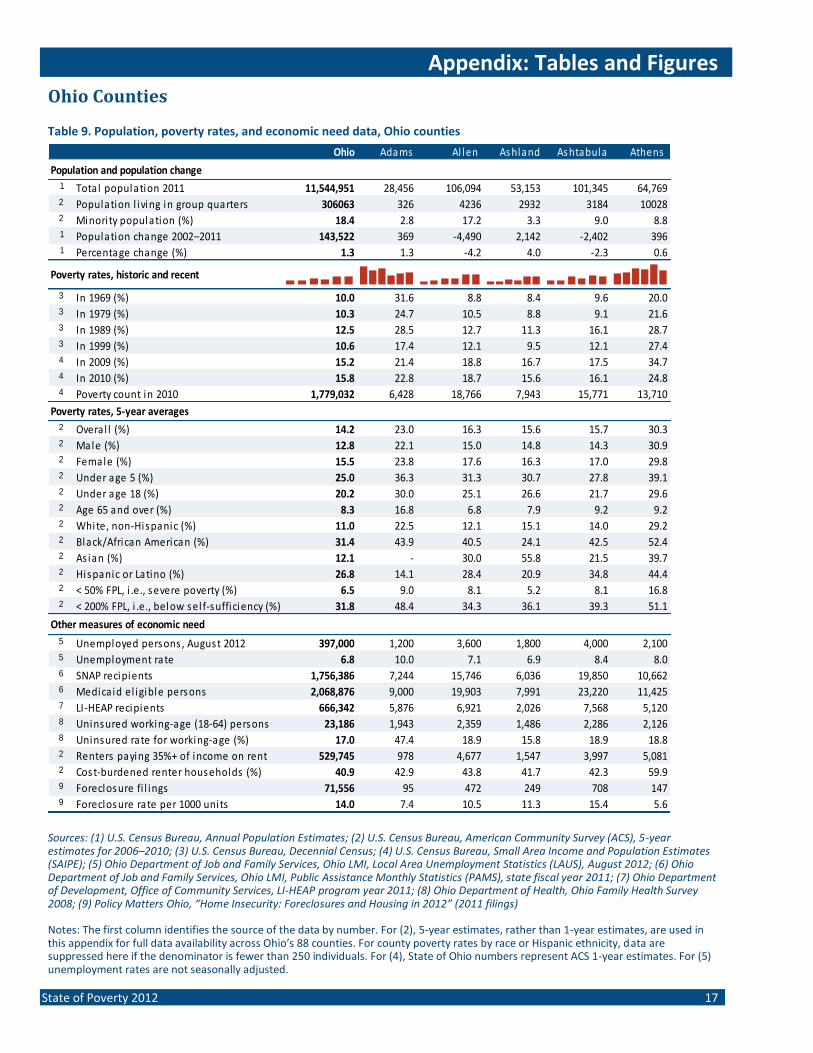
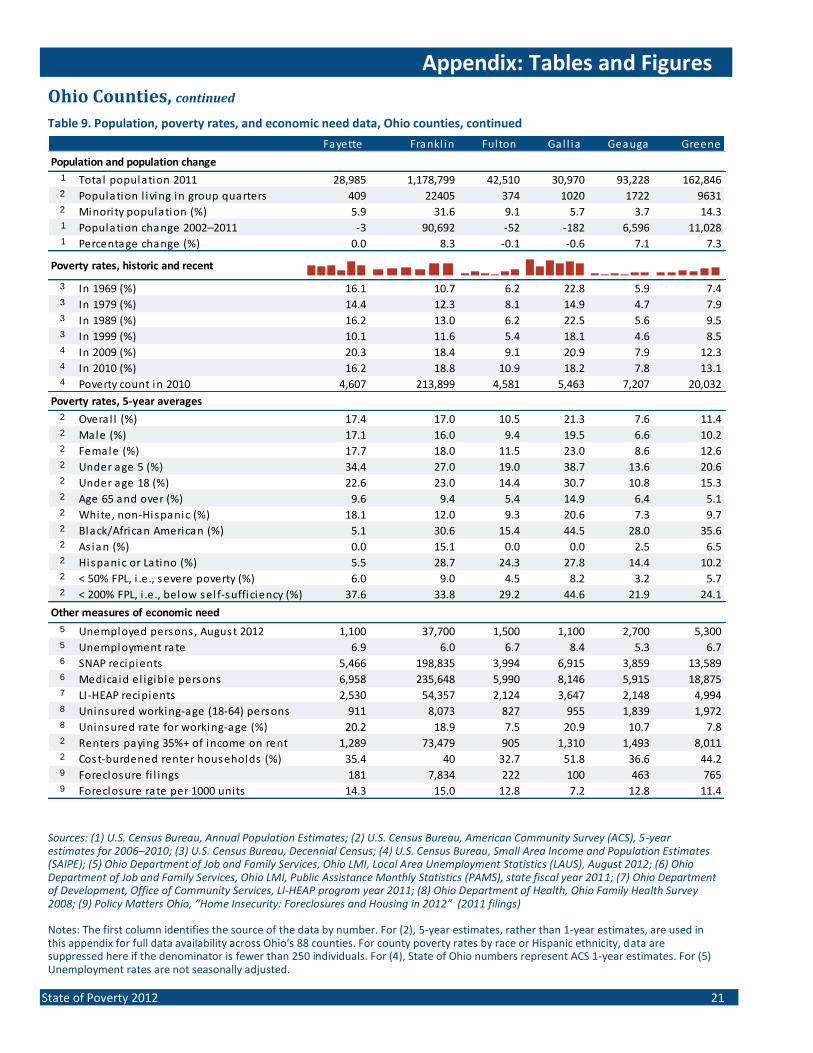
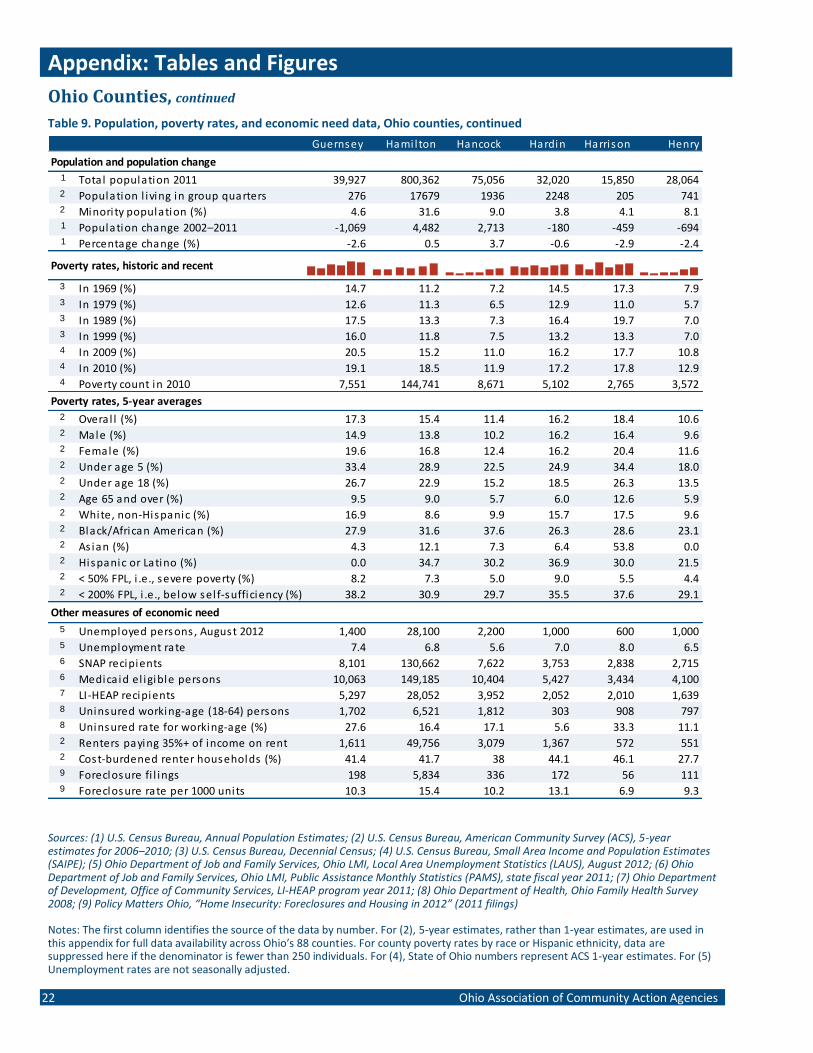
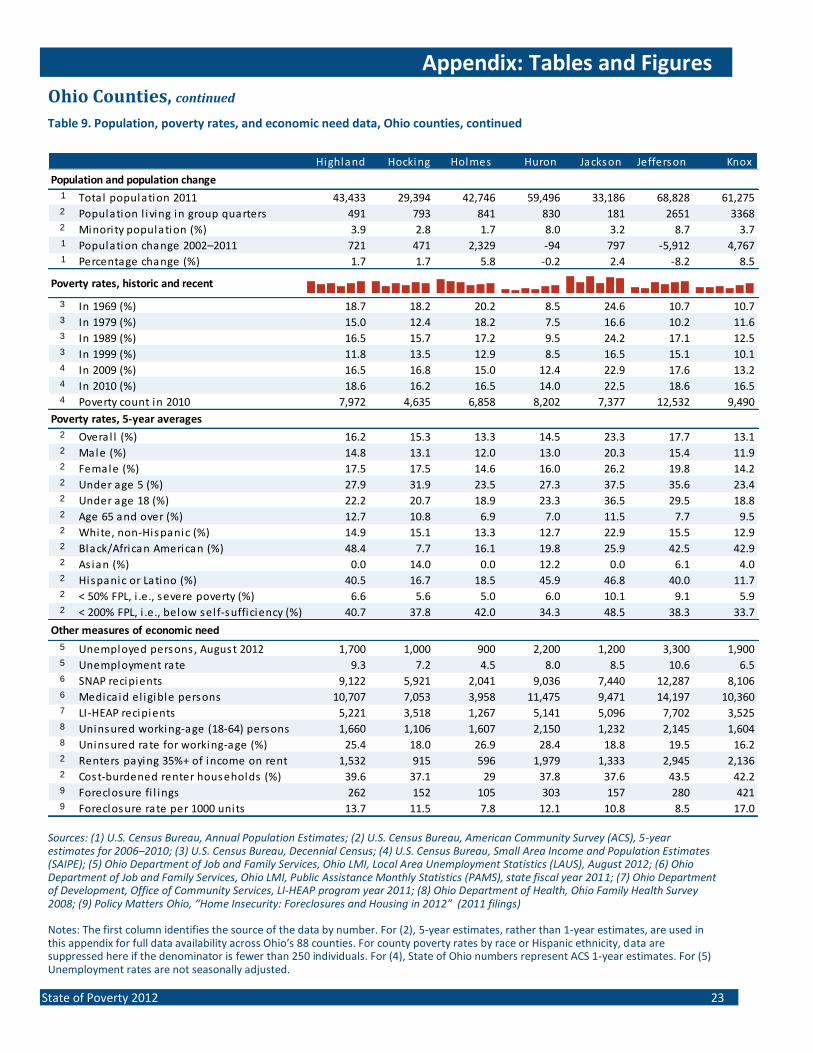
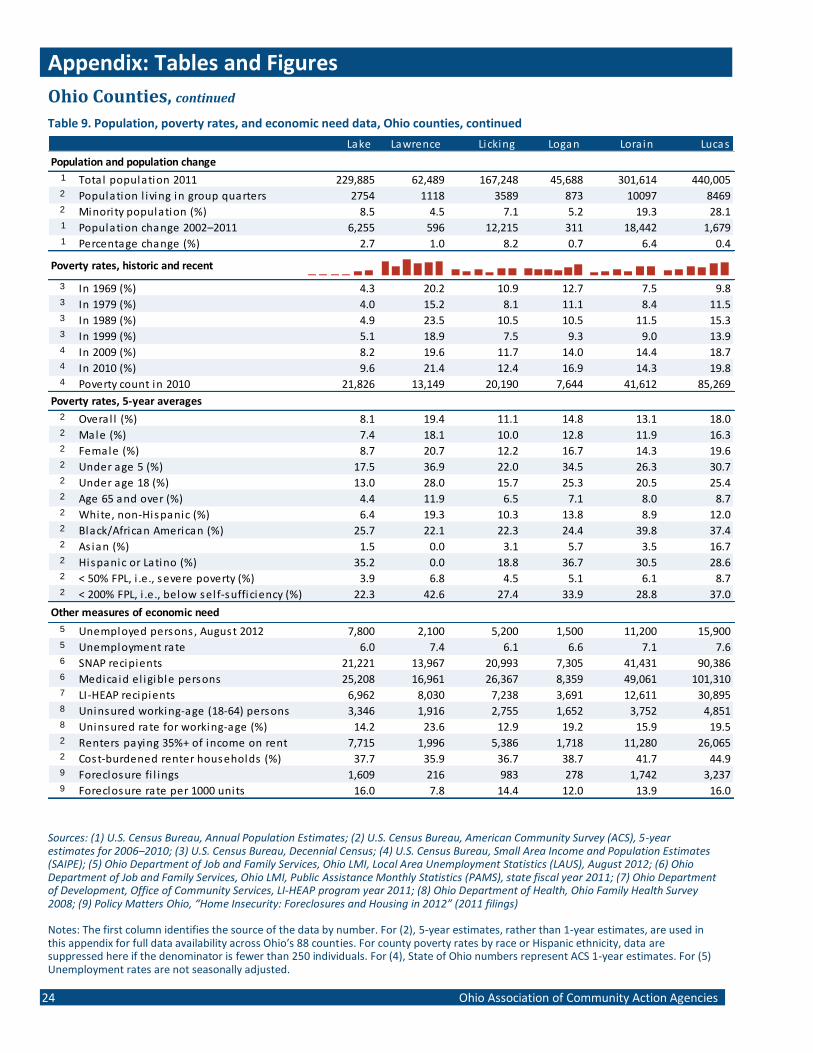
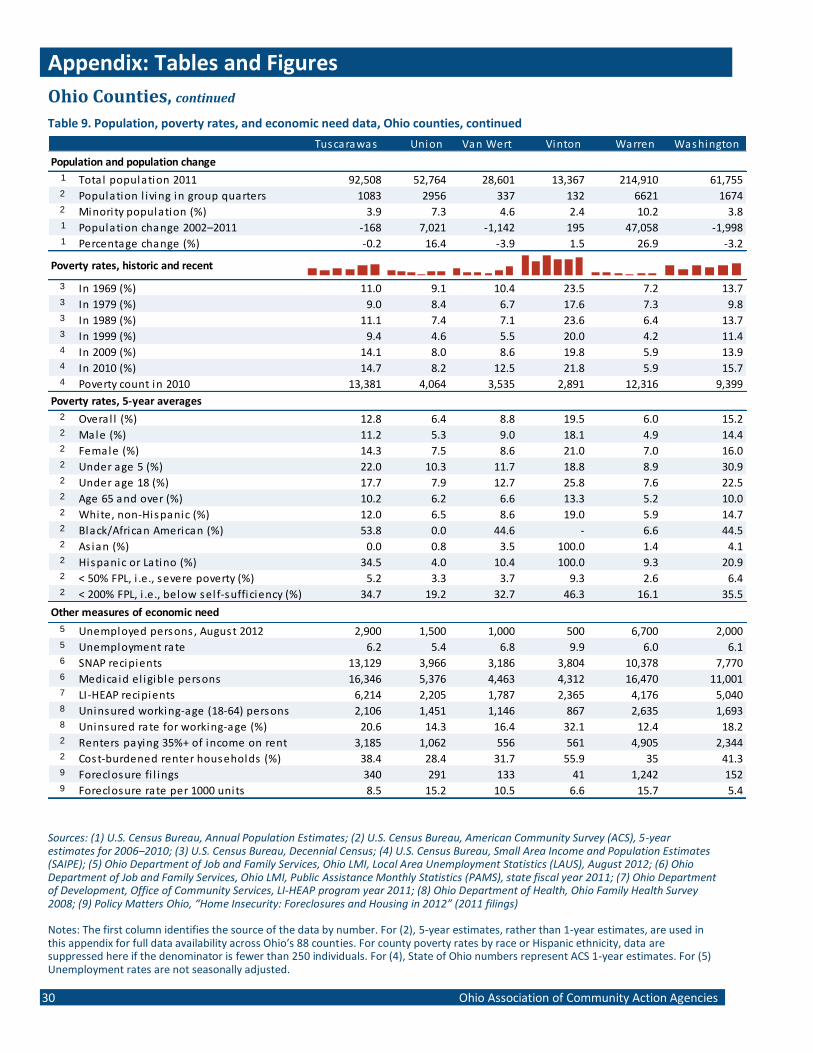
Sources: (1) U.S. Census Bureau, Annual Population Estimates; (2) U.S. Census Bureau, American Community Survey (ACS), 5-year estimates for 2006–2010; (3) U.S. Census Bureau, Decennial Census; (4) U.S. Census Bureau, Small Area Income and Population Estimates (SAIPE); (5) Ohio Department of Job and Family Services, Ohio LMI, Local Area Unemployment Statistics (LAUS), August 2012; (6) Ohio Department of Job and Family Services, Ohio LMI, Public Assistance Monthly Statistics (PAMS), state fiscal year 2011; (7) Ohio Department of Development, Office of Community Services, LI-HEAP program year 2011; (8) Ohio Department of Health, Ohio Family Health Survey 2008; (9) Policy Matters Ohio, “Home Insecurity: Foreclosures and Housing in 2012” (2011 filings) Notes: The first column identifies the source of the data by number. For (2), 5-year estimates, rather than 1-year estimates, are used in this appendix for full data availability across Ohio’s 88 counties. For county poverty rates by race or Hispanic ethnicity, data are suppressed here if the denominator is fewer than 250 individuals. For (4), State of Ohio numbers represent ACS 1-year estimates. For (5) unemployment rates are not seasonally adjusted.
State of Poverty 2012 17
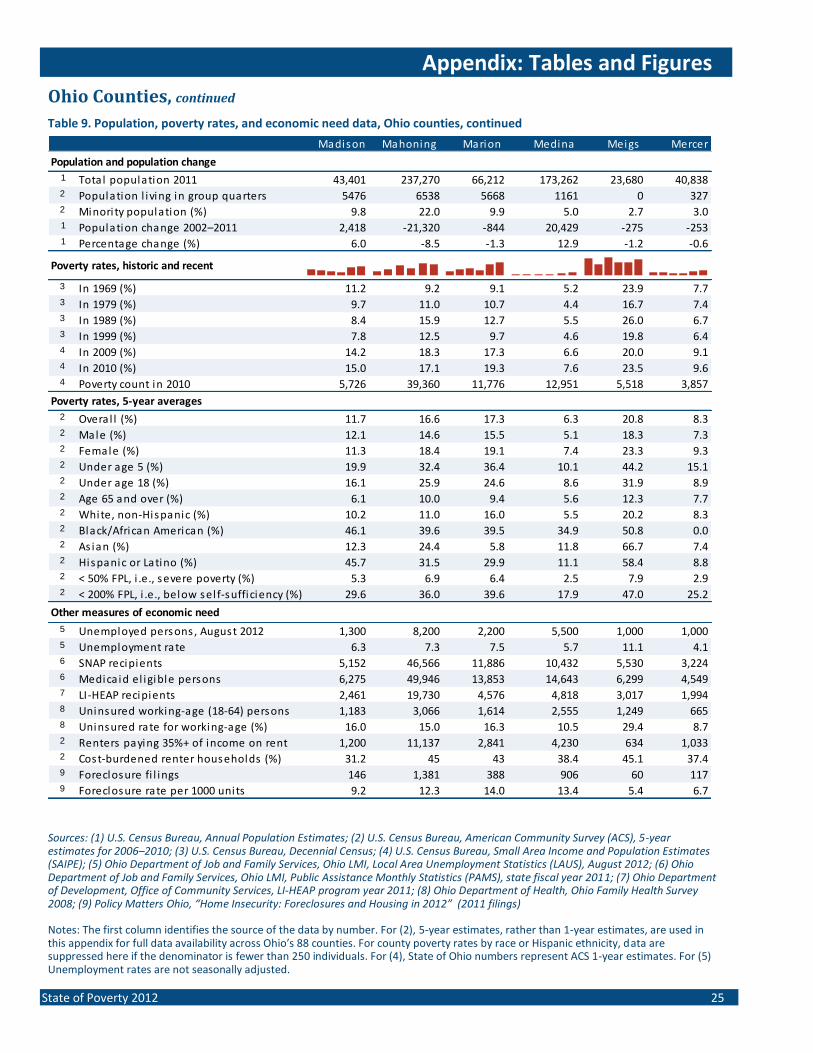
Table 9. Population, poverty rates, and economic need data, Ohio counties
Ohio Adams Al len Ashland Ashtabula Athens
Population and population change 1 Total population 2011 11,544,951 28,456 106,094 53,153 101,345 64,7692 Population l iving in group quarters 306063 326 4236 2932 3184 100282 Minori ty population (%) 18.4 2.8 17.2 3.3 9.0 8.81 Population change 2002–2011 143,522 369 -4,490 2,142 -2,402 3961 Percentage change (%) 1.3 1.3 -4.2 4.0 -2.3 0.6
Poverty rates, historic and recent
3 In 1969 (%) 10.0 31.6 8.8 8.4 9.6 20.03 In 1979 (%) 10.3 24.7 10.5 8.8 9.1 21.63 In 1989 (%) 12.5 28.5 12.7 11.3 16.1 28.73 In 1999 (%) 10.6 17.4 12.1 9.5 12.1 27.44 In 2009 (%) 15.2 21.4 18.8 16.7 17.5 34.74 In 2010 (%) 15.8 22.8 18.7 15.6 16.1 24.84 Poverty count in 2010 1,779,032 6,428 18,766 7,943 15,771 13,710
Poverty rates, 5-year averages2 Overal l (%) 14.2 23.0 16.3 15.6 15.7 30.32 Male (%) 12.8 22.1 15.0 14.8 14.3 30.92 Female (%) 15.5 23.8 17.6 16.3 17.0 29.82 Under age 5 (%) 25.0 36.3 31.3 30.7 27.8 39.12 Under age 18 (%) 20.2 30.0 25.1 26.6 21.7 29.62 Age 65 and over (%) 8.3 16.8 6.8 7.9 9.2 9.22 White, non-Hispanic (%) 11.0 22.5 12.1 15.1 14.0 29.22 Black/African American (%) 31.4 43.9 40.5 24.1 42.5 52.42 As ian (%) 12.1 - 30.0 55.8 21.5 39.72 Hispanic or Latino (%) 26.8 14.1 28.4 20.9 34.8 44.42 < 50% FPL, i .e., severe poverty (%) 6.5 9.0 8.1 5.2 8.1 16.82 < 200% FPL, i .e., below sel f-sufficiency (%) 31.8 48.4 34.3 36.1 39.3 51.1
Other measures of economic need
5 Unemployed persons , August 2012 397,000 1,200 3,600 1,800 4,000 2,1005 Unemployment rate 6.8 10.0 7.1 6.9 8.4 8.06 SNAP recipients 1,756,386 7,244 15,746 6,036 19,850 10,6626 Medica id el igible persons 2,068,876 9,000 19,903 7,991 23,220 11,4257 LI-HEAP recipients 666,342 5,876 6,921 2,026 7,568 5,1208 Uninsured working-age (18-64) persons 23,186 1,943 2,359 1,486 2,286 2,1268 Uninsured rate for working-age (%) 17.0 47.4 18.9 15.8 18.9 18.82 Renters paying 35%+ of income on rent 529,745 978 4,677 1,547 3,997 5,0812 Cost-burdened renter households (%) 40.9 42.9 43.8 41.7 42.3 59.99 Foreclosure fi l ings 71,556 95 472 249 708 1479 Foreclosure rate per 1000 units 14.0 7.4 10.5 11.3 15.4 5.6
Appendix: Tables and Figures
Ohio Counties, continued
Table 9. Population, poverty rates, and economic need data, Ohio counties, continued
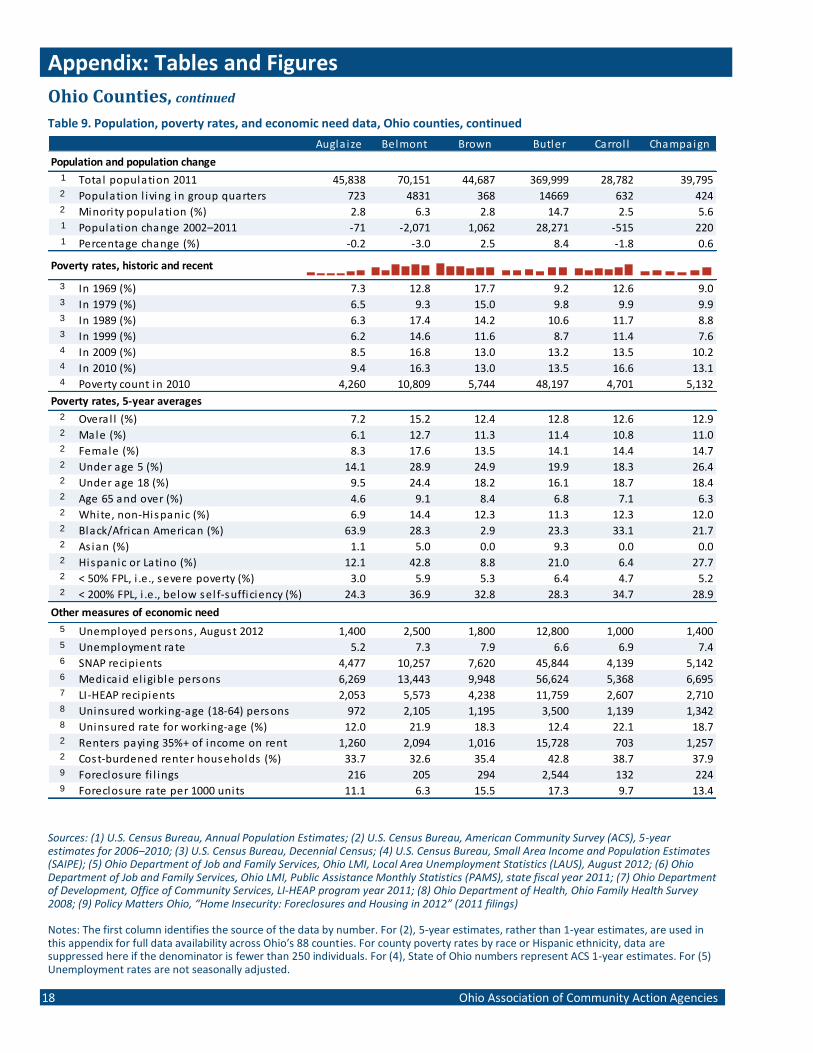
Sources: (1) U.S. Census Bureau, Annual Population Estimates; (2) U.S. Census Bureau, American Community Survey (ACS), 5-year estimates for 2006–2010; (3) U.S. Census Bureau, Decennial Census; (4) U.S. Census Bureau, Small Area Income and Population Estimates (SAIPE); (5) Ohio Department of Job and Family Services, Ohio LMI, Local Area Unemployment Statistics (LAUS), August 2012; (6) Ohio Department of Job and Family Services, Ohio LMI, Public Assistance Monthly Statistics (PAMS), state fiscal year 2011; (7) Ohio Department of Development, Office of Community Services, LI-HEAP program year 2011; (8) Ohio Department of Health, Ohio Family Health Survey 2008; (9) Policy Matters Ohio, “Home Insecurity: Foreclosures and Housing in 2012” (2011 filings) Notes: The first column identifies the source of the data by number. For (2), 5-year estimates, rather than 1-year estimates, are used in this appendix for full data availability across Ohio’s 88 counties. For county poverty rates by race or Hispanic ethnicity, data are suppressed here if the denominator is fewer than 250 individuals. For (4), State of Ohio numbers represent ACS 1-year estimates. For (5) Unemployment rates are not seasonally adjusted.
18 Ohio Association of Community Action Agencies
Augla ize Belmont Brown Butler Carrol l Champaign
Population and population change 1 Total population 2011 45,838 70,151 44,687 369,999 28,782 39,7952 Population l iving in group quarters 723 4831 368 14669 632 4242 Minori ty population (%) 2.8 6.3 2.8 14.7 2.5 5.61 Population change 2002–2011 -71 -2,071 1,062 28,271 -515 2201 Percentage change (%) -0.2 -3.0 2.5 8.4 -1.8 0.6
Poverty rates, historic and recent
3 In 1969 (%) 7.3 12.8 17.7 9.2 12.6 9.03 In 1979 (%) 6.5 9.3 15.0 9.8 9.9 9.93 In 1989 (%) 6.3 17.4 14.2 10.6 11.7 8.83 In 1999 (%) 6.2 14.6 11.6 8.7 11.4 7.64 In 2009 (%) 8.5 16.8 13.0 13.2 13.5 10.24 In 2010 (%) 9.4 16.3 13.0 13.5 16.6 13.14 Poverty count in 2010 4,260 10,809 5,744 48,197 4,701 5,132
Poverty rates, 5-year averages2 Overal l (%) 7.2 15.2 12.4 12.8 12.6 12.92 Male (%) 6.1 12.7 11.3 11.4 10.8 11.02 Female (%) 8.3 17.6 13.5 14.1 14.4 14.72 Under age 5 (%) 14.1 28.9 24.9 19.9 18.3 26.42 Under age 18 (%) 9.5 24.4 18.2 16.1 18.7 18.42 Age 65 and over (%) 4.6 9.1 8.4 6.8 7.1 6.32 White, non-Hispanic (%) 6.9 14.4 12.3 11.3 12.3 12.02 Black/African American (%) 63.9 28.3 2.9 23.3 33.1 21.72 As ian (%) 1.1 5.0 0.0 9.3 0.0 0.02 Hispanic or Latino (%) 12.1 42.8 8.8 21.0 6.4 27.72 < 50% FPL, i .e., severe poverty (%) 3.0 5.9 5.3 6.4 4.7 5.22 < 200% FPL, i .e., below sel f-sufficiency (%) 24.3 36.9 32.8 28.3 34.7 28.9
Other measures of economic need
5 Unemployed persons , August 2012 1,400 2,500 1,800 12,800 1,000 1,4005 Unemployment rate 5.2 7.3 7.9 6.6 6.9 7.46 SNAP recipients 4,477 10,257 7,620 45,844 4,139 5,1426 Medica id el igible persons 6,269 13,443 9,948 56,624 5,368 6,6957 LI-HEAP recipients 2,053 5,573 4,238 11,759 2,607 2,7108 Uninsured working-age (18-64) persons 972 2,105 1,195 3,500 1,139 1,3428 Uninsured rate for working-age (%) 12.0 21.9 18.3 12.4 22.1 18.72 Renters paying 35%+ of income on rent 1,260 2,094 1,016 15,728 703 1,2572 Cost-burdened renter households (%) 33.7 32.6 35.4 42.8 38.7 37.99 Foreclosure fi l ings 216 205 294 2,544 132 2249 Foreclosure rate per 1000 units 11.1 6.3 15.5 17.3 9.7 13.4
Appendix: Tables and Figures
Ohio Counties, continued
Table 9. Population, poverty rates, and economic need data, Ohio counties, continued
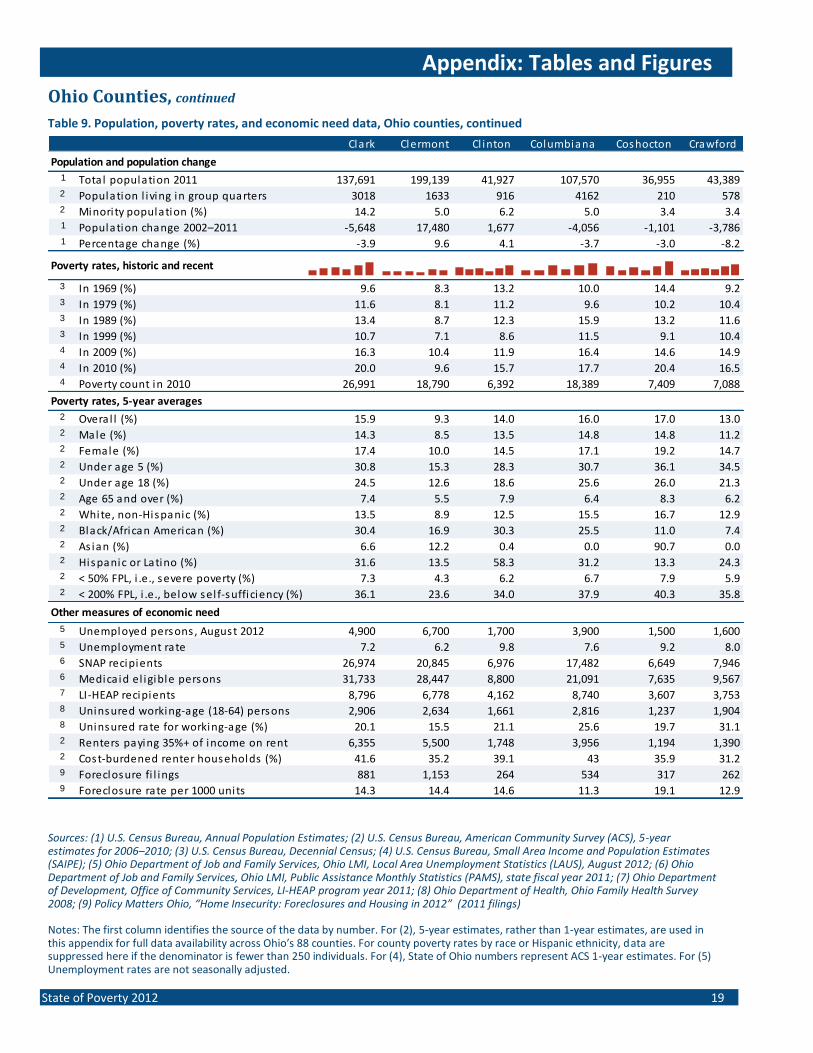
Sources: (1) U.S. Census Bureau, Annual Population Estimates; (2) U.S. Census Bureau, American Community Survey (ACS), 5-year estimates for 2006–2010; (3) U.S. Census Bureau, Decennial Census; (4) U.S. Census Bureau, Small Area Income and Population Estimates (SAIPE); (5) Ohio Department of Job and Family Services, Ohio LMI, Local Area Unemployment Statistics (LAUS), August 2012; (6) Ohio Department of Job and Family Services, Ohio LMI, Public Assistance Monthly Statistics (PAMS), state fiscal year 2011; (7) Ohio Department of Development, Office of Community Services, LI-HEAP program year 2011; (8) Ohio Department of Health, Ohio Family Health Survey 2008; (9) Policy Matters Ohio, “Home Insecurity: Foreclosures and Housing in 2012” (2011 filings) Notes: The first column identifies the source of the data by number. For (2), 5-year estimates, rather than 1-year estimates, are used in this appendix for full data availability across Ohio’s 88 counties. For county poverty rates by race or Hispanic ethnicity, data are suppressed here if the denominator is fewer than 250 individuals. For (4), State of Ohio numbers represent ACS 1-year estimates. For (5) Unemployment rates are not seasonally adjusted.
State of Poverty 2012 19
Clark Clermont Cl inton Columbiana Coshocton Crawford
Population and population change 1 Total population 2011 137,691 199,139 41,927 107,570 36,955 43,3892 Population l iving in group quarters 3018 1633 916 4162 210 5782 Minori ty population (%) 14.2 5.0 6.2 5.0 3.4 3.41 Population change 2002–2011 -5,648 17,480 1,677 -4,056 -1,101 -3,7861 Percentage change (%) -3.9 9.6 4.1 -3.7 -3.0 -8.2
Poverty rates, historic and recent
3 In 1969 (%) 9.6 8.3 13.2 10.0 14.4 9.23 In 1979 (%) 11.6 8.1 11.2 9.6 10.2 10.43 In 1989 (%) 13.4 8.7 12.3 15.9 13.2 11.63 In 1999 (%) 10.7 7.1 8.6 11.5 9.1 10.44 In 2009 (%) 16.3 10.4 11.9 16.4 14.6 14.94 In 2010 (%) 20.0 9.6 15.7 17.7 20.4 16.54 Poverty count in 2010 26,991 18,790 6,392 18,389 7,409 7,088
Poverty rates, 5-year averages2 Overal l (%) 15.9 9.3 14.0 16.0 17.0 13.02 Male (%) 14.3 8.5 13.5 14.8 14.8 11.22 Female (%) 17.4 10.0 14.5 17.1 19.2 14.72 Under age 5 (%) 30.8 15.3 28.3 30.7 36.1 34.52 Under age 18 (%) 24.5 12.6 18.6 25.6 26.0 21.32 Age 65 and over (%) 7.4 5.5 7.9 6.4 8.3 6.22 White, non-Hispanic (%) 13.5 8.9 12.5 15.5 16.7 12.92 Black/African American (%) 30.4 16.9 30.3 25.5 11.0 7.42 As ian (%) 6.6 12.2 0.4 0.0 90.7 0.02 Hispanic or Latino (%) 31.6 13.5 58.3 31.2 13.3 24.32 < 50% FPL, i .e., severe poverty (%) 7.3 4.3 6.2 6.7 7.9 5.92 < 200% FPL, i .e., below sel f-sufficiency (%) 36.1 23.6 34.0 37.9 40.3 35.8
Other measures of economic need
5 Unemployed persons , August 2012 4,900 6,700 1,700 3,900 1,500 1,6005 Unemployment rate 7.2 6.2 9.8 7.6 9.2 8.06 SNAP recipients 26,974 20,845 6,976 17,482 6,649 7,9466 Medica id el igible persons 31,733 28,447 8,800 21,091 7,635 9,5677 LI-HEAP recipients 8,796 6,778 4,162 8,740 3,607 3,7538 Uninsured working-age (18-64) persons 2,906 2,634 1,661 2,816 1,237 1,9048 Uninsured rate for working-age (%) 20.1 15.5 21.1 25.6 19.7 31.12 Renters paying 35%+ of income on rent 6,355 5,500 1,748 3,956 1,194 1,3902 Cost-burdened renter households (%) 41.6 35.2 39.1 43 35.9 31.29 Foreclosure fi l ings 881 1,153 264 534 317 2629 Foreclosure rate per 1000 units 14.3 14.4 14.6 11.3 19.1 12.9
Appendix: Tables and Figures
Ohio Counties, continued
Table 9. Population, poverty rates, and economic need data, Ohio counties, continued
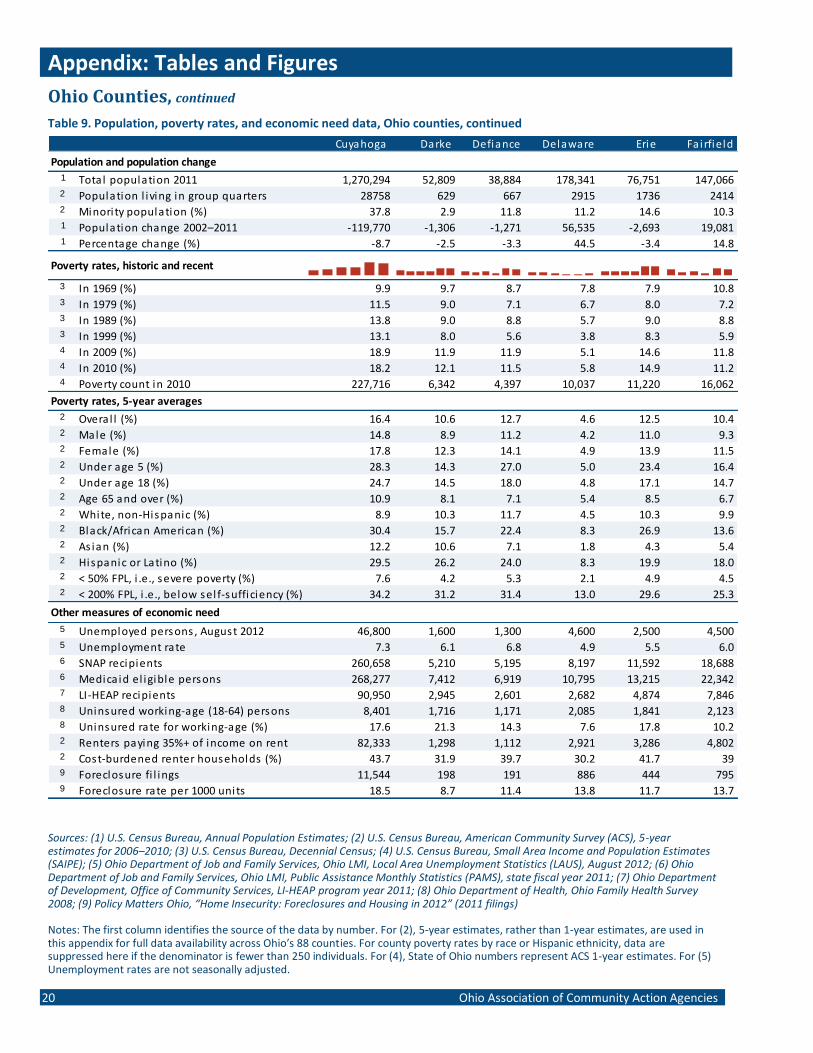
Sources: (1) U.S. Census Bureau, Annual Population Estimates; (2) U.S. Census Bureau, American Community Survey (ACS), 5-year estimates for 2006–2010; (3) U.S. Census Bureau, Decennial Census; (4) U.S. Census Bureau, Small Area Income and Population Estimates (SAIPE); (5) Ohio Department of Job and Family Services, Ohio LMI, Local Area Unemployment Statistics (LAUS), August 2012; (6) Ohio Department of Job and Family Services, Ohio LMI, Public Assistance Monthly Statistics (PAMS), state fiscal year 2011; (7) Ohio Department of Development, Office of Community Services, LI-HEAP program year 2011; (8) Ohio Department of Health, Ohio Family Health Survey 2008; (9) Policy Matters Ohio, “Home Insecurity: Foreclosures and Housing in 2012” (2011 filings) Notes: The first column identifies the source of the data by number. For (2), 5-year estimates, rather than 1-year estimates, are used in this appendix for full data availability across Ohio’s 88 counties. For county poverty rates by race or Hispanic ethnicity, data are suppressed here if the denominator is fewer than 250 individuals. For (4), State of Ohio numbers represent ACS 1-year estimates. For (5) Unemployment rates are not seasonally adjusted.
20 Ohio Association of Community Action Agencies
Cuyahoga Darke Defiance Delaware Erie Fa irfield
Population and population change 1 Total population 2011 1,270,294 52,809 38,884 178,341 76,751 147,0662 Population l iving in group quarters 28758 629 667 2915 1736 24142 Minori ty population (%) 37.8 2.9 11.8 11.2 14.6 10.31 Population change 2002–2011 -119,770 -1,306 -1,271 56,535 -2,693 19,0811 Percentage change (%) -8.7 -2.5 -3.3 44.5 -3.4 14.8
Poverty rates, historic and recent
3 In 1969 (%) 9.9 9.7 8.7 7.8 7.9 10.83 In 1979 (%) 11.5 9.0 7.1 6.7 8.0 7.23 In 1989 (%) 13.8 9.0 8.8 5.7 9.0 8.83 In 1999 (%) 13.1 8.0 5.6 3.8 8.3 5.94 In 2009 (%) 18.9 11.9 11.9 5.1 14.6 11.84 In 2010 (%) 18.2 12.1 11.5 5.8 14.9 11.24 Poverty count in 2010 227,716 6,342 4,397 10,037 11,220 16,062
Poverty rates, 5-year averages2 Overal l (%) 16.4 10.6 12.7 4.6 12.5 10.42 Male (%) 14.8 8.9 11.2 4.2 11.0 9.32 Female (%) 17.8 12.3 14.1 4.9 13.9 11.52 Under age 5 (%) 28.3 14.3 27.0 5.0 23.4 16.42 Under age 18 (%) 24.7 14.5 18.0 4.8 17.1 14.72 Age 65 and over (%) 10.9 8.1 7.1 5.4 8.5 6.72 White, non-Hispanic (%) 8.9 10.3 11.7 4.5 10.3 9.92 Black/African American (%) 30.4 15.7 22.4 8.3 26.9 13.62 As ian (%) 12.2 10.6 7.1 1.8 4.3 5.42 Hispanic or Latino (%) 29.5 26.2 24.0 8.3 19.9 18.02 < 50% FPL, i .e., severe poverty (%) 7.6 4.2 5.3 2.1 4.9 4.52 < 200% FPL, i .e., below sel f-sufficiency (%) 34.2 31.2 31.4 13.0 29.6 25.3
Other measures of economic need
5 Unemployed persons , August 2012 46,800 1,600 1,300 4,600 2,500 4,5005 Unemployment rate 7.3 6.1 6.8 4.9 5.5 6.06 SNAP recipients 260,658 5,210 5,195 8,197 11,592 18,6886 Medica id el igible persons 268,277 7,412 6,919 10,795 13,215 22,3427 LI-HEAP recipients 90,950 2,945 2,601 2,682 4,874 7,8468 Uninsured working-age (18-64) persons 8,401 1,716 1,171 2,085 1,841 2,1238 Uninsured rate for working-age (%) 17.6 21.3 14.3 7.6 17.8 10.22 Renters paying 35%+ of income on rent 82,333 1,298 1,112 2,921 3,286 4,8022 Cost-burdened renter households (%) 43.7 31.9 39.7 30.2 41.7 399 Foreclosure fi l ings 11,544 198 191 886 444 7959 Foreclosure rate per 1000 units 18.5 8.7 11.4 13.8 11.7 13.7
Appendix: Tables and Figures
Ohio Counties, continued
Table 9. Population, poverty rates, and economic need data, Ohio counties, continued
Sources: (1) U.S. Census Bureau, Annual Population Estimates; (2) U.S. Census Bureau, American Community Survey (ACS), 5-year estimates for 2006–2010; (3) U.S. Census Bureau, Decennial Census; (4) U.S. Census Bureau, Small Area Income and Population Estimates (SAIPE); (5) Ohio Department of Job and Family Services, Ohio LMI, Local Area Unemployment Statistics (LAUS), August 2012; (6) Ohio Department of Job and Family Services, Ohio LMI, Public Assistance Monthly Statistics (PAMS), state fiscal year 2011; (7) Ohio Department of Development, Office of Community Services, LI-HEAP program year 2011; (8) Ohio Department of Health, Ohio Family Health Survey 2008; (9) Policy Matters Ohio, “Home Insecurity: Foreclosures and Housing in 2012” (2011 filings) Notes: The first column identifies the source of the data by number. For (2), 5-year estimates, rather than 1-year estimates, are used in this appendix for full data availability across Ohio’s 88 counties. For county poverty rates by race or Hispanic ethnicity, data are suppressed here if the denominator is fewer than 250 individuals. For (4), State of Ohio numbers represent ACS 1-year estimates. For (5) Unemployment rates are not seasonally adjusted.
State of Poverty 2012 21
Fayette Frankl in Fulton Gal l ia Geauga Greene
Population and population change 1 Total population 2011 28,985 1,178,799 42,510 30,970 93,228 162,8462 Population l iving in group quarters 409 22405 374 1020 1722 96312 Minori ty population (%) 5.9 31.6 9.1 5.7 3.7 14.31 Population change 2002–2011 -3 90,692 -52 -182 6,596 11,0281 Percentage change (%) 0.0 8.3 -0.1 -0.6 7.1 7.3
Poverty rates, historic and recent
3 In 1969 (%) 16.1 10.7 6.2 22.8 5.9 7.43 In 1979 (%) 14.4 12.3 8.1 14.9 4.7 7.93 In 1989 (%) 16.2 13.0 6.2 22.5 5.6 9.53 In 1999 (%) 10.1 11.6 5.4 18.1 4.6 8.54 In 2009 (%) 20.3 18.4 9.1 20.9 7.9 12.34 In 2010 (%) 16.2 18.8 10.9 18.2 7.8 13.14 Poverty count in 2010 4,607 213,899 4,581 5,463 7,207 20,032
Poverty rates, 5-year averages2 Overal l (%) 17.4 17.0 10.5 21.3 7.6 11.42 Male (%) 17.1 16.0 9.4 19.5 6.6 10.22 Female (%) 17.7 18.0 11.5 23.0 8.6 12.62 Under age 5 (%) 34.4 27.0 19.0 38.7 13.6 20.62 Under age 18 (%) 22.6 23.0 14.4 30.7 10.8 15.32 Age 65 and over (%) 9.6 9.4 5.4 14.9 6.4 5.12 White, non-Hispanic (%) 18.1 12.0 9.3 20.6 7.3 9.72 Black/African American (%) 5.1 30.6 15.4 44.5 28.0 35.62 As ian (%) 0.0 15.1 0.0 0.0 2.5 6.52 Hispanic or Latino (%) 5.5 28.7 24.3 27.8 14.4 10.22 < 50% FPL, i .e., severe poverty (%) 6.0 9.0 4.5 8.2 3.2 5.72 < 200% FPL, i .e., below sel f-sufficiency (%) 37.6 33.8 29.2 44.6 21.9 24.1
Other measures of economic need
5 Unemployed persons , August 2012 1,100 37,700 1,500 1,100 2,700 5,3005 Unemployment rate 6.9 6.0 6.7 8.4 5.3 6.76 SNAP recipients 5,466 198,835 3,994 6,915 3,859 13,5896 Medica id el igible persons 6,958 235,648 5,990 8,146 5,915 18,8757 LI-HEAP recipients 2,530 54,357 2,124 3,647 2,148 4,9948 Uninsured working-age (18-64) persons 911 8,073 827 955 1,839 1,9728 Uninsured rate for working-age (%) 20.2 18.9 7.5 20.9 10.7 7.82 Renters paying 35%+ of income on rent 1,289 73,479 905 1,310 1,493 8,0112 Cost-burdened renter households (%) 35.4 40 32.7 51.8 36.6 44.29 Foreclosure fi l ings 181 7,834 222 100 463 7659 Foreclosure rate per 1000 units 14.3 15.0 12.8 7.2 12.8 11.4
Appendix: Tables and Figures
Ohio Counties, continued
Table 9. Population, poverty rates, and economic need data, Ohio counties, continued
Sources: (1) U.S. Census Bureau, Annual Population Estimates; (2) U.S. Census Bureau, American Community Survey (ACS), 5-year estimates for 2006–2010; (3) U.S. Census Bureau, Decennial Census; (4) U.S. Census Bureau, Small Area Income and Population Estimates (SAIPE); (5) Ohio Department of Job and Family Services, Ohio LMI, Local Area Unemployment Statistics (LAUS), August 2012; (6) Ohio Department of Job and Family Services, Ohio LMI, Public Assistance Monthly Statistics (PAMS), state fiscal year 2011; (7) Ohio Department of Development, Office of Community Services, LI-HEAP program year 2011; (8) Ohio Department of Health, Ohio Family Health Survey 2008; (9) Policy Matters Ohio, “Home Insecurity: Foreclosures and Housing in 2012” (2011 filings) Notes: The first column identifies the source of the data by number. For (2), 5-year estimates, rather than 1-year estimates, are used in this appendix for full data availability across Ohio’s 88 counties. For county poverty rates by race or Hispanic ethnicity, data are suppressed here if the denominator is fewer than 250 individuals. For (4), State of Ohio numbers represent ACS 1-year estimates. For (5) Unemployment rates are not seasonally adjusted.
22 Ohio Association of Community Action Agencies
Guernsey Hami l ton Hancock Hardin Harrison Henry
Population and population change 1 Total population 2011 39,927 800,362 75,056 32,020 15,850 28,0642 Population l iving in group quarters 276 17679 1936 2248 205 7412 Minori ty population (%) 4.6 31.6 9.0 3.8 4.1 8.11 Population change 2002–2011 -1,069 4,482 2,713 -180 -459 -6941 Percentage change (%) -2.6 0.5 3.7 -0.6 -2.9 -2.4
Poverty rates, historic and recent
3 In 1969 (%) 14.7 11.2 7.2 14.5 17.3 7.93 In 1979 (%) 12.6 11.3 6.5 12.9 11.0 5.73 In 1989 (%) 17.5 13.3 7.3 16.4 19.7 7.03 In 1999 (%) 16.0 11.8 7.5 13.2 13.3 7.04 In 2009 (%) 20.5 15.2 11.0 16.2 17.7 10.84 In 2010 (%) 19.1 18.5 11.9 17.2 17.8 12.94 Poverty count in 2010 7,551 144,741 8,671 5,102 2,765 3,572
Poverty rates, 5-year averages2 Overal l (%) 17.3 15.4 11.4 16.2 18.4 10.62 Male (%) 14.9 13.8 10.2 16.2 16.4 9.62 Female (%) 19.6 16.8 12.4 16.2 20.4 11.62 Under age 5 (%) 33.4 28.9 22.5 24.9 34.4 18.02 Under age 18 (%) 26.7 22.9 15.2 18.5 26.3 13.52 Age 65 and over (%) 9.5 9.0 5.7 6.0 12.6 5.92 White, non-Hispanic (%) 16.9 8.6 9.9 15.7 17.5 9.62 Black/African American (%) 27.9 31.6 37.6 26.3 28.6 23.12 As ian (%) 4.3 12.1 7.3 6.4 53.8 0.02 Hispanic or Latino (%) 0.0 34.7 30.2 36.9 30.0 21.52 < 50% FPL, i .e., severe poverty (%) 8.2 7.3 5.0 9.0 5.5 4.42 < 200% FPL, i .e., below sel f-sufficiency (%) 38.2 30.9 29.7 35.5 37.6 29.1
Other measures of economic need
5 Unemployed persons , August 2012 1,400 28,100 2,200 1,000 600 1,0005 Unemployment rate 7.4 6.8 5.6 7.0 8.0 6.56 SNAP recipients 8,101 130,662 7,622 3,753 2,838 2,7156 Medica id el igible persons 10,063 149,185 10,404 5,427 3,434 4,1007 LI-HEAP recipients 5,297 28,052 3,952 2,052 2,010 1,6398 Uninsured working-age (18-64) persons 1,702 6,521 1,812 303 908 7978 Uninsured rate for working-age (%) 27.6 16.4 17.1 5.6 33.3 11.12 Renters paying 35%+ of income on rent 1,611 49,756 3,079 1,367 572 5512 Cost-burdened renter households (%) 41.4 41.7 38 44.1 46.1 27.79 Foreclosure fi l ings 198 5,834 336 172 56 1119 Foreclosure rate per 1000 units 10.3 15.4 10.2 13.1 6.9 9.3
Appendix: Tables and Figures
Ohio Counties, continued
Table 9. Population, poverty rates, and economic need data, Ohio counties, continued
Sources: (1) U.S. Census Bureau, Annual Population Estimates; (2) U.S. Census Bureau, American Community Survey (ACS), 5-year estimates for 2006–2010; (3) U.S. Census Bureau, Decennial Census; (4) U.S. Census Bureau, Small Area Income and Population Estimates (SAIPE); (5) Ohio Department of Job and Family Services, Ohio LMI, Local Area Unemployment Statistics (LAUS), August 2012; (6) Ohio Department of Job and Family Services, Ohio LMI, Public Assistance Monthly Statistics (PAMS), state fiscal year 2011; (7) Ohio Department of Development, Office of Community Services, LI-HEAP program year 2011; (8) Ohio Department of Health, Ohio Family Health Survey 2008; (9) Policy Matters Ohio, “Home Insecurity: Foreclosures and Housing in 2012” (2011 filings) Notes: The first column identifies the source of the data by number. For (2), 5-year estimates, rather than 1-year estimates, are used in this appendix for full data availability across Ohio’s 88 counties. For county poverty rates by race or Hispanic ethnicity, data are suppressed here if the denominator is fewer than 250 individuals. For (4), State of Ohio numbers represent ACS 1-year estimates. For (5) Unemployment rates are not seasonally adjusted.
State of Poverty 2012 23
Highland Hocking Holmes Huron Jackson Jefferson Knox
Population and population change 1 Total population 2011 43,433 29,394 42,746 59,496 33,186 68,828 61,2752 Population l iving in group quarters 491 793 841 830 181 2651 33682 Minori ty population (%) 3.9 2.8 1.7 8.0 3.2 8.7 3.71 Population change 2002–2011 721 471 2,329 -94 797 -5,912 4,7671 Percentage change (%) 1.7 1.7 5.8 -0.2 2.4 -8.2 8.5
Poverty rates, historic and recent
3 In 1969 (%) 18.7 18.2 20.2 8.5 24.6 10.7 10.73 In 1979 (%) 15.0 12.4 18.2 7.5 16.6 10.2 11.63 In 1989 (%) 16.5 15.7 17.2 9.5 24.2 17.1 12.53 In 1999 (%) 11.8 13.5 12.9 8.5 16.5 15.1 10.14 In 2009 (%) 16.5 16.8 15.0 12.4 22.9 17.6 13.24 In 2010 (%) 18.6 16.2 16.5 14.0 22.5 18.6 16.54 Poverty count in 2010 7,972 4,635 6,858 8,202 7,377 12,532 9,490
Poverty rates, 5-year averages2 Overal l (%) 16.2 15.3 13.3 14.5 23.3 17.7 13.12 Male (%) 14.8 13.1 12.0 13.0 20.3 15.4 11.92 Female (%) 17.5 17.5 14.6 16.0 26.2 19.8 14.22 Under age 5 (%) 27.9 31.9 23.5 27.3 37.5 35.6 23.42 Under age 18 (%) 22.2 20.7 18.9 23.3 36.5 29.5 18.82 Age 65 and over (%) 12.7 10.8 6.9 7.0 11.5 7.7 9.52 White, non-Hispanic (%) 14.9 15.1 13.3 12.7 22.9 15.5 12.92 Black/African American (%) 48.4 7.7 16.1 19.8 25.9 42.5 42.92 As ian (%) 0.0 14.0 0.0 12.2 0.0 6.1 4.02 Hispanic or Latino (%) 40.5 16.7 18.5 45.9 46.8 40.0 11.72 < 50% FPL, i .e., severe poverty (%) 6.6 5.6 5.0 6.0 10.1 9.1 5.92 < 200% FPL, i .e., below sel f-sufficiency (%) 40.7 37.8 42.0 34.3 48.5 38.3 33.7
Other measures of economic need
5 Unemployed persons , August 2012 1,700 1,000 900 2,200 1,200 3,300 1,9005 Unemployment rate 9.3 7.2 4.5 8.0 8.5 10.6 6.56 SNAP recipients 9,122 5,921 2,041 9,036 7,440 12,287 8,1066 Medica id el igible persons 10,707 7,053 3,958 11,475 9,471 14,197 10,3607 LI-HEAP recipients 5,221 3,518 1,267 5,141 5,096 7,702 3,5258 Uninsured working-age (18-64) persons 1,660 1,106 1,607 2,150 1,232 2,145 1,6048 Uninsured rate for working-age (%) 25.4 18.0 26.9 28.4 18.8 19.5 16.22 Renters paying 35%+ of income on rent 1,532 915 596 1,979 1,333 2,945 2,1362 Cost-burdened renter households (%) 39.6 37.1 29 37.8 37.6 43.5 42.29 Foreclosure fi l ings 262 152 105 303 157 280 4219 Foreclosure rate per 1000 units 13.7 11.5 7.8 12.1 10.8 8.5 17.0
Appendix: Tables and Figures
Ohio Counties, continued
Table 9. Population, poverty rates, and economic need data, Ohio counties, continued
Sources: (1) U.S. Census Bureau, Annual Population Estimates; (2) U.S. Census Bureau, American Community Survey (ACS), 5-year estimates for 2006–2010; (3) U.S. Census Bureau, Decennial Census; (4) U.S. Census Bureau, Small Area Income and Population Estimates (SAIPE); (5) Ohio Department of Job and Family Services, Ohio LMI, Local Area Unemployment Statistics (LAUS), August 2012; (6) Ohio Department of Job and Family Services, Ohio LMI, Public Assistance Monthly Statistics (PAMS), state fiscal year 2011; (7) Ohio Department of Development, Office of Community Services, LI-HEAP program year 2011; (8) Ohio Department of Health, Ohio Family Health Survey 2008; (9) Policy Matters Ohio, “Home Insecurity: Foreclosures and Housing in 2012” (2011 filings) Notes: The first column identifies the source of the data by number. For (2), 5-year estimates, rather than 1-year estimates, are used in this appendix for full data availability across Ohio’s 88 counties. For county poverty rates by race or Hispanic ethnicity, data are suppressed here if the denominator is fewer than 250 individuals. For (4), State of Ohio numbers represent ACS 1-year estimates. For (5) Unemployment rates are not seasonally adjusted.
24 Ohio Association of Community Action Agencies
Lake Lawrence Licking Logan Lora in Lucas
Population and population change 1 Total population 2011 229,885 62,489 167,248 45,688 301,614 440,0052 Population l iving in group quarters 2754 1118 3589 873 10097 84692 Minori ty population (%) 8.5 4.5 7.1 5.2 19.3 28.11 Population change 2002–2011 6,255 596 12,215 311 18,442 1,6791 Percentage change (%) 2.7 1.0 8.2 0.7 6.4 0.4
Poverty rates, historic and recent
3 In 1969 (%) 4.3 20.2 10.9 12.7 7.5 9.83 In 1979 (%) 4.0 15.2 8.1 11.1 8.4 11.53 In 1989 (%) 4.9 23.5 10.5 10.5 11.5 15.33 In 1999 (%) 5.1 18.9 7.5 9.3 9.0 13.94 In 2009 (%) 8.2 19.6 11.7 14.0 14.4 18.74 In 2010 (%) 9.6 21.4 12.4 16.9 14.3 19.84 Poverty count in 2010 21,826 13,149 20,190 7,644 41,612 85,269
Poverty rates, 5-year averages2 Overal l (%) 8.1 19.4 11.1 14.8 13.1 18.02 Male (%) 7.4 18.1 10.0 12.8 11.9 16.32 Female (%) 8.7 20.7 12.2 16.7 14.3 19.62 Under age 5 (%) 17.5 36.9 22.0 34.5 26.3 30.72 Under age 18 (%) 13.0 28.0 15.7 25.3 20.5 25.42 Age 65 and over (%) 4.4 11.9 6.5 7.1 8.0 8.72 White, non-Hispanic (%) 6.4 19.3 10.3 13.8 8.9 12.02 Black/African American (%) 25.7 22.1 22.3 24.4 39.8 37.42 As ian (%) 1.5 0.0 3.1 5.7 3.5 16.72 Hispanic or Latino (%) 35.2 0.0 18.8 36.7 30.5 28.62 < 50% FPL, i .e., severe poverty (%) 3.9 6.8 4.5 5.1 6.1 8.72 < 200% FPL, i .e., below sel f-sufficiency (%) 22.3 42.6 27.4 33.9 28.8 37.0
Other measures of economic need
5 Unemployed persons , August 2012 7,800 2,100 5,200 1,500 11,200 15,9005 Unemployment rate 6.0 7.4 6.1 6.6 7.1 7.66 SNAP recipients 21,221 13,967 20,993 7,305 41,431 90,3866 Medica id el igible persons 25,208 16,961 26,367 8,359 49,061 101,3107 LI-HEAP recipients 6,962 8,030 7,238 3,691 12,611 30,8958 Uninsured working-age (18-64) persons 3,346 1,916 2,755 1,652 3,752 4,8518 Uninsured rate for working-age (%) 14.2 23.6 12.9 19.2 15.9 19.52 Renters paying 35%+ of income on rent 7,715 1,996 5,386 1,718 11,280 26,0652 Cost-burdened renter households (%) 37.7 35.9 36.7 38.7 41.7 44.99 Foreclosure fi l ings 1,609 216 983 278 1,742 3,2379 Foreclosure rate per 1000 units 16.0 7.8 14.4 12.0 13.9 16.0
Appendix: Tables and Figures
Ohio Counties, continued
Table 9. Population, poverty rates, and economic need data, Ohio counties, continued
Sources: (1) U.S. Census Bureau, Annual Population Estimates; (2) U.S. Census Bureau, American Community Survey (ACS), 5-year estimates for 2006–2010; (3) U.S. Census Bureau, Decennial Census; (4) U.S. Census Bureau, Small Area Income and Population Estimates (SAIPE); (5) Ohio Department of Job and Family Services, Ohio LMI, Local Area Unemployment Statistics (LAUS), August 2012; (6) Ohio Department of Job and Family Services, Ohio LMI, Public Assistance Monthly Statistics (PAMS), state fiscal year 2011; (7) Ohio Department of Development, Office of Community Services, LI-HEAP program year 2011; (8) Ohio Department of Health, Ohio Family Health Survey 2008; (9) Policy Matters Ohio, “Home Insecurity: Foreclosures and Housing in 2012” (2011 filings) Notes: The first column identifies the source of the data by number. For (2), 5-year estimates, rather than 1-year estimates, are used in this appendix for full data availability across Ohio’s 88 counties. For county poverty rates by race or Hispanic ethnicity, data are suppressed here if the denominator is fewer than 250 individuals. For (4), State of Ohio numbers represent ACS 1-year estimates. For (5) Unemployment rates are not seasonally adjusted.
State of Poverty 2012 25
Madison Mahoning Marion Medina Meigs Mercer
Population and population change 1 Total population 2011 43,401 237,270 66,212 173,262 23,680 40,8382 Population l iving in group quarters 5476 6538 5668 1161 0 3272 Minori ty population (%) 9.8 22.0 9.9 5.0 2.7 3.01 Population change 2002–2011 2,418 -21,320 -844 20,429 -275 -2531 Percentage change (%) 6.0 -8.5 -1.3 12.9 -1.2 -0.6
Poverty rates, historic and recent
3 In 1969 (%) 11.2 9.2 9.1 5.2 23.9 7.73 In 1979 (%) 9.7 11.0 10.7 4.4 16.7 7.43 In 1989 (%) 8.4 15.9 12.7 5.5 26.0 6.73 In 1999 (%) 7.8 12.5 9.7 4.6 19.8 6.44 In 2009 (%) 14.2 18.3 17.3 6.6 20.0 9.14 In 2010 (%) 15.0 17.1 19.3 7.6 23.5 9.64 Poverty count in 2010 5,726 39,360 11,776 12,951 5,518 3,857
Poverty rates, 5-year averages2 Overal l (%) 11.7 16.6 17.3 6.3 20.8 8.32 Male (%) 12.1 14.6 15.5 5.1 18.3 7.32 Female (%) 11.3 18.4 19.1 7.4 23.3 9.32 Under age 5 (%) 19.9 32.4 36.4 10.1 44.2 15.12 Under age 18 (%) 16.1 25.9 24.6 8.6 31.9 8.92 Age 65 and over (%) 6.1 10.0 9.4 5.6 12.3 7.72 White, non-Hispanic (%) 10.2 11.0 16.0 5.5 20.2 8.32 Black/African American (%) 46.1 39.6 39.5 34.9 50.8 0.02 As ian (%) 12.3 24.4 5.8 11.8 66.7 7.42 Hispanic or Latino (%) 45.7 31.5 29.9 11.1 58.4 8.82 < 50% FPL, i .e., severe poverty (%) 5.3 6.9 6.4 2.5 7.9 2.92 < 200% FPL, i .e., below sel f-sufficiency (%) 29.6 36.0 39.6 17.9 47.0 25.2
Other measures of economic need
5 Unemployed persons , August 2012 1,300 8,200 2,200 5,500 1,000 1,0005 Unemployment rate 6.3 7.3 7.5 5.7 11.1 4.16 SNAP recipients 5,152 46,566 11,886 10,432 5,530 3,2246 Medica id el igible persons 6,275 49,946 13,853 14,643 6,299 4,5497 LI-HEAP recipients 2,461 19,730 4,576 4,818 3,017 1,9948 Uninsured working-age (18-64) persons 1,183 3,066 1,614 2,555 1,249 6658 Uninsured rate for working-age (%) 16.0 15.0 16.3 10.5 29.4 8.72 Renters paying 35%+ of income on rent 1,200 11,137 2,841 4,230 634 1,0332 Cost-burdened renter households (%) 31.2 45 43 38.4 45.1 37.49 Foreclosure fi l ings 146 1,381 388 906 60 1179 Foreclosure rate per 1000 units 9.2 12.3 14.0 13.4 5.4 6.7
Appendix: Tables and Figures
Ohio Counties, continued
Table 9. Population, poverty rates, and economic need data, Ohio counties, continued
Sources: (1) U.S. Census Bureau, Annual Population Estimates; (2) U.S. Census Bureau, American Community Survey (ACS), 5-year estimates for 2006–2010; (3) U.S. Census Bureau, Decennial Census; (4) U.S. Census Bureau, Small Area Income and Population Estimates (SAIPE); (5) Ohio Department of Job and Family Services, Ohio LMI, Local Area Unemployment Statistics (LAUS), August 2012; (6) Ohio Department of Job and Family Services, Ohio LMI, Public Assistance Monthly Statistics (PAMS), state fiscal year 2011; (7) Ohio Department of Development, Office of Community Services, LI-HEAP program year 2011; (8) Ohio Department of Health, Ohio Family Health Survey 2008; (9) Policy Matters Ohio, “Home Insecurity: Foreclosures and Housing in 2012” (2011 filings) Notes: The first column identifies the source of the data by number. For (2), 5-year estimates, rather than 1-year estimates, are used in this appendix for full data availability across Ohio’s 88 counties. For county poverty rates by race or Hispanic ethnicity, data are suppressed here if the denominator is fewer than 250 individuals. For (4), State of Ohio numbers represent ACS 1-year estimates. For (5) Unemployment rates are not seasonally adjusted.
26 Ohio Association of Community Action Agencies
Miami Monroe Montgomery Morgan Morrow Muskingum
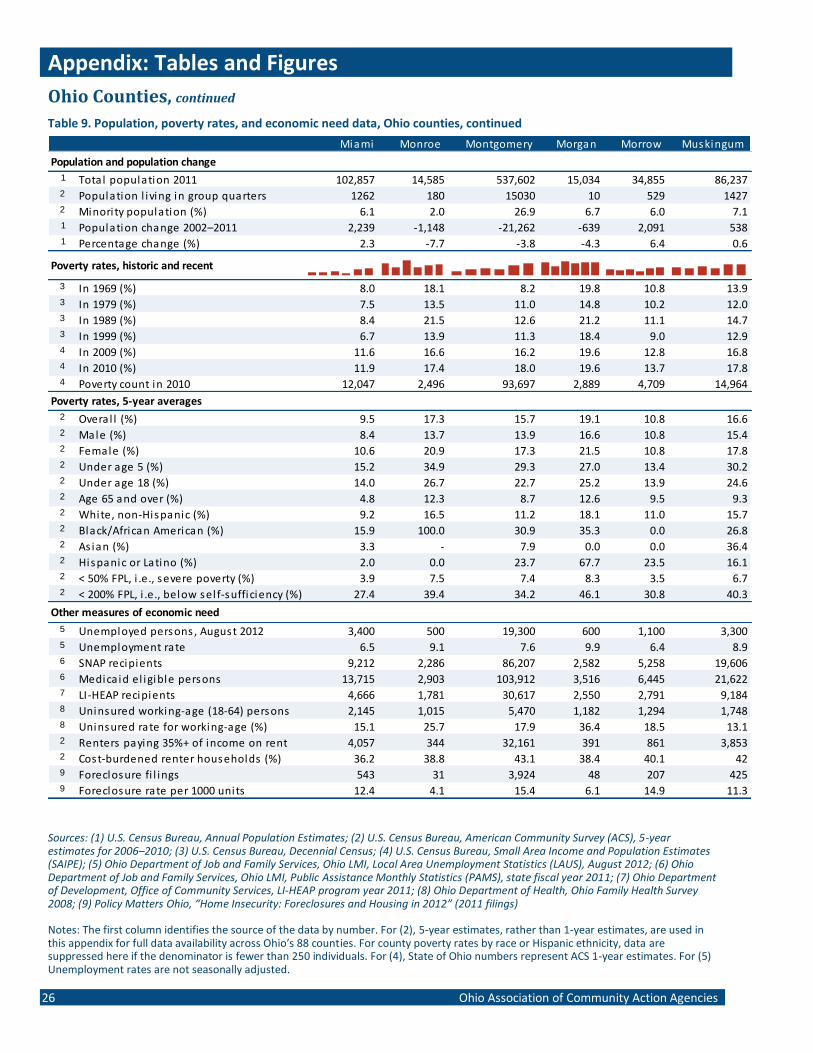
Population and population change 1 Total population 2011 102,857 14,585 537,602 15,034 34,855 86,2372 Population l iving in group quarters 1262 180 15030 10 529 14272 Minori ty population (%) 6.1 2.0 26.9 6.7 6.0 7.11 Population change 2002–2011 2,239 -1,148 -21,262 -639 2,091 5381 Percentage change (%) 2.3 -7.7 -3.8 -4.3 6.4 0.6
Poverty rates, historic and recent
3 In 1969 (%) 8.0 18.1 8.2 19.8 10.8 13.93 In 1979 (%) 7.5 13.5 11.0 14.8 10.2 12.03 In 1989 (%) 8.4 21.5 12.6 21.2 11.1 14.73 In 1999 (%) 6.7 13.9 11.3 18.4 9.0 12.94 In 2009 (%) 11.6 16.6 16.2 19.6 12.8 16.84 In 2010 (%) 11.9 17.4 18.0 19.6 13.7 17.84 Poverty count in 2010 12,047 2,496 93,697 2,889 4,709 14,964
Poverty rates, 5-year averages2 Overal l (%) 9.5 17.3 15.7 19.1 10.8 16.62 Male (%) 8.4 13.7 13.9 16.6 10.8 15.42 Female (%) 10.6 20.9 17.3 21.5 10.8 17.82 Under age 5 (%) 15.2 34.9 29.3 27.0 13.4 30.22 Under age 18 (%) 14.0 26.7 22.7 25.2 13.9 24.62 Age 65 and over (%) 4.8 12.3 8.7 12.6 9.5 9.32 White, non-Hispanic (%) 9.2 16.5 11.2 18.1 11.0 15.72 Black/African American (%) 15.9 100.0 30.9 35.3 0.0 26.82 As ian (%) 3.3 - 7.9 0.0 0.0 36.42 Hispanic or Latino (%) 2.0 0.0 23.7 67.7 23.5 16.12 < 50% FPL, i .e., severe poverty (%) 3.9 7.5 7.4 8.3 3.5 6.72 < 200% FPL, i .e., below sel f-sufficiency (%) 27.4 39.4 34.2 46.1 30.8 40.3
Other measures of economic need
5 Unemployed persons , August 2012 3,400 500 19,300 600 1,100 3,3005 Unemployment rate 6.5 9.1 7.6 9.9 6.4 8.96 SNAP recipients 9,212 2,286 86,207 2,582 5,258 19,6066 Medica id el igible persons 13,715 2,903 103,912 3,516 6,445 21,6227 LI-HEAP recipients 4,666 1,781 30,617 2,550 2,791 9,1848 Uninsured working-age (18-64) persons 2,145 1,015 5,470 1,182 1,294 1,7488 Uninsured rate for working-age (%) 15.1 25.7 17.9 36.4 18.5 13.12 Renters paying 35%+ of income on rent 4,057 344 32,161 391 861 3,8532 Cost-burdened renter households (%) 36.2 38.8 43.1 38.4 40.1 429 Foreclosure fi l ings 543 31 3,924 48 207 4259 Foreclosure rate per 1000 units 12.4 4.1 15.4 6.1 14.9 11.3
Appendix: Tables and Figures
Ohio Counties, continued
Table 9. Population, poverty rates, and economic need data, Ohio counties, continued
Sources: (1) U.S. Census Bureau, Annual Population Estimates; (2) U.S. Census Bureau, American Community Survey (ACS), 5-year estimates for 2006–2010; (3) U.S. Census Bureau, Decennial Census; (4) U.S. Census Bureau, Small Area Income and Population Estimates (SAIPE); (5) Ohio Department of Job and Family Services, Ohio LMI, Local Area Unemployment Statistics (LAUS), August 2012; (6) Ohio Department of Job and Family Services, Ohio LMI, Public Assistance Monthly Statistics (PAMS), state fiscal year 2011; (7) Ohio Department of Development, Office of Community Services, LI-HEAP program year 2011; (8) Ohio Department of Health, Ohio Family Health Survey 2008; (9) Policy Matters Ohio, “Home Insecurity: Foreclosures and Housing in 2012” (2011 filings) Notes: The first column identifies the source of the data by number. For (2), 5-year estimates, rather than 1-year estimates, are used in this appendix for full data availability across Ohio’s 88 counties. For county poverty rates by race or Hispanic ethnicity, data are suppressed here if the denominator is fewer than 250 individuals. For (4), State of Ohio numbers represent ACS 1-year estimates. For (5) Unemployment rates are not seasonally adjusted.
State of Poverty 2012 27
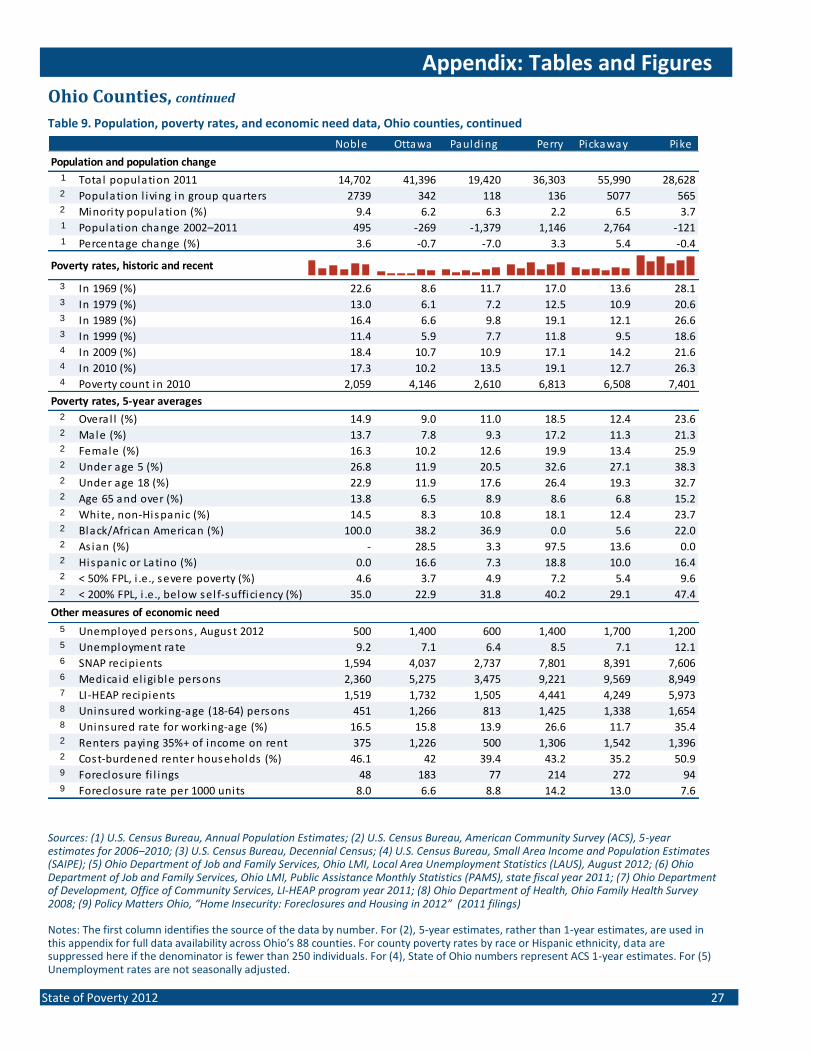
Noble Ottawa Paulding Perry Pickaway Pike
Population and population change 1 Total population 2011 14,702 41,396 19,420 36,303 55,990 28,6282 Population l iving in group quarters 2739 342 118 136 5077 5652 Minori ty population (%) 9.4 6.2 6.3 2.2 6.5 3.71 Population change 2002–2011 495 -269 -1,379 1,146 2,764 -1211 Percentage change (%) 3.6 -0.7 -7.0 3.3 5.4 -0.4
Poverty rates, historic and recent
3 In 1969 (%) 22.6 8.6 11.7 17.0 13.6 28.13 In 1979 (%) 13.0 6.1 7.2 12.5 10.9 20.63 In 1989 (%) 16.4 6.6 9.8 19.1 12.1 26.63 In 1999 (%) 11.4 5.9 7.7 11.8 9.5 18.64 In 2009 (%) 18.4 10.7 10.9 17.1 14.2 21.64 In 2010 (%) 17.3 10.2 13.5 19.1 12.7 26.34 Poverty count in 2010 2,059 4,146 2,610 6,813 6,508 7,401
Poverty rates, 5-year averages2 Overal l (%) 14.9 9.0 11.0 18.5 12.4 23.62 Male (%) 13.7 7.8 9.3 17.2 11.3 21.32 Female (%) 16.3 10.2 12.6 19.9 13.4 25.92 Under age 5 (%) 26.8 11.9 20.5 32.6 27.1 38.32 Under age 18 (%) 22.9 11.9 17.6 26.4 19.3 32.72 Age 65 and over (%) 13.8 6.5 8.9 8.6 6.8 15.22 White, non-Hispanic (%) 14.5 8.3 10.8 18.1 12.4 23.72 Black/African American (%) 100.0 38.2 36.9 0.0 5.6 22.02 As ian (%) - 28.5 3.3 97.5 13.6 0.02 Hispanic or Latino (%) 0.0 16.6 7.3 18.8 10.0 16.42 < 50% FPL, i .e., severe poverty (%) 4.6 3.7 4.9 7.2 5.4 9.62 < 200% FPL, i .e., below sel f-sufficiency (%) 35.0 22.9 31.8 40.2 29.1 47.4
Other measures of economic need
5 Unemployed persons , August 2012 500 1,400 600 1,400 1,700 1,2005 Unemployment rate 9.2 7.1 6.4 8.5 7.1 12.16 SNAP recipients 1,594 4,037 2,737 7,801 8,391 7,6066 Medica id el igible persons 2,360 5,275 3,475 9,221 9,569 8,9497 LI-HEAP recipients 1,519 1,732 1,505 4,441 4,249 5,9738 Uninsured working-age (18-64) persons 451 1,266 813 1,425 1,338 1,6548 Uninsured rate for working-age (%) 16.5 15.8 13.9 26.6 11.7 35.42 Renters paying 35%+ of income on rent 375 1,226 500 1,306 1,542 1,3962 Cost-burdened renter households (%) 46.1 42 39.4 43.2 35.2 50.99 Foreclosure fi l ings 48 183 77 214 272 949 Foreclosure rate per 1000 units 8.0 6.6 8.8 14.2 13.0 7.6

Appendix: Tables and Figures
Ohio Counties, continued
Table 9. Population, poverty rates, and economic need data, Ohio counties, continued
Sources: (1) U.S. Census Bureau, Annual Population Estimates; (2) U.S. Census Bureau, American Community Survey (ACS), 5-year estimates for 2006–2010; (3) U.S. Census Bureau, Decennial Census; (4) U.S. Census Bureau, Small Area Income and Population Estimates (SAIPE); (5) Ohio Department of Job and Family Services, Ohio LMI, Local Area Unemployment Statistics (LAUS), August 2012; (6) Ohio Department of Job and Family Services, Ohio LMI, Public Assistance Monthly Statistics (PAMS), state fiscal year 2011; (7) Ohio Department of Development, Office of Community Services, LI-HEAP program year 2011; (8) Ohio Department of Health, Ohio Family Health Survey 2008; (9) Policy Matters Ohio, “Home Insecurity: Foreclosures and Housing in 2012” (2011 filings) Notes: The first column identifies the source of the data by number. For (2), 5-year estimates, rather than 1-year estimates, are used in this appendix for full data availability across Ohio’s 88 counties. For county poverty rates by race or Hispanic ethnicity, data are suppressed here if the denominator is fewer than 250 individuals. For (4), State of Ohio numbers represent ACS 1-year estimates. For (5) Unemployment rates are not seasonally adjusted.
28 Ohio Association of Community Action Agencies
Portage Preble Putnam Richland Ross Sandusky
Population and population change 1 Total population 2011 161,624 42,083 34,294 123,510 78,249 60,7342 Population l iving in group quarters 7767 491 200 7073 6774 8322 Minori ty population (%) 8.3 2.5 6.3 13.2 9.8 13.21 Population change 2002–2011 4,397 -1,441 -640 -5,652 2,753 -2,0281 Percentage change (%) 2.9 -3.4 -1.8 -4.4 3.7 -3.3
Poverty rates, historic and recent
3 In 1969 (%) 9.7 7.7 9.5 9.1 15.8 8.83 In 1979 (%) 9.4 9.2 6.7 9.4 11.7 7.53 In 1989 (%) 11.9 10.2 5.8 11.3 17.7 9.03 In 1999 (%) 9.3 6.1 5.6 10.6 12.0 7.54 In 2009 (%) 14.3 10.3 7.5 14.8 18.3 12.24 In 2010 (%) 15.1 12.1 9.0 14.7 19.3 12.34 Poverty count in 2010 23,146 5,022 3,062 17,202 13,798 7,355
Poverty rates, 5-year averages2 Overal l (%) 13.5 9.4 7.1 12.4 17.3 10.92 Male (%) 11.7 8.9 5.8 10.2 16.7 9.82 Female (%) 15.2 9.9 8.4 14.5 17.9 11.92 Under age 5 (%) 26.8 14.3 13.1 21.0 31.1 24.42 Under age 18 (%) 16.2 13.1 9.8 18.9 24.7 15.82 Age 65 and over (%) 4.4 6.8 7.0 8.2 8.2 6.52 White, non-Hispanic (%) 12.4 8.8 5.5 11.1 16.4 8.92 Black/African American (%) 26.0 63.6 44.4 22.4 14.6 31.82 As ian (%) 22.0 6.4 0.0 29.7 17.0 6.72 Hispanic or Latino (%) 27.1 36.1 34.8 21.3 21.2 23.42 < 50% FPL, i .e., severe poverty (%) 6.7 4.3 2.8 4.7 6.1 5.22 < 200% FPL, i .e., below sel f-sufficiency (%) 29.1 29.6 20.9 32.7 37.8 29.8
Other measures of economic need
5 Unemployed persons , August 2012 5,500 1,400 1,000 4,500 2,700 2,1005 Unemployment rate 6.0 7.0 5.2 7.7 7.7 6.36 SNAP recipients 16,974 5,257 2,533 20,152 16,580 7,0796 Medica id el igible persons 19,679 6,959 3,635 24,140 18,309 10,2817 LI-HEAP recipients 7,139 2,418 1,617 9,258 8,840 2,9308 Uninsured working-age (18-64) persons 2,655 1,217 692 2,637 2,050 1,4218 Uninsured rate for working-age (%) 11.6 19.6 10.2 18.2 17.6 14.62 Renters paying 35%+ of income on rent 7,707 1,086 468 4,407 2,698 1,8402 Cost-burdened renter households (%) 43.4 34.7 26.6 34.1 42.5 34.99 Foreclosure fi l ings 792 330 86 717 349 2689 Foreclosure rate per 1000 units 11.8 18.4 6.3 13.1 10.9 10.2
Appendix: Tables and Figures
Ohio Counties, continued
Table 9. Population, poverty rates, and economic need data, Ohio counties, continued
Sources: (1) U.S. Census Bureau, Annual Population Estimates; (2) U.S. Census Bureau, American Community Survey (ACS), 5-year estimates for 2006–2010; (3) U.S. Census Bureau, Decennial Census; (4) U.S. Census Bureau, Small Area Income and Population Estimates (SAIPE); (5) Ohio Department of Job and Family Services, Ohio LMI, Local Area Unemployment Statistics (LAUS), August 2012; (6) Ohio Department of Job and Family Services, Ohio LMI, Public Assistance Monthly Statistics (PAMS), state fiscal year 2011; (7) Ohio Department of Development, Office of Community Services, LI-HEAP program year 2011; (8) Ohio Department of Health, Ohio Family Health Survey 2008; (9) Policy Matters Ohio, “Home Insecurity: Foreclosures and Housing in 2012” (2011 filings) Notes: The first column identifies the source of the data by number. For (2), 5-year estimates, rather than 1-year estimates, are used in this appendix for full data availability across Ohio’s 88 counties. For county poverty rates by race or Hispanic ethnicity, data are suppressed here if the denominator is fewer than 250 individuals. For (4), State of Ohio numbers represent ACS 1-year estimates. For (5) Unemployment rates are not seasonally adjusted.
State of Poverty 2012 29
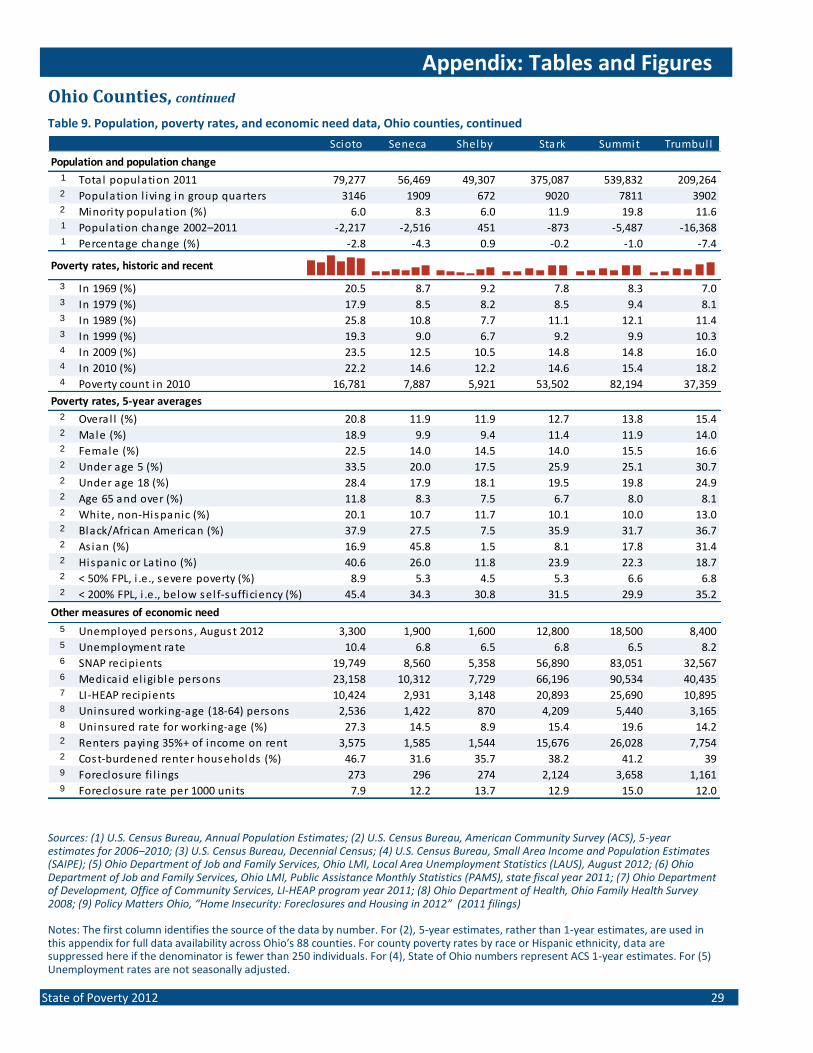
Scioto Seneca Shelby Stark Summit Trumbul l
Population and population change 1 Total population 2011 79,277 56,469 49,307 375,087 539,832 209,2642 Population l iving in group quarters 3146 1909 672 9020 7811 39022 Minori ty population (%) 6.0 8.3 6.0 11.9 19.8 11.61 Population change 2002–2011 -2,217 -2,516 451 -873 -5,487 -16,3681 Percentage change (%) -2.8 -4.3 0.9 -0.2 -1.0 -7.4
Poverty rates, historic and recent
3 In 1969 (%) 20.5 8.7 9.2 7.8 8.3 7.03 In 1979 (%) 17.9 8.5 8.2 8.5 9.4 8.13 In 1989 (%) 25.8 10.8 7.7 11.1 12.1 11.43 In 1999 (%) 19.3 9.0 6.7 9.2 9.9 10.34 In 2009 (%) 23.5 12.5 10.5 14.8 14.8 16.04 In 2010 (%) 22.2 14.6 12.2 14.6 15.4 18.24 Poverty count in 2010 16,781 7,887 5,921 53,502 82,194 37,359
Poverty rates, 5-year averages2 Overal l (%) 20.8 11.9 11.9 12.7 13.8 15.42 Male (%) 18.9 9.9 9.4 11.4 11.9 14.02 Female (%) 22.5 14.0 14.5 14.0 15.5 16.62 Under age 5 (%) 33.5 20.0 17.5 25.9 25.1 30.72 Under age 18 (%) 28.4 17.9 18.1 19.5 19.8 24.92 Age 65 and over (%) 11.8 8.3 7.5 6.7 8.0 8.12 White, non-Hispanic (%) 20.1 10.7 11.7 10.1 10.0 13.02 Black/African American (%) 37.9 27.5 7.5 35.9 31.7 36.72 As ian (%) 16.9 45.8 1.5 8.1 17.8 31.42 Hispanic or Latino (%) 40.6 26.0 11.8 23.9 22.3 18.72 < 50% FPL, i .e., severe poverty (%) 8.9 5.3 4.5 5.3 6.6 6.82 < 200% FPL, i .e., below sel f-sufficiency (%) 45.4 34.3 30.8 31.5 29.9 35.2
Other measures of economic need
5 Unemployed persons , August 2012 3,300 1,900 1,600 12,800 18,500 8,4005 Unemployment rate 10.4 6.8 6.5 6.8 6.5 8.26 SNAP recipients 19,749 8,560 5,358 56,890 83,051 32,5676 Medica id el igible persons 23,158 10,312 7,729 66,196 90,534 40,4357 LI-HEAP recipients 10,424 2,931 3,148 20,893 25,690 10,8958 Uninsured working-age (18-64) persons 2,536 1,422 870 4,209 5,440 3,1658 Uninsured rate for working-age (%) 27.3 14.5 8.9 15.4 19.6 14.22 Renters paying 35%+ of income on rent 3,575 1,585 1,544 15,676 26,028 7,7542 Cost-burdened renter households (%) 46.7 31.6 35.7 38.2 41.2 399 Foreclosure fi l ings 273 296 274 2,124 3,658 1,1619 Foreclosure rate per 1000 units 7.9 12.2 13.7 12.9 15.0 12.0
Appendix: Tables and Figures
Ohio Counties, continued
Table 9. Population, poverty rates, and economic need data, Ohio counties, continued
Sources: (1) U.S. Census Bureau, Annual Population Estimates; (2) U.S. Census Bureau, American Community Survey (ACS), 5-year estimates for 2006–2010; (3) U.S. Census Bureau, Decennial Census; (4) U.S. Census Bureau, Small Area Income and Population Estimates (SAIPE); (5) Ohio Department of Job and Family Services, Ohio LMI, Local Area Unemployment Statistics (LAUS), August 2012; (6) Ohio Department of Job and Family Services, Ohio LMI, Public Assistance Monthly Statistics (PAMS), state fiscal year 2011; (7) Ohio Department of Development, Office of Community Services, LI-HEAP program year 2011; (8) Ohio Department of Health, Ohio Family Health Survey 2008; (9) Policy Matters Ohio, “Home Insecurity: Foreclosures and Housing in 2012” (2011 filings) Notes: The first column identifies the source of the data by number. For (2), 5-year estimates, rather than 1-year estimates, are used in this appendix for full data availability across Ohio’s 88 counties. For county poverty rates by race or Hispanic ethnicity, data are suppressed here if the denominator is fewer than 250 individuals. For (4), State of Ohio numbers represent ACS 1-year estimates. For (5) Unemployment rates are not seasonally adjusted.
30 Ohio Association of Community Action Agencies
Tuscarawas Union Van Wert Vinton Warren Washington
Population and population change 1 Total population 2011 92,508 52,764 28,601 13,367 214,910 61,7552 Population l iving in group quarters 1083 2956 337 132 6621 16742 Minori ty population (%) 3.9 7.3 4.6 2.4 10.2 3.81 Population change 2002–2011 -168 7,021 -1,142 195 47,058 -1,9981 Percentage change (%) -0.2 16.4 -3.9 1.5 26.9 -3.2
Poverty rates, historic and recent
3 In 1969 (%) 11.0 9.1 10.4 23.5 7.2 13.73 In 1979 (%) 9.0 8.4 6.7 17.6 7.3 9.83 In 1989 (%) 11.1 7.4 7.1 23.6 6.4 13.73 In 1999 (%) 9.4 4.6 5.5 20.0 4.2 11.44 In 2009 (%) 14.1 8.0 8.6 19.8 5.9 13.94 In 2010 (%) 14.7 8.2 12.5 21.8 5.9 15.74 Poverty count in 2010 13,381 4,064 3,535 2,891 12,316 9,399
Poverty rates, 5-year averages2 Overal l (%) 12.8 6.4 8.8 19.5 6.0 15.22 Male (%) 11.2 5.3 9.0 18.1 4.9 14.42 Female (%) 14.3 7.5 8.6 21.0 7.0 16.02 Under age 5 (%) 22.0 10.3 11.7 18.8 8.9 30.92 Under age 18 (%) 17.7 7.9 12.7 25.8 7.6 22.52 Age 65 and over (%) 10.2 6.2 6.6 13.3 5.2 10.02 White, non-Hispanic (%) 12.0 6.5 8.6 19.0 5.9 14.72 Black/African American (%) 53.8 0.0 44.6 - 6.6 44.52 As ian (%) 0.0 0.8 3.5 100.0 1.4 4.12 Hispanic or Latino (%) 34.5 4.0 10.4 100.0 9.3 20.92 < 50% FPL, i .e., severe poverty (%) 5.2 3.3 3.7 9.3 2.6 6.42 < 200% FPL, i .e., below sel f-sufficiency (%) 34.7 19.2 32.7 46.3 16.1 35.5
Other measures of economic need
5 Unemployed persons , August 2012 2,900 1,500 1,000 500 6,700 2,0005 Unemployment rate 6.2 5.4 6.8 9.9 6.0 6.16 SNAP recipients 13,129 3,966 3,186 3,804 10,378 7,7706 Medica id el igible persons 16,346 5,376 4,463 4,312 16,470 11,0017 LI-HEAP recipients 6,214 2,205 1,787 2,365 4,176 5,0408 Uninsured working-age (18-64) persons 2,106 1,451 1,146 867 2,635 1,6938 Uninsured rate for working-age (%) 20.6 14.3 16.4 32.1 12.4 18.22 Renters paying 35%+ of income on rent 3,185 1,062 556 561 4,905 2,3442 Cost-burdened renter households (%) 38.4 28.4 31.7 55.9 35 41.39 Foreclosure fi l ings 340 291 133 41 1,242 1529 Foreclosure rate per 1000 units 8.5 15.2 10.5 6.6 15.7 5.4
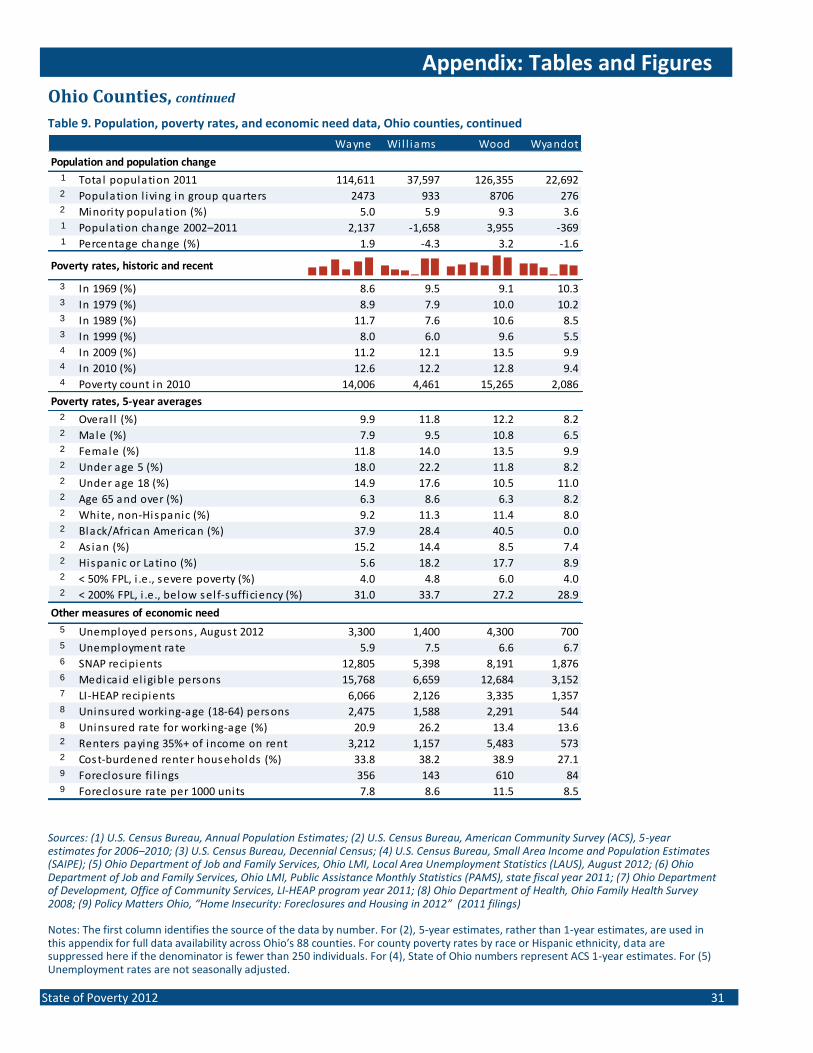
Appendix: Tables and Figures
Ohio Counties, continued
Table 9. Population, poverty rates, and economic need data, Ohio counties, continued
Sources: (1) U.S. Census Bureau, Annual Population Estimates; (2) U.S. Census Bureau, American Community Survey (ACS), 5-year estimates for 2006–2010; (3) U.S. Census Bureau, Decennial Census; (4) U.S. Census Bureau, Small Area Income and Population Estimates (SAIPE); (5) Ohio Department of Job and Family Services, Ohio LMI, Local Area Unemployment Statistics (LAUS), August 2012; (6) Ohio Department of Job and Family Services, Ohio LMI, Public Assistance Monthly Statistics (PAMS), state fiscal year 2011; (7) Ohio Department of Development, Office of Community Services, LI-HEAP program year 2011; (8) Ohio Department of Health, Ohio Family Health Survey 2008; (9) Policy Matters Ohio, “Home Insecurity: Foreclosures and Housing in 2012” (2011 filings) Notes: The first column identifies the source of the data by number. For (2), 5-year estimates, rather than 1-year estimates, are used in this appendix for full data availability across Ohio’s 88 counties. For county poverty rates by race or Hispanic ethnicity, data are suppressed here if the denominator is fewer than 250 individuals. For (4), State of Ohio numbers represent ACS 1-year estimates. For (5) Unemployment rates are not seasonally adjusted.
State of Poverty 2012 31
Wayne Wi l l iams Wood Wyandot
Population and population change 1 Total population 2011 114,611 37,597 126,355 22,6922 Population l iving in group quarters 2473 933 8706 2762 Minori ty population (%) 5.0 5.9 9.3 3.61 Population change 2002–2011 2,137 -1,658 3,955 -3691 Percentage change (%) 1.9 -4.3 3.2 -1.6
Poverty rates, historic and recent
3 In 1969 (%) 8.6 9.5 9.1 10.33 In 1979 (%) 8.9 7.9 10.0 10.23 In 1989 (%) 11.7 7.6 10.6 8.53 In 1999 (%) 8.0 6.0 9.6 5.54 In 2009 (%) 11.2 12.1 13.5 9.94 In 2010 (%) 12.6 12.2 12.8 9.44 Poverty count in 2010 14,006 4,461 15,265 2,086
Poverty rates, 5-year averages2 Overal l (%) 9.9 11.8 12.2 8.22 Male (%) 7.9 9.5 10.8 6.52 Female (%) 11.8 14.0 13.5 9.92 Under age 5 (%) 18.0 22.2 11.8 8.22 Under age 18 (%) 14.9 17.6 10.5 11.02 Age 65 and over (%) 6.3 8.6 6.3 8.22 White, non-Hispanic (%) 9.2 11.3 11.4 8.02 Black/African American (%) 37.9 28.4 40.5 0.02 As ian (%) 15.2 14.4 8.5 7.42 Hispanic or Latino (%) 5.6 18.2 17.7 8.92 < 50% FPL, i .e., severe poverty (%) 4.0 4.8 6.0 4.02 < 200% FPL, i .e., below sel f-sufficiency (%) 31.0 33.7 27.2 28.9
Other measures of economic need
5 Unemployed persons , August 2012 3,300 1,400 4,300 7005 Unemployment rate 5.9 7.5 6.6 6.76 SNAP recipients 12,805 5,398 8,191 1,8766 Medica id el igible persons 15,768 6,659 12,684 3,1527 LI-HEAP recipients 6,066 2,126 3,335 1,3578 Uninsured working-age (18-64) persons 2,475 1,588 2,291 5448 Uninsured rate for working-age (%) 20.9 26.2 13.4 13.62 Renters paying 35%+ of income on rent 3,212 1,157 5,483 5732 Cost-burdened renter households (%) 33.8 38.2 38.9 27.19 Foreclosure fi l ings 356 143 610 849 Foreclosure rate per 1000 units 7.8 8.6 11.5 8.5
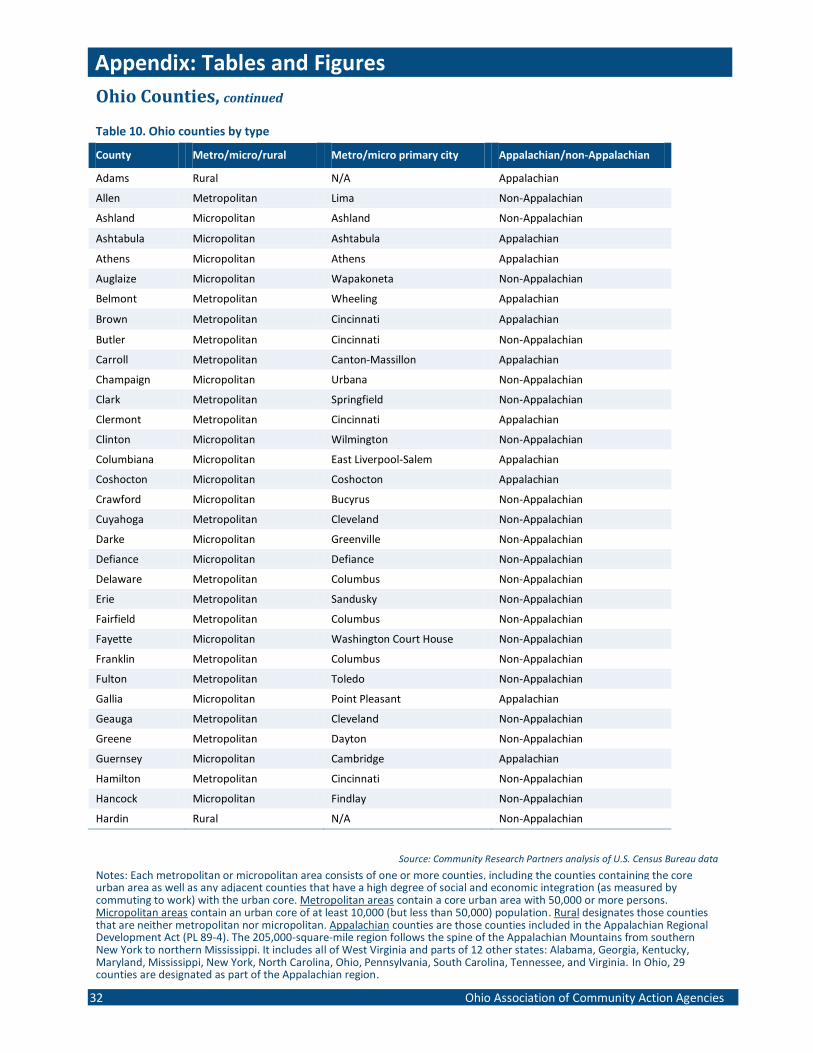
Appendix: Tables and Figures
Ohio Counties, continued
Source: Community Research Partners analysis of U.S. Census Bureau data
Notes: Each metropolitan or micropolitan area consists of one or more counties, including the counties containing the core urban area as well as any adjacent counties that have a high degree of social and economic integration (as measured by commuting to work) with the urban core. Metropolitan areas contain a core urban area with 50,000 or more persons. Micropolitan areas contain an urban core of at least 10,000 (but less than 50,000) population. Rural designates those counties that are neither metropolitan nor micropolitan. Appalachian counties are those counties included in the Appalachian Regional Development Act (PL 89-4). The 205,000-square-mile region follows the spine of the Appalachian Mountains from southern New York to northern Mississippi. It includes all of West Virginia and parts of 12 other states: Alabama, Georgia, Kentucky, Maryland, Mississippi, New York, North Carolina, Ohio, Pennsylvania, South Carolina, Tennessee, and Virginia. In Ohio, 29 counties are designated as part of the Appalachian region.
32 Ohio Association of Community Action Agencies
Table 10. Ohio counties by type
County Metro/micro/rural Metro/micro primary city Appalachian/non-Appalachian
Adams Rural N/A Appalachian
Allen Metropolitan Lima Non-Appalachian
Ashland Micropolitan Ashland Non-Appalachian
Ashtabula Micropolitan Ashtabula Appalachian
Athens Micropolitan Athens Appalachian
Auglaize Micropolitan Wapakoneta Non-Appalachian
Belmont Metropolitan Wheeling Appalachian
Brown Metropolitan Cincinnati Appalachian
Butler Metropolitan Cincinnati Non-Appalachian
Carroll Metropolitan Canton-Massillon Appalachian
Champaign Micropolitan Urbana Non-Appalachian
Clark Metropolitan Springfield Non-Appalachian
Clermont Metropolitan Cincinnati Appalachian
Clinton Micropolitan Wilmington Non-Appalachian
Columbiana Micropolitan East Liverpool-Salem Appalachian
Coshocton Micropolitan Coshocton Appalachian
Crawford Micropolitan Bucyrus Non-Appalachian
Cuyahoga Metropolitan Cleveland Non-Appalachian
Darke Micropolitan Greenville Non-Appalachian
Defiance Micropolitan Defiance Non-Appalachian
Delaware Metropolitan Columbus Non-Appalachian
Erie Metropolitan Sandusky Non-Appalachian
Fairfield Metropolitan Columbus Non-Appalachian
Fayette Micropolitan Washington Court House Non-Appalachian
Franklin Metropolitan Columbus Non-Appalachian
Fulton Metropolitan Toledo Non-Appalachian
Gallia Micropolitan Point Pleasant Appalachian
Geauga Metropolitan Cleveland Non-Appalachian
Greene Metropolitan Dayton Non-Appalachian
Guernsey Micropolitan Cambridge Appalachian
Hamilton Metropolitan Cincinnati Non-Appalachian
Hancock Micropolitan Findlay Non-Appalachian
Hardin Rural N/A Non-Appalachian
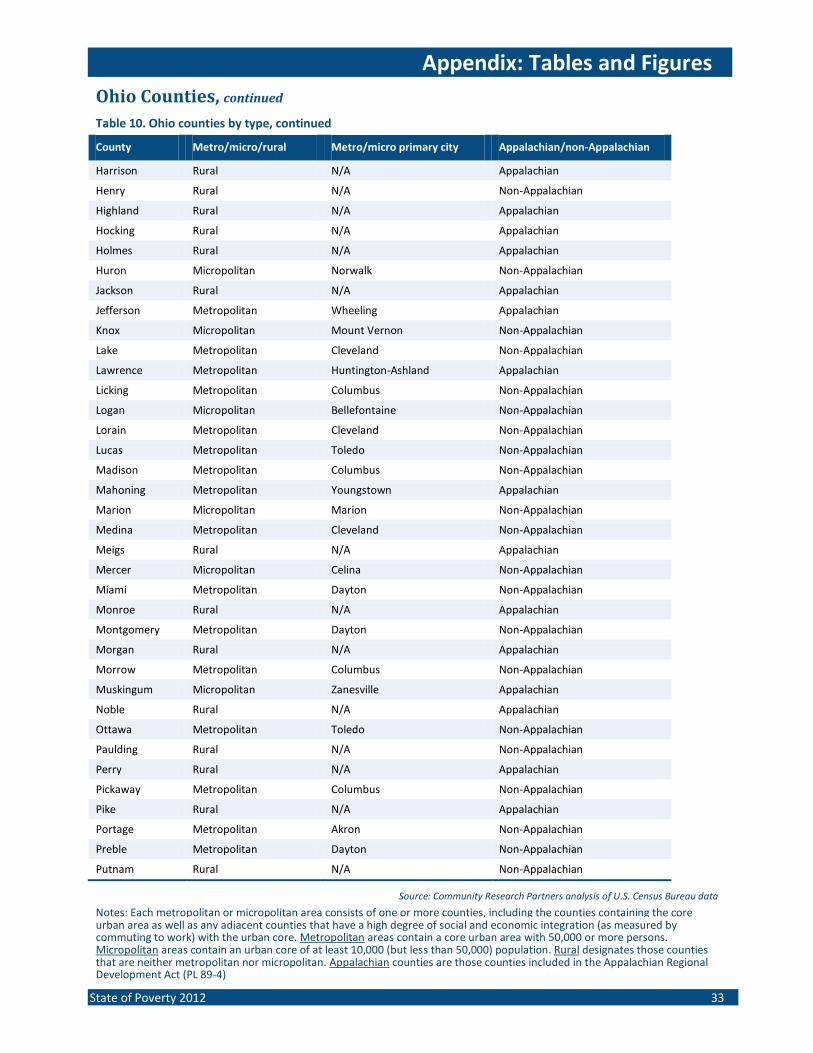
Appendix: Tables and Figures
Ohio Counties, continued
Table 10. Ohio counties by type, continued
Source: Community Research Partners analysis of U.S. Census Bureau data
Notes: Each metropolitan or micropolitan area consists of one or more counties, including the counties containing the core urban area as well as any adjacent counties that have a high degree of social and economic integration (as measured by commuting to work) with the urban core. Metropolitan areas contain a core urban area with 50,000 or more persons. Micropolitan areas contain an urban core of at least 10,000 (but less than 50,000) population. Rural designates those counties that are neither metropolitan nor micropolitan. Appalachian counties are those counties included in the Appalachian Regional Development Act (PL 89-4)
State of Poverty 2012 33
County Metro/micro/rural Metro/micro primary city Appalachian/non-Appalachian
Harrison Rural N/A Appalachian
Henry Rural N/A Non-Appalachian
Highland Rural N/A Appalachian
Hocking Rural N/A Appalachian
Holmes Rural N/A Appalachian
Huron Micropolitan Norwalk Non-Appalachian
Jackson Rural N/A Appalachian
Jefferson Metropolitan Wheeling Appalachian
Knox Micropolitan Mount Vernon Non-Appalachian
Lake Metropolitan Cleveland Non-Appalachian
Lawrence Metropolitan Huntington-Ashland Appalachian
Licking Metropolitan Columbus Non-Appalachian
Logan Micropolitan Bellefontaine Non-Appalachian
Lorain Metropolitan Cleveland Non-Appalachian
Lucas Metropolitan Toledo Non-Appalachian
Madison Metropolitan Columbus Non-Appalachian
Mahoning Metropolitan Youngstown Appalachian
Marion Micropolitan Marion Non-Appalachian
Medina Metropolitan Cleveland Non-Appalachian
Meigs Rural N/A Appalachian
Mercer Micropolitan Celina Non-Appalachian
Miami Metropolitan Dayton Non-Appalachian
Monroe Rural N/A Appalachian
Montgomery Metropolitan Dayton Non-Appalachian
Morgan Rural N/A Appalachian
Morrow Metropolitan Columbus Non-Appalachian
Muskingum Micropolitan Zanesville Appalachian
Noble Rural N/A Appalachian
Ottawa Metropolitan Toledo Non-Appalachian
Paulding Rural N/A Non-Appalachian
Perry Rural N/A Appalachian
Pickaway Metropolitan Columbus Non-Appalachian
Pike Rural N/A Appalachian
Portage Metropolitan Akron Non-Appalachian
Preble Metropolitan Dayton Non-Appalachian
Putnam Rural N/A Non-Appalachian
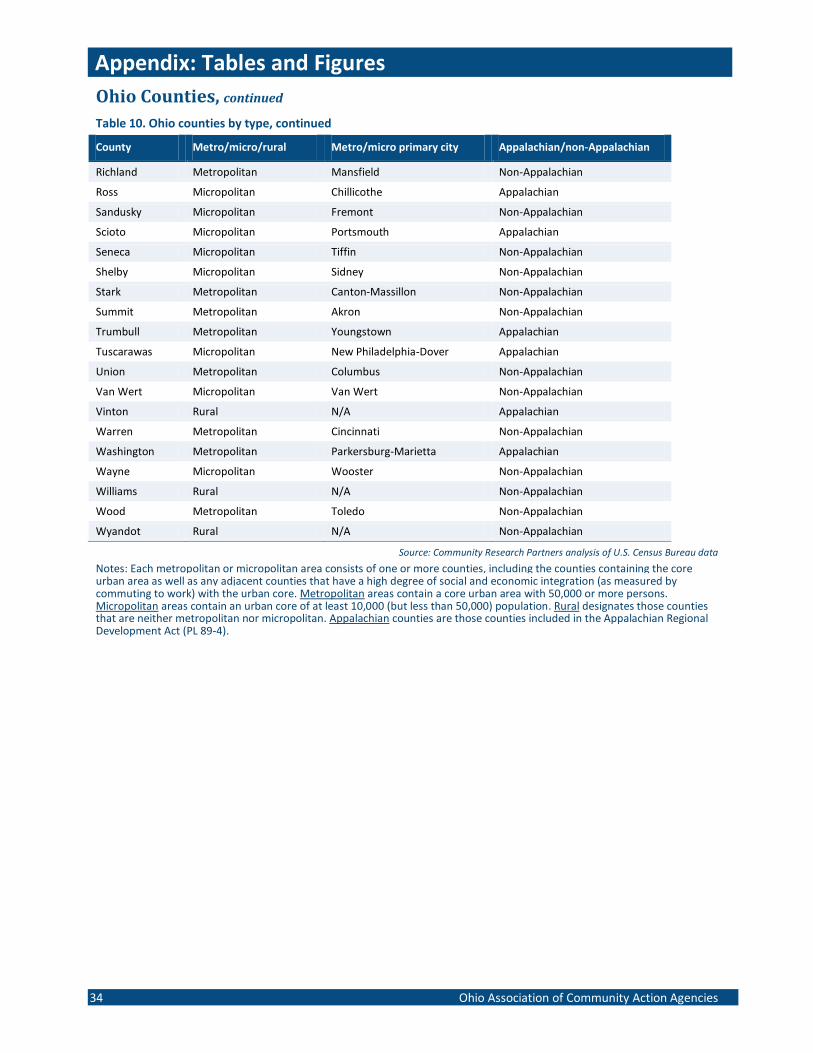
Appendix: Tables and Figures
Ohio Counties, continued
Table 10. Ohio counties by type, continued
34 Ohio Association of Community Action Agencies
County Metro/micro/rural Metro/micro primary city Appalachian/non-Appalachian
Richland Metropolitan Mansfield Non-Appalachian
Ross Micropolitan Chillicothe Appalachian
Sandusky Micropolitan Fremont Non-Appalachian
Scioto Micropolitan Portsmouth Appalachian
Seneca Micropolitan Tiffin Non-Appalachian
Shelby Micropolitan Sidney Non-Appalachian
Stark Metropolitan Canton-Massillon Non-Appalachian
Summit Metropolitan Akron Non-Appalachian
Trumbull Metropolitan Youngstown Appalachian
Tuscarawas Micropolitan New Philadelphia-Dover Appalachian
Union Metropolitan Columbus Non-Appalachian
Van Wert Micropolitan Van Wert Non-Appalachian
Vinton Rural N/A Appalachian
Warren Metropolitan Cincinnati Non-Appalachian
Washington Metropolitan Parkersburg-Marietta Appalachian
Wayne Micropolitan Wooster Non-Appalachian
Williams Rural N/A Non-Appalachian
Wood Metropolitan Toledo Non-Appalachian
Wyandot Rural N/A Non-Appalachian
Source: Community Research Partners analysis of U.S. Census Bureau data
Notes: Each metropolitan or micropolitan area consists of one or more counties, including the counties containing the core urban area as well as any adjacent counties that have a high degree of social and economic integration (as measured by commuting to work) with the urban core. Metropolitan areas contain a core urban area with 50,000 or more persons. Micropolitan areas contain an urban core of at least 10,000 (but less than 50,000) population. Rural designates those counties that are neither metropolitan nor micropolitan. Appalachian counties are those counties included in the Appalachian Regional Development Act (PL 89-4).
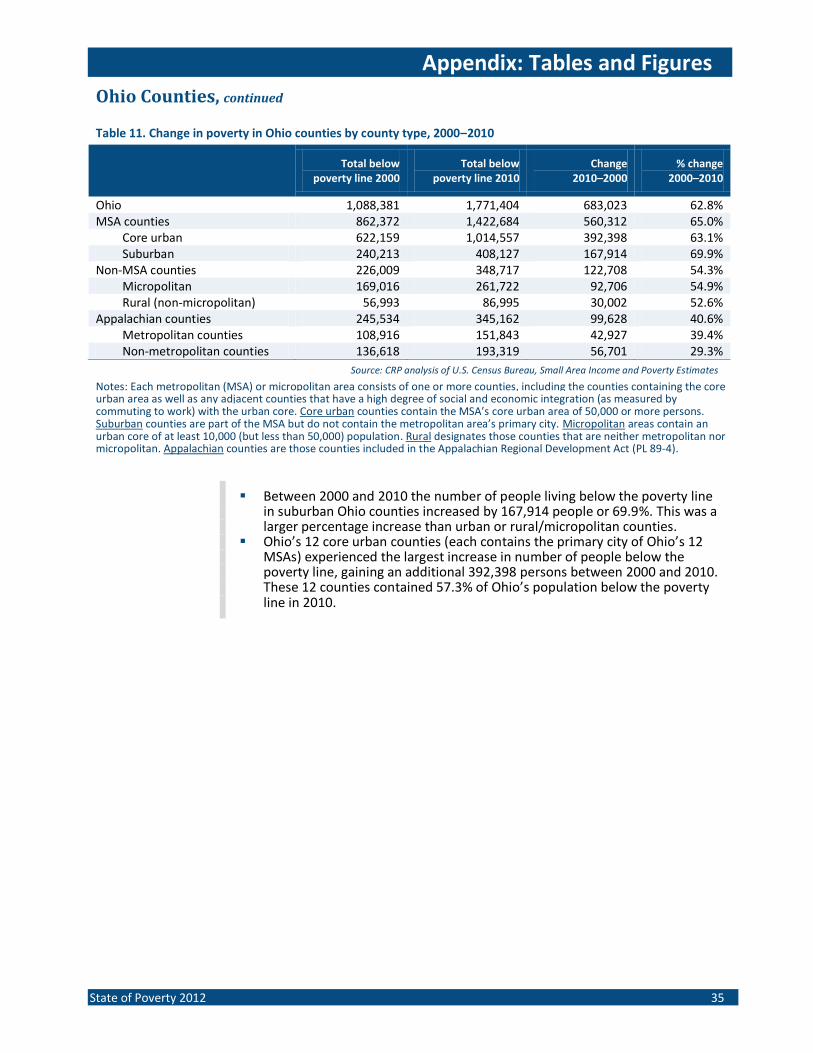
Appendix: Tables and Figures
Ohio Counties, continued
State of Poverty 2012 35
Table 11. Change in poverty in Ohio counties by county type, 2000–2010
Total below poverty line 2000
Total below poverty line 2010
Change 2010–2000
% change 2000–2010
Ohio 1,088,381 1,771,404 683,023 62.8% MSA counties 862,372 1,422,684 560,312 65.0%
Core urban 622,159 1,014,557 392,398 63.1% Suburban 240,213 408,127 167,914 69.9%
Non-MSA counties 226,009 348,717 122,708 54.3% Micropolitan 169,016 261,722 92,706 54.9% Rural (non-micropolitan) 56,993 86,995 30,002 52.6%
Appalachian counties 245,534 345,162 99,628 40.6% Metropolitan counties 108,916 151,843 42,927 39.4% Non-metropolitan counties 136,618 193,319 56,701 29.3%
Source: CRP analysis of U.S. Census Bureau, Small Area Income and Poverty Estimates
Notes: Each metropolitan (MSA) or micropolitan area consists of one or more counties, including the counties containing the core urban area as well as any adjacent counties that have a high degree of social and economic integration (as measured by commuting to work) with the urban core. Core urban counties contain the MSA’s core urban area of 50,000 or more persons. Suburban counties are part of the MSA but do not contain the metropolitan area’s primary city. Micropolitan areas contain an urban core of at least 10,000 (but less than 50,000) population. Rural designates those counties that are neither metropolitan nor micropolitan. Appalachian counties are those counties included in the Appalachian Regional Development Act (PL 89-4).
Between 2000 and 2010 the number of people living below the poverty line in suburban Ohio counties increased by 167,914 people or 69.9%. This was a larger percentage increase than urban or rural/micropolitan counties.
Ohio’s 12 core urban counties (each contains the primary city of Ohio’s 12 MSAs) experienced the largest increase in number of people below the poverty line, gaining an additional 392,398 persons between 2000 and 2010. These 12 counties contained 57.3% of Ohio’s population below the poverty line in 2010.
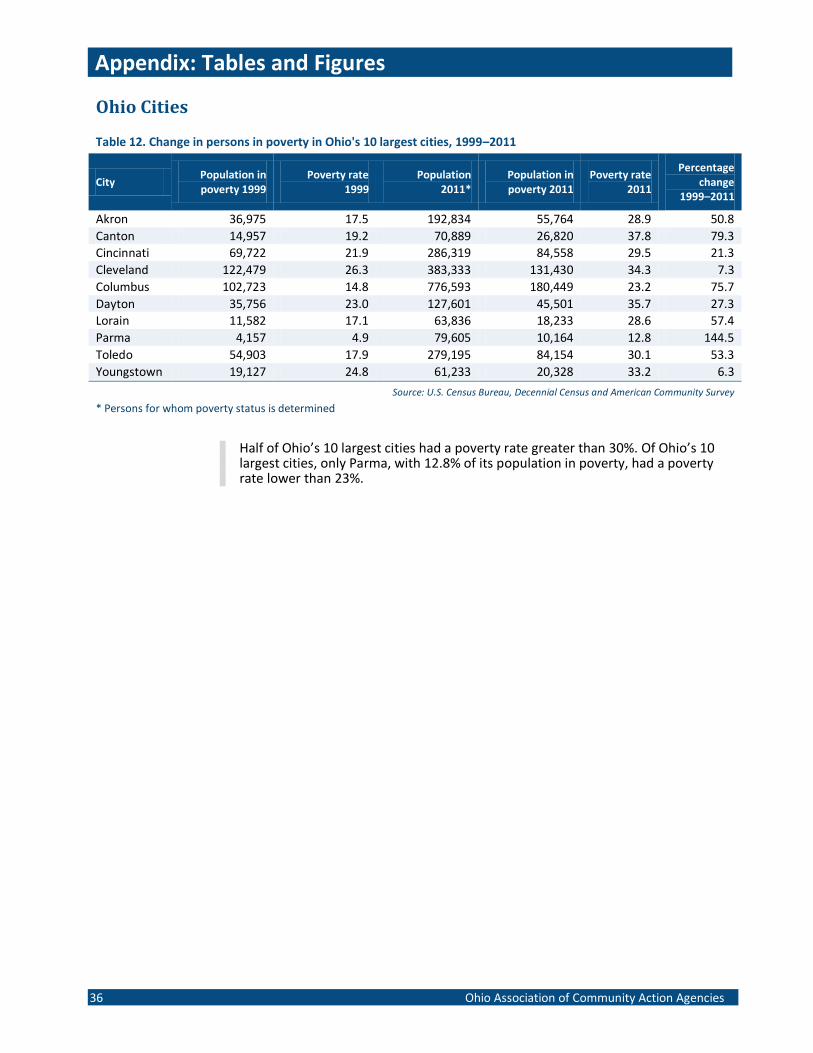
Appendix: Tables and Figures
36 Ohio Association of Community Action Agencies
Ohio Cities
Table 12. Change in persons in poverty in Ohio's 10 largest cities, 1999–2011
City Population in poverty 1999
Poverty rate 1999
Population 2011*
Population in poverty 2011
Poverty rate 2011
Percentage change
1999–2011
Akron 36,975 17.5 192,834 55,764 28.9 50.8
Canton 14,957 19.2 70,889 26,820 37.8 79.3
Cincinnati 69,722 21.9 286,319 84,558 29.5 21.3
Cleveland 122,479 26.3 383,333 131,430 34.3 7.3
Columbus 102,723 14.8 776,593 180,449 23.2 75.7
Dayton 35,756 23.0 127,601 45,501 35.7 27.3
Lorain 11,582 17.1 63,836 18,233 28.6 57.4
Parma 4,157 4.9 79,605 10,164 12.8 144.5
Toledo 54,903 17.9 279,195 84,154 30.1 53.3
Youngstown 19,127 24.8 61,233 20,328 33.2 6.3
Source: U.S. Census Bureau, Decennial Census and American Community Survey
* Persons for whom poverty status is determined
Half of Ohio’s 10 largest cities had a poverty rate greater than 30%. Of Ohio’s 10 largest cities, only Parma, with 12.8% of its population in poverty, had a poverty rate lower than 23%.
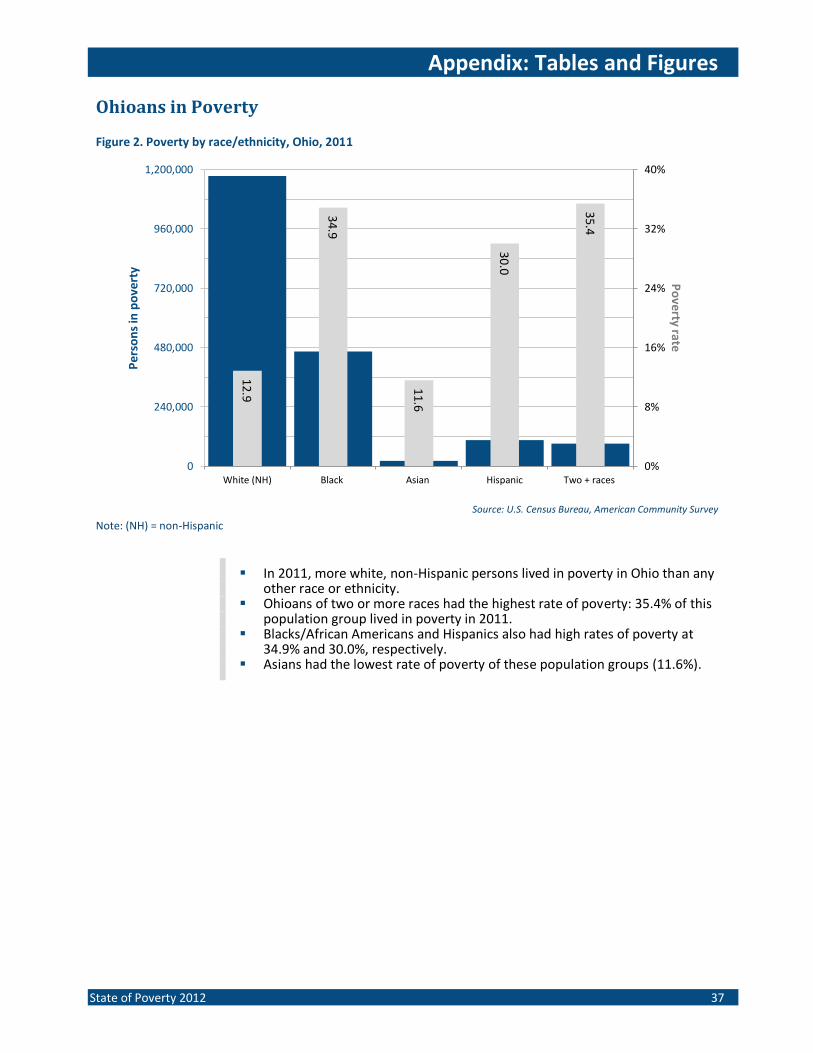
Appendix: Tables and Figures
State of Poverty 2012 37
Ohioans in Poverty
Figure 2. Poverty by race/ethnicity, Ohio, 2011
Source: U.S. Census Bureau, American Community Survey
Note: (NH) = non-Hispanic
In 2011, more white, non-Hispanic persons lived in poverty in Ohio than any other race or ethnicity.
Ohioans of two or more races had the highest rate of poverty: 35.4% of this population group lived in poverty in 2011.
Blacks/African Americans and Hispanics also had high rates of poverty at 34.9% and 30.0%, respectively.
Asians had the lowest rate of poverty of these population groups (11.6%).
12.9
34.9
11.6
30.0
35.4
0%
8%
16%
24%
32%
40%
0
240,000
480,000
720,000
960,000
1,200,000
White (NH) Black Asian Hispanic Two + races
Po
verty rate P
erso
ns
in p
ove
rty
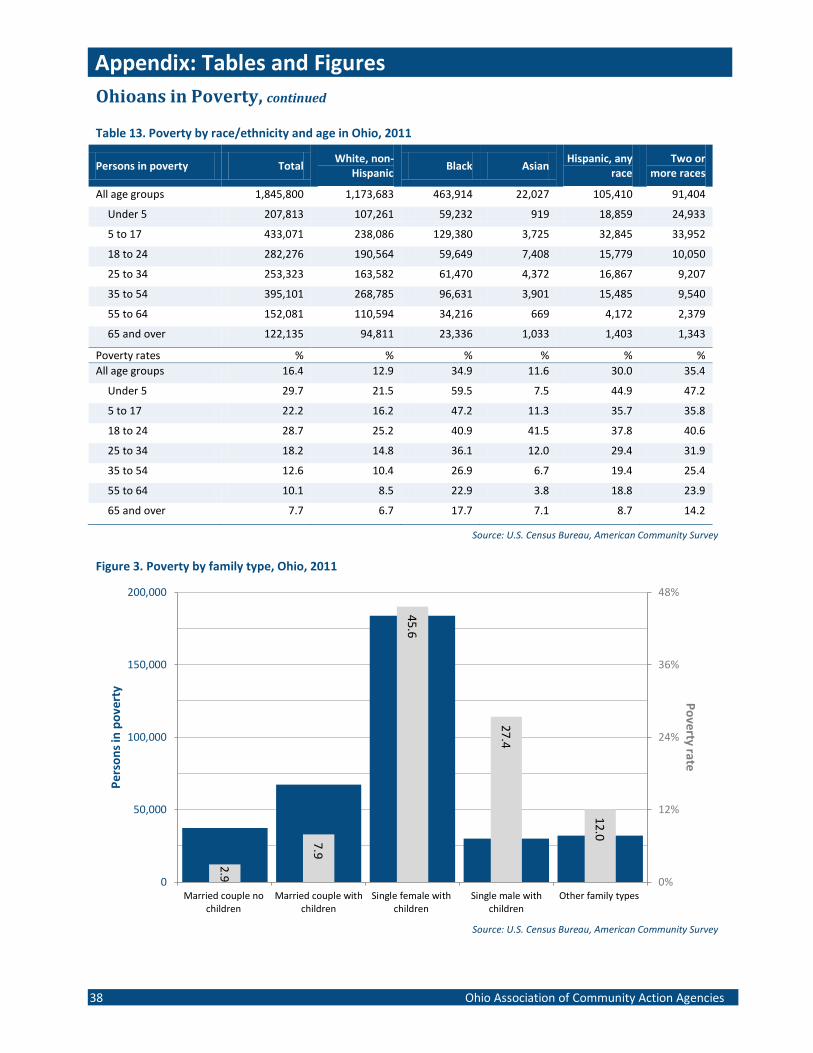
Appendix: Tables and Figures
Ohioans in Poverty, continued
38 Ohio Association of Community Action Agencies
Table 13. Poverty by race/ethnicity and age in Ohio, 2011
Persons in poverty Total White, non-
Hispanic Black Asian
Hispanic, any race
Two or more races
All age groups 1,845,800 1,173,683 463,914 22,027 105,410 91,404
Under 5 207,813 107,261 59,232 919 18,859 24,933
5 to 17 433,071 238,086 129,380 3,725 32,845 33,952
18 to 24 282,276 190,564 59,649 7,408 15,779 10,050
25 to 34 253,323 163,582 61,470 4,372 16,867 9,207
35 to 54 395,101 268,785 96,631 3,901 15,485 9,540
55 to 64 152,081 110,594 34,216 669 4,172 2,379
65 and over 122,135 94,811 23,336 1,033 1,403 1,343
Poverty rates % % % % % %
All age groups 16.4 12.9 34.9 11.6 30.0 35.4
Under 5 29.7 21.5 59.5 7.5 44.9 47.2
5 to 17 22.2 16.2 47.2 11.3 35.7 35.8
18 to 24 28.7 25.2 40.9 41.5 37.8 40.6
25 to 34 18.2 14.8 36.1 12.0 29.4 31.9
35 to 54 12.6 10.4 26.9 6.7 19.4 25.4
55 to 64 10.1 8.5 22.9 3.8 18.8 23.9
65 and over 7.7 6.7 17.7 7.1 8.7 14.2
Source: U.S. Census Bureau, American Community Survey
Figure 3. Poverty by family type, Ohio, 2011
Source: U.S. Census Bureau, American Community Survey
2.9
7.9
45.6
27.4
12.0
0%
12%
24%
36%
48%
0
50,000
100,000
150,000
200,000
Married couple nochildren
Married couple withchildren
Single female withchildren
Single male withchildren
Other family types
Po
verty rate P
erso
ns
in p
ove
rty
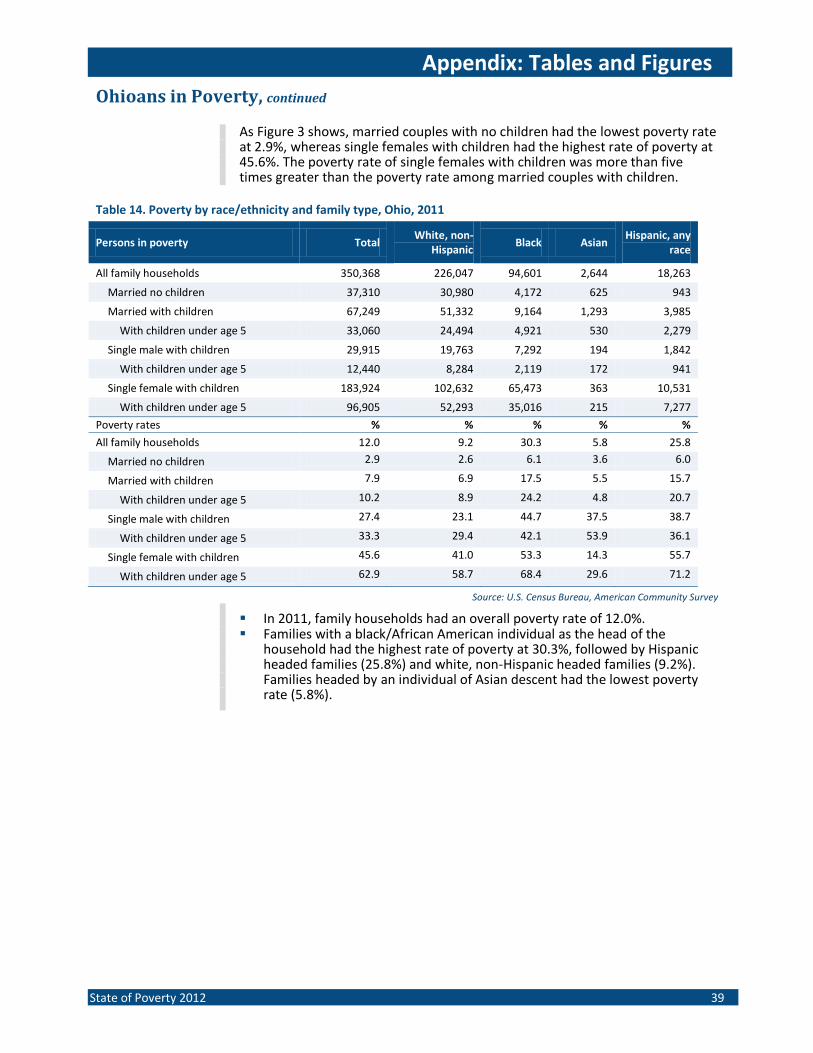
Appendix: Tables and Figures
Ohioans in Poverty, continued
State of Poverty 2012 39
As Figure 3 shows, married couples with no children had the lowest poverty rate at 2.9%, whereas single females with children had the highest rate of poverty at 45.6%. The poverty rate of single females with children was more than five times greater than the poverty rate among married couples with children.
Table 14. Poverty by race/ethnicity and family type, Ohio, 2011
Persons in poverty Total White, non-
Hispanic Black Asian
Hispanic, any race
All family households 350,368 226,047 94,601 2,644 18,263
Married no children 37,310 30,980 4,172 625 943
Married with children 67,249 51,332 9,164 1,293 3,985
With children under age 5 33,060 24,494 4,921 530 2,279
Single male with children 29,915 19,763 7,292 194 1,842
With children under age 5 12,440 8,284 2,119 172 941
Single female with children 183,924 102,632 65,473 363 10,531
With children under age 5 96,905 52,293 35,016 215 7,277
Poverty rates % % % % %
All family households 12.0 9.2 30.3 5.8 25.8
Married no children 2.9 2.6 6.1 3.6 6.0
Married with children 7.9 6.9 17.5 5.5 15.7
With children under age 5 10.2 8.9 24.2 4.8 20.7
Single male with children 27.4 23.1 44.7 37.5 38.7
With children under age 5 33.3 29.4 42.1 53.9 36.1
Single female with children 45.6 41.0 53.3 14.3 55.7
With children under age 5 62.9 58.7 68.4 29.6 71.2
Source: U.S. Census Bureau, American Community Survey
In 2011, family households had an overall poverty rate of 12.0%. Families with a black/African American individual as the head of the
household had the highest rate of poverty at 30.3%, followed by Hispanic headed families (25.8%) and white, non-Hispanic headed families (9.2%). Families headed by an individual of Asian descent had the lowest poverty rate (5.8%).
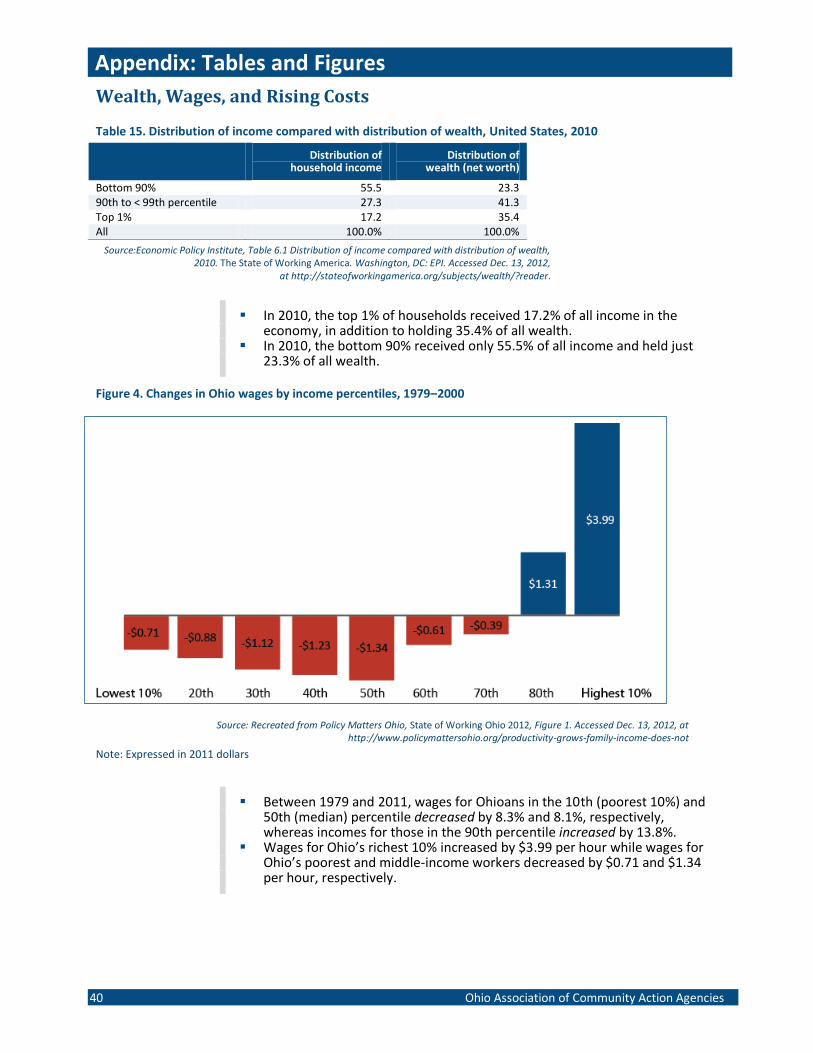
Appendix: Tables and Figures
Wealth, Wages, and Rising Costs
40 Ohio Association of Community Action Agencies
Table 15. Distribution of income compared with distribution of wealth, United States, 2010
Distribution of household income
Distribution of wealth (net worth)
Bottom 90% 55.5 23.3 90th to < 99th percentile 27.3 41.3 Top 1% 17.2 35.4 All 100.0% 100.0%
Source:Economic Policy Institute, Table 6.1 Distribution of income compared with distribution of wealth, 2010. The State of Working America. Washington, DC: EPI. Accessed Dec. 13, 2012,
at http://stateofworkingamerica.org/subjects/wealth/?reader.
In 2010, the top 1% of households received 17.2% of all income in the economy, in addition to holding 35.4% of all wealth.
In 2010, the bottom 90% received only 55.5% of all income and held just 23.3% of all wealth.
Figure 4. Changes in Ohio wages by income percentiles, 1979–2000
Source: Recreated from Policy Matters Ohio, State of Working Ohio 2012, Figure 1. Accessed Dec. 13, 2012, at http://www.policymattersohio.org/productivity-grows-family-income-does-not
Note: Expressed in 2011 dollars
Between 1979 and 2011, wages for Ohioans in the 10th (poorest 10%) and 50th (median) percentile decreased by 8.3% and 8.1%, respectively, whereas incomes for those in the 90th percentile increased by 13.8%.
Wages for Ohio’s richest 10% increased by $3.99 per hour while wages for Ohio’s poorest and middle-income workers decreased by $0.71 and $1.34 per hour, respectively.
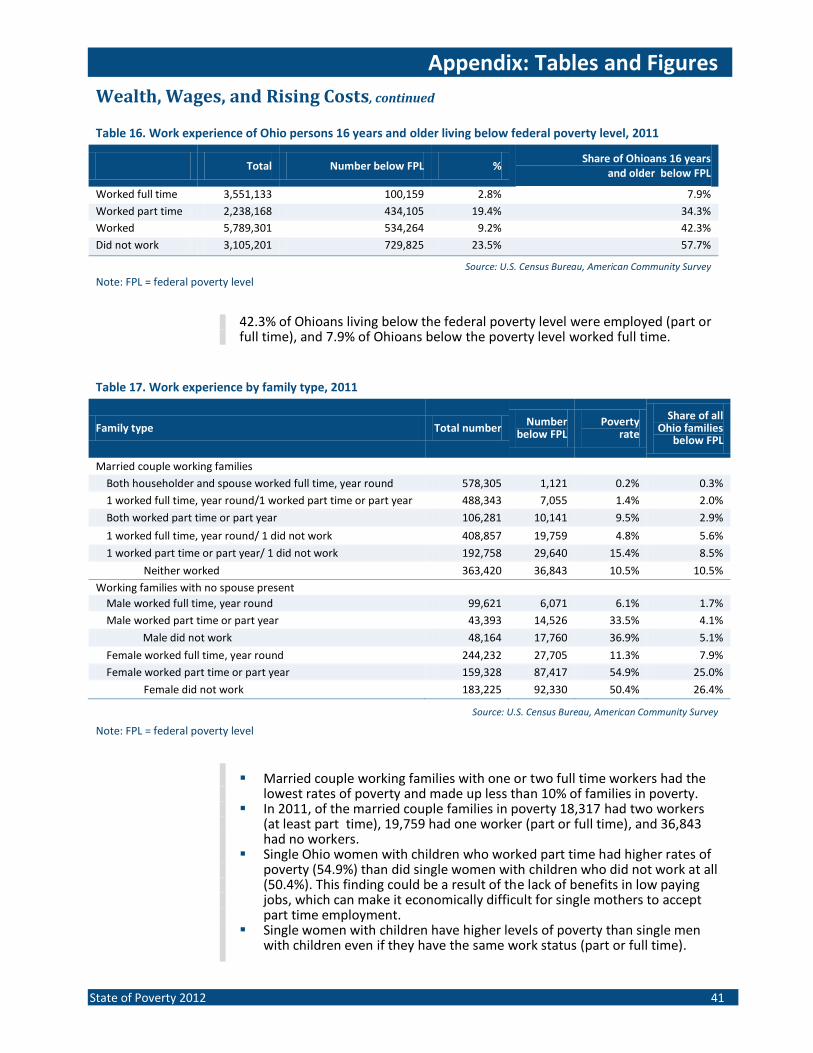
Appendix: Tables and Figures
Wealth, Wages, and Rising Costs, continued
State of Poverty 2012 41
Table 16. Work experience of Ohio persons 16 years and older living below federal poverty level, 2011
Total Number below FPL % Share of Ohioans 16 years
and older below FPL
Worked full time 3,551,133 100,159 2.8% 7.9%
Worked part time 2,238,168 434,105 19.4% 34.3%
Worked 5,789,301 534,264 9.2% 42.3%
Did not work 3,105,201 729,825 23.5% 57.7%
Source: U.S. Census Bureau, American Community Survey
Note: FPL = federal poverty level
42.3% of Ohioans living below the federal poverty level were employed (part or full time), and 7.9% of Ohioans below the poverty level worked full time.
Table 17. Work experience by family type, 2011
Family type Total number Number
below FPL Poverty
rate
Share of all Ohio families
below FPL
Married couple working families
Both householder and spouse worked full time, year round 578,305 1,121 0.2% 0.3%
1 worked full time, year round/1 worked part time or part year 488,343 7,055 1.4% 2.0%
Both worked part time or part year 106,281 10,141 9.5% 2.9%
1 worked full time, year round/ 1 did not work 408,857 19,759 4.8% 5.6%
1 worked part time or part year/ 1 did not work 192,758 29,640 15.4% 8.5%
Neither worked 363,420 36,843 10.5% 10.5%
Working families with no spouse present
Male worked full time, year round 99,621 6,071 6.1% 1.7%
Male worked part time or part year 43,393 14,526 33.5% 4.1%
Male did not work 48,164 17,760 36.9% 5.1%
Female worked full time, year round 244,232 27,705 11.3% 7.9%
Female worked part time or part year 159,328 87,417 54.9% 25.0%
Female did not work 183,225 92,330 50.4% 26.4%
Source: U.S. Census Bureau, American Community Survey
Note: FPL = federal poverty level
Married couple working families with one or two full time workers had the lowest rates of poverty and made up less than 10% of families in poverty.
In 2011, of the married couple families in poverty 18,317 had two workers (at least part time), 19,759 had one worker (part or full time), and 36,843 had no workers.
Single Ohio women with children who worked part time had higher rates of poverty (54.9%) than did single women with children who did not work at all (50.4%). This finding could be a result of the lack of benefits in low paying jobs, which can make it economically difficult for single mothers to accept part time employment.
Single women with children have higher levels of poverty than single men with children even if they have the same work status (part or full time).
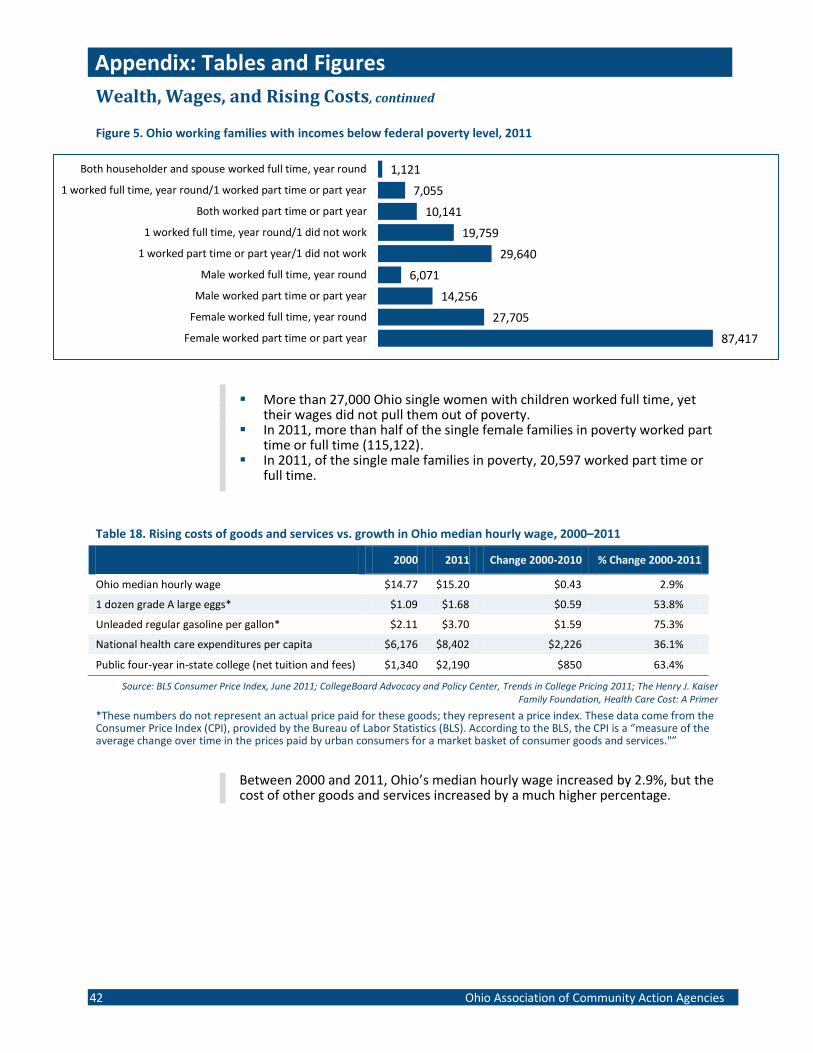
Appendix: Tables and Figures
Wealth, Wages, and Rising Costs, continued
42 Ohio Association of Community Action Agencies
1,121
7,055
10,141
19,759
29,640
6,071
14,256
27,705
87,417
Both householder and spouse worked full time, year round
1 worked full time, year round/1 worked part time or part year
Both worked part time or part year
1 worked full time, year round/1 did not work
1 worked part time or part year/1 did not work
Male worked full time, year round
Male worked part time or part year
Female worked full time, year round
Female worked part time or part year
Figure 5. Ohio working families with incomes below federal poverty level, 2011
More than 27,000 Ohio single women with children worked full time, yet their wages did not pull them out of poverty.
In 2011, more than half of the single female families in poverty worked part time or full time (115,122).
In 2011, of the single male families in poverty, 20,597 worked part time or full time.
Table 18. Rising costs of goods and services vs. growth in Ohio median hourly wage, 2000–2011
2000 2011 Change 2000-2010 % Change 2000-2011
Ohio median hourly wage $14.77 $15.20 $0.43 2.9%
1 dozen grade A large eggs* $1.09 $1.68 $0.59 53.8%
Unleaded regular gasoline per gallon* $2.11 $3.70 $1.59 75.3%
National health care expenditures per capita $6,176 $8,402 $2,226 36.1%
Public four-year in-state college (net tuition and fees) $1,340 $2,190 $850 63.4%
Source: BLS Consumer Price Index, June 2011; CollegeBoard Advocacy and Policy Center, Trends in College Pricing 2011; The Henry J. Kaiser Family Foundation, Health Care Cost: A Primer
*These numbers do not represent an actual price paid for these goods; they represent a price index. These data come from the Consumer Price Index (CPI), provided by the Bureau of Labor Statistics (BLS). According to the BLS, the CPI is a “measure of the average change over time in the prices paid by urban consumers for a market basket of consumer goods and services."”
Between 2000 and 2011, Ohio’s median hourly wage increased by 2.9%, but the cost of other goods and services increased by a much higher percentage.
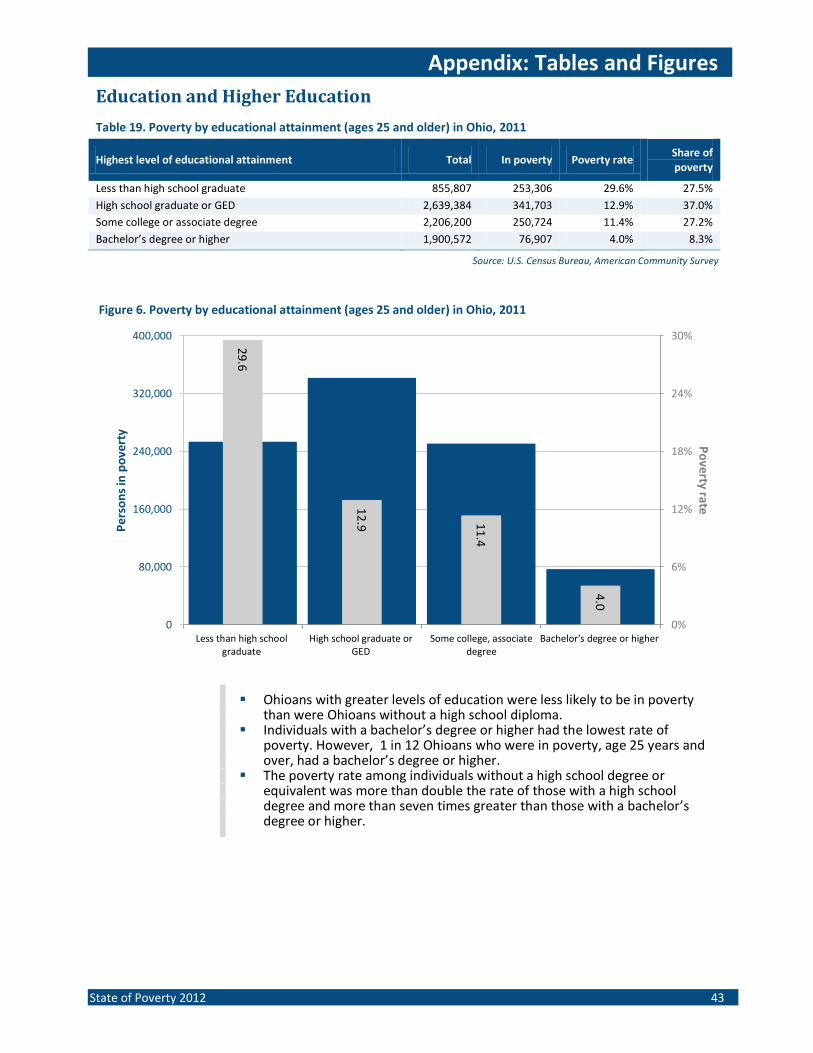
Appendix: Tables and Figures
Education and Higher Education
State of Poverty 2012 43
Table 19. Poverty by educational attainment (ages 25 and older) in Ohio, 2011
Highest level of educational attainment Total In poverty Poverty rate Share of poverty
Less than high school graduate 855,807 253,306 29.6% 27.5%
High school graduate or GED 2,639,384 341,703 12.9% 37.0%
Some college or associate degree 2,206,200 250,724 11.4% 27.2%
Bachelor’s degree or higher 1,900,572 76,907 4.0% 8.3%
Source: U.S. Census Bureau, American Community Survey
Figure 6. Poverty by educational attainment (ages 25 and older) in Ohio, 2011
Ohioans with greater levels of education were less likely to be in poverty than were Ohioans without a high school diploma.
Individuals with a bachelor’s degree or higher had the lowest rate of poverty. However, 1 in 12 Ohioans who were in poverty, age 25 years and over, had a bachelor’s degree or higher.
The poverty rate among individuals without a high school degree or equivalent was more than double the rate of those with a high school degree and more than seven times greater than those with a bachelor’s degree or higher.
29.6
12.9
11.4
4.0
0%
6%
12%
18%
24%
30%
0
80,000
160,000
240,000
320,000
400,000
Less than high schoolgraduate
High school graduate orGED
Some college, associatedegree
Bachelor's degree or higher
Po
verty rate
Per
son
s in
po
vert
y
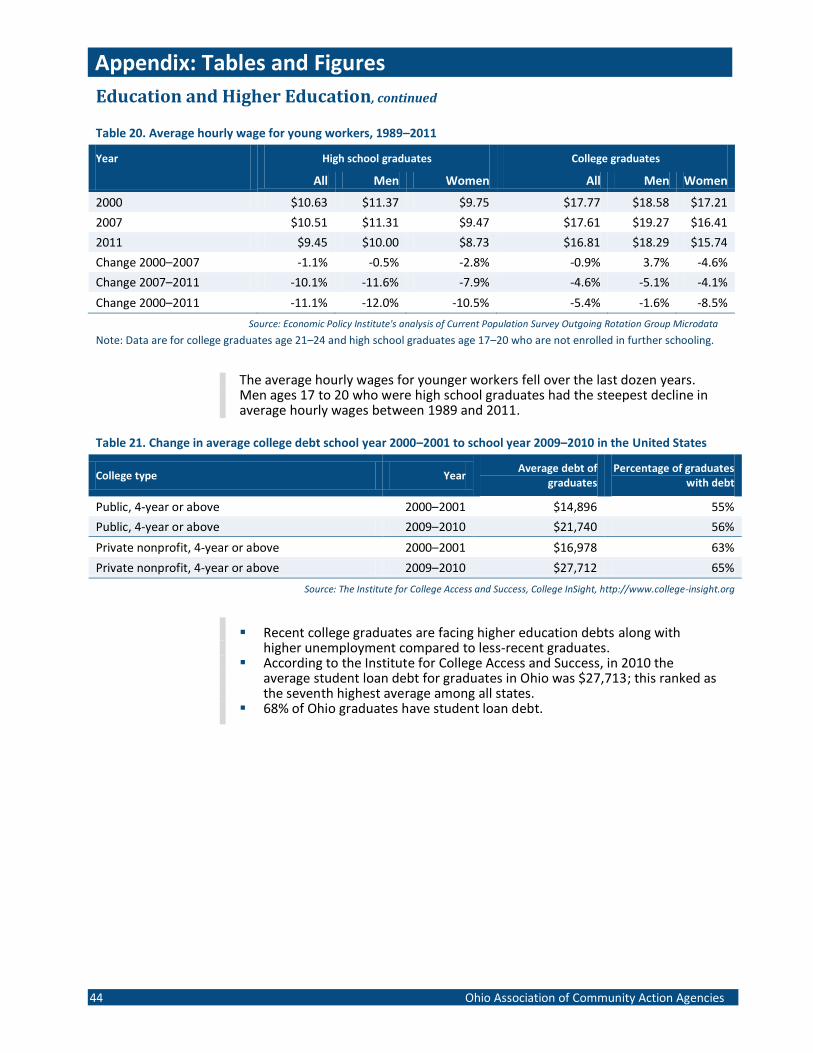
Appendix: Tables and Figures
Education and Higher Education, continued
44 Ohio Association of Community Action Agencies
Table 20. Average hourly wage for young workers, 1989–2011
Year High school graduates College graduates
All Men Women All Men Women
2000 $10.63 $11.37 $9.75 $17.77 $18.58 $17.21
2007 $10.51 $11.31 $9.47 $17.61 $19.27 $16.41
2011 $9.45 $10.00 $8.73 $16.81 $18.29 $15.74
Change 2000–2007 -1.1% -0.5% -2.8% -0.9% 3.7% -4.6%
Change 2007–2011 -10.1% -11.6% -7.9% -4.6% -5.1% -4.1%
Change 2000–2011 -11.1% -12.0% -10.5% -5.4% -1.6% -8.5%
Source: Economic Policy Institute's analysis of Current Population Survey Outgoing Rotation Group Microdata
Note: Data are for college graduates age 21–24 and high school graduates age 17–20 who are not enrolled in further schooling.
The average hourly wages for younger workers fell over the last dozen years. Men ages 17 to 20 who were high school graduates had the steepest decline in average hourly wages between 1989 and 2011.
Table 21. Change in average college debt school year 2000–2001 to school year 2009–2010 in the United States
College type Year Average debt of
graduates Percentage of graduates
with debt
Public, 4-year or above 2000–2001 $14,896 55%
Public, 4-year or above 2009–2010 $21,740 56%
Private nonprofit, 4-year or above 2000–2001 $16,978 63%
Private nonprofit, 4-year or above 2009–2010 $27,712 65%
Source: The Institute for College Access and Success, College InSight, http://www.college-insight.org
Recent college graduates are facing higher education debts along with higher unemployment compared to less-recent graduates.
According to the Institute for College Access and Success, in 2010 the average student loan debt for graduates in Ohio was $27,713; this ranked as the seventh highest average among all states.
68% of Ohio graduates have student loan debt.
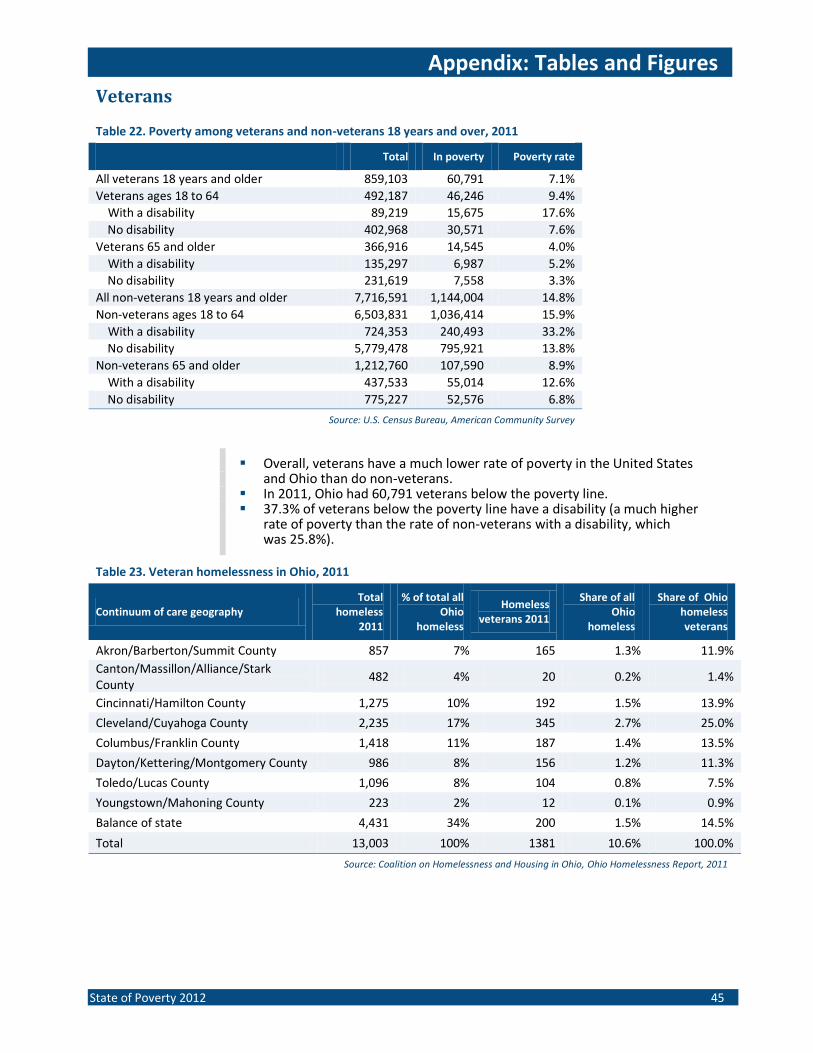
Appendix: Tables and Figures
Veterans
State of Poverty 2012 45
Table 22. Poverty among veterans and non-veterans 18 years and over, 2011
Total In poverty Poverty rate
All veterans 18 years and older 859,103 60,791 7.1%
Veterans ages 18 to 64 492,187 46,246 9.4%
With a disability 89,219 15,675 17.6%
No disability 402,968 30,571 7.6%
Veterans 65 and older 366,916 14,545 4.0%
With a disability 135,297 6,987 5.2%
No disability 231,619 7,558 3.3%
All non-veterans 18 years and older 7,716,591 1,144,004 14.8%
Non-veterans ages 18 to 64 6,503,831 1,036,414 15.9%
With a disability 724,353 240,493 33.2%
No disability 5,779,478 795,921 13.8%
Non-veterans 65 and older 1,212,760 107,590 8.9%
With a disability 437,533 55,014 12.6%
No disability 775,227 52,576 6.8%
Source: U.S. Census Bureau, American Community Survey
Overall, veterans have a much lower rate of poverty in the United States and Ohio than do non-veterans.
In 2011, Ohio had 60,791 veterans below the poverty line. 37.3% of veterans below the poverty line have a disability (a much higher
rate of poverty than the rate of non-veterans with a disability, which was 25.8%).
Table 23. Veteran homelessness in Ohio, 2011
Continuum of care geography Total
homeless 2011
% of total all Ohio
homeless
Homeless veterans 2011
Share of all Ohio
homeless
Share of Ohio homeless veterans
Akron/Barberton/Summit County 857 7% 165 1.3% 11.9%
Canton/Massillon/Alliance/Stark County
482 4% 20 0.2% 1.4%
Cincinnati/Hamilton County 1,275 10% 192 1.5% 13.9%
Cleveland/Cuyahoga County 2,235 17% 345 2.7% 25.0%
Columbus/Franklin County 1,418 11% 187 1.4% 13.5%
Dayton/Kettering/Montgomery County 986 8% 156 1.2% 11.3%
Toledo/Lucas County 1,096 8% 104 0.8% 7.5%
Youngstown/Mahoning County 223 2% 12 0.1% 0.9%
Balance of state 4,431 34% 200 1.5% 14.5%
Total 13,003 100% 1381 10.6% 100.0%
Source: Coalition on Homelessness and Housing in Ohio, Ohio Homelessness Report, 2011
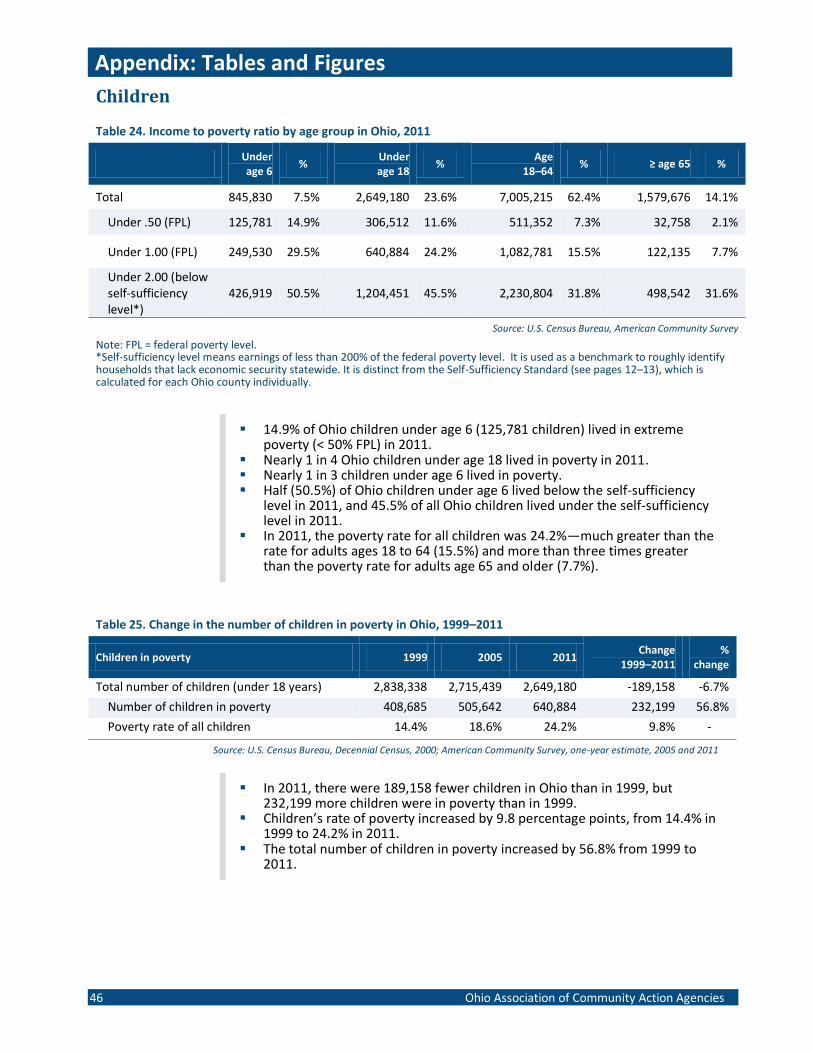
Appendix: Tables and Figures
Children
46 Ohio Association of Community Action Agencies
Table 24. Income to poverty ratio by age group in Ohio, 2011
Under age 6
% Under age 18
% Age
18–64 % ≥ age 65 %
Total 845,830 7.5% 2,649,180 23.6% 7,005,215 62.4% 1,579,676 14.1%
Under .50 (FPL) 125,781 14.9% 306,512 11.6% 511,352 7.3% 32,758 2.1%
Under 1.00 (FPL) 249,530 29.5% 640,884 24.2% 1,082,781 15.5% 122,135 7.7%
Under 2.00 (below self-sufficiency level*)
426,919 50.5% 1,204,451 45.5% 2,230,804 31.8% 498,542 31.6%
Source: U.S. Census Bureau, American Community Survey
Note: FPL = federal poverty level. *Self-sufficiency level means earnings of less than 200% of the federal poverty level. It is used as a benchmark to roughly identify households that lack economic security statewide. It is distinct from the Self-Sufficiency Standard (see pages 12–13), which is calculated for each Ohio county individually.
14.9% of Ohio children under age 6 (125,781 children) lived in extreme poverty (< 50% FPL) in 2011.
Nearly 1 in 4 Ohio children under age 18 lived in poverty in 2011. Nearly 1 in 3 children under age 6 lived in poverty. Half (50.5%) of Ohio children under age 6 lived below the self-sufficiency
level in 2011, and 45.5% of all Ohio children lived under the self-sufficiency level in 2011.
In 2011, the poverty rate for all children was 24.2%—much greater than the rate for adults ages 18 to 64 (15.5%) and more than three times greater than the poverty rate for adults age 65 and older (7.7%).
Table 25. Change in the number of children in poverty in Ohio, 1999–2011
Children in poverty 1999 2005 2011 Change
1999–2011 %
change
Total number of children (under 18 years) 2,838,338 2,715,439 2,649,180 -189,158 -6.7%
Number of children in poverty 408,685 505,642 640,884 232,199 56.8%
Poverty rate of all children 14.4% 18.6% 24.2% 9.8% -
Source: U.S. Census Bureau, Decennial Census, 2000; American Community Survey, one-year estimate, 2005 and 2011
In 2011, there were 189,158 fewer children in Ohio than in 1999, but 232,199 more children were in poverty than in 1999.
Children’s rate of poverty increased by 9.8 percentage points, from 14.4% in 1999 to 24.2% in 2011.
The total number of children in poverty increased by 56.8% from 1999 to 2011.


50 West Broad Street, Suite 1616 Columbus, OH 43215 phone: 614-224-8500 fax: 614-224-2587 www.oacaa.org


![[gender] stereotypes or preconceived notions about [women] can be](https://img.pdfslide.net/doc/110x75/6210d5557829795253557b33/gender-stereotypes-or-preconceived-notions-about-women-can-be.jpg)