Embed Size (px)
Citation preview

STATE OF RHODE ISLAND INVESTMENT COMMISSION MEETING
DATA AT December 31, 2010
January 26, 2011 MEETING
MEMBERS OF THE STATE INVESTMENT COMMISSION
Honorable Gina M. Raimondo, Chair
Ms. Rosemary Booth Gallogly Mr. J. Michael Costello Mr. Thomas P. Fay Mr. Robert R. Gaudreau, Jr. Mr. Robert Giudici Dr. Robert J. McKenna
Ms. Marcia Reback Mr. Andrew K. Reilly

AGENDA


APPROVAL OF MINUTES
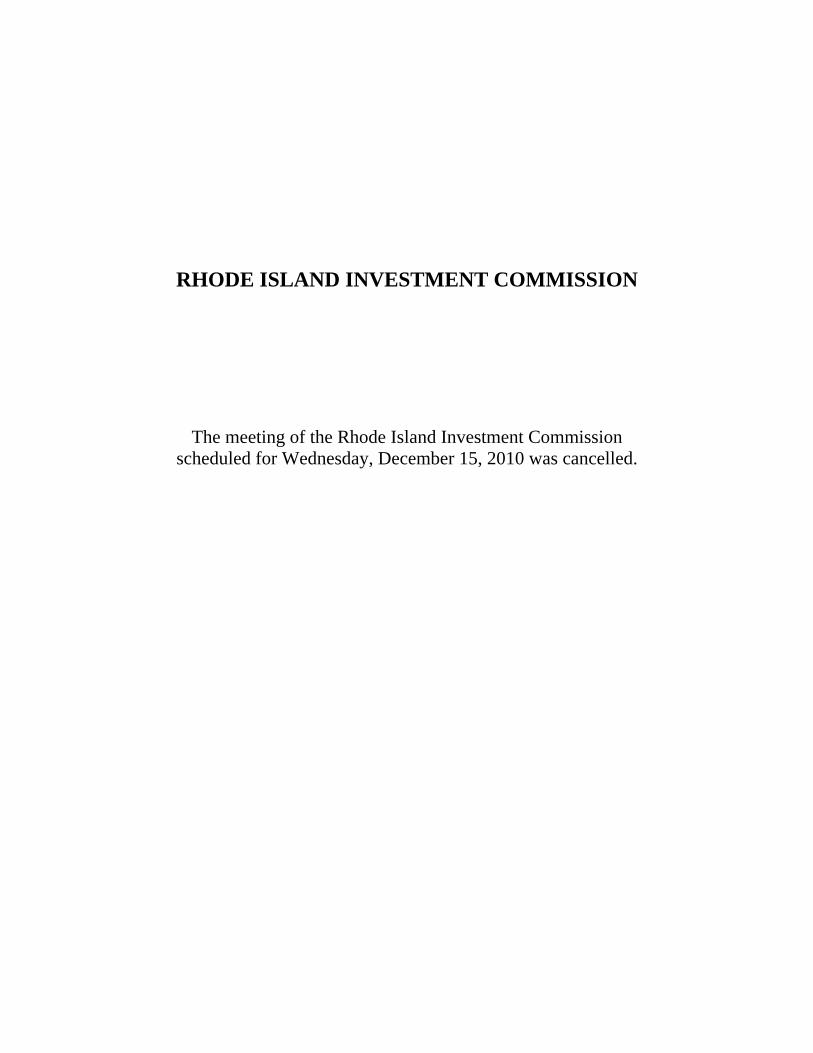
RHODE ISLAND INVESTMENT COMMISSION
The meeting of the Rhode Island Investment Commission scheduled for Wednesday, December 15, 2010 was cancelled.

State of Rhode Island and Providence Plantations STATE INVESTMENT COMMISSION
Monthly Meeting November 17, 2010
A State Investment Commission (SIC) meeting was held in Room 135, State House, Providence, Rhode Island on Wednesday, November 17, 2010. General Treasurer Caprio called the meeting to order at 9:03 a.m. Membership Roll Call. Present were: Ms. Rosemary Booth Gallogly, Mr. Michael Costello, Mr. Thomas Fay, Mr. Robert Giudici, Ms. Marcia Reback and General Treasurer Frank T. Caprio, establishing a quorum. Also present were: Ms. Sally Dowling, of Adler Pollock, & Sheehan, and Mr. Michael Murphy, of Rodio & Ursillo, Legal Counsel to the Commission; Mr. John Burns of Pension Consulting Alliance (PCA), General Policy Consultant to the Commission; Ms. Lisa Tyrrell and Ms. Kirti Patel of State Street Corporation, Ms. Michelle Davidson of Pacific Corporate Group, Mr. Peter Kerwin and Gail Mance-Rios of RI Higher Education Assistance Authority, Robert Keith, Christopher Nikolich and Patricia Roberts of AllianceBernstein and members of the Treasurer’s staff. Mr. Robert Gaudreau, Mr. Andrew Reilly and Dr. Robert McKenna were not present. State Investment Commission Minutes. Treasurer Caprio entertained a motion for approval of the minutes for the meeting of October 27, 2010. Ms. Booth Gallogly moved, Mr. Fay seconded, and the subsequent motion passed. The following members voted in favor: Ms. Booth Gallogly, Mr. Costello, Mr. Fay, Mr. Giudici, Ms. Reback and Treasurer Caprio. VOTED: To approve the Minutes of the October 27, 2010 monthly meeting. General Consultant Report. Mr. Burns stated that he will comment on two documents, the fixed income Revised 2010 Ten-Year Capital Market Assumptions and the Rhode Island Fixed Income Portfolio as of September 30, 2010. He observed that in the history of PCA this is the first time that more than one fixed income capital market assumption has been calculated in a calendar year for asset allocation or liabilities studies. Conditions in the fixed income market, where yields have gone from 4.04% to 2.77%, are currently 3.0%, warranted the revised calculation. He emphasized that the important changes are TIPS going from 5% to 4% and domestic fixed income from 4% to 3%. The expected risk did not change but it probably will in January.
Mr. Burns turned to the Fixed Income Portfolio overview. He stated that based on the data as of September 30, 2010, the managers are doing exactly what they were hired to do. They are managing various risks, including interest rate and credit risk, consistent with the fund’s mandate guidelines. He noted all the mandates are benchmark sensitive. CollegeBoundfund Presentation. Treasurer Caprio called Mr. Robert Keith, Mr. Christopher Nikolich and Ms. Patricia Roberts of AllianceBernstein to give the presentation on the CollegeBoundfund.

Ms. Roberts stated that she is the CollegeBoundfund relationship manager for the State of Rhode Island. Ms. Roberts noted that the team was on the agenda for a program review, including performance and investment philosophy, and that the topic of the recent Morningstar analysis had been added for discussion.
Ms. Roberts asked the group to turn to page 4 of the CollegeBoundfund presentation to review a summary of the criteria for the Morningstar analysis. She stated that CollegeBoundfund received a favorable ranking for its "Pricing" and was ranked nationally as #13 for lowest fees out of the 33 programs in the review. She noted that although CollegeBoundfund’s competitive pricing nationally was acknowledged, the very favorable fees for Rhode Island residents were omitted. With respect to the topic of "Performance," the CollegeBoundfund was average in its five-year, age-based performance plans. With regard to the topic of Portfolio construction, she noted that Morningstar offered positive commentary about CollegeBoundfund's popular age-based tracks, calling them "well-diversified”. She also indicated that CollegeBoundfund has a variety of other options in addition to the age-based portfolios, including a popular stable value choice, risk-based portfolios and individual fund portfolios. She noted that in the "People" category, CollegeBoundfund was also given a favorable ranking, indicating that Morningstar ranked the firm #19, a top quartile rank, for strong manager tenure out of 79 plans. Further, she noted that Morningstar ranked AllianceBernstein as #7 out of 18 plans for 5-year manager retention.
Mr. Keith stated that he met with Don Phillips, one of the founders of Morningstar, last week and had met the week prior with individuals who conducted the analysis and issued the report. Mr. Keith noted that Morningstar views corporate change as a question mark whereas AllianceBernstein views it as part of the ongoing evolution of any firm.
The group then discussed investment philosophy and the 2008 market downturn impact. Ms. Booth Gallogly asked if Morningstar discussed age based options in a child’s later years, as a
child approaches 17 or 18. Mr. Nikolich stated that the team had incorporated the following: asset allocation, college inflation,
risk factors and participant behavior. There are individual and principal protected options for participants who do not want aged based options. He referred the group to page 48 and 49 in the appendix and highlighted that economic and market downturns were typically short and that markets tended to rebound prior to the bottom of the economic cycle. 2008 was no different from prior market downturns in this regard.
Mr. Costello stated that he recalled that two years ago AllianceBernstein told the board that the reason for the higher equity percentage was that there was an 11 to 12 year payout cycle. He asked if AllianceBernstein's view on that duration has changed or whether it is up to the participant to change options.
Mr. Nikolich commented that AllianceBernstein has not viewed the draw-down period as 11 or 12 years. The examination of over 17 million investor transactions demonstrated that investors typically draw down money over 4 or 5 years, not typically all monies in the beneficiary's first year of college. Therefore, a higher equity allocation can benefit participants by helping to grow their savings above the rate of college inflation as they are saving for college. This is critical as college tuition inflation has averaged over 5% per year.
Mr. Fay asked for clarification of the gain indicated in the chart on page 49. Mr. Nikolich responded that the slide illustrated that while market downturns were severe, the
length of the decline was typically short, averaging 15 months excluding the depression. Ms. Roberts commented that the AllianceBernstein team has met several times with Mr.
Dingley, Mr. Goodreau and others after the difficult time in 2008 to talk about enhancements to the current program structure that might be considered. She also noted that a decision was made by the small group to hold off on any modifications until the direction of the relationship was decided. Early 2009 was clearly not an opportune time to make any modifications to the program that might result in selling at the market bottom. AllianceBernstein will continue to work with the SIC and RIHEAA to consider and potentially implement enhancements to the program.
Treasurer Caprio commented that when we review this issue we should consider that Morningstar focused on the national portion of the program in the fee ranking and in doing so, overlooked that Rhode

Island residents who invest in the program have the lowest available fees in the country for the popular age-based investment options. He also noted the newly-launched CollegeBoundbaby fund provides $100 for each newly born or adopted child in the state whose parents or guardians open an account within one year of birth or adoption.
Ms. Roberts stated that additionally, RI residents do not have an annual fee as their annual account maintenance fees are waived by AllianceBernstein. She asked the group to look at page 28 of the appendix for current information on the size of the program and the number of accounts established in Rhode Island and across the nation. She noted that Rhode Island’s partnership with AllianceBernstein is something you should feel proud of. Treasurer Caprio mentioned that the relationship also provides substantial funding for matching grants and scholarships for Rhode Island residents.
Mr. Nikolich proceeded with a review of performance for the fund and discussed pages 13 – 16 of the presentation. Mr. Nikolich highlighted that all of the underlying components that make up the age-based and risk-based program options have good long-term track records. Legal Counsel Report. Legal Counsel had no report. Chief Investment Officer Report. Mr. Goodreau stated that the fund is performing very well in a year that has been hard to navigate. The one month return is up 16 basis points. The fund is 49 basis points ahead of the benchmark for the calendar year and 106 basis points up from the benchmark of 12.95% for the 12 month period ending October 31, 2010. The standard deviation numbers are down relative to peers, and where the fund was in the past. The standard deviation is 11.5 and the benchmark is 12.5. The fund is beating almost every average time period with less volatility.
Treasurer Caprio asked for the return numbers for the fiscal and calendar year to date.
Mr. Goodreau replied that calendar year to date the fund is up 8.6% which is 50 basis points ahead of the 8.1% and for the fiscal year starting July 1, 2010 the fund is up almost 11% with lower fees. Treasurer’s Report. Treasurer Caprio reported that we will keep with the past practice and not hold a December meeting. He said that he and his staff are working closely to assist in a smooth transition. The fund is in a favorable position for the start of the new administration. New Business. There was no new business.
There being no new business, Treasurer Caprio entertained a motion to adjourn. Ms. Booth Gallogly moved, Ms. Reback seconded, and the subsequent motion passed. The following members voted in favor: Ms. Booth Gallogly, Mr. Costello, Mr. Fay, Mr. Giudici, Ms. Reback and Treasurer Caprio. VOTED: To adjourn the meeting.
There being no further business, the meeting was adjourned at 10:01 a.m. Respectfully submitted, Frank T. Caprio General Treasurer

STAFF SUMMARY

F h l b h
RHODE ISLAND STATE INVESTMENT COMMISSIONSTAFF SUMMARY ANALYSIS
PORTFOLIO HIGHLIGHTSDecember 31, 2010
PORTFOLIO PERFORMANCE
December
The ERSRI portfolio posted a 3.86% gain for the month of December, Dec-10 Calendaragai olic n f c es ned nnst the p y i dex o 4.33%. Domesti Equiti gai 6.94%, i ter- ERSRI Performance By A lsset C ass YTDnational equities were up 7.85%, and the fixed income asset class returned -0.30%. Domestic Equity 6.94% 17.40%
If we factor out PE & RE investments, due to the way they are monitored, Fixed Income -0.30% 6.18%
the plan performance was 4.17% against its 4.13% index. International Equity 7.85% 11.27%Total Fund Composite* 4.17% 12.21%
Calend Yar ear to Date Manager Summary Dec-10 CYTDDOMESTIC EQUITY
F th t l th di D b 31 2010 th tf li i 12 26%or t e twe ve months ending Decem er 31, 2010, t e portfolio is up 12.26% SShott % %6.29% 12.13%
against the policy index of 12.22%. Domestic equities were up 17.40%, inter- SSgA S&P 500 6.68% 15.14%
national equities were up 11.27%, while fixed income generated a return of 6.18%. Russell Overlay -0.22% 0.21%
Wellington Technical Eq 5.61% 5.43%
Fiscal Year to Date Russell 2000 Index 7.92% 26.92%
Total Domestic Equity 6.94% 17.40%
For the Fiscal Year ended June 30, 2011, the fund has gained 14.33%,against the policy index of 15.70%. FIXED INCOME
Brown Bros TIPS -1.74% 6.14%
Index Performance Summary - December 31, 2010 Brown Bros Core -0.84% 6.48%Calendar Fidelity -0.56% 7.16%
Market Indices Dec-10 YTD Taplin Canida & Habacht -0.44% 8.53%Domestic Equity Fixed Income Cash Acct 0.02% 0.19%S & P 500 6.68% 15.06% Mackay Shield 1.32% 13.18%DJ Wilshire 5000 6.78% 16.93%Russell 2000 7.94% 26.85% Total Fixed Income -0.30% 6.18%Policy Index 4.13% 12.01%
INTERNATIONAL EQUITYInternational EquityMSCI ACWI 7.85% 11.60% Total International Equity 7.85% 11.27% Fixed Income *Total Fund Composite includes all classes ex PE & REBC AGG -1.08% 6.54% Real Estate NCREIF 3.94% 6.89%

Market Valuation Report
Market Values
The total portfolio value increased in December by $242.0 million to $7.25billion. This compares with an increase in value of $60 million for thesame period in 2009. The Domestic Equity Market values increased by $184.1million, including transfers in of $0.068 million; Fixed Income decreased by $41.9 million,including transfers out of $36.9 million; while International Values increased by $99.6
illi i l di f i f $0 151 illi Th C h A i d b $22 5
December 31, 2010
$7
$8
$9
s)
January 06 - December 10
million, including transfers in of $0.151 million. The Cash Accounts increased by $22.5 million including transfers in of $23.3 million, and Alternative Investments increased by $0.5 million, including transfers out of $12.5 million. The Real Return Pool
decreased by $7.2 million including transfers in of $0.00 million. The overlay accountdecreased by $15.5 million.
$3
$4
$5
$6
$7
$8
$9
(billi
ons)
January 06 - December 10

Cash Flow
December's pension payroll of $71.2 million was greater than the $45.6 million in contributions and wire transfers received by $25.6 million.To meet pension and other obligations, a transfer from long-term investments of $26.9 million was necessary.
Alternative Investments
At this time the alternative investment asset class has unfunded commitments of approximately $189.5 million oncommitments of $1,088 million.
CAPITAL CALLSNet of Distributions
December FYTD UNFUNDED2010 BALANCE
-$10,069,715 -$42,480,946 $189,509,759
December FYTD UNFUNDED2009 BALANCE
-$3,026,162 $7,801,816 $313,632,775

.
Value AllocationUS Equity 2,841.53 39.2%International Equity 1,368.21 18.9%US Fixed Income 1,357.76 18.7%Real Return 406.39 5.6%Real Estate 237.01 3.3%Private Equity 621.48 8.6%Russell Implementation* 109.52 1.5%Cash 309.48 4.3%
Total Fund 7,251.37 100.0%
State of Rhode IslandAsset Allocation
12/31/2010
US Equity 39%
International Equity 19%
US Fixed Income 19%
Real Return 6%
Real Estate 3%
Private Equity 9%
Russell Implementation* 1% Cash
4%
US Equity
International Equity
US Fixed Income
Real Return
Real Estate
Private Equity
Russell Implementation*
Cash

REPO = Repurchase AgreementGID = Government Insured DepositCP = Commercial PaperCD = Certificate of DepositCoD = Collateralized DepositAgency = US Government Agency
RHODE ISLAND STATE INVESTMENT COMMISSIONSHORT TERM CASH INVESTMENTS AT:
December 31, 2010
Fidelity20.80%
BlackRock5.04%
Citizens Bank34.19%
Webster Bank31.42%
Washington Trust8.55% CD
8%Money
Mkt26%
PIP66%
GID0%

State of Rhode IslandOffice of the General Treasurer
Short-Term Investments
Issuer Credit RatingsDec-10
Issuer Ratings S-T Debt Rating L-T Debt Rating Credit OutlookType of Month End %
Issuer Instrument Portfolio Moody's Moody's S&P Moody's S&P S&P
Bank RI 3,4 0.00% N/R N/R
JP Morgan Chase 2,3,5 0.00% Aa1 P-1 A-1+ Aa1 AA- Negative
BlackRock Inc. 6 5.04% A1 P-1 A-1 A1 A+ Stable
RBS Citizens 3,4 34.19% A2 P-1 A-2 A2 A- Negative
Federated 6 0.00% N/R N/R N/R
Fidelity 6 20.80% N/R N/R N/R
Merrill Lynch 2,5,6 0.00% A2 P-1 A-1 A2 A Negative
Morgan Stanley 1,2,5 0.00% A2 P-1 A-1 A2 A Negative
Sovereign Bank 3,4 0.00% A3 P-2 A-1 A3 A Stable
State Street Bank & Trust Comp 1,3 0.00% A1 P-1 A-1 A1 A+ Negative
Webster Bank 3,4 31.42% A3 P-2 A-2 A3 BBB Stable
Washington Trust 3,7 8.55% N/R N/R N/R
Oppenheimer 5 0.00% B2 StableInstrument Codes
1 Repurchase Agreement2 Commercial Paper3 Certificate of Deposit4 Collateralized Deposit5 US Agency Discount Note6 Government Money Market7 Government Insured Deposit
Ratings Definitions
Moody's Short-Term Debt Ratings: S&P Short-Term Credit Ratings:Moody's Short-Term Debt Ratings: S&P Short-Term Credit Ratings:P-1 - Prime-1 have a superior ability for repayment of sr. S-T debt obligations A-1 - Highest rated, strong capacity to meet obligationsP-2 - Prime-1 have a strong ability for repayment of sr. S-T debt obligations A-2 - Somewhat more susceptible to adverse effects of changes in financial conditions, satisfactoryP-3 - Prime-1 have an acceptable ability for repayment of sr. S-T debt obligations A-3 - Exhibits adequate protection parametersNP - Not Prime B - Significant speculative characteristics, faces major ongoing uncertainties
C - Vulnerable to non-paymentD - Payment defaultModifiers:+ or - show relative standing within the category.
Moody's Issuer Rating Symbols:Aaa - Offer exceptional financial security (high-grade)Aa - Offer excellent financial security (high-grade)A - Offer good financial securityBaa - Offer adequate financial security S&P Outlook Definitions:Ba - Offer questionable financial security Positive - A rating may be raisedB - Offer poor financial security Negative - A rating may be loweredCaa - Offer very poor financial security Stable - A rating is not likely to changeCa - Offer extremely poor financial security Developing - May be raised or loweredC - Lowest rated class, usually in default NM - Not meaningfulModifiers:1 - Higher end of letter rating category2 - Mid-range of letter rating category3 - Lower end of letter rating category
S&P Long-Term Debt Ratings:AAA - Highest rating, extremely strongAA - Differs slightly from highest rating, very strongA - Somewhat more susceptible to adverse effects of change in economic condition, strongBBB - Exhibits adequate protection parameters
Moody's Long-Term Debt Ratings: BB, B, CCC, CC, C - Have significant speculative characteristics. BB least speculative, C highest degree.Aaa - Best Quality D - Payment defaultAa - High Quality Modifiers:A - Posess many favorable investment attributes + or - show relative standing within the category.Baa - Medium-grade obligationsBa - Posess speculative elementsB - Generally lack characteristics of desirable investmentsCaa - Poor standingCa - Speculative in a high degreeC - Lowest rated class of bondsModifiers:1 - Higher end of letter rating category2 - Mid-range of letter rating category3 - Lower end of letter rating category

PERFORMANCE


MKT VAL % of FUND 1 Month 3 Months YTD FYTD 1 Year 2 Years 3 Years 5 Years ITD Incept DateDOMESTIC EQUITYIndex
SSGA S&P 500 INDEX FUND 1,935,246,195 26.7 6.7 10.8 15.1 23.3 15.1 20.7 -2.8 0.1 11/01/2006S&P 500 6.7 10.8 15.1 23.3 15.1 20.6 -2.9 0.0
RUSSELL 2000 INDEX FUND 742,399,325 10.2 7.9 16.2 26.9 29.5 26.9 34.6 05/01/2009RUSSELL 2000 7.9 16.3 26.9 29.4 26.9 34.6
Active Core
WELLINGTON TECHNICAL EQUITY 161,334,905 2.2 5.6 11.8 5.4 20.2 5.4 13.6 0.8 3.9 08/01/2007RUSSELL 3000 6.8 11.6 16.9 24.5 16.9 22.5 -2.0 -1.3
OtherSHOTT CAPITAL 2,546,078 0.0 -1.4 -8.3 04/01/1999
TOTAL US EQUITY 2,841,526,504 39.2 6.9 12.2 17.4 24.6 17.4 22.9 -1.5 2.8 9.1 03/01/1989RUSSELL 3000 6.8 11.6 16.9 24.5 16.9 22.5 -2.0 -1.3
INTERNATIONAL EQUITYIndex
MSCI ACWI EX US INDEX FUND 1,367,618,322 18.9 7.9 7.2 11.3 25.0 11.3 30.1 05/01/2009MSCI AC WORLD ex US (NET) 7.8 7.2 11.2 25.0 11.2 30.0
ActiveTAX RECLAIMS 277,079 0.0 11/01/2009
MSCI AC WORLD ex US (GROSS) 7.9 7.3 11.6 25.1 11.6 14.6
SSGA TRANSITION ACCOUNT 309,650 0.0 11/01/2000
TOTAL INTERNATIONAL EQUITY 1,368,205,050 18.9 7.9 7.2 11.3 25.0 11.3 23.3 -2.8 5.2 5.1 03/01/1989MSCI AC WORLD ex US (GROSS) 7.9 7.3 11.6 25.1 11.6 14.6
U.S. FIXED INCOMECore
BROWN BROTHERS HARRIMAN - CORE 359,227,911 5.0 -0.8 -1.4 6.5 1.5 6.5 7.2 5.5 5.1 6.5 03/01/1990CITIGROUP BIG -1.2 -1.3 6.3 1.0 6.3 5.7 6.1 6.0 7.2
MortgagePYRAMIS GLOBAL ADVISORS 463,307,240 6.4 -0.6 0.5 7.2 1.6 7.2 7.7 6.7 6.0 7.5 10/01/1989
BC MBS -0.6 0.2 5.4 0.9 5.4 5.6 6.5 6.3 7.1Corporates
TAPLIN, CANIDA & HABACHT 363,716,525 5.0 -0.4 -1.1 8.5 2.8 8.5 16.8 5.8 5.4 6.7 04/01/1996BC CREDIT -1.0 -1.9 8.5 2.7 8.5 12.2 6.9 6.0 6.6
High YieldMACKAY SHIELDS, LLC 171,511,593 2.4 1.3 2.9 13.2 8.5 13.2 28.3 8.3 7.8 11.9 10/01/2002
CSFB GLOBAL HIGH YIELD 1.8 3.2 14.4 9.3 14.4 32.8 9.2 8.4 10.8Other
FIXED INCOME CASH ACCOUNT 275,813,432 3.8 0.0 0.1 0.2 0.1 0.2 0.3 1.1 2.0 04/01/2007
TOTAL US FIXED INCOME 1,633,576,700 22.5 -0.3 -0.1 6.2 2.1 6.2 10.2 5.9 5.7 6.5 12/01/1992BC AGGREGATE -1.1 -1.3 6.5 1.2 6.5 6.2 5.9 5.8 6.4
REAL RETURN POOL
BROWN BROTHERS HARRIMAN - TIPS 406,390,380 5.6 -1.7 -1.3 6.1 1.5 6.1 8.4 5.4 5.5 5.7 06/01/2004BARCLAYS US TIPS INDEX -1.6 -0.7 6.3 1.8 6.3 8.4 4.9 5.3 5.5
TOTAL REAL RETURN 406,390,380 5.6 -1.7 -1.3 6.1 1.5 6.1 8.4 5.4 5.5 5.7 06/01/2004CPI + 4% 0.4 1.2 5.1 2.4 5.1 4.9
ALTERNATIVE INVESTMENTS
REAL ESTATE 237,005,855 3.3 2.3 4.7 4.5 8.8 4.5 -22.3 -15.5 -4.7 -3.3 01/01/2005NCREIF PROPERTY LAG + 100 BPS 3.9 0.0 0.0 0.0 0.0 0.0 0.0 0.0 0.0
PRIVATE EQUITY 621,477,273 8.6 1.4 4.0 15.0 6.1 15.0 4.8 -2.0 6.6 8.9 01/01/1989S&P 500 PLUS 300 BP 6.9 11.6 18.5 25.0 18.5 24.2 0.1 5.4 12.8
TOTAL ALTERNATIVE INVESTMENTS 858,483,128 11.8 1.6 4.2 12.2 6.9 12.2 -4.4 -6.1 3.1 8.1 04/01/1996TOTAL ALTERNATIVES BENCHMARK 5.7 8.4 13.7 17.8 13.7 10.4 -1.1 5.2
RE-BALANCING
RUSSELL IMPLEMENTATION SERVICES 109,521,363 1.5 -0.2 -0.2 0.2 -0.2 0.2 0.4 0.0 09/01/2008
CASH
CASH ACCOUNT (INSIDE) 32,678,568 0.5 07/01/2000CASH ACCOUNT (OUTSIDE) 989,810 0.0 07/01/2000
TOTAL PLAN 7,251,371,504 100.0 3.9 6.0 12.3 14.3 12.3 15.1 -0.8 4.0 9.3 01/01/1984TOTAL PLAN BENCHMARK* 4.3 6.3 12.2 15.7 12.2 15.5 -1.2 4.0
State of Rhode IslandSummary of Performance
PERIODS ENDING December 31, 2010Rates of Return
* Effective 4/1/09: 36.0% RUSSELL 3000/ 22.0% BC AGG / 17.5% MSCI AC WORLD FREE EX USA / 10.0% CPI + 4% / 7.5% S&P 500 + 3% / 5.0%NCREIF PROPERTY LAGG / 2.0% 91 DAY T-BILL

MKT VAL % of FUND 6 YEARS 7 YEARS 8 YEARS 9 YEARS 10 YEARS ITD Incept DateDOMESTIC EQUITYIndex
SSGA S&P 500 INDEX FUND 1,935,246 26.7 0.1 11/1/2006S&P 500 2.7 3.9 6.7 3.0 1.4
RUSSELL 2000 INDEX FUND 742,399 10.2 34.6 5/1/2009RUSSELL 2000 4.5 6.4 10.8 6.8 6.3
Active Core
WELLINGTON TECHNICAL EQUITY 161,335 2.2 3.9 8/1/2007S&P 500 2.7 3.9 6.7 3.0 1.4
OtherSHOTT CAPITAL 2,546 0.0 4/1/1999
TOTAL US EQUITY 2,841,527 39.2 3.4 4.7 8.2 4.5 2.5 9.1 3/1/1989RUSSELL 3000 3.3 4.5 7.5 3.8 2.2
INTERNATIONAL EQUITYIndex
MSCI ACWI EX US INDEX FUND 1,367,618 18.9 30.1 5/1/2009MSCI EAFE (NET) 4.2 6.4 10.0 6.7 3.5
ActiveTAX RECLAIMS 277 0.0 11/1/2009
MSCI AC WORLD ex US (GROSS) 7.2 9.1 12.7 9.3 6.0
SSGA TRANSITION ACCOUNT 310 0.0 11/1/2000
TOTAL INTERNATIONAL EQUITY 1,368,205 18.9 7.0 8.8 11.5 8.1 4.7 5.1 3/1/1989MSCI AC WORLD ex US (GROSS) 7.2 9.1 12.7 9.3 6.0
U.S. FIXED INCOMECore
BROWN BROTHERS HARRIMAN - CORE 359,228 5.0 4.7 4.7 5.0 5.5 5.8 6.5 3/1/1990CITIGROUP BIG 5.4 5.3 5.1 5.7 6.0
MortgagePYRAMIS GLOBAL ADVISORS 463,307 6.4 5.5 5.5 5.3 5.8 6.1 7.5 10/1/1989
BC MBS 5.7 5.6 5.3 5.6 5.9 1/0/1900Corporates
TAPLIN, CANIDA & HABACHT 363,717 5.0 4.9 5.0 6.2 6.1 6.6 6.7 4/1/1996BC CREDIT 5.3 5.3 5.6 6.1 6.6
High YieldMACKAY SHIELDS, LLC 171,512 2.4 7.1 8.1 11.3 11.9 10/1/2002
CSFB GLOBAL HIGH YIELD 7.4 8.0 10.3 9.5 9.1 Other
FIXED INCOME CASH ACCOUNT 275,813 3.8 2.0 4/1/2007
TOTAL US FIXED INCOME 1,633,577 22.5 5.3 5.4 5.9 6.0 6.1 6.5 12/1/1992BC AGGREGATE 5.2 5.1 5.0 5.6 5.8
REAL RETURN POOL
BROWN BROTHERS HARRIMAN - TIPS 406,390 5.6 5.2 5.7 6/1/2004BC GLOBAL INFLATION LINKED: U.S. TIPS 4.9 5.4 5.8 6.9 7.0
TOTAL REAL RETURN 406,390 5.6 5.2 5.7CPI + 4% 6.4 6.5 6.5 6.5 6.4
ALTERNATIVE INVESTMENTS
REAL ESTATE 237,006 3.3 -3.3 -3.3 1/1/2005NCREIF PROPERTY INDEX QTR LAG 6.1 7.0 7.1 6.9 7.3
PRIVATE EQUITY 621,477 8.6 10.9 12.1 11.7 10.2 5.1 8.9 1/1/1989S&P 500 PLUS 300 BP 5.8 6.9 9.8 6.2 4.7
TOTAL ALTERNATIVE INVESTMENTS 858,483 11.8 7.6 9.1 9.0 7.7 3.7 8.1 4/1/1996TOTAL ALTERNATIVES BENCHMARK 6.4 7.4 9.1 6.9 6.1
RE-BALANCING
RUSSELL IMPLEMENTATION SERVICES 109,521 1.5 0.0 9/1/2008
CASH
CASH ACCOUNT (INSIDE) 32,679 0.5CASH ACCOUNT (OUTSIDE) 990 0.0
TOTAL PLAN 7,251,372 100.0 4.8 6.0 8.5 6.0 4.4 9.3 1/1/1984TOTAL PLAN BENCHMARK 4.6 5.7 8.1 5.7 4.3
* Effective 4/1/09: 36.0% RUSSELL 3000/ 22.0% BC AGG / 17.5% MSCI AC WORLD FREE EX USA / 10.0% CPI + 4% / 7.5% S&P 500 + 3% / 5.0%NCREIF PROPERTY LAGG / 2.0% 91 DAY T-BILL
State of Rhode IslandSummary of Performance
Rates of ReturnPERIODS ENDING December 31, 2010

STATE OF RHODE ISLANDTOTAL PLAN POOL ATTRIBUTION
1 Year Period: December 31, 2009 - December 31, 2010Value Added
Portfolio Benchmark Difference Portfolio Benchmark Difference Weighting Selection Timing
TOTAL US EQUITY 38.80 42.50 (3.70) 17.40 16.93 0.47 (0.25) 0.23
TOTAL INTERNATIONAL EQUITY 19.20 20.00 (0.80) 11.27 11.60 (0.33) (0.08) (0.04)
TOTAL US FIXED INCOME 26.60 25.00 1.60 6.18 6.54 (0.36) (0.27) (0.06)
RUSSELL IMPLEMENTATION SERVICES 1.50 0.00 1.50 0.21 17.17 (16.96) 0.46 (0.36)
REAL ESTATE 3.70 5.00 (1.30) 4.46 5.84 (1.38) 0.39 0.00
PRIVATE EQUITY 10.00 7.50 2.50 15.00 18.48 (3.48) 0.46 (0.35)TOTAL CASH 0.30 0.00 0.30 0.18 0.13 0.05 (0.06) 0.01TOTAL PLAN 100 100 12.26 12.22 0.04 0.63 (0.56) (0.04)
1 YEAR RETURNS VALUE ADDED ATTRIBUTION
Beginning Weights Returns Value Added
(1.50)
(1.00)
(0.50)
0.00
0.50
1.00
1.50
2.00
2.50Weighting Selection
12.26 12.22
Difference0.04
(40.00)
(30.00)
(20.00)
(10.00)
0.00
10.00
20.00
Total Plan Plan Benchmark Difference

December 31, 2010
Benchmark Market Value Transfers Market Value Market ValuePerformance Benchmark Alpha Description Performance Benchmark Alpha 11/30/2010 In/(out) 12/31/2010 Increase/decrease
Domestic Equity Shott Capital Management IRR 12.13% 15.06% -2.93% S & P 500 6.29% 6.68% -0.39% 2,395,295 - 2,546,078 150,783 SSgA S&P 500 15.14% 15.06% 0.08% S & P 500 6.68% 6.68% 0.00% 1,814,038,905 37,350 1,935,246,195 121,169,940 Wellington Tech Eq 5.43% 16.93% -11.50% Russell 3000 5.61% 6.78% -1.17% 153,071,559 - 161,334,905 8,263,346 Russell 2000 Index Fund 26.92% 26.85% 0.07% Russell 2000 7.92% 7.94% -0.02% 687,943,414 30,220 742,399,326 54,425,691
Total Domestic Equity 17.40% 16.93% 0.47% 6.94% 6.78% 0.16% 2,657,449,173 67,570 2,841,526,504 184,009,761
International Equity Boston Company 11.60% MSCI ACWI 7.85% 63,143 - 64,936 1,793
Goldman Sachs 11.60% MSCI ACWI 7.85% 104,665 (118) 107,980 3,433
Transition Account N/A N/A N/A N/A N/A N/A N/A 303,390 - 309,650 6,260
Mondrian 11.60% MSCI ACWI 7.85% 100,911 - 104,162 3,252
MSCI Ex US Index Fund 11.27% 11.15% 0.12% MSCI Ex US Index Fund 7.85% 7.83% 0.02% 1,268,044,332 151,075 1,367,618,322 99,422,915
Total International Equity 11.27% 11.60% -0.33% 7.85% 7.85% 0.00% 1,268,616,440 150,957 1,368,205,050 99,437,653
Fidelity Management & Research 7.16% 5.37% 1.79% BC MBS -0.56% -0.55% -0.01% 465,918,200 - 463,307,240 (2,610,960)
Brown Brothers, Harriman 6.48% 6.30% 0.18% Citigroup BIG -0.84% -1.16% 0.32% 362,280,954 - 359,227,911 (3,053,044)
Current Month
ERSRI Monthly Market Value Report With Time Weighted Returns
Valuation Change
Calendar YTD
Brown Brothers, Harriman 6.48% 6.30% 0.18% Citigroup BIG 0.84% 1.16% 0.32% 362,280,954 359,227,911 (3,053,044)
Taplin, Canida & Habacht 8.53% 8.47% 0.06% BC Credit -0.44% -1.01% 0.57% 365,329,666 - 363,716,525 (1,613,141)
Mackay Shields 13.18% 14.42% -1.24% CS First BosHiYield 1.32% 1.84% -0.52% 169,274,402 - 171,511,593 2,237,191
Fixed Income Cash Acct 0.19% 0.13% 0.06% 0.02% 0.02% 0.00% 312,664,815 (36,899,882) 275,813,432 48,499
Total Fixed Income 6.18% 6.54% -0.36% -0.30% -1.08% 0.78% 1,675,468,037 (36,899,882) 1,633,576,700 (4,991,455)
Alternative InvestmentsPrivate Equity 15.00% 18.48% -3.48% N/A 1.37% 6.93% -5.56% 623,972,440 (10,069,715) 621,477,273 7,574,548
Real Estate 4.46% 6.89% -2.43% NCREIF + 100 2.31% 3.94% -1.63% 234,036,072 (2,387,314) 237,005,855 5,357,098
Total Alternatives 12.20% 13.68% -1.48% 1.62% 5.70% -4.08% 858,008,512 (12,457,029) 858,483,128 12,931,645
Cash AccountsCash in Trust 0.19% 0.13% 0.06% 0.02% 0.02% 0.00% 10,115,594 23,282,260 32,678,568 (719,285)
Cash Outside Trust 0.00% 0.13% -0.13% 0.00% 0.02% -0.02% 1,092,659 - 989,810 (102,849)
Total Cash 0.19% 0.13% 0.06% 0.02% 0.02% 0.00% 11,208,253 23,282,260 33,668,378 (822,134)
Real Return PoolBrown Bros TIPS 6.14% 6.33% -0.19% CPI +4% -1.74% -1.56% -0.18% 413,591,189 - 406,390,380 (7,200,809)
OtherRussell Overlay 0.21% -0.22% 125,050,939 - 109,521,363 (15,529,576)
Total Plan Ex PE & RE 12.21% 12.01% 0.20% 4.17% 4.13% 0.04% 7,009,392,543 (25,856,124) 7,251,371,504 267,835,085 Total Plan 12.26% 12.22% 0.04% 3.86% 4.33% -0.47% *Policy Index: (Effective 04/1/09) 36% Russell 3000 Effective 11/1/09 Moved TIPS from Fixed Income to Real Return. The history remains in Fixed Income.22% BC Agg 639-362317.5% MSCI World Free Ex USA
10% CPI + 4%
7.5% S&P 500 + 3%
Geo's sic report1/20/2011
1

State of Rhode IslandRATES OF RETURN - TotalPeriods Ending December 31, 2010
PERFORMANCE SUMMARY REPORT1 Month Return Calendar YTD Return
Fund Index Excess Fund Index ExcessBenchmark Value (000)Net Flow
(000)
Provided by State Street Investment AnalyticsPage 7
U.S. EQUITYSSGA S&P 500 INDEX FUND S&P 500 6.68 6.68 0.00 15.14 15.06 0.08 1,935,246 -0SHOTT CAPITAL S&P 500 6.29 6.68 -0.39 12.13 15.06 -2.93 2,546 0WELLINGTON TECHNICAL EQUITY RUSSELL 3000 5.61 6.78 -1.17 5.43 16.93 -11.50 161,335 -315RUSSELL 2000 INDEX FUND RUSSELL 2000 7.92 7.94 -0.02 26.92 26.85 0.07 742,399 -0
TOTAL US EQUITY RUSSELL 3000 6.94 6.78 0.16 17.40 16.93 0.47 2,841,527 -315
INTERNATIONAL EQUITYTHE BOSTON COMPANY MSCI AC WORLD ex US (GROSS) 7.85 11.60 65 0GOLDMAN SACHS MSCI AC WORLD ex US (GROSS) 7.85 11.60 108 -0MONDRIAN MSCI AC WORLD ex US (GROSS) 7.85 11.60 104 0MSCI ACWI EX US INDEX FUND MSCI AC WORLD ex US (NET) 7.85 7.83 0.02 11.27 11.15 0.12 1,367,618 -0
TOTAL INTERNATIONAL EQUITY MSCI AC WORLD ex US (GROSS) 7.85 7.85 0.00 11.27 11.60 -0.33 1,368,205 -0
U.S. FIXED INCOMEPYRAMIS GLOBAL ADVISORS BC MBS -0.56 -0.55 -0.01 7.16 5.37 1.79 463,307 0BROWN BROTHERS HARRIMAN - CORE CITIGROUP BIG -0.84 -1.16 0.32 6.48 6.30 0.18 359,228 0TAPLIN, CANIDA & HABACHT BC CREDIT -0.44 -1.01 0.57 8.53 8.47 0.06 363,717 5MACKAY SHIELDS, LLC CSFB GLOBAL HIGH YIELD 1.32 1.84 -0.52 13.18 14.42 -1.24 171,512 0FIXED INCOME CASH ACCOUNT 91 DAY T-BILL 0.02 0.02 0.00 0.19 0.13 0.06 275,813 -36,900
TOTAL US FIXED INCOME BC AGGREGATE -0.30 -1.08 0.78 6.18 6.54 -0.36 1,633,577 -36,895

State of Rhode IslandRATES OF RETURN - TotalPeriods Ending December 31, 2010
PERFORMANCE SUMMARY REPORT1 Month Return Calendar YTD Return
Fund Index Excess Fund Index ExcessBenchmark Value (000)Net Flow
(000)
Provided by State Street Investment AnalyticsPage 8
REAL RETURN POOLBROWN BROTHERS HARRIMAN - TIPS BARCLAYS US TIPS INDEX -1.74 -1.56 -0.18 6.14 6.33 -0.19 406,390 01
TOTAL REAL RETURN POOL CPI + 4% -1.74 0.37 -2.11 6.14 5.11 1.03 406,390 0
ALTERNATIVE INVESTMENTSPRIVATE EQUITY S&P 500 PLUS 300 BP 1.37 6.93 -5.56 15.00 18.48 -3.48 621,477 -11,049REAL ESTATE NCREIF PROPERTY LAG + 100 BPS 2.31 3.94 -1.63 4.46 6.89 -2.43 237,006 -2,474
TOTAL ALTERNATIVE INVESTMENTS TOTAL ALTERNATIVES BENCHMARK 1.62 5.70 -4.08 12.20 13.68 -1.48 858,483 -13,524
CASH EQUIVALENTSCASH ACCOUNT (INSIDE) 91 DAY T-BILL 0.02 0.02 0.00 0.19 0.13 0.06 32,679 22,521CASH ACCOUNT (OUTSIDE) 91 DAY T-BILL 0.00 0.02 -0.02 0.00 0.13 -0.13 990 -103
TOTAL CASH 91 DAY T-BILL 0.01 0.02 -0.01 0.18 0.13 0.05 33,668 22,418
OTHERRUSSELL IMPLEMENTATION SERVICES -0.22 0.21 109,521 -62
TOTAL PLANTOTAL PLAN TOTAL PLAN BENCHMARK 3.86 4.33 -0.47 12.26 12.22 0.04 7,251,372 -28,377TOTAL PLAN ex PE RE TOTAL PLAN BENCHMARK ex PE RE 4.17 4.13 0.04 12.21 12.01 0.20 6,392,888 -14,853

State of Rhode IslandRATES OF RETURN - Total
PERFORMANCE SUMMARY REPORT
Periods Ending December 31, 2010
Endnotes
Provided by State Street Investment AnalyticsPage 9
Effective 11/1/09: Moved from Fixed Income to Real Return The return history remains in fixed income.1

State of Rhode IslandTOTAL PLAN
CUMULATIVE PERFORMANCE REPORT
PERIODS: December 31, 2007 - December 31, 2010Index: TOTAL PLAN BENCHMARK
Provided by State Street Investment AnalyticsPage 1

1 Month 1 Qtr 2 Qtrs 3 Qtrs 1 Yr 3 Yrs 5 Yrs 7 Yrs 10 Yrs
5th Percentile 0.58 9.64 11.06 11.37 11.89 4.96 5.67 7.19 5.69
25th Percentile -0.34 8.68 9.68 9.58 10.85 -1.15 4.13 6.13 4.80
50th Percentile -0.50 7.33 8.70 8.92 10.07 -1.91 3.62 5.74 4.38
75th Percentile -0.77 6.31 7.85 8.32 9.00 -2.95 2.98 5.36 3.98
95th Percentile -1.60 2.64 6.19 6.72 7.42 -5.04 1.49 3.57 2.97
No. of Obs 30 29 28 28 27 27 27 27 26
U TOTAL PLAN -0.49 49 7.59 37 7.89 69 8.67 59 9.49 65 -1.93 51 3.50 54 6.04 36 4.16 56
Ú TOTAL PLAN BENCHMAR1 -0.53 53 8.06 34 8.40 58 8.05 84 8.72 82 -2.71 69 3.38 64 5.69 56 4.12 68
State of Rhode IslandPublic Funds (DB) > $1 Billion (SSC)PERIOD ENDING November 30, 2010
TOTAL RETURN
Page 1Provided by State Street Investment Analytics
-6%
-4%
-2%
0%
2%
4%
6%
8%
10%
12%
UÚ
UÚ UÚUÚ
UÚ
UÚ
UÚ
UÚ
UÚ

1 Month 1 Qtr 2 Qtrs 3 Qtrs 1 Yr 3 Yrs 5 Yrs 7 Yrs 10 Yrs
5th Percentile 2.73 19.74 14.70 14.49 18.50 0.38 4.24 7.16 4.85
25th Percentile 1.32 16.11 11.45 11.23 15.03 -3.65 1.72 4.44 2.33
50th Percentile 0.75 14.61 9.90 9.88 13.33 -4.01 1.46 4.12 1.90
75th Percentile 0.10 13.40 9.46 8.85 10.63 -4.74 0.98 3.57 1.52
95th Percentile -1.01 9.80 6.73 6.98 6.01 -7.57 -0.32 3.17 -0.59
No. of Obs 27 28 28 27 27 24 24 20 20
U TOTAL US EQUITY 0.99 36 15.06 32 9.64 66 10.20 36 13.76 43 -3.87 33 1.46 53 4.29 39 1.90 48
Ú WILSHIRE 5000 0.53 69 14.16 64 9.99 43 9.86 54 12.62 58 -4.26 58 1.57 42 4.38 32 2.00 39
State of Rhode IslandUS EQUITY POOLS PUBLIC GT 1BILL (SSC)PERIOD ENDING November 30, 2010
TOTAL RETURN
Page 7Provided by State Street Investment Analytics
-10%
-6%
-2%
2%
6%
10%
14%
18%
22%
UÚ
UÚ
UÚ UÚ
UÚ
UÚ
UÚ
UÚ
UÚ

1 Qtr Qtr End Aug-10 Qtr End May-10 Qtr End Feb-10 1 Yr Yr End Nov-09 Yr End Nov-08 Yr End Nov-07 Yr End Nov-06
5th Percentile 11.79 8.00 0.15 -0.31 20.46 75.78 -42.78 42.12 35.99
25th Percentile 10.46 5.08 -2.37 -0.69 9.20 46.79 -45.86 22.11 29.42
50th Percentile 9.73 4.50 -3.99 -1.73 7.02 41.22 -46.87 19.97 28.30
75th Percentile 9.10 3.16 -5.25 -2.90 5.42 37.81 -48.86 16.22 25.55
95th Percentile 8.10 1.42 -7.71 -4.17 1.11 30.79 -50.28 12.86 22.74
No. of Obs 42 43 43 43 43 36 36 36 36
U TOTAL INTERNATIONAL 9.32 68 4.84 33 -5.31 78 -2.89 75 5.40 77 42.18 46 -43.84 15 15.43 79 28.13 54
Ú MSCI AC WORLD ex US (G 9.36 67 4.75 38 -5.05 67 -2.84 73 5.69 64 47.13 24 -48.95 83 22.54 21 29.25 28
State of Rhode IslandIntl Equity Pools - Public Funds (DB) (SSC)PERIOD ENDING November 30, 2010
TOTAL RETURN
Page 10Provided by State Street Investment Analytics
-60%
-40%
-20%
0%
20%
40%
60%
80%
UÚUÚ
UÚ UÚUÚ
UÚ
UÚ
UÚ
UÚ

1 Month 1 Qtr 2 Qtrs 3 Qtrs 1 Yr 3 Yrs 5 Yrs 7 Yrs 10 Yrs
5th Percentile 0.62 3.59 10.48 10.72 14.48 8.49 7.85 7.29 8.06
25th Percentile -0.44 1.26 6.28 10.01 11.22 7.87 7.24 6.62 7.35
50th Percentile -0.71 0.75 5.54 8.20 8.87 7.07 6.98 6.32 6.84
75th Percentile -1.41 0.28 4.56 7.00 7.09 5.59 6.29 5.63 6.45
95th Percentile -1.86 -3.80 3.04 2.12 -1.88 -4.04 3.91 3.93 4.60
No. of Obs 17 16 17 17 17 14 12 13 12
U TOTAL US FIXED INCOM -0.34 17 0.50 65 3.68 89 5.13 84 6.10 84 6.08 74 5.94 85 5.65 72 6.31 85
Ú BC AGGREGATE -0.57 46 -0.11 83 3.85 88 5.69 83 6.02 85 6.39 69 6.23 77 5.42 81 6.15 86
State of Rhode IslandUS FIXED INC POOL PUBLIC GT 1 BILL (SSC)PERIOD ENDING November 30, 2010
TOTAL RETURN
Page 13Provided by State Street Investment Analytics
-5%
-2%
1%
4%
7%
10%
13%
16%
UÚUÚ
UÚUÚ
UÚ UÚ UÚ UÚUÚ

State of Rhode IslandTOTAL PLAN
RISK VS. RETURN
December 31, 2005 - December 31, 2010Benchmark: TOTAL PLAN BENCHMARK
Provided by State Street Investment AnalyticsPage 1
RISK INFORMATION RISK STATISTICS
Portfolio ReturnBenchmark ReturnReturn DifferencesPortfolio Standard DeviationBenchmark StandardTracking Error
Historic BetaR-squaredJensen's AlphaSharpe RatioTreynor RatioInformation Ratio
0.913.983.970.01
11.8512.951.87
0.990.150.131.710.00

ASSET ALLOCATION

* Difference in actual investment allocation versus target allocation policy is offset by the notional overlay provided by the Russell Implementation account.
State of Rhode IslandAsset Allocation12/31/2010
US Equity39.2%
International Equity17.7%
US Fixed Income18.7%
Real Return5.6%
Real Estate3.3%
Private Equity8.6%
Russell 1.5%
Cash4.3%
Physical Allocation
US Equity38.4%
International Equity18.1%
US Fixed Income21.0%
Real Return5.7%
Real Estate3.3%
Private Equity8.7%
Russell
0.0% Cash4.7%
Notional Allocation
US Equity36.0%
International Equity17.5%
US Fixed Income22.0%
Real Return10.0%
Real Estate5.0%
Private Equity7.5%
Russell 0.0%
Cash2.0%
Policy Allocation

Asset Summary
RHODE ISLAND DECEMBER 31, 2010
Total Market Value 100.0% 7,246.1 100.0% 7,246.1 0.0% 0.0 100.0% 7,246.1 100.00% 7,246.1
Overlay TargetAsset Class Physical Exposure Synthetic Exposure Net Position Policy Target
Cash -5.9 -0.1% 5.8 0.1% -0.1 0.0% -0.1 0.0% 0.0 0.00%
Cash -5.9 -0.1% 5.8 0.1% -0.1 0.0% -0.1 0.0% 0.00% 0.0
Equity 4,829.4 66.6% -244.8 -3.4% 4,584.6 63.3% 4,543.1 62.7% 4,420.1 61.00%
International Developed 1,367.9 18.9% -73.1 -1.0% 1,294.8 17.9% 1,282.8 17.7% 17.50% 1,268.1
Private Equity 621.4 8.6% 0.0 0.0% 621.4 8.6% 621.4 8.6% 7.50% 543.5
US Small Cap 742.4 10.2% -79.0 -1.1% 663.4 9.2% 659.7 9.1% 9.00% 652.1
US Large Cap 2,097.7 28.9% -92.7 -1.3% 2,005.0 27.7% 1,979.2 27.3% 27.00% 1,956.4
Fixed 1,357.9 18.7% 239.1 3.3% 1,597.0 22.0% 1,638.5 22.6% 1,594.1 22.00%
Fixed Income 1,357.9 18.7% 239.1 3.3% 1,597.0 22.0% 1,638.5 22.6% 22.00% 1,594.1
Other 1,064.6 14.7% 0.0 0.0% 1,064.6 14.7% 1,064.6 14.7% 1,231.8 17.00%
Tactical Cash 420.3 5.8% 0.0 0.0% 420.3 5.8% 420.3 5.8% 5.80% 420.3
Real Estate 237.9 3.3% 0.0 0.0% 237.9 3.3% 237.9 3.3% 5.00% 362.3
Real Assets 406.4 5.6% 0.0 0.0% 406.4 5.6% 406.4 5.6% 6.20% 449.3
-4.0
-3.0
-2.0
-1.0
0.0
1.0
2.0
Cash Fixed Income InternationalDeveloped
Private Equity Real Assets Real Estate Tactical Cash US Large Cap US Small Cap
With Overlay
Without Overlay
Deviations from Target Allocation
1 Copyright © 2011 Russell Investments. All rights reserved.
All market values in millions, numbers may not add due to rounding
Daily values are provided by custodian and are unaudited
Balances and exposures include Russell Overlay accruals and pending trades
Total Absolute Notional Value: 483.9 (USD)

Domestic EquitySSGA S&P 500 INDEX FUND 1,935.25 26.69%WELLINGTON TECHNICAL EQUITY 161.33 2.22%SHOTT CAPITAL 2.55 0.04%RUSSELL 2000 INDEX FUND 742.40 10.24%
TOTAL DOMESTIC EQUITY 2,841.53 39.19%International Equity
MSCI ACWI EX US INDEX FUND 1,367.62 18.86%TAX RECLAIMS 0.28 0.00%SSGA TRANSITION ACCOUNT 0.31 0.00%
TOTAL INT'L EQUITY 1,368.21 18.87%Domestic Fixed Income
BROWN BROTHERS HARRIMAN - CORE 359.23 4.95%PYRAMIS GLOBAL ADVISORS 463.31 6.39%MACKAY SHIELDS, LLC 171.51 2.37%TAPLIN, CANIDA & HABACHT 363.72 5.02%
TOTAL FIXED-INCOME 1,357.76 18.72%Alternative Investments
Real Estate 237.01 3.27%Pacific Corp Group 621.48 8.57%
TOTAL ALTERNATIVE INVESTMENTS 858.48 11.84%Real Return Pool
BROWN BROTHERS HARRIMAN - TIPS 406.39 5.60%
TOTAL REAL RETURN POOL 406.39 5.60%Cash
CASH EQUIVALENTS 33.67 0.46%FIXED INCOME CASH ACCOUNT 275.81 3.80%
Other Russell Implementation Services 109.52 1.51%
TOTAL ASSETS 7,251.37 100.00%
STIF, Yield+
Mortgages
TIPS
December 31, 2010
High YieldCorporates
Real EstatePrivate Equity
Passive
Actual
STIF, Yield+
ClosedClosed
Opportunistic Core
Enhanced EquityTactical Equity
Mandate
ASSET ALLOCATION REPORT
(Millions $)
PassivePassive
Style

11/30/2010
Target Current 1 Yr Ago 3 Yrs Ago 5 Yrs Ago
US Equity 36.0% 39.2% 36.6% 42.1% 44.7%International Equity 17.5% 18.9% 18.1% 20.0% 23.5%US Fixed Income 22.0% 18.7% 18.5% 25.4% 23.9%Real Return 10.0% 5.6% 5.6% 0.0% 0.0%Real Estate 5.0% 3.3% 3.5% 4.3% 1.8%Private Equity 7.5% 8.6% 9.4% 7.7% 5.6%Russell Implementation* 0.0% 1.5% 1.4% 0.0% 0.0%Cash 2.0% 4.3% 6.9% 0.5% 0.6%Total Plan 100.0% 100.0% 100.0% 100.0% 100.0%
Historical Asset AllocationState of Rhode Island
12/31/2010
US Equity US Equity US Equity US Equity US Equity
International EquityInternational Equity International Equity International Equity
International Equity
US Fixed Income US Fixed Income
US Fixed IncomeUS Fixed Income
US Fixed Income
Real ReturnReal Return
Real Return
Real Return
Real Return
Real EstateReal Estate Real Estate
Real EstateReal Estate
Private Equity Private Equity Private Equity
Private EquityPrivate Equity
Cash Cash Cash
CashCash
Russell Implementation* Russell Implementation* Russell Implementation* Russell Implementation* Russell Implementation*
0%
10%
20%
30%
40%
50%
60%
70%
80%
90%
100%
Target Current 1 Yr Ago 3 Yrs Ago 5 Yrs Ago

State of Rhode IslandMANAGER ALLOCATION ANALYSIS
CURRENT MANAGER ALLOCATION
PERIOD ENDING 12/31/2010
Provided by State Street Investment AnalyticsPage 4
CURRENTPERIOD
ONE YEARAGO ALLOC. FUND
1 BROWN BROTHERS 406.4 383.4 19.9
PYRAMIS GLOBAL ADVISORS 463.3 432.7 22.7
FIXED INCOME CASH 275.8 451.3 13.5
TAPLIN, CANIDA & HABACHT 363.7 335.6 17.8
BROWN BROTHERS 359.2 337.7 17.6
MACKAY SHIELDS, LLC 171.5 152.3 8.4
2,040.0 2,093.0 100.0TOTAL

State of Rhode IslandMANAGER ALLOCATION ANALYSIS
CURRENT MANAGER ALLOCATION
PERIOD ENDING 12/31/2010
Provided by State Street Investment AnalyticsPage 3
CURRENTPERIOD
ONE YEARAGO ALLOC. FUND
RUSSELL 2000 INDEX FUND 742.4 654.9 26.1
SSGA S&P 500 INDEX FUND 1,935.2 1,680.6 68.1
SHOTT CAPITAL 2.5 1.5 0.1
WELLINGTON TECHNICAL 161.3 154.7 5.7
2,841.5 2,491.7 100.0TOTAL

State of Rhode IslandPERIOD ENDING 12/31/2010
CURRENT ASSET CLASS ALLOCATION (IN MILLIONS)
Provided by State Street Investment AnalyticsPage 2
CURRENTPERIOD FUND
TOTAL US EQUITY 2,841.5
TOTAL US FIXED INCOME 1,633.6
TOTAL INTERNATIONAL EQUITY 1,368.2
TOTAL ALTERNATIVE INVESTMENTS 858.5
TOTAL CASH 33.7
RUSSELL IMPLEMENTATION SERVICES 109.5
TOTAL REAL RETURN POOL 406.4
7,251.4TOTAL

State of Rhode IslandMANAGER ALLOCATION ANALYSIS
CURRENT MANAGER ALLOCATION
PERIOD ENDING 12/31/2010
Provided by State Street Investment AnalyticsPage 6
CURRENTPERIOD
ONE YEARAGO ALLOC. FUND
MSCI ACWI EX US INDEX 1,367.6 1,229.0 100.0
GOLDMAN SACHS 0.1 0.4 0.0
MONDRIAN 0.1 0.4 0.0
THE BOSTON COMPANY 0.1 0.4 0.0
1,367.9 1,230.2 100.0TOTAL

CASH FLOW

CASH FLOW ANALYSIS - INCOME & EXPENSES
Employees Retirement System
FISCAL YEAR 2011 FY 2010-11Actual Actual Actual Actual Actual Actual Projected Projected Projected Projected Projected ProjectedJuly August September October November December January February March April May June TOTAL2010 2011
MEMBER BENEFITS 64,786,488 65,481,557 65,315,924 65,166,401 65,107,559 65,068,608 64,740,453 64,876,760 64,656,314 64,567,121 64,560,508 64,475,293 778,802,986
ADMINISTRATIVE 393,312 548,021 590,613 618,987 508,890 492,317 365,869 494,446 750,716 624,882 615,392 866,576 6,870,022EXPENSES
INVESTMENT 1,380,131 2,706 360,147 343,219 464,523 886,459 1,108,357 159,865 234,516 376,620 378,219 352,246 6,047,008EXPENSES
TOTAL OUTFLOW 66,559,931 66,032,284 66,266,684 66,128,608 66,080,973 66,447,384 66,214,679 65,531,071 65,641,546 65,568,623 65,554,119 65,694,115 791,720,016
CONTRIBUTIONS 36,468,984 42,272,364 26,277,602 55,664,547 35,150,605 40,872,116 55,724,324 38,389,409 38,842,643 43,857,442 20,000,348 36,811,095 470,331,479
OTHER INCOME* 1,128,429 5,823,900 2,312,189 3,673,433 3,646,844 7,980,238 712,073 1,400,191 5,187,461 3,439,255 1,361,324 7,740,460 44,405,798
TOTAL INCOME 37,597,413 48,096,264 28,589,791 59,337,980 38,797,449 48,852,354 56,436,397 39,789,600 44,030,104 47,296,697 21,361,672 44,551,555 514,737,277
DIFFERENCE (28,962,518) (17,936,020) (37,676,893) (6,790,627) (27,283,524) (17,595,030) (9,778,282) (25,741,471) (21,611,442) (18,271,926) (44,192,447) (21,142,560) (276,982,739)
Municipal Employees Retirement System
Actual Actual Actual Actual Actual Actual Projected Projected Projected Projected Projected ProjectedJuly August September October November December January February March April May June TOTALy g p y y p y2010 2011
MEMBER BENEFITS 5,759,121 5,970,389 5,961,434 5,986,138 6,028,530 6,024,441 5,628,244 5,741,454 5,676,550 5,696,530 5,747,541 5,766,674 69,987,046
ADMINISTRATIVE 72,431 100,922 109,616 114,883 94,718 91,633 65,615 89,051 135,206 113,371 111,649 159,026 1,258,120EXPENSES
INVESTMENT 254,162 498 66,843 63,701 86,460 164,993 198,773 28,792 42,237 68,329 68,619 64,641 1,108,047EXPENSES
TOTAL OUTFLOW 6,085,714 6,071,810 6,137,893 6,164,722 6,209,708 6,281,067 5,892,631 5,859,297 5,853,993 5,878,230 5,927,809 5,990,340 72,353,213
CONTRIBUTIONS 4,157,420 4,226,982 3,779,357 3,955,928 4,286,411 4,770,013 5,113,953 6,276,047 6,226,961 4,556,660 4,271,452 7,021,682 58,642,866
OTHER INCOME* 207,809 1,072,515 429,137 681,781 678,772 1,485,328 127,703 252,178 934,273 623,975 246,982 1,420,455 8,160,908
TOTAL INCOME 4,365,229 5,299,497 4,208,494 4,637,709 4,965,183 6,255,341 5,241,656 6,528,225 7,161,234 5,180,635 4,518,434 8,442,137 66,803,774
DIFFERENCE (1,720,485) (772,313) (1,929,399) (1,527,013) (1,244,525) (25,726) (650,975) 668,928 1,307,242 (697,595) (1,409,375) 2,451,797 (5,549,439)

CASH FLOW ANALYSIS - INCOME & EXPENSES
Judges/State PoliceRetirement System Actual Actual Actual Actual Actual Actual Projected Projected Projected Projected Projected Projected
July August September October November December January February March April May June TOTAL2010 2011
MEMBER BENEFITS 115,057 113,835 125,801 123,501 123,501 123,501 108,032 108,076 108,054 108,054 108,054 108,054 1,373,520
ADMINISTRATIVE 6,471 9,016 9,907 10,383 8,694 8,411 5,624 7,736 11,745 9,954 9,803 14,075 111,819EXPENSES
INVESTMENT 22,706 45 6,041 5,757 7,936 15,144 17,038 2,501 3,669 5,999 6,025 5,721 98,582EXPENSES
TOTAL OUTFLOW 144,233 122,896 141,749 139,641 140,131 147,056 130,693 118,313 123,468 124,007 123,881 127,851 1,583,920
CONTRIBUTIONS 370,000 390,000 375,000 705,000 424,000 425,000 467,000 445,000 462,000 528,000 65,000 760,000 5,416,000
OTHER INCOME* 18,565 95,814 38,784 61,618 62,303 136,335 10,946 21,907 81,161 54,785 21,685 125,725 729,627
TOTAL INCOME 388,565 485,814 413,784 766,618 486,303 561,335 477,946 466,907 543,161 582,785 86,685 885,725 6,145,627
DIFFERENCE 244,332 362,918 272,035 626,977 346,172 414,279 347,253 348,594 419,692 458,778 (37,196) 757,875 4,561,707
*includes income from Real Estate Investments, Private Equity, Securities Lending, and Cash Accounts,

FISCAL YEAR 2011 INVESTMENT MANAGER FEES, PROFESSIONAL FEES & OPERATING EXPENSES
ERSRI & MERSRI ACCRUAL BASIS
Actual Actual Actual Projected Projected Projected Projected Projected Projected Projected Projected Projected ProjectedJul 10 Aug Sept Oct Nov Dec Jan 11 Feb 11 Mar 11 Apr 11 May 11 June 11 TOTAL
EQUITIES
SSgA Russell 1000/S&P 5ZU14 37,365 7,127 31,075 100,000 175,567SSGA Russell 2000 ZU06 30,227 30,801 33,387 17,388 Shott Capital ZU49 264 5 460 2,718 3,446Wellington Tech Eq ZU04 315,297 350,000 340,655 350,000 1,355,952
383,153 387,933 405,577 470,106 1,534,966
FIXED INCOME Brown Bros. ZU44 166,174 107,338 159,463 152,252 585,228 Fidelity ZU46 152,798 145,993 147,583 140,949 587,323 Taplin ZU84 228,218 210,205 214,524 179,763 832,711 Mackay Shields ZU59 175,084 161,036 167,506 147,848 651,474 Brown Bros.TIPS ZU69 114,026 158,453 108,601 113,544 494,624
836,300 783,025 797,678 734,357 3,151,360
INT'L EQUITIES
The Boston Co ZU77 0 0 0 0 0 Mondrian ZU67 0 0 0 0 0 Goldman Sachs Asset MgmZU25 0 0 0 0 0 SSgA MSCI ACWI ZU08 151,078 149,875 149,217 150,000 600,170g , , , , ,
0 151,078 0 149,875 149,217 150,000 600,170
REAL ESTATE 0
L & B Real Estate ZU79 135,186 0 86,931 127,607 357,152 979,695 1,173,526 0 243,230 150,642 385,731 86,250 3,725,951 ALTERNATIVE INVESTMENTS Other Alt Inv Mgmt FeesZU32 1,521,813 3,248 346,100 285,070 201,766 86,901 150,640 191,158 195,052 300,306 67,133 336,359 3,685,547
SUB TOTAL-INV MGMT FEES 1,656,999 3,248 1,803,562 412,677 558,919 2,387,429 1,324,167 191,158 1,790,754 450,948 452,864 1,777,072 12,697,994
PROFESSIONAL FEES
Legal 11,405 1,415 1,350 1,013 639 828 6,000 2,933 729 731 12,273 2,453 41,767 St St Bank Custodial 62,022 61,219 62,196 63,000 63,000 63,000 63,723 63,896 61,083 63,189 62,639 62,000 750,968 Pacific Corp Group ZU76 84,375 0 0 84,375 0 0 87,500 0 84,375 93,750 434,375 PCA/Wilshsire/Russell 29,792 13,125 74,629 13,125 13,125 13,125 13,125 13,125 93,129 13,125 13,125 13,125 315,678 Townsend 0 0 35,625 0 0 35,625 0 0 35,625 0 35,625 142,500
103,220 160,134 173,801 77,138 161,139 112,578 82,848 167,453 190,565 161,421 88,037 206,954 1,685,288OPERATING EXPENSE Retirement Transfers 264,911 439,143 641,931 665,657 385,417 467,833 388,964 501,148 524,808 647,610 392,246 827,323 6,146,991 Other Expense 12,500 0 5,700 0 0 11,950 5,400 0 11,650 0 6,250 5,400 58,850
277,411 439,143 647,631 665,657 385,417 479,783 394,364 501,148 536,458 647,610 398,496 832,723 6,205,841
TOTAL: 2,037,629 602,525 2,624,994 1,155,472 1,105,475 2,979,789 1,801,380 859,760 2,517,778 1,259,979 939,396 2,816,748 20,589,123
Note: Numbers in bold are actual. -2- EXPENS09

State of Rhode Island Alternative Investments Unfunded CommitmentDecember 2010
Partnership Investment Total CommitmentERSRIRemaining
Commitment
Alta BioPhama Partners III 15,000,000.00$ 1,500,000.00$ Alta Partners VIII 15,000,000.00$ 5,250,000.00$ Aurora Equity Partners II** 15,000,000.00$ -$ Aurora Equity Partners III** 15,000,000.00$ 835,850.00$ Avenue Special Situations Fund III 15,000,000.00$ -$ Avenue Special Situations Fund IV 20,000,000.00$ -$ Avenue V 20,000,000.00$ -$ Bain X 25,000,000.00$ 12,812,500.00$ Birch Hill Equity Partners III* 18,036,000.00$ 893,641.17$ Castile III 5,000,000.00$ 1,375,000.00$ Centerbridge 15,000,000.00$ 1,085,947.28$ Charterhouse Capital Partners VIII* 20,076,000.00$ 3,937,478.38$ Coller International Capital IV** 15,000,000.00$ 2,100,000.00$ Coller International Capital V 15,000,000.00$ 5,100,000.00$ Constellation III 15,000,000.00$ 7,317,632.84$ CVC European Equity Partners lll 20,000,000.00$ 899,966.05$ CVC European Equity Partners IV* 22,083,600.00$ 2,816,218.24$ CVC 5 26,768,000.00$ 14,184,565.50$ Fenway Partners Capital Fund II 15,000,000.00$ 182,176.02$ Fenway III 15,000,000.00$ 2,598,062.00$ First Reserve Fund X 20,000,000.00$ 1.00$ First Reserve Fund XI 20,000,000.00$ 4,377,941.00$ Focus Ventures III 15,000,000.00$ 675,000.00$ Granite Global Ventures II 15,000,000.00$ 675,000.00$ Granite Global Ventures III 15,000,000.00$ 3,000,000.00$ Green Equity Investors V 20,000,000.00$ 9,405,283.78$ Harvest Partners III 15,000,000.00$ 357,288.61$ Kayne Anderson Energy Fund III 15,000,000.00$ 1,312,078.00$ Kayne Anderson Energy Fund IV 15,000,000.00$ 5,550,000.00$ Leapfrog Ventures II 10,000,000.00$ 1,485,000.00$ Leeds Weld Equity Partners IV 10,000,000.00$ 114,277.47$ Lighthouse Capital Partners V 11,250,000.00$ 787,500.00$ Lighthouse Capital Partners VI 15,000,000.00$ 2,475,000.00$ LNK Partners 12,500,000.00$ 3,357,293.99$
Matlin Patterson Glb. Opp. Fund (CSFB) 15,000,000.00$ -$ MHR Institutional Partners III 20,000,000.00$ 5,877,953.00$ Nautic Partners V 20,000,000.00$ 659,283.90$ Nautic Partners VI 20,000,000.00$ 8,601,381.62$ Nordic Capital Fund III* 11,920,000.00$ 194,308.66$ Nordic Capital Fund V* 19,561,452.12$ -$ Nordic Capital Fund VI* 20,076,000.00$ 937,256.08$ Nordic VII 20,076,000.00$ 10,916,410.97$

State of Rhode Island Alternative Investments Unfunded CommitmentDecember 2010
OCM Opportunities Fund II 12,000,000.00$ -$ Palladin III 10,000,000.00$ 4,898,223.99$ Parthenon Investors 15,000,000.00$ -$ Parthenon Investors ll 20,000,000.00$ 1,953,022.00$ Perseus VII 15,000,000.00$ 3,092,906.00$ Point 406 10,000,000.00$ 3,579,999.84$ Point Judith II 5,000,000.00$ 1,789,974.93$ Providence Equity Partners III 15,000,000.00$ 1,938,955.51$ Providence Equity Partners IV 25,000,000.00$ 1,893,462.00$ Providence Equity Partners V 25,000,000.00$ 2,225,717.00$ Providence Equity Partners VI 25,000,000.00$ 7,144,071.00$ SKM Equity Fund II** 10,000,000.00$ 1,735,947.00$ Thomas McNerney & Partners 15,000,000.00$ 1,387,500.00$ Thomas McNerney & Partners 2 15,000,000.00$ 6,562,500.00$ TPG Partners II 10,000,000.00$ 308,515.00$ TPG Partners IV 15,000,000.00$ 1,080,897.00$ TPG Partners V 20,000,000.00$ 3,010,431.00$ TPG VI 10,000,000.00$ 6,525,618.00$ Trilantic IV 11,098,351.00$ 4,403,667.53$ VS&A Communication Partners III 15,000,000.00$ -$ W Capital Partners 15,000,000.00$ 880,500.00$ W Capital Partners II 15,000,000.00$ 5,309,550.00$
Washington & Congress Capital Partners** 15,000,000.00$ 305,637.24$ Wellspring Capital Partners III 20,000,000.00$ 88,978.00$ Wellspring Capital Partners IV 20,000,000.00$ 2,298,440.00$ WLR 8,000,000.00$ 3,447,950.00$
Total Alternative Investments 1,088,445,403.12$ 189,509,758.59$
*transactions occur in foreign currence
** fees NOT affecting unfunded commitment

State of Rhode Island Real Estate Investment Unfunded CommittmentDecember 2010
Real Estate Partnership InvestmentERSRI Remaining
Commitment
AEW 35,000,000.00$ 10,856,481.73$ Fillmore East Fund I 10,000,000.00$ 0.08$ Fremont Strategic Property Partners II 15,000,000.00$ 1,873,108.00$ GMAC Commerical Realty Partners II 15,000,000.00$ 2,155,117.00$ JPMorgan Fleming Asset Mgmt. Strat. Pro 50,000,000.00$ -$ JPMorgan Alternative Property Fund 20,000,000.00$ -$ LaSalle Income & Growth Fund IV 15,000,000.00$ 397,937.57$ LaSalle Income & Growth Fund IV 15,000,000.00$ 397,937.57$ Magna Hotel 4,000,000.00$ 2,709,898.00$ Morgan Stanley Prime Property Fund 35,000,000.00$ -$ Prudential Real Esate Investors (PRISA) 50,000,000.00$ -$ Prudential Real Esate Investors (PRISA) I 15,000,000.00$ -$ RREEF America REIT II Fund 35,000,000.00$ -$ Starwood Hospitality Fund I 10,000,000.00$ -$ TA Realty Fund VIII 15,000,000.00$ -$ Tri Continential Fund VII 15,000,000.00$ 428,467.00$ Walton Street Real Estate Fund V 20,000,000.00$ -$ Westbrook Real Estate Fund VI*** 15,000,000.00$ 79,399.00$ Westbrook Real Estate Fund VII 15,000,000.00$ 1,500,000.00$ ***-adjusted to reflect required reserve amount
389,000,000.00$ 20,000,408.38$

SHORT TERM INVESTMENTS

RI SIC GUIDELINE COMPLIANCE REPORT
INVESTMENTS AS OF:
REPO = Repurchase AgreementCP = Commercial PaperGID = Government Insured DepositCD = Certificate of DepositCoD = Collateralized DepositAgency = US Government Agency
Vendor CP CD Agency Money Mkt PIP Repo GID Total ($)Guidelines-Total/Vendor 25%/10% 50%/20% 75%/35% 75%/35% 75%/35% 100%/20% 75%/35%Bank RI 0 0 0 0 0 0 0 0
0% 0% 0% 0% 0% 0% 0% 0.00%Sovereign Bank 0 0 0 0 0 0 0 0
0% 0% 0% 0% 0% 0% 0% 0.00%JP Morgan Chase 0 0 0 0 0 0 0 0
0% 0% 0% 0% 0% 0% 0% 0.00%Federated Investors 0 0 0 0 0 0 0 0
0% 0% 0% 0% 0% 0% 0% 0.00%Fidelity 0 0 0 60,899,857 0 0 0 60,899,857
0% 0% 0% 21% 0% 0% 0% 20.80%BlackRock 0 0 0 14,761,135 0 0 0 14,761,135
0% 0% 0% 5% 0% 0% 0% 5.04%Wells Fargo 0 0 0 0 0 0 0 0
0% 0% 0% 0% 0% 0% 0% 0.00%Citizens Bank 0 0 0 0 100,086,977 0 0 100,086,977
0% 0% 0% 0% 34% 0% 0% 34.19%Webster Bank 0 0 0 0 91,982,867 0 0 91,982,867
0% 0% 0% 0% 31% 0% 0% 31.42%Oppenheimer Inc 0 0 0 0 0 0 0 0
0% 0% 0% 0% 0% 0% 0% 0.00%Washington Trust 0 25,034,493 0 0 0 0 0 25,034,493
0% 9% 0% 0% 0% 0% 0% 8.55%TOTALS - 25,034,492.77 - 75,660,991.89 192,069,844.01 - - 292,765,329
(%) PORTFOLIO 0.00% 8.55% 0.00% 25.84% 65.61% 0.00% 0.00% 100.00%
Note: PIP + CD must be under 75%. 74.16%Note: Maximum participation by any one vendor limited to 35% of total portfolio.
December 31, 2010
Acutal PIP + CD:
CD8%
Agency0%
Money Mkt26%
PIP66%
GID0%
Fidelity20.80%
BlackRock5.04%
Citizens Bank34.19%
Webster Bank31.42%
Washington Trust8.55%
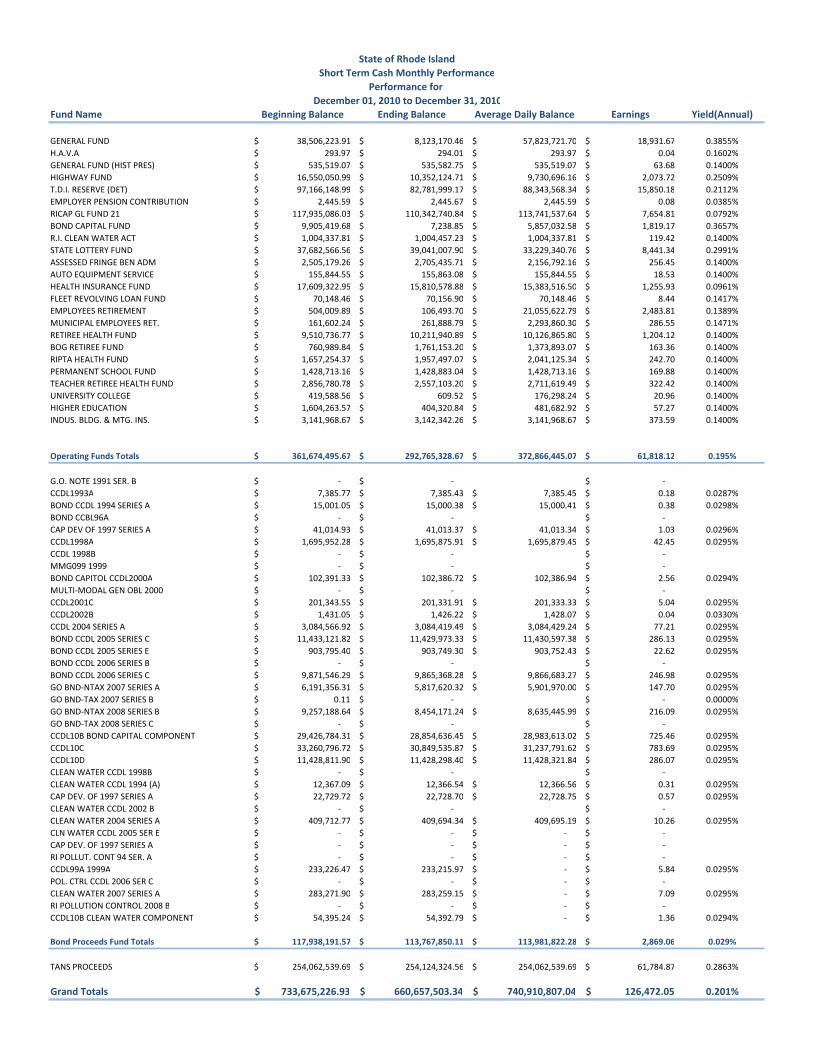
Fund Name Beginning Balance Ending Balance Average Daily Balance Earnings Yield(Annual)
GENERAL FUND 38,506,223.91$ 8,123,170.46$ 57,823,721.70$ 18,931.67$ 0.3855%H.A.V.A 293.97$ 294.01$ 293.97$ 0.04$ 0.1602%GENERAL FUND (HIST PRES) 535,519.07$ 535,582.75$ 535,519.07$ 63.68$ 0.1400%HIGHWAY FUND 16,550,050.99$ 10,352,124.71$ 9,730,696.16$ 2,073.72$ 0.2509%T.D.I. RESERVE (DET) 97,166,148.99$ 82,781,999.17$ 88,343,568.34$ 15,850.18$ 0.2112%EMPLOYER PENSION CONTRIBUTION 2,445.59$ 2,445.67$ 2,445.59$ 0.08$ 0.0385%RICAP GL FUND 21 117,935,086.03$ 110,342,740.84$ 113,741,537.64$ 7,654.81$ 0.0792%BOND CAPITAL FUND 9,905,419.68$ 7,238.85$ 5,857,032.58$ 1,819.17$ 0.3657%R.I. CLEAN WATER ACT 1,004,337.81$ 1,004,457.23$ 1,004,337.81$ 119.42$ 0.1400%STATE LOTTERY FUND 37,682,566.56$ 39,041,007.90$ 33,229,340.76$ 8,441.34$ 0.2991%ASSESSED FRINGE BEN ADM 2,505,179.26$ 2,705,435.71$ 2,156,792.16$ 256.45$ 0.1400%AUTO EQUIPMENT SERVICE 155,844.55$ 155,863.08$ 155,844.55$ 18.53$ 0.1400%HEALTH INSURANCE FUND 17,609,322.95$ 15,810,578.88$ 15,383,516.50$ 1,255.93$ 0.0961%FLEET REVOLVING LOAN FUND 70,148.46$ 70,156.90$ 70,148.46$ 8.44$ 0.1417%EMPLOYEES RETIREMENT 504,009.89$ 106,493.70$ 21,055,622.79$ 2,483.81$ 0.1389%MUNICIPAL EMPLOYEES RET. 161,602.24$ 261,888.79$ 2,293,860.30$ 286.55$ 0.1471%RETIREE HEALTH FUND 9,510,736.77$ 10,211,940.89$ 10,126,865.80$ 1,204.12$ 0.1400%BOG RETIREE FUND 760,989.84$ 1,761,153.20$ 1,373,893.07$ 163.36$ 0.1400%RIPTA HEALTH FUND 1,657,254.37$ 1,957,497.07$ 2,041,125.34$ 242.70$ 0.1400%PERMANENT SCHOOL FUND 1,428,713.16$ 1,428,883.04$ 1,428,713.16$ 169.88$ 0.1400%TEACHER RETIREE HEALTH FUND 2,856,780.78$ 2,557,103.20$ 2,711,619.49$ 322.42$ 0.1400%UNIVERSITY COLLEGE 419,588.56$ 609.52$ 176,298.24$ 20.96$ 0.1400%HIGHER EDUCATION 1,604,263.57$ 404,320.84$ 481,682.92$ 57.27$ 0.1400%INDUS. BLDG. & MTG. INS. 3,141,968.67$ 3,142,342.26$ 3,141,968.67$ 373.59$ 0.1400%
Operating Funds Totals 361,674,495.67$ 292,765,328.67$ 372,866,445.07$ 61,818.12$ 0.195%
G.O. NOTE 1991 SER. B ‐$ ‐$ ‐$ CCDL1993A 7,385.77$ 7,385.43$ 7,385.45$ 0.18$ 0.0287%BOND CCDL 1994 SERIES A 15,001.05$ 15,000.38$ 15,000.41$ 0.38$ 0.0298%BOND CCBL96A ‐$ ‐$ ‐$ CAP DEV OF 1997 SERIES A 41,014.93$ 41,013.37$ 41,013.34$ 1.03$ 0.0296%CCDL1998A 1,695,952.28$ 1,695,875.91$ 1,695,879.45$ 42.45$ 0.0295%CCDL 1998B ‐$ ‐$ ‐$ MMG099 1999 ‐$ ‐$ ‐$ BOND CAPITOL CCDL2000A 102,391.33$ 102,386.72$ 102,386.94$ 2.56$ 0.0294%MULTI‐MODAL GEN OBL 2000 ‐$ ‐$ ‐$ CCDL2001C 201,343.55$ 201,331.91$ 201,333.33$ 5.04$ 0.0295%CCDL2002B 1,431.05$ 1,426.22$ 1,428.07$ 0.04$ 0.0330%CCDL 2004 SERIES A 3,084,566.92$ 3,084,419.49$ 3,084,429.24$ 77.21$ 0.0295%BOND CCDL 2005 SERIES C 11,433,121.82$ 11,429,973.33$ 11,430,597.38$ 286.13$ 0.0295%BOND CCDL 2005 SERIES E 903,795.40$ 903,749.30$ 903,752.43$ 22.62$ 0.0295%BOND CCDL 2006 SERIES B ‐$ ‐$ ‐$ BOND CCDL 2006 SERIES C 9,871,546.29$ 9,865,368.28$ 9,866,683.27$ 246.98$ 0.0295%GO BND‐NTAX 2007 SERIES A 6,191,356.31$ 5,817,620.32$ 5,901,970.00$ 147.70$ 0.0295%GO BND‐TAX 2007 SERIES B 0.11$ ‐$ ‐$ 0.0000%GO BND‐NTAX 2008 SERIES B 9,257,188.64$ 8,454,171.24$ 8,635,445.99$ 216.09$ 0.0295%GO BND‐TAX 2008 SERIES C ‐$ ‐$ ‐$ CCDL10B BOND CAPITAL COMPONENT 29,426,784.31$ 28,854,636.45$ 28,983,613.02$ 725.46$ 0.0295%CCDL10C 33,260,796.72$ 30,849,535.87$ 31,237,791.62$ 783.69$ 0.0295%CCDL10D 11,428,811.90$ 11,428,298.40$ 11,428,321.84$ 286.07$ 0.0295%CLEAN WATER CCDL 1998B ‐$ ‐$ ‐$ CLEAN WATER CCDL 1994 (A) 12,367.09$ 12,366.54$ 12,366.56$ 0.31$ 0.0295%CAP DEV. OF 1997 SERIES A 22,729.72$ 22,728.70$ 22,728.75$ 0.57$ 0.0295%CLEAN WATER CCDL 2002 B ‐$ ‐$ ‐$ CLEAN WATER 2004 SERIES A 409,712.77$ 409,694.34$ 409,695.19$ 10.26$ 0.0295%CLN WATER CCDL 2005 SER E ‐$ ‐$ ‐$ ‐$ CAP DEV. OF 1997 SERIES A ‐$ ‐$ ‐$ ‐$ RI POLLUT. CONT 94 SER. A ‐$ ‐$ ‐$ ‐$ CCDL99A 1999A 233,226.47$ 233,215.97$ ‐$ 5.84$ 0.0295%POL. CTRL CCDL 2006 SER C ‐$ ‐$ ‐$ ‐$ CLEAN WATER 2007 SERIES A 283,271.90$ 283,259.15$ ‐$ 7.09$ 0.0295%RI POLLUTION CONTROL 2008 B ‐$ ‐$ ‐$ ‐$ CCDL10B CLEAN WATER COMPONENT 54,395.24$ 54,392.79$ ‐$ 1.36$ 0.0294%
Bond Proceeds Fund Totals 117,938,191.57$ 113,767,850.11$ 113,981,822.28$ 2,869.06$ 0.029%
TANS PROCEEDS 254,062,539.69$ 254,124,324.56$ 254,062,539.69$ 61,784.87$ 0.2863%
Grand Totals 733,675,226.93$ 660,657,503.34$ 740,910,807.04$ 126,472.05$ 0.201%
State of Rhode IslandShort Term Cash Monthly Performance
Performance for December 01, 2010 to December 31, 2010

Short Term InvestmentsMaturity Schedule
13/31/2010
$ 660,657,503.34
$400,000,000
$500,000,000
$600,000,000
$700,000,000
Short‐Term InvestmentsMaturity Schedule
Maturities in $Millions
Note: Includes $267.7 Million of Money Market and PIP investments with no specific maturity
$ 660,657,503.34
$0
$100,000,000
$200,000,000
$300,000,000
$400,000,000
$500,000,000
$600,000,000
$700,000,000
Under 30 Days 31‐60 Days 61‐90 Days 91‐120 Days Over 120 Days
Short‐Term InvestmentsMaturity Schedule

SPECIAL FUNDS
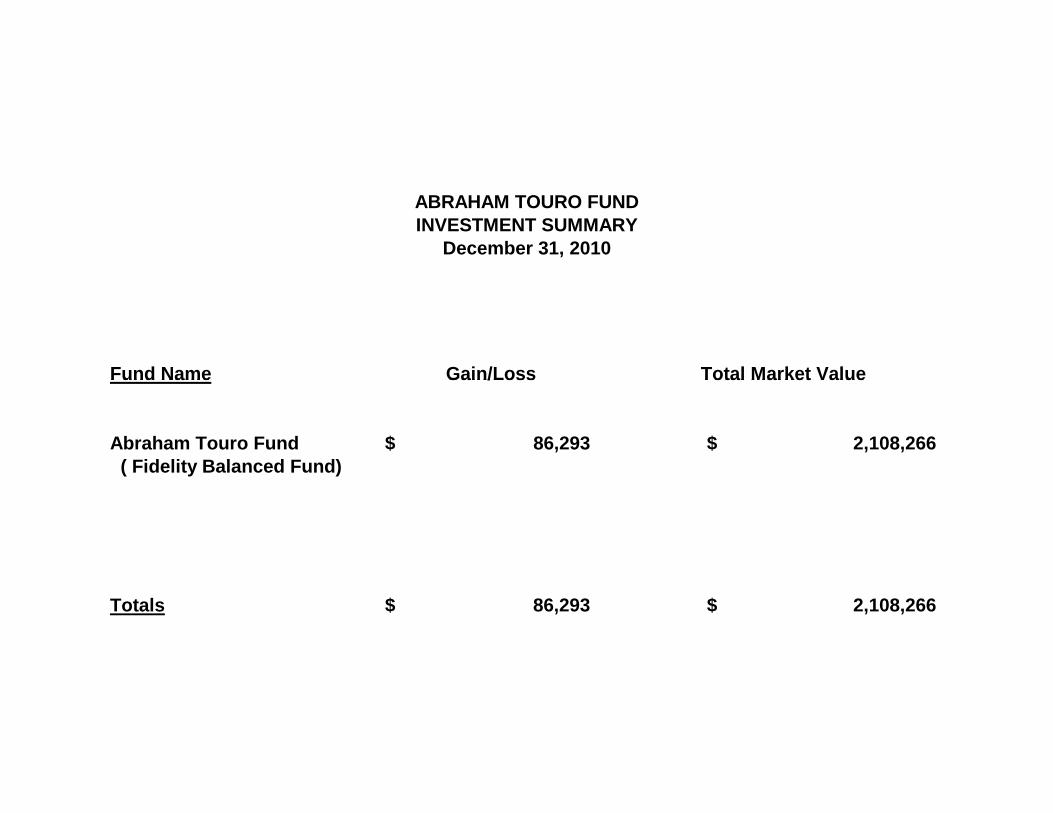
Fund Name Gain/Loss Total Market Value
December 31, 2010INVESTMENT SUMMARYABRAHAM TOURO FUND
Fund Name Gain/Loss Total Market Value
Abraham Touro Fund 86,293$ 2,108,266$ ( Fidelity Balanced Fund)
Totals 86,293$ 2,108,266$

457 PLANS

State of Rhode Island Total Assets 457 Plans
Plan Provider 3/31/2010 6/30/2010 9/30/2010 12/31/2010
AIG 44,256,808.86$ 42,900,890.45$ 44,649,454.39$ 45,773,269.99$ Fidelity 65,400,449.95$ 60,612,749.48$ 66,514,567.48$ 71,987,604.68$ ING 89,723,269.29$ 86,531,065.33$ 91,721,515.19$ 95,318,912.88$
Total 199,380,528.10$ 190,044,705.26$ 202,885,537.06$ 213,079,787.55$

AIG

The information is current as of 12/31/2010.
Effective December 31, 2001, all future contributions for all existing and new participants will be directed to VALIC for investment into the mutual fund and fixed-interest option investments. All VALIC annuity investment options will be closed to current or future Plan participants after this date.
Category/Funds YTD Return
1 Year Return
3 Year Return
5 Year Return
10 Year Return
Since Inception
Expense Ratio
ITD Date
Domestic Equity
Large Cap ValueDividend Value Fund (Black Rock/SunAmerica) 13.14 13.14 -4.97 -0.31 0.61 0.61 1.83 12/8/2000
Vanguard Windsor II Fund 9.46 9.46 -4.83 0.40 2.50 2.50 1.43 6/24/1985Large Cap Blend
Core Equity Fund (Black Rock) 11.92 11.92 -5.09 -0.65 -1.34 -1.34 1.90 4/29/1994Stock Index Fund (SunAmerica)) 13.78 13.78 -3.92 1.15 0.26 0.26 1.19 4/20/1987
Large Cap GrowthGrowth Fund (American Century) 17.30 17.30 -1.65 1.83 1.37 1.37 1.87 12/5/2005
Large Capital Growth Fund (SunAmerica/Invesco AIM) 14.57 14.57 -3.13 2.00 2.49 2.49 1.59 12/20/2004Domestic Mid Cap EquityMid Cap
Mid Cap Strategic Growth Fund (MorganStanley/PineBridge Investments) 25.17 25.17 -2.02 4.96 6.27 6.27 1.69 12/20/2004
Global EquityGlobal Social Awareness Fund (PineBridge Investments) 11.33 11.33 -4.71 0.53 -0.11 -0.11 1.52 10/2/1989
Global Equity Fund (BlackRock) 10.33 10.33 -8.80 -0.03 0.02 0.02 1.81 12/5/2005
Foreign Value Fund (Templeton Global) 6.73 6.73 -4.97 2.78 2.94 2.94 1.74 12/5/2005Speciality
Science & Technology Fund (T. Rowe/RCM/Wellington) 21.12 21.12 2.14 5.49 -3.56 -3.56 1.86 4/29/1994Hybrid
Domestic Large Cap Equity
International Equity
HybridBalanced
Vanguard Wellington Fund 9.78 9.78 0.68 4.48 5.09 5.09 1.39 7/1/1929Fixed IncomeInvestment Grade
Vanguard Long-Term Investment-Grade Fund 9.83 9.83 6.34 4.78 6.24 6.24 1.08 7/9/1973Vanguard Long-Term Treasury Fund 8.05 8.05 4.64 4.62 5.56 5.56 1.05 5/19/1986
InternationalInternational Government Bond Fund (PineBridge Investments) 7.25 7.25 5.41 5.89 6.82 6.82 1.52 10/1/1991
Stable ValueMoney Market I Fund (SunAmerica) -0.78 -0.78 0.04 1.54 1.27 1.27 1.43 1/16/1986
7-Day current yield at 30-Sep-2009: -0.79
Fixed Account Plus 3.61 3.61 3.77 3.80 4.39 4.39 1/1/1982Short Term Fixed Account 2.00 2.00 2.67 2.80 3.05 3.05 1/1/1991
An investment in money market funds is not insured or guaranteed by the Federal Deposit Insurance Corporation or any other government agency. Although the funds seek to preserve the value of your investment at $1.00 per share, it is possible to lose money by investing in the funds.
Amounts held in your employer-sponsored plan(s), as well as in IRA's, are generally tax-deferred (and subject to required minimum distributions), regardless of whether they are used to fund an annuity or another qualifying arrangement, such as a trust or custodial account.
Bear in mind that annuities also provide additional features and benefits, including, but not limited tom a guaranteed death benefit and guaranteed lifetime income options, for which a Separate Account fee is charged. Annuities are long-term investments. Income taxes are payable upon withdrawal. Federal restrictions and tax penalties may apply to early withdrawals.
Contributions to your Portfolio Director Fixed and Variable Annuity contract can qualify to be tax-deferred, subject to applicable contribution limits and related rules. That tax deferral is a result of issuing the contract, which satisfies specific important tax law requirements, including plan requirements, under your employer's retirement plan. It does not result from the mere fact that the contract is an annuity. Therefore, you do not receive any additional tax-deferred treatment of earnings beyond the treatment provided by the tax-qualified retirement plan itself.
Returns reflect overall changes in accumulation unit value from the beginning to the end of the periods shown, after deduction of fund expenses. Figures on pages 3 & 4 do not reflect deduction of account maintenance fees, surrender charges, premium taxes or IncomeLOCK fees, if applicable. Separate Account expenses are deducted only from variable options. The expenses are calculated each day and are based on the average daily net asset value of each option at the Separate Account level. The expenses are annualized at 0.35% to 1.25%, depending on the variable option and contract. Returns for periods prior to the date the funds became available in the Separate Account are hypothetical and are calculated as if the fund had been in the Separate Account during the stated period.
Fixed Account Plus contributions received and deposited during a given month will earn that month's Current interest rate for the remainder of that calendar year (for all contact series except 7.0, 7.20, 7.40, 12.0, 12.20, 12.40, and 13.20). VALIC intends (though does not guarantee) to pay this same interest rate for those deposits and transfers through the end of the following calendar year. The current interest rate may differ from month to month.
*Performance numbers for Fixed Account Plus and Short Term Fixed are based on annualized returns.
All Fixed Account Plus deposits for series 7.0, 7.20, 7.40, 12.0, 12.20, 1240, and 13.20 willl earn the monthly declared interest rate until that rate is changed. The interest rate for the Short-Term Fixed Account is

Generally, higher potential returns involve greater risk and short-term volatility. For example: Small-cap, mid-cap, sector and emerging funds can experience significant price fluctuation due to business risks and adverse political developments. International (global) and foreign funds can experience price fluctuation due hanging market conditions, currency values, and economic and political climates. High-yield bond funds, which invest in bonds that have lower ratings, typically experience price fluctuation and a greater risk of loss of principal and income than when investing directly in U.S. government securities such as U.S.Treasury bonds and bills, which are guaranteed by the government for repayment of principal and intererst if held to maturity. Mortgage-related funds' underlying mortgages are more likely to be prepaid during periods of declining interest rates, which could hurt the fund's share price or yield, and may be prepaid more slowly during periods of rapidly rising interest rates, which may lengthen the fund's expected maturity. Investors should carefully assess the risks associated with an investment in the fund. Fund shares are not insured and are not backed by the U.S. government, and their value and yield will vary with market conditions.
1) The inclusion data found in this chart are based upon the date the funds were included in the Separate Account or for the General Account, when added to the contract.2) The inception data are based upon the inception date of underlying fund.
For funds with less than a full year of performance the returns are cumulative.
All Short-Term Fixed Account deposits will earn the annual declared interest rate for the remainder of that calendar year. Interest is credited daily and subject to the claims-paying ability of the insurance company. Please refer to your contract for the minimum guaranteed rate. VALIC's interest-crediting policy is subject to change. Premium taxes will be deducted when required by state law.
If applicable returns on pages 1 & 2 reflect deduction of account maintenance fees and surrender charges, but not premium taxes or IncomeLOCK fees, if applicable. Partial or full surrenders may be subject to a surrender charge of the lesser of either 5% of the sum of the contributions received during the prior 60 months, or 5% of the amount withdrawn. There may be a quarterly account maintenance fee of $3.75 for investments in the variable options, depending on the contract. There are no account maintenance fees for investments in the fixed options.
The current 7-day yield more closely reflects the current earnings of the money market fund than does the total average annual return. Yields are historical and do not guarantee future performance. Yields do not reflect deduction of surrender charges or premium taxes, if applicable.
Returns for fixed options were calculated assuming a lump-sum deposit on the first day of each period and interest credited to the account according to VALIC's interest crediting policy. Equivalent rates were used, even though the contract may not have been available for sale during all periods shown.
Applicable to Portfolio Director Fixed and Variable Policy Form series UIT-194, UTIG-194, UTIG-194P, and UITN-194.
# This fund closed to new deposits effective 2/12/2010.
Returns for periods prior to the date the funds became available in the Separate Account are hypothetical and are derived from the performance of the udnerlying fund, adjusted to reflect fees, expenses, and surrender charges if applicable, of Portfolio Director as if the fund had been in the Separate Account during the stated period.

FUND EXPENSESThe following represents annual variable fund fees.
Core Equity Fund1 (Wellington/WAMU) 0.80% 0.80% None 0.15% 0.15% 1.90%Dividend Value Fund (American Century) 0.80% 0.78% None 0.23% 0.16% 1.97%International Government Bond Fund 0.80% 0.50% None 0.18% None 1.48%Mid Cap Strategic Growth Fund3 (MorganStanley/Brazos) 0.80% 0.70% None 0.16% 0.01% 1.67%Money Market I Fund* 0.80% 0.40% None 0.15% None 1.35%Science & Technology Fund1 (T. Rowe Price/RCM) 0.80% 0.89% None 0.13% None 1.82%Global Social Awareness Fund 0.80% 0.50% None 0.19% None 1.49%Stock Index Fund3 0.80% 0.27% None 0.11% None 1.18%Growth Fund (American Century) 0.80% 0.72% None 0.14% 0.05% 1.71%Large Capital Growth (SAAMCo/AIM) 0.80% 0.64% None 0.14% None 1.58%Global Equity Fund (Putnam) 0.80% 0.81% None 0.21% None 1.82%Foreign Value Fund (Franklin/Templeton) 0.80% 0.68% None 0.16% None 1.64%Vanguard Long-Term Investment Grade Fund 0.80% 0.23% None 0.03% None 1.06%Vanguard Long-Term Treasury Fund 0.80% 0.21% None 0.04% None 1.05%Vanguard Wellington Fund 1.05% 0.31% None 0.03% None 1.39%Vanguard Windsor II Fund 1.05% 0.34% None 0.04% None 1.43%
Fund Name 12b-1 Fee
Separate Account Fee1 Total ExpenseOther
Expenses2Management
FeeExpense Waivers or
Reimbursments
Annuities are long-term investments. Income taxes are payable upon withdrawal. Federal restrictions and tax penalties can apply to early withdrawals.
NOT FDIC-INSURED * MAY LOSE VALUE * NO BANK GUARANTEE
1Through a commission recaputre program a portion of the funds' expenses have been reduced. "Other expenses" does not take into account this expense reduction and is therefore higher than the actual expenses of the series. Had the expense reductions been taken into account, " Net Expense" would be as follows: Asset Allocation Fund, 0.72%; Broad Cap Value Fund, 0.84%; Global Equity Fund, 0.98%; Global Real Estate, 0.94%; Global Social Awareness Fund, 0.71%; Growth & Income Fund, 0.83%; Health Sciences Fund, 1.18%; Large Cap Core Fund, 0.83%; and Mid Cap Strategic Growth, 0.81%.
The fund company may limit the number of trades in and out of the fund. Please see the individual fund prospectus for more information.
**Pursuant to an Expense Limitation Agreement, the fund's advisor will waive fees and reimbursement expenses as shown in the column above. The expense waivers and fee reimbursements are voluntary and contractual and will continue through September 30, 2010 for VALIC Company I funds; December 31, 2010 for VALIC Company II funds; May 1, 2013 for Lou Holland fund; and indefinitely for SunAmerica High Watermark funds.
To obtain a Portfolio Director contract and underlying fund prospectuses, visit www.valic.com or call 1-800-448-2542 and follow the prompts. The prospectuses contain the investment objectives, risks, charges, expenses and other information about the respective investment company that you should consider carefully before investing. Please read the prospectuses carefully before investing or sending money. Policy Form series UIT-194, UITG-194 and UITG-194-P.
Portfolio Director Fixed and Variable Annuity is issued by The Valiable Annuity Life Insurance Company and distributed by its affiliate, American General Distributors, Inc., 2929 Allen Parkway, Houston, Texas, 77019, member FINRA.
VALIC represents The Variable Annuity Life Insurance Company and its subsidiaries, VALIC Financial Adcisors, Inc. and VALIC Retirement Services Company.
Annuity contracts typically include limitations, exclusions and expense charges, which are described in the current Portfolio Director prospectus. Fees include Separate Account fees, which range 0.55% to 1.05% depending on the contract, and Annual Net Fund Expenses, which range from 0.21% to 1.35% for the variable options. The current Annual Net Fund Expense is the current Annual Total Fund Expense less expense waivers or reimbursements. Fees are subject to change based on expense waivers and reimbursements. Additionally, account maintenance fees of $3.75 per quarter and surrender charges may apply, depending on your contract.
Contributions to your Portfolio Director annuity contract can qualify to be tax-deferred, subject to applicable contribution limits and related rules. That tax deferral is a result of issuing the contract, which satisfies specific important tax law requirements, including plan requirements, under yoru work place retirement plan. It does not result from the mere fact that the contract is an annuity. Therefore, you do not receive any additional tax-deferred treatment of earnings beyond the treatment provided by the tax-qualfied retirement plan itself.
An investment in a money market fund is not insured by the Federal Deposit Insurance Corporation or any other government agency. Although the fund seeks to preserve the value of your investment at $1.00 per share, it is possible to lose money by investing in the fund.
The VALIC Company II Lifestyle funds invest in the funds offered in VALIC Company I and VALIC Company II. The Vanguard LifeStrategy Funds invest in other Vanguard funds. Thus, each "Fund of Funds" indirectly bears the fees and expenses of those acquired funds.

Fidelity

Monthly Plan Performance UpdateSTATE OF RHODE ISLAND - STATE OF RI (35835)
DOW JONES 30 INDUSTRIALAVERAGE
12/31/2010 5.33 8.04 14.06 12/31/2010 14.06 -1.61 4.31 3.15
NASDAQ COMPOSITE INDEX 12/31/2010 6.29 12.34 18.15 12/31/2010 18.15 1.02 4.72 1.42
BARCLAYS CAPITAL U.S.AGGREGATE BOND INDEX
12/31/2010 -1.08 -1.30 6.54 12/31/2010 6.54 5.90 5.80 5.84
RUSSELL 2000 INDEX 12/31/2010 7.94 16.25 26.85 12/31/2010 26.85 2.22 4.47 6.33
STANDARD & POOR'S 500 ™INDEX
12/31/2010 6.68 10.76 15.06 12/31/2010 15.06 -2.86 2.29 1.41
FID BLUE CHIP GROWTH 12/31/2010 5.37 13.80 19.61 12/31/2010 19.61 2.10 4.67 0.77 10.63 — 0.94% on09/29/2010
12/31/1987
FID CONTRAFUND 12/31/2010 3.95 9.45 16.93 12/31/2010 16.93 -1.71 4.87 5.54 12.36 — 1.02% on03/01/2010
05/17/1967
FID DIVIDEND GROWTH 12/31/2010 8.68 14.90 21.19 12/31/2010 21.19 1.44 3.89 2.28 10.70 — 0.93% on09/29/2010
04/27/1993
FID EQUITY INCOME 12/31/2010 8.85 11.45 15.13 12/31/2010 15.13 -4.52 1.12 2.44 11.60 — 0.74% on04/01/2010
05/16/1966
FID GROWTH & INCOME 12/31/2010 7.09 12.67 14.57 12/31/2010 14.57 -11.53 -5.04 -2.58 9.31 — 0.75% on09/29/2010
12/30/1985
FID OTC PORTFOLIO 12/31/2010 6.91 13.66 20.14 12/31/2010 20.14 1.73 7.77 3.08 12.96 — 1.06% on09/29/2010
12/31/1984
FIDELITY MAGELLAN 12/31/2010 6.66 12.04 12.41 12/31/2010 12.41 -7.06 0.45 -0.15 16.63 — 0.75% on05/29/2010
05/02/1963
SPARTAN 500 INDEX 12/31/2010 6.66 10.72 14.98 12/31/2010 14.98 -2.89 2.25 1.32 9.38 — 0.10% on04/29/2010
02/17/1988
FID MID CAP STOCK 12/31/2010 8.89 14.82 23.57 12/31/2010 23.57 0.14 4.52 2.88 11.45 .75 % /30days
0.65% on06/29/2010
03/29/1994
FID VALUE 12/31/2010 7.92 13.35 22.27 12/31/2010 22.27 -1.97 2.08 7.71 12.41 — 0.64% on12/30/2010
12/01/1978
FIDELITY LOW PR STK 12/31/2010 6.60 10.93 20.70 12/31/2010 20.70 2.33 5.41 11.21 14.47 1.5 % /90days
0.99% on09/29/2010
12/27/1989
Page 1 of 3

FIDELITY NEW MILLEN 12/31/2010 7.02 11.38 18.93 12/31/2010 18.93 -0.11 5.68 3.14 13.70 — 1.05% on01/29/2010
12/28/1992
FKLN SMMIDCAP GRTH A 11/30/2010 5.16 22.19 21.31 09/30/2010 19.45 -4.84 2.61 -1.80 9.93 — 1.06% on09/01/2010
02/14/1992
FID DIVERSIFIED INTL 12/31/2010 7.69 8.26 9.65 12/31/2010 9.65 -7.49 2.39 5.89 9.23 1 % /30days
0.98% on12/30/2010
12/27/1991
TEMPLETON FOREIGN A 11/30/2010 -5.92 8.49 -0.46 09/30/2010 1.19 -5.97 3.08 5.64 11.50 — 1.19% on08/31/2010
10/05/1982
FID FREEDOM 2000 12/31/2010 1.65 2.68 7.86 12/31/2010 7.86 2.62 3.97 3.53 5.85 — 0.51% on05/29/2010
10/17/1996
FID FREEDOM 2010 12/31/2010 3.88 5.94 11.65 12/31/2010 11.65 1.34 4.12 3.79 6.81 — 0.67% on05/29/2010
10/17/1996
FID FREEDOM 2020 12/31/2010 4.82 7.29 12.93 12/31/2010 12.93 -0.41 3.65 3.31 6.85 — 0.74% on05/29/2010
10/17/1996
FID FREEDOM 2030 12/31/2010 5.78 8.65 14.04 12/31/2010 14.04 -2.07 2.99 2.70 6.47 — 0.79% on05/29/2010
10/17/1996
FID FREEDOM INCOME 12/31/2010 1.44 2.44 7.63 12/31/2010 7.63 3.17 4.13 3.75 5.23 — 0.50% on05/29/2010
10/17/1996
FID PURITAN 12/31/2010 4.43 7.71 14.04 12/31/2010 14.04 0.78 4.52 4.74 11.11 — 0.61% on10/30/2010
04/16/1947
PIMCO TOT RETURN ADM 11/30/2010 -1.45 0.32 9.17 09/30/2010 10.65 10.57 8.09 7.66 7.71 — 0.72% on11/12/2010
09/08/1994
FIDELITY RETIRE MMKT 12/31/2010 0 0.01 0.02 12/31/2010 0.02 1.18 2.68 2.39 4.13 — 0.42% on10/30/2010
12/02/1988
BROKERAGELINK — — — — — — — — — — — — —
† For Fidelity fund of funds the performance table displays both the Expense Ratio and the Combined Total Expense Ratio. Expense Ratio is the total annual fund operatingexpense ratio from the fund's most recent prospectus. Combined Total Expense Ratio reflects expense reimbursements and reductions and is based on the total operatingexpense ratio of the fund plus a weighted average of the total operating expense ratios of the underlying Fidelity funds in which it was invested. This ratio may be higher orlower depending on the allocation of the fund's assets among the underlying Fidelity funds and the actual expenses of the underlying Fidelity funds.
† Expense Ratio is the total annual fund operating expense ratio from the fund's most recent prospectus. Please note that for the non-Fidelity fund-of-funds listed, the ratioshown may solely reflect the total operating expense ratio of the fund, or may be a combined ratio reflecting both the total operating expense ratio of the fund and the totaloperating expense ratios of the underlying funds in which it was invested. Please consult the fund's prospectus for more detail on a particular fund's expense ratio.
Total returns are historical and include change in share value and reinvestment of dividends and capital gains, if any. Cumulative total returns are reported as of the periodindicated. Life of Fund figures are reported as of the inception date to the period indicated. These figures do not include the effect of sales charges, if any, as these charges arewaived for contributions made through your company's employee benefit plans. If sales charges were included, returns would have been lower.
Page 2 of 3

The management company may be temporarily reimbursing a portion of the fund's expenses. Absent such reimbursement, returns and yields would have been lower. A fund'sexpense limitation may be terminated at any time. Please see the prospectus for further information.
AN INVESTMENT IN A MONEY MARKET FUND IS NOT INSURED OR GUARANTEED BY THE FDIC OR ANY OTHER GOVERNMENT AGENCY. ALTHOUGH MONEY MARKETFUNDS SEEK TO PRESERVE THE VALUE OF YOUR INVESTMENT AT $1 PER SHARE, IT IS POSSIBLE TO LOSE MONEY BY INVESTING IN THESE FUNDS.
A money market fund's current yield reflects the current earnings of the fund while the total return refers to a specific past holding period.
Performance of an index is not illustrative of any particular investment and an investment cannot be made directly in an index.
The NASDAQ Composite® Index is an unmanaged market capitalization-weighted index of the National Market System which includes over 5,000 stocks traded onlyover-the-counter and not on an exchange.
The Dow Jones Industrial Average (DJIA) is an unmanaged price-weighted index and is the most widely used indicator of how the country's industrial leaders are performing.Also known as "the Dow," this is a formula based on the stock prices of 30 major companies chosen from sectors of the economy most representative of our country'seconomic condition.
The Russell 2000® Index is an unmanaged market capitalization-weighted index of 2,000 small company stocks of U.S. domiciled companies.
The S&P 500® Index is a registered service mark of The McGraw-Hill Companies, Inc., and has been licensed for use by Fidelity Distributors Corporation and its affiliates. It isan unmanaged index of the common stock prices of 500 widely held U.S. stocks that includes the reinvestment of dividends.
The Lehman Brothers Aggregate Bond Index is an unmanaged market value-weighted index for investment-grade fixed-rate debt issues, including government, corporate,asset-backed, and mortgage-backed securities with maturities of at least one year.
Because of their narrow focus, sector funds may be more volatile than funds that diversify across many sectors.
Investments in mortgage securities are subject to prepayment risk, which can limit the potential for gain during a declining interest rate environment and increase the potentialfor loss in a rising interest rate environment.
Lower-quality debt securities involve greater risk of default and/or price changes due to changes in the credit quality of the issuer.
Investments in smaller companies may involve greater risks than those of larger, more well-known companies.
Foreign investments, especially those in emerging markets involve greater risk and may offer greater potential returns than U.S. investments. This risk includes political andeconomic uncertainties of foreign countries, as well as the risk of currency fluctuations.
Strategic Advisers, Inc., a subsidiary of FMR LLC, manages the Fidelity Freedom Funds.
BEFORE INVESTING IN ANY INVESTMENT OPTION, PLEASE CAREFULLY CONSIDER THE INVESTMENT OBJECTIVES, RISKS, CHARGES AND EXPENSES. FOR THIS ANDOTHER INFORMATION, PLEASE CALL FIDELITY AT 1-800-343-0860 OR VISIT WWW.FIDELITY.COM FOR A FREE MUTUAL FUND PROSPECTUS OR VARIABLE ANNUITYPROSPECTUS. FOR INFORMATION ON FIXED ANNUITIES, CONTACT FIDELITY TO REQUEST A FACT SHEET. READ THEM CAREFULLY BEFORE YOU INVEST.
Brokerage Products and Services are offered through Fidelity Brokerage Services, Member NYSE, SIPC. Investment and workplace savings plan products and services offereddirectly to investors and plan sponsors are provided by Fidelity Brokerage Services, Member NYSE, SIPC, 900 Salem Street, Smithfield, RI 02917. Investment and workplacesavings plan products and services distributed through investment professionals are provided by Fidelity Investments Institutional Services Company, Inc., 100 Salem Street,Smithfield, RI 02917.
© 2006 FMR LLC. All rights reserved. The trademarks and service marks appearing herein are the property of their respective owners.
Page 3 of 3

ING

P E R F O R M A N C E U P D A T E
ING Life Insurance and Annuity Company
STATE OF RHODE ISLAND
12/31/2010 (shown in percentages) Average Annual Total Returns as of:
Mutual funds offered through a retirement plan are investments designed for retirement purposes. Early withdrawals will reduce your account value and if taken prior to age 59 1/2, a 10% IRSpenalty may apply.
The performance data quoted represents past performance. Past performance does not guarantee future results. For month-end performance which may be lower or higher than theperformance data shown please call 800-232-5422. Investment return and principal value of an investment will fluctuate so that, when sold, an investment may be worth more or lessthan the original cost.
The below investment options are in Separate Account D. Please note that the figures do not include an adjustment for the ING Administrative Fund Fee (where applicable) and the deduction of theDaily Asset Charge from the Separate Account (if applicable), or other applicable contract charges. If these fees and charges were included, performance would be less favorable.
The returns assume reinvestment of all dividends (ordinary income and capital gains) and are net of management fees and other fund operating expenses.
You should consider the investment objectives, risks and charges, and expenses of the funds carefully before investing. The prospectus contains this and other information. Anyonewho wishes to obtain a free copy of the fund prospectuses may call their ING representative or the number above. Please read the prospectus carefully before investing.
Returns less than one year are not annualized. Fund Inception Date is the date of inception for the underlying fund, and is the date used in calculating the periodic returns. This date may alsoprecede the portfolio's inclusion in the product.
BM10-YrYTD3-Mo
BMBM
GrossFund
Exp %*5-Yr3-Yr1-Mo
BMFund
FundInception
Date1-Yr
NetFund
Exp %*Fund
FundBenchmark
ID (BM) InceptFund FundFund FundBM BMBM FundInvestment Options
Stability of Principal
ING Fixed Account - 457/401 (6)(7) 0.30 0.91 3.65 3.65 3.90 4.10 4.80MFR 0.01 0.03 0.03 0.83 2.050.00 2.32Money Market
ING Money Market Portfolio - Class I (2) 0.00 0.01 0.24 0.24 1.07 2.63 2.36 0.37 0.3701/01/1980IBCM 0.07 1.19 1.19 1.44 2.620.02 2.93The 7-day annualized Subaccount yield as of 12/31/2010 is 0.01%, which more closely reflects current earnings. (1)Bonds
Intermediate-Term Bond
Page 1 of 7

See Performance Introduction Page for Important Information
BM10-YrYTD3-Mo
BMBM
GrossFund
Exp %*5-Yr3-Yr1-Mo
BMFund
FundInception
Date1-Yr
NetFund
Exp %*Fund
FundBenchmark
ID (BM) InceptFund FundFund FundBM BMBM FundInvestment OptionsING Intermediate Bond Portfolio - Class I -0.40 -0.56 9.84 9.84 3.90 4.35 5.30 0.51 0.5105/23/1973LEHM -1.30 6.54 6.54 5.91 5.84-1.08 5.80Balanced
Moderate AllocationCalvert VP SRI Balanced Portfolio 3.03 5.62 12.10 12.10 -1.20 1.52 1.86 0.91 0.9109/02/1986SPXRE 10.76 15.06 15.06 -2.86 1.426.68 2.29ING Balanced Portfolio - Class I 3.88 4.82 14.12 14.12 -0.73 2.58 2.84 0.63 0.6304/03/1989SPXRE 10.76 15.06 15.06 -2.86 1.426.68 2.29ING Van Kampen Equity and Income Portfolio - InitialClass
5.61 8.55 12.32 12.32 1.83 4.26 4.26 0.65 0.6512/10/2001SPXRE 10.76 15.06 15.06 -2.866.68 2.29
Large Cap Value
Large BlendFidelity® VIP Contrafund® Portfolio - Initial Class 7.56 12.31 17.22 17.22 -2.94 3.74 5.18 0.67 0.6701/03/1995SPXRE 10.76 15.06 15.06 -2.86 1.426.68 2.29ING Growth and Income Portfolio - Class I 6.67 10.28 14.14 14.14 -2.49 2.60 0.28 0.61 0.6112/31/1979SPXRE 10.76 15.06 15.06 -2.86 1.426.68 2.29ING Index Plus LargeCap Portfolio - Class I 6.03 9.63 13.96 13.96 -4.12 1.19 0.56 0.45 0.4509/16/1996SPXRE 10.76 15.06 15.06 -2.86 1.426.68 2.29ING Thornburg Value Portfolio - Initial Class 8.92 12.01 11.37 11.37 -0.96 4.01 -0.63 0.91 0.9111/28/1997SPXRE 10.76 15.06 15.06 -2.86 1.426.68 2.29ING UBS U.S. Large Cap Equity Portfolio - Initial Class 6.59 10.73 13.44 13.44 -3.44 0.85 -0.28 0.85 0.8511/28/1997SPXRE 10.76 15.06 15.06 -2.86 1.426.68 2.29Invesco V.I. Core Equity Fund - Series I Shares (4) 6.46 9.12 9.56 9.56 -0.61 4.38 1.43 0.92 0.9205/02/1994SPXRE 10.76 15.06 15.06 -2.86 1.426.68 2.29
Large ValueFidelity® VIP Equity-Income Portfolio - Initial Class 8.98 11.69 15.15 15.15 -4.91 0.97 2.46 0.58 0.5810/09/1986RS3000V 10.92 16.23 16.23 -3.90 3.637.92 1.45Large Cap Growth
Large GrowthFidelity® VIP Growth Portfolio - Initial Class 6.48 13.87 24.17 24.17 -5.59 2.69 -0.46 0.69 0.6910/09/1986RS3000G 12.26 17.64 17.64 -0.27 0.305.68 3.88Invesco V.I. Capital Appreciation Fund - Series I Shares 4.86 12.56 15.49 15.49 -7.01 -0.86 -1.78 0.92 0.9205/05/1993SPXRE 10.76 15.06 15.06 -2.86 1.426.68 2.29Small/Mid/Specialty
Mid-Cap GrowthING T. Rowe Price Diversified Mid Cap Growth Port -Initial
7.05 14.75 28.51 28.51 2.27 5.76 5.57 0.66 0.6612/10/2001RSMIDGRW 14.01 26.38 26.38 0.976.24 4.88
Small BlendING Small Company Portfolio - Class I 8.58 13.91 24.38 24.38 3.04 6.23 6.48 0.87 0.8712/27/1996RS2000 16.25 26.86 26.86 2.22 6.337.94 4.47Global / International
Foreign Large ValueING Templeton Foreign Equity Portfolio - Initial Class (5) 8.12 5.34 8.87 8.87 -5.01 3.68 0.97 0.9701/03/2006MSCIWEUSN 7.16 8.94 8.94 -6.338.05
World StockING Oppenheimer Global Portfolio - Initial Class 6.93 8.95 16.06 16.06 -1.11 3.98 6.93 0.66 0.6605/01/2002MSCIAC 8.82 13.21 13.21 -3.767.35 3.98The risks of investing in small company stocks may include relatively low trading volumes, a greater degree of change in earnings and greater short-term volatility.
Page 2 of 7

See Performance Introduction Page for Important InformationForeign investing involves special risks such as currency fluctuation and public disclosure, as well as economic and political risks.
Some of the Funds invest in securities guaranteed by the U.S. Government as to the timely payment of principal and interest; however, shares of the Funds are not insured nor guaranteed.
High yielding fixed-income securities generally are subject to greater market fluctuations and risks of loss of income and principal than are investments in lower yielding fixed-income securities.
Sector funds may involve greater-than average risk and are often more volatile than funds holding a diversified portfolio of stocks in many industries. Examples include: banking, biotechnology,chemicals, energy, environmental services, natural resources, precious metals, technology, telecommunications, and utilities.*The Gross Expense Ratios shown do not reflect any temporary fee or expense waivers that may be in effect for a fund. The performance of a fund with a temporary fee or expense waiver wouldhave been lower if the gross fund fees / expenses listed had been reflected.
Page 3 of 7
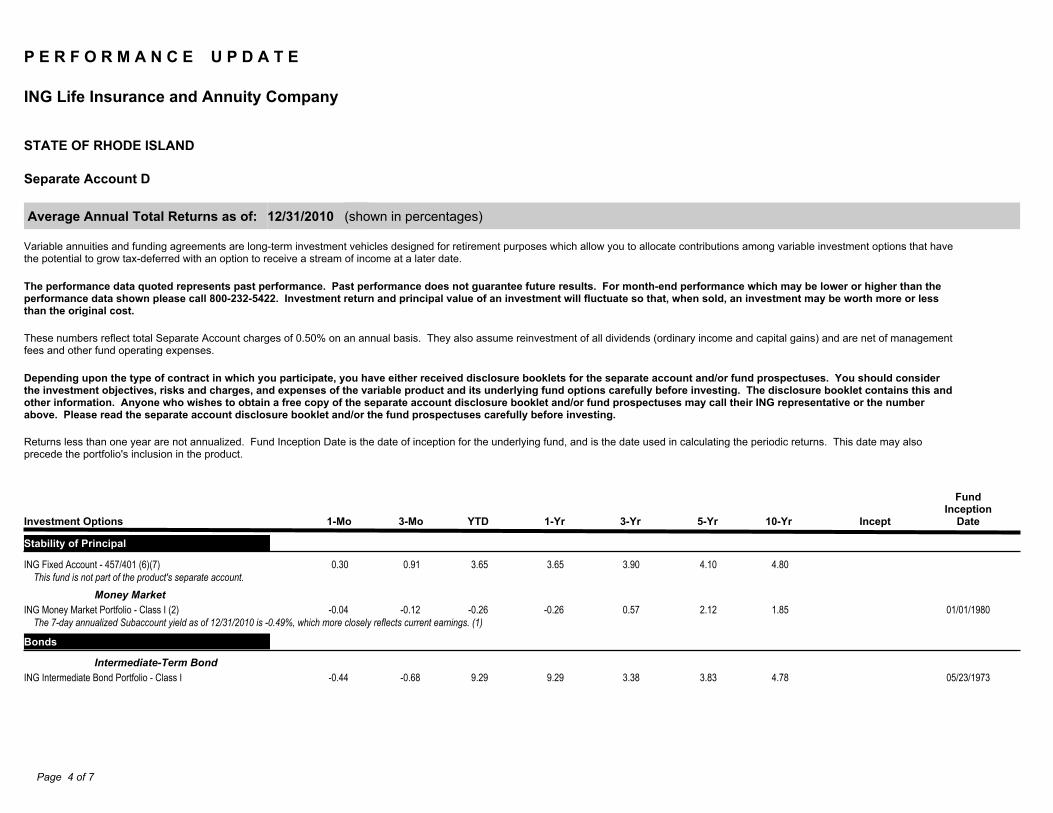
P E R F O R M A N C E U P D A T E
ING Life Insurance and Annuity Company
STATE OF RHODE ISLAND
Separate Account D
12/31/2010 (shown in percentages) Average Annual Total Returns as of:
Variable annuities and funding agreements are long-term investment vehicles designed for retirement purposes which allow you to allocate contributions among variable investment options that havethe potential to grow tax-deferred with an option to receive a stream of income at a later date.
The performance data quoted represents past performance. Past performance does not guarantee future results. For month-end performance which may be lower or higher than theperformance data shown please call 800-232-5422. Investment return and principal value of an investment will fluctuate so that, when sold, an investment may be worth more or lessthan the original cost.
These numbers reflect total Separate Account charges of 0.50% on an annual basis. They also assume reinvestment of all dividends (ordinary income and capital gains) and are net of managementfees and other fund operating expenses.
Depending upon the type of contract in which you participate, you have either received disclosure booklets for the separate account and/or fund prospectuses. You should considerthe investment objectives, risks and charges, and expenses of the variable product and its underlying fund options carefully before investing. The disclosure booklet contains this andother information. Anyone who wishes to obtain a free copy of the separate account disclosure booklet and/or fund prospectuses may call their ING representative or the numberabove. Please read the separate account disclosure booklet and/or the fund prospectuses carefully before investing.
Returns less than one year are not annualized. Fund Inception Date is the date of inception for the underlying fund, and is the date used in calculating the periodic returns. This date may alsoprecede the portfolio's inclusion in the product.
1-Mo 3-Yr1-Yr3-Mo YTD 10-Yr
FundInception
DateInvestment Options Incept5-Yr
Stability of Principal
3.653.65 4.803.90ING Fixed Account - 457/401 (6)(7) 4.100.910.30 This fund is not part of the product's separate account.
Money Market-0.26-0.26 1.85 01/01/19800.57ING Money Market Portfolio - Class I (2) 2.12-0.12-0.04
The 7-day annualized Subaccount yield as of 12/31/2010 is -0.49%, which more closely reflects current earnings. (1)
Bonds
Intermediate-Term Bond9.299.29 4.78 05/23/19733.38ING Intermediate Bond Portfolio - Class I 3.83-0.68-0.44
Page 4 of 7

See Performance Introduction Page for Important Information
1-Mo 3-Yr1-Yr3-Mo YTD 10-Yr
FundInception
DateInvestment Options Incept5-Yr
Balanced
Moderate Allocation11.5411.54 1.36 09/02/1986-1.69Calvert VP SRI Balanced Portfolio 1.015.492.9813.5513.55 2.33 04/03/1989-1.22ING Balanced Portfolio - Class I 2.074.693.8311.7611.76 3.45 09/13/19931.32ING Van Kampen Equity and Inc-I/Janus Asp Balanced-I (3) 3.748.415.5711.76 3.7411.76 12/10/20011.32ING Van Kampen Equity and Income Portfolio - Initial Class 3.748.415.57
Large Cap Value
Large Blend16.6316.63 4.66 01/03/1995-3.42Fidelity® VIP Contrafund® Portfolio - Initial Class 3.2212.177.5113.5713.57 -0.22 12/31/1979-2.98ING Growth and Income Portfolio - Class I 2.0910.146.6213.3913.39 0.05 09/16/1996-4.59ING Index Plus LargeCap Portfolio - Class I 0.689.495.9910.8210.82 -1.12 11/28/1997-1.46ING Thornburg Value Portfolio - Initial Class 3.4911.878.8812.8812.88 -0.78 11/28/1997-3.92ING UBS U.S. Large Cap Equity Portfolio - Initial Class 0.3510.606.55
9.019.01 0.92 05/02/1994-1.10Invesco V.I. Core Equity Fund - Series I Shares (4) 3.868.996.41Large Value
14.5814.58 1.94 10/09/1986-5.38Fidelity® VIP Equity-Income Portfolio - Initial Class 0.4611.558.94
Large Cap Growth
Large Growth23.5523.55 -0.96 10/09/1986-6.06Fidelity® VIP Growth Portfolio - Initial Class 2.1713.726.4414.9114.91 -2.28 05/05/1993-7.47Invesco V.I. Capital Appreciation Fund - Series I Shares -1.3612.424.82
Small/Mid/Specialty
Mid-Cap Growth27.8727.87 -0.29 09/13/19931.76ING T. Rowe Price Div MidCap-I/Janus Aspen MidCap - I (3) 5.2414.607.0127.87 5.0527.87 12/10/20011.76ING T. Rowe Price Diversified Mid Cap Growth Port - Initial 5.2414.607.01
Small Blend23.7623.76 5.95 12/27/19962.52ING Small Company Portfolio - Class I 5.7013.778.54
Global / International
Foreign Large Value8.33 3.178.33 01/03/2006-5.48ING Templeton Foreign Equity Portfolio - Initial Class (5) 5.218.08
World Stock15.4815.48 -0.20 09/13/1993-1.61ING Oppenheimer Global-Int/Janus Aspen Worldwide Gr-Inst
(3)3.468.816.89
15.48 6.4015.48 05/01/2002-1.61ING Oppenheimer Global Portfolio - Initial Class 3.468.816.89
Page 5 of 7

See Performance Introduction Page for Important InformationThe risks of investing in small company stocks may include relatively low trading volumes, a greater degree of change in earnings and greater short-term volatility.
Foreign investing involves special risks such as currency fluctuation and public disclosure, as well as economic and political risks.
Some of the Funds invest in securities guaranteed by the U.S. Government as to the timely payment of principal and interest; however, shares of the Funds are not insured nor guaranteed.
High yielding fixed-income securities generally are subject to greater market fluctuations and risks of loss of income and principal than are investments in lower yielding fixed-income securities.
Sector funds may involve greater-than average risk and are often more volatile than funds holding a diversified portfolio of stocks in many industries. Examples include: banking, biotechnology,chemicals, energy, environmental services, natural resources, precious metals, technology, telecommunications, and utilities.
Additional Notes(1)The current yield reflects the deduction of all charges under the contract that are deducted from the total return quotations shown.
Insurance products, annuities and funding agreements issued by ING Life Insurance and Annuity Company One Orange Way Windsor, CT 06095, (ILIAC), which is solely responsible for meeting itsobligations. Plan administrative services provided by ILIAC or ING Institutional Plan Services, LLC. All companies are members of the ING family of companies. Securities are distributed by oroffered through ING Financial Advisers, LLC (member SIPC) or other broker-dealers with which it has a selling agreement.
For a performance report reflecting the charges or more information regarding product expenses, please contact your ING Representative.
(2)An investment in a money market fund is not insured or guaranteed by the Federal Deposit Insurance Corporation or any other government agency. Although effective October 7, 2008, the fundseeks to preserve the value of your investment at $1.00 per share, there is no assurance it will be able to do so. While the fund's objective includes the preservation of capital, it is possible to losemoney by investing in the fund.
(3)The latter fund listed was replaced with the applicable ING Partners, Inc. Portfolio (the first fund listed). For most Plans this occurred after the close of business on December 3, 2004. Theperformance shown is based on the performance of the replaced fund until December 3, 2004, and the performance of the applicable ING Partners, Inc. Portfolio after that date. The replaced fundmay not have been available under all contracts.
(4)AIM V.I. Core Equity Fund - Series I Shares: Effective July 1, 2007, Invesco Aim contractually agreed to waive 100% of the advisory fee Invesco Aim receives from affiliated money market fundson investments by the Fund in such affiliated money market funds. Fee Waiver reflects this agreement. This waiver agreement is in effect through at least April 30, 2009.
(5)ING Templeton Foreign Equity Portfolio - Inst Class: Under the administrative services agreement between ING Partners Inc.,on behalf of the Portfolio and ING Funds Services, LLC, thePortfolio's administrator, ING Funds Services, LLC, provides administrative services necessary for the Portfolio's operation and is responsible for the supervision of the Portfolio's other serviceproviders. ING Funds Services, LLC assumes all recurring costs of the Portfolio, such as custodian, director's, transfer agency and accounting fees.
(6)The CURRENT rate for the ING Fixed Account - 457/401 Base+125 is 3.50%, expressed as an annual effective yield, and is guaranteed not to drop below 3.15% through 12/31/2011. The annualrate of interest applied to your account may be higher or lower than the current rate. Restrictions may apply to transfers of funds from the Fixed Account to other contract investment options. Pleaserefer to your product prospectus / disclosure booklet and call your 800 number for more information.
(7)The Investment Option is neither a mutual fund nor part of a Separate Account. The returns listed do not include the impact of contract charges. Please refer to the contract or disclosure book todetermine which Fixed Interest Options are available for your specific plan. The Investment Option is offered through ING Life and Insurance Annuity Company.
Not all investments options are available under all contracts; please check your disclosure booklet for options available under your plan.
The returns do not reflect the impact of a Deferred Surrender Charge. If included, performance would be less favorable.
Benchmark DescriptionBenchmark IdThe Money Fund Report Averages - All Taxable is an average of the returns of over 250 money market mutual funds surveyed eachmonth by IBC/Donoghue, Inc.
IBCM
The Barclays Capital U.S. Aggregate Index is an unmanaged index composed of securities from the Barclays Government/CorporateBond Index, Mortgage-Backed Securities Index, and the Asset-Backed Securities Index, including securities that are of investment-grade quality or better and have at least one year to maturity. Please note that indexes are unmanaged and their returns do not takeinto account any of the fees and expenses of the funds to which they are compared. Individuals cannot invest directly in any index.
LEHM
Page 6 of 7

See Performance Introduction Page for Important InformationBenchmark DescriptionBenchmark IdThe MFR Money Market Index is comprised of returns which are based upon historical average 30-day compound yields on a universeof taxable money market funds. The data for the universe, which includes approximately 980 funds, is compiled by iMoneynet, Inc. Goalof ING Fixed Account - 457/401 is to outperform the MFR by 150 - 200 basis points over 3 - 5 year time periods.
MFR
The Morgan Stanley Capital International (MSCI) All Country World Index is a broad-based unmanaged index of developed country andemerging market equities.
MSCIAC
MSCI World Ex United States Net DividendMSCIWEUSND
The Russell 2000 Index (a small cap index) consists of the smallest 2,000 companies in the Russell 3000 Index and representsapproximately 10% of the Russell 3000 total market capitalization. The Russell 2000 returns assume reinvestment of all dividends.
RS2000
The Russell 3000 Growth Index measures the performance of those Russell 3000 companies with higher price-to-book ratios and higherforecasted growth values. The stocks in this index are also members of either the Russell 1000 Growth or the Russell 2000 Growthindexes.
RS3000G
The Russell 3000 Value Index is a market capitalization-weighted index of value-oriented stocks of U.S. domiciled corporations.RS3000V
The Russell MidCap Growth Index is an unmanaged index of U.S. mid-cap growth stocks.RSMIDGRW
The Standard & Poor's (S&P) 500 Index is considered to be representative of the stock market in general. The S&P 500 returns assumereinvestment of all dividends.
SPXRE
Tuesday, January 11, 2011Creation Date:
Page 7 of 7