Embed Size (px)
Citation preview

State-of-the-Art and Definitions
The following section gives a brief overview of other approaches in the field,
focusing on disaster risk at the global or regional level. The overview of selected
current approaches also deals with some of their comparative advantages and
shortcomings. The review of existing approaches might also help to understand
the new elements of the WorldRiskIndex.
Disaster Risk Index (UNDP and UNEP GRID) 2004
In 2004, the United Nations Development Programme (UNDP) published the
study “Reducing Disaster Risk, a Challenge for Development”, introducing the
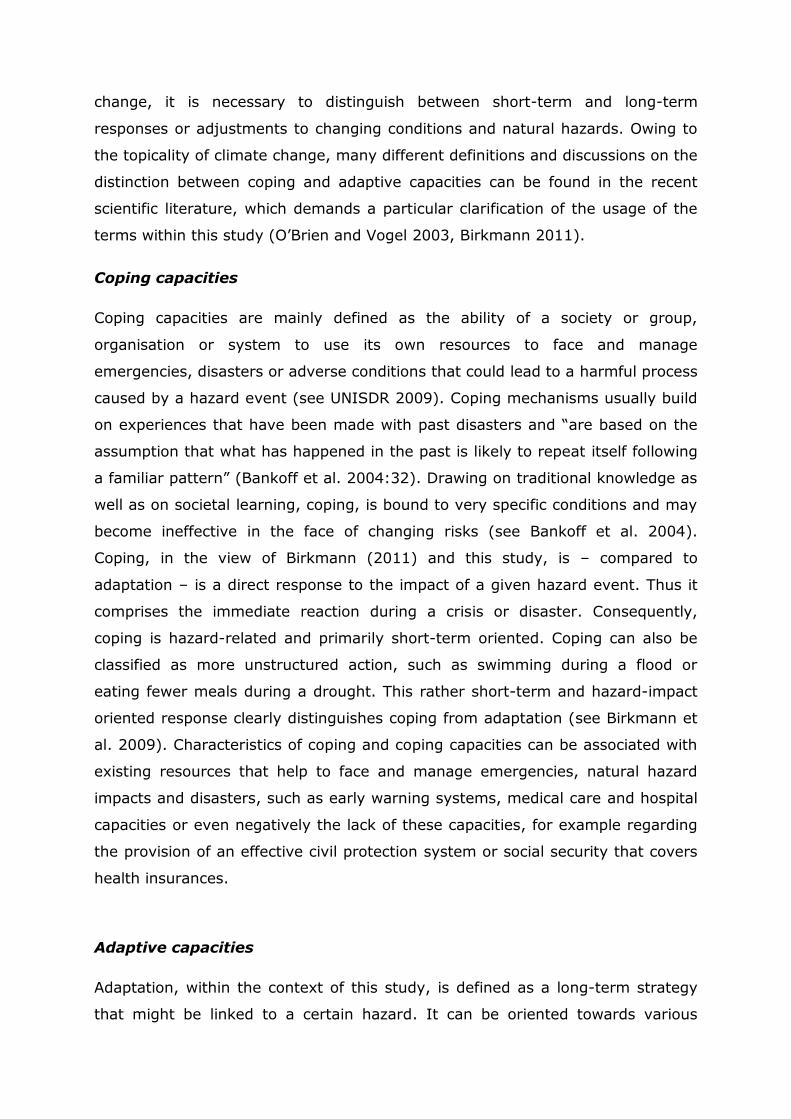
Disaster Risk Index (DRI). The DRI distinguishes several classes of natural risks
at the national level (Fig. 1), based on a model developed by UNEP GRID (United
Nations Environment Programme, Global Resource Information Database). The
UNEP GRID model assesses different physical and socio-economic parameters
that influence the impacts of natural hazards. Terminologically, the study is in
line with the United Nations International Strategy for Disaster Reduction
(UN/ISDR), which means that the underlying comprehension and definition of
risk as a function of natural hazard and vulnerability equals the approach of the
presented concept.
Fig. 1 Spatial distribution of DRI classes (0=no mortality risk to 7=highest mortality risk), source: Peduzzi
et al. 2009:1157.
As a primary goal and intention, the DRI seeks to explain the correlation of a
country‟s development status and its vulnerability to external (natural) hazards.
It thus combines the physical exposure to hazards (annual average population

exposed per spatial unit) and the vulnerability (expressed through socio-
economic variables) to calculate the mortality risk for a certain hazard type
(Peduzzi et al. 2009). Adverse effects of natural hazard impacts other than
mortality, for example the population affected, are not included in the
calculation.
The DRI is based on mortality data from the Emergency Events Database (EM-
DAT) of the Centre for Research on the Epidemiology of Disasters (CRED) that
contains approximately 15,000 large disaster events. Hazard events have to fulfil
at least one of the following criteria, in order to be included in the database:
Ten (10) or more people reported killed
One hundred (100) people reported affected
Declaration of a state of emergency
Call for international assistance
(http://www.emdat.be/criteria-and-definition)
In addition to the physical exposure and mortality data from CRED, 32 socio-
economic variables were selected as potential vulnerability indicators, but
“only five of them were finally retained by the multiple regression
analysis (i.e. GDP purchasing power parity per capita, modified percentage of arable land, percentage of urban growth, percentage of country forest coverage, transformed value of the percentage of the
country dedicated to crop land)” (Peduzzi et al. 2009:1156).
Limitations of the DRI, intended to be reduced within the World Risk,
Vulnerability and Adaptation Index, result from the consideration of mortality risk
only, as well as from the selection of the above vulnerability criteria that are very
narrowly concentrating on the quality of the environment and composition of the
economy. Most indicators used within the DRI focus mainly on the direct
consequences of disasters, in terms of the identification of the variables that
directly correlate with observed fatalities and losses. The proposed World Risk,
Vulnerability and Adaptation Index, in contrast, puts more emphasis on the
context conditions and accounts for direct losses, as well as the broader
development and governance context of a country, through indicators like the
Corruption Perceptions Index (CPI).
Natural Disaster Hotspots (International Bank for Reconstruction and Development/World
Bank/Columbia University, 2005)

The hotspots study by Dilley et al. (2005) presents an alternative approach for
an index of the global risk to natural hazards. This includes economic losses, in
addition to mortality, and disposes a higher resolution (5km x 5km grid) than the
DRI. The primary goal of this study is to identify regional hotspots of risk. Like
the DRI, it uses the CRED EM-DAT database as basis for its calculation and is
thus limited to large events. Within the study, three separate indices are
calculated:
1) Index on mortality risk (based on gridded population of the world data),
2) Index on risk of absolute economic losses, and
3) Index on risk of economic losses as proportion of GDP per grid.
The societal vulnerability within this study is estimated based on mortality and
economic losses (for different levels of income) of past events. Areas with low
population density or without agricultural importance are not regarded in this
study, which might be problematic, as these areas show high relative mortality
to floods which can lead to the exclusion of particularly vulnerable areas
(Birkmann 2007). Risk is calculated based on natural events, elements exposed
and vulnerability. The fundamental drawback of this study results from the lack
of specific indicators of vulnerability. Vulnerability, in the understanding of this
concept, cannot simply be determined by past losses of life and economic values.
Hazard-independent Vulnerability Index (Stefan Schneiderbauer, 2007)
In his PhD-Thesis on “Risk and vulnerability to natural disasters – from
broad view to focused perspective. Theoretical background and applied
methods for the identification of the most endangered populations in two
case studies at different scales”, Schneiderbauer presents a very
comprehensive vulnerability analysis, which gave important methodological input
to the proposed concept.
Based on the availability and actuality of data, Schneiderbauer selected 37
variables and performed a principal component analysis (PCA) to obtain a fewer
meaningful indicators. He then developed a composite indicator for hazard-
independent vulnerability at national scale (Fig. 2).
In the process of concept development, it was considered to use a PCA for the
creation of the Index, in order to describe the variability of the different input
variables and to weight them accordingly. The idea was rejected, however, due

to the modular structure of the Index which allows the modification of weights
and input variables over time (please see chapter on methodology for details).
Fig. 2 Hazard Independent Vulnerability of Populations , an estimation at national level (dark green =
very low vulnerability to dark red=very high vulnerability), source: Schneiderbauer 2007:63.
UNISDR – Global Assessment Report 2009
The “Global Assessment Report on Disaster Risk Reduction: Risk and poverty in a
changing climate. Invest today in a safer tomorrow” has its focus on the relation
of poverty and risk in the face of climate change. The report shows disaster risks
and their causes on a global scale and introduces measures for disaster risk
reduction. The emphasis is thus put on a more applied access to disaster risk and
disaster risk reduction. The intention of the report is not only to picture risk
exposed population, but also to make the connection of the recent findings of the
climate change community and the expected increasing damages, thereby
putting in a claim of an improved risk reduction.
The report underlines the particularly high affectedness of the poor, who suffer
most from natural hazards (compare Fig. 3). One of the key messages of the
report is that the implementation of risk-reducing measures can simultaneously
abate poverty and make a contribution to development as well as to climate
change adaptation.
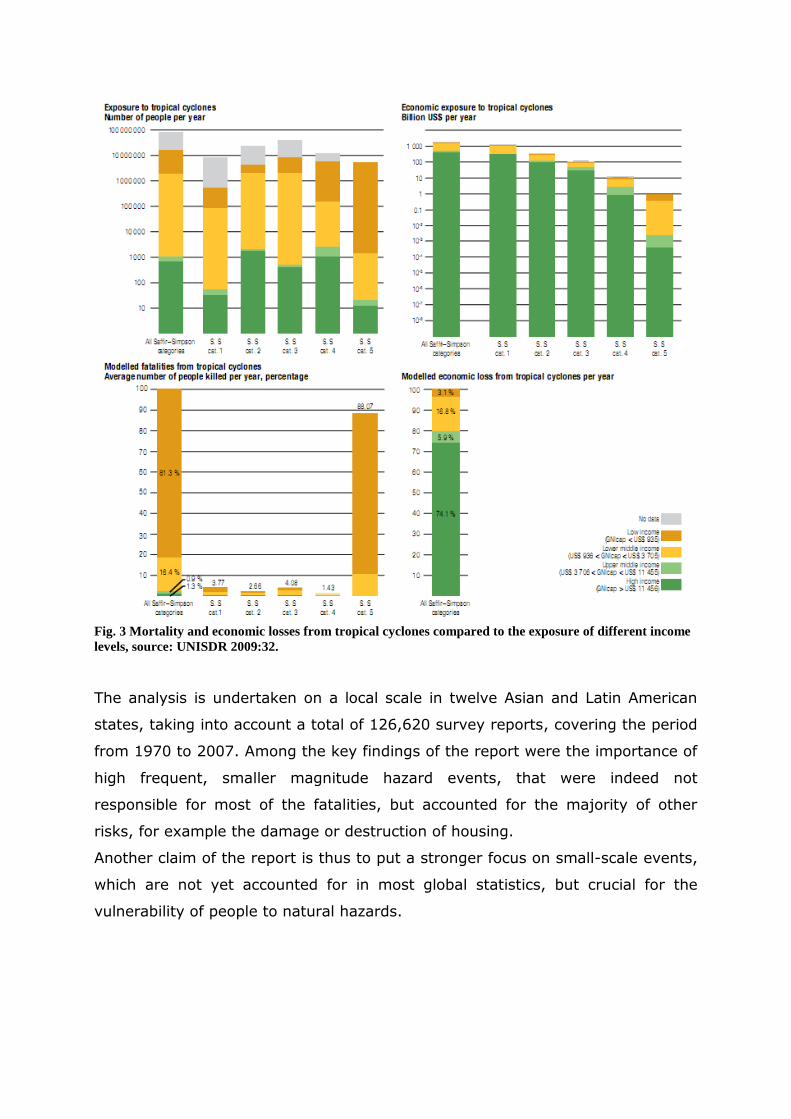
Fig. 3 Mortality and economic losses from tropical cyclones compared to the exposure of different income
levels, source: UNISDR 2009:32.
The analysis is undertaken on a local scale in twelve Asian and Latin American
states, taking into account a total of 126,620 survey reports, covering the period
from 1970 to 2007. Among the key findings of the report were the importance of
high frequent, smaller magnitude hazard events, that were indeed not
responsible for most of the fatalities, but accounted for the majority of other
risks, for example the damage or destruction of housing.
Another claim of the report is thus to put a stronger focus on small-scale events,
which are not yet accounted for in most global statistics, but crucial for the
vulnerability of people to natural hazards.

Indicators of Disaster Risk and Risk Management (Inter-American
Development Bank/ Universidad Nacional de Colombia, Manizales, IDEA)
Produced under the lead of Omar Dario Cardona, this study can be regarded as a
special case, compared to the approaches above, as it evaluates the national
levels of vulnerability and disaster risk management performance in relation to
an assumed maximum considered hazard event and does not analyse the
number of people killed and/or affected from past events. The study builds a
very complex model for measuring vulnerability to natural disasters, based on
four independent indices (for detailed explanations see Cardona 2005a, 2005b):
1) Disaster Deficit Index (DDI)
The DDI measures the risk of financial and macro-economic impacts a
country may experience resulting from the exposure to a maximum considered
event occurring in a given timeframe (derived from hazard return periods of 50,
100 and 500 years) and factors attenuating the potential impacts (e.g. insurance
schemes, financial resources reserved for emergencies, potential external
assistance, etc.).
2) Local Disaster Index (LDI)
The LDI focuses on lower magnitude events at the local level, which via
their cumulative impact, determine chronically social and environmental risks.
These events are mostly not encountered in larger scale databases, although
they may have a very serious effect on societal vulnerability to natural hazards.
3) Prevalent Vulnerability Index (PVI)
The PVI captures the predominant vulnerability conditions, assessing the
exposure of prone areas, the socio-economic fragility and the lack of social
resilience. It thus takes into account the underlying structural conditions shaping
vulnerability (vulnerability as starting point for analysis in the sense of O‟Brien et
al., 2004).
4) Risk Management Index (RMI)
The RMI refers to the risk management performance of a country and thus
to its hazard response capacities. The input variables portray the respective level

of identification of risk, risk reduction, disaster management, and governance
and financial protection.
Pooling these four indicators, the approach of Cardona and his team represents
probably the most complex model for vulnerability analysis available at the
international scale. It is, however, geographically limited to countries in Latin
America and the Caribbean (new version 2009: 17 countries assessed for DDI
and RMI, 14 countries for LDI, and 19 countries PVI) and not feasible to apply at
global scale, mainly due to the lack of data availability.

Definition of key terms
Against this background, the following section provides definitions of the key
terms used. Further details regarding the measurement are given thereafter in
the indicator and methodology section.
Risk
Risk is the product of the interactions between natural or human-induced
hazards and vulnerable conditions, including the probability of the occurrence of
the hazard phenomena (UNISDR 2004, Birkmann 2006; Cardona 2003).
Vulnerability
According to the UNISDR vulnerability encompasses conditions determined by
physical, social, economic and environmental factors or processes, which
increase the susceptibility of a community to the impact of hazards (UNISDR
2004). This term is consider as an “internal side of risk”, as an intrinsic
characteristic of a system or element at risk. The main elements of vulnerability
are those conditions that increase and determine the likelihood of injury, death,
loss and disruption of livelihood of human beings; and the extension of the
concept is associated to a „dualistic structure‟ of vulnerability when considering in
addition the ability and capacity to cope with and recover from these stresses
and negative impacts of a hazardous event (Birkmann 2006; Wisner 2002).
Exposure
Exposure in its core meaning in natural hazard research encompasses entities
exposed and prone to be affected by a hazard event. These entities include
persons, resources, infrastructure, production, goods, services or ecosystems
and coupled social-ecological systems, etc. (see e.g. UNISDR 2009 website,
MOVE Project). Exposure can be further differentiated in terms of a spatial
(geographic exposure) and a temporal component. Often, communities or
regions might be exposed spatially to a certain degree. Additionally, some people
might only be exposed to natural hazards during a certain time of the day, due
to their place of work or place of living. Beside an inventory of elements exposed
to natural hazards, exposure can also be more precisely assessed in terms of
spatial and temporal exposure. Moreover, exposure can be mapped in terms of

hazard events per country, population exposed or land area exposed. One of the
key challenges of mapping and measuring exposure of countries or societies to
different natural hazards and creeping changes, such as sea level rise, is in fact
the potentially very different nature of these hazards – such as the different
reoccurrence interval (frequency) and magnitude. In this regard, it would be
desirable to consider - besides the spatial exposure - also the frequency of the
different hazards. The intention to compare different exposure types also
requires a standardisation or normalisation of the respective hazard data.
Overall, the concept developed in this study aims to use either the population
exposed, since it can be compared between countries and communities, or the
land area exposed. The analysis of exposure often has to be based on past
hazard frequencies. However, for the issue of sea level rise, the study also
promotes the integration of exposure data that is based on a GIS analysis.
Susceptibility
Susceptibility, in the understanding of this study, refers to the conditions of
exposed communities or other exposed elements (infrastructures, ecosystems,
etc.) that make them more likely to experience harm and to be negatively
affected by a natural hazard or by climate change. On the contrary, societies or
households that are characterised by a low susceptibility might be exposed;
however, they will face only minor harm due to their low level of susceptibility.
While susceptibility – in the perspective of the authors – is more closely linked to
structural characteristics, coping and adaptation, as societal response capacities
refer more to the agency and the potential to act. However, it is also evident
that, in practical assessments, susceptibility and coping capacity are overlapping
and are closely linked. For example, the lack of a social network could be seen as
a feature of susceptibility; however, in terms of coping, the availability of the
social network, that might help to cope in stress situations, might also be seen as
a source of coping capacities.
Coping and adaptation
As this study aims at putting an emphasis on the capacities societies have in
response to natural hazards and considers novel threats caused by climate
change, it is necessary to distinguish between short-term and long-term
responses or adjustments to changing conditions and natural hazards. Owing to
the topicality of climate change, many different definitions and discussions on the
distinction between coping and adaptive capacities can be found in the recent
scientific literature, which demands a particular clarification of the usage of the
terms within this study (O‟Brien and Vogel 2003, Birkmann 2011).
Coping capacities
Coping capacities are mainly defined as the ability of a society or group,
organisation or system to use its own resources to face and manage
emergencies, disasters or adverse conditions that could lead to a harmful process
caused by a hazard event (see UNISDR 2009). Coping mechanisms usually build
on experiences that have been made with past disasters and “are based on the
assumption that what has happened in the past is likely to repeat itself following
a familiar pattern” (Bankoff et al. 2004:32). Drawing on traditional knowledge as
well as on societal learning, coping, is bound to very specific conditions and may
become ineffective in the face of changing risks (see Bankoff et al. 2004).
Coping, in the view of Birkmann (2011) and this study, is – compared to
adaptation – is a direct response to the impact of a given hazard event. Thus it
comprises the immediate reaction during a crisis or disaster. Consequently,
coping is hazard-related and primarily short-term oriented. Coping can also be
classified as more unstructured action, such as swimming during a flood or
eating fewer meals during a drought. This rather short-term and hazard-impact
oriented response clearly distinguishes coping from adaptation (see Birkmann et
al. 2009). Characteristics of coping and coping capacities can be associated with
existing resources that help to face and manage emergencies, natural hazard
impacts and disasters, such as early warning systems, medical care and hospital
capacities or even negatively the lack of these capacities, for example regarding
the provision of an effective civil protection system or social security that covers
health insurances.
Adaptive capacities
Adaptation, within the context of this study, is defined as a long-term strategy
that might be linked to a certain hazard. It can be oriented towards various

future changes that might occur (multi-hazard perspective). According to the
IPCC (2007), adaptation is defined as:
“Adjustment in natural or human systems in response to actual or expected climatic stimuli or their effects, which moderates harm or exploits beneficial opportunities”.
Although the term adaptation, within the IPCC definition, remains relatively
abstract and does not refer to coping or extreme events, the emerging scientific
literature in the field stresses an important difference between short-term coping
and long-term adaptation. O‟Brien and Vogel (2003) stress that adaptation is a
more structured behaviour that aims to promote change and transformation. For
example, a farmer who aims to adapt to climate change – in particular, to
drought – might need to change his/her seasonal calendar of cropping and
perhaps the crops themselves, in order to be able to live with the changing
environmental conditions without suffering. Whereas coping is directed more at
the compensation of a singular impact at a time, adaptation hence focuses on
changing conditions.
Additionally, the IPCC differentiates between types of adaptation such as
anticipatory, autonomous and planned adaptation. Anticipatory adaptation is
mainly characterised by the fact that it takes place before impacts of climate
change are observed (pro-active focus). Autonomous adaptation characterises
adaptive changes in natural systems or by markets in human systems
constituted by a response to climate change that just happens without planning.
The last type – planned adaptation – refers to adaptation as a result of a
deliberate policy decision, based on the awareness that conditions have changed
or will change and that respective actions are required to maintain or achieve a
desired state (see IPCC 2007).
Overall, the assessment of adaptation and adaptive capacities is a major
challenge. However, abilities that enable communities to change and to
transform, in the light of environmental and socio-economic changes, are an
important asset and characteristic of these adaptive capacities. In our point of
view, as an example, skills that enable people to shift potential livelihood
strategies, income-earning activities, educational and scientific capacities of
nations or the awareness regarding the need to consider climate change
adaptation in development strategies of the country, are used as first
characteristics to grasp a notion of what adaptation capacities might mean to
various hazards and creeping changes in the future.

References:
a) State of the Art
BIRKMANN, J (2007): Risk and vulnerability indicators at different scales: Applicability,
usefulness and policy implications. In: Environmental Hazards 7: 20-31.
CARDONA, OD (2005A): Indicators of disaster risk and risk management: program for Latin
America and the Caribbean. Summary report. Inter-American Development Bank,
Washington, DC, 43 pp.
CARDONA, OD (2005B): A System of Indicators for Disaster Risk Management in the
Americas, Proceedings of the International Conference: 250th Anniversary of the
1755 Lisbon earthquake. Lisbon.
CRED EM-DAT (THE INTERNATIONAL DISASTER DATABASE, CENTRE FOR RESEARCH ON THE
EPIDEMIOLOGY OF DISASTERS) (2009): Criteria and Definiton.
http://www.emdat.be/criteria-and-definition.
DILLEY, M; CHEN, RS; DEICHMANN, U; LERNER-LAM, AL; ARNOLD, M; AGWE, J; BUYS, P; KJEKSTAD,
O; LYON, B & G YETMAN (2005): Natural disaster hotspots: a global risk analysis.
International Bank for Reconstruction and Development/The World Bank and
Columbia University, Washington, DC, 132 pp.
INSTITUTO DE ESTUDIOS AMBIENTALES (IDEA)(2005): Indicators of Disaster Risk and Risk
Management: Main Technical Report. IADB/IDEA Program of Indicators for Disaster
Risk Management. Universidad Nacional de Colombia, Manizales.
http://idea.unalmzl.edu.co
PEDUZZI, P; DAO, H; HEROLD, C & F MOUTON (2009): Assessing global exposure and
vulnerability towards natural hazards: the Disaster Risk Index. In: Natural Hazards
and Earth System Sciences 9: 1149-1159.
SCHNEIDERBAUER, S (2007): Risk and Vulnerability to Natural Disasters from Broad View to
Focused Perspective. Theoretical Background and applied methods for the
identification of the most endangered populations in two case studies at different
scales. Dissertation an der Freien Universität Berlin. http://www.diss.fu-
berlin.de/diss/receive/FUDISS_thesis_000000003126.
UNISDR (UNITED NATIONS INTERNATIONAL STRATEGY FOR DISASTER REDUCTION) (2009): Global
Assessment Report on Disaster Risk Reduction. Risk and Poverty in a Changing
Climate –Invest today for a safer tomorrow United Nations, Geneva, Switzerland.
b) Key terms:
BANKOFF, G; FRERKS, G & T HILHORST (EDS.) (2004): Mapping Vulnerability: Disasters,
Development and People, London: Earthscan.
BIRKMANN, J (2006): Measuring Vulnerability to Promote Disaster-Resilient Societies:
Conceptual Frameworks and Definitions, in: BIRKMANN, J (ed.): Measuring
Vulnerability to Natural Hazards - Towards Disaster Resilient Societies, Tokyo, New
York, Paris; United Nations University Press: 9-54.
BIRKMANN, J (2011): First- and second-order adaptation to natural hazards and extreme
events in the context of climate change. In Natural Hazards, pp. 1–30.
http://dx.doi.org/10.1007/s11069-011-9806-8.

BIRKMANN, J (2011): Regulation and Coupling of Society and Nature in the Context of
Natural Hazards - Different theoretical approaches and conceptual frameworks and
their applicability to analyse social-ecological crises phenomena. In: BRAUCH, HG;
OSWALD SPRING, U; MESJASZ, C; GRIN, J; KAMERI-MBOTE, P; CHOUROU, B; DUNAY, P & J
BIRKMANN (eds.): Coping with Global Environmental Change, Disasters and Security -
Threats, Challenges, Vulnerabilities and Risks. (Springer) Berlin, Heidelberg, New
York, S. 1103 -1127.
BIRKMANN, J; VON TEICHMAN, K; ALDUNCE, P; BACH, C; BINH, NT; GARSCHAGEN, M; KANWAR, S;
SETIADI, N; THACH, LN & A OLIVER-SMITH (2009): Addressing the Challenge:
Recommendations and Quality Criteria for Linking Disaster Risk Reduction and
Adaptation to Climate Change. In: BIRKMANN, J, TETZLAFF, G, ZENTEL, KARL-OTTO
(eds.) DKKV Publication Series, No. 38, Bonn.
CARDONA, OD (2003): The Notion of disaster Risk. Conceptual Framework for Integrated
Risk Management, Universidad Nacional de Colombia Manizales. available at
http://www.manizales.unal.edu.co/ProyectosEspeciales/bid2/documentos/01%20Co
nceptual%20Framework%20IADB-IDEA%20Phase%20I.pdf
IPCC (INTERGOVERNMENTAL PANEL ON CLIMATE CHANGE) (2007): Climate Change 2007:
Impacts, Adaptation and Vulnerability. Contribution of Working Group II to the
Fourth Assessment Report of the Intergovernmental Panel on Climate Change. ML
PARRY, OF CANZIANI, JP PALUTIKOF, PJ VAN DER LINDEN & CE HANSON (Eds.). Cambridge
University Press, Cambridge, UK, 976pp.
MOVE (METHODS FOR THE IMPROVEMENT OF VULNERABILITY ASSESSMENT IN EUROPE): EU project
website: http://www.move-fp7.eu/.
O‟BRIEN, KL & HC VOGEL (2003): Coping with Climate Variability: The Use of Seasonal
Climate Forecasts in Southern Africa. Aldershot: Ashgate Publishing.
UNISDR (UNITED NATIONS INTERNATIONAL STRATEGY FOR DISASTER REDUCTION) (2009): Global
Assessment Report on Disaster Risk Reduction. Risk and Poverty in a Changing
Climate –Invest today for a safer tomorrow United Nations, Geneva, Switzerland.
UNISDR (UNITED NATIONS INTERNATIONAL STRATEGY FOR DISASTER REDUCTION) (2004): Living
with Risk: A Global Review of Disaster Reduction Initiatives. Preliminary Version.
Geneva, Switzerland: Inter-Agency Secretariat of the International Strategy for
Disaster Reduction. 382 pp. http://www.unisdr.org/eng/about_isdr/bd-lwr-2004-
eng.htm.
WISNER, B (2002): “ Who? What? Where? When? In an Emergency: Notes on Possible
Indicators of Vulnerability and Resilience: By Phase of the Disaster Management
Cycle and Social Actor” in: Plate, E. (ed.): Environment and Human Security.
Contributions to a workshop in Bonn, 23-25 October 2002, Germany, pp.12/7-
12/14.


![THOUGHTS ON GLITCH[ART]v2 - Nick Briznickbriz.com/thoughtsonglitchart/thoughtsonglitchartv2.0.pdfTHOUGHTS ON GLITCH[ART]v2.0 0 whois ( preface ) 1 how to glitch art 2 ..... definitions](https://img.pdfslide.net/doc/110x75/5ae5ff047f8b9a08778c6f37/thoughts-on-glitchartv2-nick-on-glitchartv20-0-whois-preface-1-how-to.jpg)