Embed Size (px)
Citation preview
applied sciences
Review
State of the Art and Trends Review of Smart Meteringin Electricity Grids
Noelia Uribe-Pérez 1,*, Luis Hernández 2, David de la Vega 3 and Itziar Angulo 3
1 Centre for the Development of Renewable Energy Sources (CEDER)—Research Centre for Energy,Environment and Technology (CIEMAT), Autovía de Navarra A15, sal. 56, Lubia, Soria 42290, Spain
2 Department of Agricultural Engineering and Forestry, University of Valladolid (UVA),Campus Universitario Duques de Soria, Soria 42004, Spain; [email protected]
3 Department of Communications Engineering, ETSI Bilbao, University of the Basque Country (UPV/EHU),Alda Urkijo s/n, Bilbao 48013, Spain; [email protected] (D.V.); [email protected] (I.A.)
* Correspondence: [email protected]; Tel.: +34-97-5281-013 (ext. 104)
Academic Editor: Minho ShinReceived: 29 October 2015; Accepted: 22 January 2016; Published: 29 February 2016
Abstract: Climate change, awareness of energy efficiency, new trends in electricity markets, theobsolescence of the actual electricity model, and the gradual conversion of consumers to prosumerprofiles are the main agents of progressive change in electricity systems towards the Smart Gridparadigm. The introduction of multiple distributed generation and storage resources, with a stronginvolvement of renewable energies, exposes the necessity of advanced metering or Smart Meteringsystems, able to manage and control those distributed resources. Due to the heterogeneity ofthe Smart Metering systems and the specific features of each grid, it is easy to find in the relatedliterature a wide range of solutions with different features. This work describes the key elementsin a Smart Metering system and compiles the most employed technologies and standards as well astheir main features. Since Smart Metering systems can perform jointly with other activities, thesegrowing initiatives are also addressed. Finally, a revision of the main trends in Smart Metering usesand deployments worldwide is included.
Keywords: communication technologies; electricity grids; smart grid; Smart Metering
1. Introduction
The need to address metering issues arises practically at the same time as the developmentof distribution electricity grids. There is a remarkable evolution from the first known electricitymeter, patented by Samuel Gardiner in 1872 [1], which only provided information about the lengthof the electricity current flow, to the up-to-date systems, which are able to provide a wide rangeof applications rather than just metering. The first automatic and commercialized remote meter isattributed to T. Paraskevakos in 1977 [2]. However, the remote metering concept was not realized inthe expected electricity context for many years. Climate change, awareness of energy efficiency, newtrends in electricity markets, and the gradual conversion of consumers towards more active agents arepromoting not only the use of Renewable Energy Resources (RES), but also the Distributed Generation (DG)and Distributed Storage (DS), which urge a dramatic evolution of the actual electricity model. Evolutiontowards an electricity grid model able to manage numerous generation and storage devices in anefficient and decentralized manner determines the core of the Smart Grid (SG) concept, making thedeployment of advanced metering systems or Smart Metering one of the basic techniques to reach thisgoal. The European Parliament, in the 2012/27/EC directive, defined a Smart Metering or intelligentmetering system as “an electronic system that can measure energy consumption, providing more
Appl. Sci. 2016, 6, 68; doi:10.3390/app6030068 www.mdpi.com/journal/applsci
Appl. Sci. 2016, 6, 68 2 of 24
information than a conventional meter, and can transmit and receive data using a form of electroniccommunication” [3]. Regarding communication, Machine-to-Machine (M2M) communications happenin devices with capabilities to communicate among them without the need of human intervention.The captured event-driven data is sent through the communication channel (wired or wireless) tothe servers in charge of extracting and processing the data and generating responses [4]. Therefore,M2M capabilities are key for Smart Metering performance, since they allow the required bidirectionalcommunication between consuming points and monitoring and control centers [5].
Besides the control and management capabilities provided by the implementation of the SmartMetering, the obtained metering data together with additional information can be used by automatizedsystems to lead new applications, such as predictive and load management systems.
2. Trends of the Smart Metering Systems
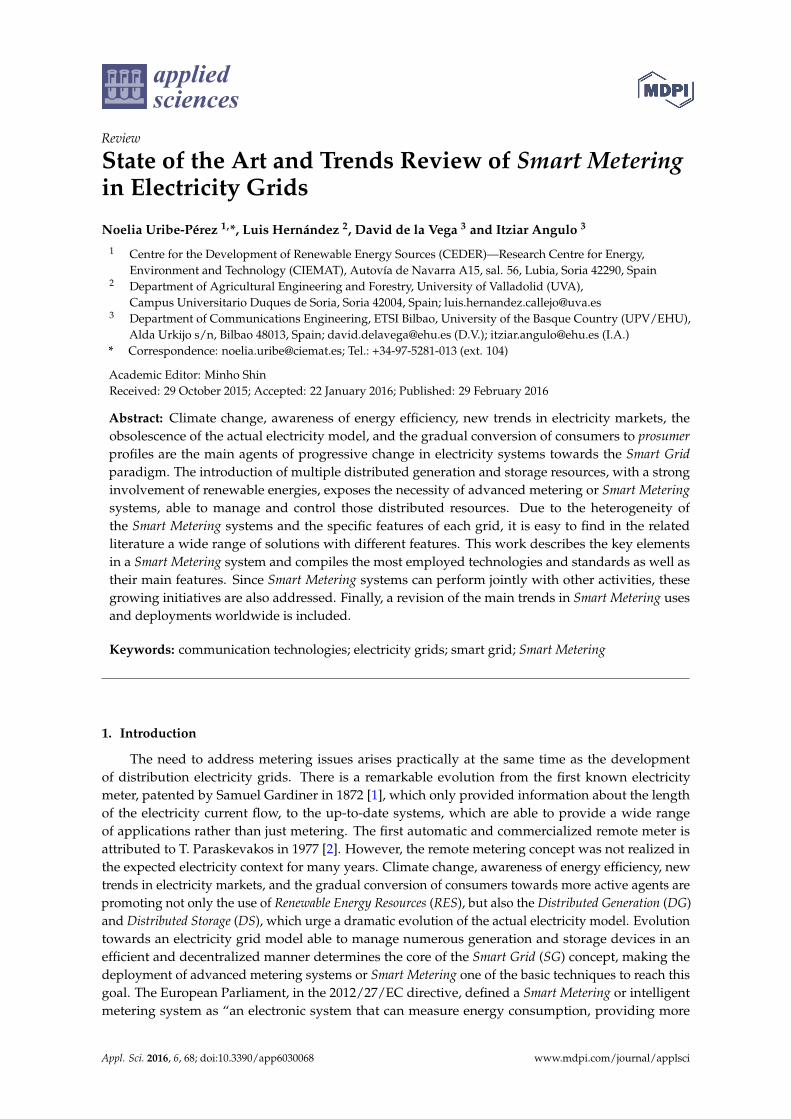
The metering side of the distribution system has been the focus of most recent infrastructureinvestments. The first attempts at metering automatization, or Automated Meter Reading (AMR), allowedutilities to remotely read the consumption records and basic status information from customers’premises [6]. Due to its one-way communication system, AMR is limited to remote reading and cannotrun additional applications, which prompted utilities to move towards the Smart Metering or AdvancedMetering Infrastructure (AMI). Smart Metering provides utilities with bidirectional communication to themeter but also the ability of evaluating the status of the grid. Recent Smart Metering systems, equippedwith an improved architecture, and working together with smart sensors and more sophisticateddistributed control technology, allow utilities to perform grid control and management [7]. Figure 1shows the evolution from AMR to AMI with lists of stakeholders and benefactors for each step.
Appl. Sci. 2016, 6, 68 2 of 25
form of electronic communication” [3]. Regarding communication, Machine‐to‐Machine (M2M)
communications happen in devices with capabilities to communicate among them without the need
of human intervention. The captured event‐driven data is sent through the communication channel
(wired or wireless) to the servers in charge of extracting and processing the data and generating
responses [4]. Therefore, M2M capabilities are key for Smart Metering performance, since they allow
the required bidirectional communication between consuming points and monitoring and control
centers [5].
Besides the control and management capabilities provided by the implementation of the
Smart Metering, the obtained metering data together with additional information can be used by
automatized systems to lead new applications, such as predictive and load management systems.
2. Trends of the Smart Metering Systems
The metering side of the distribution system has been the focus of most recent infrastructure
investments. The first attempts at metering automatization, or Automated Meter Reading (AMR),
allowed utilities to remotely read the consumption records and basic status information from
customers’ premises [6]. Due to its one‐way communication system, AMR is limited to remote
reading and cannot run additional applications, which prompted utilities to move towards the Smart
Metering or Advanced Metering Infrastructure (AMI). Smart Metering provides utilities with
bidirectional communication to the meter but also the ability of evaluating the status of the grid.
Recent Smart Metering systems, equipped with an improved architecture, and working together with
smart sensors and more sophisticated distributed control technology, allow utilities to perform grid
control and management [7]. Figure 1 shows the evolution from AMR to AMI with lists of
stakeholders and benefactors for each step.
Figure 1. Evolution of Smart Metering [8]. Reprinted with the permission of the Edison Electric
Institute, “Smart Meters and Smart Meter Systems: A Metering Industry Perspective”, published by
the Edison Electric Institute, 2011.
2.1. Architecture of a Smart Metering System
A Smart Metering system implies the deployment of a heterogeneous infrastructure, including
metering devices, communication networks, and data gathering and processing systems, as well as
the associated management and installation duties. A Smart Metering system is based on four main pillars:
A Smart Metering device, Smart Meter (SM);
A data gathering device, Data Concentrator (DC);
A communication system used for data flow;
A centralized management and control system, Control Center (CC).
Smart Metering systems are heterogeneous deployments with different requirements and
features since they highly depend on the intended use. In addition, different types of measurement
Figure 1. Evolution of Smart Metering [8]. Reprinted with the permission of the Edison Electric Institute,“Smart Meters and Smart Meter Systems: A Metering Industry Perspective”, published by the EdisonElectric Institute, 2011.
2.1. Architecture of a Smart Metering System
A Smart Metering system implies the deployment of a heterogeneous infrastructure, includingmetering devices, communication networks, and data gathering and processing systems, as well as theassociated management and installation duties. A Smart Metering system is based on four main pillars:
‚ A Smart Metering device, Smart Meter (SM);‚ A data gathering device, Data Concentrator (DC);‚ A communication system used for data flow;‚ A centralized management and control system, Control Center (CC).
Smart Metering systems are heterogeneous deployments with different requirements and featuressince they highly depend on the intended use. In addition, different types of measurement can be
Appl. Sci. 2016, 6, 68 3 of 24
found in the same Smart Metering system. Three main measurement groups can be differentiated:(i) on-demand: measured data flows from the consuming points to the CCs upon specific request ofthe utility when needed; (ii) scheduled: measured data flows from the consuming points to the CCsby pre-programmed tasks and between four and six times a day per meter; and (iii) bulk: the utilitycollects metering information from all devices several times per day [9].
2.1.1. Smart Meter
The most recent evolution of the Smart Meter (SM) is based on the introduction of bidirectionalcapabilities and the progressive appearance of new applications. Bidirectional capabilities must beunderstood from two different points of view: energy (energy flows towards/from consumption/generation points, mainly due to the DG, DS, and prosumers figures) and communication (data travelsfrom the SMs to the CC, but the CC can also communicate with them, as the SM includes an embeddedcommunication node, within a configurable and multifunctional network).
An SM can present a wide range of features. Although there is not a directive or norm thatdefines them in terms of quantity or functionality, different bodies have established some guidelines.The European Smart Meters Industry Group (ESMIG) has reduced the minimum features of an SM to thefollowing four:
‚ Remote reading‚ Bidirectional communication‚ Support of advanced tariff systems and billing applications‚ Remote energy supply control.
On the other hand, the European Union extends the minimum desirable requirements for anelectricity SM as published in 2012/148/EU recommendation, described in Table 1.
Table 1. Minimum requirements for electricity SMs according to 2012/148/EU recommendations.
2012/148/EU Recommendation
ConsumerProvide readings directly to the consumer and/or any third party.Update the readings frequently enough to use energy saving schemes.
Metering Service OperatorAllow remote reading by the operator.Provide bidirectional communication for maintenance and control.Allow frequent enough readings to be used for networking planning.
Commercial Service IssuesSupport advanced tariff system.Allow remote ON/OFF control supply and/or flow or power limitation.
Security and Data ProtectionProvide secure data communications.Fraud prevention and detection.
Distributed GenerationProvide consumed, generated, and reactive metering data.
2.1.2. Data Concentrator
The main function of the DC is to gather metering data from the SMs. In addition, DCs areusually the master node of a communication subnetwork formed by itself and a set of SMs, whichimplies that they also include an embedded communication node. DCs are usually located inside PowerTransformers (PTs) and substations. Modern DCs also include additional features such as low-voltage(LV) supervision, since they include an embedded SM.
2.1.3. Communication System
The transmission of data must be guaranteed in terms of quality, time, and security. Therefore,the communication technologies play a key role, as they have to be cost-efficient and should provide

Appl. Sci. 2016, 6, 68 4 of 24
good coverage, security features, bandwidth, and power quality with the least possible number ofrepetitions [10]. Section 5 addresses the main challenges that the Smart Metering communication systemmust face. Communications in power grids have evolved from one-way communication systems andradial topology to bidirectional systems with network topology. A wide review of communicationfeatures, requirements, and technologies for SG and Smart Metering communication networks can beconsulted in [11].
2.1.4. Control Centre
The CC or Data Management System (DMS) is in charge of receiving and storing the meteringdata for processing purposes. The CC can be seen as a modular system formed by the Meter DataManagement System (MDMS), which manages the metering data, and additional secondary modulesin charge of end-users applications, weather forecasting systems, geographical information systems,control applications, and load management, among others. The MDMS includes the tools that enablecommunication among different modules, as well as being in charge of validating, processing, andediting the metering data for a suitable information interchange among the different parts of theSmart Metering system [12]. CCs have evolved with the progressive increase of Smart Meteringsystems’ capabilities from mere data compilers and storage devices, typical of AMR systems, to moresophisticated systems able to take decisions and manage the entire system in real time. Generated datafrom measurements is a very valuable resource for utilities, since they are able to make a wide rangeof forecasts (available energy, probability of power failures, customers’ consumption predictions) byusing predictive analysis, which enables utilities to take proactive action rather than simply reacting toevents after they happen [13]. Making the most of information from SMs and SGs increasingly requiresdealing with what is called Big Data. Diamantoulakis et al. present a roadmap of Big Data analyticsin Demand Energy Management that includes, among other strategies, load patterns categorization,predictive analytics, distributed data mining, and cloud computing, to assess different aspects of theSGs that cannot be solved with conventional data processing techniques [14].
2.2. Considerations for a Smart Metering System
A Smart Metering system can be seen as three differentiated phases: planning, rollout, andoperation. The widely ranging requirements and characteristics of each specific application, technology,and deployment scenario make the planning of a Smart Metering system a nontrivial task [15].Table 2 summarizes some of the most important consideration to take into account when designinga Smart Metering system. The rollout phase refers to the actions involved in replacing all the metersincluded in the initial scope of the project. This phase also includes deploying the communicationinfrastructure, including all components and devices. Finally, the operation phase refers to actionscarried out on the infrastructure after the rollout, that is, after the scheduled replacement, initialconfiguration of devices, and initial setup of the central system [16].
Table 2. Planning considerations for a Smart Metering system.
Planning Aspects
Technological Election of the most suitable technology according the final endImplementation of software
Physical aspects Resilience and strength
Communication
Type of network (wired, wireless, hybrid)Range of networkBandwidthQuality of signalSecurity & privacy
CostsCosts of devicesCosts of communication network infrastructureMaintenance
CustomersService providingAccess to personal data
Appl. Sci. 2016, 6, 68 5 of 24
2.3. Smart Metering Applications
Beyond management and control, the implementation of a Smart Metering system allows severalapplications that join the metering data together with additional information and other devices fromwhich both utilities and end-users should benefit. Most of them are currently under developmentand are experiencing a remarkable growth since 2006 [17]. A summary of the main Smart Meteringapplications is described below.
‚ Electricity signal quality:
In the traditional power distribution networks, the control devices are solely located in thesubstations; however, with the progressive introduction of the SG, the complexity and number ofrequired controlled assets increase and more detailed, distributed, and frequent control informationis required. SMs1 capabilities of real-time voltage measurement and communication between theconsumers and network controllers are potential key players in voltage control [18]. Several projectsimplementing voltage control techniques include SMs in their solutions [19].
‚ DG and DS control:
The control and management of DG, especially regarding RES, is more complicated thanconventional sources due to its less predictable behavior and varying availability. These uncertaintieshinder CCs1 operations and represent a barrier for distributed resources in general. SMs can help inthose issues by providing accurate, frequently-updated, and real-time generation and charge/dischargemetering data from DG and DS, respectively, which may facilitate CCs1 duties and foster RES1
introduction in electricity grids.
‚ Billing:
Smart Metering systems are necessary in billing applications. The SMs get the tariff costs inreal time, in advance or through pre-programmed tariffs and then the cost of the supplied energy iscalculated. In addition, the SMs can remotely cut or restore the power supply if needed. The mostcommon billing techniques are pricing depending on the time of use, real-time pricing, and peakconsumption-dependent pricing [9].
‚ Demand Response:
The dynamic coordination of the power consumption curve of end-users within existing supplyingconditions or Demand Response (DR) contributes to the efficiency of the system. Additionally, DRprovides an opportunity for consumers to play a significant role in the operation of the electric grid byreducing or shifting their electricity usage during peak periods in response to time-based rates or otherforms of financial incentives. Such programs can lower the cost of electricity in wholesale markets,and, in turn, lead to lower retail rates [20].
‚ HAN applications:
The role of Smart Metering in the end-user1s premises is very promising. From metering dataconsumers can know and control their electricity consumption. Additionally, a wide range ofservices is emerging, such as consuming profiles, load control, remote switching of home devices,and remote consumption monitoring, among others. For instance, in [21] the data from domesticenergy consumption is used together with an algorithm to establish categories of energy consumers,while [22] contains an analysis of generated energy savings after the installation of SMs in Koreanhomes. Nevertheless, some energy managers are expected to play an important role in the progressivedeployment of the triple play (confluence of audio, video, and Internet access).
Appl. Sci. 2016, 6, 68 6 of 24
‚ Anti-fraud techniques:
Bypassing or disrupting the internal performance of a SM and using methods to avoid electric billpayment are considered as electrical frauds. Several countries are developing anti-fraud techniquesthrough Smart Metering systems. For instance, Depuru et al. present in [23] a complex system formedby SMs, harmonic generators, and filters that detect and warn users who commit fraud.
3. Smart Metering Technologies
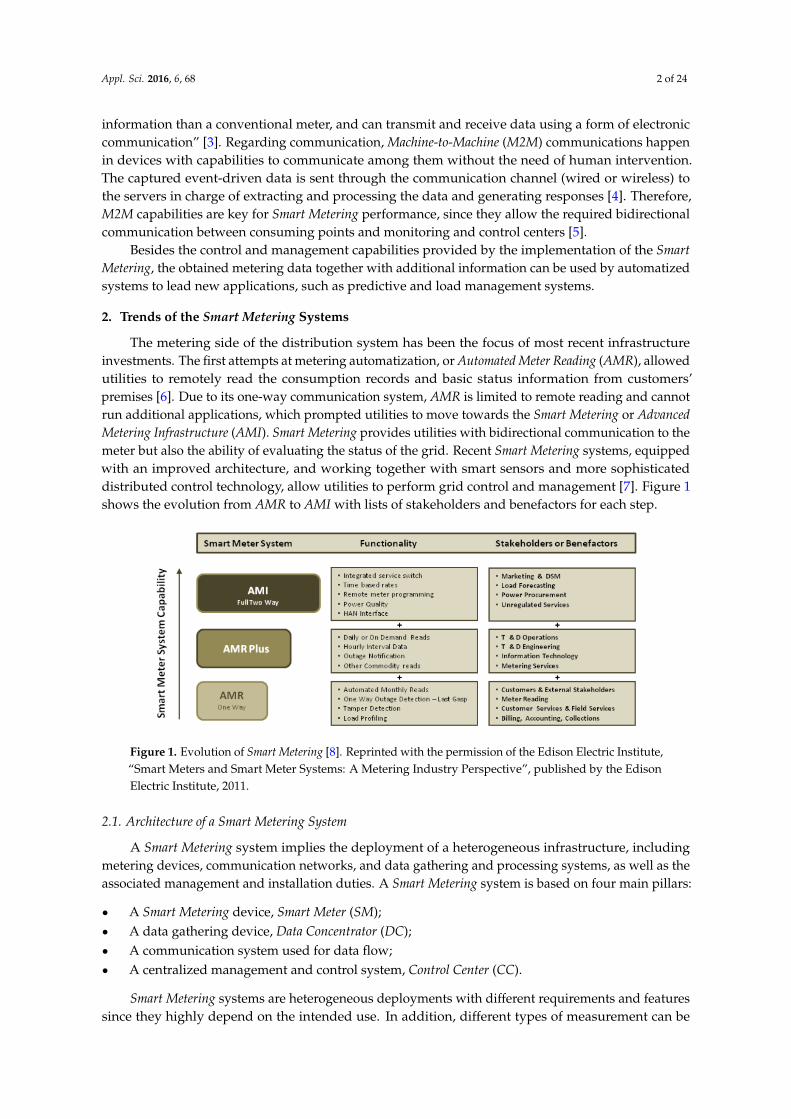
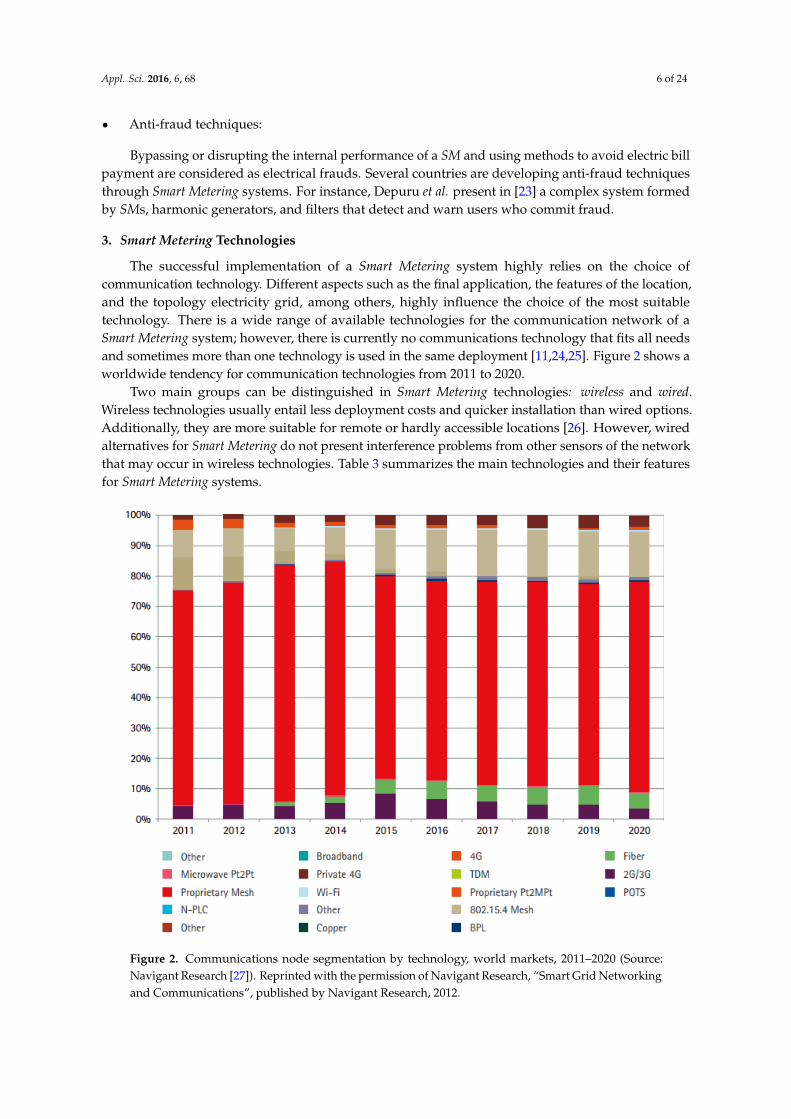
The successful implementation of a Smart Metering system highly relies on the choice ofcommunication technology. Different aspects such as the final application, the features of the location,and the topology electricity grid, among others, highly influence the choice of the most suitabletechnology. There is a wide range of available technologies for the communication network of aSmart Metering system; however, there is currently no communications technology that fits all needsand sometimes more than one technology is used in the same deployment [11,24,25]. Figure 2 shows aworldwide tendency for communication technologies from 2011 to 2020.
Two main groups can be distinguished in Smart Metering technologies: wireless and wired.Wireless technologies usually entail less deployment costs and quicker installation than wired options.Additionally, they are more suitable for remote or hardly accessible locations [26]. However, wiredalternatives for Smart Metering do not present interference problems from other sensors of the networkthat may occur in wireless technologies. Table 3 summarizes the main technologies and their featuresfor Smart Metering systems.
Appl. Sci. 2016, 6, 68 6 of 25
Anti‐fraud techniques:
Bypassing or disrupting the internal performance of a SM and using methods to avoid electric
bill payment are considered as electrical frauds. Several countries are developing anti‐fraud
techniques through Smart Metering systems. For instance, Depuru et al. present in [23] a complex
system formed by SMs, harmonic generators, and filters that detect and warn users who commit fraud.
3. Smart Metering Technologies
The successful implementation of a Smart Metering system highly relies on the choice of
communication technology. Different aspects such as the final application, the features of the
location, and the topology electricity grid, among others, highly influence the choice of the most
suitable technology. There is a wide range of available technologies for the communication network
of a Smart Metering system; however, there is currently no communications technology that fits all
needs and sometimes more than one technology is used in the same deployment [11,24,25].
Figure 2 shows a worldwide tendency for communication technologies from 2011 to 2020.
Two main groups can be distinguished in Smart Metering technologies: wireless and wired.
Wireless technologies usually entail less deployment costs and quicker installation than wired
options. Additionally, they are more suitable for remote or hardly accessible locations [26]. However,
wired alternatives for Smart Metering do not present interference problems from other sensors of the
network that may occur in wireless technologies. Table 3 summarizes the main technologies and their
features for Smart Metering systems.
Figure 2. Communications node segmentation by technology, world markets, 2011–2020 (Source:
Navigant Research [27]). Reprinted with the permission of Navigant Research, “Smart Grid
Networking and Communications”, published by Navigant Research, 2012.
Figure 2. Communications node segmentation by technology, world markets, 2011–2020 (Source:Navigant Research [27]). Reprinted with the permission of Navigant Research, “Smart Grid Networkingand Communications”, published by Navigant Research, 2012.

Appl. Sci. 2016, 6, 68 7 of 24
Table 3. Main technologies and features for Smart Metering systems.
Wireless Data Rate Frequency Bands Distance Advantages Drawbacks Deployments/Projects
RF- Mesh - 902–928 MHz Depends onhops
Coverage can be increasedwith multiple hops. Ad hoc
communication linksformed dynamically.
Tends to be a proprietaryoffering. Performance
decreases over long distances.Most rollouts in USA
Cellular3G–4G 60–240 kbps 824–894 MHz
1900 MHz Up to 50 km Wide-range coverage Lowmaintenance Low power
consumption Highflexibility
Individual connections areexpensive. Moderate bit rates
China Southern Power Grid (CHN) Smart GridSmart City (AUS) Essential Energy (AUS)
GSM 14.4 kbps max. 900–1800 MHz 1–10 km Telegestore (IT)
GPRS 170 kbps max. 900–1800 MHz 1–10 km PRICE-GEN (ES) Eandis and Infrax (BE) Linky (FR)
IEEE 802.15Group
ZigBee 20–250 kbps 868 MHz/915MHz/2.4 GHz 10–1000 m Low cost Low power
consumptionLow bit rates Security issues
(specially Bluetooth)Energy Demand Research Project, EDRP (UK)
National Smart Metering Programme, NSMP (IRL)6LoWPAN
Bluetooth 721 kbps 2.4–2.4835 GHz 1–100 m
IEEE 802.11Group
Wi-Fi 54 Mbps max. 2.4 GHz/5.8 GHzUp to 100 m High degree of reliability
and availabilityAffected by surrounding
emitting devicesCMP AMI (US) National Smart Metering Programme,
NSMP (IRL)EnhancedWi-Fi 54 Mbps max. 2.4 GHz
IEEE 802.11n 600 Mbps max. 2.4 GHz
IEEE 802.16 WiMAX 70 Mbps 1.8–3.65 GHz 50 km
Good performance overlarger distances Able to
supply thousands ofend-users
Higher costs than similartechnologies Victorian Smart Meter Rollout (AUS)
Wired Data Rate Frequency Bands Distance Advantages Drawbacks Deployments/Projects
NB-PLC up to 500 kbps 3–500 kHz Several km Medium already deployedDevices do not depend on
batteries.
Power cables are a harshmedium for communications.
Most rollouts in Europe and China Telegestore (IT)Woodruff Electric Cooperative (USA) Pacific
Northwest Boulder SmartCityGrid (US) PRICE-GEN(ES) Eandis and Infrax (BE) Linky (FR) Energy
Demand Research Project, EDRP (UK)
BB-PLC Up to severalhundred of Mbps 1.8–250 MHz Several km
xDSLADSL
800 kbps upstream8 Mbps
downstream From 25 kHz to 1MHz
5 km Medium already deployedQuite high data rates
High maintenance costsEfficiency decreases with
distancePRICE-GEN (ES) Eandis and Infrax (BE)
HDSL 2 Mbps 3.6 km
VHDSL 15–100 Mbps 1.5 km
Euridis IEC 62056-31 9.6 kbps 80 MHz–1 GHz Hundreds m Low cost Knowntechnology Low data rates Wide rollout of SMs in France
PON 155–2.5 Gbps 500 MHz-km 60 kmHigh data rates Noise
immunity Goodperformance over km
High cost Boulder SmartCityGrid (US) PRICE-GEN (ES)Austin (US)
Appl. Sci. 2016, 6, 68 8 of 24
Radio Frequency (RF) technologies for Smart Metering deployments are specially spread in theUnited States. In RF technology, measurements and other data are transmitted by wireless radio fromthe SMs to a collection point. The data is then delivered to the CC for processing. The best-knowntopology is RF mesh, in which the SMs talk to each other and form a Local Access Network (LAN) cloudto a collector [8]. RF mesh has an acceptable latency and large bandwidth and generally operates atfree license bands. In addition, the self-healing characteristic of the network enables the communicationsignals to find another route via the active nodes, if any node should drop out of the network [28].However, this tends to be a proprietary offering and the terrain and long distances typical of ruralareas are a challenge for its deployment.
It is common to find RF-cellular technologies used in Smart Metering deployments in theUnited States. Their strengths are the wide coverage and low maintenance costs that they offer.In addition, cellular technology has experienced a rapid growth, resulting in better bit rates and morepotential applications.
However, individual connections are still expensive. Several U.S. carriers such as T-Mobile andVerizon have adopted 4G Long Term Evolution (LTE) since the cost of upgrading the existing 3G networkis lower [11].
Despite the fact that most European countries use wired alternatives, cellular networks, especiallyGPRS, can also be found in some deployments [29]. GPRS is an open standard technology and aneffective and reliable technology. Several trials performed in Cork (Ireland) with SMs using GPRSreported a good performance of this technology (success rate of 97.89% for first-time reads) and easydeployment [30]. However, the data rate is moderate.
Other wireless technologies such as ZigBee, 6LoWPAN, and Bluetooth are based on IEEE 802.15standard [31]. These technologies are characterized by low bit rates, low power consumption, andlow cost. ZigBee is a widely-known technology and the most used in domestic networks so far. It isconsidered a good option for Smart Metering and energy management due to its simplicity, mobility,robustness, low bandwidth requirements, and low cost of deployment [32]. However, the limited sizeof the devices that implement ZigBee restrict the battery life, the internal memory, and the processingcapabilities. On the other hand, 6LoWPAN uses the Internet Protocol (IP) over WPAN (IPv6 over LowPower Wireless Personal Area Networks). Since it is based on the same features as ZigBee, they competewith each other in the same market. The main advantage of 6LoWPAN is that it identifies every nodeby means of an IP address, which allows ubiquity, versatility, and resilience [33]. As an example,Lu et al. present in [34] both a ZigBee-based and a 6LoWPAN-based SM network architecture. Finally,Bluetooth is a low-power and short-range option, mostly used in local applications. It allows bothpoint-to-point and point-to-multi-point configurations. Despite being less used, Bluetooth technologycan be a possible option for communication of control signals and transmitting energy consumptiondata. Koay et al. proposed in [35] a Bluetooth based energy meter that can collect and transmit theenergy consumption data wirelessly to a central base station. However, this provides a lower degreeof security in comparison with other technologies [36].
Another family of standards is IEEE 802.11 (see Table 3) or Wireless Neighborhood Access Network(WNAN), also known as wireless Ethernet [37]. They are technologies with a high degree of reliabilityand availability (although lower than wired options). However, the electromagnetic interferencesaffect their data rate and the radiofrequency that they emit may influence surrounding devices.
Finally, Worldwide inter-operability for Microwave Access, WiMAX, comes from IEEE 802.16 standardfor Wireless Metropolitan Area Networks (WMAN) and is a complementary technology to IEEE 802.11standard. WiMAX is able to supply to thousands of end-users at larger distances and with better QoSsystems [36]. Some U.S. companies are proposing WiMAX for SG solutions and WiMAX has also beenused as a backhaul in a wide Smart Metering deployment in Australia [38]. However, it is still anexpensive technology.
Among the existing wired technologies for Smart Metering systems, Power Line Communication(PLC) is one of the most widespread technologies and the most used in Europe and China [39]. A great
Appl. Sci. 2016, 6, 68 9 of 24
advantage of PLC is that the communication channel is part of the electricity grid, and therefore itis already deployed. Additionally, transmitter devices do not depend on batteries since they use thepower supply directly [40]. However, as the electricity grid was not conceived for data transmission, itis a harsh medium and communications are subject to disturbances due to spurious emissions andsupra-harmonics from the devices connected to the grid (inverters, turbines, lamps, and applianceengines, among others) [36]. The PLC frequency bands differ from one region to another. In Europe,PLC is regulated by CENELEC and specifies four different bands: energy providers (standard andproprietary protocol), users (standard and proprietary protocol), users (CSMA access), and users(standard protocol) from 3 to 148.5 kHz. FCC regulates the ranges in the United States (10–490 kHz),ARIB in Japan (10–450 kHz), and EPRI in China (two bands from 3 to 500 kHz). Two main groups canbe distinguished among PLC technologies: (i) Broadband PLC (BB-PLC), which uses frequencies upto 30 MHz and enables high data rates; and (ii) Narrowband PLC (NB-PLC), which uses frequenciesup to 500 kHz and provides moderate data rates. NB-PLC is currently experiencing an expansiondue to its good performance, a consequence of adapting advanced modulation techniques such asOFDM. Although its data rates are moderate, it is sufficient for Smart Metering applications. NB-PLCis especially popular in Europe, where nearly all countries have performed at least a pilot, and awide range of deployments use this technology. Among NB-PLC standards it is worth mentioningG3, PRIME, and IEEE 1901.2. Poland and Spain have performed massive deployments using PRIMEwhile Japan, France, and Luxembourg have used G3. Both IEEE 1901.2 and G3 offer “phase detection,”a popular feature that allows the node coordinator of the network to determine on which phase asingle-phase SM is connected. Then, the utility can balance the power demand across the three phasesand improve the quality of the supply [41].
Digital Subscriber Line (DSL) is also a popular wired technology that uses the wires of the voicetelephone network. Its main advantage is that in most cases the medium is already deployed and thedata rates are quite high. Hence, some companies have chosen DSL technology for their Smart Meteringprojects, such as Stadtwerke Emden in Germany by Deutsche Telekom, where DSL is used to transmitthe consumption information from customers’ premises to the municipal utilities [42]. However, themaintenance cost of DSL is high and its efficiency decreases with distance.
It is worth mentioning Euridis, a low-cost solution, well known (it was first introduced in theearly 1990s) and with a long history of deployment (approximately 6 million SMs worldwide use thistechnology). Euridis allows simultaneous access to up to 100 SMs connected in the same bus and it isconsidered the unique existing standardized interface for Smart Metering applications over twistedpair cable. It is part of the IEC 62056-31 standard [43]. A considerable number of SMs in France areequipped with a Euridis interface [44].
Finally, the fiber optic, well known for its very high data rates and noise immunity over severalkilometers, has experienced a moderate expansion due the cost of deployment, especially if it is onlyused in the SG context. For this reason, its use in Smart Metering systems is limited to the MediumVoltage network and as a communication backbone in the transmission network by connecting DCsand CCs. Passive Optical Networks (PONs) are the most suitable option for Smart Metering, since theyuse optical splitters and one single fiber can serve several end-users.
Within the standardization process, it is worth noting the work conducted by CENELEC, whichhas developed more than 60 standards and has 40 more underway. Additionally, CENELEC has joinedforces with CEN and ETSI (European Telecommunications Standards Institute), coming into the SmartMeters Coordination Group (SM-CG). In North America, it is worth mentioning the work developed byANSI (American National Standards Institute) and NIST (National Institute of Standards and Technology),as well as IEC (International Electrotechnical Commission), IEEE (Institute of Electrical and ElectronicsEngineers), and ISO (International Organization for Standardization) on an international level.
Appl. Sci. 2016, 6, 68 10 of 24
4. Development of Smart Metering Worldwide
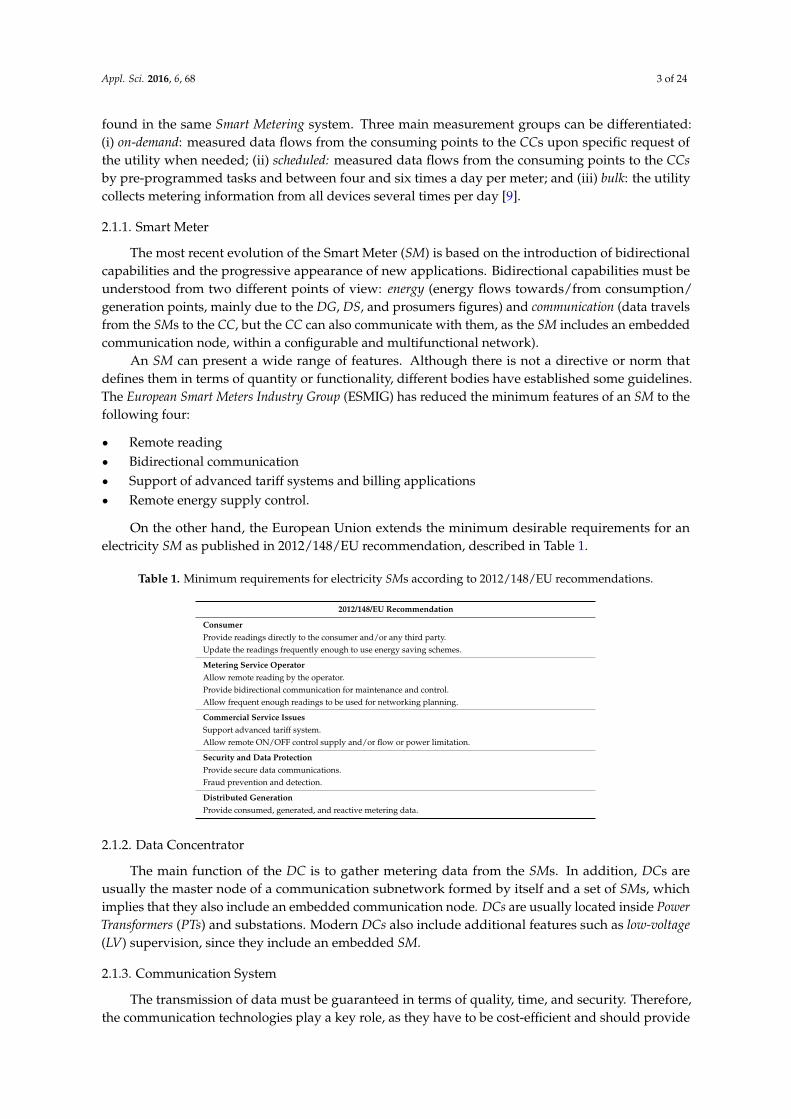
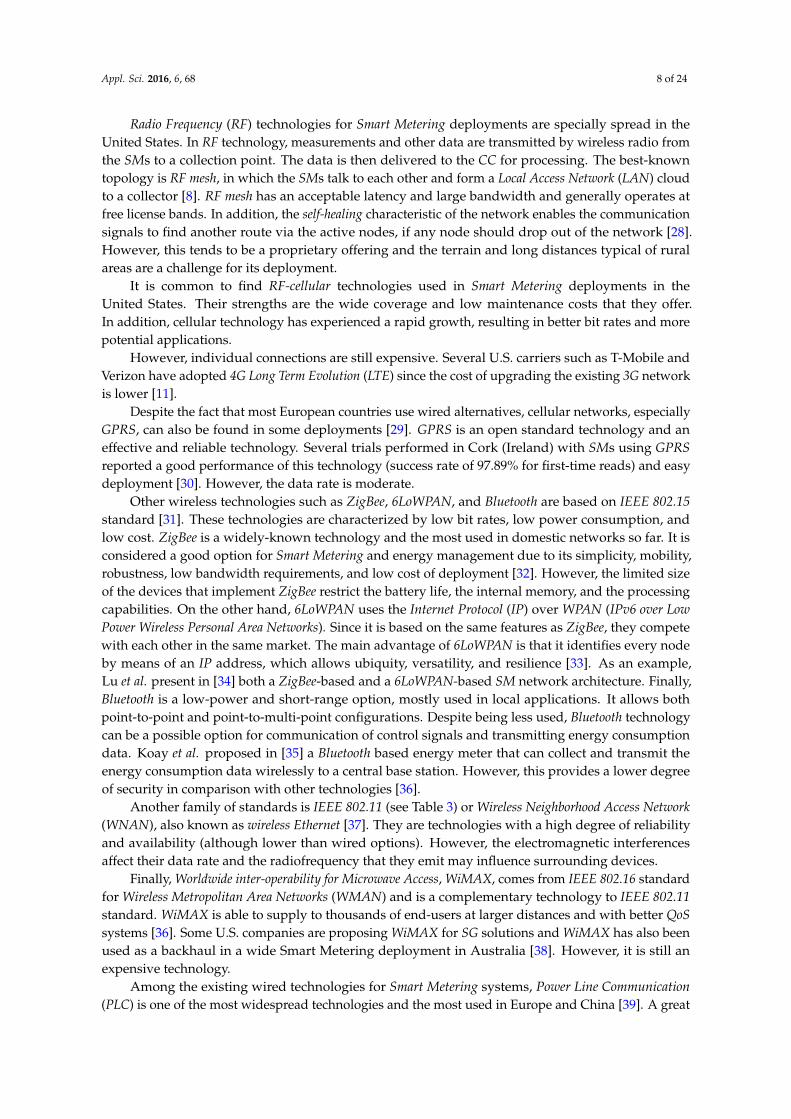
The deployment of SMs is on the rise worldwide: around 1000 million SMs are expected to beinstalled worldwide by 2022 [45]. Figure 3 represents the evolution of SM deployment worldwidefrom present to 2023. As discussed in Section 4, there is a wide range of available technologies and themost suitable one depends on a number of factors.
Appl. Sci. 2016, 6, 68 11 of 25
Figure 3. Evolution of SM deployment worldwide (Source: Navigant Research [45]). Reprinted with
the permission of Navigant Research, “Smart Electric Meters, Advanced Metering Infrastructure, and
Meter Communications: Global Market Analysis and Forecasts” published by Navigant Research, 2014.
The architecture of the electricity system highly influences the adopted approach for a
Smart Metering solution. Hence, the topology of the network defines the topology of the
Smart Metering system and may determine the equipment and the technology to be used. For
example, while in the United States a single transformer serves a few end‐users, in Europe it can
easily reach several hundred. Then, PLC technology is more profitable in Europe than in the United
States, where wireless solutions are more desirable. The drivers of the deployments also vary. While
in some regions, especially in Europe, SG and Smart Metering projects have been driven by
governmental initiatives, funding, or mandates, other regions seek to improve the efficiency of the
energy supply system and eliminate electricity theft, as with emerging countries [46,47].
Additionally, it is worth mentioning the differences in development approaches. For instance, in the
U.S. the goal is the security and stability of the electricity network, with a clear objective towards
self‐healing. By contrast, in European countries the trend is towards reduction of greenhouse gases
and the promotion of DG, DS, and RES [48]. In addition, the regulation of public band frequencies
use in the U.S. is more flexible than in Europe, which has reinforced wireless options in the U.S.
Australia, Canada, and Japan have also largely adopted wireless Smart Metering solutions, while
China relies on either PLC or BPL. In Europe, the strict regulation of public and unlicensed bands
initially encouraged early adoption of PLC solutions. Despite recent concerns about PLC reliability,
which have prompted European consideration of wireless options, NB‐PLC technology is still the
most widespread technology for Smart Metering systems in Europe with a wide range of existing pilot
projects and massive deployments [41,46]. The early adoption of PLC‐enabled SMs in Italy, Spain,
and China has given this technology its current momentum. Meanwhile, cellular connectivity is
witnessing a growing adoption, especially in cases where meter implementations are dispersed. It is
also gaining wider acceptance as a feasible, primary connectivity technology, with subscription costs
decreasing and utilities becoming more open to using public networks for their SM deployments [49].
There are also differences in the application approach of the Smart Metering systems. Among the
European member states, the technical design of Smart Metering systems varies from one country to
another. Generally, there is a common understanding of what capabilities a SM should have but often
a subset of these capabilities is chosen for their rollout. A recent report from the CEER (Council of
European Energy Regulators) groups the most common functionalities of the Smart Metering system
developed by European countries into five main categories: injected and consumed energy; energy
interruptions; exceptional energy consumption; connection to open gateway; and possibility of
software update [50]. In general, countries are more likely to have remote upgrade and the
measurement of injected and consumed electricity than they are to have interruption alerts,
exceptional usage alarms, or an open gateway for access and control of consumption. Apart from
that, according to a recent survey from the FERC (Federal Energy Regulatory Commission), the uses of
Figure 3. Evolution of SM deployment worldwide (Source: Navigant Research [45]). Reprinted withthe permission of Navigant Research, “Smart Electric Meters, Advanced Metering Infrastructure, andMeter Communications: Global Market Analysis and Forecasts” published by Navigant Research, 2014.
The architecture of the electricity system highly influences the adopted approach for aSmart Metering solution. Hence, the topology of the network defines the topology of the Smart Meteringsystem and may determine the equipment and the technology to be used. For example, while in theUnited States a single transformer serves a few end-users, in Europe it can easily reach several hundred.Then, PLC technology is more profitable in Europe than in the United States, where wireless solutionsare more desirable. The drivers of the deployments also vary. While in some regions, especially inEurope, SG and Smart Metering projects have been driven by governmental initiatives, funding, ormandates, other regions seek to improve the efficiency of the energy supply system and eliminateelectricity theft, as with emerging countries [46,47]. Additionally, it is worth mentioning the differencesin development approaches. For instance, in the U.S. the goal is the security and stability of theelectricity network, with a clear objective towards self-healing. By contrast, in European countries thetrend is towards reduction of greenhouse gases and the promotion of DG, DS, and RES [48]. In addition,the regulation of public band frequencies use in the U.S. is more flexible than in Europe, which hasreinforced wireless options in the U.S. Australia, Canada, and Japan have also largely adopted wirelessSmart Metering solutions, while China relies on either PLC or BPL. In Europe, the strict regulation ofpublic and unlicensed bands initially encouraged early adoption of PLC solutions. Despite recentconcerns about PLC reliability, which have prompted European consideration of wireless options,NB-PLC technology is still the most widespread technology for Smart Metering systems in Europewith a wide range of existing pilot projects and massive deployments [41,46]. The early adoptionof PLC-enabled SMs in Italy, Spain, and China has given this technology its current momentum.Meanwhile, cellular connectivity is witnessing a growing adoption, especially in cases where meterimplementations are dispersed. It is also gaining wider acceptance as a feasible, primary connectivitytechnology, with subscription costs decreasing and utilities becoming more open to using publicnetworks for their SM deployments [49].
There are also differences in the application approach of the Smart Metering systems. Among theEuropean member states, the technical design of Smart Metering systems varies from one country toanother. Generally, there is a common understanding of what capabilities a SM should have but often asubset of these capabilities is chosen for their rollout. A recent report from the CEER (Council of European
Appl. Sci. 2016, 6, 68 11 of 24
Energy Regulators) groups the most common functionalities of the Smart Metering system developed byEuropean countries into five main categories: injected and consumed energy; energy interruptions;exceptional energy consumption; connection to open gateway; and possibility of software update [50].In general, countries are more likely to have remote upgrade and the measurement of injected andconsumed electricity than they are to have interruption alerts, exceptional usage alarms, or an opengateway for access and control of consumption. Apart from that, according to a recent survey fromthe FERC (Federal Energy Regulatory Commission), the uses of Smart Metering in the U.S. are morenumerous: enhanced customer service; outage detection; theft detection and other line losses; outagerestoration; remote connection/disconnection; power quality; asset management; outage mapping;load forecasting; remote change metering parameters; remotely upgraded firmware; price-responsivedemand response; interface pre-pay; pricing/event notification; and HAN applications [17]. Enhancedcustomer service is the most commonly used service and there is an increased use of newer types ofadvanced metering functionality, especially the use of advanced metering to perform remote outagemanagement and to remotely upgrade firmware on the advanced meters. The report also highlightsthe significant increase of Smart Metering penetration from 2006 in the United States.
The following subsections describe the aforementioned features by countries in the mostremarkable projects and deployments worldwide.
4.1. Europe
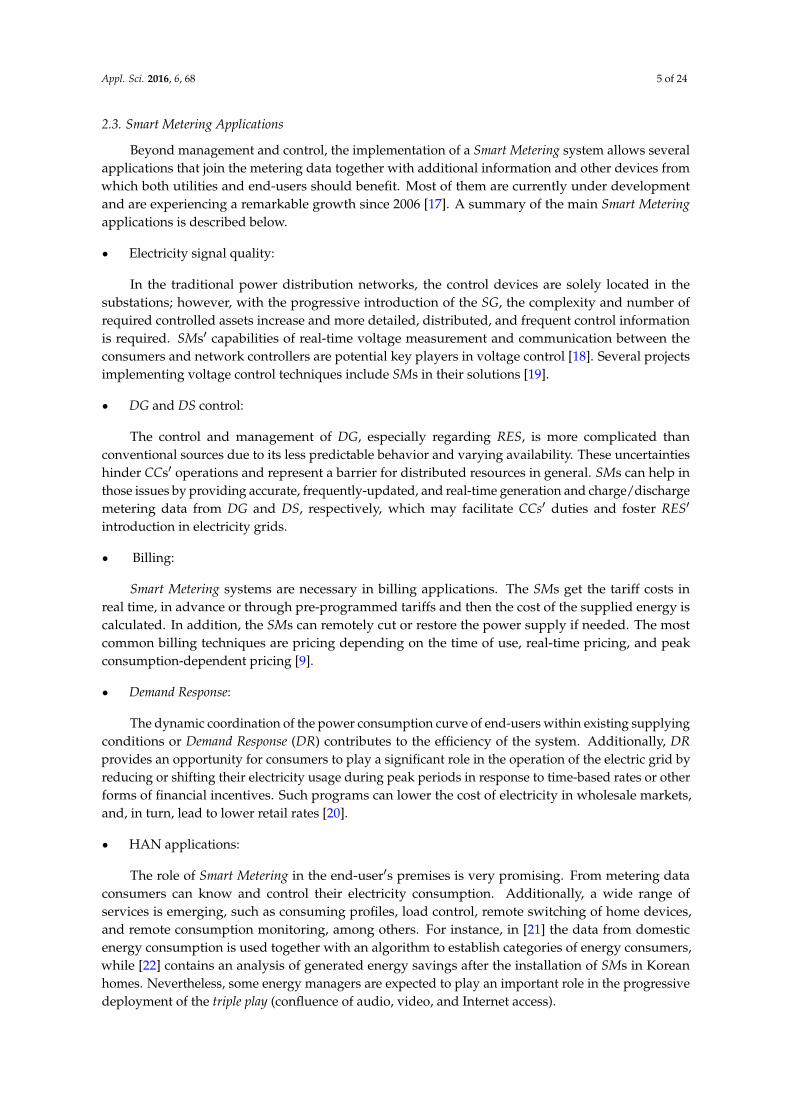
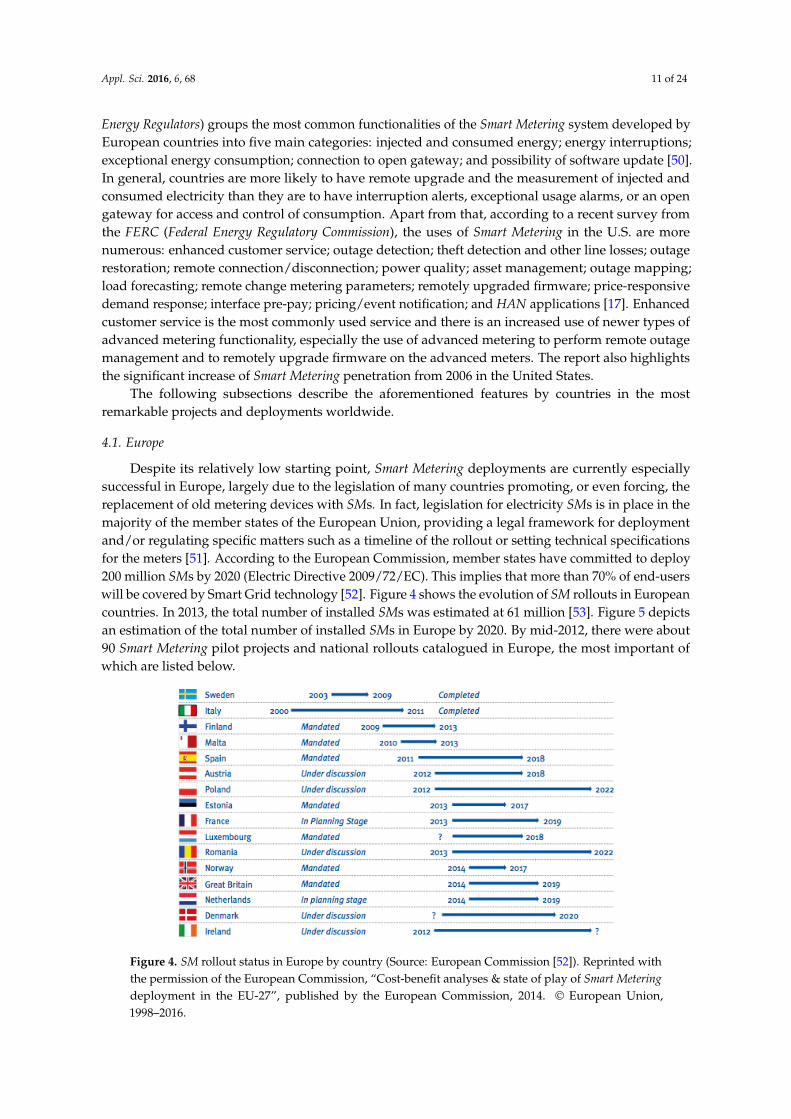
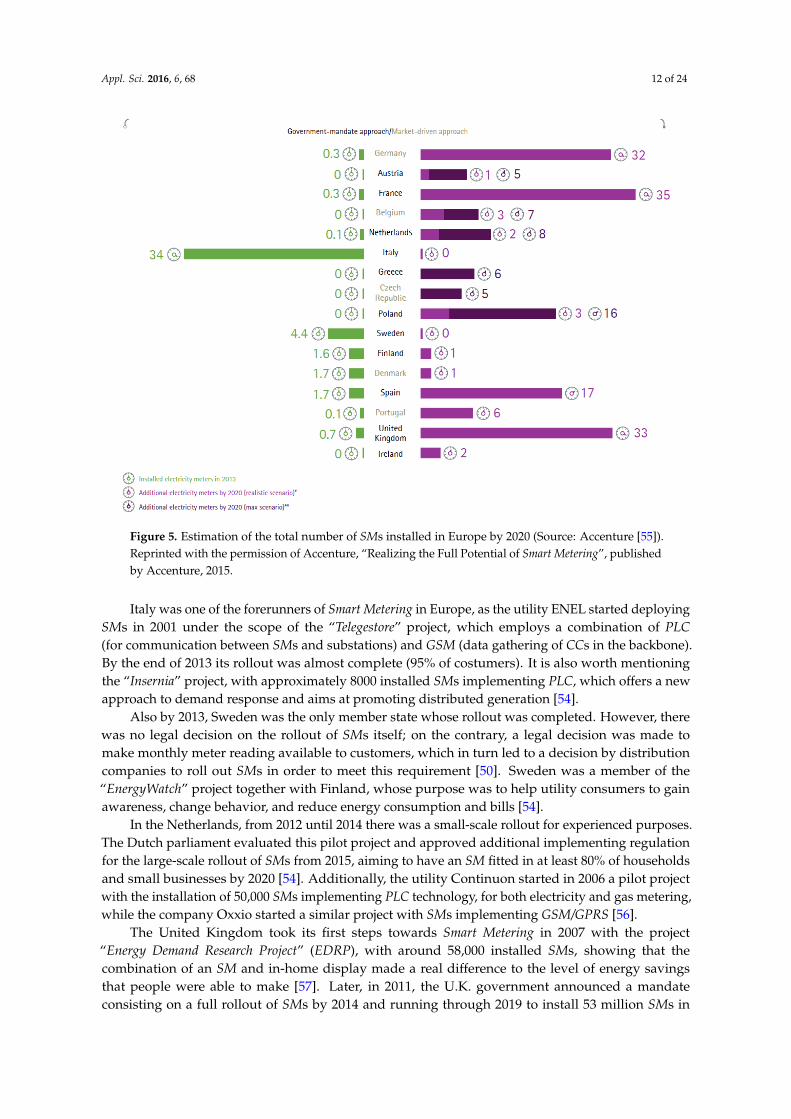
Despite its relatively low starting point, Smart Metering deployments are currently especiallysuccessful in Europe, largely due to the legislation of many countries promoting, or even forcing, thereplacement of old metering devices with SMs. In fact, legislation for electricity SMs is in place in themajority of the member states of the European Union, providing a legal framework for deploymentand/or regulating specific matters such as a timeline of the rollout or setting technical specificationsfor the meters [51]. According to the European Commission, member states have committed to deploy200 million SMs by 2020 (Electric Directive 2009/72/EC). This implies that more than 70% of end-userswill be covered by Smart Grid technology [52]. Figure 4 shows the evolution of SM rollouts in Europeancountries. In 2013, the total number of installed SMs was estimated at 61 million [53]. Figure 5 depictsan estimation of the total number of installed SMs in Europe by 2020. By mid-2012, there were about90 Smart Metering pilot projects and national rollouts catalogued in Europe, the most important ofwhich are listed below.
Appl. Sci. 2016, 6, 68 12 of 25
Smart Metering in the U.S. are more numerous: enhanced customer service; outage detection; theft
detection and other line losses; outage restoration; remote connection/disconnection; power quality;
asset management; outage mapping; load forecasting; remote change metering parameters; remotely
upgraded firmware; price‐responsive demand response; interface pre‐pay; pricing/event notification;
and HAN applications [17]. Enhanced customer service is the most commonly used service and there
is an increased use of newer types of advanced metering functionality, especially the use of advanced
metering to perform remote outage management and to remotely upgrade firmware on the advanced
meters. The report also highlights the significant increase of Smart Metering penetration from 2006 in
the United States.
The following subsections describe the aforementioned features by countries in the most
remarkable projects and deployments worldwide.
4.1. Europe
Despite its relatively low starting point, Smart Metering deployments are currently especially
successful in Europe, largely due to the legislation of many countries promoting, or even forcing, the
replacement of old metering devices with SMs. In fact, legislation for electricity SMs is in place in the
majority of the member states of the European Union, providing a legal framework for deployment
and/or regulating specific matters such as a timeline of the rollout or setting technical specifications
for the meters [51]. According to the European Commission, member states have committed to
deploy 200 million SMs by 2020 (Electric Directive 2009/72/EC). This implies that more than 70% of
end‐users will be covered by Smart Grid technology [52]. Figure 4 shows the evolution of SM rollouts
in European countries. In 2013, the total number of installed SMs was estimated at 61 million [53].
Figure 5 depicts an estimation of the total number of installed SMs in Europe by 2020. By mid‐2012,
there were about 90 Smart Metering pilot projects and national rollouts catalogued in Europe, the most
important of which are listed below.
Italy was one of the forerunners of Smart Metering in Europe, as the utility ENEL started
deploying SMs in 2001 under the scope of the “Telegestore” project, which employs a combination of
PLC (for communication between SMs and substations) and GSM (data gathering of CCs in the
backbone). By the end of 2013 its rollout was almost complete (95% of costumers). It is also worth
mentioning the “Insernia” project, with approximately 8000 installed SMs implementing PLC, which
offers a new approach to demand response and aims at promoting distributed generation [54].
Figure 4. SM rollout status in Europe by country (Source: European Commission [52]). Reprinted with
the permission of the European Commission, “Cost‐benefit analyses & state of play of
Smart Metering deployment in the EU‐27”, published by the European Commission, 2014. © European
Union, 1998–2016.
Figure 4. SM rollout status in Europe by country (Source: European Commission [52]). Reprinted withthe permission of the European Commission, “Cost-benefit analyses & state of play of Smart Meteringdeployment in the EU-27”, published by the European Commission, 2014. © European Union,1998–2016.
Appl. Sci. 2016, 6, 68 12 of 24
Appl. Sci. 2016, 6, 68 13 of 25
Figure 5. Estimation of the total number of SMs installed in Europe by 2020 (Source: Accenture [55]).
Reprinted with the permission of Accenture, “Realizing the Full Potential of Smart Metering”,
published by Accenture, 2015.
Also by 2013, Sweden was the only member state whose rollout was completed. However, there
was no legal decision on the rollout of SMs itself; on the contrary, a legal decision was made to make
monthly meter reading available to customers, which in turn led to a decision by distribution
companies to roll out SMs in order to meet this requirement [50]. Sweden was a member of the
“EnergyWatch” project together with Finland, whose purpose was to help utility consumers to gain
awareness, change behavior, and reduce energy consumption and bills [54].
In the Netherlands, from 2012 until 2014 there was a small‐scale rollout for experienced
purposes. The Dutch parliament evaluated this pilot project and approved additional implementing
regulation for the large‐scale rollout of SMs from 2015, aiming to have an SM fitted in at least 80% of
households and small businesses by 2020 [54]. Additionally, the utility Continuon started in 2006 a
pilot project with the installation of 50,000 SMs implementing PLC technology, for both electricity
and gas metering, while the company Oxxio started a similar project with SMs implementing
GSM/GPRS [56].
The United Kingdom took its first steps towards Smart Metering in 2007 with the project “Energy
Demand Research Project” (EDRP), with around 58,000 installed SMs, showing that the combination of
an SM and in‐home display made a real difference to the level of energy savings that people were
able to make [57]. Later, in 2011, the U.K. government announced a mandate consisting on a full
rollout of SMs by 2014 and running through 2019 to install 53 million SMs in 30 million homes and
businesses. However, in 2013 the government announced that the SM rollout phase would be delayed
until 2015 since the communication infrastructure needed further trial and testing [46].
France started a pilot smart meter program for a widespread deployment of 35 million SMs by
2020 [54]. The “Linky” project, led by ERDF, which employs around 250,000 SMs and 4600 DCs, aimed
at improving knowledge of residential consumption through the combined effects of an appropriate
customer panel and a modeling method adapted to more frequent reading of consumer indices [58].
Spain has also participated in the wide deployment of SMs: almost 2 million SMs by 2013 and a
rollout of 100% by 2018, in compliance with a Royal Decree in 2007. A group of Spanish utility
Figure 5. Estimation of the total number of SMs installed in Europe by 2020 (Source: Accenture [55]).Reprinted with the permission of Accenture, “Realizing the Full Potential of Smart Metering”, publishedby Accenture, 2015.
Italy was one of the forerunners of Smart Metering in Europe, as the utility ENEL started deployingSMs in 2001 under the scope of the “Telegestore” project, which employs a combination of PLC(for communication between SMs and substations) and GSM (data gathering of CCs in the backbone).By the end of 2013 its rollout was almost complete (95% of costumers). It is also worth mentioningthe “Insernia” project, with approximately 8000 installed SMs implementing PLC, which offers a newapproach to demand response and aims at promoting distributed generation [54].
Also by 2013, Sweden was the only member state whose rollout was completed. However, therewas no legal decision on the rollout of SMs itself; on the contrary, a legal decision was made tomake monthly meter reading available to customers, which in turn led to a decision by distributioncompanies to roll out SMs in order to meet this requirement [50]. Sweden was a member of the“EnergyWatch” project together with Finland, whose purpose was to help utility consumers to gainawareness, change behavior, and reduce energy consumption and bills [54].
In the Netherlands, from 2012 until 2014 there was a small-scale rollout for experienced purposes.The Dutch parliament evaluated this pilot project and approved additional implementing regulationfor the large-scale rollout of SMs from 2015, aiming to have an SM fitted in at least 80% of householdsand small businesses by 2020 [54]. Additionally, the utility Continuon started in 2006 a pilot projectwith the installation of 50,000 SMs implementing PLC technology, for both electricity and gas metering,while the company Oxxio started a similar project with SMs implementing GSM/GPRS [56].
The United Kingdom took its first steps towards Smart Metering in 2007 with the project“Energy Demand Research Project” (EDRP), with around 58,000 installed SMs, showing that thecombination of an SM and in-home display made a real difference to the level of energy savingsthat people were able to make [57]. Later, in 2011, the U.K. government announced a mandateconsisting on a full rollout of SMs by 2014 and running through 2019 to install 53 million SMs in
Appl. Sci. 2016, 6, 68 13 of 24
30 million homes and businesses. However, in 2013 the government announced that the SM rolloutphase would be delayed until 2015 since the communication infrastructure needed further trial andtesting [46].
France started a pilot smart meter program for a widespread deployment of 35 million SMs by2020 [54]. The “Linky” project, led by ERDF, which employs around 250,000 SMs and 4600 DCs, aimedat improving knowledge of residential consumption through the combined effects of an appropriatecustomer panel and a modeling method adapted to more frequent reading of consumer indices [58].
Spain has also participated in the wide deployment of SMs: almost 2 million SMs by 2013 anda rollout of 100% by 2018, in compliance with a Royal Decree in 2007. A group of Spanish utilitycompanies formed the “Spanish Utility Consortium” to establish the foundation of Spain’s SMs rolloutproject in 2009 [59]. Two main technologies are present in the rollout: PRIME and Meters and More.While PRIME only can perform over power lines, Meters and More is able to work on power lines,public communication networks, and local optical links.
Although in Germany the installation of SMs has been mandatory after major renovations and innew buildings since 2010, there has not yet been an explicit commitment made to a national rollout.In fact, the rollout to existing homes (up to 500,000 SMs by mid-2012) has remained in a pilot phase.After a report of the Federal Ministry of Economics indicating the lack of economic benefits of a fullrollout of SMs for German consumers, Germany has delayed it until at least 2020 [60]. To date, muchof the focus has been on pilot projects and small-scale trials, of which five major projects were stillongoing in 2014 [54].
By 2014 Finnish utilities had completed their SM rollouts, covering 98% of all consumers, whonow have access to their hourly consumption data through utility online information. In addition,utilities and other market players have introduced further new Smart Metering-based services andproducts, such as in-home displays, real-time feedback systems, demand response, and smart homeproducts [54].
4.2. America
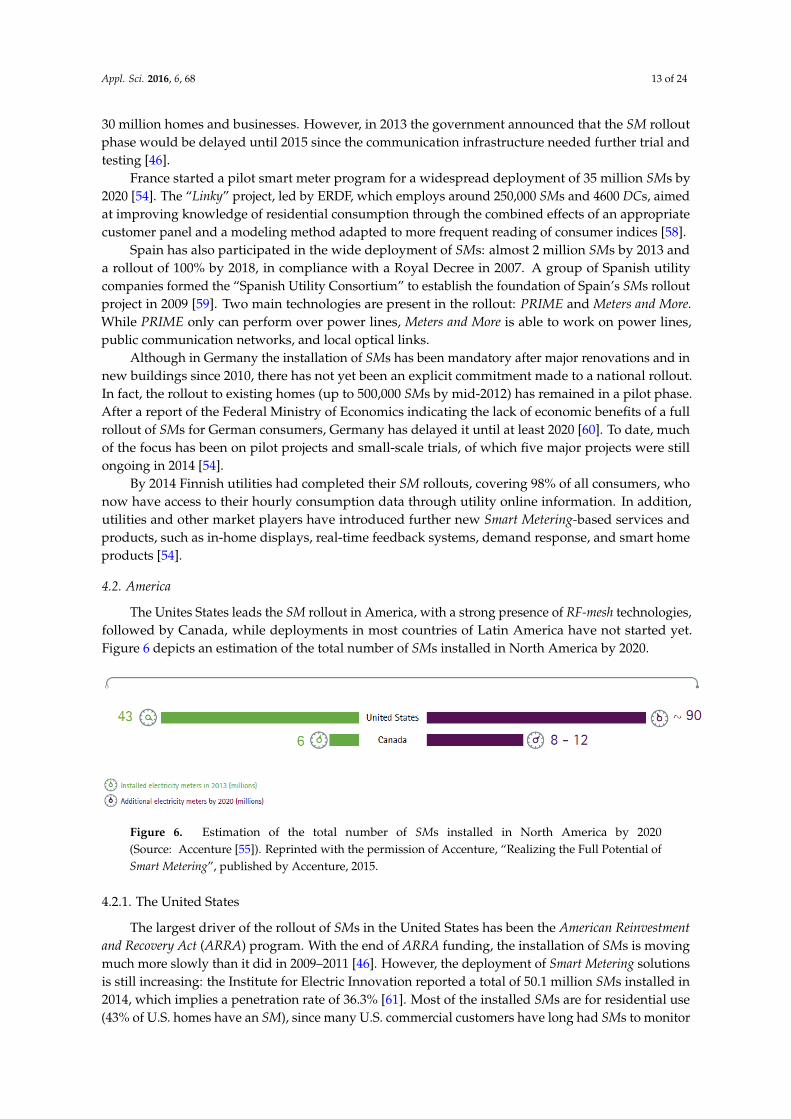
The Unites States leads the SM rollout in America, with a strong presence of RF-mesh technologies,followed by Canada, while deployments in most countries of Latin America have not started yet.Figure 6 depicts an estimation of the total number of SMs installed in North America by 2020.
Appl. Sci. 2016, 6, 68 14 of 25
companies formed the “Spanish Utility Consortium” to establish the foundation of Spain’s SMs
rollout project in 2009 [59]. Two main technologies are present in the rollout: PRIME and Meters and
More. While PRIME only can perform over power lines, Meters and More is able to work on power
lines, public communication networks, and local optical links.
Although in Germany the installation of SMs has been mandatory after major renovations and
in new buildings since 2010, there has not yet been an explicit commitment made to a national rollout.
In fact, the rollout to existing homes (up to 500,000 SMs by mid‐2012) has remained in a pilot phase.
After a report of the Federal Ministry of Economics indicating the lack of economic benefits of a full
rollout of SMs for German consumers, Germany has delayed it until at least 2020 [60]. To date, much
of the focus has been on pilot projects and small‐scale trials, of which five major projects were still
ongoing in 2014 [54].
By 2014 Finnish utilities had completed their SM rollouts, covering 98% of all consumers, who
now have access to their hourly consumption data through utility online information. In addition,
utilities and other market players have introduced further new Smart Metering‐based services and
products, such as in‐home displays, real‐time feedback systems, demand response, and smart home
products [54].
4.2. America
The Unites States leads the SM rollout in America, with a strong presence of RF‐mesh
technologies, followed by Canada, while deployments in most countries of Latin America have not
started yet. Figure 6 depicts an estimation of the total number of SMs installed in North America by 2020.
Figure 6. Estimation of the total number of SMs installed in North America by 2020 (Source:
Accenture [55]). Reprinted with the permission of Accenture, “Realizing the Full Potential of
Smart Metering”, published by Accenture, 2015.
4.2.1. The United States
The largest driver of the rollout of SMs in the United States has been the American Reinvestment
and Recovery Act (ARRA) program. With the end of ARRA funding, the installation of SMs is moving
much more slowly than it did in 2009–2011 [46]. However, the deployment of Smart Metering
solutions is still increasing: the Institute for Electric Innovation reported a total of 50.1 million SMs
installed in 2014, which implies a penetration rate of 36.3% [61]. Most of the installed SMs are for
residential use (43% of U.S. homes have an SM), since many U.S. commercial customers have long
had SMs to monitor facility electricity usage more accurately. Applied technologies vary from 2G and
3G for end‐users and BB‐PLC for HANs. The evolution of installed SMs in the last five years can be
seen in Figure 7.
Figure 6. Estimation of the total number of SMs installed in North America by 2020(Source: Accenture [55]). Reprinted with the permission of Accenture, “Realizing the Full Potential ofSmart Metering”, published by Accenture, 2015.
4.2.1. The United States
The largest driver of the rollout of SMs in the United States has been the American Reinvestmentand Recovery Act (ARRA) program. With the end of ARRA funding, the installation of SMs is movingmuch more slowly than it did in 2009–2011 [46]. However, the deployment of Smart Metering solutionsis still increasing: the Institute for Electric Innovation reported a total of 50.1 million SMs installed in2014, which implies a penetration rate of 36.3% [61]. Most of the installed SMs are for residential use(43% of U.S. homes have an SM), since many U.S. commercial customers have long had SMs to monitor

Appl. Sci. 2016, 6, 68 14 of 24
facility electricity usage more accurately. Applied technologies vary from 2G and 3G for end-users andBB-PLC for HANs. The evolution of installed SMs in the last five years can be seen in Figure 7.Appl. Sci. 2016, 6, 68 15 of 25
Figure 7. Evolution of SMs installed in recent years in the U.S. [62]. Reproduced with the permission
of A. Cooper, “Utility‐Scale Smart Meter Deployments: Building Block of the Evolving Power Grid”;
published by Edison Foundation, 2014.
By 2014, more than 43 million out of the 50.1 million SMs were installed by investor‐owned
utilities, while almost 7 million were installed by municipal and cooperative‐owned utilities. Among
the Smart Metering systems performed by investor‐owned utilities, 16 of them deployed more than
1 million SMs, according to a report published by the Institute for Electric Innovation [62]. The largest
deployment was performed by Pacific Gas & Electric utility, with 5.14 million SMs equipped with RF
mesh technology in 2013 as part of its SmartMeter Project. The main objectives of the deployment are:
(i) customer service (customers with SMs can participate in a voluntary critical peak pricing rate plan
that will help manage system load during hot summer days and receive notifications of when they
are moving into higher‐priced electricity tiers); (ii) demand response, focusing on energy efficiency
and renewable energies; and (iii) setting a platform for future innovative solutions such as HAN
services and EV appliances [63]. According to the project development report, the most challenging
issue has been the coordination and integration with other enterprise initiatives that are part of the
project [64]. Another large deployment started in 2007 and finished in 2012, consisting of almost 5
million installed SMs equipped with ZigBee, was performed in California under the SmartConnect
program by the Southern California Edison utility. At present, the project offers different tariff rates
to consumers. Several appliances and services such as energy storage, distributed control, and
artificial intelligence are currently being developed and are expected to be ready by 2020. Specifically,
the key roles of SMs in this project are: (i) enabling customers to actively participate in grid
operations; (ii) allowing maximum access by third parties to the electric grid; (iii) promoting demand
response, energy efficiency, and DG and DS into energy markets; and (iv) lowering the carbon
footprint of the electric distribution system. The project reported some disgruntled responses from
customers regarding remote supply disconnections and magnetic radiation emissions from SMs [65].
Two more SM deployments are over and above the 4 million installed SMs: the Florida Power and
Light Company installed 4.6 million RF mesh‐based SMs as part of its Smart Meter program to
residential consumers in 2014. In addition to providing several services (such as monitoring their
energy use by hour, day, and month as well as the energy they delivered to and received from the
company) and reliable supply to customers, FPL plans involve the prediction and prevention of
outages through the SMs and the deployment of monitors, sensors, and controls on their transmission
and distribution grid [66]. On the other hand, the Southern Company utility installed 4.2 million SMs
equipped with RF mesh technology in 2014. The objective of the deployment integrates advanced
metering, communications, and other appliances to provide customer service at reduced operating
costs [62]. Other remarkable deployments are: Oncor utility with 3.3 million installed RF‐based SMs
Figure 7. Evolution of SMs installed in recent years in the U.S. [62]. Reproduced with the permissionof A. Cooper, “Utility-Scale Smart Meter Deployments: Building Block of the Evolving Power Grid”;published by Edison Foundation, 2014.
By 2014, more than 43 million out of the 50.1 million SMs were installed by investor-ownedutilities, while almost 7 million were installed by municipal and cooperative-owned utilities. Amongthe Smart Metering systems performed by investor-owned utilities, 16 of them deployed more than1 million SMs, according to a report published by the Institute for Electric Innovation [62]. The largestdeployment was performed by Pacific Gas & Electric utility, with 5.14 million SMs equipped with RFmesh technology in 2013 as part of its SmartMeter Project. The main objectives of the deployment are:(i) customer service (customers with SMs can participate in a voluntary critical peak pricing rate planthat will help manage system load during hot summer days and receive notifications of when they aremoving into higher-priced electricity tiers); (ii) demand response, focusing on energy efficiency andrenewable energies; and (iii) setting a platform for future innovative solutions such as HAN servicesand EV appliances [63]. According to the project development report, the most challenging issue hasbeen the coordination and integration with other enterprise initiatives that are part of the project [64].Another large deployment started in 2007 and finished in 2012, consisting of almost 5 million installedSMs equipped with ZigBee, was performed in California under the SmartConnect program by theSouthern California Edison utility. At present, the project offers different tariff rates to consumers.Several appliances and services such as energy storage, distributed control, and artificial intelligenceare currently being developed and are expected to be ready by 2020. Specifically, the key roles of SMs inthis project are: (i) enabling customers to actively participate in grid operations; (ii) allowing maximumaccess by third parties to the electric grid; (iii) promoting demand response, energy efficiency, andDG and DS into energy markets; and (iv) lowering the carbon footprint of the electric distributionsystem. The project reported some disgruntled responses from customers regarding remote supplydisconnections and magnetic radiation emissions from SMs [65]. Two more SM deployments are overand above the 4 million installed SMs: the Florida Power and Light Company installed 4.6 million RFmesh-based SMs as part of its Smart Meter program to residential consumers in 2014. In addition toproviding several services (such as monitoring their energy use by hour, day, and month as well as theenergy they delivered to and received from the company) and reliable supply to customers, FPL plansinvolve the prediction and prevention of outages through the SMs and the deployment of monitors,sensors, and controls on their transmission and distribution grid [66]. On the other hand, the Southern
Appl. Sci. 2016, 6, 68 15 of 24
Company utility installed 4.2 million SMs equipped with RF mesh technology in 2014. The objectiveof the deployment integrates advanced metering, communications, and other appliances to providecustomer service at reduced operating costs [62]. Other remarkable deployments are: Oncor utilitywith 3.3 million installed RF-based SMs and focused on customer services, power quality monitoring,reliability, and outage prevention [67]; and CenterPoint Energy utility, with 2.2 million RF-based SMsin 2012, with the aim of improving customer service and remote connections/disconnections andenhancing system reliability [68]. Additional Smart Metering deployments in the U.S. are discussedin [62].
U.S. utilities are now focused on integrating and optimizing information gathered by SMs toprovide benefits and new capabilities to customers and system operators. Four main areas can bedistinguished [62]:
‚ Systems integration: the introduction of outage and distribution management systems providesenhanced outage management and restoration services as well as improved distribution systemand device monitoring.
‚ Integration of new resources: SMs position the grid as platform for the integration of distributedenergy resources (DG, DS, EVs, microgrids, etc.).
‚ Operational savings: remote activities (reading, connection/disconnection) and the reduction ofenergy theft are some financial benefits of SMs.
‚ New customer services: SMs have enabled services to end-users such as automated budgetassistance and bill management tools, energy use notifications, smart pricing, and demandresponse programs.
4.2.2. Canada
In contrast to other countries, whose Smart Metering initiatives have been highly promoted bygovernments and laws, in Canada they have also been driven by necessity: there are vast distances andhostile terrains separating power resources from consumers. In fact, Canada’s SG technology is moreadvanced than that of most other nations [25]. As of June 2014 there were more than 6 million installedSMs and it is expected that two thirds of Canadian households will be equipped with SMs by 2016 [69].Several provinces (Ontario, British Columbia, Saskatchewan, and Quebec) have already implementedor intend to implement a SM rollout [46]. To date, the Ontario Smart Metering initiative has beenidentified as one of the most successful deployments of Canada, with almost 4.5 million installed SMs.Initial SM testing involved GSM technology. Then, the utility decided to use radio mesh technology formost customers. The utility also deployed a ZigBee HAN within the SMs to communicate consumptiondata to market daily; however, they do not have remote connection and disconnection capability [38].Along with SMs, the government introduced mandatory time-of-use pricing, making Ontario thelargest electricity market in the world with mandated time-of-use rates and pilot programs at the startof the implementation showing peak savings of around 5%–8% [70]. However, a recent audit outlinessome weaknesses of the deployment such as: (i) lack of cost-benefit study to support the deployment(as done in other provinces and also in Germany, Australia, and the U.K.); (ii) up to 73 distributedcompanies were in charge of the deployment, with the subsequent difficulty of ensuring a cost-effectiveimplementation of Smart Metering. This situation also led to varied electricity billing amounts; (iii) thetime-of-use pricing model has not had the expected impact on reducing peak demand since targetsset by the Ministry of Energy have not been met; and (iv) complaints regarding time-of-use rates andbilling errors have been reported [71].
Full rollouts of SMs are also taking place in British Columbia and Quebec. In 2011 BC Hydroinitiated the Smart Metering Program in British Columbia as a first step towards modernizing BC’selectricity grid, with approximately 1.8 million SMs equipped with RF technology installed in 2012.According to the utility, the SM deployment will detect and reduce energy theft, with subsequentenergy savings, and will also enhance power outage control and provide new customer applicationssuch as lower rates and customer money-saving tools [72]. On the other hand, Hydro-Quebec has
Appl. Sci. 2016, 6, 68 16 of 24
already installed more than 2.7 million RF-based SMs and continues the rollout throughout Quebec,with an expected total number of 3.8 million SMs by 2017 [73]. The Canadian experience provides agreat benchmark from which to learn, as it has already implemented SMs and time-of-use rates formillions of customers [70].
4.2.3. Latin America
The deployment of Smart Metering solutions in Latin America is still poor. Brazil and Mexico arecurrently the first potential markets and Argentina and Chile are also firm candidates for introducingSmart Metering solutions in the coming years [45].
The energy regulator in Brazil, ANEEL, replaced its ambitious goal of replacing all electricitymeters with SMs in 2009 with a revised target of replacing 63 million by 2021 [74]. In 2012, ANEELscaled down the Smart Metering rollout, making SMs mandatory only for new customers starting in2014 and optional for existing consumers [46]. According to Brazilian utility companies, 4.5 millionSMs are expected to be installed by 2017. The approach of Brazilian Smart Metering deployments is tohelp reduce fraud, electricity theft, and inefficiency, as occurs in other emerging countries, which costthe country close to $4 billion per year [47].
Mexico is the second-largest potential market for SMs in Latin America after Brazil, and isexpected to have 21 million SMs installed by 2020 [74]. Many SG and Smart Metering pilot programs inMexico are being boosted in an effort to respond to high rates of electricity theft, power outages, andpoor energy infrastructure [46].
4.3. Asia-Pacific
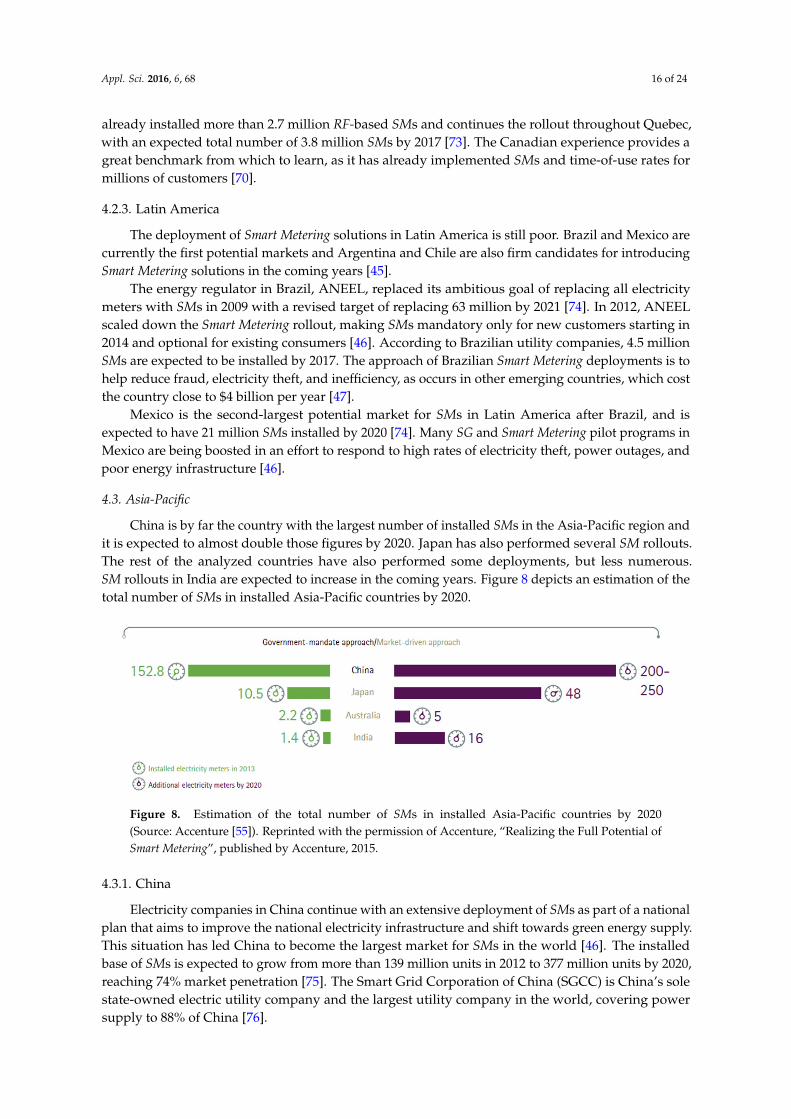
China is by far the country with the largest number of installed SMs in the Asia-Pacific region andit is expected to almost double those figures by 2020. Japan has also performed several SM rollouts.The rest of the analyzed countries have also performed some deployments, but less numerous.SM rollouts in India are expected to increase in the coming years. Figure 8 depicts an estimation of thetotal number of SMs in installed Asia-Pacific countries by 2020.
Appl. Sci. 2016, 6, 68 17 of 25
The deployment of Smart Metering solutions in Latin America is still poor. Brazil and Mexico are
currently the first potential markets and Argentina and Chile are also firm candidates for introducing
Smart Metering solutions in the coming years [45].
The energy regulator in Brazil, ANEEL, replaced its ambitious goal of replacing all electricity
meters with SMs in 2009 with a revised target of replacing 63 million by 2021 [74]. In 2012, ANEEL
scaled down the Smart Metering rollout, making SMs mandatory only for new customers starting in
2014 and optional for existing consumers [46]. According to Brazilian utility companies, 4.5 million
SMs are expected to be installed by 2017. The approach of Brazilian Smart Metering deployments is
to help reduce fraud, electricity theft, and inefficiency, as occurs in other emerging countries, which
cost the country close to $4 billion per year [47].
Mexico is the second‐largest potential market for SMs in Latin America after Brazil, and is
expected to have 21 million SMs installed by 2020 [74]. Many SG and Smart Metering pilot programs
in Mexico are being boosted in an effort to respond to high rates of electricity theft, power outages,
and poor energy infrastructure [46].
4.3. Asia‐Pacific
China is by far the country with the largest number of installed SMs in the Asia‐Pacific region
and it is expected to almost double those figures by 2020. Japan has also performed several SM
rollouts. The rest of the analyzed countries have also performed some deployments, but less
numerous. SM rollouts in India are expected to increase in the coming years. Figure 8 depicts an
estimation of the total number of SMs in installed Asia‐Pacific countries by 2020.
Figure 8. Estimation of the total number of SMs in installed Asia‐Pacific countries by 2020 (Source:
Accenture [55]). Reprinted with the permission of Accenture, “Realizing the Full Potential of Smart
Metering”, published by Accenture, 2015.
4.3.1. China
Electricity companies in China continue with an extensive deployment of SMs as part of a
national plan that aims to improve the national electricity infrastructure and shift towards green
energy supply. This situation has led China to become the largest market for SMs in the world [46].
The installed base of SMs is expected to grow from more than 139 million units in 2012 to 377 million
units by 2020, reaching 74% market penetration [75]. The Smart Grid Corporation of China (SGCC)
is China’s sole state‐owned electric utility company and the largest utility company in the world,
covering power supply to 88% of China [76].
The most important SM deployment in China corresponds to the SGCC’s Smart Grid Plan, which
aims at developing a modern power grid based on a strong information and communication
platform, with an Ultra High Voltage (UHV) grid backbone and subordinate grids coordinated at all
levels [76]. By the end of 2011, SGCC had implemented 238 SG pilot projects ranging from connecting
wind power plants to automating distribution networks to metering households. Regarding Smart
Metering, there were three remarkable deployments: (i) 26 provinces and 2.2 million users in 2009; (ii)
33 million SMs installed in 2010; and (iii) 33 million SMs installed in 2011 [77]. Most of the installed
SMs employ PLC; however, SGCC is also running an SG project with 86,000 premises connected to
Figure 8. Estimation of the total number of SMs in installed Asia-Pacific countries by 2020(Source: Accenture [55]). Reprinted with the permission of Accenture, “Realizing the Full Potential ofSmart Metering”, published by Accenture, 2015.
4.3.1. China
Electricity companies in China continue with an extensive deployment of SMs as part of a nationalplan that aims to improve the national electricity infrastructure and shift towards green energy supply.This situation has led China to become the largest market for SMs in the world [46]. The installedbase of SMs is expected to grow from more than 139 million units in 2012 to 377 million units by 2020,reaching 74% market penetration [75]. The Smart Grid Corporation of China (SGCC) is China’s solestate-owned electric utility company and the largest utility company in the world, covering powersupply to 88% of China [76].
Appl. Sci. 2016, 6, 68 17 of 24
The most important SM deployment in China corresponds to the SGCC’s Smart Grid Plan, whichaims at developing a modern power grid based on a strong information and communication platform,with an Ultra High Voltage (UHV) grid backbone and subordinate grids coordinated at all levels [76].By the end of 2011, SGCC had implemented 238 SG pilot projects ranging from connecting wind powerplants to automating distribution networks to metering households. Regarding Smart Metering, therewere three remarkable deployments: (i) 26 provinces and 2.2 million users in 2009; (ii) 33 million SMsinstalled in 2010; and (iii) 33 million SMs installed in 2011 [77]. Most of the installed SMs employ PLC;however, SGCC is also running an SG project with 86,000 premises connected to the grid using PONtechnology [78]. Additionally, under the Smart Grid Plan, SGCC has developed three standards relatedto Smart Metering: (i) Q/GDW 376.1 (communication protocol between master station and terminals);(ii) Q/GDW 376.2 (interface for local communication module of concentrators); and (iii) Q/GDW 377(technical specification for security and protection).
4.3.2. Japan
Japan is betting on Smart Metering solutions, especially after the Fukushima earthquake disaster,and they expect to deploy a total of 80 million SMs [46]. The Japanese government has set a targetfor about 80% of the nationwide electricity consumption to be monitored using SMs, phased from2015 to 2020. By 2024, virtually all of Japan’s roughly 80 million residential customers are expected tohave an SM installed in their homes. The Smart Metering plan deployment has been set with the aim ofletting utilities see the demand in real time and adjust pricing accordingly, all without dispatchingmeter readers. The devices are also expected to encourage customers to save more energy [78]. One ofthe two main power utilities of Japan, TEPCO, announced that it was expanding its rollout programfrom 7 million to 27 million SMs—essentially, all the meters of their household customers. Installationsbegan in the first half of 2014 and are to be completed by March 2021 [79]. On the other hand, KEPCOutility has already deployed about 2 million SMs. Smart Metering deployments in Japan employwireless technologies.
Unlike most other nations, reliability is not considered to be an issue in Japan. The country hasalready undertaken significant generation and transmission infrastructure improvements as a resultof investments beginning in the 1990s. A key focus area for Japan is the introduction of advancedintegrated controls for demand side management and connectivity to the end-user [80].
4.3.3. Australia
Australian SG and Smart Metering initiatives are focused on demand management, energy security,and energy efficiency and have been mainly propelled by governmental programs. Additionally, severeenergy problems caused by energy shortages suffered in 2006 and 2007 have contributed to the attemptto improve the energy supply system [70]. In fact, in response to those energy shortages, there wasa government committed to a national SM rollout as part of the National Smart Metering Program.The rollout areas were chosen from a cost-benefit analysis and the State of Victoria was the first tocommence a mandatory rollout of Smart Metering infrastructure, which started in 2009 and finished in2013 with 2.8 million installed SMs equipped with RF mesh technology and WiMAX. As happenedwith the Ontario deployment, a ZigBee HAN network was also implemented. The governmentdetermined minimum functionality and services to be conformed to by the distributors, specified interms of four key services: (i) recording of energy imported or exported from a metering point byhalf-hour trading interval; (ii) remote reading of the SMs; (iii) remote power supply disconnection;and (iv) remote power supply connection [38]. All costs associated with this deployment were passedalong to consumers, including the cost of the SM itself, which generated cost concerns from customers.This, together with customer implications and engagement, were identified as the two main problemsof the deployment [75]. The Ausgrid utility has also performed several Smart Metering pilots. In 2010a consortium led by Ausgrid won the tender for the Australian Government's “Smart Grid SmartCity” project, consisting of the rollout of up to 50,000 SMs to homes across the trial sites. Residents

Appl. Sci. 2016, 6, 68 18 of 24
are able to see a real-time analysis of electricity usage for their households, as well as for individualappliances. The deployment also improves the grid performance by controlling the efficiency andnetwork operations for energy transmission. The project employs LTE for its 4G communicationsnetwork [39]. Additionally, the “Essential Energy” project, from 2004, consisting of the deployment ofSMs for predominately residential customers, started with a size of approximately 2500 SMs equippedwith mesh radio and 3G. The pilot assesses demand management trial including in-home displaysand critical peak pricing tariffs. The trial confirmed the importance of real-time consumption data indriving energy efficiency since customers involved in the trial achieved an overall reduction in energyconsumption and up to 30% reduction in their peak demand [38]. Additional Smart Metering pilotsand trials performed in Australia are discussed in [39,81].
4.3.4. India
Although India is one of the fastest-growing economies in the world, its industrial growth hasbeen limited by inadequate energy availability, especially electricity transmission, distribution losses,and a mismatch of supply and demand in electricity [50]. This issue, along with theft, are the majorconcerns regarding power in India. Consequently, the Indian Ministry of Power is advocating for SGinvestment to solve those issues and in 2012 unveiled eight SG pilot projects that use a combination ofSmart Metering and various technologies to improve the efficiency and reliability of the power systemfor sustainable growth. Initial steps towards Smart Metering in India have been encouraging, withthe market for electricity meters both for static and electromagnetic witnessing a rapid expansionof 32% between 2008–2009 and 2010–2011. Under the India Smart Grid Task Force (ISGTF), aninter-ministerial group initiated by the Ministry of Power, a Smart Meter Task Group was formed todiscuss the development of cost-effective metering solutions that can be applied within the Indiancontext [76]. Some remarkable Smart Metering pilots are the “Puducherry Smart Grid Project,” withmore than 1400 SMs equipped with different technologies; the “Bangalore Pilot Project,” which willreach 2000 residential and commercial customers; and the deployment started in 2008 in New Delhi(with 500,000 SMs installed in 2011), where SMs include automated meter reading and a prepaidsystem utilizing PLC technology [80]. Industry reports estimate that India will install 130 million SMsequipped with both PLC and wireless technologies by 2021 [82].
However, despite the progress in Smart Metering across utilities at pilot level, there are stillinfrastructural development and capacity building issues that need to be addressed before a large-scaleimplementation. A considerable percentage of existing SMs are still being read manually; there is anabsence of associated infrastructure for meter data analysis and also an insufficient regulatory focusand policy on Smart Metering [76].
4.4. Other Regions
Other regions of the Middle East, such as Libya and the United Arab Emirates, are also startingtheir path into Smart Metering; Dubai Smart City can be cited as a model. Regarding Africa, utilities fromSouth Africa and Zimbabwe lead the Smart Metering introduction initiative, which is still very poor.
5. Challenges to be Addressed in the Near Future
With the exception of China, the pace of installation of SMs will reportedly slow in the shortterm, due in large part to a decline in the rate of meter rollouts in the United States and delayedimplementation of large projects planned for Europe and Brazil [46]. Additionally, as stated by CEER,despite the many years of assessing European standards, Europe still faces a difficult situation becauseof the lack of a common standard for SMs and an absence of interoperability. This leads to a lack ofeconomies of scale and innovation in customer services since Smart Metering should act as an enablerof additional services [50]. This situation complicates the penetration of multinational SM suppliersin certain foreign markets due to the imposition of local manufacturing standards that may requiresignificant product modifications [46]. Although most of the countries have followed at least some of
Appl. Sci. 2016, 6, 68 19 of 24
the recommendations listed in Table 2, a common approach should be envisaged for defining SMsand their functional requirements. According to the European Commission, the most challengingfunctionality to deliver relates to the frequency of consumption data update and its availability toconsumers and third parties on their behalf [51]. Also data protection and security issues must beaddressed. Not all technologies offer the same security levels and this needs to be faced. It is advisableto assess a specific framework and personal data protection must remain a central concern in thedevelopment of standards. In addition, most of the Smart Metering communication networks use alow/medium bandwidth, which generates high traffic and limits the quantity of data to be transmitted.Then, more modulation/demodulation devices and additional memory for storing the data logs willbe required, with a corresponding increase of costs [83]. In addition, high levels of data traffic may leadto an inefficient system. Techniques such as reduction of data retransmissions and the introduction ofhierarchy levels (priorities according to the type of data: measure, control, management, alarm, etc.)can help to improve efficiency in Smart Metering communications.
Additionally, communication systems may also face disturbances: wireless communications sufferinterference from surrounding emitting devices and also PLC is affected by the inherent noise fromthe power cable and the devices connected to it. Those issues can be overcome by using more robustprotection codes, redesigning emitting devices, and legislating on electromagnetic interferences [84].
At present, government investments have propelled a large proportion of Smart Meteringdeployments, especially in Europe. Most utilities are reluctant to invest in new systems and technologywithout a government mandate or incentive, despite the savings resulting from Smart Meteringsystems [46]. The European Commission has listed the advised next steps in the deployment ofSmart Metering systems as follows:
‚ Gain the trust and confidence of consumers. An intensive communication effort is required toconvince customers about three key aspects: understanding their rights as consumers, the benefitsof installing SMs, and their participation in demand response programs.
‚ Achieve an innovative energy services market. Synergies with the ICT sector will be fundamentalfor promoting an innovative energy services market.
‚ Protection of sensitive data. The European Commission and the member states will have to assessthe need for specific data privacy and security framework legislation.
‚ Management of data. Utilities and the ICT sector will have to work together and explore thepossibilities of data management.
‚ Functions of SMs. Technical and commercial interoperability in Smart Metering will enablemember states to identify common means of achieving cost efficiencies and ensure fit-for-purposein their rollout.
‚ Long-term economic assessment of costs and benefits. A review of the critical parameters usedand assumptions made in national rollouts will help to refine technology choices.
In the United States, Smart Metering is still a developing industry. The FERC highlights the lack ofintegration of HANs with Smart Metering systems, as well as existing uncertainty over the developmentand evolution of standards and their effect on networking technology, especially regarding HANintegration [17]. Utilities are also concerned about obsolescence, which may be addressed by adoptingthe most adequate technology for every particular case. Another subject under discussion, barelyseen in Europe, refers to the impact of Smart Metering deployment on residential customers and itstranslation into real bill savings [10]. This issue can be addressed by allowing access to metering datain real time to end-consumers and by offering peak-time rebates. Additionally, most Smart Meteringprojects in the U.S. have had to deal with a lack of confidence among customers regarding magneticradiation emissions, remote supply disconnections, and privacy issues [61].
Acknowledgments: This work has been partially supported by the Spanish Ministry of Economy andCompetitiveness (project TEC2015-67868-C3-1-R), the University of the Basque Country (UPV/EHU) withinthe program for the specialization of the postdoctoral researcher staff, and Microgrids with Renewable Distributed
Appl. Sci. 2016, 6, 68 20 of 24
Generation (MIGEDIR) (project 713RT0468), funded by the Science and Technology for Development IberoamericanProgram (CYTED).
Conflicts of Interest: The authors declare no conflict of interest.
References
1. The History of Making the Grid Smart. Available online: http://ethw.org/The_History_of_Making_the_Grid_Smart#The_History_of_Making_the_Grid_Smart (accessed on 1 June 2015).
2. Sensor Monitoring Device, Patent US 3842208 A. Available online: http://www.google.com/patents/US3842208 (accessed on 3 June 2015).
3. Directive 2012/27/EU of the European Parliament and of the Council of 25 October on energyefficiency, amending Directives 2009/125/EC and 2010/30/EU and repealing Directives 2004/8/ECand 2006/32/EC, 2012/27/EU. Official Journal of the European Union, L315/1. 2012. Available online:http://eur-lex.europa.eu/legal-content/EN/TXT/?uri=celex%3A32012L0027 (accessed on 10 June 2015).
4. Jaewoo, K.; Jaiyong, L.; Jaeho, K.; Jaeseok, Y. M2M service platforms: Survey, issues, and enablingtechnologies. IEEE Commun. Surv. Tutor. 2014, 16, 61–76.
5. López, G.; Moreno, J.; Amarís, H.; Salazar, F. Paving the road toward Smart Grids through large-scaleadvanced metering infrastructures. Electr. Power Syst. Res. 2015, 120, 194–205. [CrossRef]
6. Hossain, M.R.; Oo, A.M.T.; Ali, A.B.M.S. Evolution of smart grid and some pertinent issues. In Proceedingsof the 20th Australasian Universities Power Engineering Conference (AUPEC), Christchurch, New Zealand,5–8 December 2010; Volume 6, pp. 5–8.
7. Farhangi, H. The path of the smart grid. IEEE Power Energy Mag. 2010, 8, 18–28. [CrossRef]8. Edison Electric Institute. Smart Meters and Smart Meter Systems: A Metering Industry Perspective. 2011.
Available online: http://www.eei.org/issuesandpolicy/grid-enhancements/documents/smartmeters.pdf(accessed on 6 January 2016).
9. Murat, K.; Pipattanasomporn, M.; Rahman, S. Communication network requirements for major smart gridapplications in HAN, NAN and WAN. Comput. Netw. 2014, 67, 74–88.
10. Depuru, S.S.S.R.; Wang, L.; Devabhaktuni, V. Smart meters for power grid: Challenges, issues, advantagesand status. Renew. Sustain. Energy Rev. 2011, 15, 2736–2742. [CrossRef]
11. Chun-Hao, L.; Ansari, N. The progressive Smart Grid System from both power and communications aspects.IEEE Commun. Surv. Tutor. 2012, 14, 799–821.
12. Mohassel, R.; Fung, A.; Mohammadi, A.F.; Raahemifar, K. A survey on advanced metering infrastructure.Int. J. Electr. Power Energy Syst. 2014, 63, 473–484. [CrossRef]
13. IBM Software. Managing Big Data for Smart Grids and Smart Meters. White Paper. 2012. Available online:http://www-935.ibm.com/services/multimedia/Managing_big_data_for_smart_grids_and_smart_meters.pdf (accessed on 3 January 2016).
14. Diamantoulakis, P.D.; Kapinas, V.M.; Karagiannidis, G.K. Big data analytics for dynamic energy managementin smart grids. Big Data Res. 2015, 2, 94–101. [CrossRef]
15. Patel, A.; Aparicio, J.; Tas, N.; Loiacono, M.; Rosca, J. Assessing communications technology options for smartgrid applications. In Proceedings of the 2011 IEEE International Conference on Smart Grid Communications(SmartGridComm), Brussels, Belgium, 17–20 October 2011; pp. 126–131.
16. Tortolero, A. The Three Pillars for an Efficient AMI Operation. Schneider Electric White Paper, 2014. Availableonline: http://www.schneider-electric.com/solutions/sg/en/med/679458530/application/pdf/2400_998-2095-06-09-14ar1_en.pdf (accessed on 4 January 2016).
17. Assessment of Demand Response and Advanced Metering. Federal Energy Regulatory Commission (FERC),2008. Available online: https://www.ferc.gov/legal/staff-reports/12-20-12-demand-response.pdf (accessedon 15 October 2015).
18. Gao, C.; Redfern, M.A. A Review of Voltage Control in Smart Grid and Smart Metering Technologies onDistribution Networks. In Proceedings of the Universities1 46th International Power Engineering Conference(UPEC), Soest, Germany, 5–8 September 2011.
19. U.S. Department of Energy. Application of Automated Controls for Voltage and Reactive PowerManagement. Smart Grid Investment Grant Program. 2012. Available online: https://www.smartgrid.gov/files/VVO_Report_-_Final.pdf (accessed on 4 January 2016).
Appl. Sci. 2016, 6, 68 21 of 24
20. U.S. Department of Energy. Regulators: What the Smart Grid Means to You and the People YouRepresent. Available online: http://www.smartgridinformation.info/pdf/1212_doc_1.pdf (accessed on 26September 2015).
21. Grigoras, G.; Scarlatache, F. Use of data from smart meters in optimal operation of distribution systems.In Proceedings of the International Conference on Optimization of Electrical and Electronic Equipment(OPTIM), Suceava, Romania, 22–24 May 2014.
22. Dong, X.; Hongxing, W.; Tianmiao, W.; Suibing, Z. A Smart Metering system for monitoring electricity ofbuilding based on wireless network. In Proceedings of the 10th IEEE International Conference on IndustrialInformatics (INDIN), Hangzhou, China, 25–27 May 2012.
23. Depuru, S.; Lingfeng, W.; Devabhaktuni, V. A conceptual design using harmonics to reduce pilfering ofelectricity. In Proceedings of the Power and Energy Society General Meeting, Minneapolis, MN, USA, 25–29July 2010.
24. Xiang, W.; St-Hilaire, M.; Kunz, T. Roadmap of Future Smart Grid, Smart Home, and SmartAppliances. Carleton University: Canada, 2011. Available online: http://www.csit.carleton.ca/~msthilaire/Tech_Report/2011-SmartGridRoadMap.pdf (accessed on 14 December 2015).
25. Lipošcak, Z.; Boškovic, M. Survey of Smart Metering Communication Technologies. In Proceedings of theEUROCON, Zagreb, Croatia, 1–4 July 2013.
26. Parikh, P.P.; Kanabar, M.G.; Sidhu, T.S. Opportunities and challenges of wireless communication technologiesfor smart grid applications. In Proceedings of the Power and Energy Society General Meeting, Minneapolis,MN, USA, 25–29 July 2010; pp. 1–7.
27. Kirkpatrick, K.; Gohn, B. Smart Grid Networking and Communications; Research Report; Pike Research: Boulder,CO, USA, 2012.
28. Gungor, V.; Sahin, D.; Kocak, T.; Ergüt, S.; Buccella, C.; Cecati, C.; Hancke, G. Smart Grid Technologies:Communications Technologies and Standards. 2011. Available online: http://repository.up.ac.za/bitstream/handle/2263/18406/Gungor_Smart(2011).pdf?sequence=1 (accessed on 4 January 2016).
29. Accenture. The Role of Communication Technology in Europe1s Advanced Metering Infrastructure.Technical Paper. 2014. Available online: https://www.accenture.com/us-en/insight-role-communication-technology-europe-advanced-metering.aspx (accessed on 26 December 2015).
30. The Commission for Energy Regulation. Electricity Smart Metering Technology Trials Findings Report.2011. Available online: https://www.ucd.ie/t4cms/Electricity%20Smart%20Metering%20Technology%20Trials%20Findings%20Report.pdf (accessed on 27 December 2015).
31. IEEE 802.15 Wireless Personal Area Networks. Available online: https://standards.ieee.org/about/get/802/802.15.html (accessed on 27 September 2015).
32. Lu, B.; Gungor, V.C. Online and remote energy monitoring and fault diagnostics for industrial motor systemsusing wireless sensor networks. IEEE Trans. Ind. Electr. 2009, 56. [CrossRef]
33. Cisco. A Standardized and Flexible IPv6 Architecture for Field Area Networks. White Paper. 2014.Available online: https://www.cisco.com/web/strategy/docs/energy/ip_arch_sg_wp.pdf (accessed on 7January 2016).
34. Lu, S.C.; Wu, Q.; Seah, W.K. Quality of Service Provisioning for Smart Meter Networks Using Stream ControlTransport Protocol; School of Engineering and Computer Science, Victoria University of Wellington:Wellington, New Zealand, 2012.
35. Koay, B.S.; Cheah, S.; Sng, Y.; Chong, P.; Shum, P.; Tong, Y. Design and implementation of bluetooth energymeter. In Proceedings of the Fourth International Conference on Information, Communications & SignalProcessing, Singapore, Singapore, 15–18 December 2003; pp. 1474–1477.
36. Ancillotti, E.; Bruno, R.; Conti, M. The role of communication systems in smart grids: Architectures, technicalsolutions and research challenges. Comput. Commun. 2013, 36, 1665–1697. [CrossRef]
37. IEEE 802.11™ Wireless LANs. Available online: http://standards.ieee.org/about/get/802/802.11.html(accessed on 15 August 2015).
38. Victorian AMI Rollout-Legislative and Regulatory Framework. 2008. Available online: http://www.smartmeters.vic.gov.au/about-smart-meters/reports-and-consultations/advanced-metering-infrastructure-cost-benefit-analysis/2.-background (accessed on 26 December 2015).
Appl. Sci. 2016, 6, 68 22 of 24
39. Energy Networks Association. Pilots and Trials Report on Smart Metering and Related Matters. 2012.Available online: http://www.aemc.gov.au/getattachment/6a455547-4851-4a86-b83c-385be12f967d/Energy-Networks-Association-Pilots-and-trials-repo.aspx (accessed on 6 January 2016).
40. Gungor, V.C.; Sahin, D.; Kocak, T.; Ergut, S.; Buccella, C.; Cecati, C.; Hancke, G.P. Smart grid technologies:Communication technologies and standards. IEEE Trans. Ind. Inform. 2011, 7, 529–539. [CrossRef]
41. Galli, S.; Lys, T. Next generation Narrowband (under 500 kHz) Power Line Communications (PLC) standards.Communications 2015, 12, 1–8. [CrossRef]
42. Gungor, V.C.; Sahin, D.; Kocak, T.; Ergüt, S. Smart Grid Communications and Networking; Türk TelekomTechnical Report-11316-01; Türk Telekom: Altındag, Turkey, 2011.
43. IEC 62056-31:1999 Withdrawn. https://webstore.iec.ch/publication/20273 (accessed on 9 September 2015).44. Electa. Study on Smart Meters from the Angles of the Consumer Protection and the Public Service
Obligations. 2010. Available online: http://economie.fgov.be/nl/binaries/201010smartMeters_ELECTA_FINAL_REPORT_tcm325-117779.pdf (accessed on 4 January 2016).
45. Strother, N.; Lockhart, B. Smart Meters. Smart Electric Meters, Advanced Metering Infrastructure, and MeterCommunications: Global Market Analysis and Forecasts; Navigant Research: Boulder, CO, USA, 2014.
46. Alejandro, L.; Blair, C.; Bloodgood, L.; Khan, M.; Lawless, M.; Meehan, D.; Schneider, P.; Tsuji, K.Global Market for Smart Electricity Meters: Government Policies Driving Strong Growth. WorkingPaper. US International Trade Commission, 2014. Available online: https://www.usitc.gov/publications/332/id-037smart_meters_final.pdf (accessed on 28 December 2015).
47. Northeast Group, LLC. Brazil Smart Grid: Market Forecast (2012–2022). 2012. Available online: http://www.northeast-group.com/reports/Brazil_Smart_Grid_Market_Forecast_2012-2022_Brochure_Northeast_Group_LLC.pdf (accessed on 28 December 2015).
48. Li, D.; Hu, B. Advanced metering standard infrastructure for smart grid. In Proceedings of the 2012 ChinaInternational Conference on Electricity Distribution (CICED), Shanghai, China, 10–14 September 2012;pp. 1–4.
49. ABI Research. Smart Electricity Meters to Total 780 Million in 2020. 2015. Available online: https://www.abiresearch.com/press/smart-electricity-meters-to-total-780-million-in-2/ (accessed on 3 January 2016).
50. Status Review of Regulatory Aspects of Smart Metering. Council for European EnergyRegulators (CEER), 2013. Available online: http://www.ceer.eu/portal/page/portal/EER_HOME/EER_PUBLICATIONS/CEER_PAPERS/Customers/2013/7-1_C13-RMF-54-05-Status_Review_of_Regulatory_Aspects_of_Smart_Metering_FOR_PUBLICATION.pdf (accessed on 27 October 2015).
51. Benchmarking Smart Metering Deployment in the EU-27 with a Focus on Electricity. EuropeanCommission, 2014. Available online: http://ec.europa.eu/energy/en/topics/markets-and-consumers/smart-grids-and-meters (accessed on 15 October 2015).
52. Commission Staff Working Document, “Cost-benefit analyses & state of play of Smart Meteringdeployment in the EU-27”, COM(2014) 356 final. 2014. Available online: http://eur-lex.europa.eu/legal-content/EN/TXT/PDF/?uri=CELEX:52014SC0189&from=EN (accessed on 16 October 2015).
53. Executive Summary; Berg Insight: Göteborg, Sweden, 2013.54. USmart Consumer Project. European Smart Metering Landscape Report. 2014. Available online:
http://www.escansa.es/usmartconsumer/documentos/USmartConsumer_Landscape_2014_Final_pr.pdf(accessed on 28 December 2015).
55. Realizing the Full Potential of Smart Metering. Accenture1s Digitally Enabled Grid Program. Available online:https://www.accenture.com/us-en/~/media/Accenture/Conversion-Assets/DotCom/Documents/Global/PDF/Industries_9/Accenture-Smart-Metering-Report-Digitally-Enabled-Grid.pdf (accessed on 20September 2015).
56. Gerwen, R.; Jaarsma, S.; Wilhite, R. Smart Metering; KEMA: Arnhem, The Netherlands, 2006.57. House of Commons-Energy and Climate Change Committee. Smart meter roll-out-Fourth Report of
Session 2013–2014. 2013. Available online: http://www.publications.parliament.uk/pa/cm201314/cmselect/cmenergy/161/161.pdf (accessed on 18 November 2015).
58. Duplex, J.; Gosswiller, S.; Fagnoni, S. A better knowledge of electricity consumption for residential customersthrough the Linky smart meter. In Proceedings of the 22nd International Conference and Exhibition onElectricity Distribution (CIRED 2013), Stockholm, Sweden, 10–13 June 2013; pp. 1–4.

Appl. Sci. 2016, 6, 68 23 of 24
59. DNV GL. Smart Grid Data Communication: Accelerating Results in Spain. 2014. Available online:http://www.dnvkema.com/Images/SG%20Data%20Communications%20Lab%20Madrid%20A4_070714.pdf(Accessed on 4 January 2016).
60. Bayar, T. Will Germany Reject Smart Meters? Available online: http://www.renewableenergyworld.com/articles/2013/09/will-germany-reject-smart-meters.html (accessed on 26 December 2015).
61. Federal Energy Regulatory Commission. Assessment of Demand Response and Advanced Metering. 2015.Available online: http://www.ferc.gov/legal/staff-reports/2015/demand-response.pdf (accessed on 28December 2015).
62. Institute for Electric Innovation. Edison Foundation. Utility-Scale Smart Meter Deployments: BuildingBlock of the Evolving Power Grid. Report. 2014. Available online: http://www.edisonfoundation.net/iei/Documents/IEI_SmartMeterUpdate_0914.pdf (accessed on 26 December 2015).
63. PG & E SmartMeter Program Overview. 2008. Available online: http://www.edisonfoundation.net/iei/Documents/PGE_SmartMeter_Overview.pdf (accessed on 28 December 2015).
64. Park, E.; Callahan, S. PG & E SmartMeter Project (AMI)—The Intelligent Network. 2006. Available online:http://info.publicintelligence.net/SmartMeter2.pdf (accessed on 26 December 2015).
65. Nanne, Y. Southern California Edison Smart Meter Deployment. 2014. Available online: https://www.academia.edu/8872228/SCE_Smart_Meter_Deployment_A_Case_Study_of_Thematic_Implementation(accessed on 27 December 2015).
66. U.S. Department of Energy. Case Study-Florida Power & Light. 2012. Available online: https://www.smartgrid.gov/files/FPLcasestudy.pdf (accessed on 27 December 2015).
67. Greer, J. Oncor Smart Texas-Focus on Smart Meters. Available online: http://www.oncor.com/EN/Documents/Ways%20to%20Save/Advanced%20Meters/Focus%20on%20Newsletter.pdf (accessed on 29December 2015).
68. U.S. Department of Energy. Case Study—Center Point. 2013. Available online: https://www.smartgrid.gov/files/CenterPoint_Case_Study.pdf (accessed on 29 December 2015).
69. Monitoring Report Smart Meter Deployment and TOU Pricing. 2011. Available online: http://www.ontarioenergyboard.ca/OEB/_Documents/SMdeployment/Monthly_Monitoring_Report_June2011.pdf(accessed on 4January 2016).
70. The Global Smart Grid Federation Report. 2012. Available online: https://www.smartgrid.gov/files/Global_Smart_Grid_Federation_Report.pdf (accessed on 26 December 2015).
71. Auditor General of Ontario, Smart Metering Initiative. 2015. Available online: http://www.auditor.on.ca/en/reports_en/en14/311en14.pdf (accessed on 3 January 2016).
72. BC Hydro. Smart Metering & Infrastructure Program. Business Case. 2014. Available online: https://www.bchydro.com/content/dam/BCHydro/customer-portal/documents/projects/smart-metering/smi-program-business-case.pdf (accessed on 2 January 2016).
73. Hydro-Québec. Next-Generation Meters Project. 2013. Available online: http://meters.hydroquebec.com/media/exportpdf/HQ_project.pdf (accessed on 6 January 2016).
74. PR Newswire. Mexico Smart Grid Market to Reach $8.3 Billion. 2011. Available online: http://www.prnewswire.com/news-releases/mexico-smart-grid-market-to-reach-83-billion-by-2020-131504898.html(accessed on 27 December 2015).
75. PV Magazine. Smart Meter Market Is Hotting Up in China. 2013. Available online: http://www.pv-magazine.com/news/details/beitrag/smart-meter-market-is-hotting-up-in-china_100011272/#axzz3wLSfQBW1(accessed on 26 December 2015).
76. Asian Power. Metering India Smartly. 2012. Available online: http://asian-power.com/sites/default/files/asianpower/print/APMay_2013_lr_12.pdf (accessed on 7 January 2016).
77. China1s Power Sector, Smart Grid Strategy and Investment Climate. 2011. Available online:http:// nebula. wsimg.com/edf018e665a3fcef0fac9ba08f4b75e0?AccessKeyId=1A0D9A575B761BCFC58F&disposition=0&alloworigin=1 (accessed on 7 January 2016).
78. China Tests a Small Smart Electric Grid. MIT Technology Review. 2013. Available online: http://www.technologyreview.com/news/510171/china-tests-a-small-smart-electric-grid/ (accessed on 7 January 2016).
79. Global Smart Meter Unit Shipments Will Peak; Navigant Research: Boulder, CO, USA, 2013.80. SAIC. Smart Grid around the World-Selected Country Overviews. 2011. Available online: https://www.
eia.gov/analysis/studies/electricity/pdf/intl_sg.pdf (accessed on 4 January 2016).
Appl. Sci. 2016, 6, 68 24 of 24
81. Moore, K. Overview of the Victorian Smart Meter Program. 2015. Available online: http://www.mbie.govt.nz/info-services/sectors-industries/energy/electricity-market/nz-smart-grid-forum/meeting-6/case-study-victorian-smart-meter-rollout.pdf (accessed on 26 December 2015).
82. Goswami. Smart Metering: Energizing India. 2012. Available online: http://www.dqindia. com/smart-metering-energizing-india/ (accessed on 22 December 2015).
83. Alexander, B. Smart Meters, Demand Response and “Real Time” Pricing: Too Many Questions andNot Many Answers. 2007. Available online: http://www.narucmeetings.org/Presentations/Dynamic%20Pricing%20NARUC%202007.ppt (accessed on 16 October 2015).
84. Bartak, G.F.; Abart, A. EMI of Emissions in the Frequency Range 2 kHz–150 kHz. In Proceedings of the 22ndInternational Conference on Electricity Distribution (CIRED), Stockholm, Sweden, 10–13 June 2013.
© 2016 by the authors; licensee MDPI, Basel, Switzerland. This article is an open accessarticle distributed under the terms and conditions of the Creative Commons by Attribution(CC-BY) license (http://creativecommons.org/licenses/by/4.0/).