Embed Size (px)
Citation preview
State-of-the-art in POPs Analysis: Outcomes of the DIFFERENCE and
DIAC projects
Pim LeonardsNetherlands Institute for Fisheries Research (RIVO)

Dioxins in Food and Feed-Reference Methods and New Certified Reference Materials
“DIFFERENCE”
Dioxin Analysis by Comprehensive Multi-Dimensional Gas Chromatography (GCxGC)
“DIAC”COMPETITIVE AND SUSTAINABLE GROWTH
(GROWTH) PROGRAMME

Background and Societal Needs
Belgian chicken incident 1999Need for dioxin analysis capacityNeed for cheap and reliable screening and confirmatory methodsNew EU MRLs, 1 July 2002

Objectives DIAC
Optimisation of GCxGC-ECD system for dioxin analysisSelection of ‘best’ modulatorOptimisation of quantification comparison with HRMSTest of alternative detection method: ToF-MSSimplification of extraction and clean-up

WP 1, task 2Optimisation of GCxGC
WP 1, task 1Mini-workshop
WP 2, task 1Quantification standardsolution/ cleaned sample
WP 2, task 2Quantification real-life
samples GCxGC vs. GC-HRMS
WP 3, tasks 1, 2Simplification extraction/
clean-up methods
WP 4 Alternative MS detection
method
WP 5Dissemination of results
Workshop for dioxin users
Final report
DIAC Workplan

DIFFERENCE ObjectivesSelection of relevant food and feed matricesPreparation of candidate CRMsFeasibility of certificationOptimisation of bio-analytical and chemical methods for dioxin analysisValidation and standardisationOptimisation of extraction and clean-upStandardised protocols for use in Europe

WP 3. Development& optimisation methods
WP 5. Extraction & clean-up
MEA SFE
PLE
CALUX
GCXGC
Ah-PCR
LR-MS/MS
Interlaboratory tests& optimisation methods
WP 1. Preparation materials
WP 2. Homogeneity & stability test
WP 6. Method validation& standardisation
WP 7. final report
WP 4. Interlaboratory studies(feasibility on certification)
DIFFERENCE Workplan
Partners
PLE
CALUX
GCXGC LR-MS/MS

WHO Dioxins, Furans and dioxin-like PCBs
PCDDs PCDFs Dioxin-like PCBs (+IUPAC nos.)
2,3,7,8-TCDD 2,3,7,8-TCDF 3,3',4,4'-TCB (77) 1,2,3,7,8-PcCDD 1,2,3,7,8-PcCDF 3,4,4',5-TCB (81) 1,2,3,4,7,8-HxCDD 2,3,4,7,8-PcCDF 3,3',4,4',5 -PeCB (126) 1,2,3,6,7,8-HxCDD 1,2,3,4,7,8-HxCDF 3,3',4,4',5,5'-HxCB (169)1,2,3,7,8,9-HxCDD 1,2,3,6,7,8-HxCDF 2,3,3',4,4'-PeCB (105)1,2,3,4,6,7,8-HpCDD 2,3,4,6,7,8-HxCDF 2,3,4,4',5-PeCB (114) OCDD 1,2,3,7,8,9-HxCDF 2,3',4,4',5-PeCB (118) 1,2,3,4,6,7,8-HpCDF 2',3,4,4',5-PeCB (123) 1,2,3,4,7,8,9-HpCDF 2,3,3'4,4',5-HxCB (156) OCDF 2,3,3',4,4',5'-HxCB (157) 2,3',4,4',5,5'-HxCB (167) 2,3,3',4,4',5,5'-HpCB (189)

EU Requirements for Dioxin and dl- PCB Analysis
Screening Methods
Confirmatory Methods
False Negative Rate
<1%
Trueness -20 to +20%
CV <30% <15%

Quality Criteria (2002/69/EC)
r&RHigh accuracy (trueness and precision)
Interferences PCN, PCB,
PCDE
High selectivity (specificity)
Up to 1pgTEQ
High sensitivity and low limits of detection
LOQ at 1pgTEQ/g fat
LOQ (confirmatory method): range 1/5 level of interest
1 – 8 pg TEQPerformance of a method

EU: sensitivity requirements for food (pg diox./g fat)
Veg. oil
0 6
Pork
PoultryFish oil
RuminantsMilk
Eggs
Liver
Fish: 4 pg dioxins/g product
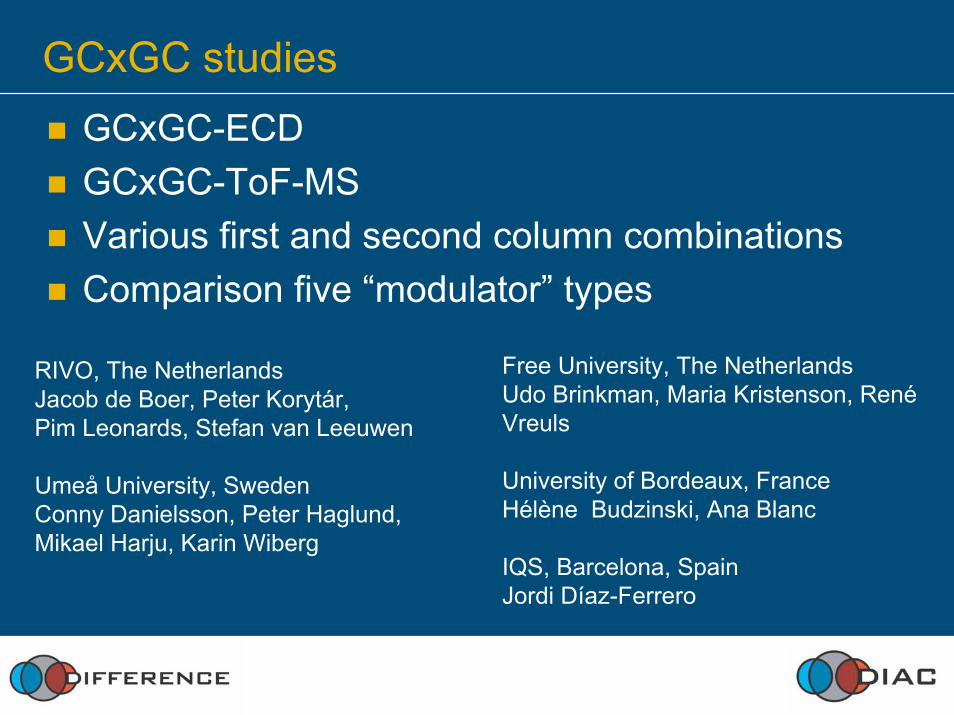
GCxGC studies
RIVO, The NetherlandsJacob de Boer, Peter Korytár, Pim Leonards, Stefan van Leeuwen
Umeå University, SwedenConny Danielsson, Peter Haglund, Mikael Harju, Karin Wiberg
Free University, The Netherlands Udo Brinkman, Maria Kristenson, René Vreuls
University of Bordeaux, FranceHélène Budzinski, Ana Blanc
IQS, Barcelona, SpainJordi Díaz-Ferrero
GCxGC-ECDGCxGC-ToF-MSVarious first and second column combinationsComparison five “modulator” types

Principles of GCxGC
Injector Detector
Modulator
2nd column1st column
•Selection of modulator•5 different modulators:
•SWEEPER•LMCS•Quad N2(l) jet•Dual CO2 jet•Loop CO2
Selection of proper column combination

Cryogenic modulation
11stst columncolumn 22ndnd columncolumn
carrier gascarrier gas
stationary phase 1
COCO22
1. Trapping stationary phase 2
COCO22
2. Release
3. Trapping andSeparation
COCO22

Cryogenic modulator

How does GCxGC work ?

How does GCxGC work ?

1
1
0 s 10 s
How does GCxGC work ?

How does GCxGC work ?
1
23
45
6
1
6
0s 10 s

2D plots
0 s 10 s43
46 min
43 46
10 s
0
1
6
0 10 s2nd dimension
2nd
dim
ensi
on
1st dimension


Cod liver: WHO-PCB separation2n
d di
men
sion
rete
ntio
n tim
e [s
]
1st dimension retention time [min]
85 90 95 100 105 110 115 120 125 130 135
6.0
5.0
4.0
3.0
2.0
1.0
0.0
206
194
207195
189
208
*
**
*202 201
170
**
*
180
*
171
157156
185
167
**
128
187
183
*
*
129
*
138,163
*141
137
*153**
105
*
*
114
149
118
151*
*
*
82
154
124
35 40 45 50 55 60 65 70 75 80
6.0
5.0
4.0
3.0
2.0
1.0
0.0
110
136
7785
87
97
*
I.S.112
**155
99101
92
56,60
84
95*
**
103
66
7061,74
**44
47
49
*
*
28,31
52,69
*
8Cl
7Cl6Cl5Cl
6Cl
3Cl 4Cl
5Cl
DB1 x HT-8

Milk: PCB fraction (DB-XLB x LC-50)
7781
123118
114
105 126
167
156157 169
189
1st dimension retention time [min]
2nddi
men
sion
rete
ntio
n tim
e [s
]
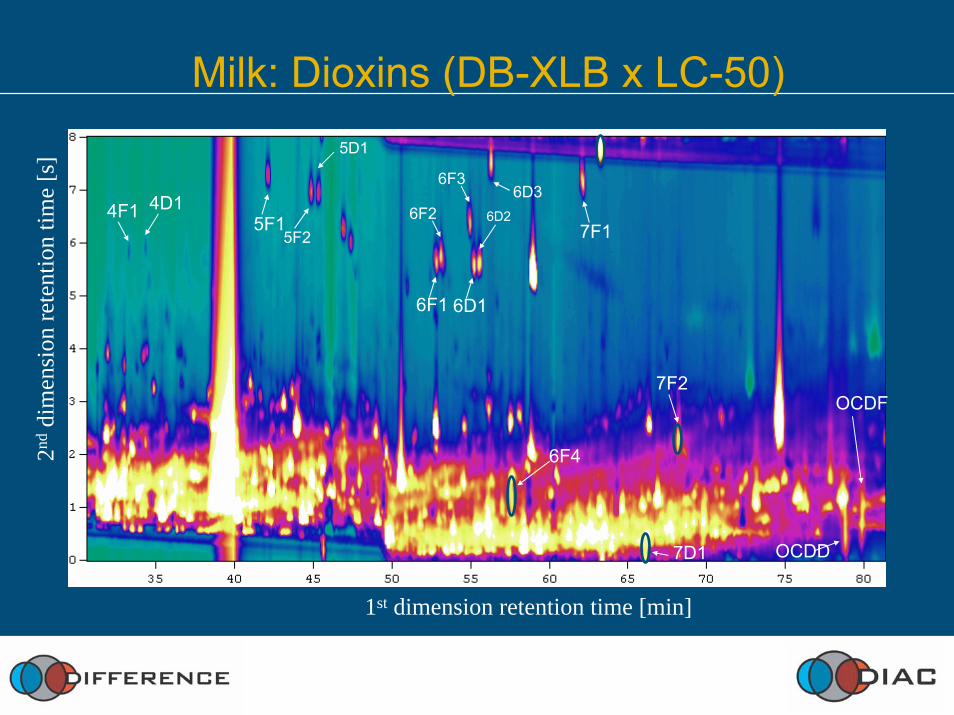
Milk: Dioxins (DB-XLB x LC-50)
4F1 4D15F1
5F2
5D1
6F1
6F2
6F3
6D1
6D2
6D3
7F1
6F4
7D1
7F2
OCDD
OCDF
2nddi
men
sion
rete
ntio
n tim
e [s
]
1st dimension retention time [min]

Improved clean-up and solvent grade
1st dimension retention time [min]
2nd
dim
ensi
on re
tent
ion
time
[s]
4F1 4D1
5F1
5F2
5D1
6F1
6F2
6F3
6D16D2
6D3
7F1
6F4
7D1
7F2
B
1st dimension retention time [min]
2nd
dim
ensi
on re
tent
ion
time
[s]
4F1 4D1
5F1
5F2
5D1
6F1
6F2
6F3
6D16D2
6D3
7F1
6F4
7D1
7F2
B4F1 4D1
5F15F2
5D1
6F1
6F2
6F3
6D1
6D2
6D3
7F1
6F4
7D1
7F2
OCDD
1st dimension retention time [min]
2nd
dim
ensi
on re
tent
ion
time
[s]
A4F1 4D1
5F15F2
5D1
6F1
6F2
6F3
6D1
6D2
6D3
7F1
6F4
7D1
7F2
OCDD
1st dimension retention time [min]
2nd
dim
ensi
on re
tent
ion
time
[s]
A

Sewage sludge with improved clean-up
4F1 4D1
5F1
5F2
5D1
6F1
6F2
6F3
6D16D2
6D3
7F1
6F4
7D1
7F2
1st dimension retention time [min]
2nd
dim
ensi
on re
tent
ion
time
[s]

Modulator comparison and column selection ■ Cryogenic modulation with CO2 had best performance
■ Most suitable column combinations:
• DB-XLB x LC50
• DB-1 x 90% cyanopropyl
• HT5 x BPX 50
■ Other phases less suitable because of:
• high background levels (bleeding of column)
• not all critical congener pairs (with different TEF values) could be separated from each other
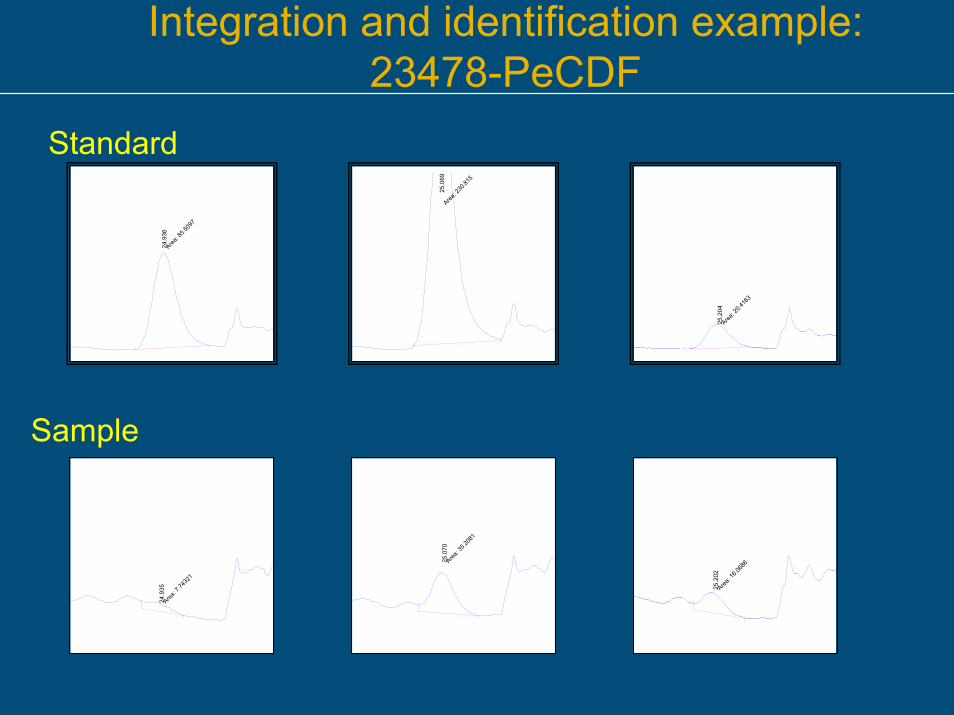
Area
: 85.5
097
24.
936
Area
: 230
.815
25.
069
Area
: 20.4
163
25.
204
Area
: 7.74
321
24.
935
Area
: 35.2
081
25.
070
Area
: 16.0
686
25.
202
Integration and identification example: 23478-PeCDF
Sample
Standard

AccuracyD
evia
tion
from
GC
-HR
MS
Pork fat
Hake
Salmon
TunaTro
utCod
Spiked m
ilk
Spiked m
ilk 2
Fly as
hMilk
Feedingstu
ff
Feedingstu
ff 2
Sewag
e sludge
Sewag
e sludge 2
Sedim
ent
Herring oil
Spiked m
ilk
Vegeta
ble oil Eel
Compound feed
Fish oil-70%
-60%
-50%
-40%
-30%
-20%
-10%
0%
10%
20%
30%DIAC 1 DIAC 2 DIAC 3 DIFF CERT

Conclusions GCxGC-ECD
High selectivityHigh sensitivity but:
Multi clean-up/fractionation steps are needed
Integration of peaks is time-consumingvarious retention time markers in GCxGC plane
Improved software requirement

GC-LRMS/MS
GC-ITMS/MS (GCQ/Polaris)MS/MS modeElectron impact (EI)
Department of Analytical ChemistryUniversity of BarcelonaBarcelona (Spain)
UNIVERSITAT DE BARCELONA
BU Mass Spectrometry-
Dioxin LaboratoryDepartment of EcotechnologiesIIQAB-CSIC, Barcelona (Spain)
J. MalaviaM.T. GalceranF.J. Santos
M. ÁbalosE. AbadJ. Rivera

RT:28.98 - 32.31SM:9G
29.0 29.5 30.0 30.5 31.0 31.5 32.0Time (min)
0
20
40
60
80
1000
20
40
60
80
1000
20
40
60
80
100
Rel
ativ
eAb
unda
nce
0
20
40
60
80
10031.10
30.00 30.6229.98
31.08
31.44
31.92
32.0031.7731.32
31.43
NL: 7.85E2m/z= 274.4-275.4+276.4-277.4 F: + c SRM ms2 [email protected] [ 274.90-276.90] MS y030121_13
NL: 1.39E4m/z= 285.4-286.4+287.4-288.4 F: + c SRM ms2 [email protected] [ 285.90-287.90] MS y030121_13
NL: 1.02E2m/z= 290.4-291.4+292.4-293.4 F: + c SRM ms2 [email protected] [ 290.90-292.90] MS y030121_13
NL: 9.80E3m/z= 301.4-302.4+303.4-304.4 F: + c SRM ms2 [email protected] [ 301.90-303.90] MS y030121_13
1,2,3,7,8-PeCDF
1,2,3,7,8-PeCDD
13C12-1,2,3,7,8-PeCDD
2,3,4,7,8-PeCDF
13C12-1,2,3,7,8-PeCDF 13C12-2,3,4,7,8-PeCDF
m/z 339.9 → m/z 274.9+276.9
m/z 351.9 → m/z 285.9+287.9
m/z 355.9 → m/z 290.9+292.9
m/z 367.9 → m/z 301.9+303.9
Clean Fish Extract: Dioxins
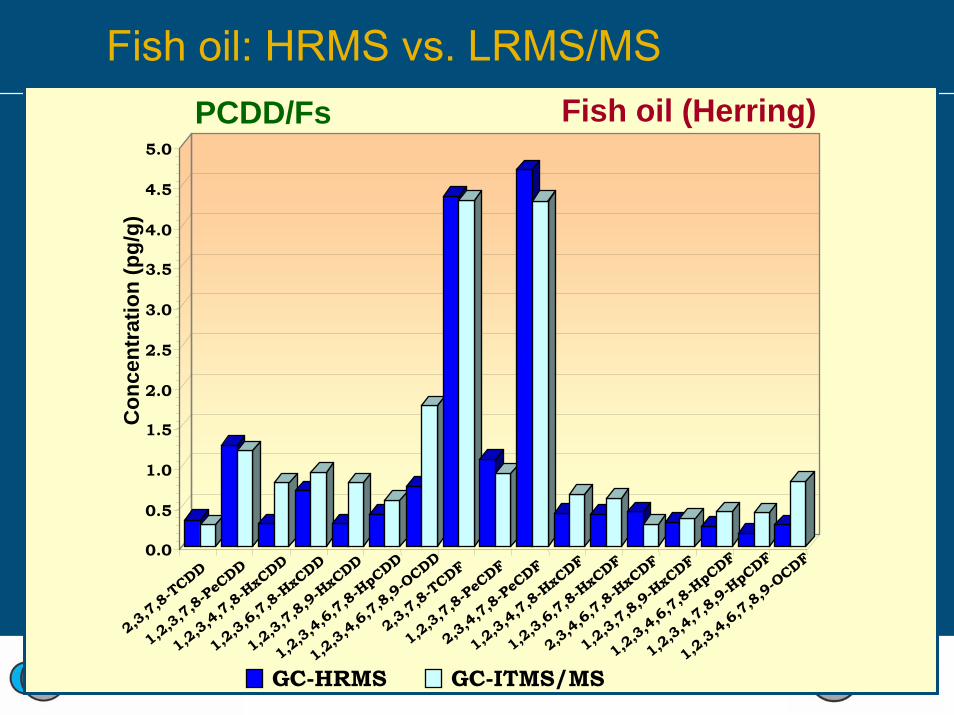
Fish oil: HRMS vs. LRMS/MS
0.0
0.5
1.0
1.5
2.0
2.5
3.0
3.5
4.0
4.5
5.0C
once
ntra
tion
(pg/
g)
2,3,7,8-TCDD
1,2,3,7,8-PeCDD
1,2,3,4,7,8-HxCDD
1,2,3,6,7,8-HxCDD
1,2,3,7,8,9-HxCDD
1,2,3,4,6,7,8-HpCDD
1,2,3,4,6,7,8,9-OCDD
2,3,7,8-TCDF
1,2,3,7,8-PeCDF
2,3,4,7,8-PeCDF
1,2,3,4,7,8-HxCDF
1,2,3,6,7,8-HxCDF
2,3,4,6,7,8-HxCDF
1,2,3,7,8,9-HxCDF
1,2,3,4,6,7,8-HpCDF
1,2,3,4,7,8,9-HpCDF
1,2,3,4,6,7,8,9-OCDF
Fish oil (Herring)PCDD/Fs
GC-HRMS GC-ITMS/MS
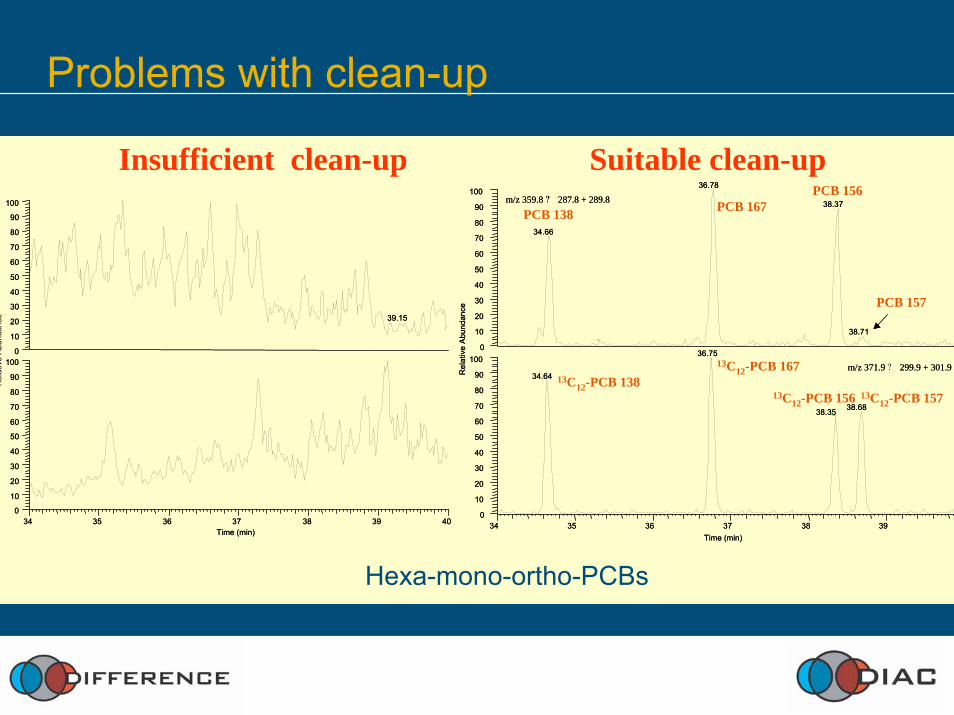
Problems with clean-up
Hexa-mono-ortho-PCBs
Rel
ativ
eA
bund
ance
34 35 36 37 38 39 40Time (min)
0
10
20
30
40
50
60
70
80
90
1000
10
20
30
40
50
60
70
80
90
100
39.15
34 35 36 37 38 39 40Time (min)
0
10
20
30
40
50
60
70
80
90
1000
10
20
30
40
50
60
70
80
90
100
39.15
Insufficient clean-up
34 35 36 37 38 39Time (min)
0
10
20
30
40
50
60
70
80
90
1000
10
20
30
40
50
60
70
80
90
100
Rel
ativ
eA
bund
ance
36.78
38.37
34.66
38.71
36.75
34.64
38.6838.35
m/z 359.8 ? 287.8 + 289.8
m/z 371.9 ? 299.9 + 301.9
34 35 36 37 38 39Time (min)
0
10
20
30
40
50
60
70
80
90
1000
10
20
30
40
50
60
70
80
90
100
Rel
ativ
eA
bund
ance
36.78
38.37
34.66
38.71
36.75
34.64
38.6838.35
PCB 167PCB 156
PCB 157
m/z 359.8 ? 287.8 + 289.8
m/z 371.9 299.9 + 301.9
PCB 138
13C12-PCB 156 13C12-PCB 15713C12-PCB 138
13C12-PCB 167
Suitable clean-up

Conclusions GC-ITMS/MS
■ Low detection limits and high selectivity■ Appropriate clean-up and fractionation method
needed ■ Further studies needed in order to prove the
general applicability of the GC-ITMS/MS for the analysis of PCDD/Fs and dioxin-like PCBs
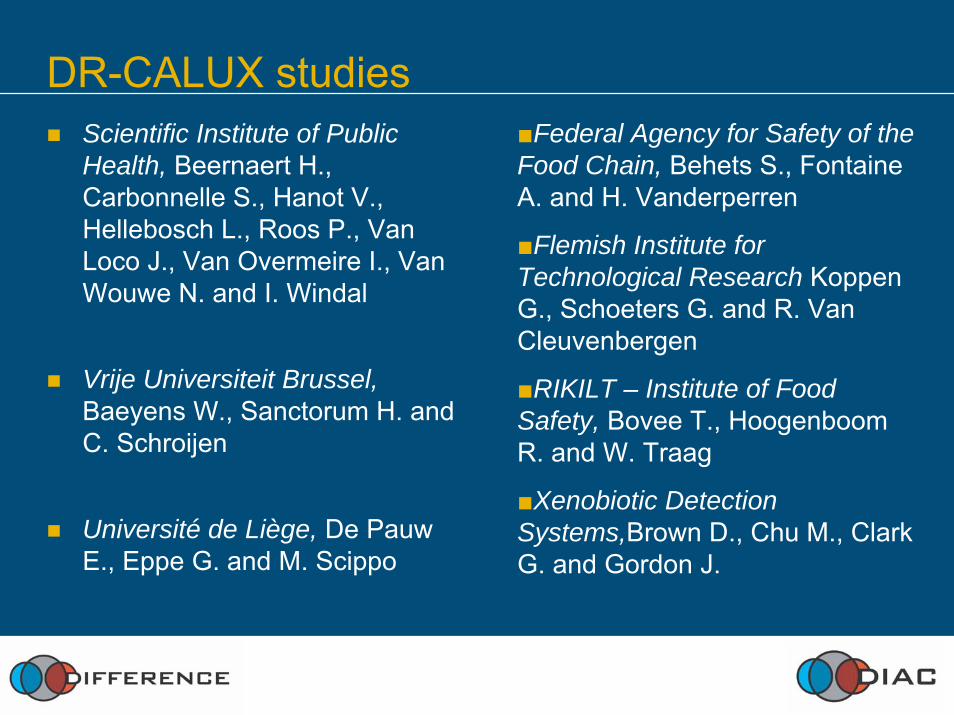
DR-CALUX studiesScientific Institute of Public Health, Beernaert H., Carbonnelle S., Hanot V., Hellebosch L., Roos P., Van Loco J., Van Overmeire I., Van Wouwe N. and I. Windal
Vrije Universiteit Brussel, Baeyens W., Sanctorum H. and C. Schroijen
Université de Liège, De PauwE., Eppe G. and M. Scippo
■Federal Agency for Safety of the Food Chain, Behets S., Fontaine A. and H. Vanderperren
■Flemish Institute for Technological Research KoppenG., Schoeters G. and R. Van Cleuvenbergen
■RIKILT – Institute of Food Safety, Bovee T., HoogenboomR. and W. Traag
■Xenobiotic Detection Systems,Brown D., Chu M., Clark G. and Gordon J.

DR-CALUX assay

CALUX activity
Cells respond to all compounds of the sample extract that activate the AhR (dioxin-like activity)
both the solvent and the sample contaminants
Total dioxin-like activity (Total TEQ of a sample)Separation of dioxins and PCBs from many other compounds

Accuracy of CALUX results
DIOXIN fraction PCB fractionCalux
0
2
4
6
8
10
12
milk
fish
oil
chic
ken
feed pork
chic
ken
tissu
e
clay
egg
herr
ing
0
2
4
6
8
10
12
milk
fish
oil
chic
ken
feed
pork
chic
ken
tissu
e
clay
egg
herr
ing
CaluxGC-HRMSGC-HRMS

REP ≠ TEF
DIOXIN fraction
0
2
4
6
8
10
0 1 2 3 4 5
CALUX-measWHO-TEF
CALUX-REP
PCB fraction
0
2
4
6
8
10
0 1 2 3 4 5
CALUX-measWHO-TEF
CALUX-REP
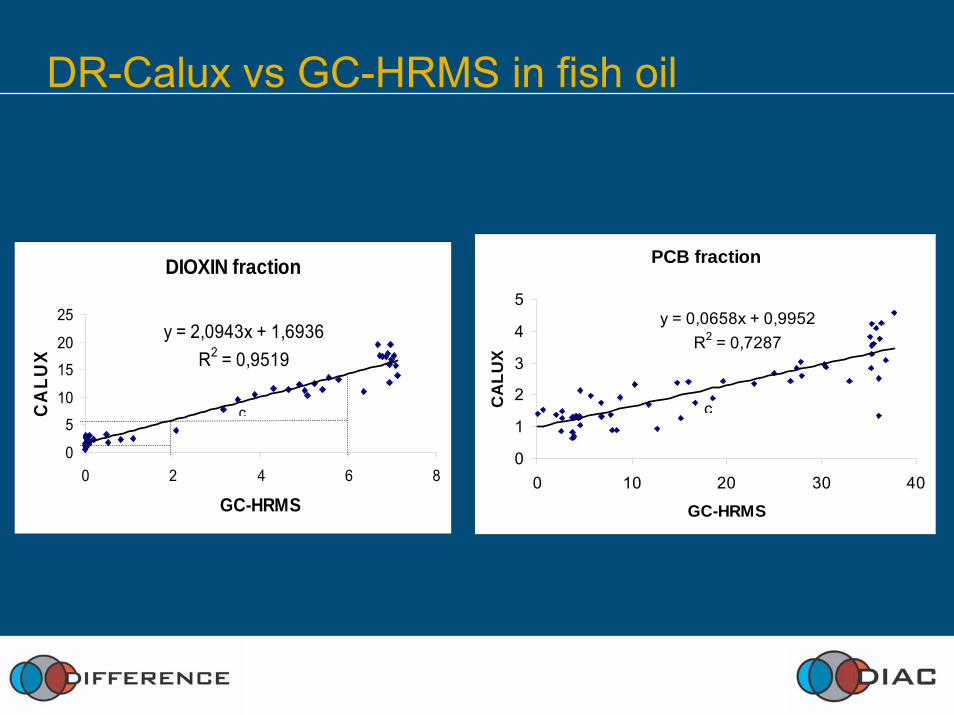
DR-Calux vs GC-HRMS in fish oil
DIOXIN fraction
y = 2,0943x + 1,6936R2 = 0,9519
0
5
10
15
20
25
0 2 4 6 8
GC-HRMS
CA
LUX
c
PCB fraction
y = 0,0658x + 0,9952R2 = 0,7287
0
1
2
3
4
5
0 10 20 30 40
GC-HRMSC
ALU
X
c

Conclusions DR-CALUX
High sensitivity Accuracy is lower Fast and cheap methodScreening method

Pressurized liquid extraction (PLE)PLE extraction: Dionex ASE 200 and ASE 300Non-selective ASE with external clean-upSelective ASE with on-line clean-up
Sulphuric acid silicaIntegrated carbon fractionation
Christoph von Holst JRCGeel Belgium
Peter Haglund, Umeå University UmeåSweden
Erland BjörklundLund UniversityLundSweden

Selective PLE fat retainer
• H2SO4/Silica gel• Florisil• Basic alumina• Neutral alumina• Acidic alumina
Na2SO4
Fat Retainer
Filter
Matrix / Na2SO4 / Sand
SFE supportFilter
n-heptane
PCBs (+ Fat)
Björklund, Müller, von Holst, Anal. Chem. 2001, 73, 4050Sporring, Björklund, J. Chrom. A 2004, 1040, 155

Fat retainers
Ratio fat/fat retainer: 0.025 Recovery about 100% Coextracted fat: 500 mg fat, 1-3 mg fat leftColour: clear florisil and sulphuric acid silica onlyReaction with H2SO4: No reaction with sulphuricacid silica
Conclusion sulphuric acid silica preferred
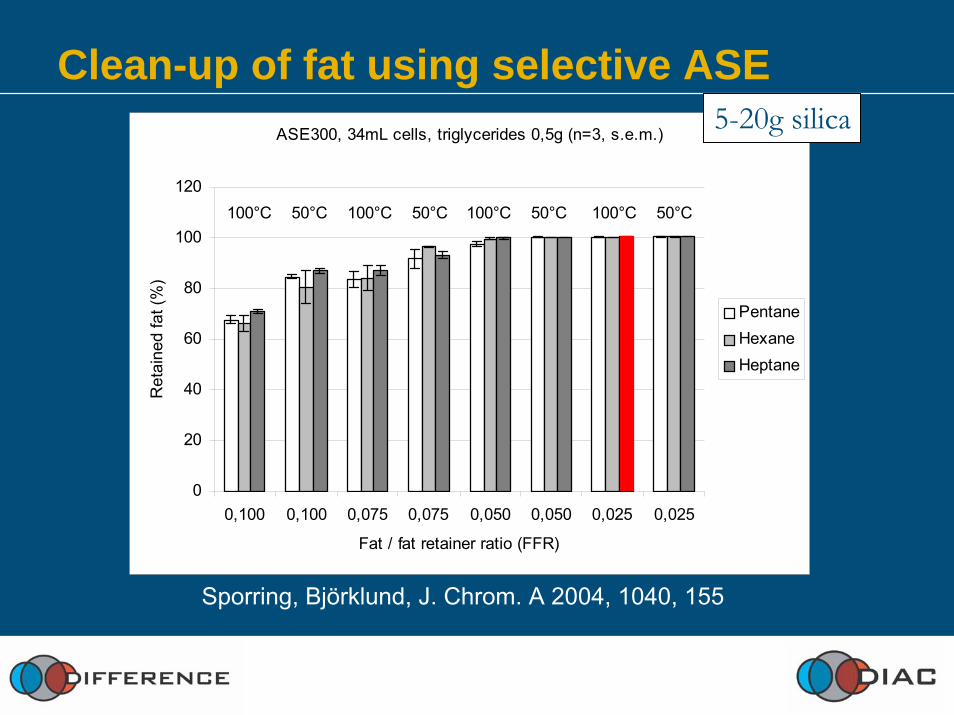
Clean-up of fat using selective ASEASE300, 34mL cells, triglycerides 0,5g (n=3, s.e.m.)
0
20
40
60
80
100
120
0,100 0,100 0,075 0,075 0,050 0,050 0,025 0,025
Fat / fat retainer ratio (FFR)
Ret
aine
d fa
t (%
)
PentaneHexaneHeptane
100°C 50°C 100°C 50°C 100°C 50°C100°C 50°C
5-20g silica
Sporring, Björklund, J. Chrom. A 2004, 1040, 155

Traditional extraction/clean-up vs. PLEVegetable oil
01234567
Lab A Lab B PLE
pgTE
Q/g
Oil
Fish oil (n=6)
02468
1012
Lab A Lab B PLE
pgTE
Q/g
Oil
PCDD/F PCB Total-TEQ
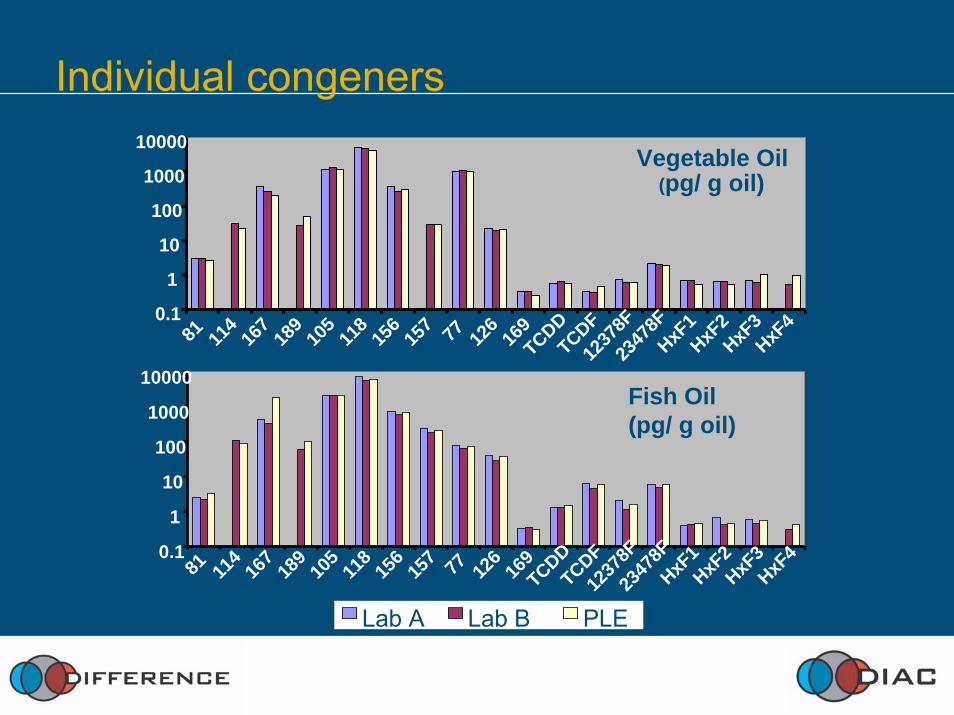
Individual congeners
Vegetable Oil(pg/ g oil)Vegetable Oil
(pg/ g oil)
0.1
1
10
100
1000
10000
81 114
167
189
105
118
156
157 77 126
169
TCDDTCDF12
378F
2347
8FHxF
1HxF
2HxF
3HxF
4
0.1
1
10
100
1000
10000
81 114
167
189
105
118
156
157 77 126
169
TCDDTCDF12
378F
2347
8FHxF
1HxF
2HxF
3HxF
4
Lab A Lab B PLE
Fish Oil(pg/ g oil)
Fish Oil: Non-ortho PCBs and PCDD/Fs6 s.
5
4
3
2
1
0
9
20 30 40 50 60 min.
6
2
1
4
3
7
10
8
5
11
12
13
5525 35 4515
6 s.
5
4
3
2
1
0
HxCDD/F
20 30 40 50 60 min.
PeCDD/F
126
77
TeCDD/F
169
10
HpCDD/F
OCDD
5525 35 4515

Selective PLE with carbonC
arbon/Celite
Matrix/Na2SO4
Na2SO4
Na2SO4
Na2SO4
7.9 %
Dionex ASE200; 33 mL cell3g Fish oil mixed in Na2SO4
“Normal” PLE parametersThree consecutive extractions (fractions)

Integrated carbon fractionation of PCBs and Dioxins
Bulk PCBs
Carbon/C
elite
1. Heptane
Mono-ortho-PCBs
Carbon/C
elite
2. Heptane:DCM (1:1)
Non-ortho-PCBs and PCDD/Fs
Car
bon/
Cel
ite
3. Toluene

Elution profile integrated carbon fractionation
Bulk-PCBsMon-ortho
PCBsNon-ortho
PCBs PCDDs andPCDFs
3 .Toluene2A. DCM/heptane (1:1)
2B. Acetone/heptane (2.5:1)1. Heptane
0
20
40
60
80
100
120
%
Fat recovery (%)Fraction 1 98,7Fraction 2 0,7Fraction 3 0,1
Fish oil

Conclusions PLE
Fast methodIntegrated carbon PLE cost efficient methodLess labour intensive than traditional methodAttractive alternative for traditional dioxin method
Validation studies
VITO (Flemish Institute for Technological Research) R. Van Cleuvenbergen
RIVOS. Van Leeuwen, J. de Boer
Other partners from DIFFERENCE and participants outside DIFFERENCE

Method validation – Interlaboratory studiesStandards, quality control solution, clean fish extractVegetable oils with spikes of PCBs, PCNs, PCDE’sFish oil, milk, vegetable oil, vegetable oils with spikes, cereal based feed, chicken, vegetable feed, egg, fish, pork
Verification of calibration curvesVerification of analytical processVerification of matrix effects during quantificationRepeatability, within & between lab reproducibility (ISO 5725)Detection CapabilitySelectivityRuggedness

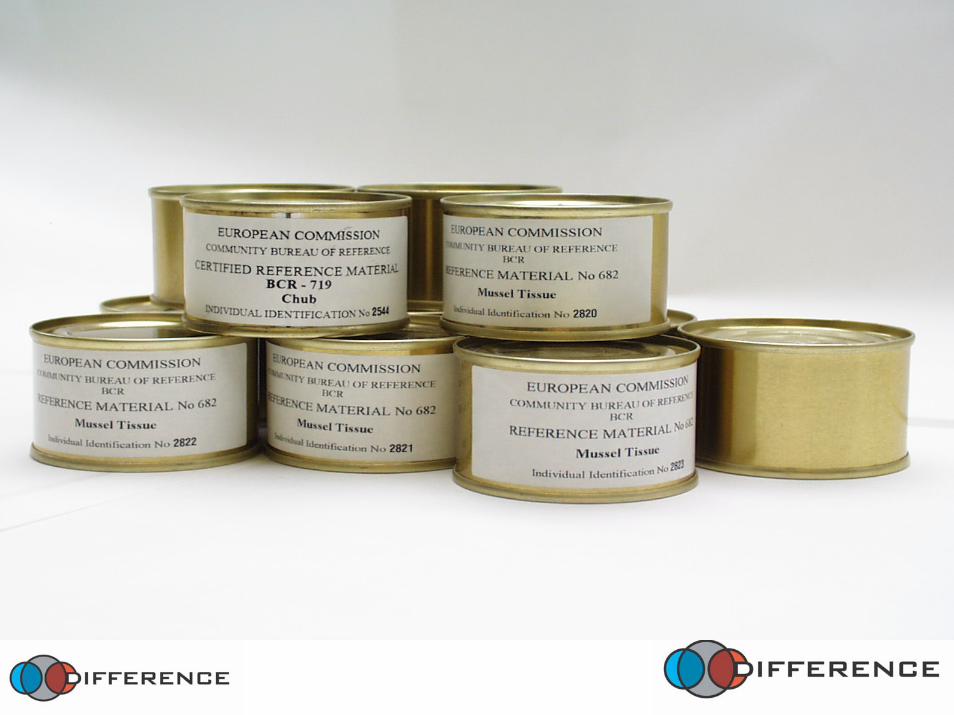
DIFFERENCE: (Candidate) CRMs for Dioxin Analysis

Fish Oil: z-scoresFISH OIL: dioxin TEQ (upperbound)
-2
-1
0
1
2
3
4
5
6
7
F G G G G F G G F F F C F C C C B B C J B B C J J A B J J J I B I A I A I I I A A ALab
z-sc
ore

Spiked MilkMILK: dioxin TEQ (upperbound)
-3
-2
-1
0
1
2
3
4
5
6
F F F F G F G C C G G A C C F C C G G J J J J J A J A I A I A I A I I I
LAB
z-sc
ore
MILK: PCB TEQ (upperbound)
-5
-4
-3
-2
-1
0
1
2
3
CAL
UX
CAL
UX
CAL
UX
CAL
UX
CAL
UX
CAL
UX
GC
-HR
MS
GC
-HR
MS
GC
-HR
MS
GC
-HR
MS
GC
-HR
MS
GC
-HR
MS
GC
-HR
MS
GC
-HR
MS
GC
*GC
GC
-HR
MS
GC
*GC
GC
*GC
GC
-LR
MS
GC
*GC
GC
*GC
GC
-HR
MS
GC
-LR
MS
GC
*GC
GC
-LR
MS
GC
-HR
MS
GC
-LR
MS
GC
-LR
MS
GC
-HR
MS
GC
-LR
MS
GC
-HR
MS
GC
-HR
MS
GC
-HR
MS
GC
-HR
MS
GC
-HR
MS
GC
-HR
MS
A A A A A A J J J J J J F F I F I I G I I F G I G F G G F G C C C C C C
LAB
z-sc
ore
CALUX:signal suppression due to high spike of mono-ortho CB-118?
GCxGC: overestimation due to combination LOQ and reporting upperbounds

Precision (%) for spiked vegetable oilWithin-Lab Reproducibility
0,0%
10,0%
20,0%
30,0%
40,0%
50,0%
0 4 8 12Conc (pg TEQ/g)
RSD
(%) CALUX
Within-Lab Reproducibility
0,0%
10,0%
20,0%
30,0%
40,0%
50,0%
0 4 8 12Conc (pg TEQ/g)
RSD
(%) GCxGC-ECD
Within-Lab Reproducibility
0,0%
10,0%
20,0%
30,0%
40,0%
50,0%
0 4 8 12Conc (pg TEQ/g)
RSD
(%) GC-HRMS
Within-Lab Reproducibility
0,0%
10,0%
20,0%
30,0%
40,0%
50,0%
0 4 8 12Conc (pg TEQ/g)
RSD
(%)
GC-LRMS
Maximum residue levelPrecision requirement

Discussion
Technique Sens
.
Acc
ur.
Prec
is.
RemarksGC-HRMS + + + Confirmatory methodGC-LRMS + + + Potential alternative for HRMS?GCxGC-ECD +/- +/- + Improved software requiredCALUX + +/- + Screening technique

ConclusionsGCxGC-ECD (and GCxGC-ToF-MS), and GC-ion-trap MS/MS may serve as alternative (routine) methods for dioxin analysisCALUX is the alternative for times of crisis, but corrections for recovery are essentialThe use of PLE will significantly reduce the extraction and clean-up time
Acknowledgement
All DIFFERENCE and
DIAC partners
Thank you for your attention
www.dioxins.nl