Embed Size (px)
Citation preview

1
STATE OF THE SECTOR 2017:
BEYOND THE TIPPING POINT
2
Foreword
This is the fourth State of the Sector report delivered under the Recovery Partnership banner, and
the second by Adfam. It has uncovered worrying signs that damage has already been done and the
capacity of the sector to respond to future cuts has been eroded. The expected further cuts by local
authorities will further reduce this capacity. These findings echoing those contained in the Advisory
Council on the Misuse of Drugs’ powerful commissioning report published in the autumn.
This year’s drug strategy contained a laudable commitment to increasing the number of people
leaving behind dependence and entering recovery. I was not alone in the sector in noting that the
long-term challenge will be ensuring there is sufficient resourcing and political will to meet that
ambition.
Unsurprisingly money is the first word on many lips. Many people we spoke to felt there may have
had been “fat in the system” which absorbed some cuts without serious negative effect. But the fat
has now been burnt and the muscle of a system which has changed, and saved, thousands of lives is
now at risk of serious damage.
Despite this there are some things England is still a world leader in. The “Orange Book” UK clinical
guidelines on clinical management of drug misuse and dependence has been refreshed this year.
They endorse everything the 2007 version contained and now include cutting-edge clinical evidence
on the delivery of interventions and guidance on treating novel psychoactive substances and over-
the-counter drug use.
We also have a very respectable penetration rate into communities of heroin users, with around
60% engaged in treatment – much more than most of Europe and North America. This sounds
positive but still leaves two in every five of the population most at risk from overdose outside
treatment and denied access to the protection from early death that it offers.
There is clearly a huge amount of people with substance misuse problems who are not getting the
help they need. Many have never accessed it at all. New figures indicated that nearly five out of six
people who are alcohol dependent are not in treatment. The continuing squeeze on resources
makes this gap ever more difficult to fill and it is possible that as they are stretched still further
services will be forced to prioritise those most at risk, making access for alcohol and cannabis users
more difficult.
Retention in treatment remains the most important factor for preventing drug-related deaths. If we
can drive up these figures we won’t only make people healthier, we’ll also keep them alive.
Alcohol remains a hidden, or at least partly unvoiced, issue. Most of the people we spoke to told us
about drugs, drug users and drug treatment systems. Maybe this was conscious, or maybe it betrays
the realities of a system still getting to grips with the size of the issue and working out how to deliver
alcohol services at scale.
Although not methodologically perfect State of the Sector 2017 is a valuable contribution to an
increasingly compelling, if undoubtedly fragmented, evidence base.
08 Fall

3
Many questions remain. Are we going to see more commissioners receiving no expressions of
interest from providers because there just isn’t enough money being made available? How might an
apprenticeship in drug and alcohol treatment drive up workforce standards? How can local areas
cope with the challenge (and opportunity) of the planned 2019/20 move to business rate retention?
How can even the most efficient, committed and innovate services square the gold-standard of the
new Orange Book with the bronze standard funding they receive?
It’s not going to be easy. But the obvious vision, passion and skills of the people we spoke to in the
writing of this report reassures me that as a society we are still offering, and will continue to offer,
life-changing support and inspiration to some of our most vulnerable citizens.
Vivienne Evans OBE, Chief Executive Adfam
December 2017

4
Table of Contents
EXECUTIVE SUMMARY AND KEY FINDINGS 6
Executive summary 6
Key findings 6
1 The potential of the sector to absorb funding cuts through efficiency savings has been
exhausted 6
2 Service capacity continues to be eroded 7
3 Only central government intervention will protect the sector from further cuts 8
4 Service models must continue to evolve 8
5 Commissioning capacity and practices remain of great interest and concern 8
1. METHODOLOGY AND REPORT STRUCTURE 10
1.1 Introduction 10
1.2 Report overview 10
1.3 Sponsorship and report writing 13
2. OVERVIEW OF EXISTING DATA 14
2.1 Drug and alcohol use 14
2.2 The drug and alcohol treatment system 2001-2013 15
2.3 The drug and alcohol treatment system from 2013 onwards 16
2.4 Advisory Council on the Misuse of Drugs – ‘Commissioning impact on drug treatment’ 19
3. FINDINGS 22
3.1 Funding 22
There is system-wide concern about falling funding levels 22
Existing funding mechanisms allow funds to flow away from the drug and alcohol sector 23
Funding cuts are already affecting the quality of services; we have passed the tipping point 24
3.2 Commissioning 25
There is on-going concern over commissioning knowledge and practice 25
There is some evidence of longer contracts, but still wide local variation 25
The prime contractor/integrated substance misuse model seems to have become the norm 26
Prime providers are perceived as influential by big and small providers alike 27
Opinion varies as to how far smaller organisations are included 27
The inclusion of small providers in contracting arrangement is seen as positive 28
Commissioning case study: Red Rose Recovery, Lancashire 28
3.3 The delivery of services 29
We have reached the limit of what can be achieved through efficiencies 29
Funding pressures are driving service re-design and technological innovation 30
Frontline pressures are altering patterns of, and reducing, client contact 30
Funding pressures are impacting on staffing levels and staff welfare with knock-on effects for
service users 31
Volunteers are increasingly central to service delivery – and this brings new challenges 31
There are mixed views on workforce development 32
3.4 The delivery of services – concerns for the future 33
The capacity of the sector is under threat from the withdrawal of public sector funding 33

5
More difficult choices about service configuration lie ahead 34
Service providers are concerned about their ability to maintain safety and quality 35
3.5 Client profile 35
Alcohol is perceived as a growing and still hidden problem 35
The challenge of helping clients with multiple needs is growing, exacerbated by increasing social
deprivation 36 General issues 36 Housing 38 Employment 38
Managing dual diagnosis remains particularly problematic 39
The treatment system should be more responsive to local patterns in drug-related deaths 40
Core services must remain flexible enough to be responsive to ever-changing patterns of drug
use 41
The importance of family and friends to recovery is widely recognised, but not universally
reflected in services 42
5. ACKNOWLEDGEMENTS 44
6. DATA SOURCES FOR SECTION 2 45

6
EXECUTIVE SUMMARY AND KEY FINDINGS
Executive summary This report was commissioned as part of the work of the Recovery Partnership, by Department of
Health as one of a series of “State of the Sector” reports on the drug and alcohol treatment sector in
England. Using qualitative research, it provides a snapshot of the sector during the period of
December 2016 to March 2017.
The report finds that reductions in public sector funding channelled to the drug and alcohol sector
have been absorbed, principally through efficiency savings and service redesign. As such, there had
so far been no serious compromise in service quality or safety standards at the time the research
was conducted. However, the report also finds that, while further evolution of service models is
needed to encompass multiple needs, the capacity of the sector to respond to further cuts has been
seriously eroded. This is especially true on the provider side, but in terms of commissioning capacity
also.
The sector has passed the point at which efficiencies and service remodelling can continually
compensate for the loss of funding and moved into a period where choices about service
configuration have become much harder. Decisions will be required as to what elements of service
are retained or withdrawn.
We are presented with a scenario still unfolding at all levels: central government, local governance
and the shape of provision, as well as the challenges of ever-changing patterns of drug use.
Commissioners and service providers will continue to develop new delivery models to respond to
the multiple pressures being faced. However, the on-going, annual reductions in Public Health Grant
and the lack of protection by funding mechanisms afforded to local authority budgets for such
services are, taken together, of serious concern. These are expected to result in a significant loss of
benefits currently delivered for service users and their families and communities.
The report sets out in narrative form many aspects of commissioning and practice which can be used
as a starting point for informing policy and for further research.
Key findings
1 The potential of the sector to absorb funding cuts through efficiency savings has been exhausted
This report shows how the sector has adapted under stress. While service re-design and innovation
are continuous in this sector as in any other, some of it using digital technologies, this has been
made imperative by funding cuts. There is a sense of the scale of the cuts being challenging to
manage, but also of them and other pressures having been used as an opportunity for reconfiguring
services and innovating, both in re-commissioning services and through service re-design by
providers.

7
This potential for service re-design is far from exhausted, especially in relation to integrating drug
and alcohol services with those relating to mental health, housing and employment. (However,
these new models would, once developed and implemented, need to be evaluated and though the
hope would naturally be they would save money this is not inevitable.)
However, this report also underlines system-wide concern about falling funding levels. The resulting
reductions in contract values shows a layered impact on providers and the services they deliver.
In terms of numbers of people accessing services, Section 2 of this report notes the 7% fall in
number entering treatment. Clearly, efficiency savings have been made in the process of absorbing
budget reductions, but the potential for these appears to have been largely exhausted or surpassed
in the areas in question. Despite this, everyone in the system is still being asked “to do more for
less”. This is of great concern as the capacity of the sector is already considered to be under severe
threat from the withdrawal of public sector funding.
The sector has reached the limit of what can be achieved through efficiencies, now being beyond the
point where efficiencies and service redesign can continually compensate for the loss of funding. It
has moved into a period where choices about service configuration have become much harder, with
decisions required as to which elements are retained or withdrawn.
This report demonstrates the concern that local authorities will now have to trade off the number of
people accessing services against the comprehensive nature (and therefore overall effectiveness) of
the services provided. The impacts of further cuts will become more visibly negative. For example,
some envisage that services and infrastructure will be stripped back to the basics, also decreasing
the wrap-around support that sustains individual recovery. This heads in the opposite direction to
providing the comprehensive services needed to underpin complete individual recovery or
facilitating improvement to the landscape of services for people with multiple needs.
2 Service capacity continues to be eroded
There are already numerous example of the erosion of capacity. These include changes to the
workforce via the partial replacement of paid, professional staff with volunteer workers; detrimental
pressure on the workforce which also affects staff retention; and a reduction in training and
development opportunities. Particularly noteworthy are the oft-reported sharp increases in
caseloads; the reduction in client contact; and changing, presumably sub-optimal, patterns of client
contact such as replacing one-to-one contact with group work. There is also a loss of spare capacity
to innovate or test new service models.
This erosion may not have immediately translated into worsening outcomes but sometimes impacts
on the quality of service delivered. It undermines the ability of the sector to provide the
comprehensive and high quality services that are needed to take service users beyond stabilisation
and through their recovery journeys. Significantly, it also limits capacity to deal with the further
pressures or funding cuts expected in the immediate future.
Indeed, service providers are concerned about their ability to maintain safety and quality in an
environment where the pace of change has not yet steadied. As pointed out, this all falls far short of
the Government’s ambitions for the sector.

8
The prospect is raised of there no longer being psychiatrists with specialist substance misuse
knowledge in future. The importance of inspection by the Care Quality Commission is noted, though
the application of the inspection regime is questioned.
3 Only central government intervention will protect the sector from further cuts
The report describes how existing funding mechanisms give no protection to drug and alcohol
services, allowing funding to flow away from the sector, given that it is not a priority for all local
decision makers. There is universal uncertainty about the impact of local authorities being able to
retain business rates collected. This is rightly seen as an extension of local authority freedom to
spend these funds and likely to result in a further diminishing of protection for funds for public
health and drugs and alcohol treatment in particular. Only some form of direction or control from
central government is seen as likely to halt or slow this trend.
There is also a fear that the effects of the business rate retention scheme will have a
disproportionately negative impact where the need for drug and alcohol services is greatest.
4 Service models must continue to evolve
Consolidation of contracts into larger, integrated contracts seems to be becoming the norm. The
integrated services with one prime contractor has become the archetype in the areas visited. The
potential of peer support models is evident in the report. The importance of family and friends to
recovery is widely recognised, but not universally integrated into services. The use of volunteers and
peer support is increasing, driven both by very positive outcomes and cost pressures. This brings a
new set of management issues.
The prevalence of alcohol-related harms and complexity of helping people with multiple needs are
both perceived to be increasing. The latter is exacerbated by worsening social deprivation. There is a
mixed picture on progress in joining up services needed by people with multiple needs. Progress is
both spurred on by the need to spend less and also hampered by the withdrawal under pressure into
policy silos. Managing dual diagnosis is highlighted as particularly problematic, as are the chronic
health problems of an aging cohort of opioid users. It is felt that core services must remain
responsive to these changing demographics and patterns of use, principally this older cohort, local
patterns in drug-related deaths and the ever-changing challenges of new psychoactive substances
and patterns of drug use. The importance of rolling out the use of naloxone in preventing deaths is
evident.
5 Commissioning capacity and practices remain of great interest and concern
Sub-contracting continues to evolve in parallel with the development of new service models. Smaller
organisations are seen to bring valuable local and specialist knowledge, but there is a wide variation
in views as to whether smaller organisations are valued and able to win contracts – or are effectively
excluded. Opinion also varies as to whether this encourages or stifles specialist services, peer-led
models, co-production with service users and innovation generally. However, prime contractors
clearly hold a lot of power, in once case being viewed as a quasi-commissioner.

9
There is concern over the loss of specific substance misuse knowledge in commissioning teams,
which makes it difficult for them to incorporate emerging evidence, good practice and delivery
models into contract specifications. This results mainly from increased staff turnover and the
location of commissioners in teams with much wider responsibilities. There is also the prospect of
increased use of joint commissioning of services across several local authority areas.
The long-rehearsed pros and cons of longer or shorter contracts are evident in the report and are
not repeated here. However, there is wide, perhaps diverging local variation in contract lengths with
areas seemingly moving to opposite extremes.

10
1. METHODOLOGY AND REPORT STRUCTURE
1.1 Introduction
In previous years, the State of the Sector reports were based on an online survey and a number of
detailed interviews with key figures in the drug and alcohol treatment sector. This year’s report has
omitted the survey and moved the primary focus to stakeholder interviews. This decision was made
for two reasons. Firstly, a review of relevant existing data in the public domain already provides in
greater depth some of the information collected in the survey. Secondly, the methodology of
previous years had limitations that curtailed the use of the data: chiefly the self-selecting nature of
the sample and the impossibility of direct comparison with previous years’ data.
Therefore, this report adds to the extant data by taking a more narrative and qualitative approach by
highlighting the experiences, opinions and concerns of actors within the sector. It consists of an
Overview of Existing Data derived from publicly accessible data, followed by a presentation of the
Findings derived from the qualitative data gathered. The findings are necessarily more
impressionistic than in previous years.
1.2 Report overview
The Overview of Existing Data in Section 2 aims to introduce the reader to the ‘big picture’ issues in
the sector and provide context for the Findings in the following section. It draws on various publicly
accessible data sources, references Collective Voice1 briefings and cites findings from the report,
‘Commissioning Impact on Drug Recovery’ from the Advisory Council on the Misuse of Drugs
(ACMD)’s Recovery Committee.
The qualitative evidence that underpins the remainder of this report is derived from a series of
telephone interviews conducted between December 2016 and March 2017, targeting a range of
different roles within the sector.
The first tranche was concentrated in two local authorities in England: the London Borough of
Newham and Lancashire County Council. Supplementary information was also gathered from Essex
County Council and Greater Manchester Combined Authority. The second tranche consisted of
interviews with a number of Chief Executives of third sector drug and alcohol service providers
spread around the country, namely:
David Higham – The Well, a community interest company, supporting people recovering
from drug and alcohol addiction through therapy, counselling, peer mentoring, employment
training and social activities.
John Jolly – Blenheim, a charity that provides support to drug and alcohol users and their
family and carers by running a number of recovery services across London.
Steve Rossell – Cranstoun, which provides community and residential treatment and works
with families of those in recovery.
1 Coalition of many of the largest third sector drug and alcohol treatment providers

11
Tim Sampey – Build on Belief, which offers a range of socially based services for people who
have, or have had, substance misuse issues. BOB is a user-led organisation.
Paul Townsley – Developing Initiatives for Support in the Community (DISC), which offers
services covering drugs and alcohol, housing, employment, training and education, health,
children, young people and families, criminal justice and community and offender
rehabilitation.
John Trolan – The Nelson Trust, a charity that runs both residential and community-based
services for the treatment of substance misuse.
Peter Yarwood – Red Rose Recovery a user-led recovery infrastructure organisation that
aims to help those in recovery through a community-approach.
Other Chief Executives:
Niamh Eastwood – Release, a national centre of expertise on drugs and drugs law, providing
advice and information on these issues to the public, professionals and those campaigning in
this area.
Paul Hayes – former Chief Executive of the National Treatment Agency for Substance Misuse
and current Chief Executive of Collective Voice, coalition of third sector drug and alcohol
treatment providers.
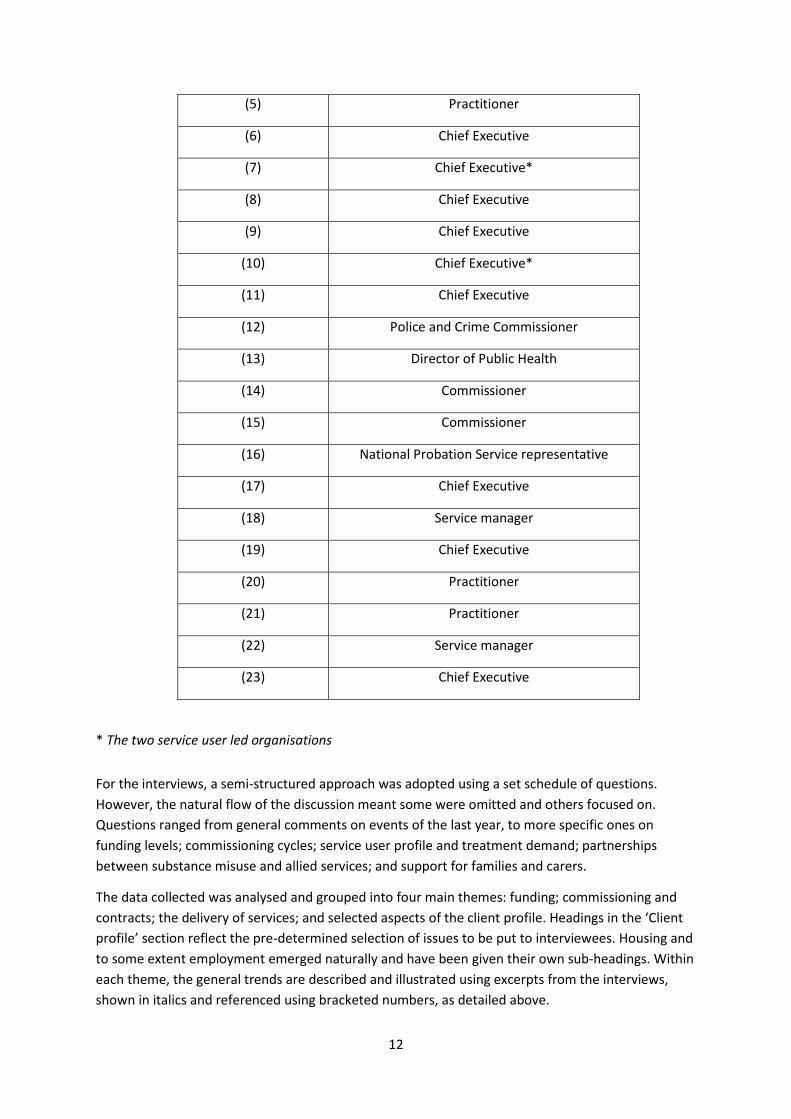
In total, 23 interviews were conducted across the following frontline and strategic roles:
6 Commissioners (primarily of substance misuse services, but also allied services)
1 Police and Crime Commissioner
1 Director of Public Health
7 Chief Executives of drug and alcohol service providers*
2 Service manager
3 Substance misuse practitioners
2 Chief Executives of other organisations
1 National Probation Service (NPS) representative
* Including Chief Executives of two service user led organisations.
Numbers in brackets in the text refer to the following table, by means of which the interviewee’s
role can be identified:
Participant Number
quoted in the text
Role
(1) Commissioner
(2) Commissioner
(3) Commissioner
(4) Commissioner
12
(5) Practitioner
(6) Chief Executive
(7) Chief Executive*
(8) Chief Executive
(9) Chief Executive
(10) Chief Executive*
(11) Chief Executive
(12) Police and Crime Commissioner
(13) Director of Public Health
(14) Commissioner
(15) Commissioner
(16) National Probation Service representative
(17) Chief Executive
(18) Service manager
(19) Chief Executive
(20) Practitioner
(21) Practitioner
(22) Service manager
(23) Chief Executive
* The two service user led organisations
For the interviews, a semi-structured approach was adopted using a set schedule of questions.
However, the natural flow of the discussion meant some were omitted and others focused on.
Questions ranged from general comments on events of the last year, to more specific ones on
funding levels; commissioning cycles; service user profile and treatment demand; partnerships
between substance misuse and allied services; and support for families and carers.
The data collected was analysed and grouped into four main themes: funding; commissioning and
contracts; the delivery of services; and selected aspects of the client profile. Headings in the ‘Client
profile’ section reflect the pre-determined selection of issues to be put to interviewees. Housing and
to some extent employment emerged naturally and have been given their own sub-headings. Within
each theme, the general trends are described and illustrated using excerpts from the interviews,
shown in italics and referenced using bracketed numbers, as detailed above.

13
The sample of interviewees was selected based on previous contacts, snowball sampling and desk-
based research on the local picture. As the number of interviews is limited, such sampling methods
can lead to sample bias and will not accurately reflect the sector in its entirety. Furthermore, there
are factors which may have prevented invited interviewees from taking part: providers going
through re-commissioning, for instance. Other constraints include capacity, confidentiality
agreements or expectations. This could potentially result in an under-representation of some
responses though every attempt was made to pursue a representative sample. Additionally, as with
any qualitative research, there is an element of unavoidable subjectivity and researcher bias.
As this year’s report takes a different approach to previous iterations, it is difficult to make direct
comparisons to previous State of the Sector reports. The most it can therefore do is comment on
patterns found, and highlight concerns and opinions where they appear to be consistent from area
to area. It does not claim to paint a definitive picture of what is happening throughout the country;
but considered alongside other rich evidence sources, including the ACMD’s work on commissioning,
a valuable composite picture emerges.
1.3 Sponsorship and report writing
The report was produced by Adfam on behalf of the Recovery Partnership, which was funded by the
Department of Health. The research is therefore limited to England.
14
2. OVERVIEW OF EXISTING DATA2
2.1 Drug and alcohol use
The United Kingdom has high rates of drug use compared to its neighbours. Rates over the period
2006 to 2014 are relatively high compared with other European countries across almost all estimates
of drug use, whether categorised by drug (cannabis, cocaine, amphetamines, ecstasy or “problem
drug use”3) or by age range (15 to 64 years old, 15 to 34 years old and school age). Use of cocaine by
15 to 34 year olds and the school age populations is in the highest band compared to the rest of
Europe. (EMCDDA, 2017).
The Crime Survey for England and Wales (CSEW) (Home Office, 2017) is recognised as a reasonably
good measure of recreational drug use. It tells us that around 1 in 12 (8.5%) adults aged 16 to 59 had
taken a drug in the last year (2016/17), which is about 2.8 million people. The trend in “last year
drug use” has been flat for the last eight years, but is lower than a decade ago (10.1% in the 2006/07
survey). The fall from that time is largely accounted for by less use of cannabis and to some extent
amphetamines.
“Last year drug use” is much higher among 16 to 24 year olds. This measure was on a long term
downward trend from 32% in 1998 to 22.4% in 2008/09. Since then, it had been in the range 18-21%
with the exception of a possibly anomalous figure in 2012/13. It now stands at 19.2%, which is about
1.2 million people.
However, the CSEW figures do not accurately reflect the entire population, given that the underlying
data does not cover groups such as homeless people; those living in institutions such as prisons or
student halls of residences, which have higher proportions of drug use; and problematic drug users
who are unable to take part in an interview. We must look therefore to other prevalence estimates.
The estimated number of opiate and/or crack cocaine users (OCU) increased by 2% to about 301,000
between 2011/12 and 2014/15. Within this group, the estimated number of opiate users rose only
slightly, but the number of crack cocaine users rose by 10%. In the 35 to 64 age group, the estimated
number of OCU rose by 18%, but fell by 16% in the 25 to 34 age group over the same period (Hay,
dos Santos and Swithenbank, 2017).
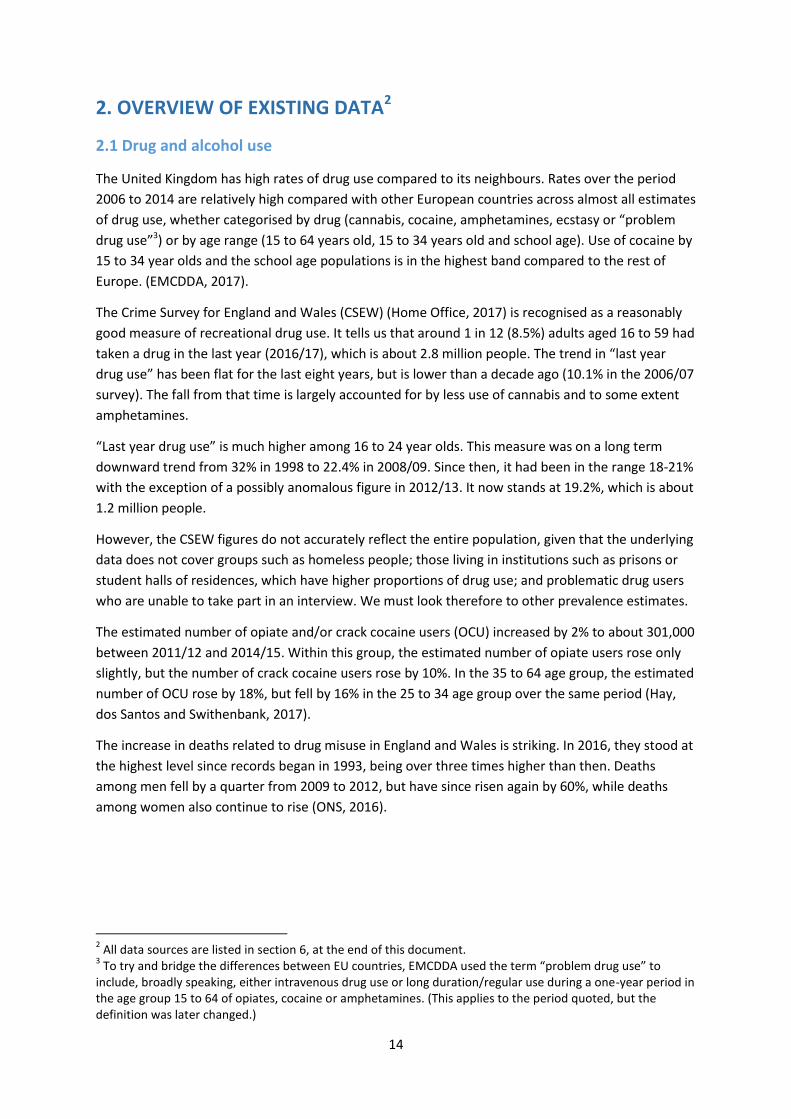
The increase in deaths related to drug misuse in England and Wales is striking. In 2016, they stood at
the highest level since records began in 1993, being over three times higher than then. Deaths
among men fell by a quarter from 2009 to 2012, but have since risen again by 60%, while deaths
among women also continue to rise (ONS, 2016).
2 All data sources are listed in section 6, at the end of this document.
3 To try and bridge the differences between EU countries, EMCDDA used the term “problem drug use” to
include, broadly speaking, either intravenous drug use or long duration/regular use during a one-year period in the age group 15 to 64 of opiates, cocaine or amphetamines. (This applies to the period quoted, but the definition was later changed.)

15
Regarding alcohol consumption in England the number of people estimated to be dependent on
alcohol and potentially in need of specialist treatment is around 600,000. Of these 57.4% are
estimated to wish to reduce their drinking. (Pryce et al., 2017).
Alcohol-related hospital admissions and deaths have risen markedly over the last decade. Using a
narrow measure, there were an estimated 339,000 hospital admissions related to alcohol
consumption in England in 2015/16, 22% higher than 2005/06. On a broader measure, there were
1.1 million in 2015/16, a rise of 4% from the previous year and representing 7% of all hospital
admissions4. Just under two-thirds of patients were male. In 2015, there were 6,813 deaths which
were related to the consumption of alcohol. This is 1.4% of all deaths. This is similar to the year
before but an increase of 10% on 2005 (NHS Digital, 2017).
2.2 The drug and alcohol treatment system 2001-2013
The importance of drug and alcohol treatment can be seen from the commentary of Public Health
England’s new Public Health Dashboard (Public Health England, 2017). This explains there is
compelling evidence that treatment touches on health outcomes in every part of the country; and
that delivery of these services will therefore impact on future demand for other council and NHS
services. Treatment services can “improve the lives of individuals, the life chances of their children
and family, and community stability”5. Drug treatment interventions, it says, have a significant
4 Measures defined in “Statistics on Alcohol”, England, 2017 (NHS Digital): “Two measures for alcohol-related
hospital admissions have been used: Narrow measure – where an alcohol-related disease, injury or condition was the primary reason for a hospital admission or an alcohol related external cause was recorded in a secondary diagnosis field; Broad measure – where an alcohol-related disease, injury or condition was the primary reason for hospital admission or a secondary diagnosis.” 5 From their Indicator Rationale document
www.google.co.uk/url?sa=t&rct=j&q=&esrc=s&source=web&cd=1&ved=0ahUKEwi46N-
0
200
400
600
800
1,000
1,200
1,400
1,600
1,800
2,000
19
93
19
94
19
95
19
96
19
97
19
98
19
99
20
00
20
01
20
02
20
03
20
04
20
05
20
06
20
07
20
08
20
09
20
10
20
11
20
12
20
13
20
14
20
15
20
16
Number of deaths related to drug misuse (England and Wales) 1993–2016
Males Females

16
impact on reducing the spread of blood-borne viruses, reducing drug related deaths and reducing
crime. Alcohol treatment has a significant impact in reducing alcohol related deaths and in reducing
crime and health costs. This report focuses on qualitative research across the drug and alcohol
sector. It is therefore useful to introduce quantitative data to provide context to the Findings below.
Between 2001 and 2008, investment in drug treatment increased from £250 million a year to £750
million a year (Collective Voice, 2016) which contributed to the rapid expansion of access to
treatment with much reduced waiting times and steady improvements in treatment quality and the
number of people completing treatment. It also led to reduced injecting drug use; very low levels of
HIV prevalence among injecting drug users; a decline in the number of new young heroin users; and
dramatic reductions in drug related crime.
The Drug Strategy of 2010 aimed to expand on this legacy. Despite the challenging financial climate,
investment was maintained at 2008 cash levels to lock in the public health and crime reduction
benefits seen until then. However, there has been a sharp rise in drug related deaths in England and
Wales since 2012, reaching the highest level since records began in 1993.
2.3 The drug and alcohol treatment system from 2013 onwards
In April 2013, local authorities assumed responsibility for commissioning drugs and alcohol
treatment, being allocated Public Health Grant on a needs-based formula, using resources previously
channelled to NHS Primary Care Trusts. Drug and alcohol services accounted for around one third of
the local public health spend that year.
For some, the shift in responsibility brought worries about disinvestment. Within public health,
treating those with serious substance misuse problems may not be a natural priority. For example,
on a population-wide basis, deaths from smoking are much higher than deaths from drugs or
alcohol. Furthermore, acquisitive crime was always noted as the big driver for investment, but is of
less concern nowadays. These worries were exacerbated by post-2012 funding mechanisms which
do not list drug and alcohol services among the public health functions which local authorities must
provide and which give no protection to these services within the ring-fence for public health
funding.
Concerns about disinvestment can now be fortified with hard data, namely local authority budget
data retrieved from the Department for Communities and Local Government (DCLG, 2013 to 2017).
These show the year-on-year fall since the peak in 2014/15 of aggregated planned expenditure by
English local authorities on drug and alcohol services (Collective Voice, 2017). However, there is
circumstantial evidence to show that net expenditure in the wider sector, including prisons and
secure estate, fell from over £1 billion in 2012/13 to less than £800 million planned expenditure in
2017/18 (Collective Voice, 2017).
The DCLG data is given in more detail below. Note that planned expenditure is essentially a budget
and usually differs from actual expenditure occurring during the year.
n5frXAhWKUlAKHd8uBKAQFggpMAA&url=https%3A%2F%2Fhealthierlives.phe.org.uk%2Fdocuments%2FPHD%2520Indicator%2520rationale%2520paper%252005102017.docx&usg=AOvVaw2ZG40zx5En-j2-8DZyPiq8
17
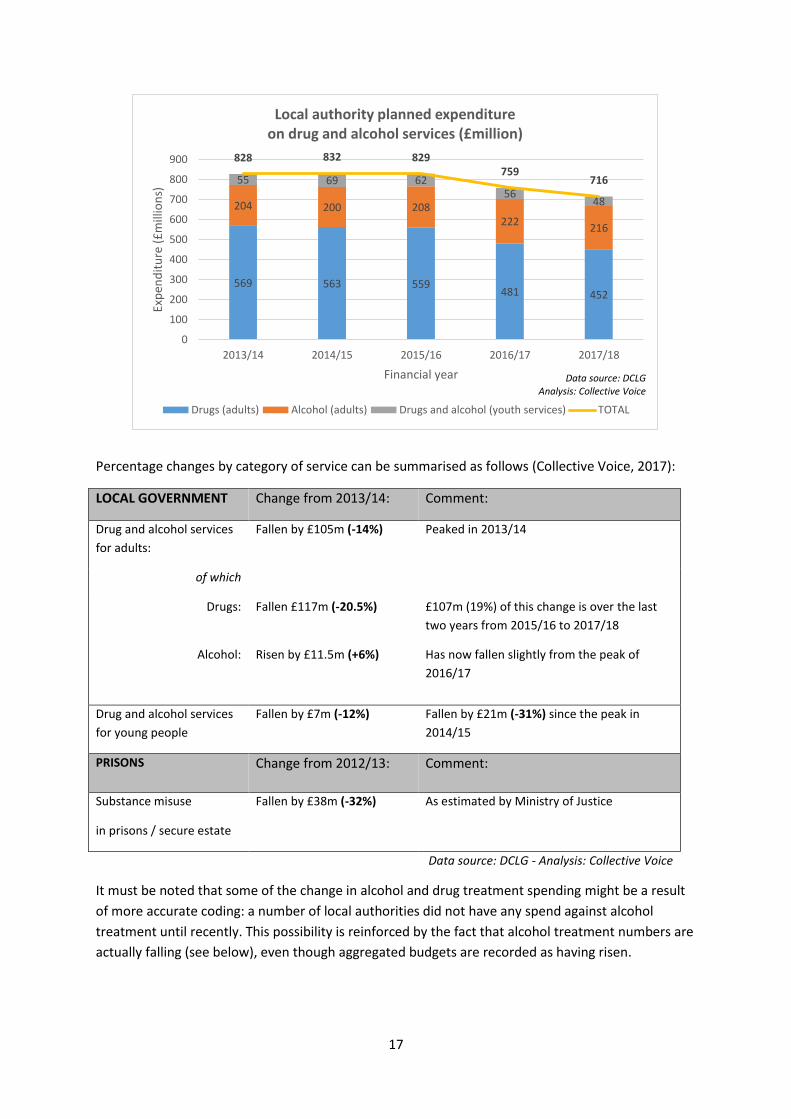
Percentage changes by category of service can be summarised as follows (Collective Voice, 2017):
LOCAL GOVERNMENT Change from 2013/14: Comment:
Drug and alcohol services
for adults:
Fallen by £105m (-14%) Peaked in 2013/14
of which
Drugs: Fallen £117m (-20.5%) £107m (19%) of this change is over the last
two years from 2015/16 to 2017/18
Alcohol:
Risen by £11.5m (+6%) Has now fallen slightly from the peak of
2016/17
Drug and alcohol services
for young people
Fallen by £7m (-12%) Fallen by £21m (-31%) since the peak in
2014/15
PRISONS Change from 2012/13: Comment:
Substance misuse
in prisons / secure estate
Fallen by £38m (-32%) As estimated by Ministry of Justice
Data source: DCLG - Analysis: Collective Voice
It must be noted that some of the change in alcohol and drug treatment spending might be a result
of more accurate coding: a number of local authorities did not have any spend against alcohol
treatment until recently. This possibility is reinforced by the fact that alcohol treatment numbers are
actually falling (see below), even though aggregated budgets are recorded as having risen.
569 563 559 481 452
204 200 208 222
216
55 69 62 56
48
828 832 829 759
716
0
100
200
300
400
500
600
700
800
900
2013/14 2014/15 2015/16 2016/17 2017/18
Exp
end
itu
re (
£m
illio
ns)
Financial year
Local authority planned expenditure on drug and alcohol services (£million)
Drugs (adults) Alcohol (adults) Drugs and alcohol (youth services) TOTAL
Data source: DCLG Analysis: Collective Voice

18
Though the picture is complex, the overall numbers of people in the drug and alcohol treatment
system is seen to have declined in parallel to the falls in local authority budgets set out above. The
total number of people in treatment showed peaks of 311,667 in 2009/10 and 301,944 in 2013/14,
with a steady fall thereafter, leaving 279,793 people in treatment now (Public Health England, 2016),
a fall of 7%.
These numbers should not be taken as measures of need, as they are also shaped by other factors,
such as capacity in the sector and the ability to reach those not yet accessing treatment, which are
both dependent on available resources. For example, the number of people dependent on alcohol
and potentially in need of specialist treatment is estimated to be around 600,000 (Pryce et al., 2017),
but the number of people in treatment is only around 80,000 and has declined by about 12% since
its peak in 2013/14. (This and the graph below gives the number of people in treatment for alcohol
dependence only, but a further 28,000 are in treatment for dependence on both non-opiate drugs
and alcohol.)
0
50000
100000
150000
200000
250000
300000
350000
Clients in contact with substance misuse treatment over time
Opiates Non-opiate only Non-opiate and alcohol Alcohol only Total

19
2.4 Advisory Council on the Misuse of Drugs – ‘Commissioning impact on drug
treatment’
The ACMD’s 2017 report’6 makes the following conclusions and recommendations:
Conclusion 1
Despite the continuation of the ring-fenced Public Health Grant to local authorities until April 2019,
reductions in local funding are the single biggest threat to drug misuse treatment recovery outcomes
being achieved in local areas.
Recommendations
National and local government should give serious consideration to how current levels of investment
can be protected, including mandating drug and alcohol misuse services within local authority
budgets and/or placing the commissioning of drug and alcohol treatment within NHS commissioning
structures.
National government should ensure more transparent and clear financial reporting on local drug
misuse treatment services, together with new mechanisms to challenge local disinvestment or falls
in treatment penetration.
National government’s commitment to develop a range of measures which will deliver greater
transparency on local performance, outcomes and spend should include a review of key
performance indicators for drug misuse treatment, particularly those in the Public Health Outcomes
6 Based on evidence obtained from a wide range of sources including earlier versions of this report, a desktop
review of published literature, an online survey, statements from professional bodies and evidence sessions and preparations from a wide range of organisations and actors including PHE and DPHs
35
22
1
40
11
4
54
69
6
78
65
8
88
08
6
88
02
0
86
41
6
87
54
4
91
65
1
89
10
7
85
03
5
80
45
4
0
10000
20000
30000
40000
50000
60000
70000
80000
90000
100000
Clients in contact with substance misuse treatment over time: alcohol only

20
Framework (PHOF), to provide levers to maintain drug treatment penetration and the quality of
treatment and achieve reductions in drug-related deaths.
Conclusion 2
The quality and effectiveness of drug misuse treatment is being compromised by under-resourcing.
Recommendations
National bodies should develop clear standards, setting out benchmarks for service costs and
staffing to prevent a ‘drive to the bottom’ and potentially under-resourced and ineffective services.
The Government’s new Drug Strategy Implementation Board should ask PHE and the Care Quality
Commission to lead or commission a national review of the drug misuse treatment workforce. This
should establish the optimal balance of qualified staff (including nurses, doctors and psychologists)
and unqualified staff and volunteers required for effective drug misuse treatment services. This
review should also benchmark the situation in England against other comparable EU countries.
Conclusion 3
There is an increasing disconnection between drug misuse treatment and other health structures,
resulting in fragmentation of drug treatment pathways (particularly for those with more complex
needs).
Recommendation
Local and national government should consider strengthening links between local health systems
and drug misuse treatment. In particular, drug misuse treatment should be included in clinical
commissioning group commissioning and planning initiatives, such as local Sustainability and
Transformation Plans (STPs).
Conclusion 4
Frequent re-procurement of drug misuse treatment is costly, disruptive and mitigates drug
treatment recovery outcomes.
Recommendation
Commissioners should ensure that recommissioning drug misuse treatment services is normally
undertaken in cycles of five to ten years, with longer contracts (longer than three years) and careful
consideration of the unintended consequences of recommissioning. PHE and the Local Government
Association (LGA) should consider the mechanisms by which they can enable local authorities to
avoid re-procurement before contracts end in systems that are meeting quality and performance
indicators.

21
Conclusion 5
The ACMD is concerned that the current commissioning practice is having a negative impact on
clinical research into drug misuse treatment across NHS and third (voluntary) sector providers. Many
treatment providers are third sector and current research structures are not designed to recognise
them. System churn due to recommissioning and reduced resources mitigates the stability and
infrastructure required for research.
Recommendation
The Government’s new Drug Strategy Implementation Board should address research infrastructure
and capacity within the drugs misuse field. Any group set up to work on this should include:
government departments;
research bodies such as the Medical Research Council (MRC) and the National Institute for
Health Research (NIHR); and
other stakeholders.
22
3. FINDINGS
3.1 Funding
There is system-wide concern about falling funding levels
Existing funding mechanisms allow funds to flow away from the drug and alcohol sector
Funding cuts are already affecting the quality of services; we have passed a tipping point
There is system-wide concern about falling funding levels
The qualitative nature of this report inevitably masks variations in changes to funding allocated to
local authorities and in local authorities’ choices as to how to deploy that funding. However, almost
all stakeholders within the system are worried by increasing expectations coupled with decreasing
funds. A point made by a number of interviewees is that, despite the potential for efficiency savings
having in general terms reached and passed its limit, with some variation between areas, everyone is
still being asked “to do more for less”.
The interviews carried out for this report reflect the varied picture of local authorities funding for
substance misuse services, as summarised in Section 2. One Chief Executive comments that the
continued strain on local authorities’ budgets has led to cuts of 10-20% in general local authority
budgets and 20-40% in tendering budgets (9). Another explains that the contract value has
decreased from £7 to £5.3 million, necessitating widespread cuts and the replacement of paid staff
with volunteers and mentors (6). However, two Chief Executives told us they have not experienced
significant reductions in funding (i.e. no reductions in contract value). One grassroots service-user
led body reports an increase in funding from local sector bodies on the basis of innovative service
models which save their funders money; but notes that funding has now run out (7).
The transfer to local authorities of substance misuse services following the Health and Social Care
Act 2012 is cited as pivotal by one Chief Executive, by implication that the transfer has affected how
resources are allocated in a worsening financial climate. Previously ‘drugs and alcohol’ was a
priority, but it is not anymore, and certainly will not be for local authorities who have to make
difficult choices regarding funding (11). Another Chief Executive, who is not commissioned but has
received some grant funding, notes a distrust of and reluctance to invest in peer-led recovery
models. This is despite his organisation helping prolific offenders, where one funder acknowledges a
rapid return in investment and research demonstrates the high costs of allowing prolific offenders to
continue to commit crime7. He adds, I don’t know anyone else getting these results, but the
achievements are not really appreciated (8).
7 Research undertaken by the author found that, based on an average offending rate of 112 crimes per year
the costs to society of one prolific offender committing crime per year is £178,640, whilst the cost of imprisoning an adult is £45,000/year (see www.bedford.gov.uk/community_and_living/community_services/community_safety/reducing_re-offending.aspx for more information).
23
Looking to the future, confidence is low, in a current political climate rooted in ‘austerity’ and
localism, that there will be the political will to slow the fall in investment in drug and alcohol
services. Brexit is seen as having the potential to exacerbate this.
Existing funding mechanisms allow funds to flow away from the drug and alcohol sector
The interviews highlight the freedom that local politicians and commissioners have within existing
national funding mechanisms to shape services and deploy resources as they see fit. Positively, this
gives the flexibility to integrate and balance drug services alongside alcohol treatment and
psychosocial interventions alongside prescribing. It also allows for services tailored to the needs of
the local population which can be jointly commissioned or at least aligned, with other important
services for people with drug and alcohol dependency. However, it is felt that these arrangements
also allow funds to be transferred away from substance misuse services. One commissioner notes:
The changes that occur vary from borough to borough. It’s very dependent on political buy-in,
strategic leadership and funding, be it government led funding, [policing-] led funding or a local
commitment of funding (14). This is a recurring theme throughout the interviews.
In this context, individual relationships with local stakeholders are identified as key at levering funds.
One commissioner (3) identifies support from the Director of Public Health (DPH) and elected
members as crucial; substance misuse services are seen as key elements of public health which must
be retained. He argues that these relationships and the understanding that senior people in the
authority have has meant the budget for services has not experienced substantial cuts, although he
continues to worry about the future.
The interviews reflect widespread
uncertainty as to the future funding
arrangements for substance misuse services
if local areas are increasingly or 100% funded
by the business rates retention scheme
(BRRS), but there is recognition that it must
be planned for nonetheless. In particular,
this policy magnifies the existing tension
between the greater freedom to deploy
resources and the risk of funds flowing away from drug and alcohol services. As now, commissioners
will have to make the case locally for the allocation of funds to support an efficient treatment
system. While there is an opportunity to become the masters of our own destiny (3), there is
concern that making this case may become even more difficult as local politicians gain yet more
freedom to deploy resources and as the ring
fence on Public Health Grant disappears.
Whether we want these developments to take
place or not is irrelevant, they are going to and
we have to work with them and we have to
positive. There will be an impact, and we have to
assess that impact and start working now so
that we’re well prepared (Commissioner, 14).
The reduction in funding is political not needs-based.
This will have huge consequences. If people with
substance misuse problems are not seen as a priority
at the local level, they should be protected at the
national level (Chief Executive, 23).

24
We have to be creative in terms of how we
attract funds. We fundraise to essentially
subsidise the quality of service, including work
with other charities to crowdfund, because we
cannot get proper funding (Chief Executive, 6).
It does not generally matter where the money is
from as long as it is there. However, in this case
[BRRS], funding depends on the area, so it becomes
much more of a postcode lottery. Some areas have
more and bigger businesses and more industry
(Commissioner, 4).
A further problem identified by multiple interviewees is that areas with higher levels of deprivation
have both higher levels of problematic drug and alcohol use and a smaller local tax base. From this it
is inferred they are concerned the BRRS has the potential to have the biggest negative impact on
funding for substance misuse services where the need for them is greatest. (It is not clear whether
interviewees were factoring in the likelihood of some ‘equalisation’ being built into the scheme to
protect councils with relatively higher needs8 but with relatively lower income.) The pace of change
is also important. For example, the DPH
we spoke to, expecting funding for
public heath to fall in his local area as it
is not a great generator of business
rates, is concerned that a sudden shift
with no transition that would pose a real
risk (13).
Funding cuts are already affecting the quality of services; we have passed the tipping point
Some commissioners and providers note that initial reductions in funding have encouraged and
helped them to modernise and make better use of public resources (4). However, one Chief Executive
comments that the value of the contracts is getting smaller and margins becoming much tighter
which leaves less money to invest in, and develop, services. They fundraise to subsidise core funding
(6). The associated worry is that this makes it harder for people to access treatment, and strips away
services seen as ‘non-essential’. As funding cuts continue, financial constraints have stifled further
innovation and efficiency gains. Another
question is: How do you get a wealth of
great information down to a local level?
(Chief Executive, 17). He explains that it’s
great we have a growing evidence base
but there’s such a lack of resource
including time. So it has become difficult
for commissioners to translate evidence
and good practice into contract specifications, exacerbated again by the churn in commissioners.
Sections 3.3 and 3.4, below, explore in greater depth the impacts of funding reductions on service
delivery.
8 “Needs” in this context means needs in a wider sense than public health in particular.
25
3.2 Commissioning
There is on-going concern over commissioning knowledge and practice
There is some evidence of longer contracts, but still wide local variation
The prime contractor/integrated substance misuse model seems to have become the norm
and prime providers are perceived as influential
Opinion varies as to how far smaller organisations are included, but their inclusion in
contracting arrangement where it happens is seen as positive
There is on-going concern over commissioning knowledge and practice
Within the two areas where we interviewed commissioners the teams consist of one or two
commissioners focusing on substance misuse, working alongside others focused in different topics.
Commissioning teams may be covering a broad range of responsibilities, such as housing-related
support, mental health, disability, domestic violence, carers and older people. Teams may also
report to other partners such as crime safety partnerships or children and young people’s services,
which can change the focus of commissioning.
We heard that there is a high turn-over of commissioners which is considered detrimental (9). In
some areas, a specific focus on substance misuse commissioning, with named commissioners, has
been maintained, but in others responsibilities have been widened and shared, so that
commissioners lose specialist expertise. This churn in commissioning expertise was mentioned by
another Chief Executive (17), who lamented the real loss of know-how, local knowledge and local
connectedness.
One Chief Executive (9) interviewed spoke of competitive tendering madness; too many contracts
are put out to tender that are not thought through well enough. This can lead to safety issues and a
waste of resources.
Commissioners (2, 14) in one area anticipate a move towards further cross-borough ‘co-
commissioning’ in their region, not least so as to save money, presumably through economies of
scale, especially where they work within the criminal justice system.
There is some evidence of longer contracts, but still wide local variation
Chief Executives whom we interviewed reported different approaches to the length of contracts.
One (10) stated that contracts are way too short at two years, even with the option to roll them
over; another (6) was generally happy that contracts are now for five years with possible two years
extension; and a third (11) was positive that commissioners have recognised the need for longer
contracts: three-four years with options to renew for one to two years.
In one area where commissioners were interviewed, contract lengths have reduced, but options to
extend tend to result in contract lengths largely the same as previous years. One commissioner there
commented, we have a good balance between contact lengths and encouraging optimal
performance to meet the needs of the community (2). In a second area they have been held at three
26
The challenge is just commitment, especially
in a financial sense. The evidence shows that
long-term contracts are better, but the
funding is dicey at best (Commissioner, 4).
years, but the possibility of extension has increased from two years to four. In the third area, they
have increased from three years to seven years.
As expected, providers tend to view longer contracts positively. However, as one pointed out, this
has a downside if a contractor underperforms and this is not well-managed by their commissioner
(Chief Executive, 6).
The concerns about reduced contract lengths are familiar. Firstly, writing tenders, setting and
attending the right meetings and filling in the right paperwork is very resource-intensive (10). This
increased focus on procurement processes, and the resources invested in this, detract from other
areas of service delivery. Secondly, the lack of
security experienced by service providers,
employees and service users reduces stability.
This can decrease employee morale, reduce the
quality of the service and decrease the potential
for investments into services and people.
Thirdly, it takes time to embed a service. You
wouldn’t normally expect a service to take-off in its first year – and with shorter contracts (often two-
four years), contracts are expiring as providers are just about starting to do well (Commissioner, 2).
This sentiment was echoed by others saying that reasonable contracts should be five years minimum
because it can take a year to eighteen months to establish an effective system, good partnerships
and achieve the desired outcomes, which means that three years is not long enough.
One Chief Executive (11) mentioned the difference that being solely funded by the local authority
has brought: contracts run for a couple of years after which they will be retendered without choice.
The atmosphere around this is now more combative rather than collaborative. Rather than looking at
best ways to deliver services, service providers are asked “why are you not hitting the targets?
The prime contractor/integrated substance misuse model seems to have become the norm
Commissioning guidance and clinical guidelines have for some time allowed or recommended
contracting for integrated services in terms of psychosocial interventions alongside prescribing;
recommending the integration of drug services with alcohol services; and integration of both of
these with mental health services and other services vital to recovery such as a housing,
employment or rehabilitation following prison. The interviews suggest that the prime contractor
model with integrated substance misuse services seems to have become the norm (without
integrating the contract with wider services). Though this model has probably come about out of
necessity, the attitude of commissioners towards it seems to be positive, with it being viewed as an
opportunity.
There was universal agreement that drug and alcohol services are already informally or formally
integrated (3, 4, 19) or moving that way (2, 13). One commissioner put this in a financial context: we
can no longer afford to isolate services and provide drugs and alcohol services alone. We have to
integrate (3).

27
Prime providers are perceived as influential by big and small providers alike
In some cases, this simply follows existing practice. For example, one Chief Executive (17) said: If
there is a good local service or network of smaller partner organisations we may subcontract out to
them – why reinvent the wheel? However, if the network is failing then we’d take on greater
elements of it … we may do everything apart from the clinical provision, which we subcontract to the
NHS (17). One Chief Executive reports commissioners being quite hands-off (9), presumably leaving
the prime contractor with more influence.
Another smaller provider notes the
emergence of the prime provider as a
“quasi-commissioner”, shaping the
contracted services, which has worked out
well for them in this case. However, they
felt they must also get actively involved in
shaping the local model, not least so that
they are not wholly bound by the prime
provider’s models, which are seen to vary
between ahead of the curve and stuck (7).
Opinion varies as to how far smaller organisations are included
All of the commissioners spoken to use a model whereby the contracted provider sub-contracts
element of service provision to local organisations with local knowledge or to NHS providers.
Commissioners do not view integrated contracts as excluding smaller providers. In one area, the fear
that smaller, local organisations would be ousted by larger ones has proven unfounded (2), in
another commissioners choose a mixed economy … which has allowed us to maintain support for
smaller local organisations (3); and in the third area local organisations are sub-contracted where
applicable (4). However, opinion among smaller providers varies as to whether investment is
available to them under integrated service models and the prime provider model. One reports
finding themselves in an ideal position in the community to create a sustainable organisation and tap
into existing resources (7); but another in the same area believes the level of investment in them
does not reflect the well-evidenced
savings they can make to the public
purse (8).
One smaller sub-contractor was
surprised at how well they could work
with the prime contractor, despite
different operating environments (Chief
Executive, 10). However, concerns
remain about how integrated service
models might edge out smaller, more
specialised organisations in favour of larger, more general, ones. An example was provided of a
holistic women’s centre with a great deal of local expertise and a flexible approach being
threatened, it was felt, due to more streamlined structures coming in. The provider questions: Why,
Traditional commissioners are evolving into
something different as lead providers are becoming
commissioners. What we’re seeing now is that
some of the big providers are becoming quasi-
commissioners. This is something we’re going to
have to navigate through because we want to
change the way some of these things are designed
(Chief Executive, 7).
We have a really good relationship with the prime
contractor and are surprised at how well they
understood what we are trying to do. We operate
using different rules but it has been a close and
remarkably effective relationship (Chief
Executive, 10).

28
Evidence suggests that peer to peer support is
vital to aid recovery from substance misuse.
Over the last five years, more and more service
user led organisations are developing and
bringing positive support mechanism to
communities. All of these small organisations
are making their mark through innovation and
specialism (Commissioner, 2).
despite all the evidence, do women need to continue getting treatment in centres that are not
appropriate and not child-friendly (6)?
The inclusion of small providers in contracting arrangement is seen as positive
Commissioners comment positively on the effect of including smaller providers in contracting
arrangements and recognise that smaller organisations can provide services bigger providers simply
cannot, or will not, provide. This has allowed for more flexibility, increased innovation, commitments
to co-produce and involve service users, increased choice for community services and different
levels of intervention. One commissioner said that over the last five years, more and more service-
user-led organisations are developing and bringing positive support mechanisms to communities (2).
That commissioner now insists on having innovative recovery interventions and a real commitment
to actively involving and co-producing our
services with our customers. This in turn
encouraged and facilitated our provider to
seek sub-contractors to fulfil the contract
specification. This approach is variously
allowing more specialist and niche providers to
come into the marketplace (2); and leads to
more choice for community services and
different levels of intervention and combined
pathways (4).
Commissioning case study: Red Rose Recovery, Lancashire
In a challenging financial environment, Peter Yarwood, Chief Executive of Red Rose Recovery (RRR)
has found a way to both identify the gaps in the system and start to fill them. RRR is comprised of
two parts, he explains:
1. Lancashire User Forum (LUF) – an independent user forum for Lancaster county (ten years
old)
2. Red Rose Recovery – the charity that underpins the LUF and helps to guarantee
opportunities for those in recovery (six years old)
As a result of the positive responses to, and outcomes of, LUF it grew over the years and developed
into an independent peer-led structure. But those involved wanted to develop it: We needed to do
more. As such, Mr Yarwood and colleagues began building links with both the local council for
voluntary services and community and the treatment system. They wanted to build something that
was sustainable in the community, and that used volunteering and networking, drove employment
opportunities, built social enterprises and harnessed the diversity of social activity that existed
around the group, including a choir and football team.
After paying RRR a visit, the Chief Executive of Public Health England, Duncan Selbie, called it
commissioning ahead of its time9. RRR has developed into a vibrant and highly visible grass-roots
9 Duncan Selbie visited RRR in January 2014

29
organisation and community for people leaving treatment and a social network for people post
treatment. It’s mutual aid on a massive scale, according to the local commissioner, with over 1000
members. Given the size the forum has now split into separate localities with 200+ people involved
in each.
RRR is externally commissioned by a range of sources, the local clinical commissioning group (CCG)
for instance supports recovery coaches buddying people entering hospital as a result of alcohol
misuse. Such initiatives help keep people out of hospital, saving money on ambulance calls, bed
stays and other costs.
The local authority Head of Commissioning in Lancashire, Chris Lee, says they have re-designed
services to be more community-oriented. The LUF and RRR focus not just on people entering
treatment or in recovery but also on family members and the wider community. Working with RRR
and LUF, Mr Lee said, is a genuine attempt at co-production.
Mr. Lee is now working to replicate the principles of the LUF and RRR through a ‘families’ version.
After a long struggle key members of the community are developing it, driven by their needs, not
those of their loved ones in recovery. Like all initiative of this kind it has required people to lead and
take responsibility, an active community and resources, both financial and network and opportunity-
related. It has taken a lot of time, dedication and effort - although the outcome has been worth it,
we didn’t get there overnight.
3.3 The delivery of services
We have reached the limit of what can be achieved through efficiencies
Funding pressures are driving service re-design and technological innovation
Frontline pressures are altering patterns of, and reducing, client contact
Funding pressures are impacting on staffing levels and staff welfare with knock-on effects for
service users
Volunteers are increasingly central to service delivery - and this brings new challenges
There are mixed views on workforce development
We have reached the limit of what can be achieved through efficiencies
From the interviews, it is not clear that funding pressures are the sole driver of service re-design and
technological innovation, but clearly they are a prime source of motivation. They suggest that
providers are still searching for efficiencies, even though they are regarded as largely historic, now,
with much of this work having been done. One commissioner (4) is quite clear on this: In 2008 the
reduction in funding helped us become more efficient. Before the current austerity drive, reductions
in funding led to modernisation and a better use of public resources. Now we have taken out up to six
million pounds. This is becoming really financially constraining. We can hear the same from the
provider perspective: There definitely were efficiencies to be found in the system. Some which were
found without too great a detrimental impact on service provision but we are definitely past that and
into the bit which has a negative impact (Chief Executive, 17).

30
Funding pressures are driving service re-design and technological innovation
There is a sense of commissioners and providers still working hard to treat multiple pressures as
opportunities and respond with creative solutions. This positivity is reflected in all parts of the
system, for example this from senior clinical and public health leads: I do think reduced resources
have allowed us to be more creative and innovative (3); and local authorities’ financial situation
being what it is leads to us needing to develop new ways of doing things (13).
Indeed, the consistent narrative is one of re-design being mentioned in response to interview
questions around funding. A couple of interviewees note that they have re-designed services to be
more community-oriented and community-embedded. Rather than six main hubs, one local
authority now has two; the remaining services are provided in libraries, community centres, GP
surgeries and so forth. This has allowed for more flexibility, and a more place-based system where
services are taken to where people are (4). Other resource-driven developments include an
increased use of technological innovation. Technology enables the digital delivery of support
services, and an increased ability to tailor services to meet needs. For example, one area provides an
online guide for service user to access an online recovery programme with community-, probation-
and prison-related versions, also available through mobile phone apps.
Frontline pressures are altering patterns of, and reducing, client contact
Pressures on frontline staff are evident in rising caseloads and the need to reconfigure client contact.
Of the eight provider representatives, seven implied or said explicitly that caseloads have increased,
sometimes to excessive levels. The
other reported level but very high
caseloads. One service provider
described an increase of 20-30% in
practitioner caseloads (11). These are
not attributed to increasing numbers of
clients. Much more indicative of the
changes is this comment from a service
manager (18): Numbers remain
consistent and whilst we have lost resources, we have had to review capacity and caseloads to
maintain safety and quality and to ensure effective provision (18). Indeed, most of the comments
arise in the context of system pressures, not least the ambition or contractual requirement to
provide a specified list of treatment and psychosocial interventions or varieties of wrap-around care
at a time when funding is decreasing.
As is to be expected, providers report different ways
of managing pressures such as changing their case
management approach or reducing levels of client
contact. For example, there are three mentions of
group work replacing one-to-one client contact to
varying degrees. One frontline report is indicative of the wider picture: Our caseloads are too big to
see people one-to-one. Trying to keep regular contact with everyone is not always possible. Following
Frontline staff are having to manage more clients
simultaneously and in a group setting so there’s less 1:1
work. If you have 80 clients on your caseload, you can’t
see them all once a week. That impacts on quality
sometimes, and it certainly has an impact on staff
welfare (Service manager, 22).
We are taking on more than we can do,
but there is always a need for more
(Chief Executive, 7).

31
pathways sometimes takes longer due to there not being enough time due to other day-to-day
responsibilities. The focus is now on group work to see more people at a time (20).
It should be noted here that it may be a positive choice to move to a model where intensive one-to-
one key working is partially replaced by a key worker facilitating different elements of a package of
care for an individual service user; and group work may be a positive and desirable aspect of this
package. However, there are also clear indications of both frontline workers and their managers
simply having to do much more. More research would be required to determine the effect on
outcomes.
Funding pressures are impacting on staffing levels and staff welfare with knock-on effects for service
users
There are widespread concerns about the effect of funding cuts on staff and staffing. A lack of
funding is pushing people to the limits, with high caseloads, as noted above, but also pressures of
work resulting in stress and burn-out,
leading to competent people leaving
the sector. This includes
commissioners (see quote) and
providers too: burn-outs are common
(10).
Volunteers are increasingly central to service delivery – and this brings new challenges
Increasingly, service providers are having to rely on volunteers. Volunteers are used in a number of
different ways. Though a small amount of professionally qualified or skilled volunteers fulfilling
counselling or therapist roles exist, the majority of volunteers are themselves people in recovery and
working as “recovery champions”, “peer mentors” or “navigators”.
Some organisations have seen an increase in volunteers. For example, one provider (17) started with
a ratio of 3:1 staff to every volunteer, now has a ratio of 1.4:1 and is aiming for 1:1 over a three-year
cycle. Interestingly, one grass-roots organisation has seen a decrease in the supply of volunteers in
recent years, making their work more difficult: the main providers are also very volunteer-reliant, so
our supply of volunteers has decreased (10). Most organisations see their number of volunteers
fluctuate; some volunteers are committed and consistent, others operate more on an ad-hoc basis
(7).
There are varying motivations for using volunteers. These include
bridging the funding gap
adding a new perspective
adding to the quality of services; for example, the appeal of the volunteers to one service
manager is their ability to support a service user through their entire journey, from the
welcome to walk-in groups and recovery activities such as music groups
The reduction in funding has impacted the quality of
services, specifically quality assurance and performance
management, pushing the resources and people to the
limits. The result is burn-outs and stress. Good people
leave the sector because of unpredictability and high
stress levels (Commissioner, 1).

32
creating opportunities for their volunteers – which in some cases is an organisation mission
in itself – for example to have purpose in their lives and to move into gainful employment
(various interviewees).
This use of volunteers brings its own challenges. Firstly, there may sometimes be a tension between
finding the balance between ensuring service delivery and creating such opportunities for
volunteers. For example, one Chief Executive (7) explains:
Volunteers are the lifeblood of [our organisation]. Our organisation exists to support
volunteers, not because it is supported by volunteers. What underpins [our organisation] and
gives us value is that we focus on creating opportunities for people to have purpose in their
lives. Although we sometimes take on contracts that depend on volunteers to deliver, the
starting point for us is creating those opportunities. Finding that balance is the challenge.
Secondly, there is the issue of how best to meet the needs of the volunteers who all need to be
managed, supported and resourced. In one organisation (17), this has led to the introduction of such
positions as ‘volunteer co-ordinator’ or paid navigators, and the introduction of targets to increase
volunteering to cover some of the gaps left by the reductions in funding.
Thirdly, deploying volunteers has the unintended consequence of shaping services. This cohort has
often been through treatment with, and received training from, the provider itself and historically
has augmented rather than delivered core functions of the service (11). However, as noted above,
service providers are increasingly having to rely on volunteers, their professional staff being
overstretched. Some providers feel they are not able to provide much more than basic treatment
plans and referrals because of the reliance on volunteers. This can harm the quality of care being
given, it was felt. Similarly, some providers feel reliance on volunteers is impacting on the range and
quality of service provided.
There are mixed views on workforce development
Worries about the development and training of both paid and unpaid staff remain.
There are mixed views on the impact of reduced funding on workforce development and the ability
to maintain skills levels, the importance of which is recognised by all interviewees.
Many organisations offer in-house training and development as well as having access to external
provision. In the current financial climate, some providers find it difficult to prioritise resources for
professional development such as accredited training and training workshops. Some interviewees
remark that skills and quality are improving across all organisations, despite financial constraints.

33
The use of peer support services requires an additional dimension to staff development and welfare.
Peer support or recovery organisations typically have workforces predominantly made up of people
in recovery. This requires a two-pronged approach to workforce development: providing people with
both a personal and a professional development element ‘to make sure employees grow as
individuals not just as professionals; we need to make sure they don’t burn out’ (7). However, one
Chief Executive of a grass-roots
organisation (8) said he was
frustrated with organisations
employing people in recovery
because ‘there is no one to look after
the staff, volunteers and coaches,
especially if they relapse. He
explained the need for a therapeutic
environment owned and created by
the organisation’s people – see
quote (8).
There is concern from a clinical lead that the specialty of addiction psychiatrists will die out, despite
the fact this group is trained to meet the specific and complex needs of service users and we need a
specialised work force to support them.
Overall, it is clear that reduced funding has already impacted on the delivery of frontline services.
The next section considers concerns about the on-going impact.
3.4 The delivery of services – concerns for the future
The capacity of the sector is under threat from the withdrawal of public sector funding
More difficult choices about service configuration lie ahead
Service providers are concerned about their ability to maintain safety and quality
The capacity of the sector is under threat from the withdrawal of public sector funding
Some interviewees commented that the financial climate has impacted on services already, with the
straightforward ability to do less on less resources. One Chief Executive notes: Community services
come down to what local commissioners can afford. If you are reducing the amount you are spending
there comes a point where caseloads are increasing and there is less and less you can do to support
people. At the same time, there is an increasingly ill and ageing population of drug users who suffer
from long-term chronic illnesses. We are not meeting the challenge to help these people (11).
Perhaps even more fundamental and serious is the perceived mismatch between the Government’s
and sector’s ambitions and the resources available: There is an existing dialogue around doing the
right thing, around recovery, housing, all these amazing things. But there is also a funding dialogue
and a rhetoric that doesn’t translate to the ground. There is a ‘do-it-yourself’ attitude (Chief
Executive, 11).
Here, staff and volunteers have recovery supervision.
We ask them how they are doing in the programme and
whether they have any problems. We also look at social
modelling: “How do you present yourself?” We want to
psychologically improve the environment, create a
therapeutic environment where people feel well (Chief
Executive, 8).
34
Though the reduction in one-to-one contact with clients was noted above, interviewees did not
explicitly report that they as are helping less people than before. However, the subtext is that this is
happening or at risk of happening. (This is in interesting in itself, given that the number of people in
treatment is actually decreasing, as noted in Section 2.) Stakeholders within the sector are clearly
worried about capacity. One commissioner summed this up as: The choice is between delivering less
to more people, or more to less people (4).
Comments from two Chief Executives touch on this still increasing pressure and the need for still
more change:
We are taking on more than we can do, but there is a need for more (7).
We are at the tipping point now. We might have to do the work differently to provide
services to the same amount of people (9).
This is reflected in the hard choices being envisaged, as described below.
More difficult choices about service configuration lie ahead
Most interviews suggest that, despite service re-design, the pace of change has not yet bottomed
out and there are even more stark choices to be made. Central is the tension between a ‘gold
standard’ based on a growing evidence-base as to what constitutes effective treatment and recovery
interventions, and the realities of resource constraints.
There are concerns about having to work with the bare minimum in terms of infrastructure
(Commissioner, 1) and a decrease in the wrap-around support services available to support and
maintain recovery, such as recovery champions or wider peer support activities such as art, music
and social meet-ups. Hence, although there is felt to be adequate investment in delivering opioid
substitution treatment (OST), there are worries over the long-term vision and commitment to
recovery.
In the context of funding cuts, one Chief Executive (10) notes service such as peer-services, drop-ins,
socially-based and weekend services can either be seen as vital components or unnecessary luxuries.
When asked about how the sector will
look in five years’ time, he envisages it
pared down to a minimum, possibly
focusing only on prescribing services
and peer-run services. Likewise a
commissioner (4) is concerned: If the
sector decreases, potential is
decreased, we might end up with
higher rates of blood-borne viruses,
more drug related deaths, higher recidivism. We need to be more efficient and stretch our resources,
e.g. through technology. My fear is that this might not be enough to stop a crisis. We are at risk of
becoming a glorified prescription service.
If current trends continue [the sector] will focus on
prescribing services, peer-run services and only a small
delivery area in the middle. Prescribing you have to
do; peer-run services are incredibly cheap. The middle
parts may be cut: counselling, drop-ins, alternative
therapies, etc (Chief Executive, 10).

35
Service providers are concerned about their ability to maintain safety and quality
While this report did not extend to researching the impact of system pressures on outcomes,
concerns about maintaining safety and quality are now sufficiently pressing that they are explicitly
voiced. As might be expected, all necessary measures are taken as described by the service manager
quoted earlier. However, one Chief Executive (17) comments:
Core provision is certainly being delivered, but staff are under pressure in terms of case-load and the
sector’s quality is at risk … I think there’s an element of clinical risk caused by cuts, because there’s
less people doing less things.
One chief executive (17) commented that the Care Quality Commission’s inspection regime is
absolutely necessary, but also that there is inconsistency in how it is applied. There is also,
sometimes, a lack of knowledge specific to substance misuse, so that the inspection framework is
applied in ways that are not relevant.
3.5 Client profile
Alcohol is perceived as a growing and still hidden problem.
The challenge of clients with multiple needs is growing, exacerbated by increasing social
deprivation
Managing dual diagnosis remains particularly problematic
The treatment system should be more responsive to local patterns in drug-related deaths
Core services must remain flexible enough to be responsive to ever-changing patterns of
drug use
The importance of family and friends to recovery is widely recognised, but not universally
recognised in services
Alcohol is perceived as a growing and still hidden problem
Collective Voice suggests alcohol services are being greater priority: There is clear evidence, since the
two budgets being brought together, of
money from drugs being spent on
alcohol treatment (19). However,
managers and practitioners in two of
the areas highlight the extent to which
alcohol use is problematic. One
comments: alcohol is becoming more of
a problem (21). Another says: alcohol
has had an increase coming into the
service. Alcohol is as big an issue as any
substance out there in terms of its
social impact and impact on health and
crime. Our alcohol clients are twice as
Usually we pick the alcohol up at the end – usually
presented very late. It is envisaged that [in five years’
time] funding will continue to be reduced whilst there
is an increasing demand particularly around physical
health, complex needs and an increase in hospital
admissions and alcohol presentations. We are liaising
with our CCGs and primary care doctors to look at a
revised offer in primary care in relation to alcohol
(Service manager, 18).
36
likely to die as our opiate-using clients (22). There is a
suggestion that interventions come only late – or too late – in
the lives of those addicted to alcohol (see text box). In a
similar vein, a commissioner (2) highlights how it is a still a
somewhat hidden problem which needs more attention: I do
think more consideration needs to go towards alcohol
nationally. The general population underestimate the harms
of alcohol … hence the formation of a hidden population, who
may be functioning in society but whose short and long-term
physical and mental health is deteriorating gradually. This
population is where we need to raise education and
encourage engagement into treatment and recovery
interventions.
As with drug treatment, peer led services have a part to play.
In particular, one provider (7) highlights the potential of
working with the NHS. The alcohol liaison team had not, they
say, been able to solve the problem people accessing A&E on
a revolving-door basis, so they generated income and
invested it into a new referral. Within a week people are
booked for a face-to-face meeting with one of our recovery
coaches. We have redesigned and re-commissioned the
system to include more face-to-face interaction with the
community. This led to massive savings and we helped the
NHS.
The provider also highlights how pressures on public funding
have curtailed this, even though it was apparently saving
money for the NHS: We got money off the police and the CCG,
but now funds have run out. … There isn’t enough money to
cover a service that is making a great difference.
The challenge of helping clients with multiple needs is
growing, exacerbated by increasing social deprivation
General issues
Many users of substance misuse services have multiple or
complex needs, meaning that as well as addiction, they face
one or more problems such as homelessness, mental ill
health, domestic violence, contact with the criminal justice
system or no realistic prospect of employment. They tend to
fall into gaps between services, making it harder for them to
address their problems and lead fulfilling lives.
One practitioner (5) noted that that numbers of clients with
multiple needs have stayed the same, although they often
The increasing
challenge of
supporting people
with multiple needs
Service manager (18) – We are seeing more complex needs.
Chief Executive (10) - Homelessness is going up massively and there is an increase in general social deprivation. We are seeing people who haven’t eaten. Complex needs are getting worse because of increased social deprivation.
Chief Executive (11) - Generally we’re seeing more complexity, more physical and mental health issues, more homelessness and unemployment issues.
Chief Executive (8) - The presenting issue is no longer just drugs or alcohol. We are seeing a number of issues: abuse, mental health, offending… no longer one thing anymore. That can be a difficulty, so we have to adapt.

37
constitute a challenging group of clients to work with. All others who commented said that the
challenge has increased, as seen from the quotes in the sidebar. An alternative perspective is that
both service providers and service users are respectively much more aware of and more able to
articulate such multiple needs, also pointing to a major cause of the problem:
Chief Executive (17) – There are more service users presenting with what you might call life
challenges - criminality and offending, housing, employment, education, mental health,
family issues. Before that was hidden until you get well into the assessment process – people
are more au fait with opening up about things now. Providers are better at acknowledging
the full range of life challenges people are facing. But on the frontline there has always been
a recognition this is part of the job, but the complication is greater now.
Various commissioners note improvements in providing for people with multiple needs. One (2)
says:
If you have a vulnerable individual with a substance misuse problem looking for housing, the
system could have failed them previously because there would have been no communication
between housing and drug and alcohol services. Whereas now housing and substance misuse
services work together and they are better equipped to assist the individual and support
them appropriately. It’s also far more cost-effective working together as gains made in
treatment are not lost due to auxiliary support measures failing.
Consistent with this, one chief executive (17) says that, where funding wasn’t being cut,
commissioners expect more by way of what the provider regards as non-core, including more work
around housing or employment and wider recovery.
Another commissioner (14) says that domestic and sexual violence services are tendered so that
contracts are linked with those of substance misuse, so that services meet each other’s needs. Yet
another (3) says there is now a more integrated approach to drug prevention and criminal justice
within a wider public health and justice system. We have gone from a Drug Intervention Programme
(DIP) service to a complex needs service.
Others feel progress has been lost. One commissioner (4) notes that with the re-commissioning of
prison services by the NHS, integration between community and prison services is progressively
being lost. Moreover, the familiar problem of a lack of joined-up thinking is still present.
From the provider perspective, one Chief Executive explains that despite substance misuse being the
core business, they have from the start dealt with housing, mental health and family issues. We will
continue to do that in order to facilitate an individual being better supported to deal with their
substance use and other life. If the business model needs to change then we will change it but that’s
our approach (17). Nonetheless, Chief Executives including the one cited above seem to believe
there is much more that could be done:
We need to be more efficient in delivering services from one stop. People don’t need to see
many different people and services (Chief Executive, 9).
We process our own outcomes and analyse data ourselves, focus is on impact on quality of
life, physical and psychological health, housing, and employment factors. These are the areas
where our services really could impact (Chief Executive, 11).

38
We have direct partnerships with a range of partners, [such as health and housing]. We may
have partnerships with local recovery organisation. And then all of the above in terms of non-
contractual relationships. Ultimately it’s trying to create a seamless pathway to avoid to
death by assessment (Chief Executive, 17).
One Chief Executive (17) says: Policy is still developed in siloes, purchasing is developed in siloes,
commissioning is done in siloes and then people get surprised when provision is siloed! He suggests
we should stop talking about a sector and focus instead on the service user, adding: our service users
don’t really care about who’s helping them as long as the quality is good, so working cross-sectorally
… is absolutely key.
Separate funding streams (Chief Executive, 9) and cultural difference are cited as barriers to better
integration. For example: it’s everything between differences in terms of process, decision making,
risk management (Chief Executive, 17).
Housing
Homelessness is mentioned as a particular problem by multiple interviewees (10, 11, 20). Many
examples of drug and alcohol providers working with housing providers were cited. For example:
[We are] trying to offer more and better services to our service users, e.g. fast-track housing
(Chief Executive, 9).
We have quite an ongoing, well-established partnership with (a housing provider) which has
been running a satellite at our service for ages. This always gets booked up in advance
(Practitioner, 20).
We do a lot of work supporting the residents of voluntary sector housing providers and also
training their staff and to a lesser extent work with the local authority (Practitioner, 5).
Local housing providers and volunteers are in symbiotic relationship (Chief Executive, 7).
We see criminal justice and housing as key partners and they have a lot of knowledge and
support, not only on an individual level but also more generally (Practitioner, 21).
However, while there seems to be a lot of committed joint working, it could not be said to represent
anything approaching systematic integration of substance misuse and housing provision. One
commissioner (15) was told by a supported housing provider that many of their service users have
drugs and alcohol issues, but the large number of providers involved makes it difficult to build
effective partnerships with treatment providers and mental health services.
Employment
There were fewer mentions of employment issues in interviews than there were of housing. Where
employment opportunities for service users are mentioned, investing in the community more widely
seems to be the context in which this issue is addressed. For example, one commissioner (4) invests
in employment opportunities as part of wider community building which allows for links with the
peer support elements of recovery, in particular.
39
One Chief Executive (8) makes the point that offenders have often not been integrated into their
community before going into prison and so cannot just be handed a job on release and expected to
integrate. How do you re-integrate someone into a community they have never been involved in?
Recovery services for people in that situation need to be owned by community to be successful, he
says, a community of people supporting one another.
One service manager (18) said: We work with a wide range of agencies both statutory and non-
statutory and third sector including police in respect of criminal justice and Early Action, Job Centre
Plus, a range of health and wellbeing agencies such as the quit squad [smoking cessation service],
the homeless services, domestic violence services, hospitals and mental health.
As noted elsewhere in this report, volunteer positions in drug and alcohol providers can lead to
employment opportunities. One practitioner says (21) says: Our peer mentors are volunteers but
they are treated as a member of staff: they have supervision and training and they are given rights
and responsibilities. The evidence from our peer mentor scheme is that a lot of them move on and
gain employment; it’s a stepping stone for them. Another provider paints a similar picture: People
are willing to give their time and are extremely well motivated. We can train them up and move
them into employment with us. It’s good having those people in the workforce, and good for the
community to have volunteering and training opportunities (Service manager, 22).
Managing dual diagnosis remains particularly problematic
Dual diagnosis, in other words helping people with co-existing addiction and mental health
problems, remains particularly problematic. One organisation (10) said that the incidence of mental
ill health issues among volunteers, staff and service users was 64% last time it was measured. There
were mixed views on how well services address the needs of people suffering both from an
addiction and mental ill health. One commissioner was upbeat: With complex needs and dual
diagnosis, our partnerships with mental health services ensure there is a link. We always have a
single point of contact, and we are able to case manage individuals collectively. Similarly, a Chief
Executive (7): We have a big partnership with [the local NHS Trust], which makes sense because lots
of people are suffering from mental health issues.
Others are much less optimistic. One
commissioner (15) believes that,
although there is guidance on dual
diagnosis, no one has successfully
addressed the challenge of working
with this client group: No one has a
clear strategy. … No one is able to
plug this gap successfully although almost everyone sees value of this. This is reflected in the
comments of a practitioner (5) in a different area: There’s still reluctance within mental health
services to help people with drugs problems, but not the other way around. There’s an attitude of
“sort out your drugs problem first”, when people with drug problems attend mental health services,
but addiction services would never reject someone with mental health problems. That is frustrating.
Our expertise is drugs and alcohol, not mental health.
Their expertise is mental health, not drugs and alcohol.
We need both sides to work on both sets of problems.
What we are able to offer our client base is restricted
compared to six or seven years ago (Chief Executive, 10).
40
One practitioner (21) cites a different problem:
The profile is becoming more complex with dual diagnosis. The majority is mild to moderate
mental health problems, but we do have a growing proportion of severe mental illness…
Community mental health teams appear to have increased their threshold for treatment due
to lack of investment so people have slipped through the net.
A service manager (22) elsewhere echoes this:
Community mental health teams don’t work with depression or lower levels of anxiety, which
are often the biggest trigger for people moving to using substances. In my experience mental
health services don’t engage with substance misuse services at all and we pick up a lot of
their work. They don’t send us referrals, and they don’t want to get involved when we do
client work.
The treatment system should be more responsive to local patterns in drug-related deaths
Interviews corroborated what the national data picture indicates: an increase in drug-related deaths,
a significant component being people in their late 40s, 50s and 60s, dying from a variety of chronic
illnesses. One commissioner noted the existence of an ageing cohort becoming increasingly unwell,
suffering from respiratory disease,
liver disease and other chronic
conditions – collateral damage from
years of substance misuse. He said
that the needs of these service users
necessitate an increased sensitivity,
and improved pathways linking
people to appropriate primary care support. As such, adaptation, flexibility and innovation are very
important (4).
A Chief Executive (11) comments, we are seeing a lot more on that and that is a big concern (11).
Another interviewee confirmed, the people dying have a complicated picture of health. We are
seeing more heroin overdoses, but also complex deaths of long-term heroin users (13). As noted
above, a service manager (22) agrees with this general profile but noting that, although they see
some opioid users, it is frequently those with alcohol problem who die. Another Chief Executive
echoed these thoughts saying that people are switching to alcohol, and alcohol kills you faster than
heroin. Or they will take a concoction of drugs (8).
This pattern does not necessarily indicate a pattern of increased use. One commissioner said that
there is a drop in the number of opiate or crack users as the population is ageing and newer younger
substance misusers are not choosing heroin (2). (This is true for England as whole, i.e. that the
numbers of opiate and opiate and/or crack users are dropping in the 15-24 year old and 25-34 year
old ranges, but rising in the 35-64 old bracket). Another commissioner (3) notes that the substance
misuse cohort is ever changing, and always has been. As such, the sector requires flexible
commissioning of services, and a focus on outcomes rather than client profiles.
Someone going into hospital with pneumonia, who’s
also a long term smoker, got COPD, plus liver disease.
They come out and use heroin, die of an overdose that’s
really underpinned by all those other health issues (DPH,
13).

41
With regards to preventative work, one commissioner said we need to approach locally and analyse
circumstances. We need to learn from deaths and coroner’s reports moving forward. We are logging,
but not enough is done with outcomes (1). Another supported this view saying on the surveillance
side of things we need to analyse trends and contract managing processes to highlight what is going
on with specific providers (2). In addition, we should draw out the top risk factors and use those as a
reference point when people are being assessed… we need to highlight those at risk and put into
place suitable mechanisms to help them (2).
Interviewees were asked about the role of naloxone in preventing drug related deaths. One Chief
Executive commented that there is increased provision, though roll-out remains patchy. We could do
better but the direction of travel is in the right way (11). Some service providers strongly encourage
naloxone roll-out, others can issue it but do not often do this, and a third group does not offer
naloxone at all.
One Chief Executive said that where possible we attempt to offer [naloxone] across all community
based services – we aren’t of a size to fund locally where commissioners can’t fund, but we are
lobbying nationally and locally to make this happen (17). He added that commissioners generally
have awareness and willingness around the issue, but not necessarily sufficient resources.
A few of those interviewed focused on the need for a wider naloxone roll-out to prevent drug-
related deaths, and increased access to naloxone for family members of substance misusers.
Furthermore, many highlighted the importance of training more providers such as housing, police
and ambulance services to administer naloxone. One service manager encourages its provision for
families as well and its roll-out in ‘health classes,’ which also focus on vaccinations and wider health
interventions, so that they can get a really good coverage (18).
Core services must remain flexible enough to be responsive to ever-changing patterns of drug use
Evidence from one Chief Executive indicates an increase in complexity (emotional, psychological and
drug-related) among service users, and in contrast to the national picture a client group that is much
younger and has faced greater adversity in childhood than previously seen (6).
Problems resulting from the use of new psychoactive substances (NPS), and especially synthetic
cannabinoids (‘spice’), are perceived as more prevalent in prisons than in the community. One
commissioner reported that in community settings, we are seeing a very low number of NPS users
calling for treatment (4). Another wondered if the media had over-emphasized the scale of the NPS
issue, with the number of users in treatment still very low compared to heroin, crack and alcohol.
That’s not to say that providing
treatment and recovery support isn’t
important, or that lives aren’t
affected by NPS (2). Whether that is
because of a lack of need, a lack of
treatment penetration or a lack of
knowledge about treatment options,
is unclear. There is some use, but in
terms of problematic use this is
With each new emerging drug, whether that is today or
in the future, we need to ensure that from a public
health perspective we are able to offer support to
communities to assist in addressing the harms caused by
all current and emerging drugs and/or alcohol
(Commissioner, 2).
42
confined to some very specific areas. There are concerns around the increase of spice usage among
the homeless, particularly in large metropolitan areas; and about some very specific drugs (11).
These include mephedrone and GBL.
This sentiment is echoed by many other commissioners and service providers. That said, one Chief
Executive noted: We have seen a lot of NPS, it’s flooded the prison systems (8). He also said that that
when they pick people up from prisons, NPS users require a lot of resource because of their mental
health issues: they need a lot more intervention and support than they are receiving right now (8). A
DPH added that it would be fair to say I don’t think they are accessing services in the numbers they
need to be, but that is an assumption.
For some, NPS is viewed as part of a general pattern of drug use: it’s part of the profile but not
necessarily the primary bit, that often being alcohol (13). A commissioner agreed with this,
emphasising the importance of training people to be flexible in delivering a broad range of services:
we should be able to deal with all the drugs and alcohol usage in the community – not doing
anything different, just making sure people are tuned into the advice (4).
A widely held view is that services should always be evolving to meet the needs of new clients,
especially when it is difficult to ascertain the actual number of users, as opposed to the numbers in
treatment. On this basis, one local NPS strategy group (which includes the police, the NHS and
prisons) has morphed into a more general preventative harms group, keeping it as a rolling agenda
point there – you never know what’s going to happen. Maybe there’ll be a kick back of heroin, it
could be synthetic opiates, who knows? (Commissioner, 13).
The importance of family and friends to recovery is widely recognised, but not universally
reflected in services
All of those interviewed see networks of friends and family as a key supportive component of
recovery. This, and the importance of support for this group themselves, is widely recognised. There
is wide variation though in the availability and type of family support provision.
From a commissioning point of view, the importance of family support in the recovery journey and
the need to support family members themselves is typically recognised and written into service
specifications. One commissioner said that family and friends’ support is hard-wired into contracts
and is a core expectation – we expect all organisations to develop work in the therapeutic area in
terms of family (4). In another area all our contracted services have to have a ‘families’ element, both
supporting them in their own right but also including them in treatment planning (13). Some
commissioners include carer assessments as part of the core specification, and service providers will
offer additional support services geared towards families. The Care Act 2014 was instrumental in
getting providers to work together to achieve this (2).
Outside the core function, some areas provide user forums, grassroots organisations and wider
community support networks to help support families and carers, although it is acknowledged that
these can be hard to get off the ground (Commissioner, 4). In another area, the substance misuse
sector works together with children’s services to run programmes geared towards parenting and
support for children. As such, there are joint protocols in place, and specialist providers for young

43
people with drug or alcohol problems, or parents struggling with similar issues. This holistic model
has been positively received thus far (Commissioner, 1).
Peer-led providers have a strong family focus. One Chief Executive (7) says of working with parents
and families: Where we can, this is the first point of contact. When we are mapping assets and skills
and capital we always ask: where is your family in this journey? Another says: We are together, we
are family … Family is at the heart of what we do (8). Another (10) said: We do not work specifically
with parents and families but everyone is welcome to use the services.
The importance of families is also recognised by other providers also: [Families] can present a
massive source of recovery support (17), says one Chief Executive. One provider of young people’s
services notes that services extend into the community through pre-emptive parental evenings in
local schools, although these are seen as controversial by some schools which claim they could
potentially encourage drug use. A Family Support Worker has been appointed to focus on therapy
sessions, parenting workshops and family weekends, they feel this is about offering a space for
everyone to be heard rather than just young people (5).
Some service providers recognise the need to develop more skills and a more family-oriented
approach. There are lots of resources dedicated to individuals and individual assessment; we need
significant change to incorporate a more family based approach (Chief Executive, 9).
Increased importance is being accorded to community support networks, rather than focusing only
on direct family members and carers. Some providers are working with schools on lifestyle changes
around smoking and alcohol, as well as trying to set-up family forums, replicating user forums (DPH,
13). Such family forums will focus on broader issues such as social isolation.

44
5. ACKNOWLEDGEMENTS
Many thanks to Emilie Frijns for her tireless work in conducting this research and writing the report.
Thanks also to Paul Hayes (Collective Voice) and Paul Anders (Revolving Doors) for their feedback.
If you would like to find out more about the contents of this report please contact Oliver Standing,
Director of Policy and Communications at [email protected].
45
6. DATA SOURCES FOR SECTION 2
Advisory Council on the Misuse of Drugs, 2017. Commissioning impact on drug treatment. The
extent to which commissioning structures, the financial environment and wider changes to health
and social welfare impact on drug misuse treatment and recovery. Available at:
www.gov.uk/government/uploads/system/uploads/attachment_data/file/642811/Final_Commissio
ning_report_5.15_6th_Sept.pdf
Collective Voice, 2016. Briefing for Health Select Committee Roundtable with Practitioners
19.04.2016. Retrieved, 13 October, 2017 from: www.collectivevoice.org.uk/blog/briefing-health-
select-committee/
Collective Voice, 2017. Notes on disinvestment in the drug and alcohol treatment sector, version 1.0.
(Unpublished.)
Department for Communities and Local Government (DCLG), 2013, 2014, 2015, 2016 & 2017.
Revenue account (RA) budget 2017 to 2018. In: Local authority revenue expenditure and financing
England: 2017 to 2018 budget individual local authority data. Retrieved, August 2017, from the
following link and previous years’ equivalents:
www.gov.uk/government/statistics/local-authority-revenue-expenditure-and-financing-england-
2017-to-2018-budget-individual-local-authority-data
European Monitoring Centre for Drugs and Drug Addiction (EMCDDA), 2017. Prevalence maps —
prevalence of drug use in Europe. Retrieved, 13 October 2017, from:
www.emcdda.europa.eu/countries/prevalence-maps
Hay, dos Santos and Swithenbank, 2017. Estimates of the Prevalence of Opiate Use and/or Crack
Cocaine Use, 2014/15: Sweep 11 report. Commissioned by Public Health England. Retrieved, 3
November 2017, from: www.cph.org.uk/wp-content/uploads/2017/09/Estimates-of-the-Prevalence-
of-Opiate-Use-and-crack-cocaine-use-2014-15.pdf
Home Office, 2017. Drug misuse: findings from the 2016 to 2017 CSEW. Retrieved, 23 November,
2017, from www.gov.uk/government/statistics/drug-misuse-findings-from-the-2016-to-2017-csew
NHS Digital, 2017. Statistics on Alcohol, England, 2017. Retrieved, 3 November 2017, from download
from: http://digital.nhs.uk/catalogue/PUB23940

46
ONS, 2016. Statistical bulletin: Deaths related to drug poisoning in England and Wales: 2016
registrations. Retrieved, 2 October 2017, from:
www.ons.gov.uk/peoplepopulationandcommunity/birthsdeathsandmarriages/deaths/bulletins/deat
hsrelatedtodrugpoisoninginenglandandwales/2016registrations
Pryce, Buykx, Gray, Stone, Drummond and Brennan, 2017. Estimates of Alcohol Dependence in
England based on APMS 2014, including Estimates of Children Living in a Household with an Adult
with Alcohol Dependence. Prevalence, Trends, and Amenability to Treatment. Retrieved, 24
November, 2017 from: www.nta.nhs.uk/uploads/estimates-of-alchohol-dependency-in-
england[0].pdf
Public Health England, 2016. Adult substance misuse statistics from the National Drug Treatment
Monitoring System (NDTMS) 1st April 2015 to 31st March 2016. Retrieved, 2 October 2017, from:
www.nta.nhs.uk/uploads/adult-statistics-from-the-national-drug-treatment-monitoring-system-
2015-2016[0].pdf
Public Health England, 2017. Introducing a new local authority public health dashboard. Retrieved,
27 October 2017, from: https://publichealthmatters.blog.gov.uk/2017/10/16/introducing-a-new-
local-authority-public-health-dashboard/

![The ILO and the informal sector: an institutional history · on the informal sector¨] [IOE Seminar on the informal sector] ILC debat on "The Dilemma of the Informal Sector" ICLS](https://img.pdfslide.net/doc/110x75/5cb8488988c993af7a8b66d0/the-ilo-and-the-informal-sector-an-institutional-history-on-the-informal-sector.jpg)