Embed Size (px)
Citation preview

STATE OF FLORIDA
1999 HIGHWAY PERFORMANCE
MONITORING SYSTEM FACTS & FIGURES
FL/DOT/SMO/99-430
April 1999
STATE MATERIALS OFFICE

Table of Contents
What is HPMS ............................................................................................................... 1
What Purpose Does HPMS Serve .................................................................................. 1
How Does Florida Collect HPMS Data ......................................................................... 1
How Does Data Collection Procedures Effect HPMS Data ........................................... 2
1999 HPMS Sections (Statewide) .................................................................................. 4
Number of HPMS Rated Sections ................................................................................. 5
Number of HPMS Rated Miles ...................................................................................... 6
Number of Designated HPMS Sections ......................................................................... 7
Number of Designated HPMS Miles ............................................................................. 8
1999 Frequency Distribution of IRI (Flexible Sections Statewide) ............................... 9
1999 Frequency Distribution of IRI (Rigid Sections Statewide) ................................... 10
1999 Frequency Distribution of IRI (Flexible and Rigid Sections Statewide) .............. 11
1999 Frequency Distribution of IRI (Sample Sections Statewide) ................................ 12
i
Table of Contents (Continued)
Percent of Rated Miles within IRI Ranges from 1995 to 1999
(Flexible Sections Statewide) ............................................................................. 13
Percent of Rated Miles within IRI Ranges from 1995 to 1999
(Rigid Sections Statewide) ................................................................................. 14
Percent of Rated Miles within IRI Ranges from 1995 to 1999
(Flexible and Rigid Sections Statewide) ............................................................ 15
Percent of Rated Miles within IRI Ranges from 1995 to 1999
(Sample Sections Statewide) .............................................................................. 16
Number of HPMS Rated Sections ................................................................................. 17
Number of HPMS Rated Miles ...................................................................................... 18
ii
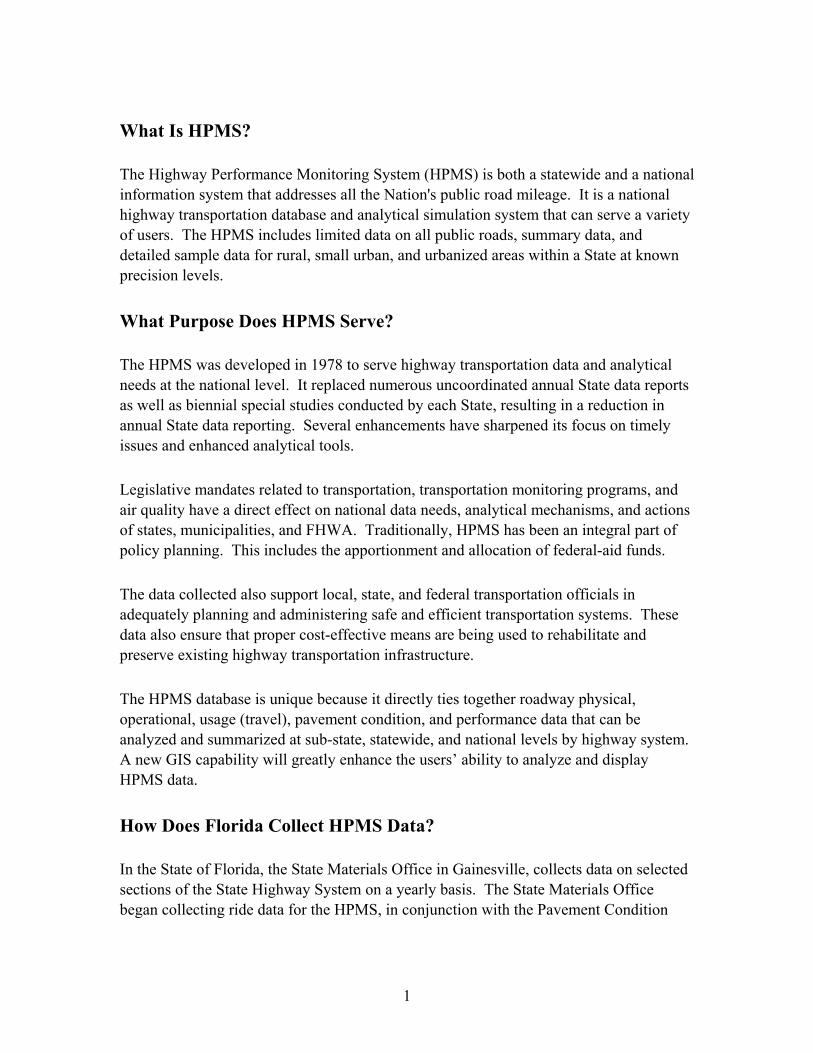
What Is HPMS?
The Highway Performance Monitoring System (HPMS) is both a statewide and a national information system that addresses all the Nation's public road mileage. It is a national highway transportation database and analytical simulation system that can serve a variety of users. The HPMS includes limited data on all public roads, summary data, and detailed sample data for rural, small urban, and urbanized areas within a State at known precision levels.
What Purpose Does HPMS Serve?
The HPMS was developed in 1978 to serve highway transportation data and analytical needs at the national level. It replaced numerous uncoordinated annual State data reports as well as biennial special studies conducted by each State, resulting in a reduction in annual State data reporting. Several enhancements have sharpened its focus on timely issues and enhanced analytical tools.
Legislative mandates related to transportation, transportation monitoring programs, and air quality have a direct effect on national data needs, analytical mechanisms, and actions of states, municipalities, and FHWA. Traditionally, HPMS has been an integral part of policy planning. This includes the apportionment and allocation of federal-aid funds.
The data collected also support local, state, and federal transportation officials in adequately planning and administering safe and efficient transportation systems. These data also ensure that proper cost-effective means are being used to rehabilitate and preserve existing highway transportation infrastructure.
The HPMS database is unique because it directly ties together roadway physical, operational, usage (travel), pavement condition, and performance data that can be analyzed and summarized at sub-state, statewide, and national levels by highway system. A new GIS capability will greatly enhance the users’ ability to analyze and display HPMS data.
How Does Florida Collect HPMS Data?
In the State of Florida, the State Materials Office in Gainesville, collects data on selected sections of the State Highway System on a yearly basis. The State Materials Office began collecting ride data for the HPMS, in conjunction with the Pavement Condition
1

Survey (PCS) in 1991. Prior to the collection of the 1994/1995 survey data, Florida reported sample sections only. However, with the collection of the 1994/1995 survey data, the Department was required to report the ride values in one direction (flexible and rigid) from the Pavement Management System (PMS) database. The flexible and rigid pavement sections were in addition to the HPMS sample sections. The State Materials Office collects ride values in both directions for divided roadways on the entire state maintained roadway system for PMS purposes.
Currently, FHWA requires the Florida Department of Transportation to collect HPMS Ride data, in one direction only, on the entire State Highway System (“Designated Sections”). These Sections follow the same section lengths and breaks as the PCS Sections. The sections resulting from this data collection are labeled “Rated Sections”. Some of the Designated Sections do not get rated because of construction projects or other causes. In addition, FHWA requires the collection of ride data on specific locations (that could be in either direction) that, in most cases, do not coincide with any PCS section. These sections are called “Sample Sections” and are identified by number, county section number, beginning milepost and ending milepost.
Prior to the 1998/99 data collection the ride values were reported as International Roughness Index (IRINF) values, not filtered. IRI is rigorously defined as a specific mathematical transform of a true profile. The 1998/1999 Survey was accomplished with new equipment (laser sensors replaced ultrasonic sensors). The ride values reported are International Roughness Index (IRIF300) filtered to a 300-foot wavelength. Because IRI is a property of the true profile, it can be measured with any valid profiler. The calculation of IRI takes into consideration wavelengths between 4 and 100 feet. Wavelengths outside this band do not contribute to the roughness seen by vehicles at speeds near 50 mph. Because different analysis apply different "filters" to a measured profile, a profilometric method will generally be valid for some applications and not for others. IRI values are reported in compliance with the FHWA order M 5600. 1B, appendix J, dated August 30, 1993.
The data collected between 1991 and 1996, in compliance with FHWA requirements, included bridges, railroad crossings, etc. But in accordance with new requirements, the current data collection omits bridges, railroad crossings, etc.
How Does Data Collection Procedures Effect HPMS Data?
Some of the problems that exist with the data collection process are that not all states process and report HPMS data the same way. Profilers collect longitudinal profile data
2
that is passed through a vehicle simulation computer program to calculate the International Roughness Index (IRI) values. However, the profile data can be averaged differently (moving average, straight average, etc.). The profile data can also be filtered differently (no filtering, 300 foot wavelength, etc.). In addition, the profile data can be collected using either ultrasonic sensors, laser sensors, optical sensors or infrared sensors. The sensors can be spaced differently on the test vehicle (different locations).
States report the collected IRI values in a variety of ways, left wheel path, right wheel path, average wheel path, half car simulation, etc. States also collect the data in a variety of ways. Although standards do exist (Appendix J), that specify the way the data is to be collected and reported, the interpretation is not always the same between states. In addition some states report HPMS data from the same section length already being collected as part of their Pavement Management System, rather than the specific HPMS sample section length.
Without specifying the details of the equipment being used to collect ride data it may not be realistic to compare data between states.
3

1999 HPMS Sections Statewide
Sample HPMS Sections are extracted from PCS data and reported to FHWA
+Sample HPMS Sections 13.5% (2,432 Miles)
4
HPMS Rated Miles: 11,264 Mi. (One Direction from PCS)
Rigid2.7%
(299 Mi.)Flexible97.3%
(10,965 Mi.)
Number of HPMS Sections: 4,638 (One Direction from PCS)
Flexible96.9%(4,496
Sections)
Rigid3.1%
(142 Sections)
Total PCS Rated Miles: 17,977 Mi. (Both Directions)
PCS Miles100%
(17,977 Mi.)
RIGID SECTIONSFLEXIBLE SECTIONS
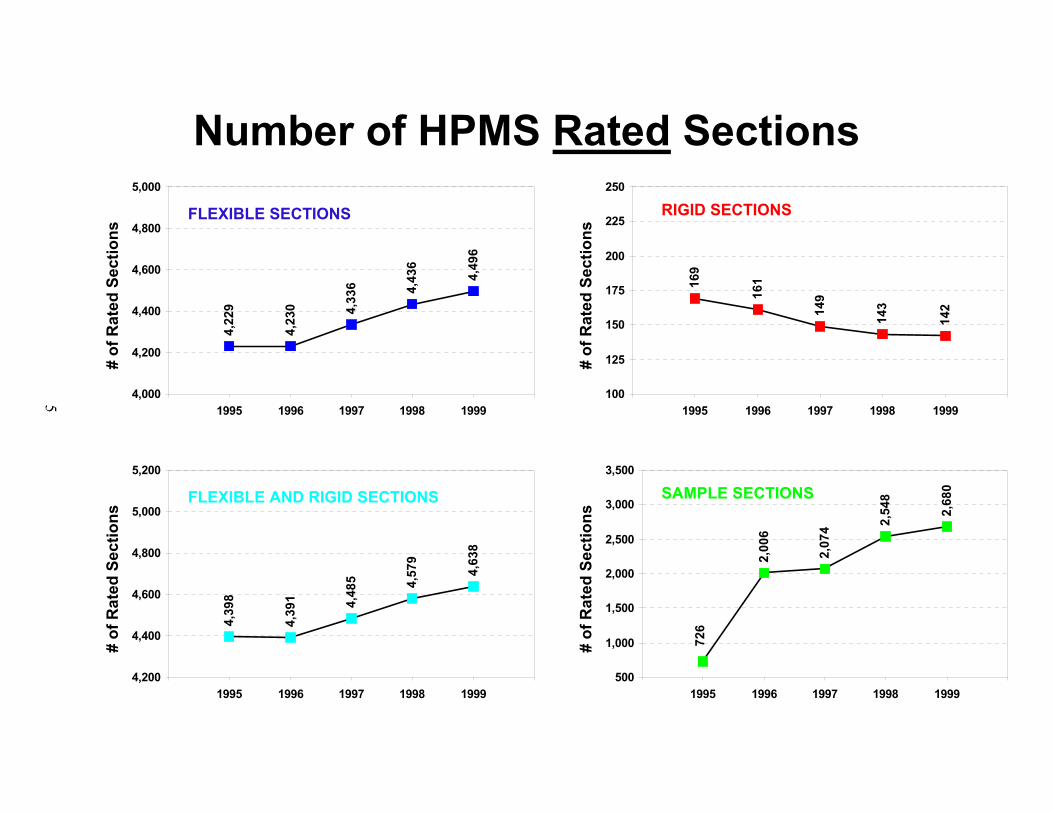
Number of HPMS Rated Sections
5
FLEXIBLE AND RIGID SECTIONS SAMPLE SECTIONS
169
161
149
143
142
100
125
150
175
200
225
250
1995 1996 1997 1998 1999
# of
Rat
ed S
ectio
ns `
4,22
9
4,23
0 4,33
6 4,43
6
4,49
6
4,000
4,200
4,400
4,600
4,800
5,000
1995 1996 1997 1998 1999
# of
Rat
ed S
ectio
ns `
4,39
8
4,39
1 4,48
5 4,57
9
4,63
8
4,200
4,400
4,600
4,800
5,000
5,200
1995 1996 1997 1998 1999
# of
Rat
ed S
ectio
ns `
2,00
6
2,07
4 2,54
8
2,68
0
726
500
1,000
1,500
2,000
2,500
3,000
3,500
1995 1996 1997 1998 1999
# of
Rat
ed S
ectio
ns `

354
334
314
312
299
200
250
300
350
400
450
1995 1996 1997 1998 1999
# of
Rat
ed M
iles
`
RIGID MILES10
,826
10,7
61
10,8
25 10,9
54
10,9
65
10,500
10,700
10,900
11,100
11,300
11,500
1995 1996 1997 1998 1999
# of
Rat
ed M
iles
`
FLEXIBLE MILES
Number of HPMS Rated Miles
6
11,1
80
11,0
95
11,1
39 11,2
66
11,2
64
10,700
10,900
11,100
11,300
11,500
11,700
1995 1996 1997 1998 1999
# of
Rat
ed M
iles
`
FLEXIBLE AND RIGID MILES
2,31
6
2,35
1
2,45
0
2,43
2
1,34
5
1,000
1,500
2,000
2,500
3,000
3,500
1995 1996 1997 1998 1999
# of
Rat
ed M
iles
`
SAMPLE MILES

180
172
166
162
156
120
140
160
180
200
220
1995 1996 1997 1998 1999
# of
Des
igna
ted
Sect
ions
RIGID SECTIONS4,
498
4,56
3 4,69
4 4,79
6
4,80
4
4,200
4,400
4,600
4,800
5,000
5,200
1995 1996 1997 1998 1999
# of
Des
igna
ted
Sect
ions FLEXIBLE SECTIONS
Number of HPMS Designated Sections
7
4,67
8
4,73
5 4,86
0
4,90
8
4,96
0
4,400
4,600
4,800
5,000
5,200
5,400
1995 1996 1997 1998 1999
# of
Des
igna
ted
Sect
ions
FLEXIBLE AND RIGID SECTIONS
906
2,13
4
2,19
2 2,68
1 2,96
4
500
1,000
1,500
2,000
2,500
3,000
3,500
4,000
1995 1996 1997 1998 1999
# of
Des
igna
ted
Sect
ions
SAMPLE SECTIONS

374
358
344
338
324
250
300
350
400
450
1995 1996 1997 1998 1999
# of
Des
igna
ted
Mile
s ` RIGID MILES
11,4
23
11,4
67
11,4
70
11,4
85
11,5
13
11,000
11,200
11,400
11,600
11,800
12,000
1995 1996 1997 1998 1999
# of
Des
igna
ted
Mile
s` FLEXIBLE MILES
Number of HPMS Designated Miles
8
11,7
96
11,8
25
11,8
14
11,8
23
11,8
37
11,400
11,600
11,800
12,000
12,200
12,400
1995 1996 1997 1998 1999
# of
Des
igna
ted
Mile
s ` FLEXIBLE AND RIGID MILES
1,60
9
2,13
4
2,19
2 2,56
6
2,68
3
1,000
1,500
2,000
2,500
3,000
3,500
1995 1996 1997 1998 1999
# of
Des
igna
ted
Mile
s ` SAMPLE MILES
IRI Range
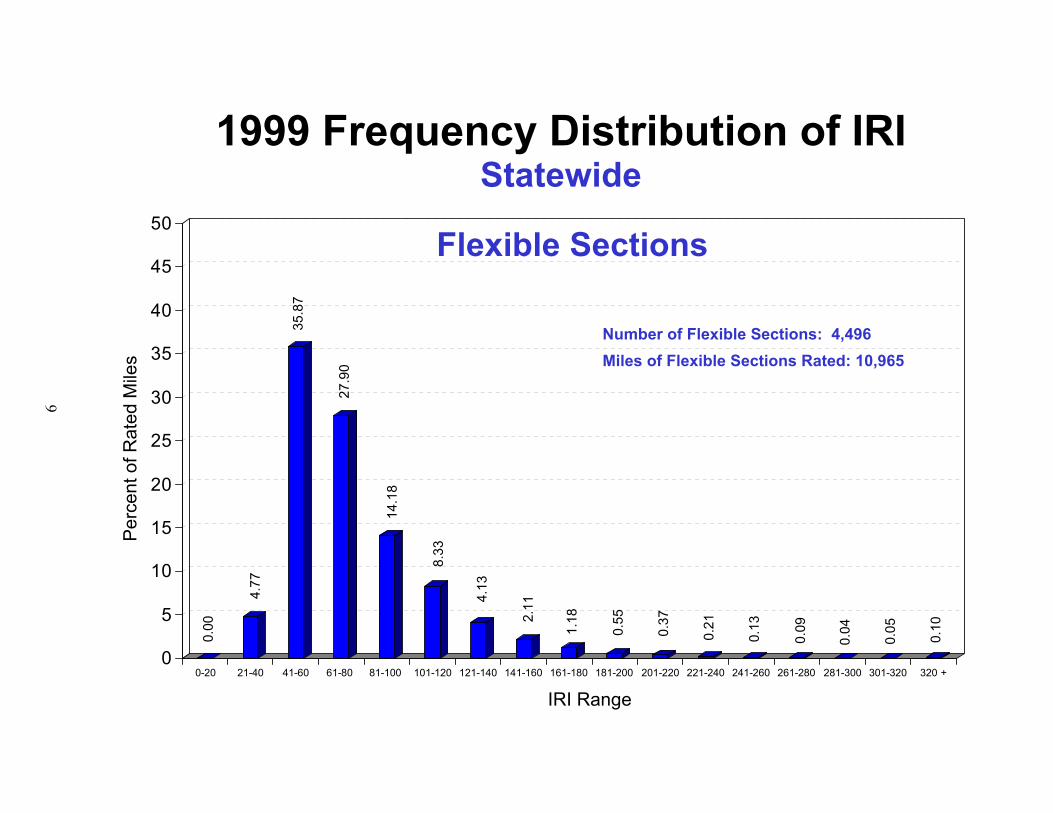
0.00
4.77
35.8
7
27.9
0
14.1
8
8.33
4.13
2.11
1.18
0.55
0.37
0.21
0.13
0.09
0.04
0.05
0.10
0
5
10
15
20
25
30
35
40
45
50
Perc
ent o
f Rat
ed M
iles
0-20 21-40 41-60 61-80 81-100 101-120 121-140 141-160 161-180 181-200 201-220 221-240 241-260 261-280 281-300 301-320 320 +
1999 Frequency Distribution of IRI Statewide
Flexible Sections
Number of Flexible Sections: 4,496 Miles of Flexible Sections Rated: 10,965
9
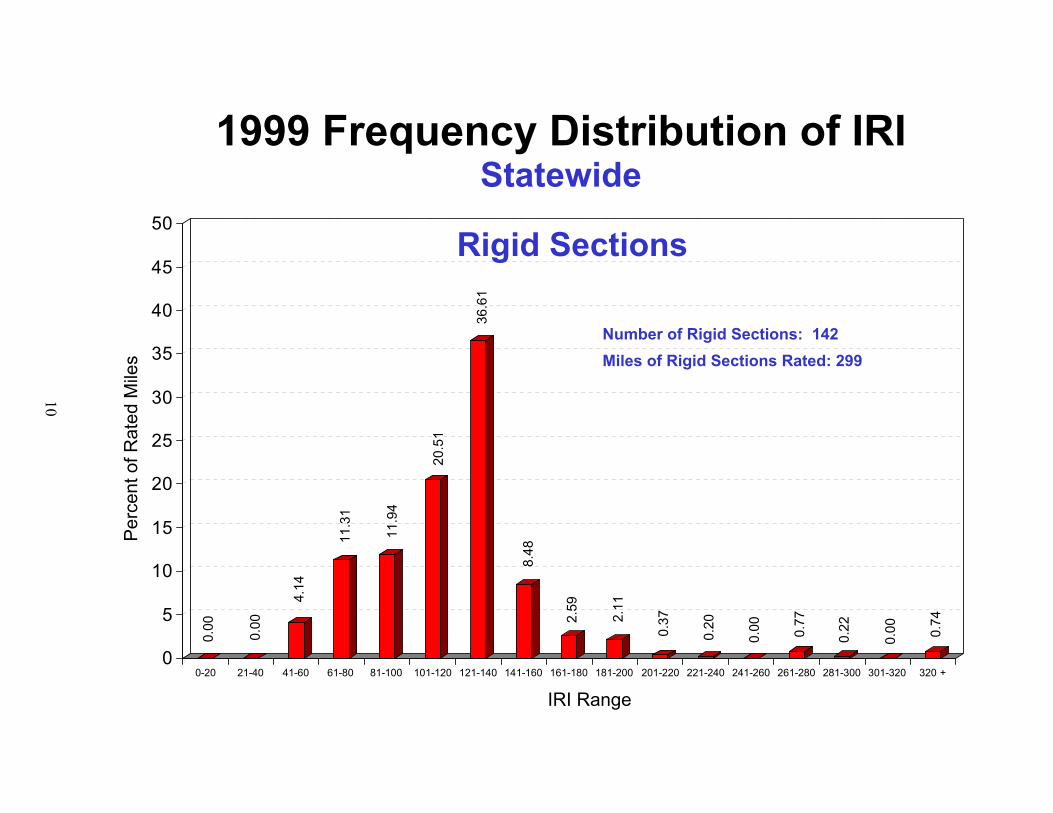
0.00
0.00
4.14
11.3
1
11.9
4
20.5
1
36.6
1
8.48
2.59
2.11
0.37
0.20
0.00 0.77
0.22
0.00 0.74
0
5
10
15
20
25
30
35
40
45
50
Perc
ent o
f Rat
ed M
iles
0-20 21-40 41-60 61-80 81-100 101-120 121-140 141-160 161-180 181-200 201-220 221-240 241-260 261-280 281-300 301-320 320 +
1999 Frequency Distribution of IRI Statewide
Rigid Sections
Number of Rigid Sections: 142 Miles of Rigid Sections Rated: 299
10
IRI Range

0.00
4.64
35.0
3
27.4
6
14.1
2
8.65
4.99
2.28
1.22
0.59
0.37
0.21
0.13
0.10
0.05
0.05
0.12
0
5
10
15
20
25
30
35
40
45
50
Perc
ent o
f Rat
ed M
iles
0-20 21-40 41-60 61-80 81-100 101-120 121-140 141-160 161-180 181-200 201-220 221-240 241-260 261-280 281-300 301-320 320 +
1999 Frequency Distribution of IRI Statewide
Flexible and Rigid Sections
Number of Flexible and Rigid Sections: 4,638 Miles of Flexible and Rigid Sections Rated: 11,264
11
IRI Range
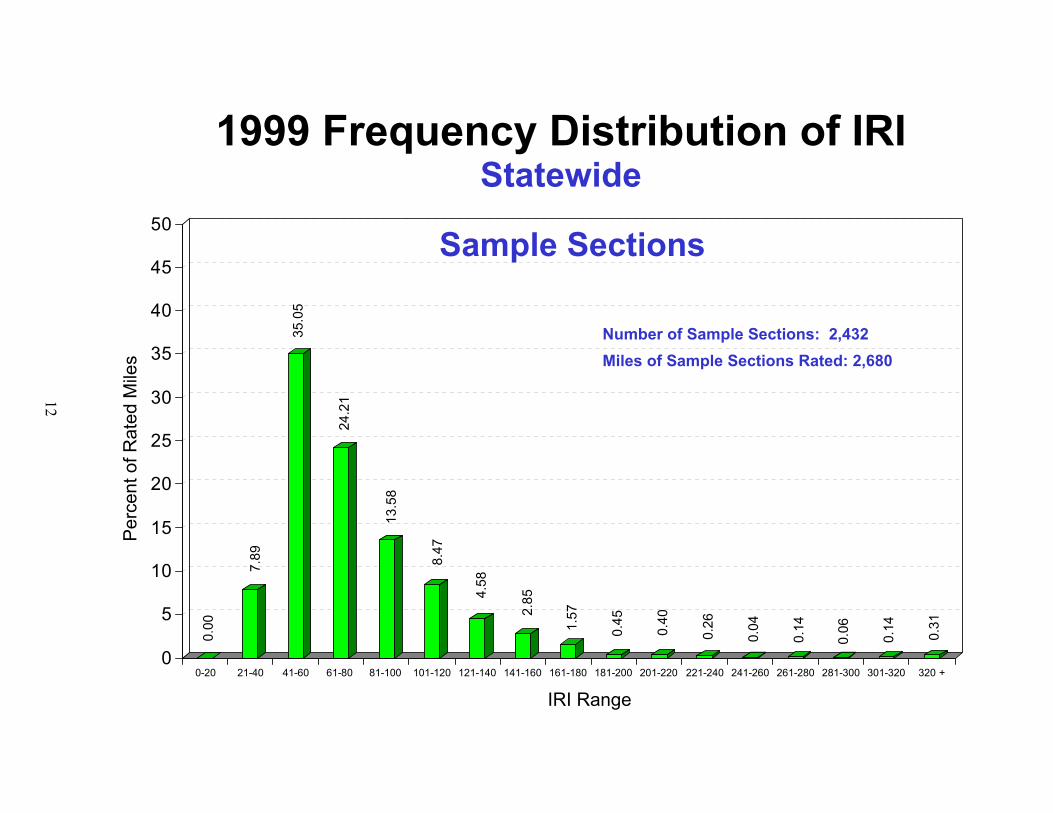
0.00
7.89
35.0
5
24.2
1
13.5
8
8.47
4.58
2.85
1.57
0.45
0.40
0.26
0.04
0.14
0.06
0.14 0.31
0
5
10
15
20
25
30
35
40
45
50
Perc
ent o
f Rat
ed M
iles
0-20 21-40 41-60 61-80 81-100 101-120 121-140 141-160 161-180 181-200 201-220 221-240 241-260 261-280 281-300 301-320 320 +
1999 Frequency Distribution of IRI Statewide
Sample Sections
Number of Sample Sections: 2,432 Miles of Sample Sections Rated: 2,680
12
IRI Range

16.8
5
15.0
4 21.7
4
23.4
2
68.5
5
46.3
8
50.0
4
45.2
5 50.0
4
24.7
3
36.7
7
34.9
1
33.0
1
26.5
4
6.73
0
10
20
30
40
50
60
70
80
90
Perc
ent o
f Rat
ed M
iles
0-80 81-130 131 +
19951996199719981999
IRI Ranges According to Appendix J of the HPMS Manual
Percent of Rated Miles within IRI Ranges from 1995 – 1999
Statewide Flexible Sections
13

8.82
8.62
6.16 8.
21
15.4
5
39.7
4
41.3
4
43.4
2
34.9
4
50.3
8
51.4
4
50.0
4
50.4
2 56.8
5
34.1
7
0
10
20
30
40
50
60
70
80
90
Perc
ent o
f Rat
ed M
iles
0-80 81-130 131 +
19951996199719981999
IRI Ranges According to Appendix J of the HPMS Manual
Percent of Rated Miles within IRI Ranges from 1995 – 1999
Statewide Rigid Sections
14

16.5
9
14.8
5 21.3
0
23.0
0
67.1
4
46.1
7
49.7
8
45.2
0
49.6
2
25.4
1
37.2
3
35.3
7
33.5
0
27.3
8
7.46
0
10
20
30
40
50
60
70
80
90
Perc
ent o
f Rat
ed M
iles
0-80 81-130 131 +
19951996199719981999
IRI Ranges According to Appendix J of the HPMS Manual
Percent of Rated Miles within IRI Ranges from 1995 – 1999
Statewide Flexible and Rigid Sections
15
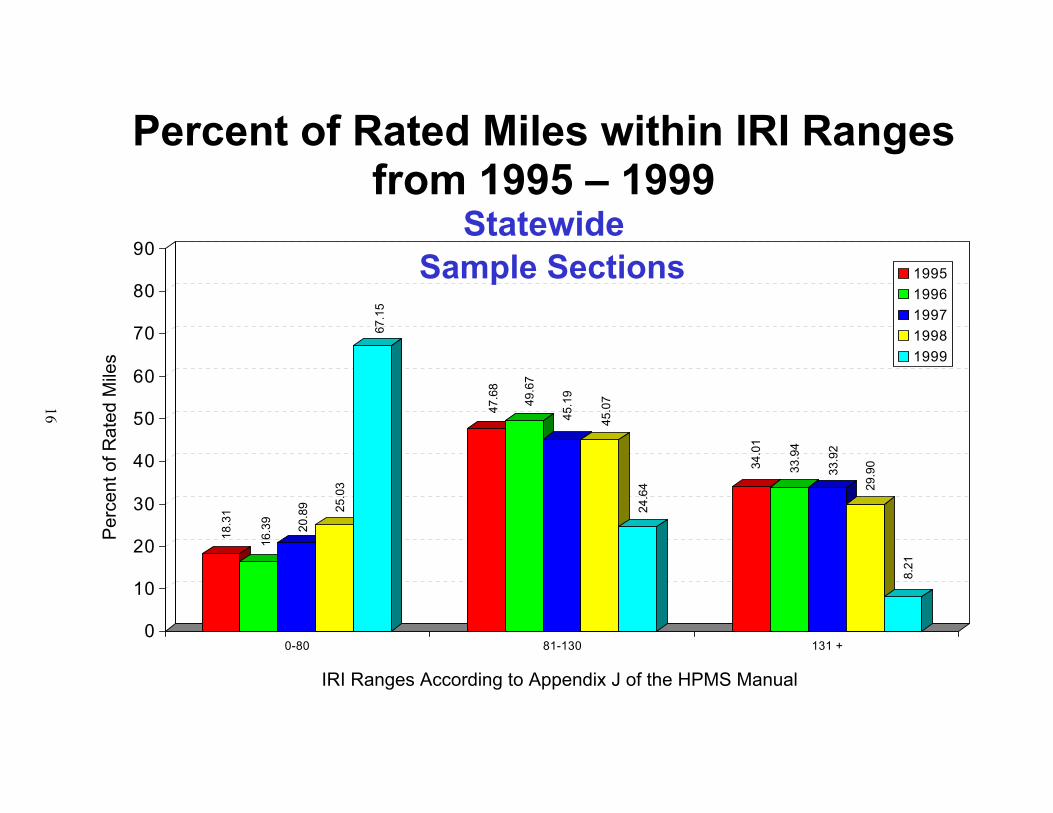
18.3
1
16.3
9
20.8
9 25.0
3
67.1
5
47.6
8
49.6
7
45.1
9
45.0
7
24.6
4
34.0
1
33.9
4
33.9
2
29.9
0
8.21
0
10
20
30
40
50
60
70
80
90
Perc
ent o
f Rat
ed M
iles
0-80 81-130 131 +
19951996199719981999
IRI Ranges According to Appendix J of the HPMS Manual
Percent of Rated Miles within IRI Ranges from 1995 – 1999
Statewide Sample Sections
16
100
120
140
160
180
200
Rat
ed S
ectio
ns
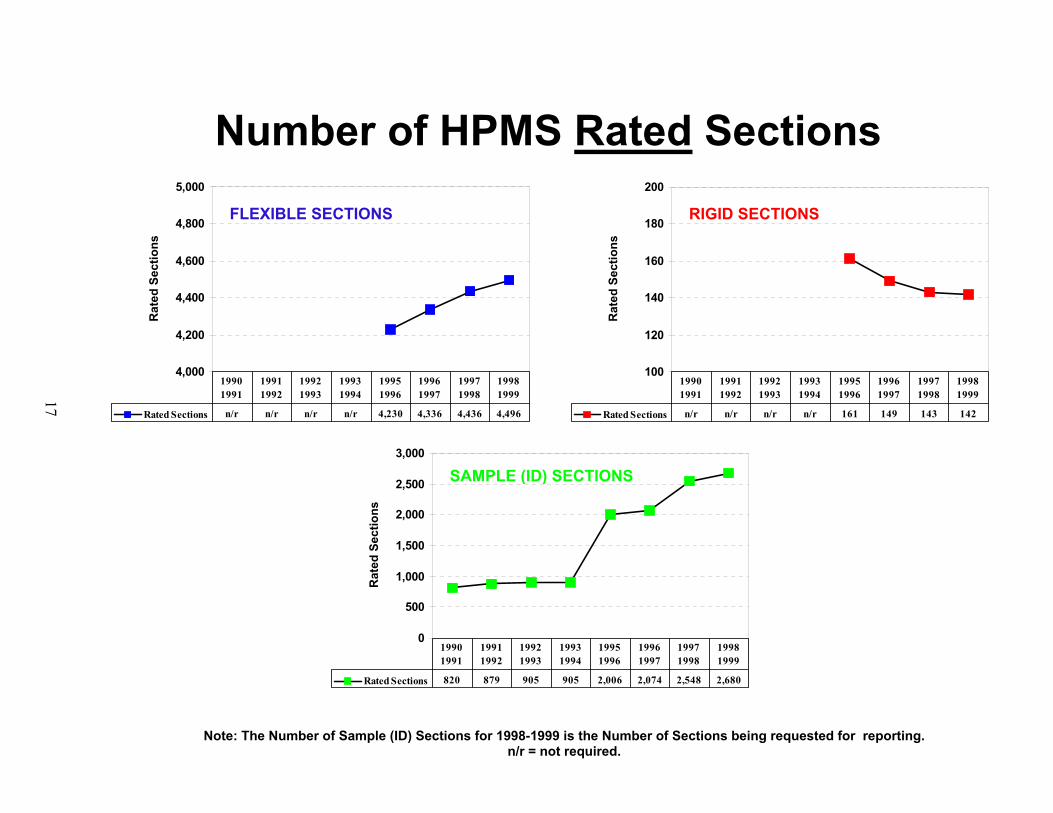
Rated Sections n/r n/r n/r n/r 161 149 143 142
1990 1991
1991 1992
1992 1993
1993 1994
1995 1996
1996 1997
1997 1998
1998 1999
RIGID SECTIONS
4,000
4,200
4,400
4,600
4,800
5,000
Rat
ed S
ectio
ns
Rated Sections n/r n/r n/r n/r 4,230 4,336 4,436 4,496
1990 1991
1991 1992
1992 1993
1993 1994
1995 1996
1996 1997
1997 1998
1998 1999
FLEXIBLE SECTIONS
Number of HPMS Rated Sections
17
0
500
1,000
1,500
2,000
2,500
3,000
Rat
ed S
ectio
ns
Rated Sections 820 879 905 905 2,006 2,074 2,548 2,680
1990 1991
1991 1992
1992 1993
1993 1994
1995 1996
1996 1997
1997 1998
1998 1999
SAMPLE (ID) SECTIONS
Note: The Number of Sample (ID) Sections for 1998-1999 is the Number of Sections being requested for reporting. n/r = not required.

200
250
300
350
400
Rat
ed M
iles
Rated Miles n/r n/r n/r n/r 354 334 314 312 299
1990 1991
1991 1992
1992 1993
1993 1994
1994 1995
1995 1996
1996 1997
1997 1998
1998 1999
RIGID MILES
10,500
10,700
10,900
11,100
11,300
11,500
Rat
ed M
iles
Rated Miles n/r n/r n/r n/r 10,826 10,761 10,825 10,954 10,965
1990 1991
1991 1992
1992 1993
1993 1994
1994 1995
1995 1996
1996 1997
1997 1998
1998 1999
FLEXIBLE MILES
Number of HPMS Rated Miles
18
1,000
1,500
2,000
2,500
3,000
Rat
ed M
iles
Rated Miles 1,585 1,574 1,612 1,612 1,345 2,316 2,351 2,450 2,432
1990 1991
1991 1992
1992 1993
1993 1994
1994 1995
1995 1996
1996 1997
1997 1998
1998 1999
SAMPLE (ID) MILES
Note: The Number of Sample (ID) Sections for 1998-1999 is the Number of Sections being requested for reporting. n/r = not required.