Embed Size (px)
Citation preview

STATE OF TRADE
SURVEYQ4 2017

Introduction page 3
Summary page 4
Workloads page 5
Residential workloads page 6
Non-residential workloads page 7
Expected workloads and enquiries page 9
Residential expected workloads page 9
Non-residential expected workloads page 10
Prices and costs page 11
Employment and labour page 12
Regional perspective page 15
About the Federation of Master Builders (FMB)
and the State of Trade Survey page 17
Contents
fmb.org.uk | 2

Introduction from FMB
Chief Executive Brian Berry
INTRODUCTION
“The number of
respondents reporting
difficulties in hiring key
skills, such as bricklayers
and carpenters, has
never been so high.”
fmb.org.uk | 3
The FMB’s latest State of Trade Survey shows that
growth in the SME construction sector slowed
slightly in the final three months of 2017, but
new enquiries and expected workloads dropped
more sharply. The picture was mixed for the home
nations with indicators in Northern Ireland and Scotland
moving into negative territory and growth slowing
amongst construction SMEs in England. Conversely
SME companies in Wales enjoyed the strongest results
with Wales being the only home nation to report an
improvement in workloads, expected workloads and
enquiries compared with the previous quarter.
Although employment rose for the nineteenth quarter
in a row and workloads overall are still growing, SME
builders continue to wrestle with material price hikes
and wage increases. Moreover, the Q4 2017 results
show that the difficulties firms face when trying to
hire tradespeople continue to mount. The number of
construction SME employers who are having trouble
hiring key occupations, such as bricklayers and
carpenters, has never been so high. This is a further sign
of the pressing need for our industry to double down on
its efforts to address the skills crisis we are facing.
• At the UK level, activity rose at a slightly
slower pace compared with Q3 2017;
• Northern Ireland’s and Scotland’s net
balances (including workloads, enquiries
and expected workloads) moved into
negative territory whereas England’s net
balance remained positive, but decreased;
• Wales was the only home nation to
experience activity increasing at a faster
rate compared to Q3 2017;
• These results represent the 19th
consecutive quarter of positive growth
which means that the construction SME
sector has been on the rise for more than
four and a half years;
• 87% of builders believe that material prices
will rise in the next six months, up from
82% in the previous quarter;
• 61% of construction SMEs foresee wage
increases over the next six months;
• 68% of firms are struggling to hire
bricklayers; 63% are struggling to hire
carpenters and joiners; and 48% are
struggling to hire plumbers and HVAC
traders.
Key statistics from Q4 2017:
fmb.org.uk | 4
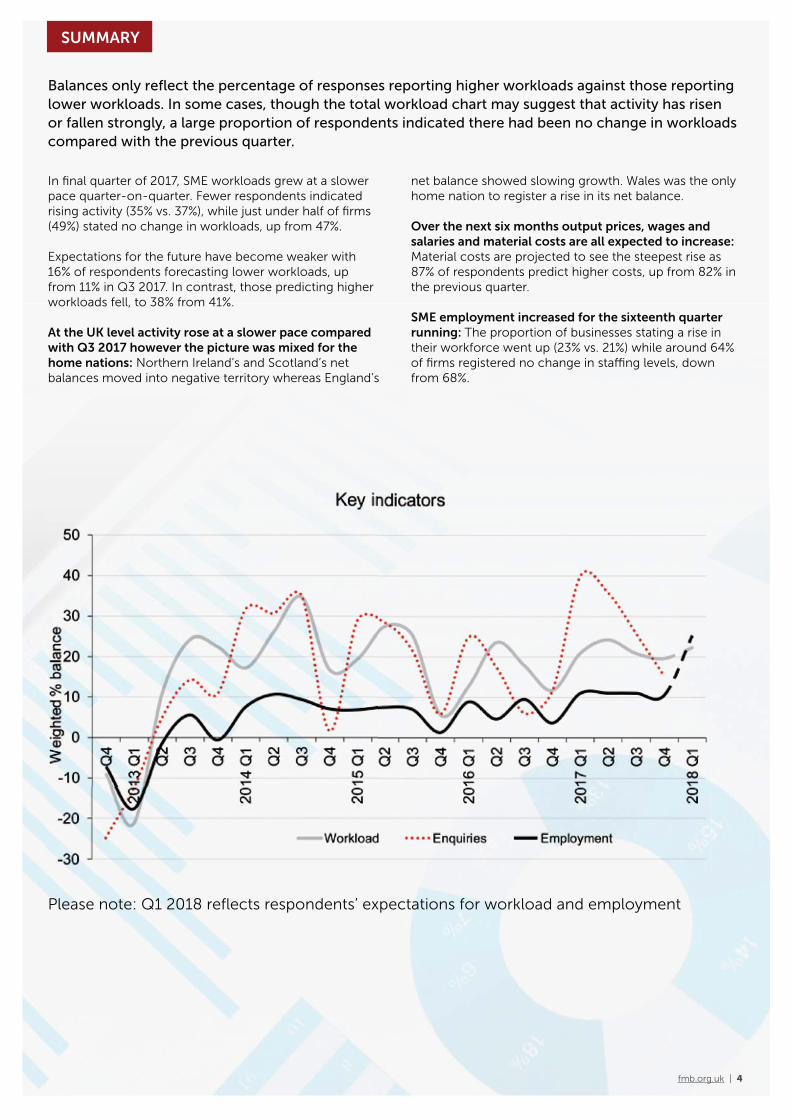
Please note: Q1 2018 reflects respondents’ expectations for workload and employment
In final quarter of 2017, SME workloads grew at a slower
pace quarter-on-quarter. Fewer respondents indicated
rising activity (35% vs. 37%), while just under half of firms
(49%) stated no change in workloads, up from 47%.
Expectations for the future have become weaker with
16% of respondents forecasting lower workloads, up
from 11% in Q3 2017. In contrast, those predicting higher
workloads fell, to 38% from 41%.
At the UK level activity rose at a slower pace compared
with Q3 2017 however the picture was mixed for the
home nations: Northern Ireland’s and Scotland’s net
balances moved into negative territory whereas England’s
net balance showed slowing growth. Wales was the only
home nation to register a rise in its net balance.
Over the next six months output prices, wages and
salaries and material costs are all expected to increase:
Material costs are projected to see the steepest rise as
87% of respondents predict higher costs, up from 82% in
the previous quarter.
SME employment increased for the sixteenth quarter
running: The proportion of businesses stating a rise in
their workforce went up (23% vs. 21%) while around 64%
of firms registered no change in staffing levels, down
from 68%.
Balances only reflect the percentage of responses reporting higher workloads against those reporting
lower workloads. In some cases, though the total workload chart may suggest that activity has risen
or fallen strongly, a large proportion of respondents indicated there had been no change in workloads
compared with the previous quarter.
SUMMARY

Despite edging down by 1 percentage point to +20, in
the three months to December 2017, the net balance
for overall workloads remained in positive territory for
the nineteenth consecutive quarter. Around 35% of
businesses indicated rising workloads, down from 37%,
while nearly half (49%) reported no change in workloads,
up from 47%.
The net balance for the commercial sector saw the
greatest jump of 17 percentage points to +19. The share
of respondents registering lower workloads fell, to 15%
from 21%, whereas approximately 34% of businesses
stated higher workloads, up from 23% in Q3 2017.
Even though the public (non-residential) R&M net balance
improved by 15 percentage points, it remained in negative
territory (-3) for the third consecutive quarter. Those
indicating lower workloads dropped from 26% to 12%,
while the majority of firms (79%) specified no change to
workloads.
The overall housing sector’s net balance edged up by
1 percentage point to +11. More businesses reported
higher workloads (28% vs. 24%) while more than half of
respondents (56%) stated no change in workloads.
The non-residential net balance increased by 8
percentage points to +16. Just over a quarter of firms
(26%) reported higher workloads, up from 19%, while
those indicating lower workloads was unchanged at 10%.
At 65%, the bulk of firms stated no change to workloads,
down from 71% in the previous quarter.
WORKLOADS
fmb.org.uk | 5
MAIN REPORT

RESIDENTIAL WORKLOADS
fmb.org.uk | 6
Despite falling by 6 percentage points to +1, the net
balance for the private new housing sector remained in
positive territory for the eighth successive quarter. The
proportion of firms reporting a rise in workloads fell (18%
vs. 23%) while those registering a decline in workloads
edged up to 17% from 16%.
The net balance for the social new housing sector
remained in negative territory for the second quarter
running as it decreased by 2 percentage points to -17.
More firms stated lower workloads (24% vs. 21%) whereas
approximately 68% of businesses reported no change in
workloads, down from 74%.
A drop of 11 percentage points took the net balance
for the social RM&I sector to -15, remaining in negative
territory for the second consecutive quarter. Just 7% of
respondents indicated a rise in workloads, down from
14% while more businesses (22% vs. 18%) stated lower
workloads.
The net balance for the private RM&I sector remained in
positive territory for the eighteenth successive quarter as
it went up by 6 percentage points to +18. Approximately
30% of businesses experienced higher workloads, up
from 27%, while those specifying lower workloads
declined, to 12% from 16%.
Weighted % balances
Workload 2016 Q1 Q2 Q3 Q4 2017 Q1 Q2 Q3 Q4
Private new +15 +13 +2 +15 +11 +27 +7 +1
Private RM&I +14 +17 +13 +8 +15 +19 +12 +18
Social new -7 +4 +13 +5 -8 +3 -15 -17
Social RM&I 0 -8 -6 +1 +3 +5 -4 -15
Total Residential +22 +22 +18 +30 +11 +16 +10 +11
MAIN REPORT

RESIDENTIAL / NON-RESIDENTIAL WORKLOADS
The public new build sector’s net balance remained in
negative territory for the second quarter running as it
deteriorated by 2 percentage points to -7. Just over a tenth
of respondents (11%) indicated higher workloads, down
from 13%, whereas those indicating lower workloads was
unchanged at 18%.
A jump of 17 percentage points took the commercial
sector’s net balance to +19. Around 34% of firms reported
higher workloads, up from 23%, while those recording
lower workloads decreased to 15% from 21%.
The net balance for the industrial sector went up by 6
percentage points to +7. A fifth of businesses reported
higher workloads, up from 14%, while those indicating
lower workloads was unchanged at 13%.
NON-RESIDENTIAL WORKLOADS
fmb.org.uk | 7
Weighted % balances
Workload 2016 Q1 Q2 Q3 Q4 2017 Q1 Q2 Q3 Q4
Public new build -26 -11 +6 -15 -1 +3 -5 -7
Public R&M -13 -13 -9 -17 +5 -11 -18 -3
Industrial -15 -17 +3 -20 0 +2 +1 +7
Commercial +2 +4 +8 -8 +4 +14 +2 +19
Private R&M -11 +0 -5 -10 +8 0 +6 +6
Total Non-Residential +5 0 +7 0 -3 +8 +8 +16
MAIN REPORT

NON-RESIDENTIAL WORKLOADS
Despite improving by 15 percentage points, the public
R&M sector’s net balance remained in negative territory
(-3) for the third consecutive quarter. Around 12% of
firms indicated lower workloads, down from 26% in the
previous quarter. However, the majority of firms (79%)
recorded no change in workloads.
The private R&M sector’s net balance was unchanged at
+6. Slightly more firms reported higher workloads (19%
vs. 18%), whereas those stating lower workloads was
unchanged at 13%.
fmb.org.uk | 8
MAIN REPORT
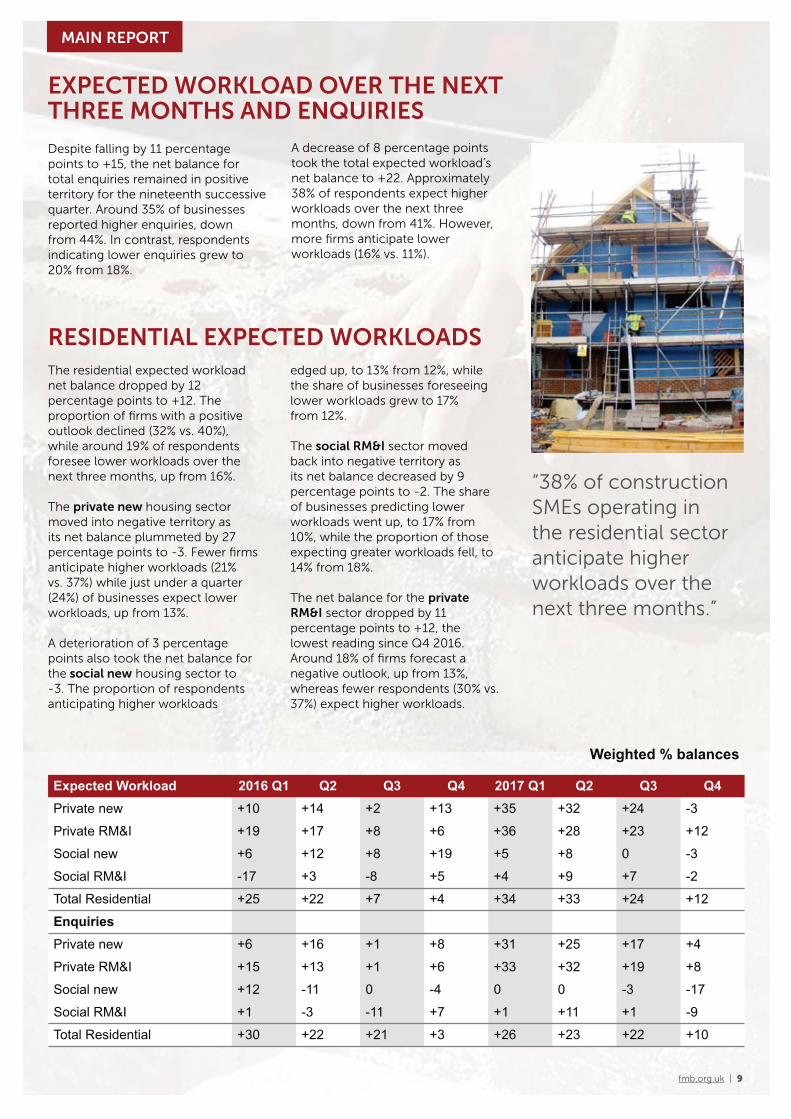
EXPECTED WORKLOAD OVER THE NEXT THREE MONTHS AND ENQUIRIES
The residential expected workload
net balance dropped by 12
percentage points to +12. The
proportion of firms with a positive
outlook declined (32% vs. 40%),
while around 19% of respondents
foresee lower workloads over the
next three months, up from 16%.
The private new housing sector
moved into negative territory as
its net balance plummeted by 27
percentage points to -3. Fewer firms
anticipate higher workloads (21%
vs. 37%) while just under a quarter
(24%) of businesses expect lower
workloads, up from 13%.
A deterioration of 3 percentage
points also took the net balance for
the social new housing sector to
-3. The proportion of respondents
anticipating higher workloads
Despite falling by 11 percentage
points to +15, the net balance for
total enquiries remained in positive
territory for the nineteenth successive
quarter. Around 35% of businesses
reported higher enquiries, down
from 44%. In contrast, respondents
indicating lower enquiries grew to
20% from 18%.
edged up, to 13% from 12%, while
the share of businesses foreseeing
lower workloads grew to 17%
from 12%.
The social RM&I sector moved
back into negative territory as
its net balance decreased by 9
percentage points to -2. The share
of businesses predicting lower
workloads went up, to 17% from
10%, while the proportion of those
expecting greater workloads fell, to
14% from 18%.
The net balance for the private
RM&I sector dropped by 11
percentage points to +12, the
lowest reading since Q4 2016.
Around 18% of firms forecast a
negative outlook, up from 13%,
whereas fewer respondents (30% vs.
37%) expect higher workloads.
A decrease of 8 percentage points
took the total expected workload’s
net balance to +22. Approximately
38% of respondents expect higher
workloads over the next three
months, down from 41%. However,
more firms anticipate lower
workloads (16% vs. 11%).
RESIDENTIAL EXPECTED WORKLOADS
fmb.org.uk | 9
“38% of construction
SMEs operating in
the residential sector
anticipate higher
workloads over the
next three months.”
Weighted % balances
Expected Workload 2016 Q1 Q2 Q3 Q4 2017 Q1 Q2 Q3 Q4
Private new +10 +14 +2 +13 +35 +32 +24 -3
Private RM&I +19 +17 +8 +6 +36 +28 +23 +12
Social new +6 +12 +8 +19 +5 +8 0 -3
Social RM&I -17 +3 -8 +5 +4 +9 +7 -2
Total Residential +25 +22 +7 +4 +34 +33 +24 +12
Enquiries
Private new +6 +16 +1 +8 +31 +25 +17 +4
Private RM&I +15 +13 +1 +6 +33 +32 +19 +8
Social new +12 -11 0 -4 0 0 -3 -17
Social RM&I +1 -3 -11 +7 +1 +11 +1 -9
Total Residential +30 +22 +21 +3 +26 +23 +22 +10
MAIN REPORT

NON-RESIDENTIAL EXPECTED WORKLOADS
Throughout 2017 the net balance for
non-residential expected workloads
remained in positive territory. This is
in spite of it falling by 3 percentage
points to +10 in the final quarter of
last year. Around 27% of businesses
predict higher workloads, down
from 29%, while approximately
17% of respondents forecast lower
workloads, up from 15%.
A rise of 2 percentage points took
the Public R&M sector’s net balance
to +3. Just under a fifth of firms
(19%) anticipate higher workloads,
up from 15%, while at 65% most
businesses envisage no change in
workloads, down from 70% in the
previous quarter.
The net balance for the private R&M
sector fell by 10 percentage points
to +3. Approximately 18% of
respondents project higher workloads,
down from 24%, while around 15% of
businesses expect lower workloads,
up from 11%. However just over two
thirds of firms (67%) forecast no
change in workloads.
The industrial sector’s net balance
decreased by 9 percentage points
to +7. Approximately 17% of firms
anticipate lower workloads, up from
9%, while the bulk of respondents
(59%) predict no change to their
workloads. Businesses expecting
higher workloads was unchanged
at 24%.
A rise of 6 percentage points to +2
took the public new build sector’s
net balance back into positive
territory. Around 18% of businesses
forecast higher workloads, up from
16%. In contrast, approximately 17%
of respondents have a negative
outlook, down from 21%.
The commercial sector’s net balance
decreased by 4 percentage points
to +13. Despite this it remained
in positive territory for the fifth
consecutive quarter. Approximately
28% of respondents anticipate
higher workloads, down from a third
whereas around 56% forecast no
change to workloads, up from 52%.
“The net balance for non-residential expected workloads remained
in positive territory for the whole of 2017.”
fmb.org.uk | 10
Weighted % balances
Expected Workload 2016 Q1 Q2 Q3 Q4 2017 Q1 Q2 Q3 Q4
Public new build -6 +17 -10 +5 +9 +11 -4 +2
Public R&M -11 +13 -16 -8 +9 +0 +1 +3
Industrial -10 0 -6 0 +18 +13 +16 +7
Commercial +18 +2 -5 +3 +14 +16 +17 +13
Private R&M +6 +13 -7 -14 +29 +15 +13 +3
Total Non-Residential +14 +11 -4 -3 +16 +3 +13 +10
Enquiries
Public new build -6 -1 -7 -14 +6 +7 -5 -3
Public R&M -3 -12 -10 -20 -8 +4 +4 -3
Industrial -15 +3 -7 -6 +5 -2 +13 +4
Commercial +4 +3 -4 -9 +13 +14 +16 +15
Private R&M +1 -3 -4 -19 +21 +6 +10 +4
Total Non-Residential +8 +5 +1 +1 +12 +10 +7 +14
MAIN REPORT

PRICES AND COSTS
The net balance for expected output prices went up
by 3 percentage points to +64. Around two thirds of
businesses forecast higher output prices over the next six
months, up from 63% in Q3 2017. Approximately 31% of
companies anticipate no change to output prices, down
from 35%.
The net balance (+61) for expected wages and salaries
also rose by 3 percentage points. Approximately 62% of
firms predict wage increases, up from 58% while around
36% of respondents expect no change in wages and
salaries, down from 41%.
An increase of 5 percentage points took the net
balance for expected material costs to +87. The bulk of
businesses (87%) project a rise in material costs, while
13% of respondents predict no change to material costs
over the coming six months.
“87% of firms expect a rise in material costs over the next six months.”
fmb.org.uk | 11
Weighted % balances
2016 Q1 Q2 Q3 Q4 2017 Q1 Q2 Q3 Q4
Output prices +29 +26 +33 +25 +49 +48 +36 +43
Wages & salaries +44 +45 +52 +44 +52 +59 +61 +63
Materials costs +64 +65 +65 +73 +87 +89 +81 +87
Weighted % balances
Expected 2016 Q1 Q2 Q3 Q4 2017 Q1 Q2 Q3 Q4
Output prices +43 +42 +33 +41 +68 +65 +61 +64
Wages & salaries +51 +53 +41 +40 +66 +62 +58 +61
Materials costs +63 +63 +65 +78 +85 +82 +82 +87
MAIN REPORT
Prices and costs weighted % balance chart

EMPLOYMENT AND LABOUR
Throughout 2017 the total employment net balance has
remained at +11. More firms stated a rise in staffing levels
(23% vs. 21%), whereas those reporting a reduction in
employment grew, to 13% from 10%.
The employment net balance for all builders edged down
by 2 percentage points to +8. Approximately 13% of firms
reported a fall in staffing levels, up from 12% while those
stating no change in employment edged down to 65%
from 66%.
The net balance for all specialists edged up by 1
percentage point to +13. A quarter of respondents
reported higher staffing levels, up from 21%, while around
63% of firms indicated a no changes to their employment,
down from 71%.
The net balance for expected total employment
increased by 2 percentage points to +25. Around 34%
of firms predict a rise in staffing levels, up from 32%,
whereas approximately 57% of respondents foresee no
changes to staffing levels, down from 60%.
The expected employment net balance for all builders
went up by 2 percentage points to +28. More firms
expect to hire more staff (37% vs. 34%), while around 55%
of businesses project no change to their workforce, up
from 59%.
A rise of 1 percentage point took the expected
employment net balance of specialists to +22.
Approximately 31% of respondents envisage a rise in
employment, up from 30%, while the bulk of firms (59%)
expect no change in staffing levels.
fmb.org.uk | 12
Weighted % balances
Employment 2016 Q1 Q2 Q3 Q4 2017 Q1 Q2 Q3 Q4
All builders +9 +7 +12 +4 +11 +10 +10 +8
All specialists +8 +2 +6 +3 +11 +12 +12 +13
Total +9 +5 +10 +4 +11 +11 +11 +11
Total Employment +9 +5 +10 +4 +11 +11 +11 +11
Weighted % balances
Expected employment 2016 Q1 Q2 Q3 Q4 2017 Q1 Q2 Q3 Q4
All builders +26 +17 +14 +7 +32 +29 +26 +28
All specialists +14 +14 +10 +5 +30 +29 +21 +22
Total +20 +16 +12 +6 +31 +29 +23 +25
Total Employment +20 +16 +12 +6 +31 +29 +23 +25
MAIN REPORT

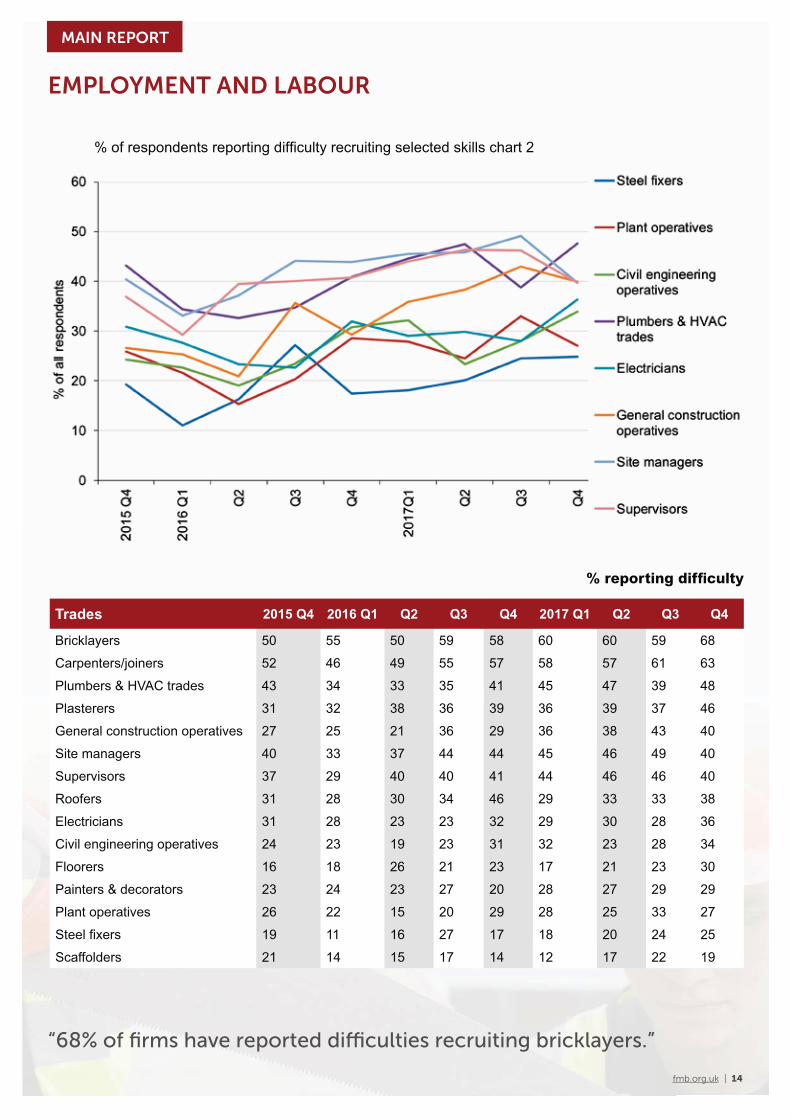
Once again, bricklayers and carpenters/joiners were the most difficult trades to hire. Plumbers and HVAC trades and
plasterers were also tough to recruit. In contrast, steel fixers and scaffolders were the easiest to hire.
EMPLOYMENT AND LABOUR
fmb.org.uk | 13
MAIN REPORT
EMPLOYMENT AND LABOUR
fmb.org.uk | 14
Trades 2015 Q4 2016 Q1 Q2 Q3 Q4 2017 Q1 Q2 Q3 Q4
Bricklayers 50 55 50 59 58 60 60 59 68
Carpenters/joiners 52 46 49 55 57 58 57 61 63
Plumbers & HVAC trades 43 34 33 35 41 45 47 39 48
Plasterers 31 32 38 36 39 36 39 37 46
General construction operatives 27 25 21 36 29 36 38 43 40
Site managers 40 33 37 44 44 45 46 49 40
Supervisors 37 29 40 40 41 44 46 46 40
Roofers 31 28 30 34 46 29 33 33 38
Electricians 31 28 23 23 32 29 30 28 36
Civil engineering operatives 24 23 19 23 31 32 23 28 34
Floorers 16 18 26 21 23 17 21 23 30
Painters & decorators 23 24 23 27 20 28 27 29 29
Plant operatives 26 22 15 20 29 28 25 33 27
Steel fixers 19 11 16 27 17 18 20 24 25
Scaffolders 21 14 15 17 14 12 17 22 19
% reporting difficulty
“68% of firms have reported difficulties recruiting bricklayers.”
MAIN REPORT

In the final quarter of last year, the
UK’s net balance went down by
11 percentage points to +12, the
lowest reading since Q4 2016. The
proportion of positive weighted
responses decreased to 28% from
35%, while the percentage of
negative weighted responses rose
to 16% from 12%. The proportion of
neutral weighted responses grew to
56% from 53%.
Scotland’s net balance moved
back into negative territory as it
plummeted by 19 percentage points
to -12. Around 16% of weighted
responses were positive, down
from 25% in the previous quarter.
In contrast, the share of firms with
negative weighted responses grew
(28% vs. 18%). At 56%, the bulk of
weighted responses were neutral,
slightly down from 57%.
England’s net balance dropped by
10 percentage points to +12. The
proportion of positive weighted
responses decreased to 25%, from
31%, while the share of negative
weighted responses increased,
to 13% from 9%. Around 62% of
responses were neutral, up from
60%.
The net balance for Northern Ireland
went down by 19 percentage points
to -7, moving into negative territory.
Just over a fifth (21%) of weighted
responses were positive, down from
28%, whereas negative weighted
responses rose to 28% from 16%.
Just over half (51%) of weighted
responses were neutral, down from
56%.
Wales was the only home nation to
experience a rise in its net balance, as
it went up by 13 percentage points to
+19. A third of weighted responses
were positive, up from 25%, while
the share of negative weighted
responses decreased to 14% from
19%. Neutral weighted responses fell
to 53% from 56%.
Regional figures are based on a composite indicator combining workload, expected workload and
enquiries questions, weighted by firm’s size. The net balance shows the difference between those
saying higher and those saying lower for the three questions.
REGIONAL PERSPECTIVE
fmb.org.uk | 15
Weighted % balances
2016 Q1 Q2 Q3 Q4 2017 Q1 Q2 Q3 Q4
East Midlands +4 +3 -12 +16 +12 +39 +46 +37
Eastern +18 +16 +7 +4 +37 +42 +34 +11
London +25 -17 0 +14 +29 +23 +19 +15
North East +22 +28 +30 -3 +36 +28 +23 +25
North West -2 +11 0 +10 +28 +19 +25 +6
South East +17 +15 -3 -8 +23 +32 +26 +23
South West +19 +11 +4 -14 +18 +24 +14 +4
West Midlands +9 +7 +1 -9 +18 +8 +36 -4
Yorks & Humber +26 +13 +30 +19 +28 +8 +28 -9
2016 Q1 Q2 Q3 Q4 2017 Q1 Q2 Q3 Q4
England +16 +12 +6 +3 +25 +25 +22 +12
Northern Ireland +34 +27 +15 +10 +27 +4 +12 -7
Scotland +6 +21 +8 +10 +35 +13 +7 -12
Wales -6 +16 -7 +15 +35 +26 +6 +19
UK +15 +14 +6 +4 +26 +24 +23 +12
MAIN REPORT

The net balance incorporates recent
workloads, expected workloads and
enquiries. It shows the difference
between those reporting higher and
those reporting lower.
fmb.org.uk | 16
Number = balance
Green arrow = Net balance increase
compared to previous quarter
Red arrow = Net balance decrease
compared to previous quarter
SCOTLAND
NORTHERNIRELAND
NORTHWEST
WALES EASTERN
EASTMIDLANDS
WESTMIDLANDS
-12
-7
23
4
6
11
37
-4
-9
15
SOUTHWEST
SOUTHEAST
LONDON
NORTHEAST
YORKSHIRE& HUMBER
25
19
DEVOLVED COUNTRY AND REGIONAL PERSPECTIVE
MAIN REPORT
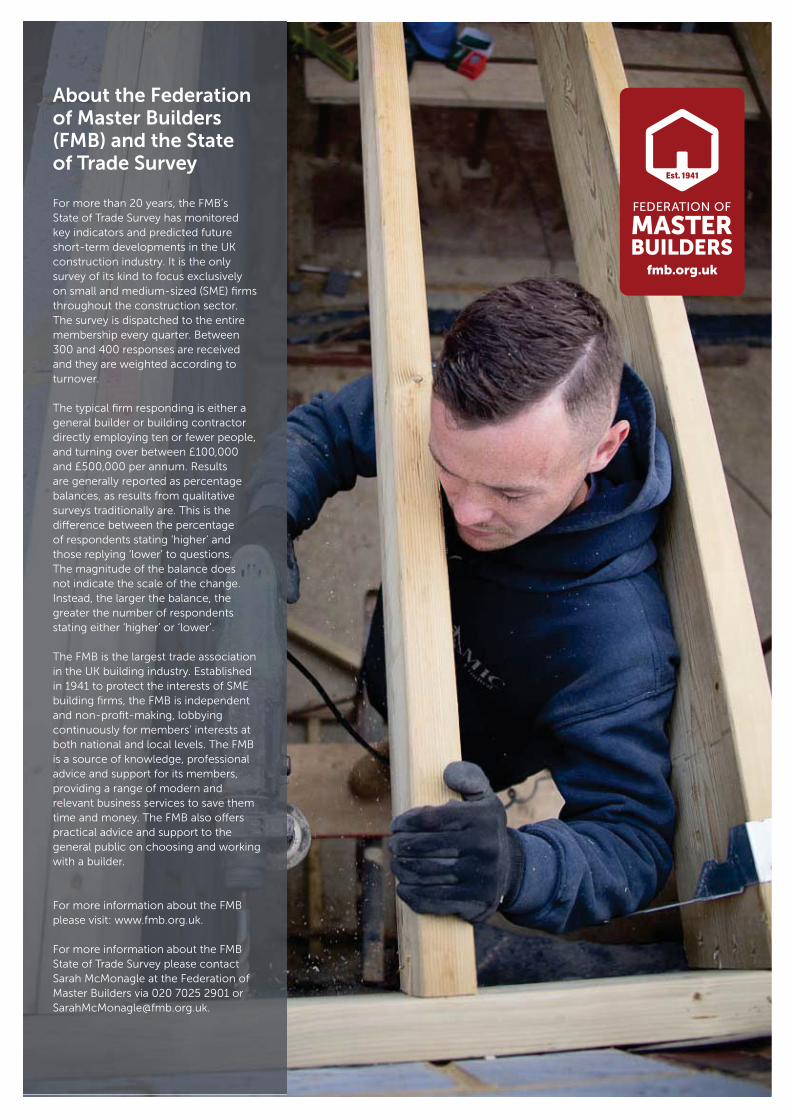
About the Federation of Master Builders (FMB) and the State of Trade Survey
For more than 20 years, the FMB’s
State of Trade Survey has monitored
key indicators and predicted future
short-term developments in the UK
construction industry. It is the only
survey of its kind to focus exclusively
on small and medium-sized (SME) firms
throughout the construction sector.
The survey is dispatched to the entire
membership every quarter. Between
300 and 400 responses are received
and they are weighted according to
turnover.
The typical firm responding is either a
general builder or building contractor
directly employing ten or fewer people,
and turning over between £100,000
and £500,000 per annum. Results
are generally reported as percentage
balances, as results from qualitative
surveys traditionally are. This is the
difference between the percentage
of respondents stating ‘higher’ and
those replying ‘lower’ to questions.
The magnitude of the balance does
not indicate the scale of the change.
Instead, the larger the balance, the
greater the number of respondents
stating either ‘higher’ or ‘lower’.
The FMB is the largest trade association
in the UK building industry. Established
in 1941 to protect the interests of SME
building firms, the FMB is independent
and non-profit-making, lobbying
continuously for members’ interests at
both national and local levels. The FMB
is a source of knowledge, professional
advice and support for its members,
providing a range of modern and
relevant business services to save them
time and money. The FMB also offers
practical advice and support to the
general public on choosing and working
with a builder.
For more information about the FMB
please visit: www.fmb.org.uk.
For more information about the FMB
State of Trade Survey please contact
Sarah McMonagle at the Federation of
Master Builders via 020 7025 2901 or