Embed Size (px)
Citation preview
Dialogue on “Water Environment Partnership in Asia (WEPA)”Ministry of Natural Resources and Environment22 O t 200822 Oct 2008
State of Water ResourcesState of Water Resources in Malaysia
Dato’ Ir. Lim Chow HockDepartment of Irrigation and Drainage MalaysiaMalaysia

As I take you alongAs I take you along…
Introduction- Annual Rainfall, Water Resources
Water Issues - Floods, Droughts, Pollution, g ,
Legislative and Institutional Issues
Challenges AheadChallenges Ahead
Conclusion

1 Introduction- Annual1. Introduction- Annual
Rainfall Water ResourcesRainfall, Water Resources

Annual Rainfall
Water is abundantNot well managed
2400 3800 2300
Average Annual Rainfall (mm)
Not well managed –shortage during drought and excess
2500300035004000
during wet season
1000150020002500
0500
Peninsular Sarawak Sabah

Mean Yearly RunoffMean Yearly Runoff

MeanYearly RunoffMeanYearly Runoff

Malaysia Water Resources billion m3
Annual rainfall : 990
Surface runoff : 566
Evapo-transpiration : 360
Groundwater recharge : 64
Surface artificial storages (dams) : 25Groundwater storage (aquifers) : 5 000Groundwater storage (aquifers) : 5,000
Water Use (year 2000)
Total for Malaysia : 12.5 billion m3 ( 2.2 % of surface runoff)
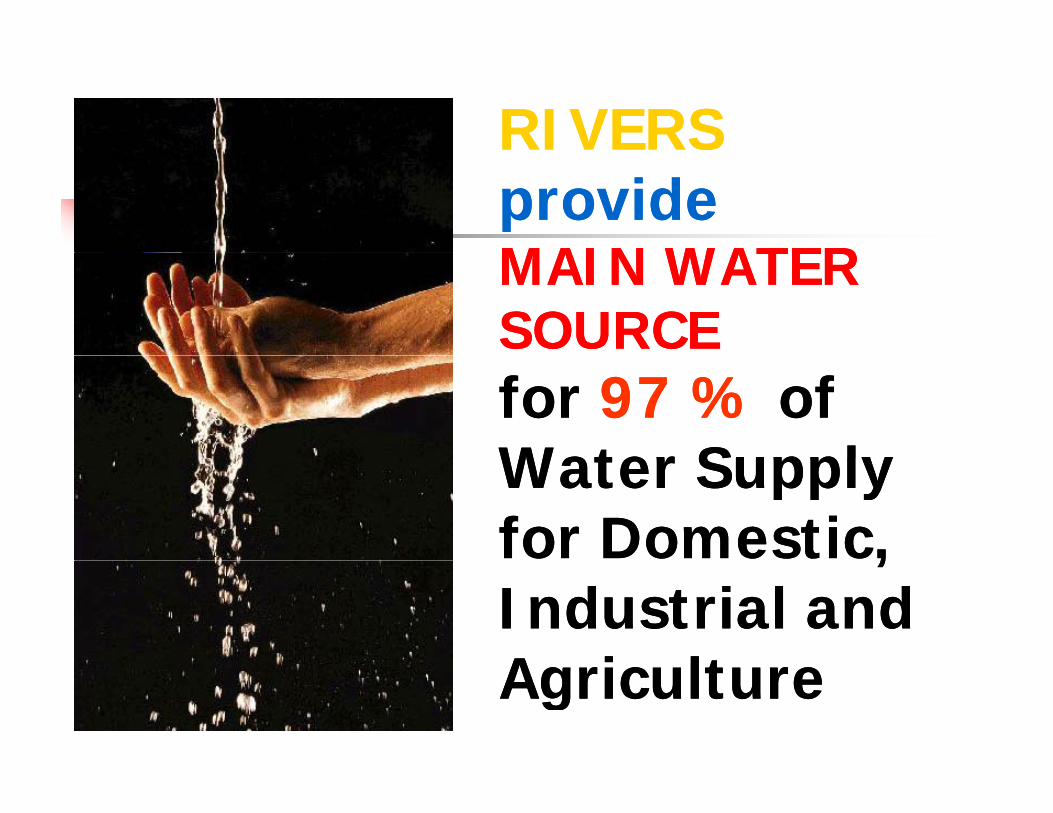
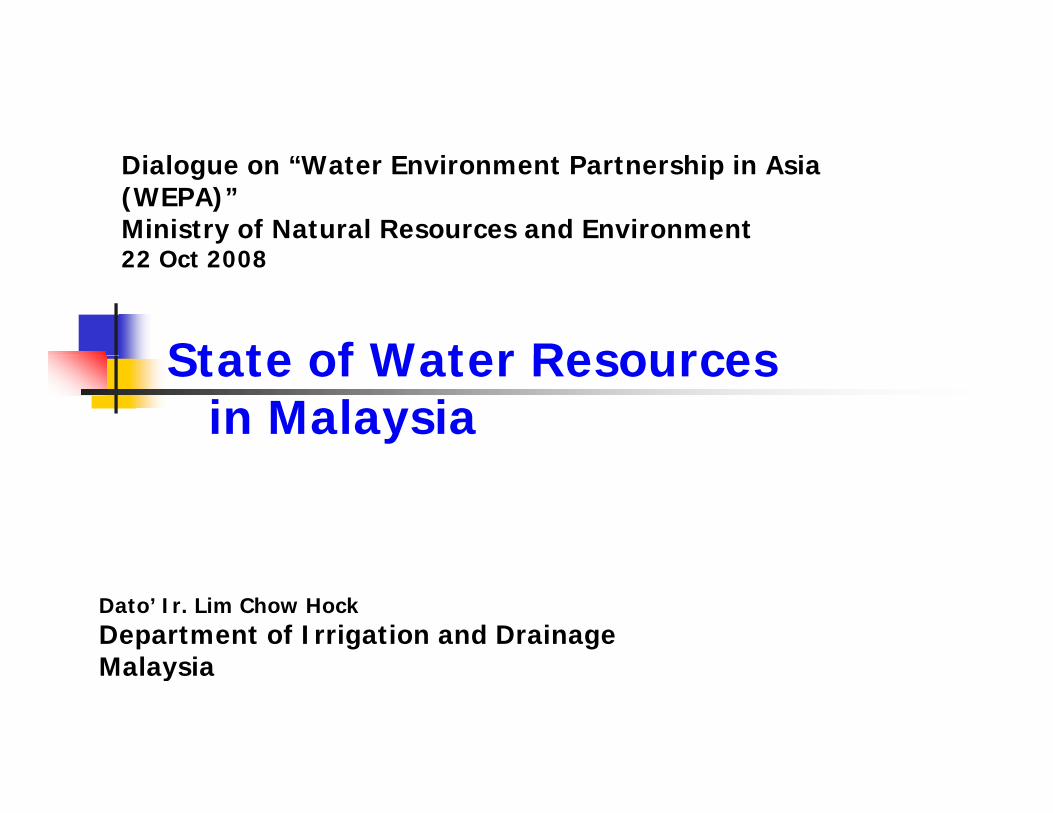
RIVERSRIVERSprovideMAIN WATERprovideMAIN WATERMAIN WATER SOURCEMAIN WATER SOURCEfor 97 % ofWater Supplyfor 97 % ofWater SupplyWater Supply for Domestic, Water Supply for Domestic, ,Industrial and A i lt
,Industrial and A i ltAgricultureAgriculture

Simplified Hydrogeological Map of Peninsular Malaysia
Aquifers in Alluvial Depositscoastal zone - Quaternary deposits of east and west coasts
highly productive zone ~ yielding gen 30-50 m3/h some havehighly productive zone ~ yielding gen. 30-50 m3/h, some have yield from 100 - 500 m3/h
water quality – good with some localities are brackish
Aquifers in Limestone/ Carbonate RocksAquifers in Limestone/ Carbonate Rocksdistribution - Kedah, Perlis, Perak, Kelantan & Selangorkarstic limestone most productive, yield about 30 m3/hwater quality - good, moderate to high TDS (soluble bicarbonate)
Aquifers in Sedimentary/ Volcanic Rocksfractures/sheared zones/porous
yield about 10 - 20 m3/h
water quality good with some high in Fewater quality – good with some high in Fe
Aquifers in Igneous Rocksjoints and fractures/weathered zones
yield - up to 10 m3/h (can be higher)
water quality - good to moderate, with low TDS, some with high Fe.

Location of dams belong to DID and other agencies


Total Domestic, Industrial and Irrigation Demand for Peninsular
Demand*
1998 2000 2010 2020 2030 2040 2050
Irrigation Demand for Peninsular Malaysia
*
Domestic Million m3/yr 1,833 2,029 2,987 3,862 4,606 5,251 5,904
Mld 5,022 5,558 8,184 10,582 12,622 14,388 16,176
Industrial Million m3/yr 1,260 1,454 2,592 3,561 4,330 5,016 5,639
Mld 3,453 3,985 7,101 9,756 11,863 13,743 15,452
Domestic Million m3/yr 3,093 3,483 5,578 7,423 8,936 10,267 11,543and
IndustrialMld 8,475 9,543 15,285 20,338 24,485 28,131 31,628
Irrigation Million m3/yr 7,350 7,350 6,517 6,517 6,132 6,132 6,132
Mld 20,139 20,139 17,857 17,857 16,802 16,802 16,802
Total Demand
Million m3/yr 10,443 10,833
12,095 13,940
15,068 16,399
17,675
Mld 28 614 29 68 33 142 38 19 41 287 44 93 48 43Mld 28,614 29,682
33,142 38,195
41,287 44,933
48,430*Include losses
m3/yr = cubic meters per yearMld = Million litres per day

Water ManagementWater is a state matter
gazette of water catchmentsNational Water Resources Council 1998National Water Resources Council - 1998
involvement of Federal Government in the water sectornational water resources policyi 2003 d th f l ti f IRBM M t Pl fin 2003 approved the formulation of IRBM Master Plans for all 189 river basins
Ministry of Energy, Water and Communications, and Mi i t f N t l R d E i tMinistry of Natural Resources and Environment -2004
address water sector with respect to improving water utility i d i tservices and managing water resources

National Water Resources Council
- Proposed 189 IRBM master plans

WATER USER SECTORS
ReligionFlora & Fauna(Eco-system) Food/Fishery
SportsRecreation Culture
Transportation Water supply Agriculture

Rain-fed paddy 278,000 ha.
Irrigated paddy 322,000 ha.

2. Water Issues – Floods, Drought and PollutionDrought and Pollution

a. Water Excess (Floods)

b. Water Shortages (Droughts)

c. Water Quality (Pollution)

a. W a t e r E x c e s s
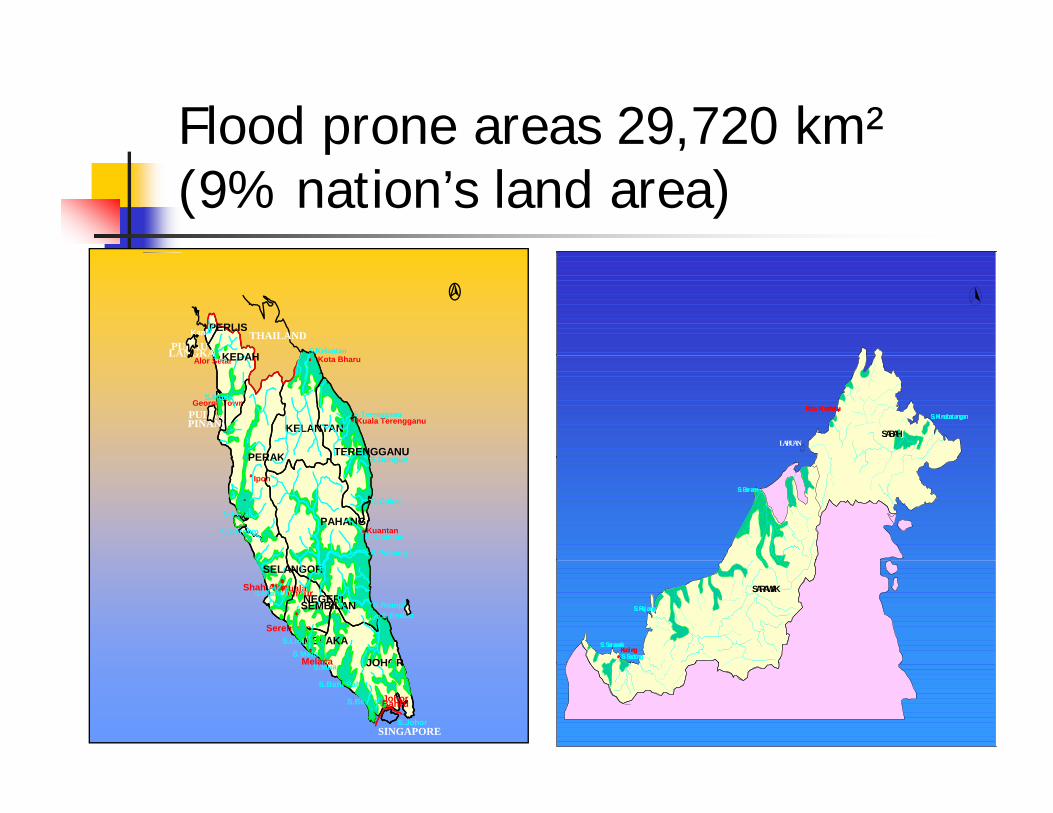
Flood prone areas 29,720 km² p ,(9% nation’s land area)
Kangar
LANGKAWIPULAUKEDAH
PERLISTHAILAND
S.Kelantan
KELANTAN
Alor Setar
George Town
PINANGPULAU
LANGKAWI
S.Muda
KEDAH
PERAK S D ng n
Kuala Terengganu
Kota Bharu
TERENGGANU
S.Terengganu
LABUAN
Kota KinabaluKota Kinabalu
SABAH
S.KinabatanganS.Kinabatangan
Ipoh
S.Perak
S.Bernam
PERAK
Kuantan
S.Pahang
S.Cukai
PAHANGS.Kuantan
S.Dungun
S.BaramS.Baram
LumpurKuala
S.Linggi
Shah Alam
Seremban
S.Klang
SELANGOR
S.RompinSEMBILANNEGERI
MELAKA
MelakaS.Melaka
JOHOR
S.EndauS.Rejang
S.Sadong
S.Rejang
S.Sadong
S.SarawakS.SarawakKucingKucing
SARAWAK
SINGAPORE
S.Muar
S.Batu Pahat
S.Benut
Melaka JOHOR
S.Johor
BahruJohor

Population affected by floodsPopulation affected by floodsStates
Flood Prone AreaTotal Area (km2) People Affected (no.)
PERLIS 19 13,000KEDAH 209 124 000KEDAH 209 124,000PULAU PINANG 232 510,000PERAK 535 244,000SELANGOR 1 652 726 000SELANGOR 1,652 726,000W.P. KUALA LUMPUR 3 13,000NEGERI SEMBILAN 130 42,000MELAKA 81 31,000JOHOR 2,367 297,000PAHANG 6,274 615,000TERENGGANU 2,223 457,000KELANTAN 1,640 714,000SABAH 3,241 635,000SARAWAK 11,114 494,000
P. MALAYSIAP. MALAYSIA 15,36515,365 3,786,0003,786,000SABAH & SARAWAKSABAH & SARAWAK 14,35514,355 1,129,0001,129,000
JUMLAHJUMLAH 29,72029,720 4,915,0004,915,000

Flood damage: RM 915 million annuallyRM1.83 billion consequential economic drag

Cause of FloodingDisposal of solid wastes into waterways
Sediments from land clearance and
construction areas.
Increase in impervious areas

Types of flooding
Flash Flooding (localise and short duration)duration)Monsoonal Flooding (widespread and
long duration)Flooding caused by tsunami (an
isolated case)

i. Flash Flooding
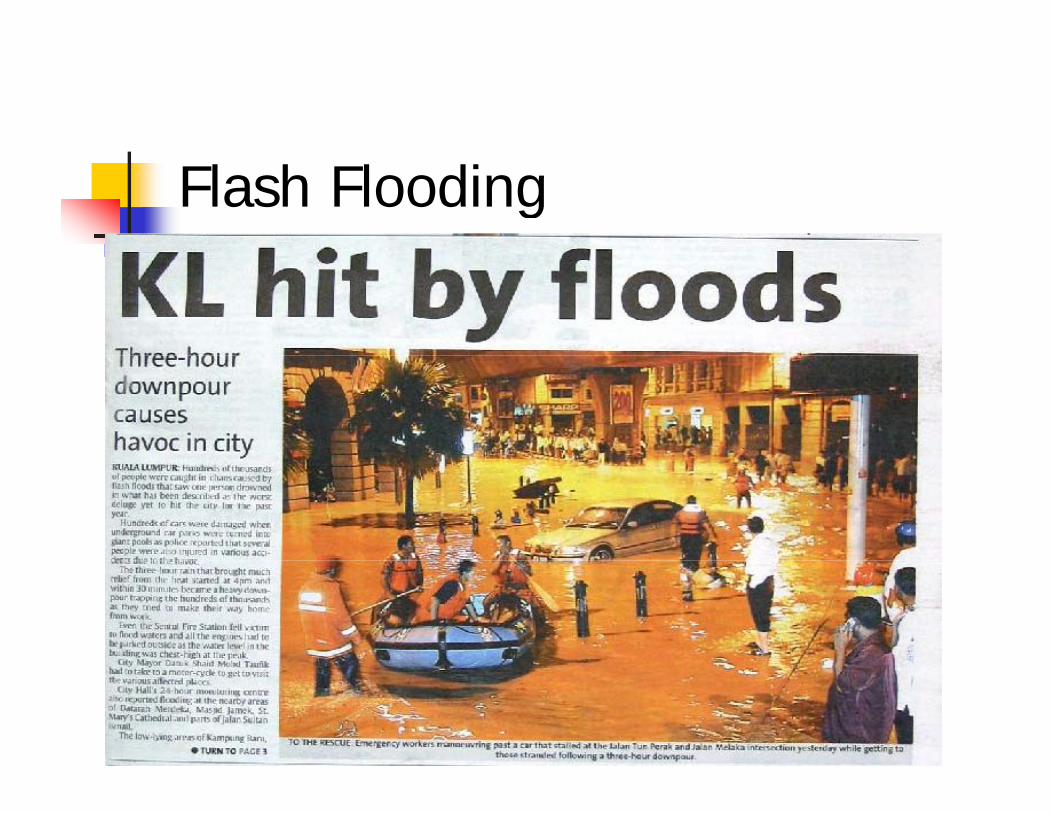
Flash Flooding

Flash Floodingg

Flash Flooding
Flooding in Sungai Buloh on 17 Julai 2004
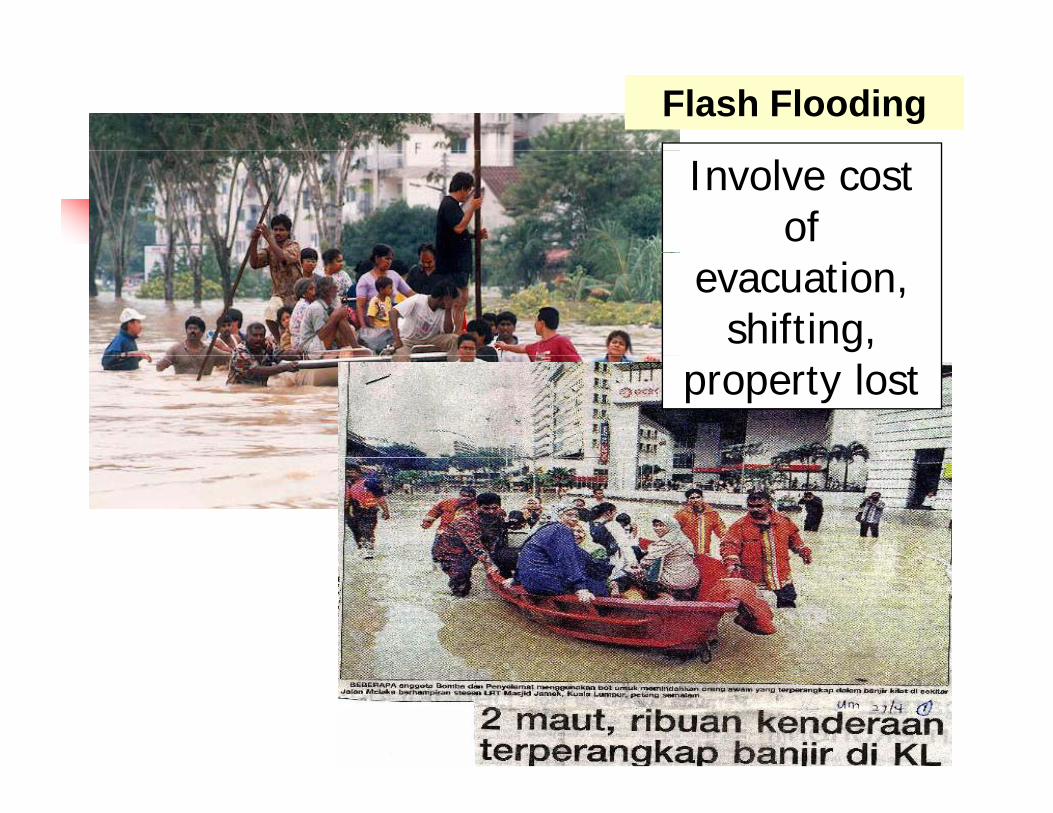
Flash Flooding
Involve cost of
evacuation, shifting,
property lost

ii. Monsoonal Flooding
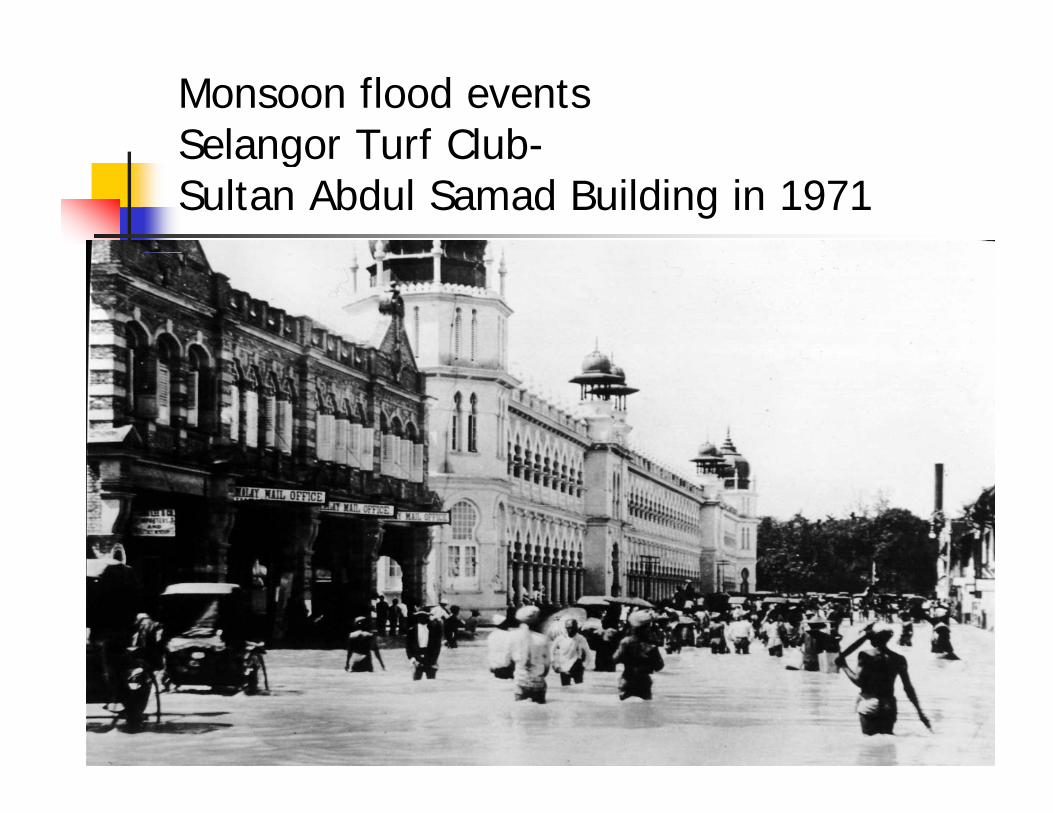
Monsoon flood eventsSelangor Turf Club-Selangor Turf ClubSultan Abdul Samad Building in 1971

Monsoon flood eventsMonsoon flood eventsKuala Kangsar, Perak in 1971

Flooding caused by tropical storm Greg Penampang Sabah 26 Dec 1996Greg Penampang, Sabah 26 Dec. 1996
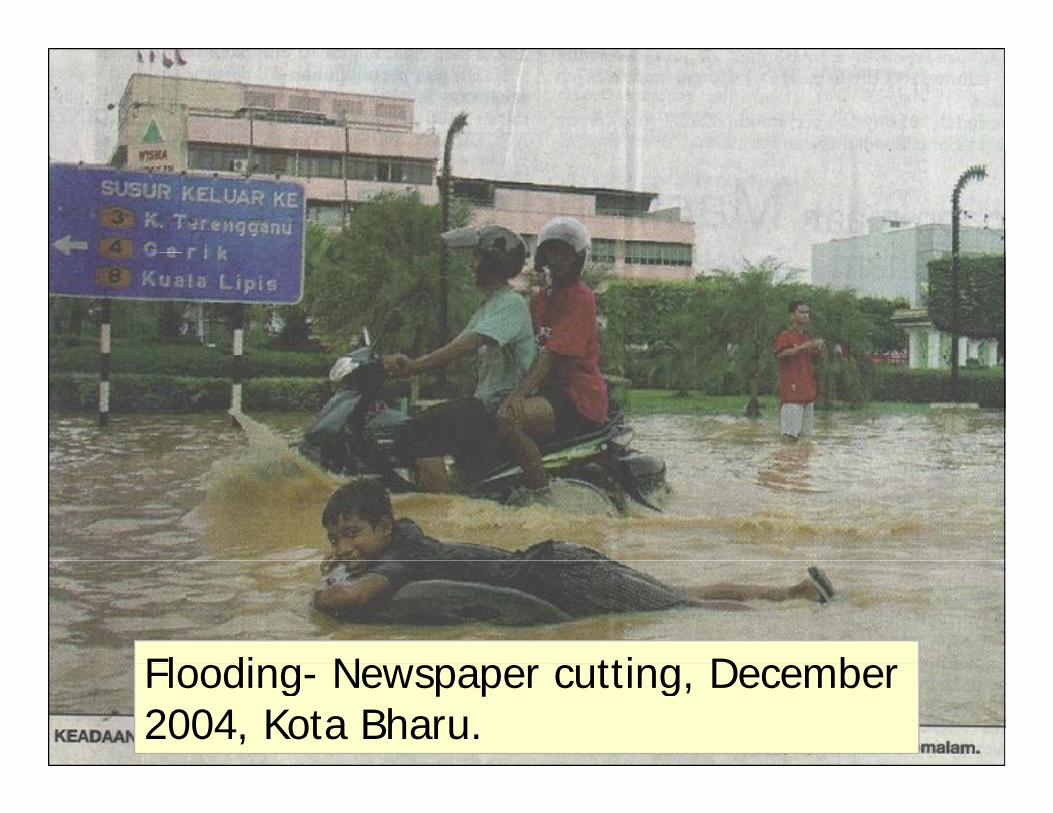
Fl di N tti D bFlooding- Newspaper cutting, December 2004, Kota Bharu.

Monsoon Flooding Dec 2004 in Kota Bharu, Kelantan

Newspaper cutting….December 2004, Kota Bharu flooding

Flood Area in Muda Catchment 2002

Banjir di Kota Tinggi Jan 2007

Banjir di Kota Tinggi Jan 2007

iii Flooding causediii. Flooding caused by Tsunami
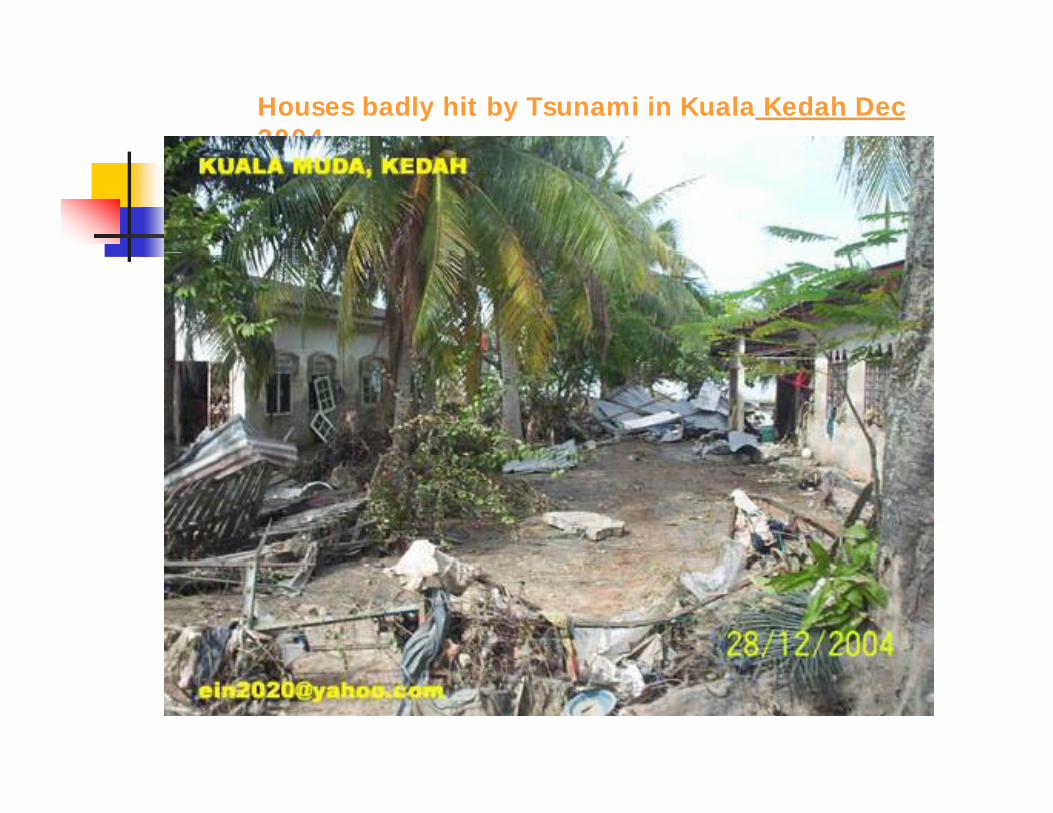
Houses badly hit by Tsunami in Kuala Kedah Dec 2004

Effect of Tsunami in Kuala Kedah
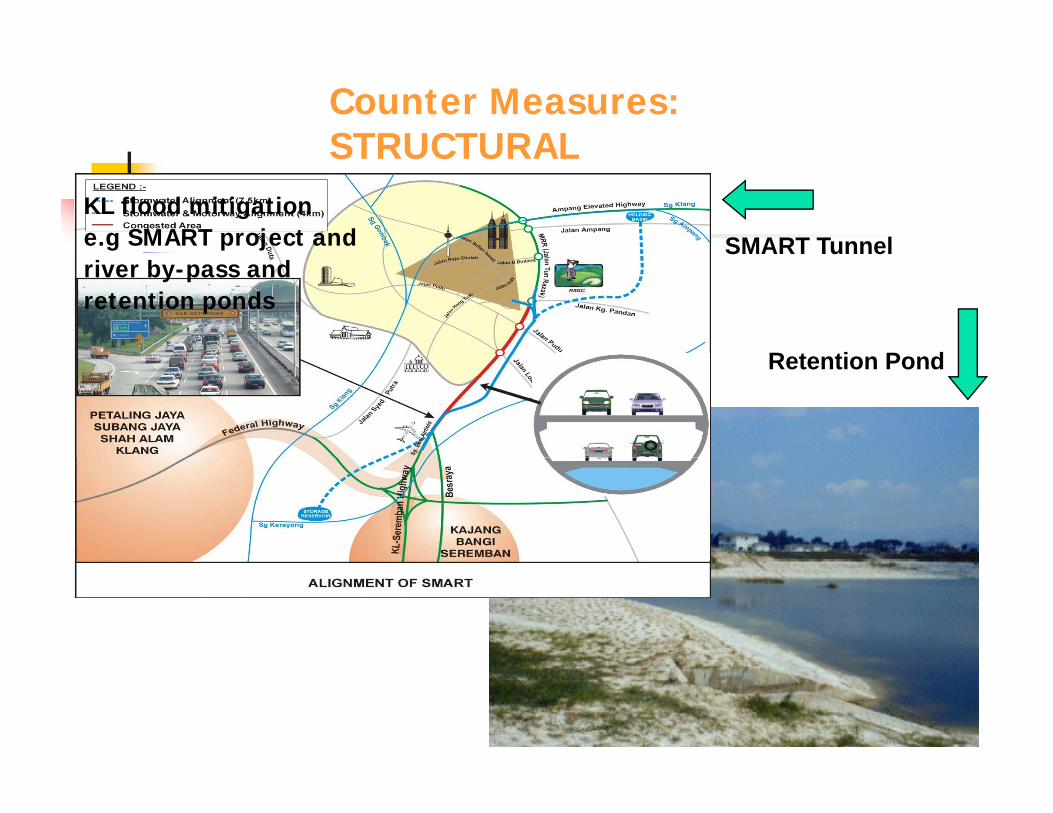
Counter Measures: STRUCTURALSTRUCTURAL
KL flood mitigatione.g SMART project and SMART Tunnelriver by-pass and retention ponds
SMART Tunnel
R t ti P dRetention Pond

STRUCTURALSTRUCTURAL

STRUCTURAL
dam river channelisation
by-pass tunnelretention pond

Counter Measures (soft approach): Application of MSMA in reducing the effect of flooding

STORMWATER MANAGEMENT MANUAL (MSMA)
Detention pondmay serve a dual f ti dfunction, reduce
flooding as well as a recreational park

b W a t e r S h o r t a g e sb. W a t e r S h o r t a g e s

National Water Resources Study 2000-2010 (Peninsular Malaysia)
Water Demand and Projected Supply for Selangor
7000
5000
6000WATER SUPPLY
3000
4000
ater
Dem
and
(Mld
)
2000
3000
Tota
l Wa
WATER DEMAND
0
1000
1990 1995 2000 2005 2010 2015
YearYear

1998 drought has 1998 drought has caused serious water caused serious water rationing and hardship rationing and hardship for 1.8 million residents for 1.8 million residents of Kuala Lumpur & otherof Kuala Lumpur & otherof Kuala Lumpur & other of Kuala Lumpur & other Klang Valley towns.Klang Valley towns.

Water shortagesG i d d d tGrowing demands and pressure on water resourcesPer capita availability of water is decreasingReached practical limit of surface water resourcesReached practical limit of surface water resources development
Inter-basin and inter-statewater transfers

PADDY PRODUCTION 2.5 million ton/yeary
Rain-fed paddy 278 000 haRain-fed paddy 278,000 ha.
Drought will have a major affect to rain-major affect to rainfed paddy than it does to theIrrigated one.
Irrigated paddy 322,000 ha.

1998: Kuala Lumpur was badly affected by haze
August 1999: Kuala Lumpurby haze

Water shortagesWater shortages
Water demand management
1999 - Guidelines for Installing A Rainwater Collection and Utilization System2002 - Six-liter toilet flushing systems


Carry out a drought monitoring for Peninsular Malaysia
ANALISA SUMBER AIR DI SEMENANJUNG MALAYSIACURAHAN HUJAN SEBENAR BAGI BULAN JAN - MAC 2002
( MOVING 3 MONTHLY RAINFALL )
( a ) PERIOD : NOV-DEC 2001 & JAN 2002
R1 -38(324)
K1 36(255)
( b ) PERIOD : DEC 2001 & JAN, FEB 2002
R1 -43(167)
( c ) PERIOD : JAN, FEB & MAC 2002
R1-71(179)
K1 36(255)K3 9(285)K4 -5(412)
K5 -38(423)
P1 -34(438)
P2 4(442)P3 -10(382)
A12 -21(687)
A14 -30(765)A15 -83(376)
A16 -13(354)
D1 35(1820)D2 50(522)
D6 30(688)
T2 27(1222)
T5 -17(1456)
K1 -6(141)K3 25(130)K4 -7(217)
K5 -50(213)
P1 -21(258)
P2 -41(283)P3 -22(209)
A12 -4(380)
A14 -44(588)A15 -61(273)
A16 -13(209)
D1 49(1335)D2 73(371)
D6 26(486)
T2 -16(786)
T5 -50(767)
K1-56(180)K3-48(141)K4-39(219)
K5-47(209)
P1-29(263)
P2-28(289)P3-29(214)
A12-24(362)
A14-66(581)A15-57(291)
A16-59(203)
D1-23(741)D2-20(279)
D66(279)
T2-26(338)
T5-26(319)
20%
40%
60%
80%
100%
LEGEND :A4 -6(530)
A6 -38(901)A8 -58(1116)
A12 -21(687)
B3 5(504)
B6 -34(603)
B7 -43(625)B8 -21(659)
N3 -12(645)
C3 6(477) C4 47(1130)
C8 6(624)
C9 12(1240)
T1 10(1450)
60%
80%
100%
LEGEND :
A4 -16(453)
A6 -45(802)A8 -56(948)
A12 -4(380)
B3 -32(398)
B4 65(474)
B6 -62(406)
B7 -53(522)B8 -25(564)
N3 -43(518)
C3 3(362) C4 86(866)
C8 -26(461)
C9 3(1085)
T1 1(977)
40%
60%
80%
100%
LEGEND :
A48(463)
A6-41(775)A8-47(874)
A12 24(362)
B322(345)
B4 67(487)
B6-38(394)
B7-5(537)B8-12(575)
N3-45(465)
C3-62(357) C4-45(486)
C8-45(431)
C9-59(763)
T1-53(480)
-80%
-60%
-40%
-20%
0%
% Deviation from L-Term Mean
Cum. Rainfall
B4 -45(600)B5 26(481)
N1 -20(498)
M1 -12(436)
J1 -35(516)
J2 28(614)
J5 16(590)
J7 -6(584)
J8 20(478) J9 -17(1660)
J10 -32(560)
-80%
-60%
-40%
-20%
0%
20%
40%
% Deviation from L-Term Mean
Cum. Rainfall
Rainfall Station
B4 -65(474)B5 -36(353)
N1 -50(356)
M1 -35(275)
J1 -21(417)
J2 10(520)
J5 20(516)
J7 -9(496)
J8 36(363) J9 -21(1434)
J10 -37(481)
-80%
-60%
-40%
-20%
0%
20%
% Deviation from L-Term Mean
Cum. Rainfall
Rainfall Station
B4-67(487)B5-66(401)
N1-27(373)
M1-3(304)
J1-14(366)
J212(464)
J50(525)
J7-16(513)
J80(423) J9-58(851)
J10-21(441)
C9 3 (1085) Stn C9 , 3% above L/T Mean ( Cum. RF)
Note : Rainfall variations from (+ 20%) to ( - 20% )
f l t i l
BiasaAmaranSerius Biasa
AmaranSerius
BiasaAmaranSerius
of long-term mean is normal
Rajah 1 : Peta agihan curahan hujan sebenar (November 2001 - Januari 2002)
Rajah 2 : Peta agihan curahan hujan sebenar (Disember 2001 - Februari 2002)
Rajah 3 : Peta agihan curahan hujan sebenar ( Januari - Mac 2002 )

Drought ImpactsMelaka
1991 D i T l d d i d t 1991 Durian Tunggal dam was dried up, water transferred from Muar River1998 Water rationing + water transfer2002 Water rationing + transfer – RM 2.9 Mil
Selangor1998 Water rationing from April to September
KedahMADA deferred 3 off-season crops since 1978Released 15 cumecs for 10 days to augment Released 15 cumecs for 10 days to augment Penang’s water need in 1998
Kelantan1998 – KADA built temporary sand dyke to raise 1998 KADA built temporary sand dyke to raise WL at Pasir Mas Pump House

Drought Impacts cont…
Sabah – (1998)State Wide RF Deficit ranging from 4 to 9 months2 797 sq km and 170 000 people affected2,797 sq. km and 170,000 people affected1580 sq. km affected by wild fireOf these, 100 sq. km are agricultural lands 7,200 Farmers affected and Damage Cost ~ RM 7.0 Mil.Water Rationing and Food Aidsg
Sarawak – (1998)Wild FiresAir Pollution - Schools Shut DownAir Pollution Schools Shut DownCoastal Areas – Water Shortage 1998 –
Kelantan – (2005)
KADA built temporary sand dyke to raise WL at Pasir Mas Pump House
Negeri Sembilan

c W a t e r P o l l u t i o nc. W a t e r P o l l u t i o n

Water quality problems
1 Chemical Waste in rivers1. Chemical Waste in rivers
2 Solid Waste and Rubbish2. Solid Waste and Rubbish in rivers

Sources
1. Squatter

2. Land Developments

3. Slaughter houses

4 Untreated waste from animal4. Untreated waste from animal husbandaries and farms

Statistics on river pollution released by Department of Environment
7.1%Polluted
clean
slightly44.5%
Clean
g ypollutedpolluted
Slightly polluted48.4%
Slightly polluted

Statistics on percentage cause of river pollution released by Department of Environment
waste fromagriculture13%
effluent fromlivestock24%40%
earthwork
household,commercial &industry
23%
industry,


DID’s Programme: River Awareness CampaignAwareness Campaign
‘Love Our Rivers’Rivers
campaign

3 Legislative and3. Legislative and Institutional Issues Regarding to Water Reso rcesResources

Legislative and Institutional Issues Regarding to Water ResourcesRegarding to Water Resources
Matters pertaining to water – State Government jurisdiction
Fragmentation in the management of water resources – many institutions involved
National Water Resources Council was set up in 1998
Danish International Development Agency (DANIDA) begins pilot projects for Sungai Selangor and Sungai Kedah / Anak Bukit
2006 N ti l W t S i C i i (SPAN) tl d b2006 - National Water Services Commission (SPAN) recently passed bythe Parliament
Malaysian Water Partnership – serve to unify and integrate various y p y gstakeholders in water sector
LUAS (Lembaga Urus Air Selangor) was formed in 2000 with the aim of implementing water management at the river basin levelimplementing water management at the river basin level
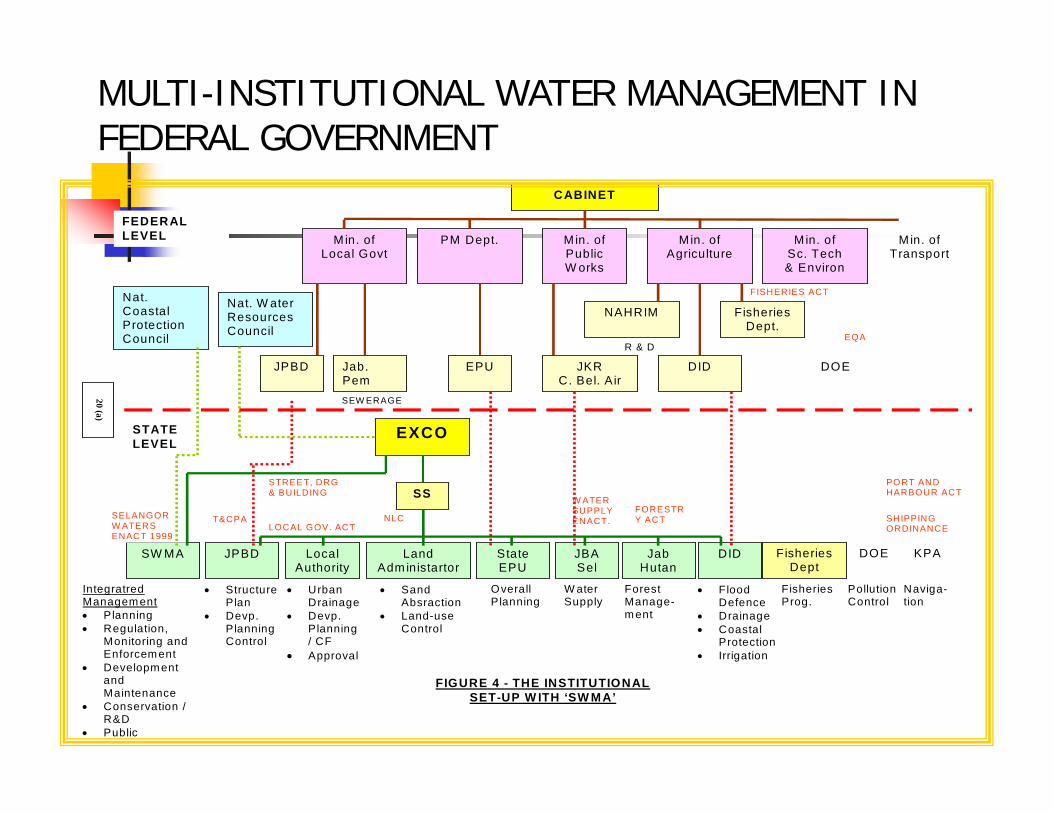
MULTI-INSTITUTIONAL WATER MANAGEMENT IN FEDERAL GOVERNMENT
CABINET
Min. of Local Govt
PM Dept. M in. of Public
Min. of Agriculture
Min. of Sc Tech
Min. of Transport
FEDERAL LEVEL
GO
EQA
FISHERIES ACT
R & D
Local Govt PublicW orks
Agriculture
Sc. Tech& Environ
Transport
Nat. Coastal Protection Council
Nat. W ater Resources Council
NAHRIM FisheriesDept.
SEW ERAGE
JPBD Jab. Pem
EPU JKR C. Bel. A ir
DID DOE
EXCO STATE LEVEL
20 (a)
STREET, DRG & BUILDING
LOCAL GOV. ACTNLC
W ATER SUPPLY ENACT.
PORT AND HARBOUR ACT
SHIPPING ORDINANCE
SS
SW MA JPBD Local Land State JBA Jab DID KPADOEFisheries
SELANGOR W ATERS ENACT 1999
T&CPA FORESTRY ACT
Integratred Management • Planning • Regulation,
Monitoring and Enforcement
• Structure Plan
• Devp. Planning Control
• Urban Drainage
• Devp. Planning / CF
• Approval
• Sand Absraction
• Land-use Control
Overall Planning
W ater Supply
Forest Manage- ment
• Flood Defence
• Drainage • Coastal
Protection • Irrigation
Fisheries Prog.
Pollution Control
Naviga- tion
Authority Adm inistartor EPU Sel Hutan Dept
• Development and Maintenance
• Conservation / R&D
• Public
FIGURE 4 - THE INSTITUTIONAL SET-UP W ITH ‘SW MA’

MULTI-INSTITUTIONAL WATER MANAGEMENT IN STATES
STATE GOVERNMENT
MANAGEMENT IN STATES
SELANGOR WATERSMANAGEMENT
AUTHORITY CONSUMERS 1) ABSTRACTORS
a) JBA / Puncak Niaga ( Water Supply )
b) JPS ( Irrigation ) c) Factories ( Ground
W & Ri W )
SERVICES PROVIDERS JPS - Flood defence / O&M river conservancy
corridor improvement
SUPPORT AGENCIES LAND USE PLANNING • JPBD / Local Govt. REGULATORS
a) Agriculture – AgricultureWater & River Water )
d) PTG ( Sand ) 2) DISCHARGER
a) Local Authorities b) IWK / Alam Flora c) Factories d) Others
p Hidrology data collection Drainage Local Govt - Corridor devp.
- Debris clearing - Drainage
DOE - Pollution monitoring & control JBA / PNSB Operate Dams
a) Agriculture Agriculture Dept.
b) Mining – Mining Dept.
c) Forestry – Forestry Dept.
d) Sewerage – Sewerage Dept.
e) Solid Waste – Local Govt.
20 (b)
3) RIVER TRANSPORT OPER. 4) RECREATION OPERATOR 5) AQUACULTURE/FISHING 6) HYDROPOWER GEN. TNB / IPP
JBA / PNSB - Operate Dams NAHRIM / - R & D Universities Fisheries Dept. - Restock fish control aquaculture
f) Industry – DOE
g) Wildlife – Perhilitan
FIGURE 5 : INSTITUTIONAL RELATIONSHIP BETWEEN SWMA AND OTHER AGENCIES IN WATER RESOURCES, RIVER BASIN AND COASTAL ZONE ENVIRONMENTAL MANAGEMENT IN THE STATE OF SELANGOR

Proposed IRBM Approach for Sg Muar Basin Water Act 1920, EQA 74, Land Code 65, Local Govt Act 74, Sewerage Service Act,
Off Budget Agencies (OBA), Inter-Agency Mechanism (IAM)
RBOs,DOE, LAs, Land Office
EnforcementInstitution
Legislation Love Our River
Finance IRBM PublicAwareness
River Campaign,Environment Awareness Campaign,Seminars,
5 Years Development Plan,
Planning Preventive
Awareness Workshops, Study Visit, Poster, Manual, Guidelines, etc
a ,O &M allocation
gCurative
Landuse Control Zoning of Flood Pronel d (b d )
etc
Landuse Control, Zoning of Flood Prone, River Conservation Zone, River Reserve, Buffer Zone, Drainage Control (MSMA), Increase nos of Navigation Lights, Hydrographic Survey, Water Quality Monitoring, Landscape
Flood Mitigation (bunds), River maintenance, Repair Infrastructure (jetties)
Management Tools (GIS - MaCGDI), Integrated River Basin Mgmt (IRBM) Plan, River Basin Information System(RBIS)

4. Challenges Ahead
Require a great deal of attention, expertise,coorperation concerted effort capacity building andcoorperation, concerted effort, capacity building andfinancial provision
W t L /F d l C tit ti d t bWater Laws/Federal Constitution may need to beamended
Institutional reform needed in the long term
Need tremendous amount of financial allocationNeed tremendous amount of financial allocation
5. C o n c l u s i o n
Water resource is a national heritage that needs tobe preservedbe preserved.
Without proper management, water related problemsillwill recur.
Water has to be well planned and well managed to ensure long sustainability of development.

T h a n k Y o uT h a n k Y o u