Embed Size (px)
Citation preview

State Oil Company ofthe Azerbaijan Republic
International Financial Reporting StandardsConsolidated financial statements
31 December 2016
State Oil Company of the Azerbaijan Republic Consolidated financial statements
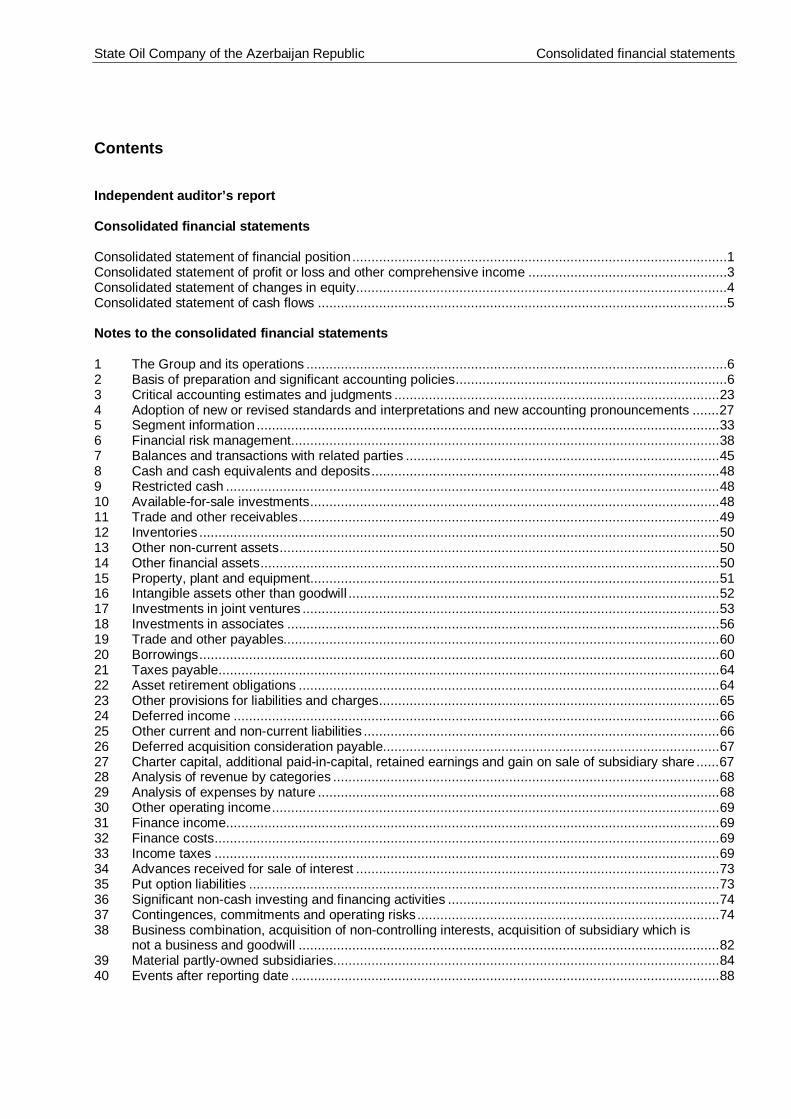
Contents
Independent auditor’s report
Consolidated financial statements
Consolidated statement of financial position ..................................................................................................1Consolidated statement of profit or loss and other comprehensive income ....................................................3Consolidated statement of changes in equity .................................................................................................4Consolidated statement of cash flows ...........................................................................................................5
Notes to the consolidated financial statements
1 The Group and its operations ..............................................................................................................62 Basis of preparation and significant accounting policies .......................................................................63 Critical accounting estimates and judgments ..................................................................................... 234 Adoption of new or revised standards and interpretations and new accounting pronouncements ....... 275 Segment information ......................................................................................................................... 336 Financial risk management ................................................................................................................ 387 Balances and transactions with related parties .................................................................................. 458 Cash and cash equivalents and deposits ........................................................................................... 489 Restricted cash ................................................................................................................................. 4810 Available-for-sale investments ........................................................................................................... 4811 Trade and other receivables .............................................................................................................. 4912 Inventories ........................................................................................................................................ 5013 Other non-current assets ................................................................................................................... 5014 Other financial assets ........................................................................................................................ 5015 Property, plant and equipment ........................................................................................................... 5116 Intangible assets other than goodwill ................................................................................................. 5217 Investments in joint ventures ............................................................................................................. 5318 Investments in associates ................................................................................................................. 5619 Trade and other payables.................................................................................................................. 6020 Borrowings ........................................................................................................................................ 6021 Taxes payable................................................................................................................................... 6422 Asset retirement obligations .............................................................................................................. 6423 Other provisions for liabilities and charges ......................................................................................... 6524 Deferred income ............................................................................................................................... 6625 Other current and non-current liabilities ............................................................................................. 6626 Deferred acquisition consideration payable........................................................................................ 6727 Charter capital, additional paid-in-capital, retained earnings and gain on sale of subsidiary share ...... 6728 Analysis of revenue by categories ..................................................................................................... 6829 Analysis of expenses by nature ......................................................................................................... 6830 Other operating income ..................................................................................................................... 6931 Finance income ................................................................................................................................. 6932 Finance costs .................................................................................................................................... 6933 Income taxes .................................................................................................................................... 6934 Advances received for sale of interest ............................................................................................... 7335 Put option liabilities ........................................................................................................................... 7336 Significant non-cash investing and financing activities ....................................................................... 7437 Contingences, commitments and operating risks ............................................................................... 7438 Business combination, acquisition of non-controlling interests, acquisition of subsidiary which is
not a business and goodwill .............................................................................................................. 8239 Material partly-owned subsidiaries ..................................................................................................... 8440 Events after reporting date ................................................................................................................ 88
State Oil Company of the Azerbaijan Republic Consolidated financial statements
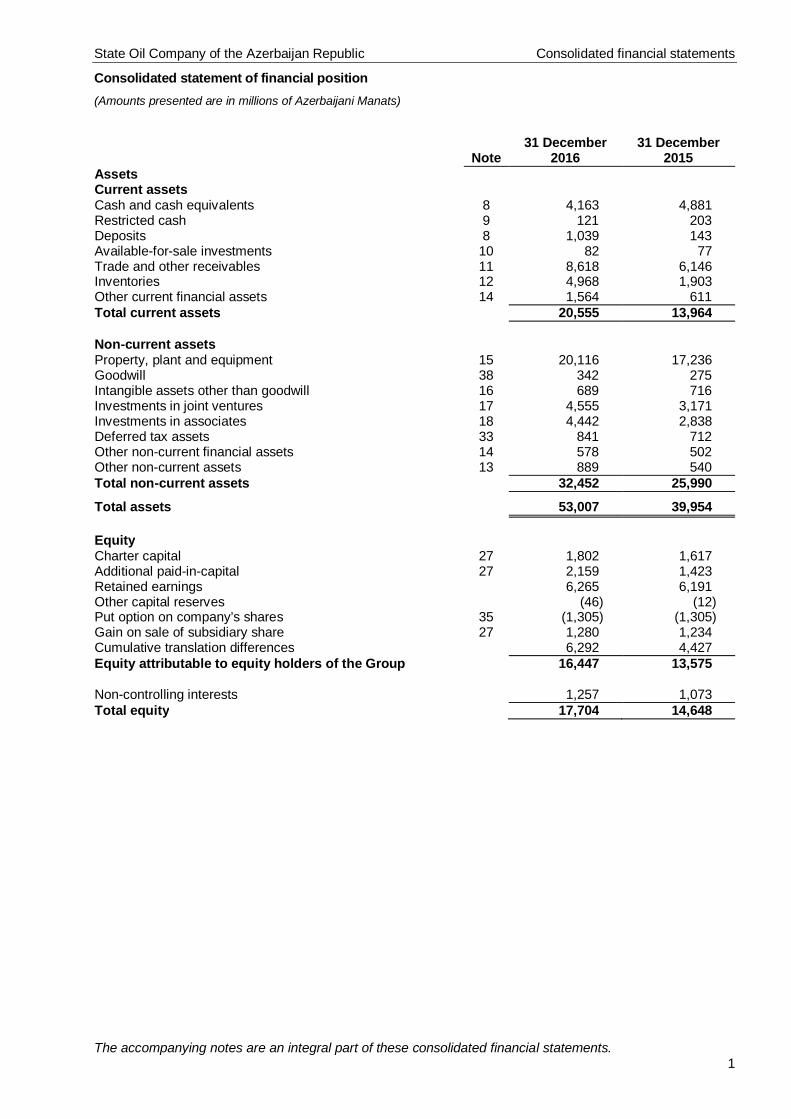
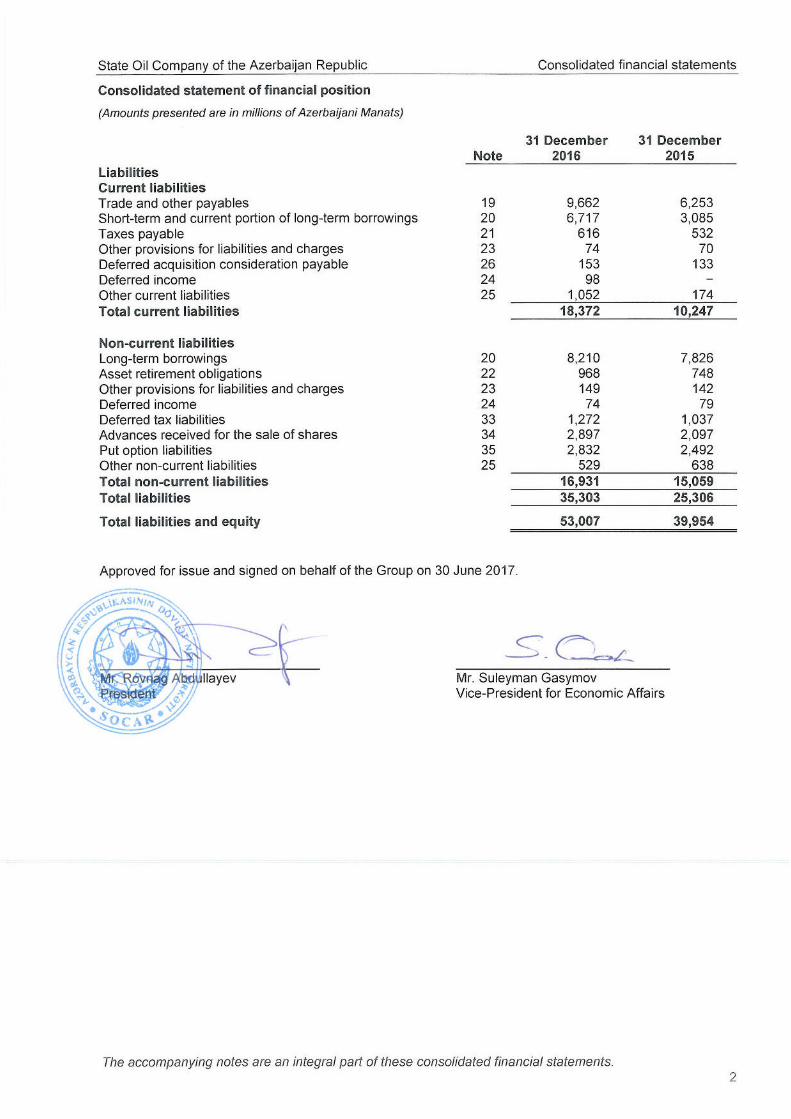
Consolidated statement of financial position(Amounts presented are in millions of Azerbaijani Manats)
The accompanying notes are an integral part of these consolidated financial statements.1
Note31 December
201631 December
2015AssetsCurrent assetsCash and cash equivalents 8 4,163 4,881Restricted cash 9 121 203Deposits 8 1,039 143Available-for-sale investments 10 82 77Trade and other receivables 11 8,618 6,146Inventories 12 4,968 1,903Other current financial assets 14 1,564 611Total current assets 20,555 13,964
Non-current assetsProperty, plant and equipment 15 20,116 17,236Goodwill 38 342 275Intangible assets other than goodwill 16 689 716Investments in joint ventures 17 4,555 3,171Investments in associates 18 4,442 2,838Deferred tax assets 33 841 712Other non-current financial assets 14 578 502Other non-current assets 13 889 540Total non-current assets 32,452 25,990
Total assets 53,007 39,954
EquityCharter capital 27 1,802 1,617Additional paid-in-capital 27 2,159 1,423Retained earnings 6,265 6,191Other capital reserves (46) (12)Put option on company’s shares 35 (1,305) (1,305)Gain on sale of subsidiary share 27 1,280 1,234Cumulative translation differences 6,292 4,427Equity attributable to equity holders of the Group 16,447 13,575
Non-controlling interests 1,257 1,073Total equity 17,704 14,648
State Oil Company of the Azerbaijan Republic Consolidated financial statements
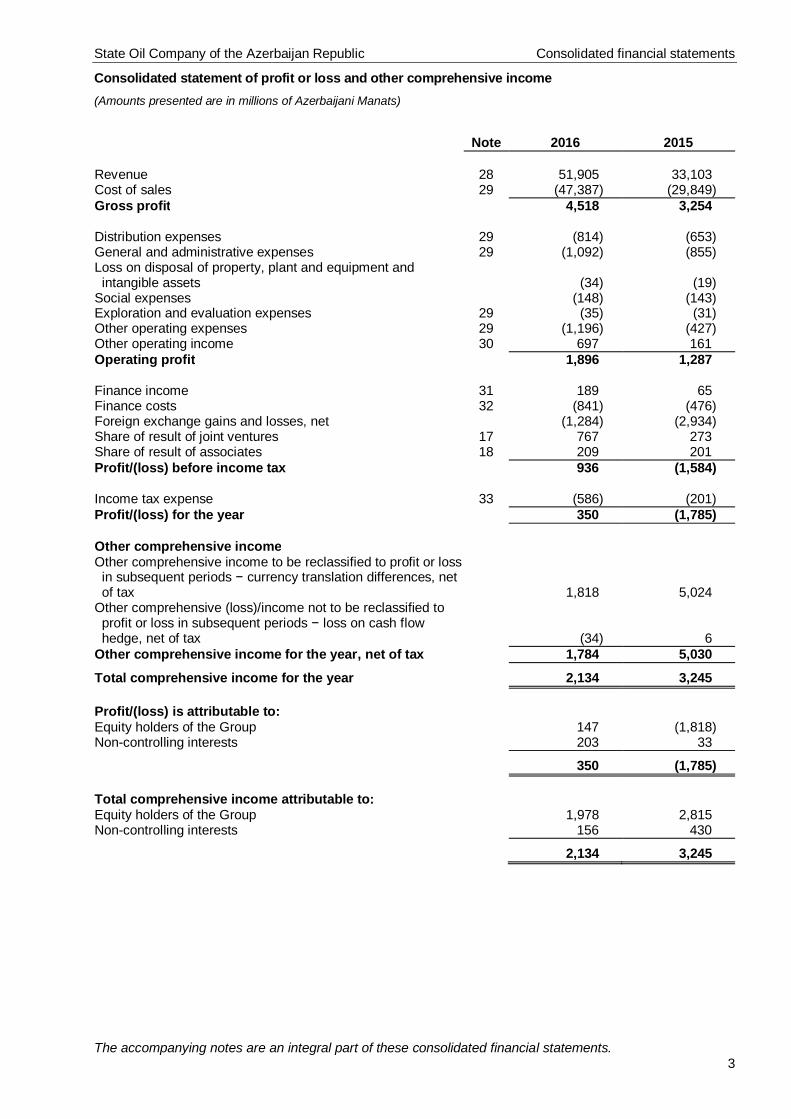
Consolidated statement of profit or loss and other comprehensive income(Amounts presented are in millions of Azerbaijani Manats)
The accompanying notes are an integral part of these consolidated financial statements.3
Note 2016 2015
Revenue 28 51,905 33,103Cost of sales 29 (47,387) (29,849)Gross profit 4,518 3,254
Distribution expenses 29 (814) (653)General and administrative expenses 29 (1,092) (855)Loss on disposal of property, plant and equipment andintangible assets (34) (19)
Social expenses (148) (143)Exploration and evaluation expenses 29 (35) (31)Other operating expenses 29 (1,196) (427)Other operating income 30 697 161Operating profit 1,896 1,287
Finance income 31 189 65Finance costs 32 (841) (476)Foreign exchange gains and losses, net (1,284) (2,934)Share of result of joint ventures 17 767 273Share of result of associates 18 209 201Profit/(loss) before income tax 936 (1,584)
Income tax expense 33 (586) (201)Profit/(loss) for the year 350 (1,785)
Other comprehensive incomeOther comprehensive income to be reclassified to profit or lossin subsequent periods − currency translation differences, netof tax 1,818 5,024
Other comprehensive (loss)/income not to be reclassified toprofit or loss in subsequent periods − loss on cash flowhedge, net of tax (34) 6
Other comprehensive income for the year, net of tax 1,784 5,030
Total comprehensive income for the year 2,134 3,245
Profit/(loss) is attributable to:Equity holders of the Group 147 (1,818)Non-controlling interests 203 33
350 (1,785)
Total comprehensive income attributable to:Equity holders of the Group 1,978 2,815Non-controlling interests 156 430
2,134 3,245
State Oil Company of the Azerbaijan Republic Consolidated financial statements
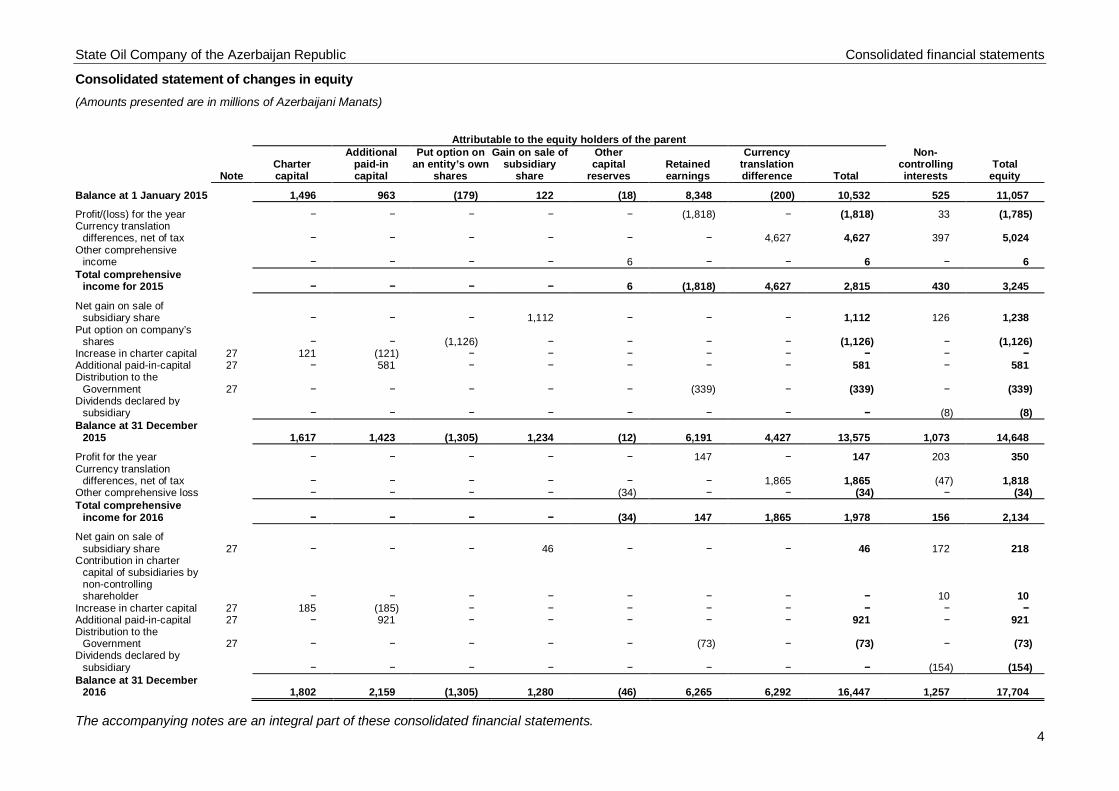
Consolidated statement of changes in equity(Amounts presented are in millions of Azerbaijani Manats)
The accompanying notes are an integral part of these consolidated financial statements.4
Attributable to the equity holders of the parent
NoteChartercapital
Additionalpaid-incapital
Put option onan entity’s own
shares
Gain on sale ofsubsidiary
share
Othercapital
reservesRetainedearnings
Currencytranslationdifference Total
Non-controllinginterests
Totalequity
Balance at 1 January 2015 1,496 963 (179) 122 (18) 8,348 (200) 10,532 525 11,057
Profit/(loss) for the year − − − − − (1,818) − (1,818) 33 (1,785)Currency translation
differences, net of tax − − − − − − 4,627 4,627 397 5,024Other comprehensive
income − − − − 6 − − 6 − 6Total comprehensive
income for 2015 − − − − 6 (1,818) 4,627 2,815 430 3,245
Net gain on sale ofsubsidiary share − − − 1,112 − − − 1,112 126 1,238
Put option on company’sshares − − (1,126) − − − − (1,126) − (1,126)
Increase in charter capital 27 121 (121) − − − − − − − −Additional paid-in-capital 27 − 581 − − − − − 581 − 581Distribution to the
Government 27 − − − − − (339) − (339) − (339)Dividends declared by
subsidiary − − − − − − − − (8) (8)Balance at 31 December
2015 1,617 1,423 (1,305) 1,234 (12) 6,191 4,427 13,575 1,073 14,648
Profit for the year − − − − − 147 − 147 203 350Currency translation
differences, net of tax − − − − − − 1,865 1,865 (47) 1,818Other comprehensive loss − − − − (34) − − (34) − (34)Total comprehensive
income for 2016 − − − − (34) 147 1,865 1,978 156 2,134
Net gain on sale ofsubsidiary share 27 − − − 46 − − − 46 172 218
Contribution in chartercapital of subsidiaries bynon-controllingshareholder − − − − − − − − 10 10
Increase in charter capital 27 185 (185) − − − − − − − −Additional paid-in-capital 27 − 921 − − − − − 921 − 921Distribution to the
Government 27 − − − − − (73) − (73) − (73)Dividends declared by
subsidiary − − − − − − − − (154) (154)Balance at 31 December
2016 1,802 2,159 (1,305) 1,280 (46) 6,265 6,292 16,447 1,257 17,704
State Oil Company of the Azerbaijan Republic Consolidated financial statements
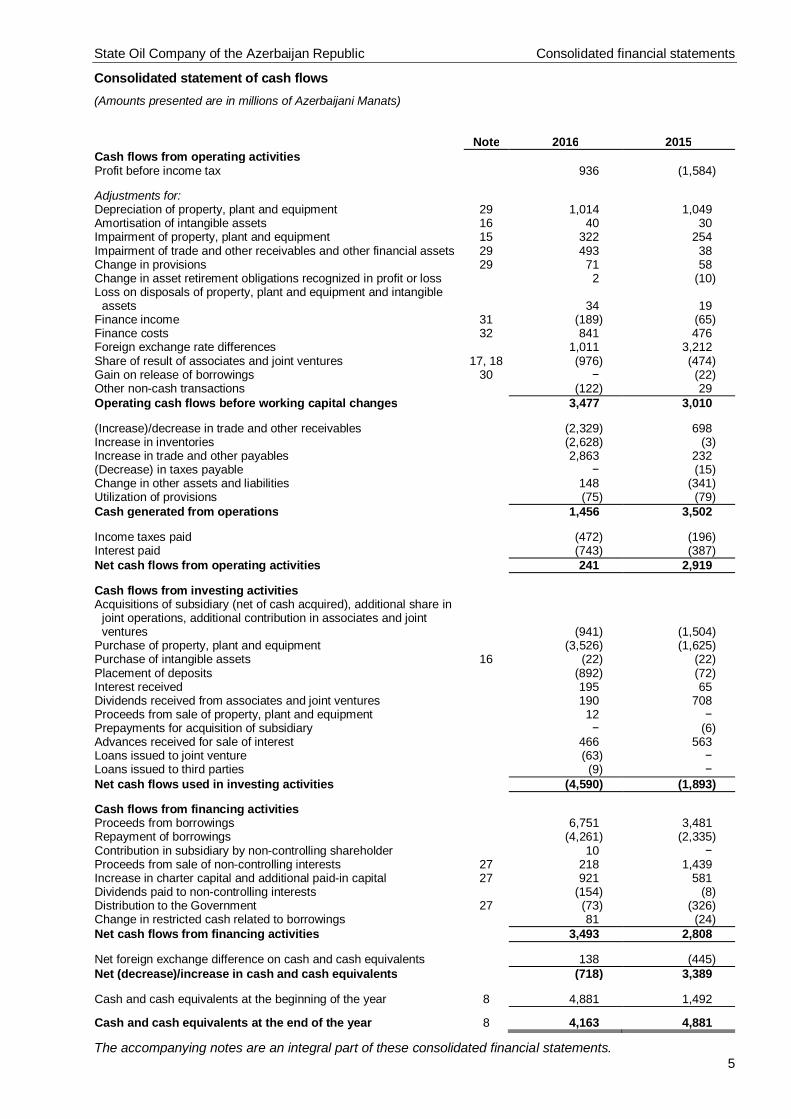
Consolidated statement of cash flows(Amounts presented are in millions of Azerbaijani Manats)
The accompanying notes are an integral part of these consolidated financial statements.5
Note 2016 2015Cash flows from operating activitiesProfit before income tax 936 (1,584)
Adjustments for:Depreciation of property, plant and equipment 29 1,014 1,049Amortisation of intangible assets 16 40 30Impairment of property, plant and equipment 15 322 254Impairment of trade and other receivables and other financial assets 29 493 38Change in provisions 29 71 58Change in asset retirement obligations recognized in profit or loss 2 (10)Loss on disposals of property, plant and equipment and intangible
assets 34 19Finance income 31 (189) (65)Finance costs 32 841 476Foreign exchange rate differences 1,011 3,212Share of result of associates and joint ventures 17, 18 (976) (474)Gain on release of borrowings 30 − (22)Other non-cash transactions (122) 29Operating cash flows before working capital changes 3,477 3,010
(Increase)/decrease in trade and other receivables (2,329) 698Increase in inventories (2,628) (3)Increase in trade and other payables 2,863 232(Decrease) in taxes payable − (15)Change in other assets and liabilities 148 (341)Utilization of provisions (75) (79)Cash generated from operations 1,456 3,502
Income taxes paid (472) (196)Interest paid (743) (387)Net cash flows from operating activities 241 2,919
Cash flows from investing activitiesAcquisitions of subsidiary (net of cash acquired), additional share in
joint operations, additional contribution in associates and jointventures (941) (1,504)
Purchase of property, plant and equipment (3,526) (1,625)Purchase of intangible assets 16 (22) (22)Placement of deposits (892) (72)Interest received 195 65Dividends received from associates and joint ventures 190 708Proceeds from sale of property, plant and equipment 12 −Prepayments for acquisition of subsidiary − (6)Advances received for sale of interest 466 563Loans issued to joint venture (63) −Loans issued to third parties (9) −Net cash flows used in investing activities (4,590) (1,893)
Cash flows from financing activitiesProceeds from borrowings 6,751 3,481Repayment of borrowings (4,261) (2,335)Contribution in subsidiary by non-controlling shareholder 10 −Proceeds from sale of non-controlling interests 27 218 1,439Increase in charter capital and additional paid-in capital 27 921 581Dividends paid to non-controlling interests (154) (8)Distribution to the Government 27 (73) (326)Change in restricted cash related to borrowings 81 (24)Net cash flows from financing activities 3,493 2,808
Net foreign exchange difference on cash and cash equivalents 138 (445)Net (decrease)/increase in cash and cash equivalents (718) 3,389
Cash and cash equivalents at the beginning of the year 8 4,881 1,492
Cash and cash equivalents at the end of the year 8 4,163 4,881
State Oil Company of the Azerbaijan Republic Notes to the consolidated financial statements for 2016
(Amounts presented are in millions of Azerbaijani Manats, unless otherwise stated)
6
1 The Group and its operations
The State Oil Company of the Azerbaijan Republic (“SOCAR”) was established by the Presidential Decreeon 13 September 1992 in accordance with Azerbaijani legislation and is domiciled in the AzerbaijanRepublic. SOCAR is involved in upstream, midstream and downstream operations. SOCAR’s main functionspertain to the extraction, refining, transportation of oil, gas and gas condensates, and sale of gas and oil andgas products. SOCAR is 100 per cent owned by the Government of the Azerbaijan Republic(the “Government”).
SOCAR’s registered address is 121 Heydar Aliyev avenue, AZ 1029 Baku, Azerbaijan Republic.
Information about subsidiaries
The consolidated financial statements of the Group include the following material subsidiaries:
Country ofincorporation
% equity interestName Principal activities 2016 2015
SOCAR Turkey Enerji A.Ş. Refinery Turkey 86.99% 86.99%Azerbaijan (ACG) Ltd Oil production Cayman Islands 100% 100%Azerbaijan (Shah Deniz) Ltd Gas production Cayman Islands 100% 100%Caspian Drilling Company (CDC) Drilling operations Azerbaijan 92.44% 92.44%SOCAR Energy Georgia LLC Sales and Distribution Georgia 51% 51%SOCAR Overseas LLC Sales and Distribution UAE 100% 100%SOCAR Trading Holding Sales and Distribution Malta 100% 100%Azerbaijan (BTC) Ltd Sales and Distribution Cayman Islands 100% 100%Cooperative Menkent U.A. Sales and Distribution Netherlands 100% 100%SOCAR Energy Holdings AG Sales and Distribution Switzerland 100% 100%SOCAR Energy Ukraine Sales and Distribution Ukraine 100% 100%Azerbaijan (SCP) LTD Sales and Distribution Cayman Islands 100% 100%SOCAR Petroleum CJSC Sales and Distribution Azerbaijan 100% 100%Baku Shipyard Company Construction Azerbaijan 65% 65%Socar Polymer LLC Chemicals production Azerbaijan 71% 71%BOS Shelf LLC Construction Azerbaijan 90% 90%
2 Basis of preparation and significant accounting policies
Basis of preparation
These consolidated financial statements of SOCAR and its subsidiaries, associates and joint ventures(collectively referred to as “the Group”) have been prepared in accordance with International FinancialReporting Standards (“IFRS”) as issued by the International Accounting Standards Board (“IASB”). Theprincipal accounting policies applied in the preparation of these consolidated financial statements are set outbelow. These policies have been consistently applied to all the periods presented.
Basis of consolidation
The consolidated financial statements comprise the financial statements of the Group and its subsidiaries asat 31 December 2016.
Subsidiaries are all entities (including special-purpose entities) over which the Group has control. Control isachieved when the Group is exposed, or has rights, to variable returns from its involvement with the investeeand has the ability to affect those returns through its power over the investee. Specifically, the Groupcontrols an investee if and only if the Group has:► Power over the investee (i.e., existing rights that give it the current ability to direct the relevant
activities of the investee);► Exposure, or rights, to variable returns from its involvement with the investee; and► The ability to use its power over the investee to affect its returns.
State Oil Company of the Azerbaijan Republic Notes to the consolidated financial statements for 2016
(Amounts presented are in millions of Azerbaijani Manats, unless otherwise stated)
7
2 Basis of preparation and significant accounting policies (continued)
Basis of consolidation (continued)
When the Group has less than a majority of the voting or similar rights of an investee, the Group considersall relevant facts and circumstances in assessing whether it has power over an investee, including:
► The contractual arrangement(s) with the other vote holders of the investee;
► Rights arising from other contractual arrangements;
► The Group’s voting rights and potential voting rights.
The Group re-assesses whether or not it controls an investee if facts and circumstances indicate that thereare changes to one or more of the three elements of control. Consolidation of a subsidiary begins when theGroup obtains control over the subsidiary and ceases when the Group loses control of the subsidiary.
Inter-company transactions, balances and unrealized gains on transactions between group companies areeliminated. Unrealized losses are also eliminated but considered an impairment indicator of the assettransferred. Accounting policies of subsidiaries have been changed where necessary to ensure consistencywith the policies adopted by the Group.
Total comprehensive income within a subsidiary is attributed to the non-controlling interests even if thatresults in a deficit balance.
Business combinations
Business combinations are accounted for using the acquisition method. The cost of an acquisition ismeasured as the aggregate of the consideration transferred, which is measured at acquisition date fair value,and the amount of any non-controlling interests in the acquiree. For each business combination, the acquirermeasures the non-controlling interests in the acquiree at the proportionate share of the acquiree’sidentifiable net assets. Acquisition costs incurred are expensed and included in administrative expenses.When the Group acquires a business, it assesses the financial assets and liabilities assumed for appropriateclassification and designation in accordance with the contractual terms, economic circumstances andpertinent conditions as at the acquisition date. This includes the separation of embedded derivatives in hostcontracts by the acquiree.
If the business combination is achieved in stages, the acquisition date fair value of the acquirer’s previouslyheld equity interest in the acquiree is re-measured to fair value at the acquisition date through profit or loss.
Transactions with non-controlling interests
Changes in the Group’s ownership interest in a subsidiary that do not result in a loss of control areaccounted for as equity transactions (i.e. transactions with owners in their capacity as owners). In suchcircumstances the carrying amounts of the controlling and non-controlling interests shall be adjusted toreflect the changes in their relative interests in the subsidiary. Any difference between the amount by whichthe non-controlling interests are adjusted and the fair value of the consideration paid or received isrecognized directly in equity and attributed to the owners of the Group.
Business combinations with entities under common control
The Group applies acquisition method of accounting for business combinations with entities under thecommon control.
Investments in associates and joint ventures
An associate is an entity over which the Group has significant influence. Significant influence is the power toparticipate in the financial and operating policy decisions of the investee, but is not control or joint controlover those policies.
State Oil Company of the Azerbaijan Republic Notes to the consolidated financial statements for 2016
(Amounts presented are in millions of Azerbaijani Manats, unless otherwise stated)
8
2 Basis of preparation and significant accounting policies (continued)
Investments in associates and joint ventures (continued)
A joint venture (“JV”) is a type of joint arrangement whereby the parties that have joint control of thearrangement have rights to the net assets of the joint venture. Joint control is the contractually agreedsharing of control of an arrangement, which exists only when decisions about the relevant activities requireunanimous consent of the parties sharing control.
The considerations made in determining significant influence or joint control is similar to those necessary todetermine control over subsidiaries.
The Group’s investments in its associate and joint venture are accounted for using the equity method. Underthe equity method, the investment in an associate or a joint venture is initially recognized at cost. Thecarrying amount of the investment is adjusted to recognize changes in the Group’s share of net assets of theassociate or joint venture since the acquisition date. Goodwill relating to the associate or joint venture isincluded in the carrying amount of the investment and is neither amortised nor individually tested forimpairment.
The statement of profit or loss reflects the Group’s share of the results of operations of the associate or jointventure. Any change in OCI of those investees is presented as part of the Group’s OCI. Any gain or loss onsale of share that was recognized directly in the equity of the associate or joint venture is reflected as a gainor loss within the Group share of associate's or joint venture's profit or loss. Unrealised gains and lossesresulting from transactions between the Group and the associate or joint venture are eliminated to the extentof the interest in the associate or joint venture.
The aggregate of the Group’s share of profit or loss of an associate and a joint venture is shown on the faceof the statement of profit or loss outside operating profit and represents profit or loss after tax and non-controlling interests in the subsidiaries of the associate or joint venture.
The financial statements of the associate or joint venture are prepared for the same reporting period as theGroup. When necessary, adjustments are made to bring the accounting policies in line with those of theGroup.
After application of the equity method, the Group determines whether it is necessary to recognize animpairment loss on its investment in its associate or joint venture. At each reporting date, the Groupdetermines whether there is objective evidence that the investment in the associate or joint venture isimpaired. If there is such evidence, the Group calculates the amount of impairment as the differencebetween the recoverable amount of the associate or joint venture and its carrying value, and then recognizesthe loss as ‘Share of profit of an associate and a joint venture’ in the statement of profit or loss.
Upon loss of significant influence over the associate or joint control over the joint venture, the Groupmeasures and recognizes any retained investment at its fair value. Any difference between the carryingamount of the associate or joint venture upon loss of significant influence or joint control and the fair value ofthe retained investment and proceeds from disposal is recognized in profit or loss.
Investments in Production Sharing Agreements (“PSAs”)
Certain of the Group’s upstream activities are governed by the PSAs. According to the terms of PSAs, theGroup owns the portion of project’s assets and liable for its portion of project’s liabilities. At the same timethe Group is entitled to its portion of expenses incurred and revenues earned by the whole project.Therefore, the Group accounts for its investment in PSA’s by recognizing the portion of underlying assets,liabilities, expenses incurred and income earned by the projects using undivided interest method.
PSA is the method to execute exploitation of mineral resources by taking advantage of the expertise of acommercial oil and gas entity. The Government retains title to the mineral resources (whatever the quantitythat is ultimately extracted) and often the legal title to all fixed assets constructed to exploit the resources.The Government takes a percentage share of the output which may be delivered in product or paid in cashunder an agreed pricing formula. The contracting parties may only be entitled to recover specified costs plusan agreed profit margin. It may have the right to extract resources over a specified period of time. Operatingcompany is a legal entity created by one or more contracting parties to operate PSA.
State Oil Company of the Azerbaijan Republic Notes to the consolidated financial statements for 2016
(Amounts presented are in millions of Azerbaijani Manats, unless otherwise stated)
9
2 Basis of preparation and significant accounting policies (continued)
Investments in Production Sharing Agreements (“PSAs”) (continued)
As a contracting party to various PSAs the Group evaluates and accounts for the PSAs in accordance withthe substance of the arrangement. It records only its own share of oil and gas under a PSA as revenue.Neither revenue nor cost is recorded by the Group for the oil and gas extracted and sold on behalf of theGovernment. The Group acts as the Government’s agent to extract, deliver or sell the oil and gas and remitthe proceeds.
Costs that meet the recognition criteria as intangible or fixed assets in accordance with IAS 38 and IAS 16,respectively, are recognized where the entity is exposed to the majority of the economic risks and hasaccess to the probable future economic benefits of the assets. Acquisition, development and explorationcosts are accounted for in accordance with policies stated herein.
Assets subject to depreciation, depletion or amortization are expensed using the appropriate depletion ordepreciation method stipulated by the present accounting policies over the shorter of the PSA validity periodor the expected useful life of the related assets.
Foreign currency translation
All amounts in these consolidated statements are presented in millions of Azerbaijani Manats (“AZN”), unlessotherwise stated.
The functional currencies of the Group’s consolidated entities are the currencies of the primary economicenvironments in which the entities operate. The functional currency of SOCAR and its 23 business units andthe Group’s presentation currency is the national currency of the Azerbaijan Republic, AZN. However,US Dollar (“USD”), Swiss Franc (“CHF”), Georgian Lari (“GEL”), Ukrainian Hryvnia (“UAH”), Japanese Yen(“JPY”) and Turkish Lira (“TRY”) are considered the functional currency of the Group’s certain subsidiaries,associates and joint ventures as majority of these investments’ receivables, revenues, costs and debtliabilities are either priced, incurred, payable or otherwise measured in these currencies.
The transactions executed in foreign currencies are initially recorded in the functional currencies of respectiveGroup entities by applying the appropriate rates of exchanges prevailing at the date of transaction.
Monetary assets and liabilities denominated in foreign currencies other than functional currency of respectiveGroup entity are translated into the functional currency of that entity at the appropriate exchange ratesprevailing at the reporting date.
Foreign exchange gains and losses resulting from the re-measurement into the functional currencies ofrespective Group’s entities are recognized in profit or loss.
The results and financial position of the Group entities which functional currency differ from the presentationcurrency of the Group and not already measured in the Group’s presentation currency (functional currency ofnone of these entities is a currency of a hyperinflationary economy) are translated into the presentationcurrency of the Group as follows:(i) assets and liabilities for each statement of financial position are translated at the closing rate at the
date of that statement of financial position;(ii) income and expenses for each statement of profit or loss and other comprehensive income are
translated at average exchange rates (unless this average is not a reasonable approximation of thecumulative effect of the rates prevailing on the transaction dates, in which case income and expensesare translated at the dates of the transactions); and
(iii) all resulting exchange differences are recognized as a separate component of equity − currencytranslation difference.
At 31 December 2016 the principal rate of exchange used for translating foreign currency balances wasUSD 1 = AZN 1.7707, EUR 1 = AZN 1.8644, CHF 1 = AZN 1.7351, GEL 1 = AZN 0.6663, UAH 1 =AZN 0.0653, TRY 1 = AZN 0.5023, JPY 100 = AZN 1.5168 (2015: USD 1 = AZN 1.5594, EUR 1 =AZN 1.7046, CHF 1 = AZN 1.5709, GEL 1 = AZN 0.6511, UAH 1 = AZN 0.0655, TRY 1 = AZN 0.5358,JPY 100 = AZN 1.2946).
State Oil Company of the Azerbaijan Republic Notes to the consolidated financial statements for 2016
(Amounts presented are in millions of Azerbaijani Manats, unless otherwise stated)
10
2 Basis of preparation and significant accounting policies (continued)
Financial instruments − key measurement terms
Depending on their classification financial instruments are carried at fair value, or amortized cost asdescribed below.
Fair value is the price that would be received to sell an asset or paid to transfer a liability in an orderlytransaction between market participants at the measurement date. The fair value measurement is based onthe presumption that the transaction to sell the asset or transfer the liability takes place either in the principalmarket for the asset or liability, or in the absence of a principal market, in the most advantageous market forthe asset or liability. The principal or the most advantageous market must be accessible to by the Group.The fair value of an asset or a liability is measured using the assumptions that market participants would usewhen pricing the asset or liability, assuming that market participants act in their economic best interest.
The Group uses valuation techniques that are appropriate in the circumstances and for which sufficient dataare available to measure fair value, maximising the use of relevant observable inputs and minimising the useof unobservable inputs.
All assets and liabilities for which fair value is measured or disclosed in the financial statements arecategorised within the fair value hierarchy, described as follows, based on the lowest level input that issignificant to the fair value measurement as a whole:
Level 1 − quoted (unadjusted) market prices in active markets for identical assets or liabilities;
Level 2 − valuation techniques for which the lowest level input that is significant to the fair valuemeasurement is directly or indirectly observable;
Level 3 − valuation techniques for which the lowest level input that is significant to the fair valuemeasurement is unobservable.
For assets and liabilities that are recognized in the financial statements at fair value on a recurring basis, theGroup determines whether transfers have occurred between Levels in the hierarchy by re-assessingcategorisation (based on the lowest level input that is significant to the fair value measurement as a whole)at the end of each reporting period.
Cost is the amount of cash or cash equivalents paid or the fair value of the other consideration given toacquire an asset at the time of its acquisition and includes transaction costs. Measurement at cost is onlyapplicable to investments in equity instruments that do not have a quoted market price and whose fair valuecannot be reliably measured.
Transaction costs are incremental costs that are directly attributable to the acquisition, issue or disposal of afinancial instrument. An incremental cost is one that would not have been incurred if the transaction had nottaken place. Transaction costs include fees and commissions paid to agents (including employees acting asselling agents), advisors, brokers and dealers, levies by regulatory agencies and securities exchanges, andtransfer taxes and duties. Transaction costs do not include debt premiums or discounts, financing costs orinternal administrative or holding costs.
Amortised cost is the amount at which the financial instrument was recognized at initial recognition less anyprincipal repayments, plus accrued interest, and for financial assets less any write-down for incurredimpairment losses. Accrued interest includes amortisation of transaction costs deferred at initial recognitionand of any premium or discount to maturity amount using the effective interest rate method. Accrued interestincome and accrued interest expense, including both accrued coupon and amortised discount or premium(including fees deferred at origination, if any), are not presented separately and are included in the carryingvalues of related statement of financial position items.
The effective interest rate method is a method of allocating interest income or interest expense over therelevant period so as to achieve a constant periodic rate of interest (effective interest rate) on the carryingamount. The effective interest rate is the rate that exactly discounts estimated future cash payments orreceipts (excluding future credit losses) through the expected life of the financial instrument or a shorterperiod, if appropriate, to the net carrying amount of the financial instrument.
State Oil Company of the Azerbaijan Republic Notes to the consolidated financial statements for 2016
(Amounts presented are in millions of Azerbaijani Manats, unless otherwise stated)
11
2 Basis of preparation and significant accounting policies (continued)
Financial instruments − key measurement terms (continued)
The effective interest rate discounts cash flows of variable interest instruments to the next interest re-pricingdate except for the premium or discount which reflects the credit spread over the floating rate specified in theinstrument, or other variables that are not reset to market rates. Such premiums or discounts are amortisedover the whole expected life of the instrument. The present value calculation includes all fees paid orreceived between parties to the contract that are an integral part of the effective interest rate.
Financial assets
The Group classifies its financial assets in the following measurement categories: a) financial assets at fairvalue through profit or loss; b) loans and receivables; c) financial assets held-to-maturity and d) available-for-sale financial assets. The classification depends on the purpose for which the financial assets were acquired.Management determines the classification of its financial assets at initial recognition.
The subsequent measurement of financial assets depends on their classification, as follows:
(a) Financial assets at fair value through profit or loss. Financial assets at fair value through profit or lossare financial assets held for trading (a financial asset is classified in this category if acquired principallyfor the purpose of selling in the short term) and financial assets designated upon initial recognition asat fair value through profit or loss. Derivatives are classified as held for trading unless they aredesignated as hedges. Assets in this category are classified as current assets.
(b) Loans and receivables. Loans and receivables are non-derivative financial assets with fixed ordeterminable payments that are not quoted in an active market. They are included in current assets,except for maturities greater than 12 months after the reporting date. These are classified asnon-current assets. Loans and receivables are classified as trade and other receivables in thestatement of financial position.
(c) Held-to-maturity financial assets. This classification includes quoted non-derivative financial assetswith fixed or determinable payments and fixed maturities that the Group has both the intention andability to hold to maturity. Management determines the classification of investment securities held-to-maturity at their initial recognition and reassesses the appropriateness of that classification at eachreporting date.
(d) Available-for-sale financial assets. Available-for-sale financial assets are non-derivatives that areeither designated in this category or not classified in any of the other categories. They are included innon-current assets unless management intends to dispose of the investment within 12 months of thereporting date.
Regular purchases and sales of financial assets are recognized on the trade date − the date on which theGroup commits to purchase or sell the asset. Investments are initially recognized at fair value plustransaction costs for all financial assets not carried at fair value through profit or loss. Financial assetscarried at fair value through profit or loss are initially recognized at fair value, and transaction costs areexpensed in the statement of profit or loss and other comprehensive income. Available-for-sale financialassets and financial assets at fair value through profit or loss are subsequently carried at fair value. Loansand receivables, investment securities held-to-maturity are carried at amortized cost using the effectiveinterest rate method.
Gains or losses arising from changes in the fair value of the ‘financial assets at fair value through profit orloss’ category are presented in the statement of profit or loss and other comprehensive income within othergains/(losses) in the period in which they arise. Dividend income from financial assets at fair value throughprofit or loss is recognized in the statement of profit or loss and other comprehensive income as part of otherincome when the Group’s right to receive payments is established.
Changes in the fair value of monetary securities denominated in a foreign currency and classified asavailable-for-sale are analyzed between translation differences resulting from changes in amortized cost ofthe security and other changes in the carrying amount of the security. The translation differences onmonetary securities are recognized in profit or loss; translation differences on non-monetary securities arerecognized in equity. Changes in the fair value of monetary and non-monetary securities classified asavailable-for-sale are recognized in equity.
State Oil Company of the Azerbaijan Republic Notes to the consolidated financial statements for 2016
(Amounts presented are in millions of Azerbaijani Manats, unless otherwise stated)
12
2 Basis of preparation and significant accounting policies (continued)
Financial assets (continued)
When securities classified as available-for-sale are sold or impaired, the accumulated fair value adjustmentsrecognized in equity are included in the statement of profit or loss and other comprehensive income as gainsand losses from investment securities. Interest on available-for-sale securities calculated using the effectiveinterest rate method is recognized in the statement of profit or loss and other comprehensive income as partof other income. Dividends on available-for-sale equity instruments are recognized in the statement of profitor loss and other comprehensive income as part of other income when the Group’s right to receive paymentsis established.
The fair values of quoted investments are based on current bid prices. If the market for a financial asset isnot active (and for unlisted securities), the Group establishes fair value by using valuation techniques. Theseinclude the use of recent arm’s length transactions, reference to other instruments that are substantially thesame, discounted cash flow analysis and option pricing models, making maximum use of market inputs andrelying as little as possible on entity-specific inputs.
The Group assesses at each reporting date whether there is objective evidence that a financial asset or agroup of financial assets is impaired. In the case of equity securities classified as available-for-sale, a significantor prolonged decline in the fair value of the security below its cost is considered as an indicator that thesecurities are impaired. If any such evidence exists for available-for-sale financial assets, the cumulative loss −measured as the difference between the acquisition cost and the current fair value, less any impairment loss onthat financial asset previously recognized in other comprehensive income − is removed from equity andrecognized in the statement of profit or loss. Impairment losses recognized in the statement of profit or loss andother comprehensive income on equity instruments are not reversed through the profit or loss.
Financial liabilities
The Group classifies its financial liabilities into the following measurement categories: (a) held for trading whichalso includes financial derivatives and (b) other financial liabilities. Liabilities held for trading are carried at fairvalue with changes in value recognized in the consolidated statement of profit or loss and other comprehensiveincome in the period in which they arise. Other financial liabilities are carried at amortised cost.
Derecognition of financial assets
The Group derecognizes financial assets when (i) the assets are redeemed or the rights to cash flows fromthe assets have otherwise expired or (ii) the Group has transferred substantially all the risks and rewards ofownership of the assets or (iii) the Group has neither transferred nor retained substantially all risks andrewards of ownership but has not retained control. Control is retained if the counterparty does not have thepractical ability to sell the asset in its entirety to an unrelated third party without needing to impose additionalrestrictions on the sale.
Derecognition of financial liabilities
The Group derecognizes financial liability when the obligation under the liability is discharged, cancelled orexpires. Where an existing financial liability is replaced by another from the same lender on substantiallydifferent terms, or the terms of an existing liability are substantially modified, such an exchange ormodification is treated as the derecognition of the original liability and the recognition of a new liability, suchthat the difference in the respective carrying amounts, together with any costs or fees incurred is recognizedin the statement of profit or loss.
Financial guarantee contracts
Financial guarantee contracts issued by the Group are those contracts that require a payment to be made toreimburse the holder for a loss it incurs because the specified debtor fails to make a payment when due inaccordance with the terms of a debt instrument. Financial guarantee contracts are recognized initially as aliability at fair value, adjusted for transaction costs that are directly attributable to the issuance of theguarantee. Subsequently, the liability is measured at the higher of the best estimate of the expenditurerequired to settle the present obligation at the reporting date and the amount recognized less cumulativeamortisation.
State Oil Company of the Azerbaijan Republic Notes to the consolidated financial statements for 2016
(Amounts presented are in millions of Azerbaijani Manats, unless otherwise stated)
13
2 Basis of preparation and significant accounting policies (continued)
Derivative financial instruments and hedge accounting
Oil and Gas derivative financial instruments, including paper and physical contracts, are initially measured atfair value through profit or loss as well as subsequent changes in fair value. Fair value is defined as theamount for which an asset could be exchanged, or a liability settled, between knowledgeable, willing partiesin an arm’s length transaction.
Financial assets or financial liabilities at fair value through profit or loss includes financial assets or financialliabilities held for trading that do not meet the hedge accounting criteria as defined by IAS 39 FinancialInstruments: Recognition and Measurement and derivatives (except for a derivative that is a financialguarantee contract or a designated and effective hedging instrument) within the scope of IAS 39.
Financial instruments are differentiated as quoted in an active market and when there is no active market.A financial instrument is regarded as quoted in an active market if quoted prices are readily and regularlyavailable from an exchange, dealer, broker, industry group, pricing service or regulatory agency and thoseprices represent actual and regularly occurring market transactions on an arm’s length basis. If no activemarket, fair value has to be established using valuation techniques, including:
• Recent transaction prices;
• The current fair value of similar instruments;
• Discounted cash flow analysis;
• Option pricing models (e.g. Black & Scholes model).
Current market conditions, credit and liquidity risk are also considered by the Group in the determination offair value.
For the purpose of hedge accounting, hedges are classified as:
• Fair value hedges when hedging the exposure to changes of a recognized asset or liability or anunrecognized firm commitment.
• Cash flow hedges when hedging the exposure to variability in cash flows that is either attributable to aparticular risk associated with a recognized asset or liability or a highly probable forecast transactionor the foreign currency risk in an unrecognized firm commitment.
At the inception of a hedge relationship, the Group formally designates and documents the hedgerelationship to which the Group wishes to apply hedge accounting and the risk management objective andstrategy for undertaking the hedge. The documentation includes identification of the hedging instrument, thehedged item or transaction, the nature of the risk being hedged and how the entity will assess theeffectiveness of changes in the hedging instrument’s fair value in offsetting the exposure to changes in thehedged item’s fair value. Such hedges are expected to be highly effective in achieving offsetting changes infair value and are assessed on an ongoing basis to determine that they actually have been highly effectivethroughout the financial reporting periods for which they were designated.
Fair value hedges
When hedges meet the strict criteria for hedge accounting and an unrecognized firm commitment isdesignated as a hedged item, the subsequent cumulative change in the fair value of the firm commitmentattributable to the hedged risk is recognized as an asset or liability with a corresponding gain or lossrecognized in the income statement.
Cash flow hedges
The effective portion of the gain or loss on the hedging instrument is recognized in OCI in the cash flowhedge reserve, while any ineffective portion is recognized immediately in the statement of profit or loss asother operating expenses. Amounts recognized as OCI are transferred to profit or loss when the hedgedtransaction affects profit or loss, such as when the hedged financial income or financial expense isrecognized or when the forecast sale or expense occurs.
State Oil Company of the Azerbaijan Republic Notes to the consolidated financial statements for 2016
(Amounts presented are in millions of Azerbaijani Manats, unless otherwise stated)
14
2 Basis of preparation and significant accounting policies (continued)
Trade and other receivables
Trade and other receivables are carried at amortised cost using the effective interest rate method. TheGroup first assesses whether objective evidence of impairment exists individually for financial assets that areindividually significant, or collectively for financial assets that are not individually significant. If the Groupdetermines that no objective evidence of impairment exists for an individually assessed financial asset,whether significant or not, it includes the asset in a group of financial assets with similar credit riskcharacteristics and collectively assesses them for impairment. Assets that are individually assessed forimpairment and for which an impairment loss is, or continues to be, recognized are not included in acollective assessment of impairment.
A provision for impairment of receivables is established when there is objective evidence that the Group willnot be able to collect all amounts due according to the original terms of receivables. The amount of theprovision is the difference between the asset’s carrying amount and the present value of estimated futurecash flows, discounted at the original effective interest rate. The amount of provision is recognized in profit orloss. The primary factors that the Group considers when determining whether a receivable is impaired is itsoverdue status and realisability or related collateral, if any.
The following other principal criteria are also used to determine whether there is an objective evidence thatan impairment loss has occurred:
► the counterparty experiences a significant financial difficulty as evidenced by its financial informationthat the Group obtains;
► the counterparty considers bankruptcy or a financial reorganisation;
► there is an adverse change in the payment status of the counterparty as a result of changes in thenational or local economic conditions that impact the counterparty;
► the value of collateral, if any, significantly decreases as a result of deteriorating market conditions.
Trade and other receivables are derecognized upon cash receipts from customers and borrowers or othersimilar settlements.
Cash and cash equivalents
Cash and cash equivalents include cash in hand, deposits held at call with banks, and other short-termhighly liquid investments with original maturities of three months or less.
Restricted cash
Restricted cash is presented separately from cash and cash equivalents. Restricted balances are excludedfrom cash and cash equivalents for the purposes of cash flow statement.
Trade payables
Trade payables are accrued when the counterparty performed its obligations under the contract. Tradepayables are recognized initially at fair value and subsequently measured at amortised cost using theeffective interest rate method.
Borrowings
All borrowings are initially recognized at fair value of the proceeds received net of issue costs associatedwith the borrowing. Borrowings are carried at amortised cost using the effective interest rate method.
Interest costs on borrowings to finance the construction of property, plant and equipment are capitalised,during the period of time that is required to complete and prepare the asset for its intended use. All otherborrowing costs are expensed.
State Oil Company of the Azerbaijan Republic Notes to the consolidated financial statements for 2016
(Amounts presented are in millions of Azerbaijani Manats, unless otherwise stated)
15
2 Basis of preparation and significant accounting policies (continued)
Property, plant and equipment
The Group elected to measure property, plant and equipment at the date of transition to IFRS (1 January2007) at their fair value and use that fair value as their deemed cost at that date. Fair value was determinedby reference to market-based evidence and by using the depreciated replacement cost method. Subsequentto transition to IFRS, property, plant and equipment are stated at cost as described below, less accumulateddepreciation and provision for impairment, where required.
The initial cost of an asset purchased after 1 January 2007 comprises its purchase price or construction cost,any costs directly attributable to bringing the asset into operation, the initial estimate of decommissioningobligation, if any, and, for qualifying assets, borrowing costs. The assets held under finance lease are alsoincluded within property, plant and equipment. Non-recoverable value-added tax related with acquisition ofproperty, plant and equipment is capitalized by the Group. Non-recoverable value-added tax related withoperational activities is charged to profit or loss.
Exploration and evaluation costs
Property leasehold acquisition costs are capitalised until the determination of reserves is evaluated. If acommercial discovery has not been achieved, these costs are charged to expense. Capitalisation is madewithin property, plant and equipment or intangible assets according to the nature of the expenditure.
The Group accounts for exploration and evaluation activities, capitalizing exploration and evaluation costsuntil such time as the economic viability of producing the underlying resources is determined.
Exploration and evaluation costs related to resources determined to be not economically viable areexpensed through operating expenses in the consolidated statement of profit or loss and othercomprehensive income.
Development tangible and intangible assets
Expenditure on the construction, installation or completion of infrastructure facilities such as platforms,pipelines and the drilling of commercially proven development wells is capitalised within tangible andintangible assets according to nature. When development is completed on a specific field, it is transferred toproduction assets (oil and gas properties).
The present value of the estimated costs of dismantling oil and gas production facilities, including abandonmentand site restoration costs, are recognized when the obligation is incurred and are included within the carryingvalue of property, plant and equipment, subject to depletion using unit-of-production method.
All minor repair and maintenance costs are expensed as incurred. Cost of replacing major parts orcomponents of property, plant and equipment items are capitalized and the replaced part is retired.
At each reporting date management assesses whether there is any indication of impairment of property,plant and equipment. If any such indication exists, management estimates the recoverable amount, which isdetermined as the higher of an asset’s or cash generating unit’s fair value less costs to sell and its value inuse. The carrying amount is reduced to the recoverable amount and the impairment loss, if any, isrecognized in the statement of profit or loss and other comprehensive income. An impairment lossrecognized for an asset or cash generating unit in prior years is reversed if there are indicators thatimpairment loss may no longer exist or may have decreased.
Gains and losses on disposals are determined by comparing proceeds with the carrying amount. Gains andlosses are recognized in profit or loss.
Depreciation
Property, plant and equipment related to oil and natural gas properties are depreciated using a unit-of-production method.
Depreciation of oil and gas assets is computed on a field-by-field basis over proved developed reserves orover total proved reserves, as appropriate. Shared oil and gas properties and equipment (e.g. internaldelivery systems, processing units, etc.) are depleted over total proved reserves.
State Oil Company of the Azerbaijan Republic Notes to the consolidated financial statements for 2016
(Amounts presented are in millions of Azerbaijani Manats, unless otherwise stated)
16
2 Basis of preparation and significant accounting policies (continued)
Depreciation (continued)
Land is not depreciated. Property, plant and equipment other than oil and gas properties and equipment, aredepreciated on a straight-line basis over their estimated useful lives. Assets under construction are notdepreciated.
The estimated useful lives of the Group’s property, plant and equipment (other than oil and gas properties)are as follows:
Buildings and constructions 12 to 40 yearsPlant and machinery 3 to 50 yearsVessels 25 years
The expected useful lives of property, plant and equipment are reviewed on an annual basis and, ifnecessary, changes in useful lives are accounted for prospectively.
The residual value of an asset is the estimated amount that the Group would currently obtain from disposalof the asset less the estimated costs of disposal, if the asset were already of the age and in the conditionexpected at the end of its useful life. The residual value of an asset is nil if the Group expects to use theasset until the end of its physical life unless scrap value is significant. The assets’ residual values arereviewed, and adjusted if appropriate, at each reporting date.
Operating leases
Where the Group is a lessee in a lease which does not transfer substantially all the risks and rewardsincidental to ownership from the lessor to the Group, the total lease payments are charged to profit or loss ona straight-line basis over the lease term.
The lease term is the non-cancellable period for which the lessee has contracted to lease the asset togetherwith any further terms for which the lessee has the option to continue to lease the asset, with or withoutfurther payment, when at the inception of the lease it is reasonably certain that the lessee will exercise theoption.
When assets are leased out under an operating lease, the lease payments receivable are recognized asrental income on a straight-line basis over the lease term.
Goodwill
Goodwill is initially measured at cost being (the excess of the aggregate of the consideration transferred andthe amount recognized for non-controlling interests) over the net identifiable assets acquired and liabilitiesassumed. If this consideration is lower than the fair value of the net assets of the subsidiary acquired, thedifference is recognized in profit or loss. After initial recognition, goodwill is measured at cost less anyaccumulated impairment losses.
For the purpose of impairment testing, goodwill acquired in a business combination is, from the acquisitiondate, allocated to each of the Group’s cash-generating units that are expected to benefit from thecombination, irrespective of whether other assets or liabilities of the acquiree are assigned to those units.Where goodwill forms part of a cash-generating unit and part of the operation within that unit is disposed of,the goodwill associated with the operation disposed of is included in the carrying amount of the operationwhen determining the gain or loss on disposal of the operation. Goodwill disposed of in this circumstance ismeasured based on the relative values of the operation disposed of and the portion of the cash-generatingunit retained.
Intangible assets
Intangible assets are stated at cost, less accumulated amortization and accumulated impairment losses.Intangible assets include rights and computer software, patents, licences, customer relationships, tradename, water rights and development projects.
State Oil Company of the Azerbaijan Republic Notes to the consolidated financial statements for 2016
(Amounts presented are in millions of Azerbaijani Manats, unless otherwise stated)
17
2 Basis of preparation and significant accounting policies (continued)
Intangible assets (continued)
The useful lives of intangible assets are assessed as either finite or indefinite. Intangible assets with finitelives are amortised on a straight-line basis over the useful economic life and assessed for impairmentwhenever there is an indication that the intangible asset may be impaired. The amortisation period and theamortisation method for an intangible asset with a finite useful life is reviewed at least at the end of eachreporting period. Changes in the expected useful life or the expected pattern of consumption of futureeconomic benefits embodied in the asset is accounted for by changing the amortisation period or method, asappropriate, and are treated as changes in accounting estimates. The amortisation expense on intangibleassets with finite lives is recognized in the statement of profit or loss and other comprehensive income in theexpense category consistent with the function of the intangible assets.
Intangible assets with indefinite useful lives are not amortised, but are tested for impairment annually, eitherindividually or at the cash-generating unit level. The assessment of indefinite life is reviewed annually todetermine whether the indefinite life continues to be supportable. If not, the change in useful life fromindefinite to finite is made on a prospective basis.
(a) Rights and computer software
Software is carried at cost less accumulated amortisation. Amortisation is calculated using the straight-linemethod over the estimated useful lives of such assets. Land property rights consist of the rights over thedam, factory site, port site, site development, site and the water transmission line. Land property rightsobtained at the acquisition of Petkim Petrokimya Holding A.Ş. (“Petkim”) (Note 16) were initially recognizedat their fair values in accordance with IFRS 3 as at 30 May 2008 and amortised over their remaining usefullives commencing from the date of acquisition, except for the water transmission line which is not amortisedas it is deemed to have an indefinite useful life.
(b) Customer relationships
Customer relationships acquired as part of net assets of Petkim were initially recognized at their fair values inaccordance with IFRS 3 as at 30 May 2008 and amortised over their remaining useful lives of 22 yearscommencing from the date of the acquisition (Note 16).
Customer relationships acquired as part of net assets of SOCAR Switzerland were initially recognized attheir fair values in accordance with IFRS 3 as at 30 June 2012 and amortised over their remaining usefullives commencing from the date of acquisition. The estimated useful life of retail card end customers is18 years, retail distribution network and fuel customers are 30 years.
(c) Petkim trade name
Petkim trade name acquired at the Petkim acquisition was initially recognized at its fair value in accordancewith IFRS 3 as at 30 May 2008. Petkim trade name is not amortised as it is deemed to have an indefiniteuseful life (Note 16).
(d) Water rights
Water rights acquired with the Petkim acquisition were initially recognized at their fair value in accordancewith IFRS 3 as at 30 May 2008 and amortised over their remaining useful lives of 47 years commencing fromthe date of the acquisition (Note 16).
State Oil Company of the Azerbaijan Republic Notes to the consolidated financial statements for 2016
(Amounts presented are in millions of Azerbaijani Manats, unless otherwise stated)
18
2 Basis of preparation and significant accounting policies (continued)
Intangible assets (continued)
(e) Development projects
Development projects (design and testing of new or improved products) acquired with the Petkim acquisitionwere initially recognized at their fair value in accordance with IFRS 3 as of 30 May 2008 and amortised on astraight-line basis over their remaining useful lives of 5 years commencing from the date of the acquisition.Cost incurred on development projects (relating to the design and testing of new or improved products) arerecognized as intangible assets when it is probable that the project will be operational considering itscommercial and technological feasibility, and only if the cost can be measured reliably. Other expenditureson research and development activities are recognized as an expense in the period in which they incurred.When there is an impairment, the carrying values of the intangible assets are written down to theirrecoverable amounts. Intangible assets with indefinite useful lives are not amortized, however are tested forimpairment annually.
The assets’ residual values and useful lives are reviewed, and adjusted if appropriate, at each reportingdate.
Corporate income taxes
Corporate income taxes have been provided for in the consolidated financial statements in accordance withthe applicable legislation enacted or substantively enacted by the reporting date. The income tax chargecomprises current tax and deferred tax and is recognized on the profit or loss unless it relates to transactionsthat are recognized, in the same or a different period, in other comprehensive income or directly in equity.
Current tax is the amount expected to be paid to or recovered from the taxation authorities in respect oftaxable profits or losses for the current and prior periods. Taxes, other than on income, are recorded withinoperating expenses.
Deferred income tax is provided in full, using the liability method, on temporary differences arising betweenthe tax bases of assets and liabilities and their carrying amounts in the consolidated financial statements.Deferred income tax is determined using tax rates (and laws) that have been enacted or substantiallyenacted by the reporting date and are expected to apply when the related deferred income tax asset isrealized or the deferred income tax liability is settled.
Deferred income tax assets and liabilities are offset when there is a legally enforceable right to offset currenttax assets against current tax liabilities and when the deferred income taxes assets and liabilities relate toincome taxes levied by the same taxation authority on either the same taxable entity or different taxableentities where there is an intention to settle the balances on a net basis. Deferred income tax assets arerecognized to the extent that it is probable that future taxable profit will be available against which thetemporary differences can be utilised.
Deferred income tax is provided on temporary differences arising on investments in subsidiaries andassociates, except where the timing of the reversal of the temporary difference is controlled by the Groupand it is probable that the temporary difference will not reverse in the foreseeable future.
Deferred tax relating to items outside profit or loss is recognized either in OCI or directly in equity.
Deferred income taxes are provided in full on temporary differences arising on recognition and subsequentmeasurement of provision for asset retirement obligation and related adjustments to cost of property, plantand equipment.
Inventories
Inventories are stated at the lower of cost and net realizable value. Cost is assigned by the weightedaverage method. Cost comprises direct purchase costs, cost of production, transportation and manufacturingexpenses (based on normal operating capacity).
State Oil Company of the Azerbaijan Republic Notes to the consolidated financial statements for 2016
(Amounts presented are in millions of Azerbaijani Manats, unless otherwise stated)
19
2 Basis of preparation and significant accounting policies (continued)
Government grants
Grants from the Government are recognized at their fair value where there is a reasonable assurance thatthe grant will be received and the Group will comply with all attached conditions. Government grants relatingto the purchase of property, plant and equipment are included in non-current liabilities as deferred incomeand are credited to profit or loss on a straight line basis over the expected lives of the related assets.
When the grant relates to an expense item, it is recognized as income on a systematic basis over theperiods that the related costs, for which it is intended to compensate, are expensed.
Asset retirement obligations
Liabilities for asset retirement obligation costs are recognized when the Group has an obligation to dismantleand remove a facility or an item of plant and to restore the site on which it is located, and when a reasonableestimate of that liability can be made. Where an obligation exists for a new facility, such as oil and naturalgas production or transportation facilities, this will be on construction or installation. An obligation for assetretirement may also crystallize during the period of operation of a facility through a change in legislation. Theamount recognized is the present value of the estimated future expenditure determined in accordance withlocal conditions and requirements.
The cost of property, plant and equipment is also adjusted for amounts of estimated liabilities for assetretirement obligations.
Any change in the present value of the obligation resulting from changes in estimates of the amounts ortiming of future expenditures is reflected as an adjustment to the provision and the corresponding capitalizedcosts within property, plant and equipment. Changes in estimates of the amounts or timing of futureexpenditures to dismantle and remove fully depreciated plant or facility is recognized in the statement ofprofit or loss and other comprehensive income. Changes in the present value of the obligation resulting fromunwinding of the discount are recognized as finance costs in the statement of profit or loss and othercomprehensive income.
Provisions for liabilities and charges
Provisions for liabilities and charges are liabilities of uncertain timing or amount. They are accrued when theGroup has a present legal or constructive obligation as a result of past events, it is probable that an outflowof resources embodying economic benefits will be required to settle the obligation, and a reliable estimate ofthe amount of the obligation can be made. Provisions are not recognized for future operating losses.
Where there are a number of similar obligations, the likelihood that an outflow will be required in settlementis determined by considering the class of obligations as a whole. A provision is recognized even if thelikelihood of an outflow with respect to any one item included in the same class of obligations may be small.
Provisions are measured at the present value of the expenditures expected to be required to settle theobligation using a pre-tax rate that reflects current market assessments of the time value of money and therisks specific to the obligation. The increase in the provision due to passage of time is recognized as interestexpense.
Distribution to the Government
Distribution to the Government represent cash distributions or financing which the Group may be required tomake to the state budget, various government agencies and projects administered by the Government basedon the particular decisions of the Government.
Such distributions are recorded as a reduction of equity. Distributions in the form of transfers ofnon-monetary assets are recognized at the carrying value of transferred assets.
State Oil Company of the Azerbaijan Republic Notes to the consolidated financial statements for 2016
(Amounts presented are in millions of Azerbaijani Manats, unless otherwise stated)
20
2 Basis of preparation and significant accounting policies (continued)
Contributions by the Government
Contributions by the Government are made in the form of cash contributions, transfer of other state-ownedentities or transfer of all or part of the Government’s share in other entities. Transfer of the state-ownedentities to the Group is recognized as contribution through equity statement in the amount being the fairvalue of the transferred entity (in case of transfer by the Government of its share in other entities − thetransferred share in the fair value of the respective entity).
Value-added tax
The tax authorities permit the settlement of sales and purchases value-added tax (“VAT”) on a net basis.
VAT payable
VAT payable represents VAT related to sales that is payable to tax authorities upon recognition of sales tocustomers, net of VAT on purchases which have been settled at the reporting date. VAT related to saleswhich have not been settled at the reporting date (VAT deferral) is also included in VAT payable. Whereprovision has been made for impairment of receivables, impairment loss is recorded for the gross amount ofthe debtor, including VAT where applicable. The related VAT deferred liability is maintained until the debtoris written off for tax purposes.
VAT recoverable
VAT recoverable relates to purchases which have not been settled at the reporting date. VAT recoverable isreclaimable against VAT on sales upon payment for the purchases.
In accordance with ACG and Shah Deniz PSA provisions, AzACG and AzSD are charged with zero per centVAT effective in the Azerbaijan Republic for a contractor party under the respective PSAs according to aVAT certification issued by tax authorities and effective until 19 September 2019 and 3 June 2026,respectively.
Revenue recognition
Revenue comprises the fair value of consideration received or receivable for the sale of goods and servicesin the ordinary course of the Group’s activities. Revenue is shown net of VAT, returns, discounts, and othersales-based taxes, if any, after eliminating sales within the Group.
Revenues from sales of crude oil are recognized at the point of transfer of risks and rewards of ownership ofthe crude oil, normally when the oil is loaded into the oil tanker or other transportation facilities. Revenuesfrom sales of petroleum products are recognized at the point of transfer of risks and rewards of ownership ofthe petroleum products, normally when the products are shipped. Revenue from sales of natural gas arerecorded on the basis of regular meter readings (monitored on a monthly basis) and estimates of customerusage from the last meter reading to the end of the reporting period. Natural gas prices and gastransportation tariffs to the final consumers in the Azerbaijan Republic are established by the Tariff Council ofthe Azerbaijan Republic.
Revenues from sales of other goods are recognized at the point of transfer of risks and rewards of ownershipof the goods.
Sales of services are recognized in the accounting period in which the services are rendered, by reference tostage of completion of the specific transaction assessed on the basis of the actual service provided as aproportion of the total services to be provided.
Interest income is recognized on a time-proportion basis using the effective interest rate method.
State Oil Company of the Azerbaijan Republic Notes to the consolidated financial statements for 2016
(Amounts presented are in millions of Azerbaijani Manats, unless otherwise stated)
21
2 Basis of preparation and significant accounting policies (continued)
Overlift/underlift of crude oil
Overlift or underlift of crude oil occurs when the volume of oil lifted by a partner in a joint operation differsfrom its participating interest in the production. Underlift is recognized as a sale of crude oil at the point oflifting by the underlifter to the overlifter. Overlift is recognized as a purchase of oil by the overlifter from theunderlifter. The extent of underlift is reflected by the Group as an asset in the statement of financial position,and the extent of overlift is reflected as a liability. The initial measurement of the overlift liability or underliftasset is at the market price of crude oil at the date of lifting. Subsequent measurement of overlift/underliftliabilities and assets depends on the settlement terms of the related operating agreements.
If such terms allow for a cash settlement of the overlift/underlift balances between the parties, the balancesare remeasured at fair value at reporting dates subsequent to initial recognition. The overlift/underliftbalances that are settled through delivery of physical quantities of crude oil are measured at the lower ofcarrying amount and fair value at reporting dates subsequent to initial recognition.
Employee benefits
Wages, salaries, contributions to the Social Protection Fund of the Azerbaijan Republic, paid annual leaveand sick leave, bonuses, and non-monetary benefits (e.g. health services and kindergarten services) areaccrued in the year in which the associated services are rendered by the employees of the Group.
Segment reporting
Operating segments are reported in a manner consistent with the internal reporting provided to the Group’schief operating decision maker. Segments whose revenue, result or assets are ten per cent or more of all thesegments are reported separately.
Related parties
Related parties are defined in IAS 24 Related Party Disclosures.
Governmental economic and social policies affect the Group’s financial position, results of operations andcash flows. The Government imposed an obligation on the Group to provide an uninterrupted supply of oiland gas to customers in the Azerbaijan Republic at government controlled prices. Transactions with the stateinclude taxes which are detailed in Note 21.
Related parties may enter into transactions which unrelated parties might not, and transactions betweenrelated parties may not be effected on the same terms, conditions and amounts as transactions betweenunrelated parties.
It is the nature of transactions with related parties that they cannot be presumed to be carried out on anarm’s length basis.
Carried interest arrangements
A carried interest arrangement where the Group participate as carried party is an agreement under which thecarrying party agrees to pay for a portion or all of the pre-production costs of the carried party on a project inwhich both parties own participating interest. If the project is unsuccessful then the carrying party will not bereimbursed for the costs that it has incurred on behalf of the carried party. If the project is successful then thecarrying party will be reimbursed either in cash out of proceeds of the share of production attributable to thecarried party, or by receiving a disproportionately high share of the production until the carried costs are fullyrecovered.
Depending on the terms of the carried interest agreements the Group recognizes them either as financing-type arrangement or purchase/sale-type arrangement.
The finance-type arrangements presume that carrying party provides funding to the carried party andreceives a lender’s return on the funds provided, while the right to additional production acts as a securitythat underpins the arrangement.
State Oil Company of the Azerbaijan Republic Notes to the consolidated financial statements for 2016
(Amounts presented are in millions of Azerbaijani Manats, unless otherwise stated)
22
2 Basis of preparation and significant accounting policies (continued)
Carried interest arrangements (continued)
In the purchase/sale-type arrangement, the carried party effectively sells an interest or a partial interest in aproject to the carrying party. The carrying party will be required to fund the project in exchange for anincreased share of any proceeds if the project succeeds, while the carried party retains a much reducedshare of any proceeds. The Group does not have any purchase/sale-type arrangement recognized in theseconsolidated financial statements.
During exploration stage of projects when the outcome of projects and probability of the carrying party torecover costs incurred on behalf of the carried party are not certain the Group does not recognize any carryrelated transactions and balances in the consolidated financial statements.
Step-acquisition of subsidiary that is not a business
Step-acquisition of subsidiary which has been previously accounted as investment in associates isrecognized in the amount being the carrying value under the equity method related to the original interest inassociate plus cost of additional investments made by the Group in order to obtain control over associate(“deemed cost”).
Upon obtaining of the control over associate it becomes subsidiary of the Group and the “deemed” cost isallocated to the individual identifiable assets and liabilities of the subsidiary as following:
► monetary assets and monetary liabilities are recognized at their fair value;
► the amount of “deemed” cost remained after deduction of the fair value of monetary assets andmonetary liabilities is allocated to non-monetary assets and non-monetary liabilities on the basis oftheir fair value at the date of acquisition.
Non-current assets held for sale or for distribution to equity holders of the parent and discontinuedoperations
The Group classifies non-current assets and disposal groups as held for sale or for distribution to equityholders of the parent if their carrying amounts will be recovered principally through a sale or distributionrather than through continuing use. Such non-current assets and disposal groups classified as held for saleor as held for distribution are measured at their carrying amount.
The criteria for held for distribution classification is regarded as met only when the distribution is highlyprobable and the asset or disposal group is available for immediate distribution in its present condition.Actions required to complete the distribution should indicate that it is unlikely that significant changes to thedistribution will be made or that the decision to distribution will be withdrawn. Management must becommitted to the distribution expected within one year from the date of the classification. Similarconsiderations apply to assets or a disposal group held for sale.
Property, plant and equipment and intangible assets are not depreciated or amortised once classified as heldfor sale or as held for distribution. Assets and liabilities classified as held for sale or for distribution arepresented separately as current items in the statement of financial position.
A disposal group qualifies as discontinued operation if it is:
► Represents a separate major line of business or geographical area of operations;
► Is part of a single co-ordinated plan to dispose of a separate major line of business or geographicalarea of operations; or
► Is a subsidiary acquired exclusively with a view to resale.
Discontinued operations are excluded from the results of continuing operations and are presented as asingle amount as profit or loss after tax from discontinued operations in the statement of profit or loss. Allnotes to the consolidated financial statements include amounts for continuing operations.
State Oil Company of the Azerbaijan Republic Notes to the consolidated financial statements for 2016
(Amounts presented are in millions of Azerbaijani Manats, unless otherwise stated)
23
3 Critical accounting estimates and judgments
The Group makes estimates and assumptions that affect the reported amounts of assets and liabilities.Estimates and judgments are continually evaluated and are based on management’s experience and otherfactors, including expectations of future events that are believed to be reasonable under the circumstances.Management also makes certain judgments, apart from those involving estimations, in the process ofapplying the accounting policies. Judgments that have the most significant effect on the amounts recognizedin these consolidated financial statements and estimates that can cause a significant adjustment to thecarrying amount of assets and liabilities at reporting date include:
Estimation of oil and gas reserves
Oil and gas reserves are key elements in the Group’s investment decision-making process. They are also animportant element of testing for impairment. Changes in proved oil and gas reserves, particularly proveddeveloped reserves, will affect unit-of-production depreciation charges in the statement of profit or loss andother comprehensive income.
Proved oil and gas reserves are the estimated quantities of crude oil and natural gas which geological andengineering data demonstrate with reasonable certainty to be recoverable in future years from knownreservoirs under existing economic and operating conditions, i.e. prices and costs as of the date the estimateis made. Proved developed reserves are reserves that can be expected to be recovered through existingwells with existing equipment and operating methods. Estimates of oil and gas reserves are inherentlyimprecise, require the application of judgment and are subject to future revision.
Accordingly, financial and accounting measures (such as depletion and amortization charges and provisionfor asset retirement obligations) that are based on proved developed or proved reserves are also subject tochange. Proved reserves are estimated by reference to available reservoir and well information. All provedreserves estimates are subject to revision, either upward or downward, based on new information, such asfrom drilling and production activities or from changes in economic factors, including product prices, contractterms or development plans. In general, changes in the technical maturity or hydrocarbon reserves resultingfrom new information becoming available from development plans. In general, changes in the technicalmaturity of hydrocarbon reserves resulting from new information becoming available from development andproduction activities have tended to be the most significant cause of annual revisions.
In general, estimates of reserves for undeveloped or partially developed fields are subject to greateruncertainty over their future life than estimates of reserves for fields that are developed and being depleted.As a field goes into production, the amount of proved reserves will be subject to future revision onceadditional information becomes available through, for example, the drilling of additional wells or theobservation of long-term reservoir performance under producing conditions. As those fields are furtherdeveloped, new information may lead to revisions.
Proved reserves of the SOCAR as of 1 January 2017 were based on reports prepared by independentreservoir engineers in accordance with Petroleum Resources Management System rules.
Asset retirement obligations
As further discussed in Note 22, management makes provision for the future costs of decommissioning oiland gas production and storage facilities, pipelines and related support equipment and site restoration basedon the estimates of future cost and economic lives of those assets. Estimating future asset retirementobligations is complex and requires management to make estimates and judgments with respect to removalobligations that will occur many years in the future. Changes in the measurement of existing obligations canresult from changes in estimated timing, future costs or discount rates used in valuation.
State Oil Company of the Azerbaijan Republic Notes to the consolidated financial statements for 2016
(Amounts presented are in millions of Azerbaijani Manats, unless otherwise stated)
24
3 Critical accounting estimates and judgments (continued)
Asset retirement obligations (continued)
The Group assesses its asset retirement obligation liabilities in accordance with the guidelines ofInternational Financial Reporting Interpretations Committee (“IFRIC”) 1 Changes in ExistingDecommissioning, Restoration and Similar Liabilities. The amount recognized as a provision is the bestestimate of the expenditures required to settle the present obligation at the reporting date based on currentapplicable legislation and regulations, and is also subject to changes because of modifications, revisions andchanges in laws and regulations and respective interpretations thereof. Governmental authorities arecontinually considering applicable regulations and their enforcement. Consequently, the Group’s ultimateasset retirement liabilities may differ from the recorded amounts. As a result of the subjectivity of theseprovisions there is uncertainty regarding both the amount and estimated timing of incurring such costs.Estimated liability of dismantling oil and gas production and storage facilities, including abandonment andsite restoration costs, amounted to AZN 968 at 31 December 2016 (2015: AZN 748). Changes in any ofthese conditions may result in adjustments to provisions recorded by the Group.
Management determines discount rates used for discounting abandonment and site restoration costs as apre-tax rate that reflects current market assessments of the time value of money and where appropriate, therisks specific to the liability. The discount rate used as at 31 December 2016 was in range of5.59-8.24 per cent (2015: 5.95-8.28 per cent). Management believes that this discount rate appropriatelyreflects all risks and uncertainties pertaining to oil and gas exploration, evaluation, development anddistribution in Azerbaijan as of the reporting date.
If the estimated discount rate used in the calculation had been 1 per cent higher/lower than management’sestimate, the carrying amount of the provision would have been AZN 124 lower / AZN 185 higher, respectively.
Environmental obligations
As further discussed in Note 23, the Group records a provision in respect of estimated costs of remediationof the damage historically caused to the natural environment primarily in the Absheron area both by theactivities of the Group and its legacy operations in periods preceding the formation of the Group.
The amount recognized as a provision is the best estimate of the expenditures required to settle the presentobligation at the reporting date based on current applicable legislation and regulations, and is also subject tochanges because of modifications, revisions and changes in laws and regulations and respectiveinterpretations thereof. Governmental authorities are continually considering applicable regulations and theirenforcement. Consequently, the Group’s ultimate liability for environmental remediation may differ from therecorded amounts. As a result of the subjectivity of these provisions there is uncertainty regarding both theamount and estimated timing of incurring such costs. Estimated liability for environmental remediation as of31 December 2016 amounted to AZN 76 (2015: AZN 88). Changes in any of these conditions may result inadjustments to provisions recorded by the Group.
Management determines discount rate used for discounting environmental remediation costs as pre-tax ratethat reflects current market assessments of the time value of money and where appropriate, the risks specificto the liability as of the reporting date. The discount rate used as at 31 December 2016 was 8.73 per cent(2015: 8.59 per cent). Management believes that this discount rate appropriately reflects all risks anduncertainties pertaining to oil and gas exploration, evaluation and development industry in Azerbaijan.Changes in any of these conditions may result in adjustments to provisions recorded by the Group. If theestimated discount rate used in the calculation had been 1 per cent higher/lower than management’sestimate, the carrying amount of the provision would have been AZN 1 lower / AZN 1 higher, respectively.
Useful lives of property, plant and equipment and intangible assets
Management determines the estimated useful lives and related depreciation and amortisation charges for itsproperty, plant and equipment and intangible assets. This estimate is based on projected period over whichthe Group expects to consume economic benefits from the asset. Management increases the depreciationcharge where useful lives are less than previously estimated lives, or it write-offs or write-downs technicallyobsolete assets that have been abandoned or sold. The useful lives are reviewed at least at each financialyear-end. Changes in any of the above conditions or estimates may result in adjustments to futuredepreciation rates.
State Oil Company of the Azerbaijan Republic Notes to the consolidated financial statements for 2016
(Amounts presented are in millions of Azerbaijani Manats, unless otherwise stated)
25
3 Critical accounting estimates and judgments (continued)
Deferred income tax assets recognition
The net deferred tax assets represent income taxes recoverable through future deductions from taxableprofits and is recorded on the statement of financial position. Deferred income tax assets are recorded to theextent that realisation of the related tax benefit is probable. In determining future taxable profits and theamount of tax benefits that are probable in the future management makes judgments and applies estimationbased on last three years taxable profits and expectations of future income that are believed to bereasonable under the circumstances.
Impairment of non-financial assets
Management assesses whether there are any indicators of possible impairment of all non-financial assets ateach reporting date based on events or circumstances that indicate the carrying value of assets may not berecoverable. Such indicators include changes in the Group’s business plans, changes in commodity pricesleading to unprofitable performances, changes in product mixes, and for oil and gas properties, significantdownward revisions of estimated proved reserves. Goodwill and other indefinite life intangibles are tested forimpairment annually and at other times when impairment indicators exist. Other non-financial assets aretested for impairment when there are indicators that the carrying amounts may not be recoverable.
When value in use calculations are undertaken, management estimates the expected future cash flows fromthe asset or cash generating unit and chooses a suitable discount rate in order to calculate the present valueof those cash flows. In 2016, as the result of underperformance of some Cash Generating Units (CGUs) theGroup carried out a review of the recoverable amounts of those CGUs resulting in impairment chargeamounting to AZN 322 (2015: AZN 254). These assets are used in the Group’s oil and gas, construction andrefinery segments. In assessing whether impairment is required in the carrying value of a potentially impairedasset, its carrying value is compared with its recoverable amount.
The recoverable amount is the higher of the asset’s fair value less costs to sell and value-in-use. Given thenature of the Group’s activities, information on the fair value of an asset is usually difficult to obtain unlessnegotiations with potential purchasers are taking place.
Consequently, unless indicated otherwise, the recoverable amount used in assessing the impairmentcharges described below is value-in-use. The Group generally estimates value-in-use using a discountedcash flow model from financial budgets approved by management.
Key assumptions used in value-in-use calculations
The calculation of value-in-use for property, plant and equipment fields is most sensitive to the followingassumptions:
Production volumes
Estimated production volumes of SOCAR operated fields are based on detailed data for the fields and takeinto account development plans for the fields agreed by management as part of the long-term planningprocess. It is estimated that, if all production were to be reduced by 10 per cent for the whole of the next20 years, this would result in additional impairment charge of AZN 192.
Operating expenses
Operating expenses are based on previous year’s actual figures. These are increased over the budgetperiod for anticipated inflation rate.
Gross margins
Gross margins are based on previous year’s actual figures. These are increased over the budget period foranticipated inflation rate.
State Oil Company of the Azerbaijan Republic Notes to the consolidated financial statements for 2016
(Amounts presented are in millions of Azerbaijani Manats, unless otherwise stated)
26
3 Critical accounting estimates and judgments (continued)
Impairment of non-financial assets (continued)
Capital expenditures
Capital expenditures necessary to maintain estimated production volumes are based on long-termdevelopment plans for particular oil field.
Crude oil price
Forecast commodity prices are publicly available.
Natural gas price
Natural gas prices are calculated based on the long-term sales contracts provisions and are either fixed ordepend on crude oil prices and other inputs.
Discount rate
The pre-tax discount rate applied to the cash flow projections was in range of 13.01-19.29 per cent fordifferent CGUs (2015: 13.70-16.49 per cent). The discount rate calculation is based on the specificcircumstances of the Group and its operating segments and derived from its weighted average cost of capital(WACC). In calculating WACC the cost of equity was estimated using peer group data and the cost of debt isbased on interest bearing borrowings, the Group is obliged to service. Specific risks are incorporated byapplying individual beta factors, market risk and size of the Group. The beta factors are evaluated annuallybased on publicly available market data. If the estimated WACC used in the calculation had been 1 per centhigher management’s estimate, no additional impairment loss would be recognized.
Inflation rate estimates
Rates used are Oxford Economics and Economic Intelligence Unit forecasts.
Excise taxes, road taxes and export duties
Excise taxes, road taxes and export duties on oil and gas and petroleum products are an important factor foroil and gas properties and equipment and are forecasted based on enacted tax and duty rates.
Impairment provision for trade receivables
The impairment provision for trade receivables is based on management’s assessment of the probability ofcollection of individual customer accounts receivable. Significant financial difficulties of the customer,probability that the customer will suffer bankruptcy or financial reorganisation, and default or delinquency inpayments are considered indicators that the receivable is potentially impaired. Actual results could differ fromthese estimates if there is deterioration in a major customer’s creditworthiness or actual defaults are higherthan the estimates.
When there is no expectation of recovering additional cash for an amount receivable, amount receivable iswritten off against associated provision.
Future cash flows of trade receivables that are evaluated for impairment are estimated on the basis of thecontractual cash flows of the assets and the experience of management in respect of the extent to whichamounts will become overdue as a result of past loss events and the success of recovery of overdueamounts. Past experience is adjusted on the basis of current observable data to reflect the effects of currentconditions that did not affect past periods and to remove the effects of past conditions that do not existcurrently.
State Oil Company of the Azerbaijan Republic Notes to the consolidated financial statements for 2016
(Amounts presented are in millions of Azerbaijani Manats, unless otherwise stated)
27
3 Critical accounting estimates and judgments (continued)
Disability provision
As further discussed in Note 23, the Group records a provision in accordance with Azerbaijan Labour Codeand has an obligation to pay compensation for employees damaged at work. Estimated liability for disabilityremediation as of 31 December 2016 amounted to AZN 117 (2015: AZN 99).
Management determines discount rate used for discounting disability provision as pre-tax rate that reflectscurrent market assessments of the time value of money and where appropriate, the risks specific to theliability as of the reporting date. The discount rate used as at 31 December 2016 was 8.13 per cent (2015:8.29 per cent). In addition, the Group estimated a life expectancy as 71 and 76 for men and women,respectively for the purpose of calculation of the lifetime payments to injured employees. Changes in any ofthese conditions may result in adjustments to provisions recorded by the Group.
If the estimated discount rate used in the calculation had been 1 per cent higher/lower than management’sestimate, the carrying amount of the provision would have been AZN 7 lower / AZN 8 higher, respectively.
4 Adoption of new or revised standards and interpretations and new accountingpronouncements
The accounting policies adopted are consistent with those of the previous financial year, except for thefollowing amendment to IFRS effective beginning on or after 1 January 2016:
IFRS 14 Regulatory Deferral Accounts
IFRS 14 is an optional standard that allows an entity, whose activities are subject to rate-regulation, tocontinue applying most of its existing accounting policies for regulatory deferral account balances upon itsfirst-time adoption of IFRS. Entities that adopt IFRS 14 must present the regulatory deferral accounts asseparate line items on the statement of financial position and present movements in these account balancesas separate line items in the statement of profit or loss and OCI. The standard requires disclosure of thenature of, and risks associated with, the entity’s rate-regulation and the effects of that rate-regulation on itsfinancial statements. Since the Group is an existing IFRS preparer and is not involved in any rate-regulatedactivities, this standard does not apply.
Amendments to IFRS 11 Joint Arrangements: Accounting for Acquisitions of Interests
The amendments to IFRS 11 require that a joint operator accounting for the acquisition of an interest in ajoint operation, in which the activity of the joint operation constitutes a business, must apply the relevantIFRS 3 Business Combinations principles for business combination accounting. The amendments also clarifythat a previously held interest in a joint operation is not re-measured on the acquisition of an additionalinterest in the same joint operation if joint control is retained. In addition, a scope exclusion has been addedto IFRS 11 to specify that the amendments do not apply when the parties sharing joint control, including thereporting entity, are under common control of the same ultimate controlling party. The amendments apply toboth the acquisition of the initial interest in a joint operation and the acquisition of any additional interests inthe same joint operation and are applied prospectively. These amendments do not have any impact on theGroup as there has been no interest acquired in a joint operation during the period.
Amendments to IAS 16 and IAS 38: Clarification of Acceptable Methods of Depreciation andAmortisation
The amendments clarify the principle in IAS 16 Property, Plant and Equipment and IAS 38 Intangible Assetsthat revenue reflects a pattern of economic benefits that are generated from operating a business (of whichthe asset is a part) rather than the economic benefits that are consumed through use of the asset. As aresult, a revenue-based method cannot be used to depreciate property, plant and equipment and may onlybe used in very limited circumstances to amortise intangible assets. The amendments are appliedprospectively and do not have any impact on the Group, given that it has not used a revenue-based methodto depreciate its non-current assets. In addition, non-refundable purchase taxes amount should becapitalized as part of the cost of the asset.
State Oil Company of the Azerbaijan Republic Notes to the consolidated financial statements for 2016
(Amounts presented are in millions of Azerbaijani Manats, unless otherwise stated)
28
4 Adoption of new or revised standards and interpretations and new accountingpronouncements (continued)
Amendments to IAS 16 and IAS 41 Agriculture: Bearer Plants
The amendments change the accounting requirements for biological assets that meet the definition of bearerplants. Under the amendments, biological assets that meet the definition of bearer plants will no longer bewithin the scope of IAS 41 Agriculture. Instead, IAS 16 will apply. After initial recognition, bearer plants willbe measured under IAS 16 at accumulated cost (before maturity) and using either the cost model orrevaluation model (after maturity). The amendments also require that produce that grows on bearer plantswill remain in the scope of IAS 41 measured at fair value less costs to sell. For government grants related tobearer plants, IAS 20 Accounting for Government Grants and Disclosure of Government Assistance willapply. The amendments are applied retrospectively and do not have any impact on the Group as it does nothave any bearer plants.
Amendments to IAS 27: Equity Method in Separate Financial Statements
The amendments allow entities to use the equity method to account for investments in subsidiaries, jointventures and associates in their separate financial statements. Entities already applying IFRS and electing tochange to the equity method in their separate financial statements have to apply that change retrospectively.These amendments do not have any impact on the Group’s consolidated financial statements.
Annual improvements 2012-2014 cycle
These improvements include:
IFRS 5 Non-current Assets Held for Sale and Discontinued Operations
Assets (or disposal groups) are generally disposed of either through sale or distribution to owners. Theamendment clarifies that changing from one of these disposal methods to the other would not be considereda new plan of disposal, rather it is a continuation of the original plan. There is, therefore, no interruption ofthe application of the requirements in IFRS 5. This amendment is applied prospectively.
IFRS 7 Financial Instruments: Disclosures
(i) Servicing contracts
The amendment clarifies that a servicing contract that includes a fee can constitute continuing involvement ina financial asset. An entity must assess the nature of the fee and the arrangement against the guidance forcontinuing involvement in IFRS 7 in order to assess whether the disclosures are required. The assessmentof which servicing contracts constitute continuing involvement must be made retrospectively. However, therequired disclosures need not to be provided for any period beginning before the annual period in which theentity first applies the amendments.
(ii) Applicability of the amendments to IFRS 7 to condensed interim financial statements
The amendment clarifies that the offsetting disclosure requirements do not apply to condensed interimfinancial statements, unless such disclosures provide a significant update to the information reported in themost recent annual report. This amendment is applied retrospectively.
IAS 19 Employee Benefits
The amendment clarifies that market depth of high quality corporate bonds is assessed based on thecurrency in which the obligation is denominated, rather than the country where the obligation is located.When there is no deep market for high quality corporate bonds in that currency, government bond rates mustbe used. This amendment is applied prospectively.
State Oil Company of the Azerbaijan Republic Notes to the consolidated financial statements for 2016
(Amounts presented are in millions of Azerbaijani Manats, unless otherwise stated)
29
4 Adoption of new or revised standards and interpretations and new accountingpronouncements (continued)
Annual improvements 2012-2014 cycle (continued)
IAS 34 Interim Financial Reporting
The amendment clarifies that the required interim disclosures must either be in the interim financialstatements or incorporated by cross-reference between the interim financial statements and wherever theyare included within the interim financial report (e.g., in the management commentary or risk report). Theother information within the interim financial report must be available to users on the same terms as theinterim financial statements and at the same time. This amendment is applied retrospectively.
These amendments do not have any impact on the Group.
Amendments to IAS 1 Presentation of Financial Statements: Disclosure Initiative
The amendments to IAS 1 clarify, rather than significantly change, existing IAS 1 requirements. Theamendments clarify:• The materiality requirements in IAS 1;• That specific line items in the statement(s) of profit or loss and OCI and the statement of financial
position may be disaggregated;• That entities have flexibility as to the order in which they present the notes to financial statements;• That the share of OCI of associates and joint ventures accounted for using the equity method must be
presented in aggregate as a single line item, and classified between those items that will or will not besubsequently reclassified to profit or loss.
Furthermore, the amendments clarify the requirements that apply when additional subtotals are presented inthe statement of financial position and the statement(s) of profit or loss and OCI. These amendments do nothave any impact on the Group.
Amendments to IFRS 10, IFRS 12 and IAS 28 Investment Entities: Applying the ConsolidationException
The amendments address issues that have arisen in applying the investment entities exception under IFRS 10Consolidated Financial Statements. The amendments to IFRS 10 clarify that the exemption from presentingconsolidated financial statements applies to a parent entity that is a subsidiary of an investment entity, whenthe investment entity measures all of its subsidiaries at fair value. Furthermore, the amendments to IFRS 10clarify that only a subsidiary of an investment entity that is not an investment entity itself and that providessupport services to the investment entity is consolidated. All other subsidiaries of an investment entity aremeasured at fair value. The amendments to IAS 28 Investments in Associates and Joint Ventures allow theinvestor, when applying the equity method, to retain the fair value measurement applied by the investmententity associate or joint venture to its interests in subsidiaries. These amendments are applied retrospectivelyand do not have any impact on the Group as the Group does not apply the consolidation exception.
Standards issued but not yet effective
The standards and interpretations that are issued, but not yet effective, up to the date of issuance of theGroup’s consolidated financial statements are disclosed below. The Group intends to adopt these standards,if applicable, when they become effective.
IFRS 9 Financial Instruments
In July 2014, the IASB issued the final version of IFRS 9 Financial Instruments that replaces IAS 39Financial Instruments: Recognition and Measurement and all previous versions of IFRS 9. IFRS 9 bringstogether all three aspects of the accounting for the financial instruments project: classification andmeasurement; impairment; and hedge accounting. IFRS 9 is effective for annual periods beginning on orafter 1 January 2018, with early application permitted. Except for hedge accounting, retrospective applicationis required, but providing comparative information is not compulsory. For hedge accounting, therequirements are generally applied prospectively, with some limited exceptions.
State Oil Company of the Azerbaijan Republic Notes to the consolidated financial statements for 2016
(Amounts presented are in millions of Azerbaijani Manats, unless otherwise stated)
30
4 Adoption of new or revised standards and interpretations and new accountingpronouncements (continued)
Standards issued but not yet effective (continued)
(a) Classification and measurement
The Group does not expect a significant impact on its balance sheet or equity on applying the classificationand measurement requirements of IFRS 9. It expects to continue measuring at fair value all financial assetscurrently held at fair value. Quoted equity shares currently held as available-for-sale with gains and lossesrecorded in OCI will be measured at fair value through profit or loss instead, which will increase volatility inrecorded profit or loss. The AFS reserve currently presented as accumulated OCI will be reclassified toopening retained earnings. Debt securities are expected to be measured at fair value through OCI underIFRS 9 as the Group expects not only to hold the assets to collect contractual cash flows, but also to sell asignificant amount on a relatively frequent basis. The equity shares in non-listed companies are intended tobe held for the foreseeable future. The Group expects to apply the option to present fair value changes inOCI, and, therefore, believes the application of IFRS 9 would not have a significant impact.
If the Group were not to apply that option, the shares would be held at fair value through profit or loss, whichwould increase the volatility of loans as well as trade receivables are held to collect contractual cash flowsand are expected to give rise to cash flows representing solely payments of principal and interest. Thus, theGroup expects that these will continue to be measured at amortised cost under IFRS 9. However, the Groupwill analyse the contractual cash flow characteristics of those instruments in more detail before concludingwhether all those instruments meet the criteria for amortised cost measurement under IFRS 9.
(b) Impairment
IFRS 9 requires the Group to record expected credit losses on all of its debt securities, loans and tradereceivables, either on a 12-month or lifetime basis. The Group expects to apply the simplified approach andrecord lifetime expected losses on all trade receivables. The Group expects a significant impact on its equitydue to the unsecured nature of its loans and receivables, but it will need to perform a more detailed analysiswhich considers all reasonable and supportable information, including forward-looking elements to determinethe extent of the impact.
(c) Hedge accounting
The Group believes that all existing hedge relationships that are currently designated in effective hedgingrelationships will still qualify for hedge accounting under IFRS 9. As IFRS 9 does not change the generalprinciples of how an entity accounts for effective hedges, the Group does not expect a significant impact as aresult of applying IFRS 9. The Group will assess possible changes related to the accounting for the timevalue of options, forward points or the currency basis spread in more detail in the future.
IFRS 15 Revenue from Contracts with Customers
IFRS 15 was issued in May 2014 and establishes a five-step model to account for revenue arising fromcontracts with customers. Under IFRS 15, revenue is recognised at an amount that reflects the considerationto which an entity expects to be entitled in exchange for transferring goods or services to a customer.
The new revenue standard will supersede all current revenue recognition requirements under IFRS. Either afull retrospective application or a modified retrospective application is required for annual periods beginningon or after 1 January 2018. Early adoption is permitted. The Group plans to adopt the new standard on therequired effective date using the full retrospective method. During 2016, the Group performed a preliminaryassessment of IFRS 15, which is subject to changes arising from a more detailed ongoing analysis.Furthermore, the Group is considering the clarifications issued by the IASB in April 2016 and will monitor anyfurther developments.
State Oil Company of the Azerbaijan Republic Notes to the consolidated financial statements for 2016
(Amounts presented are in millions of Azerbaijani Manats, unless otherwise stated)
31
4 Adoption of new or revised standards and interpretations and new accountingpronouncements (continued)
Standards issued but not yet effective (continued)
(a) Presentation and disclosure requirements
IFRS 15 provides presentation and disclosure requirements, which are more detailed than under currentIFRS. The presentation requirements represent a significant change from current practice and significantlyincreases the volume of disclosures required in Group’s consolidated financial statements. Many of thedisclosure requirements in IFRS 15 are completely new. In 2016 the Group developed and started testing ofappropriate systems, internal controls, policies and procedures necessary to collect and disclose therequired information.
Amendments to IFRS 10 and IAS 28: Sale or Contribution of Assets between an Investor and its Associateor Joint Venture
The amendments address the conflict between IFRS 10 and IAS 28 in dealing with the loss of control of asubsidiary that is sold or contributed to an associate or joint venture. The amendments clarify that the gain orloss resulting from the sale or contribution of assets that constitute a business, as defined in IFRS 3,between an investor and its associate or joint venture, is recognised in full. Any gain or loss resulting fromthe sale or contribution of assets that do not constitute a business, however, is recognised only to the extentof unrelated investors’ interests in the associate or joint venture. The IASB has deferred the effective date ofthese amendments indefinitely, but an entity that early adopts the amendments must apply themprospectively. The Group will apply these amendments when they become effective.
IAS 7 Disclosure Initiative − Amendments to IAS 7
The amendments to IAS 7 Statement of Cash Flows are part of the IASB’s Disclosure Initiative and requirean entity to provide disclosures that enable users of financial statements to evaluate changes in liabilitiesarising from financing activities, including both changes arising from cash flows and non-cash changes. Oninitial application of the amendment, entities are not required to provide comparative information forpreceding periods. These amendments are effective for annual periods beginning on or after 1 January2017, with early application permitted. Application of the amendments will result in additional disclosuresprovided by the Group.
IAS 12 Recognition of Deferred Tax Assets for Unrealised Losses − Amendments to IAS 12
The amendments clarify that an entity needs to consider whether tax law restricts the sources of taxableprofits against which it may make deductions on the reversal of that deductible temporary difference.Furthermore, the amendments provide guidance on how an entity should determine future taxable profitsand explain the circumstances in which taxable profit may include the recovery of some assets for more thantheir carrying amount. Entities are required to apply the amendments retrospectively. However, on initialapplication of the amendments, the change in the opening equity of the earliest comparative period may berecognised in the opening retained earnings (or in another component of equity, as appropriate), withoutallocating the change between opening retained earnings and other components of equity. Entities applyingthis relief must disclose that fact. These amendments are effective for annual periods beginning on or after1 January 2017 with early application permitted. If an entity applies the amendments for an earlier period, itmust disclose that fact. These amendments are not expected to have any impact on the Group.
IFRS 2 Classification and Measurement of Share-based Payment Transactions − Amendments to IFRS 2
The IASB issued amendments to IFRS 2 Share-based Payment that address three main areas: the effects ofvesting conditions on the measurement of a cash-settled share-based payment transaction; the classificationof a share-based payment transaction with net settlement features for withholding tax obligations; andaccounting where a modification to the terms and conditions of a share-based payment transaction changesits classification from cash settled to equity settled. On adoption, entities are required to apply theamendments without restating prior periods, but retrospective application is permitted if elected for allthree amendments and other criteria are met. The amendments are effective for annual periods beginning onor after 1 January 2018, with early application permitted. The Group is assessing the potential effect of theamendments on its consolidated financial statements.
State Oil Company of the Azerbaijan Republic Notes to the consolidated financial statements for 2016
(Amounts presented are in millions of Azerbaijani Manats, unless otherwise stated)
32
4 Adoption of new or revised standards and interpretations and new accountingpronouncements (continued)
Standards issued but not yet effective (continued)
IFRS 16 Leases
IFRS 16 was issued in January 2016 and it replaces IAS 17 Leases, IFRIC 4 Determining whether anArrangement Contains a Lease, SIC-15 Operating Leases-Incentives and SIC-27 Evaluating the Substanceof Transactions Involving the Legal Form of a Lease. IFRS 16 sets out the principles for the recognition,measurement, presentation and disclosure of leases and requires lessees to account for all leases under asingle on-balance sheet model similar to the accounting for finance leases under IAS 17. The standardincludes two recognition exemptions for lessees − leases of ‘low-value’ assets (e.g., personal computers)and short-term leases (i.e., leases with a lease term of 12 months or less). At the commencement date of alease, a lessee will recognise a liability to make lease payments (i.e., the lease liability) and an assetrepresenting the right to use the underlying asset during the lease term (i.e., the right-of-use asset). Lesseeswill be required to separately recognise the interest expense on the lease liability and the depreciationexpense on the right-of-use asset.
Lessees will be also required to re-measure the lease liability upon the occurrence of certain events (e.g., achange in the lease term, a change in future lease payments resulting from a change in an index or rateused to determine those payments). The lessee will generally recognise the amount of the re-measurementof the lease liability as an adjustment to the right-of-use asset.
Lessor accounting under IFRS 16 is substantially unchanged from today’s accounting under IAS 17. Lessorswill continue to classify all leases using the same classification principle as in IAS 17 and distinguishbetween two types of leases: operating and finance leases. IFRS 16 also requires lessees and lessors tomake more extensive disclosures than under IAS 17. IFRS 16 is effective for annual periods beginning on orafter 1 January 2019. Early application is permitted, but not before an entity applies IFRS 15. A lessee canchoose to apply the standard using either a full retrospective or a modified retrospective approach. Thestandard’s transition provisions permit certain reliefs. In 2017, the Group plans to assess the potential effectof IFRS 16 on its consolidated financial statements.
IFRIC 22 Foreign Currency Transactions and Advance Consideration
The interpretation clarifies that in determining the spot exchange rate to use on initial recognition of therelated asset, expense or income (or part of it), or on the derecognition of a non-monetary asset or non-monetary liability relating to advance consideration, the date of the transaction is the date on which an entityinitially recognizes the non-monetary asset or non-monetary liability arising from the advance consideration.If there are multiple payments or receipts in advance, then the entity must determine a date of thetransaction for each payment or receipt of advance consideration.
The amendments are effective from 1 January 2018 and may be applied on a fully retrospective basis;prospectively to all assets, expenses and income in its scope that are initially recognised on or after thebeginning of the reporting period in which the entity first applies the interpretation; or, the beginning of a priorreporting period presented as comparative information in the financial statements of the reporting period inwhich the entity first applies the interpretation. The Group intends to adopt the amendments on the effectivedate, and does not expect the impact of adoption of the interpretation to be material.
IFRIC 23 Uncertainty over Income Tax Treatments
This Interpretation issued in June 2017 clarifies how to apply the recognition and measurement requirementsin IAS 12 when there is uncertainty over income tax treatments. In such a circumstance, an entity shallrecognise and measure its current or deferred tax asset or liability applying the requirements in IAS 12 basedon taxable profit (tax loss), tax bases, unused tax losses, unused tax credits and tax rates determinedapplying this Interpretation. This interpretation is effective for annual reporting periods beginning on or after1 January 2019.
State Oil Company of the Azerbaijan Republic Notes to the consolidated financial statements for 2016
(Amounts presented are in millions of Azerbaijani Manats, unless otherwise stated)
33
4 Adoption of new or revised standards and interpretations and new accountingpronouncements (continued)
Standards issued but not yet effective (continued)
IAS 40 Transfers of Investment Property − Amendments to IAS 40
The amendments clarify when an entity should transfer property, including property under construction ordevelopment into, or out of investment property. The amendments state that a change in use occurs whenthe property meets, or ceases to meet, the definition of investment property and there is evidence of thechange in use. A mere change in management’s intentions for the use of a property does not provideevidence of a change in use. Entities should apply the amendments prospectively to changes in use thatoccur on or after the beginning of the annual reporting period in which the entity first applies theamendments. An entity should reassess the classification of property held at that date and, if applicable,reclassify property to reflect the conditions that exist at that date. Retrospective application in accordancewith IAS 8 is only permitted if that is possible without the use of hindsight. Early application of theamendments is permitted and must be disclosed. These amendments are effective for annual periodsbeginning on or after 1 January 2018.
5 Segment information
Operating segments are components that engage in business activities that may earn revenues or incurexpenses, whose operating results are regularly reviewed by the management of the Group and for whichdiscrete financial information is available.
The Group is organised into business units and subsidiaries based on their products and services and hasfour reportable segments as follows:
► Oil and gas − representing extraction of oil and gas products;
► Refining − representing refining of crude oil and gas condensate;
► Construction − representing construction of administrative premises and assets for extraction of oiland gas condensate;
► Sales and distribution − representing transportation and marketing of crude oil, natural gas, oilproducts and gas condensate.
No operating segments have been aggregated to form the above reportable operating segments.
The Group’s segments are strategic business units and subsidiaries that focus on different customers.Management monitors the operating results of its business units and subsidiaries separately for the purposeof making decisions about resource allocation and performance assessment. Transfer prices betweenoperating segments are either on an arm’s length basis or non-arm’s length basis.
Management evaluates performance of each segment based on profit after tax.

State Oil Company of the Azerbaijan Republic Notes to the consolidated financial statements for 2016
(Amounts presented are in millions of Azerbaijani Manats, unless otherwise stated)
34
5 Segment information (continued)
Information about reportable segment profit or loss, assets and liabilities
Segment information for the reportable segments for the year ended 31 December 2016 is set out below:
Oiland gas Refining
Construc-tion
Sales anddistribu-
tionUnalloca-
ted (*)Elimina-tions (**) Total
2016RevenuesExternal customers 1,808 3,069 1,518 45,488 22 − 51,905Inter-segment 1,896 286 416 16,867 428 (19,893) −Total revenue 3,704 3,355 1,934 62,355 450 (19,893) 51,905
Other operating income (1) 30 401 192 139 (64) 697Finance income 10 160 1 34 543 (559) 189Foreign exchange
gains/losses (net) (12) (106) (69) (107) (689) (301) (1,284)Raw materials and
consumables used (666) (2,082) (247) (60,118) (55) 18,903 (44,265)Depreciation of property,
plant and equipment (507) (147) (119) (203) (78) 40 (1,014)Wages, salaries and
social security costs (183) (248) (271) (468) (221) 94 (1,297)Transportation and
vehicle maintenance (349) (15) (116) (523) (44) 333 (714)Repairs and maintenance
expenses (151) (6) (121) (44) (5) 138 (189)Impairment of property,
plant and equipment (144) (37) (138) (3) − − (322)Mining tax (103) − − − − − (103)Utilities expense (13) (216) (2) (75) (3) 2 (307)Taxes other than on
income (73) (10) (3) (26) (66) − (178)Amortization expense − (15) − (20) (5) − (40) Impairment of trade and
other receivables andother financial assets (4) (75) − (407) (7) − (493)
Change in otherprovisions for liabilitiesand charges (16) (11) (17) (12) (15) − (71)
Other (414) (307) (500) (662) (304) 656 (1,531)Gains less losses on
disposals of property,plant and equipment 47 (3) (2) (7) (69) − (34)
Finance cost (75) (218) (23) (156) (449) 80 (841)Social expenses (9) (6) (3) (7) (123) − (148)Share of result of joint
ventures (55) 752 34 5 31 − 767Share of result of
associates − − − 190 19 − 209Income tax expense (237) (14) (182) (5) (148) − (586)Net profit/(loss) for the
year 749 781 557 (67) (1,099) (571) 350
(*) These numbers include unallocated revenues and expenses related to research and development, IT, security and other functionsthat are not managed at the group level.
(**) Inter-segment revenues and expenses are eliminated on consolidation. Amounts shown as eliminations include intercompanytransactions.
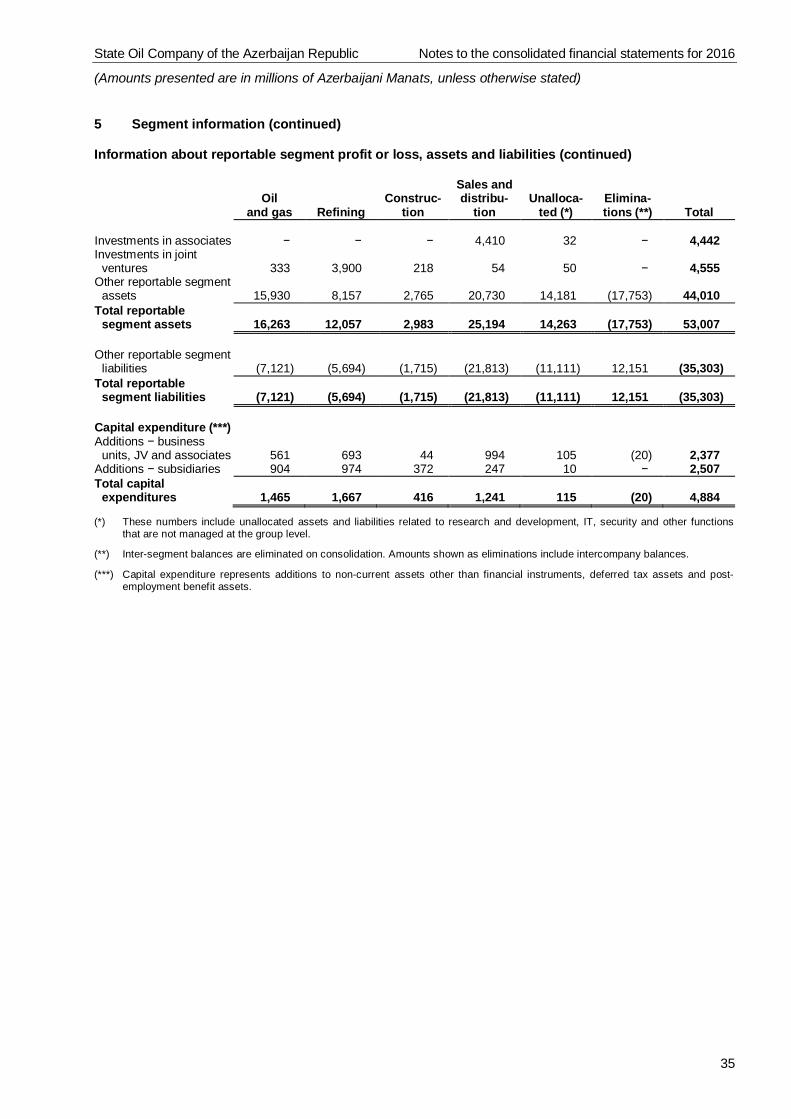
State Oil Company of the Azerbaijan Republic Notes to the consolidated financial statements for 2016
(Amounts presented are in millions of Azerbaijani Manats, unless otherwise stated)
35
5 Segment information (continued)
Information about reportable segment profit or loss, assets and liabilities (continued)
Oiland gas Refining
Construc-tion
Sales anddistribu-
tionUnalloca-
ted (*)Elimina-tions (**) Total
Investments in associates − − − 4,410 32 − 4,442Investments in joint
ventures 333 3,900 218 54 50 − 4,555Other reportable segment
assets 15,930 8,157 2,765 20,730 14,181 (17,753) 44,010Total reportable
segment assets 16,263 12,057 2,983 25,194 14,263 (17,753) 53,007
Other reportable segmentliabilities (7,121) (5,694) (1,715) (21,813) (11,111) 12,151 (35,303)
Total reportablesegment liabilities (7,121) (5,694) (1,715) (21,813) (11,111) 12,151 (35,303)
Capital expenditure (***)Additions − business
units, JV and associates 561 693 44 994 105 (20) 2,377Additions − subsidiaries 904 974 372 247 10 − 2,507Total capital
expenditures 1,465 1,667 416 1,241 115 (20) 4,884
(*) These numbers include unallocated assets and liabilities related to research and development, IT, security and other functionsthat are not managed at the group level.
(**) Inter-segment balances are eliminated on consolidation. Amounts shown as eliminations include intercompany balances.
(***) Capital expenditure represents additions to non-current assets other than financial instruments, deferred tax assets and post-employment benefit assets.
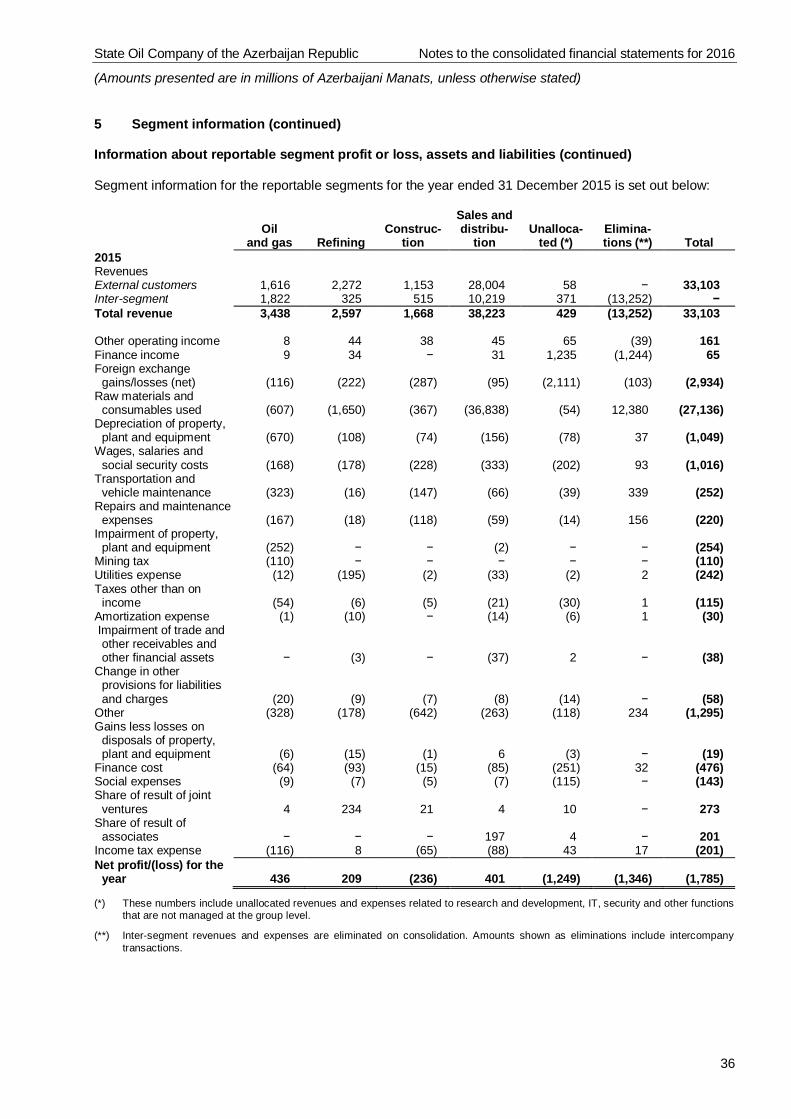
State Oil Company of the Azerbaijan Republic Notes to the consolidated financial statements for 2016
(Amounts presented are in millions of Azerbaijani Manats, unless otherwise stated)
36
5 Segment information (continued)
Information about reportable segment profit or loss, assets and liabilities (continued)
Segment information for the reportable segments for the year ended 31 December 2015 is set out below:
Oiland gas Refining
Construc-tion
Sales anddistribu-
tionUnalloca-
ted (*)Elimina-tions (**) Total
2015RevenuesExternal customers 1,616 2,272 1,153 28,004 58 − 33,103Inter-segment 1,822 325 515 10,219 371 (13,252) −Total revenue 3,438 2,597 1,668 38,223 429 (13,252) 33,103
Other operating income 8 44 38 45 65 (39) 161Finance income 9 34 − 31 1,235 (1,244) 65Foreign exchange
gains/losses (net) (116) (222) (287) (95) (2,111) (103) (2,934)Raw materials and
consumables used (607) (1,650) (367) (36,838) (54) 12,380 (27,136)Depreciation of property,
plant and equipment (670) (108) (74) (156) (78) 37 (1,049)Wages, salaries and
social security costs (168) (178) (228) (333) (202) 93 (1,016)Transportation and
vehicle maintenance (323) (16) (147) (66) (39) 339 (252)Repairs and maintenance
expenses (167) (18) (118) (59) (14) 156 (220)Impairment of property,
plant and equipment (252) − − (2) − − (254)Mining tax (110) − − − − − (110)Utilities expense (12) (195) (2) (33) (2) 2 (242)Taxes other than on
income (54) (6) (5) (21) (30) 1 (115)Amortization expense (1) (10) − (14) (6) 1 (30) Impairment of trade and
other receivables andother financial assets − (3) − (37) 2 − (38)
Change in otherprovisions for liabilitiesand charges (20) (9) (7) (8) (14) − (58)
Other (328) (178) (642) (263) (118) 234 (1,295)Gains less losses on
disposals of property,plant and equipment (6) (15) (1) 6 (3) − (19)
Finance cost (64) (93) (15) (85) (251) 32 (476)Social expenses (9) (7) (5) (7) (115) − (143)Share of result of joint
ventures 4 234 21 4 10 − 273Share of result of
associates − − − 197 4 − 201Income tax expense (116) 8 (65) (88) 43 17 (201)Net profit/(loss) for the
year 436 209 (236) 401 (1,249) (1,346) (1,785)
(*) These numbers include unallocated revenues and expenses related to research and development, IT, security and other functionsthat are not managed at the group level.
(**) Inter-segment revenues and expenses are eliminated on consolidation. Amounts shown as eliminations include intercompanytransactions.
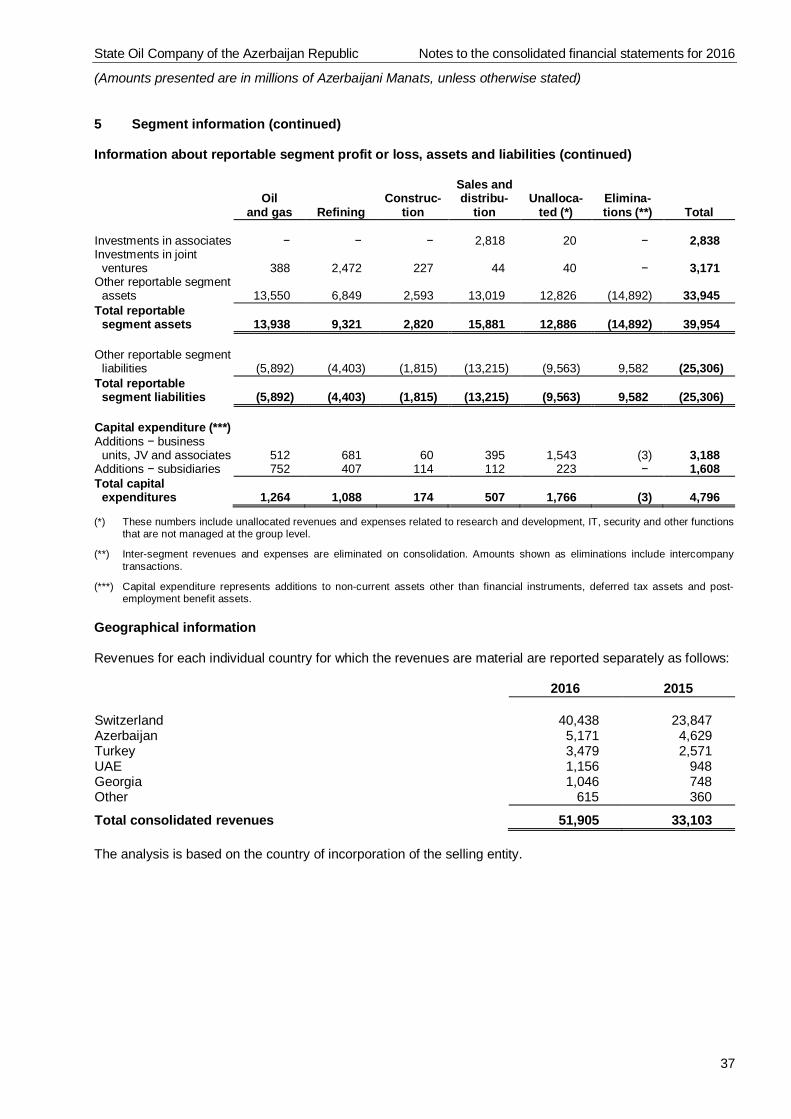
State Oil Company of the Azerbaijan Republic Notes to the consolidated financial statements for 2016
(Amounts presented are in millions of Azerbaijani Manats, unless otherwise stated)
37
5 Segment information (continued)
Information about reportable segment profit or loss, assets and liabilities (continued)
Oiland gas Refining
Construc-tion
Sales anddistribu-
tionUnalloca-
ted (*)Elimina-tions (**) Total
Investments in associates − − − 2,818 20 − 2,838Investments in joint
ventures 388 2,472 227 44 40 − 3,171Other reportable segment
assets 13,550 6,849 2,593 13,019 12,826 (14,892) 33,945Total reportable
segment assets 13,938 9,321 2,820 15,881 12,886 (14,892) 39,954
Other reportable segmentliabilities (5,892) (4,403) (1,815) (13,215) (9,563) 9,582 (25,306)
Total reportablesegment liabilities (5,892) (4,403) (1,815) (13,215) (9,563) 9,582 (25,306)
Capital expenditure (***)Additions − business
units, JV and associates 512 681 60 395 1,543 (3) 3,188Additions − subsidiaries 752 407 114 112 223 − 1,608Total capital
expenditures 1,264 1,088 174 507 1,766 (3) 4,796
(*) These numbers include unallocated revenues and expenses related to research and development, IT, security and other functionsthat are not managed at the group level.
(**) Inter-segment revenues and expenses are eliminated on consolidation. Amounts shown as eliminations include intercompanytransactions.
(***) Capital expenditure represents additions to non-current assets other than financial instruments, deferred tax assets and post-employment benefit assets.
Geographical information
Revenues for each individual country for which the revenues are material are reported separately as follows:
2016 2015
Switzerland 40,438 23,847Azerbaijan 5,171 4,629Turkey 3,479 2,571UAE 1,156 948Georgia 1,046 748Other 615 360
Total consolidated revenues 51,905 33,103
The analysis is based on the country of incorporation of the selling entity.
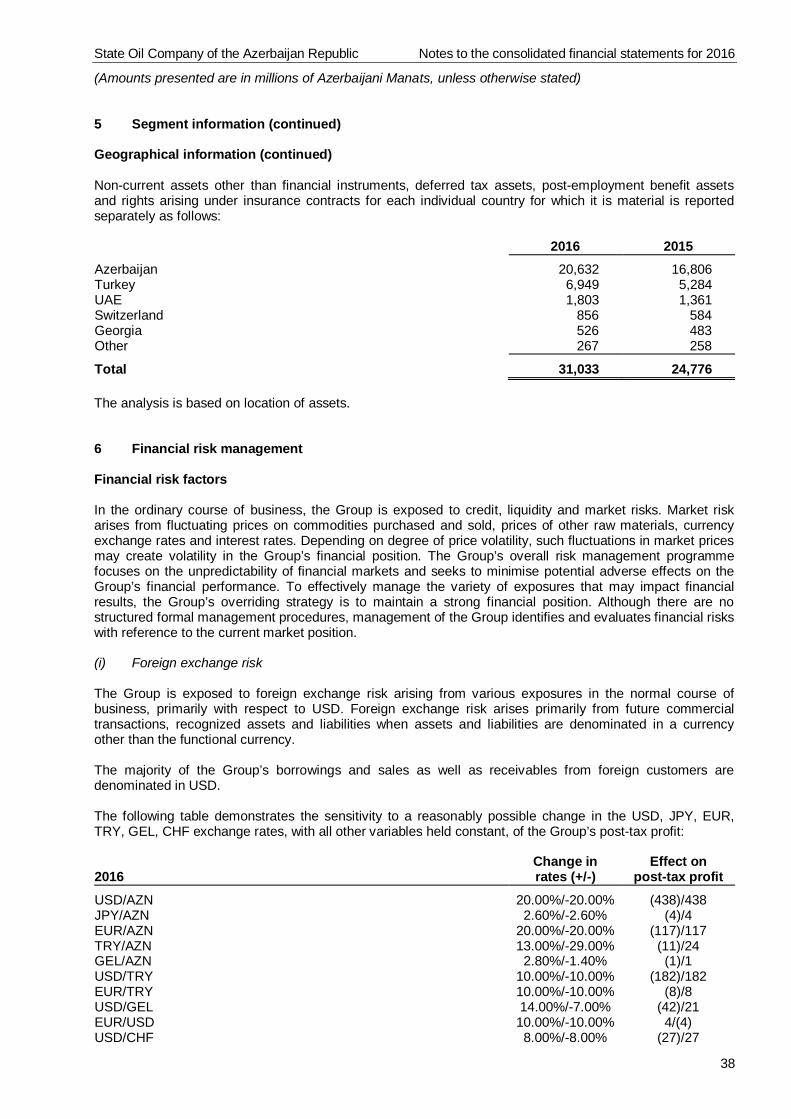
State Oil Company of the Azerbaijan Republic Notes to the consolidated financial statements for 2016
(Amounts presented are in millions of Azerbaijani Manats, unless otherwise stated)
38
5 Segment information (continued)
Geographical information (continued)
Non-current assets other than financial instruments, deferred tax assets, post-employment benefit assetsand rights arising under insurance contracts for each individual country for which it is material is reportedseparately as follows:
2016 2015Azerbaijan 20,632 16,806Turkey 6,949 5,284UAE 1,803 1,361Switzerland 856 584Georgia 526 483Other 267 258
Total 31,033 24,776
The analysis is based on location of assets.
6 Financial risk management
Financial risk factors
In the ordinary course of business, the Group is exposed to credit, liquidity and market risks. Market riskarises from fluctuating prices on commodities purchased and sold, prices of other raw materials, currencyexchange rates and interest rates. Depending on degree of price volatility, such fluctuations in market pricesmay create volatility in the Group’s financial position. The Group’s overall risk management programmefocuses on the unpredictability of financial markets and seeks to minimise potential adverse effects on theGroup’s financial performance. To effectively manage the variety of exposures that may impact financialresults, the Group’s overriding strategy is to maintain a strong financial position. Although there are nostructured formal management procedures, management of the Group identifies and evaluates financial riskswith reference to the current market position.
(i) Foreign exchange risk
The Group is exposed to foreign exchange risk arising from various exposures in the normal course ofbusiness, primarily with respect to USD. Foreign exchange risk arises primarily from future commercialtransactions, recognized assets and liabilities when assets and liabilities are denominated in a currencyother than the functional currency.
The majority of the Group’s borrowings and sales as well as receivables from foreign customers aredenominated in USD.
The following table demonstrates the sensitivity to a reasonably possible change in the USD, JPY, EUR,TRY, GEL, CHF exchange rates, with all other variables held constant, of the Group’s post-tax profit:
2016Change inrates (+/-)
Effect onpost-tax profit
USD/AZN 20.00%/-20.00% (438)/438JPY/AZN 2.60%/-2.60% (4)/4EUR/AZN 20.00%/-20.00% (117)/117TRY/AZN 13.00%/-29.00% (11)/24GEL/AZN 2.80%/-1.40% (1)/1USD/TRY 10.00%/-10.00% (182)/182EUR/TRY 10.00%/-10.00% (8)/8USD/GEL 14.00%/-7.00% (42)/21EUR/USD 10.00%/-10.00% 4/(4)USD/CHF 8.00%/-8.00% (27)/27
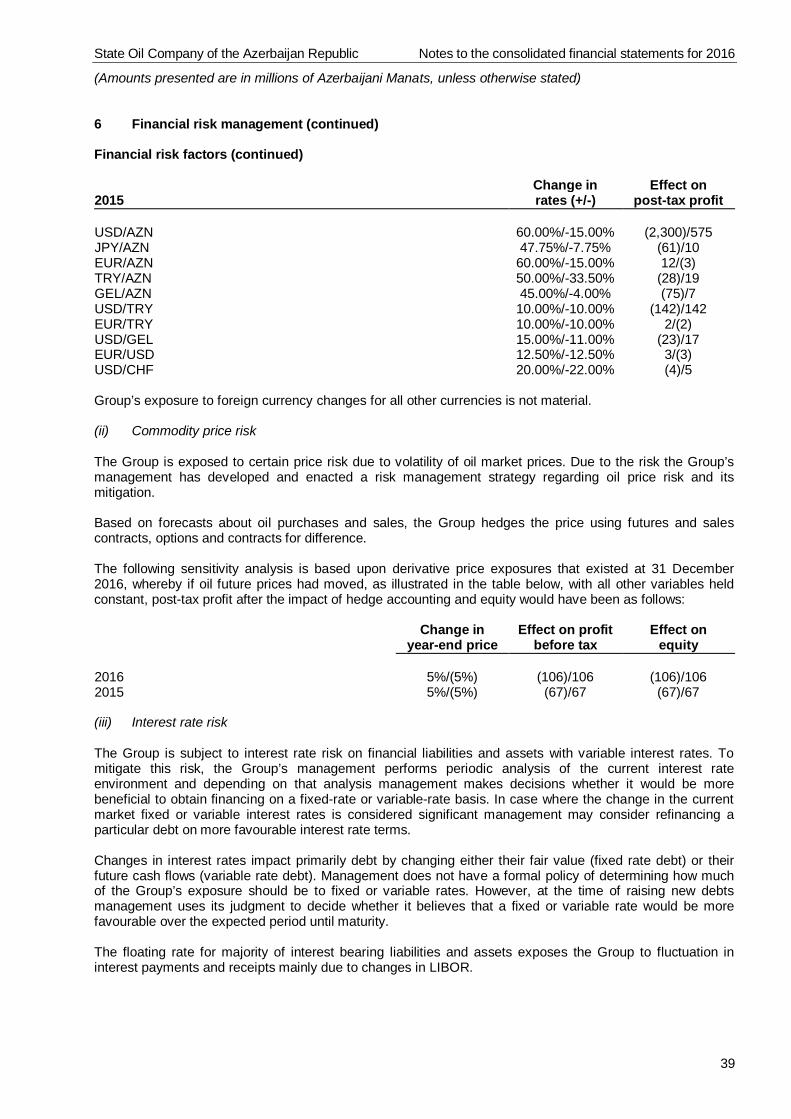
State Oil Company of the Azerbaijan Republic Notes to the consolidated financial statements for 2016
(Amounts presented are in millions of Azerbaijani Manats, unless otherwise stated)
39
6 Financial risk management (continued)
Financial risk factors (continued)
2015Change inrates (+/-)
Effect onpost-tax profit
USD/AZN 60.00%/-15.00% (2,300)/575JPY/AZN 47.75%/-7.75% (61)/10EUR/AZN 60.00%/-15.00% 12/(3)TRY/AZN 50.00%/-33.50% (28)/19GEL/AZN 45.00%/-4.00% (75)/7USD/TRY 10.00%/-10.00% (142)/142EUR/TRY 10.00%/-10.00% 2/(2)USD/GEL 15.00%/-11.00% (23)/17EUR/USD 12.50%/-12.50% 3/(3)USD/CHF 20.00%/-22.00% (4)/5
Group’s exposure to foreign currency changes for all other currencies is not material.
(ii) Commodity price risk
The Group is exposed to certain price risk due to volatility of oil market prices. Due to the risk the Group’smanagement has developed and enacted a risk management strategy regarding oil price risk and itsmitigation.
Based on forecasts about oil purchases and sales, the Group hedges the price using futures and salescontracts, options and contracts for difference.
The following sensitivity analysis is based upon derivative price exposures that existed at 31 December2016, whereby if oil future prices had moved, as illustrated in the table below, with all other variables heldconstant, post-tax profit after the impact of hedge accounting and equity would have been as follows:
Change inyear-end price
Effect on profitbefore tax
Effect onequity
2016 5%/(5%) (106)/106 (106)/1062015 5%/(5%) (67)/67 (67)/67
(iii) Interest rate risk
The Group is subject to interest rate risk on financial liabilities and assets with variable interest rates. Tomitigate this risk, the Group’s management performs periodic analysis of the current interest rateenvironment and depending on that analysis management makes decisions whether it would be morebeneficial to obtain financing on a fixed-rate or variable-rate basis. In case where the change in the currentmarket fixed or variable interest rates is considered significant management may consider refinancing aparticular debt on more favourable interest rate terms.
Changes in interest rates impact primarily debt by changing either their fair value (fixed rate debt) or theirfuture cash flows (variable rate debt). Management does not have a formal policy of determining how muchof the Group’s exposure should be to fixed or variable rates. However, at the time of raising new debtsmanagement uses its judgment to decide whether it believes that a fixed or variable rate would be morefavourable over the expected period until maturity.
The floating rate for majority of interest bearing liabilities and assets exposes the Group to fluctuation ininterest payments and receipts mainly due to changes in LIBOR.
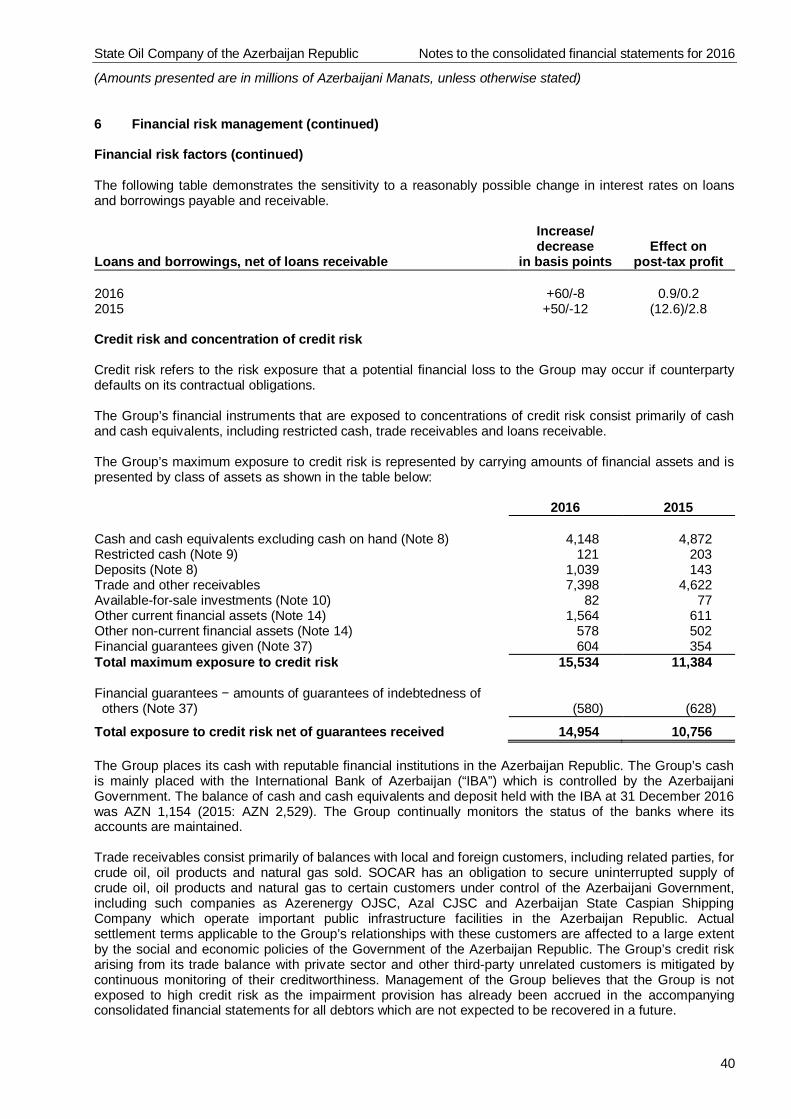
State Oil Company of the Azerbaijan Republic Notes to the consolidated financial statements for 2016
(Amounts presented are in millions of Azerbaijani Manats, unless otherwise stated)
40
6 Financial risk management (continued)
Financial risk factors (continued)
The following table demonstrates the sensitivity to a reasonably possible change in interest rates on loansand borrowings payable and receivable.
Loans and borrowings, net of loans receivable
Increase/decrease
in basis pointsEffect on
post-tax profit
2016 +60/-8 0.9/0.22015 +50/-12 (12.6)/2.8
Credit risk and concentration of credit risk
Credit risk refers to the risk exposure that a potential financial loss to the Group may occur if counterpartydefaults on its contractual obligations.
The Group’s financial instruments that are exposed to concentrations of credit risk consist primarily of cashand cash equivalents, including restricted cash, trade receivables and loans receivable.
The Group’s maximum exposure to credit risk is represented by carrying amounts of financial assets and ispresented by class of assets as shown in the table below:
2016 2015
Cash and cash equivalents excluding cash on hand (Note 8) 4,148 4,872Restricted cash (Note 9) 121 203Deposits (Note 8) 1,039 143Trade and other receivables 7,398 4,622Available-for-sale investments (Note 10) 82 77Other current financial assets (Note 14) 1,564 611Other non-current financial assets (Note 14) 578 502Financial guarantees given (Note 37) 604 354Total maximum exposure to credit risk 15,534 11,384
Financial guarantees − amounts of guarantees of indebtedness ofothers (Note 37) (580) (628)
Total exposure to credit risk net of guarantees received 14,954 10,756
The Group places its cash with reputable financial institutions in the Azerbaijan Republic. The Group’s cashis mainly placed with the International Bank of Azerbaijan (“IBA”) which is controlled by the AzerbaijaniGovernment. The balance of cash and cash equivalents and deposit held with the IBA at 31 December 2016was AZN 1,154 (2015: AZN 2,529). The Group continually monitors the status of the banks where itsaccounts are maintained.
Trade receivables consist primarily of balances with local and foreign customers, including related parties, forcrude oil, oil products and natural gas sold. SOCAR has an obligation to secure uninterrupted supply ofcrude oil, oil products and natural gas to certain customers under control of the Azerbaijani Government,including such companies as Azerenergy OJSC, Azal CJSC and Azerbaijan State Caspian ShippingCompany which operate important public infrastructure facilities in the Azerbaijan Republic. Actualsettlement terms applicable to the Group’s relationships with these customers are affected to a large extentby the social and economic policies of the Government of the Azerbaijan Republic. The Group’s credit riskarising from its trade balance with private sector and other third-party unrelated customers is mitigated bycontinuous monitoring of their creditworthiness. Management of the Group believes that the Group is notexposed to high credit risk as the impairment provision has already been accrued in the accompanyingconsolidated financial statements for all debtors which are not expected to be recovered in a future.
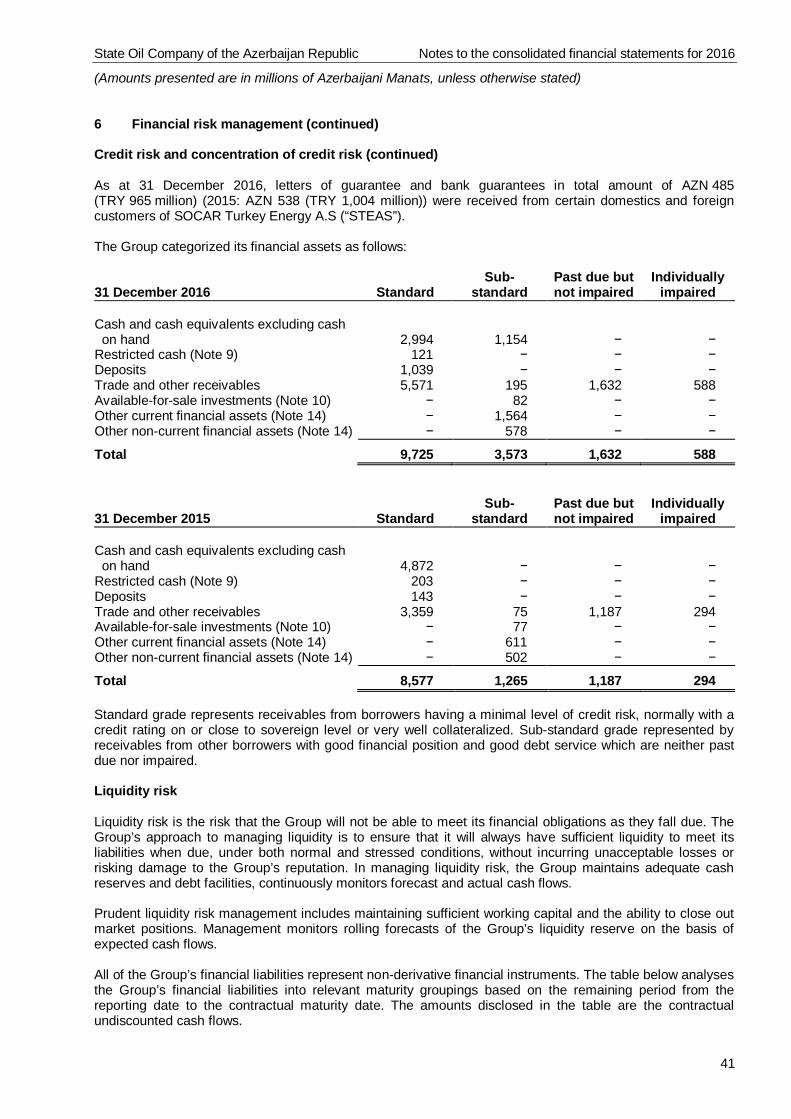
State Oil Company of the Azerbaijan Republic Notes to the consolidated financial statements for 2016
(Amounts presented are in millions of Azerbaijani Manats, unless otherwise stated)
41
6 Financial risk management (continued)
Credit risk and concentration of credit risk (continued)
As at 31 December 2016, letters of guarantee and bank guarantees in total amount of AZN 485(TRY 965 million) (2015: AZN 538 (TRY 1,004 million)) were received from certain domestics and foreigncustomers of SOCAR Turkey Energy A.S (“STEAS”).
The Group categorized its financial assets as follows:
31 December 2016 StandardSub-
standardPast due butnot impaired
Individuallyimpaired
Cash and cash equivalents excluding cashon hand 2,994 1,154 − −
Restricted cash (Note 9) 121 − − −Deposits 1,039 − − −Trade and other receivables 5,571 195 1,632 588Available-for-sale investments (Note 10) − 82 − −Other current financial assets (Note 14) − 1,564 − −Other non-current financial assets (Note 14) − 578 − −
Total 9,725 3,573 1,632 588
31 December 2015 StandardSub-
standardPast due butnot impaired
Individuallyimpaired
Cash and cash equivalents excluding cashon hand 4,872 − − −
Restricted cash (Note 9) 203 − − −Deposits 143 − − −Trade and other receivables 3,359 75 1,187 294Available-for-sale investments (Note 10) − 77 − −Other current financial assets (Note 14) − 611 − −Other non-current financial assets (Note 14) − 502 − −
Total 8,577 1,265 1,187 294
Standard grade represents receivables from borrowers having a minimal level of credit risk, normally with acredit rating on or close to sovereign level or very well collateralized. Sub-standard grade represented byreceivables from other borrowers with good financial position and good debt service which are neither pastdue nor impaired.
Liquidity risk
Liquidity risk is the risk that the Group will not be able to meet its financial obligations as they fall due. TheGroup’s approach to managing liquidity is to ensure that it will always have sufficient liquidity to meet itsliabilities when due, under both normal and stressed conditions, without incurring unacceptable losses orrisking damage to the Group’s reputation. In managing liquidity risk, the Group maintains adequate cashreserves and debt facilities, continuously monitors forecast and actual cash flows.
Prudent liquidity risk management includes maintaining sufficient working capital and the ability to close outmarket positions. Management monitors rolling forecasts of the Group’s liquidity reserve on the basis ofexpected cash flows.
All of the Group’s financial liabilities represent non-derivative financial instruments. The table below analysesthe Group’s financial liabilities into relevant maturity groupings based on the remaining period from thereporting date to the contractual maturity date. The amounts disclosed in the table are the contractualundiscounted cash flows.
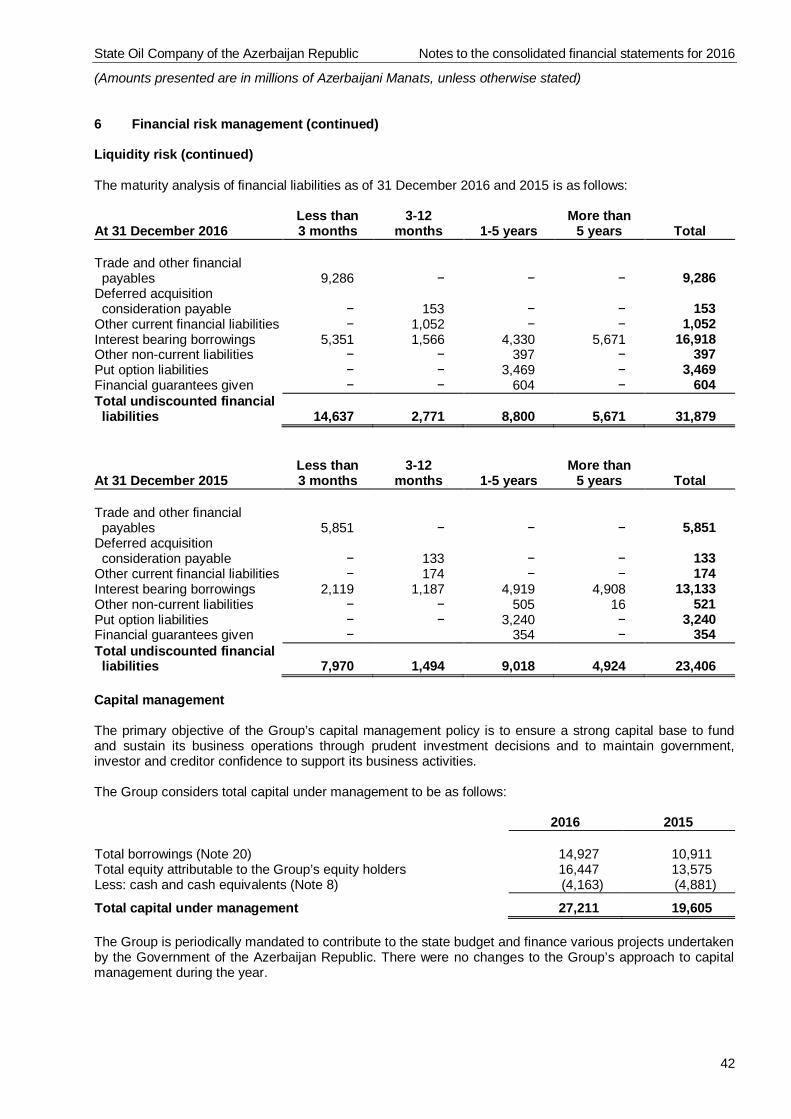
State Oil Company of the Azerbaijan Republic Notes to the consolidated financial statements for 2016
(Amounts presented are in millions of Azerbaijani Manats, unless otherwise stated)
42
6 Financial risk management (continued)
Liquidity risk (continued)
The maturity analysis of financial liabilities as of 31 December 2016 and 2015 is as follows:
At 31 December 2016Less than3 months
3-12months 1-5 years
More than5 years Total
Trade and other financialpayables 9,286 − − − 9,286
Deferred acquisitionconsideration payable − 153 − − 153
Other current financial liabilities − 1,052 − − 1,052Interest bearing borrowings 5,351 1,566 4,330 5,671 16,918Other non-current liabilities − − 397 − 397Put option liabilities − − 3,469 − 3,469Financial guarantees given − − 604 − 604Total undiscounted financialliabilities 14,637 2,771 8,800 5,671 31,879
At 31 December 2015Less than3 months
3-12months 1-5 years
More than5 years Total
Trade and other financialpayables 5,851 − − − 5,851
Deferred acquisitionconsideration payable − 133 − − 133
Other current financial liabilities − 174 − − 174Interest bearing borrowings 2,119 1,187 4,919 4,908 13,133Other non-current liabilities − − 505 16 521Put option liabilities − − 3,240 − 3,240Financial guarantees given − 354 − 354Total undiscounted financialliabilities 7,970 1,494 9,018 4,924 23,406
Capital management
The primary objective of the Group’s capital management policy is to ensure a strong capital base to fundand sustain its business operations through prudent investment decisions and to maintain government,investor and creditor confidence to support its business activities.
The Group considers total capital under management to be as follows:
2016 2015
Total borrowings (Note 20) 14,927 10,911Total equity attributable to the Group’s equity holders 16,447 13,575Less: cash and cash equivalents (Note 8) (4,163) (4,881)
Total capital under management 27,211 19,605
The Group is periodically mandated to contribute to the state budget and finance various projects undertakenby the Government of the Azerbaijan Republic. There were no changes to the Group’s approach to capitalmanagement during the year.
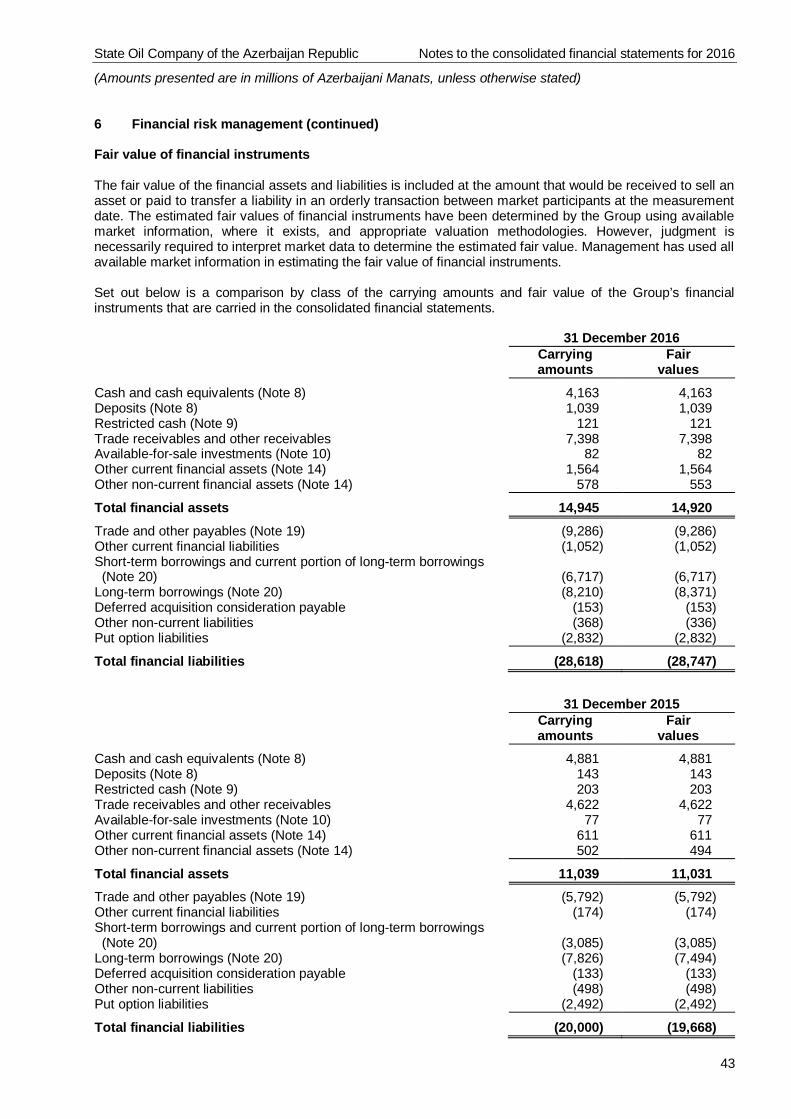
State Oil Company of the Azerbaijan Republic Notes to the consolidated financial statements for 2016
(Amounts presented are in millions of Azerbaijani Manats, unless otherwise stated)
43
6 Financial risk management (continued)
Fair value of financial instruments
The fair value of the financial assets and liabilities is included at the amount that would be received to sell anasset or paid to transfer a liability in an orderly transaction between market participants at the measurementdate. The estimated fair values of financial instruments have been determined by the Group using availablemarket information, where it exists, and appropriate valuation methodologies. However, judgment isnecessarily required to interpret market data to determine the estimated fair value. Management has used allavailable market information in estimating the fair value of financial instruments.
Set out below is a comparison by class of the carrying amounts and fair value of the Group’s financialinstruments that are carried in the consolidated financial statements.
31 December 2016Carryingamounts
Fairvalues
Cash and cash equivalents (Note 8) 4,163 4,163Deposits (Note 8) 1,039 1,039Restricted cash (Note 9) 121 121Trade receivables and other receivables 7,398 7,398Available-for-sale investments (Note 10) 82 82Other current financial assets (Note 14) 1,564 1,564Other non-current financial assets (Note 14) 578 553
Total financial assets 14,945 14,920Trade and other payables (Note 19) (9,286) (9,286)Other current financial liabilities (1,052) (1,052)Short-term borrowings and current portion of long-term borrowings(Note 20) (6,717) (6,717)
Long-term borrowings (Note 20) (8,210) (8,371)Deferred acquisition consideration payable (153) (153)Other non-current liabilities (368) (336)Put option liabilities (2,832) (2,832)
Total financial liabilities (28,618) (28,747)
31 December 2015Carryingamounts
Fairvalues
Cash and cash equivalents (Note 8) 4,881 4,881Deposits (Note 8) 143 143Restricted cash (Note 9) 203 203Trade receivables and other receivables 4,622 4,622Available-for-sale investments (Note 10) 77 77Other current financial assets (Note 14) 611 611Other non-current financial assets (Note 14) 502 494
Total financial assets 11,039 11,031Trade and other payables (Note 19) (5,792) (5,792)Other current financial liabilities (174) (174)Short-term borrowings and current portion of long-term borrowings(Note 20) (3,085) (3,085)
Long-term borrowings (Note 20) (7,826) (7,494)Deferred acquisition consideration payable (133) (133)Other non-current liabilities (498) (498)Put option liabilities (2,492) (2,492)
Total financial liabilities (20,000) (19,668)
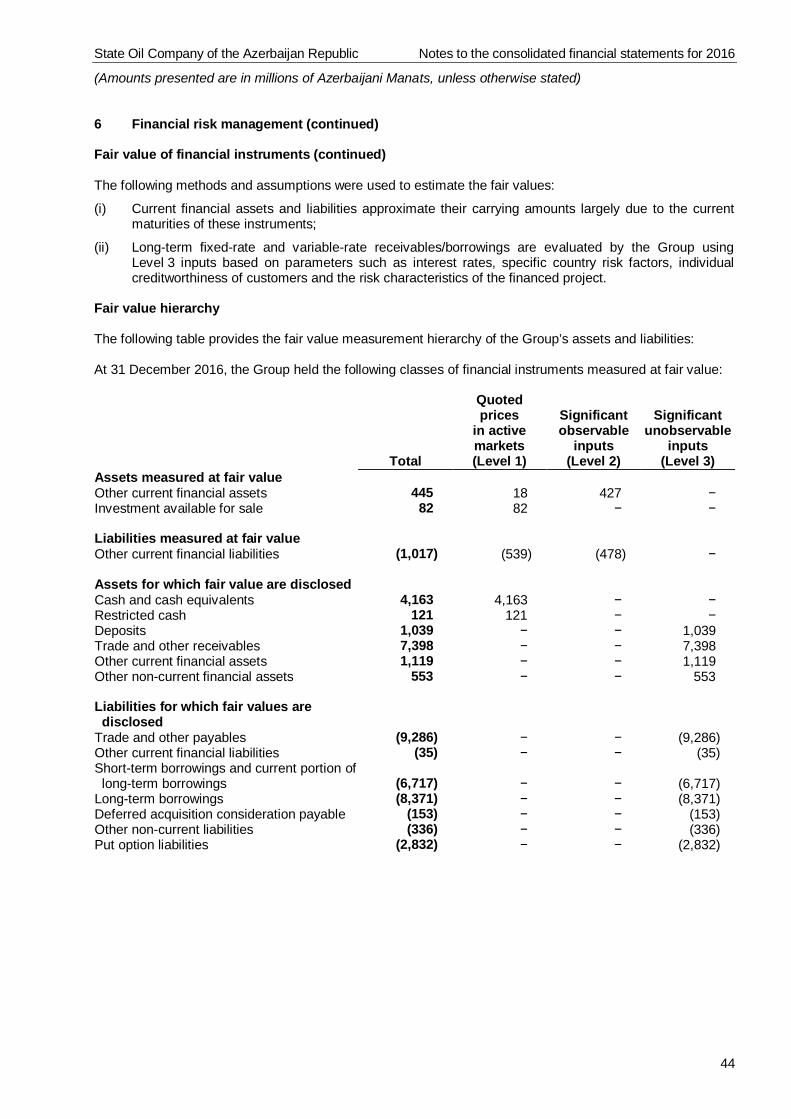
State Oil Company of the Azerbaijan Republic Notes to the consolidated financial statements for 2016
(Amounts presented are in millions of Azerbaijani Manats, unless otherwise stated)
44
6 Financial risk management (continued)
Fair value of financial instruments (continued)
The following methods and assumptions were used to estimate the fair values:
(i) Current financial assets and liabilities approximate their carrying amounts largely due to the currentmaturities of these instruments;
(ii) Long-term fixed-rate and variable-rate receivables/borrowings are evaluated by the Group usingLevel 3 inputs based on parameters such as interest rates, specific country risk factors, individualcreditworthiness of customers and the risk characteristics of the financed project.
Fair value hierarchy
The following table provides the fair value measurement hierarchy of the Group’s assets and liabilities:
At 31 December 2016, the Group held the following classes of financial instruments measured at fair value:
Total
Quotedprices
in activemarkets(Level 1)
Significantobservable
inputs(Level 2)
Significantunobservable
inputs(Level 3)
Assets measured at fair valueOther current financial assets 445 18 427 −Investment available for sale 82 82 − −
Liabilities measured at fair valueOther current financial liabilities (1,017) (539) (478) −
Assets for which fair value are disclosedCash and cash equivalents 4,163 4,163 − −Restricted cash 121 121 − −Deposits 1,039 − − 1,039Trade and other receivables 7,398 − − 7,398Other current financial assets 1,119 − − 1,119Other non-current financial assets 553 − − 553
Liabilities for which fair values aredisclosed
Trade and other payables (9,286) − − (9,286)Other current financial liabilities (35) − − (35)Short-term borrowings and current portion oflong-term borrowings (6,717) − − (6,717)
Long-term borrowings (8,371) − − (8,371)Deferred acquisition consideration payable (153) − − (153)Other non-current liabilities (336) − − (336)Put option liabilities (2,832) − − (2,832)
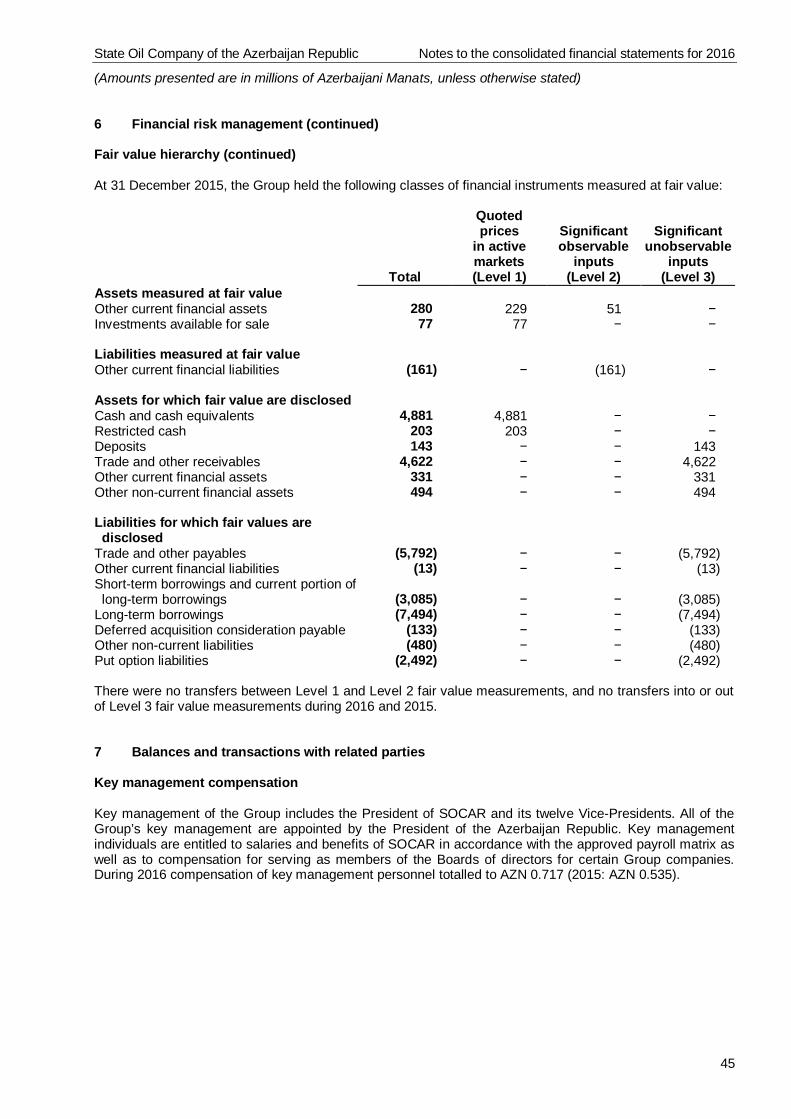
State Oil Company of the Azerbaijan Republic Notes to the consolidated financial statements for 2016
(Amounts presented are in millions of Azerbaijani Manats, unless otherwise stated)
45
6 Financial risk management (continued)
Fair value hierarchy (continued)
At 31 December 2015, the Group held the following classes of financial instruments measured at fair value:
Total
Quotedprices
in activemarkets(Level 1)
Significantobservable
inputs(Level 2)
Significantunobservable
inputs(Level 3)
Assets measured at fair valueOther current financial assets 280 229 51 −Investments available for sale 77 77 − −
Liabilities measured at fair valueOther current financial liabilities (161) − (161) −
Assets for which fair value are disclosedCash and cash equivalents 4,881 4,881 − −Restricted cash 203 203 − −Deposits 143 − − 143Trade and other receivables 4,622 − − 4,622Other current financial assets 331 − − 331Other non-current financial assets 494 − − 494
Liabilities for which fair values aredisclosed
Trade and other payables (5,792) − − (5,792)Other current financial liabilities (13) − − (13)Short-term borrowings and current portion oflong-term borrowings (3,085) − − (3,085)
Long-term borrowings (7,494) − − (7,494)Deferred acquisition consideration payable (133) − − (133)Other non-current liabilities (480) − − (480)Put option liabilities (2,492) − − (2,492)
There were no transfers between Level 1 and Level 2 fair value measurements, and no transfers into or outof Level 3 fair value measurements during 2016 and 2015.
7 Balances and transactions with related parties
Key management compensation
Key management of the Group includes the President of SOCAR and its twelve Vice-Presidents. All of theGroup’s key management are appointed by the President of the Azerbaijan Republic. Key managementindividuals are entitled to salaries and benefits of SOCAR in accordance with the approved payroll matrix aswell as to compensation for serving as members of the Boards of directors for certain Group companies.During 2016 compensation of key management personnel totalled to AZN 0.717 (2015: AZN 0.535).
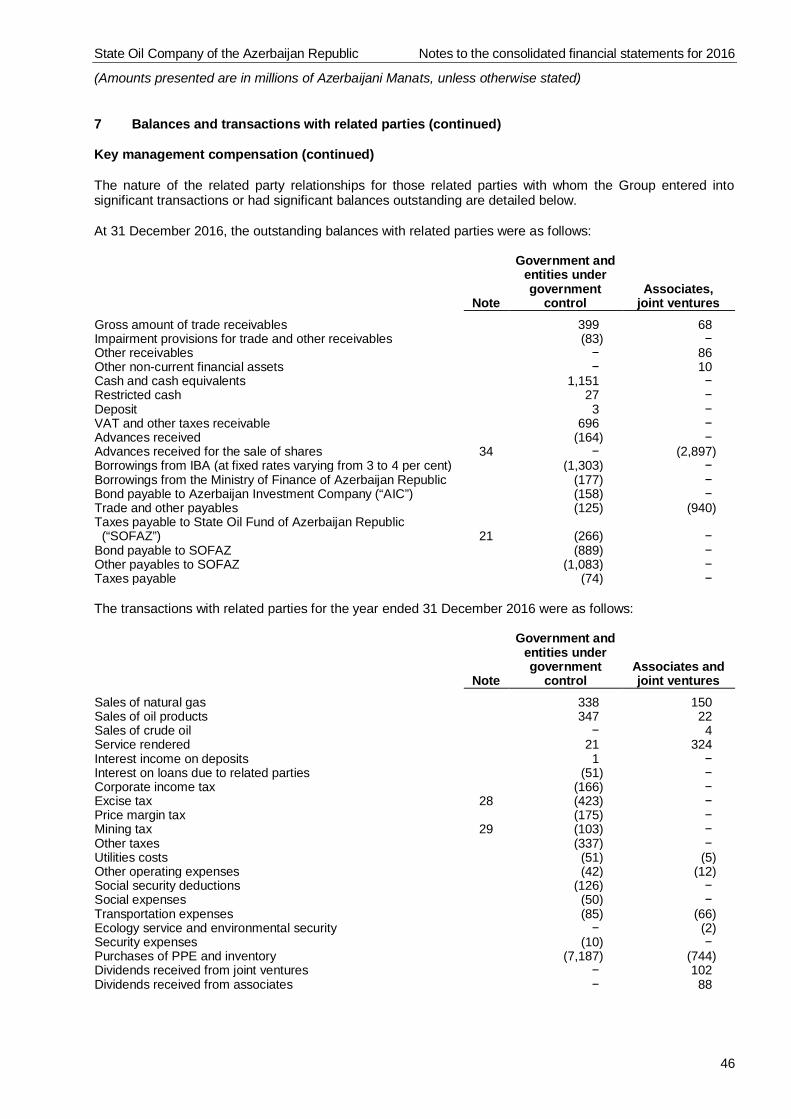
State Oil Company of the Azerbaijan Republic Notes to the consolidated financial statements for 2016
(Amounts presented are in millions of Azerbaijani Manats, unless otherwise stated)
46
7 Balances and transactions with related parties (continued)
Key management compensation (continued)
The nature of the related party relationships for those related parties with whom the Group entered intosignificant transactions or had significant balances outstanding are detailed below.
At 31 December 2016, the outstanding balances with related parties were as follows:
Note
Government andentities undergovernment
controlAssociates,
joint venturesGross amount of trade receivables 399 68Impairment provisions for trade and other receivables (83) −Other receivables − 86Other non-current financial assets − 10Cash and cash equivalents 1,151 −Restricted cash 27 −Deposit 3 −VAT and other taxes receivable 696 −Advances received (164) −Advances received for the sale of shares 34 − (2,897)Borrowings from IBA (at fixed rates varying from 3 to 4 per cent) (1,303) −Borrowings from the Ministry of Finance of Azerbaijan Republic (177) −Bond payable to Azerbaijan Investment Company (“AIC”) (158) −Trade and other payables (125) (940)Taxes payable to State Oil Fund of Azerbaijan Republic
(“SOFAZ”) 21 (266) −Bond payable to SOFAZ (889) −Other payables to SOFAZ (1,083) −Taxes payable (74) −
The transactions with related parties for the year ended 31 December 2016 were as follows:
Note
Government andentities undergovernment
controlAssociates andjoint ventures
Sales of natural gas 338 150Sales of oil products 347 22Sales of crude oil − 4Service rendered 21 324Interest income on deposits 1 −Interest on loans due to related parties (51) −Corporate income tax (166) −Excise tax 28 (423) −Price margin tax (175) −Mining tax 29 (103) −Other taxes (337) −Utilities costs (51) (5)Other operating expenses (42) (12)Social security deductions (126) −Social expenses (50) −Transportation expenses (85) (66)Ecology service and environmental security − (2)Security expenses (10) −Purchases of PPE and inventory (7,187) (744)Dividends received from joint ventures − 102Dividends received from associates − 88
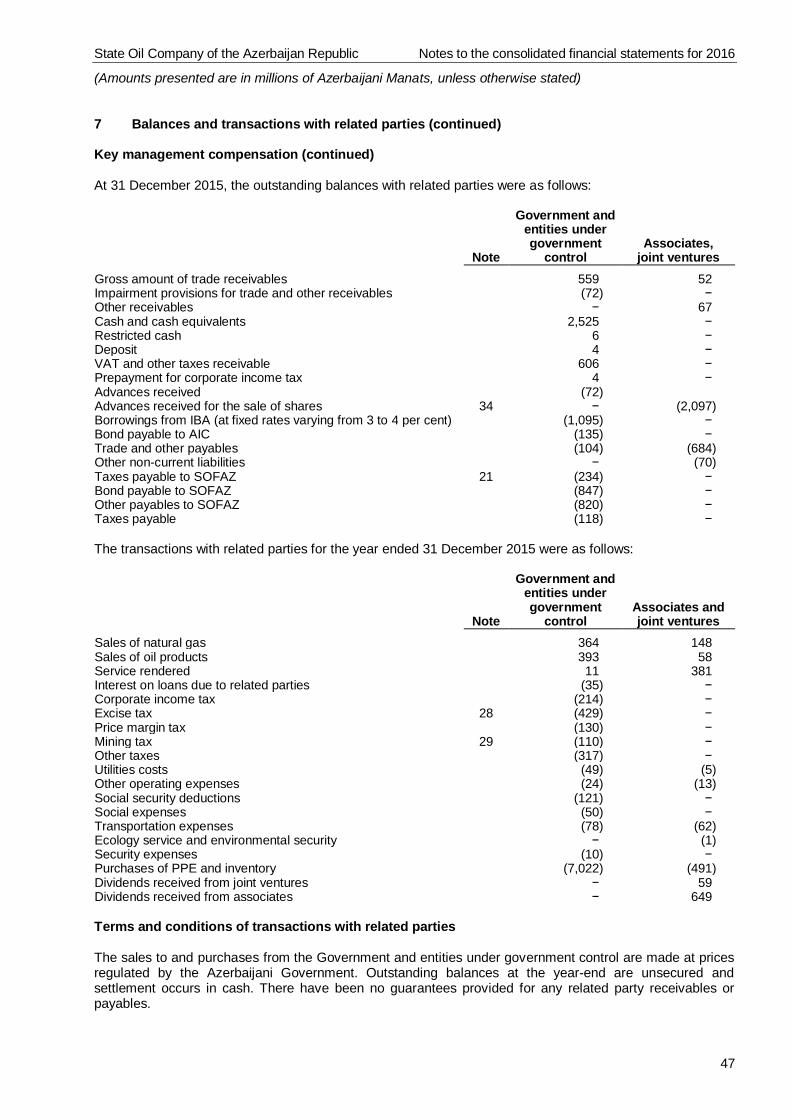
State Oil Company of the Azerbaijan Republic Notes to the consolidated financial statements for 2016
(Amounts presented are in millions of Azerbaijani Manats, unless otherwise stated)
47
7 Balances and transactions with related parties (continued)
Key management compensation (continued)
At 31 December 2015, the outstanding balances with related parties were as follows:
Note
Government andentities undergovernment
controlAssociates,
joint venturesGross amount of trade receivables 559 52Impairment provisions for trade and other receivables (72) −Other receivables − 67Cash and cash equivalents 2,525 −Restricted cash 6 −Deposit 4 −VAT and other taxes receivable 606 −Prepayment for corporate income tax 4 −Advances received (72)Advances received for the sale of shares 34 − (2,097)Borrowings from IBA (at fixed rates varying from 3 to 4 per cent) (1,095) −Bond payable to AIC (135) −Trade and other payables (104) (684)Other non-current liabilities − (70)Taxes payable to SOFAZ 21 (234) −Bond payable to SOFAZ (847) −Other payables to SOFAZ (820) −Taxes payable (118) −
The transactions with related parties for the year ended 31 December 2015 were as follows:
Note
Government andentities undergovernment
controlAssociates andjoint ventures
Sales of natural gas 364 148Sales of oil products 393 58Service rendered 11 381Interest on loans due to related parties (35) −Corporate income tax (214) −Excise tax 28 (429) −Price margin tax (130) −Mining tax 29 (110) −Other taxes (317) −Utilities costs (49) (5)Other operating expenses (24) (13)Social security deductions (121) −Social expenses (50) −Transportation expenses (78) (62)Ecology service and environmental security − (1)Security expenses (10) −Purchases of PPE and inventory (7,022) (491)Dividends received from joint ventures − 59Dividends received from associates − 649
Terms and conditions of transactions with related parties
The sales to and purchases from the Government and entities under government control are made at pricesregulated by the Azerbaijani Government. Outstanding balances at the year-end are unsecured andsettlement occurs in cash. There have been no guarantees provided for any related party receivables orpayables.
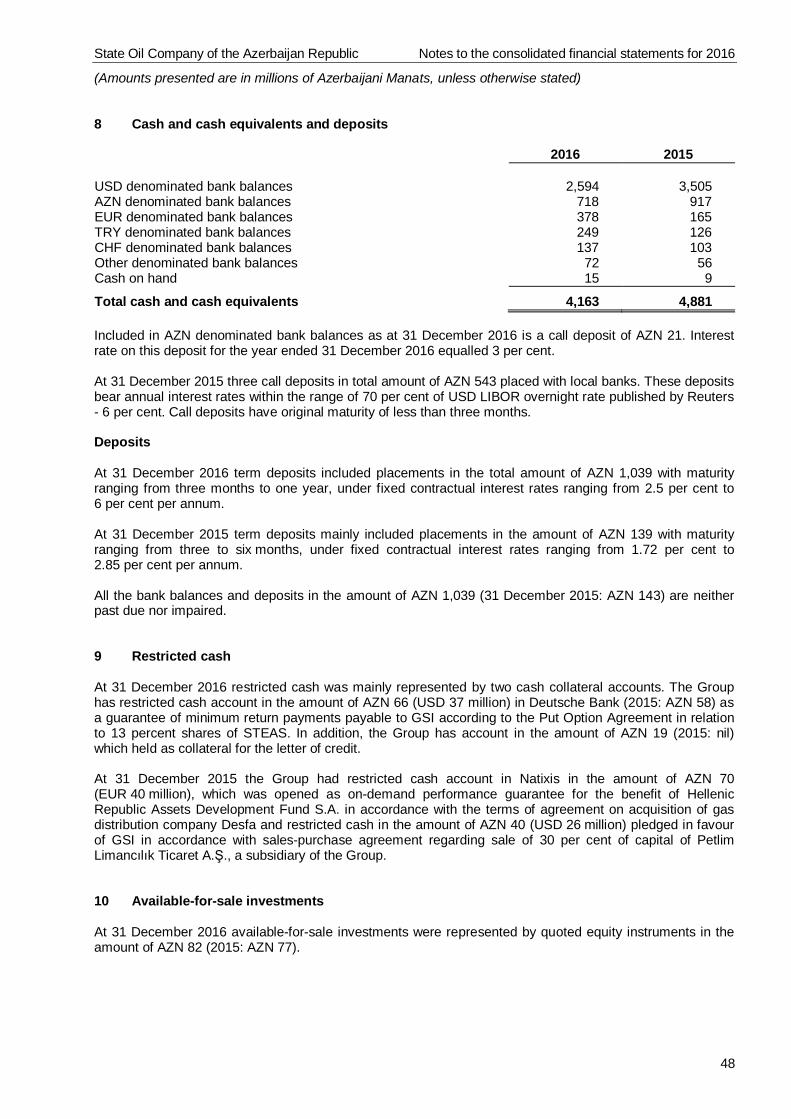
State Oil Company of the Azerbaijan Republic Notes to the consolidated financial statements for 2016
(Amounts presented are in millions of Azerbaijani Manats, unless otherwise stated)
48
8 Cash and cash equivalents and deposits
2016 2015
USD denominated bank balances 2,594 3,505AZN denominated bank balances 718 917EUR denominated bank balances 378 165TRY denominated bank balances 249 126CHF denominated bank balances 137 103Other denominated bank balances 72 56Cash on hand 15 9
Total cash and cash equivalents 4,163 4,881
Included in AZN denominated bank balances as at 31 December 2016 is a call deposit of AZN 21. Interestrate on this deposit for the year ended 31 December 2016 equalled 3 per cent.
At 31 December 2015 three call deposits in total amount of AZN 543 placed with local banks. These depositsbear annual interest rates within the range of 70 per cent of USD LIBOR overnight rate published by Reuters- 6 per cent. Call deposits have original maturity of less than three months.
Deposits
At 31 December 2016 term deposits included placements in the total amount of AZN 1,039 with maturityranging from three months to one year, under fixed contractual interest rates ranging from 2.5 per cent to6 per cent per annum.
At 31 December 2015 term deposits mainly included placements in the amount of AZN 139 with maturityranging from three to six months, under fixed contractual interest rates ranging from 1.72 per cent to2.85 per cent per annum.
All the bank balances and deposits in the amount of AZN 1,039 (31 December 2015: AZN 143) are neitherpast due nor impaired.
9 Restricted cash
At 31 December 2016 restricted cash was mainly represented by two cash collateral accounts. The Grouphas restricted cash account in the amount of AZN 66 (USD 37 million) in Deutsche Bank (2015: AZN 58) asa guarantee of minimum return payments payable to GSI according to the Put Option Agreement in relationto 13 percent shares of STEAS. In addition, the Group has account in the amount of AZN 19 (2015: nil)which held as collateral for the letter of credit.
At 31 December 2015 the Group had restricted cash account in Natixis in the amount of AZN 70(EUR 40 million), which was opened as on-demand performance guarantee for the benefit of HellenicRepublic Assets Development Fund S.A. in accordance with the terms of agreement on acquisition of gasdistribution company Desfa and restricted cash in the amount of AZN 40 (USD 26 million) pledged in favourof GSI in accordance with sales-purchase agreement regarding sale of 30 per cent of capital of PetlimLimancılık Ticaret A.Ş., a subsidiary of the Group.
10 Available-for-sale investments
At 31 December 2016 available-for-sale investments were represented by quoted equity instruments in theamount of AZN 82 (2015: AZN 77).
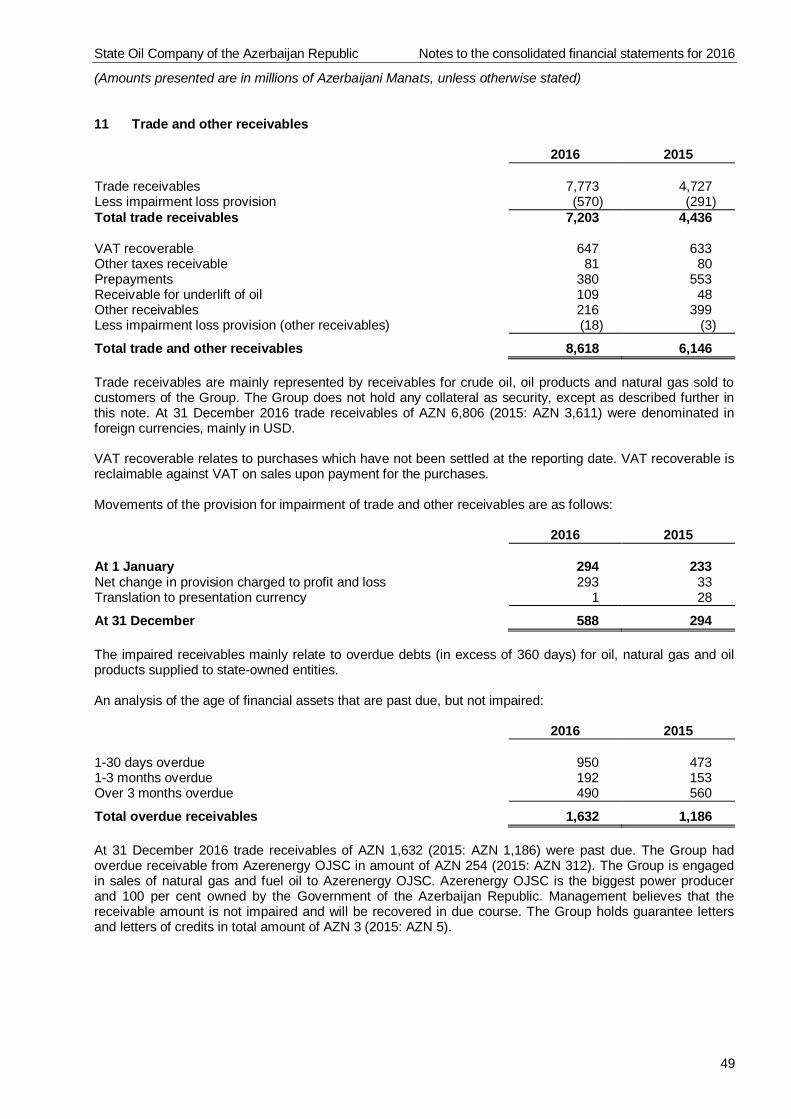
State Oil Company of the Azerbaijan Republic Notes to the consolidated financial statements for 2016
(Amounts presented are in millions of Azerbaijani Manats, unless otherwise stated)
49
11 Trade and other receivables
2016 2015
Trade receivables 7,773 4,727Less impairment loss provision (570) (291)Total trade receivables 7,203 4,436
VAT recoverable 647 633Other taxes receivable 81 80Prepayments 380 553Receivable for underlift of oil 109 48Other receivables 216 399Less impairment loss provision (other receivables) (18) (3)
Total trade and other receivables 8,618 6,146
Trade receivables are mainly represented by receivables for crude oil, oil products and natural gas sold tocustomers of the Group. The Group does not hold any collateral as security, except as described further inthis note. At 31 December 2016 trade receivables of AZN 6,806 (2015: AZN 3,611) were denominated inforeign currencies, mainly in USD.
VAT recoverable relates to purchases which have not been settled at the reporting date. VAT recoverable isreclaimable against VAT on sales upon payment for the purchases.
Movements of the provision for impairment of trade and other receivables are as follows:
2016 2015
At 1 January 294 233Net change in provision charged to profit and loss 293 33Translation to presentation currency 1 28
At 31 December 588 294
The impaired receivables mainly relate to overdue debts (in excess of 360 days) for oil, natural gas and oilproducts supplied to state-owned entities.
An analysis of the age of financial assets that are past due, but not impaired:
2016 2015
1-30 days overdue 950 4731-3 months overdue 192 153Over 3 months overdue 490 560
Total overdue receivables 1,632 1,186
At 31 December 2016 trade receivables of AZN 1,632 (2015: AZN 1,186) were past due. The Group hadoverdue receivable from Azerenergy OJSC in amount of AZN 254 (2015: AZN 312). The Group is engagedin sales of natural gas and fuel oil to Azerenergy OJSC. Azerenergy OJSC is the biggest power producerand 100 per cent owned by the Government of the Azerbaijan Republic. Management believes that thereceivable amount is not impaired and will be recovered in due course. The Group holds guarantee lettersand letters of credits in total amount of AZN 3 (2015: AZN 5).
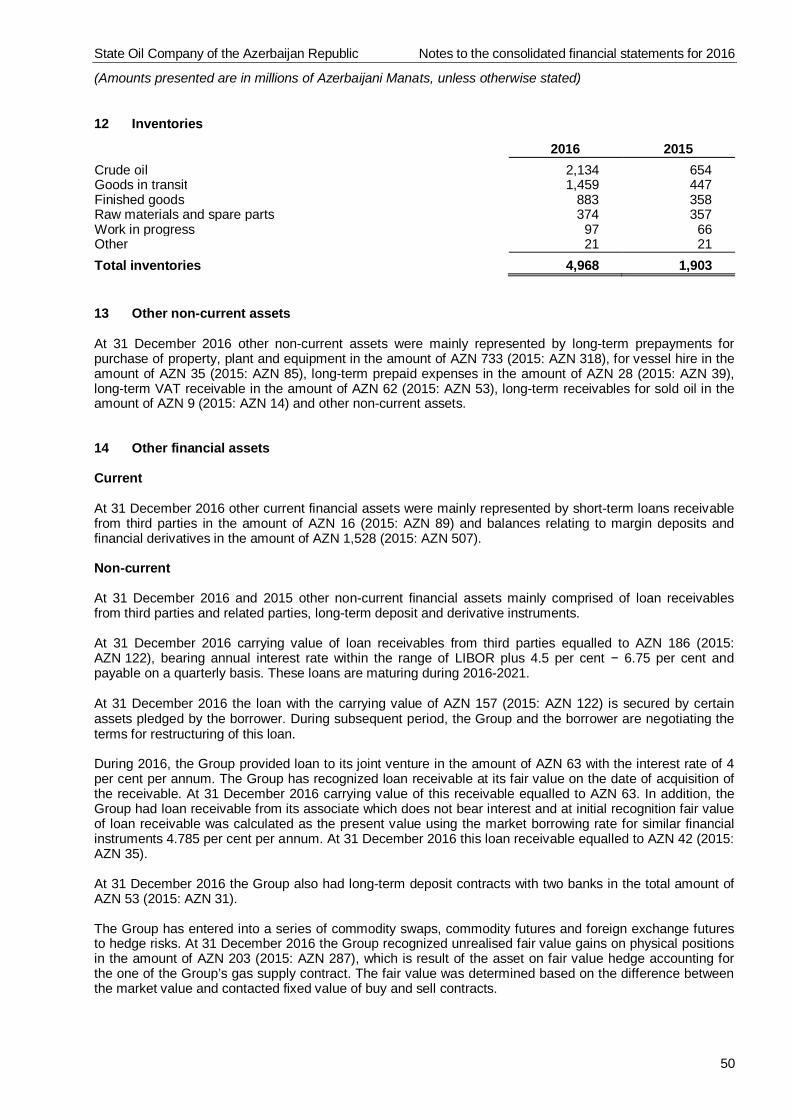
State Oil Company of the Azerbaijan Republic Notes to the consolidated financial statements for 2016
(Amounts presented are in millions of Azerbaijani Manats, unless otherwise stated)
50
12 Inventories
2016 2015Crude oil 2,134 654Goods in transit 1,459 447Finished goods 883 358Raw materials and spare parts 374 357Work in progress 97 66Other 21 21Total inventories 4,968 1,903
13 Other non-current assets
At 31 December 2016 other non-current assets were mainly represented by long-term prepayments forpurchase of property, plant and equipment in the amount of AZN 733 (2015: AZN 318), for vessel hire in theamount of AZN 35 (2015: AZN 85), long-term prepaid expenses in the amount of AZN 28 (2015: AZN 39),long-term VAT receivable in the amount of AZN 62 (2015: AZN 53), long-term receivables for sold oil in theamount of AZN 9 (2015: AZN 14) and other non-current assets.
14 Other financial assets
Current
At 31 December 2016 other current financial assets were mainly represented by short-term loans receivablefrom third parties in the amount of AZN 16 (2015: AZN 89) and balances relating to margin deposits andfinancial derivatives in the amount of AZN 1,528 (2015: AZN 507).
Non-current
At 31 December 2016 and 2015 other non-current financial assets mainly comprised of loan receivablesfrom third parties and related parties, long-term deposit and derivative instruments.
At 31 December 2016 carrying value of loan receivables from third parties equalled to AZN 186 (2015:AZN 122), bearing annual interest rate within the range of LIBOR plus 4.5 per cent − 6.75 per cent andpayable on a quarterly basis. These loans are maturing during 2016-2021.
At 31 December 2016 the loan with the carrying value of AZN 157 (2015: AZN 122) is secured by certainassets pledged by the borrower. During subsequent period, the Group and the borrower are negotiating theterms for restructuring of this loan.
During 2016, the Group provided loan to its joint venture in the amount of AZN 63 with the interest rate of 4per cent per annum. The Group has recognized loan receivable at its fair value on the date of acquisition ofthe receivable. At 31 December 2016 carrying value of this receivable equalled to AZN 63. In addition, theGroup had loan receivable from its associate which does not bear interest and at initial recognition fair valueof loan receivable was calculated as the present value using the market borrowing rate for similar financialinstruments 4.785 per cent per annum. At 31 December 2016 this loan receivable equalled to AZN 42 (2015:AZN 35).
At 31 December 2016 the Group also had long-term deposit contracts with two banks in the total amount ofAZN 53 (2015: AZN 31).
The Group has entered into a series of commodity swaps, commodity futures and foreign exchange futuresto hedge risks. At 31 December 2016 the Group recognized unrealised fair value gains on physical positionsin the amount of AZN 203 (2015: AZN 287), which is result of the asset on fair value hedge accounting forthe one of the Group’s gas supply contract. The fair value was determined based on the difference betweenthe market value and contacted fixed value of buy and sell contracts.
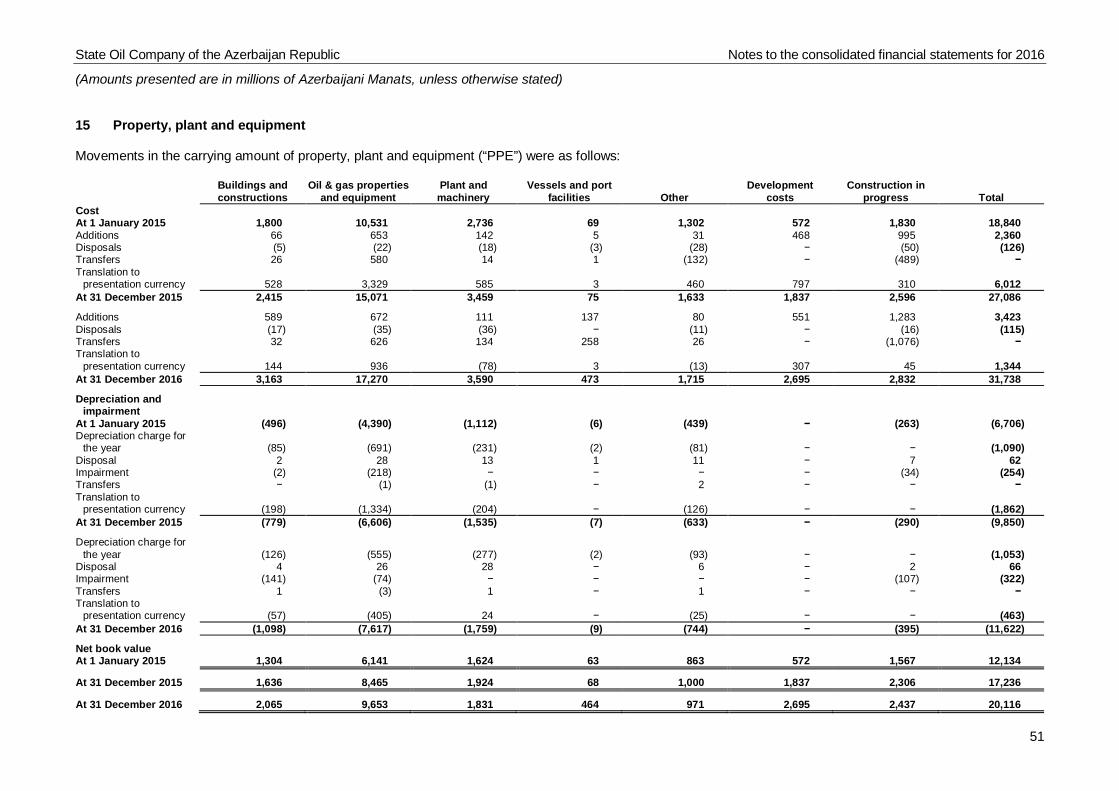
State Oil Company of the Azerbaijan Republic Notes to the consolidated financial statements for 2016
(Amounts presented are in millions of Azerbaijani Manats, unless otherwise stated)
51
15 Property, plant and equipment
Movements in the carrying amount of property, plant and equipment (“PPE”) were as follows:
Buildings andconstructions
Oil & gas propertiesand equipment
Plant andmachinery
Vessels and portfacilities Other
Developmentcosts
Construction inprogress Total
CostAt 1 January 2015 1,800 10,531 2,736 69 1,302 572 1,830 18,840Additions 66 653 142 5 31 468 995 2,360Disposals (5) (22) (18) (3) (28) − (50) (126)Transfers 26 580 14 1 (132) − (489) −Translation to
presentation currency 528 3,329 585 3 460 797 310 6,012At 31 December 2015 2,415 15,071 3,459 75 1,633 1,837 2,596 27,086
Additions 589 672 111 137 80 551 1,283 3,423Disposals (17) (35) (36) − (11) − (16) (115)Transfers 32 626 134 258 26 − (1,076) −Translation to
presentation currency 144 936 (78) 3 (13) 307 45 1,344At 31 December 2016 3,163 17,270 3,590 473 1,715 2,695 2,832 31,738
Depreciation andimpairment
At 1 January 2015 (496) (4,390) (1,112) (6) (439) − (263) (6,706)Depreciation charge for
the year (85) (691) (231) (2) (81) − − (1,090)Disposal 2 28 13 1 11 − 7 62Impairment (2) (218) − − − − (34) (254)Transfers − (1) (1) − 2 − − −Translation to
presentation currency (198) (1,334) (204) − (126) − − (1,862)At 31 December 2015 (779) (6,606) (1,535) (7) (633) − (290) (9,850)
Depreciation charge forthe year (126) (555) (277) (2) (93) − − (1,053)
Disposal 4 26 28 − 6 − 2 66Impairment (141) (74) − − − − (107) (322)Transfers 1 (3) 1 − 1 − − −Translation to
presentation currency (57) (405) 24 − (25) − − (463)At 31 December 2016 (1,098) (7,617) (1,759) (9) (744) − (395) (11,622)
Net book valueAt 1 January 2015 1,304 6,141 1,624 63 863 572 1,567 12,134
At 31 December 2015 1,636 8,465 1,924 68 1,000 1,837 2,306 17,236
At 31 December 2016 2,065 9,653 1,831 464 971 2,695 2,437 20,116
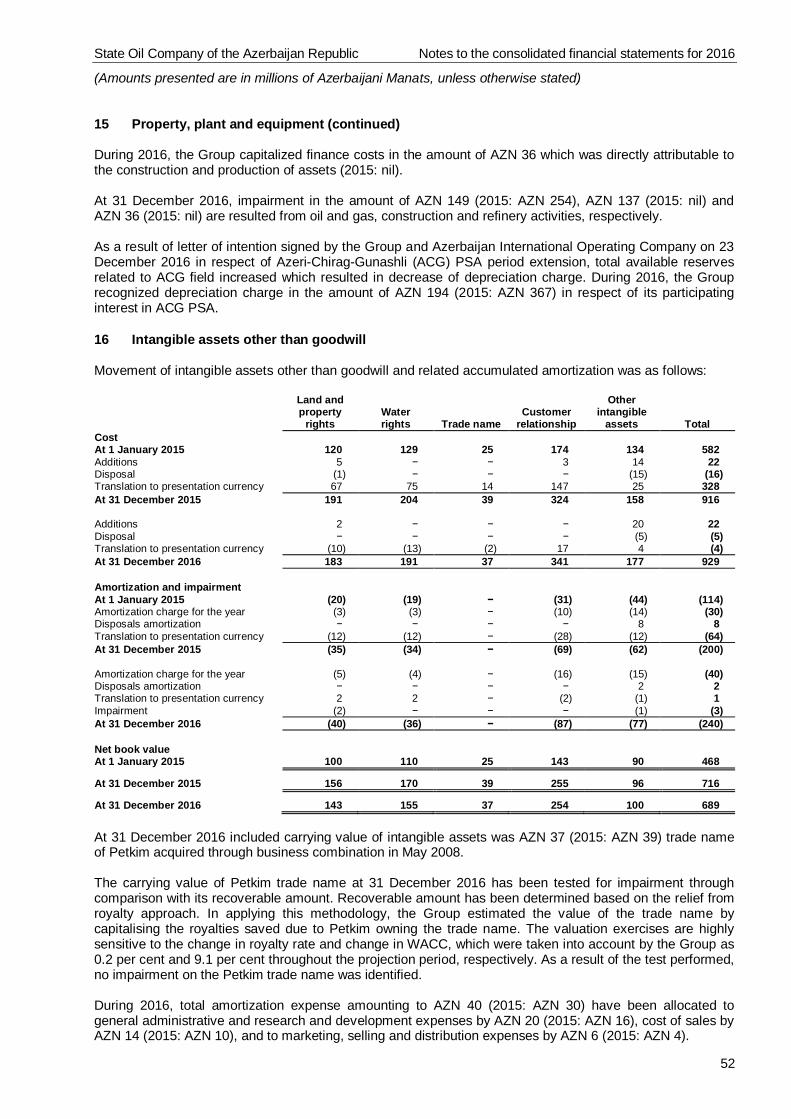
State Oil Company of the Azerbaijan Republic Notes to the consolidated financial statements for 2016
(Amounts presented are in millions of Azerbaijani Manats, unless otherwise stated)
52
15 Property, plant and equipment (continued)
During 2016, the Group capitalized finance costs in the amount of AZN 36 which was directly attributable tothe construction and production of assets (2015: nil).
At 31 December 2016, impairment in the amount of AZN 149 (2015: AZN 254), AZN 137 (2015: nil) andAZN 36 (2015: nil) are resulted from oil and gas, construction and refinery activities, respectively.
As a result of letter of intention signed by the Group and Azerbaijan International Operating Company on 23December 2016 in respect of Azeri-Chirag-Gunashli (ACG) PSA period extension, total available reservesrelated to ACG field increased which resulted in decrease of depreciation charge. During 2016, the Grouprecognized depreciation charge in the amount of AZN 194 (2015: AZN 367) in respect of its participatinginterest in ACG PSA.
16 Intangible assets other than goodwill
Movement of intangible assets other than goodwill and related accumulated amortization was as follows:
Land andproperty
rightsWaterrights Trade name
Customerrelationship
Otherintangible
assets TotalCostAt 1 January 2015 120 129 25 174 134 582Additions 5 − − 3 14 22Disposal (1) − − − (15) (16)Translation to presentation currency 67 75 14 147 25 328At 31 December 2015 191 204 39 324 158 916
Additions 2 − − − 20 22Disposal − − − − (5) (5)Translation to presentation currency (10) (13) (2) 17 4 (4)At 31 December 2016 183 191 37 341 177 929
Amortization and impairmentAt 1 January 2015 (20) (19) − (31) (44) (114)Amortization charge for the year (3) (3) − (10) (14) (30)Disposals amortization − − − − 8 8Translation to presentation currency (12) (12) − (28) (12) (64)At 31 December 2015 (35) (34) − (69) (62) (200)
Amortization charge for the year (5) (4) − (16) (15) (40)Disposals amortization − − − − 2 2Translation to presentation currency 2 2 − (2) (1) 1Impairment (2) − − − (1) (3)At 31 December 2016 (40) (36) − (87) (77) (240)
Net book valueAt 1 January 2015 100 110 25 143 90 468
At 31 December 2015 156 170 39 255 96 716
At 31 December 2016 143 155 37 254 100 689
At 31 December 2016 included carrying value of intangible assets was AZN 37 (2015: AZN 39) trade nameof Petkim acquired through business combination in May 2008.
The carrying value of Petkim trade name at 31 December 2016 has been tested for impairment throughcomparison with its recoverable amount. Recoverable amount has been determined based on the relief fromroyalty approach. In applying this methodology, the Group estimated the value of the trade name bycapitalising the royalties saved due to Petkim owning the trade name. The valuation exercises are highlysensitive to the change in royalty rate and change in WACC, which were taken into account by the Group as0.2 per cent and 9.1 per cent throughout the projection period, respectively. As a result of the test performed,no impairment on the Petkim trade name was identified.
During 2016, total amortization expense amounting to AZN 40 (2015: AZN 30) have been allocated togeneral administrative and research and development expenses by AZN 20 (2015: AZN 16), cost of sales byAZN 14 (2015: AZN 10), and to marketing, selling and distribution expenses by AZN 6 (2015: AZN 4).
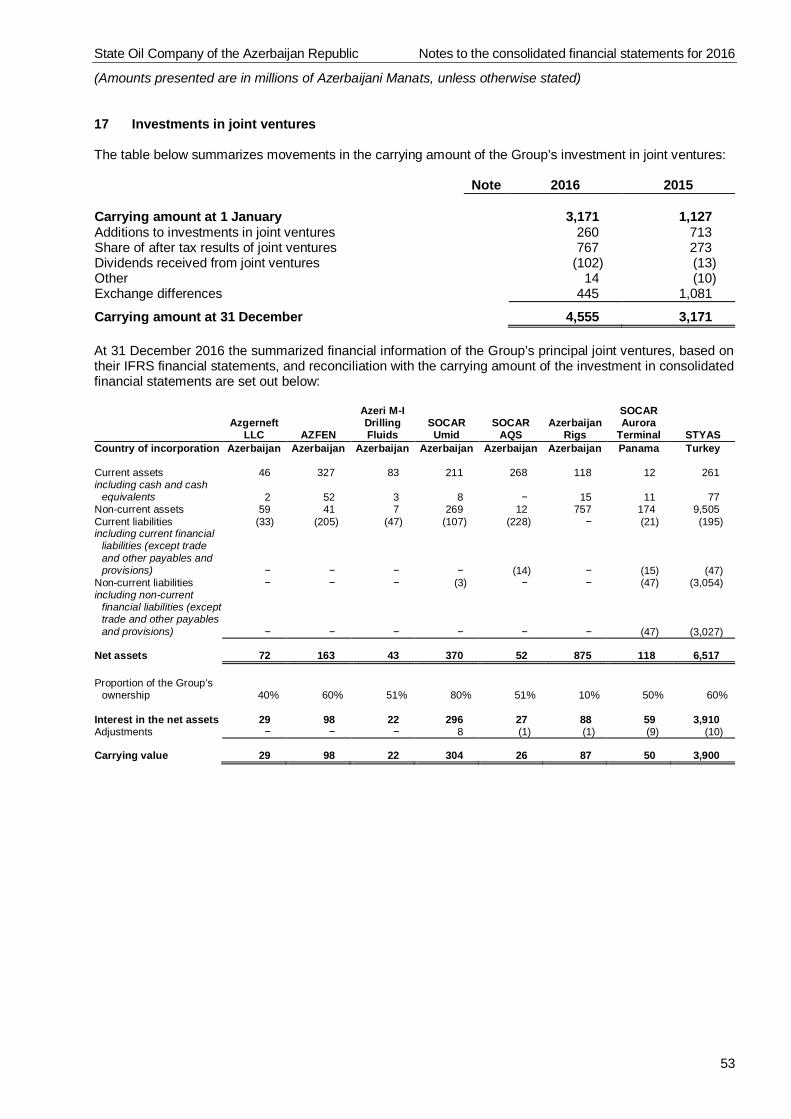
State Oil Company of the Azerbaijan Republic Notes to the consolidated financial statements for 2016
(Amounts presented are in millions of Azerbaijani Manats, unless otherwise stated)
53
17 Investments in joint ventures
The table below summarizes movements in the carrying amount of the Group’s investment in joint ventures:
Note 2016 2015
Carrying amount at 1 January 3,171 1,127Additions to investments in joint ventures 260 713Share of after tax results of joint ventures 767 273Dividends received from joint ventures (102) (13)Other 14 (10)Exchange differences 445 1,081
Carrying amount at 31 December 4,555 3,171
At 31 December 2016 the summarized financial information of the Group’s principal joint ventures, based ontheir IFRS financial statements, and reconciliation with the carrying amount of the investment in consolidatedfinancial statements are set out below:
AzgerneftLLC AZFEN
Azeri M-IDrillingFluids
SOCARUmid
SOCARAQS
AzerbaijanRigs
SOCARAurora
Terminal STYASCountry of incorporation Azerbaijan Azerbaijan Azerbaijan Azerbaijan Azerbaijan Azerbaijan Panama Turkey
Current assets 46 327 83 211 268 118 12 261including cash and cash
equivalents 2 52 3 8 − 15 11 77Non-current assets 59 41 7 269 12 757 174 9,505Current liabilities (33) (205) (47) (107) (228) − (21) (195)including current financial
liabilities (except tradeand other payables andprovisions) − − − − (14) − (15) (47)
Non-current liabilities − − − (3) − − (47) (3,054)including non-current
financial liabilities (excepttrade and other payablesand provisions) − − − − − − (47) (3,027)
Net assets 72 163 43 370 52 875 118 6,517
Proportion of the Group’sownership 40% 60% 51% 80% 51% 10% 50% 60%
Interest in the net assets 29 98 22 296 27 88 59 3,910Adjustments − − − 8 (1) (1) (9) (10)
Carrying value 29 98 22 304 26 87 50 3,900
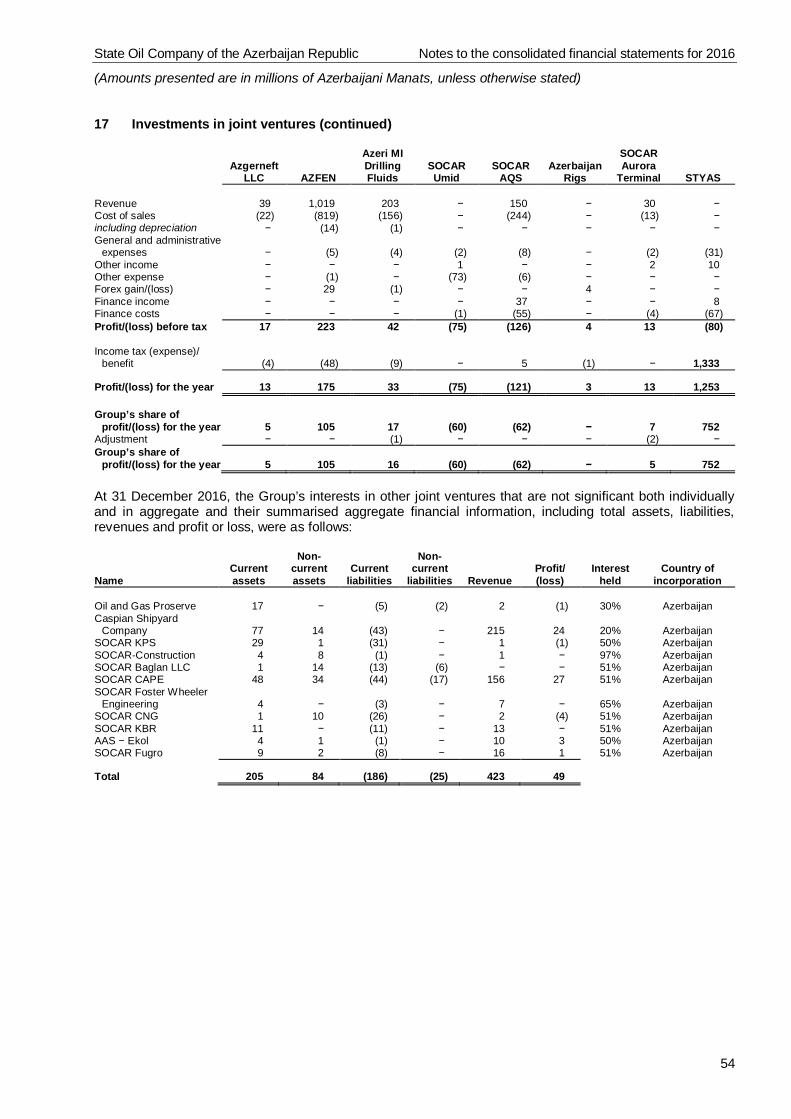
State Oil Company of the Azerbaijan Republic Notes to the consolidated financial statements for 2016
(Amounts presented are in millions of Azerbaijani Manats, unless otherwise stated)
54
17 Investments in joint ventures (continued)
AzgerneftLLC AZFEN
Azeri MIDrillingFluids
SOCARUmid
SOCARAQS
AzerbaijanRigs
SOCARAurora
Terminal STYAS
Revenue 39 1,019 203 − 150 − 30 −Cost of sales (22) (819) (156) − (244) − (13) −including depreciation − (14) (1) − − − − −General and administrative
expenses − (5) (4) (2) (8) − (2) (31)Other income − − − 1 − − 2 10Other expense − (1) − (73) (6) − − −Forex gain/(loss) − 29 (1) − − 4 − −Finance income − − − − 37 − − 8Finance costs − − − (1) (55) − (4) (67)Profit/(loss) before tax 17 223 42 (75) (126) 4 13 (80)
Income tax (expense)/benefit (4) (48) (9) − 5 (1) − 1,333
Profit/(loss) for the year 13 175 33 (75) (121) 3 13 1,253
Group’s share ofprofit/(loss) for the year 5 105 17 (60) (62) − 7 752
Adjustment − − (1) − − − (2) −Group’s share of
profit/(loss) for the year 5 105 16 (60) (62) − 5 752
At 31 December 2016, the Group’s interests in other joint ventures that are not significant both individuallyand in aggregate and their summarised aggregate financial information, including total assets, liabilities,revenues and profit or loss, were as follows:
NameCurrentassets
Non-currentassets
Currentliabilities
Non-current
liabilities RevenueProfit/(loss)
Interestheld
Country ofincorporation
Oil and Gas Proserve 17 − (5) (2) 2 (1) 30% AzerbaijanCaspian Shipyard
Company 77 14 (43) − 215 24 20% AzerbaijanSOCAR KPS 29 1 (31) − 1 (1) 50% AzerbaijanSOCAR-Construction 4 8 (1) − 1 − 97% AzerbaijanSOCAR Baglan LLC 1 14 (13) (6) − − 51% AzerbaijanSOCAR CAPE 48 34 (44) (17) 156 27 51% AzerbaijanSOCAR Foster Wheeler
Engineering 4 − (3) − 7 − 65% AzerbaijanSOCAR CNG 1 10 (26) − 2 (4) 51% AzerbaijanSOCAR KBR 11 − (11) − 13 − 51% AzerbaijanAAS − Ekol 4 1 (1) − 10 3 50% AzerbaijanSOCAR Fugro 9 2 (8) − 16 1 51% Azerbaijan
Total 205 84 (186) (25) 423 49
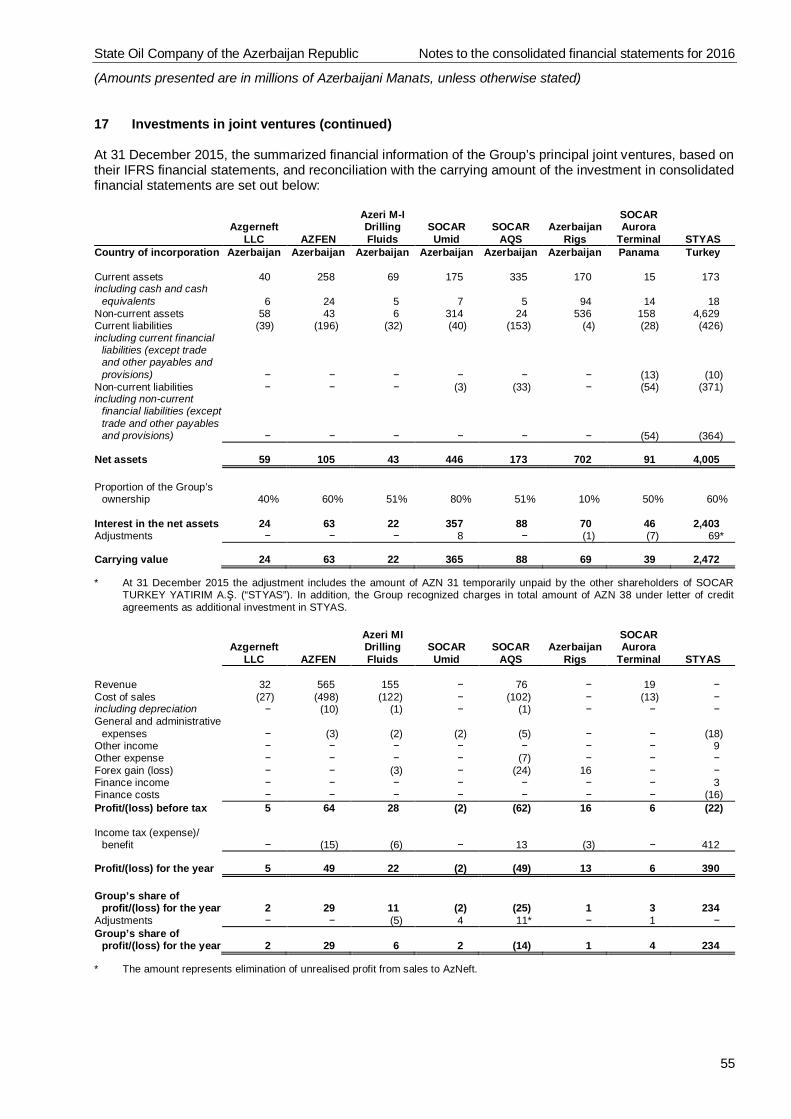
State Oil Company of the Azerbaijan Republic Notes to the consolidated financial statements for 2016
(Amounts presented are in millions of Azerbaijani Manats, unless otherwise stated)
55
17 Investments in joint ventures (continued)
At 31 December 2015, the summarized financial information of the Group’s principal joint ventures, based ontheir IFRS financial statements, and reconciliation with the carrying amount of the investment in consolidatedfinancial statements are set out below:
AzgerneftLLC AZFEN
Azeri M-IDrillingFluids
SOCARUmid
SOCARAQS
AzerbaijanRigs
SOCARAurora
Terminal STYASCountry of incorporation Azerbaijan Azerbaijan Azerbaijan Azerbaijan Azerbaijan Azerbaijan Panama Turkey
Current assets 40 258 69 175 335 170 15 173including cash and cash
equivalents 6 24 5 7 5 94 14 18Non-current assets 58 43 6 314 24 536 158 4,629Current liabilities (39) (196) (32) (40) (153) (4) (28) (426)including current financial
liabilities (except tradeand other payables andprovisions) − − − − − − (13) (10)
Non-current liabilities − − − (3) (33) − (54) (371)including non-current
financial liabilities (excepttrade and other payablesand provisions) − − − − − − (54) (364)
Net assets 59 105 43 446 173 702 91 4,005
Proportion of the Group’sownership 40% 60% 51% 80% 51% 10% 50% 60%
Interest in the net assets 24 63 22 357 88 70 46 2,403Adjustments − − − 8 − (1) (7) 69*
Carrying value 24 63 22 365 88 69 39 2,472
* At 31 December 2015 the adjustment includes the amount of AZN 31 temporarily unpaid by the other shareholders of SOCARTURKEY YATIRIM A.Ş. (“STYAS”). In addition, the Group recognized charges in total amount of AZN 38 under letter of creditagreements as additional investment in STYAS.
AzgerneftLLC AZFEN
Azeri MIDrillingFluids
SOCARUmid
SOCARAQS
AzerbaijanRigs
SOCARAurora
Terminal STYAS
Revenue 32 565 155 − 76 − 19 −Cost of sales (27) (498) (122) − (102) − (13) −including depreciation − (10) (1) − (1) − − −General and administrative
expenses − (3) (2) (2) (5) − − (18)Other income − − − − − − − 9Other expense − − − − (7) − − −Forex gain (loss) − − (3) − (24) 16 − −Finance income − − − − − − − 3Finance costs − − − − − − − (16)Profit/(loss) before tax 5 64 28 (2) (62) 16 6 (22)
Income tax (expense)/benefit − (15) (6) − 13 (3) − 412
Profit/(loss) for the year 5 49 22 (2) (49) 13 6 390
Group’s share ofprofit/(loss) for the year 2 29 11 (2) (25) 1 3 234
Adjustments − − (5) 4 11* − 1 −Group’s share of
profit/(loss) for the year 2 29 6 2 (14) 1 4 234
* The amount represents elimination of unrealised profit from sales to AzNeft.
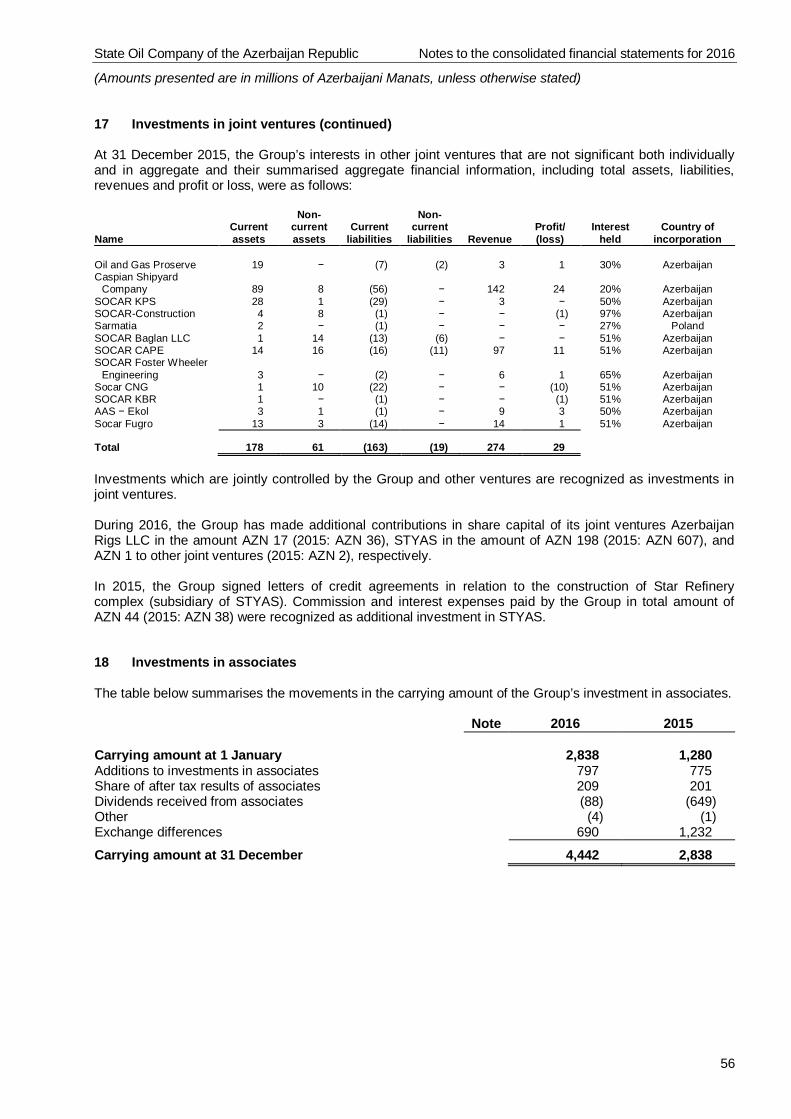
State Oil Company of the Azerbaijan Republic Notes to the consolidated financial statements for 2016
(Amounts presented are in millions of Azerbaijani Manats, unless otherwise stated)
56
17 Investments in joint ventures (continued)
At 31 December 2015, the Group’s interests in other joint ventures that are not significant both individuallyand in aggregate and their summarised aggregate financial information, including total assets, liabilities,revenues and profit or loss, were as follows:
NameCurrentassets
Non-currentassets
Currentliabilities
Non-current
liabilities RevenueProfit/(loss)
Interestheld
Country ofincorporation
Oil and Gas Proserve 19 − (7) (2) 3 1 30% AzerbaijanCaspian Shipyard
Company 89 8 (56) − 142 24 20% AzerbaijanSOCAR KPS 28 1 (29) − 3 − 50% AzerbaijanSOCAR-Construction 4 8 (1) − − (1) 97% AzerbaijanSarmatia 2 − (1) − − − 27% PolandSOCAR Baglan LLC 1 14 (13) (6) − − 51% AzerbaijanSOCAR CAPE 14 16 (16) (11) 97 11 51% AzerbaijanSOCAR Foster Wheeler
Engineering 3 − (2) − 6 1 65% AzerbaijanSocar CNG 1 10 (22) − − (10) 51% AzerbaijanSOCAR KBR 1 − (1) − − (1) 51% AzerbaijanAAS − Ekol 3 1 (1) − 9 3 50% AzerbaijanSocar Fugro 13 3 (14) − 14 1 51% Azerbaijan
Total 178 61 (163) (19) 274 29
Investments which are jointly controlled by the Group and other ventures are recognized as investments injoint ventures.
During 2016, the Group has made additional contributions in share capital of its joint ventures AzerbaijanRigs LLC in the amount AZN 17 (2015: AZN 36), STYAS in the amount of AZN 198 (2015: AZN 607), andAZN 1 to other joint ventures (2015: AZN 2), respectively.
In 2015, the Group signed letters of credit agreements in relation to the construction of Star Refinerycomplex (subsidiary of STYAS). Commission and interest expenses paid by the Group in total amount ofAZN 44 (2015: AZN 38) were recognized as additional investment in STYAS.
18 Investments in associates
The table below summarises the movements in the carrying amount of the Group’s investment in associates.
Note 2016 2015
Carrying amount at 1 January 2,838 1,280Additions to investments in associates 797 775Share of after tax results of associates 209 201Dividends received from associates (88) (649)Other (4) (1)Exchange differences 690 1,232
Carrying amount at 31 December 4,442 2,838
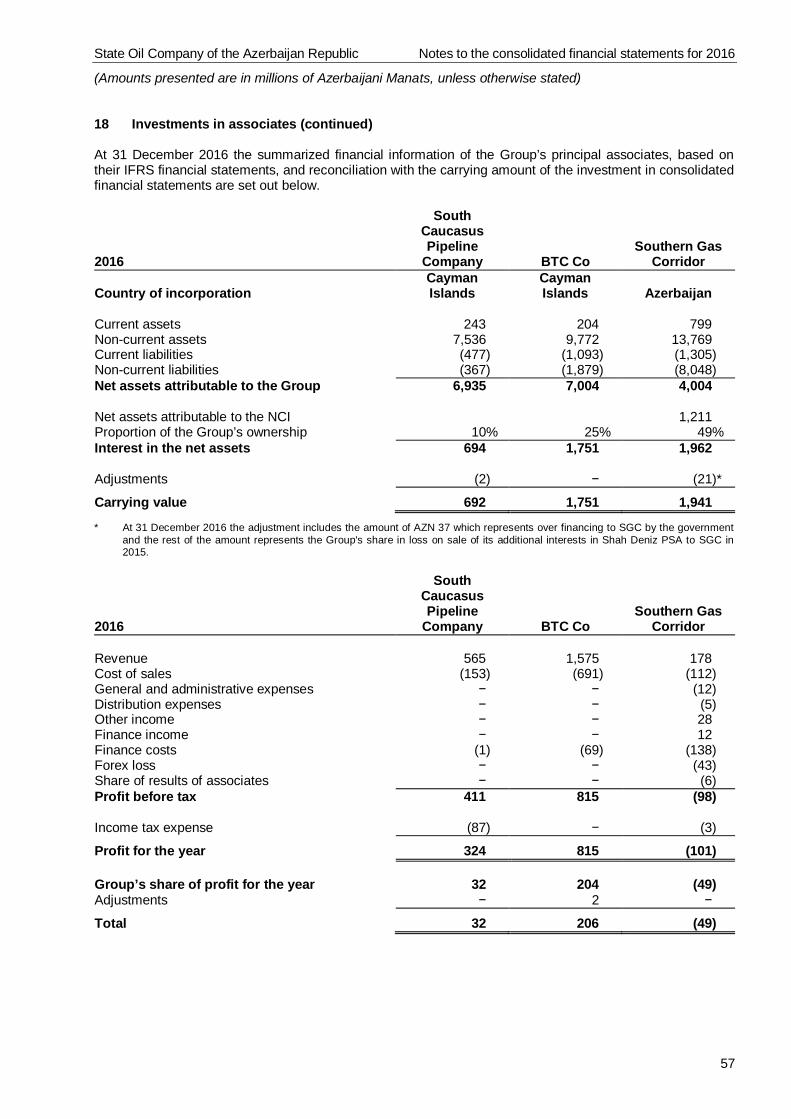
State Oil Company of the Azerbaijan Republic Notes to the consolidated financial statements for 2016
(Amounts presented are in millions of Azerbaijani Manats, unless otherwise stated)
57
18 Investments in associates (continued)
At 31 December 2016 the summarized financial information of the Group’s principal associates, based ontheir IFRS financial statements, and reconciliation with the carrying amount of the investment in consolidatedfinancial statements are set out below.
2016
SouthCaucasusPipeline
Company BTC CoSouthern Gas
Corridor
Country of incorporationCaymanIslands
CaymanIslands Azerbaijan
Current assets 243 204 799Non-current assets 7,536 9,772 13,769Current liabilities (477) (1,093) (1,305)Non-current liabilities (367) (1,879) (8,048)Net assets attributable to the Group
Net assets attributable to the NCI
6,935 7,004 4,004
1,211Proportion of the Group’s ownership 10% 25% 49%Interest in the net assets 694 1,751 1,962
Adjustments (2) − (21)*
Carrying value 692 1,751 1,941
* At 31 December 2016 the adjustment includes the amount of AZN 37 which represents over financing to SGC by the governmentand the rest of the amount represents the Group's share in loss on sale of its additional interests in Shah Deniz PSA to SGC in2015.
2016
SouthCaucasusPipeline
Company BTC CoSouthern Gas
Corridor
Revenue 565 1,575 178Cost of sales (153) (691) (112)General and administrative expenses − − (12)Distribution expenses − − (5)Other income − − 28Finance income − − 12Finance costs (1) (69) (138)Forex loss − − (43)Share of results of associates − − (6)Profit before tax 411 815 (98)
Income tax expense (87) − (3)
Profit for the year 324 815 (101)
Group’s share of profit for the year 32 204 (49)Adjustments − 2 −
Total 32 206 (49)
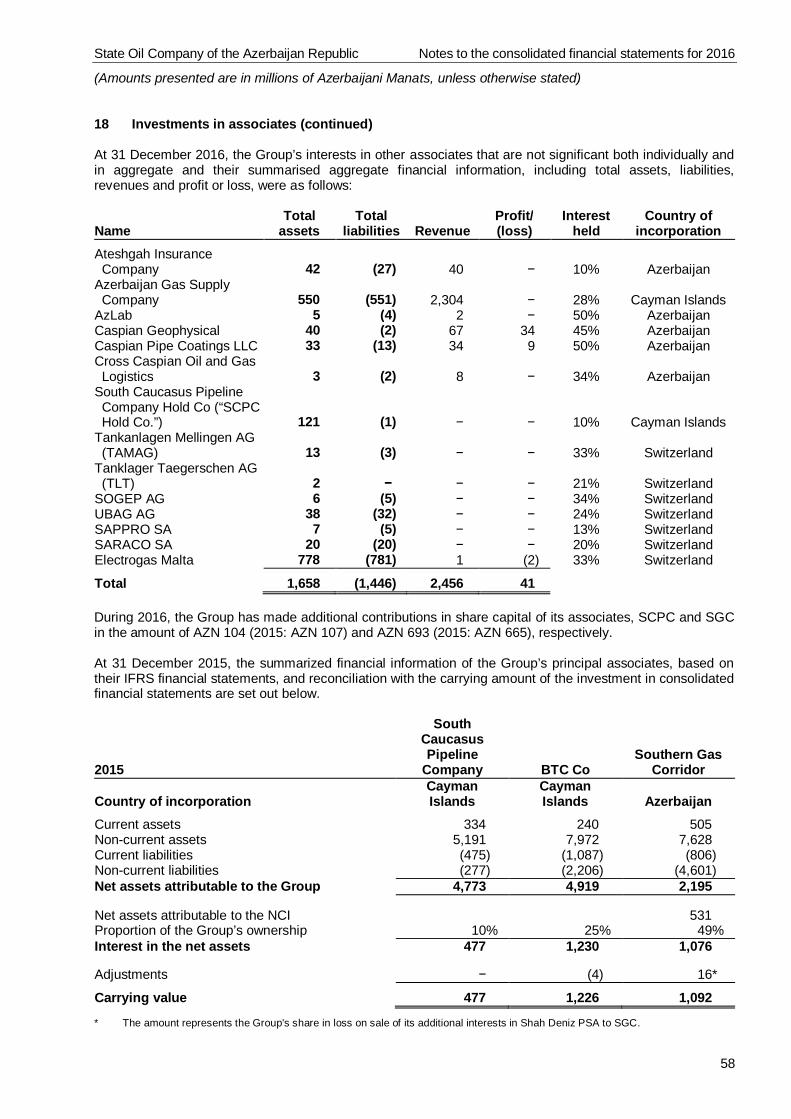
State Oil Company of the Azerbaijan Republic Notes to the consolidated financial statements for 2016
(Amounts presented are in millions of Azerbaijani Manats, unless otherwise stated)
58
18 Investments in associates (continued)
At 31 December 2016, the Group’s interests in other associates that are not significant both individually andin aggregate and their summarised aggregate financial information, including total assets, liabilities,revenues and profit or loss, were as follows:
NameTotal
assetsTotal
liabilities RevenueProfit/(loss)
Interestheld
Country ofincorporation
Ateshgah InsuranceCompany 42 (27) 40 − 10% Azerbaijan
Azerbaijan Gas SupplyCompany 550 (551) 2,304 − 28% Cayman Islands
AzLab 5 (4) 2 − 50% AzerbaijanCaspian Geophysical 40 (2) 67 34 45% AzerbaijanCaspian Pipe Coatings LLC 33 (13) 34 9 50% AzerbaijanCross Caspian Oil and GasLogistics 3 (2) 8 − 34% Azerbaijan
South Caucasus PipelineCompany Hold Co (“SCPCHold Co.”) 121 (1) − − 10% Cayman Islands
Tankanlagen Mellingen AG(TAMAG) 13 (3) − − 33% Switzerland
Tanklager Taegerschen AG(TLT) 2 − − − 21% Switzerland
SOGEP AG 6 (5) − − 34% SwitzerlandUBAG AG 38 (32) − − 24% SwitzerlandSAPPRO SA 7 (5) − − 13% SwitzerlandSARACO SA 20 (20) − − 20% SwitzerlandElectrogas Malta 778 (781) 1 (2) 33% Switzerland
Total 1,658 (1,446) 2,456 41
During 2016, the Group has made additional contributions in share capital of its associates, SCPC and SGCin the amount of AZN 104 (2015: AZN 107) and AZN 693 (2015: AZN 665), respectively.
At 31 December 2015, the summarized financial information of the Group’s principal associates, based ontheir IFRS financial statements, and reconciliation with the carrying amount of the investment in consolidatedfinancial statements are set out below.
2015
SouthCaucasusPipeline
Company BTC CoSouthern Gas
Corridor
Country of incorporationCaymanIslands
CaymanIslands Azerbaijan
Current assets 334 240 505Non-current assets 5,191 7,972 7,628Current liabilities (475) (1,087) (806)Non-current liabilities (277) (2,206) (4,601)Net assets attributable to the Group 4,773 4,919 2,195
Net assets attributable to the NCI 531Proportion of the Group’s ownership 10% 25% 49%Interest in the net assets 477 1,230 1,076
Adjustments − (4) 16*
Carrying value 477 1,226 1,092
* The amount represents the Group's share in loss on sale of its additional interests in Shah Deniz PSA to SGC.
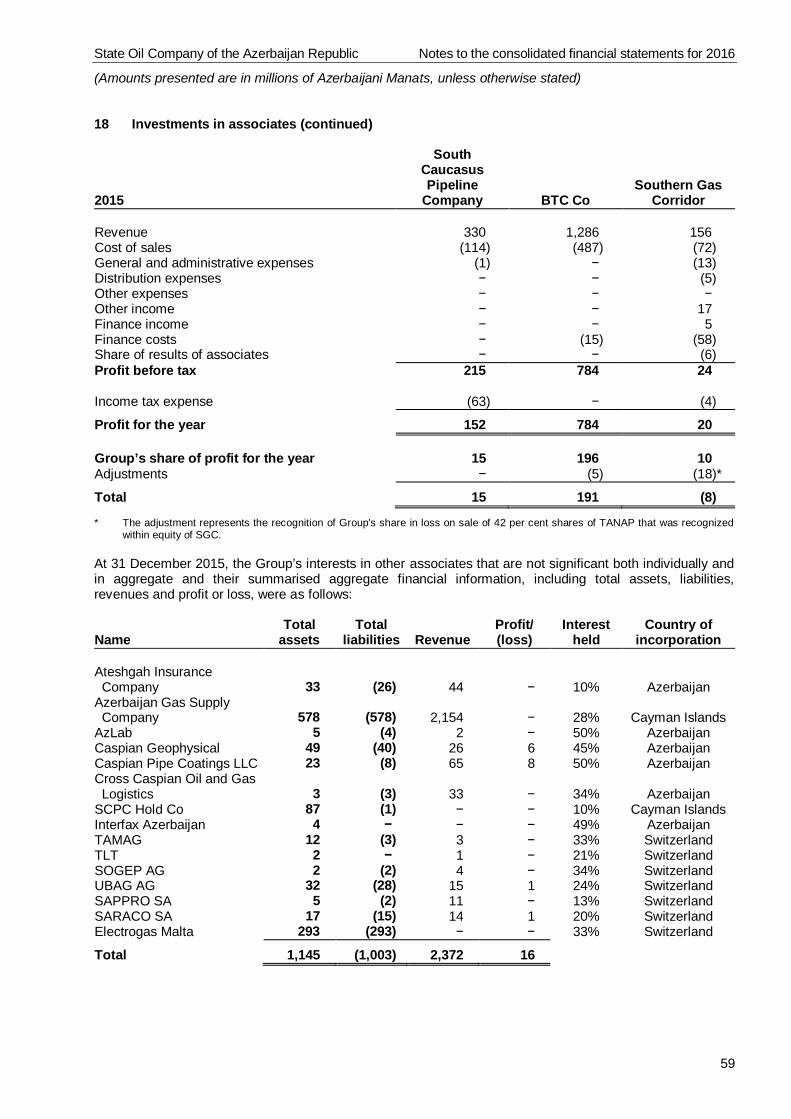
State Oil Company of the Azerbaijan Republic Notes to the consolidated financial statements for 2016
(Amounts presented are in millions of Azerbaijani Manats, unless otherwise stated)
59
18 Investments in associates (continued)
2015
SouthCaucasusPipeline
Company BTC CoSouthern Gas
Corridor
Revenue 330 1,286 156Cost of sales (114) (487) (72)General and administrative expenses (1) − (13)Distribution expenses − − (5)Other expenses − − −Other income − − 17Finance income − − 5Finance costs − (15) (58)Share of results of associates − − (6)Profit before tax 215 784 24
Income tax expense (63) − (4)
Profit for the year 152 784 20
Group’s share of profit for the year 15 196 10Adjustments − (5) (18)*
Total 15 191 (8)
* The adjustment represents the recognition of Group's share in loss on sale of 42 per cent shares of TANAP that was recognizedwithin equity of SGC.
At 31 December 2015, the Group’s interests in other associates that are not significant both individually andin aggregate and their summarised aggregate financial information, including total assets, liabilities,revenues and profit or loss, were as follows:
NameTotal
assetsTotal
liabilities RevenueProfit/(loss)
Interestheld
Country ofincorporation
Ateshgah InsuranceCompany 33 (26) 44 − 10% Azerbaijan
Azerbaijan Gas SupplyCompany 578 (578) 2,154 − 28% Cayman Islands
AzLab 5 (4) 2 − 50% AzerbaijanCaspian Geophysical 49 (40) 26 6 45% AzerbaijanCaspian Pipe Coatings LLC 23 (8) 65 8 50% AzerbaijanCross Caspian Oil and GasLogistics 3 (3) 33 − 34% Azerbaijan
SCPC Hold Co 87 (1) − − 10% Cayman IslandsInterfax Azerbaijan 4 − − − 49% AzerbaijanTAMAG 12 (3) 3 − 33% SwitzerlandTLT 2 − 1 − 21% SwitzerlandSOGEP AG 2 (2) 4 − 34% SwitzerlandUBAG AG 32 (28) 15 1 24% SwitzerlandSAPPRO SA 5 (2) 11 − 13% SwitzerlandSARACO SA 17 (15) 14 1 20% SwitzerlandElectrogas Malta 293 (293) − − 33% Switzerland
Total 1,145 (1,003) 2,372 16
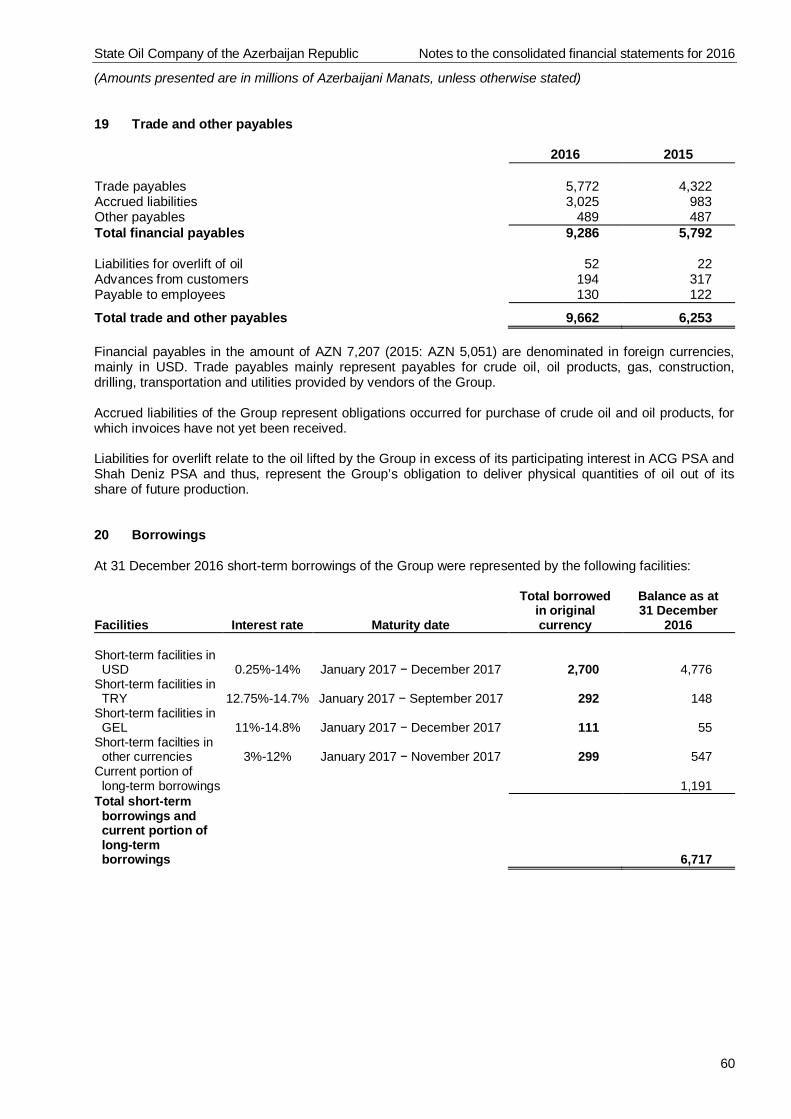
State Oil Company of the Azerbaijan Republic Notes to the consolidated financial statements for 2016
(Amounts presented are in millions of Azerbaijani Manats, unless otherwise stated)
60
19 Trade and other payables
2016 2015
Trade payables 5,772 4,322Accrued liabilities 3,025 983Other payables 489 487Total financial payables 9,286 5,792
Liabilities for overlift of oil 52 22Advances from customers 194 317Payable to employees 130 122
Total trade and other payables 9,662 6,253
Financial payables in the amount of AZN 7,207 (2015: AZN 5,051) are denominated in foreign currencies,mainly in USD. Trade payables mainly represent payables for crude oil, oil products, gas, construction,drilling, transportation and utilities provided by vendors of the Group.
Accrued liabilities of the Group represent obligations occurred for purchase of crude oil and oil products, forwhich invoices have not yet been received.
Liabilities for overlift relate to the oil lifted by the Group in excess of its participating interest in ACG PSA andShah Deniz PSA and thus, represent the Group’s obligation to deliver physical quantities of oil out of itsshare of future production.
20 Borrowings
At 31 December 2016 short-term borrowings of the Group were represented by the following facilities:
Facilities Interest rate Maturity date
Total borrowedin originalcurrency
Balance as at31 December
2016
Short-term facilities inUSD 0.25%-14% January 2017 − December 2017 2,700 4,776
Short-term facilities inTRY 12.75%-14.7% January 2017 − September 2017 292 148
Short-term facilities inGEL 11%-14.8% January 2017 − December 2017 111 55
Short-term facilties inother currencies 3%-12% January 2017 − November 2017 299 547
Current portion oflong-term borrowings 1,191
Total short-termborrowings andcurrent portion oflong-termborrowings 6,717
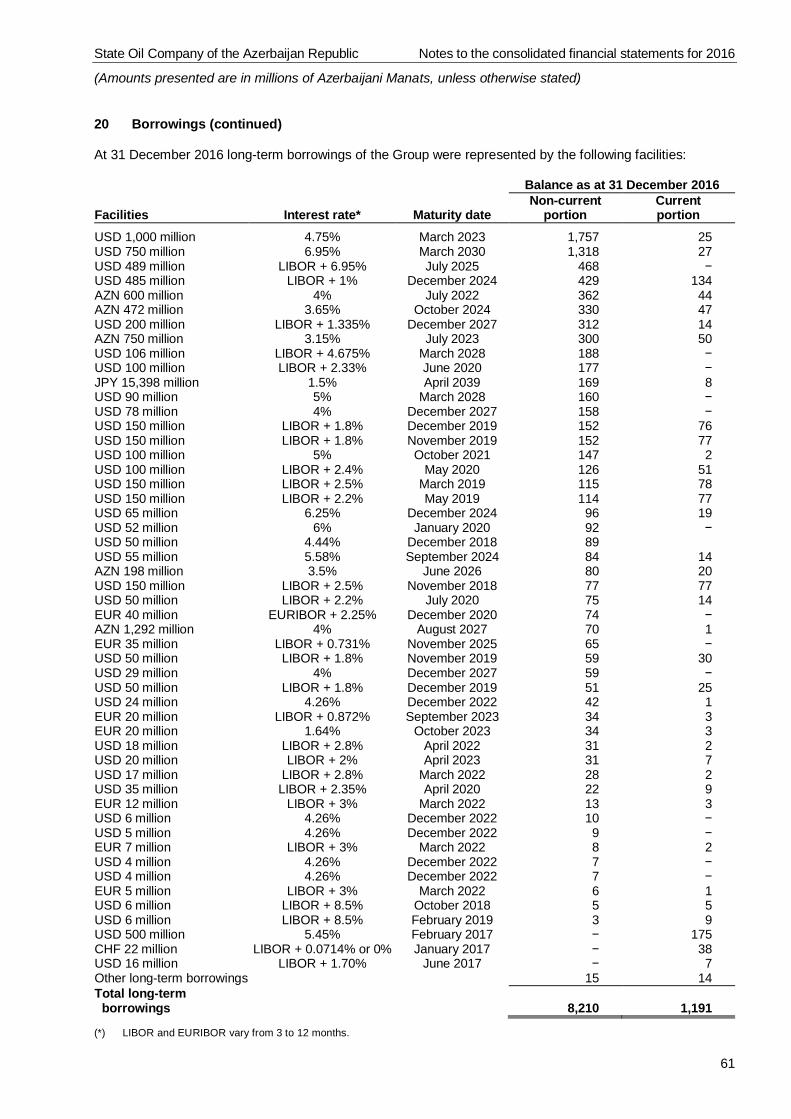
State Oil Company of the Azerbaijan Republic Notes to the consolidated financial statements for 2016
(Amounts presented are in millions of Azerbaijani Manats, unless otherwise stated)
61
20 Borrowings (continued)
At 31 December 2016 long-term borrowings of the Group were represented by the following facilities:
Balance as at 31 December 2016
Facilities Interest rate* Maturity dateNon-current
portionCurrentportion
USD 1,000 million 4.75% March 2023 1,757 25USD 750 million 6.95% March 2030 1,318 27USD 489 million LIBOR + 6.95% July 2025 468 −USD 485 million LIBOR + 1% December 2024 429 134AZN 600 million 4% July 2022 362 44AZN 472 million 3.65% October 2024 330 47USD 200 million LIBOR + 1.335% December 2027 312 14AZN 750 million 3.15% July 2023 300 50USD 106 million LIBOR + 4.675% March 2028 188 −USD 100 million LIBOR + 2.33% June 2020 177 −JPY 15,398 million 1.5% April 2039 169 8USD 90 million 5% March 2028 160 −USD 78 million 4% December 2027 158 −USD 150 million LIBOR + 1.8% December 2019 152 76USD 150 million LIBOR + 1.8% November 2019 152 77USD 100 million 5% October 2021 147 2USD 100 million LIBOR + 2.4% May 2020 126 51USD 150 million LIBOR + 2.5% March 2019 115 78USD 150 million LIBOR + 2.2% May 2019 114 77USD 65 million 6.25% December 2024 96 19USD 52 million 6% January 2020 92 −USD 50 million 4.44% December 2018 89USD 55 million 5.58% September 2024 84 14AZN 198 million 3.5% June 2026 80 20USD 150 million LIBOR + 2.5% November 2018 77 77USD 50 million LIBOR + 2.2% July 2020 75 14EUR 40 million EURIBOR + 2.25% December 2020 74 −AZN 1,292 million 4% August 2027 70 1EUR 35 million LIBOR + 0.731% November 2025 65 −USD 50 million LIBOR + 1.8% November 2019 59 30USD 29 million 4% December 2027 59 −USD 50 million LIBOR + 1.8% December 2019 51 25USD 24 million 4.26% December 2022 42 1EUR 20 million LIBOR + 0.872% September 2023 34 3EUR 20 million 1.64% October 2023 34 3USD 18 million LIBOR + 2.8% April 2022 31 2USD 20 million LIBOR + 2% April 2023 31 7USD 17 million LIBOR + 2.8% March 2022 28 2USD 35 million LIBOR + 2.35% April 2020 22 9EUR 12 million LIBOR + 3% March 2022 13 3USD 6 million 4.26% December 2022 10 −USD 5 million 4.26% December 2022 9 −EUR 7 million LIBOR + 3% March 2022 8 2USD 4 million 4.26% December 2022 7 −USD 4 million 4.26% December 2022 7 −EUR 5 million LIBOR + 3% March 2022 6 1USD 6 million LIBOR + 8.5% October 2018 5 5USD 6 million LIBOR + 8.5% February 2019 3 9USD 500 million 5.45% February 2017 − 175CHF 22 million LIBOR + 0.0714% or 0% January 2017 − 38USD 16 million LIBOR + 1.70% June 2017 − 7Other long-term borrowings 15 14Total long-term
borrowings 8,210 1,191
(*) LIBOR and EURIBOR vary from 3 to 12 months.
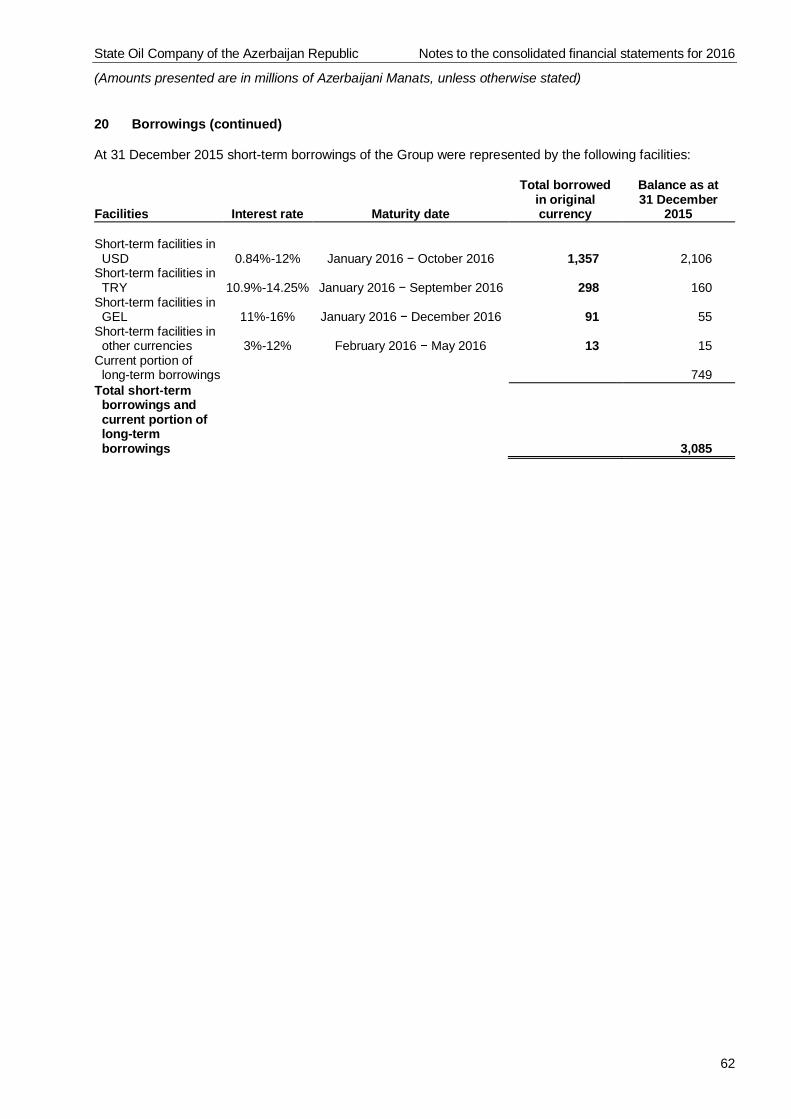
State Oil Company of the Azerbaijan Republic Notes to the consolidated financial statements for 2016
(Amounts presented are in millions of Azerbaijani Manats, unless otherwise stated)
62
20 Borrowings (continued)
At 31 December 2015 short-term borrowings of the Group were represented by the following facilities:
Facilities Interest rate Maturity date
Total borrowedin originalcurrency
Balance as at31 December
2015
Short-term facilities inUSD 0.84%-12% January 2016 − October 2016 1,357 2,106
Short-term facilities inTRY 10.9%-14.25% January 2016 − September 2016 298 160
Short-term facilities inGEL 11%-16% January 2016 − December 2016 91 55
Short-term facilities inother currencies 3%-12% February 2016 − May 2016 13 15
Current portion oflong-term borrowings 749
Total short-termborrowings andcurrent portion oflong-termborrowings 3,085
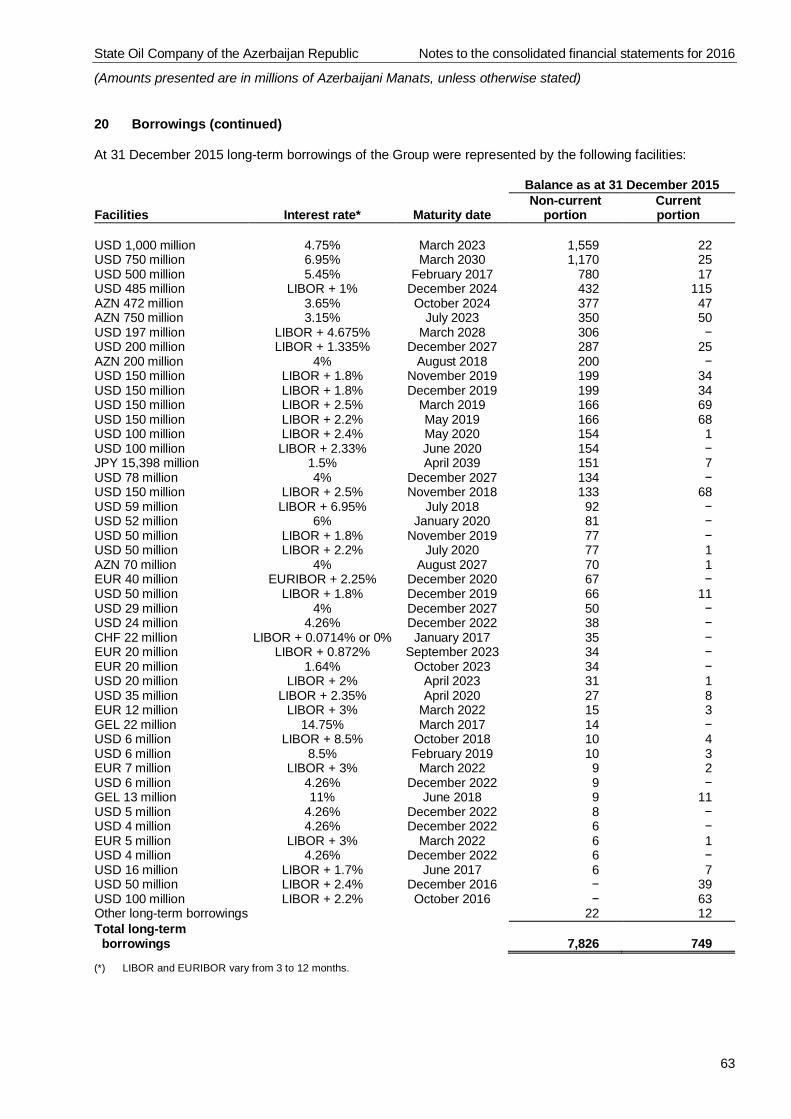
State Oil Company of the Azerbaijan Republic Notes to the consolidated financial statements for 2016
(Amounts presented are in millions of Azerbaijani Manats, unless otherwise stated)
63
20 Borrowings (continued)
At 31 December 2015 long-term borrowings of the Group were represented by the following facilities:
Balance as at 31 December 2015
Facilities Interest rate* Maturity dateNon-current
portionCurrentportion
USD 1,000 million 4.75% March 2023 1,559 22USD 750 million 6.95% March 2030 1,170 25USD 500 million 5.45% February 2017 780 17USD 485 million LIBOR + 1% December 2024 432 115AZN 472 million 3.65% October 2024 377 47AZN 750 million 3.15% July 2023 350 50USD 197 million LIBOR + 4.675% March 2028 306 −USD 200 million LIBOR + 1.335% December 2027 287 25AZN 200 million 4% August 2018 200 −USD 150 million LIBOR + 1.8% November 2019 199 34USD 150 million LIBOR + 1.8% December 2019 199 34USD 150 million LIBOR + 2.5% March 2019 166 69USD 150 million LIBOR + 2.2% May 2019 166 68USD 100 million LIBOR + 2.4% May 2020 154 1USD 100 million LIBOR + 2.33% June 2020 154 −JPY 15,398 million 1.5% April 2039 151 7USD 78 million 4% December 2027 134 −USD 150 million LIBOR + 2.5% November 2018 133 68USD 59 million LIBOR + 6.95% July 2018 92 −USD 52 million 6% January 2020 81 −USD 50 million LIBOR + 1.8% November 2019 77 −USD 50 million LIBOR + 2.2% July 2020 77 1AZN 70 million 4% August 2027 70 1EUR 40 million EURIBOR + 2.25% December 2020 67 −USD 50 million LIBOR + 1.8% December 2019 66 11USD 29 million 4% December 2027 50 −USD 24 million 4.26% December 2022 38 −CHF 22 million LIBOR + 0.0714% or 0% January 2017 35 −EUR 20 million LIBOR + 0.872% September 2023 34 −EUR 20 million 1.64% October 2023 34 −USD 20 million LIBOR + 2% April 2023 31 1USD 35 million LIBOR + 2.35% April 2020 27 8EUR 12 million LIBOR + 3% March 2022 15 3GEL 22 million 14.75% March 2017 14 −USD 6 million LIBOR + 8.5% October 2018 10 4USD 6 million 8.5% February 2019 10 3EUR 7 million LIBOR + 3% March 2022 9 2USD 6 million 4.26% December 2022 9 −GEL 13 million 11% June 2018 9 11USD 5 million 4.26% December 2022 8 −USD 4 million 4.26% December 2022 6 −EUR 5 million LIBOR + 3% March 2022 6 1USD 4 million 4.26% December 2022 6 −USD 16 million LIBOR + 1.7% June 2017 6 7USD 50 million LIBOR + 2.4% December 2016 − 39USD 100 million LIBOR + 2.2% October 2016 − 63Other long-term borrowings 22 12Total long-term
borrowings 7,826 749
(*) LIBOR and EURIBOR vary from 3 to 12 months.
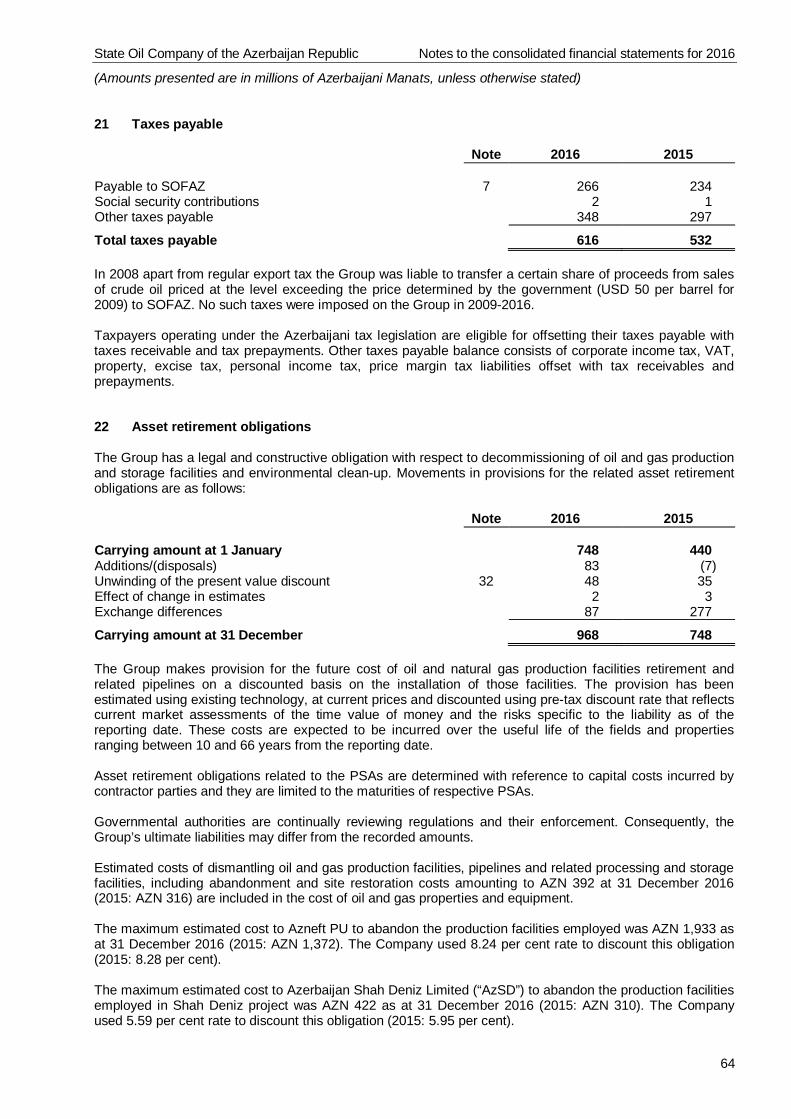
State Oil Company of the Azerbaijan Republic Notes to the consolidated financial statements for 2016
(Amounts presented are in millions of Azerbaijani Manats, unless otherwise stated)
64
21 Taxes payable
Note 2016 2015
Payable to SOFAZ 7 266 234Social security contributions 2 1Other taxes payable 348 297
Total taxes payable 616 532
In 2008 apart from regular export tax the Group was liable to transfer a certain share of proceeds from salesof crude oil priced at the level exceeding the price determined by the government (USD 50 per barrel for2009) to SOFAZ. No such taxes were imposed on the Group in 2009-2016.
Taxpayers operating under the Azerbaijani tax legislation are eligible for offsetting their taxes payable withtaxes receivable and tax prepayments. Other taxes payable balance consists of corporate income tax, VAT,property, excise tax, personal income tax, price margin tax liabilities offset with tax receivables andprepayments.
22 Asset retirement obligations
The Group has a legal and constructive obligation with respect to decommissioning of oil and gas productionand storage facilities and environmental clean-up. Movements in provisions for the related asset retirementobligations are as follows:
Note 2016 2015
Carrying amount at 1 January 748 440Additions/(disposals) 83 (7)Unwinding of the present value discount 32 48 35Effect of change in estimates 2 3Exchange differences 87 277
Carrying amount at 31 December 968 748
The Group makes provision for the future cost of oil and natural gas production facilities retirement andrelated pipelines on a discounted basis on the installation of those facilities. The provision has beenestimated using existing technology, at current prices and discounted using pre-tax discount rate that reflectscurrent market assessments of the time value of money and the risks specific to the liability as of thereporting date. These costs are expected to be incurred over the useful life of the fields and propertiesranging between 10 and 66 years from the reporting date.
Asset retirement obligations related to the PSAs are determined with reference to capital costs incurred bycontractor parties and they are limited to the maturities of respective PSAs.
Governmental authorities are continually reviewing regulations and their enforcement. Consequently, theGroup’s ultimate liabilities may differ from the recorded amounts.
Estimated costs of dismantling oil and gas production facilities, pipelines and related processing and storagefacilities, including abandonment and site restoration costs amounting to AZN 392 at 31 December 2016(2015: AZN 316) are included in the cost of oil and gas properties and equipment.
The maximum estimated cost to Azneft PU to abandon the production facilities employed was AZN 1,933 asat 31 December 2016 (2015: AZN 1,372). The Company used 8.24 per cent rate to discount this obligation(2015: 8.28 per cent).
The maximum estimated cost to Azerbaijan Shah Deniz Limited (“AzSD”) to abandon the production facilitiesemployed in Shah Deniz project was AZN 422 as at 31 December 2016 (2015: AZN 310). The Companyused 5.59 per cent rate to discount this obligation (2015: 5.95 per cent).
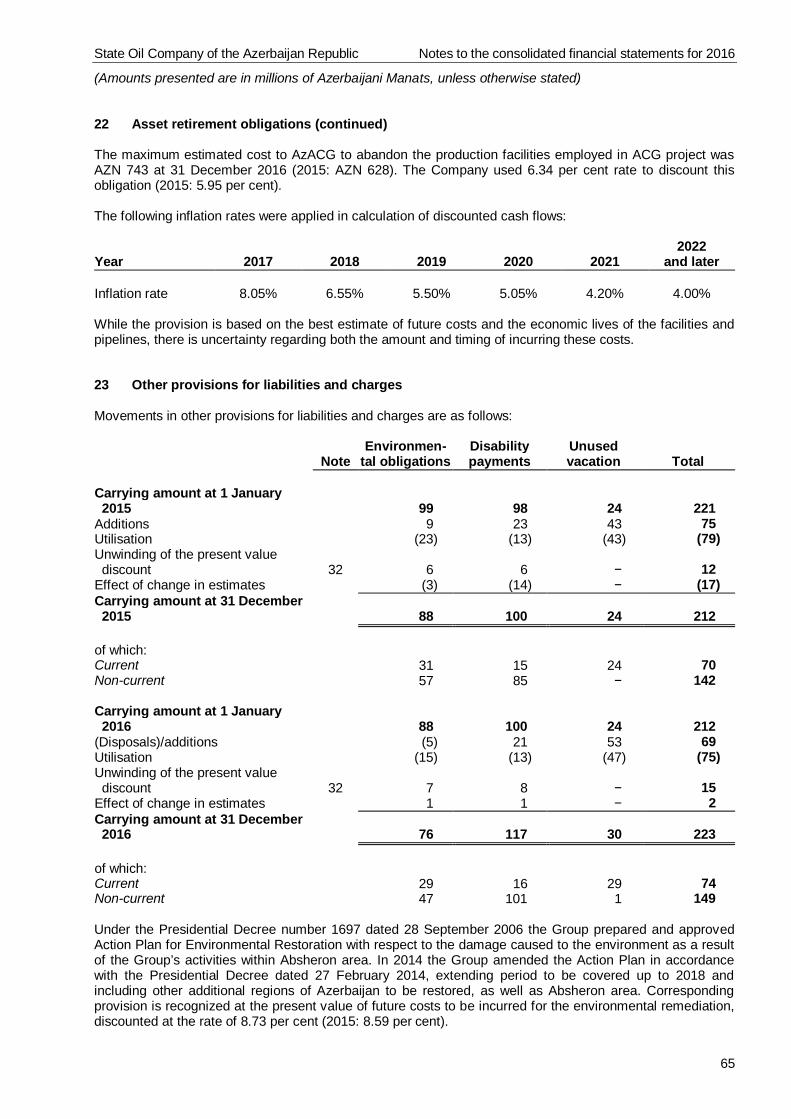
State Oil Company of the Azerbaijan Republic Notes to the consolidated financial statements for 2016
(Amounts presented are in millions of Azerbaijani Manats, unless otherwise stated)
65
22 Asset retirement obligations (continued)
The maximum estimated cost to AzACG to abandon the production facilities employed in ACG project wasAZN 743 at 31 December 2016 (2015: AZN 628). The Company used 6.34 per cent rate to discount thisobligation (2015: 5.95 per cent).
The following inflation rates were applied in calculation of discounted cash flows:
Year 2017 2018 2019 2020 20212022
and later
Inflation rate 8.05% 6.55% 5.50% 5.05% 4.20% 4.00%
While the provision is based on the best estimate of future costs and the economic lives of the facilities andpipelines, there is uncertainty regarding both the amount and timing of incurring these costs.
23 Other provisions for liabilities and charges
Movements in other provisions for liabilities and charges are as follows:
NoteEnvironmen-
tal obligationsDisabilitypayments
Unusedvacation Total
Carrying amount at 1 January2015 99 98 24 221
Additions 9 23 43 75Utilisation (23) (13) (43) (79)Unwinding of the present valuediscount 32 6 6 − 12
Effect of change in estimates (3) (14) − (17)Carrying amount at 31 December2015 88 100 24 212
of which:Current 31 15 24 70Non-current 57 85 − 142
Carrying amount at 1 January2016 88 100 24 212
(Disposals)/additions (5) 21 53 69Utilisation (15) (13) (47) (75)Unwinding of the present valuediscount 32 7 8 − 15
Effect of change in estimates 1 1 − 2Carrying amount at 31 December2016 76 117 30 223
of which:Current 29 16 29 74Non-current 47 101 1 149
Under the Presidential Decree number 1697 dated 28 September 2006 the Group prepared and approvedAction Plan for Environmental Restoration with respect to the damage caused to the environment as a resultof the Group’s activities within Absheron area. In 2014 the Group amended the Action Plan in accordancewith the Presidential Decree dated 27 February 2014, extending period to be covered up to 2018 andincluding other additional regions of Azerbaijan to be restored, as well as Absheron area. Correspondingprovision is recognized at the present value of future costs to be incurred for the environmental remediation,discounted at the rate of 8.73 per cent (2015: 8.59 per cent).
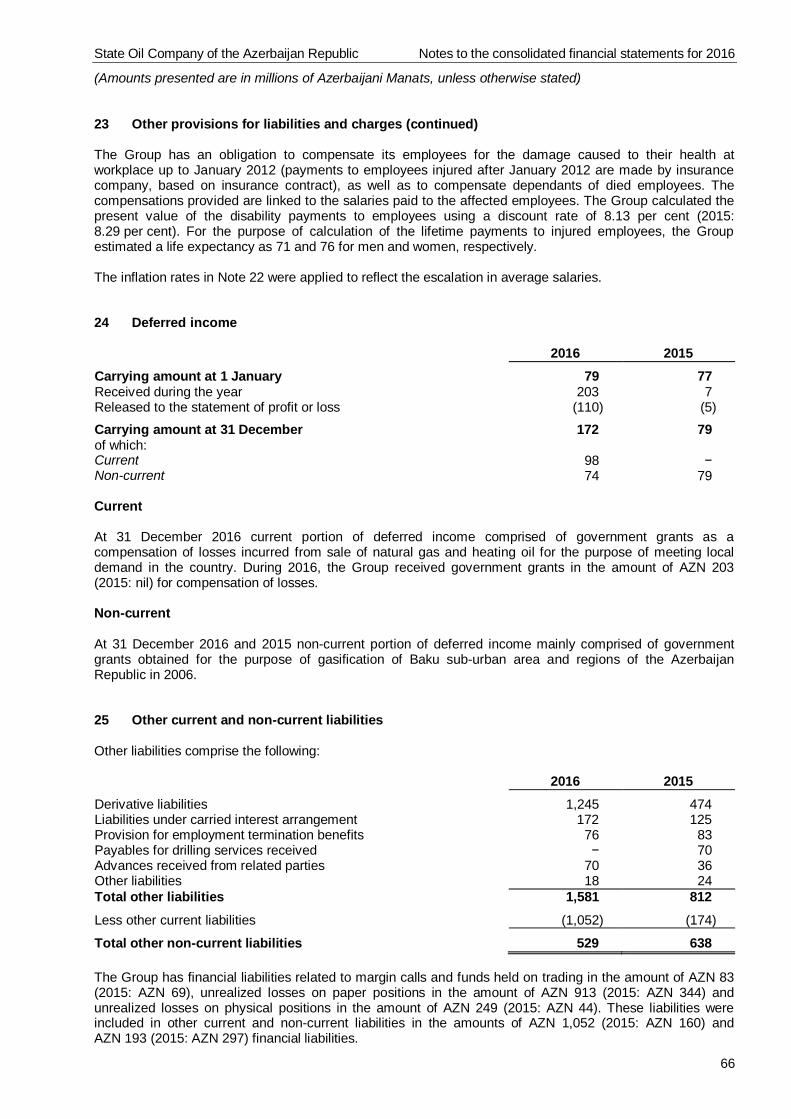
State Oil Company of the Azerbaijan Republic Notes to the consolidated financial statements for 2016
(Amounts presented are in millions of Azerbaijani Manats, unless otherwise stated)
66
23 Other provisions for liabilities and charges (continued)
The Group has an obligation to compensate its employees for the damage caused to their health atworkplace up to January 2012 (payments to employees injured after January 2012 are made by insurancecompany, based on insurance contract), as well as to compensate dependants of died employees. Thecompensations provided are linked to the salaries paid to the affected employees. The Group calculated thepresent value of the disability payments to employees using a discount rate of 8.13 per cent (2015:8.29 per cent). For the purpose of calculation of the lifetime payments to injured employees, the Groupestimated a life expectancy as 71 and 76 for men and women, respectively.
The inflation rates in Note 22 were applied to reflect the escalation in average salaries.
24 Deferred income
2016 2015Carrying amount at 1 January 79 77Received during the year 203 7Released to the statement of profit or loss (110) (5)
Carrying amount at 31 December 172 79of which:Current 98 −Non-current 74 79
Current
At 31 December 2016 current portion of deferred income comprised of government grants as acompensation of losses incurred from sale of natural gas and heating oil for the purpose of meeting localdemand in the country. During 2016, the Group received government grants in the amount of AZN 203(2015: nil) for compensation of losses.
Non-current
At 31 December 2016 and 2015 non-current portion of deferred income mainly comprised of governmentgrants obtained for the purpose of gasification of Baku sub-urban area and regions of the AzerbaijanRepublic in 2006.
25 Other current and non-current liabilities
Other liabilities comprise the following:
2016 2015Derivative liabilities 1,245 474Liabilities under carried interest arrangement 172 125Provision for employment termination benefits 76 83Payables for drilling services received − 70Advances received from related parties 70 36Other liabilities 18 24Total other liabilities 1,581 812Less other current liabilities (1,052) (174)
Total other non-current liabilities 529 638
The Group has financial liabilities related to margin calls and funds held on trading in the amount of AZN 83(2015: AZN 69), unrealized losses on paper positions in the amount of AZN 913 (2015: AZN 344) andunrealized losses on physical positions in the amount of AZN 249 (2015: AZN 44). These liabilities wereincluded in other current and non-current liabilities in the amounts of AZN 1,052 (2015: AZN 160) andAZN 193 (2015: AZN 297) financial liabilities.
State Oil Company of the Azerbaijan Republic Notes to the consolidated financial statements for 2016
(Amounts presented are in millions of Azerbaijani Manats, unless otherwise stated)
67
25 Other current and non-current liabilities (continued)
Under Turkish Labor Law, the Group is required to pay termination benefits to each employee who hascompleted one year of service and whose employment is terminated without due cause, is called up formilitary service, dies or who retires after completing 25 years of service (20 years for women) and achievesthe retirement age (58 for women and 60 for men).
The liability is not funded, as there is no funding requirement. The provision is calculated by estimating thepresent value of the future probable obligation of the Group arising from the retirement of the employees.IAS 19 requires actuarial valuation methods to be developed to estimate the enterprises’ obligation underdefined benefit plans. Accordingly, the following actuarial assumptions were used in the calculation of thetotal liability:
2016 2015
Discount rate (per cent) 3.61 4.39Probability of retirement (per cent) 100 95
The principal assumption is that the maximum liability for each year of service will increase in line withinflation. Thus the discount rate applied represents the expected real rate after adjusting for the anticipatedeffects of future inflation.
Movement of the provision for employment termination benefits were as follows:
2016 2015
Carrying amount at 1 January 83 38Actuarial loss and service cost 4 5Payments during the year (8) (4)Defined (obligation)/benefit pension plan (10) 13Other 5 1Translation to presentation currency 2 30
Carrying amount at 31 December 76 83
26 Deferred acquisition consideration payable
The Group has deferred cash consideration payable in the amount of AZN 67 (2015: AZN 59) for thepurchase of remaining 49 per cent shares of SOCAR Petroleum CJSC from other shareholder.
In addition to this the Group has deferred cash consideration payable in the amount of AZN 86 (2015:AZN 74) for acquisition of SOCAR Trading and other entities.
27 Charter capital, additional paid-in-capital, retained earnings and gain on sale of subsidiaryshare
Charter capital
SOCAR as a holding company of the Group has a legal status of a state enterprise. Increase in the amountof AZN 185 in charter capital was registered during 2016 and accordingly the amount was reclassified fromadditional paid in capital to charter capital (2015: AZN 121).
Additional paid-in capital (“APIC”)
During 2016 Government contributed to the charter capital of the Group in the amount of AZN 921 (2015:AZN 581). The increase in charter capital was not registered as of 31 December 2016 and recognized asAPIC.
State Oil Company of the Azerbaijan Republic Notes to the consolidated financial statements for 2016
(Amounts presented are in millions of Azerbaijani Manats, unless otherwise stated)
68
27 Charter capital, additional paid-in-capital, retained earnings and gain on sale of subsidiaryshare (continued)
Distribution to the Government
Based on decisions of the Government, the Group is periodically mandated to make direct cash contributionsor finance construction and repair works for the Government (including transfer of assets), variousgovernment agencies and projects administered by the Government. During the year 2016, such direct cashtransfers to the Government and financing (made in the form of payments to sub-contractors ofgovernmental entities) amounted to AZN 56 and AZN 17, respectively (2015: AZN 140 and AZN 186,respectively), mainly for repair and reconstruction of existing, as well as construction of new recreational,transport, educational and medical infrastructure of the Azerbaijan Republic. As at 31 December 2016 therewas no financing in the form of transfer of assets constructed by the Group (2015: AZN 13).
Gain on sale of subsidiary share
During 2016, the Group sold its 6.75 per cent shares of Petkim Petrokimya Holding A.Ş with the carryingamount in the amount of AZN 172 (TRY 326 million) and recognized gain in the amount of AZN 46(TRY 87 million) within the equity. Gain on sale of shares in subsidiaries during 2015 is disclosed in Note 35.
28 Analysis of revenue by categories
2016 2015Crude oil, net 29,613 14,453Oil products, net 11,759 11,391Petrochemicals 2,643 1,835Natural gas 1,952 1,683Other revenue 5,938 3,741Total revenue 51,905 33,103
Revenue from crude oil sales is stated net of price margin tax which is levied in the Azerbaijan Republic onthe margins between the international market price and internal state-regulated price on crude oil. Thedifference between the market price and the internal state-regulated price is taxed at the rate of 30 per centand the amount of tax is transferred to the State Budget.
Revenue from oil product sales is stated net of excise tax of AZN 423 (2015: AZN 429).
Revenue from sales of crude oil produced under ACG PSA and condensate produced underShah Deniz PSA is not subject to excise and price margin taxes mentioned above.
29 Analysis of expenses by nature
Note 2016 2015Raw materials and consumables used 44,265 27,136Depreciation of property, plant and equipment 1,014 1,049Wages, salaries and social security costs 1,297 1,016Transportation and vehicle maintenance 714 252Repairs and maintenance expenses 189 220Impairment of property, plant and equipment 15 322 254Mining tax 7 103 110Utilities expense 307 242Taxes other than on income 178 115Amortization expense 16 40 30Impairment of trade and other receivables and other financialassets 493 38
Change in other provisions for liabilities and charges 23 71 58Other 1,531 1,295Total cost of sales, exploration and evaluation, distribution,general and administrative and other operating expenses 50,524 31,815
State Oil Company of the Azerbaijan Republic Notes to the consolidated financial statements for 2016
(Amounts presented are in millions of Azerbaijani Manats, unless otherwise stated)
69
30 Other operating income
2016 2015
Government grant (Note 24) 110 5Rig upgrade reimbursed by third party 387 −Sales of other goods and services rendered 18 15Gain on release of borrowings − 22Other 182 119
Total other operating income 697 161
31 Finance income
2016 2015
Interest income on deposits and bank accounts 170 38Other 19 27
Total finance income 189 65
32 Finance costs
Note 2016 2015
Interest expense 778 429Provisions for asset retirement obligations: unwinding of thepresent value discount 22 48 35
Environmental provision: unwinding of the present valuediscount 23 7 6
Provision for disability payments: unwinding of the presentvalue discount 23 8 6
Total finance costs 841 476
33 Income taxes
Income tax expense comprises the following:
2016 2015
Current tax expense 537 394Deferred tax charge/(benefit) 49 (193)
Income tax expense reported in the statement of profit or loss 586 201
State Oil Company of the Azerbaijan Republic Notes to the consolidated financial statements for 2016
(Amounts presented are in millions of Azerbaijani Manats, unless otherwise stated)
70
33 Income taxes (continued)
Reconciliation between the expected and the actual taxation charge is provided below:
2016 2015
Profit/(loss) before tax 936 (1,584)Theoretical tax charge/(benefit) at statutory rate of 20 per cent 187 (317)
Effects of different tax rates for certain subsidiaries (25 and27 per cent) 22 5
Tax effect of items which are not deductible or assessable for taxationpurposes:
- Income which is exempt from taxation (236) (40)- Non-deductible expenses 176 58Allowance for deferred tax assets 294 535Current income tax on non-resident dividends 38 14Recognition of previously unrecognized deferred tax asset (48) −Income not recognized in IFRS 15 31Unused investment incentives on which deferred income tax assetsrecognized (48) (70)
Potential income tax on retained profit/(loss) of subsidiaries,associates and joint ventures 137 (12)
Other 49 (3)
Income tax expense reported in the statement of profit or loss 586 201
Non-deductible expenses are mainly comprised of the social and employee-related expenses, as well as theprovision for impaired receivables which are not expected to be deductible from taxable income in future.Allowance for deferred tax assets mainly relates to the accumulated tax losses of the Group’s subsidiarieswhich are not expected to utilize these losses.
At 31 December 2016 cumulative balance of unrecognized deferred tax assets is AZN 1,206 (2015:AZN 960).
At 31 December 2016 the Group recognized deferred income tax asset on the portion of unused investmentincentive for which the realization of the related tax benefit through the future taxable profit has deemedprobable with respect to its projections.
At 31 December 2016, benefits arising from previously unrecognized deferred tax assets were used duringthe year to reduce deferred tax and current tax expenses by the amount of AZN 39 and AZN 9 (2015: nil),respectively.
At 31 December 2016 and 2015 the Group recognized deferred income tax benefit and charge in the amountof AZN 19 and AZN 124, respectively, on the exchange differences arising on translation of the financialstatements of foreign operations and charged to OCI.
As at 31 December 2016 the Group has not recognised deferred tax liability in the amount of AZN 148 (31December 2015: AZN 65) in respect of taxable temporary differences associated with investments insubsidiaries as the Group is able to control the timing of the reversal of those temporary differences and it isnot expected to reverse them in the foreseeable future.
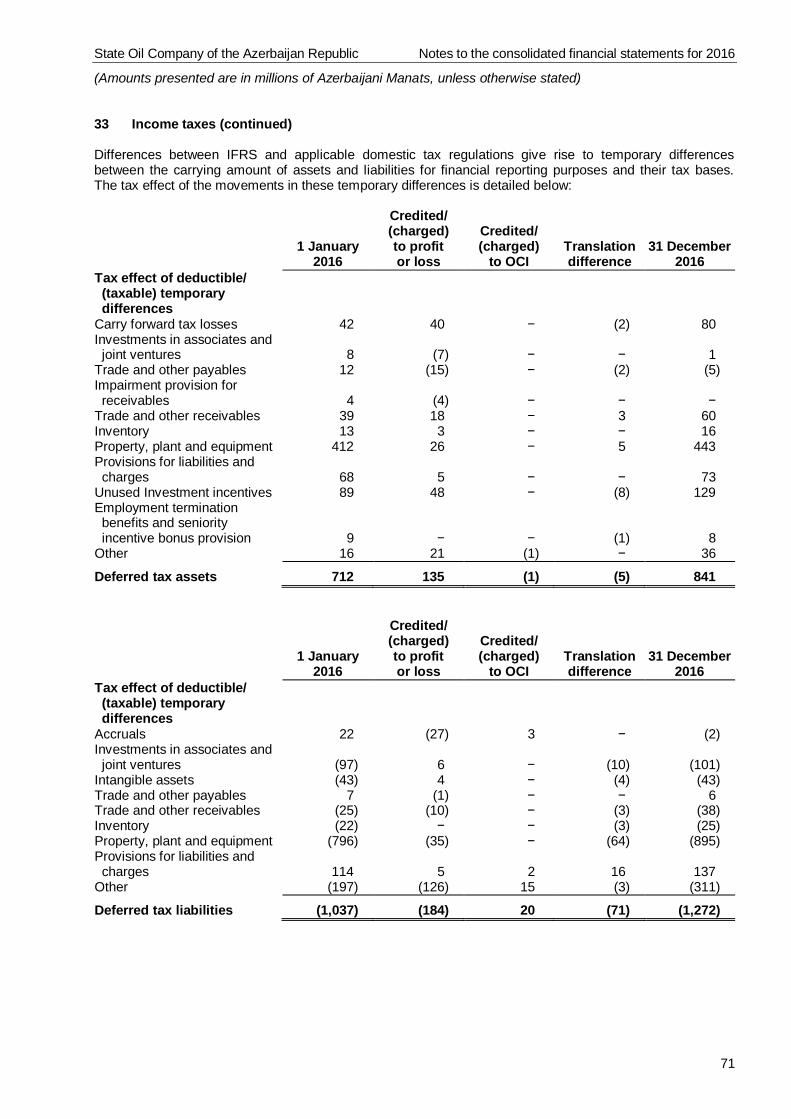
State Oil Company of the Azerbaijan Republic Notes to the consolidated financial statements for 2016
(Amounts presented are in millions of Azerbaijani Manats, unless otherwise stated)
71
33 Income taxes (continued)
Differences between IFRS and applicable domestic tax regulations give rise to temporary differencesbetween the carrying amount of assets and liabilities for financial reporting purposes and their tax bases.The tax effect of the movements in these temporary differences is detailed below:
1 January2016
Credited/(charged)to profitor loss
Credited/(charged)
to OCITranslationdifference
31 December2016
Tax effect of deductible/(taxable) temporarydifferences
Carry forward tax losses 42 40 − (2) 80Investments in associates andjoint ventures 8 (7) − − 1
Trade and other payables 12 (15) − (2) (5)Impairment provision forreceivables 4 (4) − − −
Trade and other receivables 39 18 − 3 60Inventory 13 3 − − 16Property, plant and equipment 412 26 − 5 443Provisions for liabilities andcharges 68 5 − − 73
Unused Investment incentives 89 48 − (8) 129Employment terminationbenefits and seniorityincentive bonus provision 9 − − (1) 8
Other 16 21 (1) − 36
Deferred tax assets 712 135 (1) (5) 841
1 January2016
Credited/(charged)to profitor loss
Credited/(charged)
to OCITranslationdifference
31 December2016
Tax effect of deductible/(taxable) temporarydifferences
Accruals 22 (27) 3 − (2)Investments in associates andjoint ventures (97) 6 − (10) (101)
Intangible assets (43) 4 − (4) (43)Trade and other payables 7 (1) − − 6Trade and other receivables (25) (10) − (3) (38)Inventory (22) − − (3) (25)Property, plant and equipment (796) (35) − (64) (895)Provisions for liabilities andcharges 114 5 2 16 137
Other (197) (126) 15 (3) (311)
Deferred tax liabilities (1,037) (184) 20 (71) (1,272)
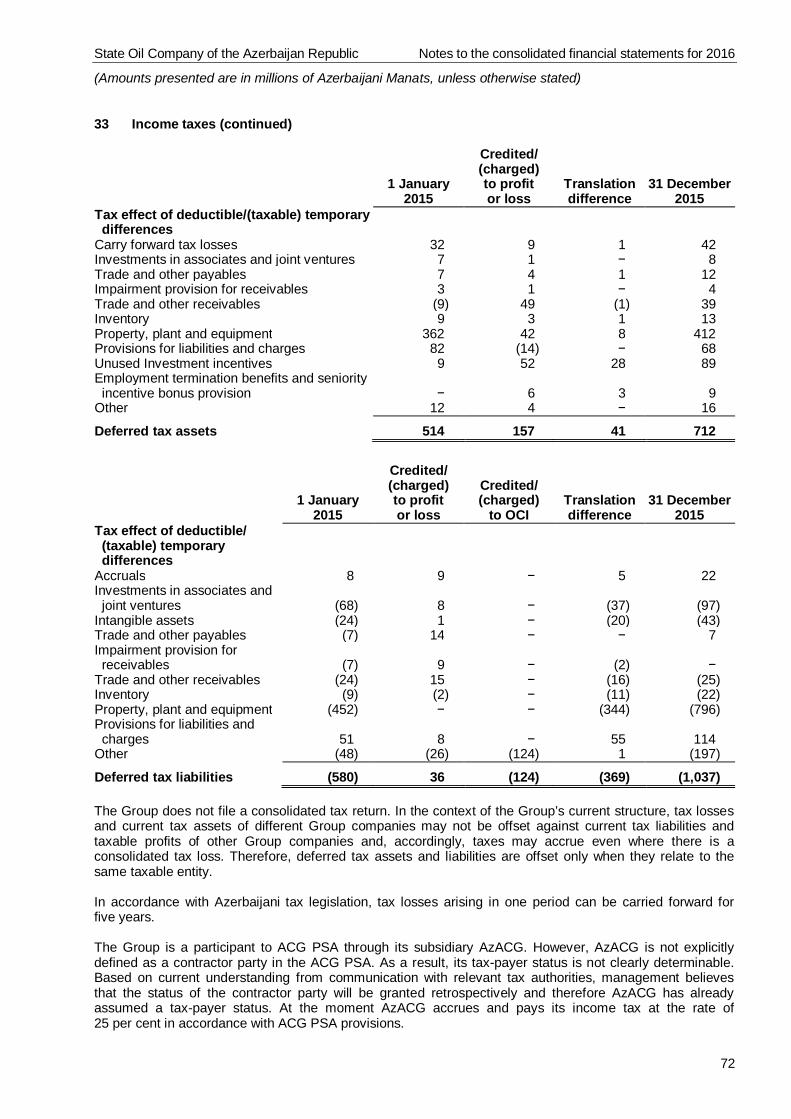
State Oil Company of the Azerbaijan Republic Notes to the consolidated financial statements for 2016
(Amounts presented are in millions of Azerbaijani Manats, unless otherwise stated)
72
33 Income taxes (continued)
1 January2015
Credited/(charged)to profitor loss
Translationdifference
31 December2015
Tax effect of deductible/(taxable) temporarydifferences
Carry forward tax losses 32 9 1 42Investments in associates and joint ventures 7 1 − 8Trade and other payables 7 4 1 12Impairment provision for receivables 3 1 − 4Trade and other receivables (9) 49 (1) 39Inventory 9 3 1 13Property, plant and equipment 362 42 8 412Provisions for liabilities and charges 82 (14) − 68Unused Investment incentives 9 52 28 89Employment termination benefits and seniorityincentive bonus provision − 6 3 9
Other 12 4 − 16
Deferred tax assets 514 157 41 712
1 January2015
Credited/(charged)to profitor loss
Credited/(charged)
to OCITranslationdifference
31 December2015
Tax effect of deductible/(taxable) temporarydifferences
Accruals 8 9 − 5 22Investments in associates andjoint ventures (68) 8 − (37) (97)
Intangible assets (24) 1 − (20) (43)Trade and other payables (7) 14 − − 7Impairment provision forreceivables (7) 9 − (2) −
Trade and other receivables (24) 15 − (16) (25)Inventory (9) (2) − (11) (22)Property, plant and equipment (452) − − (344) (796)Provisions for liabilities andcharges 51 8 − 55 114
Other (48) (26) (124) 1 (197)
Deferred tax liabilities (580) 36 (124) (369) (1,037)
The Group does not file a consolidated tax return. In the context of the Group’s current structure, tax lossesand current tax assets of different Group companies may not be offset against current tax liabilities andtaxable profits of other Group companies and, accordingly, taxes may accrue even where there is aconsolidated tax loss. Therefore, deferred tax assets and liabilities are offset only when they relate to thesame taxable entity.
In accordance with Azerbaijani tax legislation, tax losses arising in one period can be carried forward forfive years.
The Group is a participant to ACG PSA through its subsidiary AzACG. However, AzACG is not explicitlydefined as a contractor party in the ACG PSA. As a result, its tax-payer status is not clearly determinable.Based on current understanding from communication with relevant tax authorities, management believesthat the status of the contractor party will be granted retrospectively and therefore AzACG has alreadyassumed a tax-payer status. At the moment AzACG accrues and pays its income tax at the rate of25 per cent in accordance with ACG PSA provisions.
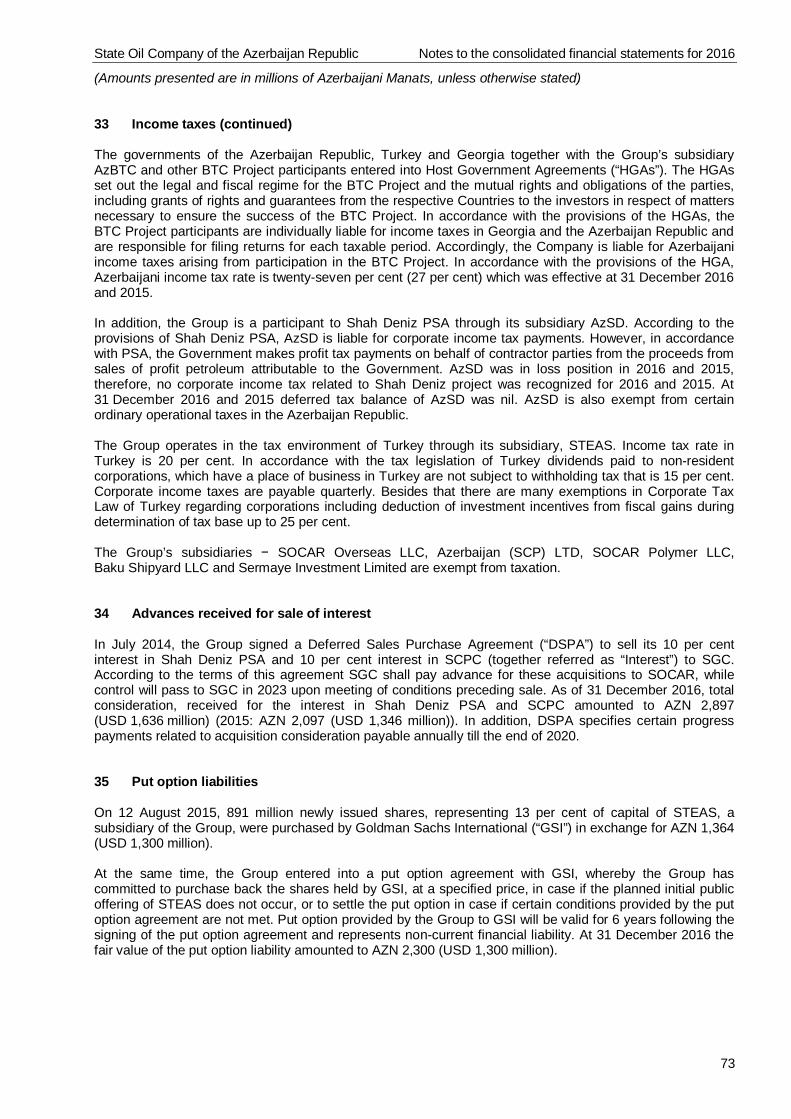
State Oil Company of the Azerbaijan Republic Notes to the consolidated financial statements for 2016
(Amounts presented are in millions of Azerbaijani Manats, unless otherwise stated)
73
33 Income taxes (continued)
The governments of the Azerbaijan Republic, Turkey and Georgia together with the Group’s subsidiaryAzBTC and other BTC Project participants entered into Host Government Agreements (“HGAs”). The HGAsset out the legal and fiscal regime for the BTC Project and the mutual rights and obligations of the parties,including grants of rights and guarantees from the respective Countries to the investors in respect of mattersnecessary to ensure the success of the BTC Project. In accordance with the provisions of the HGAs, theBTC Project participants are individually liable for income taxes in Georgia and the Azerbaijan Republic andare responsible for filing returns for each taxable period. Accordingly, the Company is liable for Azerbaijaniincome taxes arising from participation in the BTC Project. In accordance with the provisions of the HGA,Azerbaijani income tax rate is twenty-seven per cent (27 per cent) which was effective at 31 December 2016and 2015.
In addition, the Group is a participant to Shah Deniz PSA through its subsidiary AzSD. According to theprovisions of Shah Deniz PSA, AzSD is liable for corporate income tax payments. However, in accordancewith PSA, the Government makes profit tax payments on behalf of contractor parties from the proceeds fromsales of profit petroleum attributable to the Government. AzSD was in loss position in 2016 and 2015,therefore, no corporate income tax related to Shah Deniz project was recognized for 2016 and 2015. At31 December 2016 and 2015 deferred tax balance of AzSD was nil. AzSD is also exempt from certainordinary operational taxes in the Azerbaijan Republic.
The Group operates in the tax environment of Turkey through its subsidiary, STEAS. Income tax rate inTurkey is 20 per cent. In accordance with the tax legislation of Turkey dividends paid to non-residentcorporations, which have a place of business in Turkey are not subject to withholding tax that is 15 per cent.Corporate income taxes are payable quarterly. Besides that there are many exemptions in Corporate TaxLaw of Turkey regarding corporations including deduction of investment incentives from fiscal gains duringdetermination of tax base up to 25 per cent.
The Group’s subsidiaries − SOCAR Overseas LLC, Azerbaijan (SCP) LTD, SOCAR Polymer LLC,Baku Shipyard LLC and Sermaye Investment Limited are exempt from taxation.
34 Advances received for sale of interest
In July 2014, the Group signed a Deferred Sales Purchase Agreement (“DSPA”) to sell its 10 per centinterest in Shah Deniz PSA and 10 per cent interest in SCPC (together referred as “Interest”) to SGC.According to the terms of this agreement SGC shall pay advance for these acquisitions to SOCAR, whilecontrol will pass to SGC in 2023 upon meeting of conditions preceding sale. As of 31 December 2016, totalconsideration, received for the interest in Shah Deniz PSA and SCPC amounted to AZN 2,897(USD 1,636 million) (2015: AZN 2,097 (USD 1,346 million)). In addition, DSPA specifies certain progresspayments related to acquisition consideration payable annually till the end of 2020.
35 Put option liabilities
On 12 August 2015, 891 million newly issued shares, representing 13 per cent of capital of STEAS, asubsidiary of the Group, were purchased by Goldman Sachs International (“GSI”) in exchange for AZN 1,364(USD 1,300 million).
At the same time, the Group entered into a put option agreement with GSI, whereby the Group hascommitted to purchase back the shares held by GSI, at a specified price, in case if the planned initial publicoffering of STEAS does not occur, or to settle the put option in case if certain conditions provided by the putoption agreement are not met. Put option provided by the Group to GSI will be valid for 6 years following thesigning of the put option agreement and represents non-current financial liability. At 31 December 2016 thefair value of the put option liability amounted to AZN 2,300 (USD 1,300 million).
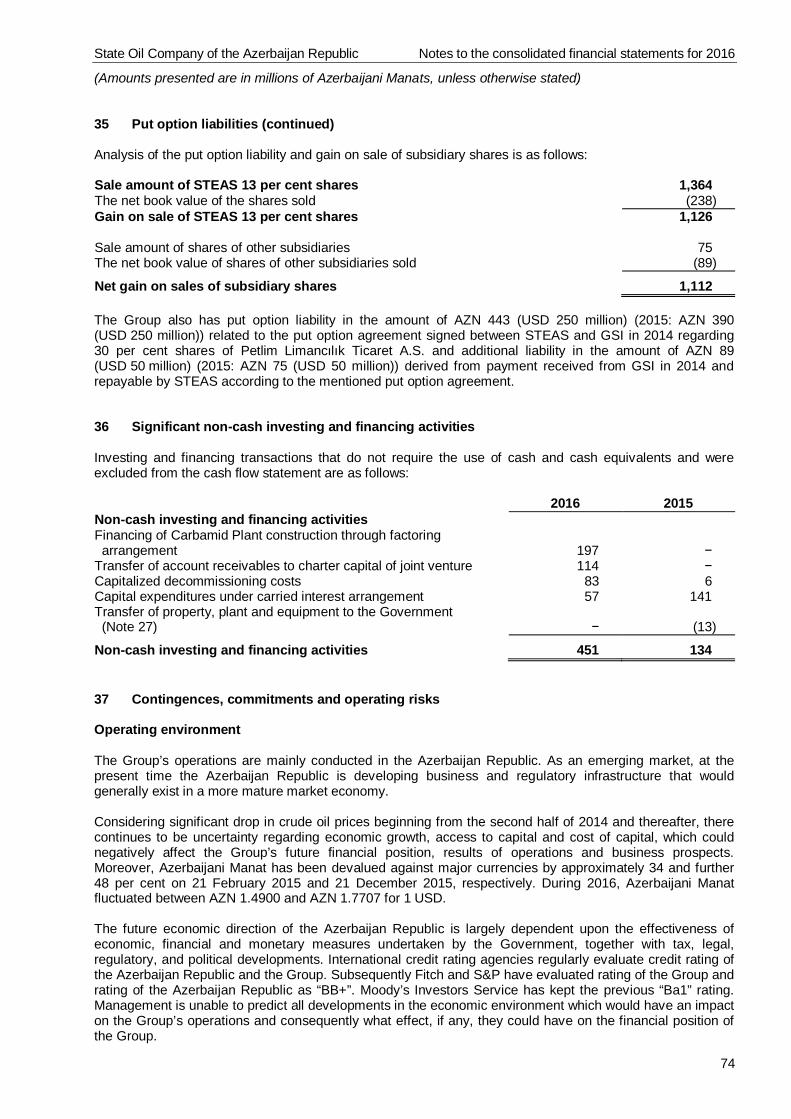
State Oil Company of the Azerbaijan Republic Notes to the consolidated financial statements for 2016
(Amounts presented are in millions of Azerbaijani Manats, unless otherwise stated)
74
35 Put option liabilities (continued)
Analysis of the put option liability and gain on sale of subsidiary shares is as follows:
Sale amount of STEAS 13 per cent shares 1,364The net book value of the shares sold (238)Gain on sale of STEAS 13 per cent shares
Sale amount of shares of other subsidiaries
1,126
75The net book value of shares of other subsidiaries sold (89)
Net gain on sales of subsidiary shares 1,112
The Group also has put option liability in the amount of AZN 443 (USD 250 million) (2015: AZN 390(USD 250 million)) related to the put option agreement signed between STEAS and GSI in 2014 regarding30 per cent shares of Petlim Limancılık Ticaret A.S. and additional liability in the amount of AZN 89(USD 50 million) (2015: AZN 75 (USD 50 million)) derived from payment received from GSI in 2014 andrepayable by STEAS according to the mentioned put option agreement.
36 Significant non-cash investing and financing activities
Investing and financing transactions that do not require the use of cash and cash equivalents and wereexcluded from the cash flow statement are as follows:
2016 2015Non-cash investing and financing activitiesFinancing of Carbamid Plant construction through factoringarrangement 197 −
Transfer of account receivables to charter capital of joint venture 114 −Capitalized decommissioning costs 83 6Capital expenditures under carried interest arrangement 57 141Transfer of property, plant and equipment to the Government(Note 27) − (13)
Non-cash investing and financing activities 451 134
37 Contingences, commitments and operating risks
Operating environment
The Group’s operations are mainly conducted in the Azerbaijan Republic. As an emerging market, at thepresent time the Azerbaijan Republic is developing business and regulatory infrastructure that wouldgenerally exist in a more mature market economy.
Considering significant drop in crude oil prices beginning from the second half of 2014 and thereafter, therecontinues to be uncertainty regarding economic growth, access to capital and cost of capital, which couldnegatively affect the Group’s future financial position, results of operations and business prospects.Moreover, Azerbaijani Manat has been devalued against major currencies by approximately 34 and further48 per cent on 21 February 2015 and 21 December 2015, respectively. During 2016, Azerbaijani Manatfluctuated between AZN 1.4900 and AZN 1.7707 for 1 USD.
The future economic direction of the Azerbaijan Republic is largely dependent upon the effectiveness ofeconomic, financial and monetary measures undertaken by the Government, together with tax, legal,regulatory, and political developments. International credit rating agencies regularly evaluate credit rating ofthe Azerbaijan Republic and the Group. Subsequently Fitch and S&P have evaluated rating of the Group andrating of the Azerbaijan Republic as “BB+”. Moody’s Investors Service has kept the previous “Ba1” rating.Management is unable to predict all developments in the economic environment which would have an impacton the Group’s operations and consequently what effect, if any, they could have on the financial position ofthe Group.
State Oil Company of the Azerbaijan Republic Notes to the consolidated financial statements for 2016
(Amounts presented are in millions of Azerbaijani Manats, unless otherwise stated)
75
37 Contingences, commitments and operating risks (continued)
Operating environment (continued)
The Azerbaijani economy is vulnerable to market downturns and economic slowdowns elsewhere in theworld. While the Azerbaijan Government has introduced a range of stabilization measures and asmanagement believes it is taking appropriate measures to support the sustainability of the Group’s businessin the current circumstances, unexpected further deterioration in the areas described above could negativelyaffect the Group’s results and financial position in a manner not currently determinable.
The Group’s activities in Ukraine are exposed to, amongst others, low levels of liquidity in the capital marketsand the existence of currency controls which cause the national currency to be illiquid outside of Ukraine.The stability of the Ukrainian economy will be significantly impacted by the Government’s policies andactions with regard to administrative, fiscal, legal, and economic reforms. As a result, operations in Ukraineinvolve risks that are not typical for developed markets. The Ukrainian economy is vulnerable to marketdownturns and economic slowdowns elsewhere in the world.
Significant changes occurred in operating environment and political situation in Ukraine at the end of 2013 −beginning of 2014, which resulted in political and economic instability and continued to deterioratesignificantly further. From 1 January 2016 to 31 December 2016, the Ukrainian Hryvnia (the “UAH”)depreciated against major foreign currencies by approximately 12 and 8 per cent calculated based on theNational Bank of Ukraine’s (“NBU”s) exchange rates of UAH to US Dollar and Euro, respectively (from1 January 2015 to 31 December 2015: 52 and 36 per cent respectively) and NBU continues to extendpreviously imposed restrictions on purchase of foreign currencies at the inter-bank market, cross bordersettlements (including payment of dividends) and also mandated obligatory conversion of foreign currencyproceeds into UAH. The international rating agencies have downgraded sovereign debt ratings for Ukraine.The combination of the above events has resulted in a deterioration of liquidity and much tighter creditconditions where credit is available. Management is monitoring these developments in the currentenvironment and taking actions where appropriate. Further negative developments, including the politicalunrest, could adversely affect the Group’s subsidiary, SOCAR Energy Ukraine’s results and financial positionin a manner not currently determinable. These consolidated financial statements do not include anyadjustments that may result from the future clarification of these uncertainties. Such adjustments, if any, willbe reported in the period when they become known and estimable.
Legal proceedings
From time to time and in the normal course of business, claims against the Group are received. On the basisof its own estimates and both internal and external professional advice management is of the opinion that nomaterial losses will be incurred in respect of claims in excess of provisions that have been made in theseconsolidated financial statements.
Tax legislation
Azerbaijan tax, currency and customs legislation is subject to varying interpretations, and changes, whichmay occur frequently. Management’s interpretation of such legislation as applied to the transactions andactivity of the Group may be challenged by the relevant authorities.
Fiscal periods remain open to review by the tax authorities in respect of taxes for three calendar yearspreceding the year of tax audit. Under certain circumstances such reviews may cover longer periods.
The Group’s management believes that its interpretation of the relevant legislation is appropriate and theGroup’s tax, currency legislation and customs positions will be sustained and potential tax liabilities of theGroup will not exceed the amounts recorded in these consolidated financial statements. Accordingly, at31 December 2016 and 2015 no provision for potential tax liabilities had been recorded.
State Oil Company of the Azerbaijan Republic Notes to the consolidated financial statements for 2016
(Amounts presented are in millions of Azerbaijani Manats, unless otherwise stated)
76
37 Contingences, commitments and operating risks (continued)
Environmental matters
The enforcement of environmental regulation in the Azerbaijan Republic is evolving and the enforcementposture of government authorities is continually being reconsidered. The Group periodically evaluates itsobligations under environmental regulations. As obligations are determined, they are recognizedimmediately. Potential liabilities, which might arise as a result of changes in existing regulations, civillitigation or legislation, cannot be estimated but could be material. In the current enforcement climate underexisting legislation, management believes that there are no significant liabilities for environmental damageabove environmental obligation provision currently made by the Group. See Note 23.
The Group is subject to numerous national and local environmental laws and regulations concerning itsproducts, operations and other activities. These laws and regulations may require the Group to take futureaction to remediate the effects on the environment of prior disposal or release of chemicals or petroleumsubstances by the Group or other parties. Such contingencies may exist for various sites including refineries,chemical plants, oil fields, service stations, terminals and waste disposal sites. In addition, the Group mayhave obligations relating to prior asset sales or closed facilities. The ultimate requirement for remediationand its cost are inherently difficult to estimate. However, the estimated cost of known environmentalobligations has been provided in the consolidated financial statements in accordance with the Group’saccounting policies. While the amounts of future costs could be significant and could be material to theGroup’s results of operations in the period in which they are recognized, it is not practical to estimate theamounts involved. The Group does not expect these costs to have a material effect on the Group’s financialposition or liquidity.
The Group also has obligations to decommission oil and natural gas production facilities and relatedpipelines. Provision is made for the estimated costs of these activities, however there is uncertaintyregarding both the amount and timing of these costs, given the long-term nature of these obligations.
The Group believes that the impact of any reasonably foreseeable changes to these provisions on theGroup’s results of operations, financial position or liquidity will not be material.
Compliance with financial covenants
At 31 December 2016 the Group had loans payable in total amount of AZN 14,927 (2015: AZN 10,911)which were received for financing its investing and operating activity. The Group is subject to certain financialcovenants related to these borrowings. Non-compliance with such covenants may result in negativeconsequences for the Group including growth in the cost of borrowings and declaration of default.Management believes that, as of 31 December 2016 and 2015 the Group was in compliance with allapplicable financial covenants.
Commitments of Petkim
During 2015 Petlim Limancılık Ticaret A.Ş, where Group subsidiary Petkim owns 70 per cent shares, hassigned a project finance credit agreement with AKBANK T.A.Ş. in the amount of USD 212 million (AZN 375)which has 13 years of maturity with no repayment during first 3 years period, for the external funding of thecontainer port project. Petkim has pledged its shares in Petlim amounting to TRY 105 million (AZN 53) as aguarantee for the loan repayment. The project has financial ration liabilities that are valid during theoperating period. Additionally, a mortgage amounting to USD 350 million (AZN 620) million was establishedby Petkim on Petlim's land sold.
At 31 December 2016 STEAS has a commitment to purchase 943,746,586 cubic meters of natural gas fromBOTAS Petroleum Pipeline Corporation (“BOTAS”) in 2017.
State Oil Company of the Azerbaijan Republic Notes to the consolidated financial statements for 2016
(Amounts presented are in millions of Azerbaijani Manats, unless otherwise stated)
77
37 Contingences, commitments and operating risks (continued)
Guarantee received and given by Petkim
The following table demonstrates guarantees received and given by the Group at 31 December:
2016 2015Guarantees receivedBank guarantees within the context of direct order collection system(DOCS) 247 321
Letters of guarantee received from customers 145 174Letters of guarantee received from suppliers 96 90Receivable Insurance 42 41Letters of credit received 48 −Other 2 2
Total guarantees received 580 628
Guarantees givenLetters of guarantee given 604 354
Total guarantees given 604 354
Commitment of Azerigas PU
Based on Presidential Decree number 118 dated 27 February 2014, directed to social-economicdevelopment of Baku area and regions of the Republic of Azerbaijan, Azerigas PU has certain commitmentswith respect to improvement of gasification options in mentioned areas for years 2014-2018. According tothis decree, Azerigas PU would be engaged in restoration of old local gas pipelines, continue gasification ofnew residential communities/regions/far locations, and renewal of old industrial and personal meters forphysical customers.
Management believes that these expenditures will continue to be financed by the Government throughcontributions into capital.
Gas purchase commitment
Based on the Gas Sales and Purchase Agreement signed on 27 February 2003 between Azerbaijan GasSupply Company (“AGSC”) and the Ministry of Fuel and Energy of the Azerbaijan Republic (currentlypurchase rights under this agreement are executed by the Group), the Group has obligation to purchaseseller’s minimum annual quantity as indicated in the agreement for the period beginning from signing of thecontract up to the termination date of Shah Deniz PSA. As at 31 December 2016 monetary amount ofcommitment to purchase seller’s minimum annual quantity is USD 87 million (AZN 154) (2015:USD 87 million (AZN 136)).
Shah Deniz Debottlenecking agreement was signed between AGSC and SOCAR on 17 December 2013.Based on agreement the Group agreed to buy additional volume of (Low Pressure) Gas from Shah Denizfield. The Annual contractual volume of gas in the first delivery year (for year 2014) was defined as0.65 bcm. The annual contractual volume for each delivery year, other than the first and the last deliveryyears is defined as 1.3 bcm (being 0.75 bcm in Turkey and 0.55 bcm in Azerbaijan). The contractual volumeof gas to be made available in the last delivery year (1 January 2018 − 30 June 2018) is 0.64 bcm (being0.37 bcm in Turkey and 0.27 bcm in Azerbaijan).
Participating interest in ACG PSA
Azerbaijan International Operating Company, the Operator of the ACG PSA has entered into a number ofcapital commitments and operating leases as at 31 December 2016. The Group estimated its 11.65 per cent(2015: 11.65 per cent) share of these commitments and operating leases to be USD 238 million (AZN 421)(2015: USD 462 million (AZN 720)) and USD 22 million (AZN 39) (2015: USD 17 million (AZN 26)),respectively.
State Oil Company of the Azerbaijan Republic Notes to the consolidated financial statements for 2016
(Amounts presented are in millions of Azerbaijani Manats, unless otherwise stated)
78
37 Contingences, commitments and operating risks (continued)
Commitments related to participating interest in Shah Deniz
On 17 December 2013, Shah Deniz consortium announced the final investment decision for Stage 2development of Shah Deniz gas field in the Azerbaijan Sector of the Caspian Sea and signed certainAddendums to Shah Deniz Exploration and Development and Production Sharing Agreement (“SD EDPSA”).According to the Eighth Addendum to SD EDPSA the parties agreed to extend the development andproduction period to 46 years ending on 6 March 2047. This extension is conditional upon execution of theadditional work program where Contractor parties shall spend no less than USD 25 million (AZN 20) by31 December 2018.
BP Exploration Shah Deniz Limited, the Operator of the Shah Deniz PSA has entered into a number ofcapital commitments and operating leases as at 31 December 2016. The Group estimated its13.27 per cent share of these capital commitments and operating leases through its subsidiary and associateto be USD 1,372 million (AZN 2,430) (2015: USD 1,922 million (AZN 2,997)) and USD 66 million (AZN 117)(2015: USD 43 million (AZN 67)), respectively.
Commitments related to participating interest in AGSC
The Group holds 28 per cent direct interest in AGSC and indirect 2.62 per cent through its associate. Inaccordance with the agreements of AGSC the Group has the following commitments relating to AGSC’sactivity:
Stage 2 Gas Contract
On 25 October 2011 the Group and BOTAS executed a gas Sale and Purchase Agreement (“Stage 2 SPA”)with respect to the sale by the Group to BOTAS of certain volumes of Shah Deniz Stage 2 Gas (2 bcm firstdelivery year, 4 bcm second delivery year, 6 bcm plateau period). In December 2012, the Group transferredand assigned the rights and obligations under the Stage 2 SPA to AGSC. The anticipated commencement ofthe first gas delivery under Stage 2 BOTAS SPA will be between 1 January and July 2018.
AGSC sales to BOTAS through BTC Co.
AGSC is obliged under the agreement with BOTAS to make available 0.16 bcm of gas annually from 2016 till2019 at a price which is calculated based on a formula established in the contract.
Georgian gas obligation
AGSC is obliged under the agreement signed with Georgian Oil and Gas Corporation (“GOGC”) and thegovernment of Georgia to make available 0.5 bcm of gas in 2016 and onwards, at a price which is calculatedbased on a formula established in the contract.
Sale and purchase agreement with OptionCo.
AGSC is obliged under the agreement signed with OptionCo to make available 0.29 bcm of gas during thecontract year started on 1 October 2015 and ending 1 September 2016. Thereafter, AGSC is obliged todeliver during the next contract year, which starts on 1 October 2016 and ends 30 September 2017, 0.3 bcm(a maximum of five percent of the volumes transported by AGSC through Georgia via the SCP in theprevious contract year), at a price which is calculated based on a formula established in the contract.
BOTAS SPA
AGSC is obliged under the Gas contract signed with BOTAS to make available a maximum of approximately6.6 bcm of gas annually from 2017 till 2021 at a price calculated based on a formula established by the Gascontract.
State Oil Company of the Azerbaijan Republic Notes to the consolidated financial statements for 2016
(Amounts presented are in millions of Azerbaijani Manats, unless otherwise stated)
79
37 Contingences, commitments and operating risks (continued)
Commitments related to participating interest in AGSC (continued)
Shah Deniz Stage 2 EU Long term Gas Sales Agreements (“GSA”)
In September 2013, ten EU GSA were signed by the Group with nine EU Buyers and in December 2013 theGSA were assigned to AGSC until Shah Deniz PSA expiry with re-assignment to the Group as Shah DenizProduction declines. The commencement date will be firmed up through funnelling mechanism within a1-year window between 1 January 2020 and 1 January 2021 for DEPA, Shell, Axpo (PSV) and E.On; 1 July2020 and 1 July 2021 for Axpo (WTB), GDF Suez, Gas Natural Fenosa, Enel, Hera and Bulgargaz. The GSAassume 2-3 years build up period, as defined in the contract, and with the following peak annual deliveryobligations: AXPO (PSV) 0.48 bcm, GDF Suez 2.64 bcm, Gas Natural Fenosa 0.99 bcm, E.On 1.45 bcm,Shell 0.95 bcm, Hera 0.3 bcm, Enel 0.48 bcm, AXPO (WTB) 0.96 bcm, Bulgargaz 0.94 bcm, DEPA 1 bcm.
Transportation agreement with SCPC
AGSC is party to SCPC Gas Transportation Agreement (“GTA”), dated 27 February 2003 which wassubsequently amended and re-stated (“SCP GTA”) with effect from 17 December 2013 in order to provideadditional transportation services in respect of Shah Deniz Stage 2 volumes. AGSC is obliged to pay certaintariffs, as calculated in accordance with the agreement, to SCPC starting from the commencement date,which is 1 October 2006. The SCP GTA provides for Minimum Monthly Payments (“MMP”), as calculated inaccordance with the subject agreement, payable by AGSC to SCPC, regardless of whether natural gas isshipped or not, in respect of each contract year until the termination or expiry of the GTA. MMPs are fundedby BP Exploration (Shah Deniz) Limited (“BPX SD”) as operator for and on behalf of the SD JOA Partiesunder the amended Annual Reserved Capacity Deed (“ARC Deed”). Annual Minimum Payment (“AMP”) duein 2017 is USD 310 million (AZN 549), as calculated and presented to AGSC by SCPC in January 2016. Inaddition to AMP amount, AGSC shall pay to SCPC Incremental Monthly Charges calculated in accordancewith the GTA. Further, AGSC is obliged to provide SCPC, free of charge, the natural gas necessary to fill andpressurize the pipeline to its designed operating pressure and used as fuel gas.
Framework agreement
On 17 December 2013, AGSC executed a Term Sheet for GSA Novation and Capacity Transfer FrameworkAgreement with SOCAR (“Term Sheet”). A fully-termed Framework Agreement was negotiated with SOCARto give effect to the Term Sheet. Framework Agreement relates to novation of long-term GSAs and transferof GTA capacity between SOCAR and AGSC after 2036. The Framework Agreement was executed on19 October 2015.
Trans Anatolian Pipeline Gas Transportation Agreement (TANAP GTA)
AGSC is a party to TANAP GTA with annual reserved capacity during the build-up period, as defined in thecontract, of 6.1 bcm, 6.2 bcm, 7.2 bcm and plateau of 10.5 bcm after 18 months with 100 per cent ship orpay on the capacity reservation. The start date will be set through a funnelling mechanism inside thefirst window period between 1 July 2019 − 1 July 2021.
Trans Adriatic Pipeline Gas Transportation Agreement (TAP GTA)
AGSC is a party to TAP GTA with annual capacity of 9.08 bcm and additional annual regulated capacity of0.46 bcm booked under TAP First Booking Phase (“FBP”). The planned commencement date is inside thesecond window period between1 January 2020 − 31 December 2020.
Sale and purchase agreement with Baku-Tbilisi-Ceyhan Pipeline Company (“BTC Co”)
AGSC is obliged under the Fuel Gas Sales and Purchase Agreement between AGSC and BTC Co, dated30 November 2007 (“BTC SPA”) to make 0.16 bcm during the following years until the termination of thecontract subject to the right of BTC to reduce annual off-take, at a price which is calculated based on aformula established in the contract.
State Oil Company of the Azerbaijan Republic Notes to the consolidated financial statements for 2016
(Amounts presented are in millions of Azerbaijani Manats, unless otherwise stated)
80
37 Contingences, commitments and operating risks (continued)
Oil shipment commitment
On 1 August 2002 the Group and other participants under the ACG PSA (the “Shipper Group”) have enteredinto the ACG Field Production Transportation Agreement (“ACG TA”) with the BTC Co which was amendedon 3 February 2004. Under this Agreement, the Shipper Group have committed to ship through theBTC Pipeline all of their crude oil entitlement from the ACG field, other than any production which eachparticipant may ship through the Western Export Route. The Group has agreed to transport its crude oil byrail unless BTC Co is operating at its full capacity. In accordance with ACG TA the Group has agreed not touse other transportation options if capacity of the BTC Co is sufficient. The BTC Pipeline was put intooperation in May 2006.
The BTC Pipeline, with a throughput capacity of more than 1,200,000 barrels per day, is used as the ShipperGroup’s main export route. In accordance with the Transportation Agreement, the Shipper Group, the GroupRepresentative, the lenders and security trustee to BTC Co, and the lenders and security trustee to certainparticipants of the ACG Shipper Group have agreed that payment of BTC Co tariff has a first priority claim onoil sale proceeds.
Commitments of SOCAR Switzerland
The Group has entered into a number of operating leases for the next years. The Group estimated itsoperating leases to be CHF 102 million (AZN 177).
Commitments of SOCAR Overseas
The Group has entered into number of Letter of Credit agreements during November and December 2016with different banks (CA Indosuez, ING, Natixis, Societe Generale and etc.) against various shipments. As at31 December 2016 the Group has outstanding amount in the amount of USD 250 million (AZN 458).
Commitment of SOCAR Energy Georgia
For the purposes of supplying natural gas in regions of Georgia and raising funds for investing in respectivesphere, based on agreement formed with the Ministry of Economy of Georgia in 2008, the Group had toinvest USD 40 million (AZN 31) and provide natural gas to additional 150,000 subscribers. However, on19 December 2013 the terms of this commitment were amended and a new decree # 1988 of thegovernment of Georgia was approved. According to this decree the commitment of investing in gas networkincreased to USD 250 million (AZN 443) and the number of new gas subscribers increased to 250,000.According to decree the maturity of commitment was defined to be 3 year beginning from conductingamendment agreement which is signed on 8 December 2014 by both parties.
As of 31 December 2016 SOCAR Energy Georgia had guarantees to banks in the total amount of AZN 16 infavour of third parties that engaged in the gasification process.
Commitments of Baku Shipyard LLC
At 31 December 2016, the Group had capital commitments to third parties in the amount of AZN 46 (2015:AZN 66) in respect of construction contracts.
Commitments of SOCAR Head Office
According to Equity Subscription Support and Retention Agreement (“ESSRA”) which had been signed as apart of STAR Project Finance deal, the Group concluded letter of credit (“LC”) facility agreements in the totalamount of USD 1,429 million (AZN 2,228) with certain banks (The Lenders).
The LCs are intended to provide security to the Lenders for the unpaid portion and to serve as the creditsupport of the Project in case there would be cost overruns exceeding the contingency amount designated inthe Project budget. The outstanding amount of LCs as of 31 December 2016 was USD 514 million(AZN 910) (2015: USD 1,269 million (AZN 1,979)).
State Oil Company of the Azerbaijan Republic Notes to the consolidated financial statements for 2016
(Amounts presented are in millions of Azerbaijani Manats, unless otherwise stated)
81
37 Contingences, commitments and operating risks (continued)
Commitment related to SCP Expansion
Shah Deniz PSA Contractor Parties made the final investment decision on SCP Expansion project on17 December 2013. SCP Expansion project objective is to expand the existing SCP pipeline systemcapacity. Due to SCP expansion additional facilities will be constructed in Georgia for the purposes ofinterconnection with TANAP. The Group has the commitment to fund the SCP Expansion project throughoutthe construction and initial operational phase.
The SCP Expansion remaining construction budget is estimated in the amount of USD 1,607 million(AZN 2,846) (the Group’s 13.27 per cent share through its subsidiary and associate: USD 213 million(AZN 378)).
Construction of TANAP
At the financial statement date, the Group has capital commitment to fund construction of TANAP pipelinesystem. Remaining budget for construction of TANAP system is estimated in the amount ofUSD 5,028 million (AZN 8,903) (2015: USD 8,112 million (AZN 12,649)) and the Group’s share through itsassociate at the financial statement date was USD 2,464 million (AZN 4,363) (2015: USD 3,975 million(AZN 6,198)).
Construction of TAP
The Group has the commitment to fund construction of TAP pipeline system. The remaining budget forconstruction of the TAP system is estimated in the amount of USD 3,121 million (AZN 5,527) (2015:USD 4,338 million (AZN 6,764)). The Group’s share of commitment through its associate at the financialstatement date was USD 306 million (AZN 542) (2015: USD 425 million (AZN 663)).
Commitments of SOCAR Trading S.A (“SOCAR Trading”)
The Group has entered into a number of operating leases for the next years. The Group estimated itsoperating leases to be USD 62 million (AZN 110).
Deferred Sale and Purchase Agreement with SGC
According to Deferred Sale and Purchase Agreement (“DSPA”) signed with SGC Upstream LLC andSGC Midstream LLC the Group agrees to sell its whole interest in Shah Deniz PSA, AGSC and SCPC inMarch 2023 upon meeting of the following conditions preceding sale:
• The full and unconditional repayment of the notes and fulfilment of other obligations underthe Eurobonds agreements by SOCAR; and
• Confirmation of the payment of full consideration amount in accordance with agreement terms.
Commitment under the funding agreement with BOTAS (the “Funding Agreement”)
On 26 May 2014 SOCAR and BOTAS signed Funding Agreement for financing BOTAS’s 5 per cent sharesin TANAP A.Ş., upon acquisition of shares in TANAP A.Ş. by BOTAS. Following the sale of Tanap to SGC,on 13 March 2015, the Group signed novation agreement with SGC and BOTAS, where all rights andobligations under the Funding Agreement were transferred from SOCAR to the SGC. According toagreement with BOTAS, the SGC has commitment for providing interest free loan to BOTAS for financing its5 per cent share in TANAP A.Ş.’s future cash call requirements till TANAP becomes operational. The Groupcommitment in this financing equals to its share in SGC.
BOTAS Gas Transportation Agreement (BOTAS GTA)
TANAP is a party to BOTAS GTA and with annual reserved capacity during the build-up period, as defined inthe contract, of 1.9 bcm (12 month period commencing on start date), 3.8 bcm (next 12 month period) andplateau of 5.7 bcm 24 months after the start date. The start date will be within the period from and including1 May 2018 to and including 30 June 2018.
State Oil Company of the Azerbaijan Republic Notes to the consolidated financial statements for 2016
(Amounts presented are in millions of Azerbaijani Manats, unless otherwise stated)
82
37 Contingences, commitments and operating risks (continued)
SOCAR Gas Transportation Agreement (SOCAR GTA)
Based on this GTA, from and including the start date (6 March 2036) SOCAR shall pay to TAP AG theamount of actual monthly charge in relation of each booking of reserved capacity at each entry point and exitpoint at a price which is calculated based on the formula established in the contract.
TAP Deferral Gas Sales Agreement
The Group is obliged under the agreement signed with AGSC to Purchase minimum annual quantity of gasas indicated in the agreement during the period 1 May 2019 − 31 December 2020 (or until an earliertermination of the agreement in accordance with provisions of the agreement) at a price which is stipulated inthe contract.
Feedstock supply agreement
On 20 June 2014 the Group and SOCAR Polymer signed a feedstock supply agreement according to whichthe Group bears obligation to supply ethylene and propylene at 44 per cent and 40 per cent discount ofmarket price, respectively. SOCAR Polymer expects to start its production process in 2017.
Commitments of SOCAR Polymer
During 2015, SOCAR Polymer LLC signed agreements for provision of design, engineering, procurement, allonshore work and offshore assistance required for commissioning and testing for the polypropylene plant,high density polyethylene plant and utilities and off-sites. Total contract price of agreements isUSD 503 million (AZN 891). During 2016, the SOCAR Polymer LLC incurred cost of USD 212 million(AZN 375) on the mentioned services.
38 Business combination, acquisition of non-controlling interests, acquisition of subsidiary whichis not a business and goodwill
Goodwill
Movement in the carrying amount of goodwill was as follows:
2016 2015
Carrying amount at 1 January 275 177Translation difference 67 98
Carrying amount at 31 December 342 275
The carrying amount of goodwill as of 31 December 2016 and 2015 includes an accumulated goodwillimpairment of AZN 3.
Allocation of goodwill by CGUs at 31 December 2016 and 2015 were as following:
2016 2015
SOCAR Switzerland 116 105SOCAR Trading 110 48Petkim 98 104Other 18 18
Carrying amount at 31 December 342 275
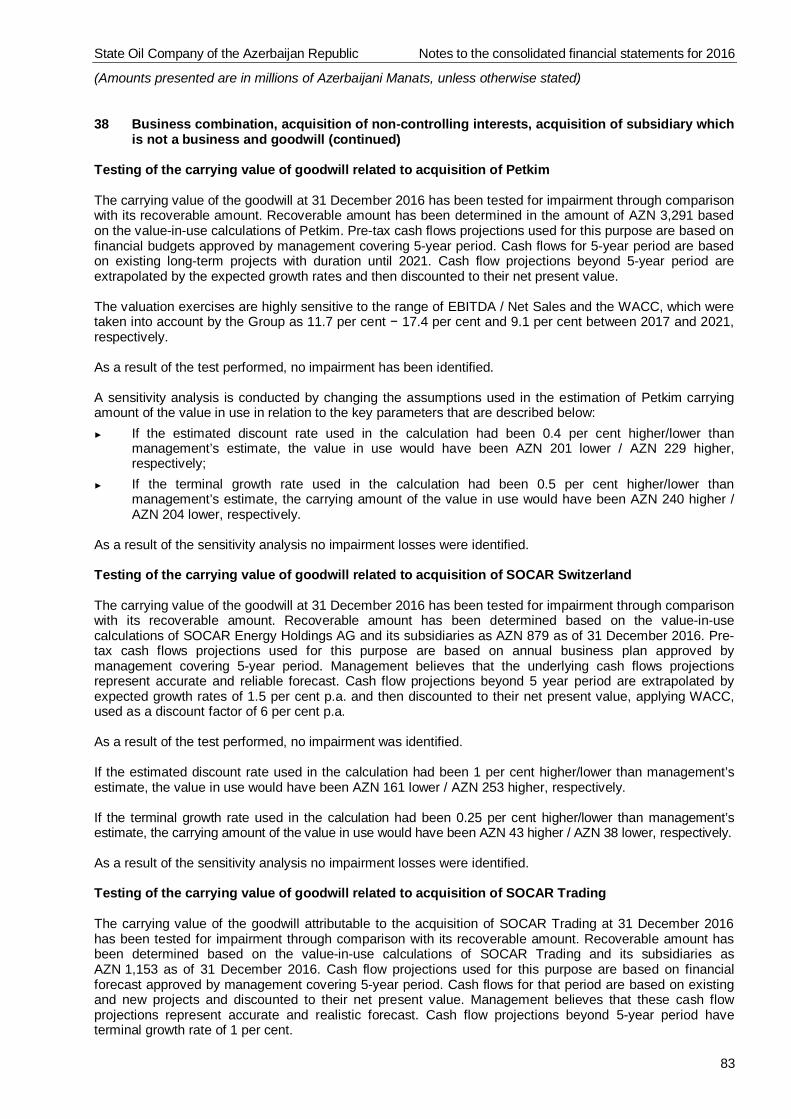
State Oil Company of the Azerbaijan Republic Notes to the consolidated financial statements for 2016
(Amounts presented are in millions of Azerbaijani Manats, unless otherwise stated)
83
38 Business combination, acquisition of non-controlling interests, acquisition of subsidiary whichis not a business and goodwill (continued)
Testing of the carrying value of goodwill related to acquisition of Petkim
The carrying value of the goodwill at 31 December 2016 has been tested for impairment through comparisonwith its recoverable amount. Recoverable amount has been determined in the amount of AZN 3,291 basedon the value-in-use calculations of Petkim. Pre-tax cash flows projections used for this purpose are based onfinancial budgets approved by management covering 5-year period. Cash flows for 5-year period are basedon existing long-term projects with duration until 2021. Cash flow projections beyond 5-year period areextrapolated by the expected growth rates and then discounted to their net present value.
The valuation exercises are highly sensitive to the range of EBITDA / Net Sales and the WACC, which weretaken into account by the Group as 11.7 per cent − 17.4 per cent and 9.1 per cent between 2017 and 2021,respectively.
As a result of the test performed, no impairment has been identified.
A sensitivity analysis is conducted by changing the assumptions used in the estimation of Petkim carryingamount of the value in use in relation to the key parameters that are described below:► If the estimated discount rate used in the calculation had been 0.4 per cent higher/lower than
management’s estimate, the value in use would have been AZN 201 lower / AZN 229 higher,respectively;
► If the terminal growth rate used in the calculation had been 0.5 per cent higher/lower thanmanagement’s estimate, the carrying amount of the value in use would have been AZN 240 higher /AZN 204 lower, respectively.
As a result of the sensitivity analysis no impairment losses were identified.
Testing of the carrying value of goodwill related to acquisition of SOCAR Switzerland
The carrying value of the goodwill at 31 December 2016 has been tested for impairment through comparisonwith its recoverable amount. Recoverable amount has been determined based on the value-in-usecalculations of SOCAR Energy Holdings AG and its subsidiaries as AZN 879 as of 31 December 2016. Pre-tax cash flows projections used for this purpose are based on annual business plan approved bymanagement covering 5-year period. Management believes that the underlying cash flows projectionsrepresent accurate and reliable forecast. Cash flow projections beyond 5 year period are extrapolated byexpected growth rates of 1.5 per cent p.a. and then discounted to their net present value, applying WACC,used as a discount factor of 6 per cent p.a.
As a result of the test performed, no impairment was identified.
If the estimated discount rate used in the calculation had been 1 per cent higher/lower than management’sestimate, the value in use would have been AZN 161 lower / AZN 253 higher, respectively.
If the terminal growth rate used in the calculation had been 0.25 per cent higher/lower than management’sestimate, the carrying amount of the value in use would have been AZN 43 higher / AZN 38 lower, respectively.
As a result of the sensitivity analysis no impairment losses were identified.
Testing of the carrying value of goodwill related to acquisition of SOCAR Trading
The carrying value of the goodwill attributable to the acquisition of SOCAR Trading at 31 December 2016has been tested for impairment through comparison with its recoverable amount. Recoverable amount hasbeen determined based on the value-in-use calculations of SOCAR Trading and its subsidiaries asAZN 1,153 as of 31 December 2016. Cash flow projections used for this purpose are based on financialforecast approved by management covering 5-year period. Cash flows for that period are based on existingand new projects and discounted to their net present value. Management believes that these cash flowprojections represent accurate and realistic forecast. Cash flow projections beyond 5-year period haveterminal growth rate of 1 per cent.
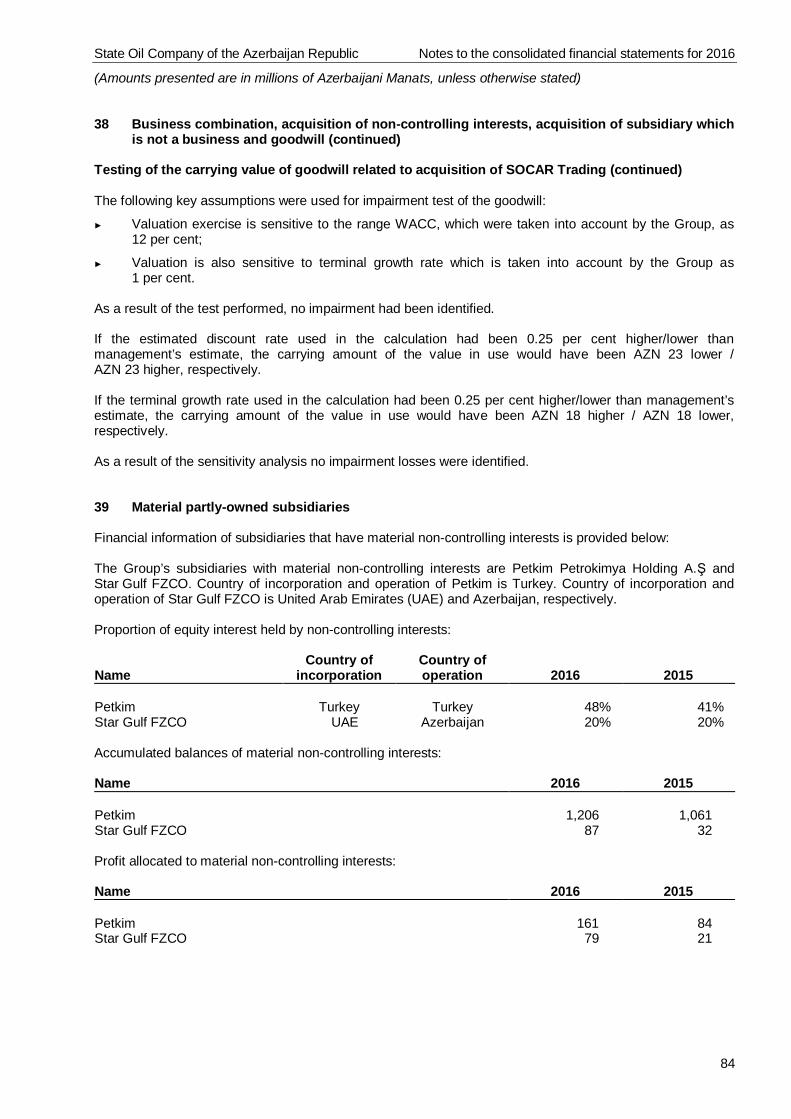
State Oil Company of the Azerbaijan Republic Notes to the consolidated financial statements for 2016
(Amounts presented are in millions of Azerbaijani Manats, unless otherwise stated)
84
38 Business combination, acquisition of non-controlling interests, acquisition of subsidiary whichis not a business and goodwill (continued)
Testing of the carrying value of goodwill related to acquisition of SOCAR Trading (continued)
The following key assumptions were used for impairment test of the goodwill:
► Valuation exercise is sensitive to the range WACC, which were taken into account by the Group, as12 per cent;
► Valuation is also sensitive to terminal growth rate which is taken into account by the Group as1 per cent.
As a result of the test performed, no impairment had been identified.
If the estimated discount rate used in the calculation had been 0.25 per cent higher/lower thanmanagement’s estimate, the carrying amount of the value in use would have been AZN 23 lower /AZN 23 higher, respectively.
If the terminal growth rate used in the calculation had been 0.25 per cent higher/lower than management’sestimate, the carrying amount of the value in use would have been AZN 18 higher / AZN 18 lower,respectively.
As a result of the sensitivity analysis no impairment losses were identified.
39 Material partly-owned subsidiaries
Financial information of subsidiaries that have material non-controlling interests is provided below:
The Group’s subsidiaries with material non-controlling interests are Petkim Petrokimya Holding A.Ş andStar Gulf FZCO. Country of incorporation and operation of Petkim is Turkey. Country of incorporation andoperation of Star Gulf FZCO is United Arab Emirates (UAE) and Azerbaijan, respectively.
Proportion of equity interest held by non-controlling interests:
NameCountry of
incorporationCountry ofoperation 2016 2015
Petkim Turkey Turkey 48% 41%Star Gulf FZCO UAE Azerbaijan 20% 20%
Accumulated balances of material non-controlling interests:
Name 2016 2015
Petkim 1,206 1,061Star Gulf FZCO 87 32
Profit allocated to material non-controlling interests:
Name 2016 2015
Petkim 161 84Star Gulf FZCO 79 21
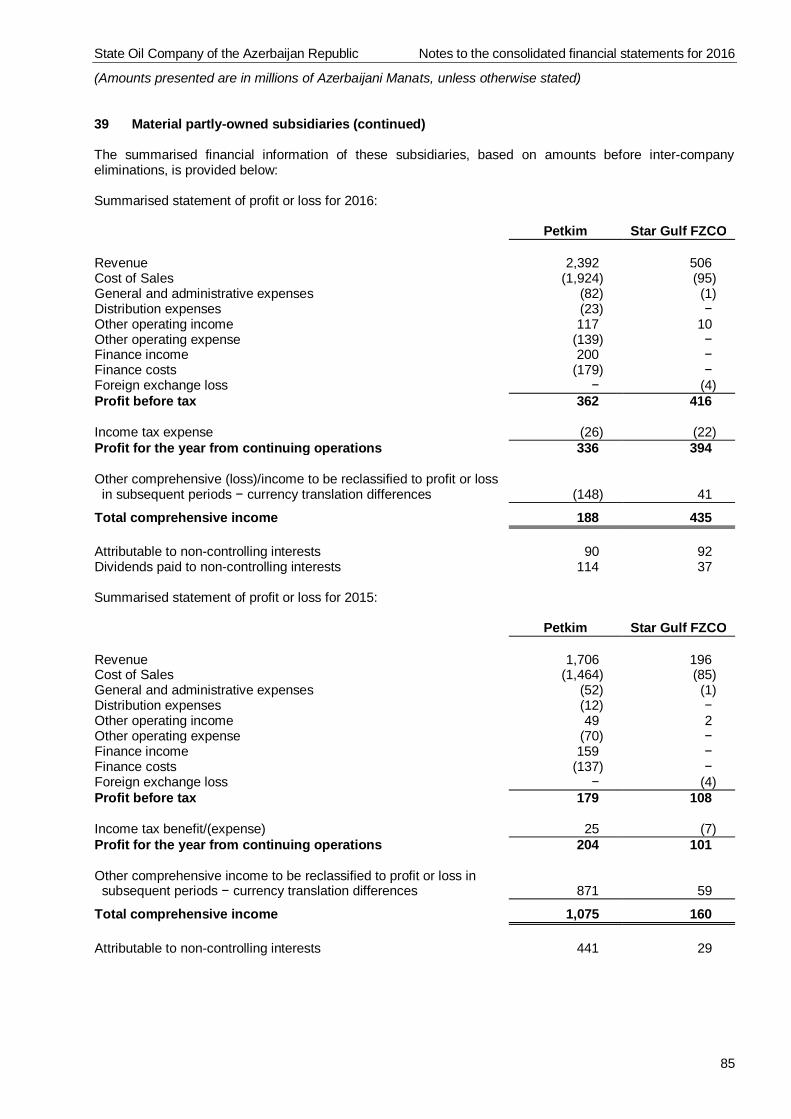
State Oil Company of the Azerbaijan Republic Notes to the consolidated financial statements for 2016
(Amounts presented are in millions of Azerbaijani Manats, unless otherwise stated)
85
39 Material partly-owned subsidiaries (continued)
The summarised financial information of these subsidiaries, based on amounts before inter-companyeliminations, is provided below:
Summarised statement of profit or loss for 2016:
Petkim Star Gulf FZCO
Revenue 2,392 506Cost of Sales (1,924) (95)General and administrative expenses (82) (1)Distribution expenses (23) −Other operating income 117 10Other operating expense (139) −Finance income 200 −Finance costs (179) −Foreign exchange loss − (4)Profit before tax 362 416
Income tax expense (26) (22)Profit for the year from continuing operations 336 394
Other comprehensive (loss)/income to be reclassified to profit or lossin subsequent periods − currency translation differences (148) 41
Total comprehensive income 188 435
Attributable to non-controlling interests 90 92Dividends paid to non-controlling interests 114 37
Summarised statement of profit or loss for 2015:
Petkim Star Gulf FZCO
Revenue 1,706 196Cost of Sales (1,464) (85)General and administrative expenses (52) (1)Distribution expenses (12) −Other operating income 49 2Other operating expense (70) −Finance income 159 −Finance costs (137) −Foreign exchange loss − (4)Profit before tax 179 108
Income tax benefit/(expense) 25 (7)Profit for the year from continuing operations 204 101
Other comprehensive income to be reclassified to profit or loss insubsequent periods − currency translation differences 871 59
Total comprehensive income 1,075 160
Attributable to non-controlling interests 441 29
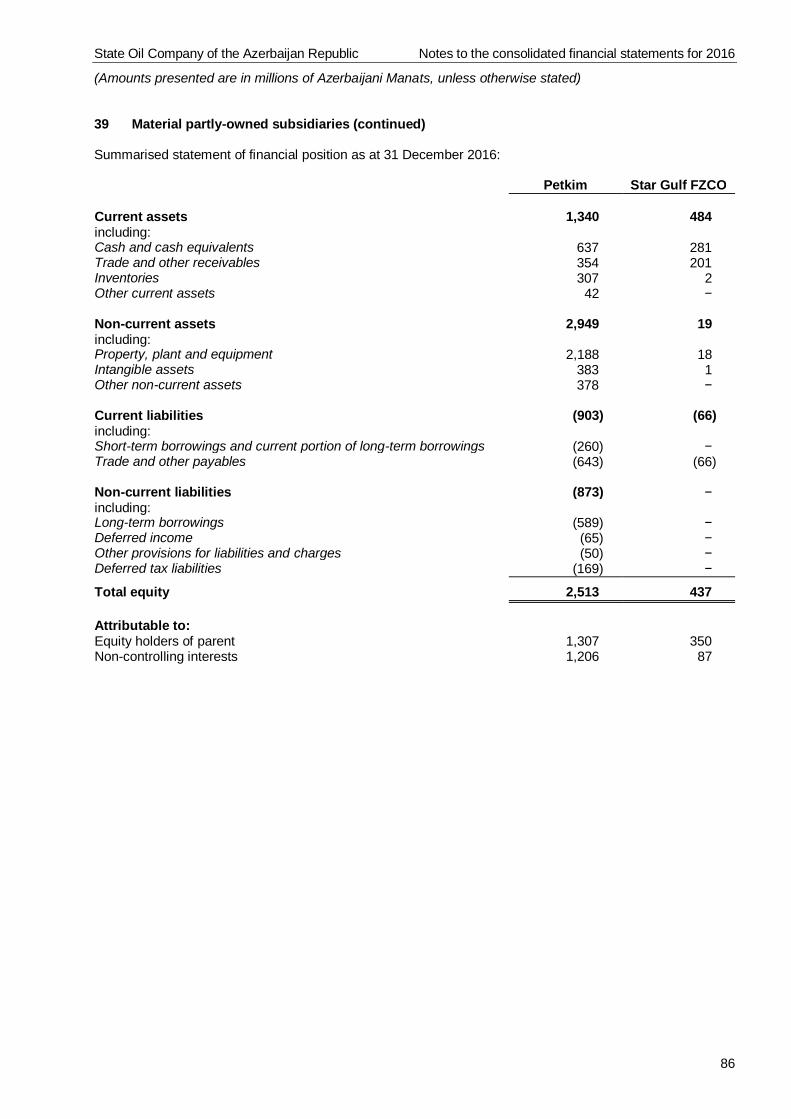
State Oil Company of the Azerbaijan Republic Notes to the consolidated financial statements for 2016
(Amounts presented are in millions of Azerbaijani Manats, unless otherwise stated)
86
39 Material partly-owned subsidiaries (continued)
Summarised statement of financial position as at 31 December 2016:
Petkim Star Gulf FZCO
Current assets 1,340 484including:Cash and cash equivalents 637 281Trade and other receivables 354 201Inventories 307 2Other current assets 42 −
Non-current assets 2,949 19including:Property, plant and equipment 2,188 18Intangible assets 383 1Other non-current assets 378 −
Current liabilities (903) (66)including:Short-term borrowings and current portion of long-term borrowings (260) −Trade and other payables (643) (66)
Non-current liabilities (873) −including:Long-term borrowings (589) −Deferred income (65) −Other provisions for liabilities and charges (50) −Deferred tax liabilities (169) −
Total equity 2,513 437
Attributable to:Equity holders of parent 1,307 350Non-controlling interests 1,206 87
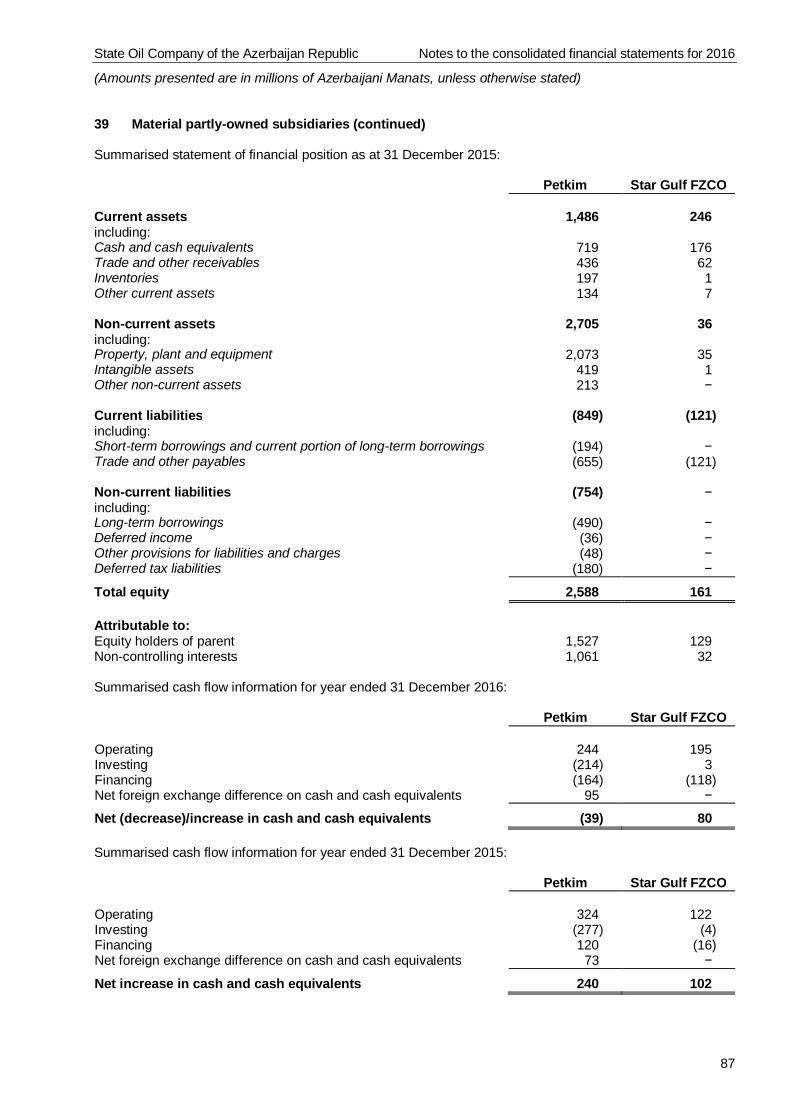
State Oil Company of the Azerbaijan Republic Notes to the consolidated financial statements for 2016
(Amounts presented are in millions of Azerbaijani Manats, unless otherwise stated)
87
39 Material partly-owned subsidiaries (continued)
Summarised statement of financial position as at 31 December 2015:
Petkim Star Gulf FZCO
Current assets 1,486 246including:Cash and cash equivalents 719 176Trade and other receivables 436 62Inventories 197 1Other current assets 134 7
Non-current assets 2,705 36including:Property, plant and equipment 2,073 35Intangible assets 419 1Other non-current assets 213 −
Current liabilities (849) (121)including:Short-term borrowings and current portion of long-term borrowings (194) −Trade and other payables (655) (121)
Non-current liabilities (754) −including:Long-term borrowings (490) −Deferred income (36) −Other provisions for liabilities and charges (48) −Deferred tax liabilities (180) −
Total equity 2,588 161
Attributable to:Equity holders of parent 1,527 129Non-controlling interests 1,061 32
Summarised cash flow information for year ended 31 December 2016:
Petkim Star Gulf FZCO
Operating 244 195Investing (214) 3Financing (164) (118)Net foreign exchange difference on cash and cash equivalents 95 −
Net (decrease)/increase in cash and cash equivalents (39) 80
Summarised cash flow information for year ended 31 December 2015:
Petkim Star Gulf FZCO
Operating 324 122Investing (277) (4)Financing 120 (16)Net foreign exchange difference on cash and cash equivalents 73 −
Net increase in cash and cash equivalents 240 102
State Oil Company of the Azerbaijan Republic Notes to the consolidated financial statements for 2016
(Amounts presented are in millions of Azerbaijani Manats, unless otherwise stated)
88
40 Events after reporting date
Increase in Additional Paid in Capital
On 3 February 2017 the Group’s additional paid in capital was increased by the Government of theAzerbaijan Republic in the amount of AZN 143.
New Loans
During subsequent period, the Group obtained new long-term loans in the amount of AZN 798 (USD 457million), AZN 186 (EUR 101 million) and AZN 254 (GEL 368 million) from local and international banks. Inaddition, the Group obtained new short-term loan in the amount of AZN 140 (USD 82 million) from localbank.
Bond repayment
On 6 February 2017 the Group fully repaid AZN 185 (USD 97 million) of its outstanding 5.45 per cent seniorunsecured notes (with original balance of USD 500 million) due on 9 February 2017.
Issue of notes
On 10 March 2017 the Group’s associate − SGC issued AZN 1,720 (USD 1 billion) senior unsecured notesguaranteed by the Azerbaijan Republic (“Notes”) bearing interest rate of 6.875 per cent per annum withmaturity due on 24 March 2026.
Declaration of dividends by associate
During subsequent period the Group’s associate - BTC Co declared dividends in the amount of AZN 72(USD 42 million) that were fully paid to the Group.
Investments
During subsequent period the Group has made additional investment in its associate − SGC and jointventure − Azerbaijan Rigs LLC in the amount of AZN 140 and AZN 19, respectively.
On 29 May 2017 the Group purchased 16.34 per cent shares of SOCAR Energy Georgia for theconsideration in the amount of AZN 58 (USD 34 million). As a result, the Group’s controlling ownership inSOCAR Energy Georgia increased from 51 per cent to 67.34 per cent.
Sale of Petkim’s shares
On 8 March 2017, the Group sold its 1.32 per cent shares of Petkim Petrokimya Holding A.Ş forconsideration in the amount of AZN 42 (TRY 88 million) and as a result, the Group’s controlling ownership inPetkim Petrokimya Holding A.Ş decreased from 52.32 per cent to 51 per cent.
Prepayment for acquisition of Methanol Plant
During subsequent period the Group signed an agreement with related party for acquisition of methanolproduction assets (the Plant) in the amount of AZN 810. According to the agreement the Group has madeAZN 394 prepayment to the seller. The control over the Plant was not transferred to the Group.
Government Grant
According to the decree of National Assembly dated 30 June 2017, the Group will receive government grantin the amount of AZN 250 in 2017 as a compensation of losses incurred from sale of natural gas and heatingoil for the purpose of meeting local demand in the country.