Embed Size (px)
Citation preview

State Public Health Agency
Classification:
Understanding the Relationship
Between State and Local Public Health

© Association of State and Territorial Health Officials 2012 2231 Crystal Drive, Ste 450, Arlington, VA 202-371-9090 www.astho.org
i
Table of Contents
Acknowledgements ......................................................................................................................... 1
Background ..................................................................................................................................... 2
Methodology ................................................................................................................................... 4
Developing and Piloting the Survey .......................................................................................... 4
Refining the Survey Questions .................................................................................................. 5
Collecting Data .......................................................................................................................... 6
Categorizing the States .............................................................................................................. 6
Gathering Additional Information About the States ................................................................. 9
Findings ......................................................................................................................................... 10
State Categorization ................................................................................................................ 10
Complexities in Categorizing States ........................................................................................ 12
Next Steps ..................................................................................................................................... 13
Appendices
Appendix A: Comparison of Classifications of States .............................................................. 17
Appendix B: Survey Instrument ............................................................................................... 21
Appendix C: Detailed Descriptions of Each State .................................................................... 26
Appendix D: Suggested Modifications to Survey Questions .................................................... 76

© Association of State and Territorial Health Officials 2012 2231 Crystal Drive, Ste 450, Arlington, VA 202-371-9090 www.astho.org
1
Acknowledgements
This study was initially supported by the Robert Wood Johnson Foundation (RWJF). Additional research
was supported by the Centers for Disease Control and Prevention (CDC). We would like to acknowledge
the contributions of staff from NORC at the University of Chicago, the Association of State and Territorial
Health Officials (ASTHO), and the National Association of County and City Health Officials (NACCHO):
Michael Meit, Jessica Kronstadt, and Alexa Brown (NORC); Jim Pearsol, Katie Sellers, Katherine Barbacci,
and Michael Dickey (ASTHO); and Michelle Chuk and Carolyn Leep (NACCHO). We would also like to
thank our panel of advisors for their guidance: Les Beitsch, Jeffrey Lake, Glen Mays, Doug Scutchfield,
and Bonnie Sorenson. Most importantly, we are grateful to the health departments that provided the
information essential to this study through their survey participation.
The conclusions and opinions expressed in this report are the authors’ alone. No endorsement by RWJF,
CDC, or other parties is intended or should be inferred.
For more information about this project, please contact Katie Sellers at 571‐527‐3171 or by email at

© Association of State and Territorial Health Officials 2012 2231 Crystal Drive, Ste 450, Arlington, VA 202-371-9090 www.astho.org
2
Background
States have organized their governmental public health systems in different ways. Exploring the
relationships between state and local public health has important implications for delivery of public
health services and for determining which delivery strategies and models may best apply in different
settings. There have been several attempts in the past to classify the organizational structure of state
health agencies (SHAs), with the intent of understanding their relationship with local health
departments (LHDs) and the coordination and provision of services within the state. Defining the
relationship between state and local public health agencies is important for understanding the roles,
responsibilities, and authorities across levels of government for services provided within the community.
Having a uniform and objective classification of SHAs can help elucidate the ways in which public health
structure influences health departments’ operations, financing, and performance and may also be key to
understanding how accreditation standards will apply in different states.
Public health systems and services research often refers to several organizational patterns that
represent the functional and administrative relationships between state and local public health
agencies: centralized, decentralized, shared, and mixed (see Figure 1 for more information on these
categories). These four categories are frequently used as explanatory variables in research, and past
studies have explored if there are differences based on SHA classifications in the following areas:
Availability and perceived effectiveness of public health activities.1
Public health system performance.2
The participation of managed care plans in local public health activities.3
Public health financing.4
Unfortunately, there are major inconsistencies among past efforts to categorize SHAs. Despite their
frequent use in public health systems and services research, the four categories—centralized,
decentralized, shared, and mixed—are defined differently in different studies, which has led to
variations in the way that states are classified. Further, categorization efforts are often dependent on
1 Mays GP, Halverson PK, Baker EL, Stevens R & Vann JJ. “Availability and perceived effectiveness of public health activities in the nation’s most populous communities.” 2004. American Journal of Public Health, 94:1019-1026. 2 Mays GP, McHugh MC, Shim K, Perry N, Lenaway D, Halverson PK & Moonesinghe R. “Institutional and economic determinants of public health system performance.” 2006. American Journal of Public Health, 96:523-531. 3 Mays GP, Halverson PK & Stevens R. “The contributions of managed care plans to public health practice: Evidence from the nation’s largest local health departments.” 2001. Public Health Reports, Supplement, 116. 4 Mays GP, McHugh MC, Shim K, Lenaway D, Halverson PK, Moonesinghe R & Honore P. “Getting what you pay for: Public health spending and the performance of essential public health services.” 2004. Journal of Public Health Management Practice, 10(5):435-443.

© Association of State and Territorial Health Officials 2012 2231 Crystal Drive, Ste 450, Arlington, VA 202-371-9090 www.astho.org
3
the self‐report of health department personnel, so that the response relies on the judgment of the
individual completing the survey. Additionally, past surveys typically just ask one question: “Is your state
centralized, decentralized, shared, or mixed?”5 Not only does this methodology mean that an individual
state’s response may vary from survey to survey depending on who completes it, but there is little
transparency behind the classifications. In other words, it is not always clear what respondents mean
when they classify their states in a particular way. As a result, a review of past efforts to categorize SHAs
revealed very little consistency in the way states were classified. Only eight states had the same
classification in all seven of the past reports that were reviewed as part of this study. (Please see
Appendix A for a list of how states have been categorized in the past.)
Organizational structure may also have implications for how accreditation standards apply in different
states. In both the public vetting of the Public Health Accreditation Board (PHAB) proposed standards
and measures for national, voluntary accreditation6 and the evaluation of the PHAB beta test,7
participants raised questions about how particular measures would play out in their states given the
organizational structure. For example, beta‐test participants were uncertain about whether local health
departments in centralized states could submit documents that were created by the state or if they
would need to tailor them to their communities. Questions were also raised about how state health
agencies in centralized states should respond to measures that focus on the relationship with local
health departments—if indeed those local health departments are staffed by state employees. PHAB
convened a Centralized States Think Tank to address some of these issues and to clarify the application
process in centralized states. It may also be helpful to provide training to site visitors to help them
understand how the governance structure of the health department they are reviewing may provide
important context in assessing that health department’s conformity with the PHAB measures.
To address some of the challenges associated with inconsistent SHA classification, in 2009 the
Association of State and Territorial Health Officials (ASTHO), with funding from the Robert Wood
Johnson Foundation (RWJF), contracted with NORC at the University of Chicago to develop an objective
method for categorization. NORC developed a questionnaire for senior SHA personnel to complete that
describes the functional characteristics of the SHA and LHDs within their state. The research team used
the results from this survey to objectively classify states. In 2011 ASTHO and the National Association of
County and City Health Officials (NACCHO), with funding from the Centers for Disease Control and
5 Fraser M & Downing K, comps. NACCHO Survey Examines State/Local Health Department Relationships. Washington, DC: NACCHO. 1998, Research Brief, No. 2. 6 NORC, Vetting the Public Health Accreditation Board Standards and Measures. Alexandria, VA: Public Health Accreditation Board. 2009. 7 NORC and PHAB Brief Report: Evaluation of the Public Health Accreditation Board Beta Test. Alexandria, VA: Public Health Accreditation Board. 2011.

© Association of State and Territorial Health Officials 2012 2231 Crystal Drive, Ste 450, Arlington, VA 202-371-9090 www.astho.org
4
Prevention (CDC), contracted with NORC to gather additional information about several of the states
and develop maps depicting the governance structures.
Methodology
This section provides details about how feedback from state health officials and from other experts in
the field contributed to the development of the data collection instrument. It also describes the key
questions in the survey and the methodology for classifying states based on their survey responses.
Developing and Piloting the Survey
In designing the state survey, NORC researchers conducted a review of the literature, held conversations
with experts in the field, and gathered input from ASTHO and NACCHO.
An extensive literature review was conducted to understand the methodology of past categorization
efforts, uncovering seven past categorization efforts by various researchers and organizations. From the
review of these efforts, an initial set of criteria were developed to be used in categorizing health
departments into the four main existing categories—centralized, decentralized, shared, and mixed.
From the initial set of criteria, a draft survey about the provision of public health services was
developed.
A group of expert advisors was convened via teleconference in February 2009 to discuss the validity and
adequacy of the categorization scheme conceived by the research team. The expert advisors provided
valuable feedback on the first survey draft, which led to a revised set of questions. A pilot testing phase
occurred in the month of May, during which the revised survey draft was sent to four ASTHO members
to test the survey questions. During the pilot test, the small group of ASTHO members completed the
survey and provided feedback on the following:
Clarity of questions and definitions.
Need for additional definitions.
Importance of factors considered in categorization.
If SHA respondents had all of the information necessary to complete the survey.
Additional suggestions for improving the survey.
This feedback permitted the research team to develop a final survey to be fielded to ASTHO members.

© Association of State and Territorial Health Officials 2012 2231 Crystal Drive, Ste 450, Arlington, VA 202-371-9090 www.astho.org
5
Refining the Survey Questions
After refining the questions following the pilot test, a final, web‐based version of the survey was
developed. The final survey questions are presented in Appendix B. Below, the key elements of the
survey are briefly described.
One important part of this survey was defining local health units within the state. A local health unit was
defined as “an administrative or service unit of local or state government concerned with health and
carrying some responsibility for the health of a jurisdiction smaller than the state.” In this way, local
health units can be units of either state or local government.
It was considered important to acknowledge that within one state there might be different types of local
health units. Thus the survey opened with a table where respondents were asked to fill in both the
number of local health units and the percent of the state population served by health units that fit into
two different categories—local health units led by state employees and local health units led by local
employees.
If respondents indicated that there is at least one local health unit within their state that is led by state
employees, they were directed to a series of questions about those state‐led health units. These
questions asked about:
The extent to which local governmental entities have authority to make budgetary decisions
about those local health units.
The ability of local health units to establish taxes for public health.
The ability of local health units to establish fees for public health services.
The ability of local health units to issue public health orders.
The entities that appoint and approve local chief executives.
Respondents who indicated the existence of local health units led by local employees were directed to a
parallel set of questions that asked about the characteristics of those local health units. If a state had
both local health units led by state employees and local health units led by local employees, they were
asked to respond to both sets of questions.

© Association of State and Territorial Health Officials 2012 2231 Crystal Drive, Ste 450, Arlington, VA 202-371-9090 www.astho.org
6
Collecting Data
When the survey was finalized, the ASTHO survey team sent emails to the deputy state health officials in
all 50 states, inviting them to take the online survey. The survey was in the field from June 10 to mid‐July
2009, and ASTHO sent several reminders to individuals who had not yet completed the survey. All 50
states completed the questionnaire.
Responses provided by 16 states were ambiguous and required followup. The research team sent emails
to the individuals who had completed the survey to request additional information. Each email had one
or two specific questions and invited responses either via e‐mail or telephone. The two most common
issues that required followup were:
1. States indicated that a portion of the state population was not covered by a local health unit.
The research team wrote to respondents to determine if local public health services were
provided in those areas and if so, by whom.
2. Respondents stated that none of the options in the survey adequately described the roles
played by state and local entities in making budgetary decisions. The research team asked for
details about how those budgetary decisions were made.
Because of the need to ask these clarifying questions, NORC recommends several revisions to the
questionnaire, should the survey be fielded again in the future. These recommendations are described
in the Lessons Learned section on page 14.
Categorizing the States
The research team developed a decision tree to categorize the states (see Figure 1Error! Reference
source not found.). The decision tree is framed similarly to the survey that was sent to deputy state
health officials in that both the leadership of local health units and the authorities of state/local
government are considered in the classification of each state’s public health agency governance
structure.

© Association of State and Territorial Health Officials 2012 2231 Crystal Drive, Ste 450, Arlington, VA 202-371-9090 www.astho.org
7
Figure 1. Decision tree for determining state public health agency (SHA) categorization.
There are several principles that guided the development of the decision tree:
1. If a state reported having no local public health units (i.e., all public health services are
administered through the central office), then the state is considered centralized. This is
depicted by the topmost arrow on the decision tree. Accordingly, Hawaii and Rhode Island were
classified as centralized states.
2. The primary criterion for determining if local health units are centralized or decentralized is
whether those units are led by state or local employees. Health units led by state employees are
presumed to be centralized and those led by local employees are presumed to be decentralized.
However, in acknowledgment of the fact that local and state entities may have shared authority
around certain public health budget and governance decisions, the decision tree includes
Leadership of Local Health Units + Authorities = Classification of Governance
* If the majority (75% or more) but not all of the state population meets this designation, then the state is largely centralized, decentralized, or shared.
Is 75% or more of the population served by a local health unit led by a state employee?*
Do health units meet three or more of the criteria for having shared authority with local government?
Does the state have local health units that serve at least 75% of the state’s population?*
If NoState is centralized
AR, DE, HI, MS, NM, RI, SC, VT
OR largely centralizedAL, LA, ME, NH, SD, VA
Is 75% or more of population served by a local health unit led by a local employee?*
Do health units meet three or more of the criteria for having shared authority with state government?
State is decentralizedAZ, CA, CO, CT, ID, IL, IN, IA, KS, MA, MI, MN, MO, MT, NE, NJ, NY, NC, ND, OH, OR, UT, WA, WV, WI
OR largely decentralizedNV, TX
State has a mix of centralized, decentralized and/or shared
governanceAK, OK, PA, TN, WY
If Yes
If Yes
If No
If Yes If No
State has sharedgovernanceFL, GA, KY
OR largely shared governanceMD
If No
If Yes

© Association of State and Territorial Health Officials 2012 2231 Crystal Drive, Ste 450, Arlington, VA 202-371-9090 www.astho.org
8
criteria to determine if local health units within a state should be considered shared, rather than
centralized or decentralized. To make that classification decision, state‐led health units are
considered to have shared authority with local government if they meet three or more of the
criteria listed in the left column of the table below (see Figure 2). Similarly, local‐led health units
are considered to have shared authority with state government if they meet three or more of
the criteria in the right column below.
Figure 2. Criteria for determining shared local and state authority for public health units.
Criteria for state‐led health units having shared authority with local government
Criteria for local‐led health units having shared authority with state government
Local governmental entities have authority to make budgetary decisions
Local government can establish taxes for public health or establish fees for services AND this revenue goes to local government
50% or less of local heath unit budget is provided by state public health agency
Local governmental entities can issue public health orders
Local chief executives are appointed by local officials
Local chief executives are approved by local officials
State governmental entities have authority to make budgetary decisions
Local government cannot establish taxes for public health nor establish fees for services OR this revenue goes to state government
More than 50% of local heath unit budget is provided by state public health agency
Local governmental entities cannot issue public health orders
Local chief executives are appointed by state officials
Local chief executives are approved by state officials
3. If all of the local health units in a state have the same type of organizational structure, the state
is classified as centralized, decentralized, or shared. If a large majority of the state’s population
(75% or more8) is served by local health units that have a similar organizational structure, it was
deemed important to acknowledge that there is one predominant model in the state. For that
reason, those states are considered to be largely centralized, largely decentralized, or largely
shared. If there is no one predominant model (i.e., if fewer than 75% of the state’s population is
served by local health units with the same type of governance structure), the state is considered
to be mixed. Six states are classified as mixed for this reason, as is shown in the bottom right of
the decision tree (Figure 1).
Using this decision tree, NORC objectively categorized SHAs based on survey responses. States are
grouped into four general categories—centralized/largely centralized, decentralized/largely
decentralized, shared/largely shared, and mixed. This taxonomy offers more nuance than is found in
most past surveys. Based on the logic in the decision tree, these categories are defined as follows:
8 This threshold was determined in consultation with ASTHO and NACCHO.

© Association of State and Territorial Health Officials 2012 2231 Crystal Drive, Ste 450, Arlington, VA 202-371-9090 www.astho.org
9
Centralized/Largely Centralized. Seventy‐five percent or more of the state’s population is
served by local health units that are led by employees of the state, and the state retains
authority over many decisions relating to the budget, public health orders, and the selection of
local health officials.
Decentralized/Largely Decentralized. Seventy‐five percent or more of the state’s population is
served by local health units that are led by employees of local governments, and the local
governments retain authority over many decisions relating to the budget, public health orders,
and the selection of local health officials.
Shared/Largely Shared. Seventy‐five percent or more of the state’s population is served by local
health units that meet one of these criteria: where local health units are led by state employees,
local government has authority over many decisions relating to the budget, public health orders,
and the selection of local health officials; OR, where local health units are led by local
employees, the state has many of those authorities.
Mixed. Within the state there is a combination of centralized, shared, and/or decentralized
arrangements. No one arrangement predominates in the state.
Gathering Additional Information about the States
In 2011, ASTHO and NACCHO contracted with NORC to develop a map of the 50 states depicting which
states are centralized, decentralized, and shared, as well as maps illustrating which jurisdictions within
states fall into these various categories. To generate maps for states in which all jurisdictions did not fall
into a single category, it was necessary to know sub‐state jurisdictional boundaries by category. In some
instances, this information was available on health department websites, while in other cases deputy
state health officials were contacted for additional information.
During this stage of the process, NORC, ASTHO, and NACCHO also reviewed data from the 2010 ASTHO
and NACCHO profiles and identified any instances in which those profiles provided information that
contradicted the results of the initial 2009 survey. For example, there were some instances in which the
NACCHO profile identified a larger number of independent health departments than had been reported
in 2009. NORC followed up with deputy state health officials in those instances to ensure that this report
contains the most up‐to‐date information about the state.

© Association of State and Territorial Health Officials 2012 2231 Crystal Drive, Ste 450, Arlington, VA 202-371-9090 www.astho.org
10
Findings
State Categorization
After receiving information from all 50 states, the research team classified SHAs based on the
methodology presented above. The map below (Figure 3) illustrates how each state has been
categorized.
Based on this classification system, 14 states are considered to be centralized/largely centralized, 27 are
decentralized/largely decentralized, four states have shared/largely shared governance, and the
remaining five states are mixed. The classification is largely consistent with past categorization efforts;
with the exception of the nine states that were classified as largely centralized, largely decentralized, or
largely shared—designations that have not been used before—for only three states did this system give
a state a classification that it had not previously received in at least two studies.
We also provide more detailed profiles about each state in Appendix C. Each state map within Appendix
C illustrates, where appropriate, how the jurisdictions within that state have been categorized.

11
Figure 3. The 50 states and their classification.

© Association of State and Territorial Health Officials 2012 2231 Crystal Drive, Ste 450, Arlington, VA 202-371-9090 www.astho.org
12
Complexities in Categorizing States
This effort highlighted some of the challenges inherent in trying to develop a clear taxonomy to describe
all 50 states when the relationships between state and local governmental public health are often
complex. Several of the nuanced findings are described below. (Appendix C provides more detail about
the states.)
Even in states that are considered centralized, it is not uncommon for local governmental entities to
exhibit some authority; likewise, in some decentralized states, state government has some powers
regarding the local health unit. (See Figure 4.) In some instances, whole functions may be performed by
another level of government. For example, although New York is classified as a decentralized state, the
state provides environmental public health services in about one‐third of the counties.
Figure 4. Examples of authorities held at a different level of government in centralized and decentralized states.
Among the 14 states classified as centralized/largely centralized …
Number of States Authority
1 Local entities have the authority to make budgetary decisions
5 Local entities can provide nonbinding input in the budgetary process
3 Local entities can generate taxes or fees and that revenue either goes to local government or can be allocated for some local public health services
5 Local entities can issue public health orders
1 Local entities can appoint local chief executives
Among the 27 states classified as decentralized/largely decentralized …
Number of States Authority
2 State entities can provide nonbinding input in the budgetary process
8 State entities can approve local chief executives
These nuances are particularly striking when it comes to funding and the authority to make budgetary
decisions. Even in decentralized states where local governmental entities have budgetary authority,
states often contribute some resources. These funds are often tied to guidelines on how the money can
be spent. In these circumstances, states are still classified as decentralized, but it should be noted that
local health units may still feel the impact of state decisions. The importance of contributing funds also
plays out in states where local health units are led by state employees. The responses to the survey
questions and the conversations related to follow‐up questions suggested that in cases where local

© Association of State and Territorial Health Officials 2012 2231 Crystal Drive, Ste 450, Arlington, VA 202-371-9090 www.astho.org
13
governmental entities contribute revenue to the local health unit, local governmental entities assumed
control over portions of the budget.
Another complicating issue is the fact that states may have multiple, coexisting layers of governmental
public health. In addition to a state level and a local level, some states also have regional public health
offices. Based on the definition of a local health unit provided as part of this survey, regional arms of a
SHA could be considered local health units. Indeed, this was done deliberately so that states would have
the opportunity to describe the budgetary processes in these state‐employee‐led health units if they are
the only health units operating in a particular area. However, it would have been more useful if the
survey explicitly stated that in cases where there are both regional arms of SHAs and local health units
that cover smaller jurisdictions, the respondent should focus on those smaller jurisdictions when
answering the questions. This would provide a clearer picture of on‐the‐ground provision of local public
health services.
Next Steps
The survey and categorization scheme were designed to offer a more transparent and objective method
for SHA classification. As such, it may be valuable to use this standard set of questions in future surveys
that are seeking to clarify the relationship between state and local governmental public health. Periodic
administration of a similar survey on a regular (5‐ or 10‐year) basis to determine if states have changed
their organizational structure is recommended. These questions may also be a useful guide for other
efforts that would benefit from a clearer understanding of how local and state entities interact. For
example, in preparation for assessing states for accreditation, it may be valuable to ask applicant public
health agencies a series of questions that are based on the ones used in this study. This may provide
valuable contextual information for site visitors.
If these questions are used again in the future, some refinements are recommended. In the Lessons
Learned box below, several areas for improvement are identified. Appendix D presents suggested
revisions to the data collection tool based on those lessons. These revised questions should be pilot
tested to ensure usability.

© Association of State and Territorial Health Officials 2012 2231 Crystal Drive, Ste 450, Arlington, VA 202-371-9090 www.astho.org
14
Lessons Learned and Advice for Future Iterations of This Survey
Respondents should be given additional opportunities to provide free‐text narrative. Although the survey was deliberately designed to try to capture discrete data points, additional clarification would have proven valuable in several instances. In particular, if states respond that none of the descriptions of budgetary authority apply, they should be given the opportunity to explain how budgetary decisions are made.
An additional question should be added to ask who, if anyone, provides local governmental public health services in areas that are not served by a local health unit.
The opening table should be clarified to indicate that if a particular portion of the population is served both by a locally led health unit serving a smaller jurisdiction (e.g., a county or city) and by a state‐led health unit serving a broader jurisdiction (e.g., a regional branch of a SHA), the respondent should focus on the unit that has a smaller jurisdiction.
One of the response options about budgetary authority in local health units that are led by local employees may need to be revised. The response “Aside from requirements to report on the use of state‐provided funds, local governmental entities retain decision making capacity about the budget for local health units, with no state input” may need to be broadened to account for the fact that states, as funders of public health activities, may impose guidelines on the use of funds that go beyond simply reporting how they were used.
If a paper‐based version of the survey is administered, it should more clearly articulate the skip patterns. In the online version, respondents are directed to answer either the questions about health units led by state employees, the questions about health units led by local employees, or both, based on their responses to the opening table. Similar instructions are needed to direct paper‐based respondents to the appropriate responses.
Although this process asks more specific questions about the interactions between state and local public health than previous studies, it still relies on the judgment and knowledge of one respondent. Given the complexity of the issues addressed in this survey, different respondents may interpret the same questions differently. To validate the answers in the survey, it may, therefore, be useful to have respondents first complete the survey and then hold telephone conversations to review their responses and ask clarifying questions to better understand the reasoning behind each response.
In addition to offering a methodology that can be applied in the future, the classifications provided in
this report may serve as valuable inputs for future research. For example, it would be interesting to
conduct a study that looks at past research that used state classification as an explanatory variable (e.g.,
the studies on financing and public health performance described above) to see how the results would
change if states were categorized in the way recommended in this report. Another area of additional
research that flows from this project would be to examine responses to similar questions that are asked
of local health departments. Matching local perspectives on the organizational structure in their state to

© Association of State and Territorial Health Officials 2012 2231 Crystal Drive, Ste 450, Arlington, VA 202-371-9090 www.astho.org
15
state perspectives would provide an even richer picture of intergovernmental public health
relationships.
This project has developed a replicable process for objectively classifying states based on the
distribution of public health authorities between state and local governmental entities. The state
classifications put forth through this effort can serve as a strong foundation for future efforts in public
health systems and services research.

© Association of State and Territorial Health Officials 2012 2231 Crystal Drive, Ste 450, Arlington, VA 202-371-9090 www.astho.org
16
Appendices

State Public Health Agency Categorization
17
Appendix A: Comparison of Classifications of States
DeFriese et al.
(1981)9 Mullan & Smith
(1988)10 CDC (1991)11 NACCHO (1998)12 Gostin & Hodge
(2002)13 PHF (2002)14 ASTHO (2007)15 NORC (2011)
Alabama Mixed Shared Shared Mixed Hybrid Mixed Mixed Largely Centralized
Alaska Shared Mixed Mixed Mixed Hybrid Mixed Mixed Mixed‐ Decentralized & Centralized
Arizona Mixed Decentralized Decentralized Decentralized Decentralized‐ Bottom Up
Decentralized Shared Decentralized
Arkansas Centralized Centralized Centralized Centralized Centralized‐ Top Down
Centralized Centralized Centralized
California Decentralized Mixed Mixed Mixed Hybrid Decentralized Decentralized
Colorado Shared Decentralized Decentralized Shared Decentralized‐ Bottom Up
Shared Mixed Decentralized
Connecticut Centralized Decentralized Decentralized Decentralized Decentralized‐ Bottom Up
Decentralized Shared Decentralized
Delaware *Reported no LPHAs
Centralized Centralized Centralized *Reported no LPHAs
Centralized
Florida Centralized Centralized Centralized Centralized Centralized‐ Top Down
Shared Centralized Shared‐ State Led
Georgia Shared Shared Shared Decentralized Hybrid Decentralized Shared Shared‐ State Led
Hawaii Centralized Centralized Other Centralized *Reported no LPHAs
Centralized
Idaho Decentralized Decentralized Decentralized Decentralized Decentralized‐ Bottom Up
Shared Shared Decentralized
Illinois Decentralized Mixed Mixed Decentralized Hybrid Decentralized Decentralized Decentralized
Indiana Shared Decentralized Decentralized Decentralized Decentralized‐ Bottom Up
Decentralized Decentralized Decentralized
Iowa Decentralized Decentralized Decentralized Decentralized Decentralized‐ Bottom Up
Decentralized Decentralized Decentralized
Kansas Decentralized Mixed Mixed Decentralized Hybrid Decentralized Decentralized Decentralized
Kentucky Shared Shared Shared Shared Hybrid Decentralized Shared Shared‐ Local Led
Louisiana Centralized Centralized Centralized Centralized Centralized‐ Top Down
Centralized Centralized Largely Centralized

State Public Health Agency Categorization
18
DeFriese et al.
(1981)9 Mullan & Smith
(1988)10 CDC (1991)11 NACCHO (1998)12 Gostin & Hodge
(2002)13 PHF (2002)14 ASTHO (2007)15 NORC (2011)
Maine Decentralized Decentralized Mixed Decentralized Decentralized‐ Bottom Up
Centralized Largely Centralized
Maryland Centralized Shared Shared Mixed Hybrid Shared Mixed Largely Shared‐ State Led
Massachusetts Decentralized Mixed Mixed Decentralized Hybrid Mixed Decentralized Decentralized
Michigan Shared Mixed Mixed Decentralized Hybrid Decentralized Decentralized Decentralized
Minnesota Centralized Shared Shared Decentralized Hybrid Decentralized Decentralized Decentralized
Mississippi Centralized Centralized Centralized Centralized Centralized‐ Top Down
Centralized Centralized Centralized
Missouri Mixed Decentralized Decentralized Decentralized Decentralized‐ Bottom Up
Decentralized Decentralized Decentralized
Montana Centralized Decentralized Decentralized Decentralized Decentralized‐ Bottom Up
Decentralized Decentralized Decentralized
Nebraska Decentralized Decentralized Decentralized Mixed Decentralized‐ Bottom Up
Decentralized Mixed Decentralized
Nevada Centralized Decentralized Mixed Centralized Decentralized‐ Bottom Up
Shared Largely Decentralized
New Hampshire Decentralized Mixed Mixed Mixed Hybrid Decentralized Decentralized Largely Centralized
New Jersey Shared Decentralized Decentralized Decentralized Decentralized‐ Bottom Up
Decentralized Decentralized Decentralized
New Mexico Centralized Centralized Centralized Centralized Centralized‐ Top Down
Centralized Centralized Centralized
New York Shared Mixed Mixed Decentralized Hybrid Mixed Mixed Decentralized
North Carolina Decentralized Shared Shared Decentralized Hybrid Decentralized Decentralized Decentralized
North Dakota Centralized Decentralized Decentralized Decentralized Decentralized‐ Bottom Up
Decentralized Decentralized Decentralized
Ohio Decentralized Shared Shared Decentralized Hybrid Shared Decentralized Decentralized
Oklahoma Shared Mixed Mixed Centralized Hybrid Mixed Mixed Mixed‐ Centralized & Decentralized
Oregon Decentralized Decentralized Decentralized Decentralized Decentralized‐ Bottom Up
Mixed Decentralized Decentralized
Pennsylvania Mixed Mixed Mixed Decentralized Hybrid Mixed Mixed Mixed‐ Centralized & Decentralized

State Public Health Agency Categorization
19
DeFriese et al.
(1981)9 Mullan & Smith
(1988)10 CDC (1991)11 NACCHO (1998)12 Gostin & Hodge
(2002)13 PHF (2002)14 ASTHO (2007)15 NORC (2011)
Rhode Island *Reported no LPHAs
*Reported no LPHAs
Other Centralized *Reported no LPHAs
Centralized
South Carolina Centralized Centralized Centralized Centralized Centralized‐ Top Down
Centralized Centralized Centralized
South Dakota Decentralized Mixed Mixed Mixed Hybrid Centralized Centralized Largely Centralized
Tennessee Centralized Mixed Mixed Mixed Hybrid Mixed Decentralized Mixed‐ Centralized & Decentralized
Texas Decentralized Mixed Mixed Mixed Hybrid Mixed Mixed Largely Decentralized
Utah Decentralized Decentralized Decentralized Decentralized Decentralized‐ Bottom Up
Decentralized Decentralized Decentralized
Vermont *Reported no LPHAs
Centralized Centralized Centralized Centralized Centralized
Virginia Centralized Centralized Centralized Centralized Centralized‐ Top Down
Mixed Mixed Largely Centralized
Washington Decentralized Decentralized Decentralized Decentralized Decentralized‐ Bottom Up
Decentralized Decentralized Decentralized
West Virginia Shared Shared Shared Decentralized Hybrid Decentralized Decentralized Decentralized
Wisconsin Mixed Decentralized Decentralized Decentralized Decentralized‐ Bottom Up
Decentralized Shared Decentralized
Wyoming Mixed Mixed Mixed Decentralized Hybrid Mixed *Reported no LPHAs
Mixed‐ Shared (State Led) & Decentralized

State Public Health Agency Categorization
© Association of State and Territorial Health Officials 2012 2231 Crystal Drive, Ste 450, Arlington, VA 202-371-9090 www.astho.org
20
References for Table
9 DeFriese GH, Hetherington JS, Brooks EF, Miller CA, Jain SC, Kavaler F & Stein JS. “The program implications of administrative relationships between local health departments and state and local government.” 1981. American Journal of Public Health, 71(10):1109‐1115.
10 Mullan F & Smith J. Characteristics of state and local health agencies, mimeographed paper. Baltimore, MD: Johns Hopkins University School of Hygiene and Public Health, 1998, cited in Pickett, GE and Hanlon, JJ. Public health: administration and practice (9th ed.). St. Louis: Times Mirror/Mosby College. 1990.
11 Centers for Disease Control (CDC) and Public Health Practice Program Office (PHPPO). Profile of state and territorial public health system, 1991. U.S. Department of Health and Human Services. 1991. Available at: http://wonder.cdc.gov/wonder/sci_data/misc/type_txt/stprof91.asp.
12 Fraser M & Downing K, comps. NACCHO Survey Examines State/Local Health Department Relationships. Washington, DC: NACCHO. 1998. Research Brief, 2.
13 Gostin LO & Hodge JG. State public health law assessment report. 2002. Turning Point: Collaborating for a New Century in Public Health. Available at: http://www.turningpointprogram.org/Pages/pdfs/statute_mod/phsm_state_ph_law_assessment_report.pdf.
14 Public Health Foundation. Survey on performance management practice in states: results of a baseline assessment of state health agencies. Seattle, WA: Turning Point National Program Office at the University of Washington. 2002.
15 Association of State and Territorial Health Officials. ASTHO Baseline Survey. 2007.

State Public Health Agency Categorization
© Association of State and Territorial Health Officials 2012 2231 Crystal Drive, Ste 450, Arlington, VA 202-371-9090 www.astho.org
21
Appendix B: Survey Instrument
SHA Survey Contact Information
Name
Job Title
E‐mail Address
Phone Number
In what state is your public health agency located?
Introductory Table
The following definitions will be helpful in completing the introductory table:
Local health unit – A local health unit is an administrative or service unit of local or state government
concerned with health, and carrying some responsibility for the health of a jurisdiction smaller than the
state. (This includes local public health departments, regional public health departments, and regional
and local units of state public health agencies. Please do not consider tribal health agencies when
responding. We understand that tribal health agencies make an important contribution to protecting the
public health in many states; however, because tribal nations have sovereignty, their relationship with
state public health agencies may differ from the relationship between states and local health units.)
State Employee – An individual is a state employee if that individual’s salary is paid directly by the state
government.
Local Employee – An individual is a local employee if that individual’s salary is paid by a city, county, or
other sub‐state jurisdiction.
Led by – An organization is led by the employee at the organization with the most seniority.

State Public Health Agency Categorization
© Association of State and Territorial Health Officials 2012 2231 Crystal Drive, Ste 450, Arlington, VA 202-371-9090 www.astho.org
22
Please provide your best estimates to complete the following table. You will be asked about two
different types of local health units—those led by a state employee and those led by a local employee.
For each type of health unit, please indicate in the first column the number of such units in your state. In
the second column, please indicate the percentage of the TOTAL state population that lives in an area
served by that type of health unit.
Number of this type of local health unit
% of TOTAL state population served by this type of local health unit*
Local health unit led by a STATE employee
Local health unit led by a LOCAL employee
What percent of the state’s population lives in areas that are not served by a local health unit?
% of TOTAL state population served by this type of local health unit*
State population not served by a
local health unit
Please note: The three percentages in the columns marked with an * in the above questions should add
up to 100 percent.
Areas Served by Health Units Led by a State Employee When you respond to questions in this section, please think ONLY about areas served by health units led
by a STATE employee.
How would you describe local involvement with budgetary decisions related to local health units that
are led by a state employee? (Please select ONLY ONE response.)
o Local governmental entities (e.g., local health departments, local elected officials, or Boards of Health) have the authority to make budgetary decisions about allocating resources for programs within the local health unit.
o All authority to make budget decisions is held at the state level with no local input.
o All authority for budget decisions is held at the state level, but local governmental entities play a nonbinding advisory role related to setting the budget for local health units.
o Varies by health unit among health units that are led by a state employee. (Please provide additional details in the space provided.)
o None of the above applies to local health units that are led by a state employee.

State Public Health Agency Categorization
© Association of State and Territorial Health Officials 2012 2231 Crystal Drive, Ste 450, Arlington, VA 202-371-9090 www.astho.org
23
Do any local governmental entities (e.g., local health departments, local elected officials, or Boards of
Health) have the ability to do any of the following? (Select all that apply.)
o Establish taxes for public health
o Establish fees for services without getting approval from a governmental entity led by a state employee
o Issue public health orders (e.g., close a food‐service establishment)
o None of the above
Where does the revenue generated from those taxes or fees go? (Select ONLY ONE response.)
o To local government
o To state government
o Some revenue goes to state government and some to local government
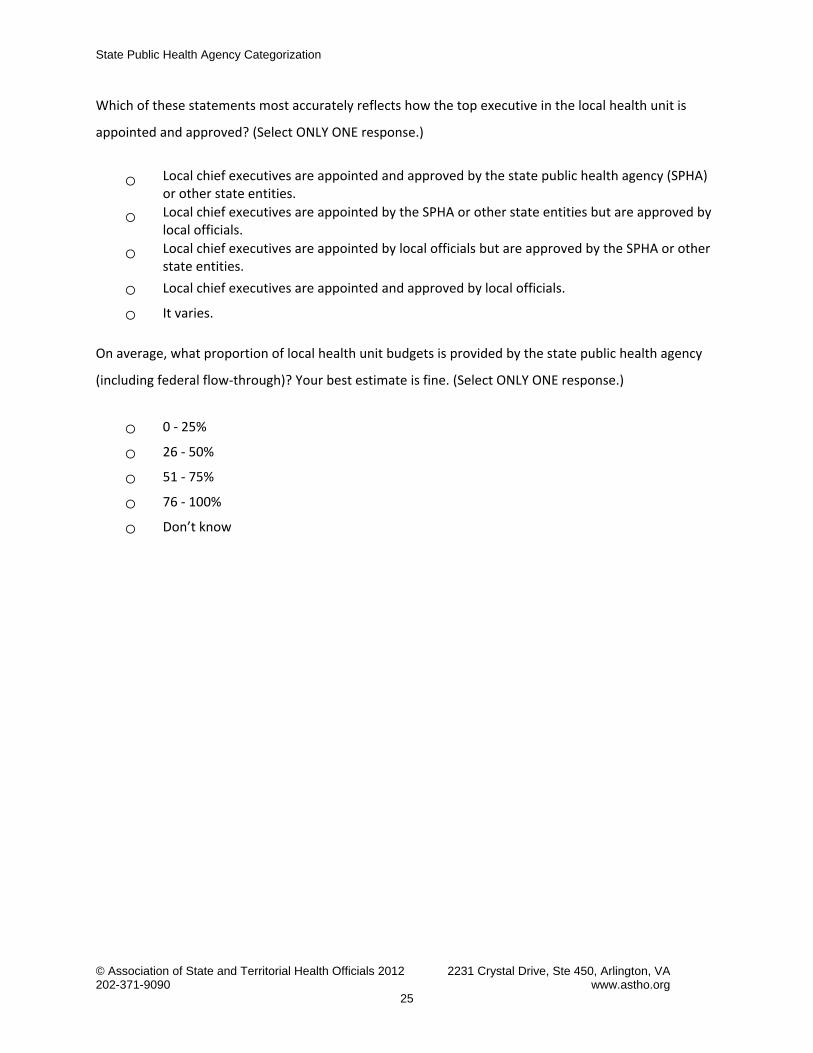
Which of these statements most accurately reflects how the top executive in the local health unit is
appointed and approved? (Select ONLY ONE response.)
o Local chief executives are appointed and approved by the state public health agency (SPHA) or other state entities.
o Local chief executives are appointed by the SPHA or other state entities but are approved by local officials.
o Local chief executives are appointed by local officials but are approved by the SPHA or other state entities.
o Local chief executives are appointed and approved by local officials.
o It varies.
On average, what proportion of local health unit budgets is provided by the state public health agency
(including federal flow‐through)? Your best estimate is fine. (Select ONLY ONE response.)
o 0 ‐ 25%
o 26 ‐ 50%
o 51 ‐ 75%
o 76 ‐ 100%
o Don’t know

State Public Health Agency Categorization
© Association of State and Territorial Health Officials 2012 2231 Crystal Drive, Ste 450, Arlington, VA 202-371-9090 www.astho.org
24
Areas Served by Health Units Led by a Local Employee
When you respond to questions in this section, please think ONLY about areas served by health units led
by a LOCAL employee.
How would you describe state involvement with budgetary decisions related to local health units that
are led by a local employee? (Select ONLY ONE response.)
o State authority is required to allocate resources for programs within the local health unit.
o Aside from requirements to report on the use of state‐provided funds, local governmental entities (e.g., local health departments, local elected officials, or Boards of Health) retain decision making capacity about the budget for local health units, with no state input.
o All authority for budget decisions is held at the local level, but there is a nonbinding advisory role at the state level.
o Varies by health unit among health units that are led by a local employee. (Please provide additional details in the space provided.)
o None of the above applies to local health units that are led by a local employee.
Do any local governmental entities (e.g., local health departments, local elected officials, or Boards of
Health) have the ability to do any of the following? (Select all that apply.)
o Establish taxes for public health
o Establish fees for services without getting approval from a governmental entity led by a state employee
o Issue public health orders (e.g., close a food services establishment)
o None of the above
Where does the revenue generated from those taxes or fees go? (Select ONLY ONE response.)
o To local government
o To state government
o Some revenue goes to state government and some to local government
State Public Health Agency Categorization
© Association of State and Territorial Health Officials 2012 2231 Crystal Drive, Ste 450, Arlington, VA 202-371-9090 www.astho.org
25
Which of these statements most accurately reflects how the top executive in the local health unit is
appointed and approved? (Select ONLY ONE response.)
o Local chief executives are appointed and approved by the state public health agency (SPHA) or other state entities.
o Local chief executives are appointed by the SPHA or other state entities but are approved by local officials.
o Local chief executives are appointed by local officials but are approved by the SPHA or other state entities.
o Local chief executives are appointed and approved by local officials.
o It varies.
On average, what proportion of local health unit budgets is provided by the state public health agency
(including federal flow‐through)? Your best estimate is fine. (Select ONLY ONE response.)
o 0 ‐ 25%
o 26 ‐ 50%
o 51 ‐ 75%
o 76 ‐ 100%
o Don’t know

State Public Health Agency Categorization
26
Appendix C: Detailed Descriptions of Each State
State Name and Categorization Details About the Relationship Between State and Local Public Health Agencies
Alabama Largely Centralized
Centralized: 65 local health units led by state employee, serving 77% of total state population. For these areas:
Budgetary authority rests with state government, but local government plays a nonbinding advisory role
Local governmental entities may:
Issue public health orders
Top executive is appointed and approved by the state
0‐25% of local health unit budget is provided by the state
Decentralized: 2 local health units led by local employee, serving 23% of total state population. For these areas:
Budgetary authority rests with local government with no state input
Local governmental entities may:
Establish taxes for public health
Establish fees for services without state approval
Issue public health orders
Revenue from taxes/fees goes to local government
Top executive is appointed by local officials but approved by the state
0‐25% of local health unit budget is provided by the state

State Public Health Agency Categorization
27
State Name and Categorization Details About the Relationship Between State and Local Public Health Agencies
Alaska Mixed – Decentralized & Centralized
Decentralized: 3 local health units led by local employee, serving 43% of total state population. For these areas:
Budgetary authority rests with local government with no state input
Local governmental entities may:
Establish taxes for public health
Establish fees for services without state approval
Revenue from taxes/fees goes to local government
Top executive is appointed and approved by local officials
51‐75% of local health unit budget is provided by the state
Centralized: 23 local health units led by state employee, serving 57% of total state population. For these areas:
Budgetary authority rests with state government with no local input
Top executive is appointed and approved by the state
76‐100% of local health unit budget is provided by the state

State Public Health Agency Categorization
28
State Name and Categorization Details About the Relationship Between State and Local Public Health Agencies
Arizona Decentralized
Decentralized: 15 local health units led by local employee, serving 100% of total state population. For these areas:
Budgetary authority rests with local government with no state input
Local governmental entities may:
Establish taxes for public health
Establish fees for services without state approval
Issue public health orders
Revenue from taxes/fees goes to local government
Top executive is appointed and approved by local officials
0‐25% of local health unit budget is provided by the state

State Public Health Agency Categorization
29
State Name and Categorization Details About the Relationship Between State and Local Public Health Agencies
Arkansas Centralized
Centralized: 94 local health units led by state employee, serving 100% of total state population. For these areas:
Budgetary authority rests with state government, but local government plays a nonbinding advisory role
Top executive is appointed and approved by the state
76‐100% of local health unit budget is provided by the state

State Public Health Agency Categorization
30
State Name and Categorization Details About the Relationship Between State and Local Public Health Agencies
California Decentralized
Decentralized: 61 local health units led by local employee, serving 100% of total state population. For these areas:
Budgetary authority rests with local government with no state input
Local governmental entities may:
Establish taxes for public health
Establish fees for services without state approval
Issue public health orders
Revenue from taxes/fees goes to local government
Top executive is appointed and approved by local officials
51‐75% of local health unit budget is provided by the state

State Public Health Agency Categorization
31
State Name and Categorization Details About the Relationship Between State and Local Public Health Agencies
Colorado Decentralized
Decentralized: 54 local health units led by local employee, serving 100% of total state population. For these areas:
Budgetary authority rests with local government with no state input
Local governmental entities may:
Establish taxes for public health
Establish fees for services without state approval
Issue public health orders
Revenue from taxes/fees goes to local government
Top executive is appointed and approved by local officials
76‐100% of local health unit budget is provided by the state

State Public Health Agency Categorization
32
State Name and Categorization Details About the Relationship Between State and Local Public Health Agencies
Connecticut Decentralized
Decentralized: 80 local health units led by local employee, serving 100% of total state population. For these areas:
Budgetary authority rests with local government with no state input
Local governmental entities may:
Establish fees for services without state approval
Issue public health orders
Top executive is appointed by local officials but approved by the state
51‐75% of local health unit budget is provided by the state

State Public Health Agency Categorization
33
State Name and Categorization Details About the Relationship Between State and Local Public Health Agencies
Delaware Centralized
Centralized: No local health units are reported for the state. However, there are two satellite clinics of the state health department.

State Public Health Agency Categorization
34
State Name and Categorization Details About the Relationship Between State and Local Public Health Agencies
Florida Shared (State Led)
Shared (State Led): 67 local health units led by state employee, serving 100% of total state population. For these areas:
Both the state Department of Health and the Board of County Commissioners contribute funding; Board of County Commissioners can designate how the funds it contributes will be used
Local governmental entities may:
Establish taxes for public health
Establish fees for services without state approval
Issue public health orders
Revenue from taxes/fees goes to state government
Top executive is appointed by the state but approved by local officials
26‐50% of local health unit budget is provided by the state

State Public Health Agency Categorization
35
State Name and Categorization Details About the Relationship Between State and Local Public Health Agencies
Georgia Shared (State Led)
Shared (State Led): 18 local health units led by state employee, serving 100% of total state population. For these areas:
Local governmental entities have authority to make budgetary decisions
Local governmental entities may:
Establish fees for services without state approval
Issue public health orders
Revenue from fees goes to local government
Top executive is appointed and approved by the state
26‐50% of local health unit budget is provided by the state
Georgia has 18 regional offices. There are also 159 local health units that are run by local boards of health.

State Public Health Agency Categorization
36
State Name and Categorization Details About the Relationship Between State and Local Public Health Agencies
Hawaii Centralized
Centralized: Local public health services are organized at the state level by one state health agency with district health offices providing local health services.

State Public Health Agency Categorization
37
State Name and Categorization Details About the Relationship Between State and Local Public Health Agencies
Idaho Decentralized
Decentralized: 7 local health units led by local employee, serving 100% of total state population. For these areas:
Budgetary authority varies among health units
Local governmental entities may:
Establish taxes for public health
Establish fees for services without state approval
Issue public health orders
Revenue from taxes/fees goes to local government
Top executive is appointed and approved by local officials
51‐75% of local health unit budget is provided by the state

State Public Health Agency Categorization
38
State Name and Categorization Details About the Relationship Between State and Local Public Health Agencies
Illinois Decentralized
Note: Areas labeled as “other” represent communities in which state public health agency respondents indicated no local public health units. In many of these areas, at least a limited set of services may be provided by the state health department, neighboring local health departments, or other entities.
Decentralized: 96 local health units led by local employee, serving 99.5% of total state population. For these areas:
Budgetary authority rests with local government with no state input*
Local governmental entities may:
Establish taxes for public health
Establish fees for services without state approval
Issue public health orders
Revenue from taxes/fees goes to local government
Top executive is appointed by local officials but approved by the state
51‐75% of local health unit budget is provided by the state
0.5% of the population is not served by local health units. There is no organized governmental public health unit in these areas, which have a combined population of about 23,000 individuals. Some services (although not comprehensive) are provided by neighboring health departments; the funds for these services are designated by the state, specifically to cover this population. The only mandated state function is support at the local level in case of foodborne illness.
*State has influence over local budgets in their determination of the level of funding that reaches local public health.

State Public Health Agency Categorization
39
State Name and Categorization Details About the Relationship Between State and Local Public Health Agencies
Indiana Decentralized
Decentralized: 93 local health units led by local employee, serving 100% of total state population. For these areas:
Budgetary authority rests with local government with no state input
Local governmental entities may:
Establish taxes for public health
Establish fees for services without state approval
Issue public health orders
Revenue from taxes/fees goes to local government
Top executive is appointed and approved by local officials
0‐25% of local health unit budget is provided by the state

State Public Health Agency Categorization
40
State Name and Categorization Details About the Relationship Between State and Local Public Health Agencies
Iowa Decentralized
Decentralized: 101 local health units led by local employee, serving 100% of total state population. For these areas:
Budgetary authority rests with local government, but state government plays a nonbinding advisory role
Local governmental entities may:
Establish fees for services without state approval
Issue public health orders
Revenue from taxes/fees goes to local government
Top executive is appointed and approved by local officials
51‐75% of local health unit budget is provided by the state

State Public Health Agency Categorization
41
State Name and Categorization Details About the Relationship Between State and Local Public Health Agencies
Kansas Decentralized
Decentralized: 100 local health units led by local employee, serving 100% of total state population. For these areas:
Budgetary authority rests with local government with no state input
Local governmental entities may:
Establish taxes for public health
Establish fees for services without state approval
Issue public health orders
Revenue from taxes/fees goes to local government
Top executive is appointed and approved by local officials
0‐25% of local health unit budget is provided by the state

State Public Health Agency Categorization
42
State Name and Categorization Details About the Relationship Between State and Local Public Health Agencies
Kentucky Shared (Local Led)
Shared (Local Led): 57 local health units led by local employee, serving 100% of total state population. For these areas:
State authority is required to allocate resources
Local governmental entities may:
Establish taxes for public health
Establish fees for services without state approval
Issue public health orders
Revenue from taxes/fees goes to both state and local government
Top executive is appointed by local officials but approved by the state
51‐75% of local health unit budget is provided by the state

State Public Health Agency Categorization
43
State Name and Categorization Details About the Relationship Between State and Local Public Health Agencies
Louisiana Largely Centralized
Centralized: 9 local health units led by state employee, serving 92% of total state population. For these areas:
Budgetary authority rests with state government with no local input
Local governmental entities may:
Establish taxes for public health
Revenue from taxes goes to local government
Top executive is appointed and approved by the state
76‐100% of local health unit budget is provided by the state
Decentralized: 2 local health units led by local employee, serving 8% of total state population. For these areas:
Budgetary authority rests with local government, but state government plays a nonbinding advisory role
Local governmental entities may:
Establish taxes for public health
Revenue from taxes goes to local government
Top executive is appointed and approved by local officials
51‐75% of local health unit budget is provided by the state

State Public Health Agency Categorization
44
State Name and Categorization Details About the Relationship Between State and Local Public Health Agencies
Maine Largely Centralized
Centralized: 8 local health units led by state employee, serving 90% of total state population. For these areas:
Budgetary authority rests with state government, but local government plays a nonbinding advisory role
Top executive is appointed and approved by the state
76‐100% of local health unit budget is provided by the state
Decentralized: 2 local health unit led by local employee, serving 10% of total state population. For this area:
Budgetary authority rests with local government with no state input
Top executive is appointed and approved by local officials
26‐50% of local health budget is provided by the state.

State Public Health Agency Categorization
45
State Name and Categorization Details About the Relationship Between State and Local Public Health Agencies
Maryland Largely Shared (State Led)
Shared (State Led): 23 local health units led by state employee, serving 92% of total state population. For these areas:
Local governmental entities have authority to make budgetary decisions
Local governmental entities may*:
Establish taxes for public health
Establish fees for services without state approval
Issue public health orders
Revenue from taxes/fees goes to local government
Top executive is appointed by local officials but approved by the state
51‐75% of local health unit budget is provided by the state
Decentralized: 1 local health unit led by local employee, serving 8% of total state population. For this area:
Budgetary authority rests with local government with no state input
Local governmental entities may:
Establish taxes for public health
Establish fees for services without state approval
Issue public health orders
Revenue from taxes/fees goes to local government
Top executive is appointed and approved by local officials
76‐100% of local health unit budget is provided by the state
*For those few services that are completely locally funded

State Public Health Agency Categorization
46
State Name and Categorization Details About the Relationship Between State and Local Public Health Agencies
Massachusetts Decentralized
Decentralized: 351 local health units led by local employee, serving 100% of total state population. For these areas:
Budgetary authority rests with local government with no state input
Local governmental entities may:
Establish taxes for public health
Establish fees for services without state approval
Issue public health orders
Revenue from taxes/fees goes to local government
Top executive is appointed and approved by local officials
0‐25% of local health unit budget is provided by the state

State Public Health Agency Categorization
47
State Name and Categorization Details About the Relationship Between State and Local Public Health Agencies
Michigan Decentralized
Decentralized : 45 local health units led by local employee, serving 100% of total state population. For these areas:
Budgetary authority rests with local government with no state input
Local governmental entities may:
Establish taxes for public health
Establish fees for services without state approval
Issue public health orders
Revenue from taxes/fees goes to local government
Top executive is appointed by local officials but approved by the state
26‐50% of local health unit budget is provided by the state

State Public Health Agency Categorization
48
State Name and Categorization Details About the Relationship Between State and Local Public Health Agencies
Minnesota Decentralized
s
Decentralized: 51 local health units led by local employee, serving 100% of total state population. For these areas:
Budgetary authority rests with local government with no state input
Local governmental entities may:
Establish taxes for public health
Establish fees for services without state approval
Issue public health orders
Revenue from taxes/fees goes to local government
Top executive is appointed and approved by local officials
26‐50% of local health unit budget is provided by the state
The number of local health units fluctuates frequently, as local health units close or combine when they do not cover a certain population threshold. In addition to these local health units, there are 8 district offices in the state.

State Public Health Agency Categorization
49
State Name and Categorization Details About the Relationship Between State and Local Public Health Agencies
Mississippi Centralized
Centralized: 81 local health units led by state employee, serving 100% of total state population. For these areas:
Budgetary authority rests with state government, but local government plays a nonbinding advisory role
Local governmental entities may:
Issue public health orders
Top executive is appointed by local officials but approved by the state
76‐100% of local health unit budget is provided by the state

State Public Health Agency Categorization
50
State Name and Categorization Details About the Relationship Between State and Local Public Health Agencies
Missouri Decentralized
Decentralized: 115 local health units led by local employee, serving 100% of total state population. For these areas:
Budgetary authority rests with local government with no state input
Local governmental entities may:
Establish taxes for public health
Establish fees for services without state approval
Issue public health orders
Revenue from taxes/fees goes to local government
Top executive is appointed and approved by local officials
0‐25% of local health unit budget is provided by the state

State Public Health Agency Categorization
51
State Name and Categorization Details About the Relationship Between State and Local Public Health Agencies
Montana Decentralized
Decentralized: 50 local health units led by local employee, serving 100% of total state population. For these areas:
Budgetary authority rests with local government with no state input
Local governmental entities may:
Establish taxes for public health
Establish fees for services without state approval
Issue public health orders
Revenue from taxes/fees goes to local government
Top executive is appointed by local officials but approved by the state
51‐75% of local health unit budget is provided by the state

State Public Health Agency Categorization
52
State Name and Categorization Details About the Relationship Between State and Local Public Health Agencies
Nebraska Decentralized
Decentralized: 21 local health units led by local employee, serving 100% of total state population. For these areas:
Budgetary authority rests with local government with no state input
Local governmental entities may:
Establish taxes for public health
Establish fees for services without state approval
Issue public health orders
Revenue from taxes/fees goes to local government
Top executive is appointed by local officials but approved by the state
51‐75% of local health unit budget is provided by the state

State Public Health Agency Categorization
53
State Name and Categorization Details About the Relationship Between State and Local Public Health Agencies
Nevada Largely Decentralized
Decentralized:3 local health units led by local employee, serving 84% of total state population. For these areas:
Budgetary authority rests with local government with no state input.
Local governmental entities may:
Establish taxes for public health
Establish fees for services without state approval
Issue public health orders
Revenue from taxes/fees goes to local government
Top executive is appointed and approved by local officials
51‐75% of local health unit budget is provided by the state
Centralized: 1 local health unit led by state employee, serving 16% of total state population. For these areas:
Budgetary authority rests with state government with some local input
Local governmental entities may*:
Establish fees for services without state approval
Issue public health orders
Revenue from fees goes to state government**
Top executive is appointed and approved by the state
76‐100% of local health unit budget is provided by the state
*If the state serves as their health authority, local health units typically do not establish separate local fees. The state provides guidance for health issues ordered by the locally appointed health officer. ** Revenue is generated through the taxing authority and comes to the state through an agreement or billing arrangement.

State Public Health Agency Categorization
54
State Name and Categorization Details About the Relationship Between State and Local Public Health Agencies
New Hampshire Largely Centralized
Centralized: 80% of the population is not served by local health units. For this population, the state is responsible for contracting or directly providing public health services.
Decentralized: 5 local health units led by local employee, serving 20% of total state population. For these areas:
Budgetary authority rests with local government with no state input
Local governmental entities may:
Establish taxes for public health
Establish fees for services without state approval
Issue public health orders
Revenue from taxes/fees goes to local government
Top executive is appointed and approved by local officials
26‐50% of local health unit budget is provided by the state

State Public Health Agency Categorization
55
State Name and Categorization Details About the Relationship Between State and Local Public Health Agencies
New Jersey Decentralized
Decentralized: 100 local health units led by local employee, serving 100% of total state population. For these areas:
Budgetary authority rests with local government with no state input
Local governmental entities may:
Establish taxes for public health
Establish fees for services without state approval
Issue public health orders
Revenue from taxes/fees goes to local government
Top executive is appointed and approved by local officials
0‐25% of local health unit budget is provided by the state

State Public Health Agency Categorization
56
State Name and Categorization Details About the Relationship Between State and Local Public Health Agencies
New Mexico Centralized
Centralized: 4 regional health units led by state employee, serving 100% of total state population. For these areas:
Budgetary authority rests with state government, but local government plays a nonbinding advisory role
Top executive is appointed and approved by the state
76‐100% of local health unit budget is provided by the state
In addition, there are 55 county health offices led by state employees, and the city of Albuquerque has an Environmental Health Department.

State Public Health Agency Categorization
57
State Name and Categorization Details About the Relationship Between State and Local Public Health Agencies
New York Decentralized
Decentralized: 58 local health units led by local employee, serving 100% of total state population. For these areas:
Budgetary authority rests with local government, but state government plays a nonbinding advisory role
Local governmental entities may:
Establish taxes for public health
Establish fees for services without state approval
Issue public health orders
Revenue from taxes/fees goes to local government
Top executive is appointed by local officials but approved by the state
26‐50% of local health unit budget is provided by the state

State Public Health Agency Categorization
58
State Name and Categorization Details About the Relationship Between State and Local Public Health Agencies
North Carolina Decentralized
Decentralized: 85 local health units led by local employee, serving 100% of total state population. For these areas:
Budgetary authority rests with local government with no state input
Local governmental entities may:
Establish taxes for public health
Establish fees for services without state approval
Issue public health orders
Revenue from taxes/fees goes to local government
Top executive is appointed and approved by local officials
0‐25% of local health unit budget is provided by the state

State Public Health Agency Categorization
59
State Name and Categorization Details About the Relationship Between State and Local Public Health Agencies
North Dakota Decentralized
Decentralized: 28 local health units led by local employee, serving 100% of total state population. For these areas:
Budgetary authority rests with local government with no state input
Local governmental entities may:
Establish taxes for public health
Establish fees for services without state approval
Issue public health orders
Revenue from taxes/fees goes to local government
Top executive is appointed and approved by local officials
26‐50% of local health unit budget is provided by the state

State Public Health Agency Categorization
60
State Name and Categorization Details About the Relationship Between State and Local Public Health Agencies
Ohio Decentralized
Decentralized: 125 local health units led by local employee, serving 100% of total state population. For these areas:
Budgetary authority rests with local government with no state input
Local governmental entities may:
Establish taxes for public health
Issue public health orders
Revenue from taxes goes to both state and local government
Top executive is appointed by local officials but approved by the state
0‐25% of local health unit budget is provided by the state

State Public Health Agency Categorization
61
State Name and Categorization Details About the Relationship Between State and Local Public Health Agencies
Oklahoma Mixed – Centralized & Decentralized
Note: Areas labeled as “other” represent communities in which state public health agency respondents indicated no local public health units. In many of these areas, at least a limited set of services may be provided by the state health department, neighboring local health departments, or other entities.
Centralized:68 local health units led by state employee, serving 63.2% of total state population. For these areas:
Budgetary authority rests with state government, but local government plays a nonbinding advisory role*
Local governmental entities may:
Establish taxes for public health
Revenue from taxes goes to local government
Top executive is appointed and approved by the state
51‐75% of local health unit budget is provided by the state
Decentralized: 2 local health units led by local employee, serving 35.6% of total state population. For these areas:
Budgetary authority rests with local government with no state input
Local governmental entities may:
Establish taxes for public health
Establish fees for services without state approval
Issue public health orders
Revenue from taxes/fees goes to local government
Top executive is appointed and approved by local officials
51‐75% of local health unit budget is provided by the state
1.2% of the state population is not served by local health units. This population may seek governmental public health services in adjoining counties provided by county health departments and/or by state central office.
*The budgetary process is controlled by the state, but the county may have limited oversight for funds that are generated through millage or taxes.

State Public Health Agency Categorization
62
State Name and Categorization Details About the Relationship Between State and Local Public Health Agencies
Oregon Decentralized
Decentralized: 34 local health units led by local employee, serving 100% of total state population. For these areas:
Budgetary authority rests with local government with no state input
Local governmental entities may:
Establish taxes for public health
Establish fees for services without state approval
Issue public health orders
Revenue from taxes/fees goes to both state and local government
Top executive is appointed and approved by local officials
26‐50% of local health unit budget is provided by the state

State Public Health Agency Categorization
63
State Name and Categorization Details About the Relationship Between State and Local Public Health Agencies
Pennsylvania Mixed – Centralized & Decentralized
Centralized: 6 local health units led by state employee, serving 60% of total state population. For these areas:
Budgetary authority rests with state government, but local government plays a nonbinding advisory role
Local governmental entities may:
Issue public health orders
Top executive is appointed and approved by the state
51‐75% of local health unit budget is provided by the state
Decentralized: 10 local health units led by local employee, serving 40% of total state population. For these areas:
Budgetary authority rests with local government, but state government plays a nonbinding advisory role
Local governmental entities may:
Establish taxes for public health
Establish fees for services without state approval
Issue public health orders
Revenue from taxes/fees goes to local government
Top executive is appointed and approved by the state
51‐75% of local health unit budget is provided by the state

State Public Health Agency Categorization
64
State Name and Categorization Details About the Relationship Between State and Local Public Health Agencies
Rhode Island Centralized
Centralized: No local health units are reported for the state.

State Public Health Agency Categorization
65
State Name and Categorization Details About the Relationship Between State and Local Public Health Agencies
South Carolina Centralized
Centralized: 8 local health units led by state employee, serving 100% of total state population. For these areas:
Local governmental entities have authority to make budgetary decisions
Local governmental entities may:
Issue public health orders
Top executive is appointed and approved by the state
76‐100% of local health unit budget is provided by the state

State Public Health Agency Categorization
66
State Name and Categorization Details About the Relationship Between State and Local Public Health Agencies
South Dakota Largely Centralized
Note: Areas labeled as “other” represent communities in which state public health agency respondents indicated no local public health units. In many of these areas, at least a limited set of services may be provided by the state health department, neighboring local health departments, or other entities.
Centralized: 67 local health units led by state employee, serving approximately 81% of total state population. For these areas:
Budgetary authority rests with state government with no local input
Local governmental entities may:
Issue public health orders
Decentralized: 1 local health unit led by local employee, serving approximately 17% of total state population. For these areas:
Budgetary authority rests with local government with no state input
Local governmental entities may:
Establish fees for services without state approval
Issue public health orders
Revenue from taxes/fees goes to local government
Top executive is appointed and approved by local officials
0‐25% of local health unit budget is provided by the state
2% of the total state population is not served by local health units. This population represents counties predominantly consisting of Tribal populations, which may receive public health services through IHS.
In addition to the 67 state‐led local health units, there are 7 state‐run regional units that do not provide direct services.

State Public Health Agency Categorization
67
State Name and Categorization Details About the Relationship Between State and Local Public Health Agencies
Tennessee Mixed – Centralized & Decentralized
Centralized: 89 local health units led by state employee, serving 71.7% of total state population. For these areas:
Budgetary authority varies among health units—some local governments contribute resources to local health units and participate in budgetary decision making regarding those funds
Top executive is appointed and approved by the state
76‐100% of local health unit budget is provided by the state
Decentralized: 6 local health units led by local employee, serving 28.3% of total state population. For these areas:
Budgetary authority rests with local government with no state input
Local governmental entities may:
Establish taxes for public health
Establish fees for services without state approval
Issue public health orders
Revenue from taxes/fees goes to local government
Top executive is appointed and approved by local officials

State Public Health Agency Categorization
68
State Name and Categorization Details About the Relationship Between State and Local Public Health Agencies
Texas Largely Decentralized
Decentralized: 60 local health units led by local employee, serving 79% of total state population. For these areas:
Budgetary authority rests with local government with no state input
Local governmental entities may:
Establish fees for services without state approval
Issue public health orders
Revenue from fees goes to local government
Top executive is appointed and approved by local officials
26‐50% of local health unit budget is provided by the state
Centralized: 8 local health units led by state employee, serving 21% of total state population. For these areas:
Budgetary authority rests with state government with no local input
Local governmental entities may:
Issue public health orders
Top executive is appointed and approved by the state
76‐100% of local health unit budget is provided by the state

State Public Health Agency Categorization
69
State Name and Categorization Details About the Relationship Between State and Local Public Health Agencies
Utah Decentralized
Decentralized: 12 local health units led by local employee, serving 100% of total state population. For these areas:
Budgetary authority rests with local government with no state input
Local governmental entities may:
Establish taxes for public health
Establish fees for services without state approval
Issue public health orders
Revenue from taxes/fees goes to local government
Top executive is appointed by local officials but approved by the state
26‐50% of local health unit budget is provided by the state

State Public Health Agency Categorization
70
State Name and Categorization Details About the Relationship Between State and Local Public Health Agencies
Vermont Centralized
Centralized: 12 local health units led by state employee, serving 100% of total state population. For these areas:
Budgetary authority rests with state government
Local governmental entities may:
Establish fees for services without state approval
Issue public health orders
Revenue from fees goes to local government
Top executive is appointed and approved by the state
76‐100% of local health unit budget is provided by the state

State Public Health Agency Categorization
71
State Name and Categorization Details About the Relationship Between State and Local Public Health Agencies
Virginia Largely Centralized
Centralized: 33 local health units led by state employee, serving 84.3% of total state population. For these areas:
Localities can allocate additional funds from their general revenue or raise fees on a set list of public health services and then allocate additional funds to services that are local priorities
Local governmental entities may:
Establish fees for services without state approval*
Issue public health orders
Top executive is appointed and approved by the state
51‐75% of local health unit budget is provided by the state
Decentralized: 2 local health units led by local employee, serving 15.7% of total state population. For these areas:
Budgetary authority rests with local government, but state government plays a nonbinding advisory role
Local governmental entities may:
Establish fees for services without state approval*
Issue public health orders
Top executive is appointed by local officials but approved by the state
26‐50% of local health unit budget is provided by the state
* Local fees can be established only within the framework expressly designated by state law.

State Public Health Agency Categorization
72
State Name and Categorization Details About the Relationship Between State and Local Public Health Agencies
Washington Decentralized
Decentralized: 35 local health units led by local employee, serving 100% of total state population. For these areas:
Budgetary authority rests with local government with no state input
Local governmental entities may:
Establish fees for services without state approval
Issue public health orders
Revenue from fees goes to local government
Top executive is appointed and approved by local officials
0‐25% of local health unit budget is provided by the state

State Public Health Agency Categorization
73
State Name and Categorization Details About the Relationship Between State and Local Public Health Agencies
West Virginia Decentralized
Decentralized: 49 local health units led by local employee, serving 100% of total state population. For these areas:
Budgetary authority rests with local government with no state input
Local governmental entities may:
Establish taxes for public health
Issue public health orders
Revenue from taxes goes to local government
Top executive is appointed and approved by local officials
51‐75% of local health unit budget is provided by the state

State Public Health Agency Categorization
74
State Name and Categorization Details About the Relationship Between State and Local Public Health Agencies
Wisconsin Decentralized
Decentralized: 92 local health units led by local employee, serving 100% of total state population. For these areas:
Budgetary authority rests with local government with no state input
Local governmental entities may:
Establish taxes for public health
Establish fees for services without state approval
Issue public health orders
Revenue from taxes/fees goes to local government
Top executive is appointed and approved by local officials
26‐50% of local health unit budget is provided by the state
In addition to the 92 local health units covering the entire population, there are 5 regional offices staffed by state health employees.

State Public Health Agency Categorization
75
State Name and Categorization Details About the Relationship Between State and Local Public Health Agencies
Wyoming Mixed – Shared (State Led) & Decentralized
Shared (State Led):19 local health units led by state employee, serving 55% of total state population. For these areas:
Budgetary decisions are jointly made between state and county officials, per a state‐county contract
Local budgets are a mix of state and local funds (and mix of state and local employees)
Local governmental entities may:
Establish taxes for public health
Establish fees for services without state approval
Issue public health orders
Revenue from taxes/fees goes to local government
Top executive is appointed by the state but approved by local officials.
26‐50% of local health unit budget is provided by the state
Decentralized: 4 local health units led by local employee, serving 45% of total state population. For these areas:
Budgetary authority varies among health units.
1 local health unit is 100% county funded; 2 local health units share budget responsibilities between state and county employees
Local government entities may:
Establish taxes for public health
Establish fees for services without state approval
Issue public health orders
Revenue from taxes/fees goes to local government
Top executive is appointed and approved by local officials
0 ‐ 25% of local health unit budget is provided by the state

State Public Health Agency Categorization
© Association of State and Territorial Health Officials 2012 2231 Crystal Drive, Ste 450, Arlington, VA 202-371-9090 www.astho.org
76
Appendix D: Suggested Modifications to Survey Questions
Below, we present the survey instrument used in this study, with several recommended revisions. Language we recommend adding is underlined and language we recommend deleting is crossed out.
Introductory Table
The following definitions will be helpful in completing the introductory table:
Local health unit – A local health unit is an administrative or service unit of local or state government concerned with health, and carrying some responsibility for the health of a jurisdiction smaller than the state. (This includes local public health departments, regional public health departments, and regional and local units of state public health agencies. Please do not consider tribal health agencies when responding. We understand that tribal health agencies make an important contribution to protecting the public health in many states; however, because tribal nations have sovereignty, their relationship with state public health agencies may differ from the relationship between states and local health units.)
State Employee – An individual is a state employee if that individual’s salary is paid directly by the state government.
Local Employee – An individual is a local employee if that individual’s salary is paid by a city, county, or other sub‐state jurisdiction.
Led by – An organization is led by the employee at the organization with the most seniority.
Are there any regional or district offices of the state public health agency in your state?
o No
o Yes
If there are regional or district offices of the state public health agency, do they serve populations that are also served by other local health units?
o No, there are no regional or district offices.
o No, the regional or district offices only serve populations that are also served by local health units that cover a smaller jurisdiction (e.g., city or county).
o Yes
Please provide your best estimates to complete the following table. You will be asked about two different types of local health units—those led by a state employee and those led by a local employee. For each type of health unit, please indicate in the first column the number of such units in your state. In the second column, please indicate the percentage of the TOTAL state population that lives in an area served by that type of health unit. If you answered “yes” to both of the questions above, please consider those regional or district health offices as local health units. If you answered “no” to one or both of the questions above, please disregard those regional or district offices as you complete the questions below.

State Public Health Agency Categorization
© Association of State and Territorial Health Officials 2012 2231 Crystal Drive, Ste 450, Arlington, VA 202-371-9090 www.astho.org
77
Number of this type of local health unit
% of TOTAL state population served by this type of local health unit*
Local health unit led by a STATE employee
Local health unit led by a LOCAL employee
What percent of the state’s population lives in areas that are not served by a local health unit?
% of TOTAL state population not served by a this type of local health unit*
State population not served by a
local health unit
Please note: The three percentages in the columns marked with an * in the above questions should add up to 100 percent.
If you indicated that at least some of the residents of your state live in areas not served by a local health unit, please answer the following question:
Are local governmental public health services provided in those areas? (Select all that apply.)
o Yes, services are provided on military bases.
o Yes, services are provided by the Indian Health Service.
o Yes, services are provided by another entity. (Please describe who provides those services in the space provided.)
o None of the above—there are no local governmental public health services.
Areas Served by Health Units Led by a State Employee
When you respond to questions in this section, please think ONLY about areas served by health units led by a STATE employee. If there are no health units led by a state employee in your state, please skip this section.
How would you describe local involvement with budgetary decisions related to local health units that are led by a state employee? (Please select ONLY ONE response.)
o Local governmental entities (e.g., local health departments, local elected officials, or Boards of Health) have the authority to make budgetary decisions about allocating resources for programs within the local health unit.
o All authority to make budget decisions is held at the state level with no local input.
o All authority for budget decisions is held at the state level, but local governmental entities play a nonbinding advisory role related to setting the budget for local health units.
o Varies by health unit among health units that are led by a state employee. (Please provide additional details in the space provided.)
o None of the above applies to local health units that are led by a state employee. (Please provide additional details in the space provided.)

State Public Health Agency Categorization
© Association of State and Territorial Health Officials 2012 2231 Crystal Drive, Ste 450, Arlington, VA 202-371-9090 www.astho.org
78
Do any local governmental entities (e.g., local health departments, local elected officials, or Boards of Health) have the ability to do any of the following? (Select all that apply.)
o Establish taxes for public health
o Establish fees for services without getting approval from a governmental entity led by a state employee
o Issue public health orders (e.g., close a food‐service establishment)
o None of the above
Where does the revenue generated from those taxes or fees go? (Select ONLY ONE response.)
o To local government
o To state government
o Some revenue goes to state government and some to local government
Which of these statements most accurately reflects how the top executive in the local health unit is appointed and approved? (Select ONLY ONE response.)
o Local chief executives are appointed and approved by the state public health agency (SPHA) or other state entities.
o Local chief executives are appointed by the SPHA or other state entities but are approved by local officials.
o Local chief executives are appointed by local officials but are approved by the SPHA or other state entities.
o Local chief executives are appointed and approved by local officials.
o It varies.
On average, what proportion of local health unit budgets is provided by the state public health agency (including federal flow‐through)? Your best estimate is fine. (Select ONLY ONE response.)
o 0‐25%
o 26‐50%
o 51‐75%
o 76‐100%
o Don’t know

State Public Health Agency Categorization
© Association of State and Territorial Health Officials 2012 2231 Crystal Drive, Ste 450, Arlington, VA 202-371-9090 www.astho.org
79
Areas Served by Health Units Led by a Local Employee
When you respond to questions in this section, please think ONLY about areas served by health units led by a LOCAL employee. If there are no health units led by a local employee in your state, please skip this section.
How would you describe state involvement with budgetary decisions related to local health units that are led by a local employee? (Select ONLY ONE response.)
o State authority is required to allocate resources for programs within the local health unit.
o Aside from requirements to report on associated with the use of state‐provided funds, local governmental entities (e.g., local health departments, local elected officials, or Boards of Health) retain decision making capacity about the budget for local health units, with no state input.
o All authority for budget decisions is held at the local level, but there is a nonbinding advisory role at the state level.
o Varies by health unit among health units that are led by a local employee. (Please provide additional details in the space provided.)
o None of the above applies to local health units that are led by a local employee. (Please provide additional details in the space provided.)
Do any local governmental entities (e.g., local health departments, local elected officials, or Boards of Health) have the ability to do any of the following? (Select all that apply.)
o Establish taxes for public health
o Establish fees for services without getting approval from a governmental entity led by a state employee
o Issue public health orders (e.g., close a food‐service establishment)
o None of the above
Where does the revenue generated from those taxes or fees go? (Select ONLY ONE response.)
o To local government
o To state government
o Some revenue goes to state government and some to local government
Which of these statements most accurately reflects how the top executive in the local health unit is appointed and approved? (Select ONLY ONE response.)
o Local chief executives are appointed and approved by the state public health agency (SPHA) or other state entities.
o Local chief executives are appointed by the SPHA or other state entities but are approved by local officials.
o Local chief executives are appointed by local officials but are approved by the SPHA or other state entities.

State Public Health Agency Categorization
© Association of State and Territorial Health Officials 2012 2231 Crystal Drive, Ste 450, Arlington, VA 202-371-9090 www.astho.org
80
o Local chief executives are appointed and approved by local officials.
o It varies.
On average, what proportion of local health unit budgets is provided by the state public health agency (including federal flow‐through)? Your best estimate is fine. (Select ONLY ONE response.)
o 0‐25%
o 26‐50%
o 51‐75%
o 76‐100%
o Don’t know