Embed Size (px)
Citation preview
Front Page Today's News Information Technology Distance Education Teaching Publishing Money Government & Politics Community Colleges Science Students Athletics International People Events The Chronicle Review Jobs
Colloquy Colloquy Live Magazines & Journals New Grant Competitions Internet Resources Facts & Figures Issues in Depth Site Sampler
This Week's Issue Back Issues Related Materials
About The Chronicle How to Contact Us How to Register How to Subscribe Subscriber Services Change Your User Name Change Your Password
From the issue dated January 18, 2002
State Spending on Higher Education Grows by Smallest Rate in 5 Years
Funds increased by 4.6%, but 13 states failed to keep pace with inflation
By PETER SCHMIDT
A new analysis of budget data shows that state support for higher education softened considerably going into the current
fiscal year, leaving many public colleges ill-prepared to cope with recent budget cuts. In budgets that states adopted for the current, 2001-2 fiscal year, aggregate appropriations for higher education rose by a total of 4.6 percent, the smallest such increase in five years, according to a survey conducted by the Center for the Study of Education Policy at
Illinois State University. In 13 states, higher education was not appropriated enough new money to stay ahead of inflation. Five of those states -- Florida, Iowa, Massachusetts, Mississippi, and Nebraska -- adopted budgets that called for reductions in higher-education spending. The survey's findings "reflect the vulnerability of higher education to downturns in the economy," said James C. Palmer, a professor of higher education at Illinois State. He was assisted by Sandra L. Gillilan, a doctoral student there, in conducting the 50-state survey, which is in its 43rd year. Mr. Palmer said the current financial picture for public colleges and student-aid programs is actually bleaker than the one painted by the survey, because the survey looked at the state budgets that lawmakers passed months ago, and so did not take midyear rescissions in state spending into account. The survey also did not account for population growth. As of last week, 18 states had responded to shortfalls in their
ALSO SEE: 1-Year Changes in State Appropriations for Higher Education State Appropriations for Higher Education, 2001-2 How the States Rank
Forgot Your Password? How to Advertise Press Inquiries Corrections Privacy Policy The Mobile Chronicle Help
budgets for this fiscal year by withholding a portion of the funds that they had planned to spend on higher education. The rescissions varied considerably in size, ranging from about 1 percent in Colorado and Illinois to 10 percent in Iowa. At least five other states are considering such cuts in response to the continued deterioration of their economies. And, with 36 states facing deficits in the coming, 2002-3 fiscal year, public-college officials throughout the nation have said they hold little hope of winning substantially more state support anytime soon. "If the nation's economy does not pick up in the next year, we may be returning to the days of zero growth or decline experienced during the recession of the early 1990s," Mr. Palmer and Ms. Gillilan warn in their analysis of the survey's findings. The survey, which tracks state general-fund appropriations for higher-education needs other than construction, found that in aggregate the states had appropriated about $63.6-billion for such needs in this fiscal year. That represents a one-year increase of $2.8-billion, or 4.6 percent, down from annual increases of about 7 percent in the previous two years. Adjusted for the current annual inflation rate of 1.9 percent, as measured by the Consumer Price Index, aggregate state appropriations for higher education rose by 2.7 percent going into 2001-2. The survey shows that some states and some sectors of higher education fared much better than others. Several states, particularly in the West, continued to pour new money into higher education, and 15 were able to increase their overall spending on higher education by 7 percent or more. In Idaho, lawmakers agreed to increase spending on higher education by about 12.3 percent, or $36-million, and appropriated about 32 percent more for community colleges (a $5-million increase), partly to offset a property-tax decrease. "The legislature was quite generous to all of higher education last year," said Michael L. Burke, the president of North Idaho College. Like many public colleges in Western states, North Idaho asked for a big infusion of state tax-dollar support to accommodate rapid enrollment growth, and found lawmakers willing to accommodate its requests given the robust local economy.
Texas recorded the largest one-year increase in higher-education appropriations -- 13.7 percent. But its spending figure was skewed upward by its use of a biennial budgeting-and-accounting system that caused it to record much of its increased spending for this first year of the biennium. Next year, its budget growth is likely to appear relatively flat. Among the states with flat or declining higher-education budgets were several Rust Belt states, such as Michigan, Ohio, and Pennsylvania, which have economies that are vulnerable to economic downturns due to their reliance on manufacturing. Massachusetts fared worse than any other state in the survey, as a result of a decision by lawmakers there to cut higher-education spending by 6.2 percent. But its budget was not adopted until mid-November, and took into account several months of economic decline that were not accounted for in the spending plans that other states passed much earlier in the year. When midyear rescissions in some other states' budgets are taken into account, they appear to be in equally bad, or worse, shape. That's not much consolation to the leaders of the University of Massachusetts system, who plan to eliminate 270 job positions and to raise tuitions on its campuses by an average of 7.8 percent to make up for the loss in state funds. "When the legislature looked for places to cut, unfortunately higher education was one of the prime areas that they looked at," said Robert P. Connolly, a system spokesman. Among the various sectors of higher education, community and technical colleges no longer seemed to be favored by lawmakers for bigger percentage increases than their four-year counterparts, as had been the case in recent years. Last year, 31 of the 44 states that distinguish between two-year and four-year colleges in responding to the survey reported giving bigger percentage increases to two-year institutions. This year, 12 states gave bigger increases to two-year institutions, 15 states treated both sectors roughly the same, and 14 states gave larger percentage increases to their four-year colleges. (Three states changed how they financed community colleges in ways that made it impossible to calculate how much state support had changed from one year to the next.) "When times are tight fiscally, [lawmakers] tend to treat everybody alike," notes Paul E. Lingenfelter, executive director of State Higher Education Executive Officers, a
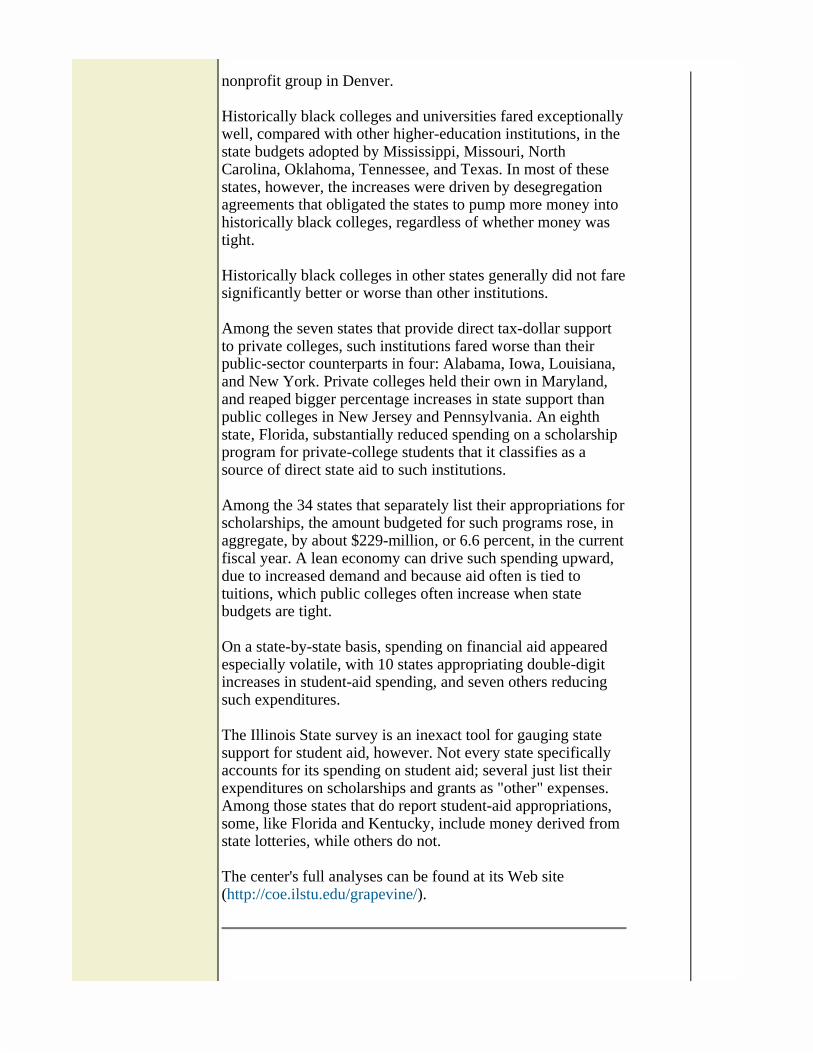
nonprofit group in Denver. Historically black colleges and universities fared exceptionally well, compared with other higher-education institutions, in the state budgets adopted by Mississippi, Missouri, North Carolina, Oklahoma, Tennessee, and Texas. In most of these states, however, the increases were driven by desegregation agreements that obligated the states to pump more money into historically black colleges, regardless of whether money was tight. Historically black colleges in other states generally did not fare significantly better or worse than other institutions. Among the seven states that provide direct tax-dollar support to private colleges, such institutions fared worse than their public-sector counterparts in four: Alabama, Iowa, Louisiana, and New York. Private colleges held their own in Maryland, and reaped bigger percentage increases in state support than public colleges in New Jersey and Pennsylvania. An eighth state, Florida, substantially reduced spending on a scholarship program for private-college students that it classifies as a source of direct state aid to such institutions. Among the 34 states that separately list their appropriations for scholarships, the amount budgeted for such programs rose, in aggregate, by about $229-million, or 6.6 percent, in the current fiscal year. A lean economy can drive such spending upward, due to increased demand and because aid often is tied to tuitions, which public colleges often increase when state budgets are tight. On a state-by-state basis, spending on financial aid appeared especially volatile, with 10 states appropriating double-digit increases in student-aid spending, and seven others reducing such expenditures. The Illinois State survey is an inexact tool for gauging state support for student aid, however. Not every state specifically accounts for its spending on student aid; several just list their expenditures on scholarships and grants as "other" expenses. Among those states that do report student-aid appropriations, some, like Florida and Kentucky, include money derived from state lotteries, while others do not. The center's full analyses can be found at its Web site (http://coe.ilstu.edu/grapevine/).
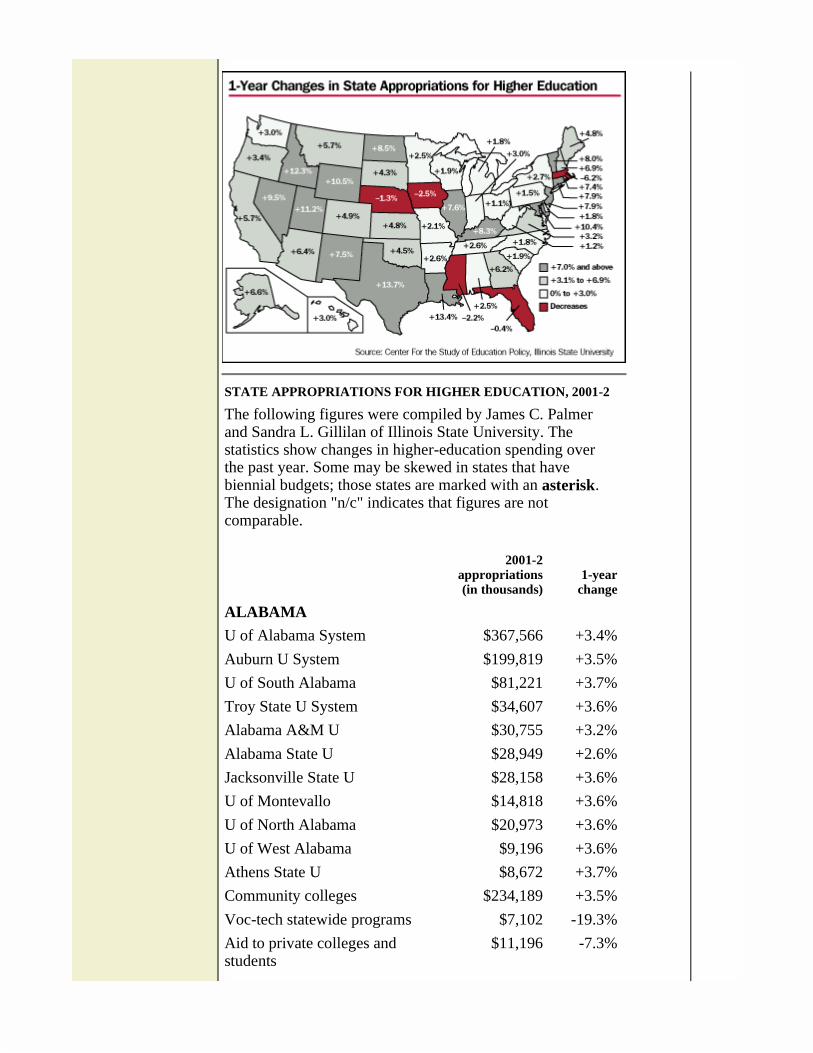
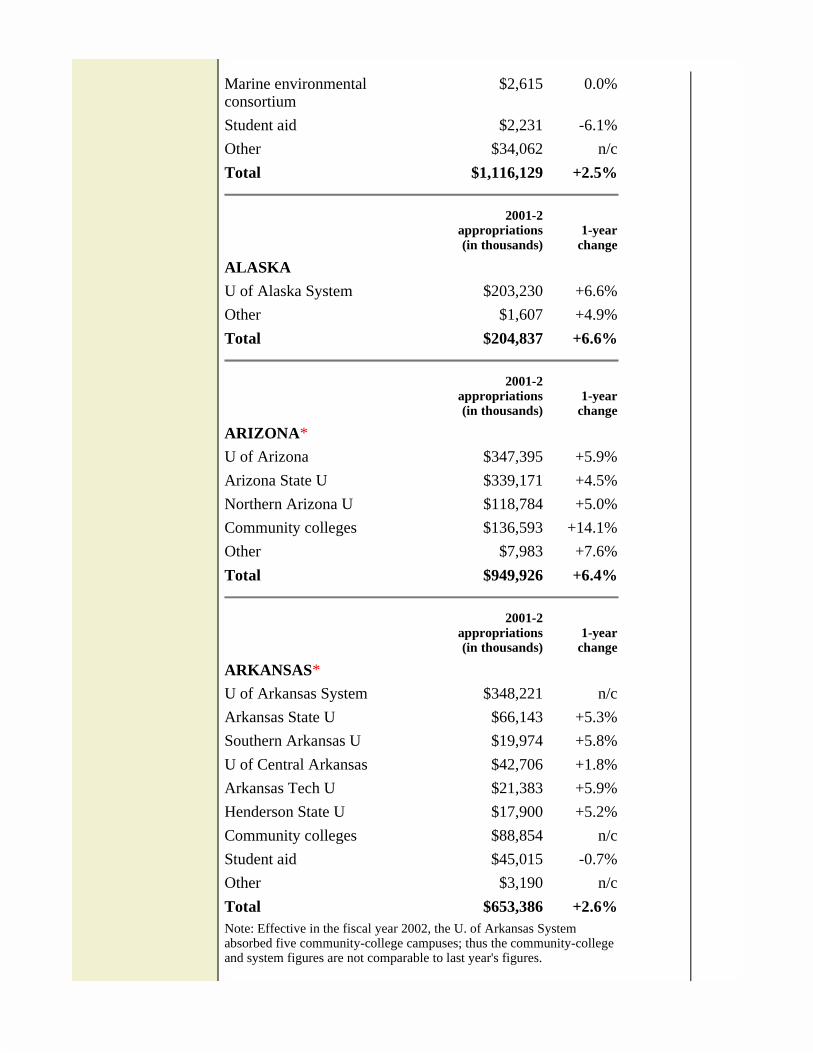
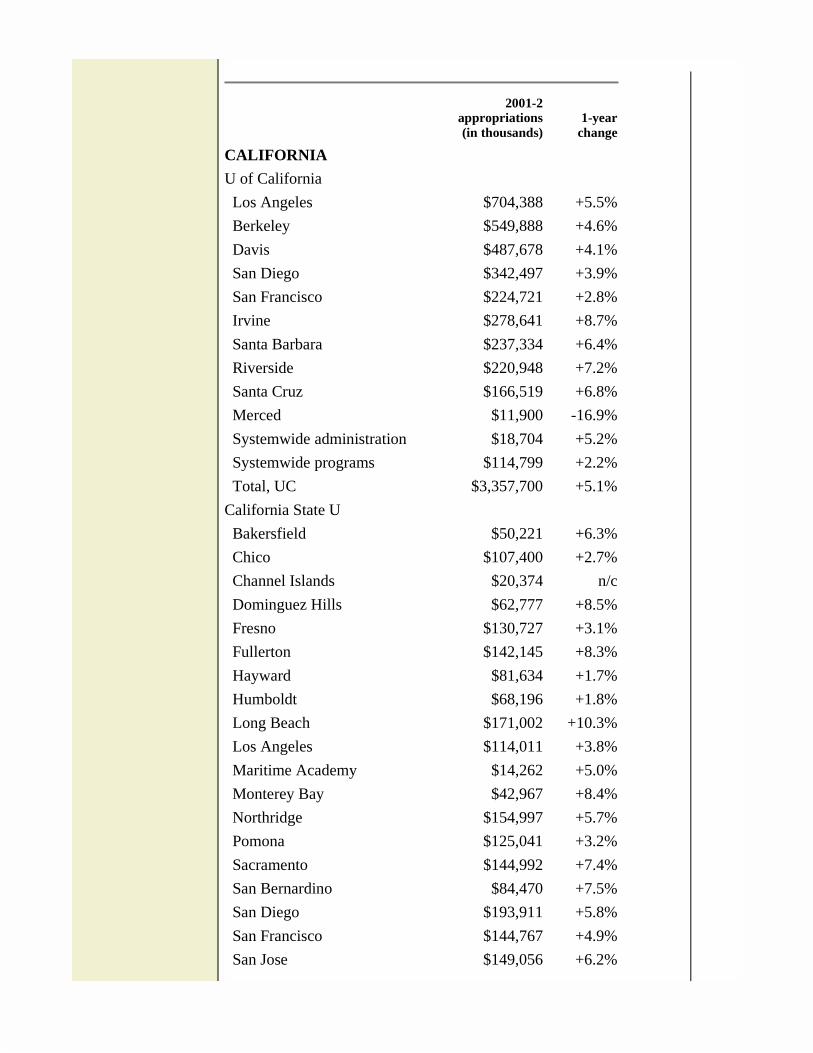
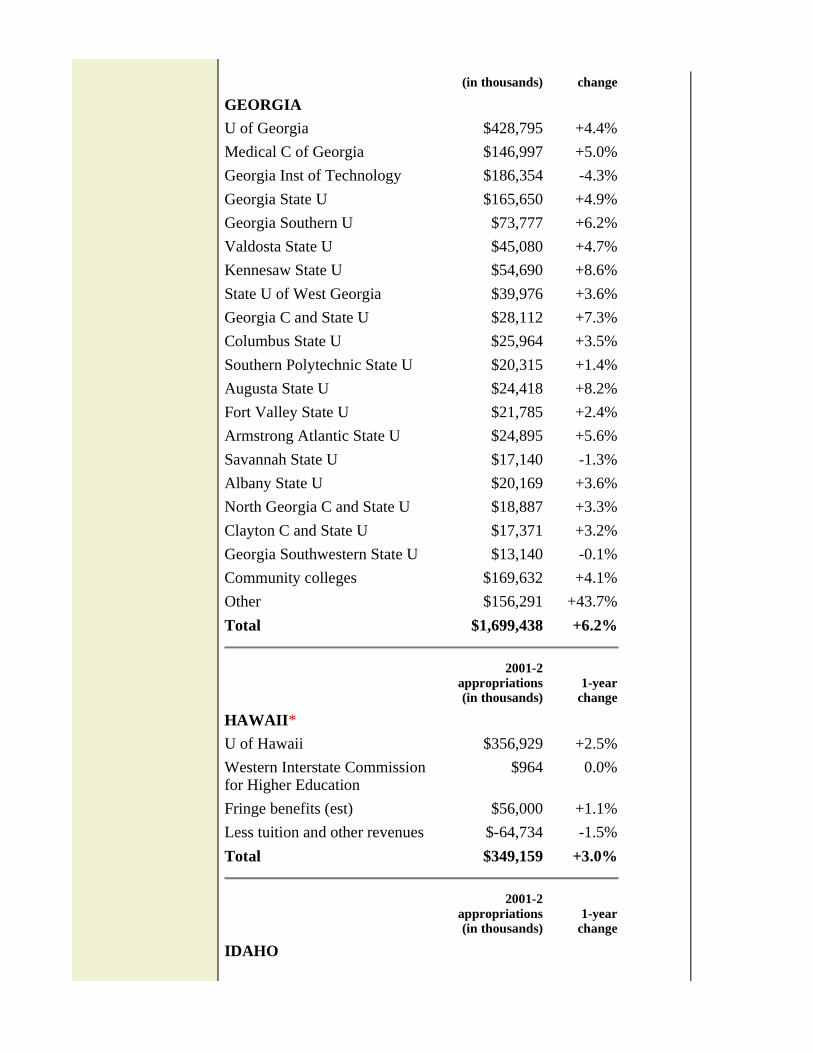
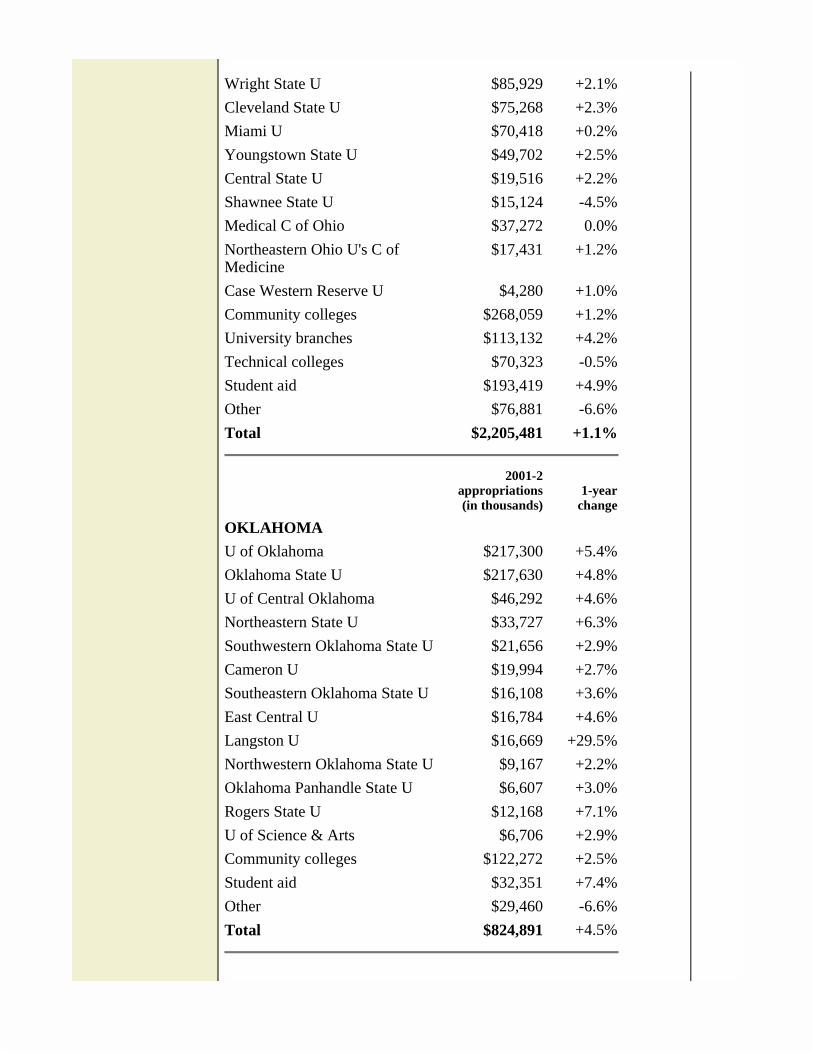
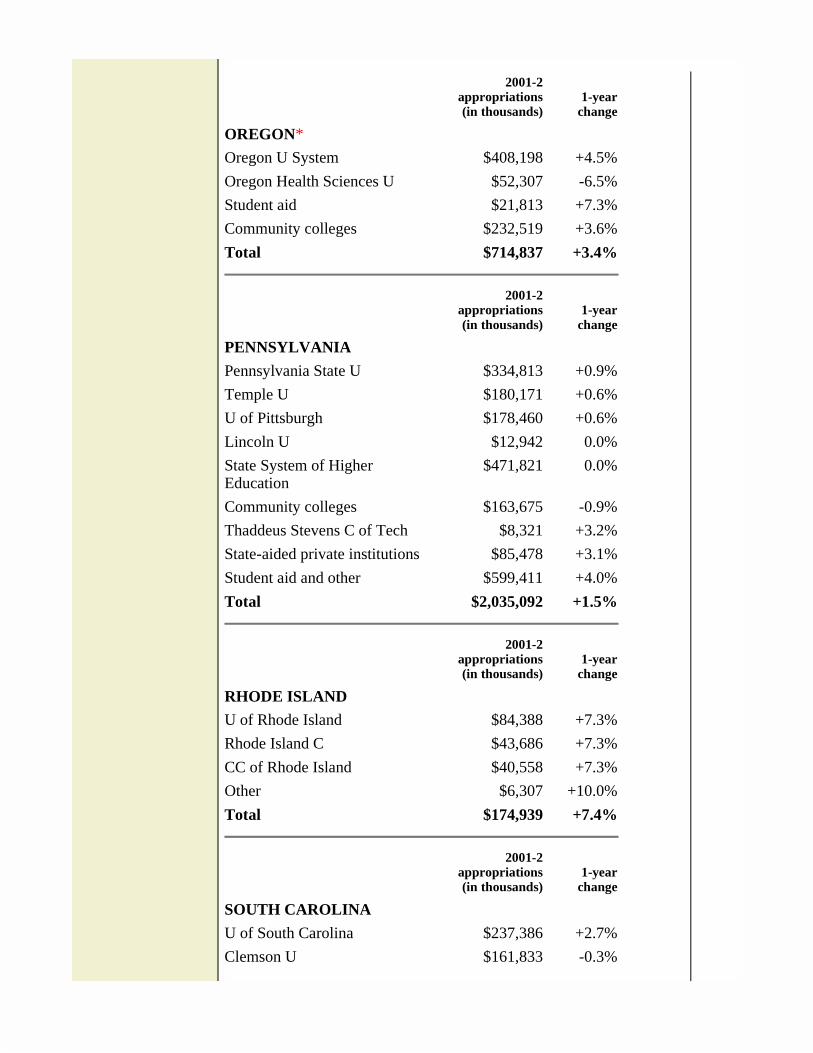
STATE APPROPRIATIONS FOR HIGHER EDUCATION, 2001-2
The following figures were compiled by James C. Palmer and Sandra L. Gillilan of Illinois State University. The statistics show changes in higher-education spending over the past year. Some may be skewed in states that have biennial budgets; those states are marked with an asterisk. The designation "n/c" indicates that figures are not comparable.
2001-2appropriations(in thousands)
1-year change
ALABAMAU of Alabama System $367,566 +3.4%Auburn U System $199,819 +3.5%U of South Alabama $81,221 +3.7%Troy State U System $34,607 +3.6%Alabama A&M U $30,755 +3.2%Alabama State U $28,949 +2.6%Jacksonville State U $28,158 +3.6%U of Montevallo $14,818 +3.6%U of North Alabama $20,973 +3.6%U of West Alabama $9,196 +3.6%Athens State U $8,672 +3.7%Community colleges $234,189 +3.5%Voc-tech statewide programs $7,102 -19.3%Aid to private colleges and students
$11,196 -7.3%
Marine environmental consortium
$2,615 0.0%
Student aid $2,231 -6.1%Other $34,062 n/cTotal $1,116,129 +2.5%
2001-2appropriations(in thousands)
1-year change
ALASKAU of Alaska System $203,230 +6.6%Other $1,607 +4.9%Total $204,837 +6.6%
2001-2appropriations(in thousands)
1-year change
ARIZONA*U of Arizona $347,395 +5.9%Arizona State U $339,171 +4.5%Northern Arizona U $118,784 +5.0%Community colleges $136,593 +14.1%Other $7,983 +7.6%Total $949,926 +6.4%
2001-2appropriations(in thousands)
1-year change
ARKANSAS*U of Arkansas System $348,221 n/cArkansas State U $66,143 +5.3%Southern Arkansas U $19,974 +5.8%U of Central Arkansas $42,706 +1.8%Arkansas Tech U $21,383 +5.9%Henderson State U $17,900 +5.2%Community colleges $88,854 n/cStudent aid $45,015 -0.7%Other $3,190 n/cTotal $653,386 +2.6%Note: Effective in the fiscal year 2002, the U. of Arkansas System absorbed five community-college campuses; thus the community-college and system figures are not comparable to last year's figures.
2001-2appropriations(in thousands)
1-year change
CALIFORNIAU of California Los Angeles $704,388 +5.5% Berkeley $549,888 +4.6% Davis $487,678 +4.1% San Diego $342,497 +3.9% San Francisco $224,721 +2.8% Irvine $278,641 +8.7% Santa Barbara $237,334 +6.4% Riverside $220,948 +7.2% Santa Cruz $166,519 +6.8% Merced $11,900 -16.9% Systemwide administration $18,704 +5.2% Systemwide programs $114,799 +2.2% Total, UC $3,357,700 +5.1%California State U Bakersfield $50,221 +6.3% Chico $107,400 +2.7% Channel Islands $20,374 n/c Dominguez Hills $62,777 +8.5% Fresno $130,727 +3.1% Fullerton $142,145 +8.3% Hayward $81,634 +1.7% Humboldt $68,196 +1.8% Long Beach $171,002 +10.3% Los Angeles $114,011 +3.8% Maritime Academy $14,262 +5.0% Monterey Bay $42,967 +8.4% Northridge $154,997 +5.7% Pomona $125,041 +3.2% Sacramento $144,992 +7.4% San Bernardino $84,470 +7.5% San Diego $193,911 +5.8% San Francisco $144,767 +4.9% San Jose $149,056 +6.2%
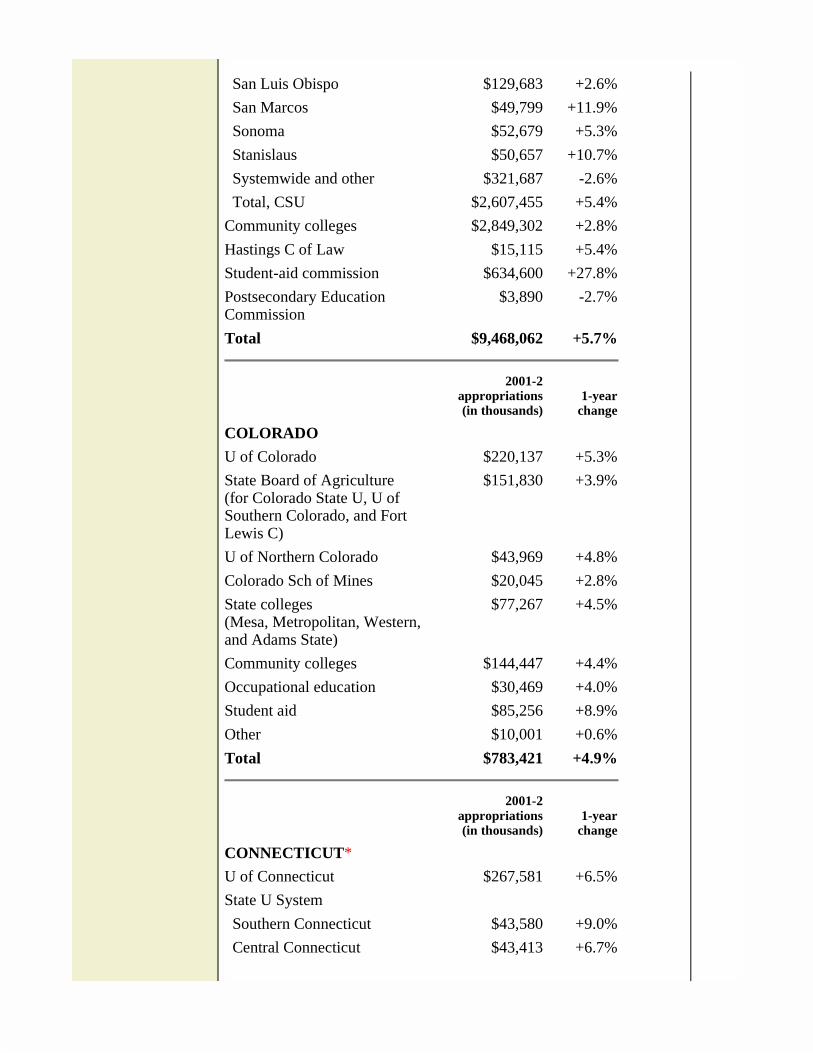
San Luis Obispo $129,683 +2.6% San Marcos $49,799 +11.9% Sonoma $52,679 +5.3% Stanislaus $50,657 +10.7% Systemwide and other $321,687 -2.6% Total, CSU $2,607,455 +5.4%Community colleges $2,849,302 +2.8%Hastings C of Law $15,115 +5.4%Student-aid commission $634,600 +27.8%Postsecondary Education Commission
$3,890 -2.7%
Total $9,468,062 +5.7%
2001-2appropriations(in thousands)
1-year change
COLORADOU of Colorado $220,137 +5.3%State Board of Agriculture (for Colorado State U, U of Southern Colorado, and Fort Lewis C)
$151,830 +3.9%
U of Northern Colorado $43,969 +4.8%Colorado Sch of Mines $20,045 +2.8%State colleges (Mesa, Metropolitan, Western, and Adams State)
$77,267 +4.5%
Community colleges $144,447 +4.4%Occupational education $30,469 +4.0%Student aid $85,256 +8.9%Other $10,001 +0.6%Total $783,421 +4.9%
2001-2appropriations(in thousands)
1-year change
CONNECTICUT*U of Connecticut $267,581 +6.5%State U System Southern Connecticut $43,580 +9.0% Central Connecticut $43,413 +6.7%
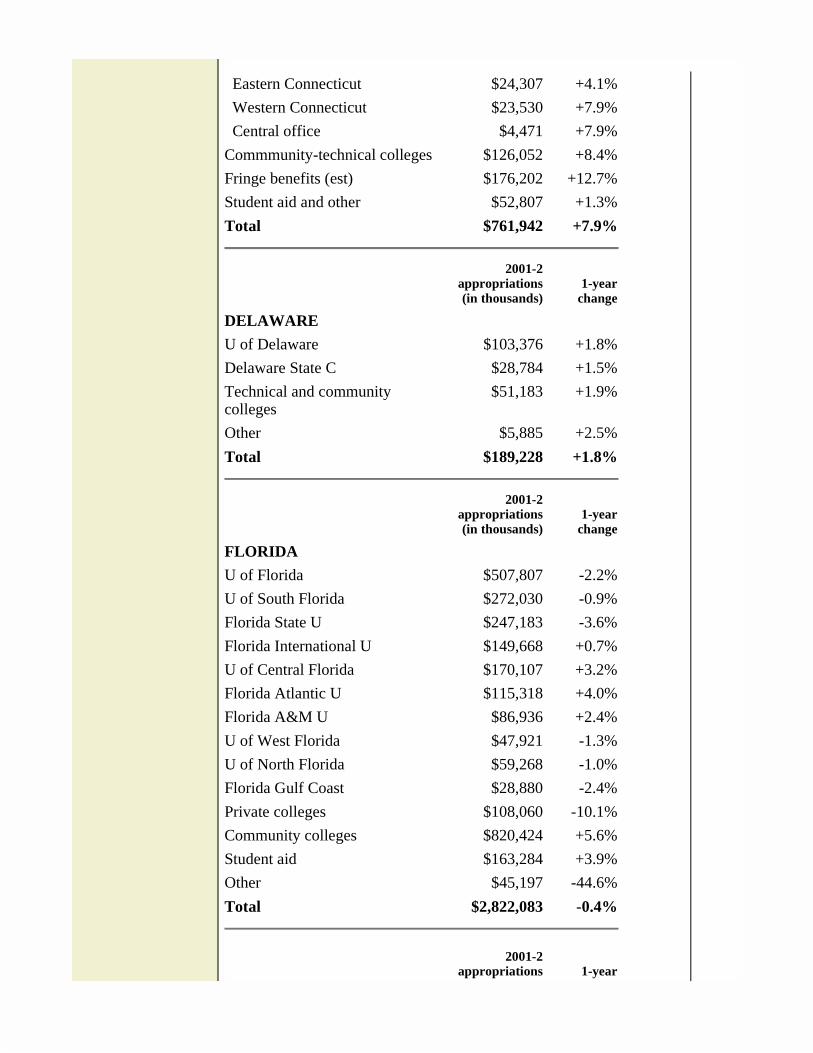
Eastern Connecticut $24,307 +4.1% Western Connecticut $23,530 +7.9% Central office $4,471 +7.9%Commmunity-technical colleges $126,052 +8.4%Fringe benefits (est) $176,202 +12.7%Student aid and other $52,807 +1.3%Total $761,942 +7.9%
2001-2appropriations(in thousands)
1-year change
DELAWAREU of Delaware $103,376 +1.8%Delaware State C $28,784 +1.5%Technical and community colleges
$51,183 +1.9%
Other $5,885 +2.5%Total $189,228 +1.8%
2001-2appropriations(in thousands)
1-year change
FLORIDAU of Florida $507,807 -2.2%U of South Florida $272,030 -0.9%Florida State U $247,183 -3.6%Florida International U $149,668 +0.7%U of Central Florida $170,107 +3.2%Florida Atlantic U $115,318 +4.0%Florida A&M U $86,936 +2.4%U of West Florida $47,921 -1.3%U of North Florida $59,268 -1.0%Florida Gulf Coast $28,880 -2.4%Private colleges $108,060 -10.1%Community colleges $820,424 +5.6%Student aid $163,284 +3.9%Other $45,197 -44.6%Total $2,822,083 -0.4%
2001-2appropriations 1-year
(in thousands) change
GEORGIAU of Georgia $428,795 +4.4%Medical C of Georgia $146,997 +5.0%Georgia Inst of Technology $186,354 -4.3%Georgia State U $165,650 +4.9%Georgia Southern U $73,777 +6.2%Valdosta State U $45,080 +4.7%Kennesaw State U $54,690 +8.6%State U of West Georgia $39,976 +3.6%Georgia C and State U $28,112 +7.3%Columbus State U $25,964 +3.5%Southern Polytechnic State U $20,315 +1.4%Augusta State U $24,418 +8.2%Fort Valley State U $21,785 +2.4%Armstrong Atlantic State U $24,895 +5.6%Savannah State U $17,140 -1.3%Albany State U $20,169 +3.6%North Georgia C and State U $18,887 +3.3%Clayton C and State U $17,371 +3.2%Georgia Southwestern State U $13,140 -0.1%Community colleges $169,632 +4.1%Other $156,291 +43.7%Total $1,699,438 +6.2%
2001-2appropriations(in thousands)
1-year change
HAWAII*U of Hawaii $356,929 +2.5%Western Interstate Commission for Higher Education
$964 0.0%
Fringe benefits (est) $56,000 +1.1%Less tuition and other revenues $-64,734 -1.5%Total $349,159 +3.0%
2001-2appropriations(in thousands)
1-year change
IDAHO
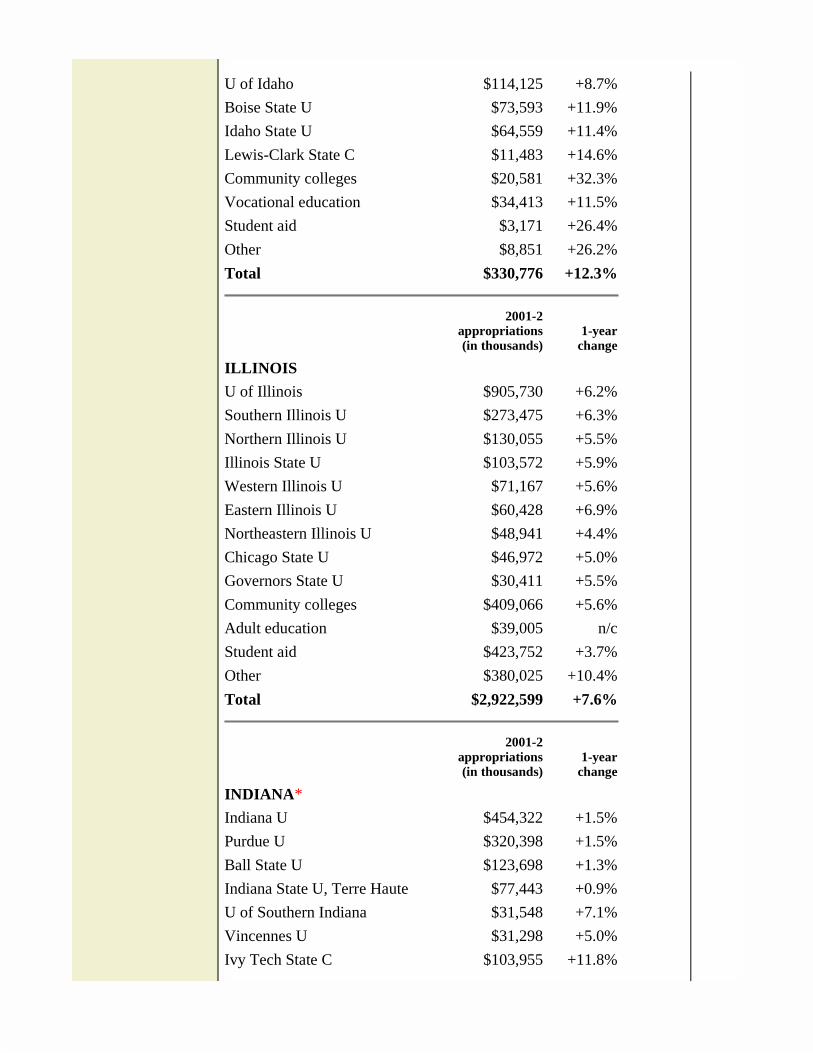
U of Idaho $114,125 +8.7%Boise State U $73,593 +11.9%Idaho State U $64,559 +11.4%Lewis-Clark State C $11,483 +14.6%Community colleges $20,581 +32.3%Vocational education $34,413 +11.5%Student aid $3,171 +26.4%Other $8,851 +26.2%Total $330,776 +12.3%
2001-2appropriations(in thousands)
1-year change
ILLINOISU of Illinois $905,730 +6.2%Southern Illinois U $273,475 +6.3%Northern Illinois U $130,055 +5.5%Illinois State U $103,572 +5.9%Western Illinois U $71,167 +5.6%Eastern Illinois U $60,428 +6.9%Northeastern Illinois U $48,941 +4.4%Chicago State U $46,972 +5.0%Governors State U $30,411 +5.5%Community colleges $409,066 +5.6%Adult education $39,005 n/cStudent aid $423,752 +3.7%Other $380,025 +10.4%Total $2,922,599 +7.6%
2001-2appropriations(in thousands)
1-year change
INDIANA*Indiana U $454,322 +1.5%Purdue U $320,398 +1.5%Ball State U $123,698 +1.3%Indiana State U, Terre Haute $77,443 +0.9%U of Southern Indiana $31,548 +7.1%Vincennes U $31,298 +5.0%Ivy Tech State C $103,955 +11.8%
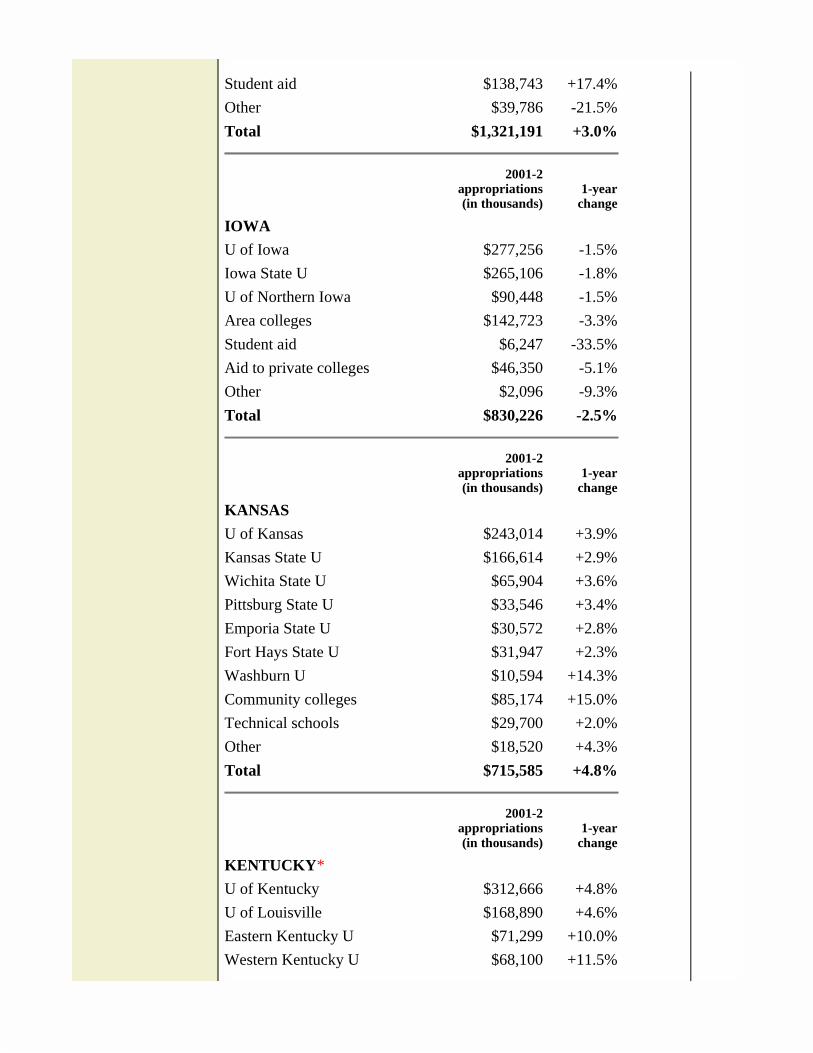
Student aid $138,743 +17.4%Other $39,786 -21.5%Total $1,321,191 +3.0%
2001-2appropriations(in thousands)
1-year change
IOWAU of Iowa $277,256 -1.5%Iowa State U $265,106 -1.8%U of Northern Iowa $90,448 -1.5%Area colleges $142,723 -3.3%Student aid $6,247 -33.5%Aid to private colleges $46,350 -5.1%Other $2,096 -9.3%Total $830,226 -2.5%
2001-2appropriations(in thousands)
1-year change
KANSASU of Kansas $243,014 +3.9%Kansas State U $166,614 +2.9%Wichita State U $65,904 +3.6%Pittsburg State U $33,546 +3.4%Emporia State U $30,572 +2.8%Fort Hays State U $31,947 +2.3%Washburn U $10,594 +14.3%Community colleges $85,174 +15.0%Technical schools $29,700 +2.0%Other $18,520 +4.3%Total $715,585 +4.8%
2001-2appropriations(in thousands)
1-year change
KENTUCKY*U of Kentucky $312,666 +4.8%U of Louisville $168,890 +4.6%Eastern Kentucky U $71,299 +10.0%Western Kentucky U $68,100 +11.5%
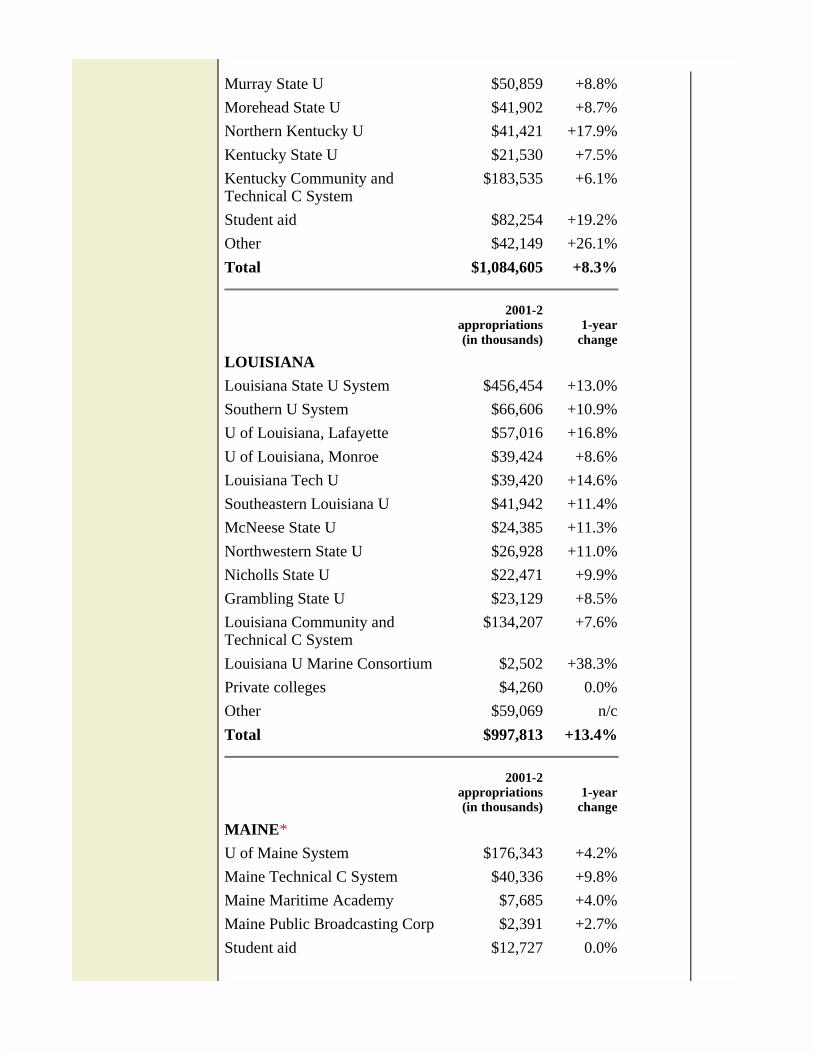
Murray State U $50,859 +8.8%Morehead State U $41,902 +8.7%Northern Kentucky U $41,421 +17.9%Kentucky State U $21,530 +7.5%Kentucky Community and Technical C System
$183,535 +6.1%
Student aid $82,254 +19.2%Other $42,149 +26.1%Total $1,084,605 +8.3%
2001-2appropriations(in thousands)
1-year change
LOUISIANALouisiana State U System $456,454 +13.0%Southern U System $66,606 +10.9%U of Louisiana, Lafayette $57,016 +16.8%U of Louisiana, Monroe $39,424 +8.6%Louisiana Tech U $39,420 +14.6%Southeastern Louisiana U $41,942 +11.4%McNeese State U $24,385 +11.3%Northwestern State U $26,928 +11.0%Nicholls State U $22,471 +9.9%Grambling State U $23,129 +8.5%Louisiana Community and Technical C System
$134,207 +7.6%
Louisiana U Marine Consortium $2,502 +38.3%Private colleges $4,260 0.0%Other $59,069 n/cTotal $997,813 +13.4%
2001-2appropriations(in thousands)
1-year change
MAINE*U of Maine System $176,343 +4.2%Maine Technical C System $40,336 +9.8%Maine Maritime Academy $7,685 +4.0%Maine Public Broadcasting Corp $2,391 +2.7%Student aid $12,727 0.0%
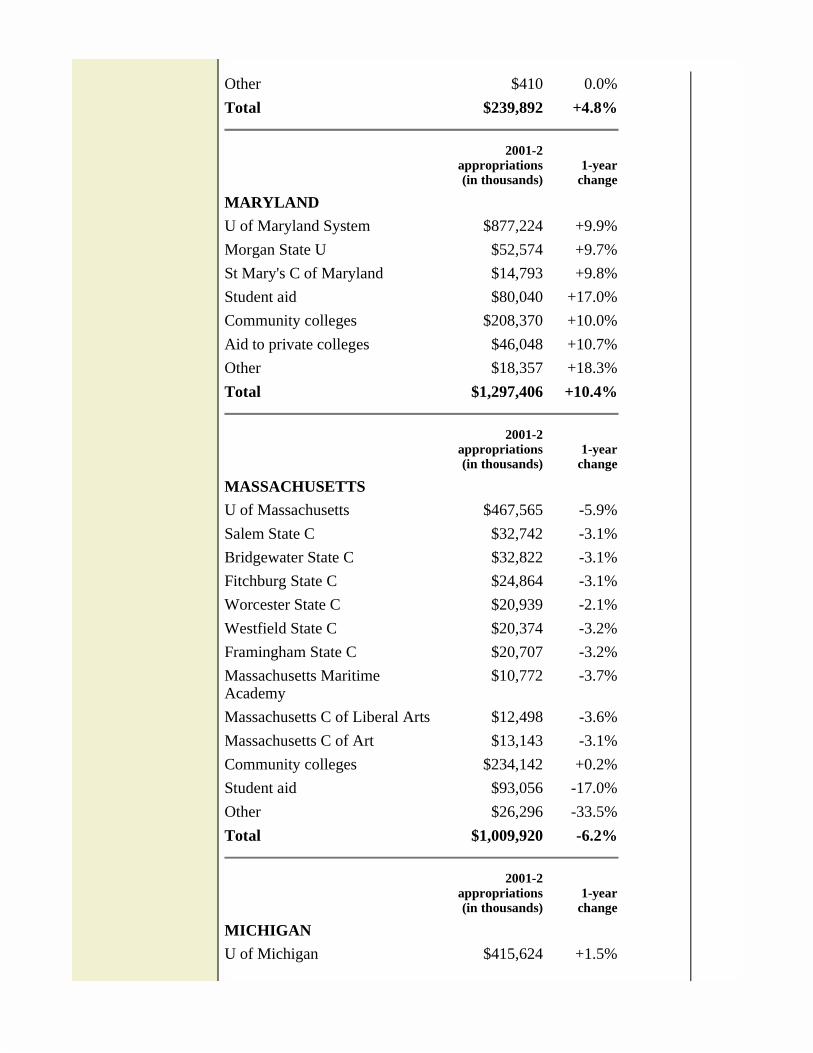
Other $410 0.0%Total $239,892 +4.8%
2001-2appropriations(in thousands)
1-year change
MARYLANDU of Maryland System $877,224 +9.9%Morgan State U $52,574 +9.7%St Mary's C of Maryland $14,793 +9.8%Student aid $80,040 +17.0%Community colleges $208,370 +10.0%Aid to private colleges $46,048 +10.7%Other $18,357 +18.3%Total $1,297,406 +10.4%
2001-2appropriations(in thousands)
1-year change
MASSACHUSETTSU of Massachusetts $467,565 -5.9%Salem State C $32,742 -3.1%Bridgewater State C $32,822 -3.1%Fitchburg State C $24,864 -3.1%Worcester State C $20,939 -2.1%Westfield State C $20,374 -3.2%Framingham State C $20,707 -3.2%Massachusetts Maritime Academy
$10,772 -3.7%
Massachusetts C of Liberal Arts $12,498 -3.6%Massachusetts C of Art $13,143 -3.1%Community colleges $234,142 +0.2%Student aid $93,056 -17.0%Other $26,296 -33.5%Total $1,009,920 -6.2%
2001-2appropriations(in thousands)
1-year change
MICHIGANU of Michigan $415,624 +1.5%
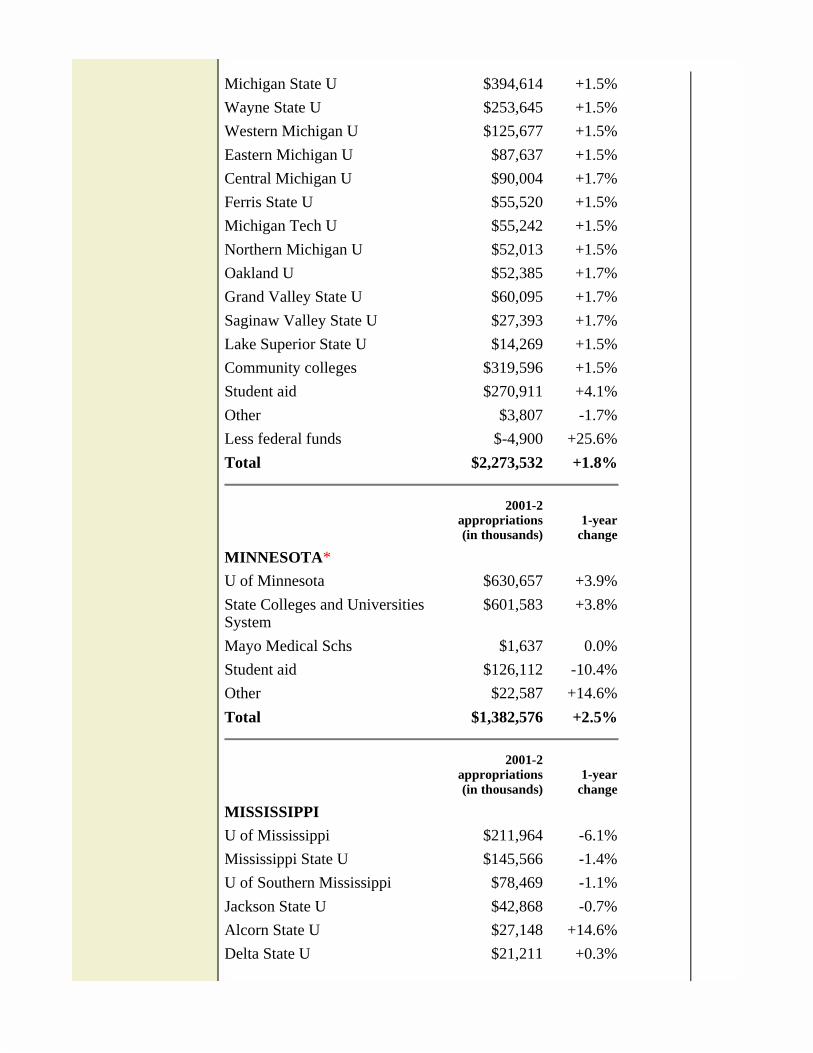
Michigan State U $394,614 +1.5%Wayne State U $253,645 +1.5%Western Michigan U $125,677 +1.5%Eastern Michigan U $87,637 +1.5%Central Michigan U $90,004 +1.7%Ferris State U $55,520 +1.5%Michigan Tech U $55,242 +1.5%Northern Michigan U $52,013 +1.5%Oakland U $52,385 +1.7%Grand Valley State U $60,095 +1.7%Saginaw Valley State U $27,393 +1.7%Lake Superior State U $14,269 +1.5%Community colleges $319,596 +1.5%Student aid $270,911 +4.1%Other $3,807 -1.7%Less federal funds $-4,900 +25.6%Total $2,273,532 +1.8%
2001-2appropriations(in thousands)
1-year change
MINNESOTA*U of Minnesota $630,657 +3.9%State Colleges and Universities System
$601,583 +3.8%
Mayo Medical Schs $1,637 0.0%Student aid $126,112 -10.4%Other $22,587 +14.6%Total $1,382,576 +2.5%
2001-2appropriations(in thousands)
1-year change
MISSISSIPPIU of Mississippi $211,964 -6.1%Mississippi State U $145,566 -1.4%U of Southern Mississippi $78,469 -1.1%Jackson State U $42,868 -0.7%Alcorn State U $27,148 +14.6%Delta State U $21,211 +0.3%
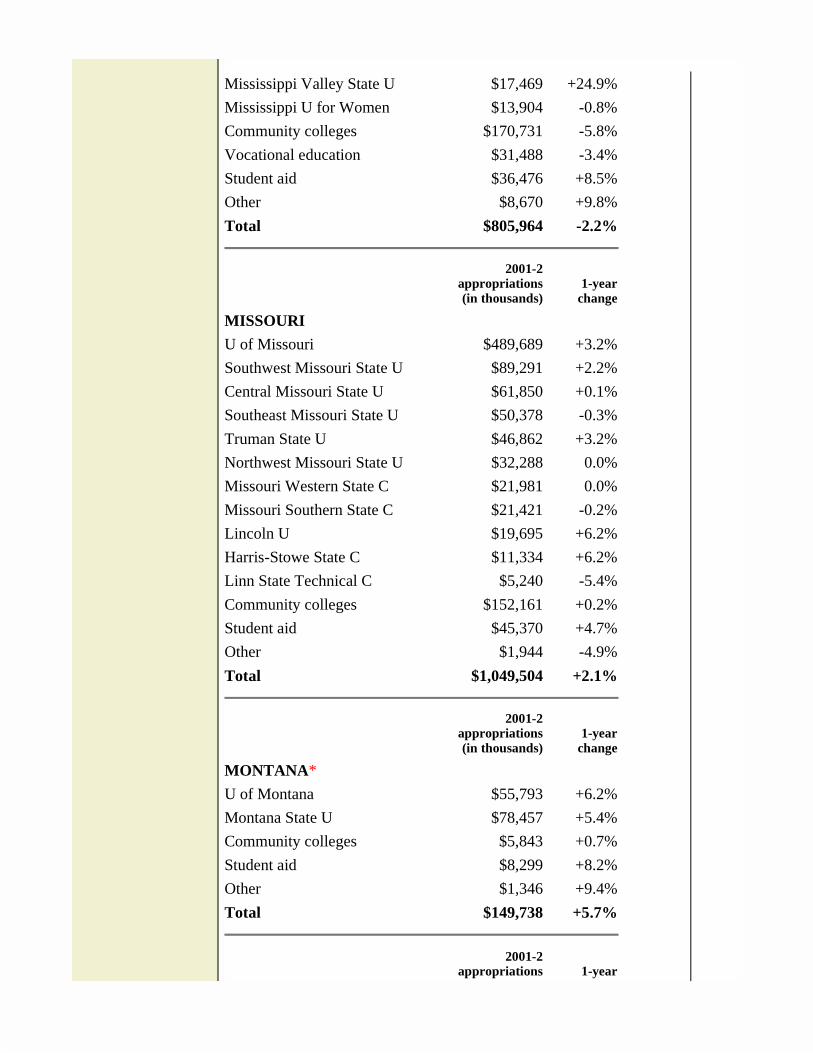
Mississippi Valley State U $17,469 +24.9%Mississippi U for Women $13,904 -0.8%Community colleges $170,731 -5.8%Vocational education $31,488 -3.4%Student aid $36,476 +8.5%Other $8,670 +9.8%Total $805,964 -2.2%
2001-2appropriations(in thousands)
1-year change
MISSOURIU of Missouri $489,689 +3.2%Southwest Missouri State U $89,291 +2.2%Central Missouri State U $61,850 +0.1%Southeast Missouri State U $50,378 -0.3%Truman State U $46,862 +3.2%Northwest Missouri State U $32,288 0.0%Missouri Western State C $21,981 0.0%Missouri Southern State C $21,421 -0.2%Lincoln U $19,695 +6.2%Harris-Stowe State C $11,334 +6.2%Linn State Technical C $5,240 -5.4%Community colleges $152,161 +0.2%Student aid $45,370 +4.7%Other $1,944 -4.9%Total $1,049,504 +2.1%
2001-2appropriations(in thousands)
1-year change
MONTANA*U of Montana $55,793 +6.2%Montana State U $78,457 +5.4%Community colleges $5,843 +0.7%Student aid $8,299 +8.2%Other $1,346 +9.4%Total $149,738 +5.7%
2001-2appropriations 1-year
(in thousands) change
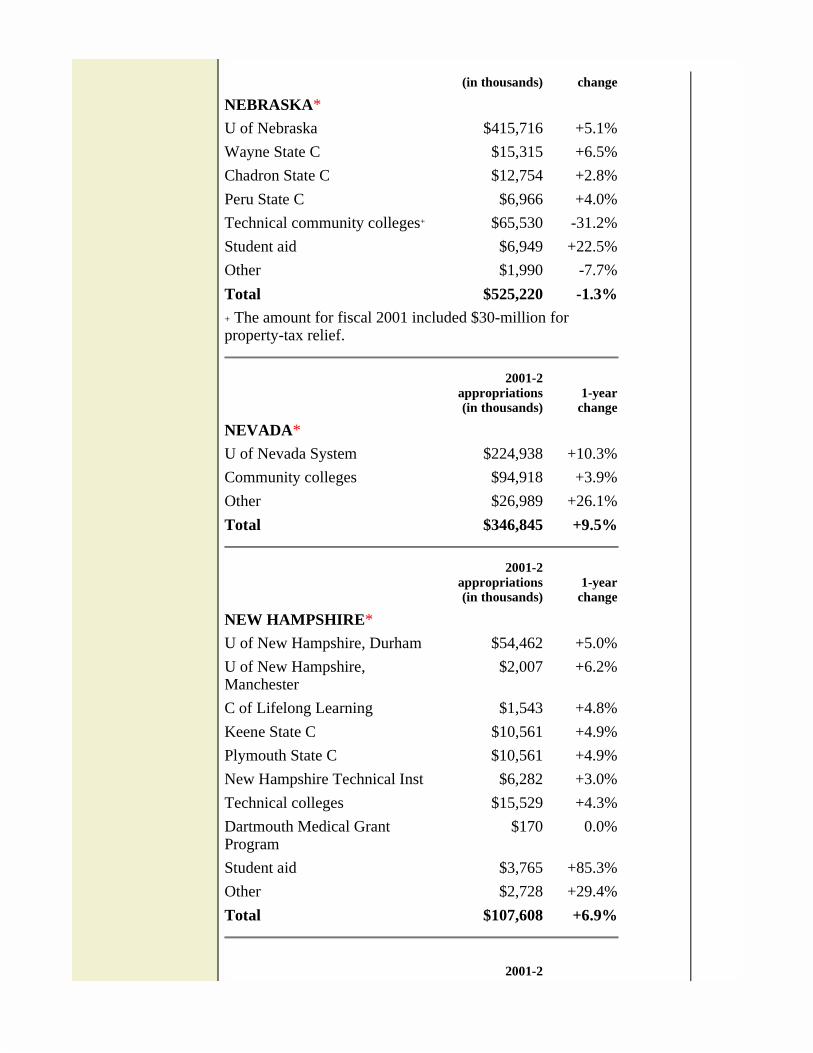
NEBRASKA*U of Nebraska $415,716 +5.1%Wayne State C $15,315 +6.5%Chadron State C $12,754 +2.8%Peru State C $6,966 +4.0%Technical community colleges+ $65,530 -31.2%Student aid $6,949 +22.5%Other $1,990 -7.7%Total $525,220 -1.3%+ The amount for fiscal 2001 included $30-million for property-tax relief.
2001-2appropriations(in thousands)
1-year change
NEVADA*U of Nevada System $224,938 +10.3%Community colleges $94,918 +3.9%Other $26,989 +26.1%Total $346,845 +9.5%
2001-2appropriations(in thousands)
1-year change
NEW HAMPSHIRE*U of New Hampshire, Durham $54,462 +5.0%U of New Hampshire, Manchester
$2,007 +6.2%
C of Lifelong Learning $1,543 +4.8%Keene State C $10,561 +4.9%Plymouth State C $10,561 +4.9%New Hampshire Technical Inst $6,282 +3.0%Technical colleges $15,529 +4.3%Dartmouth Medical Grant Program
$170 0.0%
Student aid $3,765 +85.3%Other $2,728 +29.4%Total $107,608 +6.9%
2001-2
appropriations(in thousands)
1-year change
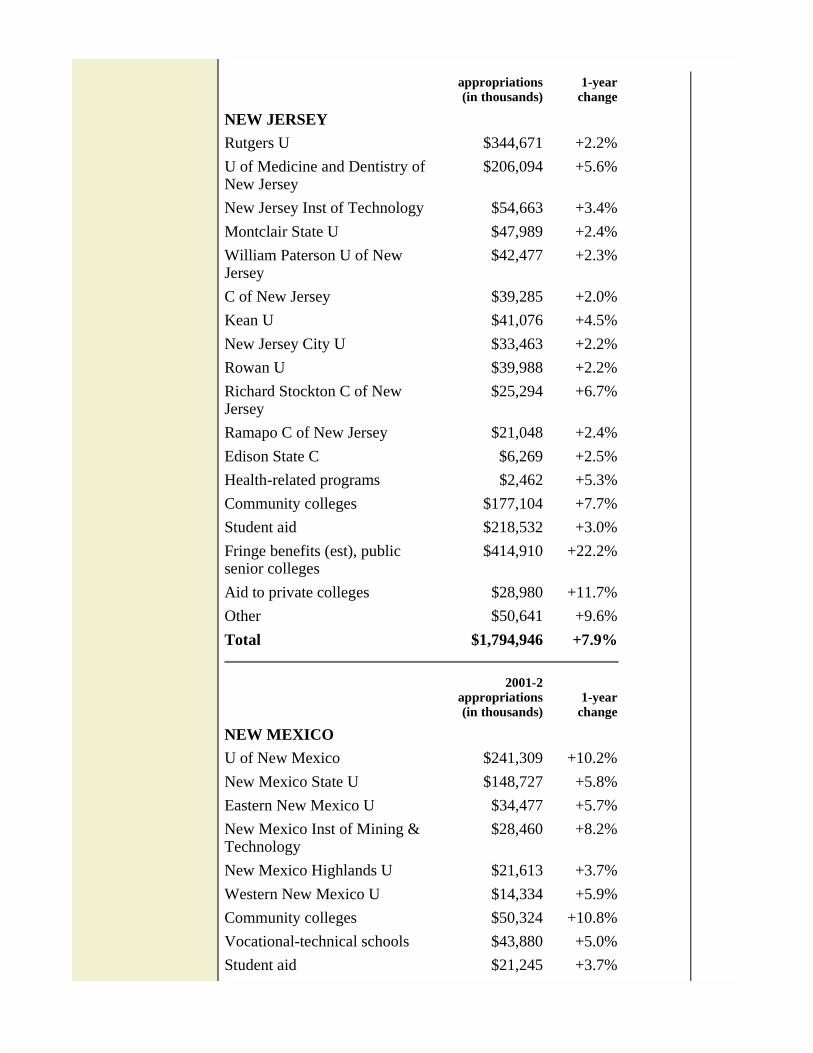
NEW JERSEYRutgers U $344,671 +2.2%U of Medicine and Dentistry of New Jersey
$206,094 +5.6%
New Jersey Inst of Technology $54,663 +3.4%Montclair State U $47,989 +2.4%William Paterson U of New Jersey
$42,477 +2.3%
C of New Jersey $39,285 +2.0%Kean U $41,076 +4.5%New Jersey City U $33,463 +2.2%Rowan U $39,988 +2.2%Richard Stockton C of New Jersey
$25,294 +6.7%
Ramapo C of New Jersey $21,048 +2.4%Edison State C $6,269 +2.5%Health-related programs $2,462 +5.3%Community colleges $177,104 +7.7%Student aid $218,532 +3.0%Fringe benefits (est), public senior colleges
$414,910 +22.2%
Aid to private colleges $28,980 +11.7%Other $50,641 +9.6%Total $1,794,946 +7.9%
2001-2appropriations(in thousands)
1-year change
NEW MEXICOU of New Mexico $241,309 +10.2%New Mexico State U $148,727 +5.8%Eastern New Mexico U $34,477 +5.7%New Mexico Inst of Mining & Technology
$28,460 +8.2%
New Mexico Highlands U $21,613 +3.7%Western New Mexico U $14,334 +5.9%Community colleges $50,324 +10.8%Vocational-technical schools $43,880 +5.0%Student aid $21,245 +3.7%
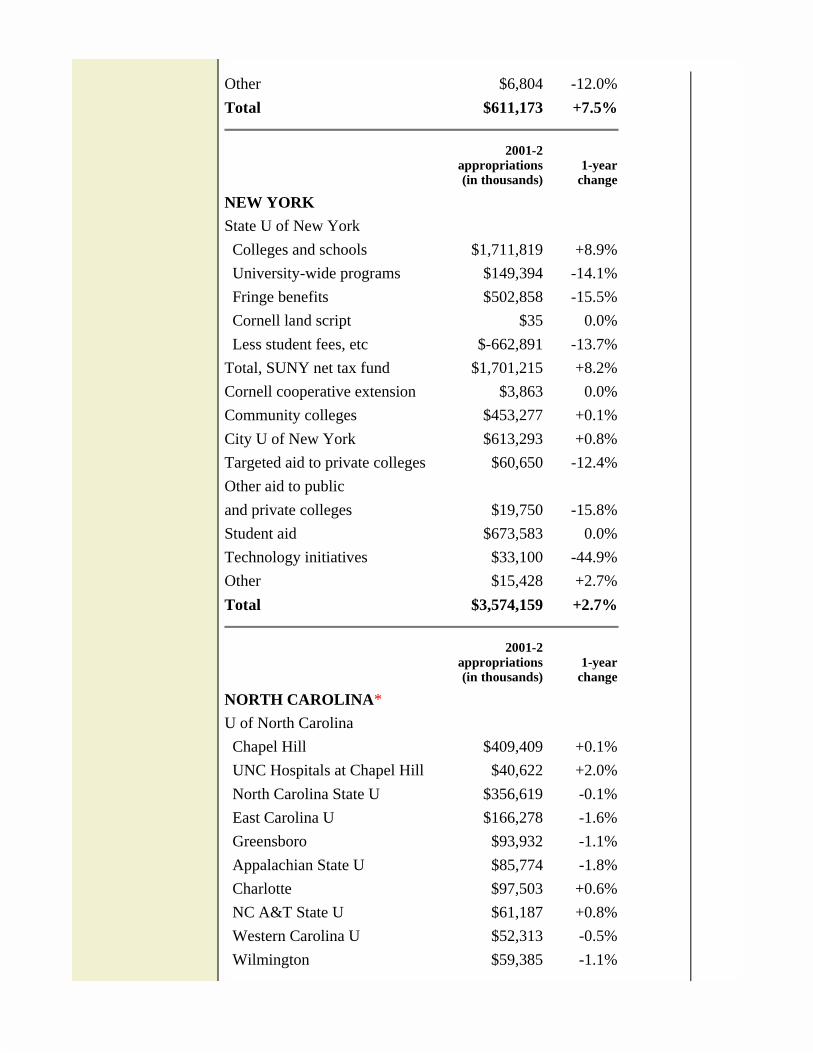
Other $6,804 -12.0%Total $611,173 +7.5%
2001-2appropriations(in thousands)
1-year change
NEW YORKState U of New York Colleges and schools $1,711,819 +8.9% University-wide programs $149,394 -14.1% Fringe benefits $502,858 -15.5% Cornell land script $35 0.0% Less student fees, etc $-662,891 -13.7%Total, SUNY net tax fund $1,701,215 +8.2%Cornell cooperative extension $3,863 0.0%Community colleges $453,277 +0.1%City U of New York $613,293 +0.8%Targeted aid to private colleges $60,650 -12.4%Other aid to public and private colleges $19,750 -15.8%Student aid $673,583 0.0%Technology initiatives $33,100 -44.9%Other $15,428 +2.7%Total $3,574,159 +2.7%
2001-2appropriations(in thousands)
1-year change
NORTH CAROLINA*U of North Carolina Chapel Hill $409,409 +0.1% UNC Hospitals at Chapel Hill $40,622 +2.0% North Carolina State U $356,619 -0.1% East Carolina U $166,278 -1.6% Greensboro $93,932 -1.1% Appalachian State U $85,774 -1.8% Charlotte $97,503 +0.6% NC A&T State U $61,187 +0.8% Western Carolina U $52,313 -0.5% Wilmington $59,385 -1.1%
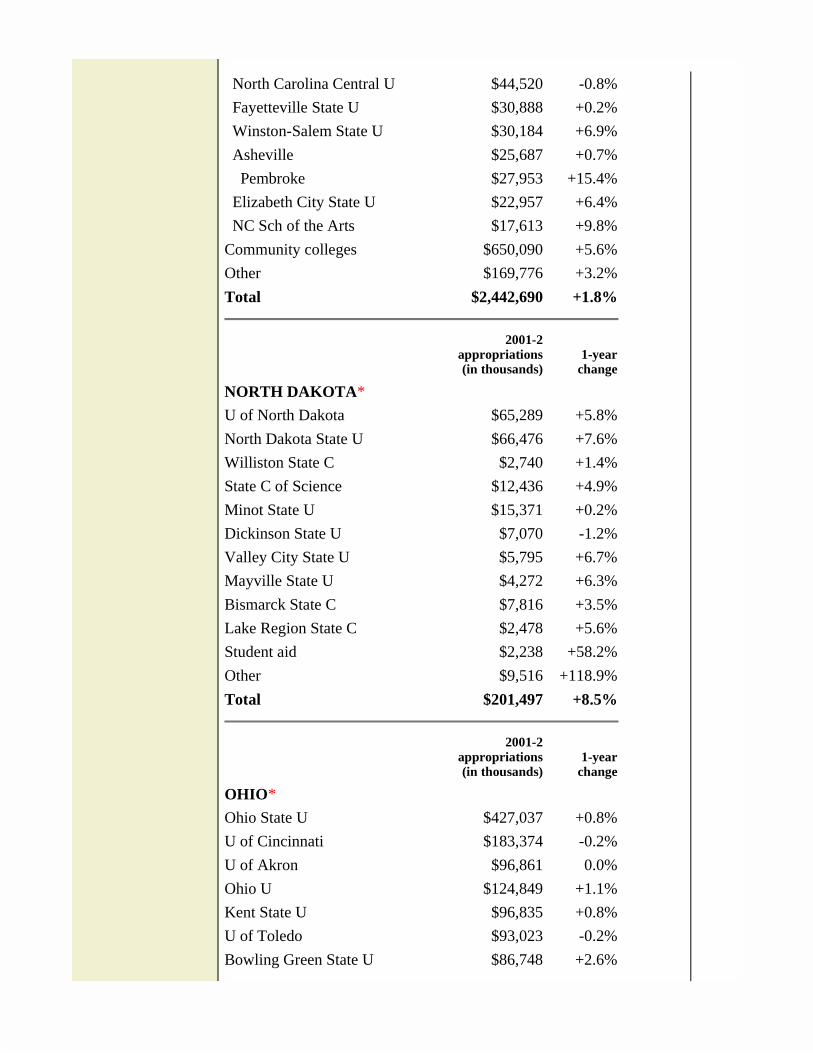
North Carolina Central U $44,520 -0.8% Fayetteville State U $30,888 +0.2% Winston-Salem State U $30,184 +6.9% Asheville $25,687 +0.7% Pembroke $27,953 +15.4% Elizabeth City State U $22,957 +6.4% NC Sch of the Arts $17,613 +9.8%Community colleges $650,090 +5.6%Other $169,776 +3.2%Total $2,442,690 +1.8%
2001-2appropriations(in thousands)
1-year change
NORTH DAKOTA*U of North Dakota $65,289 +5.8%North Dakota State U $66,476 +7.6%Williston State C $2,740 +1.4%State C of Science $12,436 +4.9%Minot State U $15,371 +0.2%Dickinson State U $7,070 -1.2%Valley City State U $5,795 +6.7%Mayville State U $4,272 +6.3%Bismarck State C $7,816 +3.5%Lake Region State C $2,478 +5.6%Student aid $2,238 +58.2%Other $9,516 +118.9%Total $201,497 +8.5%
2001-2appropriations(in thousands)
1-year change
OHIO*Ohio State U $427,037 +0.8%U of Cincinnati $183,374 -0.2%U of Akron $96,861 0.0%Ohio U $124,849 +1.1%Kent State U $96,835 +0.8%U of Toledo $93,023 -0.2%Bowling Green State U $86,748 +2.6%
Wright State U $85,929 +2.1%Cleveland State U $75,268 +2.3%Miami U $70,418 +0.2%Youngstown State U $49,702 +2.5%Central State U $19,516 +2.2%Shawnee State U $15,124 -4.5%Medical C of Ohio $37,272 0.0%Northeastern Ohio U's C of Medicine
$17,431 +1.2%
Case Western Reserve U $4,280 +1.0%Community colleges $268,059 +1.2%University branches $113,132 +4.2%Technical colleges $70,323 -0.5%Student aid $193,419 +4.9%Other $76,881 -6.6%Total $2,205,481 +1.1%
2001-2appropriations(in thousands)
1-year change
OKLAHOMAU of Oklahoma $217,300 +5.4%Oklahoma State U $217,630 +4.8%U of Central Oklahoma $46,292 +4.6%Northeastern State U $33,727 +6.3%Southwestern Oklahoma State U $21,656 +2.9%Cameron U $19,994 +2.7%Southeastern Oklahoma State U $16,108 +3.6%East Central U $16,784 +4.6%Langston U $16,669 +29.5%Northwestern Oklahoma State U $9,167 +2.2%Oklahoma Panhandle State U $6,607 +3.0%Rogers State U $12,168 +7.1%U of Science & Arts $6,706 +2.9%Community colleges $122,272 +2.5%Student aid $32,351 +7.4%Other $29,460 -6.6%Total $824,891 +4.5%
2001-2appropriations(in thousands)
1-year change
OREGON*Oregon U System $408,198 +4.5%Oregon Health Sciences U $52,307 -6.5%Student aid $21,813 +7.3%Community colleges $232,519 +3.6%Total $714,837 +3.4%
2001-2appropriations(in thousands)
1-year change
PENNSYLVANIAPennsylvania State U $334,813 +0.9%Temple U $180,171 +0.6%U of Pittsburgh $178,460 +0.6%Lincoln U $12,942 0.0%State System of Higher Education
$471,821 0.0%
Community colleges $163,675 -0.9%Thaddeus Stevens C of Tech $8,321 +3.2%State-aided private institutions $85,478 +3.1%Student aid and other $599,411 +4.0%Total $2,035,092 +1.5%
2001-2appropriations(in thousands)
1-year change
RHODE ISLANDU of Rhode Island $84,388 +7.3%Rhode Island C $43,686 +7.3%CC of Rhode Island $40,558 +7.3%Other $6,307 +10.0%Total $174,939 +7.4%
2001-2appropriations(in thousands)
1-year change
SOUTH CAROLINAU of South Carolina $237,386 +2.7%Clemson U $161,833 -0.3%
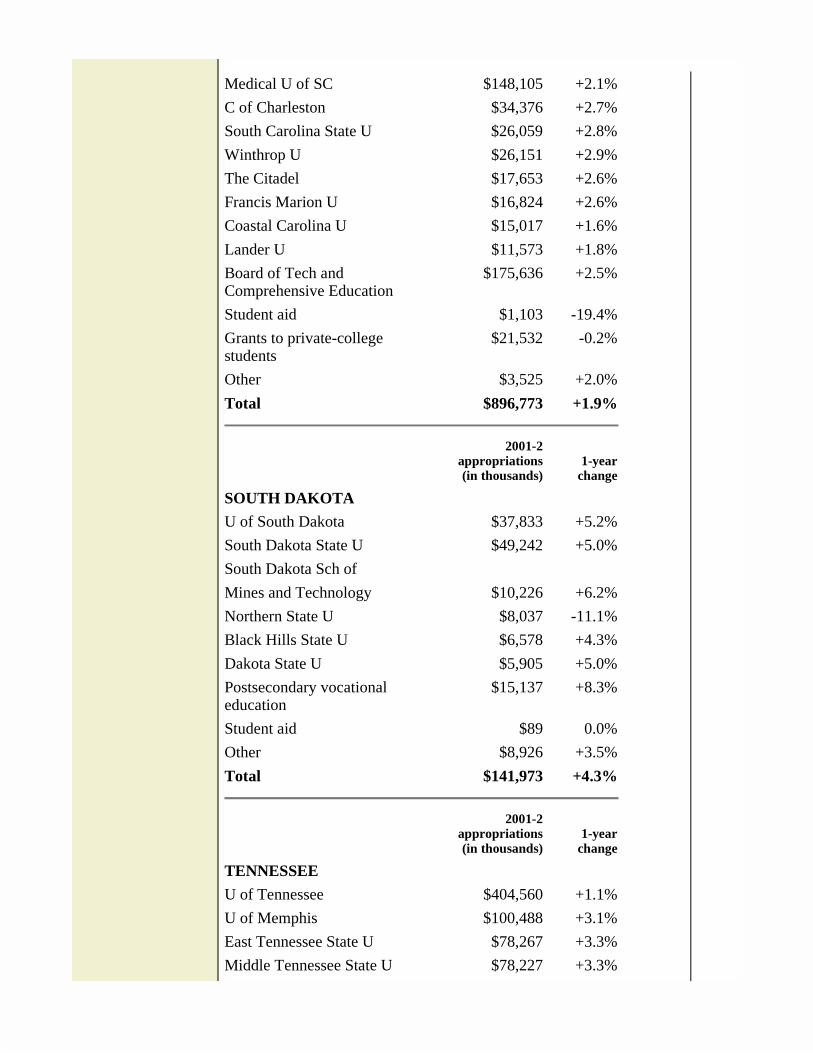
Medical U of SC $148,105 +2.1%C of Charleston $34,376 +2.7%South Carolina State U $26,059 +2.8%Winthrop U $26,151 +2.9%The Citadel $17,653 +2.6%Francis Marion U $16,824 +2.6%Coastal Carolina U $15,017 +1.6%Lander U $11,573 +1.8%Board of Tech and Comprehensive Education
$175,636 +2.5%
Student aid $1,103 -19.4%Grants to private-college students
$21,532 -0.2%
Other $3,525 +2.0%Total $896,773 +1.9%
2001-2appropriations(in thousands)
1-year change
SOUTH DAKOTAU of South Dakota $37,833 +5.2%South Dakota State U $49,242 +5.0%South Dakota Sch of Mines and Technology $10,226 +6.2%Northern State U $8,037 -11.1%Black Hills State U $6,578 +4.3%Dakota State U $5,905 +5.0%Postsecondary vocational education
$15,137 +8.3%
Student aid $89 0.0%Other $8,926 +3.5%Total $141,973 +4.3%
2001-2appropriations(in thousands)
1-year change
TENNESSEEU of Tennessee $404,560 +1.1%U of Memphis $100,488 +3.1%East Tennessee State U $78,267 +3.3%Middle Tennessee State U $78,227 +3.3%
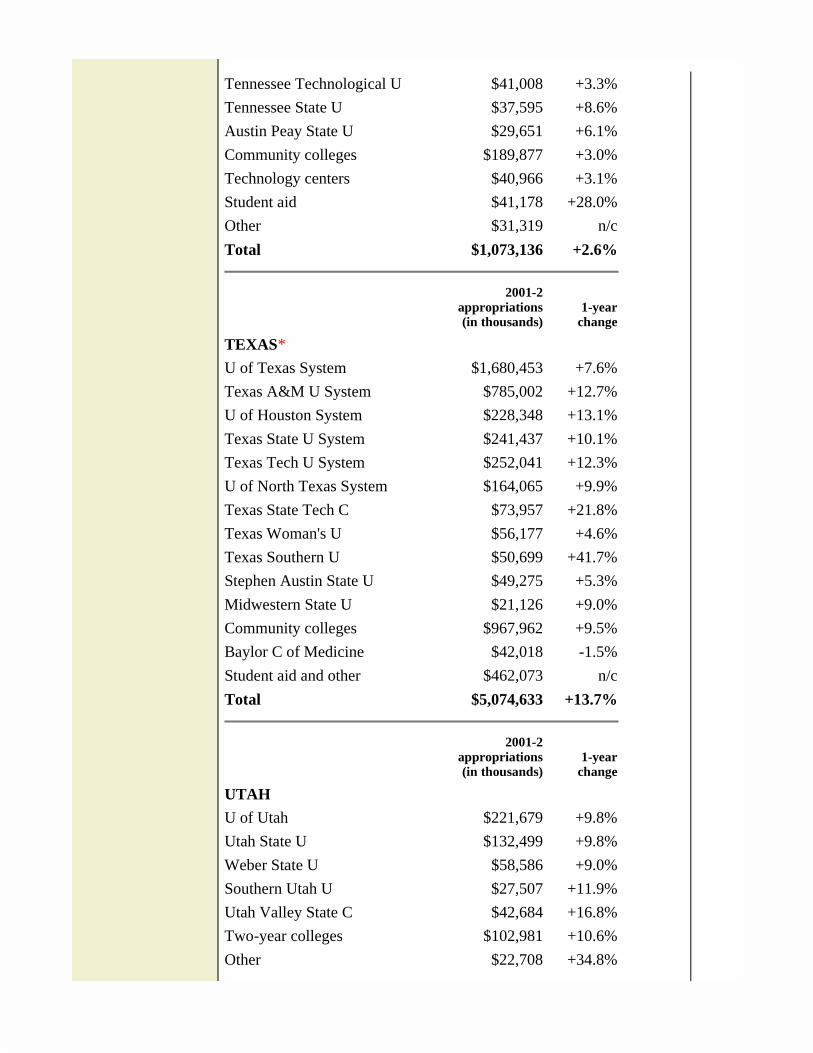
Tennessee Technological U $41,008 +3.3%Tennessee State U $37,595 +8.6%Austin Peay State U $29,651 +6.1%Community colleges $189,877 +3.0%Technology centers $40,966 +3.1%Student aid $41,178 +28.0%Other $31,319 n/cTotal $1,073,136 +2.6%
2001-2appropriations(in thousands)
1-year change
TEXAS*U of Texas System $1,680,453 +7.6%Texas A&M U System $785,002 +12.7%U of Houston System $228,348 +13.1%Texas State U System $241,437 +10.1%Texas Tech U System $252,041 +12.3%U of North Texas System $164,065 +9.9%Texas State Tech C $73,957 +21.8%Texas Woman's U $56,177 +4.6%Texas Southern U $50,699 +41.7%Stephen Austin State U $49,275 +5.3%Midwestern State U $21,126 +9.0%Community colleges $967,962 +9.5%Baylor C of Medicine $42,018 -1.5%Student aid and other $462,073 n/cTotal $5,074,633 +13.7%
2001-2appropriations(in thousands)
1-year change
UTAHU of Utah $221,679 +9.8%Utah State U $132,499 +9.8%Weber State U $58,586 +9.0%Southern Utah U $27,507 +11.9%Utah Valley State C $42,684 +16.8%Two-year colleges $102,981 +10.6%Other $22,708 +34.8%
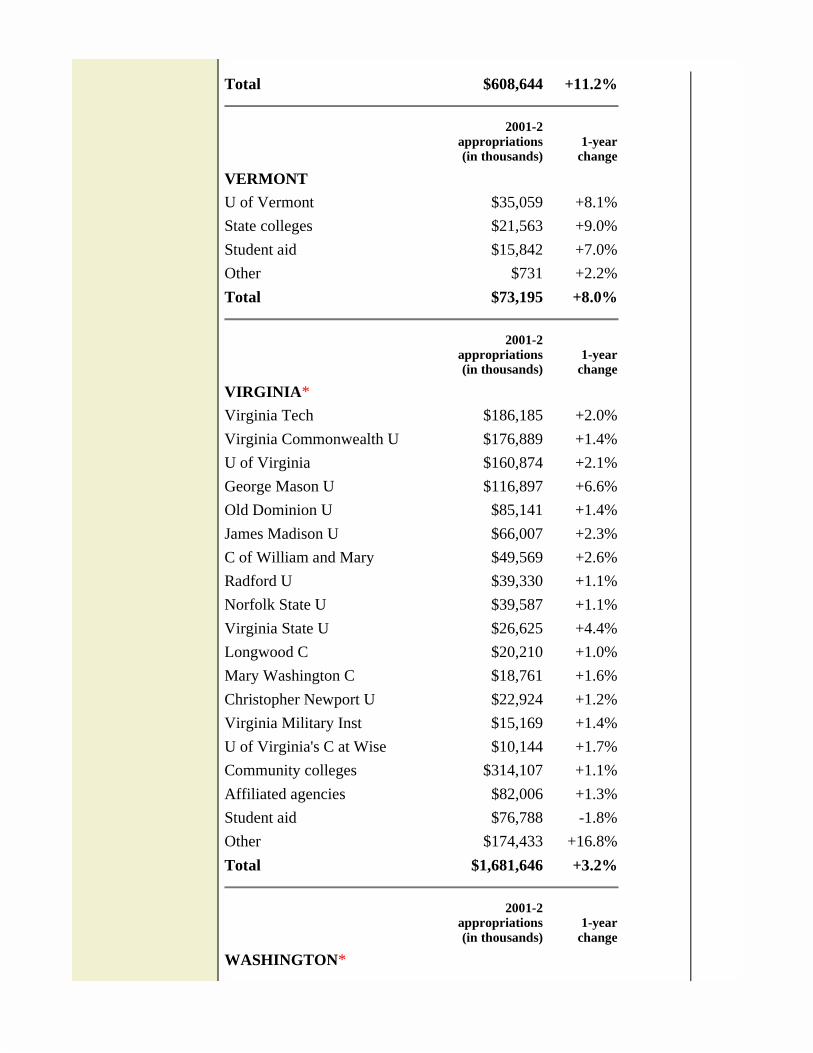
Total $608,644 +11.2%
2001-2appropriations(in thousands)
1-year change
VERMONTU of Vermont $35,059 +8.1%State colleges $21,563 +9.0%Student aid $15,842 +7.0%Other $731 +2.2%Total $73,195 +8.0%
2001-2appropriations(in thousands)
1-year change
VIRGINIA*Virginia Tech $186,185 +2.0%Virginia Commonwealth U $176,889 +1.4%U of Virginia $160,874 +2.1%George Mason U $116,897 +6.6%Old Dominion U $85,141 +1.4%James Madison U $66,007 +2.3%C of William and Mary $49,569 +2.6%Radford U $39,330 +1.1%Norfolk State U $39,587 +1.1%Virginia State U $26,625 +4.4%Longwood C $20,210 +1.0%Mary Washington C $18,761 +1.6%Christopher Newport U $22,924 +1.2%Virginia Military Inst $15,169 +1.4%U of Virginia's C at Wise $10,144 +1.7%Community colleges $314,107 +1.1%Affiliated agencies $82,006 +1.3%Student aid $76,788 -1.8%Other $174,433 +16.8%Total $1,681,646 +3.2%
2001-2appropriations(in thousands)
1-year change
WASHINGTON*
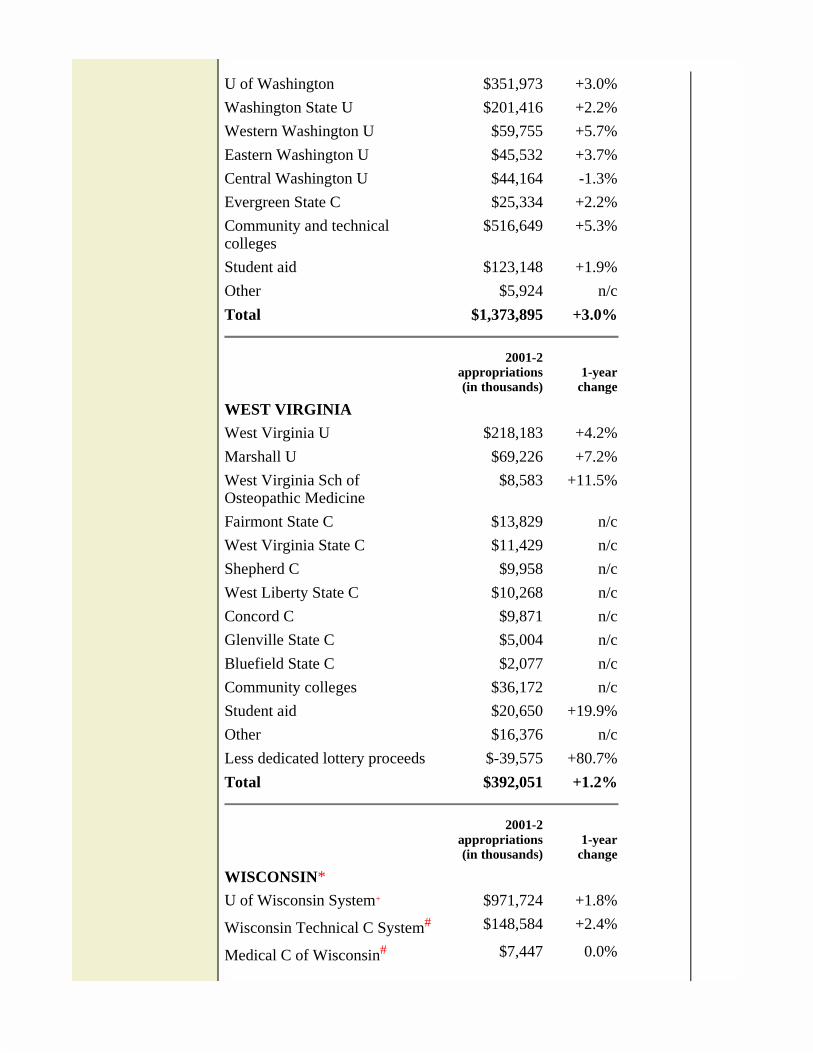
U of Washington $351,973 +3.0%Washington State U $201,416 +2.2%Western Washington U $59,755 +5.7%Eastern Washington U $45,532 +3.7%Central Washington U $44,164 -1.3%Evergreen State C $25,334 +2.2%Community and technical colleges
$516,649 +5.3%
Student aid $123,148 +1.9%Other $5,924 n/cTotal $1,373,895 +3.0%
2001-2appropriations(in thousands)
1-year change
WEST VIRGINIAWest Virginia U $218,183 +4.2%Marshall U $69,226 +7.2%West Virginia Sch of Osteopathic Medicine
$8,583 +11.5%
Fairmont State C $13,829 n/cWest Virginia State C $11,429 n/cShepherd C $9,958 n/cWest Liberty State C $10,268 n/cConcord C $9,871 n/cGlenville State C $5,004 n/cBluefield State C $2,077 n/cCommunity colleges $36,172 n/cStudent aid $20,650 +19.9%Other $16,376 n/cLess dedicated lottery proceeds $-39,575 +80.7%Total $392,051 +1.2%
2001-2appropriations(in thousands)
1-year change
WISCONSIN*U of Wisconsin System+ $971,724 +1.8%
Wisconsin Technical C System# $148,584 +2.4%
Medical C of Wisconsin# $7,447 0.0%
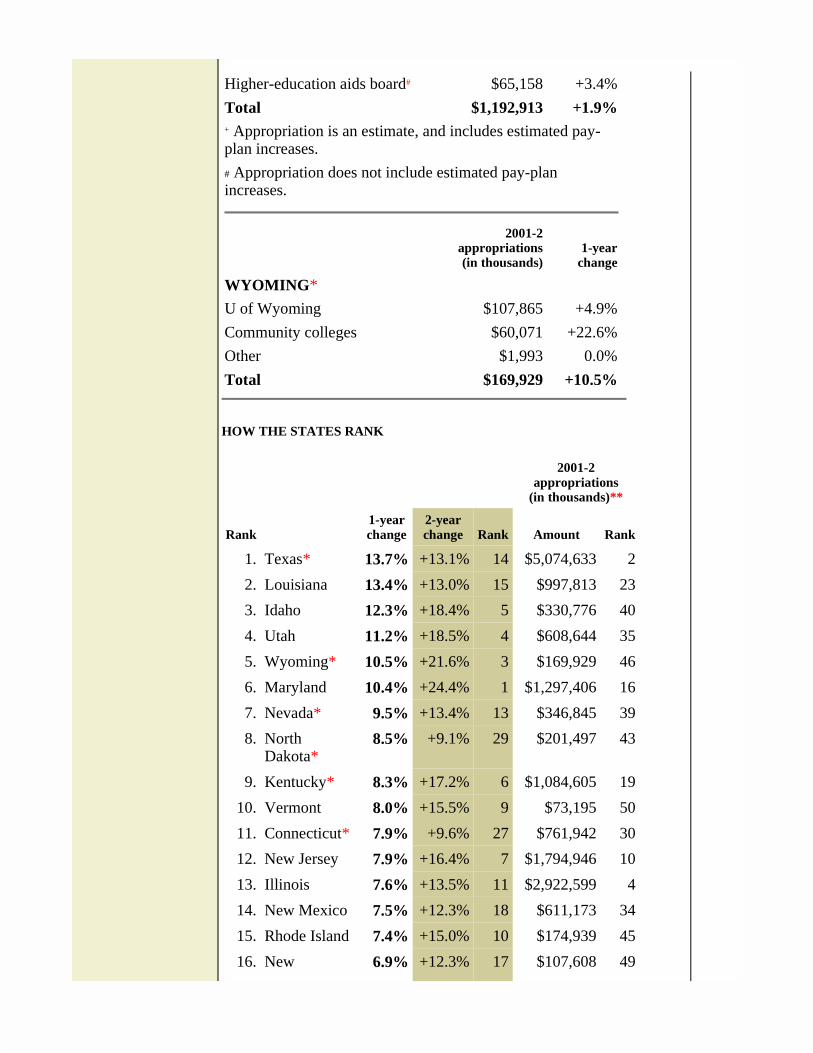
HOW THE STATES RANK
Higher-education aids board# $65,158 +3.4%Total $1,192,913 +1.9%+ Appropriation is an estimate, and includes estimated pay-plan increases.# Appropriation does not include estimated pay-plan increases.
2001-2appropriations(in thousands)
1-year change
WYOMING*U of Wyoming $107,865 +4.9%Community colleges $60,071 +22.6%Other $1,993 0.0%Total $169,929 +10.5%
2001-2 appropriations
(in thousands)**
Rank1-year change
2-year change Rank Amount Rank
1. Texas* 13.7% +13.1% 14 $5,074,633 22. Louisiana 13.4% +13.0% 15 $997,813 233. Idaho 12.3% +18.4% 5 $330,776 404. Utah 11.2% +18.5% 4 $608,644 355. Wyoming* 10.5% +21.6% 3 $169,929 466. Maryland 10.4% +24.4% 1 $1,297,406 167. Nevada* 9.5% +13.4% 13 $346,845 398. North
Dakota*8.5% +9.1% 29 $201,497 43
9. Kentucky* 8.3% +17.2% 6 $1,084,605 1910. Vermont 8.0% +15.5% 9 $73,195 5011. Connecticut* 7.9% +9.6% 27 $761,942 3012. New Jersey 7.9% +16.4% 7 $1,794,946 1013. Illinois 7.6% +13.5% 11 $2,922,599 414. New Mexico 7.5% +12.3% 18 $611,173 3415. Rhode Island 7.4% +15.0% 10 $174,939 4516. New 6.9% +12.3% 17 $107,608 49
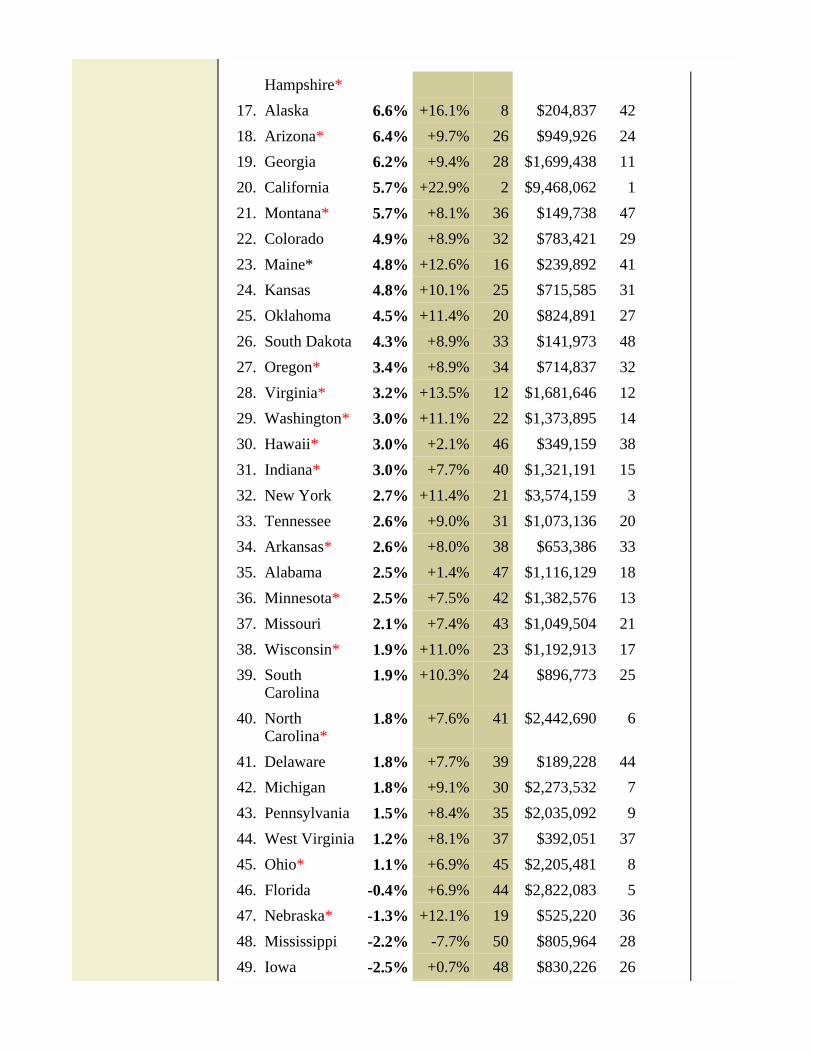
Hampshire*17. Alaska 6.6% +16.1% 8 $204,837 4218. Arizona* 6.4% +9.7% 26 $949,926 2419. Georgia 6.2% +9.4% 28 $1,699,438 1120. California 5.7% +22.9% 2 $9,468,062 121. Montana* 5.7% +8.1% 36 $149,738 4722. Colorado 4.9% +8.9% 32 $783,421 2923. Maine* 4.8% +12.6% 16 $239,892 4124. Kansas 4.8% +10.1% 25 $715,585 3125. Oklahoma 4.5% +11.4% 20 $824,891 2726. South Dakota 4.3% +8.9% 33 $141,973 4827. Oregon* 3.4% +8.9% 34 $714,837 3228. Virginia* 3.2% +13.5% 12 $1,681,646 1229. Washington* 3.0% +11.1% 22 $1,373,895 1430. Hawaii* 3.0% +2.1% 46 $349,159 3831. Indiana* 3.0% +7.7% 40 $1,321,191 1532. New York 2.7% +11.4% 21 $3,574,159 333. Tennessee 2.6% +9.0% 31 $1,073,136 2034. Arkansas* 2.6% +8.0% 38 $653,386 3335. Alabama 2.5% +1.4% 47 $1,116,129 1836. Minnesota* 2.5% +7.5% 42 $1,382,576 1337. Missouri 2.1% +7.4% 43 $1,049,504 2138. Wisconsin* 1.9% +11.0% 23 $1,192,913 1739. South
Carolina1.9% +10.3% 24 $896,773 25
40. North Carolina*
1.8% +7.6% 41 $2,442,690 6
41. Delaware 1.8% +7.7% 39 $189,228 4442. Michigan 1.8% +9.1% 30 $2,273,532 743. Pennsylvania 1.5% +8.4% 35 $2,035,092 944. West Virginia 1.2% +8.1% 37 $392,051 3745. Ohio* 1.1% +6.9% 45 $2,205,481 846. Florida -0.4% +6.9% 44 $2,822,083 547. Nebraska* -1.3% +12.1% 19 $525,220 3648. Mississippi -2.2% -7.7% 50 $805,964 2849. Iowa -2.5% +0.7% 48 $830,226 26
Copyright © 2002 by The Chronicle of Higher Education
http://chronicle.com Section: Government & Politics Page: A20
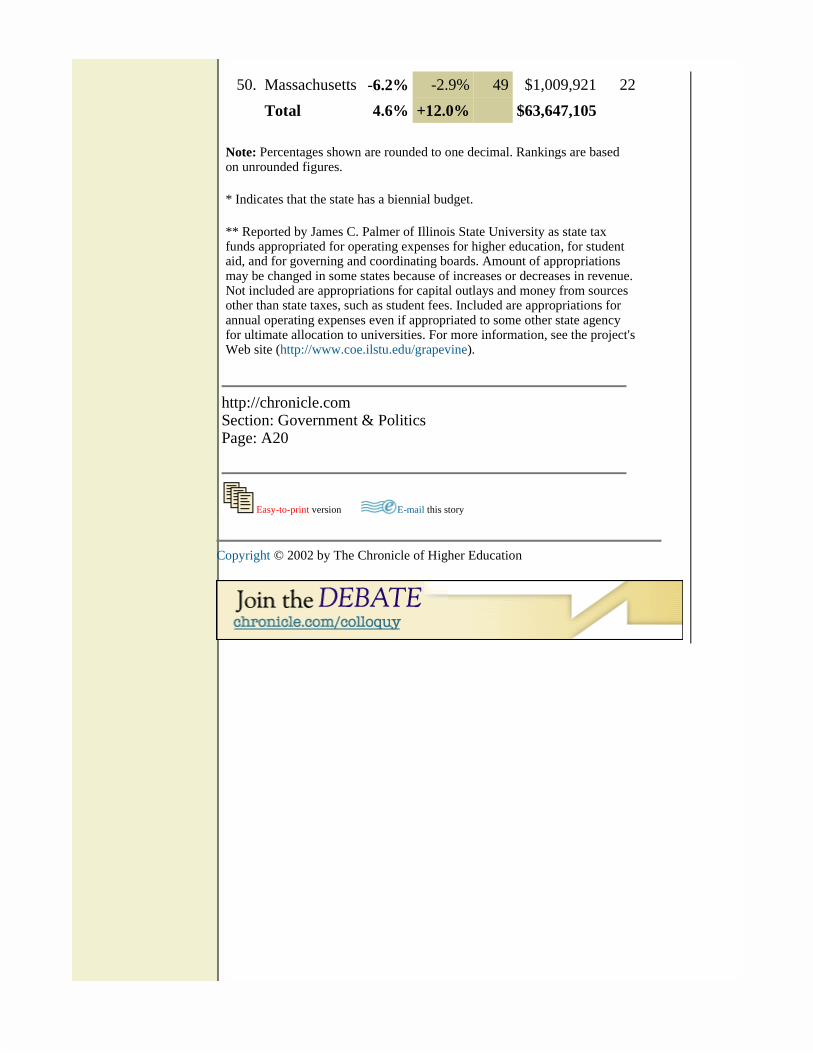
50. Massachusetts -6.2% -2.9% 49 $1,009,921 22Total 4.6% +12.0% $63,647,105
Note: Percentages shown are rounded to one decimal. Rankings are based on unrounded figures. * Indicates that the state has a biennial budget. ** Reported by James C. Palmer of Illinois State University as state tax funds appropriated for operating expenses for higher education, for student aid, and for governing and coordinating boards. Amount of appropriations may be changed in some states because of increases or decreases in revenue. Not included are appropriations for capital outlays and money from sources other than state taxes, such as student fees. Included are appropriations for annual operating expenses even if appropriated to some other state agency for ultimate allocation to universities. For more information, see the project's Web site (http://www.coe.ilstu.edu/grapevine).
Easy-to-print version E-mail this story