Embed Size (px)
Citation preview

State Street Global Advisors Trust Company
State Street Russell Small Cap Value® Index Non-Lending Series Fund
Financial Statements
December 31, 2018
PricewaterhouseCoopers LLP, 101 Seaport Boulevard, Suite 500, Boston, MA 02210
T: (617) 530 5000, F: (617) 530 5001, www.pwc.com/us
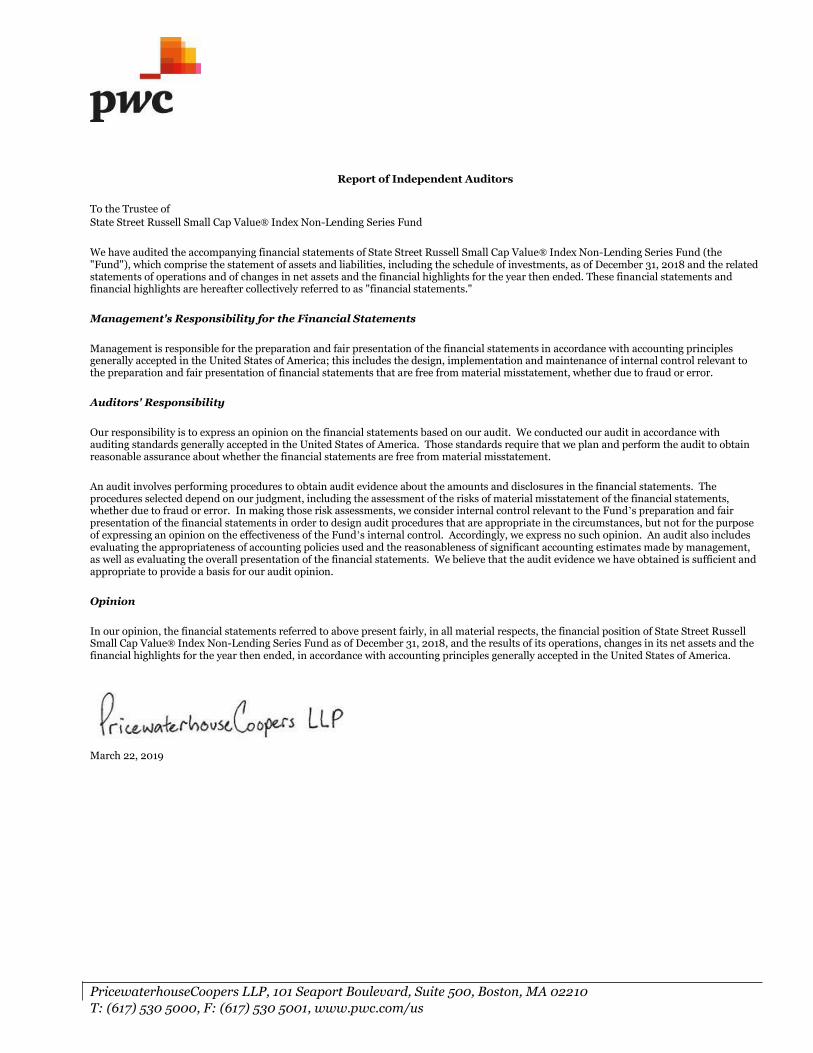
Report of Independent Auditors
To the Trustee of State Street Russell Small Cap Value® Index Non-Lending Series Fund We have audited the accompanying financial statements of State Street Russell Small Cap Value® Index Non-Lending Series Fund (the "Fund"), which comprise the statement of assets and liabilities, including the schedule of investments, as of December 31, 2018 and the related statements of operations and of changes in net assets and the financial highlights for the year then ended. These financial statements and financial highlights are hereafter collectively referred to as "financial statements." Management's Responsibility for the Financial Statements Management is responsible for the preparation and fair presentation of the financial statements in accordance with accounting principles generally accepted in the United States of America; this includes the design, implementation and maintenance of internal control relevant to the preparation and fair presentation of financial statements that are free from material misstatement, whether due to fraud or error. Auditors' Responsibility Our responsibility is to express an opinion on the financial statements based on our audit. We conducted our audit in accordance with auditing standards generally accepted in the United States of America. Those standards require that we plan and perform the audit to obtain reasonable assurance about whether the financial statements are free from material misstatement. An audit involves performing procedures to obtain audit evidence about the amounts and disclosures in the financial statements. The procedures selected depend on our judgment, including the assessment of the risks of material misstatement of the financial statements, whether due to fraud or error. In making those risk assessments, we consider internal control relevant to the Fund’s preparation and fair presentation of the financial statements in order to design audit procedures that are appropriate in the circumstances, but not for the purpose of expressing an opinion on the effectiveness of the Fund’s internal control. Accordingly, we express no such opinion. An audit also includes evaluating the appropriateness of accounting policies used and the reasonableness of significant accounting estimates made by management, as well as evaluating the overall presentation of the financial statements. We believe that the audit evidence we have obtained is sufficient and appropriate to provide a basis for our audit opinion. Opinion In our opinion, the financial statements referred to above present fairly, in all material respects, the financial position of State Street Russell Small Cap Value® Index Non-Lending Series Fund as of December 31, 2018, and the results of its operations, changes in its net assets and the financial highlights for the year then ended, in accordance with accounting principles generally accepted in the United States of America.
March 22, 2019
State Street Global Advisors Trust Company
State Street Russell Small Cap Value® Index Non-Lending Series Fund
Statement of Assets and Liabilities
December 31, 2018
The accompanying notes are an integral part
of these financial statements.
2
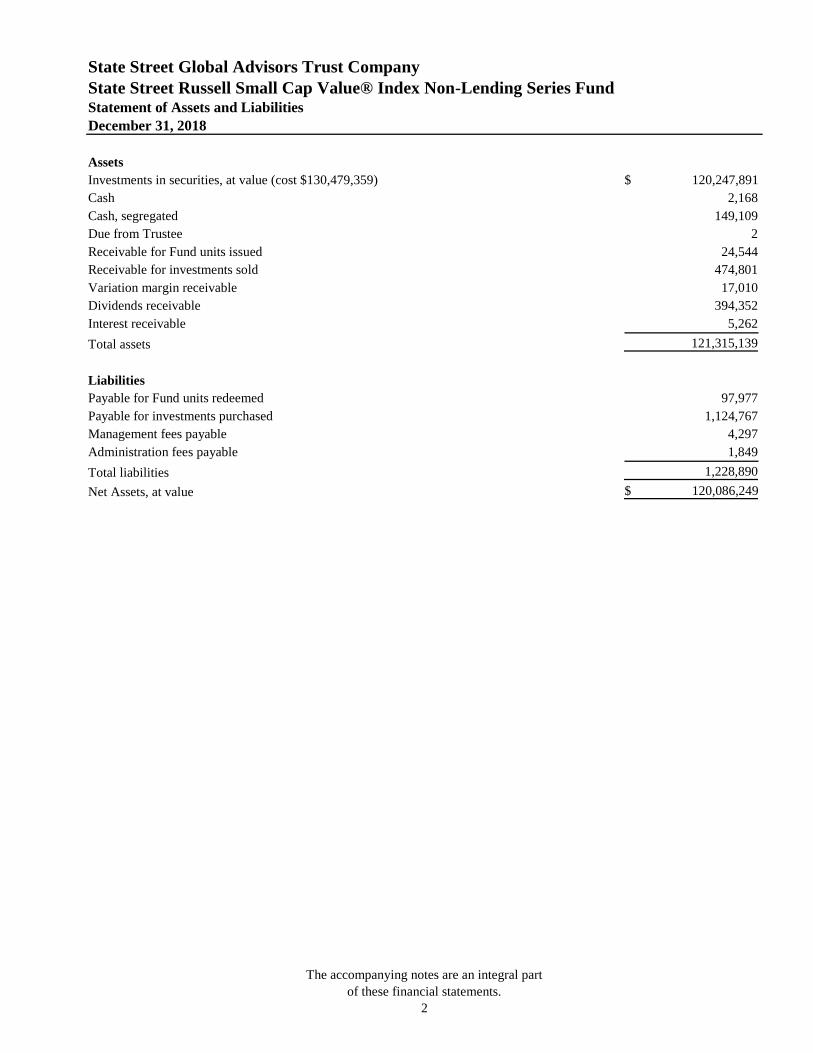
Assets
Investments in securities, at value (cost $130,479,359) $ 120,247,891
Cash 2,168
Cash, segregated 149,109
Due from Trustee 2
Receivable for Fund units issued 24,544
Receivable for investments sold 474,801
Variation margin receivable 17,010
Dividends receivable 394,352
Interest receivable 5,262
Total assets 121,315,139
Liabilities
Payable for Fund units redeemed 97,977
Payable for investments purchased 1,124,767
Management fees payable 4,297
Administration fees payable 1,849
Total liabilities 1,228,890
Net Assets, at value $ 120,086,249

State Street Global Advisors Trust Company
State Street Russell Small Cap Value® Index Non-Lending Series Fund
Statement of Assets and Liabilities (continued)
December 31, 2018
The accompanying notes are an integral part
of these financial statements.
3
State Street Russell Small Cap Value® Index Non-Lending Series Fund - Class C
(4,992,900 units outstanding, at $24.05 per unit net asset value) $ 120,086,249

State Street Global Advisors Trust Company
State Street Russell Small Cap Value® Index Non-Lending Series Fund
Statement of Operations
Year Ended December 31, 2018
The accompanying notes are an integral part
of these financial statements.
4
Investment income
Dividends $ 3,188,321
Interest 38,244
Total investment income 3,226,565
Expenses
Management fees 31,886
Administration fees 31,538
Audit fees 8,500
Other expenses 3,951
Total expenses 75,875
Waivers and reimbursements (26,196)
Net expenses 49,679
Net investment income (loss) 3,176,886
Net realized and unrealized gain (loss):
Net realized gain (loss):
Investments 18,926,060
Foreign currency transactions (36)
Futures contracts (491,972)
18,434,052
Net change in unrealized appreciation (depreciation):
Investments (35,978,532)
Futures contracts (174,106)
(36,152,638)
Net realized and unrealized gain (loss) (17,718,586)
Net increase (decrease) in net assets resulting from operations $ (14,541,700)
State Street Global Advisors Trust Company
State Street Russell Small Cap Value® Index Non-Lending Series Fund
Statement of Changes in Net Assets
Year Ended December 31, 2018
The accompanying notes are an integral part
of these financial statements.
5
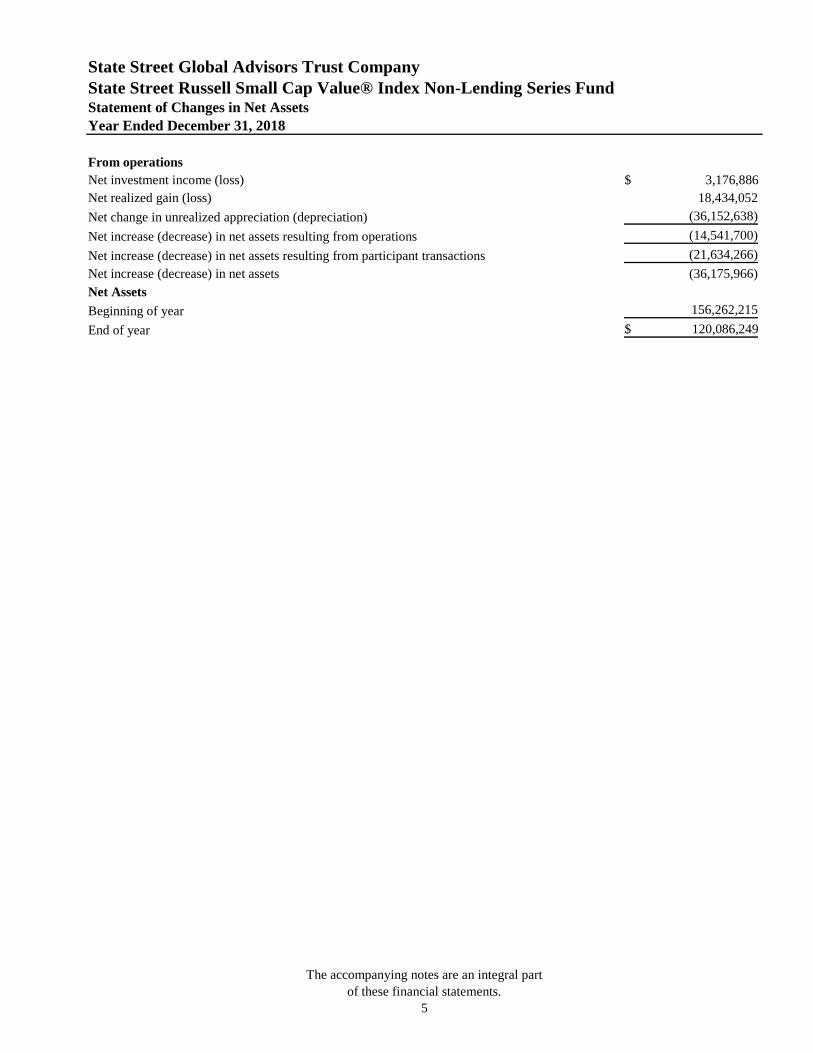
From operations
Net investment income (loss) $ 3,176,886
Net realized gain (loss) 18,434,052
Net change in unrealized appreciation (depreciation) (36,152,638)
Net increase (decrease) in net assets resulting from operations (14,541,700)
Net increase (decrease) in net assets resulting from participant transactions (21,634,266)
Net increase (decrease) in net assets (36,175,966)
Net Assets
Beginning of year 156,262,215
End of year $ 120,086,249

State Street Global Advisors Trust Company
State Street Russell Small Cap Value® Index Non-Lending Series Fund
Statement of Changes in Net Assets (continued)
Year Ended
December 31, 2018
Units Amount
The accompanying notes are an integral part
of these financial statements.
6
Units of Participation
Participant transactions for the Fund were as follows:
Class A1
Units issued 332,324 $ 9,443,185
Units redeemed (3,600,876) (102,869,206)
(3,268,552) (93,426,021)
Class C
Units issued 3,570,269 $ 98,803,698
Units redeemed (978,979) (27,011,943)
2,591,290 71,791,755
Net increase (decrease) $ (21,634,266)
1 Due to participant redemptions, the Class had no units outstanding subsequent to October 19, 2018.
State Street Global Advisors Trust Company
State Street Russell Small Cap Value® Index Non-Lending Series Fund - Class C
Financial Highlights
Year Ended December 31, 2018
(For a Unit of Participation Outstanding Throughout the Year)
The accompanying notes are an integral part
of these financial statements.
7
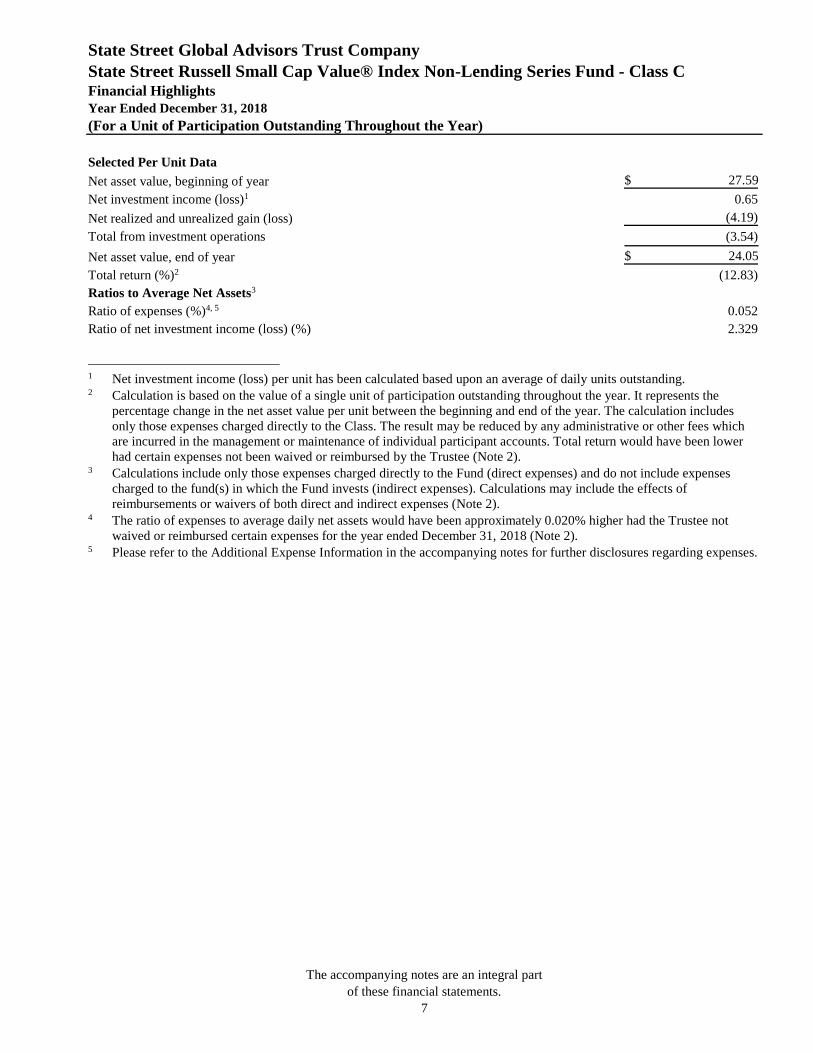
Selected Per Unit Data
Net asset value, beginning of year $ 27.59
Net investment income (loss)1 0.65
Net realized and unrealized gain (loss) (4.19)
Total from investment operations (3.54)
Net asset value, end of year $ 24.05
Total return (%)2 (12.83)
Ratios to Average Net Assets3
Ratio of expenses (%)4, 5 0.052
Ratio of net investment income (loss) (%) 2.329
1 Net investment income (loss) per unit has been calculated based upon an average of daily units outstanding. 2 Calculation is based on the value of a single unit of participation outstanding throughout the year. It represents the
percentage change in the net asset value per unit between the beginning and end of the year. The calculation includes
only those expenses charged directly to the Class. The result may be reduced by any administrative or other fees which
are incurred in the management or maintenance of individual participant accounts. Total return would have been lower
had certain expenses not been waived or reimbursed by the Trustee (Note 2). 3 Calculations include only those expenses charged directly to the Fund (direct expenses) and do not include expenses
charged to the fund(s) in which the Fund invests (indirect expenses). Calculations may include the effects of
reimbursements or waivers of both direct and indirect expenses (Note 2). 4 The ratio of expenses to average daily net assets would have been approximately 0.020% higher had the Trustee not
waived or reimbursed certain expenses for the year ended December 31, 2018 (Note 2). 5 Please refer to the Additional Expense Information in the accompanying notes for further disclosures regarding expenses.

State Street Global Advisors Trust Company
State Street Russell Small Cap Value® Index Non-Lending Series Fund
Schedule of Investments
(showing percentage of total value of investments)
December 31, 2018
The accompanying notes are an integral part
of these financial statements.
8
Common Stock - 97.7% Shares
Value
($)
Aerospace & Defense - 1.4%
AAR Corp. 4,500 168,030
Cubic Corp. 1,000 53,740
Ducommun Inc. 1,600 58,112
Engility Holdings Inc. 2,600 73,996
Esterline Technologies Corp. 3,500 425,075
KeyW Holding Corp. 7,300 48,837
Kratos Defense & Security Solutions Inc. 7,893 111,212
Maxar Technologies Ltd. 8,000 95,680
Mercury Systems Inc. 3,200 151,328
Moog Inc. 4,000 309,920
National Presto Industries Inc. 600 70,152
Sparton Corp. 300 5,457
Triumph Group Inc. 6,900 79,350
Vectrus Inc. 1,200 25,896
Wesco Aircraft Holdings Inc. 4,200 33,180
1,709,965
Air Freight & Logistics - 0.2%
Atlas Air Worldwide Holdings Inc. 3,300 139,227
Echo Global Logistics Inc. 200 4,066
Hub Group Inc. 1,700 63,019
Radiant Logistics Inc. 4,100 17,425
223,737
Airlines - 0.9%
Hawaiian Holdings Inc. 6,500 171,665
Mesa Air Group Inc. 1,200 9,252
SkyWest Inc. 7,000 311,290
Spirit Airlines Inc. 9,300 538,656
1,030,863
Auto Components - 0.9%
American Axle & Manufacturing Holdings Inc. 15,450 171,495
Cooper Tire & Rubber Co. 7,000 226,310
Cooper-Standard Holdings Inc. 2,500 155,300
Dana Inc. 1,200 16,356
Gentherm Inc. 4,500 179,910
State Street Global Advisors Trust Company
State Street Russell Small Cap Value® Index Non-Lending Series Fund
Schedule of Investments
(showing percentage of total value of investments)
December 31, 2018
The accompanying notes are an integral part
of these financial statements.
9
Common Stock - 97.7% Shares
Value
($)
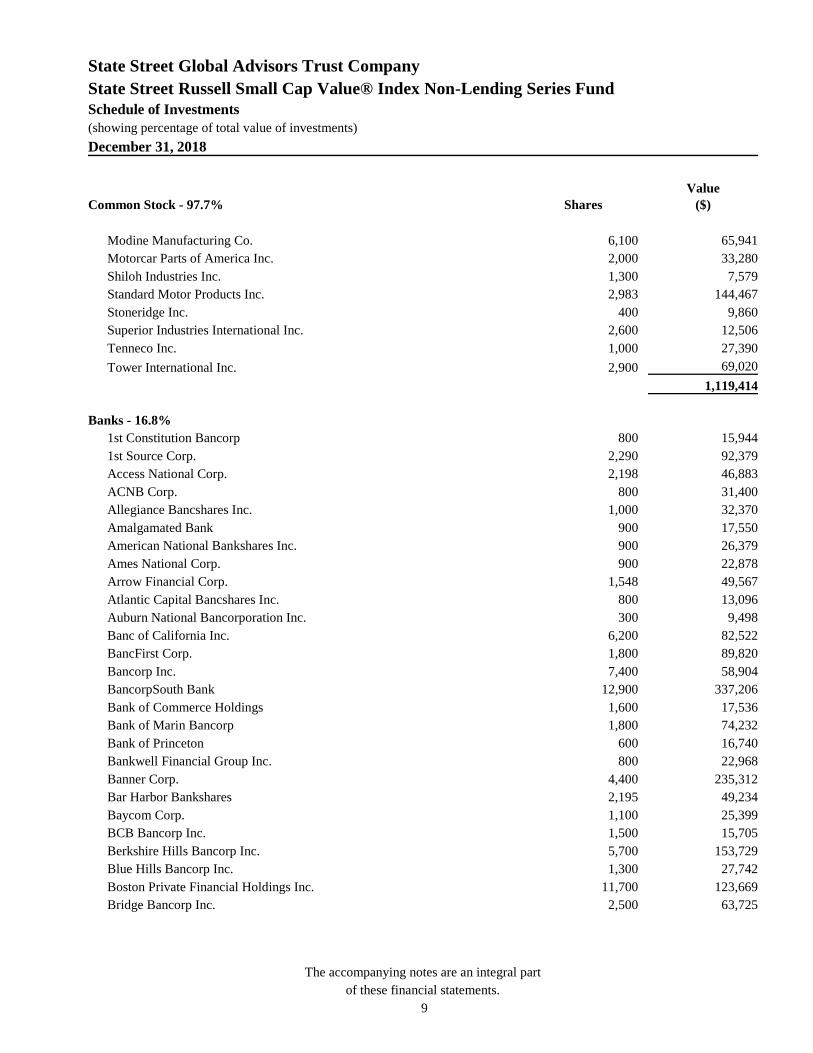
Modine Manufacturing Co. 6,100 65,941
Motorcar Parts of America Inc. 2,000 33,280
Shiloh Industries Inc. 1,300 7,579
Standard Motor Products Inc. 2,983 144,467
Stoneridge Inc. 400 9,860
Superior Industries International Inc. 2,600 12,506
Tenneco Inc. 1,000 27,390
Tower International Inc. 2,900 69,020
1,119,414
Banks - 16.8%
1st Constitution Bancorp 800 15,944
1st Source Corp. 2,290 92,379
Access National Corp. 2,198 46,883
ACNB Corp. 800 31,400
Allegiance Bancshares Inc. 1,000 32,370
Amalgamated Bank 900 17,550
American National Bankshares Inc. 900 26,379
Ames National Corp. 900 22,878
Arrow Financial Corp. 1,548 49,567
Atlantic Capital Bancshares Inc. 800 13,096
Auburn National Bancorporation Inc. 300 9,498
Banc of California Inc. 6,200 82,522
BancFirst Corp. 1,800 89,820
Bancorp Inc. 7,400 58,904
BancorpSouth Bank 12,900 337,206
Bank of Commerce Holdings 1,600 17,536
Bank of Marin Bancorp 1,800 74,232
Bank of Princeton 600 16,740
Bankwell Financial Group Inc. 800 22,968
Banner Corp. 4,400 235,312
Bar Harbor Bankshares 2,195 49,234
Baycom Corp. 1,100 25,399
BCB Bancorp Inc. 1,500 15,705
Berkshire Hills Bancorp Inc. 5,700 153,729
Blue Hills Bancorp Inc. 1,300 27,742
Boston Private Financial Holdings Inc. 11,700 123,669
Bridge Bancorp Inc. 2,500 63,725
State Street Global Advisors Trust Company
State Street Russell Small Cap Value® Index Non-Lending Series Fund
Schedule of Investments
(showing percentage of total value of investments)
December 31, 2018
The accompanying notes are an integral part
of these financial statements.
10
Common Stock - 97.7% Shares
Value
($)
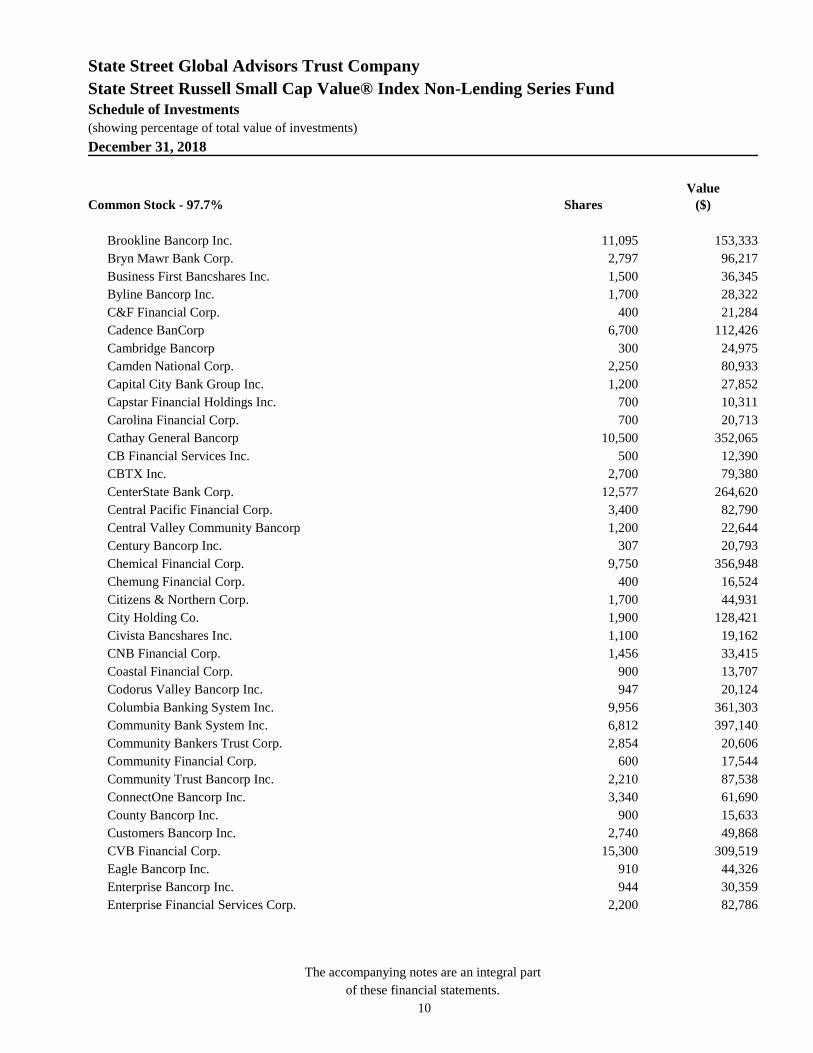
Brookline Bancorp Inc. 11,095 153,333
Bryn Mawr Bank Corp. 2,797 96,217
Business First Bancshares Inc. 1,500 36,345
Byline Bancorp Inc. 1,700 28,322
C&F Financial Corp. 400 21,284
Cadence BanCorp 6,700 112,426
Cambridge Bancorp 300 24,975
Camden National Corp. 2,250 80,933
Capital City Bank Group Inc. 1,200 27,852
Capstar Financial Holdings Inc. 700 10,311
Carolina Financial Corp. 700 20,713
Cathay General Bancorp 10,500 352,065
CB Financial Services Inc. 500 12,390
CBTX Inc. 2,700 79,380
CenterState Bank Corp. 12,577 264,620
Central Pacific Financial Corp. 3,400 82,790
Central Valley Community Bancorp 1,200 22,644
Century Bancorp Inc. 307 20,793
Chemical Financial Corp. 9,750 356,948
Chemung Financial Corp. 400 16,524
Citizens & Northern Corp. 1,700 44,931
City Holding Co. 1,900 128,421
Civista Bancshares Inc. 1,100 19,162
CNB Financial Corp. 1,456 33,415
Coastal Financial Corp. 900 13,707
Codorus Valley Bancorp Inc. 947 20,124
Columbia Banking System Inc. 9,956 361,303
Community Bank System Inc. 6,812 397,140
Community Bankers Trust Corp. 2,854 20,606
Community Financial Corp. 600 17,544
Community Trust Bancorp Inc. 2,210 87,538
ConnectOne Bancorp Inc. 3,340 61,690
County Bancorp Inc. 900 15,633
Customers Bancorp Inc. 2,740 49,868
CVB Financial Corp. 15,300 309,519
Eagle Bancorp Inc. 910 44,326
Enterprise Bancorp Inc. 944 30,359
Enterprise Financial Services Corp. 2,200 82,786

State Street Global Advisors Trust Company
State Street Russell Small Cap Value® Index Non-Lending Series Fund
Schedule of Investments
(showing percentage of total value of investments)
December 31, 2018
The accompanying notes are an integral part
of these financial statements.
11
Common Stock - 97.7% Shares
Value
($)
Equity Bancshares Inc. 1,000 35,250
Esquire Financial Holdings Inc. 400 8,680
Evans Bancorp Inc. 700 22,757
Farmers & Merchants Bancorp Inc. 100 3,849
Farmers National Banc Corp. 2,700 34,398
FB Financial Corp. 1,000 35,020
Fidelity D&D Bancorp Inc. 300 19,254
Fidelity Southern Corp. 3,185 82,874
Financial Institutions Inc. 2,300 59,110
First Bancorp 4,076 133,122
First Bancorp Inc. 1,031 27,115
First BanCorp. 29,400 252,840
First Bancshares Inc. 1,900 57,475
First Bank 1,700 20,604
First Busey Corp. 6,145 150,798
First Business Financial Services Inc. 900 17,559
First Choice Bancorp 1,200 27,120
First Commonwealth Financial Corp. 13,900 167,912
First Community Bankshares Inc. 2,100 66,108
First Community Corp. 800 15,544
First Financial Bancorp 13,037 309,238
First Financial Corp. 1,700 68,255
First Financial Northwest Inc. 800 12,376
First Foundation Inc. 3,900 50,154
First Guaranty Bancshares Inc. 660 15,319
First Internet Bancorp 900 18,396
First Interstate BancSystem Inc. 4,546 166,202
First Merchants Corp. 6,800 233,036
First Mid-Illinois Bancshares Inc. 1,900 60,648
First Midwest Bancorp Inc. 14,000 277,340
First Northwest Bancorp 1,000 14,830
First of Long Island Corp. 3,575 71,321
First Savings Financial Group Inc. 269 13,972
First United Corp. 1,000 15,920
Flushing Financial Corp. 4,000 86,120
Franklin Financial Network Inc. 1,400 36,918
Fulton Financial Corp. 23,500 363,780
German American Bancorp Inc. 2,350 65,260
State Street Global Advisors Trust Company
State Street Russell Small Cap Value® Index Non-Lending Series Fund
Schedule of Investments
(showing percentage of total value of investments)
December 31, 2018
The accompanying notes are an integral part
of these financial statements.
12
Common Stock - 97.7% Shares
Value
($)
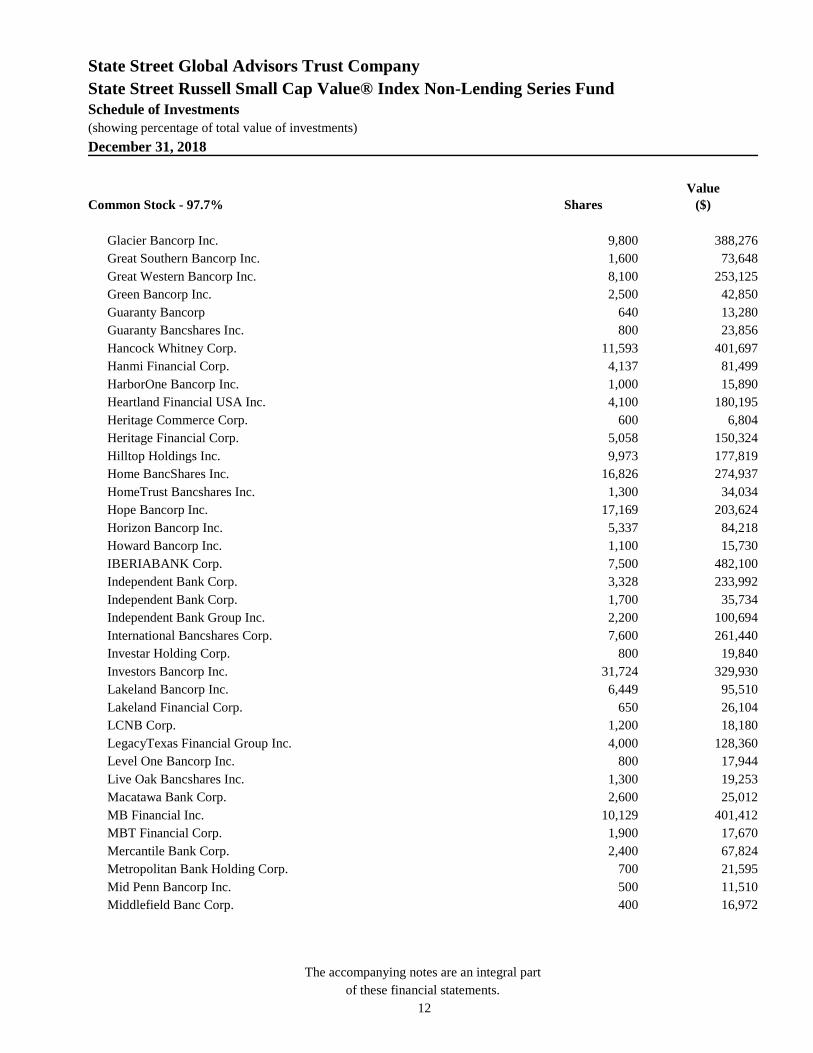
Glacier Bancorp Inc. 9,800 388,276
Great Southern Bancorp Inc. 1,600 73,648
Great Western Bancorp Inc. 8,100 253,125
Green Bancorp Inc. 2,500 42,850
Guaranty Bancorp 640 13,280
Guaranty Bancshares Inc. 800 23,856
Hancock Whitney Corp. 11,593 401,697
Hanmi Financial Corp. 4,137 81,499
HarborOne Bancorp Inc. 1,000 15,890
Heartland Financial USA Inc. 4,100 180,195
Heritage Commerce Corp. 600 6,804
Heritage Financial Corp. 5,058 150,324
Hilltop Holdings Inc. 9,973 177,819
Home BancShares Inc. 16,826 274,937
HomeTrust Bancshares Inc. 1,300 34,034
Hope Bancorp Inc. 17,169 203,624
Horizon Bancorp Inc. 5,337 84,218
Howard Bancorp Inc. 1,100 15,730
IBERIABANK Corp. 7,500 482,100
Independent Bank Corp. 3,328 233,992
Independent Bank Corp. 1,700 35,734
Independent Bank Group Inc. 2,200 100,694
International Bancshares Corp. 7,600 261,440
Investar Holding Corp. 800 19,840
Investors Bancorp Inc. 31,724 329,930
Lakeland Bancorp Inc. 6,449 95,510
Lakeland Financial Corp. 650 26,104
LCNB Corp. 1,200 18,180
LegacyTexas Financial Group Inc. 4,000 128,360
Level One Bancorp Inc. 800 17,944
Live Oak Bancshares Inc. 1,300 19,253
Macatawa Bank Corp. 2,600 25,012
MB Financial Inc. 10,129 401,412
MBT Financial Corp. 1,900 17,670
Mercantile Bank Corp. 2,400 67,824
Metropolitan Bank Holding Corp. 700 21,595
Mid Penn Bancorp Inc. 500 11,510
Middlefield Banc Corp. 400 16,972
State Street Global Advisors Trust Company
State Street Russell Small Cap Value® Index Non-Lending Series Fund
Schedule of Investments
(showing percentage of total value of investments)
December 31, 2018
The accompanying notes are an integral part
of these financial statements.
13
Common Stock - 97.7% Shares
Value
($)
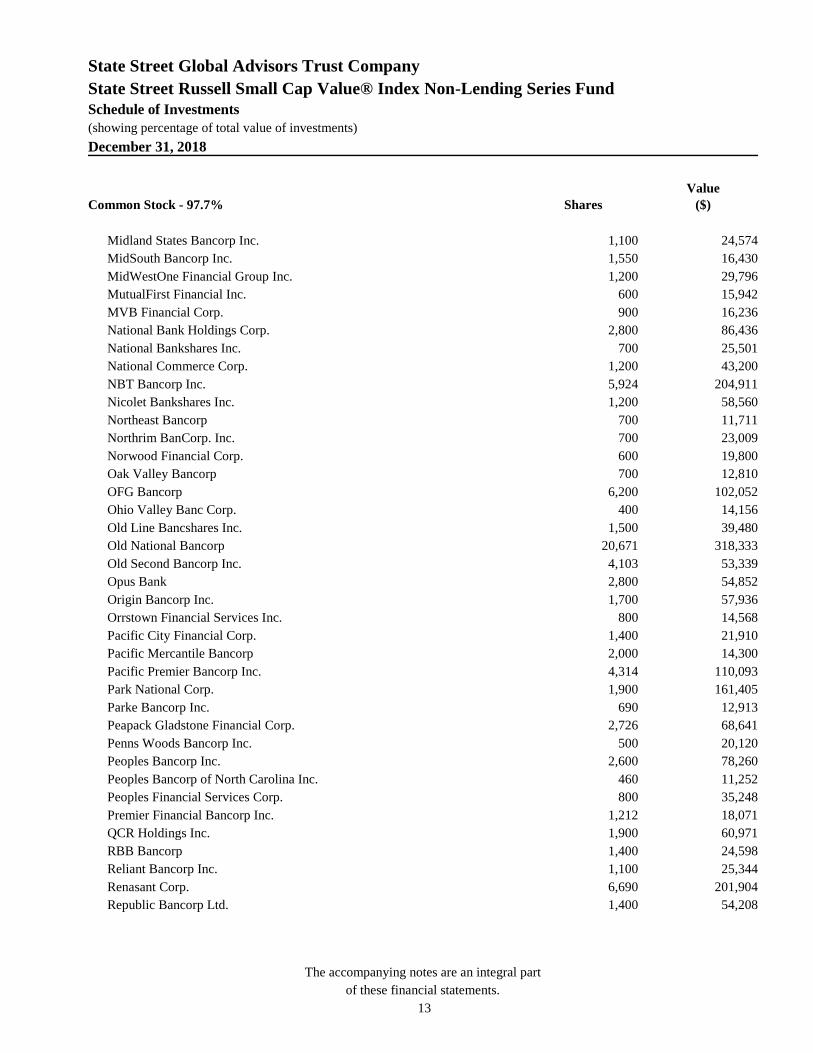
Midland States Bancorp Inc. 1,100 24,574
MidSouth Bancorp Inc. 1,550 16,430
MidWestOne Financial Group Inc. 1,200 29,796
MutualFirst Financial Inc. 600 15,942
MVB Financial Corp. 900 16,236
National Bank Holdings Corp. 2,800 86,436
National Bankshares Inc. 700 25,501
National Commerce Corp. 1,200 43,200
NBT Bancorp Inc. 5,924 204,911
Nicolet Bankshares Inc. 1,200 58,560
Northeast Bancorp 700 11,711
Northrim BanCorp. Inc. 700 23,009
Norwood Financial Corp. 600 19,800
Oak Valley Bancorp 700 12,810
OFG Bancorp 6,200 102,052
Ohio Valley Banc Corp. 400 14,156
Old Line Bancshares Inc. 1,500 39,480
Old National Bancorp 20,671 318,333
Old Second Bancorp Inc. 4,103 53,339
Opus Bank 2,800 54,852
Origin Bancorp Inc. 1,700 57,936
Orrstown Financial Services Inc. 800 14,568
Pacific City Financial Corp. 1,400 21,910
Pacific Mercantile Bancorp 2,000 14,300
Pacific Premier Bancorp Inc. 4,314 110,093
Park National Corp. 1,900 161,405
Parke Bancorp Inc. 690 12,913
Peapack Gladstone Financial Corp. 2,726 68,641
Penns Woods Bancorp Inc. 500 20,120
Peoples Bancorp Inc. 2,600 78,260
Peoples Bancorp of North Carolina Inc. 460 11,252
Peoples Financial Services Corp. 800 35,248
Premier Financial Bancorp Inc. 1,212 18,071
QCR Holdings Inc. 1,900 60,971
RBB Bancorp 1,400 24,598
Reliant Bancorp Inc. 1,100 25,344
Renasant Corp. 6,690 201,904
Republic Bancorp Ltd. 1,400 54,208
State Street Global Advisors Trust Company
State Street Russell Small Cap Value® Index Non-Lending Series Fund
Schedule of Investments
(showing percentage of total value of investments)
December 31, 2018
The accompanying notes are an integral part
of these financial statements.
14
Common Stock - 97.7% Shares
Value
($)
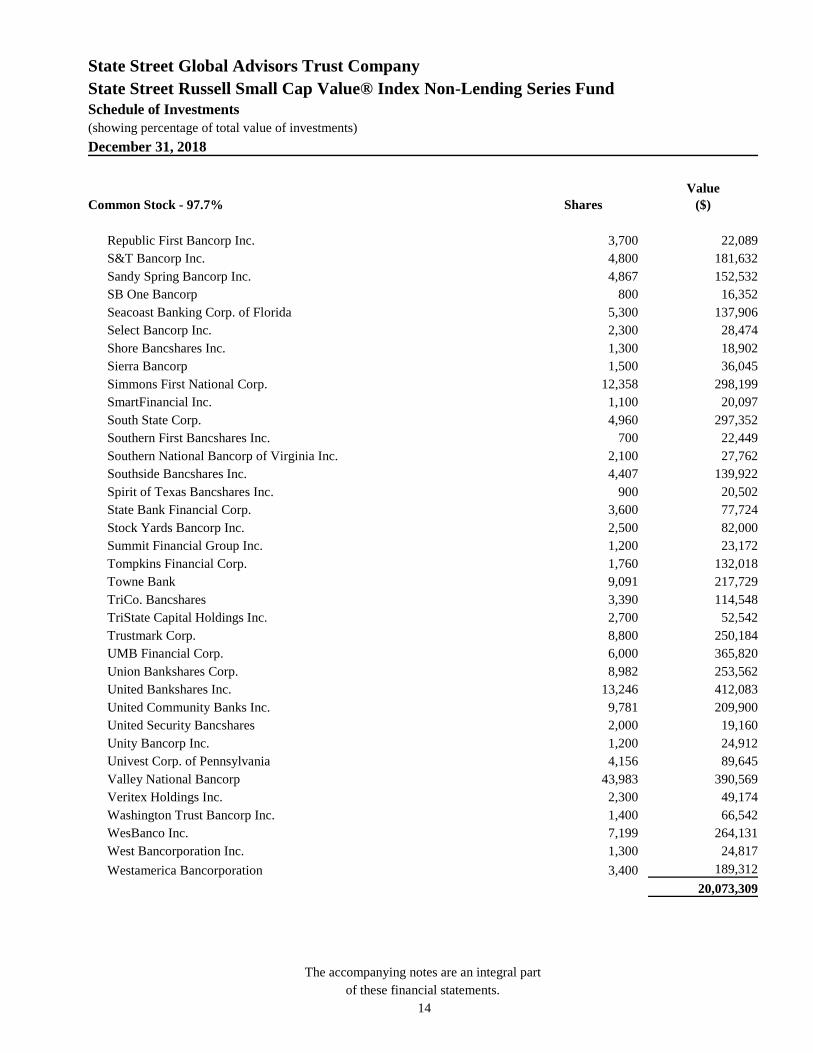
Republic First Bancorp Inc. 3,700 22,089
S&T Bancorp Inc. 4,800 181,632
Sandy Spring Bancorp Inc. 4,867 152,532
SB One Bancorp 800 16,352
Seacoast Banking Corp. of Florida 5,300 137,906
Select Bancorp Inc. 2,300 28,474
Shore Bancshares Inc. 1,300 18,902
Sierra Bancorp 1,500 36,045
Simmons First National Corp. 12,358 298,199
SmartFinancial Inc. 1,100 20,097
South State Corp. 4,960 297,352
Southern First Bancshares Inc. 700 22,449
Southern National Bancorp of Virginia Inc. 2,100 27,762
Southside Bancshares Inc. 4,407 139,922
Spirit of Texas Bancshares Inc. 900 20,502
State Bank Financial Corp. 3,600 77,724
Stock Yards Bancorp Inc. 2,500 82,000
Summit Financial Group Inc. 1,200 23,172
Tompkins Financial Corp. 1,760 132,018
Towne Bank 9,091 217,729
TriCo. Bancshares 3,390 114,548
TriState Capital Holdings Inc. 2,700 52,542
Trustmark Corp. 8,800 250,184
UMB Financial Corp. 6,000 365,820
Union Bankshares Corp. 8,982 253,562
United Bankshares Inc. 13,246 412,083
United Community Banks Inc. 9,781 209,900
United Security Bancshares 2,000 19,160
Unity Bancorp Inc. 1,200 24,912
Univest Corp. of Pennsylvania 4,156 89,645
Valley National Bancorp 43,983 390,569
Veritex Holdings Inc. 2,300 49,174
Washington Trust Bancorp Inc. 1,400 66,542
WesBanco Inc. 7,199 264,131
West Bancorporation Inc. 1,300 24,817
Westamerica Bancorporation 3,400 189,312
20,073,309

State Street Global Advisors Trust Company
State Street Russell Small Cap Value® Index Non-Lending Series Fund
Schedule of Investments
(showing percentage of total value of investments)
December 31, 2018
The accompanying notes are an integral part
of these financial statements.
15
Common Stock - 97.7% Shares
Value
($)
Beverages - 0.0%
MGP Ingredients Inc. 200 11,410
Biotechnology - 0.8%
Abeona Therapeutics Inc. 400 2,856
Acceleron Pharma Inc. 700 30,485
Achillion Pharmaceuticals Inc. 14,400 22,896
Acorda Therapeutics Inc. 5,400 84,132
Adamas Pharmaceuticals Inc. 1,100 9,394
Adverum Biotechnologies Inc. 5,300 16,695
AgeX Therapeutics Inc. 690 2,063
Albireo Pharma Inc. 700 17,171
Alder Biopharmaceuticals Inc. 1,200 12,300
Allogene Therapeutics Inc. 600 16,158
AMAG Pharmaceuticals Inc. 5,000 75,950
Arbutus Biopharma Corp. 2,700 10,341
Arcus Biosciences Inc. 1,500 16,155
Ardelyx Inc. 3,500 6,265
Arena Pharmaceuticals Inc. 1,400 54,530
Audentes Therapeutics Inc. 300 6,396
AVEO Pharmaceuticals Inc. 4,400 7,040
Bellicum Pharmaceuticals Inc. 900 2,628
BioCryst Pharmaceuticals Inc. 1,800 14,526
BioTime Inc. 6,900 6,300
Calithera Biosciences Inc. 3,300 13,233
Cara Therapeutics Inc. 600 7,800
Catalyst Biosciences Inc. 1,700 13,413
Chimerix Inc. 4,700 12,079
Concert Pharmaceuticals Inc. 2,300 28,865
Corvus Pharmaceuticals Inc. 200 734
Dynavax Technologies Corp. 1,000 9,150
Epizyme Inc. 1,500 9,240
Five Prime Therapeutics Inc. 3,500 32,550
Immune Design Corp. 2,300 2,990
Immunomedics Inc. 1,300 18,551
Karyopharm Therapeutics Inc. 700 6,559
Myriad Genetics Inc. 800 23,256
State Street Global Advisors Trust Company
State Street Russell Small Cap Value® Index Non-Lending Series Fund
Schedule of Investments
(showing percentage of total value of investments)
December 31, 2018
The accompanying notes are an integral part
of these financial statements.
16
Common Stock - 97.7% Shares
Value
($)
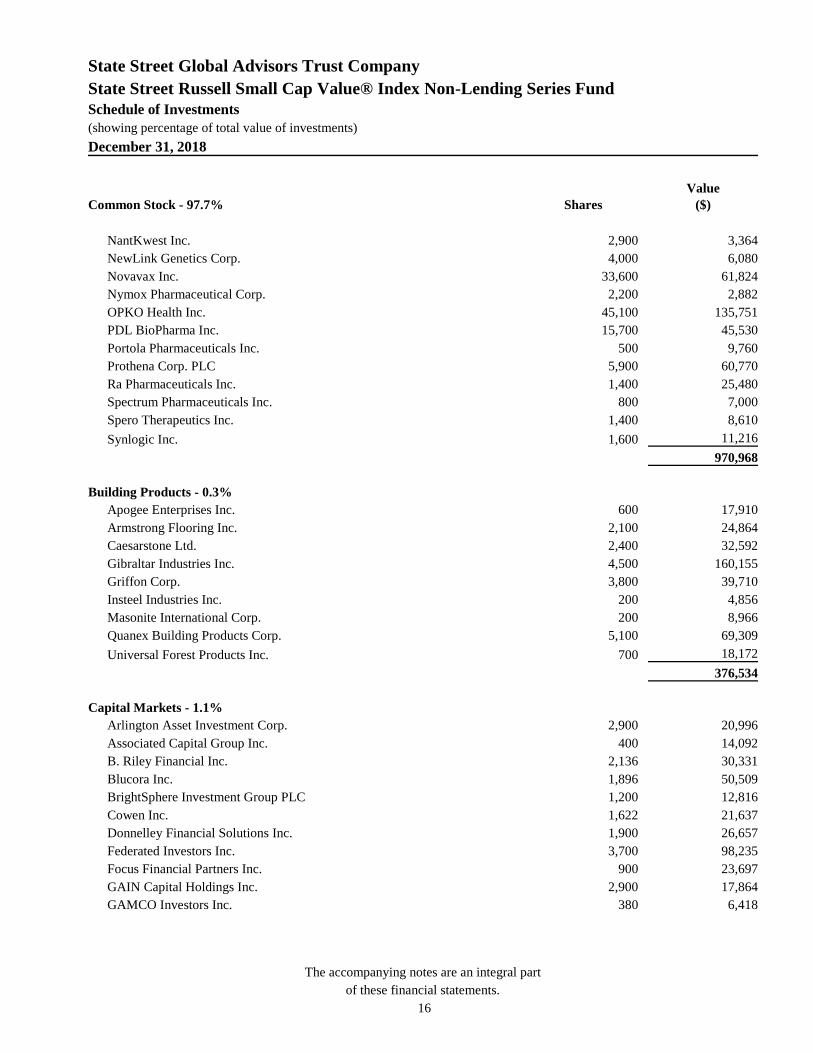
NantKwest Inc. 2,900 3,364
NewLink Genetics Corp. 4,000 6,080
Novavax Inc. 33,600 61,824
Nymox Pharmaceutical Corp. 2,200 2,882
OPKO Health Inc. 45,100 135,751
PDL BioPharma Inc. 15,700 45,530
Portola Pharmaceuticals Inc. 500 9,760
Prothena Corp. PLC 5,900 60,770
Ra Pharmaceuticals Inc. 1,400 25,480
Spectrum Pharmaceuticals Inc. 800 7,000
Spero Therapeutics Inc. 1,400 8,610
Synlogic Inc. 1,600 11,216
970,968
Building Products - 0.3%
Apogee Enterprises Inc. 600 17,910
Armstrong Flooring Inc. 2,100 24,864
Caesarstone Ltd. 2,400 32,592
Gibraltar Industries Inc. 4,500 160,155
Griffon Corp. 3,800 39,710
Insteel Industries Inc. 200 4,856
Masonite International Corp. 200 8,966
Quanex Building Products Corp. 5,100 69,309
Universal Forest Products Inc. 700 18,172
376,534
Capital Markets - 1.1%
Arlington Asset Investment Corp. 2,900 20,996
Associated Capital Group Inc. 400 14,092
B. Riley Financial Inc. 2,136 30,331
Blucora Inc. 1,896 50,509
BrightSphere Investment Group PLC 1,200 12,816
Cowen Inc. 1,622 21,637
Donnelley Financial Solutions Inc. 1,900 26,657
Federated Investors Inc. 3,700 98,235
Focus Financial Partners Inc. 900 23,697
GAIN Capital Holdings Inc. 2,900 17,864
GAMCO Investors Inc. 380 6,418
State Street Global Advisors Trust Company
State Street Russell Small Cap Value® Index Non-Lending Series Fund
Schedule of Investments
(showing percentage of total value of investments)
December 31, 2018
The accompanying notes are an integral part
of these financial statements.
17
Common Stock - 97.7% Shares
Value
($)
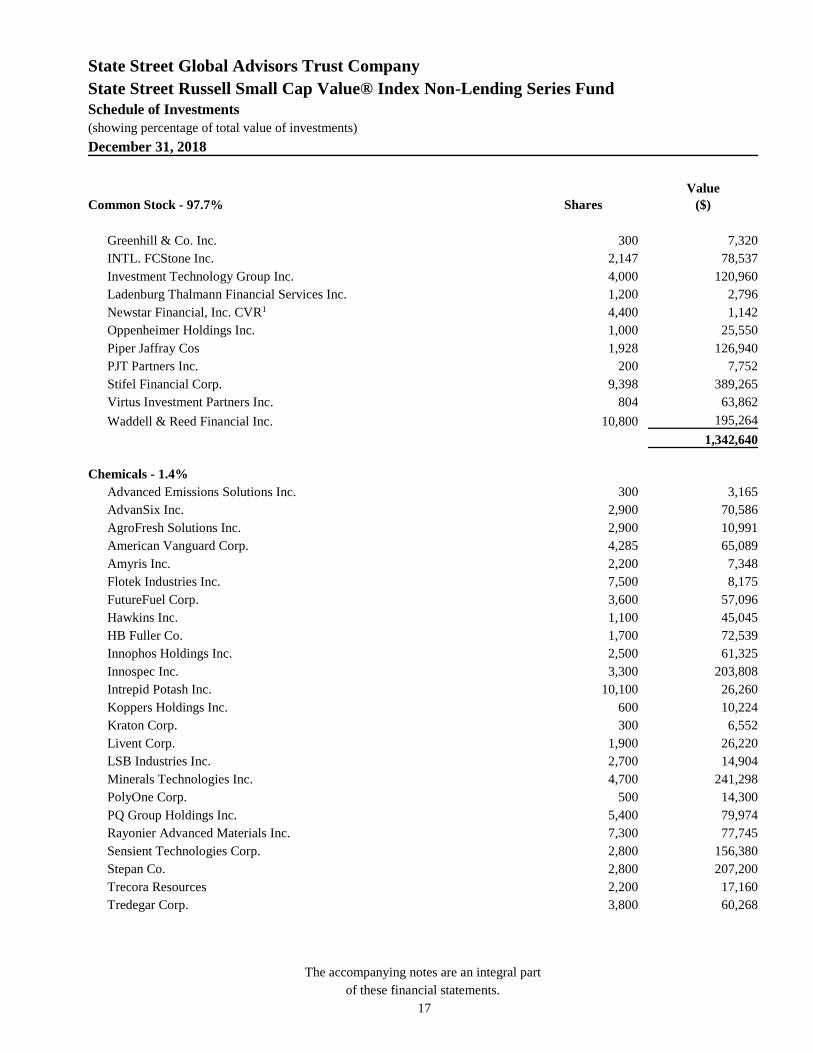
Greenhill & Co. Inc. 300 7,320
INTL. FCStone Inc. 2,147 78,537
Investment Technology Group Inc. 4,000 120,960
Ladenburg Thalmann Financial Services Inc. 1,200 2,796
Newstar Financial, Inc. CVR1 4,400 1,142
Oppenheimer Holdings Inc. 1,000 25,550
Piper Jaffray Cos 1,928 126,940
PJT Partners Inc. 200 7,752
Stifel Financial Corp. 9,398 389,265
Virtus Investment Partners Inc. 804 63,862
Waddell & Reed Financial Inc. 10,800 195,264
1,342,640
Chemicals - 1.4%
Advanced Emissions Solutions Inc. 300 3,165
AdvanSix Inc. 2,900 70,586
AgroFresh Solutions Inc. 2,900 10,991
American Vanguard Corp. 4,285 65,089
Amyris Inc. 2,200 7,348
Flotek Industries Inc. 7,500 8,175
FutureFuel Corp. 3,600 57,096
Hawkins Inc. 1,100 45,045
HB Fuller Co. 1,700 72,539
Innophos Holdings Inc. 2,500 61,325
Innospec Inc. 3,300 203,808
Intrepid Potash Inc. 10,100 26,260
Koppers Holdings Inc. 600 10,224
Kraton Corp. 300 6,552
Livent Corp. 1,900 26,220
LSB Industries Inc. 2,700 14,904
Minerals Technologies Inc. 4,700 241,298
PolyOne Corp. 500 14,300
PQ Group Holdings Inc. 5,400 79,974
Rayonier Advanced Materials Inc. 7,300 77,745
Sensient Technologies Corp. 2,800 156,380
Stepan Co. 2,800 207,200
Trecora Resources 2,200 17,160
Tredegar Corp. 3,800 60,268
State Street Global Advisors Trust Company
State Street Russell Small Cap Value® Index Non-Lending Series Fund
Schedule of Investments
(showing percentage of total value of investments)
December 31, 2018
The accompanying notes are an integral part
of these financial statements.
18
Common Stock - 97.7% Shares
Value
($)
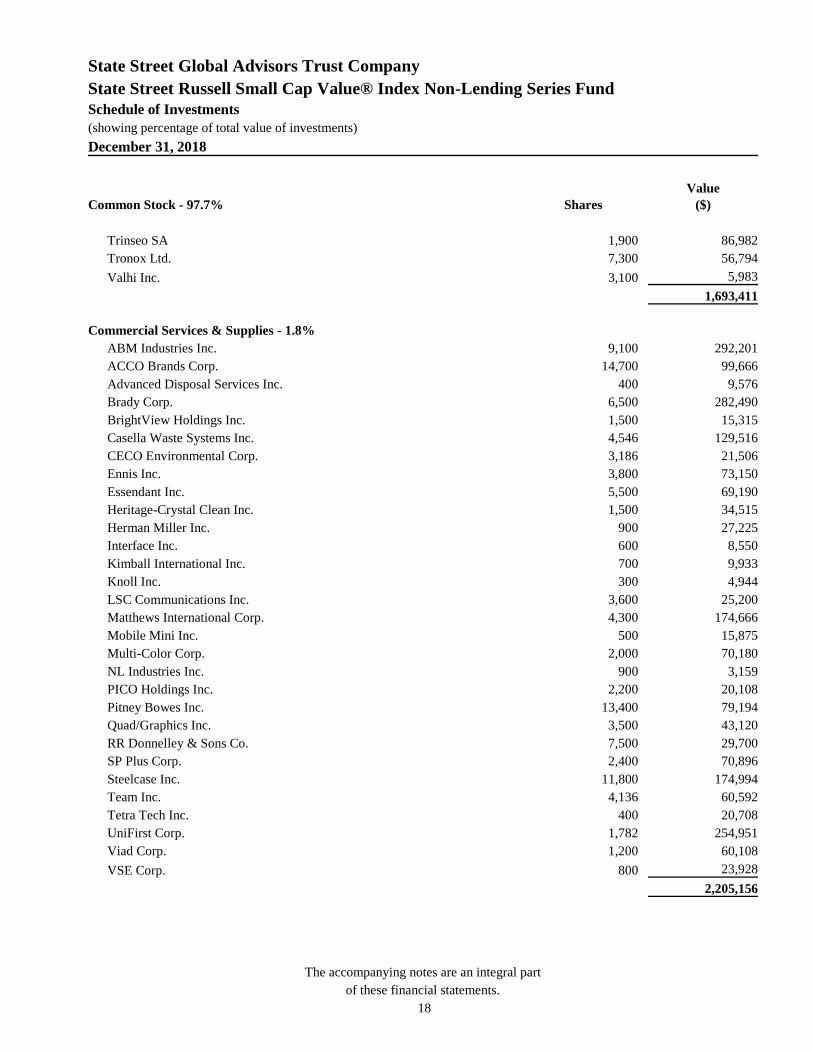
Trinseo SA 1,900 86,982
Tronox Ltd. 7,300 56,794
Valhi Inc. 3,100 5,983
1,693,411
Commercial Services & Supplies - 1.8%
ABM Industries Inc. 9,100 292,201
ACCO Brands Corp. 14,700 99,666
Advanced Disposal Services Inc. 400 9,576
Brady Corp. 6,500 282,490
BrightView Holdings Inc. 1,500 15,315
Casella Waste Systems Inc. 4,546 129,516
CECO Environmental Corp. 3,186 21,506
Ennis Inc. 3,800 73,150
Essendant Inc. 5,500 69,190
Heritage-Crystal Clean Inc. 1,500 34,515
Herman Miller Inc. 900 27,225
Interface Inc. 600 8,550
Kimball International Inc. 700 9,933
Knoll Inc. 300 4,944
LSC Communications Inc. 3,600 25,200
Matthews International Corp. 4,300 174,666
Mobile Mini Inc. 500 15,875
Multi-Color Corp. 2,000 70,180
NL Industries Inc. 900 3,159
PICO Holdings Inc. 2,200 20,108
Pitney Bowes Inc. 13,400 79,194
Quad/Graphics Inc. 3,500 43,120
RR Donnelley & Sons Co. 7,500 29,700
SP Plus Corp. 2,400 70,896
Steelcase Inc. 11,800 174,994
Team Inc. 4,136 60,592
Tetra Tech Inc. 400 20,708
UniFirst Corp. 1,782 254,951
Viad Corp. 1,200 60,108
VSE Corp. 800 23,928
2,205,156
State Street Global Advisors Trust Company
State Street Russell Small Cap Value® Index Non-Lending Series Fund
Schedule of Investments
(showing percentage of total value of investments)
December 31, 2018
The accompanying notes are an integral part
of these financial statements.
19
Common Stock - 97.7% Shares
Value
($)
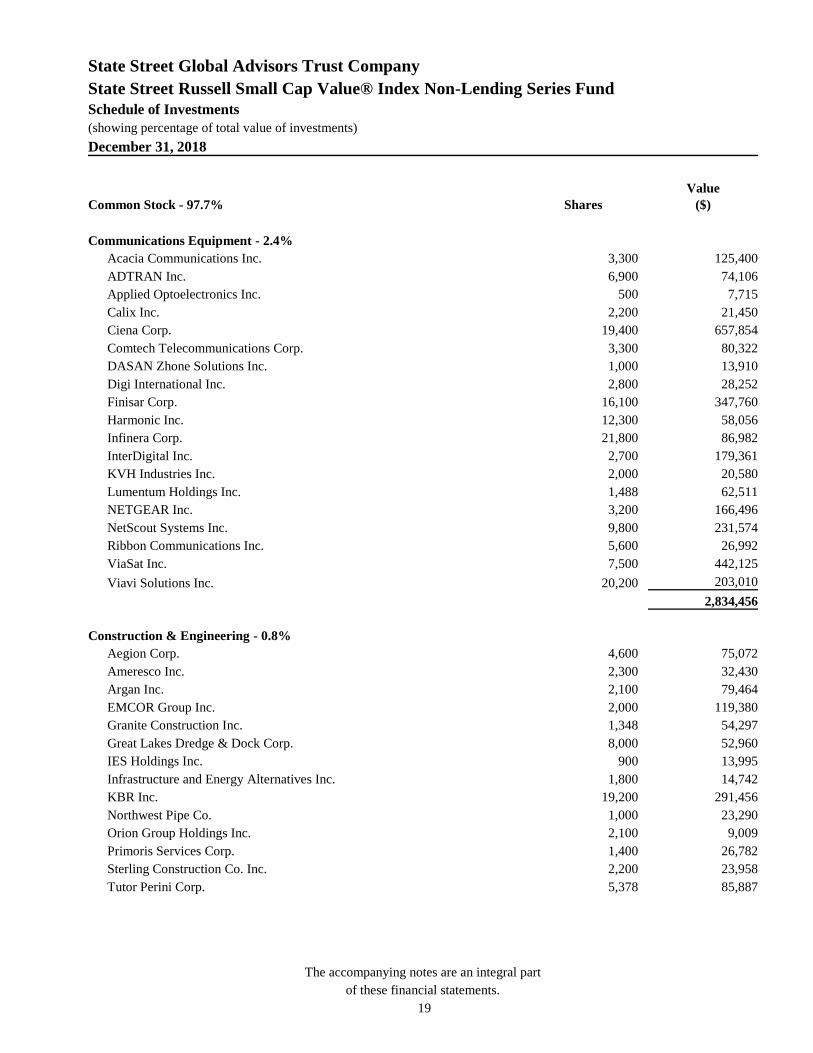
Communications Equipment - 2.4%
Acacia Communications Inc. 3,300 125,400
ADTRAN Inc. 6,900 74,106
Applied Optoelectronics Inc. 500 7,715
Calix Inc. 2,200 21,450
Ciena Corp. 19,400 657,854
Comtech Telecommunications Corp. 3,300 80,322
DASAN Zhone Solutions Inc. 1,000 13,910
Digi International Inc. 2,800 28,252
Finisar Corp. 16,100 347,760
Harmonic Inc. 12,300 58,056
Infinera Corp. 21,800 86,982
InterDigital Inc. 2,700 179,361
KVH Industries Inc. 2,000 20,580
Lumentum Holdings Inc. 1,488 62,511
NETGEAR Inc. 3,200 166,496
NetScout Systems Inc. 9,800 231,574
Ribbon Communications Inc. 5,600 26,992
ViaSat Inc. 7,500 442,125
Viavi Solutions Inc. 20,200 203,010
2,834,456
Construction & Engineering - 0.8%
Aegion Corp. 4,600 75,072
Ameresco Inc. 2,300 32,430
Argan Inc. 2,100 79,464
EMCOR Group Inc. 2,000 119,380
Granite Construction Inc. 1,348 54,297
Great Lakes Dredge & Dock Corp. 8,000 52,960
IES Holdings Inc. 900 13,995
Infrastructure and Energy Alternatives Inc. 1,800 14,742
KBR Inc. 19,200 291,456
Northwest Pipe Co. 1,000 23,290
Orion Group Holdings Inc. 2,100 9,009
Primoris Services Corp. 1,400 26,782
Sterling Construction Co. Inc. 2,200 23,958
Tutor Perini Corp. 5,378 85,887

State Street Global Advisors Trust Company
State Street Russell Small Cap Value® Index Non-Lending Series Fund
Schedule of Investments
(showing percentage of total value of investments)
December 31, 2018
The accompanying notes are an integral part
of these financial statements.
20
Common Stock - 97.7% Shares
Value
($)
Willscot Corp. 1,100 10,362
913,084
Construction Materials - 0.0%
United States Lime & Minerals Inc. 200 14,200
Consumer Finance - 0.5%
Encore Capital Group Inc. 3,738 87,843
EZCORP Inc. 7,500 57,975
LendingClub Corp. 44,300 116,509
Nelnet Inc. 2,600 136,084
PRA Group Inc. 6,200 151,094
Regional Management Corp. 500 12,025
World Acceptance Corp. 800 81,808
643,338
Containers & Packaging - 0.1%
Greif Inc. 3,300 122,463
Greif Inc. 500 22,200
UFP Technologies Inc. 800 24,032
168,695
Distributors - 0.1%
Core-Mark Holding Co. Inc. 5,800 134,850
Weyco Group Inc. 700 20,419
155,269
Diversified Consumer Services - 0.8%
Adtalem Global Education Inc. 7,700 364,364
American Public Education Inc. 2,200 62,612
Carriage Services Inc. 1,000 15,500
Houghton Mifflin Harcourt Co. 13,600 120,496
K12 Inc. 5,200 128,908
Laureate Education Inc. 12,900 196,596
Regis Corp. 4,400 74,580
Strategic Education Inc. 87 9,868

State Street Global Advisors Trust Company
State Street Russell Small Cap Value® Index Non-Lending Series Fund
Schedule of Investments
(showing percentage of total value of investments)
December 31, 2018
The accompanying notes are an integral part
of these financial statements.
21
Common Stock - 97.7% Shares
Value
($)
Weight Watchers International Inc. 200 7,710
980,634
Diversified Financial Services - 0.3%
Banco Latinoamericano de Comercio Exterior SA 4,500 77,850
Cannae Holdings Inc. 9,600 164,352
FGL Holdings 19,900 132,534
Marlin Business Services Corp. 600 13,398
On Deck Capital Inc. 1,000 5,900
394,034
Diversified Telecommunication Services - 0.6%
ATN International Inc. 1,500 107,295
Cincinnati Bell Inc. 6,642 51,675
Consolidated Communications Holdings Inc. 9,909 97,901
Frontier Communications Corp. 10,946 26,051
Intelsat SA 7,600 162,564
Iridium Communications Inc. 13,200 243,540
pdvWireless Inc. 1,000 37,390
Windstream Holdings Inc. 4,340 9,071
735,487
Electric Utilities - 2.5%
ALLETE Inc. 6,900 525,918
El Paso Electric Co. 5,500 275,715
IDACORP Inc. 6,800 632,808
MGE Energy Inc. 4,750 284,810
Otter Tail Corp. 5,400 268,056
PNM Resources Inc. 10,800 443,772
Portland General Electric Co. 11,955 548,137
2,979,216
Electrical Equipment - 0.6%
AZZ Inc. 2,500 100,900
Babcock & Wilcox Enterprises Inc. 4,680 1,827
Encore Wire Corp. 2,700 135,486
EnerSys 2,000 155,220
Enphase Energy Inc. 11,200 52,976
State Street Global Advisors Trust Company
State Street Russell Small Cap Value® Index Non-Lending Series Fund
Schedule of Investments
(showing percentage of total value of investments)
December 31, 2018
The accompanying notes are an integral part
of these financial statements.
22
Common Stock - 97.7% Shares
Value
($)
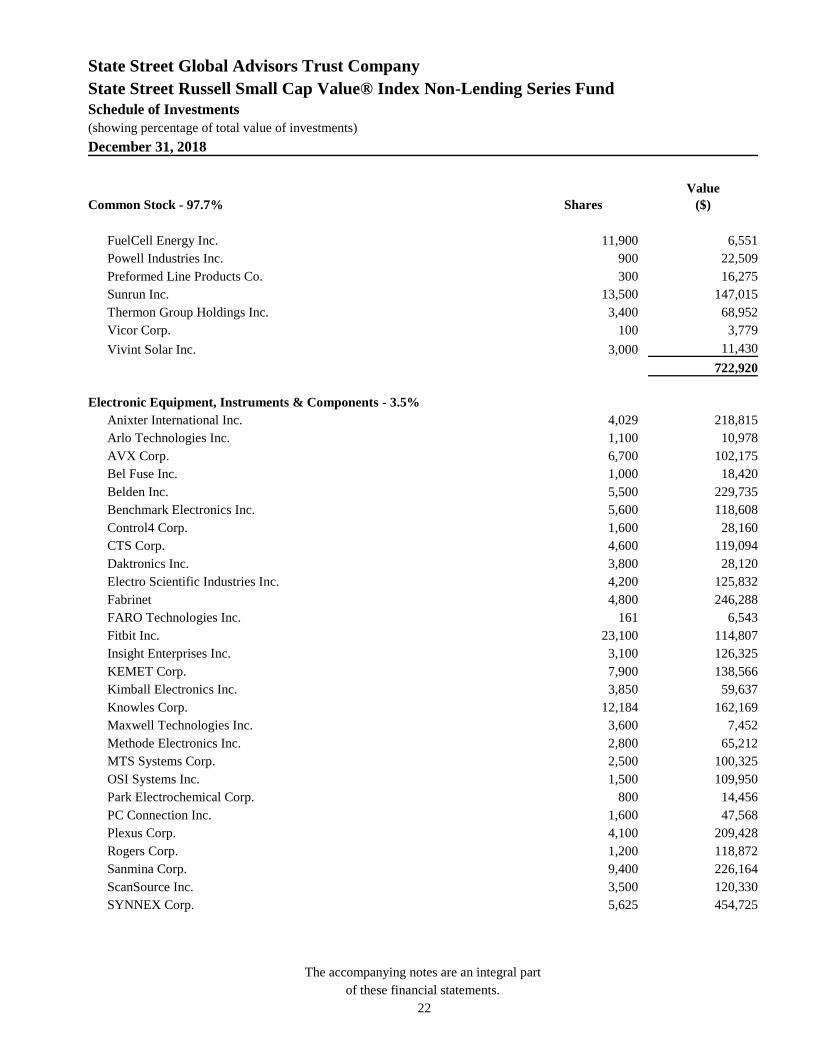
FuelCell Energy Inc. 11,900 6,551
Powell Industries Inc. 900 22,509
Preformed Line Products Co. 300 16,275
Sunrun Inc. 13,500 147,015
Thermon Group Holdings Inc. 3,400 68,952
Vicor Corp. 100 3,779
Vivint Solar Inc. 3,000 11,430
722,920
Electronic Equipment, Instruments & Components - 3.5%
Anixter International Inc. 4,029 218,815
Arlo Technologies Inc. 1,100 10,978
AVX Corp. 6,700 102,175
Bel Fuse Inc. 1,000 18,420
Belden Inc. 5,500 229,735
Benchmark Electronics Inc. 5,600 118,608
Control4 Corp. 1,600 28,160
CTS Corp. 4,600 119,094
Daktronics Inc. 3,800 28,120
Electro Scientific Industries Inc. 4,200 125,832
Fabrinet 4,800 246,288
FARO Technologies Inc. 161 6,543
Fitbit Inc. 23,100 114,807
Insight Enterprises Inc. 3,100 126,325
KEMET Corp. 7,900 138,566
Kimball Electronics Inc. 3,850 59,637
Knowles Corp. 12,184 162,169
Maxwell Technologies Inc. 3,600 7,452
Methode Electronics Inc. 2,800 65,212
MTS Systems Corp. 2,500 100,325
OSI Systems Inc. 1,500 109,950
Park Electrochemical Corp. 800 14,456
PC Connection Inc. 1,600 47,568
Plexus Corp. 4,100 209,428
Rogers Corp. 1,200 118,872
Sanmina Corp. 9,400 226,164
ScanSource Inc. 3,500 120,330
SYNNEX Corp. 5,625 454,725

State Street Global Advisors Trust Company
State Street Russell Small Cap Value® Index Non-Lending Series Fund
Schedule of Investments
(showing percentage of total value of investments)
December 31, 2018
The accompanying notes are an integral part
of these financial statements.
23
Common Stock - 97.7% Shares
Value
($)
Tech Data Corp. 5,200 425,412
TTM Technologies Inc. 13,141 127,862
Vishay Intertechnology Inc. 18,100 325,981
Vishay Precision Group Inc. 300 9,069
4,217,078
Energy Equipment & Services - 1.9%
Archrock Inc. 17,700 132,573
Basic Energy Services Inc. 2,000 7,680
Bristow Group Inc. 3,400 8,262
C&J Energy Services Inc. 8,300 112,050
CARBO Ceramics Inc. 2,200 7,656
Dawson Geophysical Co. 2,200 7,436
Diamond Offshore Drilling Inc. 9,200 86,848
Dril-Quip Inc. 4,600 138,138
Era Group Inc. 2,500 21,850
Exterran Corp. 4,650 82,305
Forum Energy Technologies Inc. 11,693 48,292
Frank's International NV 10,700 55,854
FTS International Inc. 4,900 34,839
Helix Energy Solutions Group Inc. 19,700 106,577
Independence Contract Drilling Inc. 2,300 7,176
Keane Group Inc. 300 2,454
KLX Energy Services Holdings Inc. 2,960 69,412
Matrix Service Co. 3,800 68,172
McDermott International Inc. 24,823 162,342
Natural Gas Services Group Inc. 1,300 21,372
NCS Multistage Holdings Inc. 1,000 5,090
Newpark Resources Inc. 12,800 87,936
Nine Energy Service Inc. 2,200 49,588
Noble Corp. PLC 34,600 90,652
Oceaneering International Inc. 13,600 164,560
Oil States International Inc. 8,300 118,524
PHI Inc. 1,400 2,590
Pioneer Energy Services Corp. 7,400 9,102
RigNet Inc. 1,400 17,696
Rowan Cos PLC 17,500 146,825
SEACOR Holdings Inc. 2,400 88,800

State Street Global Advisors Trust Company
State Street Russell Small Cap Value® Index Non-Lending Series Fund
Schedule of Investments
(showing percentage of total value of investments)
December 31, 2018
The accompanying notes are an integral part
of these financial statements.
24
Common Stock - 97.7% Shares
Value
($)
SEACOR Marine Holdings Inc. 1,711 20,121
Select Energy Services Inc. 3,700 23,384
Smart Sand Inc. 3,300 7,326
Superior Energy Services Inc. 21,400 71,690
TETRA Technologies Inc. 2,300 3,864
Tidewater Inc. 4,050 77,477
Unit Corp. 7,300 104,244
US Silica Holdings Inc. 3,300 33,594
2,304,351
Entertainment - 0.2%
AMC Entertainment Holdings Inc. 7,391 90,761
Eros International PLC 1,700 14,093
Marcus Corp. 2,500 98,750
Reading International Inc. 1,600 23,264
Rosetta Stone Inc. 1,700 27,880
254,748
Food & Staples Retailing - 0.5%
Andersons Inc. 3,850 115,077
BJ's Wholesale Club Holdings Inc. 4,400 97,504
Ingles Markets Inc. 2,100 57,162
Natural Grocers by Vitamin Cottage Inc. 1,200 18,396
Rite Aid Corp. 146,400 103,695
Smart & Final Stores Inc. 2,400 11,376
SpartanNash Co. 5,120 87,962
United Natural Foods Inc. 7,100 75,189
Village Super Market Inc. 1,000 26,740
Weis Markets Inc. 1,400 66,892
659,993
Food Products - 1.5%
Alico Inc. 300 8,850
B&G Foods Inc. 8,100 234,171
Cal-Maine Foods Inc. 2,600 109,980
Darling Ingredients Inc. 22,265 428,379
Dean Foods Co. 13,400 51,054
Farmer Brothers Co. 1,100 25,663

State Street Global Advisors Trust Company
State Street Russell Small Cap Value® Index Non-Lending Series Fund
Schedule of Investments
(showing percentage of total value of investments)
December 31, 2018
The accompanying notes are an integral part
of these financial statements.
25
Common Stock - 97.7% Shares
Value
($)
Fresh Del Monte Produce Inc. 4,340 122,692
Hostess Brands Inc. 13,900 152,066
Lancaster Colony Corp. 700 123,802
Landec Corp. 2,900 34,336
Limoneira Co. 900 17,595
Sanderson Farms Inc. 2,800 278,012
Seneca Foods Corp. 700 19,754
Simply Good Foods Co. 8,400 158,760
Tootsie Roll Industries Inc. 2,024 67,602
1,832,716
Gas Utilities - 2.3%
Chesapeake Utilities Corp. 1,893 153,901
New Jersey Resources Corp. 10,700 488,669
Northwest Natural Holding Co. 3,900 235,794
ONE Gas Inc. 6,913 550,275
RGC Resources Inc. 600 17,976
South Jersey Industries Inc. 10,000 278,000
Southwest Gas Holdings Inc. 6,493 496,715
Spire Inc. 6,700 496,336
2,717,666
Health Care Equipment & Services - 0.0%
R1 RCM Inc. 1,500 11,925
Health Care Equipment & Supplies - 0.8%
AngioDynamics Inc. 5,200 104,676
Anika Therapeutics Inc. 1,800 60,498
Avanos Medical Inc. 6,400 286,656
Cerus Corp. 1,800 9,126
CONMED Corp. 2,200 141,240
CryoLife Inc. 1,200 34,056
FONAR Corp. 500 10,120
Integer Holdings Corp. 1,200 91,512
Invacare Corp. 3,500 15,050
LivaNova PLC 1,400 128,058
Meridian Bioscience Inc. 585 10,156
State Street Global Advisors Trust Company
State Street Russell Small Cap Value® Index Non-Lending Series Fund
Schedule of Investments
(showing percentage of total value of investments)
December 31, 2018
The accompanying notes are an integral part
of these financial statements.
26
Common Stock - 97.7% Shares
Value
($)
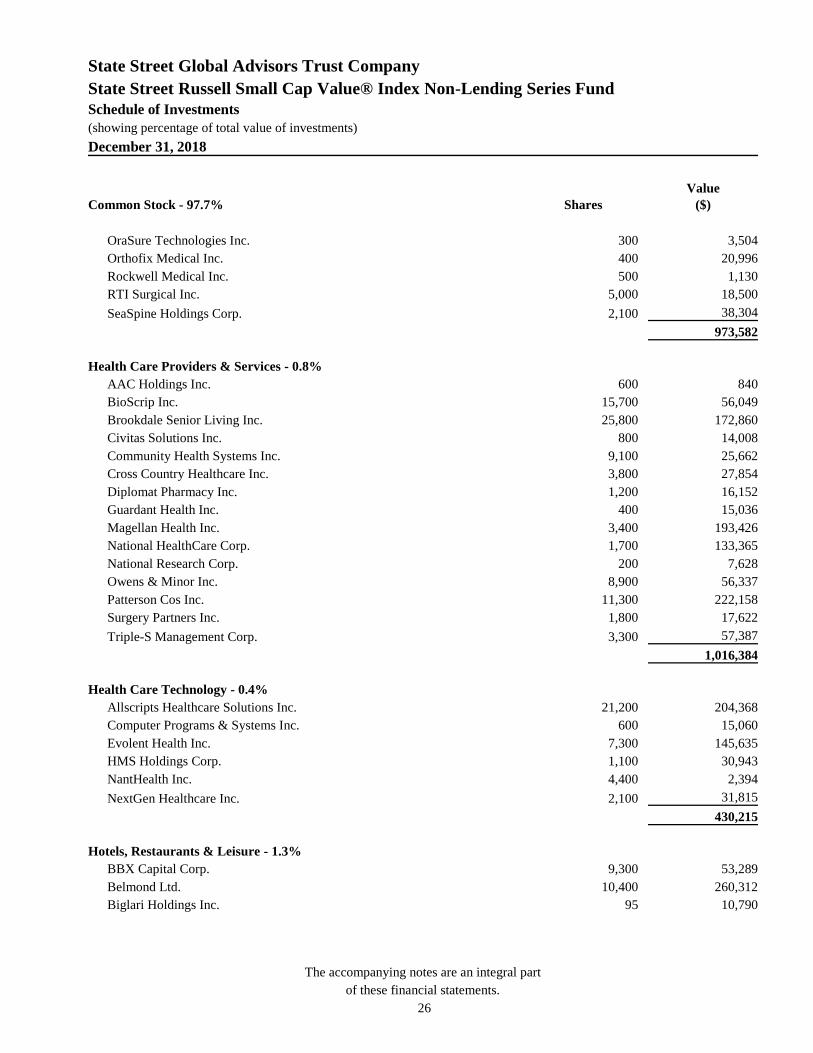
OraSure Technologies Inc. 300 3,504
Orthofix Medical Inc. 400 20,996
Rockwell Medical Inc. 500 1,130
RTI Surgical Inc. 5,000 18,500
SeaSpine Holdings Corp. 2,100 38,304
973,582
Health Care Providers & Services - 0.8%
AAC Holdings Inc. 600 840
BioScrip Inc. 15,700 56,049
Brookdale Senior Living Inc. 25,800 172,860
Civitas Solutions Inc. 800 14,008
Community Health Systems Inc. 9,100 25,662
Cross Country Healthcare Inc. 3,800 27,854
Diplomat Pharmacy Inc. 1,200 16,152
Guardant Health Inc. 400 15,036
Magellan Health Inc. 3,400 193,426
National HealthCare Corp. 1,700 133,365
National Research Corp. 200 7,628
Owens & Minor Inc. 8,900 56,337
Patterson Cos Inc. 11,300 222,158
Surgery Partners Inc. 1,800 17,622
Triple-S Management Corp. 3,300 57,387
1,016,384
Health Care Technology - 0.4%
Allscripts Healthcare Solutions Inc. 21,200 204,368
Computer Programs & Systems Inc. 600 15,060
Evolent Health Inc. 7,300 145,635
HMS Holdings Corp. 1,100 30,943
NantHealth Inc. 4,400 2,394
NextGen Healthcare Inc. 2,100 31,815
430,215
Hotels, Restaurants & Leisure - 1.3%
BBX Capital Corp. 9,300 53,289
Belmond Ltd. 10,400 260,312
Biglari Holdings Inc. 95 10,790
State Street Global Advisors Trust Company
State Street Russell Small Cap Value® Index Non-Lending Series Fund
Schedule of Investments
(showing percentage of total value of investments)
December 31, 2018
The accompanying notes are an integral part
of these financial statements.
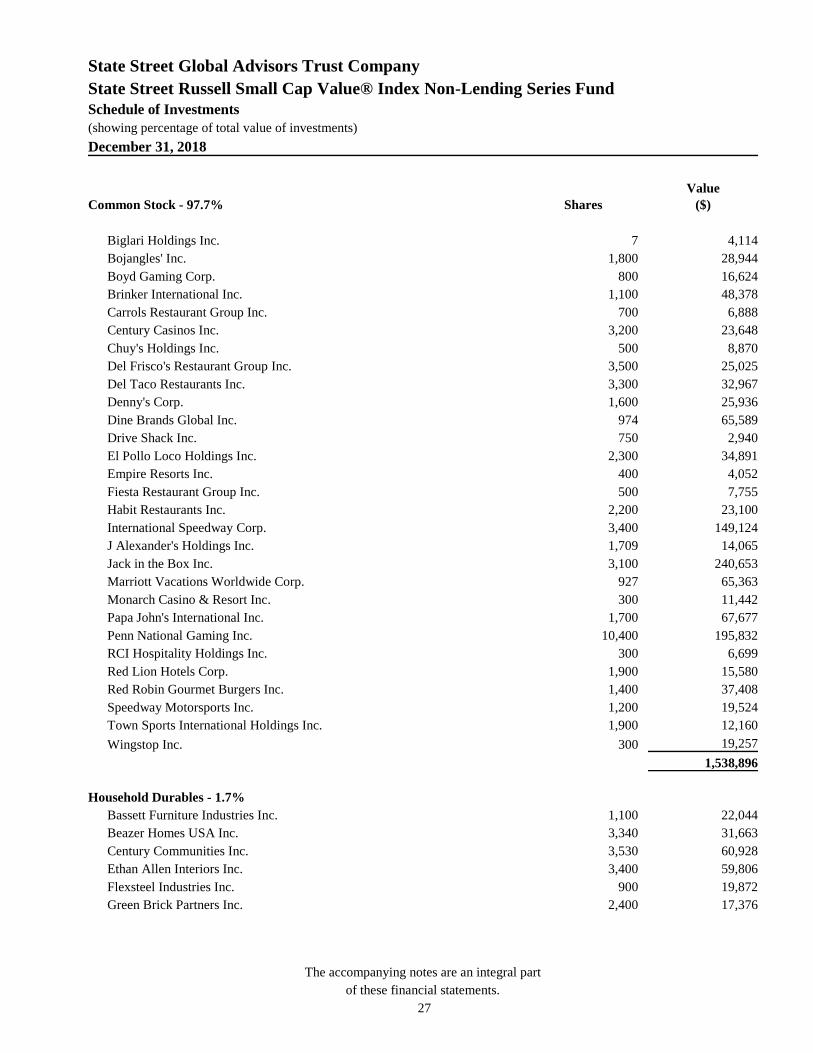
27
Common Stock - 97.7% Shares
Value
($)
Biglari Holdings Inc. 7 4,114
Bojangles' Inc. 1,800 28,944
Boyd Gaming Corp. 800 16,624
Brinker International Inc. 1,100 48,378
Carrols Restaurant Group Inc. 700 6,888
Century Casinos Inc. 3,200 23,648
Chuy's Holdings Inc. 500 8,870
Del Frisco's Restaurant Group Inc. 3,500 25,025
Del Taco Restaurants Inc. 3,300 32,967
Denny's Corp. 1,600 25,936
Dine Brands Global Inc. 974 65,589
Drive Shack Inc. 750 2,940
El Pollo Loco Holdings Inc. 2,300 34,891
Empire Resorts Inc. 400 4,052
Fiesta Restaurant Group Inc. 500 7,755
Habit Restaurants Inc. 2,200 23,100
International Speedway Corp. 3,400 149,124
J Alexander's Holdings Inc. 1,709 14,065
Jack in the Box Inc. 3,100 240,653
Marriott Vacations Worldwide Corp. 927 65,363
Monarch Casino & Resort Inc. 300 11,442
Papa John's International Inc. 1,700 67,677
Penn National Gaming Inc. 10,400 195,832
RCI Hospitality Holdings Inc. 300 6,699
Red Lion Hotels Corp. 1,900 15,580
Red Robin Gourmet Burgers Inc. 1,400 37,408
Speedway Motorsports Inc. 1,200 19,524
Town Sports International Holdings Inc. 1,900 12,160
Wingstop Inc. 300 19,257
1,538,896
Household Durables - 1.7%
Bassett Furniture Industries Inc. 1,100 22,044
Beazer Homes USA Inc. 3,340 31,663
Century Communities Inc. 3,530 60,928
Ethan Allen Interiors Inc. 3,400 59,806
Flexsteel Industries Inc. 900 19,872
Green Brick Partners Inc. 2,400 17,376
State Street Global Advisors Trust Company
State Street Russell Small Cap Value® Index Non-Lending Series Fund
Schedule of Investments
(showing percentage of total value of investments)
December 31, 2018
The accompanying notes are an integral part
of these financial statements.
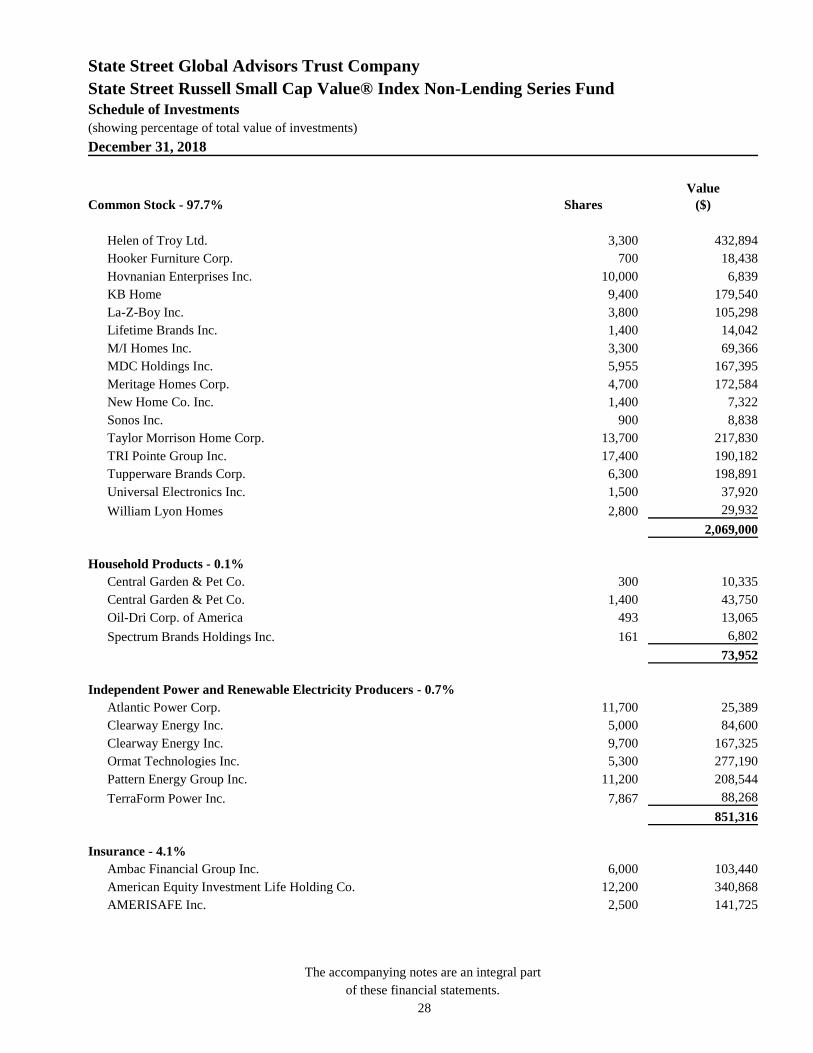
28
Common Stock - 97.7% Shares
Value
($)
Helen of Troy Ltd. 3,300 432,894
Hooker Furniture Corp. 700 18,438
Hovnanian Enterprises Inc. 10,000 6,839
KB Home 9,400 179,540
La-Z-Boy Inc. 3,800 105,298
Lifetime Brands Inc. 1,400 14,042
M/I Homes Inc. 3,300 69,366
MDC Holdings Inc. 5,955 167,395
Meritage Homes Corp. 4,700 172,584
New Home Co. Inc. 1,400 7,322
Sonos Inc. 900 8,838
Taylor Morrison Home Corp. 13,700 217,830
TRI Pointe Group Inc. 17,400 190,182
Tupperware Brands Corp. 6,300 198,891
Universal Electronics Inc. 1,500 37,920
William Lyon Homes 2,800 29,932
2,069,000
Household Products - 0.1%
Central Garden & Pet Co. 300 10,335
Central Garden & Pet Co. 1,400 43,750
Oil-Dri Corp. of America 493 13,065
Spectrum Brands Holdings Inc. 161 6,802
73,952
Independent Power and Renewable Electricity Producers - 0.7%
Atlantic Power Corp. 11,700 25,389
Clearway Energy Inc. 5,000 84,600
Clearway Energy Inc. 9,700 167,325
Ormat Technologies Inc. 5,300 277,190
Pattern Energy Group Inc. 11,200 208,544
TerraForm Power Inc. 7,867 88,268
851,316
Insurance - 4.1%
Ambac Financial Group Inc. 6,000 103,440
American Equity Investment Life Holding Co. 12,200 340,868
AMERISAFE Inc. 2,500 141,725

State Street Global Advisors Trust Company
State Street Russell Small Cap Value® Index Non-Lending Series Fund
Schedule of Investments
(showing percentage of total value of investments)
December 31, 2018
The accompanying notes are an integral part
of these financial statements.
29
Common Stock - 97.7% Shares
Value
($)
Argo Group International Holdings Ltd. 4,264 286,754
Citizens Inc. 7,000 52,640
CNO Financial Group Inc. 22,400 333,312
Crawford & Co. 1,173 10,557
Donegal Group Inc. 1,000 13,645
eHealth Inc. 2,700 103,734
EMC Insurance Group Inc. 950 30,258
Employers Holdings Inc. 4,500 188,865
Enstar Group Ltd. 1,653 276,993
FBL Financial Group Inc. 1,400 91,910
FedNat Holding Co. 600 11,952
Genworth Financial Inc. 69,100 322,006
Global Indemnity Ltd. 750 27,173
Goosehead Insurance Inc. 1,000 26,290
Greenlight Capital Re Ltd. 3,200 27,584
Hallmark Financial Services Inc. 1,400 14,966
HCI Group Inc. 800 40,648
Heritage Insurance Holdings Inc. 1,900 27,968
Horace Mann Educators Corp. 5,700 213,465
Independence Holding Co. 490 17,248
Investors Title Co. 100 17,668
James River Group Holdings Ltd. 2,000 73,080
Kemper Corp. 2,903 192,701
Kingstone Cos Inc. 700 12,383
Maiden Holdings Ltd. 7,200 11,880
MBIA Inc. 11,400 101,688
National General Holdings Corp. 3,600 87,156
National Western Life Group Inc. 292 87,804
Navigators Group Inc. 2,600 180,674
NI Holdings Inc. 1,600 25,168
ProAssurance Corp. 7,300 296,088
Protective Insurance Corp. 1,000 16,650
RLI Corp. 700 48,293
Safety Insurance Group Inc. 2,000 163,620
Selective Insurance Group Inc. 7,700 469,238
State Auto Financial Corp. 2,400 81,696
Stewart Information Services Corp. 3,100 128,340
Third Point Reinsurance Ltd. 9,700 93,508
State Street Global Advisors Trust Company
State Street Russell Small Cap Value® Index Non-Lending Series Fund
Schedule of Investments
(showing percentage of total value of investments)
December 31, 2018
The accompanying notes are an integral part
of these financial statements.
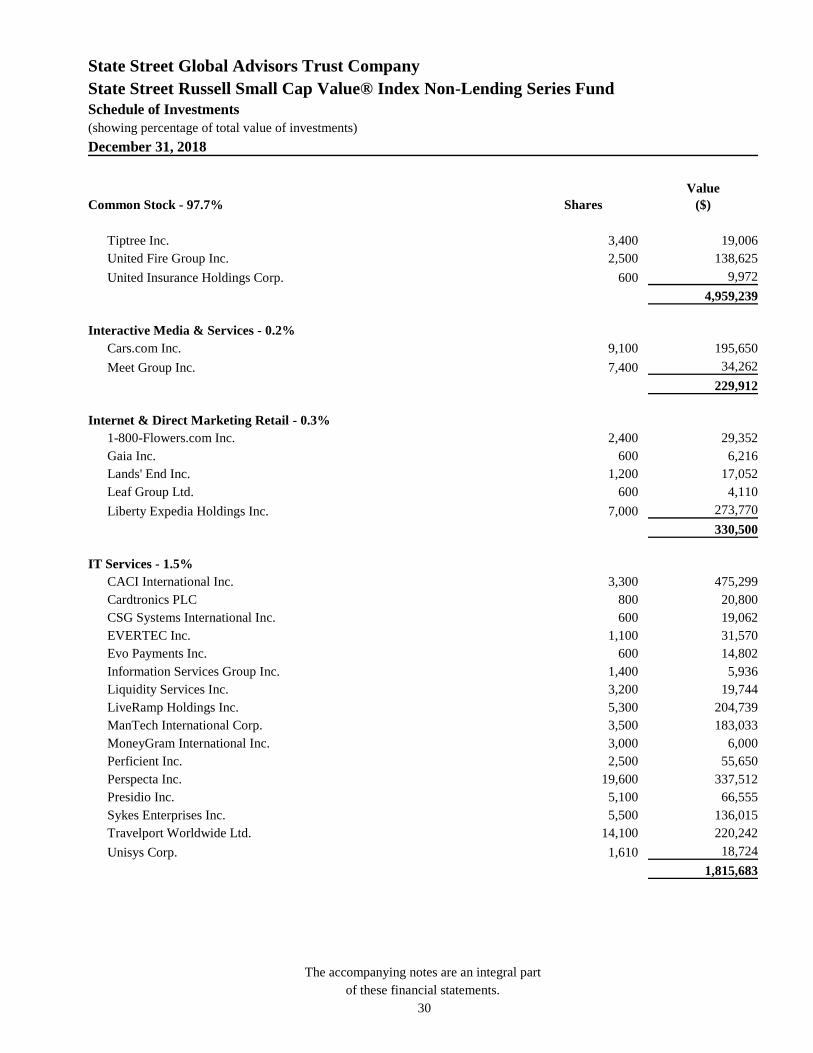
30
Common Stock - 97.7% Shares
Value
($)
Tiptree Inc. 3,400 19,006
United Fire Group Inc. 2,500 138,625
United Insurance Holdings Corp. 600 9,972
4,959,239
Interactive Media & Services - 0.2%
Cars.com Inc. 9,100 195,650
Meet Group Inc. 7,400 34,262
229,912
Internet & Direct Marketing Retail - 0.3%
1-800-Flowers.com Inc. 2,400 29,352
Gaia Inc. 600 6,216
Lands' End Inc. 1,200 17,052
Leaf Group Ltd. 600 4,110
Liberty Expedia Holdings Inc. 7,000 273,770
330,500
IT Services - 1.5%
CACI International Inc. 3,300 475,299
Cardtronics PLC 800 20,800
CSG Systems International Inc. 600 19,062
EVERTEC Inc. 1,100 31,570
Evo Payments Inc. 600 14,802
Information Services Group Inc. 1,400 5,936
Liquidity Services Inc. 3,200 19,744
LiveRamp Holdings Inc. 5,300 204,739
ManTech International Corp. 3,500 183,033
MoneyGram International Inc. 3,000 6,000
Perficient Inc. 2,500 55,650
Perspecta Inc. 19,600 337,512
Presidio Inc. 5,100 66,555
Sykes Enterprises Inc. 5,500 136,015
Travelport Worldwide Ltd. 14,100 220,242
Unisys Corp. 1,610 18,724
1,815,683
State Street Global Advisors Trust Company
State Street Russell Small Cap Value® Index Non-Lending Series Fund
Schedule of Investments
(showing percentage of total value of investments)
December 31, 2018
The accompanying notes are an integral part
of these financial statements.
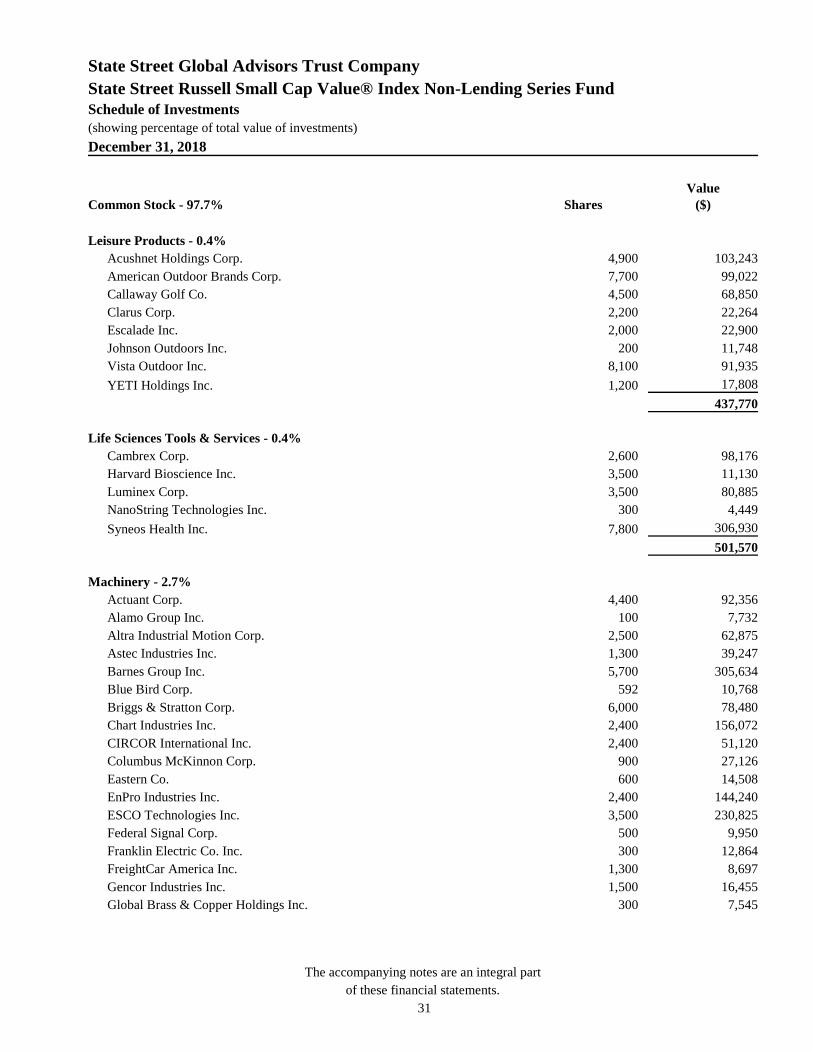
31
Common Stock - 97.7% Shares
Value
($)
Leisure Products - 0.4%
Acushnet Holdings Corp. 4,900 103,243
American Outdoor Brands Corp. 7,700 99,022
Callaway Golf Co. 4,500 68,850
Clarus Corp. 2,200 22,264
Escalade Inc. 2,000 22,900
Johnson Outdoors Inc. 200 11,748
Vista Outdoor Inc. 8,100 91,935
YETI Holdings Inc. 1,200 17,808
437,770
Life Sciences Tools & Services - 0.4%
Cambrex Corp. 2,600 98,176
Harvard Bioscience Inc. 3,500 11,130
Luminex Corp. 3,500 80,885
NanoString Technologies Inc. 300 4,449
Syneos Health Inc. 7,800 306,930
501,570
Machinery - 2.7%
Actuant Corp. 4,400 92,356
Alamo Group Inc. 100 7,732
Altra Industrial Motion Corp. 2,500 62,875
Astec Industries Inc. 1,300 39,247
Barnes Group Inc. 5,700 305,634
Blue Bird Corp. 592 10,768
Briggs & Stratton Corp. 6,000 78,480
Chart Industries Inc. 2,400 156,072
CIRCOR International Inc. 2,400 51,120
Columbus McKinnon Corp. 900 27,126
Eastern Co. 600 14,508
EnPro Industries Inc. 2,400 144,240
ESCO Technologies Inc. 3,500 230,825
Federal Signal Corp. 500 9,950
Franklin Electric Co. Inc. 300 12,864
FreightCar America Inc. 1,300 8,697
Gencor Industries Inc. 1,500 16,455
Global Brass & Copper Holdings Inc. 300 7,545
State Street Global Advisors Trust Company
State Street Russell Small Cap Value® Index Non-Lending Series Fund
Schedule of Investments
(showing percentage of total value of investments)
December 31, 2018
The accompanying notes are an integral part
of these financial statements.
32
Common Stock - 97.7% Shares
Value
($)
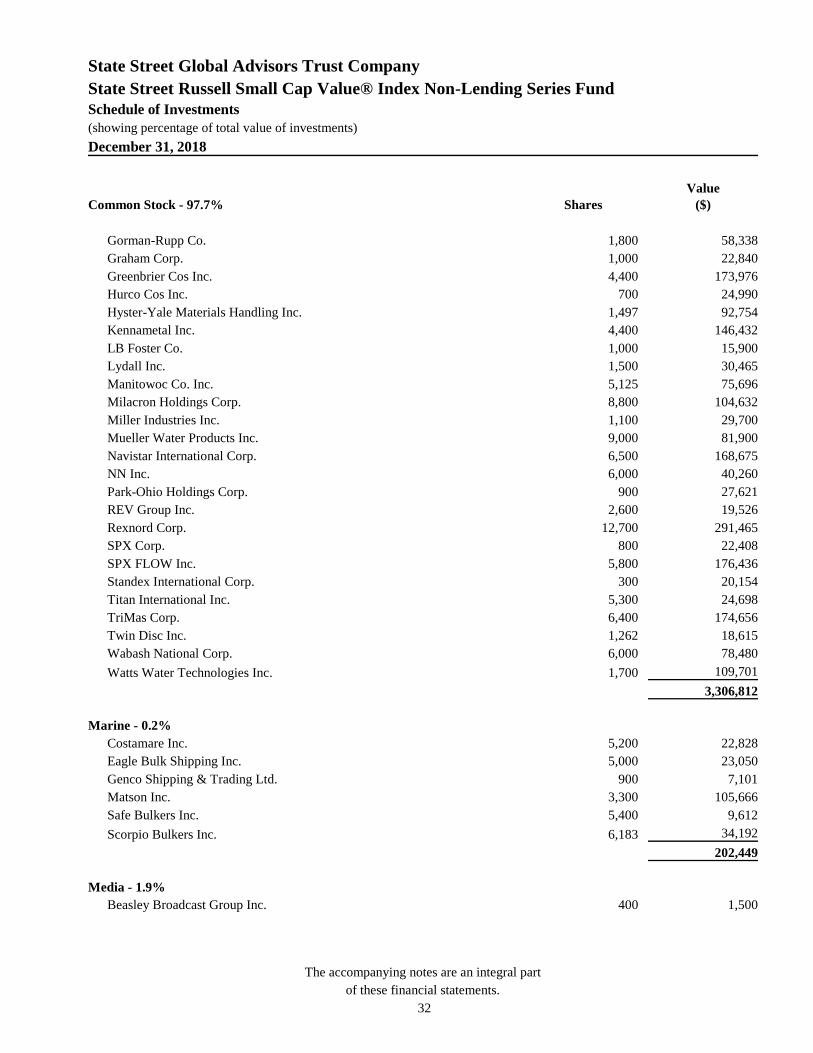
Gorman-Rupp Co. 1,800 58,338
Graham Corp. 1,000 22,840
Greenbrier Cos Inc. 4,400 173,976
Hurco Cos Inc. 700 24,990
Hyster-Yale Materials Handling Inc. 1,497 92,754
Kennametal Inc. 4,400 146,432
LB Foster Co. 1,000 15,900
Lydall Inc. 1,500 30,465
Manitowoc Co. Inc. 5,125 75,696
Milacron Holdings Corp. 8,800 104,632
Miller Industries Inc. 1,100 29,700
Mueller Water Products Inc. 9,000 81,900
Navistar International Corp. 6,500 168,675
NN Inc. 6,000 40,260
Park-Ohio Holdings Corp. 900 27,621
REV Group Inc. 2,600 19,526
Rexnord Corp. 12,700 291,465
SPX Corp. 800 22,408
SPX FLOW Inc. 5,800 176,436
Standex International Corp. 300 20,154
Titan International Inc. 5,300 24,698
TriMas Corp. 6,400 174,656
Twin Disc Inc. 1,262 18,615
Wabash National Corp. 6,000 78,480
Watts Water Technologies Inc. 1,700 109,701
3,306,812
Marine - 0.2%
Costamare Inc. 5,200 22,828
Eagle Bulk Shipping Inc. 5,000 23,050
Genco Shipping & Trading Ltd. 900 7,101
Matson Inc. 3,300 105,666
Safe Bulkers Inc. 5,400 9,612
Scorpio Bulkers Inc. 6,183 34,192
202,449
Media - 1.9%
Beasley Broadcast Group Inc. 400 1,500
State Street Global Advisors Trust Company
State Street Russell Small Cap Value® Index Non-Lending Series Fund
Schedule of Investments
(showing percentage of total value of investments)
December 31, 2018
The accompanying notes are an integral part
of these financial statements.
33
Common Stock - 97.7% Shares
Value
($)
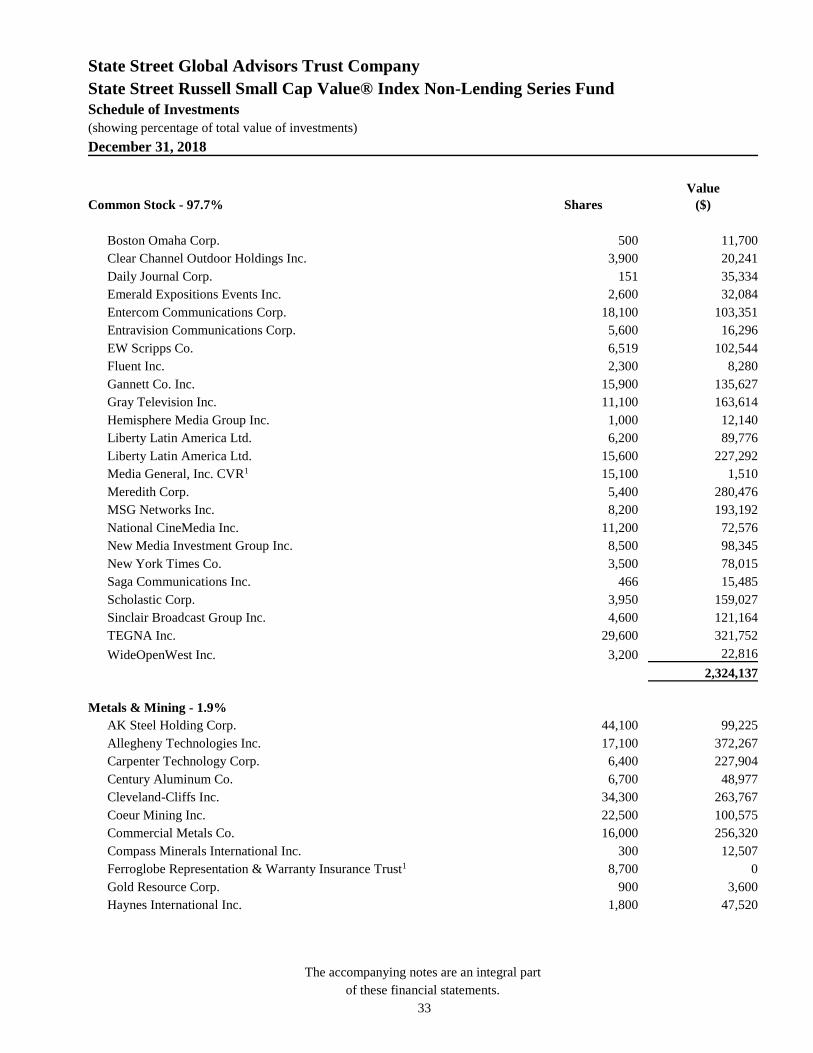
Boston Omaha Corp. 500 11,700
Clear Channel Outdoor Holdings Inc. 3,900 20,241
Daily Journal Corp. 151 35,334
Emerald Expositions Events Inc. 2,600 32,084
Entercom Communications Corp. 18,100 103,351
Entravision Communications Corp. 5,600 16,296
EW Scripps Co. 6,519 102,544
Fluent Inc. 2,300 8,280
Gannett Co. Inc. 15,900 135,627
Gray Television Inc. 11,100 163,614
Hemisphere Media Group Inc. 1,000 12,140
Liberty Latin America Ltd. 6,200 89,776
Liberty Latin America Ltd. 15,600 227,292
Media General, Inc. CVR1 15,100 1,510
Meredith Corp. 5,400 280,476
MSG Networks Inc. 8,200 193,192
National CineMedia Inc. 11,200 72,576
New Media Investment Group Inc. 8,500 98,345
New York Times Co. 3,500 78,015
Saga Communications Inc. 466 15,485
Scholastic Corp. 3,950 159,027
Sinclair Broadcast Group Inc. 4,600 121,164
TEGNA Inc. 29,600 321,752
WideOpenWest Inc. 3,200 22,816
2,324,137
Metals & Mining - 1.9%
AK Steel Holding Corp. 44,100 99,225
Allegheny Technologies Inc. 17,100 372,267
Carpenter Technology Corp. 6,400 227,904
Century Aluminum Co. 6,700 48,977
Cleveland-Cliffs Inc. 34,300 263,767
Coeur Mining Inc. 22,500 100,575
Commercial Metals Co. 16,000 256,320
Compass Minerals International Inc. 300 12,507
Ferroglobe Representation & Warranty Insurance Trust1 8,700 0
Gold Resource Corp. 900 3,600
Haynes International Inc. 1,800 47,520
State Street Global Advisors Trust Company
State Street Russell Small Cap Value® Index Non-Lending Series Fund
Schedule of Investments
(showing percentage of total value of investments)
December 31, 2018
The accompanying notes are an integral part
of these financial statements.
34
Common Stock - 97.7% Shares
Value
($)
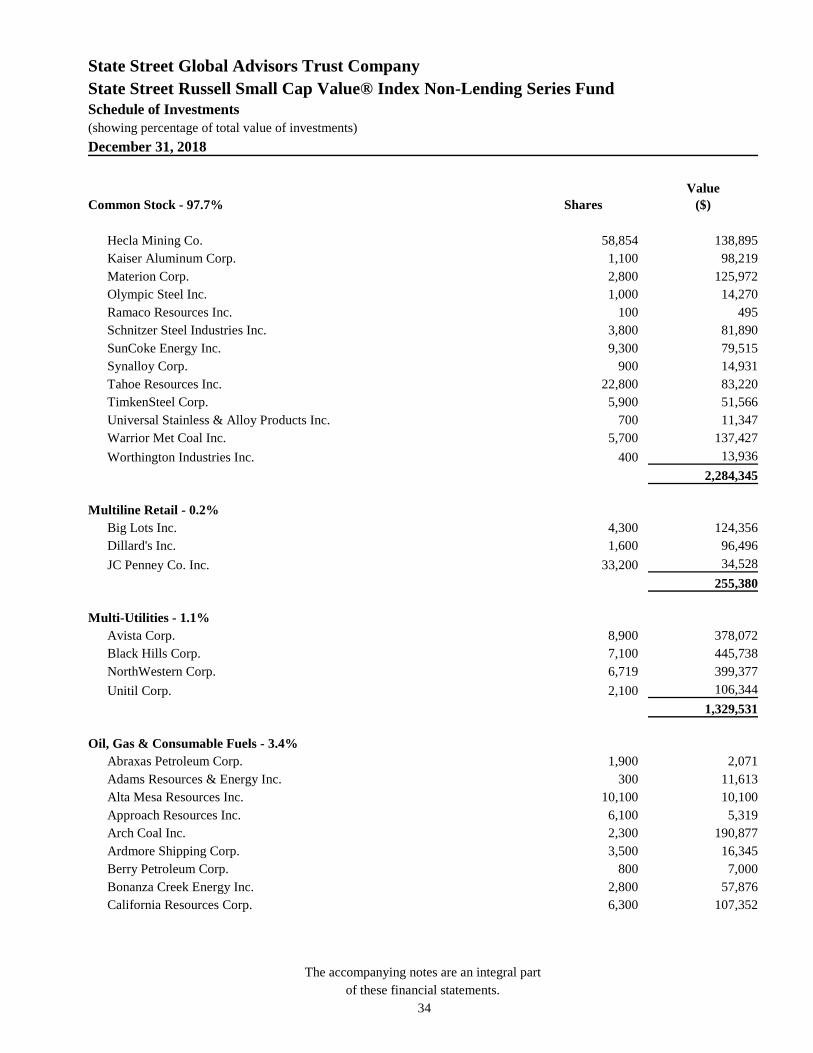
Hecla Mining Co. 58,854 138,895
Kaiser Aluminum Corp. 1,100 98,219
Materion Corp. 2,800 125,972
Olympic Steel Inc. 1,000 14,270
Ramaco Resources Inc. 100 495
Schnitzer Steel Industries Inc. 3,800 81,890
SunCoke Energy Inc. 9,300 79,515
Synalloy Corp. 900 14,931
Tahoe Resources Inc. 22,800 83,220
TimkenSteel Corp. 5,900 51,566
Universal Stainless & Alloy Products Inc. 700 11,347
Warrior Met Coal Inc. 5,700 137,427
Worthington Industries Inc. 400 13,936
2,284,345
Multiline Retail - 0.2%
Big Lots Inc. 4,300 124,356
Dillard's Inc. 1,600 96,496
JC Penney Co. Inc. 33,200 34,528
255,380
Multi-Utilities - 1.1%
Avista Corp. 8,900 378,072
Black Hills Corp. 7,100 445,738
NorthWestern Corp. 6,719 399,377
Unitil Corp. 2,100 106,344
1,329,531
Oil, Gas & Consumable Fuels - 3.4%
Abraxas Petroleum Corp. 1,900 2,071
Adams Resources & Energy Inc. 300 11,613
Alta Mesa Resources Inc. 10,100 10,100
Approach Resources Inc. 6,100 5,319
Arch Coal Inc. 2,300 190,877
Ardmore Shipping Corp. 3,500 16,345
Berry Petroleum Corp. 800 7,000
Bonanza Creek Energy Inc. 2,800 57,876
California Resources Corp. 6,300 107,352
State Street Global Advisors Trust Company
State Street Russell Small Cap Value® Index Non-Lending Series Fund
Schedule of Investments
(showing percentage of total value of investments)
December 31, 2018
The accompanying notes are an integral part
of these financial statements.
35
Common Stock - 97.7% Shares
Value
($)
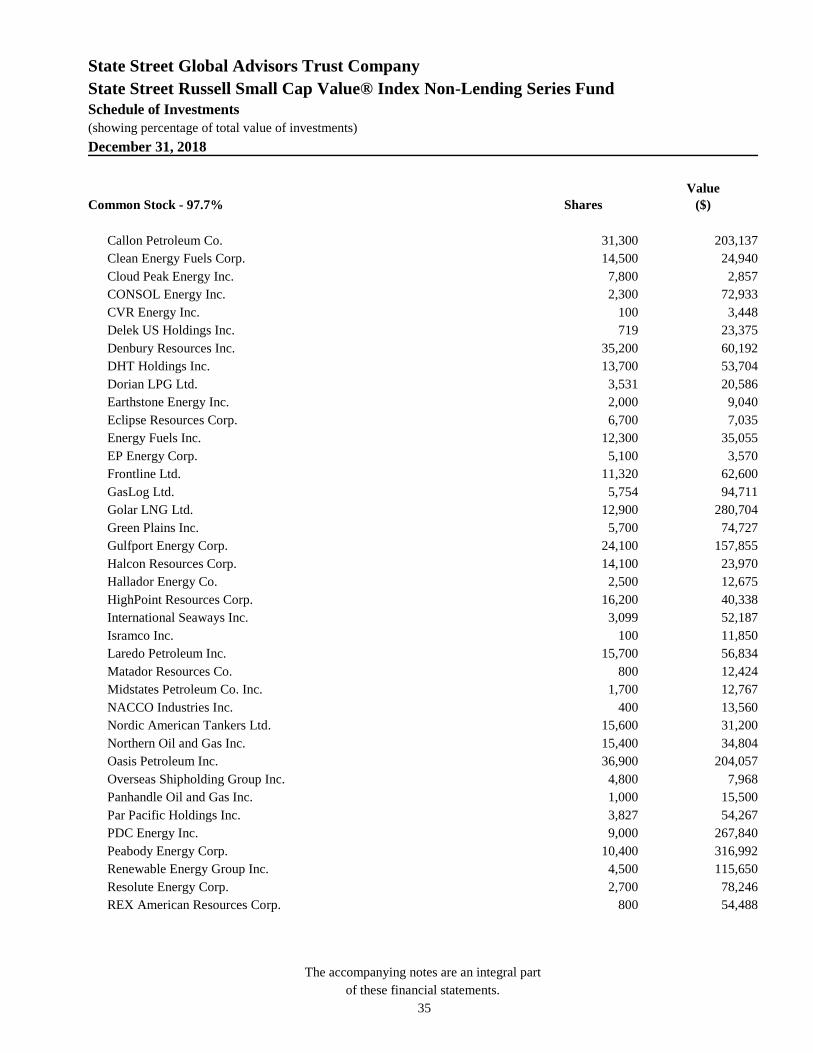
Callon Petroleum Co. 31,300 203,137
Clean Energy Fuels Corp. 14,500 24,940
Cloud Peak Energy Inc. 7,800 2,857
CONSOL Energy Inc. 2,300 72,933
CVR Energy Inc. 100 3,448
Delek US Holdings Inc. 719 23,375
Denbury Resources Inc. 35,200 60,192
DHT Holdings Inc. 13,700 53,704
Dorian LPG Ltd. 3,531 20,586
Earthstone Energy Inc. 2,000 9,040
Eclipse Resources Corp. 6,700 7,035
Energy Fuels Inc. 12,300 35,055
EP Energy Corp. 5,100 3,570
Frontline Ltd. 11,320 62,600
GasLog Ltd. 5,754 94,711
Golar LNG Ltd. 12,900 280,704
Green Plains Inc. 5,700 74,727
Gulfport Energy Corp. 24,100 157,855
Halcon Resources Corp. 14,100 23,970
Hallador Energy Co. 2,500 12,675
HighPoint Resources Corp. 16,200 40,338
International Seaways Inc. 3,099 52,187
Isramco Inc. 100 11,850
Laredo Petroleum Inc. 15,700 56,834
Matador Resources Co. 800 12,424
Midstates Petroleum Co. Inc. 1,700 12,767
NACCO Industries Inc. 400 13,560
Nordic American Tankers Ltd. 15,600 31,200
Northern Oil and Gas Inc. 15,400 34,804
Oasis Petroleum Inc. 36,900 204,057
Overseas Shipholding Group Inc. 4,800 7,968
Panhandle Oil and Gas Inc. 1,000 15,500
Par Pacific Holdings Inc. 3,827 54,267
PDC Energy Inc. 9,000 267,840
Peabody Energy Corp. 10,400 316,992
Renewable Energy Group Inc. 4,500 115,650
Resolute Energy Corp. 2,700 78,246
REX American Resources Corp. 800 54,488
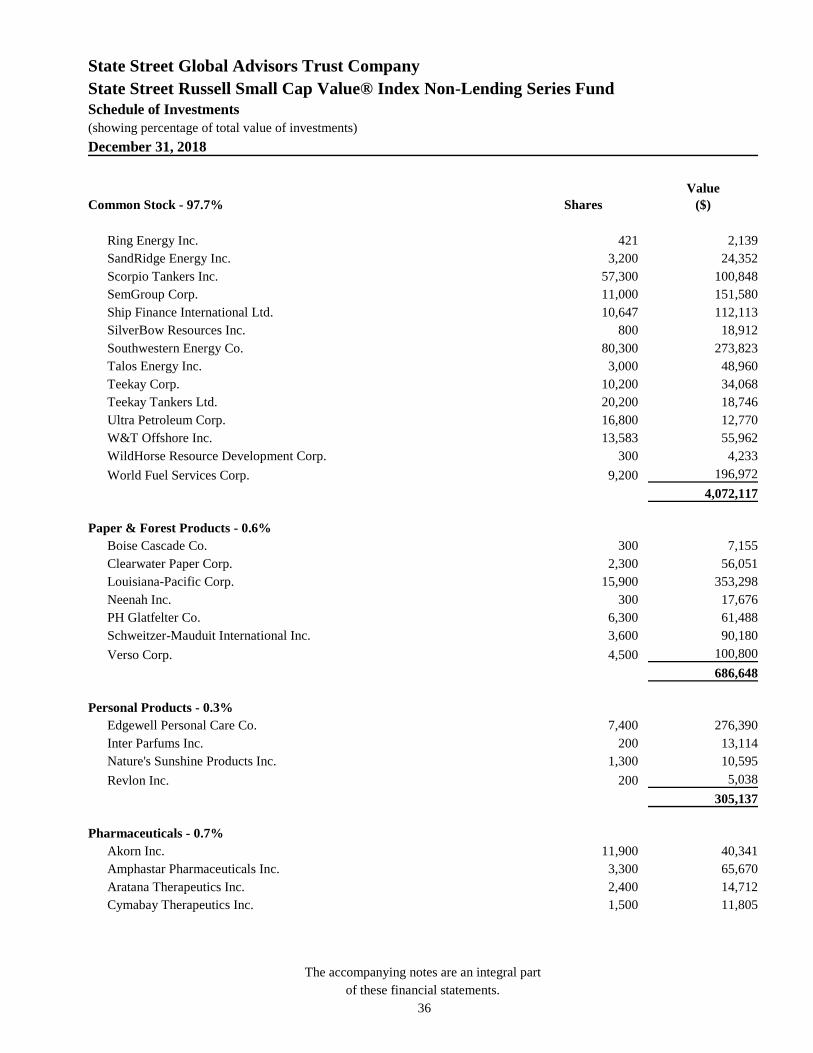
State Street Global Advisors Trust Company
State Street Russell Small Cap Value® Index Non-Lending Series Fund
Schedule of Investments
(showing percentage of total value of investments)
December 31, 2018
The accompanying notes are an integral part
of these financial statements.
36
Common Stock - 97.7% Shares
Value
($)
Ring Energy Inc. 421 2,139
SandRidge Energy Inc. 3,200 24,352
Scorpio Tankers Inc. 57,300 100,848
SemGroup Corp. 11,000 151,580
Ship Finance International Ltd. 10,647 112,113
SilverBow Resources Inc. 800 18,912
Southwestern Energy Co. 80,300 273,823
Talos Energy Inc. 3,000 48,960
Teekay Corp. 10,200 34,068
Teekay Tankers Ltd. 20,200 18,746
Ultra Petroleum Corp. 16,800 12,770
W&T Offshore Inc. 13,583 55,962
WildHorse Resource Development Corp. 300 4,233
World Fuel Services Corp. 9,200 196,972
4,072,117
Paper & Forest Products - 0.6%
Boise Cascade Co. 300 7,155
Clearwater Paper Corp. 2,300 56,051
Louisiana-Pacific Corp. 15,900 353,298
Neenah Inc. 300 17,676
PH Glatfelter Co. 6,300 61,488
Schweitzer-Mauduit International Inc. 3,600 90,180
Verso Corp. 4,500 100,800
686,648
Personal Products - 0.3%
Edgewell Personal Care Co. 7,400 276,390
Inter Parfums Inc. 200 13,114
Nature's Sunshine Products Inc. 1,300 10,595
Revlon Inc. 200 5,038
305,137
Pharmaceuticals - 0.7%
Akorn Inc. 11,900 40,341
Amphastar Pharmaceuticals Inc. 3,300 65,670
Aratana Therapeutics Inc. 2,400 14,712
Cymabay Therapeutics Inc. 1,500 11,805
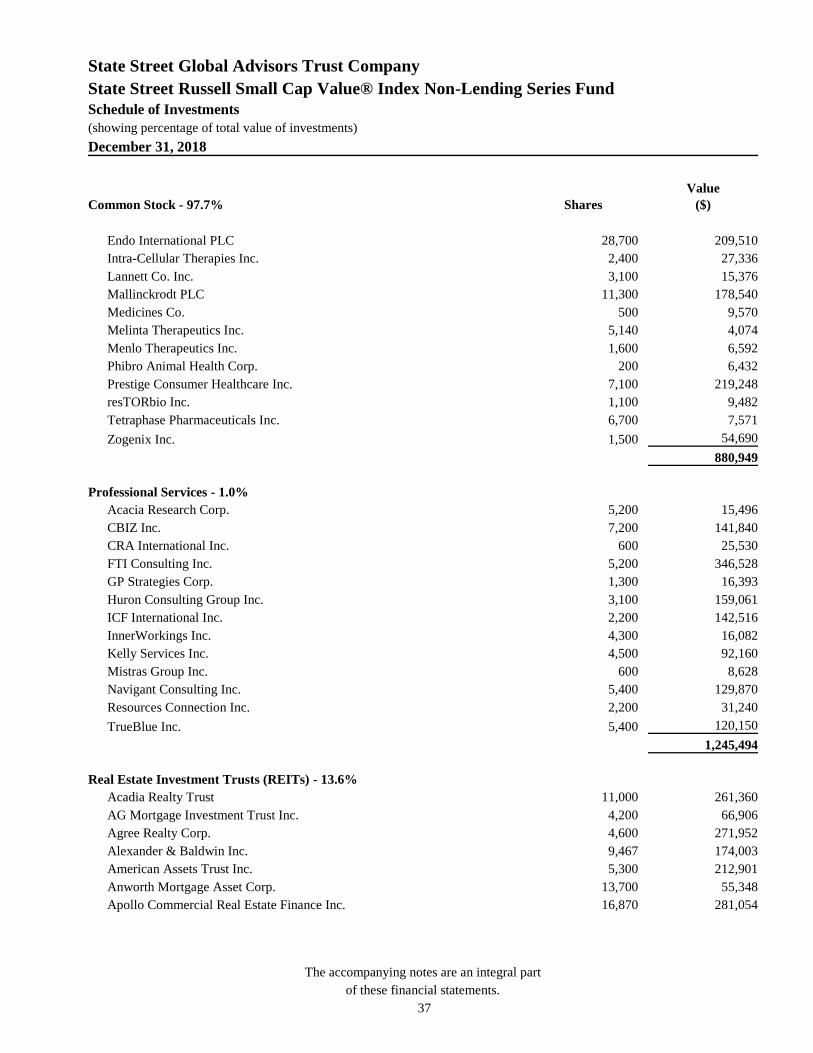
State Street Global Advisors Trust Company
State Street Russell Small Cap Value® Index Non-Lending Series Fund
Schedule of Investments
(showing percentage of total value of investments)
December 31, 2018
The accompanying notes are an integral part
of these financial statements.
37
Common Stock - 97.7% Shares
Value
($)
Endo International PLC 28,700 209,510
Intra-Cellular Therapies Inc. 2,400 27,336
Lannett Co. Inc. 3,100 15,376
Mallinckrodt PLC 11,300 178,540
Medicines Co. 500 9,570
Melinta Therapeutics Inc. 5,140 4,074
Menlo Therapeutics Inc. 1,600 6,592
Phibro Animal Health Corp. 200 6,432
Prestige Consumer Healthcare Inc. 7,100 219,248
resTORbio Inc. 1,100 9,482
Tetraphase Pharmaceuticals Inc. 6,700 7,571
Zogenix Inc. 1,500 54,690
880,949
Professional Services - 1.0%
Acacia Research Corp. 5,200 15,496
CBIZ Inc. 7,200 141,840
CRA International Inc. 600 25,530
FTI Consulting Inc. 5,200 346,528
GP Strategies Corp. 1,300 16,393
Huron Consulting Group Inc. 3,100 159,061
ICF International Inc. 2,200 142,516
InnerWorkings Inc. 4,300 16,082
Kelly Services Inc. 4,500 92,160
Mistras Group Inc. 600 8,628
Navigant Consulting Inc. 5,400 129,870
Resources Connection Inc. 2,200 31,240
TrueBlue Inc. 5,400 120,150
1,245,494
Real Estate Investment Trusts (REITs) - 13.6%
Acadia Realty Trust 11,000 261,360
AG Mortgage Investment Trust Inc. 4,200 66,906
Agree Realty Corp. 4,600 271,952
Alexander & Baldwin Inc. 9,467 174,003
American Assets Trust Inc. 5,300 212,901
Anworth Mortgage Asset Corp. 13,700 55,348
Apollo Commercial Real Estate Finance Inc. 16,870 281,054
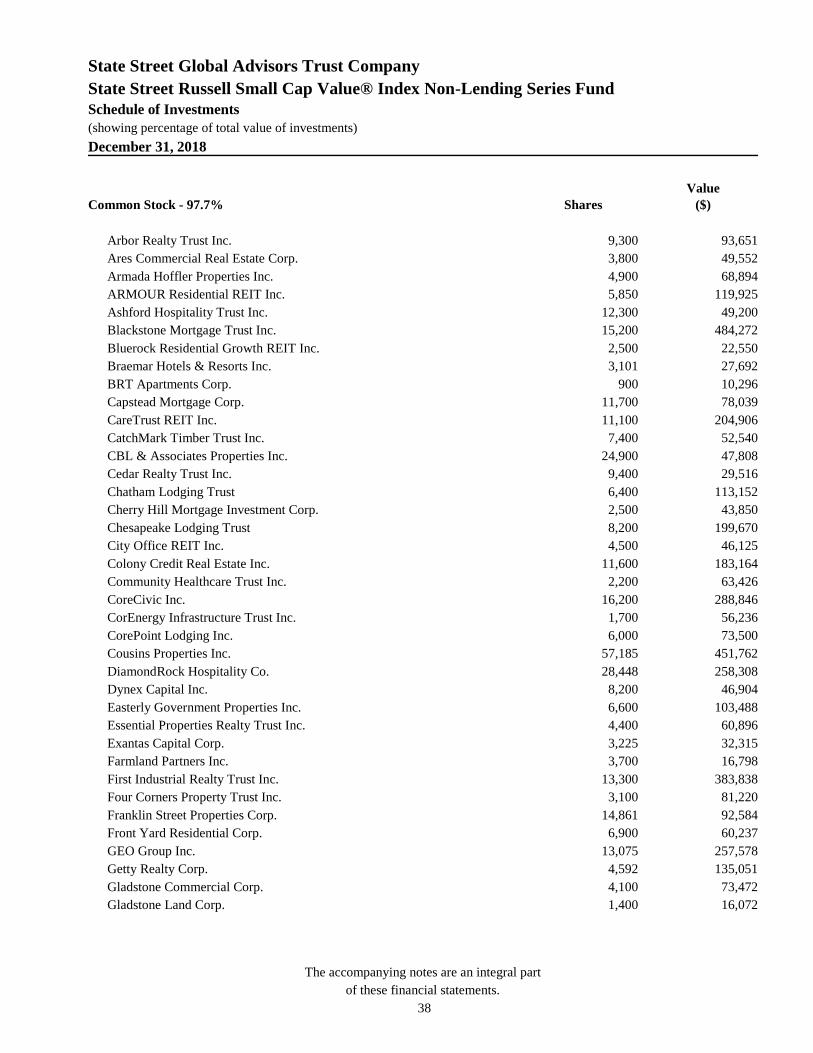
State Street Global Advisors Trust Company
State Street Russell Small Cap Value® Index Non-Lending Series Fund
Schedule of Investments
(showing percentage of total value of investments)
December 31, 2018
The accompanying notes are an integral part
of these financial statements.
38
Common Stock - 97.7% Shares
Value
($)
Arbor Realty Trust Inc. 9,300 93,651
Ares Commercial Real Estate Corp. 3,800 49,552
Armada Hoffler Properties Inc. 4,900 68,894
ARMOUR Residential REIT Inc. 5,850 119,925
Ashford Hospitality Trust Inc. 12,300 49,200
Blackstone Mortgage Trust Inc. 15,200 484,272
Bluerock Residential Growth REIT Inc. 2,500 22,550
Braemar Hotels & Resorts Inc. 3,101 27,692
BRT Apartments Corp. 900 10,296
Capstead Mortgage Corp. 11,700 78,039
CareTrust REIT Inc. 11,100 204,906
CatchMark Timber Trust Inc. 7,400 52,540
CBL & Associates Properties Inc. 24,900 47,808
Cedar Realty Trust Inc. 9,400 29,516
Chatham Lodging Trust 6,400 113,152
Cherry Hill Mortgage Investment Corp. 2,500 43,850
Chesapeake Lodging Trust 8,200 199,670
City Office REIT Inc. 4,500 46,125
Colony Credit Real Estate Inc. 11,600 183,164
Community Healthcare Trust Inc. 2,200 63,426
CoreCivic Inc. 16,200 288,846
CorEnergy Infrastructure Trust Inc. 1,700 56,236
CorePoint Lodging Inc. 6,000 73,500
Cousins Properties Inc. 57,185 451,762
DiamondRock Hospitality Co. 28,448 258,308
Dynex Capital Inc. 8,200 46,904
Easterly Government Properties Inc. 6,600 103,488
Essential Properties Realty Trust Inc. 4,400 60,896
Exantas Capital Corp. 3,225 32,315
Farmland Partners Inc. 3,700 16,798
First Industrial Realty Trust Inc. 13,300 383,838
Four Corners Property Trust Inc. 3,100 81,220
Franklin Street Properties Corp. 14,861 92,584
Front Yard Residential Corp. 6,900 60,237
GEO Group Inc. 13,075 257,578
Getty Realty Corp. 4,592 135,051
Gladstone Commercial Corp. 4,100 73,472
Gladstone Land Corp. 1,400 16,072
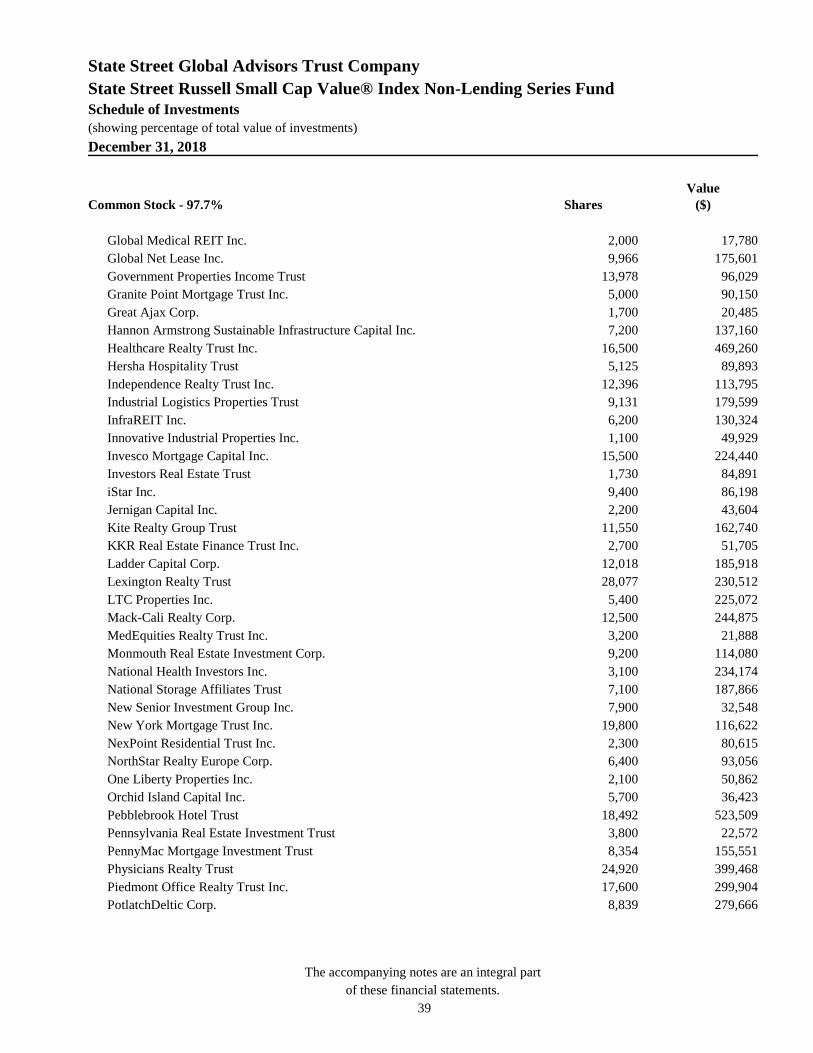
State Street Global Advisors Trust Company
State Street Russell Small Cap Value® Index Non-Lending Series Fund
Schedule of Investments
(showing percentage of total value of investments)
December 31, 2018
The accompanying notes are an integral part
of these financial statements.
39
Common Stock - 97.7% Shares
Value
($)
Global Medical REIT Inc. 2,000 17,780
Global Net Lease Inc. 9,966 175,601
Government Properties Income Trust 13,978 96,029
Granite Point Mortgage Trust Inc. 5,000 90,150
Great Ajax Corp. 1,700 20,485
Hannon Armstrong Sustainable Infrastructure Capital Inc. 7,200 137,160
Healthcare Realty Trust Inc. 16,500 469,260
Hersha Hospitality Trust 5,125 89,893
Independence Realty Trust Inc. 12,396 113,795
Industrial Logistics Properties Trust 9,131 179,599
InfraREIT Inc. 6,200 130,324
Innovative Industrial Properties Inc. 1,100 49,929
Invesco Mortgage Capital Inc. 15,500 224,440
Investors Real Estate Trust 1,730 84,891
iStar Inc. 9,400 86,198
Jernigan Capital Inc. 2,200 43,604
Kite Realty Group Trust 11,550 162,740
KKR Real Estate Finance Trust Inc. 2,700 51,705
Ladder Capital Corp. 12,018 185,918
Lexington Realty Trust 28,077 230,512
LTC Properties Inc. 5,400 225,072
Mack-Cali Realty Corp. 12,500 244,875
MedEquities Realty Trust Inc. 3,200 21,888
Monmouth Real Estate Investment Corp. 9,200 114,080
National Health Investors Inc. 3,100 234,174
National Storage Affiliates Trust 7,100 187,866
New Senior Investment Group Inc. 7,900 32,548
New York Mortgage Trust Inc. 19,800 116,622
NexPoint Residential Trust Inc. 2,300 80,615
NorthStar Realty Europe Corp. 6,400 93,056
One Liberty Properties Inc. 2,100 50,862
Orchid Island Capital Inc. 5,700 36,423
Pebblebrook Hotel Trust 18,492 523,509
Pennsylvania Real Estate Investment Trust 3,800 22,572
PennyMac Mortgage Investment Trust 8,354 155,551
Physicians Realty Trust 24,920 399,468
Piedmont Office Realty Trust Inc. 17,600 299,904
PotlatchDeltic Corp. 8,839 279,666
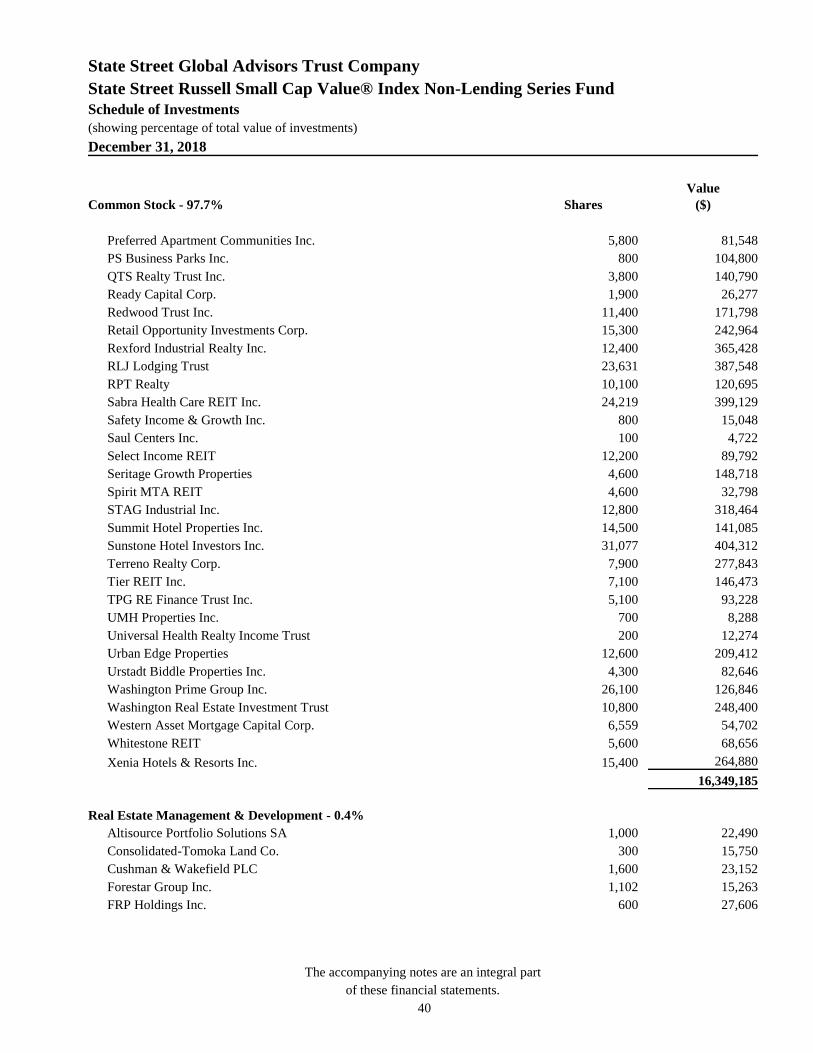
State Street Global Advisors Trust Company
State Street Russell Small Cap Value® Index Non-Lending Series Fund
Schedule of Investments
(showing percentage of total value of investments)
December 31, 2018
The accompanying notes are an integral part
of these financial statements.
40
Common Stock - 97.7% Shares
Value
($)
Preferred Apartment Communities Inc. 5,800 81,548
PS Business Parks Inc. 800 104,800
QTS Realty Trust Inc. 3,800 140,790
Ready Capital Corp. 1,900 26,277
Redwood Trust Inc. 11,400 171,798
Retail Opportunity Investments Corp. 15,300 242,964
Rexford Industrial Realty Inc. 12,400 365,428
RLJ Lodging Trust 23,631 387,548
RPT Realty 10,100 120,695
Sabra Health Care REIT Inc. 24,219 399,129
Safety Income & Growth Inc. 800 15,048
Saul Centers Inc. 100 4,722
Select Income REIT 12,200 89,792
Seritage Growth Properties 4,600 148,718
Spirit MTA REIT 4,600 32,798
STAG Industrial Inc. 12,800 318,464
Summit Hotel Properties Inc. 14,500 141,085
Sunstone Hotel Investors Inc. 31,077 404,312
Terreno Realty Corp. 7,900 277,843
Tier REIT Inc. 7,100 146,473
TPG RE Finance Trust Inc. 5,100 93,228
UMH Properties Inc. 700 8,288
Universal Health Realty Income Trust 200 12,274
Urban Edge Properties 12,600 209,412
Urstadt Biddle Properties Inc. 4,300 82,646
Washington Prime Group Inc. 26,100 126,846
Washington Real Estate Investment Trust 10,800 248,400
Western Asset Mortgage Capital Corp. 6,559 54,702
Whitestone REIT 5,600 68,656
Xenia Hotels & Resorts Inc. 15,400 264,880
16,349,185
Real Estate Management & Development - 0.4%
Altisource Portfolio Solutions SA 1,000 22,490
Consolidated-Tomoka Land Co. 300 15,750
Cushman & Wakefield PLC 1,600 23,152
Forestar Group Inc. 1,102 15,263
FRP Holdings Inc. 600 27,606

State Street Global Advisors Trust Company
State Street Russell Small Cap Value® Index Non-Lending Series Fund
Schedule of Investments
(showing percentage of total value of investments)
December 31, 2018
The accompanying notes are an integral part
of these financial statements.
41
Common Stock - 97.7% Shares
Value
($)
Kennedy-Wilson Holdings Inc. 8,600 156,262
RE/MAX Holdings Inc. 2,600 79,950
St Joe Co. 4,900 64,533
Stratus Properties Inc. 600 14,388
Tejon Ranch Co. 3,000 49,740
469,134
Road & Rail - 0.3%
ArcBest Corp. 3,200 109,632
Covenant Transportation Group Inc. 1,300 24,960
Daseke Inc. 4,300 15,824
Hertz Global Holdings Inc. 7,700 105,105
Marten Transport Ltd. 2,300 37,237
US Xpress Enterprises Inc. 900 5,049
Werner Enterprises Inc. 3,400 100,436
YRC Worldwide Inc. 2,800 8,820
407,063
Semiconductors & Semiconductor Equipment - 1.8%
Alpha & Omega Semiconductor Ltd. 2,100 21,399
Ambarella Inc. 2,300 80,454
Amkor Technology Inc. 14,700 96,432
Axcelis Technologies Inc. 4,700 83,660
AXT Inc. 4,000 17,400
Cabot Microelectronics Corp. 40 3,814
Cirrus Logic Inc. 7,400 245,532
Cohu Inc. 3,743 60,150
Cree Inc. 13,400 573,185
Diodes Inc. 4,200 135,492
FormFactor Inc. 9,600 135,264
Kopin Corp. 1,000 999
MACOM Technology Solutions Holdings Inc. 6,500 94,315
NeoPhotonics Corp. 3,700 23,976
PDF Solutions Inc. 2,700 22,761
Photronics Inc. 8,600 83,248
Rambus Inc. 15,000 115,050
Semtech Corp. 600 27,522
SunPower Corp. 4,300 21,371
State Street Global Advisors Trust Company
State Street Russell Small Cap Value® Index Non-Lending Series Fund
Schedule of Investments
(showing percentage of total value of investments)
December 31, 2018
The accompanying notes are an integral part
of these financial statements.
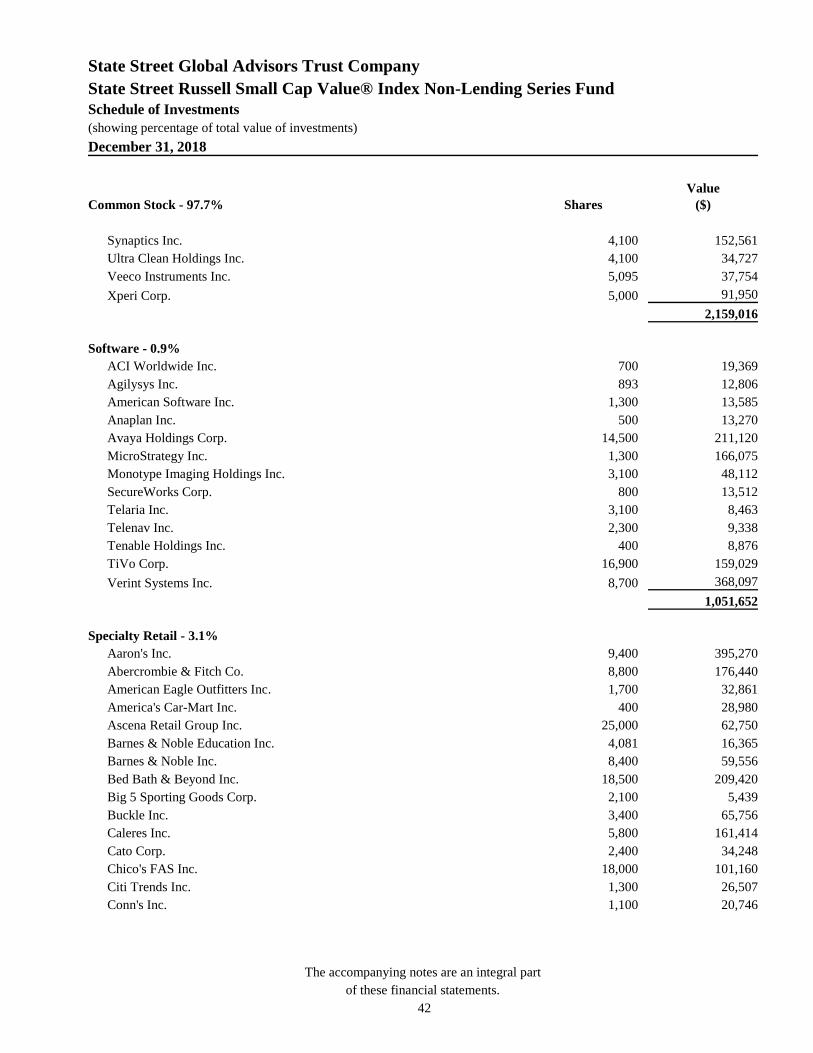
42
Common Stock - 97.7% Shares
Value
($)
Synaptics Inc. 4,100 152,561
Ultra Clean Holdings Inc. 4,100 34,727
Veeco Instruments Inc. 5,095 37,754
Xperi Corp. 5,000 91,950
2,159,016
Software - 0.9%
ACI Worldwide Inc. 700 19,369
Agilysys Inc. 893 12,806
American Software Inc. 1,300 13,585
Anaplan Inc. 500 13,270
Avaya Holdings Corp. 14,500 211,120
MicroStrategy Inc. 1,300 166,075
Monotype Imaging Holdings Inc. 3,100 48,112
SecureWorks Corp. 800 13,512
Telaria Inc. 3,100 8,463
Telenav Inc. 2,300 9,338
Tenable Holdings Inc. 400 8,876
TiVo Corp. 16,900 159,029
Verint Systems Inc. 8,700 368,097
1,051,652
Specialty Retail - 3.1%
Aaron's Inc. 9,400 395,270
Abercrombie & Fitch Co. 8,800 176,440
American Eagle Outfitters Inc. 1,700 32,861
America's Car-Mart Inc. 400 28,980
Ascena Retail Group Inc. 25,000 62,750
Barnes & Noble Education Inc. 4,081 16,365
Barnes & Noble Inc. 8,400 59,556
Bed Bath & Beyond Inc. 18,500 209,420
Big 5 Sporting Goods Corp. 2,100 5,439
Buckle Inc. 3,400 65,756
Caleres Inc. 5,800 161,414
Cato Corp. 2,400 34,248
Chico's FAS Inc. 18,000 101,160
Citi Trends Inc. 1,300 26,507
Conn's Inc. 1,100 20,746

State Street Global Advisors Trust Company
State Street Russell Small Cap Value® Index Non-Lending Series Fund
Schedule of Investments
(showing percentage of total value of investments)
December 31, 2018
The accompanying notes are an integral part
of these financial statements.
43
Common Stock - 97.7% Shares
Value
($)
Container Store Group Inc. 1,500 7,155
DSW Inc. 9,500 234,650
Express Inc. 10,509 53,701
Francesca's Holdings Corp. 3,700 3,592
GameStop Corp. 13,900 175,418
Genesco Inc. 2,802 124,129
GNC Holdings Inc. 8,700 20,619
Group 1 Automotive Inc. 2,400 126,528
Guess? Inc. 8,000 166,160
Haverty Furniture Cos Inc. 2,000 37,560
Hibbett Sports Inc. 2,000 28,600
J. Jill Inc. 2,400 12,792
Kirkland's Inc. 1,200 11,436
Lithia Motors Inc. 1,100 83,963
Lumber Liquidators Holdings Inc. 800 7,616
MarineMax Inc. 1,000 18,310
Murphy USA Inc. 3,400 260,576
Office Depot Inc. 72,000 185,760
Party City Holdco Inc. 7,800 77,844
Pier 1 Imports Inc. 8,400 2,569
Rent-A-Center Inc. 6,400 103,616
Sally Beauty Holdings Inc. 12,200 208,010
Shoe Carnival Inc. 1,150 38,537
Signet Jewelers Ltd. 6,700 212,859
Sonic Automotive Inc. 2,500 34,400
Tile Shop Holdings Inc. 2,000 10,960
Tilly's Inc. 1,500 16,290
Zumiez Inc. 1,400 26,838
3,687,400
Technology Hardware, Storage & Peripherals - 0.5%
3D Systems Corp. 14,400 146,448
Avid Technology Inc. 1,300 6,175
Cray Inc. 4,800 103,632
Diebold Nixdorf Inc. 8,100 20,169
Electronics For Imaging Inc. 5,800 143,840
State Street Global Advisors Trust Company
State Street Russell Small Cap Value® Index Non-Lending Series Fund
Schedule of Investments
(showing percentage of total value of investments)
December 31, 2018
The accompanying notes are an integral part
of these financial statements.
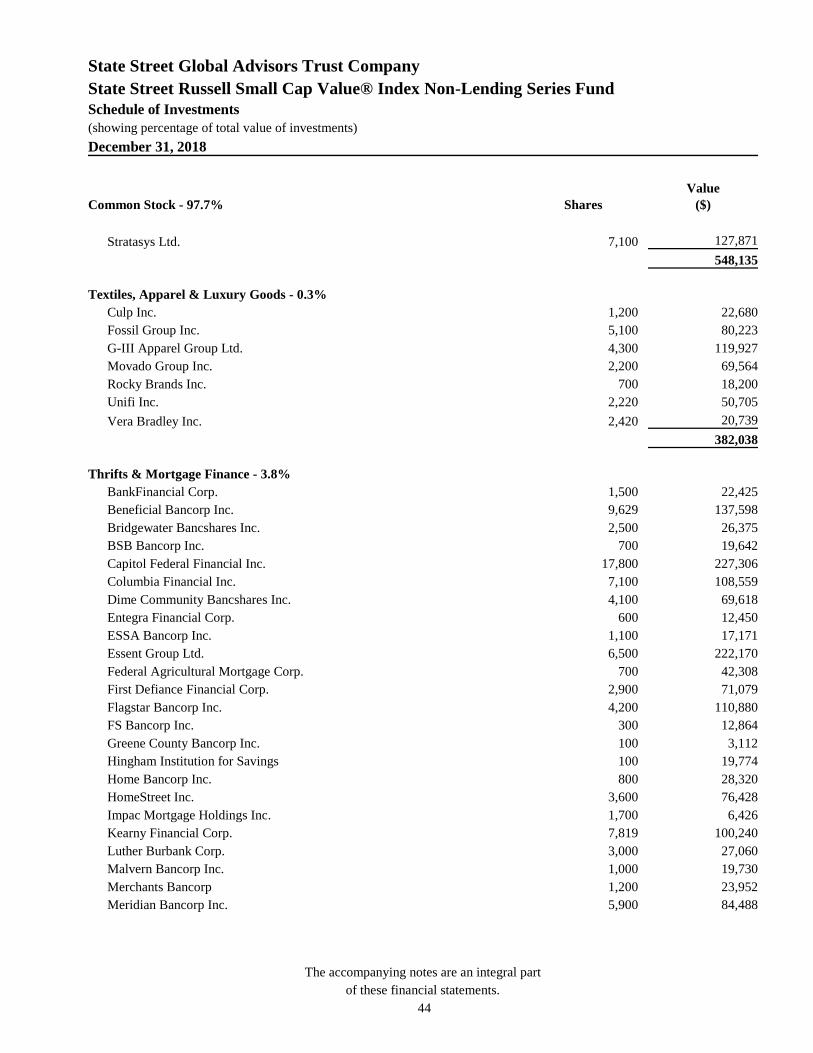
44
Common Stock - 97.7% Shares
Value
($)
Stratasys Ltd. 7,100 127,871
548,135
Textiles, Apparel & Luxury Goods - 0.3%
Culp Inc. 1,200 22,680
Fossil Group Inc. 5,100 80,223
G-III Apparel Group Ltd. 4,300 119,927
Movado Group Inc. 2,200 69,564
Rocky Brands Inc. 700 18,200
Unifi Inc. 2,220 50,705
Vera Bradley Inc. 2,420 20,739
382,038
Thrifts & Mortgage Finance - 3.8%
BankFinancial Corp. 1,500 22,425
Beneficial Bancorp Inc. 9,629 137,598
Bridgewater Bancshares Inc. 2,500 26,375
BSB Bancorp Inc. 700 19,642
Capitol Federal Financial Inc. 17,800 227,306
Columbia Financial Inc. 7,100 108,559
Dime Community Bancshares Inc. 4,100 69,618
Entegra Financial Corp. 600 12,450
ESSA Bancorp Inc. 1,100 17,171
Essent Group Ltd. 6,500 222,170
Federal Agricultural Mortgage Corp. 700 42,308
First Defiance Financial Corp. 2,900 71,079
Flagstar Bancorp Inc. 4,200 110,880
FS Bancorp Inc. 300 12,864
Greene County Bancorp Inc. 100 3,112
Hingham Institution for Savings 100 19,774
Home Bancorp Inc. 800 28,320
HomeStreet Inc. 3,600 76,428
Impac Mortgage Holdings Inc. 1,700 6,426
Kearny Financial Corp. 7,819 100,240
Luther Burbank Corp. 3,000 27,060
Malvern Bancorp Inc. 1,000 19,730
Merchants Bancorp 1,200 23,952
Meridian Bancorp Inc. 5,900 84,488

State Street Global Advisors Trust Company
State Street Russell Small Cap Value® Index Non-Lending Series Fund
Schedule of Investments
(showing percentage of total value of investments)
December 31, 2018
The accompanying notes are an integral part
of these financial statements.
45
Common Stock - 97.7% Shares
Value
($)
MGIC Investment Corp. 49,100 513,586
Mr Cooper Group Inc. 9,442 110,188
NMI Holdings Inc. 1,100 19,635
Northfield Bancorp Inc. 6,364 86,232
Northwest Bancshares Inc. 13,200 223,608
OceanFirst Financial Corp. 6,653 149,759
Ocwen Financial Corp. 12,400 16,616
OP Bancorp 1,300 11,531
Oritani Financial Corp. 5,800 85,550
PCSB Financial Corp. 1,600 31,296
PDL Community Bancorp 1,300 16,562
PennyMac Financial Services Inc. 2,800 59,528
Provident Bancorp Inc. 500 10,840
Provident Financial Services Inc. 8,600 207,518
Prudential Bancorp Inc. 1,200 21,120
Radian Group Inc. 29,300 479,348
Riverview Bancorp Inc. 2,200 16,016
SI Financial Group Inc. 1,500 19,095
Southern Missouri Bancorp Inc. 800 27,120
Sterling Bancorp Inc. 1,300 9,035
Territorial Bancorp Inc. 800 20,784
Timberland Bancorp Inc. 700 15,610
TrustCo. Bank Corp. NY 13,400 91,924
United Community Financial Corp. 7,300 64,605
United Financial Bancorp Inc. 7,188 105,664
Walker & Dunlop Inc. 3,400 147,050
Washington Federal Inc. 11,400 304,494
Waterstone Financial Inc. 3,287 55,090
Western New England Bancorp Inc. 3,770 37,851
WSFS Financial Corp. 3,200 121,312
4,568,542
Tobacco - 0.2%
Pyxus International Inc. 900 10,674
Universal Corp. 3,400 184,110
Vector Group Ltd. 8,121 79,017
273,801

State Street Global Advisors Trust Company
State Street Russell Small Cap Value® Index Non-Lending Series Fund
Schedule of Investments
(showing percentage of total value of investments)
December 31, 2018
The accompanying notes are an integral part
of these financial statements.
46
Common Stock - 97.7% Shares
Value
($)
Trading Companies & Distributors - 1.2%
Aircastle Ltd. 7,100 122,404
Beacon Roofing Supply Inc. 2,400 76,128
BMC Stock Holdings Inc. 9,000 139,320
CAI International Inc. 960 22,301
DXP Enterprises Inc. 400 11,136
Foundation Building Materials Inc. 1,400 11,634
GATX Corp. 5,100 361,131
General Finance Corp. 900 9,099
H&E Equipment Services Inc. 700 14,294
Lawson Products Inc. 500 15,800
MRC Global Inc. 5,600 68,488
Nexeo Solutions Inc. 3,500 30,065
NOW Inc. 14,900 173,436
Rush Enterprises Inc. 2,100 72,408
Rush Enterprises Inc. 300 10,680
Systemax Inc. 400 9,556
Textainer Group Holdings Ltd. 2,900 28,884
Titan Machinery Inc. 2,000 26,300
Triton International Ltd. 6,800 211,276
Veritiv Corp. 1,200 29,964
Willis Lease Finance Corp. 300 10,380
1,454,684
Water Utilities - 0.6%
American States Water Co. 1,500 100,560
AquaVenture Holdings Ltd. 1,200 22,668
Artesian Resources Corp. 800 27,896
Cadiz Inc. 2,300 23,690
California Water Service Group 5,800 276,428
Connecticut Water Service Inc. 1,700 113,679
Consolidated Water Co. Ltd. 1,600 18,656
Middlesex Water Co. 300 16,005
Pure Cycle Corp. 900 8,937
SJW Group 900 50,058
York Water Co. 223 7,149
665,726

State Street Global Advisors Trust Company
State Street Russell Small Cap Value® Index Non-Lending Series Fund
Schedule of Investments
(showing percentage of total value of investments)
December 31, 2018
The accompanying notes are an integral part
of these financial statements.
47
Common Stock - 97.7% Shares
Value
($)
Wireless Telecommunication Services - 0.1%
NII Holdings Inc. 12,800 56,448
Spok Holdings Inc. 2,000 26,510
82,958
Total Common Stock
(Cost $127,749,037)
117,517,569
State Street Global Advisors Trust Company Collective Investment Funds -
2.3% Units
Value
($)
State Street Short Term Investment Fund2 2,730,322 2,730,322
Total State Street Global Advisors Trust Company Collective Investment
Funds
(Cost $2,730,322)
2,730,322
TOTAL INVESTMENTS - 100.0%
(Cost $130,479,359)
120,247,891
1 Valued by Trustee. 2 Collective investment fund advised by State Street Global Advisors Trust Company.
At December 31, 2018, segregated balances totaling $149,109 were pledged to cover margin requirements for open futures
contracts. The following futures contracts were open at December 31, 2018:
Futures Contracts
Number of
Contracts
Long/(Short) Notional Cost Maturity Date
Unrealized
Gain/(Loss) ( $ )
E-mini Russell 2000 Index Futures 42 USD 3,001,283 March 2019 (168,383)
USD : United States Dollar
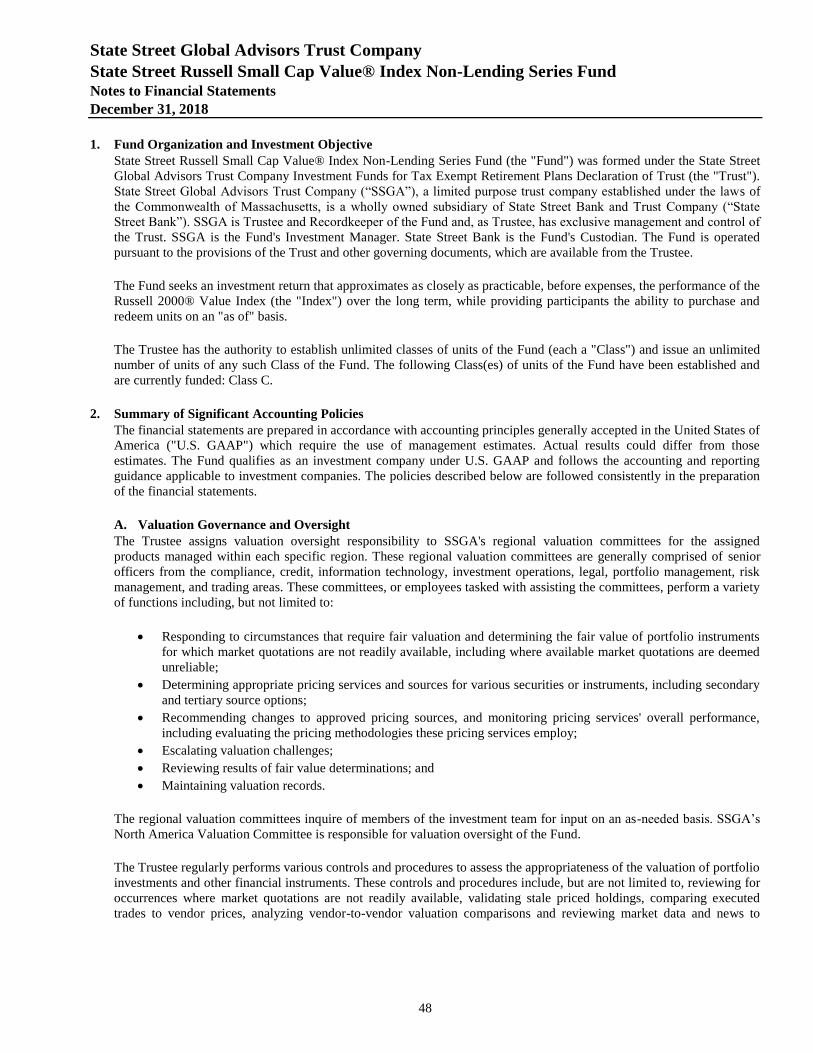
State Street Global Advisors Trust Company
State Street Russell Small Cap Value® Index Non-Lending Series Fund
Notes to Financial Statements
December 31, 2018
48
1. Fund Organization and Investment Objective
State Street Russell Small Cap Value® Index Non-Lending Series Fund (the "Fund") was formed under the State Street
Global Advisors Trust Company Investment Funds for Tax Exempt Retirement Plans Declaration of Trust (the "Trust").
State Street Global Advisors Trust Company (“SSGA”), a limited purpose trust company established under the laws of
the Commonwealth of Massachusetts, is a wholly owned subsidiary of State Street Bank and Trust Company (“State
Street Bank”). SSGA is Trustee and Recordkeeper of the Fund and, as Trustee, has exclusive management and control of
the Trust. SSGA is the Fund's Investment Manager. State Street Bank is the Fund's Custodian. The Fund is operated
pursuant to the provisions of the Trust and other governing documents, which are available from the Trustee.
The Fund seeks an investment return that approximates as closely as practicable, before expenses, the performance of the
Russell 2000® Value Index (the "Index") over the long term, while providing participants the ability to purchase and
redeem units on an "as of" basis.
The Trustee has the authority to establish unlimited classes of units of the Fund (each a "Class") and issue an unlimited
number of units of any such Class of the Fund. The following Class(es) of units of the Fund have been established and
are currently funded: Class C.
2. Summary of Significant Accounting Policies
The financial statements are prepared in accordance with accounting principles generally accepted in the United States of
America ("U.S. GAAP") which require the use of management estimates. Actual results could differ from those
estimates. The Fund qualifies as an investment company under U.S. GAAP and follows the accounting and reporting
guidance applicable to investment companies. The policies described below are followed consistently in the preparation
of the financial statements.
A. Valuation Governance and Oversight
The Trustee assigns valuation oversight responsibility to SSGA's regional valuation committees for the assigned
products managed within each specific region. These regional valuation committees are generally comprised of senior
officers from the compliance, credit, information technology, investment operations, legal, portfolio management, risk
management, and trading areas. These committees, or employees tasked with assisting the committees, perform a variety
of functions including, but not limited to:
Responding to circumstances that require fair valuation and determining the fair value of portfolio instruments
for which market quotations are not readily available, including where available market quotations are deemed
unreliable;
Determining appropriate pricing services and sources for various securities or instruments, including secondary
and tertiary source options;
Recommending changes to approved pricing sources, and monitoring pricing services' overall performance,
including evaluating the pricing methodologies these pricing services employ;
Escalating valuation challenges;
Reviewing results of fair value determinations; and
Maintaining valuation records.
The regional valuation committees inquire of members of the investment team for input on an as-needed basis. SSGA’s
North America Valuation Committee is responsible for valuation oversight of the Fund.
The Trustee regularly performs various controls and procedures to assess the appropriateness of the valuation of portfolio
investments and other financial instruments. These controls and procedures include, but are not limited to, reviewing for
occurrences where market quotations are not readily available, validating stale priced holdings, comparing executed
trades to vendor prices, analyzing vendor-to-vendor valuation comparisons and reviewing market data and news to
State Street Global Advisors Trust Company
State Street Russell Small Cap Value® Index Non-Lending Series Fund
Notes to Financial Statements
December 31, 2018
49
identify potential fair valuation considerations. These procedures and the results of these controls are reviewed
periodically by SSGA’s North America Valuation Committee.
B. Security Valuation
The Fund’s investments, including derivative instruments, are valued at fair value each business day. Fair value is
generally defined as the price a fund would receive to sell an asset or pay to transfer a liability in an orderly transaction
between market participants at the measurement date. By its nature, a fair value price is a good faith estimate of the
valuation in a current sale and may not reflect an actual market price. The Fund’s investments are valued pursuant to the
policy and procedures approved by the Trustee.
Equity investments, such as common stock and preferred stock, including equity investments sold short, if any, traded on
a recognized securities exchange for which market quotations are readily available (including registered investment
companies that are exchange traded) are valued at the last sale price or official closing price, as applicable, on the
primary market or exchange on which they trade. Equity investments traded on a recognized exchange for which there
were no sales on that day are valued at the last published sale price or at fair value as determined in good faith by the
Trustee. To the extent equity investments are actively traded and valuation adjustments are not applied, these
investments are classified within Level 1 of the fair value hierarchy. Equity investments traded on inactive markets or
valued by reference to similar instruments are generally classified within Level 2 of the fair value hierarchy.
Investments in registered investment companies (other than those that are exchange traded), if any, are valued at their
respective net asset value and are classified within Level 1 of the fair value hierarchy. Investments in collective
investment funds, if any, are valued at their respective net asset value and are not classified within the fair value
hierarchy.
Fixed income investments (including short-term investments) are valued on the basis of valuations furnished by
independent pricing services. These independent pricing services determine valuations for normal institutional-size
trading units of such securities using valuation models or matrix pricing; which incorporates yield and/or price with
respect to bonds that are considered comparable in characteristics such as rating, interest rate and maturity date and
quotations from securities dealers to determine current value. To the extent the inputs are observable, timely and/or
consistent with other valuation inputs, these investments are classified within Level 2 of the fair value hierarchy.
In the event current market prices or quotations are not readily available or are deemed unreliable by the Trustee, such as
the occurrence of a significant event, the fair value will be determined in good faith by the Trustee using alternative fair
valuation methods. A "significant event" is an event that the Trustee believes, with a reasonably high degree of certainty,
has caused the closing market prices of a Fund's portfolio securities to no longer reflect their value at the time of the
Fund's net asset value calculation.
Please refer to the Derivative Instruments note for further details on the valuation policy for derivatives.
Fair Value Hierarchy
The Fund values its assets and liabilities at fair value using a hierarchy that prioritizes the inputs to valuation techniques
giving the highest priority to readily available unadjusted quoted prices in active markets for identical assets or liabilities
(Level 1 measurements) and the lowest priority to unobservable inputs (Level 3 measurements) when market prices are
not readily available or reliable. The three levels of the hierarchy are described below:
Level 1 Unadjusted quoted prices in active markets for identical assets or liabilities.
State Street Global Advisors Trust Company
State Street Russell Small Cap Value® Index Non-Lending Series Fund
Notes to Financial Statements
December 31, 2018
50
Level 2
Prices determined using other significant observable inputs. Observable inputs are inputs that
other market participants would use in valuing a portfolio instrument. These may include quoted
prices for similar assets or liabilities in markets that are active, quoted prices for identical assets
or liabilities in markets that are not active, or observable inputs other than quoted prices (such as
interest rates, yield curves, foreign exchange rates, volatilities, prepayment speeds, and credit
risk) or other market corroborated inputs.
Level 3
Prices determined using significant unobservable inputs. In situations where quoted prices or
observable inputs are unavailable (for example, when there is little or no market activity for an
investment at the end of the period), unobservable inputs may be used. Unobservable inputs
reflect the Trustee's own assumptions about the factors market participants would use in valuing
a portfolio instrument, and would be based on the best information available.
The following is a summary of the inputs used, as of December 31, 2018, involving the Fund's assets and liabilities
carried at fair value. The inputs or methodologies used for valuing investments and other financial instruments may not
be an indication of the risk associated with investing in those securities.
Level 1 Level 2 Level 3 Total
Investments in securities, long - Assets
Common Stock $ 117,514,917 $ 2,652 $ 0 $ 117,517,569
Collective Investment Funds - - - 2,730,322
$ 117,514,917 $ 2,652 $ 0 $ 120,247,891
Other financial instruments - Liabilities
Futures Contracts $ (168,383) $ - $ - $ (168,383)
Please refer to the Schedule of Investments for additional information regarding composition of amounts listed above.
Collective Investment Funds, if any, have been measured at fair value using the net asset value per unit practical
expedient and accordingly have not been classified in the fair value hierarchy. The fair value total amount presented for
the aforementioned category in the table above, if applicable, is intended to permit reconciliation of the fair value
hierarchy to the amounts presented in the Statement of Assets and Liabilities.
Changes in valuation techniques may result in transfers in or out of an assigned level within the fair value hierarchy.
Transfers between fair value hierarchy levels are recognized at the end of the period.
The Fund had no significant transfers into or out of Level 3 for the period ended December 31, 2018.
C. Security Transactions and Investment Income
Security transactions are accounted for as of the trade date. Realized gains and losses from investment transactions are
determined using the average cost method. Distributions received from an underlying fund, if any, are recorded on the
ex-dividend date and retain the character of income as earned by the underlying fund. Dividend income, if any, is
recorded on the ex-dividend date. Non-cash dividends, if any, are recorded at the fair value of the securities received.
Interest income earned on securities, if any, is recorded on the accrual basis from settlement date. Interest income
includes accretion of discounts and amortization of premiums, if any.
Investment income, expenses that are not attributable to a particular class, and unrealized and realized gains or losses are
allocated daily to each Class of the Fund based upon the relative proportion of net assets of each Class.
State Street Global Advisors Trust Company
State Street Russell Small Cap Value® Index Non-Lending Series Fund
Notes to Financial Statements
December 31, 2018
51
D. Taxes
It is the Fund's policy to comply with the requirements of Section 501(a) of the Internal Revenue Code relating to
collective investment of employee benefit funds. Accordingly, the Fund is exempt from federal and state taxes and no
federal or state tax provision is required.
The Trustee has reviewed the Fund's tax positions for all open tax periods (current and prior tax periods) and has
determined that no provision for income taxes is required in the Fund's financial statements.
E. Issuances and Redemptions of Units of Participation
The per unit net asset value of each Class is determined each business day. Issuances and redemptions of Class units may
be made on such days, based upon the net asset value per unit as of the Class' valuation date last preceding the date on
which such order to contribute or redeem assets is received. The Trustee, in its sole discretion, reserves the right to value
any contribution or redemption as of the next succeeding valuation date or another date as the Trustee deems appropriate.
Additional terms of participation are detailed in the Trust and the Fund’s other governing documents. Such terms may be
implemented pursuant to the Trustee's prudent determination.
F. Expenses
Under the Trust, the Fund may be charged an annual audit fee and such other fees and expenses as are permitted by the
Declaration of Trust. The Fund indirectly bears the expenses incurred by the underlying fund(s), if any.
Each Class is charged its allocable share of the fees and expenses borne by the Fund that are not specifically allocated to
one or more of the Classes.
Management Fee
The Trustee charges a management fee to each Class at the following annual rate of each Class' daily net asset value:
Class Rate (%) Management Fees
Class C 0.040 $ 31,886
Total Management Fees $ 31,886
Class A was not charged a direct management fee. SSGA received investment fees from the Class participants and
therefore, the Class made no payments for these services.
Administration Fee
The Fund may be charged by the Trustee an annual administration fee equal to 0.010% of the average daily net asset
value of the Fund and $5 per Fund transaction of securities and portfolio instruments. Alternatively, should the Fund, in
the discretion of the Trustee, invest more than 50% of its assets directly in collective investment funds, the Trustee will
instead charge an administration fee equal to $25,000 to each Class. This administration fee relates to the provision of
custody, bookkeeping and accounting services, shareholder servicing, transfer agency and other services that the Trustee
may from time to time consider necessary or appropriate.
State Street Global Advisors Trust Company
State Street Russell Small Cap Value® Index Non-Lending Series Fund
Notes to Financial Statements
December 31, 2018
52
Waivers and Reimbursements
During the period ended December 31, 2018, certain direct and/or indirect expenses, if any, incurred by the Fund were
contractually or voluntarily waived and/or reimbursed by the Trustee:
Class
Total Annual
Operating Expense
Ratio (%) Waivers and/or
Reimbursements
Class A 0.012 $ (10,162)
Class C 0.052 (16,034)
Total Waivers and Reimbursements $ (26,196)
Please refer to the Additional Expense Information footnote for further disclosures regarding expenses.
G. Treatment of Net Investment Income and Net Realized Gains
Net investment income and net realized gains are retained by the Fund.
H. Foreign Currency
The accounting records of the Fund are maintained in U.S. dollars ("USD"), the Fund's base currency. Foreign currency,
investment securities, and other assets and liabilities denominated in a foreign currency are translated into USD at the
prevailing rates of exchange on each valuation date. Purchases and sales of securities, income, withholding taxes and
expenses are translated into USD at the prevailing exchange rate on the respective dates of the transactions. Generally,
when the USD rises in value against a foreign currency, the Fund's foreign currency, investment securities, and other
assets and liabilities denominated in that currency will lose value because that currency is worth fewer USD; the opposite
effect occurs if the USD falls in relative value.
The effects of changes in foreign currency exchange rates on securities and derivative instruments are included with the
net realized and unrealized gain or loss on securities and derivative instruments. Net realized gains and losses on foreign
currency transactions may include net realized foreign exchange gains or losses on closed forward foreign currency
contracts, disposition of foreign currencies, currency gains and losses realized between the trade and settlement dates on
securities transactions and the difference between amounts of investment income and foreign withholding taxes recorded
on the Fund's accounting records and the USD equivalent amounts actually paid or received. Translation of assets and
liabilities in foreign currencies may include changes in the value of open forward foreign currency contracts and assets
and liabilities other than investments at period end, resulting from changes in foreign exchange rates.
Investments in foreign securities involve certain risks, including those related to economic instability, unfavorable
political developments and currency fluctuations, not present with domestic investments. For example, there may be less
publicly available information about foreign companies, particularly those not subject to the disclosure and reporting
requirements of the U.S. securities laws. Additionally, certain foreign issuers may not be bound by uniform accounting,
auditing and financial reporting requirements and standards of practice comparable to those applicable to domestic
issuers. Investments in foreign securities may also involve the risk of possible adverse changes in investment or
exchange control regulations, nationalization, expropriation or confiscatory taxation and limitation on the removal of
Fund assets. Also, certain foreign stock markets may not be as developed as those in the United States, and securities of
certain foreign issuers (particularly those located in developing countries) may be less liquid and more volatile than
securities of comparable U.S. companies.
The value of foreign currency relative to the Fund's base currency may fluctuate in response to, among other factors,
interest rate changes, intervention (or failure to intervene) by national governments, central banks or supranational
entities such as the International Monetary Fund, the imposition of currency controls and other political or regulatory
State Street Global Advisors Trust Company
State Street Russell Small Cap Value® Index Non-Lending Series Fund
Notes to Financial Statements
December 31, 2018
53
developments. Foreign currency values may decrease significantly both in the short term and over the long term in
response to these and other developments.
I. Derivative Instruments
The Fund's use of derivative instruments involves risks different from, and possibly greater than, the risks associated
with investing directly in securities and other more traditional investments. Derivatives are instruments whose values are
derived from underlying assets, indices, reference rates or a combination of these factors. Derivatives are subject to a
number of risks, such as potential changes in value in response to interest rate changes, index return or other market
developments or as a result of changes unrelated to any reference asset, including changes in credit quality of the Fund's
counterparty to the derivative transaction. Over-the-counter ("OTC") derivatives usually do not have publicly available
price sources and therefore there may be differences between bespoke price offers by dealers. Furthermore, there is a risk
that changes in the value of a derivative may not correlate as anticipated with respect to the change in the value of the
asset, rate, or index underlying the derivative. Derivative transactions can create investment leverage and may be highly
volatile. Use of derivatives other than for hedging purposes may be considered speculative. When the Fund executes a
derivative instrument, the future exposure is potentially unlimited. The value of a derivative instrument will depend, in
part, on the ability and the willingness of the Fund’s derivative counterparty to perform its obligations under the
transaction. A liquid secondary market may not always exist for the Fund’s derivative positions at any time and may
impact the Fund’s ability to establish fair market value of a derivative transaction and close out derivative positions.
Although the use of derivatives is intended to complement the Fund’s performance, it may instead reduce returns and
increase volatility. The measurement of the risks associated with derivative instruments is meaningful only when all
related and offsetting transactions are considered. The Fund must set aside liquid assets or engage in other appropriate
measures to cover its obligations under these derivative instruments.
Certain derivatives, including forward foreign currency contracts and some swap contracts, as applicable, are entered
into OTC under the terms and conditions of International Swaps and Derivatives Association Master Agreements or
similar agreements (“Master Agreements”), which are separately negotiated with each counterparty. Master Agreements
may contain provisions allowing a counterparty to exercise rights to terminate derivative contracts, to the extent not
otherwise waived, against the Fund in the event the Fund’s net assets decline over a period of time by a predetermined
percentage or decrease below a predetermined floor amount. Master Agreements also contain certain provisions for the
Fund to exercise rights to terminate derivative contracts, to the extent not otherwise waived, against counterparties upon
the occurrence of certain events, such as a decline in a counterparty’s credit rating below a specified level. Such rights
for both the counterparty and the Fund to terminate open contracts may be transacted at prices that favor the
counterparty, which could have an adverse effect to the Fund.
Certain derivatives, including futures contracts and centrally cleared swaps, as applicable, are transacted on an exchange
or through a clearinghouse, as applicable. These exchange traded derivatives generally present less counterparty risk to
the Fund because the exchange's clearinghouse, as counterparty to the exchange traded derivatives, guarantees the
derivative against default. Clearinghouses have been established to act as central counterparties on eligible OTC
transactions, including centrally cleared swaps. While the risk of counterparty default is substantially less likely for
exchange traded derivatives, a default by an exchange member under a derivative transaction(s) unrelated to the Fund’s
derivatives transactions could cause a default by the exchange impacting the Fund. Margin, collateral and settlement
requirements are set by each clearinghouse and may vary from one exchange or clearinghouse to another. While offset
rights may exist under applicable law, the Fund does not have a contractual right of offset against a clearing broker or
clearinghouse in the event of default by the clearing broker or clearinghouse.
The Fund values derivatives at fair value as described below and recognizes changes in fair value currently in its results
of operations. Accordingly, the Fund does not follow hedge accounting, even for derivatives employed as economic
hedges. Derivative instruments outstanding at period end, if any, are disclosed in the Schedule of Investments.
State Street Global Advisors Trust Company
State Street Russell Small Cap Value® Index Non-Lending Series Fund
Notes to Financial Statements
December 31, 2018
54
Futures Contracts
The Fund may use futures contracts to manage exposure to the market. Buying futures tends to increase a fund's
exposure to the underlying instrument. Selling futures tends to decrease a fund's exposure to the underlying instrument or
hedge the fair value of other fund investments. When entering into a futures contract, the Fund agrees to buy or sell a
specified quantity of a security, currency, basket of securities or an index for an agreed-upon price on an agreed-upon
date.
Futures contracts are valued at the quoted daily settlement price at the end of each day on the board of trade or exchange
upon which they are traded. Futures contracts are classified within Level 1 of the fair value hierarchy. Upon entering into
a futures contract, the Fund is required to deposit either in cash, currency or securities, an amount ("initial margin") equal
to a certain percentage of the nominal value of the contract. Subsequent payments are made or received by the Fund
periodically, depending on the fluctuation in the value of the underlying instrument, and are recorded as variation margin
receivable or payable with a corresponding offset in unrealized gains or losses. The Fund recognizes a realized gain or
loss when a contract is closed or expires.
Futures contracts involve, to varying degrees, credit and market risks. The Fund enters into futures contracts only on
exchanges or boards of trade where the exchange or board of trade acts as the counterparty to the transaction. Thus,
credit risk on such transactions is limited to the failure of the exchange or board of trade. Losses in value may arise from
changes in the value of the underlying instruments or if there is an illiquid secondary market for the contracts. In
addition, there is the risk that there may not be an exact correlation between movements in the price of a futures contract
and movements in the price of the underlying instrument.
During the period, the Fund entered into certain derivative contract types. These instruments were used to meet the
Fund's investment objectives and to obtain and/or manage exposure related to the risks below. The following table sets
forth the fair value of the Fund's derivative contracts for trading activities by certain primary underlying risk types as of
the end of the period. The values in the table below exclude the effects of collateral received or posted pursuant to
derivative contracts, and therefore are not necessarily representative of the Fund's net exposure.
Fair Values of Asset and Liability Derivative Contracts at December 31, 2018:
Derivatives not accounted
for as hedging instruments Credit Equity Foreign
Exchange Interest Rate Total
Liability Derivative
Variation margin
receivable/(payable)* $ - $ (168,383) $ - $ - $ (168,383)
*Includes cumulative appreciation/(depreciation) of futures contracts as reported in the Schedule of Investments. Only
current day's variation margin is reported within the Statement of Assets and Liabilities.
State Street Global Advisors Trust Company
State Street Russell Small Cap Value® Index Non-Lending Series Fund
Notes to Financial Statements
December 31, 2018
55
The following tables set forth by certain primary underlying risk types the Fund's gains and (losses) related to derivative
activities for the period ended December 31, 2018.
Effect of Derivative Instruments on the Statement of Operations - Net Realized Gain/(Loss):
Derivatives not accounted
for as hedging instruments Credit Equity Foreign
Exchange Interest Rate Total
Futures contracts $ - $ (491,972) $ - $ - $ (491,972)
Effect of Derivative Instruments on the Statement of Operations - Net Change in Unrealized Appreciation
(Depreciation):
Derivatives not accounted
for as hedging instruments Credit Equity Foreign
Exchange Interest Rate Total
Futures contracts $ - $ (174,106) $ - $ - $ (174,106)
During the period ended December 31, 2018, the Fund had an average of 24 futures contracts outstanding.
For financial reporting purposes, the Fund does not offset derivative assets or liabilities, including those that may be
subject to an enforceable Master Agreement, on the Statement of Assets and Liabilities. Futures that settle variation
margin daily are included within variation margin receivable or payable on the Statement of Assets and Liabilities. The
following table sets forth the Fund's net exposure to derivative assets and liabilities available for offset and net of
collateral at December 31, 2018:
Derivative Type Gross Assets Amounts Eligible
for Offset Net Derivative
Asset Balance Collateral
(Received) Net Exposure
Futures contracts $ 17,010 $ - $ 17,010 $ - $ 17,010
The actual value of collateral, if any, may be more than the amount presented.
3. Concentration of Ownership
The following information illustrates concentration of ownership of participants owning units in excess of 10% of total
units outstanding as well as units owned by other SSGA Collective Investment Funds.
10% or Greater Participants % of Units Outstanding held by other
# of Participants % of Units held SSGA Collective Investment Funds
Class C 3 86% - %
4. Risks and Uncertainties
A. Market and Credit Risk
In the normal course of business, the Fund trades financial instruments and enters into financial transactions where risk
of potential loss exists due to changes in the market (market risk). The Fund may be exposed to credit risk, which is the
risk that an issuer, guarantor or liquidity provider of a fixed-income security held by the Fund may be unable or
unwilling, or may be perceived as unable or unwilling, to make timely principal and/or interest payments, or to otherwise
honor its obligations. The Fund may be exposed to additional credit risk that an institution or other entity with which the
Fund has unsettled or open transactions will default, or otherwise fail to perform on its obligations as counterparty.
Additionally, if a counterparty is in bankruptcy, reorganization proceedings, becomes insolvent or otherwise fails to
perform its obligations, the Fund may experience significant delays in obtaining any recovery.
State Street Global Advisors Trust Company
State Street Russell Small Cap Value® Index Non-Lending Series Fund
Notes to Financial Statements
December 31, 2018
56
5. Real Estate Investment Trusts (REITs)
Because the Fund may invest substantially all or a portion of its assets in REITs, the Fund may be subject to certain risks
associated with direct investment in REITs. REITs may be affected by changes in the value of their underlying properties
and by defaults by borrowers or tenants as well as other risks similar to those associated with direct ownership in real
estate, including losses from casualty or condemnation and changes in local and general economic conditions, supply and
demand, interest rates, zoning laws, regulatory limitations on rents, property taxes and operating expenses. Furthermore,
REITs are dependent upon specialized management skills, have limited diversification and are, therefore, subject to risks
inherent in financing a limited number of projects. REITs depend generally on their ability to generate cash flow to make
distributions to shareholders, and certain REITs have self-liquidation provisions by which mortgages held may be paid in
full and distributions of capital returns may be made at any time.
6. Indemnifications
In the normal course of business, the Fund enters into contracts that contain a variety of representations which provide
general indemnifications. The Fund's maximum exposure under these arrangements is unknown as this would involve
future claims that may be made against the Fund that have not yet occurred. However, based on experience, the Trustee
expects the risk of loss to be remote.
7. Recent Accounting Pronouncements
In August 2018, the Financial Accounting Standards Board (“FASB”) issued an amendment to U.S. GAAP that alters the
required disclosures related to fair value measurements. The amendment removes, modifies, and adds certain required
footnote disclosures for assets and liabilities measured at fair value. The amendment is effective for fiscal years
beginning after December 15, 2019; however, entities are allowed to early adopt the amendment immediately. The Fund
has adopted the amendment. Adoption of the amendment has resulted in modification of disclosures in the Security
Valuation section of Note 2.
In March 2017, the FASB issued an amendment to U.S. GAAP, which amends the required amortization period for
purchased callable debt securities that have been purchased at a premium to the amount repayable at the next call date.
The scope of the amendment is limited to debt securities that have an explicit non-contingent call feature at a fixed price
on a preset date or dates. The amendment requires that the aforementioned premium on such debt securities shall be
amortized through the next call date, whereas current U.S. GAAP requires amortization through the maturity date of the
security. Debt securities purchased at a discount will continue to have such discount amortized to the maturity date,
consistent with current U.S. GAAP. The amendment is effective for fiscal years beginning after December 15, 2019. The
Trustee is currently evaluating the impact, if any, of this guidance on the Fund’s financial statements and disclosures.
8. Other
SSGA is involved in various industry-related and other regulatory, governmental and law enforcement inquiries and
subpoenas. The Trustee has reviewed these matters in connection with these financial statements. Based upon that
review, the Trustee has determined that no accrual or loss contingency is required on the Fund's financial statements.
9. Subsequent Events
The Trustee has evaluated subsequent events after December 31, 2018 through March 22, 2019, the date the financial
statements were available to be issued, and has concluded that there is no impact requiring adjustment or disclosure in
these financial statements.
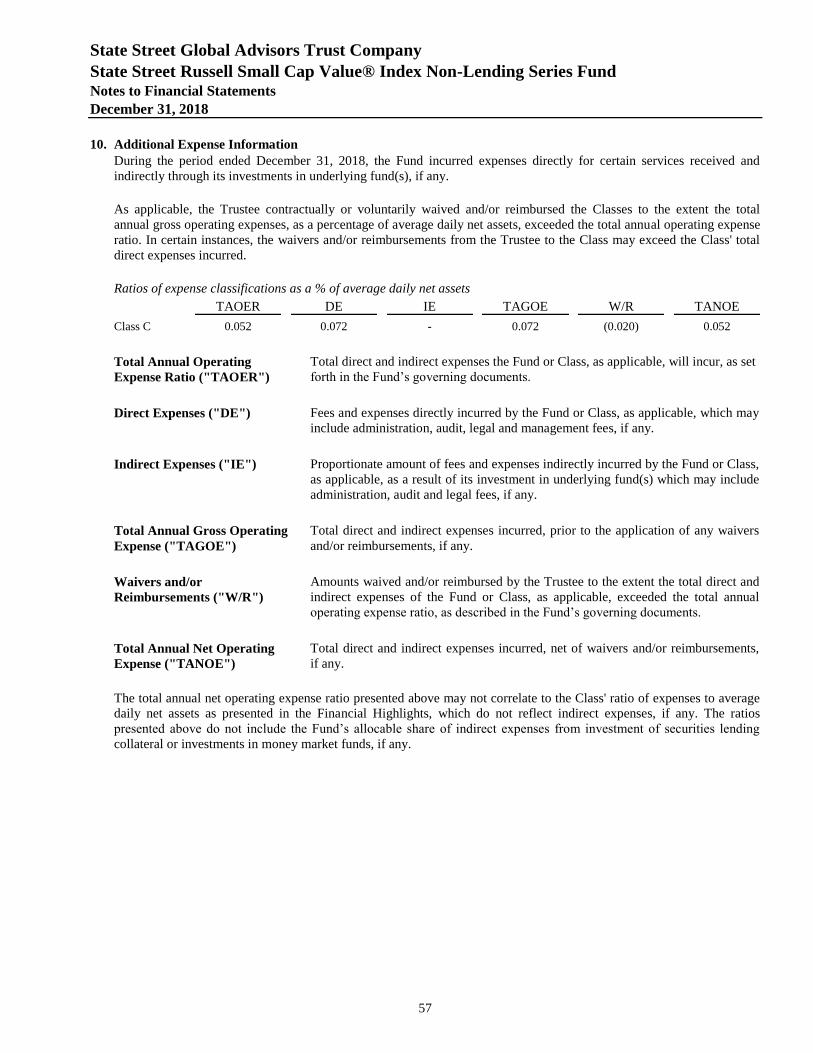
State Street Global Advisors Trust Company
State Street Russell Small Cap Value® Index Non-Lending Series Fund
Notes to Financial Statements
December 31, 2018
57
10. Additional Expense Information
During the period ended December 31, 2018, the Fund incurred expenses directly for certain services received and
indirectly through its investments in underlying fund(s), if any.
As applicable, the Trustee contractually or voluntarily waived and/or reimbursed the Classes to the extent the total
annual gross operating expenses, as a percentage of average daily net assets, exceeded the total annual operating expense
ratio. In certain instances, the waivers and/or reimbursements from the Trustee to the Class may exceed the Class' total
direct expenses incurred.
Ratios of expense classifications as a % of average daily net assets
TAOER DE IE TAGOE W/R TANOE
Class C 0.052 0.072 - 0.072 (0.020) 0.052
Total Annual Operating
Expense Ratio ("TAOER")
Total direct and indirect expenses the Fund or Class, as applicable, will incur, as set
forth in the Fund’s governing documents.
Direct Expenses ("DE")
Fees and expenses directly incurred by the Fund or Class, as applicable, which may
include administration, audit, legal and management fees, if any.
Indirect Expenses ("IE")
Proportionate amount of fees and expenses indirectly incurred by the Fund or Class,
as applicable, as a result of its investment in underlying fund(s) which may include
administration, audit and legal fees, if any.
Total Annual Gross Operating
Expense ("TAGOE")
Total direct and indirect expenses incurred, prior to the application of any waivers
and/or reimbursements, if any.
Waivers and/or
Reimbursements ("W/R")
Amounts waived and/or reimbursed by the Trustee to the extent the total direct and
indirect expenses of the Fund or Class, as applicable, exceeded the total annual
operating expense ratio, as described in the Fund’s governing documents.
Total Annual Net Operating
Expense ("TANOE")
Total direct and indirect expenses incurred, net of waivers and/or reimbursements,
if any.
The total annual net operating expense ratio presented above may not correlate to the Class' ratio of expenses to average
daily net assets as presented in the Financial Highlights, which do not reflect indirect expenses, if any. The ratios
presented above do not include the Fund’s allocable share of indirect expenses from investment of securities lending
collateral or investments in money market funds, if any.

State Street Global Advisors Trust Company
State Street Russell Small Cap Value® Index Non-Lending Series Fund
Brokerage Commissions (unaudited)
December 31, 2018
58
Brokerage Commissions
Subject to its duty to seek best execution, SSGA employs a standard negotiated commission schedule for specific types of
trades (generally equities) entered into on behalf of the Fund. SSGA retains the right to use “soft” or commission dollars
consistent with the parameters of Section 28(e) of the Securities Exchange Act of 1934, as amended (the “Exchange Act”). In
addition, certain client accounts and as applicable, the Fund or underlying fund(s), may participate in arrangements or
programs pursuant to which transactions generate “credits” which may be used by SSGA to obtain third-party research or
brokerage services (“Commission Sharing Agreements” or “CSAs”). SSGA has suspended the CSA program. SSGA may
decide to engage in CSAs again in the future. Participants who invest in the Fund may not limit the ability of the Fund or the
underlying fund(s) to directly or indirectly participate in CSAs.
Research and brokerage services furnished to SSGA may be used in furnishing investment or other advice to all or some
subset of SSGA’s (and/or its affiliates) clients. Services received from a broker-dealer that executed transactions for a
particular fund or client may not necessarily be used by SSGA specifically in servicing that particular fund or account. SSGA
may share some or all of the brokerage and research services received by it with affiliates.
Transactions effected for SSGA's funds or clients that generate credits may be aggregated with transactions effected for
clients of SSGA whose commission dollars do not generate credits used to obtain third-party research and brokerage services
(“Restricted Accounts”). Restricted Accounts may benefit from any third-party research or brokerage services obtained using
credits arising from transactions effected for other funds or clients of SSGA.
The Fund paid an aggregate dollar amount of brokerage commissions of $16,960 for 2018. None of the brokerage
commissions paid were paid to affiliated brokers. Brokerage commissions paid by the Fund may be substantially different
from year to year for multiple reasons, including market volatility and the demand for a particular security. The Fund did not
generate any CSA credits during the period ended December 31, 2018.


![Saka HES ÇBD 24.05[1]](https://img.pdfslide.net/doc/110x75/5571fbe2497959916996072f/saka-hes-cbd-24051.jpg)