Embed Size (px)
Citation preview
STATEMENT OF ACCOUNTS FOR THE
YEAR ENDED 31 MARCH 2012
S T A T E M E N T O F A C C O U N T S
2 0 1 1 / 1 2
CONTENTS
P A G E
Explanatory Foreword 1 Council Approval 1 5 Statement of Responsibilities for the Statement of Accounts 1 6 Movement in Reserves Statement 1 7 Comprehensive Income and Expenditure Statement 2 0 Balance Sheet 2 1 Cash Flow Statement 2 3 Notes to the Accounts 2 4 Housing Revenue Account Income and Expenditure Statement 1 0 8 Movement on the Housing Revenue Account Statement 1 1 0 Notes to the Housing Revenue Account 1 1 1 Collection Fund 1 2 0 Notes to the Collection Fund 1 2 1 Independent Audit Opinion and Certificate 1 2 4 Glossary 1 2 7
S T A T E M E N T O F A C C O U N T S
2 0 1 1 / 1 2
E X P L A N A T O R Y F O R E W O R D The Statement of Accounts The purpose of the Accounts, which follow, is to give electors, those subject to locally levied taxes and charges, Members of the Council, employees and other interested parties clear information about the Council’s finances. The Accounts show the financial performance for 2011/12 and the financial position at 31 March 2012. The Accounts present expenditure and income incurred by the Council in the financial year 2011/12 and highlight changes in the financial position of the Council over the course of the year. The financial statements have been prepared in accordance with the Code of Practice on Local Authority Accounting in the UK (the code) published by the Chartered Institute of Public Finance and Accountancy (CIPFA). The Statement of Accounts consist of various sections and statements, which are briefly explained below: An Explanatory Foreword – this provides information on the format of this Statement of Accounts as well as a review of the financial position of the Council for the financial year. The Statement of Responsibilities – this details the responsibilities of the Council and the S151 Officer concerning the Council’s financial affairs and the actual Statement of Accounts. The Audit Opinion and Certificate – this is provided by the Audit Commission following the completion of the annual audit. The Accounting Policies – this statement explains the basis for the recognition, measurement and disclosure of transactions and other events in the accounts. The Core Financial Statements, comprising:
• The Movements in Reserves Statement – this statement shows the movement in year on the different reserves held by the Council, analysed into ‘usable’ (i.e. those that can be applied to fund expenditure or reduce local taxation) and other unusable reserves.
• The Comprehensive Income and Expenditure Statement – this statement
shows the accounting cost in the year of providing services in accordance with generally accepted accounting practices, rather than the amount funded from taxation. The Council raises taxation to cover the cost of expenditure in accordance with regulations; this may be different from the accounting cost. The taxation position is shown in the Movement in Reserves Statement.
• The Balance Sheet – the Balance Sheet shows the value as at the Balance
Sheet date of the assets and liabilities recognised by the Council. The net assets of the Council are (assets less liabilities) matched by the reserves held by the Council.
1
S T A T E M E N T O F A C C O U N T S
2 0 1 1 / 1 2
• The Cash Flow Statement – this statement shows the changes in cash and
cash equivalents of the Council during the year. It shows how the Council generates and uses cash and cash equivalents by classifying cash flows as operating, investing and financing activities.
The Supplementary Statements, comprising:
• The Housing Revenue Income and Expenditure Statement - this statement shows the economic cost in the year of providing housing services in accordance with generally accepted accounting practices, rather than the amount to be funded from rents and government grants. The Council charges rents to cover expenditure in accordance with regulations, this may be different from the accounting cost. The increase or decrease in the year, on the basis of which rents are raised, is shown in the Movement on the HRA Statement
• The Movement on the HRA Statement – this statement takes the outturn on the
HRA Income and Expenditure Statement and reconciles it to the surplus or deficit for the year on the HRA Balance, calculated in accordance with the requirements of the Local Government and Housing Act 1989.
• The Collection Fund Statement- this statement is an agent’s statement that
reflects the statutory obligation for billing authorities (such as the City of Lincoln Council) to maintain a separate Collection Fund. The statement shows the transactions of the Council in relation to the collection from council tax and business rate payers and distribution to Lincolnshire County Council, Lincolnshire Police Authority and Government of council tax and national non-domestic rates.
The Notes to the Financial Statements – these provide supporting and explanatory information on the Financial Statements. Financial Summary 2011/12 2011/12 has been another challenging year financially as the economic climate remained largely unchanged from the previous and so continued to present difficult circumstances with regards to the financial management of the Council. Despite some initial encouraging signs in the UK economy during 2011, the overall recovery remains weak and continues to be affected by the financial difficulties being experienced by the Eurozone countries. The threat of a dip back into recession remains during 2012 and there have been no significant improvements to the performance of the financial and property markets. Hence, the most challenging areas continued to be treasury management, asset values and the use of, and demand for, Council services, coupled with a real terms decrease in Central Government funding. The continued difficult condition in the economy gave rise to a number of specific issues for the Council, as follows;
• The Bank of England’s policy of continuing to maintain low interest rates to combat the liquidity crisis has had a significant effect on the
2
S T A T E M E N T O F A C C O U N T S
2 0 1 1 / 1 2
Council’s income from investments. In addition, the ongoing financial instability in the Eurozone has meant that the Council has limited the placing of investments to mainly short term deposits in 2011/12 to reduce risk but thereby reducing investment returns.
• Investment counterparty risk remains high. As a result there continues to be a
very limited range of counterparties available to the Council for investment purposes.
• Although the property market has continued to show poor performance in
2011/12, the overall market value of the Council’s property holdings increased by £1.76m. This was mainly due to revaluations of previously unrecognised land holdings which have been brought into use, either for rental or for development purposes. There were also net downwards revaluations and impairments of £1.657m in 2011/12 charged to the Comprehensive Income and Expenditure Statement.
• The poor performance of the property market has also reduced the Council’s
ability to generate capital receipts affecting the affordability of the General Fund Investment Programme with the financing of schemes being heavily reliant on the sales of Council assets.
• Demand for services such as Council tax and Housing Benefits has continued
to increase, with currently 12,171 household (28%) in the City in receipt of Housing and/or Council Tax Benefit. Services including Council Housing and Customer Services are also continuing to experience high levels of demand.
• Income has continued to remain at historically low levels in a number of areas
e.g. planning regulation fees, local land charges and car parking. In spite of the challenges the Council has faced it has maintained sound financial management and has delivered spending within budget in both the General Fund and the Housing Revenue Account, whilst over achieving its target for the delivery of revenue savings; and has delivered over £35.9m of capital investment, of which £24.931m relates a payment to Central Government to buy out of the Housing Revenue Account subsidy system and to become a ‘self financed’ Housing Authority from 1 April 2012. Revenue Income and Expenditure General Fund The General Fund account covers all net spending by the Council on services other than those accounted for in the Housing Revenue Account. General Fund services are partly paid for by Government Grants and contributions from Business Rates, with the balance being funded from Council Tax.
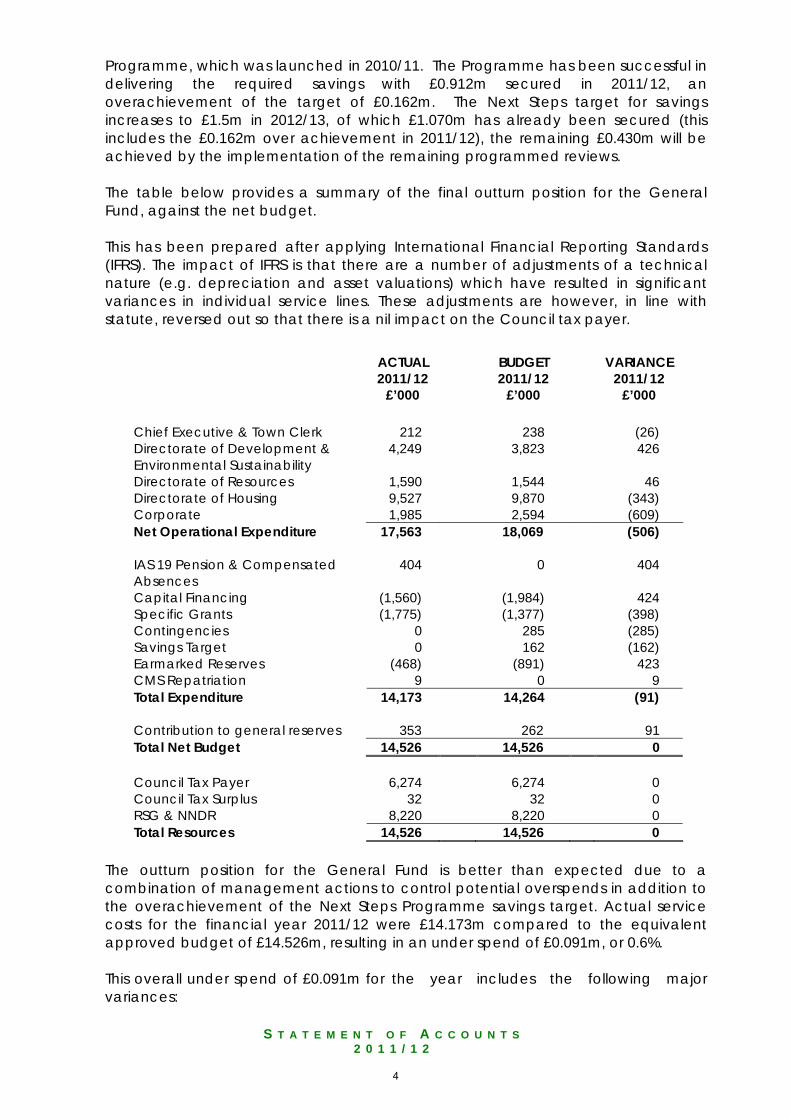
For 2011/12, the approved net expenditure budget for General Fund services was £14.264m. After allowing for planned contributions of £0.262m to non-earmarked general reserves the total Net General Fund Budget for 2011/12 was £14.526m. The Net General Fund Budget of £14.526m assumed the achievement of a £0.750m savings target to be delivered as part of the Council’s Next Steps
3
S T A T E M E N T O F A C C O U N T S
2 0 1 1 / 1 2
Programme, which was launched in 2010/11. The Programme has been successful in delivering the required savings with £0.912m secured in 2011/12, an overachievement of the target of £0.162m. The Next Steps target for savings increases to £1.5m in 2012/13, of which £1.070m has already been secured (this includes the £0.162m over achievement in 2011/12), the remaining £0.430m will be achieved by the implementation of the remaining programmed reviews. The table below provides a summary of the final outturn position for the General Fund, against the net budget. This has been prepared after applying International Financial Reporting Standards (IFRS). The impact of IFRS is that there are a number of adjustments of a technical nature (e.g. depreciation and asset valuations) which have resulted in significant variances in individual service lines. These adjustments are however, in line with statute, reversed out so that there is a nil impact on the Council tax payer.
ACTUAL 2011/12
£’000
BUDGET 2011/12
£’000
VARIANCE 2011/12
£’000 Chief Executive & Town Clerk 212 238 (26) Directorate of Development & Environmental Sustainability
4,249 3,823 426
Directorate of Resources 1,590 1,544 46 Directorate of Housing 9,527 9,870 (343) Corporate 1,985 2,594 (609) Net Operational Expenditure 17,563 18,069 (506) IAS 19 Pension & Compensated Absences
404 0 404
Capital Financing (1,560) (1,984) 424 Specific Grants (1,775) (1,377) (398) Contingencies 0 285 (285) Savings Target 0 162 (162) Earmarked Reserves (468) (891) 423 CMS Repatriation 9 0 9 Total Expenditure 14,173 14,264 (91) Contribution to general reserves 353 262 91 Total Net Budget 14,526 14,526 0 Council Tax Payer 6,274 6,274 0 Council Tax Surplus 32 32 0 RSG & NNDR 8,220 8,220 0 Total Resources 14,526 14,526 0
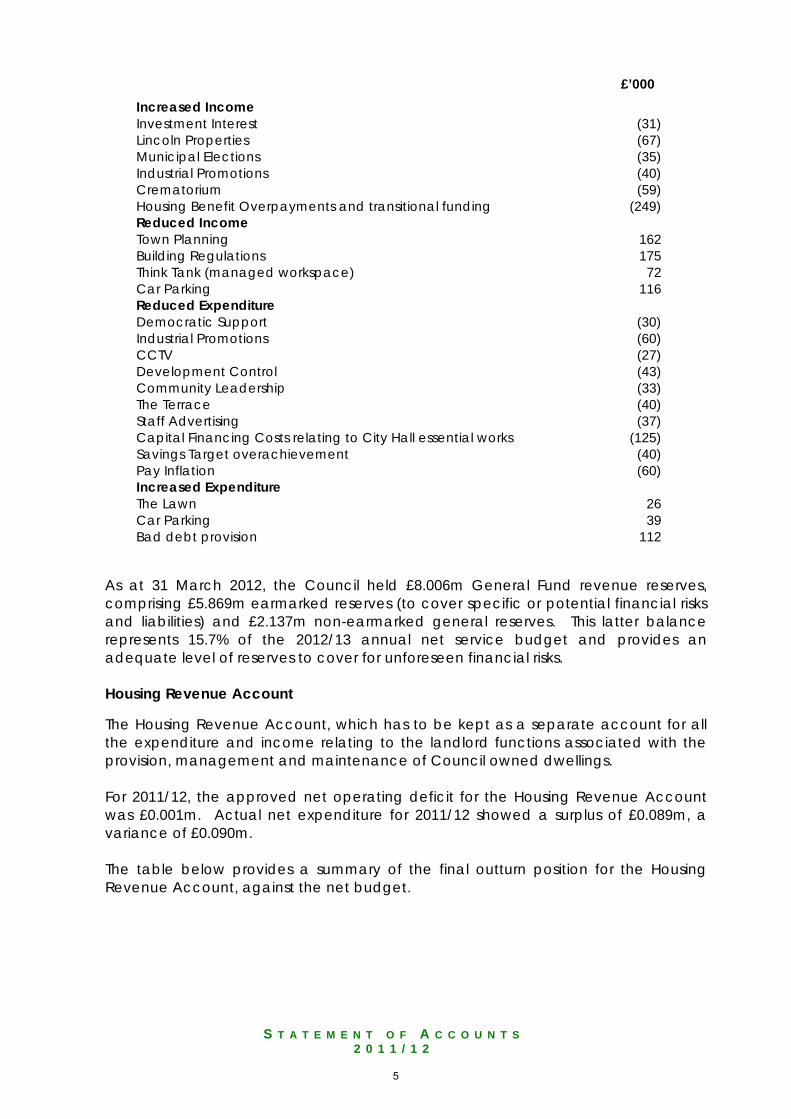
The outturn position for the General Fund is better than expected due to a combination of management actions to control potential overspends in addition to the overachievement of the Next Steps Programme savings target. Actual service costs for the financial year 2011/12 were £14.173m compared to the equivalent approved budget of £14.526m, resulting in an under spend of £0.091m, or 0.6%. This overall under spend of £0.091m for the year includes the following major variances:
4
S T A T E M E N T O F A C C O U N T S
2 0 1 1 / 1 2
£’000 Increased Income Investment Interest (31) Lincoln Properties (67) Municipal Elections (35) Industrial Promotions (40) Crematorium (59) Housing Benefit Overpayments and transitional funding (249) Reduced Income Town Planning 162 Building Regulations 175 Think Tank (managed workspace) 72 Car Parking 116 Reduced Expenditure Democratic Support (30) Industrial Promotions (60) CCTV (27) Development Control (43) Community Leadership (33) The Terrace (40) Staff Advertising (37) Capital Financing Costs relating to City Hall essential works (125) Savings Target overachievement (40) Pay Inflation (60) Increased Expenditure The Lawn 26 Car Parking 39 Bad debt provision 112
As at 31 March 2012, the Council held £8.006m General Fund revenue reserves, comprising £5.869m earmarked reserves (to cover specific or potential financial risks and liabilities) and £2.137m non-earmarked general reserves. This latter balance represents 15.7% of the 2012/13 annual net service budget and provides an adequate level of reserves to cover for unforeseen financial risks. Housing Revenue Account
The Housing Revenue Account, which has to be kept as a separate account for all the expenditure and income relating to the landlord functions associated with the provision, management and maintenance of Council owned dwellings. For 2011/12, the approved net operating deficit for the Housing Revenue Account was £0.001m. Actual net expenditure for 2011/12 showed a surplus of £0.089m, a variance of £0.090m. The table below provides a summary of the final outturn position for the Housing Revenue Account, against the net budget.
5
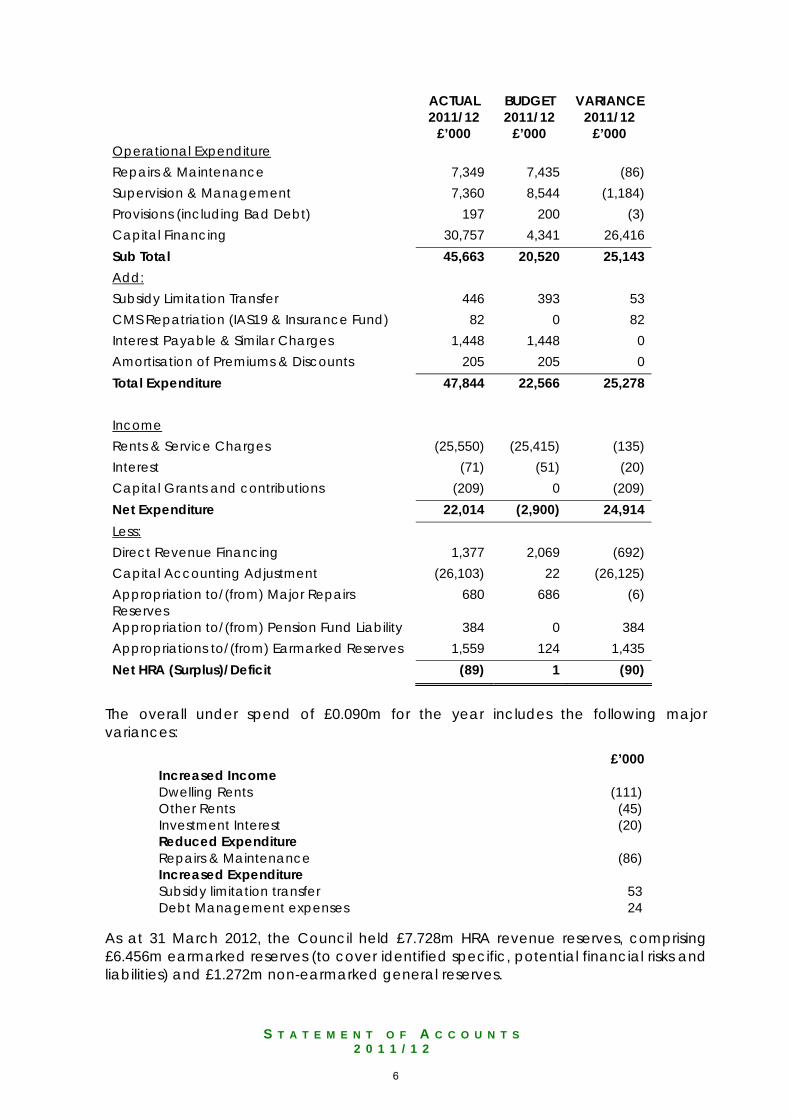
S T A T E M E N T O F A C C O U N T S
2 0 1 1 / 1 2
ACTUAL
2011/12 £’000
BUDGET 2011/12
£’000
VARIANCE 2011/12
£’000 Operational Expenditure Repairs & Maintenance 7,349 7,435 (86) Supervision & Management 7,360 8,544 (1,184) Provisions (including Bad Debt) 197 200 (3) Capital Financing 30,757 4,341 26,416 Sub Total 45,663 20,520 25,143 Add: Subsidy Limitation Transfer 446 393 53 CMS Repatriation (IAS19 & Insurance Fund) 82 0 82 Interest Payable & Similar Charges 1,448 1,448 0 Amortisation of Premiums & Discounts 205 205 0 Total Expenditure 47,844 22,566 25,278 Income Rents & Service Charges (25,550) (25,415) (135) Interest (71) (51) (20) Capital Grants and contributions (209) 0 (209) Net Expenditure 22,014 (2,900) 24,914 Less: Direct Revenue Financing 1,377 2,069 (692) Capital Accounting Adjustment (26,103) 22 (26,125) Appropriation to/(from) Major Repairs Reserves
680 686 (6)
Appropriation to/(from) Pension Fund Liability 384 0 384 Appropriations to/(from) Earmarked Reserves 1,559 124 1,435 Net HRA (Surplus)/Deficit (89) 1 (90)
The overall under spend of £0.090m for the year includes the following major variances:
£’000 Increased Income Dwelling Rents (111) Other Rents (45) Investment Interest (20) Reduced Expenditure Repairs & Maintenance (86) Increased Expenditure Subsidy limitation transfer 53 Debt Management expenses 24
As at 31 March 2012, the Council held £7.728m HRA revenue reserves, comprising £6.456m earmarked reserves (to cover identified specific, potential financial risks and liabilities) and £1.272m non-earmarked general reserves.
6
S T A T E M E N T O F A C C O U N T S
2 0 1 1 / 1 2
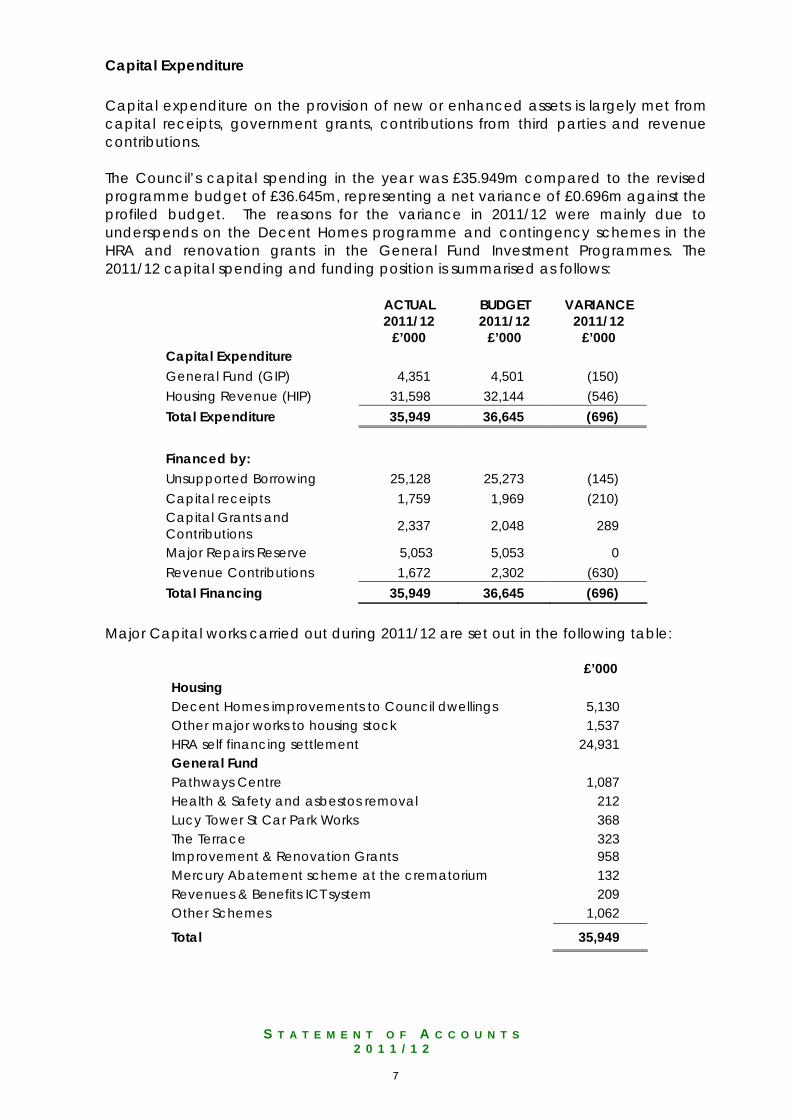
Capital Expenditure Capital expenditure on the provision of new or enhanced assets is largely met from capital receipts, government grants, contributions from third parties and revenue contributions. The Council’s capital spending in the year was £35.949m compared to the revised programme budget of £36.645m, representing a net variance of £0.696m against the profiled budget. The reasons for the variance in 2011/12 were mainly due to underspends on the Decent Homes programme and contingency schemes in the HRA and renovation grants in the General Fund Investment Programmes. The 2011/12 capital spending and funding position is summarised as follows:
ACTUAL 2011/12
£’000
BUDGET 2011/12
£’000
VARIANCE 2011/12
£’000 Capital Expenditure General Fund (GIP) 4,351 4,501 (150) Housing Revenue (HIP) 31,598 32,144 (546) Total Expenditure 35,949 36,645 (696) Financed by: Unsupported Borrowing 25,128 25,273 (145) Capital receipts 1,759 1,969 (210) Capital Grants and Contributions 2,337 2,048 289
Major Repairs Reserve 5,053 5,053 0 Revenue Contributions 1,672 2,302 (630) Total Financing 35,949 36,645 (696)
Major Capital works carried out during 2011/12 are set out in the following table:
£’000 Housing Decent Homes improvements to Council dwellings 5,130 Other major works to housing stock 1,537 HRA self financing settlement 24,931 General Fund Pathways Centre 1,087 Health & Safety and asbestos removal 212 Lucy Tower St Car Park Works 368 The Terrace 323 Improvement & Renovation Grants 958 Mercury Abatement scheme at the crematorium 132 Revenues & Benefits ICT system 209 Other Schemes 1,062
Total 35,949
7
S T A T E M E N T O F A C C O U N T S
2 0 1 1 / 1 2
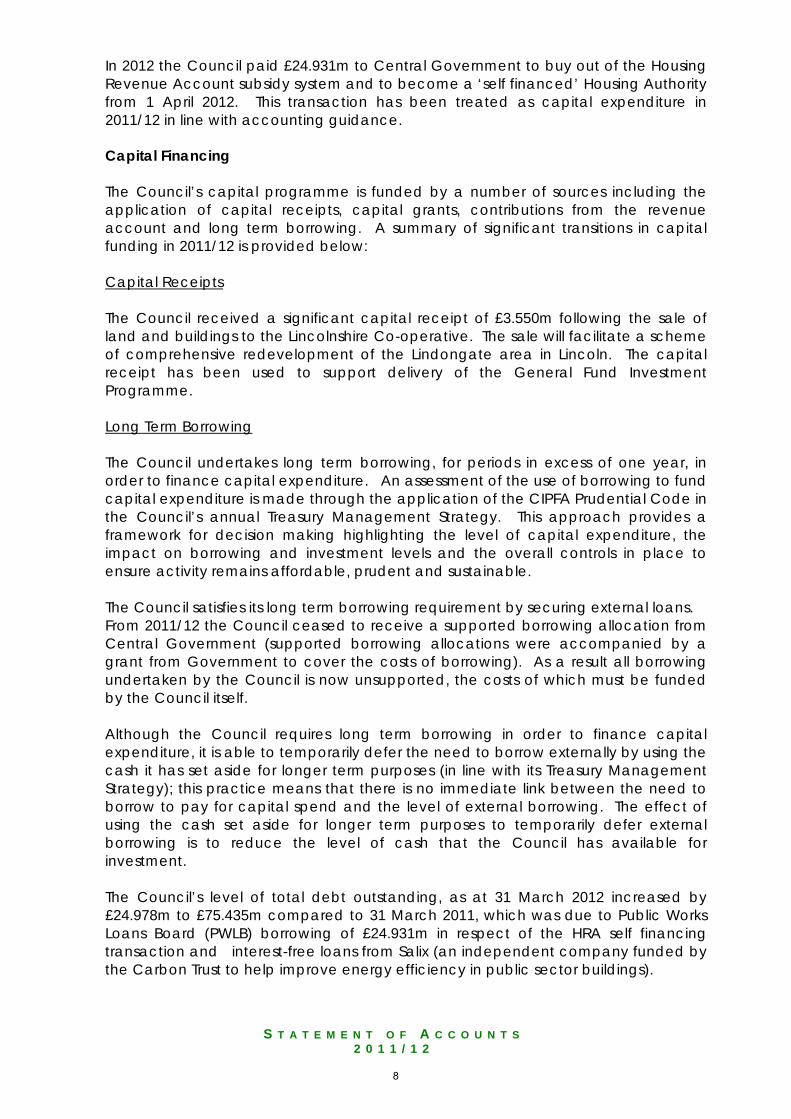
In 2012 the Council paid £24.931m to Central Government to buy out of the Housing Revenue Account subsidy system and to become a ‘self financed’ Housing Authority from 1 April 2012. This transaction has been treated as capital expenditure in 2011/12 in line with accounting guidance. Capital Financing The Council’s capital programme is funded by a number of sources including the application of capital receipts, capital grants, contributions from the revenue account and long term borrowing. A summary of significant transitions in capital funding in 2011/12 is provided below: Capital Receipts The Council received a significant capital receipt of £3.550m following the sale of land and buildings to the Lincolnshire Co-operative. The sale will facilitate a scheme of comprehensive redevelopment of the Lindongate area in Lincoln. The capital receipt has been used to support delivery of the General Fund Investment Programme. Long Term Borrowing
The Council undertakes long term borrowing, for periods in excess of one year, in order to finance capital expenditure. An assessment of the use of borrowing to fund capital expenditure is made through the application of the CIPFA Prudential Code in the Council’s annual Treasury Management Strategy. This approach provides a framework for decision making highlighting the level of capital expenditure, the impact on borrowing and investment levels and the overall controls in place to ensure activity remains affordable, prudent and sustainable. The Council satisfies its long term borrowing requirement by securing external loans. From 2011/12 the Council ceased to receive a supported borrowing allocation from Central Government (supported borrowing allocations were accompanied by a grant from Government to cover the costs of borrowing). As a result all borrowing undertaken by the Council is now unsupported, the costs of which must be funded by the Council itself. Although the Council requires long term borrowing in order to finance capital expenditure, it is able to temporarily defer the need to borrow externally by using the cash it has set aside for longer term purposes (in line with its Treasury Management Strategy); this practice means that there is no immediate link between the need to borrow to pay for capital spend and the level of external borrowing. The effect of using the cash set aside for longer term purposes to temporarily defer external borrowing is to reduce the level of cash that the Council has available for investment. The Council’s level of total debt outstanding, as at 31 March 2012 increased by £24.978m to £75.435m compared to 31 March 2011, which was due to Public Works Loans Board (PWLB) borrowing of £24.931m in respect of the HRA self financing transaction and interest-free loans from Salix (an independent company funded by the Carbon Trust to help improve energy efficiency in public sector buildings).
8
S T A T E M E N T O F A C C O U N T S
2 0 1 1 / 1 2
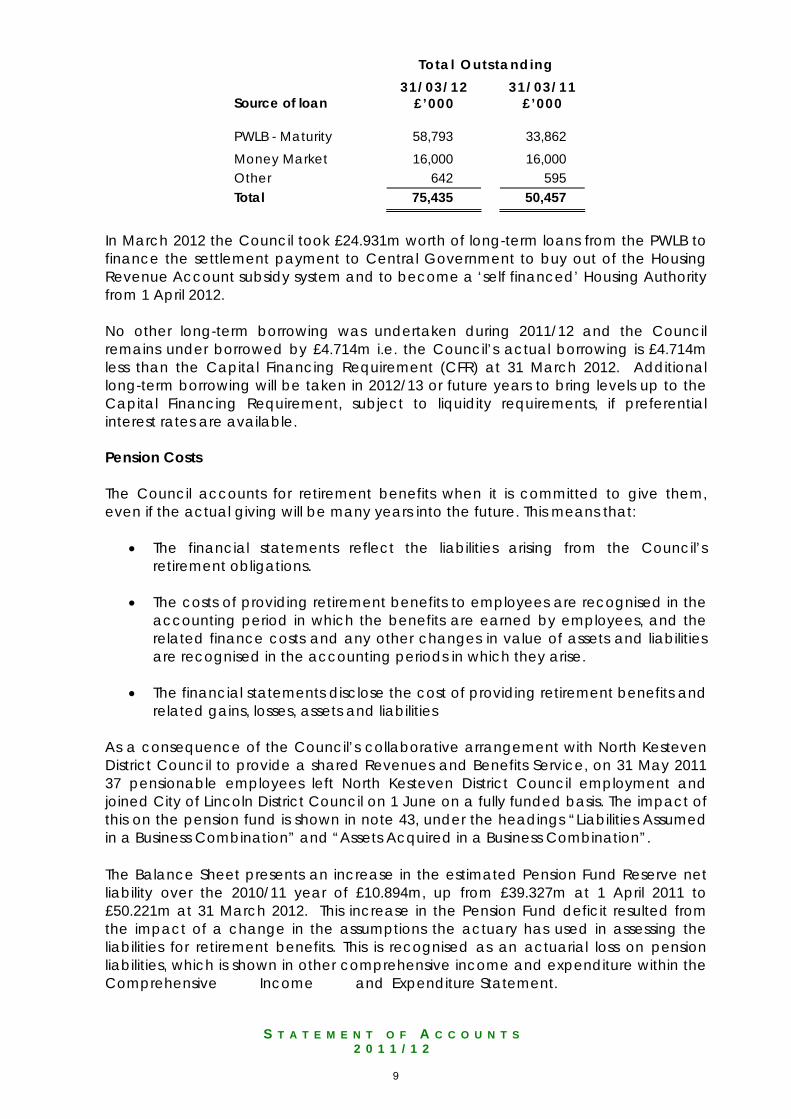
Total Outstanding
Source of loan 31/03/12
£’000
31/03/11 £’000
PWLB - Maturity 58,793 33,862 Money Market 16,000 16,000 Other 642 595 Total 75,435 50,457
In March 2012 the Council took £24.931m worth of long-term loans from the PWLB to finance the settlement payment to Central Government to buy out of the Housing Revenue Account subsidy system and to become a ‘self financed’ Housing Authority from 1 April 2012. No other long-term borrowing was undertaken during 2011/12 and the Council remains under borrowed by £4.714m i.e. the Council’s actual borrowing is £4.714m less than the Capital Financing Requirement (CFR) at 31 March 2012. Additional long-term borrowing will be taken in 2012/13 or future years to bring levels up to the Capital Financing Requirement, subject to liquidity requirements, if preferential interest rates are available. Pension Costs The Council accounts for retirement benefits when it is committed to give them, even if the actual giving will be many years into the future. This means that:
• The financial statements reflect the liabilities arising from the Council’s retirement obligations.
• The costs of providing retirement benefits to employees are recognised in the
accounting period in which the benefits are earned by employees, and the related finance costs and any other changes in value of assets and liabilities are recognised in the accounting periods in which they arise.
• The financial statements disclose the cost of providing retirement benefits and
related gains, losses, assets and liabilities As a consequence of the Council’s collaborative arrangement with North Kesteven District Council to provide a shared Revenues and Benefits Service, on 31 May 2011 37 pensionable employees left North Kesteven District Council employment and joined City of Lincoln District Council on 1 June on a fully funded basis. The impact of this on the pension fund is shown in note 43, under the headings “Liabilities Assumed in a Business Combination” and “Assets Acquired in a Business Combination”. The Balance Sheet presents an increase in the estimated Pension Fund Reserve net liability over the 2010/11 year of £10.894m, up from £39.327m at 1 April 2011 to £50.221m at 31 March 2012. This increase in the Pension Fund deficit resulted from the impact of a change in the assumptions the actuary has used in assessing the liabilities for retirement benefits. This is recognised as an actuarial loss on pension liabilities, which is shown in other comprehensive income and expenditure within the Comprehensive Income and Expenditure Statement.
9
S T A T E M E N T O F A C C O U N T S
2 0 1 1 / 1 2
The statutory arrangements for funding the remaining liability of £50.221m means that this deficit will be made good by the increased level of annual employer contributions payable to the Pension Fund over the remaining estimated average working life of our employees in the Pension Scheme. The latest triennial review of the Pension Fund was completed as at 31 March 2010 and although the results identified that there had been a deterioration in the funding position from a 83% funding level to 72%, this review did not indicate that any immediate changes in the annual contributions were required. The next triennial review is due as at 31 March 2013, when a stabilisation approach will be implemented so that in any three year period rates will only be increased or decreased by a maximum of 1%, thus avoiding any unaffordable increases in employer contributions. Any changes identified as a result of the next triennial review will be effective from 1 April 2014. Future Plans General Fund The Council, along with all other public sector bodies, will continue to face an unprecedented, and extremely challenging short and medium term financial environment as it responds to; the Coalition Government’s Spending Review, announced in October 2010; existing financial pressures, principally the current economic climate; and the publication of a large number of Government White Papers, consultation documents and statutory instruments including:
• The Local Government Resource Review proposals for business rate retention by Councils.
• Council Tax Benefit Reform containing proposals for Councils to take
responsibility for their own schemes. • Proposals to radically overhaul national welfare services, in particular to take
housing benefit services away from local government.
• The Localism Act and its implications for governance, housing and planning arrangements within local government.
• The Open Public Services White Paper that considers, amongst other ideas,
the concept that public services should not necessarily be delivered by the public sector.
As a result of significant grant reductions imposed by the Coalition Government (the Council’s grant funding was reduced by 24.4% over the period 2011/12 to 2012/13) the Council faces a significant challenge if it is to continue to deliver services to the public and remain within a severely reduced funding envelope. The Council’s Medium Term Financial Strategy for 2012-17 is based on a reduction of annual revenue spending of £1.500m in 2012/13, increasing annually to £2.750m by 2015/16. This challenge is not new to the Council and it has in recent years already become accustomed to working within tight budgets and has demonstrated excellent progress in the delivery of its Service Review and Next Steps Programmes, already securing £3.3m annual savings to the revenue budget. The Council’s Next Steps Programme continues to be the most fundamental
10
S T A T E M E N T O F A C C O U N T S
2 0 1 1 / 1 2
element of the Council’s response to the financial and policy environment. The programme brings together into a co-ordinated programme a single unified approach focusing on four core strands:
• Lean Systems Interventions • Collaborative Working • Income Generation • Cost Reductions
It will remain important to maintain the pace and extent of changes that can be delivered from the programme as the Council moves into the completion of phase one and delivery of phase two. The scale of external changes facing the Council means that further radical change will be required for the foreseeable future. In response the Council will seek to continue to make changes across the whole range of activity including how it delivers its services, the organisational structures of these services, relationships with key partners and its human resources policies. It will aim to ensure that the services the Council provides are ‘lean and fit’, achieving the standards agreed with customers and delivering the best possible value for money to the taxpayer. Housing Revenue Account (HRA) With effect from 1 April 2012 the Council’s Housing Revenue Account (HRA) is self financing following its ‘buy out’ of the former housing subsidy system. Under the old system the Council had been paying over £2m per year to the Government in negative subsidy, to be redistributed nationally. The new self financing regime will give the Council as landlord the resources, incentives and flexibility needed to manage its housing stock for the long-term and to drive up quality and efficiency. The regime allows greater certainty about future income as the Council will no longer be subject to annual funding decisions by Central Government. This will support the development of long-term plans and reinvestment of income in the Council’s housing stock. The Council will have greater flexibility to manage its stock in the way that best suits local need and will provide more opportunity for tenants to have a real say in setting priorities looking to the longer term. However, self financing also transfers significant risks from Central Government to local authorities. The Council will bear the responsibility for the long term security and viability of council housing in Lincoln. The Council will have to fund all activity related to council housing from the income generated from rents through long term business planning. The Council will be more exposed to changes in interest rates, high inflation and the financial impact of falling stock numbers and it will also need to factor in the impact of changes in government policy e.g. the impacts of the forthcoming welfare reform on income recovery. In order to optimise its resources for council housing over the short, medium and long term the Council has developed a 30 year HRA business plan. A robust business minded approach is being taken to ensure that the Council is in a position to optimise the benefits of its new responsibilities and to minimise the impact of the additional risks that self financing brings. Ultimately the business plan aims to ensure that the Council is in a position to continue to enhance the housing stock,
11
S T A T E M E N T O F A C C O U N T S
2 0 1 1 / 1 2
and provide quality, affordable services to tenants. Capital Expenditure The Council’s capital programmes will deliver projects to the value of £75.7m over the next five years, with £17.7m estimated to be spent in 2012/13. This includes significant investment and improvement to Council dwellings, and Council buildings, housing assistance grant aid, a mortgage indemnity scheme to support first time buyers and the provision of a new burial site. Capital resources for the next five years include capital receipts, government grants, contributions from third parties and revenue contributions. The General Fund element of the programme is heavily reliant upon capital receipts with a target of £10.375m over the period, 74% of the overall programme. The continued poor performance of property markets increases the risk to the Council of not generating the required level of capital receipts. In response to this the Council’s Asset Management Plan includes a major review programme of assets to identify potential disposals. Additionally, ongoing capital commitments will be reviewed regularly to ensure that the capital programme remains affordable. This will require strong integration of the Council’s Capital Strategy, Asset Management Plan, Treasury Management Strategy and balancing the impact of any changes on the revenue position. The Housing element of the capital programme is predominantly reliant upon revenue contributions from the Housing Revenue Account (HRA). This places enormous pressure on the revenue budget and is a fundamental consideration in the development of the 30 year HRA business plan. In the first 10 years of the Housing Business Plan the majority of revenue resources will be fully committed to support the capital investment required in the existing stock. Given the level of revenue support required, and increased dependency on this as the primary source of capital funding, it is recognised that it is critical that there is robust budget management of the HRA and that opportunities to achieve efficiencies and maintain/maximise income streams are actively pursued. Summary Despite the challenging financial environment the Council has continued to maintain sound, prudent financial management and remains in a good financial position, balances remain at prudent levels and the necessary provisions have been set aside for future liabilities or losses. However due to the level of uncertainty and risks facing the Council, particularly the significant reductions in Central Government funding, it needs to continue to respond positively to these challenges and continue to manage its affairs in such a way as to ensure the economic, efficient and effective use of its resources, and to safeguard its assets for the future. The Council is committed to its vision to improve the quality of life for its residents and that will be paramount to every decision it makes.
Group Accounts The increasing scope and scale of local authorities moving away from traditional ways of providing services makes it increasingly difficult for the Council’s own
12
S T A T E M E N T O F A C C O U N T S
2 0 1 1 / 1 2
financial statements to present fairly all the aspects of control over service provision and accountability for all resources and exposure to risks that the Council has taken on. A consolidated set of group accounts can make a vital contribution towards giving users a full picture of the Council’s sphere of control and influence. The Council has identified that the interest that it holds in Investors in Lincoln Ltd meets the test of ‘joint control’ and as such should be accounted for as a Joint Venture. However, after assessing the criteria for materiality, has concluded that the amounts are not material to the fair presentation of the financial position and transactions of the Council and to the understanding of the Statement of Accounts by a reader. Investors in Lincoln Ltd has therefore not been consolidated into the Council’s accounts. Details of transactions and relevant balances with Investors in Lincoln Ltd can be found in note 37 (related parties). The Council has a collaborative arrangement with North Kesteven and West Lindsey District Councils to provide the Central Lincolnshire Joint Planning Unit. This arrangement is hosted by North Kesteven District Council. The Council also has a collaborative arrangement with North Kesteven to provide a shared Revenues and Benefits Service. This shared service is hosted by the City of Lincoln Council. Both of these arrangements are governed through a Joint Committee representing each of the partner authorities. These arrangements are considered as Jointly Controlled Operations, where ventures use their own resources to undertake an activity subject to joint control, and as such do not require consolidation into the Council’s accounts. The Council’s proportion of activity is accounted for separately within the Core Financial Statements.
Changes in Accounting Policies In 2011/12 the code introduced a change to the accounting treatment for heritage assets held by the Council. Heritage assets are now required to be carried in the Council’s Balance Sheet at valuation. Previously these assets had been recorded as community assets in property, plant and equipment at historic (usually de-minimis) cost . The net effect of the change in accounting policy in 2011/12 has been that heritage assets are recognised at £4.667m in the Balance Sheet resulting in an increase to the Revaluation Reserve of £4.652m. These assets had not been previously recognised in the Balance Sheet. Further details on the effect of the new accounting policy can be found in note 48 (Heritage Assets: Change in Accounting Policy Required by the code). Prior Period Adjustment The financial statements for the previous year were the first to be prepared under International Financial Reporting Standards (IFRS). This included classifying all property assets held by the Council as either Investment Properties (IP) or Property, Plant & Equipment (PPE), according to strict criteria set out in the code. In preparing the financial statements for 2011/12, a review of this classification was undertaken in the light of additional information available. The result of this review is that property and land to the value of £13.797m, which was classified as
13

S T A T E M E N T O F A C C O U N T S
2 0 1 1 / 1 2
investment property in the previous year’s financial statements, do not fully meet the criteria and should therefore, have been classified under property, plant and equipment. A prior period adjustment has been made to the financial statements to correct the original misclassification. The Balance Sheet at 1 April 2010 and 31 March 2011 has been restated to reflect the required changes. Further Information Further information about the accounts is available on request from the Directorate of Resources, City Hall, Beaumont Fee Lincoln LN1 1DB. In addition, local electors have a statutory right to inspect the accounts before the audit is completed. The availability of the accounts for inspection is advertised in the local press and on the Council’s website.
14
S T A T E M E N T O F A C C O U N T S
2 0 1 1 / 1 2
C O U N C I L A P P R O V A L
The Statement of Accounts for the year 1 April 2011 to 31 March 2012 has been prepared and I confirm that these Accounts were approved by the City of Lincoln Council, at the meeting held on 25 September 2012. Karen Lee Councillor Karen Lee Chairman of Council Date: 25 September 2012
15
S T A T E M E N T O F A C C O U N T S
2 0 1 1 / 1 2
E M E N T O F R E S P O N S I B I L I T I E S F O R T H E S T A T E M E N T O F A C C O U N T S
The Authority’s Responsibilities
The Authority is required:
• to make arrangements for the proper administration of its financial affairs and to ensure that one of its officers has the responsibility for the administration of those affairs. In this Authority, that officer is the Director of Resources;
• to manage its affairs to ensure economic, efficient and effective use of resources and safeguard its assets;
• to approve the Statement of Accounts. The Director of Resources Responsibilities The Director of Resources is responsible for the preparation of the Authority’s Statement of Accounts in accordance with proper practices as set out in the Code of Practice on Local Authority Accounting in the UK (‘the code ’). In preparing this Statement of Accounts, the Director of Resources has:
• selected suitable accounting policies and then applied them consistently;
• made judgements and estimates that were reasonable and prudent;
• complied with the Code of Practice. The Director of Resources has also:
• kept proper accounting records which were up to date;
• taken reasonable steps for the prevention and detection of fraud and other irregularities.
The Accounts present a true and fair view of the financial position of the Authority at 31 March 2012 and its income and expenditure for the year ended on that date. ANGELA ANDREWS A ANDREWS, CPFA, Director of Resources DATE: 25 September 2012
16
S T A T E M E N T O F A C C O U N T S
2 0 1 1 / 1 2
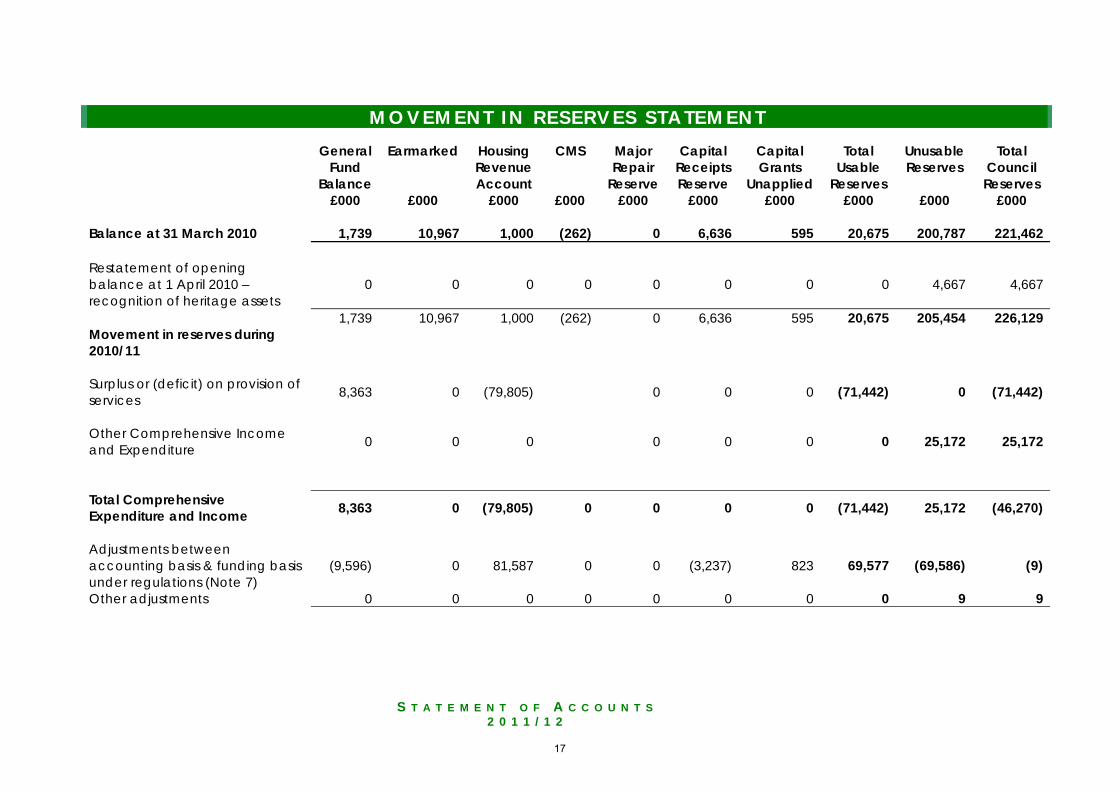
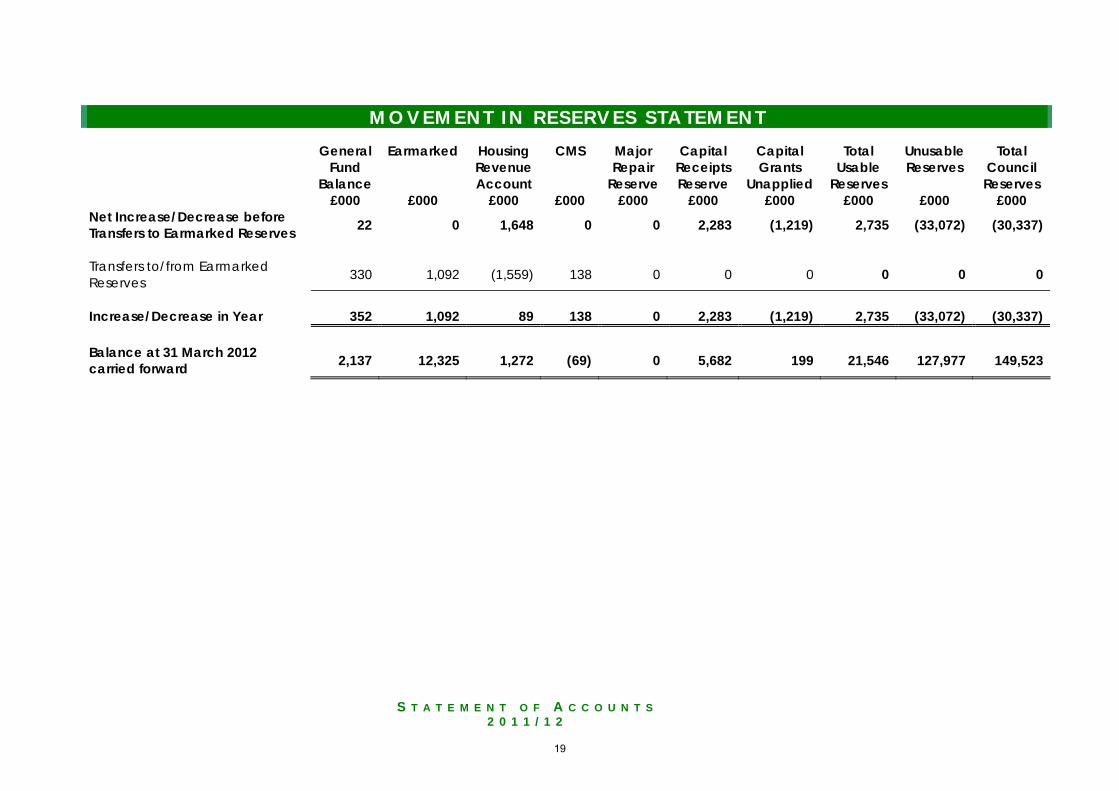
M O V E M E N T I N R E S E R V E S S T A T E M E N T
General Earmarked Housing CMS Major Capital Capital Total Unusable Total Fund Revenue Repair Receipts Grants Usable Reserves Council Balance Account Reserve Reserve Unapplied Reserves Reserves £000 £000 £000 £000 £000 £000 £000 £000 £000 £000 Balance at 31 March 2010 1,739 10,967 1,000 (262) 0 6,636 595 20,675 200,787 221,462 Restatement of opening balance at 1 April 2010 – recognition of heritage assets
0 0 0 0 0 0 0 0 4,667 4,667
1,739 10,967 1,000 (262) 0 6,636 595 20,675 205,454 226,129 Movement in reserves during 2010/11
Surplus or (deficit) on provision of services 8,363 0 (79,805) 0 0 0 (71,442) 0 (71,442)
Other Comprehensive Income and Expenditure 0 0 0 0 0 0 0 25,172 25,172
Total Comprehensive Expenditure and Income 8,363 0 (79,805) 0 0 0 0 (71,442) 25,172 (46,270)
Adjustments between accounting basis & funding basis under regulations (Note 7)
(9,596) 0 81,587 0 0 (3,237) 823 69,577 (69,586) (9)
Other adjustments 0 0 0 0 0 0 0 0 9 9
17
S T A T E M E N T O F A C C O U N T S
2 0 1 1 / 1 2
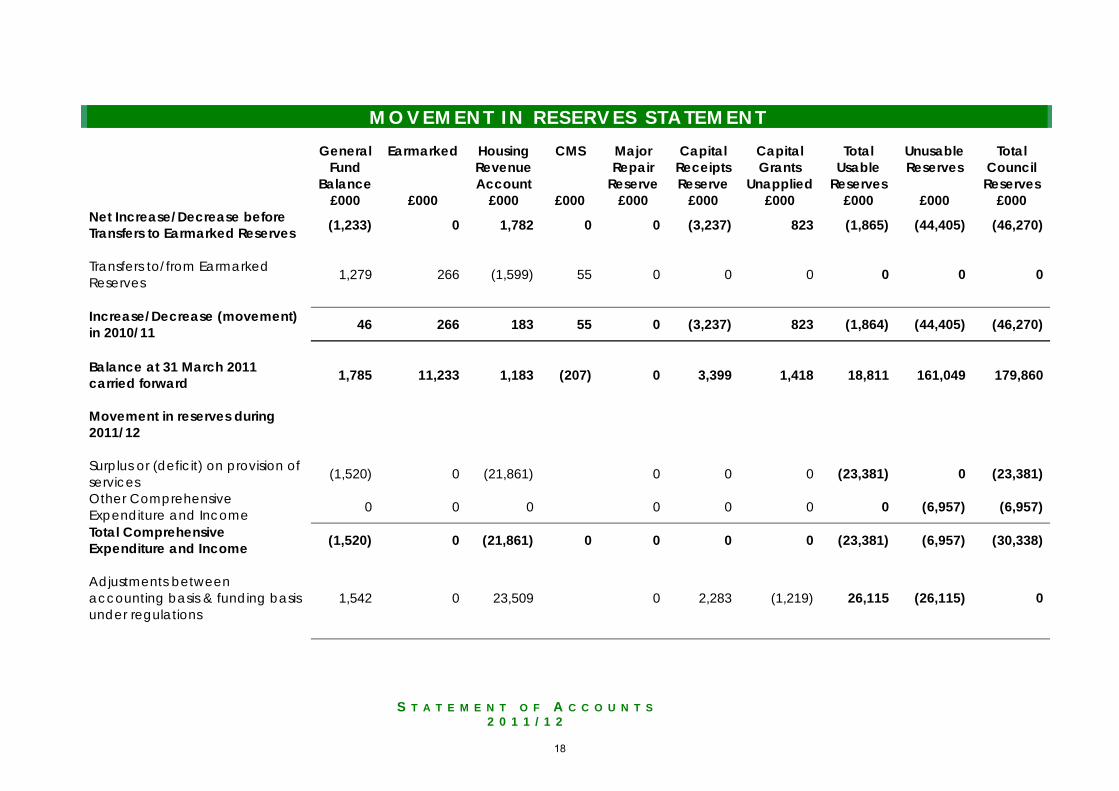
M O V E M E N T I N R E S E R V E S S T A T E M E N T
General Earmarked Housing CMS Major Capital Capital Total Unusable Total Fund Revenue Repair Receipts Grants Usable Reserves Council Balance Account Reserve Reserve Unapplied Reserves Reserves £000 £000 £000 £000 £000 £000 £000 £000 £000 £000 Net Increase/Decrease before Transfers to Earmarked Reserves (1,233) 0 1,782 0 0 (3,237) 823 (1,865) (44,405) (46,270)
Transfers to/from Earmarked Reserves 1,279 266 (1,599) 55 0 0 0 0 0 0
Increase/Decrease (movement) in 2010/11 46 266 183 55 0 (3,237) 823 (1,864) (44,405) (46,270)
Balance at 31 March 2011 carried forward 1,785 11,233 1,183 (207) 0 3,399 1,418 18,811 161,049 179,860
Movement in reserves during 2011/12
Surplus or (deficit) on provision of services (1,520) 0 (21,861) 0 0 0 (23,381) 0 (23,381)
Other Comprehensive Expenditure and Income 0 0 0 0 0 0 0 (6,957) (6,957)
Total Comprehensive Expenditure and Income (1,520) 0 (21,861) 0 0 0 0 (23,381) (6,957) (30,338)
Adjustments between accounting basis & funding basis under regulations
1,542 0 23,509 0 2,283 (1,219) 26,115 (26,115) 0
18
S T A T E M E N T O F A C C O U N T S
2 0 1 1 / 1 2
M O V E M E N T I N R E S E R V E S S T A T E M E N T
General Earmarked Housing CMS Major Capital Capital Total Unusable Total Fund Revenue Repair Receipts Grants Usable Reserves Council Balance Account Reserve Reserve Unapplied Reserves Reserves £000 £000 £000 £000 £000 £000 £000 £000 £000 £000 Net Increase/Decrease before Transfers to Earmarked Reserves 22 0 1,648 0 0 2,283 (1,219) 2,735 (33,072) (30,337)
Transfers to/from Earmarked Reserves 330 1,092 (1,559) 138 0 0 0 0 0 0
Increase/Decrease in Year 352 1,092 89 138 0 2,283 (1,219) 2,735 (33,072) (30,337) Balance at 31 March 2012 carried forward 2,137 12,325 1,272 (69) 0 5,682 199 21,546 127,977 149,523
19
S T A T E M E N T O F A C C O U N T S
2 0 1 1 / 1 2
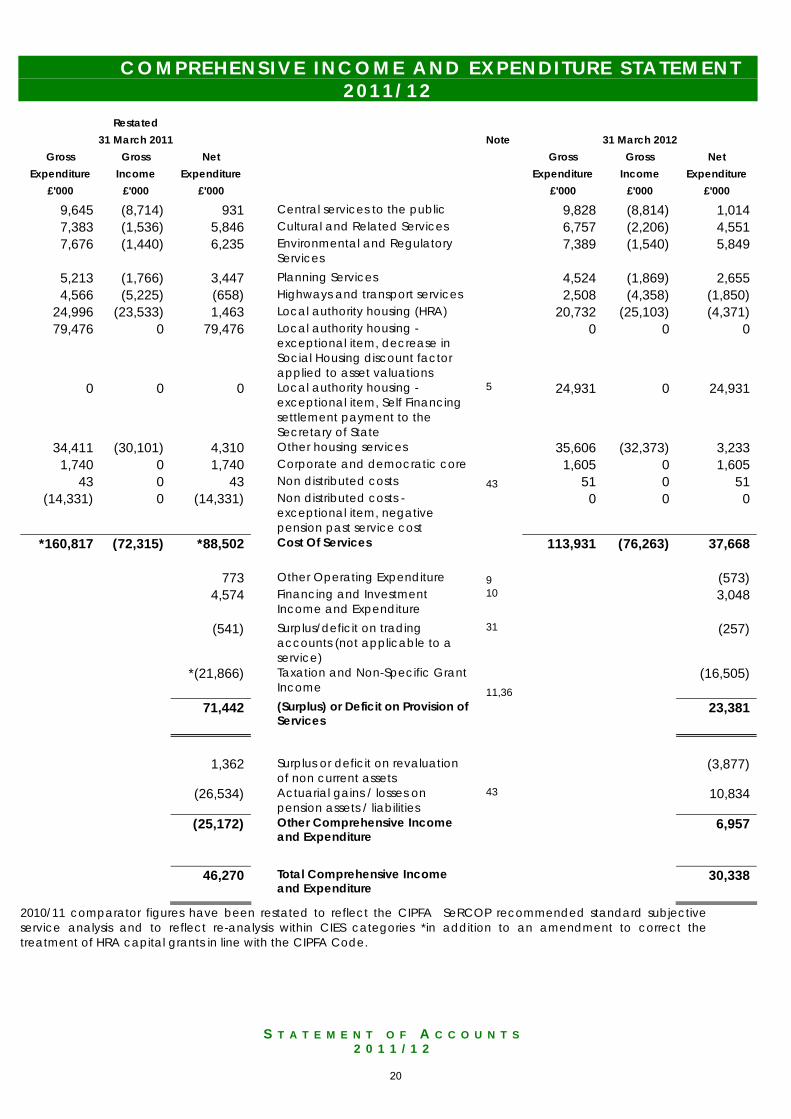
C O M P R E H E N S I V E I N C O M E A N D E X P E N D I T U R E S T A T E M E N T 2011/12
Restated
31 March 2011 Note 31 March 2012 Gross Gross Net Gross Gross Net
Expenditure Income Expenditure Expenditure Income Expenditure £'000 £'000 £'000 £'000 £'000 £'000
9,645 (8,714) 931 Central services to the public 9,828 (8,814) 1,014 7,383 (1,536) 5,846 Cultural and Related Services 6,757 (2,206) 4,551 7,676 (1,440) 6,235
Environmental and Regulatory Services
7,389 (1,540) 5,849
5,213 (1,766) 3,447 Planning Services 4,524 (1,869) 2,655 4,566 (5,225) (658) Highways and transport services 2,508 (4,358) (1,850)
24,996 (23,533) 1,463 Local authority housing (HRA) 20,732 (25,103) (4,371) 79,476 0 79,476
Local authority housing - exceptional item, decrease in Social Housing discount factor applied to asset valuations
0 0 0
0 0 0
Local authority housing - exceptional item, Self Financing settlement payment to the Secretary of State
5 24,931 0 24,931
34,411 (30,101) 4,310 Other housing services 35,606 (32,373) 3,233 1,740 0 1,740 Corporate and democratic core 1,605 0 1,605
43 0 43 Non distributed costs 43 51 0 51 (14,331) 0 (14,331)
Non distributed costs - exceptional item, negative pension past service cost
0 0 0
*160,817 (72,315) *88,502 Cost Of Services 113,931 (76,263) 37,668 773 Other Operating Expenditure 9 (573)
4,574
Financing and Investment Income and Expenditure
10 3,048
(541) Surplus/deficit on trading accounts (not applicable to a service)
31 (257)
*(21,866)
Taxation and Non-Specific Grant Income 11,36
(16,505)
71,442
(Surplus) or Deficit on Provision of Services
23,381
1,362 Surplus or deficit on revaluation
of non current assets (3,877)
(26,534) Actuarial gains / losses on
pension assets / liabilities 43 10,834
(25,172) Other Comprehensive Income
and Expenditure 6,957
46,270 Total Comprehensive Income
and Expenditure 30,338
2010/11 comparator figures have been restated to reflect the CIPFA SeRCOP recommended standard subjective service analysis and to reflect re-analysis within CIES categories *in addition to an amendment to correct the treatment of HRA capital grants in line with the CIPFA Code.
20
S T A T E M E N T O F A C C O U N T S
2 0 1 1 / 1 2
B A L A N C E S H E E T A S A T 3 1 M A R C H 2 0 1 2
Restated
1 April 2010
31 March 2011
Notes
31 March 2012
£'000 £'000 £'000
320,224 237,495 Property, Plant & Equipment 4,12,38,40 241,760 4,667 4,667 Heritage Assets 13,47,48 4,667
15,235 15,479 Investment Property 12,38 12,754 536 451 Intangible Assets 12,38 546 311 65 Assets held for sale (> 1yr) 12 0
1,449 449 Long Term Investments 16,46 449 165 156 Long Term Debtors 153
342,587 258,762 Long Term Assets 260,329
15,744 15,579 Short Term Investments 16,46 20,723
183 140 Inventories 17 141 9,916 7,191 Short Term Debtors 16,18,46 8,723
0 396 Cash and Cash Equivalents 19 0 25,843 23,306 Current Assets 29,587
(978) 0 Cash and Cash Equivalents 19 (3) (868) (965) Short Term Borrowing 16 (993)
(9,466) (9,582) Short Term Creditors 16,21 (11,907) (11,312) (10,547) Current Liabilities (12,903)
(1,376) (1,342) Long Term Creditors (807)
(476) (545) Provisions 22 (1,053) (50,423) (50,447) Long Term Borrowing 5,16 (75,409) (78,714) (39,327) Other Long Term Liabilities 4,43 (50,221)
(130,989) (91,661) Long Term Liabilities (127,490)
226,129 179,860 Net Assets 149,523
21
S T A T E M E N T O F A C C O U N T S
2 0 1 1 / 1 2
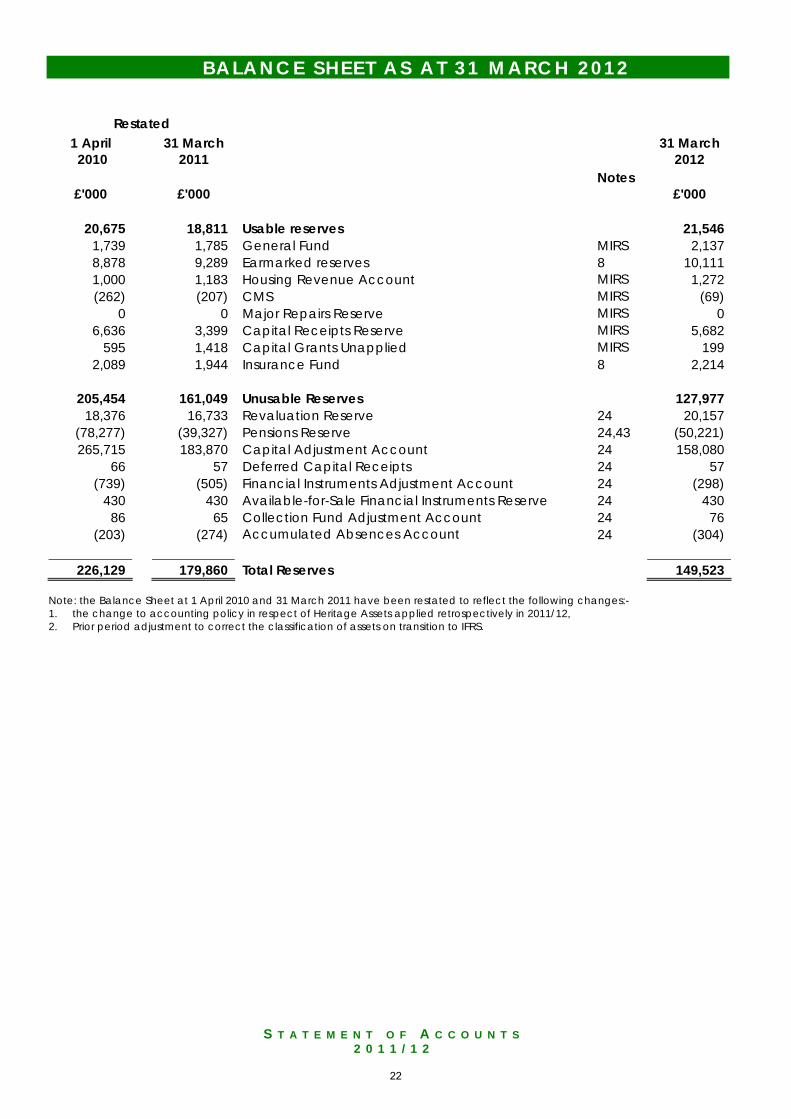
B A L A N C E S H E E T A S A T 3 1 M A R C H 2 0 1 2
Restated 1 April 2010
31 March 2011
Notes
31 March 2012
£'000 £'000 £'000
20,675 18,811 Usable reserves 21,546 1,739 1,785 General Fund MIRS 2,137 8,878 9,289 Earmarked reserves 8 10,111 1,000 1,183 Housing Revenue Account MIRS 1,272 (262) (207) CMS MIRS (69)
0 0 Major Repairs Reserve MIRS 0 6,636 3,399 Capital Receipts Reserve MIRS 5,682
595 1,418 Capital Grants Unapplied MIRS 199 2,089 1,944 Insurance Fund 8 2,214
205,454 161,049 Unusable Reserves 127,977
18,376 16,733 Revaluation Reserve 24 20,157 (78,277) (39,327) Pensions Reserve 24,43 (50,221) 265,715 183,870 Capital Adjustment Account 24 158,080
66 57 Deferred Capital Receipts 24 57 (739) (505) Financial Instruments Adjustment Account 24 (298)
430 430 Available-for-Sale Financial Instruments Reserve 24 430 86 65 Collection Fund Adjustment Account 24 76
(203) (274) Accumulated Absences Account 24 (304)
226,129 179,860 Total Reserves 149,523
Note: the Balance Sheet at 1 April 2010 and 31 March 2011 have been restated to reflect the following changes:- 1. the change to accounting policy in respect of Heritage Assets applied retrospectively in 2011/12, 2. Prior period adjustment to correct the classification of assets on transition to IFRS.
22
S T A T E M E N T O F A C C O U N T S
2 0 1 1 / 1 2
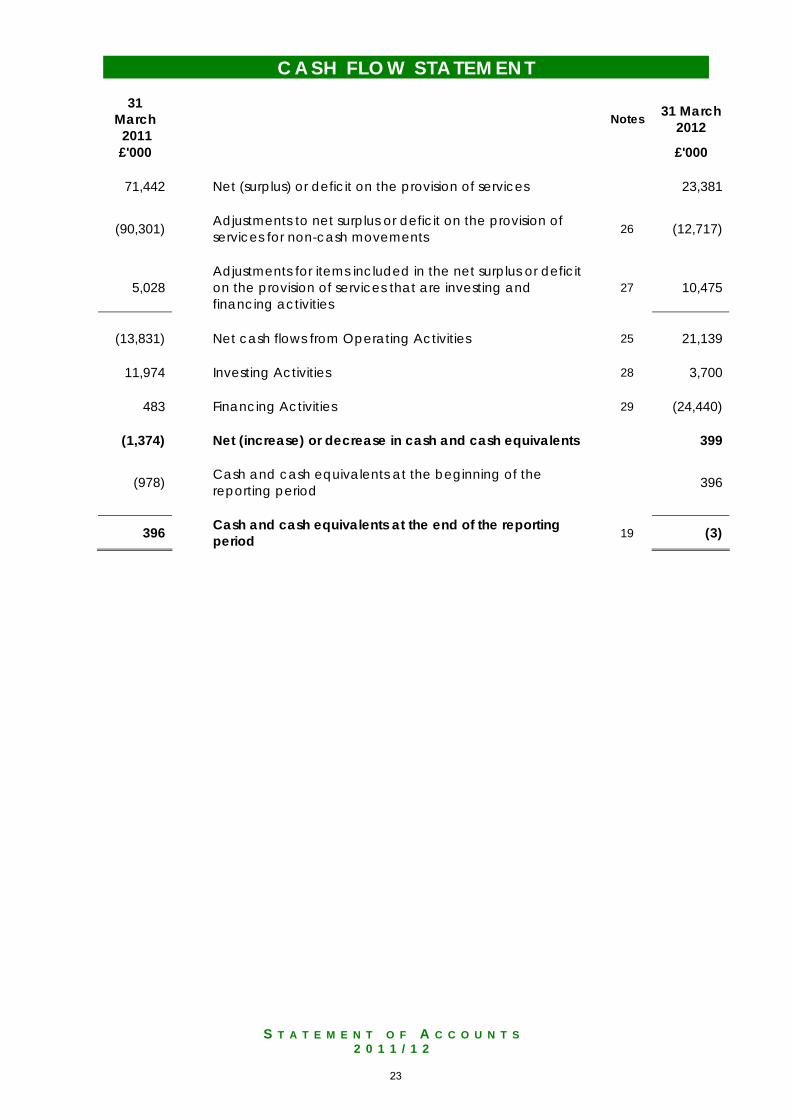
C A S H F L O W S T A T E M E N T
31 March 2011
Notes 31 March 2012
£'000 £'000
71,442 Net (surplus) or deficit on the provision of services 23,381
(90,301) Adjustments to net surplus or deficit on the provision of services for non-cash movements 26 (12,717)
5,028 Adjustments for items included in the net surplus or deficit on the provision of services that are investing and financing activities
27 10,475
(13,831) Net cash flows from Operating Activities 25 21,139
11,974 Investing Activities 28 3,700
483 Financing Activities 29 (24,440)
(1,374) Net (increase) or decrease in cash and cash equivalents 399
(978) Cash and cash equivalents at the beginning of the reporting period 396
396 Cash and cash equivalents at the end of the reporting period 19 (3)
23
S T A T E M E N T O F A C C O U N T S
2 0 1 1 / 1 2
N O T E S T O T H E A C C O U N T S
Note 1 – Accounting Policies 1. General Principles The Statement of Accounts summarises the Council’s transactions for the 2011/12 financial year and its position at the year-end of 31 March 2012. The Statement of Accounts has been prepared in accordance with proper accounting practices. These practices primarily comprise the Code of Practice on Local Authority Accounting in the United Kingdom 2011/12 (the Code) and the CIPFA Service Reporting Code of Practice 2011/12 (SeRCOP), supported by International Financial Reporting Standards (IFRS) and statutory guidance issued under section 7 of the Accounts and Audit Regulations 2011. The accounting convention adopted in the Statement of Accounts is historic cost, modified by the revaluation of certain categories of non-current assets and financial instruments. The accounts are prepared on a going concern basis which assumes that the functions of the Council will continue in operational existence for the foreseeable future. 2. Accruals of Income and Expenditure The revenue accounts of the Council are maintained on an accruals basis meaning that activity is accounted for in the year that it takes place, not simply when cash payments are made or received. In particular:
• Revenue from the sale of assets is recognised when the Council transfers the significant risks and rewards of ownership to the purchaser and it is probable that economic benefits or service potential associated with the transaction will flow to the Council.
• Revenue from the provision of services is recognised when the Council can
measure reliably the percentage of completion of the transaction and it is probable that economic benefits or service potential associated with the transaction will flow to the Council.
• Supplies are recorded as expenditure when they are consumed – where there
is a gap between the date supplies are received and their consumption they are carried as inventories on the Balance Sheet.
• Expenses in relation to services received (including services provided by
employees) are recorded as expenditure when the services are received rather than when payments are made.
• Interest receivable on investments and payable on borrowings is accounted
for respectively as income and expenditure on the basis of the effective interest rate for the relevant financial instrument rather than the cash flows fixed or determined by the contract.
24
S T A T E M E N T O F A C C O U N T S
2 0 1 1 / 1 2
• Where revenue and expenditure have been recognised but cash has not been received or paid, a debtor or creditor for the relevant amount is recorded in the Balance Sheet. Where debts may not be settled, the balance of debtors is written down and a charge made to revenue for the income that might not be collected.
3. Cash and Cash Equivalents Cash is represented by cash in hand and deposits with financial institutions repayable without penalty on notice of not more than 24 hours. Cash equivalents are investments that mature within three months or less from the date of acquisition and that are readily convertible to known amounts of cash with insignificant risk of change in value. In the Cash Flow Statement, cash and cash equivalents are shown net of bank overdrafts that are repayable on demand and form an integral part of the Council’s cash management. 4. Exceptional Items When items of income and expense are material, their nature and amount is disclosed separately, either on the face of the Comprehensive Income and Expenditure Statement or in the notes to the accounts, depending on how significant the items are to an understanding of the Council’s financial performance. 5. Prior Period Adjustments, Changes in Accounting Policies and Estimates and Errors Prior period adjustments may arise as a result of a change in accounting policies or to correct a material error. Changes in accounting estimates are accounted for prospectively i.e. in the current and future years affected by the change and do not give rise to prior period adjustment. Changes in accounting policies are only made when required by proper accounting practices or the change provides more reliable or relevant information about the effect of transactions, other events and conditions on the Council’s financial position or financial performance. Where a change is made, it is applied retrospectively (unless stated otherwise) by adjusting opening balances and comparative amounts for the prior period as if the new policy had always been applied. Material errors discovered in prior period figures are corrected retrospectively by amending opening balances and comparative amounts for the prior period. 6. Charges to Revenue for Non-Current Assets Service revenue accounts, central support services and trading accounts are charged with the following amounts to reflect the cost of holding fixed assets during the year:
• depreciation of the assets used by the service
• revaluation and impairment losses on assets used by the service
25
S T A T E M E N T O F A C C O U N T S
2 0 1 1 / 1 2
where there are no accumulated gains in the Revaluation Reserve against which losses can be written off
• amortisation of intangible fixed assets used by the service.
The Council is not required to raise Council Tax to fund depreciation, revaluation and impairment losses or amortisation. However, it is required to make an annual contribution from revenue towards the reduction in its overall borrowing requirement equal to an amount calculated on a prudent basis determined by the Council in accordance with statutory guidance. This is referred to as the Minimum Revenue Provision (MRP) and Voluntary Revenue Provision (VRP). The Council’s policy on MRP is:
• For capital expenditure incurred before 1 April 2009, or which from 1 April 2009 is supported borrowing, the MRP is based on 4% of the opening capital financing requirement (with adjustments allowed for in DCLG Regulations).
• For all unsupported borrowing from 1 April 2009, the MRP is based on the
estimated life of the asset which the borrowing has been used to fund.
• VRP will be charged if considered prudent for individual asset financing. Depreciation, revaluation and impairment losses and amortisation are replaced by the MRP and VRP, by way of an adjusting transaction between the Capital Adjustment Account and the General Fund Balance in the Movement in Reserves Statement, for the differences between the two. 7. Employee Benefits Benefits payable during employment Short-term employee benefits are those due to be settled within 12 months of the year-end. They include such benefits as wages and salaries, paid annual leave and paid sick leave, bonuses and non-monetary benefits (e.g. cars) for current employees and are recognised as an expense for services in the year in which employees render service to the Council. An accrual is made for the cost of holiday entitlements or time off in lieu, earned by employees but not taken before the year-end, which employees can carry forward into the next financial year. The accrual is made at the wage and salary rates applicable in the following accounting year, being the period in which employee take the benefit. The accrual is charged to Surplus or Deficit on the Provision of Services, but then reversed out through the Movement in Reserves Statement so that holiday benefits are charged to revenue in the financial year in which the holiday absence occurs. Termination benefits Termination benefits are amounts payable as a result of a decision by the Council to terminate an officer’s employment before the normal retirement date or an officer’s decision to accept voluntary redundancy and are charged on an accruals basis to the appropriate service line in the Comprehensive Income and Expenditure Statement when the Council is demonstrably committed to the termination of the
26
S T A T E M E N T O F A C C O U N T S
2 0 1 1 / 1 2
employment of an officer or group of officers or making an offer to encourage voluntary redundancy. Where termination benefits involve the enhancement of pensions, statutory provisions require the General Fund balance to be charged with the amount payable by the Council to the pension fund or pensioner in the year, not the amount calculated according to relevant accounting standards. In the Movement in Reserves Statement, transfers are required to and from the Pensions Reserve to remove notional debits and credits for pension enhancement termination benefits and replace them with debits for the cash paid to the pension fund and pensioners and any such amounts payable but unpaid at the year-end. Post Employment Benefits Employees of the Council are members of the Local Government Pension Scheme, administered by Lincolnshire County Council. This scheme provides defined benefits to members (retirement lump sums and pensions), earned as employees worked for the Council. The Local Government Pension Scheme The Local Government Scheme is accounted for as a defined benefits scheme: The liabilities of the Lincolnshire County Council pension fund attributable to the Council are included in the Balance Sheet on an actuarial basis using the protected unit method – i.e. an assessment of the future payments that will be made in relation to retirement benefits earned to date by employees, based on assumptions about mortality rates, employee turnover rates, etc, and forecasts of projected earnings for current employees. Liabilities are discounted to their value at current prices, using a discount rate of 4.7% (provisional) (based on the indicative rate of return on high quality corporate bond (iBoxx Sterling Corporates AA over 15 year Index). The assets of the Lincolnshire County Council pension fund attributable to the Council are included in the Balance Sheet at their fair value:
• Quoted securities – current bid price • Unquoted securities – professional estimate • Unitised securities – current bid price • Property – market value.
The change in the net pensions liability is analysed into seven components:
• Current service cost – the increase in liabilities as a result of years of service earned this year – allocated in the Comprehensive Income and Expenditure Statement to the services for which the employees worked
• Past service cost – the increase in liabilities arising from current year decisions
whose effect relates to years of service earned in earlier years – debited to the Surplus or Deficit on the Provision of Services in the Comprehensive
27
S T A T E M E N T O F A C C O U N T S
2 0 1 1 / 1 2
Income and Expenditure Statement as part of Non Distributed Costs
• Interest cost – the expected increase in the present value of liabilities during the year as they move one year closer to being paid – debited to the Financing and Investment Income and Expenditure line in the Comprehensive Income and Expenditure Statement
• Expected return on assets – the annual investment return on the fund assets
attributable to the Council, based on an average of the expected long-term return – credited to the Financing and Investment Income and Expenditure line in the Comprehensive Income and Expenditure Statement
• Gains or losses on settlements and curtailments – the result of actions to
relieve the Council of liabilities or events that reduce the expected future service or accrual of benefits of employees – debited or credited to the Surplus or Deficit on the Provision of Services in the Comprehensive Income and Expenditure Statement as part of Non Distributed Costs
• Actuarial gains and losses – changes in the net pensions liability that arise
because events have not coincided with assumptions made at the last actuarial valuation or because the actuaries have updated their assumptions – debited to the Pensions Reserve
• Contributions paid to the Lincolnshire County Council pension fund – cash
paid as employer’s contributions to the pension fund in settlement of liabilities; not accounted for as an expense.
In relation to retirement benefits, statutory provisions require the General Fund balance to be charged with the amount payable by the Council to the pension fund or directly to pensioners in the year, not the amount calculated according to the relevant accounting standards. In the Movement in Reserves Statement, this means that there are transfers to and from the Pensions Reserve to remove the notional debits and credits for retirement benefits and replace them with debits for the cash paid to the pension fund and pensioners and any such amounts payable but unpaid at the year-end. The negative balance that arises on the Pension Reserve thereby measures the beneficial impact to the General Fund of being required to account for retirement benefits on the basis of cash flows rather than as benefits are earned by employees. Discretionary Benefits The Council also has restricted powers to make discretionary awards of retirement benefits in the event of early retirements. Any liabilities estimated to arise as a result of an award to any member of staff are accrued in the year of decision to make the award and accounted for using the same policies as are applied to the Local Government Pension Scheme. 8. Events After the Balance Sheet Date Events after the Balance Sheet date are those events, both favourable and unfavourable, that occur between the end of the reporting period and the date
28
S T A T E M E N T O F A C C O U N T S
2 0 1 1 / 1 2
when the Statement of Accounts is authorised for issue. Two types of events can be identified:
• Those that provide evidence of conditions that existed at the end of the reporting period – the Statement of Accounts is adjusted to reflect such events
• Those that are indicative of conditions that arose after the reporting period –
the Statement of Accounts is not adjusted to reflect such events, but where category of events would have a material effect, disclosure is made in the notes of the nature of the events and their estimated financial effect.
Events taking place after the date of authorisation for issue are not reflected in the Statement of Accounts. 9. Financial Instruments Financial Liabilities Financial liabilities are recognised on the Balance Sheet when the Council becomes a party to the contractual provisions of a financial instrument. They are initially measured at fair value and carried at their amortised cost. Annual charges for interest payable are shown in the Financing and Investment Income and Expenditure line in the Comprehensive Income and Expenditure Statement, and are based on the carrying amount of the liability, multiplied by the effective rate of interest for the instrument. The effective interest rate is the rate that exactly discounts estimated future cash payments over the life of the instrument to the amount at which it was originally recognised. For most of the borrowings that the Council has, this means that the amount presented in the Balance Sheet is the outstanding principal repayable, with accrued interest due within one year shown under short term borrowings; and interest charged to the Comprehensive Income and Expenditure Statement is the amount payable for the year according to the loan agreement. Gains and losses on the repurchase or early settlement of borrowing are credited and debited to the Financing and Investment Income and Expenditure line in the Comprehensive Income and Expenditure Statement in the year of repurchase/settlement. However, where repurchase has taken place as part of a restructuring of the loan portfolio that involves the modification or exchange of existing instruments, any premium or discount is respectively deducted from or added to the amortised cost of the new or modified loan and the write-down to the Comprehensive Income and Expenditure Statement is spread over the life of the loan by an adjustment to the effective interest rate. Where premiums and discounts have been charged to the Comprehensive Income and Expenditure Statement, regulations allow the impact on the General Fund Balance to be spread over future years. The Council has a policy of spreading the gain or loss over the unexpired life of the original loan. The reconciliation of amounts charged to the Comprehensive Income and Expenditure Statement to the net charge required against the General Fund Balance is managed by a transfer to or
29
S T A T E M E N T O F A C C O U N T S
2 0 1 1 / 1 2
from the Financial Instruments Adjustment Account in the Movement in Reserves Statement. Financial Assets Financial assets are classified into two types:
• Loans and receivables – assets that have fixed or determinable payments but are not quoted in an active market
• Available for sale assets – assets that have a quoted market price and/or do
not have fixed or determinable payments. Loans and receivables Loans and receivables are recognised on the Balance Sheet when the Council becomes a party to the contractual provisions of a financial instrument. They are initially measured at fair value and carried at their amortised cost. Annual credits to the Financing and Investment and Expenditure line in the Comprehensive Income and Expenditure Statement for interest receivable are based on the carrying amount of the asset multiplied by the effective rate of interest for the instrument. For most of the loans that the Council has made, this means that the amount presented in the Balance Sheet is the outstanding principal receivable, with interest receivable within one year shown under short term investments and interest credited to the Comprehensive Income and Expenditure Statement is the amount receivable for the year in the loan agreement. However, occasionally the Council may make loans to other parties (e.g. voluntary organisations) at less than market rates (soft loans). When soft loans are made, a loss is recorded in the Comprehensive Income and Expenditure Statement for the present value of the interest that will be foregone over the life of the instrument, resulting in a lower amortised cost than the outstanding principal. Interest is credited to the Financing and Investment Income and Expenditure line in the Comprehensive Income and Expenditure Statement at a marginally higher effective rate of interest than the rate receivable, with the difference serving to increase the amortised cost of the loan in the Balance Sheet. Statutory provisions require that the impact of soft loans on the General Fund Balance is the interest receivable for the financial year – the reconciliation of amounts debited and credited to the Comprehensive Income and Expenditure Statement to the net gain required against the General Fund Balance as managed by a transfer to or from the Financial Instruments Adjustment Account in the Movement in the Reserves Statement. Where assets are identified as impaired because of a likelihood arising from a past event that payments due under the contract will not be made, the asset is written down and a charge made to the Financing and Investment Income and Expenditure line in the Comprehensive Income and Expenditure Statement. The impairment loss is measured as the difference between the carrying amount and the present value of the revised future cash flows discounted at the asset’s original effective interest rate. Any gains and losses that arise on the de-recognition of an asset are credited or debited to the Financial and Investment Income Expenditure line in the
30
S T A T E M E N T O F A C C O U N T S
2 0 1 1 / 1 2
Comprehensive Income and Expenditure Statement. Available-for-Sale Assets Available-for-sale assets are recognised on the Balance Sheet when the Council becomes a party to the contractual provisions of a financial instrument and are initially measured and carried at fair value. Where the asset has fixed or determinable payments, annual credits to the Financing and Investment Income and Expenditure line in the Comprehensive Income and Expenditure Statement for interest receivable are based on the amortised cost of the asset multiplied by the effective rate of interest for the instrument. Where there are no fixed or determinable payments, income (e.g. dividends) is credited to the Comprehensive Income and Expenditure Statement when it becomes receivable by the Council. Assets are maintained in the Balance Sheet at fair value. Values are based on the following principles:
• Instruments with quoted market prices – the market price
• Other instruments with fixed and determinable payments – discounted cash flow analysis
• Equity shares with no quoted market prices – independent appraisal of
company valuation or most recent price at which the shares changed hands. Changes in fair value are balanced by an entry in the Available-for-Sale Reserve and the gain/loss is recognised in the Surplus or Deficit on Revaluation of Available for Sale Financial Assets. The exception is where impairment losses have been incurred – these are debited to the Financial and Investment Income and Expenditure line in the Comprehensive Income and Expenditure Statement, along with any net gain or loss for the asset accumulated in the Available-for-Sale Reserve. Where assets are identified as impaired because of a likelihood arising from a past event that payments due under the contract will not be made (fixed or determinable payments) or fair value falls below cost, the asset is written down and a charge made to the Financing and Investment Income and Expenditure line in the Comprehensive Income and Expenditure Statement. If the asset has fixed or determinable payments, the impairment loss is measured as the difference between the carrying amount and the present value of the revised future cash flows discounted at the asset’s original effective interest rate. Otherwise, the impairment loss is measured as any shortfall of fair value against the acquisition cost of the instrument (net of any principal repayment and amortisation). Any gains and losses that arise on de-recognition of the asset are credited or debited to the Financing and Investment Income and Expenditure line in the Comprehensive Income and Expenditure Statement, along with any accumulated gains or losses previously recognised in the Available-for-Sale Reserve. Where fair value cannot be measured reliably, the instrument is carried at cost (less any impairment losses). 10. Foreign Currency Translation
31
S T A T E M E N T O F A C C O U N T S
2 0 1 1 / 1 2
Where the Council has entered into a transaction denominated in a foreign currency, the transaction is converted into sterling at the exchange rate applicable on the date the transaction was effective. Where material amounts in foreign currency are outstanding at the year-end, they are reconverted at the spot exchange rate at 31 March. Resulting gains or losses, if material, are recognised in the Financing and Investment Income and Expenditure line in the Comprehensive Income and Expenditure Statement. 11. Government Grants and Contributions Whether paid on account, by instalments or in arrears, government grants and the third party contributions and donations are recognised as due to the Council when there is reasonable assurance that:
• The Council will comply with the conditions attached to the payments and • The grants or contributions will be received.
Amounts recognised as due to the Council are not credited to the Comprehensive Income and Expenditure Statement until conditions attached to the grant or contribution have been satisfied. Conditions are stipulations that specify that the future economic benefits or service potential embodied in the asset acquired using the grant or contribution are required to be consumed by the recipient as specified, or future economic benefits or service potential must be returned to the transferor. Monies advanced as grants and contributions for which conditions have not been satisfied are carried in the Balance Sheet as creditors. When conditions are satisfied, the grant or contribution is credited to the relevant service line (attributable revenue grants and contributions) or Taxation and Non-Specific Grant Income (non ring-fenced revenue grants and all capital grants) in the Comprehensive Income and Expenditure Statement. Where capital grants are credited to the Comprehensive Income and Expenditure Statement, they are reversed out of the General Fund Balance in the Movement in Reserves Statement. Where the grant has yet to be used to finance capital expenditure, it is posted to the Capital Grants Unapplied reserve. Where it has been applied, it is posted to the Capital Adjustment Account. Amounts in the Capital Grants Unapplied reserve are transferred to the Capital Adjustment Account once they have been applied to fund capital expenditure. Area Based Grant Area Based Grant (ABG) is a general grant allocated by central government directly to local authorities as additional revenue funding. ABG is non-ringfenced and is credited to Taxation and Non-Specific Grant Income in the Comprehensive Income and Expenditure Statement. Business Improvement Districts A Business Improvement District (BID) scheme applies across the whole of the Council. The scheme is funded by BID levy paid by non-domestic ratepayers. The Council acts as a principal under the scheme, and accounts for income received
32
S T A T E M E N T O F A C C O U N T S
2 0 1 1 / 1 2
and expenditure incurred (including contributions to the BID project) within the relevant services within the Comprehensive Income and Expenditure Statement. 12. Intangible Assets Intangible assets are assets that do not have physical substance but are identifiable and controlled by the Council (e.g. software licences). Expenditure on intangible assets is capitalised when it is expected that future economic benefits or service potential will flow from the intangible asset to the Council for a period of more than one year. Internally generated intangible assets are capitalised where it is demonstrable that the project is technically feasible and is intended to be completed and the Council will be able to generate future economic benefits or deliver service potential by being able to sell or use the asset. Expenditure is capitalised where it can be measured reliably as attributable to the asset and is restricted to that incurred during the development phase (research expenditure cannot be capitalised). Expenditure on the development of the Council’s website is not capitalised as the website is primarily intended to promote or advertise the Council’s services. Intangible assets are measured initially at cost. Amounts are only re-valued where the fair value of the assets can be determined by reference to an active market. In practice, no intangible asset held by the Council meets this criterion, and they are therefore carried at amortised cost. Intangible assets are amortised over their useful life and charged to the relevant service lines in the Comprehensive Income and Expenditure Statement and are subject to impairment reviews. Any gain or loss arising on the disposal or abandonment of an intangible asset is posted to the Other Operating Expenditure line in the Comprehensive Income and Expenditure Statement. Where expenditure on intangible assets qualifies as capital expenditure for statutory purposes, amortisation, impairment losses and disposal gains and losses are not permitted to have an impact on the General Fund Balance. The gains and losses are therefore reversed out of the General Fund Balance in the Movement in Reserves Statement and posted to the Capital Adjustment Account and (for any sale proceeds greater than £10,000) the Capital Receipts Reserve. 13. Interests in Companies and other Entities Councils are required to produce Group Accounts to include services offered to Council Tax payers by organisations other than the Council itself but in which the Council has an interest. There are a number of criteria set out by which the Council must determine whether the value of the company and the Council’s interest is significant enough for Group Accounts to be produced. The Council has complied with the Code of Practice on Local Authority Accounting, and while it has identified a company over which it has joint control, it has concluded that the company does not meet the criteria that would require consolidation into the Council’s accounts. 14. Inventories and Long Term Contracts
33
S T A T E M E N T O F A C C O U N T S
2 0 1 1 / 1 2
Inventories are included in the Balance Sheet at the lower of cost and net realisable value. The cost of inventories is assigned using either the FIFO or weighted average costing formula. Long term contracts are accounted for on the basis of charging the Surplus and Deficit on the Provision of Services with the value of works and services received under the contract during the financial year. 15. Investment Property Investment properties are those that are used solely to earn rentals and/or for capital appreciation. The definition is not met if the property is used in any way to facilitate the delivery of services or is held for sale. Investment properties are measured initially at cost and subsequently at fair value, based on the amount at which the asset could be exchanged between knowledgeable parties at arm’s-length. Properties are not depreciated but are re-valued annually according to market conditions at year-end. Gains and losses on revaluation are posted to the Financing and Investment Income and Expenditure line in the Comprehensive Income and Expenditure Statement. The same treatment is applied to gains and losses on disposal. Rentals received in relation to investment properties are credited to the Financing and Investment Income line and result in a gain for the General Fund Balance. However, revaluation and disposal gains and losses are not permitted by statutory arrangements to have an impact on the General Fund Balance. The gains and losses are therefore reversed out of the General Fund Balance in the Movement in Reserves Statement and posted to the Capital Adjustment Account and (for any sale proceeds greater than £10,000) the Capital Receipts Reserve. 16. Jointly Controlled Operations and Jointly Controlled Assets Jointly controlled operations are activities undertaken by the Council in conjunction with other ventures that involve the use of the assets and resources of the ventures rather than the establishment of a separate entity. If and when these exist the Council recognises on its Balance Sheet the assets that it controls and the liabilities that it incurs and debits and credits the Comprehensive Income and Expenditure Statement with the expenditure it incurs and the share of income it earns from the activity of the operation. Jointly controlled assets are items of property, plant or equipment that are jointly controlled by the Council and other ventures, with the assets being used to obtain benefits for the ventures. The joint venture does not involve the establishment of a separate entity. The Council accounts for only its share of the jointly controlled assets, the liabilities and expenses that it incurs on its own behalf or jointly with others in respect of its interest in the joint venture and income that it earns from the venture. 17. Leases Leases are classified as finance leases where the terms of the lease transfer
34

S T A T E M E N T O F A C C O U N T S
2 0 1 1 / 1 2
substantially all the risks and rewards incidental to ownership of the property, plant or equipment from the lessor to the lessee. All other leases are classified as operating leases. Where a lease covers both land and buildings, the land and buildings elements are considered separately for classification. Arrangements that do not have the legal status of a lease but convey a right to use an asset in return for payment are accounted for under this policy where fulfilment of the arrangement is dependant on the use of specific assets. The Council as Lessee Finance Leases Property, plant and equipment held under finance leases is recognised on the Balance Sheet at the commencement of the lease at its fair value measured at the lease’s inception (or the present value of the minimum lease payments, if lower). The asset recognised is matched by a liability for the obligation to pay the lessor. Initial direct costs of the Council are added to the carrying amount of the asset. Premiums paid on entry into a lease are applied to writing down the lease liability. Contingent rents are charged as expenses in the periods in which they are incurred. Lease payments are apportioned between:
• A charge for the acquisition of the interest in the property, plant or equipment – applied to write down the lease liability, and
• A financing charge (debited to the Financing and Investment Income and
Expenditure line in the Comprehensive Income and Expenditure Statement). Property, Plant and Equipment recognised under finance leases is accounted for using the policies applied generally to such assets, subject to depreciation being charged over the lease term if this is shorter than the asset’s estimated useful life (where ownership of the asset does not transfer to the Council at the end of the lease period). The Council is not required to raise council tax to cover depreciation or revaluation and impairment losses arising on leased assets. Instead, a prudent annual contribution (Voluntary Revenue Provision - VRP) is made from revenue funds towards the deemed capital investment in accordance with statutory requirements. Depreciation and revaluation and impairment losses are therefore substituted by the VRP in the General Fund Balance, by way of an adjusting transaction with the Capital Adjustment Account in the Movement in Reserves Statement for the difference between the two. Operating Leases Rentals paid under operating leases are charged to the Comprehensive Income and Expenditure Statement as an expense of the service benefiting from use of the leased asset. Charges are made on a straight-line basis over the term of the lease.
35
S T A T E M E N T O F A C C O U N T S
2 0 1 1 / 1 2
The Council as Lessor Finance Leases Where the Council grants a finance lease over a property or an item of plant or equipment, the relevant asset is written out of the Balance Sheet as a disposal. At the commencement of the lease, the carrying amount of the asset in the Balance Sheet is written off to the Other Operating Expenditure line in the Comprehensive Income and Expenditure Statement as part of the gain and loss on disposal. A gain, representing the Council’s net investment in the lease, is credited to the same line in the Comprehensive Income and Expenditure Statement also as part of the gain or loss on disposal (i.e. netted off against the carrying value of the asset at the time of disposal), matched by a long-term lease debtor in the Balance Sheet. Lease rentals receivable are apportioned between:
• A charge for the acquisition of the interest in the property – applied to write down the lease debtor (together with any premiums received), and
• Finance income (credited to the Financing and Investment Income and
Expenditure line in the Comprehensive Income and Expenditure Statement). The gain credited to the Comprehensive Income and Expenditure Statement on disposal is not permitted by statute to increase the General Fund Balance and is required to be treated as a capital receipt. Where a premium has been received, this is posted out of the General Fund Balance to the Capital Receipt Reserve in the Movement in Reserves Statement. Where the amount due in relation to the leased asset is to be settled by the payment of rentals in future financial years, this is posted out of the General Fund Balance to the Deferred Capital Receipts Reserve in the Movement in Reserves Statement. When the future rentals are received, the element for the capital receipt for the disposal of the asset is used to write down the lease debtor. At this point, the deferred capital receipts are transferred to the Capital Receipts Reserve. The written-off value of disposals is not a charge against council tax, as the cost of fixed assets is fully provided for under separate arrangements for capital financing. Amounts are therefore appropriated to the Capital Adjustment Account from the General Fund Balance in the Movement in Reserve Statement. Operating Leases Where the Council grants an operating lease over a property or an item of plant or equipment, the asset is retained in the Balance Sheet. Rental income is credited to the Other Operating Expenditure line in the Comprehensive Income and Expenditure Statement. Credits are made on a straight-line basis over the life of the lease. Initially direct costs incurred in negotiating and arranging the lease are added to the carrying amount of the relevant asset and charged as an expense over the lease term on the same basis as rental income. 18. Overheads and Support Services The costs of overheads support services are charged to those services that benefit
36
S T A T E M E N T O F A C C O U N T S
2 0 1 1 / 1 2
from the supply or service in accordance with the costing principles of the CIPFA Service Reporting Code of Practice 2011/12 (SeRCOP). The total absorption costing principle is used – the full cost of overheads and support services are shared between users in proportion to the benefits received, with the exception of:
• Corporate and Democratic Core – costs relating to the Council’s status as a multi-functional, democratic organisation.
• Non Distributed Costs – the cost of discretionary benefits awarded to
employees retiring early and impairment losses chargeable on Assets Held for Sale.
These two cost categories are defined in SeRCOP and accounted for as separate headings in the Comprehensive Income and Expenditure Statement, as part of Net Expenditure on Continuing Services. 19. Non-Current Assets - Property, Plant and Equipment Assets that have physical substance and are held for use in the supply of services, for rental to others, or for administrative purposes and that are expected to be used during more than one financial year are classified as Property, Plant and Equipment. Recognition Expenditure on the acquisition, creation or enhancement of Property, Plant or Equipment is capitalised on an accruals basis, provided that it is probable that the future economic benefits or service potential associated with the item will flow to the Council and the cost of the item can be measured reliably. Expenditure that maintains but does not add to an asset’s potential to deliver future economic benefits or service potential (i.e. Repairs and maintenance) is charged as an expense when it is incurred. Measurement Assets are initially measured at cost, comprising:
• The purchase price
• Any costs attributable to bringing the asset to the location and condition necessary for it to be capable of operating in the manner intended by management
• The initial estimate of the costs of dismantling and removing the item and
restoring the site on which it is located. The Council does not capitalise borrowing costs incurred whilst assets are under construction. The cost of assets acquired other than by purchase is deemed to be its fair value, unless the acquisition does not have commercial substance (i.e. it will not lead to
37
S T A T E M E N T O F A C C O U N T S
2 0 1 1 / 1 2
a variation in the cash flows of the Council). In the latter case, where an asset is acquired via an exchange, the cost of the acquisition is the carrying amount of the asset given up by the Council. Donated assets are measured initially at fair value. The difference between fair value and any consideration paid is credited to the Taxation and Non-Specific Grant Income line of the Comprehensive Income and Expenditure Statement, unless the donation has been made conditionally. Until conditions are satisfied, the gain is held in the Donated Assets Account. Where gains are credited to the Comprehensive Income and Expenditure Statement, they are reversed out of the General Fund Balance to the Capital Adjustment Account in the Movement in Reserves Statement. Assets are then carried in the Balance Sheet using the following measurement bases:
• Infrastructure, community assets and assets under construction – depreciated historical cost
• Dwellings – fair value, determined using the basis of existing use value for
social housing (EUV-SH)
• All other assets – fair value, determined as the amount that would be paid for the asset in its existing use (existing use value – EUV).
Where there is no market-based evidence of fair value because of the specialist nature of an asset, depreciated replacement cost (DRC) is used as an estimate of fair value. For non-property assets that have short useful lives or low values (or both), depreciated historical cost basis is used as a proxy for fair value. Assets included in the Balance Sheet at fair value are re-valued sufficiently regularly to ensure that their carrying amount is not materially different from their fair value at the year-end, but as a minimum every five years. Increases in valuations are matched by credits to the Revaluation Reserve to recognise unrealised gains. However, in exceptional circumstances, gains may be credited to the Comprehensive Income and Expenditure Statement where they arise from the reversal of a loss previously charged to services. When decreases in value are identified, they are accounted for as follows:
• Where there is a balance of revaluation gains for the asset in the Revaluation Reserve, the carrying amount of the asset is written down against that balance, up to the amount of the accumulated gains.
• Where there is no balance in the Revaluation Reserve or an insufficient
balance, the carrying amount of the asset is written down against the relevant service lines in the Comprehensive Income and Expenditure Statement.
The Revaluation Reserve contains revaluation gains recognised since 1 April 2007 only, the date of its formal implementation. Gains arising before that date have been consolidated into the Capital Adjustment Account.
38
S T A T E M E N T O F A C C O U N T S
2 0 1 1 / 1 2
Impairment Assets are reviewed at each year-end for evidence of reductions in value i.e. impairment. Where impairment is identified, the recoverable amount of the asset is estimated and, where this is less than the carrying amount of the asset, an impairment loss is recognised for the shortfall. When impairment losses are identified, they are accounted for as follows:
• Where there is a balance in the revaluation gains for the asset in the Revaluation Reserve, the carrying amount of the asset is written down against that balance, up to the amount of the accumulated gains.
• Where there is no balance in the Revaluation Reserve or an insufficient
balance, the carrying amount of the asset is written down against the relevant service line(s) in the Comprehensive Income and Expenditure Statement.
Where an impairment loss is reversed subsequently, the reversal is credited to the relevant service line in the Comprehensive Income and Expenditure Statement, up to the amount of the original loss, adjusted for depreciation that would have been charged if the loss had not been recognised. Depreciation Depreciation is provided for on all Property, Plant and Equipment assets by the systematic allocation of their depreciable amounts over their useful lives. An exception is made for assets without a determinable finite useful life (i.e. freehold land and certain Community Assets) and assets that are not yet available for use (i.e. assets under construction). Depreciation is calculated on the following bases:
• Dwellings and other buildings – straight-line allocation over the useful life of the property as estimated by the Valuer
• Vehicles, plant, furniture and equipment – straight-line allocation over the
useful life of each class of asset, as advised by a suitably qualified officer Where an item of Property, Plant or Equipment asset has major components whose cost is significant in relation to the total cost of the item, the components are depreciated separately. A major component is defined as comprising at least 20% of the value and having a useful life of 50% or less of that of the parent asset. Revaluation gains are also depreciated, with an amount equal to the difference between the current value depreciation charge on assets and the depreciation that would have been charged based on their historical cost, being transferred each year from the Revaluation Reserve to the Capital Adjustment Account.
20. Heritage Assets
39
S T A T E M E N T O F A C C O U N T S
2 0 1 1 / 1 2
The Council holds a number of Heritage Assets, which can be grouped into the following categories:
• Civic Insignia • Art and Sculptures • Musical Instruments • Vehicles • Ancient Monuments and War Memorials • Miscellaneous
These are not held in a single collection but in a number of appropriate locations, where they are considered to contribute to increasing the knowledge, understanding and appreciation of the Council’s history and local area. Heritage Assets are recognised and measured (including the treatment of revaluation gains and losses) in accordance with the Council’s accounting policies on Property, Plant and Equipment. However, some of the measurement rules are relaxed in relation to heritage assets as detailed below. • Civic Insignia
The collection of civic insignia includes the Mayor’s and Sheriff’s badges and chains of office, mace and ceremonial sword. These items are reported in the Balance Sheet at insurance valuation which is based on market values. These insurance valuations are updated on an annual basis with periodic reviews by a specialist valuer. The civic insignia are deemed to have indeterminate lives and a high residual value; hence the Council does not consider it appropriate to charge depreciation.
• Art and Sculptures
This category includes paintings and a number of public art works such as statues and sculptures. Where a valuation is available e.g. an insurance valuation, the asset is reported in the balance sheet at this valuation. However, for a number of public art sculptures and statues, no cost or valuation information is available and consequently, these assets are not recognised in the balance sheet. Where artworks are recognised, they are deemed to have indeterminate lives and the Council does not consider it appropriate to charge depreciation.
• Musical Instruments
The Council holds a Steinway grand piano at the Drill Hall and a Stradivarius violin, which is on loan to the Halle orchestra. These items are reported in the Balance Sheet at insurance valuation which is based on market values. These insurance valuations are updated on an annual basis with periodic reviews by a specialist valuer. The instruments are deemed to have indeterminate lives and a high residual value; hence the Council does not consider it appropriate to charge depreciation.
• Vehicles
The Council holds a number of vehicles as heritage assets; these are a vintage Leyland bus, a World War I tank and a steam locomotive. These items are
40
S T A T E M E N T O F A C C O U N T S
2 0 1 1 / 1 2
reported in the Balance Sheet at insurance valuation which is based on market values. These insurance valuations are updated on an annual basis with periodic reviews by a specialist valuer. The vehicles are deemed to have indeterminate lives as they are not in operation but are on display; hence the Council does not consider it appropriate to charge depreciation.
• Ancient Monuments and War Memorials
This category includes various roman ruins and ancient structures and four war memorials. The Council does not consider that reliable cost or valuation information can be obtained for the items in this category. This is because of the nature of the assets held and the lack of market values. Consequently, these assets are not recognised in the balance sheet.
• Miscellaneous
This category includes any other assets which are being held for their contribution to knowledge and culture but do not readily fall into the above categories. One example is the collection of Books of Remembrance held at the City crematorium. These items are reported in the Balance Sheet at either cost or insurance valuation where material. No depreciation is charged on these assets.
Heritage Assets – General The carrying amounts of heritage assets are reviewed where there is evidence of impairment e.g. where an item has suffered physical deterioration or breakage or where doubts arise as to its authenticity. Any impairment is recognised and measured in accordance with the Council’s accounting policies on impairment. The Council may occasionally dispose of heritage assets which are unsuitable for public display or to an appropriate body which will ensure the asset is maintained and displayed within a suitable collection e.g. to a museum or historical trust. The proceeds of such items are accounted for in accordance with the Council’s accounting policy on disposal of Property, Plant and Equipment. Disposal proceeds are disclosed separately in the notes to the financial statements and are accounted for in accordance with statutory accounting requirements relating to capital expenditure and capital receipts. 21. Disposals and Non-current Assets Held for Sale When it becomes probable that the carrying amount of an asset will be recovered principally through a sale transaction rather than through its continuing use, it is reclassified as an Asset Held for Sale. The asset is re-valued immediately before reclassification and then carried at the lower of this amount and fair value less costs to sell. Where there is subsequent decrease to fair value less costs to sell, the loss is posted to the Other Operating Expenditure line in the Comprehensive Income and Expenditure Statement. Gains in fair value are recognised only up to the amount of any previously recognised losses in the Surplus and Deficit on Provision of Services. Depreciation is not charged on Assets Held for Sale. If assets no longer meet the criteria to be classified as Assets Held for Sale, they are
41
S T A T E M E N T O F A C C O U N T S
2 0 1 1 / 1 2
reclassified back to non-current assets and valued at the lower of their carrying amount before they were classified as held for sale; adjusted for depreciation, amortisation or revaluations that would have been recognised had they not been classified as Held for Sale, and their recoverable amount at the date of the decision not to sell. When an asset is disposed of or decommissioned, the carrying amount of the asset in the Balance Sheet (whether Property, Plant and Equipment or Assets Held for Sale) is written off to the Other Operating Expenditure line in the Comprehensive Income and Expenditure Statement as part of the gain or loss on disposal. Receipts from the disposal (if any) are credited to the same line in the Comprehensive Income and Expenditure Statement also as part of the gain or loss on disposal (i.e. netted off against the carrying value of the asset at the time of disposal). Any revaluation gains accumulated for the asset in the Revaluation Reserve are transferred to the Capital Adjustment Account. Amounts received for a disposal in excess of £10,000 are categorised as capital receipts. A proportion of receipts relating to housing disposals (75% for dwellings, 50% for land and other assets, net of statutory deductions and allowances) is payable to the Government. The balance of receipts is required to be credited to the Capital Receipts Reserve, and can then only be used for new capital investment or set aside to reduce the Council’s underlying need to borrow. Receipts are transferred to the Reserve from the General Fund Balance in the Movement in Reserves Statement. The written-off value of disposals is not a charge against council tax, as the cost of fixed assets is fully provided under separate arrangements for capital financing. Amounts are transferred to the Capital Adjustment Account in the General Fund Balance in the Movement in Reserves Statement. 22. Provisions, Contingent Liabilities and Contingent Assets Provisions Provisions are made where an event has taken place that gives the Council a legal or constructive obligation that probably requires settlement by a transfer of economic benefits, and reliable estimate can be made of the amount of the obligation. For instance, the Council may be involved in a court case that could eventually result in the making of a settlement or the payment of compensation. Provisions are charged as an expense to the appropriate service line in the Comprehensive Income and Expenditure Statement in the year that the Council becomes aware of the obligation, and are measured at the best estimate at the balance sheet date of the expenditure required to settle the obligation, taking into account relevant risks and uncertainties. When payments are eventually made, they are charged to the provision carried in the Balance Sheet. Estimated settlements are reviewed at the end of each financial year – where it becomes less than probable that a transfer of economic benefits will not now be required (or a lower settlement than anticipated is made), the provision is reversed and credited back to the relevant service. Where some or all of the payment required to settle a provision is expected to
42
S T A T E M E N T O F A C C O U N T S
2 0 1 1 / 1 2
be recovered from another party (e.g. from an insurance claim), this is only recognised as income for the relevant service if it is virtually certain that the reimbursement will be received if the Council settles the obligation. Contingent Liabilities A contingent liability arises where an event has taken place that gives the Council a possible obligation whose existence will only be confirmed by the occurrence or otherwise of uncertain future events not wholly within the control of the Council. Contingent liabilities also arise in circumstances where a provision would otherwise be made but either it is not probable that an outflow of resources will be required or the amount of the obligation cannot be measured reliably. Contingent liabilities are not recognised in the Balance Sheet but disclosed in a note to the accounts. Contingent Assets A contingent asset arises where an event has taken place that gives the Council a possible asset whose existence will only be confirmed by the occurrence or otherwise of uncertain future events not wholly within the control of the Council. Contingent assets are not recognised in the Balance Sheet but disclosed in a note to the accounts where it is probable that there will be an inflow of economic benefits. 23. Reserves The Council sets aside specific amounts as reserves for future policy purposes or to cover contingencies. Reserves are created by transferring amounts out of the General Fund Balance in the Movement in Reserves Statement. When expenditure to be financed from a reserve is incurred, it is charged to the appropriate service in that year to score against the Surplus or Deficit on the Provision of Services in the Comprehensive Income and Expenditure Statement. The reserve is then appropriated back into the General Fund Balance in the Movement in Reserves Statement so that there is no net charge against council tax for the expenditure. Certain reserves are kept to manage the accounting processes for non-current assets, financial instruments, and retirement and employee benefits and do not represent usable resources for the Council – these reserves are explained in the relevant policies. 24. Revenue Expenditure Funded from Capital under Statute Expenditure incurred during the year that may be capitalised under statutory provisions but that does not result in the creation of a non-current asset has been charged as expenditure to the relevant service in the Comprehensive Income and Expenditure Statement in the year. Where the Council has determined to meet the cost of this expenditure from existing capital resources or by borrowing, a transfer in the Movement in Reserves Statement from the General Fund Balance to the Capital Adjustment Account then reverses out the amounts charged so that there is no impact on the level of council tax.
43
S T A T E M E N T O F A C C O U N T S
2 0 1 1 / 1 2
25. VAT VAT payable is included as an expense only to the extent that it is not recoverable from HM Revenue and Customs. VAT receivable is excluded from income. Note 2 – Accounting Standards Issued, Not Adopted The Council will be required to adopt the amendments to IFRS7 Financial Instruments: Disclosures (transfer of financial assets) in the 2012/13 financial statements. The accounting changes are included within the code and relate to additional disclosure requirements in respect of transfers of financial assets. This will result in a change of accounting policy; however, it is not expected to have a material impact upon the Council’s financial statements. Note 3 – Critical Judgements in Applying Accounting Policies In applying the accounting policies in Note 1, the Council has had to make certain judgements about complex transactions or those involving uncertainty about future events. The critical judgements made in the Statement of Accounts are:
• There is a high degree of uncertainty about the future levels of funding for local government. However, the Council has determined that this uncertainty is not yet sufficient to provide an indication that the assets of the Council might be impaired as a result of a need to close facilities or reduce levels of service provision.
• The Council has a collaborative arrangement with North Kesteven and West
Lindsey District Councils to provide the Central Lincolnshire Joint Planning Unit. This arrangement is hosted by North Kesteven District Council. The Council also has a collaborative arrangement with North Kesteven to provide a shared Revenues and Benefits Service. This shared service is hosted by the City of Lincoln Council. Both of these arrangements are governed through a Joint Committee representing each of the partner authorities. These arrangements are considered as a Jointly Controlled Operations, where ventures use their own resources to undertake an activity subject to joint control, and as such do not require consolidation into the Council’s accounts. The Council’s proportion of activity is accounted for separately within the Core Financial Statements.
• Investment in banks and other financial institutions are secure and will not
suffer impairments. Note 4 – Assumptions Made about the Future and Other Major Sources of Estimation Uncertainty The Statement of Accounts contains estimated figures that are based on assumptions made by the Council about the future or that are otherwise uncertain. Estimates are made taking into account historical experience, current trends and other relevant factors. However, because balances cannot be determined
44
S T A T E M E N T O F A C C O U N T S
2 0 1 1 / 1 2
with certainty, actual results could be materially different from the assumptions and estimates. The items in the Council’s Balance Sheet as at 31 March 2012 for which there is a significant risk of material adjustment in the forthcoming financial year are as follows: Item Uncertainties Effect if Actual Results Differ
from Assumptions Property, Plant and Equipment
Assets are depreciated over useful lives that are dependent on assumptions about the levels of repairs and maintenance that will be incurred in relation to individual assets. The current economic climate makes it uncertain that the Council will be able to sustain its current spending on repairs and maintenance, bringing into doubt the useful lives assigned to the assets.
If the useful lives of the assets reduce, depreciation increases and the carrying amount of the assets falls. It is estimated that the annual depreciation charge for buildings would increase by £0.700m for every year that the useful lives had to be reduced.
Assets held for sale and investment properties
Assets classified as Held for Sale or as Investment Property are carried at fair value based on a recently observed market price. In the current economic climate, market prices can fluctuate considerably due to global events. The value of these assets was current at the balance sheet date, but it cannot be determined for how long this value will be correct.
A 1% reduction in the value of investment properties would result in a charge to the CIES of £0.128m; a 1% increase in value would result in the recognition of a gain of £0.128m in the CIES.
Arrears As at 31 March 2012, the Council had a balance on sundry debtors of £2.817m. A review of significant balances suggested that an impairment of doubtful debts of £1.343m was required.
If collection rates were to deteriorate by 5% the amount of the impairment of doubtful debts would require an additional £0.141m to be set aside as an allowance.
45
S T A T E M E N T O F A C C O U N T S
2 0 1 1 / 1 2
Item Uncertainties Effect if Actual Results Differ from Assumptions
Pension Liability Estimation of the net liability to pay pensions depends on a number of complex judgements relating to the discount rate used, the rate at which salaries are projected to increase, changes in retirement ages, mortality rates and the expected return on pension fund assets. A firm of consulting actuaries (Hymans Robertson LLP) is engaged to provide the Council with expert advice about the assumptions to be applied. For more information on the Defined Benefit Pension Scheme please refer to note 43.
The effects on the net pensions liability of changes in individual assumptions can be measured. For instance, a 0.5% increase in the discount rate assumption would result in a decrease in the pension liability of £13.384m A 1 year increase in member life expectancy would result in an increased liability of £4.241m
Investments At 31 March 2012, the Council held £20.645m of short term investments, £14.645m of which were in AAA-rated instant access Money Market Funds. Of the remaining £6m, £3m has matured since the Balance Sheet date and has been reinvested in the short term in part-Government owned banks.
As all the investments are either in AAA-rated MMF’s or short term deposits in part-Government owned institutions, the risk of impairment is considered to be minimal.
Note 5 – Material Items of Income and Expense The following items of income and expense within the Comprehensive Income and Expenditure Statement that require separate disclosure are set out in the following table: Item
Value £’000
Housing Revenue Account (HRA) Self Financing Payment to the Secretary of State of £24.931m. This represents the Council’s one off payment in order to exit from the central government HRA subsidy system, which was payable on the 28 March 2012.
24,931
Note 6 – Events after the Balance Sheet Date The Statement of Accounts was authorised for issue by the Director of Resources on 25th September 2012. Events taking place after this date are not reflected in the financial statements or notes. Where events taking place before this date
46
S T A T E M E N T O F A C C O U N T S
2 0 1 1 / 1 2
provided information about conditions existing at 31st March 2012, the figures in the financial statements and notes have been adjusted in all material respects to reflect the impact of this information.
Note 7 – Adjustment between Accounting Basis and Funding Basis under Regulations This note details the adjustments that are made to the total comprehensive income and expenditure recognised by the Council in year in accordance with proper accounting practice to the resources that are specified by statutory provisions as being available to the Council to meet future capital and revenue expenditure.
47
S T A T E M E N T O F A C C O U N T S
2 0 1 1 / 1 2
2011/12 Usable Reserves Unusable Reserves
General Housing CMS Major Capital Capital Total Total Fund Revenue Repair Receipts Grants Balance Account Reserve Reserve Unapplied £000 £000 £000 £000 £000 £000 £000 £000 Reversal of items debited or credited to the Comprehensive Income and Expenditure Statement
Depreciation (excl HRA depreciation) 1,876 0 0 0 0 0 1,876 (1,876) Amortisation of Intangible Assets (excl HRA) 152 152 (152) HRA Depreciation 0 0 0 4,502 0 0 4,502 (4,502) HRA amortisation of intangible assets 41 41 (41) Impairment/revaluation losses (charged to I&E) 108 1,362 0 0 0 0 1,470 (1,470) Revenue Expenditure Funded from Capital under Statute 2,340 0 0 0 0 0 2,340 (2,340) Movement in market value of investment property 188 0 0 0 0 0 188 (188) Amounts of non current assets written off on disposal or sale as part of the gain/loss on disposal to the CIES 2,601 155 0 0 0 0 2,756 (2,756)
Capital grant and contributions unapplied credited to I&E (909) (209) 0 0 0 1,118 0 0 Use of capital grants and contributions to finance capital expenditure 0 0 0 0 (2,337) (2,337) 2,337 Transfer of sale proceeds credited as part of the gain/loss on disposal to the CIES (3,817) (408) 0 0 4,225 0 0 0
Use of capital receipts reserve to finance capital expenditure 0 0 0 (1,759) 0 (1,759) 1,759 Reversal of items relating to retirement benefits debited or credited to the Comprehensive Income and Expenditure Statement 2,402 1,087 0 0 0 0 3,489 (3,489)
Differences between statutory debits/credits and amounts recognised as income and expenditure in relation to financial instruments e.g. Soft loans (3) (205) 0 0 0 0 (208) 208
Reversal of Self Financing Settlement Payment to the Secretary of State 0 24,931 0 0 0 0 24,931 (24,931) Amount by which council tax income and residual community charge adjustment included in the Comprehensive Income and Expenditure Statement is different from the amount taken to the General Fund in accordance with regulation
(11) 0 0 0 0 (11) 11
48
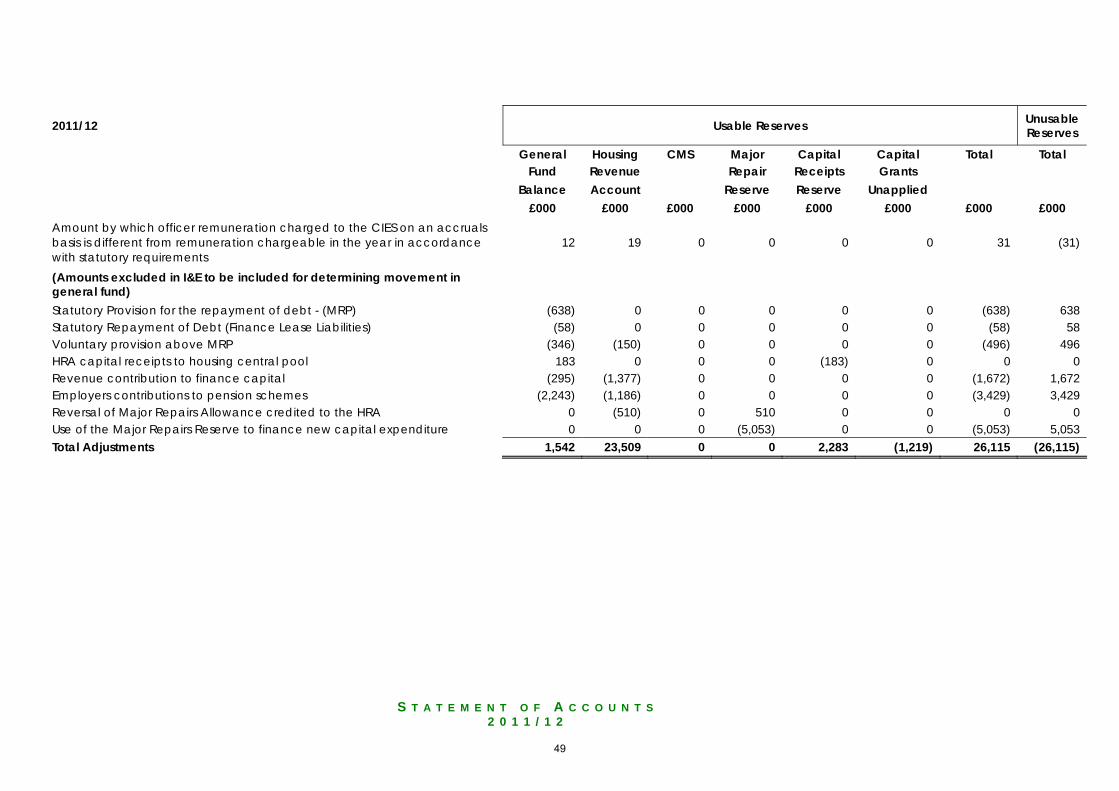
S T A T E M E N T O F A C C O U N T S
2 0 1 1 / 1 2
2011/12 Usable Reserves Unusable Reserves
General Housing CMS Major Capital Capital Total Total Fund Revenue Repair Receipts Grants Balance Account Reserve Reserve Unapplied £000 £000 £000 £000 £000 £000 £000 £000 Amount by which officer remuneration charged to the CIES on an accruals basis is different from remuneration chargeable in the year in accordance with statutory requirements
12 19 0 0 0 0 31 (31)
(Amounts excluded in I&E to be included for determining movement in general fund)
Statutory Provision for the repayment of debt - (MRP) (638) 0 0 0 0 0 (638) 638 Statutory Repayment of Debt (Finance Lease Liabilities) (58) 0 0 0 0 0 (58) 58 Voluntary provision above MRP (346) (150) 0 0 0 0 (496) 496 HRA capital receipts to housing central pool 183 0 0 0 (183) 0 0 0 Revenue contribution to finance capital (295) (1,377) 0 0 0 0 (1,672) 1,672 Employers contributions to pension schemes (2,243) (1,186) 0 0 0 0 (3,429) 3,429 Reversal of Major Repairs Allowance credited to the HRA 0 (510) 0 510 0 0 0 0 Use of the Major Repairs Reserve to finance new capital expenditure 0 0 0 (5,053) 0 0 (5,053) 5,053 Total Adjustments 1,542 23,509 0 0 2,283 (1,219) 26,115 (26,115)
49
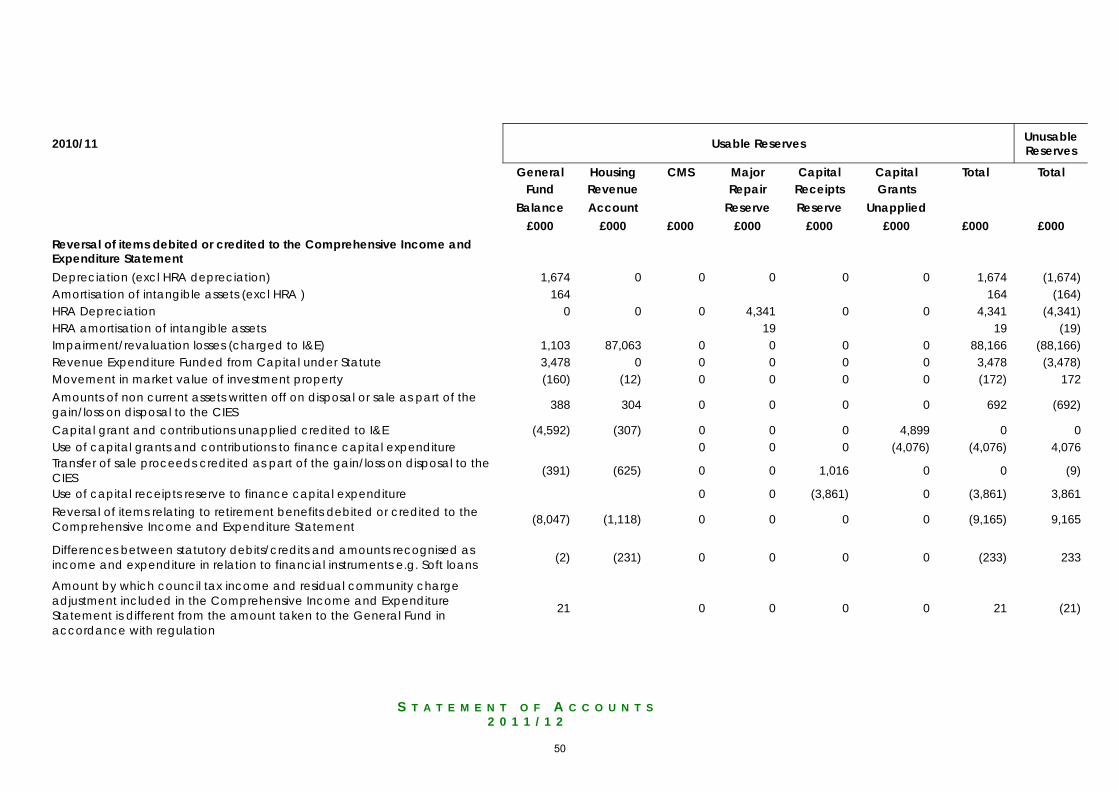
S T A T E M E N T O F A C C O U N T S
2 0 1 1 / 1 2
2010/11 Usable Reserves Unusable Reserves
General Housing CMS Major Capital Capital Total Total Fund Revenue Repair Receipts Grants
Balance Account Reserve Reserve Unapplied £000 £000 £000 £000 £000 £000 £000 £000 Reversal of items debited or credited to the Comprehensive Income and Expenditure Statement
Depreciation (excl HRA depreciation) 1,674 0 0 0 0 0 1,674 (1,674) Amortisation of intangible assets (excl HRA ) 164 164 (164) HRA Depreciation 0 0 0 4,341 0 0 4,341 (4,341) HRA amortisation of intangible assets 19 19 (19) Impairment/revaluation losses (charged to I&E) 1,103 87,063 0 0 0 0 88,166 (88,166) Revenue Expenditure Funded from Capital under Statute 3,478 0 0 0 0 0 3,478 (3,478) Movement in market value of investment property (160) (12) 0 0 0 0 (172) 172 Amounts of non current assets written off on disposal or sale as part of the gain/loss on disposal to the CIES 388 304 0 0 0 0 692 (692)
Capital grant and contributions unapplied credited to I&E (4,592) (307) 0 0 0 4,899 0 0 Use of capital grants and contributions to finance capital expenditure 0 0 0 (4,076) (4,076) 4,076 Transfer of sale proceeds credited as part of the gain/loss on disposal to the CIES (391) (625) 0 0 1,016 0 0 (9)
Use of capital receipts reserve to finance capital expenditure 0 0 (3,861) 0 (3,861) 3,861 Reversal of items relating to retirement benefits debited or credited to the Comprehensive Income and Expenditure Statement (8,047) (1,118) 0 0 0 0 (9,165) 9,165
Differences between statutory debits/credits and amounts recognised as income and expenditure in relation to financial instruments e.g. Soft loans (2) (231) 0 0 0 0 (233) 233
Amount by which council tax income and residual community charge adjustment included in the Comprehensive Income and Expenditure Statement is different from the amount taken to the General Fund in accordance with regulation
21 0 0 0 0 21 (21)
50
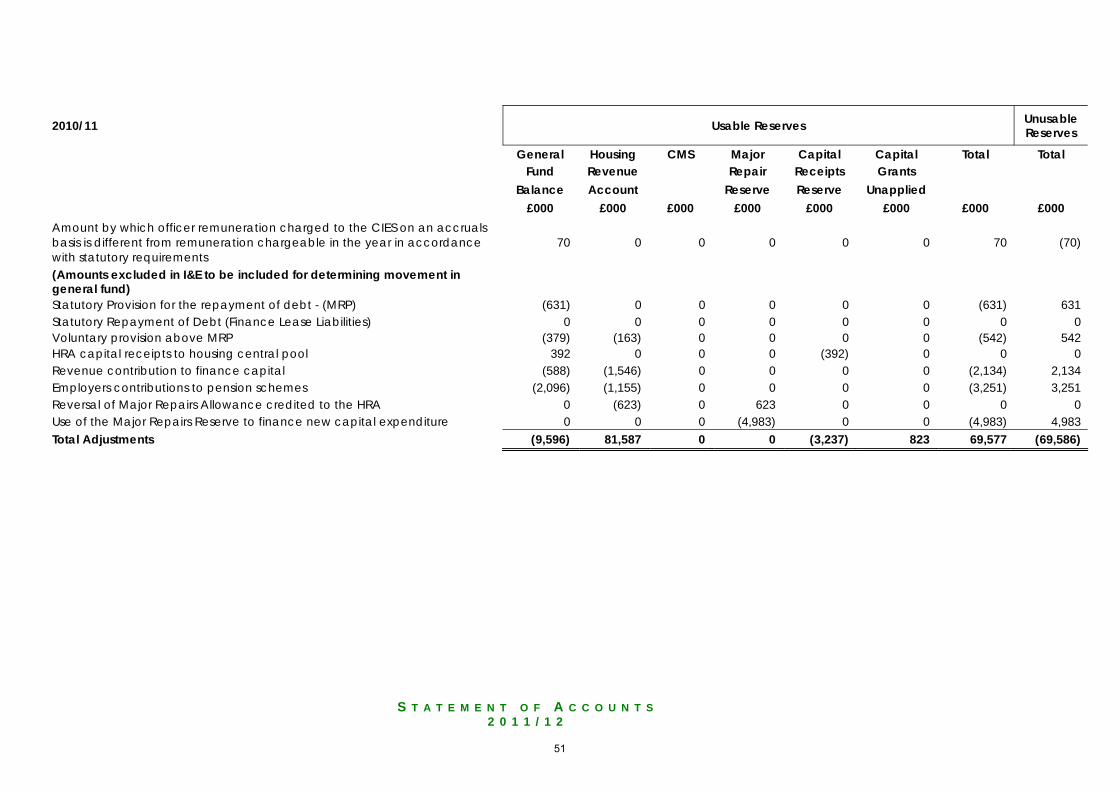
S T A T E M E N T O F A C C O U N T S
2 0 1 1 / 1 2
2010/11 Usable Reserves Unusable Reserves
General Housing CMS Major Capital Capital Total Total Fund Revenue Repair Receipts Grants
Balance Account Reserve Reserve Unapplied £000 £000 £000 £000 £000 £000 £000 £000 Amount by which officer remuneration charged to the CIES on an accruals basis is different from remuneration chargeable in the year in accordance with statutory requirements
70 0 0 0 0 0 70 (70)
(Amounts excluded in I&E to be included for determining movement in general fund)
Statutory Provision for the repayment of debt - (MRP) (631) 0 0 0 0 0 (631) 631 Statutory Repayment of Debt (Finance Lease Liabilities) 0 0 0 0 0 0 0 0 Voluntary provision above MRP (379) (163) 0 0 0 0 (542) 542 HRA capital receipts to housing central pool 392 0 0 0 (392) 0 0 0 Revenue contribution to finance capital (588) (1,546) 0 0 0 0 (2,134) 2,134 Employers contributions to pension schemes (2,096) (1,155) 0 0 0 0 (3,251) 3,251 Reversal of Major Repairs Allowance credited to the HRA 0 (623) 0 623 0 0 0 0 Use of the Major Repairs Reserve to finance new capital expenditure 0 0 0 (4,983) 0 0 (4,983) 4,983 Total Adjustments (9,596) 81,587 0 0 (3,237) 823 69,577 (69,586)
51
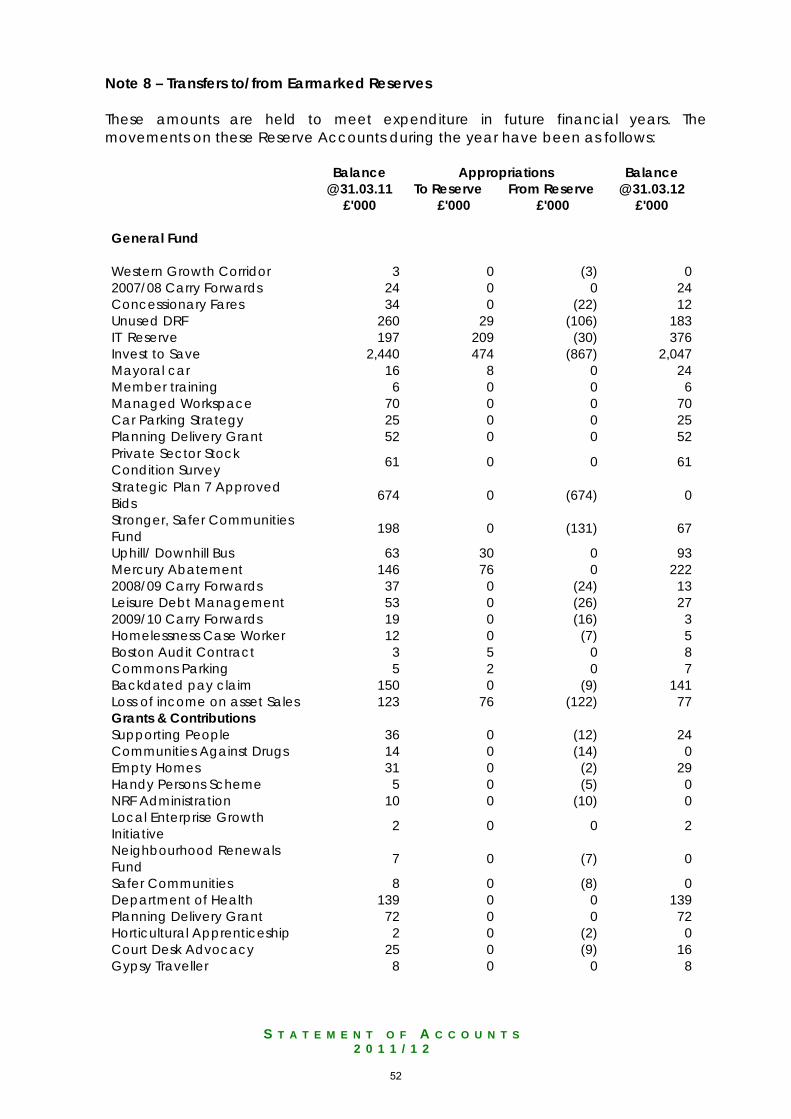
S T A T E M E N T O F A C C O U N T S
2 0 1 1 / 1 2
Note 8 – Transfers to/from Earmarked Reserves These amounts are held to meet expenditure in future financial years. The movements on these Reserve Accounts during the year have been as follows: Balance Appropriations Balance @ 31.03.11 To Reserve From Reserve @ 31.03.12 £'000 £'000 £'000 £'000 General Fund Western Growth Corridor 3 0 (3) 0 2007/08 Carry Forwards 24 0 0 24 Concessionary Fares 34 0 (22) 12 Unused DRF 260 29 (106) 183 IT Reserve 197 209 (30) 376 Invest to Save 2,440 474 (867) 2,047 Mayoral car 16 8 0 24 Member training 6 0 0 6 Managed Workspace 70 0 0 70 Car Parking Strategy 25 0 0 25 Planning Delivery Grant 52 0 0 52 Private Sector Stock Condition Survey 61 0 0 61
Strategic Plan 7 Approved Bids 674 0 (674) 0
Stronger, Safer Communities Fund 198 0 (131) 67
Uphill/ Downhill Bus 63 30 0 93 Mercury Abatement 146 76 0 222 2008/09 Carry Forwards 37 0 (24) 13 Leisure Debt Management 53 0 (26) 27 2009/10 Carry Forwards 19 0 (16) 3 Homelessness Case Worker 12 0 (7) 5 Boston Audit Contract 3 5 0 8 Commons Parking 5 2 0 7 Backdated pay claim 150 0 (9) 141 Loss of income on asset Sales 123 76 (122) 77 Grants & Contributions Supporting People 36 0 (12) 24 Communities Against Drugs 14 0 (14) 0 Empty Homes 31 0 (2) 29 Handy Persons Scheme 5 0 (5) 0 NRF Administration 10 0 (10) 0 Local Enterprise Growth Initiative 2 0 0 2
Neighbourhood Renewals Fund 7 0 (7) 0
Safer Communities 8 0 (8) 0 Department of Health 139 0 0 139 Planning Delivery Grant 72 0 0 72 Horticultural Apprenticeship 2 0 (2) 0 Court Desk Advocacy 25 0 (9) 16 Gypsy Traveller 8 0 0 8
52
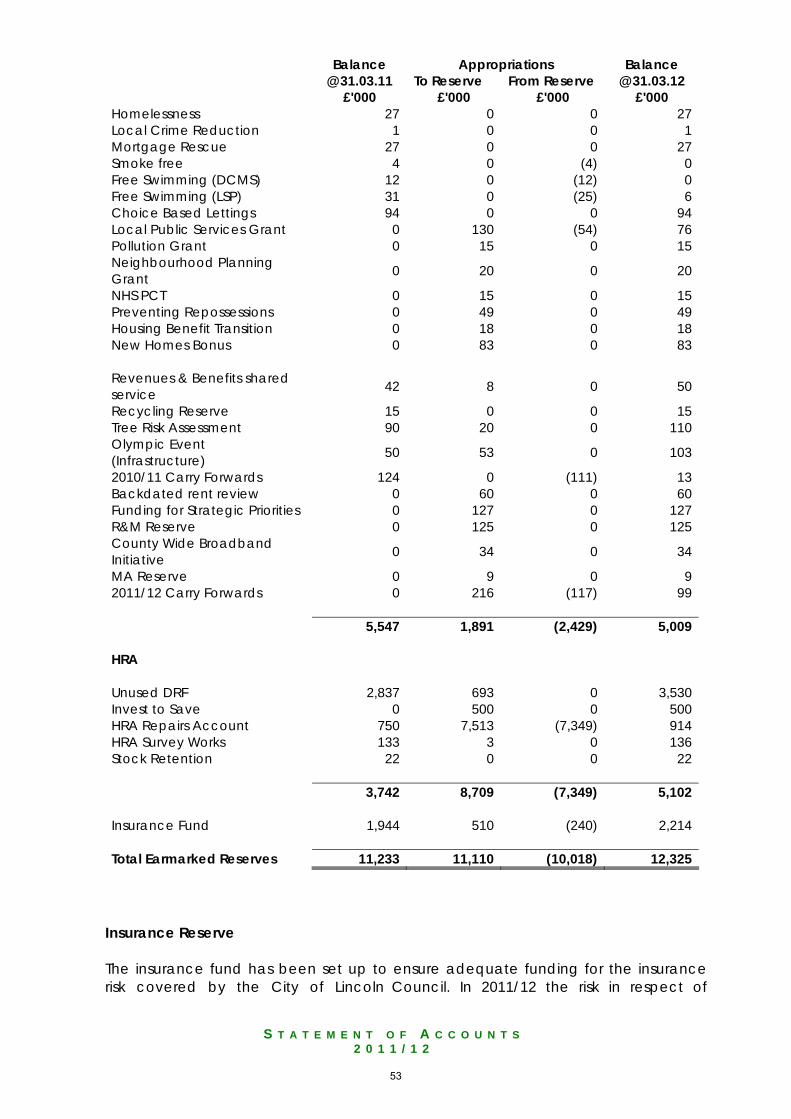
S T A T E M E N T O F A C C O U N T S
2 0 1 1 / 1 2
Balance Appropriations Balance @ 31.03.11 To Reserve From Reserve @ 31.03.12 £'000 £'000 £'000 £'000 Homelessness 27 0 0 27 Local Crime Reduction 1 0 0 1 Mortgage Rescue 27 0 0 27 Smoke free 4 0 (4) 0 Free Swimming (DCMS) 12 0 (12) 0 Free Swimming (LSP) 31 0 (25) 6 Choice Based Lettings 94 0 0 94 Local Public Services Grant 0 130 (54) 76 Pollution Grant 0 15 0 15 Neighbourhood Planning Grant 0 20 0 20
NHS PCT 0 15 0 15 Preventing Repossessions 0 49 0 49 Housing Benefit Transition 0 18 0 18 New Homes Bonus 0 83 0 83 Revenues & Benefits shared service 42 8 0 50
Recycling Reserve 15 0 0 15 Tree Risk Assessment 90 20 0 110 Olympic Event (Infrastructure) 50 53 0 103
2010/11 Carry Forwards 124 0 (111) 13 Backdated rent review 0 60 0 60 Funding for Strategic Priorities 0 127 0 127 R&M Reserve 0 125 0 125 County Wide Broadband Initiative 0 34 0 34
MA Reserve 0 9 0 9 2011/12 Carry Forwards 0 216 (117) 99 5,547 1,891 (2,429) 5,009 HRA Unused DRF 2,837 693 0 3,530 Invest to Save 0 500 0 500 HRA Repairs Account 750 7,513 (7,349) 914 HRA Survey Works 133 3 0 136 Stock Retention 22 0 0 22 3,742 8,709 (7,349) 5,102 Insurance Fund 1,944 510 (240) 2,214 Total Earmarked Reserves 11,233 11,110 (10,018) 12,325
Insurance Reserve The insurance fund has been set up to ensure adequate funding for the insurance risk covered by the City of Lincoln Council. In 2011/12 the risk in respect of
53
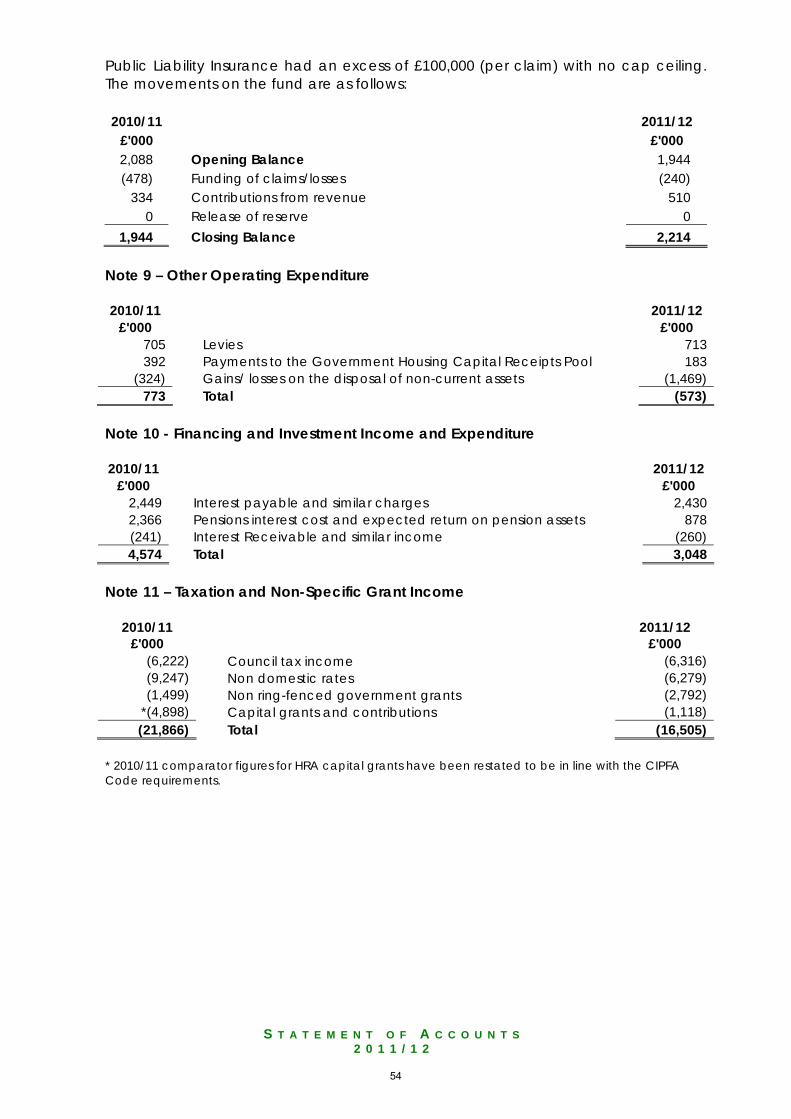
S T A T E M E N T O F A C C O U N T S
2 0 1 1 / 1 2
Public Liability Insurance had an excess of £100,000 (per claim) with no cap ceiling. The movements on the fund are as follows: 2010/11 2011/12
£'000 £'000 2,088 Opening Balance 1,944 (478) Funding of claims/losses (240)
334 Contributions from revenue 510 0 Release of reserve 0
1,944 Closing Balance 2,214 Note 9 – Other Operating Expenditure 2010/11 2011/12
£'000 £'000 705 Levies 713 392 Payments to the Government Housing Capital Receipts Pool 183
(324) Gains/ losses on the disposal of non-current assets (1,469) 773 Total (573)
Note 10 - Financing and Investment Income and Expenditure 2010/11 2011/12
£'000 £'000 2,449 Interest payable and similar charges 2,430 2,366 Pensions interest cost and expected return on pension assets 878 (241) Interest Receivable and similar income (260) 4,574 Total 3,048
Note 11 – Taxation and Non-Specific Grant Income
2010/11 2011/12 £'000 £'000
(6,222) Council tax income (6,316) (9,247) Non domestic rates (6,279) (1,499) Non ring-fenced government grants (2,792)
*(4,898) Capital grants and contributions (1,118) (21,866) Total (16,505)
* 2010/11 comparator figures for HRA capital grants have been restated to be in line with the CIPFA Code requirements.
54
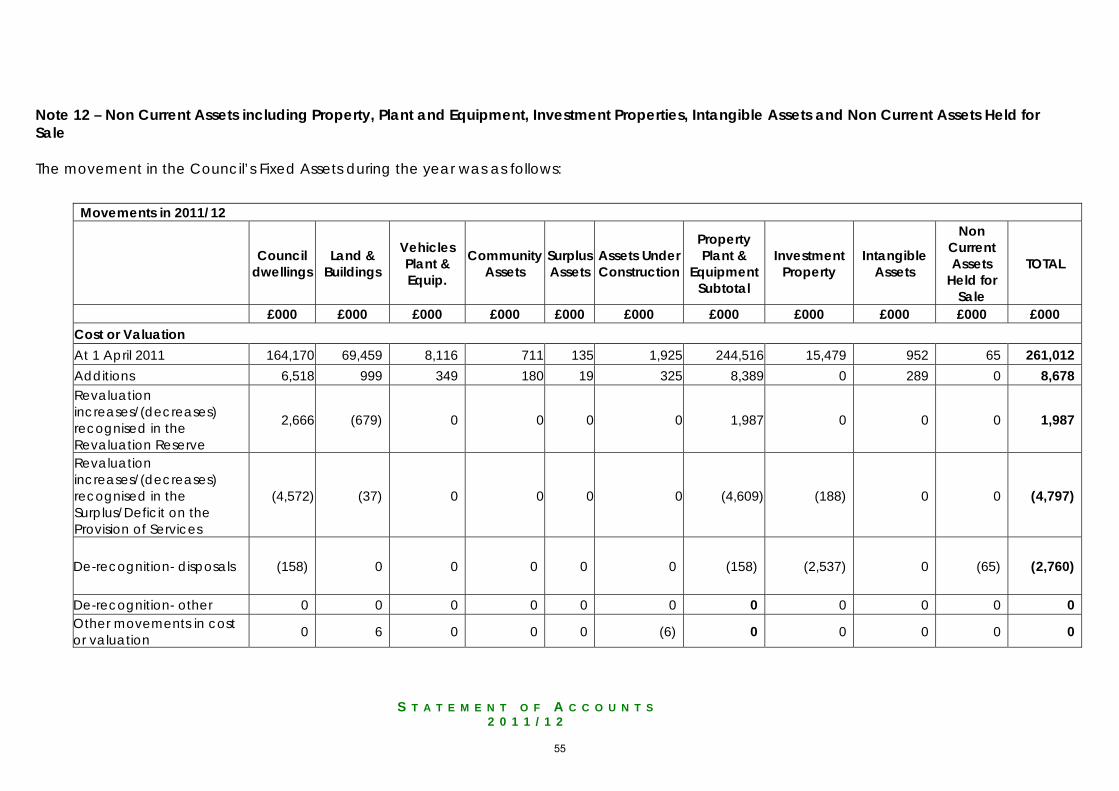
S T A T E M E N T O F A C C O U N T S
2 0 1 1 / 1 2
Note 12 – Non Current Assets including Property, Plant and Equipment, Investment Properties, Intangible Assets and Non Current Assets Held for Sale
The movement in the Council’s Fixed Assets during the year was as follows:
Movements in 2011/12
Council dwellings
Land & Buildings
Vehicles Plant & Equip.
Community Assets
Surplus Assets
Assets Under Construction
Property Plant &
Equipment Subtotal
Investment Property
Intangible Assets
Non Current Assets
Held for Sale
TOTAL
£000 £000 £000 £000 £000 £000 £000 £000 £000 £000 £000 Cost or Valuation At 1 April 2011 164,170 69,459 8,116 711 135 1,925 244,516 15,479 952 65 261,012 Additions 6,518 999 349 180 19 325 8,389 0 289 0 8,678 Revaluation increases/(decreases) recognised in the Revaluation Reserve
2,666 (679) 0 0 0 0 1,987 0 0 0 1,987
Revaluation increases/(decreases) recognised in the Surplus/Deficit on the Provision of Services
(4,572) (37) 0 0 0 0 (4,609) (188) 0 0 (4,797)
De-recognition- disposals (158) 0 0 0 0 0 (158) (2,537) 0 (65) (2,760)
De-recognition- other 0 0 0 0 0 0 0 0 0 0 0 Other movements in cost or valuation 0 6 0 0 0 (6) 0 0 0 0 0
55
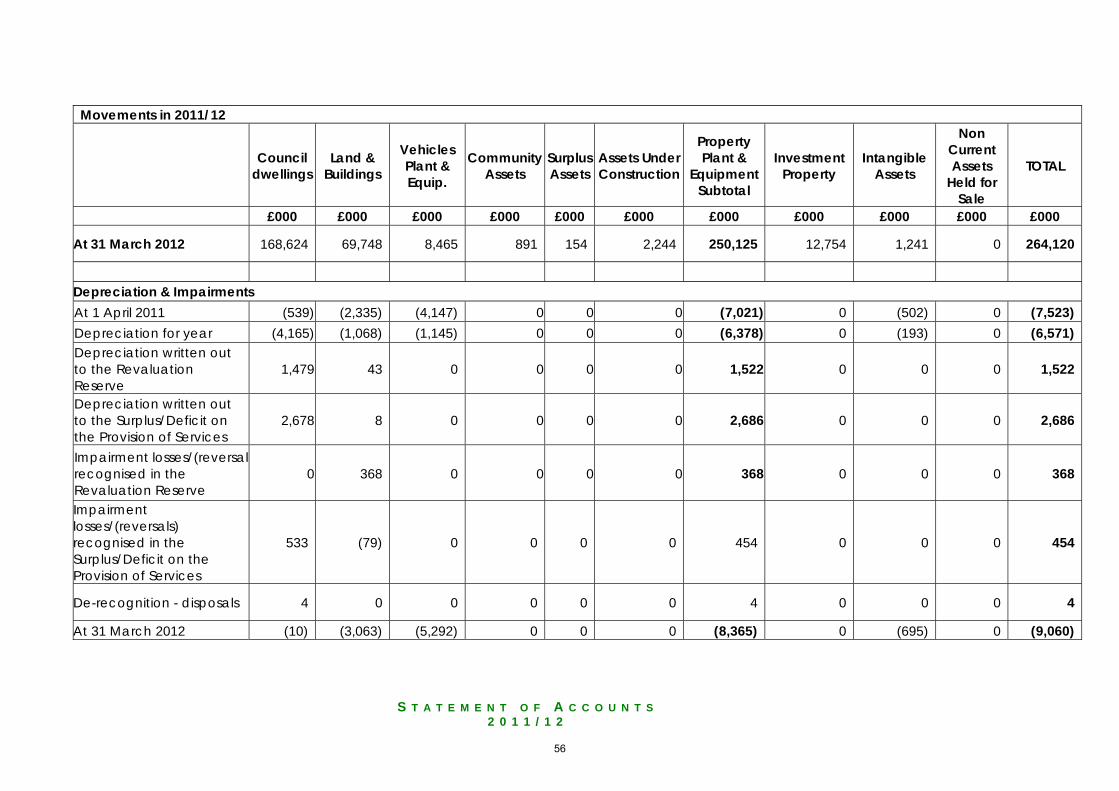
S T A T E M E N T O F A C C O U N T S
2 0 1 1 / 1 2
Movements in 2011/12
Council dwellings
Land & Buildings
Vehicles Plant & Equip.
Community Assets
Surplus Assets
Assets Under Construction
Property Plant &
Equipment Subtotal
Investment Property
Intangible Assets
Non Current Assets
Held for Sale
TOTAL
£000 £000 £000 £000 £000 £000 £000 £000 £000 £000 £000
At 31 March 2012 168,624 69,748 8,465 891 154 2,244 250,125 12,754 1,241 0 264,120
Depreciation & Impairments At 1 April 2011 (539) (2,335) (4,147) 0 0 0 (7,021) 0 (502) 0 (7,523) Depreciation for year (4,165) (1,068) (1,145) 0 0 0 (6,378) 0 (193) 0 (6,571) Depreciation written out to the Revaluation Reserve
1,479 43 0 0 0 0 1,522 0 0 0 1,522
Depreciation written out to the Surplus/Deficit on the Provision of Services
2,678 8 0 0 0 0 2,686 0 0 0 2,686
Impairment losses/(reversalsrecognised in the Revaluation Reserve
0 368 0 0 0 0 368 0 0 0 368
Impairment losses/(reversals) recognised in the Surplus/Deficit on the Provision of Services
533 (79) 0 0 0 0 454 0 0 0 454
De-recognition - disposals 4 0 0 0 0 0 4 0 0 0 4
At 31 March 2012 (10) (3,063) (5,292) 0 0 0 (8,365) 0 (695) 0 (9,060)
56
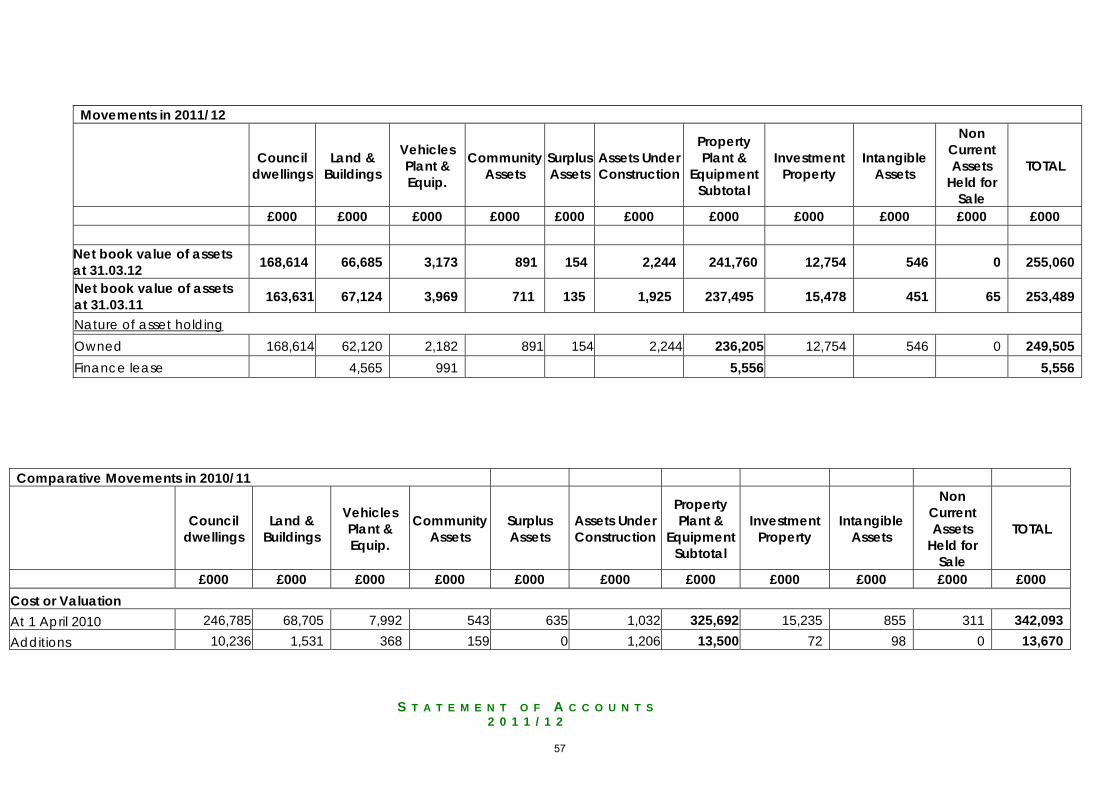
S T A T E M E N T O F A C C O U N T S
2 0 1 1 / 1 2
Movements in 2011/12
Council dwellings
Land & Buildings
Vehicles Plant & Equip.
Community Assets
Surplus Assets
Assets Under Construction
Property Plant &
Equipment Subtotal
Investment Property
Intangible Assets
Non Current Assets
Held for Sale
TOTAL
£000 £000 £000 £000 £000 £000 £000 £000 £000 £000 £000
Net book value of assets at 31.03.12 168,614 66,685 3,173 891 154 2,244 241,760 12,754 546 0 255,060
Net book value of assets at 31.03.11 163,631 67,124 3,969 711 135 1,925 237,495 15,478 451 65 253,489
Nature of asset holding Owned 168,614 62,120 2,182 891 154 2,244 236,205 12,754 546 0 249,505 Finance lease 4,565 991 5,556 5,556
Comparative Movements in 2010/11
Council dwellings
Land & Buildings
Vehicles Plant & Equip.
Community Assets
Surplus Assets
Assets Under Construction
Property Plant &
Equipment Subtotal
Investment Property
Intangible Assets
Non Current Assets
Held for Sale
TOTAL
£000 £000 £000 £000 £000 £000 £000 £000 £000 £000 £000 Cost or Valuation At 1 April 2010 246,785 68,705 7,992 543 635 1,032 325,692 15,235 855 311 342,093 Additions 10,236 1,531 368 159 0 1,206 13,500 72 98 0 13,670
57
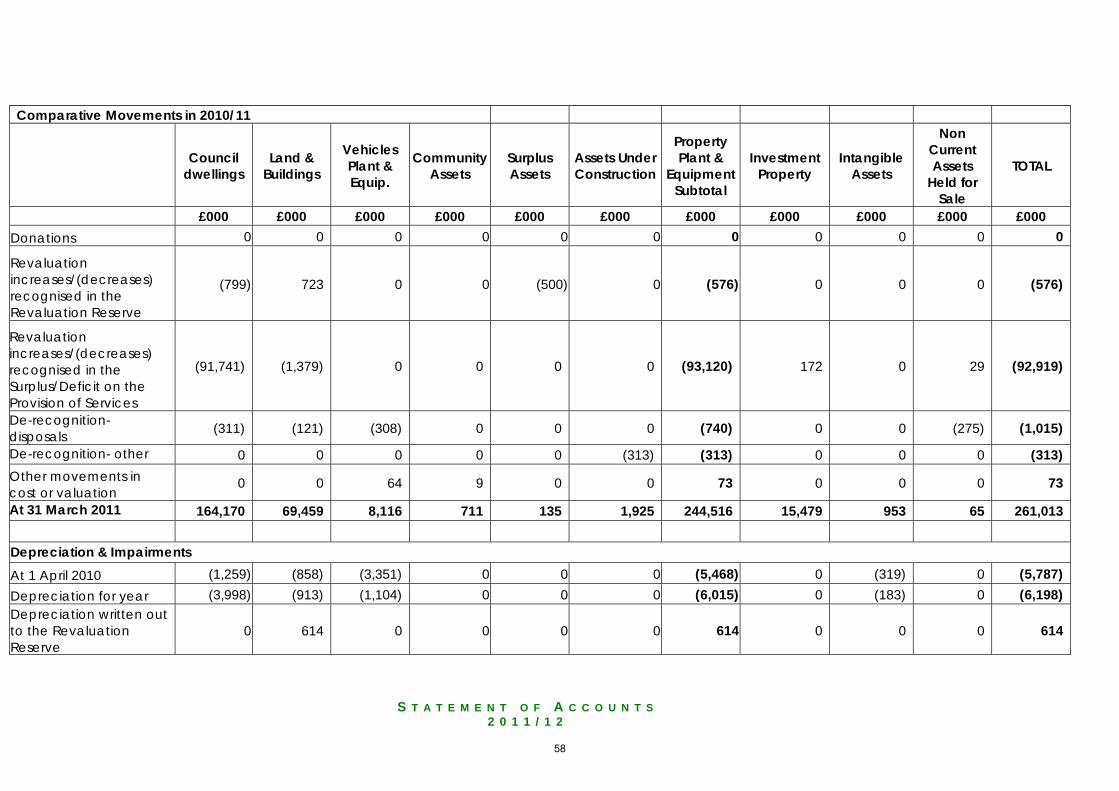
S T A T E M E N T O F A C C O U N T S
2 0 1 1 / 1 2
Comparative Movements in 2010/11
Council dwellings
Land & Buildings
Vehicles Plant & Equip.
Community Assets
Surplus Assets
Assets Under Construction
Property Plant &
Equipment Subtotal
Investment Property
Intangible Assets
Non Current Assets
Held for Sale
TOTAL
£000 £000 £000 £000 £000 £000 £000 £000 £000 £000 £000 Donations 0 0 0 0 0 0 0 0 0 0 0
Revaluation increases/(decreases) recognised in the Revaluation Reserve
(799) 723 0 0 (500) 0 (576) 0 0 0 (576)
Revaluation increases/(decreases) recognised in the Surplus/Deficit on the Provision of Services
(91,741) (1,379) 0 0 0 0 (93,120) 172 0 29 (92,919)
De-recognition- disposals (311) (121) (308) 0 0 0 (740) 0 0 (275) (1,015)
De-recognition- other 0 0 0 0 0 (313) (313) 0 0 0 (313) Other movements in cost or valuation
0 0 64 9 0 0 73 0 0 0 73
At 31 March 2011 164,170 69,459 8,116 711 135 1,925 244,516 15,479 953 65 261,013 Depreciation & Impairments At 1 April 2010 (1,259) (858) (3,351) 0 0 0 (5,468) 0 (319) 0 (5,787) Depreciation for year (3,998) (913) (1,104) 0 0 0 (6,015) 0 (183) 0 (6,198) Depreciation written out to the Revaluation Reserve
0 614 0 0 0 0 614 0 0 0 614
58
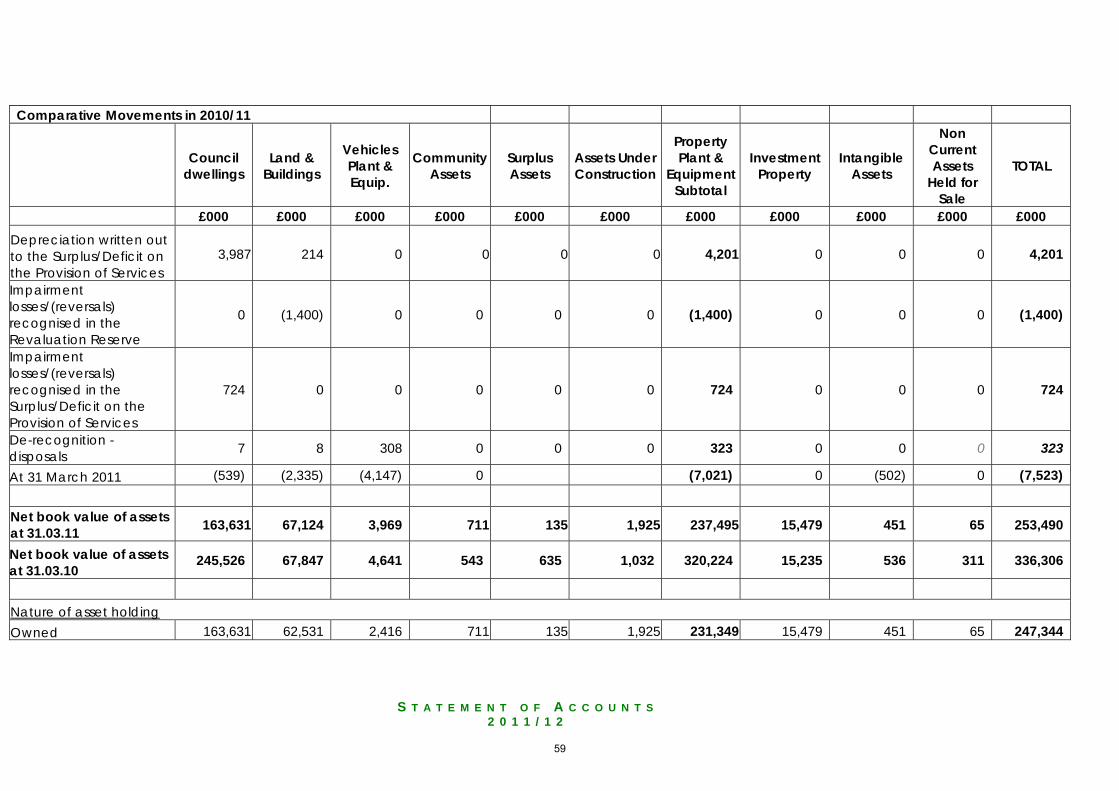
S T A T E M E N T O F A C C O U N T S
2 0 1 1 / 1 2
Comparative Movements in 2010/11
Council dwellings
Land & Buildings
Vehicles Plant & Equip.
Community Assets
Surplus Assets
Assets Under Construction
Property Plant &
Equipment Subtotal
Investment Property
Intangible Assets
Non Current Assets
Held for Sale
TOTAL
£000 £000 £000 £000 £000 £000 £000 £000 £000 £000 £000 Depreciation written out to the Surplus/Deficit on the Provision of Services
3,987 214 0 0 0 0 4,201 0 0 0 4,201
Impairment losses/(reversals) recognised in the Revaluation Reserve
0 (1,400) 0 0 0 0 (1,400) 0 0 0 (1,400)
Impairment losses/(reversals) recognised in the Surplus/Deficit on the Provision of Services
724 0 0 0 0 0 724 0 0 0 724
De-recognition - disposals 7 8 308 0 0 0 323 0 0 0 323
At 31 March 2011 (539) (2,335) (4,147) 0 (7,021) 0 (502) 0 (7,523) Net book value of assets at 31.03.11 163,631 67,124 3,969 711 135 1,925 237,495 15,479 451 65 253,490
Net book value of assets at 31.03.10
245,526 67,847 4,641 543 635 1,032 320,224 15,235 536 311 336,306
Nature of asset holding Owned 163,631 62,531 2,416 711 135 1,925 231,349 15,479 451 65 247,344
59
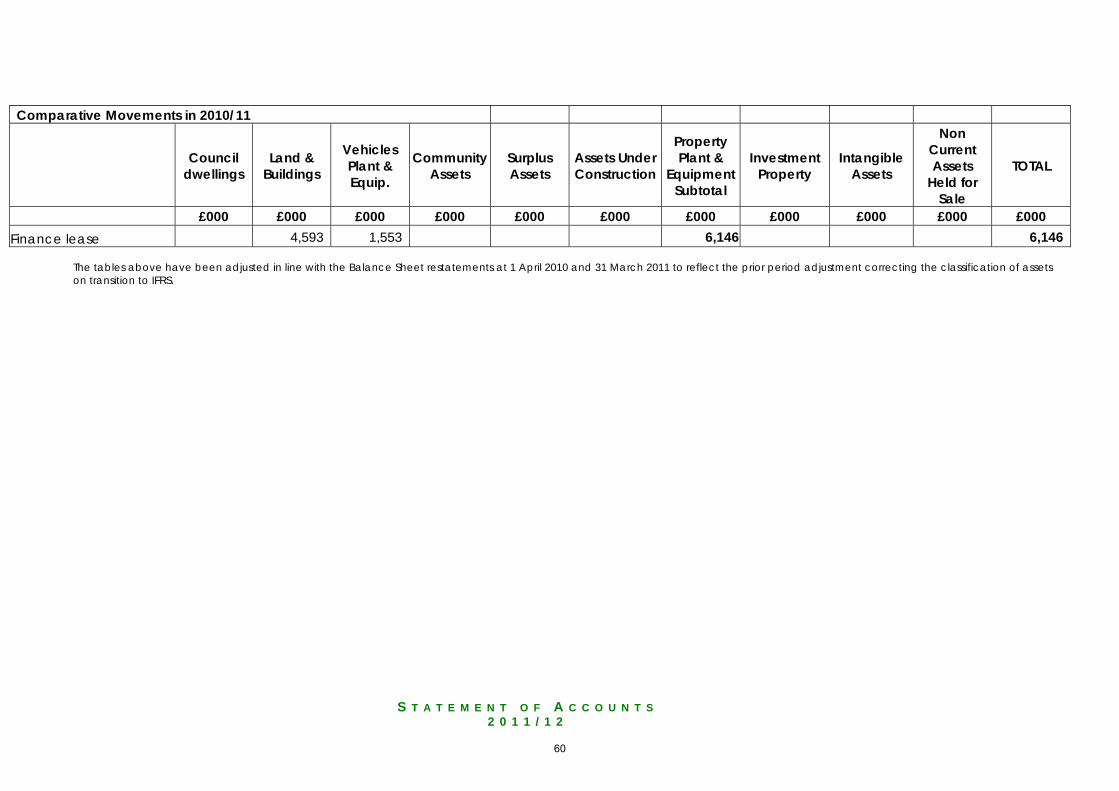
S T A T E M E N T O F A C C O U N T S
2 0 1 1 / 1 2
Comparative Movements in 2010/11
Council dwellings
Land & Buildings
Vehicles Plant & Equip.
Community Assets
Surplus Assets
Assets Under Construction
Property Plant &
Equipment Subtotal
Investment Property
Intangible Assets
Non Current Assets
Held for Sale
TOTAL
£000 £000 £000 £000 £000 £000 £000 £000 £000 £000 £000 Finance lease 4,593 1,553 6,146 6,146
The tables above have been adjusted in line with the Balance Sheet restatements at 1 April 2010 and 31 March 2011 to reflect the prior period adjustment correcting the classification of assets on transition to IFRS.
60
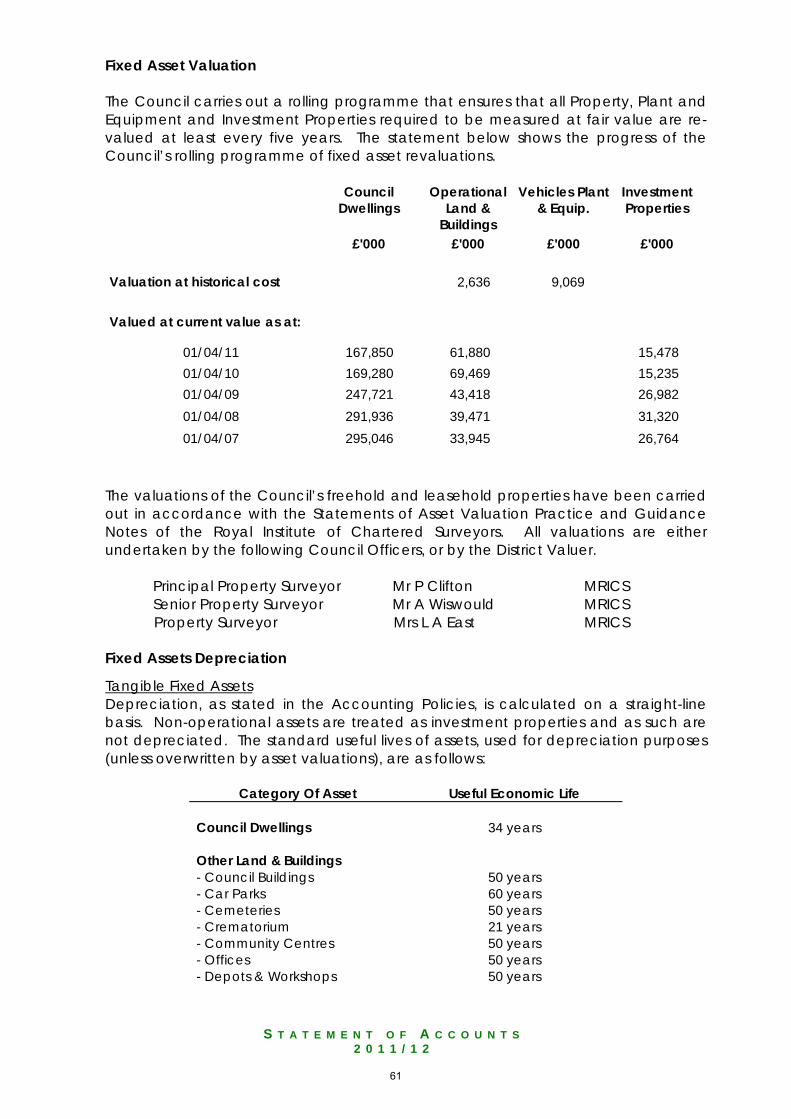
S T A T E M E N T O F A C C O U N T S
2 0 1 1 / 1 2
Fixed Asset Valuation The Council carries out a rolling programme that ensures that all Property, Plant and Equipment and Investment Properties required to be measured at fair value are re-valued at least every five years. The statement below shows the progress of the Council’s rolling programme of fixed asset revaluations. Council
Dwellings Operational
Land & Buildings
Vehicles Plant & Equip.
Investment Properties
£'000 £'000 £'000 £'000 Valuation at historical cost 2,636 9,069 Valued at current value as at:
01/04/11 167,850 61,880 15,478 01/04/10 169,280 69,469 15,235 01/04/09 247,721 43,418 26,982 01/04/08 291,936 39,471 31,320 01/04/07 295,046 33,945 26,764
The valuations of the Council’s freehold and leasehold properties have been carried out in accordance with the Statements of Asset Valuation Practice and Guidance Notes of the Royal Institute of Chartered Surveyors. All valuations are either undertaken by the following Council Officers, or by the District Valuer. Principal Property Surveyor Mr P Clifton MRICS Senior Property Surveyor Mr A Wiswould MRICS Property Surveyor Mrs L A East MRICS Fixed Assets Depreciation
Tangible Fixed Assets Depreciation, as stated in the Accounting Policies, is calculated on a straight-line basis. Non-operational assets are treated as investment properties and as such are not depreciated. The standard useful lives of assets, used for depreciation purposes (unless overwritten by asset valuations), are as follows:
Category Of Asset Useful Economic Life Council Dwellings 34 years Other Land & Buildings - Council Buildings 50 years - Car Parks 60 years - Cemeteries 50 years - Crematorium 21 years - Community Centres 50 years - Offices 50 years - Depots & Workshops 50 years
61
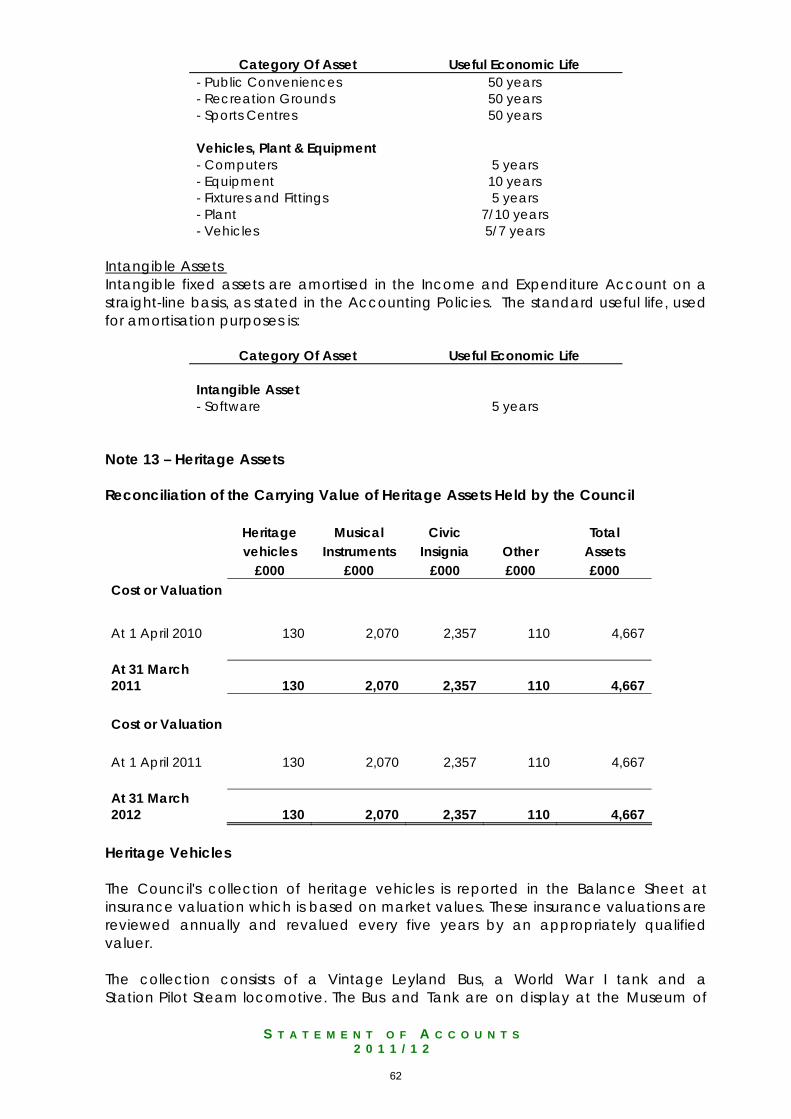
S T A T E M E N T O F A C C O U N T S
2 0 1 1 / 1 2
Category Of Asset Useful Economic Life - Public Conveniences 50 years - Recreation Grounds 50 years - Sports Centres 50 years Vehicles, Plant & Equipment - Computers 5 years - Equipment 10 years - Fixtures and Fittings 5 years - Plant 7/10 years - Vehicles 5/7 years
Intangible Assets Intangible fixed assets are amortised in the Income and Expenditure Account on a straight-line basis, as stated in the Accounting Policies. The standard useful life, used for amortisation purposes is:
Category Of Asset Useful Economic Life Intangible Asset - Software 5 years
Note 13 – Heritage Assets Reconciliation of the Carrying Value of Heritage Assets Held by the Council Heritage Musical Civic Total vehicles Instruments Insignia Other Assets £000 £000 £000 £000 £000 Cost or Valuation
At 1 April 2010 130 2,070 2,357 110 4,667 At 31 March 2011 130 2,070 2,357 110 4,667 Cost or Valuation At 1 April 2011 130 2,070 2,357 110 4,667 At 31 March 2012 130 2,070 2,357 110 4,667
Heritage Vehicles The Council's collection of heritage vehicles is reported in the Balance Sheet at insurance valuation which is based on market values. These insurance valuations are reviewed annually and revalued every five years by an appropriately qualified valuer. The collection consists of a Vintage Leyland Bus, a World War I tank and a Station Pilot Steam locomotive. The Bus and Tank are on display at the Museum of
62
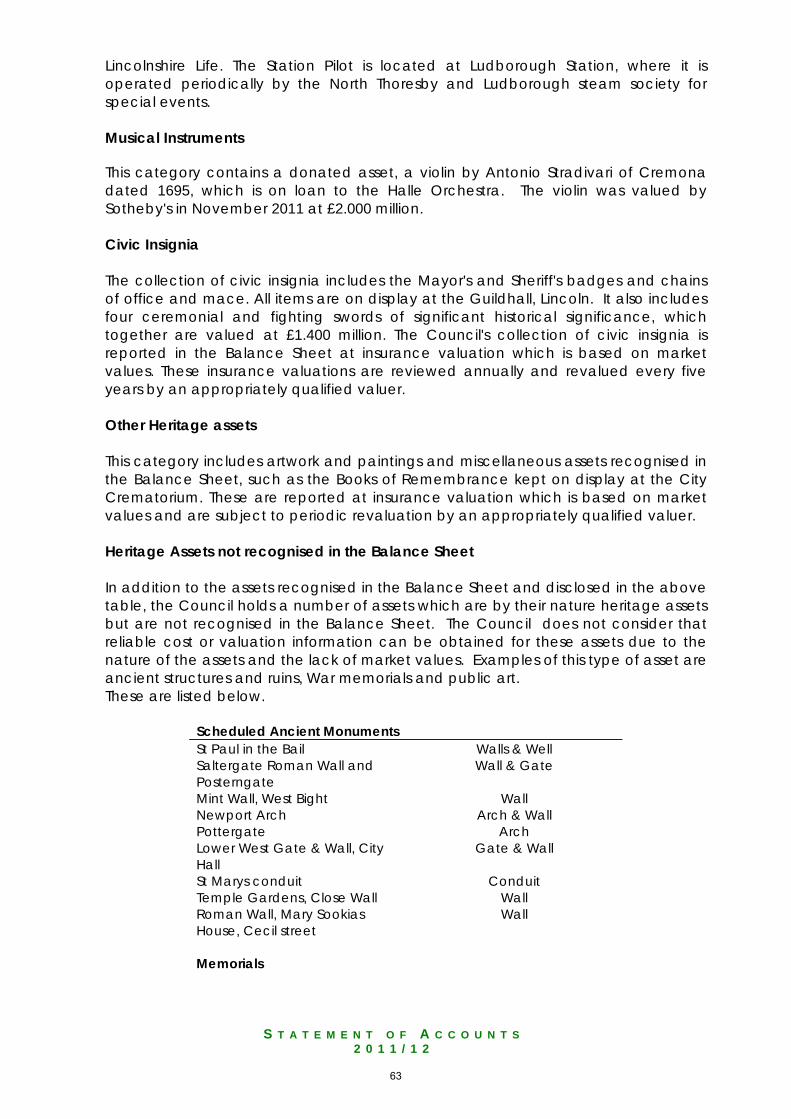
S T A T E M E N T O F A C C O U N T S
2 0 1 1 / 1 2
Lincolnshire Life. The Station Pilot is located at Ludborough Station, where it is operated periodically by the North Thoresby and Ludborough steam society for special events. Musical Instruments This category contains a donated asset, a violin by Antonio Stradivari of Cremona dated 1695, which is on loan to the Halle Orchestra. The violin was valued by Sotheby's in November 2011 at £2.000 million. Civic Insignia The collection of civic insignia includes the Mayor's and Sheriff's badges and chains of office and mace. All items are on display at the Guildhall, Lincoln. It also includes four ceremonial and fighting swords of significant historical significance, which together are valued at £1.400 million. The Council's collection of civic insignia is reported in the Balance Sheet at insurance valuation which is based on market values. These insurance valuations are reviewed annually and revalued every five years by an appropriately qualified valuer. Other Heritage assets This category includes artwork and paintings and miscellaneous assets recognised in the Balance Sheet, such as the Books of Remembrance kept on display at the City Crematorium. These are reported at insurance valuation which is based on market values and are subject to periodic revaluation by an appropriately qualified valuer. Heritage Assets not recognised in the Balance Sheet In addition to the assets recognised in the Balance Sheet and disclosed in the above table, the Council holds a number of assets which are by their nature heritage assets but are not recognised in the Balance Sheet. The Council does not consider that reliable cost or valuation information can be obtained for these assets due to the nature of the assets and the lack of market values. Examples of this type of asset are ancient structures and ruins, War memorials and public art. These are listed below.
Scheduled Ancient Monuments St Paul in the Bail Walls & Well Saltergate Roman Wall and Posterngate
Wall & Gate
Mint Wall, West Bight Wall Newport Arch Arch & Wall Pottergate Arch Lower West Gate & Wall, City Hall
Gate & Wall
St Marys conduit Conduit Temple Gardens, Close Wall Wall Roman Wall, Mary Sookias House, Cecil street
Wall
Memorials
63
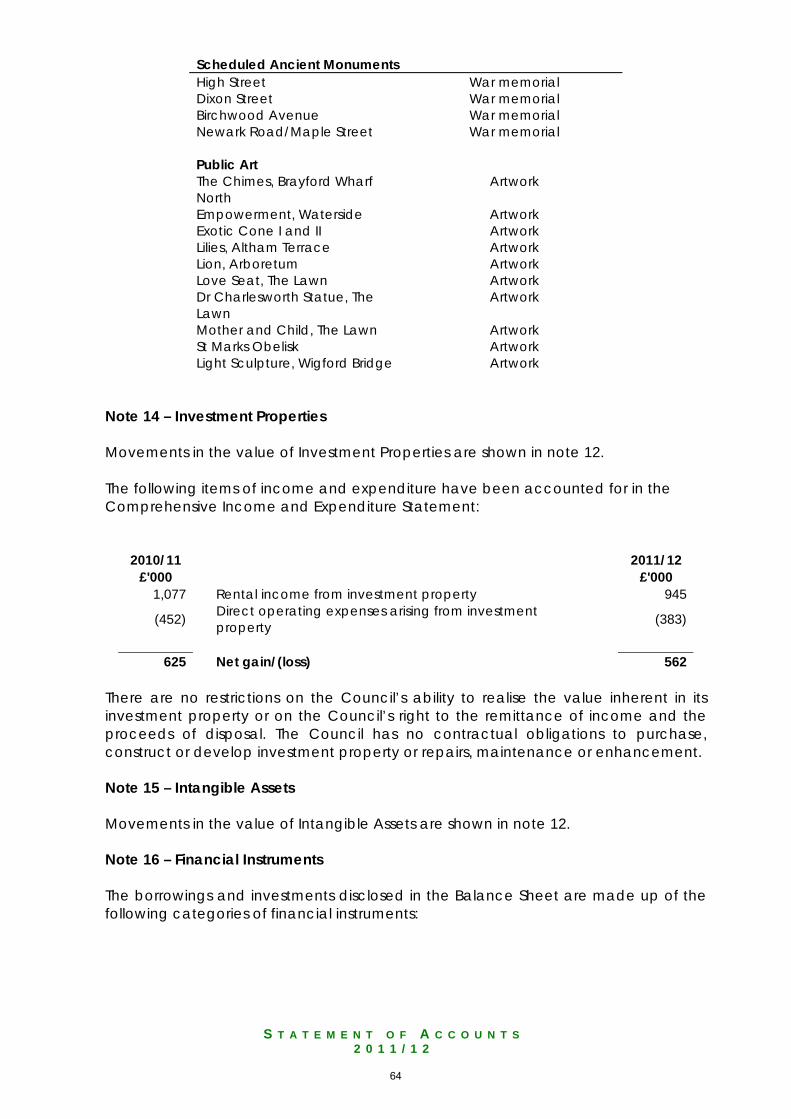
S T A T E M E N T O F A C C O U N T S
2 0 1 1 / 1 2
Scheduled Ancient Monuments High Street War memorial Dixon Street War memorial Birchwood Avenue War memorial Newark Road/Maple Street War memorial Public Art The Chimes, Brayford Wharf North
Artwork
Empowerment, Waterside Artwork Exotic Cone I and II Artwork Lilies, Altham Terrace Artwork Lion, Arboretum Artwork Love Seat, The Lawn Artwork Dr Charlesworth Statue, The Lawn
Artwork
Mother and Child, The Lawn Artwork St Marks Obelisk Artwork Light Sculpture, Wigford Bridge Artwork
Note 14 – Investment Properties Movements in the value of Investment Properties are shown in note 12. The following items of income and expenditure have been accounted for in the Comprehensive Income and Expenditure Statement:
2010/11 2011/12 £'000 £'000
1,077 Rental income from investment property 945
(452) Direct operating expenses arising from investment property (383)
625 Net gain/(loss) 562
There are no restrictions on the Council’s ability to realise the value inherent in its investment property or on the Council’s right to the remittance of income and the proceeds of disposal. The Council has no contractual obligations to purchase, construct or develop investment property or repairs, maintenance or enhancement. Note 15 – Intangible Assets Movements in the value of Intangible Assets are shown in note 12. Note 16 – Financial Instruments The borrowings and investments disclosed in the Balance Sheet are made up of the following categories of financial instruments:
64
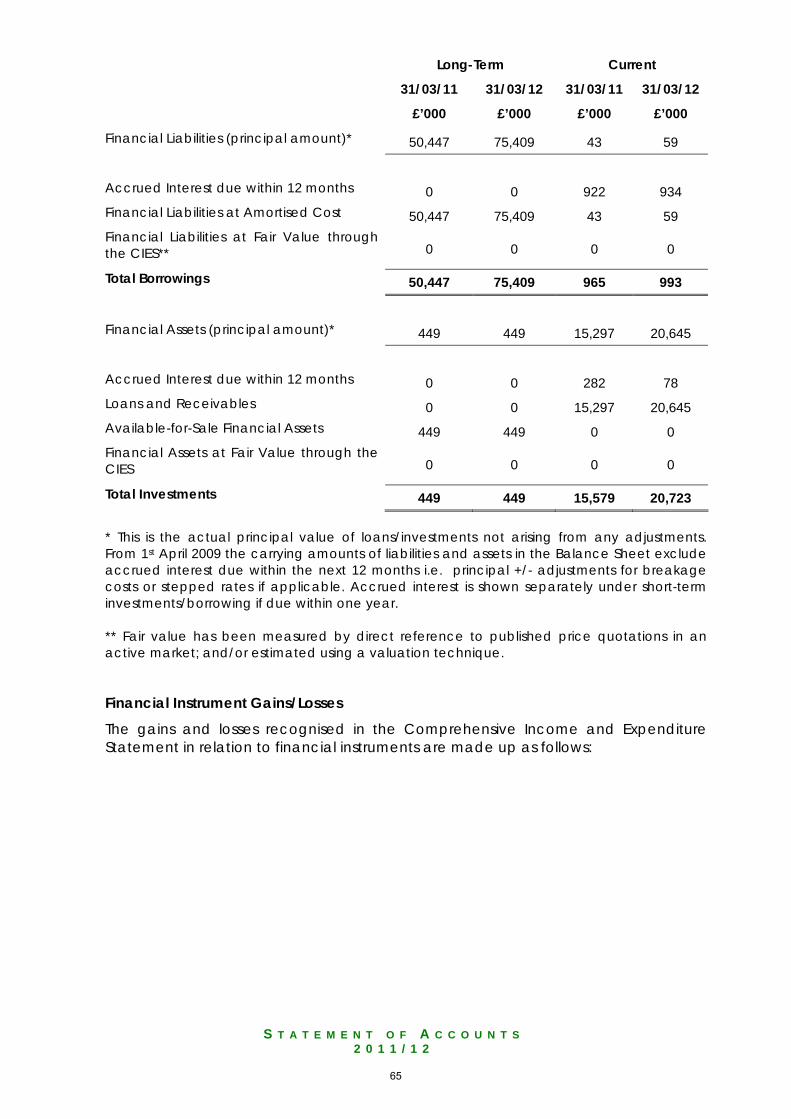
S T A T E M E N T O F A C C O U N T S
2 0 1 1 / 1 2
Long-Term Current
31/03/11 31/03/12 31/03/11 31/03/12
£’000 £’000 £’000 £’000
Financial Liabilities (principal amount)* 50,447 75,409 43 59 Accrued Interest due within 12 months 0 0 922 934 Financial Liabilities at Amortised Cost 50,447 75,409 43 59 Financial Liabilities at Fair Value through the CIES** 0 0 0 0
Total Borrowings 50,447 75,409 965 993 Financial Assets (principal amount)* 449 449 15,297 20,645 Accrued Interest due within 12 months 0 0 282 78 Loans and Receivables 0 0 15,297 20,645 Available-for-Sale Financial Assets 449 449 0 0 Financial Assets at Fair Value through the CIES 0 0 0 0
Total Investments 449 449 15,579 20,723 * This is the actual principal value of loans/investments not arising from any adjustments. From 1st April 2009 the carrying amounts of liabilities and assets in the Balance Sheet exclude accrued interest due within the next 12 months i.e. principal +/- adjustments for breakage costs or stepped rates if applicable. Accrued interest is shown separately under short-term investments/borrowing if due within one year. ** Fair value has been measured by direct reference to published price quotations in an active market; and/or estimated using a valuation technique. Financial Instrument Gains/Losses
The gains and losses recognised in the Comprehensive Income and Expenditure Statement in relation to financial instruments are made up as follows:
65
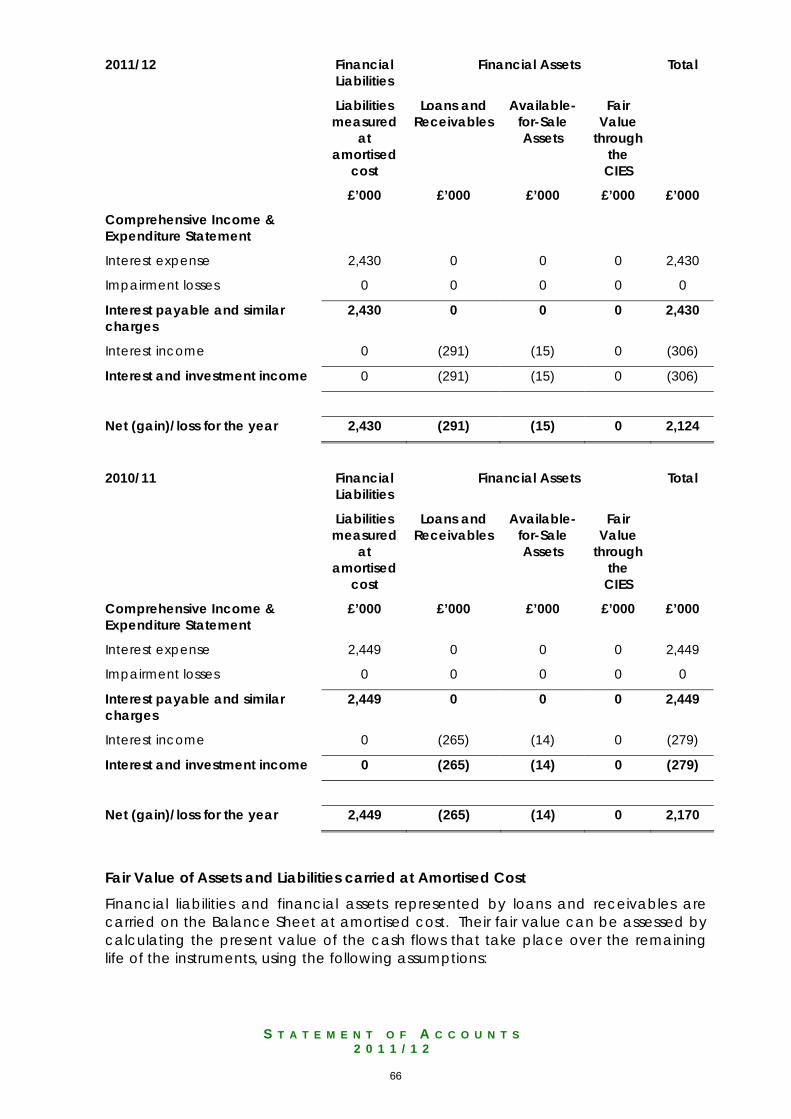
S T A T E M E N T O F A C C O U N T S
2 0 1 1 / 1 2
2011/12
Financial Liabilities
Financial Assets Total
Liabilities measured
at amortised
cost
Loans and Receivables
Available-for-Sale Assets
Fair Value
through the
CIES
£’000 £’000 £’000 £’000 £’000
Comprehensive Income & Expenditure Statement
Interest expense 2,430 0 0 0 2,430
Impairment losses 0 0 0 0 0
Interest payable and similar charges
2,430 0 0 0 2,430
Interest income 0 (291) (15) 0 (306)
Interest and investment income 0 (291) (15) 0 (306)
Net (gain)/loss for the year 2,430 (291) (15) 0 2,124
2010/11
Financial Liabilities
Financial Assets Total
Liabilities measured
at amortised
cost
Loans and Receivables
Available-for-Sale Assets
Fair Value
through the
CIES
Comprehensive Income & Expenditure Statement
£’000 £’000 £’000 £’000 £’000
Interest expense 2,449 0 0 0 2,449
Impairment losses 0 0 0 0 0
Interest payable and similar charges
2,449 0 0 0 2,449
Interest income 0 (265) (14) 0 (279)
Interest and investment income 0 (265) (14) 0 (279)
Net (gain)/loss for the year 2,449 (265) (14) 0 2,170
Fair Value of Assets and Liabilities carried at Amortised Cost Financial liabilities and financial assets represented by loans and receivables are carried on the Balance Sheet at amortised cost. Their fair value can be assessed by calculating the present value of the cash flows that take place over the remaining life of the instruments, using the following assumptions:
66
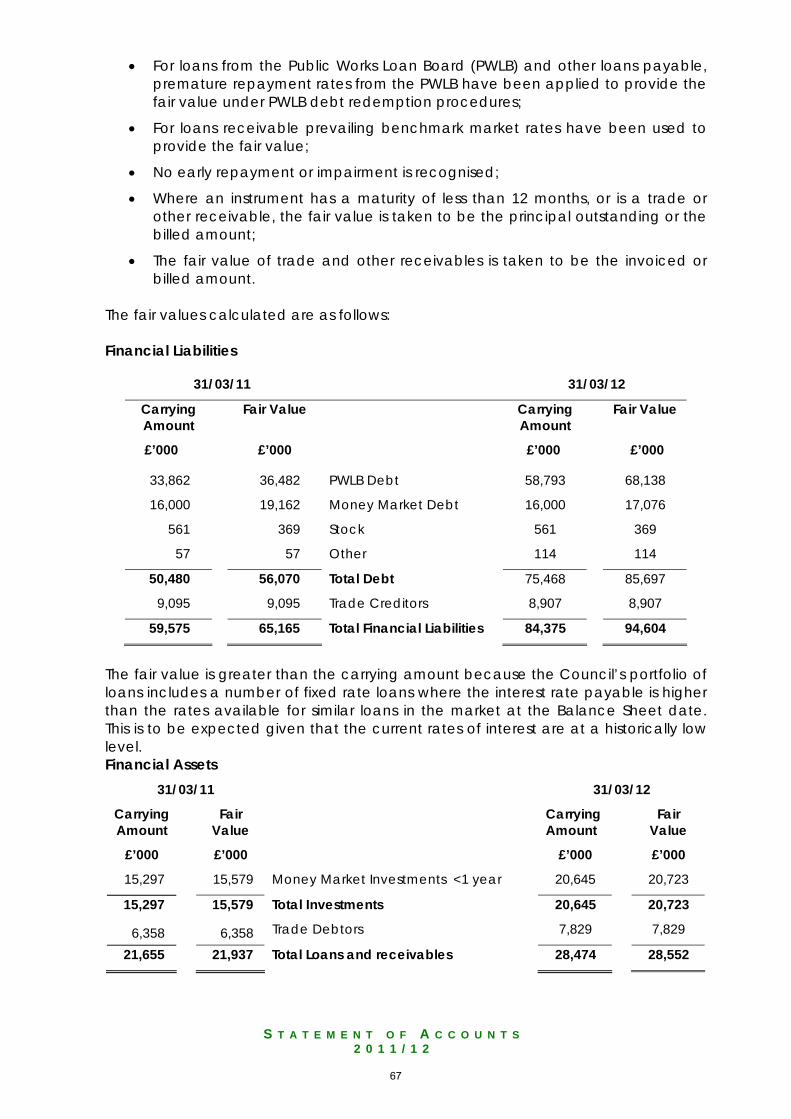
S T A T E M E N T O F A C C O U N T S
2 0 1 1 / 1 2
• For loans from the Public Works Loan Board (PWLB) and other loans payable, premature repayment rates from the PWLB have been applied to provide the fair value under PWLB debt redemption procedures;
• For loans receivable prevailing benchmark market rates have been used to provide the fair value;
• No early repayment or impairment is recognised;
• Where an instrument has a maturity of less than 12 months, or is a trade or other receivable, the fair value is taken to be the principal outstanding or the billed amount;
• The fair value of trade and other receivables is taken to be the invoiced or billed amount.
The fair values calculated are as follows: Financial Liabilities
31/03/11 31/03/12
Carrying Amount
Fair Value Carrying Amount
Fair Value
£’000 £’000 £’000 £’000
33,862 36,482 PWLB Debt 58,793 68,138
16,000 19,162 Money Market Debt 16,000 17,076
561 369 Stock 561 369
57 57 Other 114 114
50,480 56,070 Total Debt 75,468 85,697
9,095 9,095 Trade Creditors 8,907 8,907
59,575 65,165 Total Financial Liabilities 84,375 94,604
The fair value is greater than the carrying amount because the Council’s portfolio of loans includes a number of fixed rate loans where the interest rate payable is higher than the rates available for similar loans in the market at the Balance Sheet date. This is to be expected given that the current rates of interest are at a historically low level. Financial Assets
31/03/11 31/03/12
Carrying Amount
Fair Value
Carrying Amount
Fair Value
£’000 £’000 £’000 £’000
15,297 15,579 Money Market Investments <1 year 20,645 20,723
15,297 15,579 Total Investments 20,645 20,723
6,358 6,358 Trade Debtors 7,829 7,829
21,655 21,937 Total Loans and receivables 28,474 28,552
67
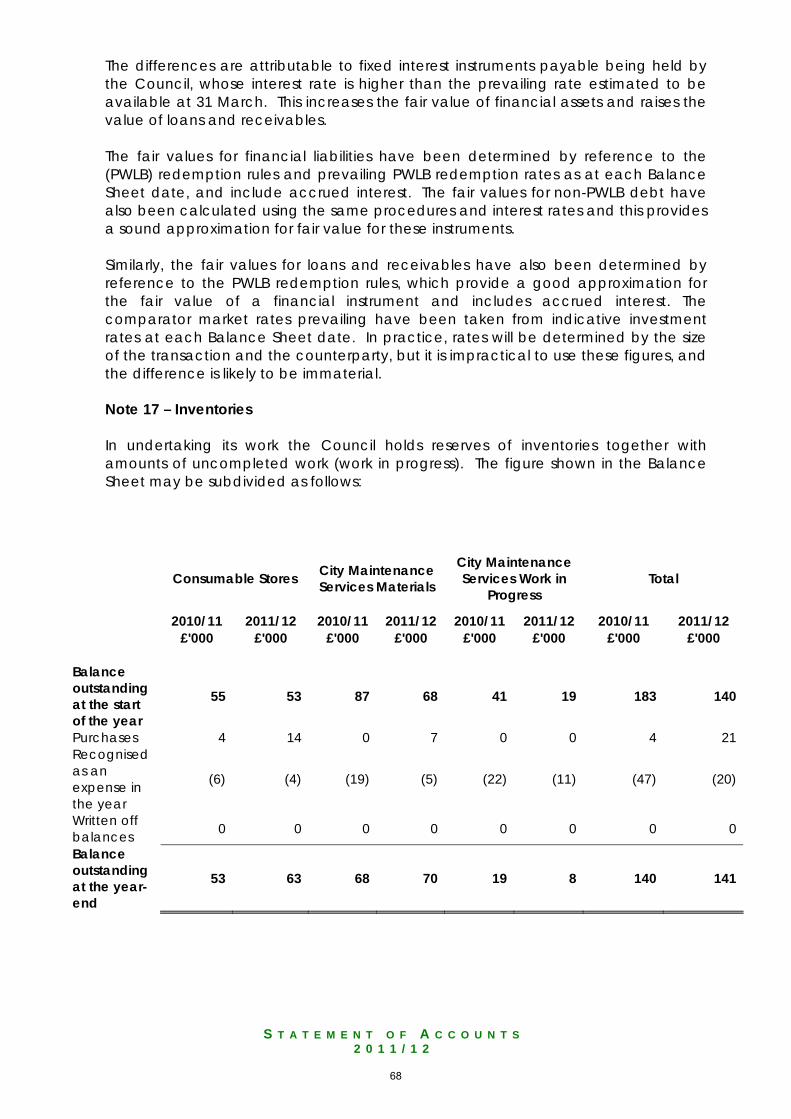
S T A T E M E N T O F A C C O U N T S
2 0 1 1 / 1 2
The differences are attributable to fixed interest instruments payable being held by the Council, whose interest rate is higher than the prevailing rate estimated to be available at 31 March. This increases the fair value of financial assets and raises the value of loans and receivables. The fair values for financial liabilities have been determined by reference to the (PWLB) redemption rules and prevailing PWLB redemption rates as at each Balance Sheet date, and include accrued interest. The fair values for non-PWLB debt have also been calculated using the same procedures and interest rates and this provides a sound approximation for fair value for these instruments. Similarly, the fair values for loans and receivables have also been determined by reference to the PWLB redemption rules, which provide a good approximation for the fair value of a financial instrument and includes accrued interest. The comparator market rates prevailing have been taken from indicative investment rates at each Balance Sheet date. In practice, rates will be determined by the size of the transaction and the counterparty, but it is impractical to use these figures, and the difference is likely to be immaterial. Note 17 – Inventories In undertaking its work the Council holds reserves of inventories together with amounts of uncompleted work (work in progress). The figure shown in the Balance Sheet may be subdivided as follows:
Consumable Stores City Maintenance Services Materials
City Maintenance Services Work in
Progress Total
2010/11 2011/12 2010/11 2011/12 2010/11 2011/12 2010/11 2011/12 £'000 £'000 £'000 £'000 £'000 £'000 £'000 £'000 Balance outstanding at the start of the year
55 53 87 68 41 19 183 140
Purchases 4 14 0 7 0 0 4 21 Recognised as an expense in the year
(6) (4) (19) (5) (22) (11) (47) (20)
Written off balances 0 0 0 0 0 0 0 0
Balance outstanding at the year-end
53 63 68 70 19 8 140 141
68
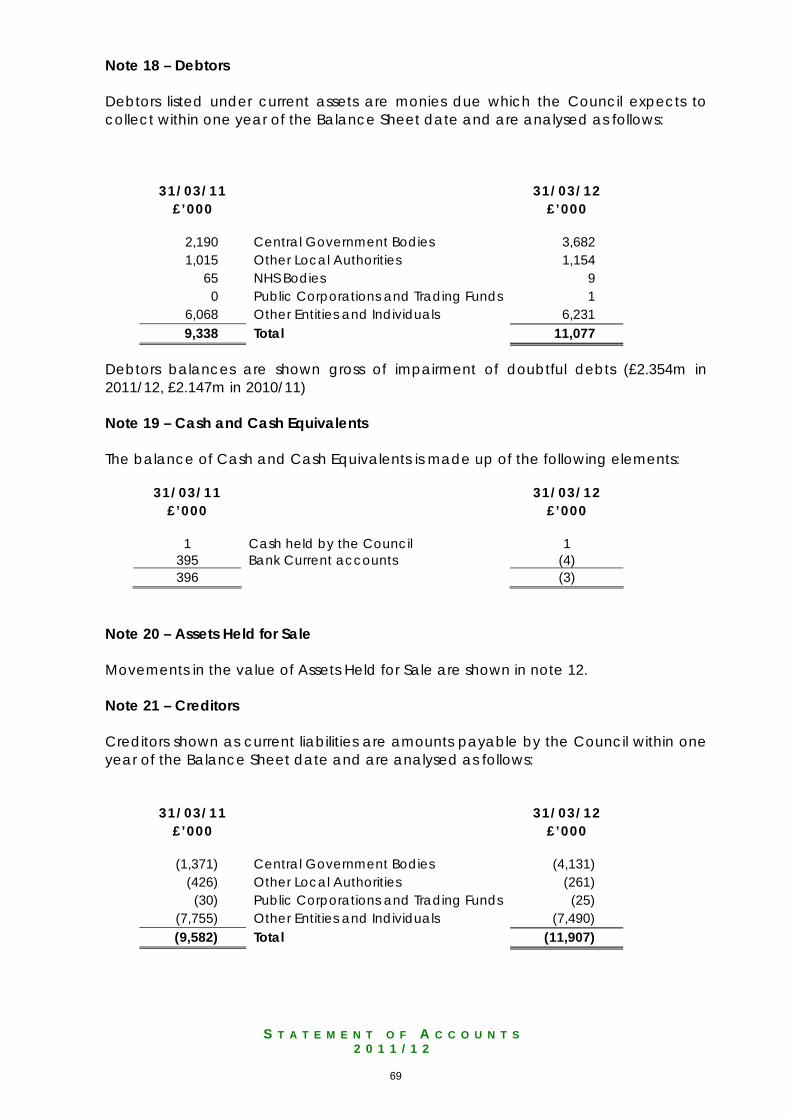
S T A T E M E N T O F A C C O U N T S
2 0 1 1 / 1 2
Note 18 – Debtors Debtors listed under current assets are monies due which the Council expects to collect within one year of the Balance Sheet date and are analysed as follows:
31/03/11 31/03/12 £’000 £’000
2,190 Central Government Bodies 3,682 1,015 Other Local Authorities 1,154
65 NHS Bodies 9 0 Public Corporations and Trading Funds 1
6,068 Other Entities and Individuals 6,231 9,338 Total 11,077
Debtors balances are shown gross of impairment of doubtful debts (£2.354m in 2011/12, £2.147m in 2010/11) Note 19 – Cash and Cash Equivalents The balance of Cash and Cash Equivalents is made up of the following elements:
31/03/11 31/03/12 £’000
£’000
1 Cash held by the Council 1
395 Bank Current accounts (4) 396 (3)
Note 20 – Assets Held for Sale Movements in the value of Assets Held for Sale are shown in note 12. Note 21 – Creditors Creditors shown as current liabilities are amounts payable by the Council within one year of the Balance Sheet date and are analysed as follows:
31/03/11 31/03/12 £’000 £’000
(1,371) Central Government Bodies (4,131)
(426) Other Local Authorities (261) (30) Public Corporations and Trading Funds (25)
(7,755) Other Entities and Individuals (7,490) (9,582) Total (11,907)
69
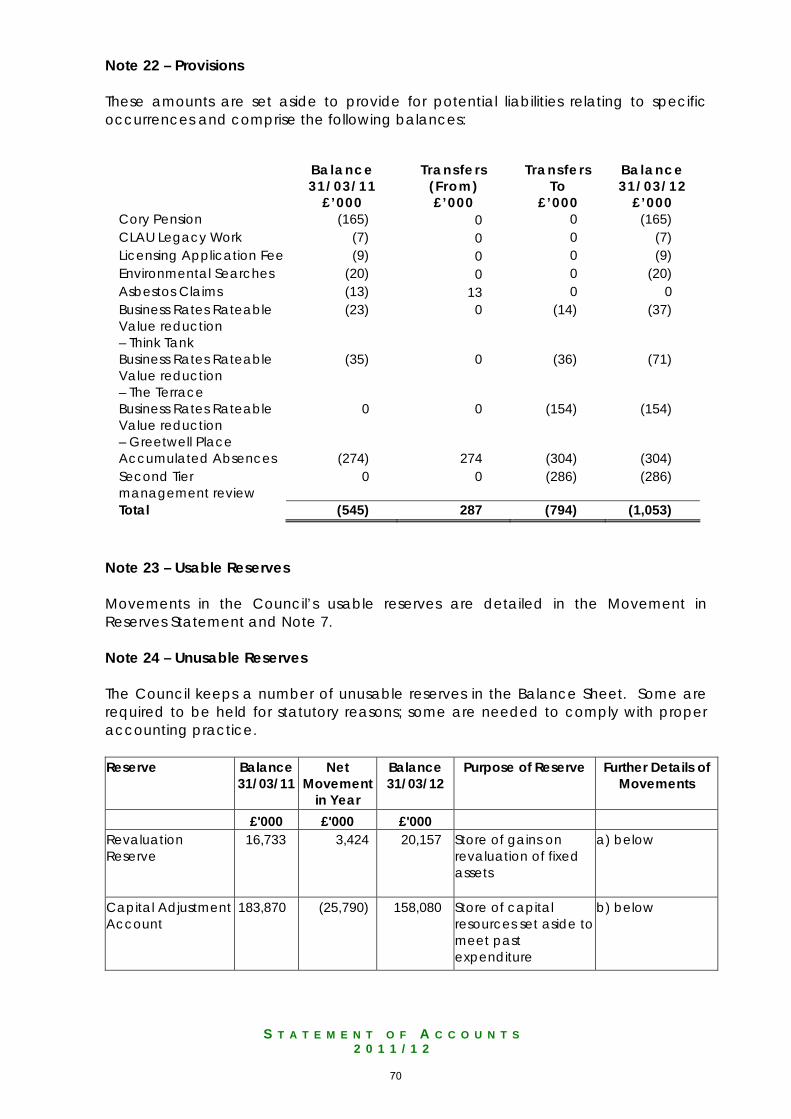
S T A T E M E N T O F A C C O U N T S
2 0 1 1 / 1 2
Note 22 – Provisions These amounts are set aside to provide for potential liabilities relating to specific occurrences and comprise the following balances:
Balance 31/03/11
£’000
Transfers
(From) £’000
Transfers
To £’000
Balance 31/03/12
£’000 Cory Pension (165) 0 0 (165) CLAU Legacy Work (7) 0 0 (7) Licensing Application Fee (9) 0 0 (9) Environmental Searches (20) 0 0 (20) Asbestos Claims (13) 13 0 0 Business Rates Rateable Value reduction – Think Tank
(23) 0 (14) (37)
Business Rates Rateable Value reduction – The Terrace
(35) 0 (36) (71)
Business Rates Rateable Value reduction – Greetwell Place
0 0 (154) (154)
Accumulated Absences (274) 274 (304) (304) Second Tier management review
0 0 (286) (286)
Total (545) 287 (794) (1,053) Note 23 – Usable Reserves Movements in the Council’s usable reserves are detailed in the Movement in Reserves Statement and Note 7. Note 24 – Unusable Reserves The Council keeps a number of unusable reserves in the Balance Sheet. Some are required to be held for statutory reasons; some are needed to comply with proper accounting practice. Reserve Balance
31/03/11 Net
Movement in Year
Balance 31/03/12
Purpose of Reserve Further Details of Movements
£'000 £'000 £'000 Revaluation Reserve
16,733 3,424 20,157 Store of gains on revaluation of fixed assets
a) below
Capital Adjustment Account
183,870 (25,790) 158,080 Store of capital resources set aside to meet past expenditure
b) below
70
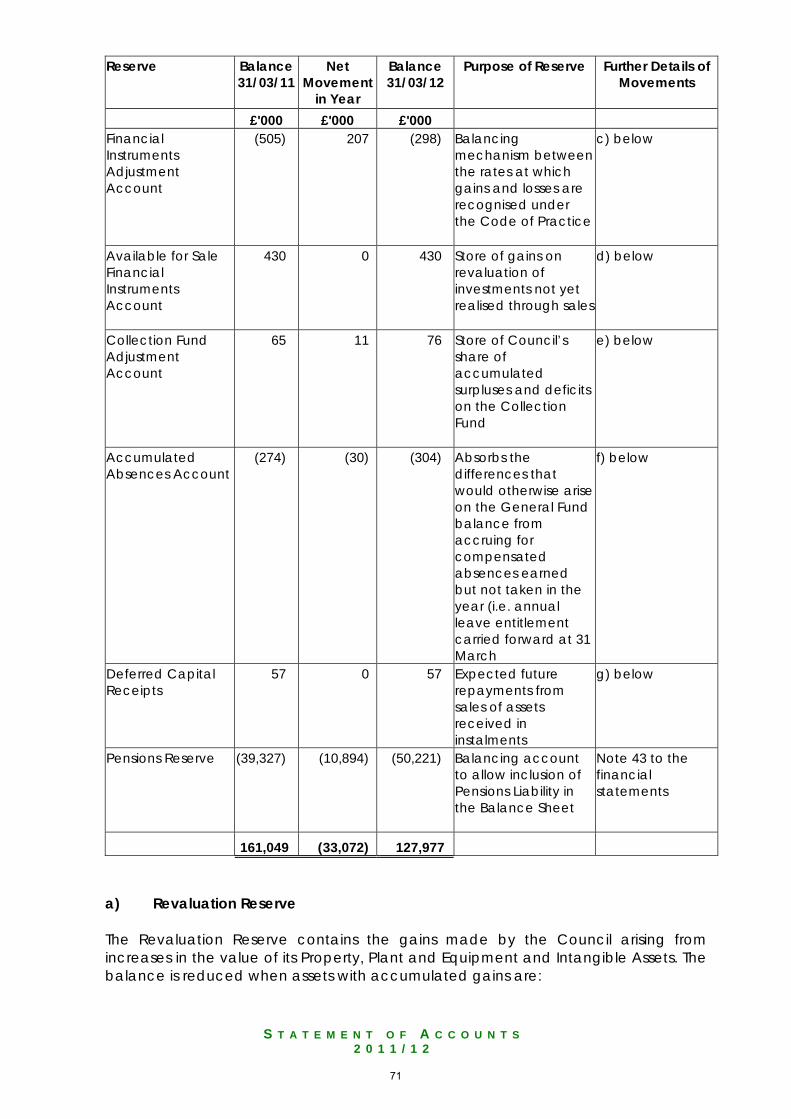
S T A T E M E N T O F A C C O U N T S
2 0 1 1 / 1 2
Reserve Balance 31/03/11
Net Movement
in Year
Balance 31/03/12
Purpose of Reserve Further Details of Movements
£'000 £'000 £'000 Financial Instruments Adjustment Account
(505) 207 (298) Balancing mechanism between the rates at which gains and losses are recognised under the Code of Practice
c) below
Available for Sale Financial Instruments Account
430 0 430 Store of gains on revaluation of investments not yet realised through sales
d) below
Collection Fund Adjustment Account
65 11 76 Store of Council’s share of accumulated surpluses and deficits on the Collection Fund
e) below
Accumulated Absences Account
(274) (30) (304) Absorbs the differences that would otherwise arise on the General Fund balance from accruing for compensated absences earned but not taken in the year (i.e. annual leave entitlement carried forward at 31 March
f) below
Deferred Capital Receipts
57 0 57 Expected future repayments from sales of assets received in instalments
g) below
Pensions Reserve (39,327) (10,894) (50,221) Balancing account to allow inclusion of Pensions Liability in the Balance Sheet
Note 43 to the financial statements
161,049 (33,072) 127,977 a) Revaluation Reserve The Revaluation Reserve contains the gains made by the Council arising from increases in the value of its Property, Plant and Equipment and Intangible Assets. The balance is reduced when assets with accumulated gains are:
71
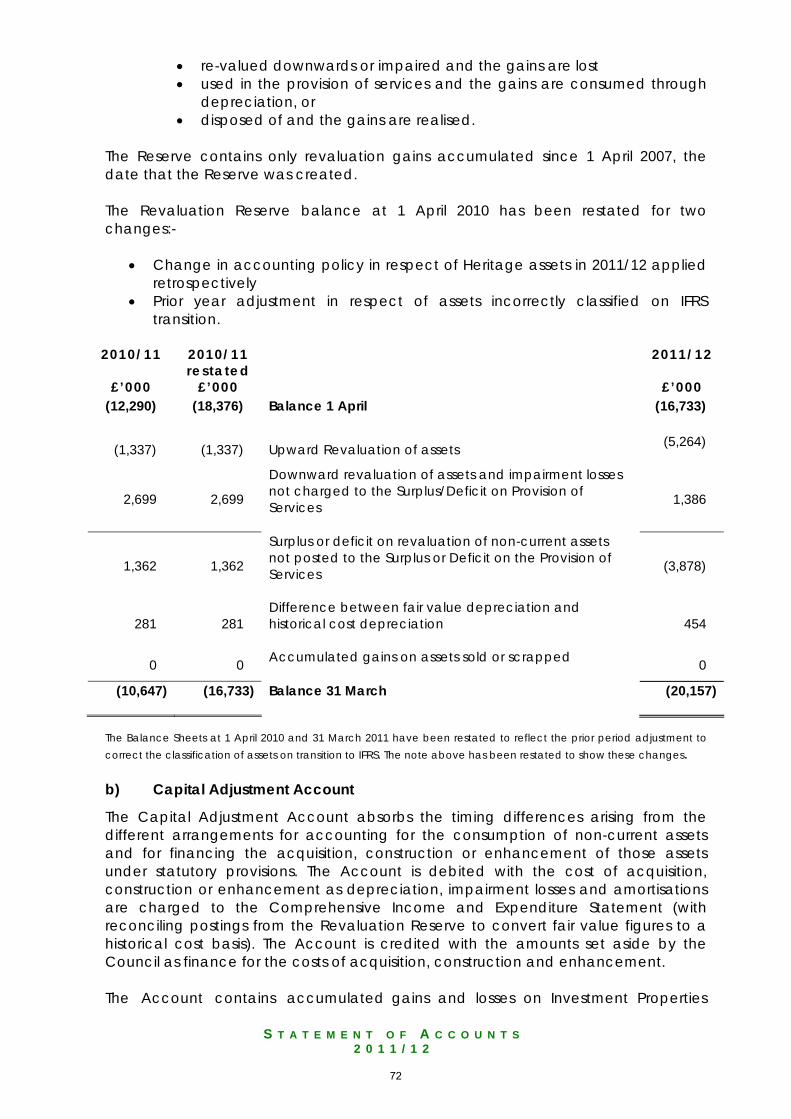
S T A T E M E N T O F A C C O U N T S
2 0 1 1 / 1 2
• re-valued downwards or impaired and the gains are lost • used in the provision of services and the gains are consumed through
depreciation, or • disposed of and the gains are realised.
The Reserve contains only revaluation gains accumulated since 1 April 2007, the date that the Reserve was created. The Revaluation Reserve balance at 1 April 2010 has been restated for two changes:-
• Change in accounting policy in respect of Heritage assets in 2011/12 applied retrospectively
• Prior year adjustment in respect of assets incorrectly classified on IFRS transition.
2010/11
£’000
2010/11 restated
£’000
2011/12
£’000 (12,290) (18,376) Balance 1 April (16,733)
(1,337) (1,337) Upward Revaluation of assets (5,264)
2,699 2,699
Downward revaluation of assets and impairment losses not charged to the Surplus/Deficit on Provision of Services
1,386
1,362 1,362
Surplus or deficit on revaluation of non-current assets not posted to the Surplus or Deficit on the Provision of Services
(3,878)
281 281 Difference between fair value depreciation and historical cost depreciation
454
0 0 Accumulated gains on assets sold or scrapped 0
(10,647) (16,733)
Balance 31 March
(20,157)
The Balance Sheets at 1 April 2010 and 31 March 2011 have been restated to reflect the prior period adjustment to correct the classification of assets on transition to IFRS. The note above has been restated to show these changes. b) Capital Adjustment Account
The Capital Adjustment Account absorbs the timing differences arising from the different arrangements for accounting for the consumption of non-current assets and for financing the acquisition, construction or enhancement of those assets under statutory provisions. The Account is debited with the cost of acquisition, construction or enhancement as depreciation, impairment losses and amortisations are charged to the Comprehensive Income and Expenditure Statement (with reconciling postings from the Revaluation Reserve to convert fair value figures to a historical cost basis). The Account is credited with the amounts set aside by the Council as finance for the costs of acquisition, construction and enhancement. The Account contains accumulated gains and losses on Investment Properties
72
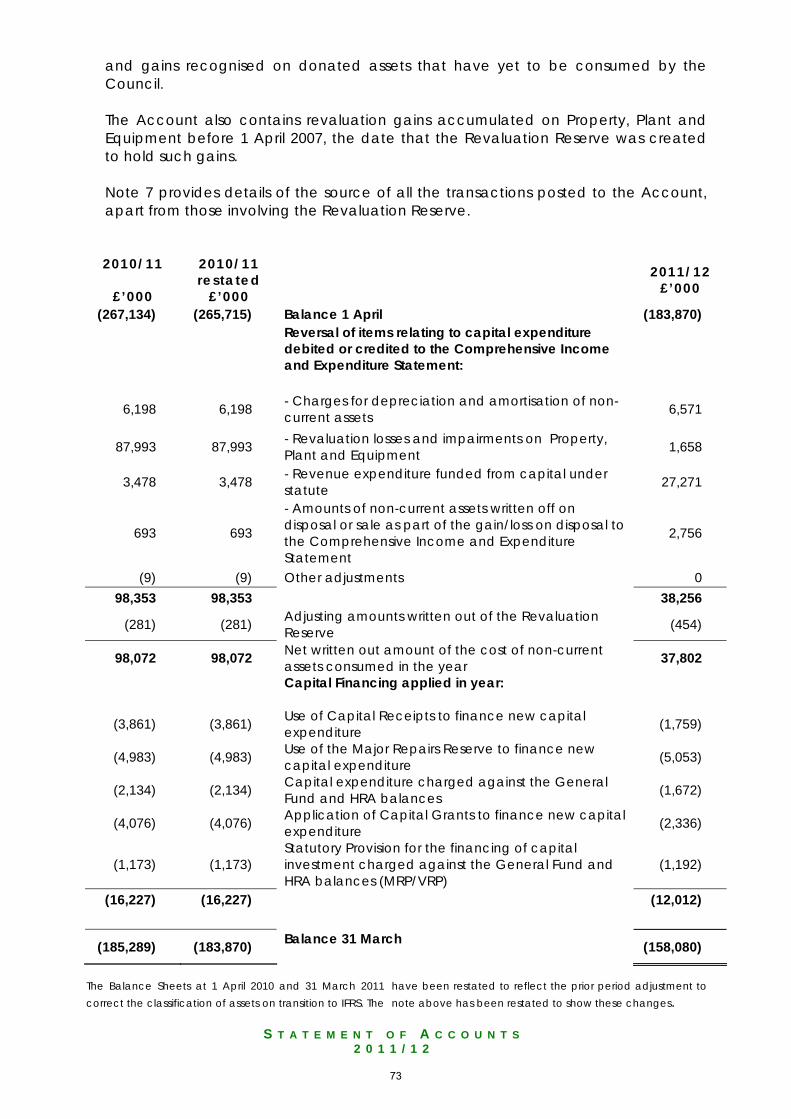
S T A T E M E N T O F A C C O U N T S
2 0 1 1 / 1 2
and gains recognised on donated assets that have yet to be consumed by the Council. The Account also contains revaluation gains accumulated on Property, Plant and Equipment before 1 April 2007, the date that the Revaluation Reserve was created to hold such gains. Note 7 provides details of the source of all the transactions posted to the Account, apart from those involving the Revaluation Reserve. 2010/11
£’000
2010/11 restated
£’000
2011/12 £’000
(267,134) (265,715) Balance 1 April (183,870)
Reversal of items relating to capital expenditure debited or credited to the Comprehensive Income and Expenditure Statement:
6,198 6,198 - Charges for depreciation and amortisation of non-current assets 6,571
87,993 87,993 - Revaluation losses and impairments on Property, Plant and Equipment 1,658
3,478 3,478 - Revenue expenditure funded from capital under statute 27,271
693 693
- Amounts of non-current assets written off on disposal or sale as part of the gain/loss on disposal to the Comprehensive Income and Expenditure Statement
2,756
(9) (9) Other adjustments 0 98,353 98,353 38,256
(281) (281) Adjusting amounts written out of the Revaluation Reserve (454)
98,072 98,072 Net written out amount of the cost of non-current assets consumed in the year 37,802
Capital Financing applied in year:
(3,861) (3,861) Use of Capital Receipts to finance new capital expenditure (1,759)
(4,983) (4,983) Use of the Major Repairs Reserve to finance new capital expenditure (5,053)
(2,134) (2,134) Capital expenditure charged against the General Fund and HRA balances (1,672)
(4,076) (4,076) Application of Capital Grants to finance new capital expenditure (2,336)
(1,173) (1,173) Statutory Provision for the financing of capital investment charged against the General Fund and HRA balances (MRP/VRP)
(1,192)
(16,227) (16,227) (12,012)
(185,289) (183,870) Balance 31 March (158,080)
The Balance Sheets at 1 April 2010 and 31 March 2011 have been restated to reflect the prior period adjustment to correct the classification of assets on transition to IFRS. The note above has been restated to show these changes.
73
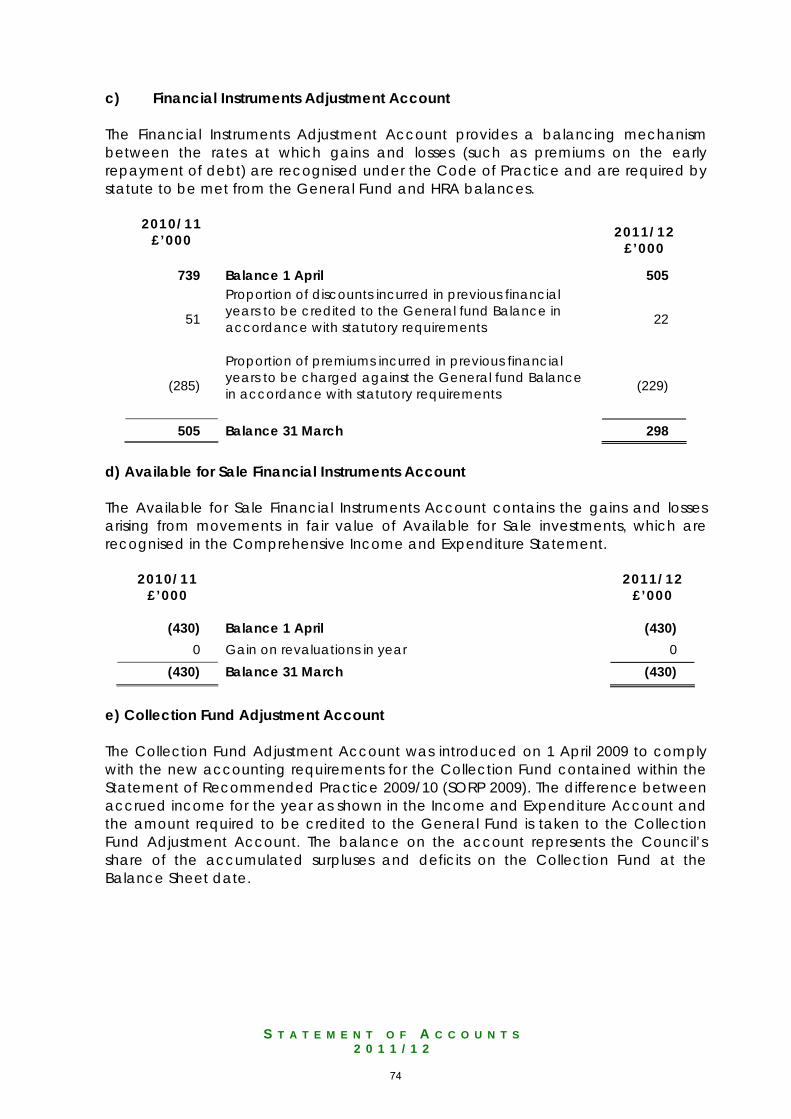
S T A T E M E N T O F A C C O U N T S
2 0 1 1 / 1 2
c) Financial Instruments Adjustment Account The Financial Instruments Adjustment Account provides a balancing mechanism between the rates at which gains and losses (such as premiums on the early repayment of debt) are recognised under the Code of Practice and are required by statute to be met from the General Fund and HRA balances.
2010/11 £’000
2011/12
£’000
739 Balance 1 April 505
51
Proportion of discounts incurred in previous financial years to be credited to the General fund Balance in accordance with statutory requirements
22
(285)
Proportion of premiums incurred in previous financial years to be charged against the General fund Balance in accordance with statutory requirements
(229)
505 Balance 31 March 298 d) Available for Sale Financial Instruments Account The Available for Sale Financial Instruments Account contains the gains and losses arising from movements in fair value of Available for Sale investments, which are recognised in the Comprehensive Income and Expenditure Statement.
2010/11 £’000
2011/12 £’000
(430) Balance 1 April (430) 0 Gain on revaluations in year 0
(430) Balance 31 March (430)
e) Collection Fund Adjustment Account The Collection Fund Adjustment Account was introduced on 1 April 2009 to comply with the new accounting requirements for the Collection Fund contained within the Statement of Recommended Practice 2009/10 (SORP 2009). The difference between accrued income for the year as shown in the Income and Expenditure Account and the amount required to be credited to the General Fund is taken to the Collection Fund Adjustment Account. The balance on the account represents the Council’s share of the accumulated surpluses and deficits on the Collection Fund at the Balance Sheet date.
74
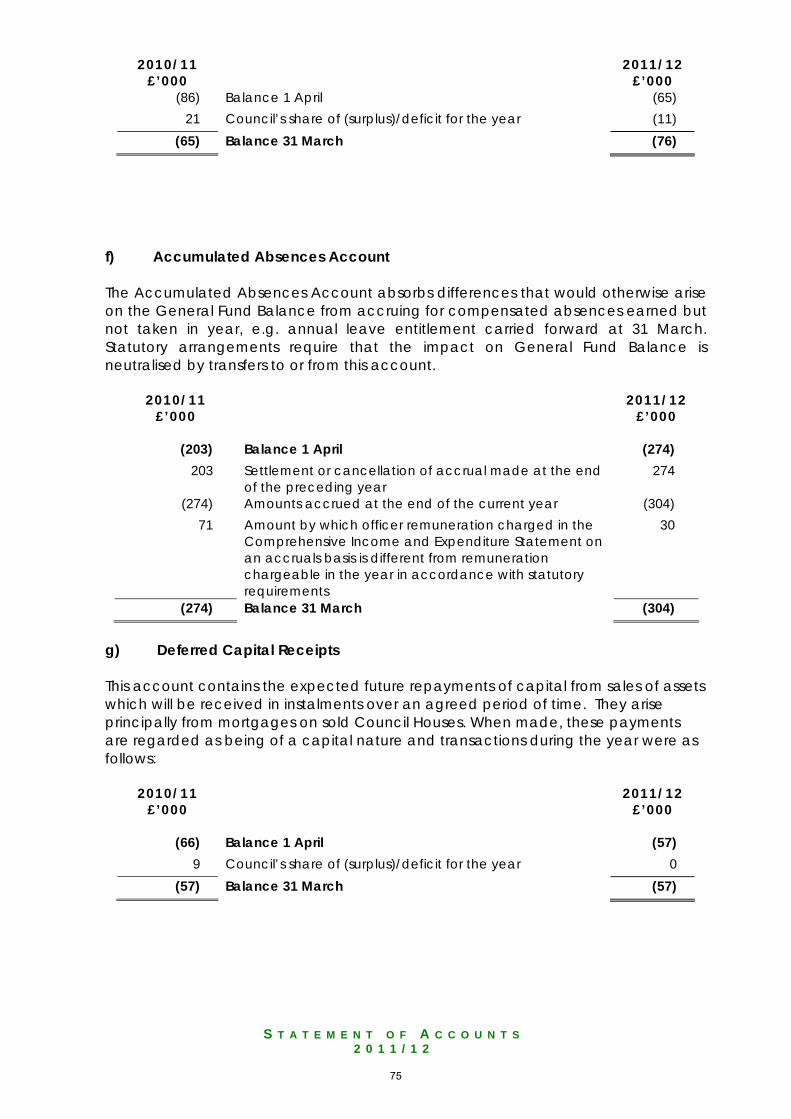
S T A T E M E N T O F A C C O U N T S
2 0 1 1 / 1 2
2010/11 £’000
2011/12 £’000
(86) Balance 1 April (65) 21 Council’s share of (surplus)/deficit for the year (11)
(65) Balance 31 March (76)
f) Accumulated Absences Account The Accumulated Absences Account absorbs differences that would otherwise arise on the General Fund Balance from accruing for compensated absences earned but not taken in year, e.g. annual leave entitlement carried forward at 31 March. Statutory arrangements require that the impact on General Fund Balance is neutralised by transfers to or from this account.
2010/11 £’000
2011/12 £’000
(203) Balance 1 April (274) 203 Settlement or cancellation of accrual made at the end
of the preceding year 274
(274) Amounts accrued at the end of the current year (304) 71 Amount by which officer remuneration charged in the
Comprehensive Income and Expenditure Statement on an accruals basis is different from remuneration chargeable in the year in accordance with statutory requirements
30
(274) Balance 31 March (304)
g) Deferred Capital Receipts This account contains the expected future repayments of capital from sales of assets which will be received in instalments over an agreed period of time. They arise principally from mortgages on sold Council Houses. When made, these payments are regarded as being of a capital nature and transactions during the year were as follows:
2010/11 £’000
2011/12 £’000
(66) Balance 1 April (57) 9 Council’s share of (surplus)/deficit for the year 0
(57) Balance 31 March (57)
75
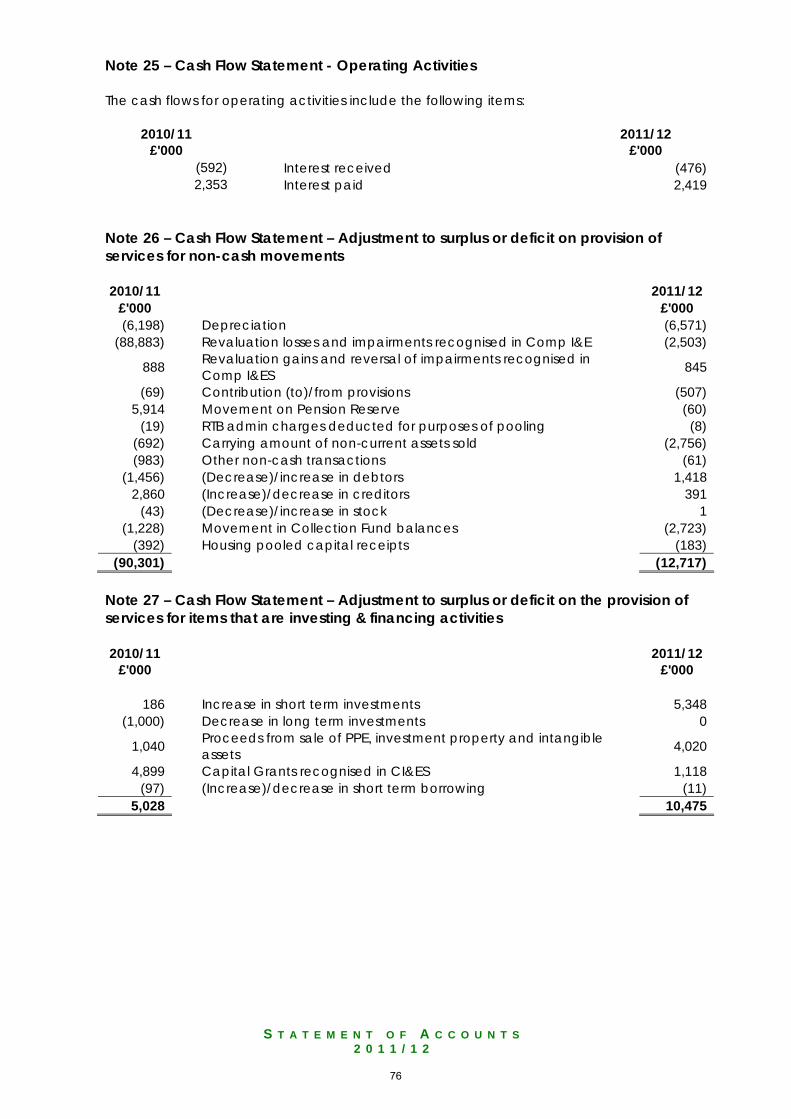
S T A T E M E N T O F A C C O U N T S
2 0 1 1 / 1 2
Note 25 – Cash Flow Statement - Operating Activities The cash flows for operating activities include the following items:
2010/11 2011/12 £'000 £'000
(592) Interest received (476) 2,353 Interest paid 2,419
Note 26 – Cash Flow Statement – Adjustment to surplus or deficit on provision of services for non-cash movements 2010/11 2011/12
£'000 £'000 (6,198) Depreciation (6,571)
(88,883) Revaluation losses and impairments recognised in Comp I&E (2,503)
888 Revaluation gains and reversal of impairments recognised in Comp I&ES 845
(69) Contribution (to)/from provisions (507) 5,914 Movement on Pension Reserve (60)
(19) RTB admin charges deducted for purposes of pooling (8) (692) Carrying amount of non-current assets sold (2,756) (983) Other non-cash transactions (61)
(1,456) (Decrease)/increase in debtors 1,418 2,860 (Increase)/decrease in creditors 391
(43) (Decrease)/increase in stock 1 (1,228) Movement in Collection Fund balances (2,723)
(392) Housing pooled capital receipts (183) (90,301) (12,717)
Note 27 – Cash Flow Statement – Adjustment to surplus or deficit on the provision of services for items that are investing & financing activities 2010/11 2011/12
£'000 £'000
186 Increase in short term investments 5,348 (1,000) Decrease in long term investments 0
1,040 Proceeds from sale of PPE, investment property and intangible assets 4,020
4,899 Capital Grants recognised in CI&ES 1,118 (97) (Increase)/decrease in short term borrowing (11)
5,028 10,475
76
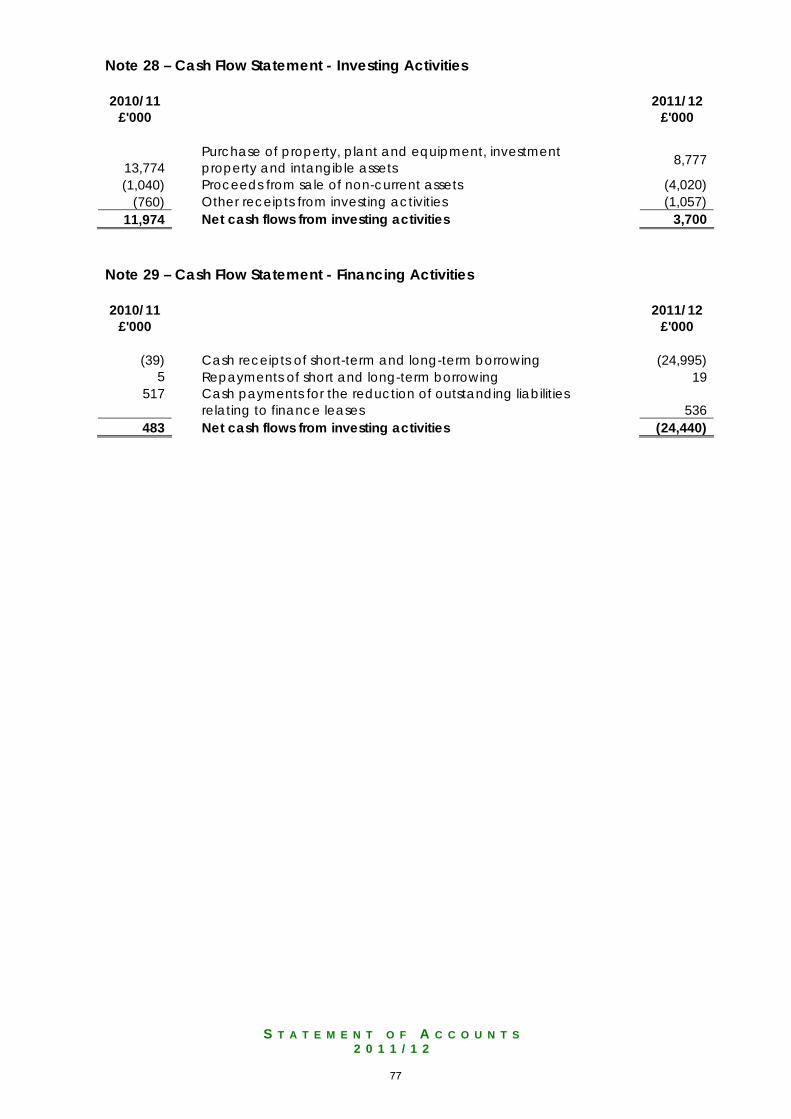
S T A T E M E N T O F A C C O U N T S
2 0 1 1 / 1 2
Note 28 – Cash Flow Statement - Investing Activities 2010/11 2011/12
£'000 £'000
13,774 Purchase of property, plant and equipment, investment property and intangible assets 8,777
(1,040) Proceeds from sale of non-current assets (4,020) (760) Other receipts from investing activities (1,057)
11,974 Net cash flows from investing activities 3,700 Note 29 – Cash Flow Statement - Financing Activities 2010/11 2011/12
£'000 £'000
(39) Cash receipts of short-term and long-term borrowing (24,995) 5 Repayments of short and long-term borrowing 19
517
Cash payments for the reduction of outstanding liabilities relating to finance leases 536
483 Net cash flows from investing activities (24,440)
77
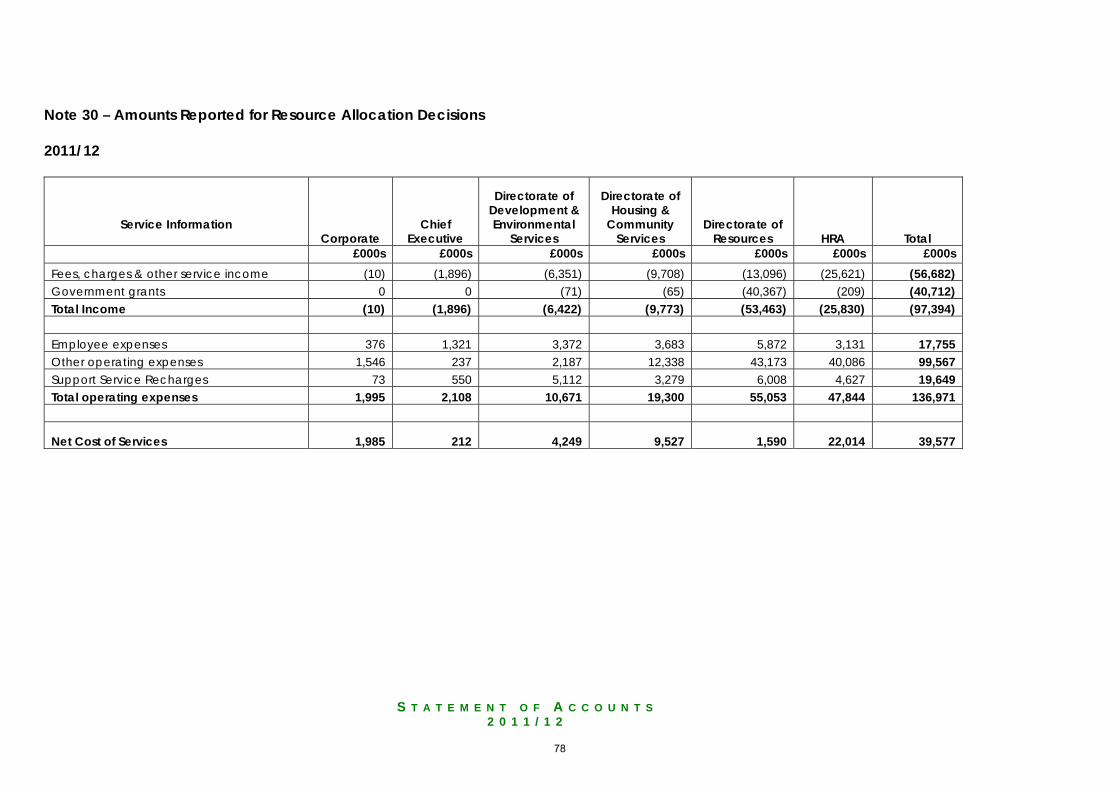
S T A T E M E N T O F A C C O U N T S
2 0 1 1 / 1 2
Note 30 – Amounts Reported for Resource Allocation Decisions 2011/12
Service Information Corporate
Chief Executive
Directorate of Development & Environmental
Services
Directorate of Housing &
Community Services
Directorate of Resources HRA Total
£000s £000s £000s £000s £000s £000s £000s Fees, charges & other service income (10) (1,896) (6,351) (9,708) (13,096) (25,621) (56,682) Government grants 0 0 (71) (65) (40,367) (209) (40,712) Total Income (10) (1,896) (6,422) (9,773) (53,463) (25,830) (97,394) Employee expenses 376 1,321 3,372 3,683 5,872 3,131 17,755 Other operating expenses 1,546 237 2,187 12,338 43,173 40,086 99,567 Support Service Recharges 73 550 5,112 3,279 6,008 4,627 19,649 Total operating expenses 1,995 2,108 10,671 19,300 55,053 47,844 136,971
Net Cost of Services 1,985 212 4,249 9,527 1,590 22,014 39,577
78
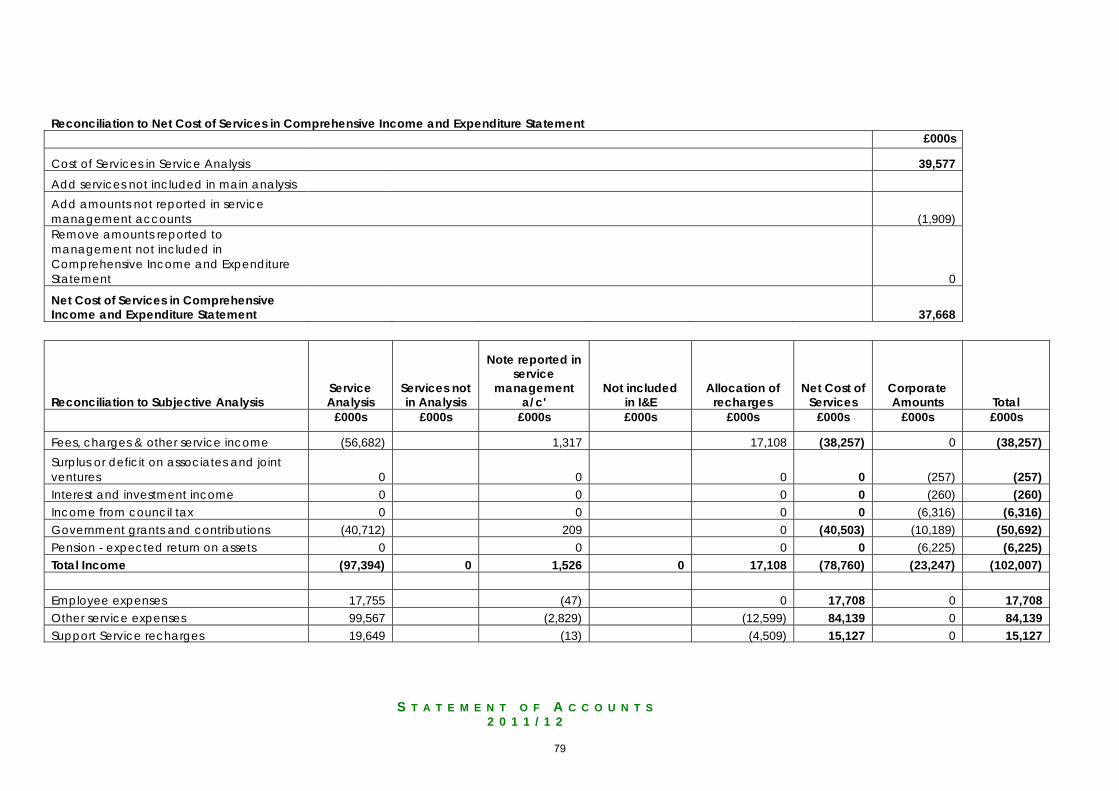
S T A T E M E N T O F A C C O U N T S
2 0 1 1 / 1 2
Reconciliation to Net Cost of Services in Comprehensive Income and Expenditure Statement £000s
Cost of Services in Service Analysis 39,577
Add services not included in main analysis Add amounts not reported in service management accounts (1,909) Remove amounts reported to management not included in Comprehensive Income and Expenditure Statement 0
Net Cost of Services in Comprehensive Income and Expenditure Statement 37,668
Reconciliation to Subjective Analysis Service Analysis
Services not in Analysis
Note reported in service
management a/c'
Not included in I&E
Allocation of recharges
Net Cost of Services
Corporate Amounts Total
£000s £000s £000s £000s £000s £000s £000s £000s
Fees, charges & other service income (56,682) 1,317 17,108 (38,257) 0 (38,257) Surplus or deficit on associates and joint ventures 0 0 0 0 (257) (257) Interest and investment income 0 0 0 0 (260) (260) Income from council tax 0 0 0 0 (6,316) (6,316) Government grants and contributions (40,712) 209 0 (40,503) (10,189) (50,692) Pension - expected return on assets 0 0 0 0 (6,225) (6,225) Total Income (97,394) 0 1,526 0 17,108 (78,760) (23,247) (102,007) Employee expenses 17,755 (47) 0 17,708 0 17,708 Other service expenses 99,567 (2,829) (12,599) 84,139 0 84,139 Support Service recharges 19,649 (13) (4,509) 15,127 0 15,127
79
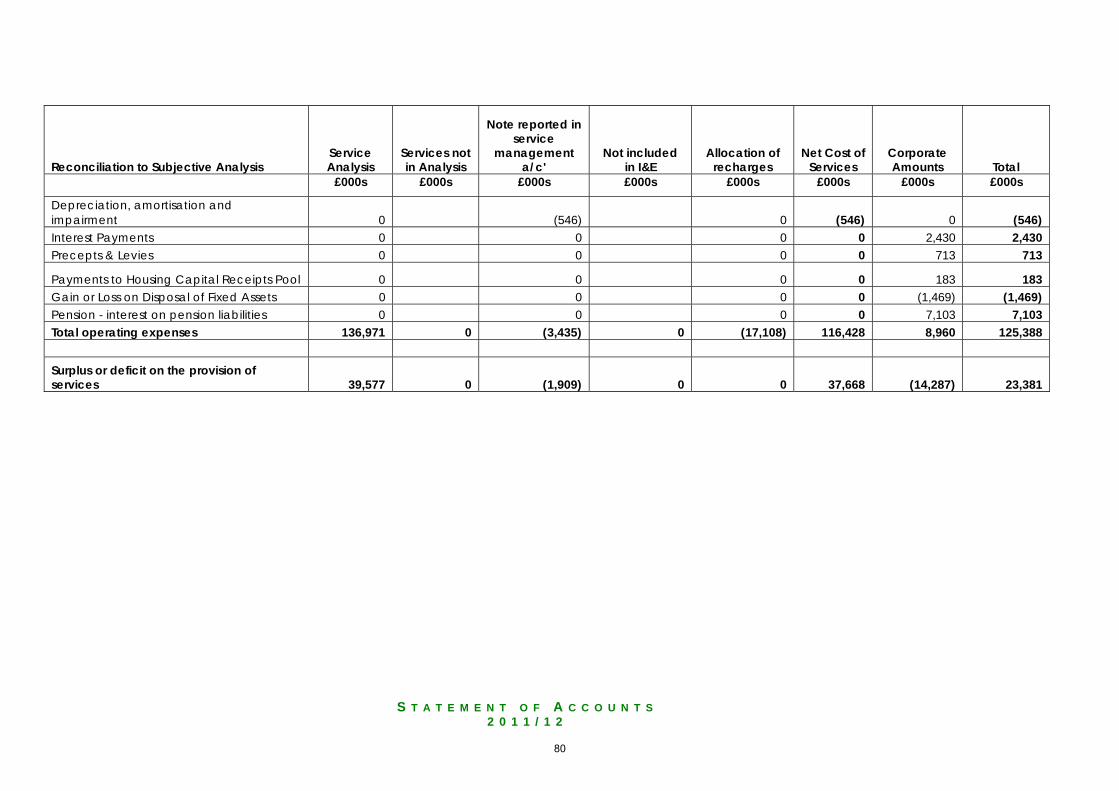
S T A T E M E N T O F A C C O U N T S
2 0 1 1 / 1 2
Reconciliation to Subjective Analysis Service Analysis
Services not in Analysis
Note reported in service
management a/c'
Not included in I&E
Allocation of recharges
Net Cost of Services
Corporate Amounts Total
£000s £000s £000s £000s £000s £000s £000s £000s
Depreciation, amortisation and impairment 0 (546) 0 (546) 0 (546) Interest Payments 0 0 0 0 2,430 2,430 Precepts & Levies 0 0 0 0 713 713
Payments to Housing Capital Receipts Pool 0 0 0 0 183 183 Gain or Loss on Disposal of Fixed Assets 0 0 0 0 (1,469) (1,469) Pension - interest on pension liabilities 0 0 0 0 7,103 7,103 Total operating expenses 136,971 0 (3,435) 0 (17,108) 116,428 8,960 125,388 Surplus or deficit on the provision of services 39,577 0 (1,909) 0 0 37,668 (14,287) 23,381
80
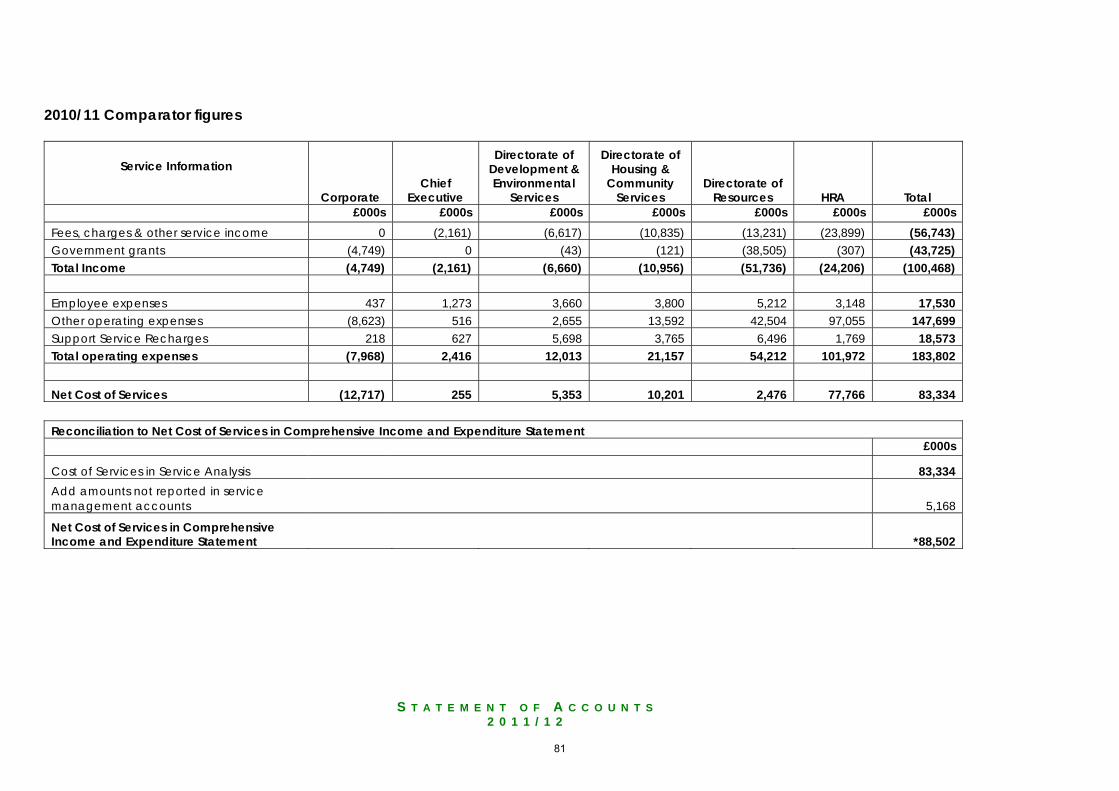
S T A T E M E N T O F A C C O U N T S
2 0 1 1 / 1 2
2010/11 Comparator figures
Service Information
Corporate Chief
Executive
Directorate of Development & Environmental
Services
Directorate of Housing &
Community Services
Directorate of Resources HRA Total
£000s £000s £000s £000s £000s £000s £000s Fees, charges & other service income 0 (2,161) (6,617) (10,835) (13,231) (23,899) (56,743) Government grants (4,749) 0 (43) (121) (38,505) (307) (43,725) Total Income (4,749) (2,161) (6,660) (10,956) (51,736) (24,206) (100,468) Employee expenses 437 1,273 3,660 3,800 5,212 3,148 17,530 Other operating expenses (8,623) 516 2,655 13,592 42,504 97,055 147,699 Support Service Recharges 218 627 5,698 3,765 6,496 1,769 18,573 Total operating expenses (7,968) 2,416 12,013 21,157 54,212 101,972 183,802 Net Cost of Services (12,717) 255 5,353 10,201 2,476 77,766 83,334
Reconciliation to Net Cost of Services in Comprehensive Income and Expenditure Statement £000s
Cost of Services in Service Analysis 83,334 Add amounts not reported in service management accounts 5,168
Net Cost of Services in Comprehensive Income and Expenditure Statement *88,502
81
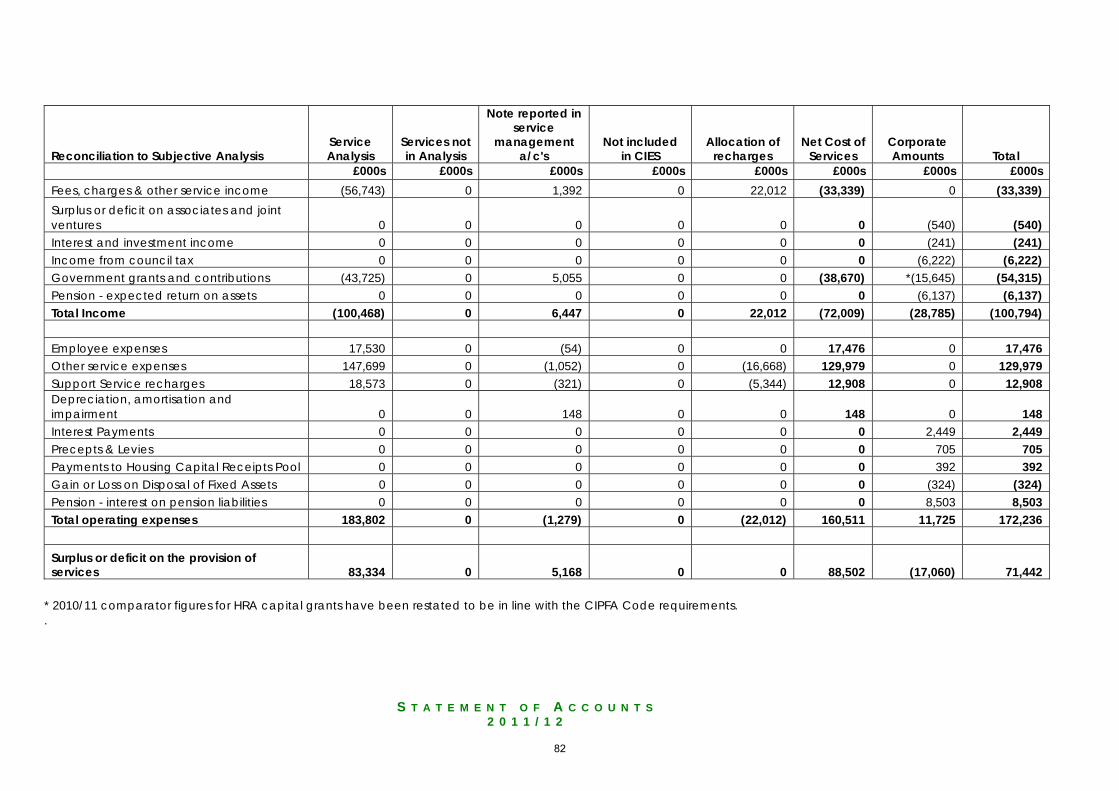
S T A T E M E N T O F A C C O U N T S
2 0 1 1 / 1 2
Reconciliation to Subjective Analysis Service Analysis
Services not in Analysis
Note reported in service
management a/c's
Not included in CIES
Allocation of recharges
Net Cost of Services
Corporate Amounts Total
£000s £000s £000s £000s £000s £000s £000s £000s Fees, charges & other service income (56,743) 0 1,392 0 22,012 (33,339) 0 (33,339) Surplus or deficit on associates and joint ventures 0 0 0 0 0 0 (540) (540) Interest and investment income 0 0 0 0 0 0 (241) (241) Income from council tax 0 0 0 0 0 0 (6,222) (6,222) Government grants and contributions (43,725) 0 5,055 0 0 (38,670) *(15,645) (54,315) Pension - expected return on assets 0 0 0 0 0 0 (6,137) (6,137) Total Income (100,468) 0 6,447 0 22,012 (72,009) (28,785) (100,794) Employee expenses 17,530 0 (54) 0 0 17,476 0 17,476 Other service expenses 147,699 0 (1,052) 0 (16,668) 129,979 0 129,979 Support Service recharges 18,573 0 (321) 0 (5,344) 12,908 0 12,908 Depreciation, amortisation and impairment 0 0 148 0 0 148 0 148 Interest Payments 0 0 0 0 0 0 2,449 2,449 Precepts & Levies 0 0 0 0 0 0 705 705 Payments to Housing Capital Receipts Pool 0 0 0 0 0 0 392 392 Gain or Loss on Disposal of Fixed Assets 0 0 0 0 0 0 (324) (324) Pension - interest on pension liabilities 0 0 0 0 0 0 8,503 8,503 Total operating expenses 183,802 0 (1,279) 0 (22,012) 160,511 11,725 172,236 Surplus or deficit on the provision of services 83,334 0 5,168 0 0 88,502 (17,060) 71,442
* 2010/11 comparator figures for HRA capital grants have been restated to be in line with the CIPFA Code requirements. .
82
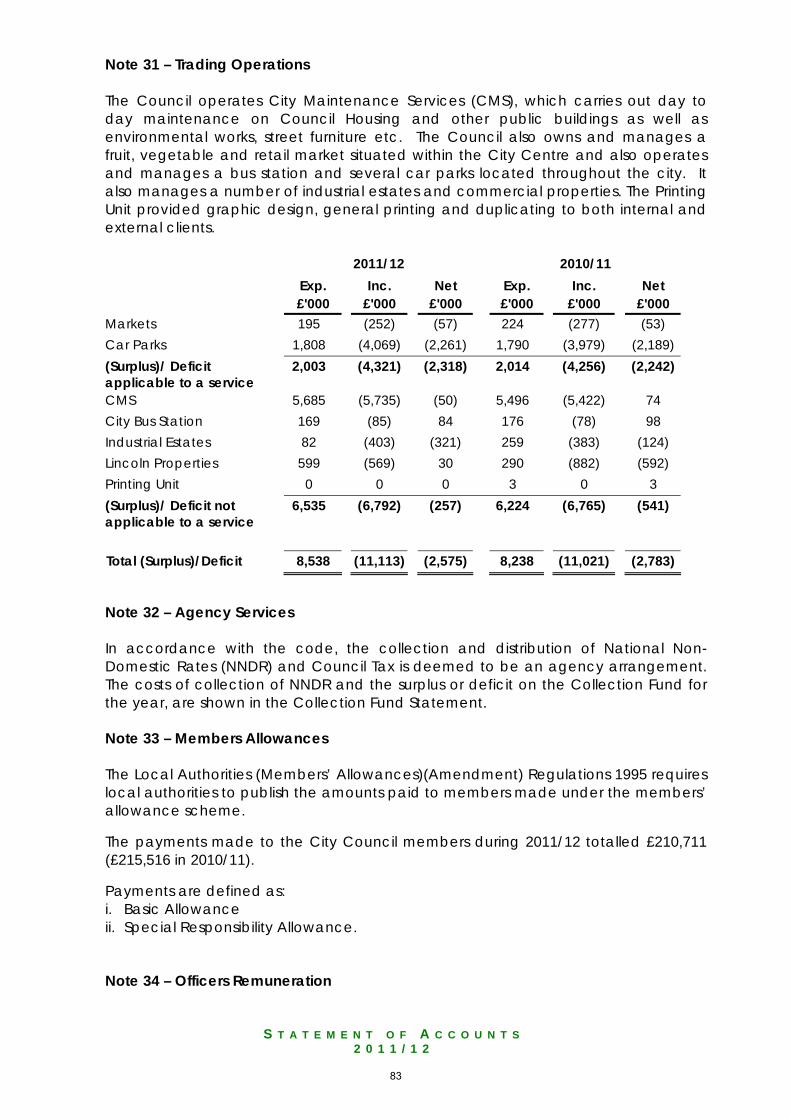
S T A T E M E N T O F A C C O U N T S
2 0 1 1 / 1 2
Note 31 – Trading Operations The Council operates City Maintenance Services (CMS), which carries out day to day maintenance on Council Housing and other public buildings as well as environmental works, street furniture etc. The Council also owns and manages a fruit, vegetable and retail market situated within the City Centre and also operates and manages a bus station and several car parks located throughout the city. It also manages a number of industrial estates and commercial properties. The Printing Unit provided graphic design, general printing and duplicating to both internal and external clients. 2011/12 2010/11
Exp. Inc. Net Exp. Inc. Net £'000 £'000 £'000 £'000 £'000 £'000
Markets 195 (252) (57) 224 (277) (53) Car Parks 1,808 (4,069) (2,261) 1,790 (3,979) (2,189) (Surplus)/ Deficit applicable to a service
2,003 (4,321) (2,318) 2,014 (4,256) (2,242)
CMS 5,685 (5,735) (50) 5,496 (5,422) 74 City Bus Station 169 (85) 84 176 (78) 98 Industrial Estates 82 (403) (321) 259 (383) (124) Lincoln Properties 599 (569) 30 290 (882) (592) Printing Unit 0 0 0 3 0 3 (Surplus)/ Deficit not applicable to a service
6,535 (6,792) (257) 6,224 (6,765) (541)
Total (Surplus)/Deficit 8,538 (11,113) (2,575) 8,238 (11,021) (2,783)
Note 32 – Agency Services In accordance with the code, the collection and distribution of National Non-Domestic Rates (NNDR) and Council Tax is deemed to be an agency arrangement. The costs of collection of NNDR and the surplus or deficit on the Collection Fund for the year, are shown in the Collection Fund Statement. Note 33 – Members Allowances The Local Authorities (Members’ Allowances)(Amendment) Regulations 1995 requires local authorities to publish the amounts paid to members made under the members’ allowance scheme. The payments made to the City Council members during 2011/12 totalled £210,711 (£215,516 in 2010/11). Payments are defined as: i. Basic Allowance ii. Special Responsibility Allowance. Note 34 – Officers Remuneration
83
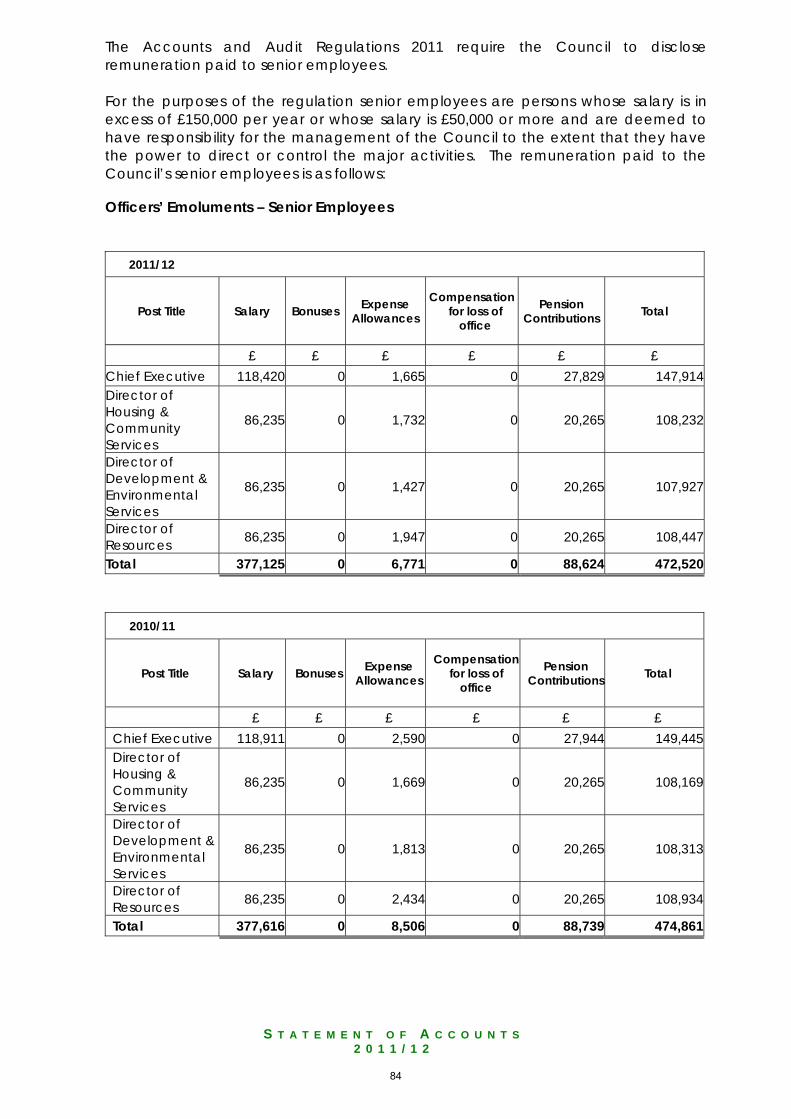
S T A T E M E N T O F A C C O U N T S
2 0 1 1 / 1 2
The Accounts and Audit Regulations 2011 require the Council to disclose remuneration paid to senior employees. For the purposes of the regulation senior employees are persons whose salary is in excess of £150,000 per year or whose salary is £50,000 or more and are deemed to have responsibility for the management of the Council to the extent that they have the power to direct or control the major activities. The remuneration paid to the Council’s senior employees is as follows: Officers’ Emoluments – Senior Employees 2011/12
Post Title Salary Bonuses Expense Allowances
Compensation for loss of
office Pension
Contributions Total
£ £ £ £ £ £ Chief Executive 118,420 0 1,665 0 27,829 147,914Director of Housing & Community Services
86,235 0 1,732 0 20,265 108,232
Director of Development & Environmental Services
86,235 0 1,427 0 20,265 107,927
Director of Resources 86,235 0 1,947 0 20,265 108,447
Total 377,125 0 6,771 0 88,624 472,520
2010/11
Post Title Salary Bonuses Expense Allowances
Compensation for loss of
office Pension
Contributions Total
£ £ £ £ £ £ Chief Executive 118,911 0 2,590 0 27,944 149,445 Director of Housing & Community Services
86,235 0 1,669 0 20,265 108,169
Director of Development & Environmental Services
86,235 0 1,813 0 20,265 108,313
Director of Resources 86,235 0 2,434 0 20,265 108,934
Total 377,616 0 8,506 0 88,739 474,861
84
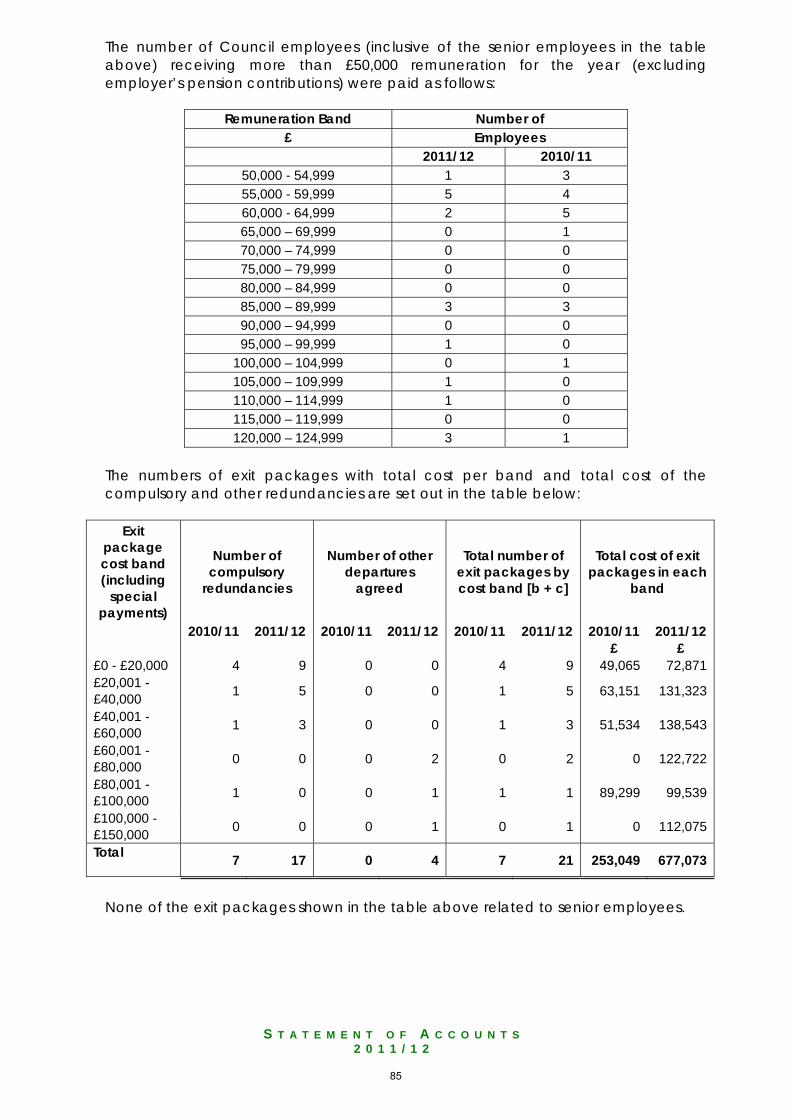
S T A T E M E N T O F A C C O U N T S
2 0 1 1 / 1 2
The number of Council employees (inclusive of the senior employees in the table above) receiving more than £50,000 remuneration for the year (excluding employer’s pension contributions) were paid as follows:
Remuneration Band Number of £ Employees 2011/12 2010/11
50,000 - 54,999 1 3 55,000 - 59,999 5 4 60,000 - 64,999 2 5 65,000 – 69,999 0 1 70,000 – 74,999 0 0 75,000 – 79,999 0 0 80,000 – 84,999 0 0 85,000 – 89,999 3 3 90,000 – 94,999 0 0 95,000 – 99,999 1 0
100,000 – 104,999 0 1 105,000 – 109,999 1 0 110,000 – 114,999 1 0 115,000 – 119,999 0 0 120,000 – 124,999 3 1
The numbers of exit packages with total cost per band and total cost of the compulsory and other redundancies are set out in the table below:
Exit package cost band (including
special payments)
Number of compulsory
redundancies
Number of other departures
agreed
Total number of exit packages by cost band [b + c]
Total cost of exit packages in each
band
2010/11 2011/12 2010/11 2011/12 2010/11 2011/12 2010/11 2011/12 £ £ £0 - £20,000 4 9 0 0 4 9 49,065 72,871 £20,001 - £40,000 1 5 0 0 1 5 63,151 131,323
£40,001 - £60,000 1 3 0 0 1 3 51,534 138,543
£60,001 - £80,000 0 0 0 2 0 2 0 122,722
£80,001 - £100,000 1 0 0 1 1 1 89,299 99,539
£100,000 - £150,000 0 0 0 1 0 1 0 112,075
Total 7 17 0 4 7 21 253,049 677,073
None of the exit packages shown in the table above related to senior employees.
85
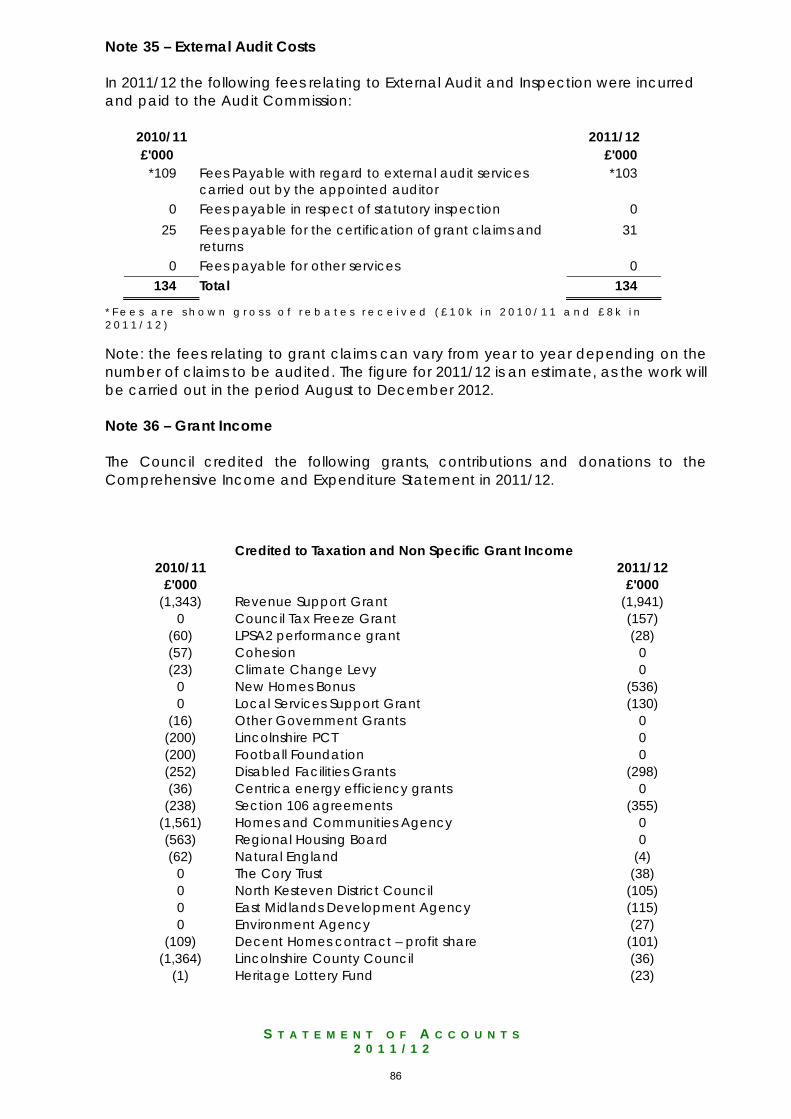
S T A T E M E N T O F A C C O U N T S
2 0 1 1 / 1 2
Note 35 – External Audit Costs In 2011/12 the following fees relating to External Audit and Inspection were incurred and paid to the Audit Commission:
2010/11 2011/12 £'000 £'000
*109 Fees Payable with regard to external audit services carried out by the appointed auditor
*103
0 Fees payable in respect of statutory inspection 0 25 Fees payable for the certification of grant claims and
returns 31
0 Fees payable for other services 0 134 Total 134
* F e e s a r e s h o w n g r o s s o f r e b a t e s r e c e i v e d ( £ 1 0 k i n 2 0 1 0 / 1 1 a n d £ 8 k i n 2 0 1 1 / 1 2 ) Note: the fees relating to grant claims can vary from year to year depending on the number of claims to be audited. The figure for 2011/12 is an estimate, as the work will be carried out in the period August to December 2012. Note 36 – Grant Income The Council credited the following grants, contributions and donations to the Comprehensive Income and Expenditure Statement in 2011/12.
Credited to Taxation and Non Specific Grant Income 2010/11 2011/12
£'000 £'000 (1,343) Revenue Support Grant (1,941)
0 Council Tax Freeze Grant (157) (60) LPSA2 performance grant (28) (57) Cohesion 0 (23) Climate Change Levy 0
0 New Homes Bonus (536) 0 Local Services Support Grant (130)
(16) Other Government Grants 0 (200) Lincolnshire PCT 0 (200) Football Foundation 0 (252) Disabled Facilities Grants (298) (36) Centrica energy efficiency grants 0
(238) Section 106 agreements (355) (1,561) Homes and Communities Agency 0 (563) Regional Housing Board 0 (62) Natural England (4)
0 The Cory Trust (38) 0 North Kesteven District Council (105) 0 East Midlands Development Agency (115) 0 Environment Agency (27)
(109) Decent Homes contract – profit share (101) (1,364) Lincolnshire County Council (36)
(1) Heritage Lottery Fund (23)
86
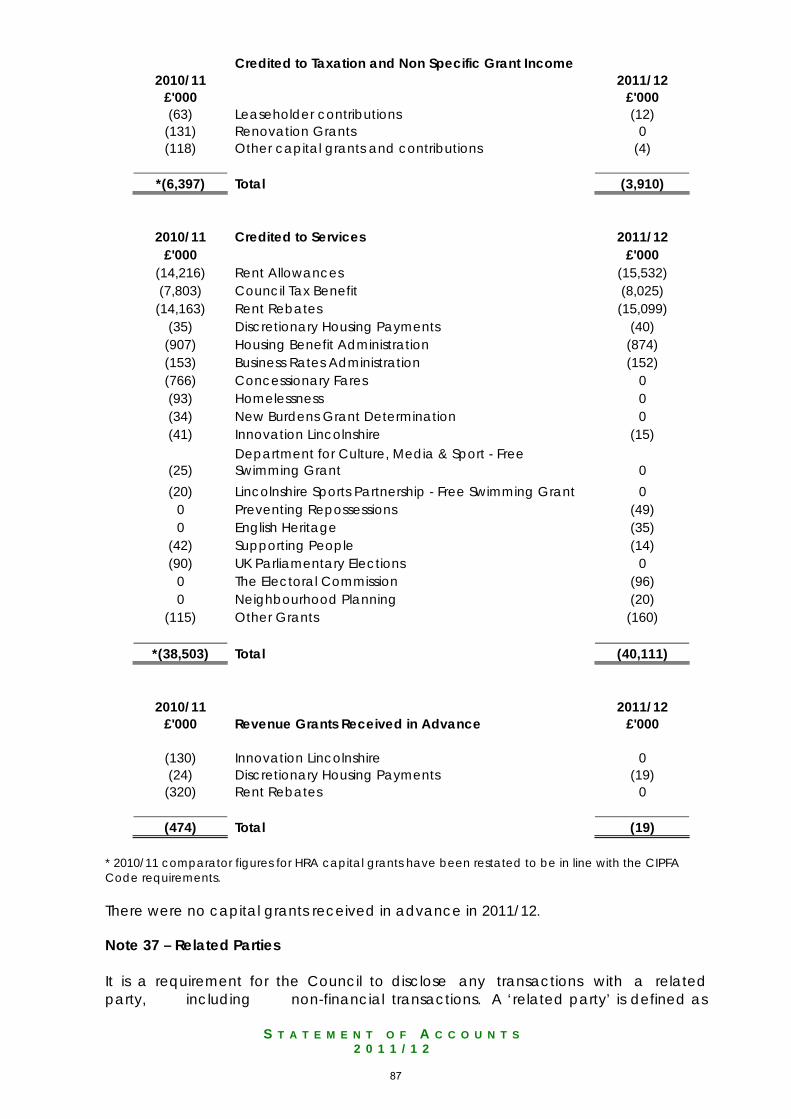
S T A T E M E N T O F A C C O U N T S
2 0 1 1 / 1 2
Credited to Taxation and Non Specific Grant Income 2010/11 2011/12
£'000 £'000 (63) Leaseholder contributions (12)
(131) Renovation Grants 0 (118) Other capital grants and contributions (4)
*(6,397) Total (3,910)
2010/11 Credited to Services 2011/12 £'000 £'000
(14,216) Rent Allowances (15,532) (7,803) Council Tax Benefit (8,025)
(14,163) Rent Rebates (15,099) (35) Discretionary Housing Payments (40)
(907) Housing Benefit Administration (874) (153) Business Rates Administration (152) (766) Concessionary Fares 0 (93) Homelessness 0 (34) New Burdens Grant Determination 0 (41) Innovation Lincolnshire (15)
(25) Department for Culture, Media & Sport - Free Swimming Grant 0
(20) Lincolnshire Sports Partnership - Free Swimming Grant 0 0 Preventing Repossessions (49) 0 English Heritage (35)
(42) Supporting People (14) (90) UK Parliamentary Elections 0
0 The Electoral Commission (96) 0 Neighbourhood Planning (20)
(115) Other Grants (160)
*(38,503) Total (40,111)
2010/11 2011/12 £'000 Revenue Grants Received in Advance £'000
(130) Innovation Lincolnshire 0 (24) Discretionary Housing Payments (19)
(320) Rent Rebates 0
(474) Total (19) * 2010/11 comparator figures for HRA capital grants have been restated to be in line with the CIPFA Code requirements. There were no capital grants received in advance in 2011/12. Note 37 – Related Parties It is a requirement for the Council to disclose any transactions with a related party, including non-financial transactions. A ‘related party’ is defined as
87
S T A T E M E N T O F A C C O U N T S
2 0 1 1 / 1 2
being an organisation with which the Council has dealings and where Officers or Members of the Council have a controlling interest or influence in the activities of that organisation. The code requires local authorities to disclose material transactions with ‘related parties’. The disclosure is required in order that the true and fairness of the accounts can be understood by the reader of the accounts having knowledge of any ‘related parties’ of the Council. Members/Officers - For 2011/12 the Council sent a letter, dated 1 April 2012, to all Members, Chief Officers and Heads of Service, requesting disclosure of any ‘related party transactions’. All letters were returned, no Members or Officers declared pecuniary interests in accordance with section 117 of the Local Government Act 1972. In addition, the table below details both Member and Officer representation on the boards of levying bodies, assisted organisations with which the Council makes material financial assistance and Joint Ventures.
Name of Organisation Member Representative
Officer Representative
Upper Witham – Drainage Board Cllr Vaughan Cllr Coupland Cllr Jackson Cllr Hewson
N/A
Witham First – Drainage Board Cllr Coupland Cllr Hewson Cllr Vaughan Cllr Jackson
N/A
Witham Third – Drainage Board Cllr Coupland Cllr Hewson Cllr Vaughan Cllr Jackson
N/A
Lincoln Arts Trust Cllr Bushell N/A Lincoln Dial-a-Ride Cllr Charlesworth Director of Resources Citizens Advice Bureau Cllr Burke N/A Investors in Lincoln Cllr Metcalfe
Cllr Murry N/A
Central Lincolnshire Joint Strategic Planning Partnership
Cllr Metcalfe Cllr Murray Cllr West
Director of Development & Environmental Services
The Shared Revenues & Benefits Joint Committee
Cllr Metcalfe Cllr Nannestad
Director of Resources, Head of Shared Revenues & Benefits
None of the above Members or Officers took part in the decision making of any financial assistance awarded to any of the organisations. Central Government - has significant influence over the general operations of the Council. It is responsible for providing the statutory framework within which the Council operates, provides the majority of its funding in the form of grants and prescribes the terms of many of the transactions that the Council has with other parties (e.g. housing benefits).
88
S T A T E M E N T O F A C C O U N T S
2 0 1 1 / 1 2
Details of transactions with government departments are set out in note 36. Other Bodies - transactions with other bodies levying demands on the Council Tax - Levying bodies in 2011/12 were as follows:
2010/11 2011/12 £'000 £'000 373 Upper Witham Drainage Board 380 113 Witham 1st Drainage Board 114 219 Witham 3rd Drainage Board 219 705 Total 713
Assisted Organisations - the Council made material financial assistance to the following organisations during the year:-
2010/11 2011/12 £'000 £'000 303 Lincoln Arts Trust 271 46 Lincoln Dial-a-Ride 47 48 Citizens Advice Bureau 49
Joint Ventures – The Council holds 5.6% (£14,000) of the ordinary share capital of £250,000 of Investors in Lincoln Ltd. (IIL) The principal activity of the company is the promotion of economic regeneration and the development and expansion of industry, commerce and enterprise of all forms for the benefit of the community in and around the City of Lincoln. Investors in Lincoln Ltd grants the Council the sole and exclusive right to licence and manage its managed workspace development at Greetwell Place. The company's accounting year-end is 31st March and the latest (audited) accounts are for the year ended 31st March 2011, showing net assets of £3,435,823 and a profit of £228,770 before taxation, £177,302 after tax (£243,214 before tax and £188,697 after tax in 2009/10). The Council is fully responsible for meeting the first £100,000 of any cumulative deficit on operating the managed workspace units. In the event that the cumulative deficiency exceeds £100,000 the Council shall meet 75% of the deficiency. In 2011/12 a deficit on the managed workspace units of £1,208 was attributable to the Council. Details of amounts received from IIL during 2011/12 are shown below:
2010/11 2011/12 £'000 £'000 179 Property Management costs 180
90 Facility Fee 90
0 Management Fee (1)
89
S T A T E M E N T O F A C C O U N T S
2 0 1 1 / 1 2
An amount of £13,584 was owed to IIL at 31st March 2012 in respect of property management costs, facility fees and management fees. This is included in the creditors balance in the Council’s Balance Sheet. The accounts of the company may be obtained from The Company Secretary, 5 Beck Hall, Welton, LN2 3LJ. Joint Ventures - The Council has a collaborative arrangement with North Kesteven and West Lindsey District Councils to provide the Central Lincolnshire Joint Planning Unit. This arrangement is hosted by North Kesteven District Council. The Council also has a collaborative arrangement with North Kesteven to provide a shared Revenues and Benefits Service. This shared service is hosted by the City of Lincoln Council. Both of these arrangements are governed through a Joint Committee representing each of the partner authorities. These arrangements are considered as Jointly Controlled Operations, where ventures use their own resources to undertake an activity subject to joint control, and as such do not require consolidation into the Council’s accounts. The Council’s proportion of activity is accounted for separately within the Core Financial Statements. Note 38 – Capital Expenditure and Capital Financing The total amount of capital expenditure incurred in the year is shown in the table below (including the value of assets acquired under finance leases), together with the resources that have been used to finance it. Where capital expenditure is to be financed in future years by charges to revenue as assets are used by the Council, the expenditure results in an increase in the Capital Financing Requirement (CFR). The Capital Financing Requirement (CFR) is a measure of the capital expenditure incurred historically that has yet to be financed. The CFR is analysed in the second part of this note. Total Capital expenditure and financing during the year:
2010/11 2011/12 £’000 £’000
Capital investment 13,500 Property, Plant and Equipment 8,389
72 Investment Properties 0 97 Intangible Assets 289
3,165 Revenue Expenditure Funded from Capital under Statute** 27,271 16,834 35,949
Sources of finance (3,861) Capital Receipts (1,759) (4,076) Government grants and other contributions (2,337) (2,134) Revenue Contributions (1,672) (4,983) Major Repairs Reserve (5,053)
1,780 Capital Financing Requirement 25,128
Capital Financing Requirement - Funded by:
1,020 Supported Borrowing 0
90
S T A T E M E N T O F A C C O U N T S
2 0 1 1 / 1 2
2010/11 2011/12 £’000 £’000
760 Unsupported Borrowing 25,128 1,780 25,128
Analysis of movements in the Capital Financing Requirement in Year:
56,882 Opening CFR 57,554
1,020 Supported borrowing 0 760 Unsupported borrowing 25,128
65 Adjustments in respect of embedded leases reflected within non-current assets 0
(1,173) Minimum Revenue Provision/Voluntary Revenue Provision (1,192)
57,554 Closing CFR 81,490
**Revenue Expenditure Funded from Capital under Statute includes the HRA self financing settlement payment of £24.931m. The Council has a five-year Housing Investment programme, of which £5.242m is contractually committed. This is for a period of investment of two years and relates to a partnership arrangement to ensure that all our properties continue to meet Decent Homes Standard. In addition, the Council also has a five-year General Fund Investment Programme, of which £1.033m is contractually committed. £ 000 Lucy Tower Street Car Park Works 523 Lucy Tower Lift Works 56 Mercury Abatement 454 Total 1,033 Note 39 – Leases Council as Lessee Finance Leases The Council has acquired two car parks and the Bus Station and fleet vehicles under finance leases. The assets acquired under these leases are carried as Property, Plant and Equipment in the Balance Sheet at the following amounts:
91
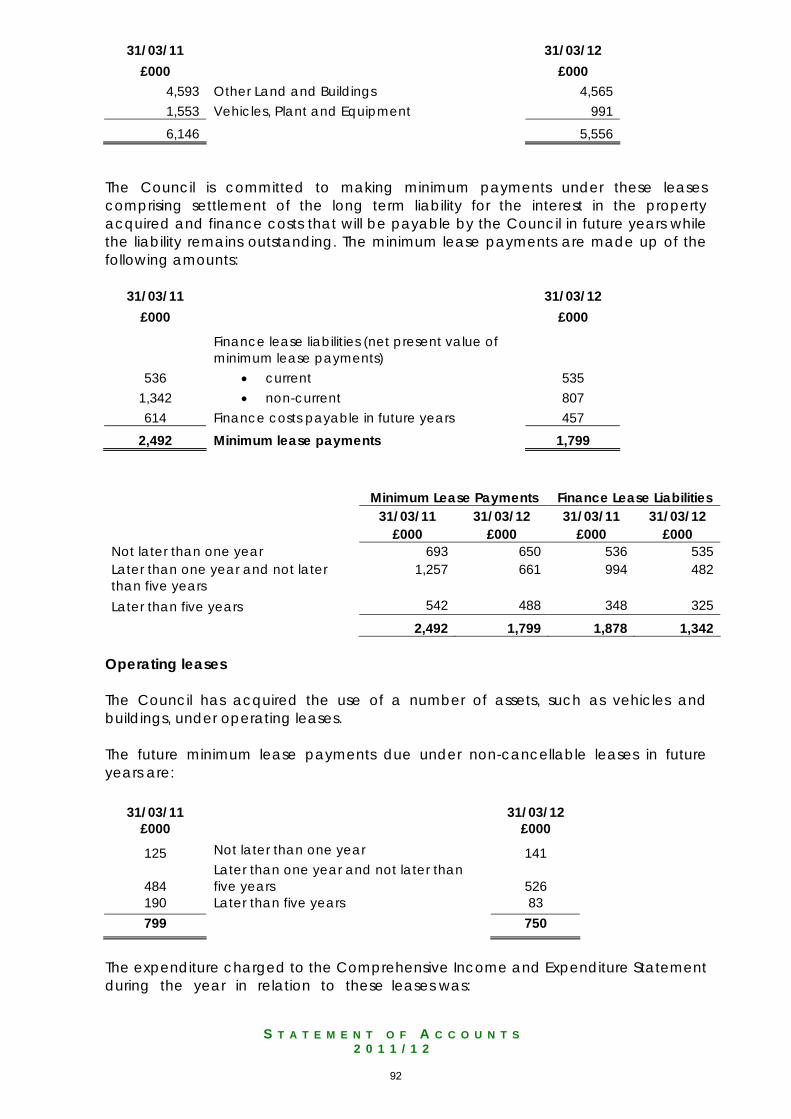
S T A T E M E N T O F A C C O U N T S
2 0 1 1 / 1 2
31/03/11 31/03/12 £000 £000
4,593 Other Land and Buildings 4,565 1,553 Vehicles, Plant and Equipment 991 6,146 5,556
The Council is committed to making minimum payments under these leases comprising settlement of the long term liability for the interest in the property acquired and finance costs that will be payable by the Council in future years while the liability remains outstanding. The minimum lease payments are made up of the following amounts:
31/03/11 31/03/12 £000 £000
Finance lease liabilities (net present value of minimum lease payments)
536 • current 535 1,342 • non-current 807 614 Finance costs payable in future years 457
2,492 Minimum lease payments 1,799 Minimum Lease Payments Finance Lease Liabilities 31/03/11 31/03/12 31/03/11 31/03/12 £000 £000 £000 £000 Not later than one year 693 650 536 535 Later than one year and not later than five years
1,257 661 994 482
Later than five years 542 488 348 325
2,492 1,799 1,878 1,342 Operating leases The Council has acquired the use of a number of assets, such as vehicles and buildings, under operating leases. The future minimum lease payments due under non-cancellable leases in future years are:
31/03/11 31/03/12 £000
£000
125 Not later than one year 141
484 Later than one year and not later than five years 526
190 Later than five years 83 799 750
The expenditure charged to the Comprehensive Income and Expenditure Statement during the year in relation to these leases was:
92
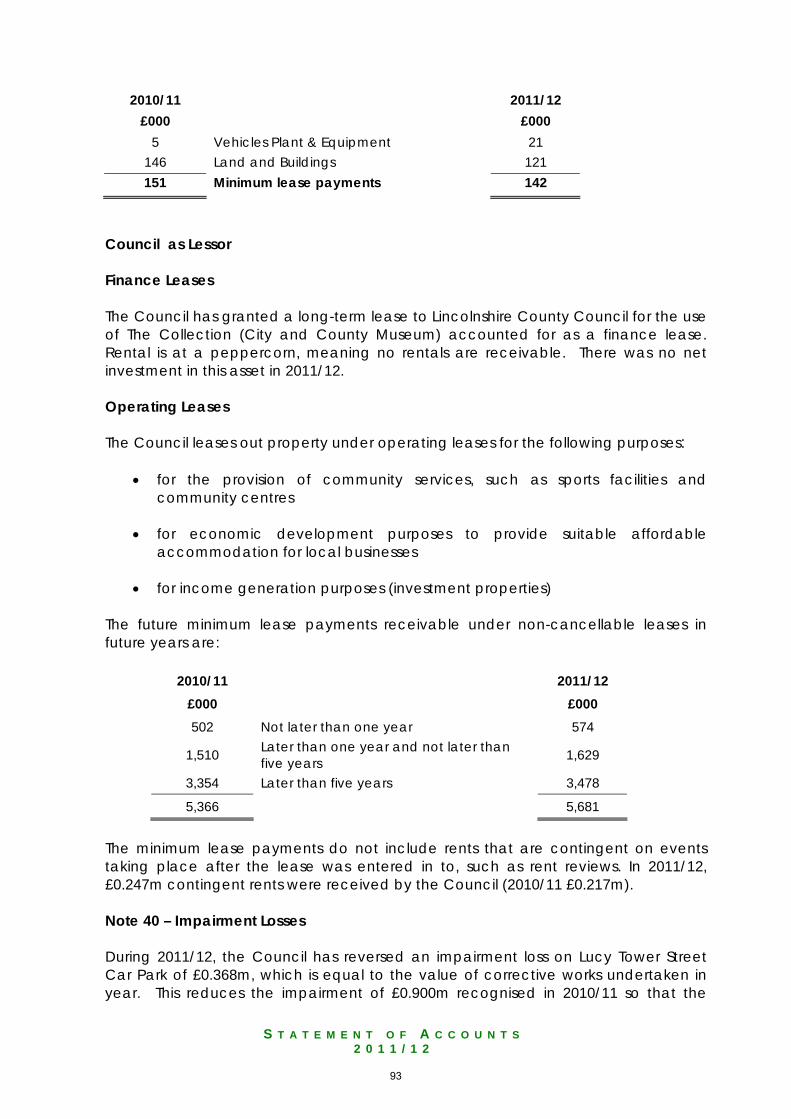
S T A T E M E N T O F A C C O U N T S
2 0 1 1 / 1 2
2010/11 2011/12 £000 £000
5 Vehicles Plant & Equipment 21 146 Land and Buildings 121 151 Minimum lease payments 142
Council as Lessor Finance Leases The Council has granted a long-term lease to Lincolnshire County Council for the use of The Collection (City and County Museum) accounted for as a finance lease. Rental is at a peppercorn, meaning no rentals are receivable. There was no net investment in this asset in 2011/12. Operating Leases The Council leases out property under operating leases for the following purposes:
• for the provision of community services, such as sports facilities and community centres
• for economic development purposes to provide suitable affordable
accommodation for local businesses
• for income generation purposes (investment properties)
The future minimum lease payments receivable under non-cancellable leases in future years are:
2010/11 2011/12 £000 £000 502 Not later than one year 574
1,510 Later than one year and not later than five years 1,629
3,354 Later than five years 3,478
5,366 5,681
The minimum lease payments do not include rents that are contingent on events taking place after the lease was entered in to, such as rent reviews. In 2011/12, £0.247m contingent rents were received by the Council (2010/11 £0.217m). Note 40 – Impairment Losses During 2011/12, the Council has reversed an impairment loss on Lucy Tower Street Car Park of £0.368m, which is equal to the value of corrective works undertaken in year. This reduces the impairment of £0.900m recognised in 2010/11 so that the
93

S T A T E M E N T O F A C C O U N T S
2 0 1 1 / 1 2
balance carried forward at 31 March 2012 is £0.532m. An impairment on Thornbridge car park of £0.500m recognised in 2010/11 has been carried forward at 31 March 2012. The car parks are in urgent need of extensive restoration works to maintain full capacity usage and hence income generating potential. The values of the car parks have been revised to reflect this impairment of their service potential and the impairments have been charged to the Revaluation Reserve, reducing the balance of previous accumulated gains in respect of these assets. The value of the impairment was determined by consideration of the value of the capital works required to restore full service potential. Note 41 – Capitalisation of Borrowing Costs As permitted by the code, the Council has adopted a policy of accounting for borrowing costs in the Comprehensive Income and Expenditure Statement as they arise. No borrowing costs are capitalised. Note 42 – Termination Benefits The Council terminated the contracts of a number of employees in 2011/12, incurring liabilities of £0.677m (£0.253m in 2010/11) – see note 34 for the number of exit packages and total cost per band. These costs exclude any ill health retirements or departures as they are not termination benefits in accordance with the requirements of the code. Note 43 – Defined Benefit Pension Scheme Participation in Pension Schemes As part of the terms and conditions of employment of its officers and other employees, the Council offers retirement benefits. Although these benefits will not actually be payable until employees retire, the Council has a commitment to make the payments that need to be disclosed. The Council participates in the Local Government Pension Scheme, administered by Lincolnshire County Council. This is a funded scheme, meaning that the Council and employees pay contributions into a fund, calculated at a level intended to balance the pensions liability with investment assets. Transactions Relating to Retirement Benefits The Council recognises the cost of retirement benefits in the Net Cost of Services when they are earned by employees, rather than when the benefits are eventually paid as pensions. However, the charge that is required to go against Council Tax is based on the cash payable in the year, so the real cost of retirement benefits is reversed out in the Movement in Reserves Statement. The following transactions have been made in the Comprehensive Income & Expenditure Statement and the General Fund Balance via the Movement in Reserves Statement during the year:
94
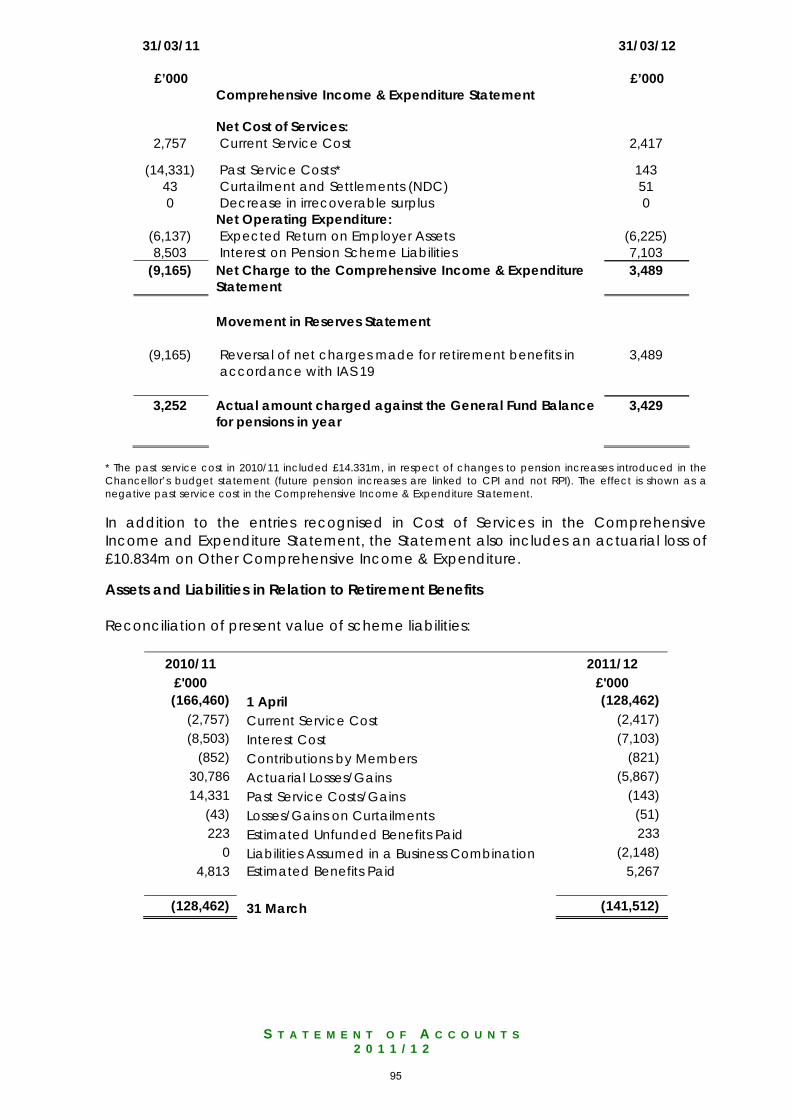
S T A T E M E N T O F A C C O U N T S
2 0 1 1 / 1 2
31/03/11
31/03/12
£’000 £’000 Comprehensive Income & Expenditure Statement
Net Cost of Services: 2,757 Current Service Cost 2,417
(14,331) Past Service Costs* 143 43 Curtailment and Settlements (NDC) 51 0 Decrease in irrecoverable surplus 0 Net Operating Expenditure:
(6,137) Expected Return on Employer Assets (6,225) 8,503 Interest on Pension Scheme Liabilities 7,103
(9,165) Net Charge to the Comprehensive Income & Expenditure Statement
3,489
Movement in Reserves Statement
(9,165) Reversal of net charges made for retirement benefits in accordance with IAS 19
3,489
3,252 Actual amount charged against the General Fund Balance
for pensions in year 3,429
* The past service cost in 2010/11 included £14.331m, in respect of changes to pension increases introduced in the Chancellor’s budget statement (future pension increases are linked to CPI and not RPI). The effect is shown as a negative past service cost in the Comprehensive Income & Expenditure Statement. In addition to the entries recognised in Cost of Services in the Comprehensive Income and Expenditure Statement, the Statement also includes an actuarial loss of £10.834m on Other Comprehensive Income & Expenditure. Assets and Liabilities in Relation to Retirement Benefits Reconciliation of present value of scheme liabilities:
2010/11 2011/12 £'000 £'000 (166,460) 1 April (128,462)
(2,757) Current Service Cost (2,417) (8,503) Interest Cost (7,103)
(852) Contributions by Members (821) 30,786 Actuarial Losses/Gains (5,867) 14,331 Past Service Costs/Gains (143)
(43) Losses/Gains on Curtailments (51) 223 Estimated Unfunded Benefits Paid 233
0 Liabilities Assumed in a Business Combination (2,148) 4,813 Estimated Benefits Paid
5,267
(128,462) 31 March (141,512)
95
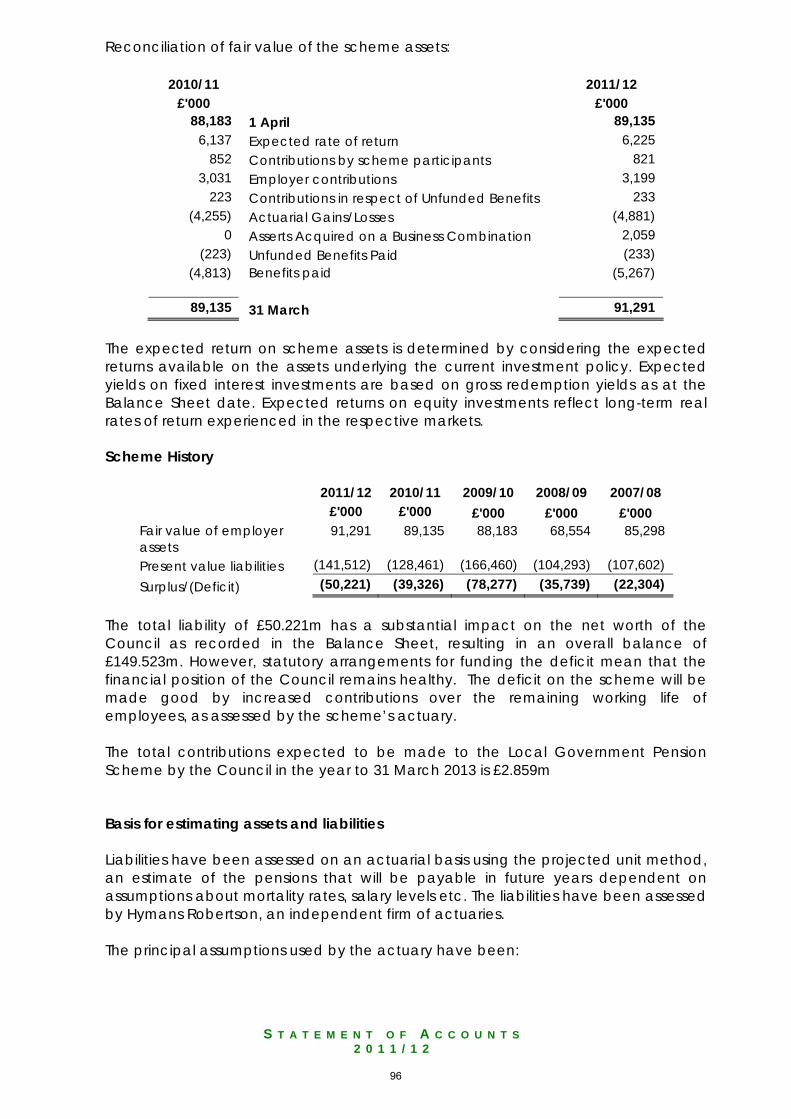
S T A T E M E N T O F A C C O U N T S
2 0 1 1 / 1 2
Reconciliation of fair value of the scheme assets:
2010/11 2011/12 £'000 £'000
88,183 1 April 89,135 6,137 Expected rate of return 6,225
852 Contributions by scheme participants 821 3,031 Employer contributions 3,199
223 Contributions in respect of Unfunded Benefits 233 (4,255) Actuarial Gains/Losses (4,881)
0 Asserts Acquired on a Business Combination 2,059 (223) Unfunded Benefits Paid (233)
(4,813) Benefits paid
(5,267)
89,135 31 March 91,291 The expected return on scheme assets is determined by considering the expected returns available on the assets underlying the current investment policy. Expected yields on fixed interest investments are based on gross redemption yields as at the Balance Sheet date. Expected returns on equity investments reflect long-term real rates of return experienced in the respective markets. Scheme History
2011/12 2010/11 2009/10 2008/09 2007/08 £'000 £'000 £'000 £'000 £'000 Fair value of employer assets
91,291 89,135 88,183 68,554 85,298
Present value liabilities (141,512) (128,461) (166,460) (104,293) (107,602) Surplus/(Deficit) (50,221) (39,326) (78,277) (35,739) (22,304)
The total liability of £50.221m has a substantial impact on the net worth of the Council as recorded in the Balance Sheet, resulting in an overall balance of £149.523m. However, statutory arrangements for funding the deficit mean that the financial position of the Council remains healthy. The deficit on the scheme will be made good by increased contributions over the remaining working life of employees, as assessed by the scheme’s actuary. The total contributions expected to be made to the Local Government Pension Scheme by the Council in the year to 31 March 2013 is £2.859m Basis for estimating assets and liabilities Liabilities have been assessed on an actuarial basis using the projected unit method, an estimate of the pensions that will be payable in future years dependent on assumptions about mortality rates, salary levels etc. The liabilities have been assessed by Hymans Robertson, an independent firm of actuaries. The principal assumptions used by the actuary have been:
96
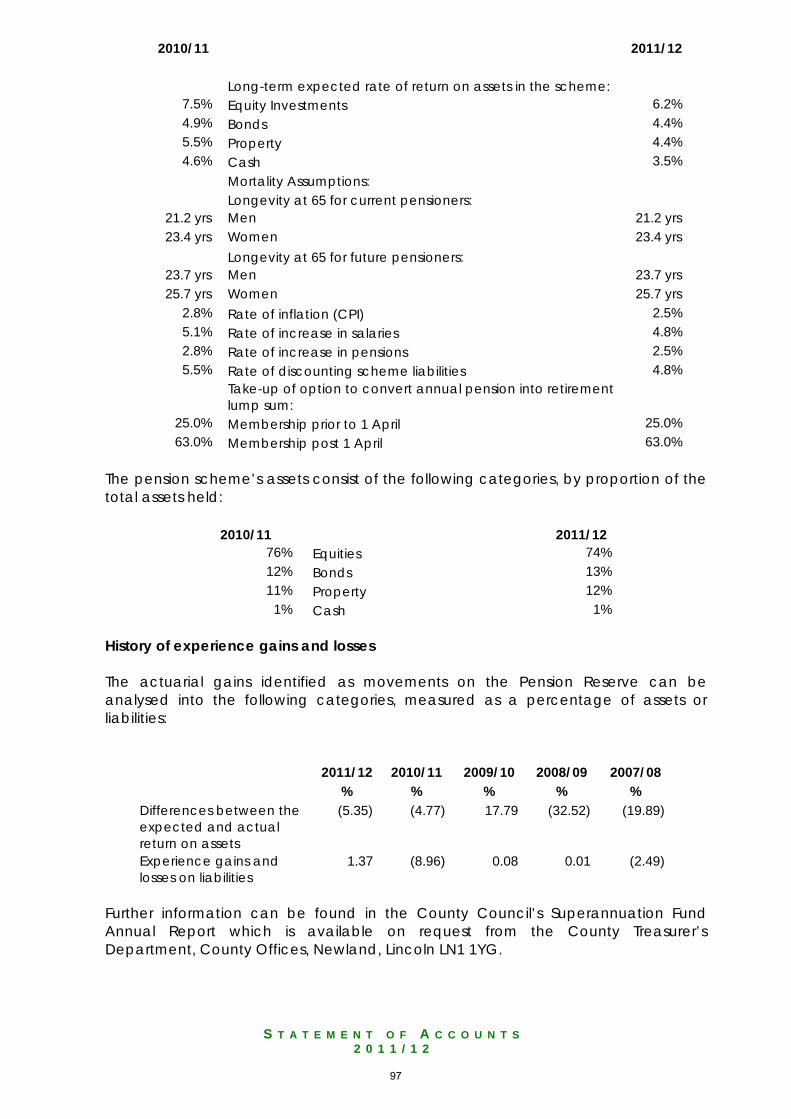
S T A T E M E N T O F A C C O U N T S
2 0 1 1 / 1 2
2010/11 2011/12
Long-term expected rate of return on assets in the scheme: 7.5% Equity Investments 6.2% 4.9% Bonds 4.4% 5.5% Property 4.4% 4.6% Cash 3.5%
Mortality Assumptions: Longevity at 65 for current pensioners:
21.2 yrs Men 21.2 yrs 23.4 yrs Women 23.4 yrs
Longevity at 65 for future pensioners: 23.7 yrs Men 23.7 yrs 25.7 yrs Women 25.7 yrs
2.8% Rate of inflation (CPI) 2.5% 5.1% Rate of increase in salaries 4.8% 2.8% Rate of increase in pensions 2.5% 5.5% Rate of discounting scheme liabilities 4.8%
Take-up of option to convert annual pension into retirement lump sum:
25.0% Membership prior to 1 April 25.0% 63.0% Membership post 1 April 63.0%
The pension scheme’s assets consist of the following categories, by proportion of the total assets held:
2010/11 2011/12 76% Equities 74% 12% Bonds 13% 11% Property 12%
1% Cash 1% History of experience gains and losses The actuarial gains identified as movements on the Pension Reserve can be analysed into the following categories, measured as a percentage of assets or liabilities:
2011/12 2010/11 2009/10 2008/09 2007/08 % % % % % Differences between the expected and actual return on assets
(5.35) (4.77) 17.79 (32.52) (19.89)
Experience gains and losses on liabilities
1.37 (8.96) 0.08 0.01 (2.49)
Further information can be found in the County Council’s Superannuation Fund Annual Report which is available on request from the County Treasurer’s Department, County Offices, Newland, Lincoln LN1 1YG.
97
S T A T E M E N T O F A C C O U N T S
2 0 1 1 / 1 2
Note 44 – Contingent Liabilities A contingent liability is a possible liability arising from past events whose existence will be confirmed only by the occurrence of one or more uncertain future events not wholly within the Council’s control. Where a material loss can be estimated with reasonable accuracy a provision is accrued within the financial statements. If, however a loss cannot be accurately estimated or the event is not considered sufficiently certain, a contingent liability will be disclosed in a note to the Balance Sheet. There are no contingent liabilities at 31st March 2012. Note 45 – Contingent Assets The Council has no Contingent Assets as at 31st March 2012. Note 46 – Nature and Extent of Risks Arising from Financial Instruments
The Council’s activities expose it to a variety of financial risks. The key risks are:
Credit risk – the possibility that other parties might fail to pay amounts due to the Council.
Liquidity risk – the possibility that the Council might not have funds available to meet its commitments to make payments.
Re-financing risk – the possibility that the Council might be requiring to renew a financial instrument on maturity at disadvantageous interest rates or terms.
Market risk - the possibility that financial loss might arise for the Council as a result of changes in such measures as interest rates movements.
Overall Procedures for Managing Risk
The Council’s overall risk management procedures focus on the unpredictability of financial markets, and implementing restrictions to minimise these risks. The procedures for risk management are set out through a legal framework set out in the Local Government Act 2003 and the associated regulations. These require the Council to comply with the CIPFA Prudential Code, the CIPFA Treasury Management in the Public Services Code of Practice and Investment Guidance issued through the Act. Overall these procedures require the Council to manage risk in the following ways:
by formally adopting the requirements of the Code of Practice;
by the adoption of a Treasury Management Policy Statement and treasury management clauses within its standing orders;
by approving, annually in advance, prudential indicators for the following three years limiting:
98
S T A T E M E N T O F A C C O U N T S
2 0 1 1 / 1 2
o The Council’s overall borrowing;
o Its maximum and minimum exposures to fixed and variable rates;
o Its maximum and minimum limits on the maturity structure of its debt;
o Its maximum annual exposures to investments maturing beyond a year.
by approving an investment strategy for the forthcoming year setting out its criteria for both investing and selecting investment counterparties in compliance with the Government Guidance;
These are required to be reported and approved at or before the Council’s annual Council Tax setting budget. These items are reported with the annual Treasury Management Strategy, which outlines the detailed approach to managing risk in relation to the Council’s financial instrument exposure. Actual performance is also reported semi-annually to Members.
The annual Treasury Management Strategy which incorporates the prudential indicators was approved by Council on 1st March 2011 and the prudential indicators were revised on 6th March 2012 and is available on the Council’s website (www.lincoln.gov.uk). The key issues within the strategy were:
• The Authorised Limit for 2011/12 was set at £60.7m. This is the maximum limit of external borrowings or other long term liabilities during the year. This was revised during 2011/12 to £85.0m to include borrowing in respect of the HRA self financing settlement payment.
• The Operational Boundary was expected to be £58.5m. This is the expected level of debt and other long term liabilities during the year. This was revised in year to £83.6m to allow for the HRA borrowing in respect of the self financing payment.
• The maximum amounts of fixed and variable interest rate exposure were set at £51.7m and £22.4m based on the Council’s net debt.
• The maximum and minimum exposures to the maturity structure of debt are shown within this note.
These policies are implemented by the Treasury team in Financial Services. The Council maintains written principles for overall risk management, as well as written policies covering specific areas, such as interest rate risk, credit risk, and the investment of surplus cash through Treasury Management Practices (TMPs). These TMPs are a requirement of the Code of Practice and are reviewed regularly.
99
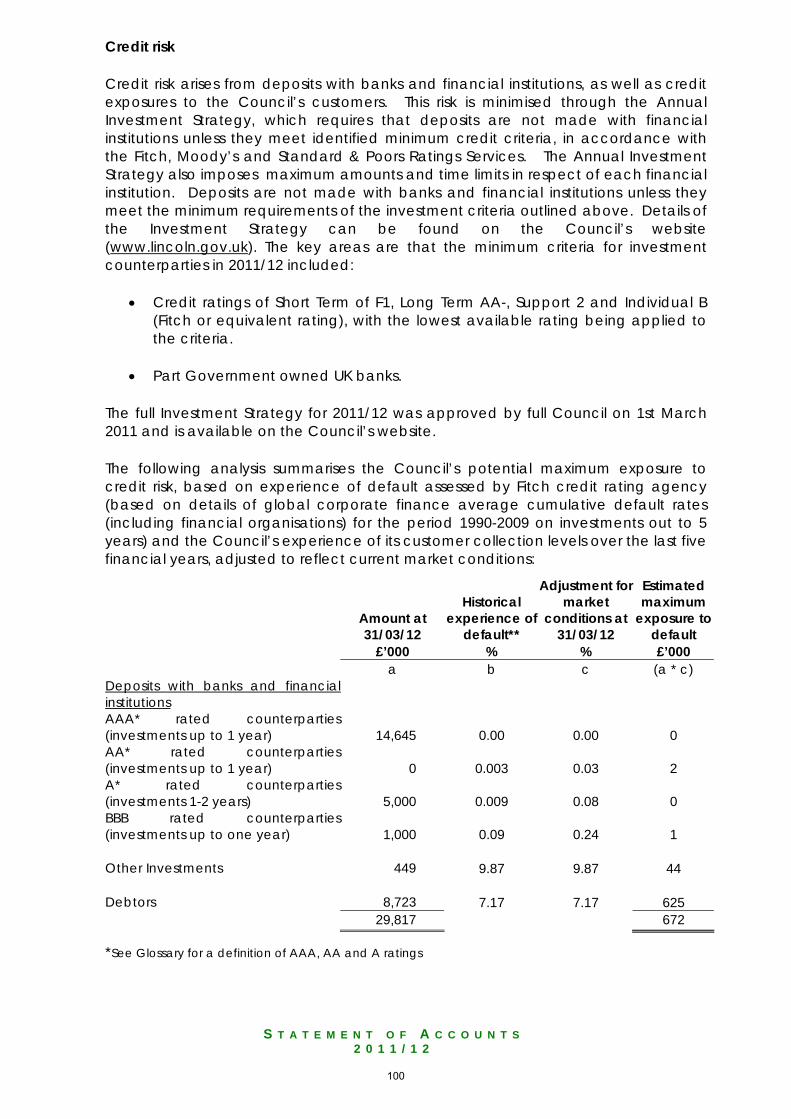
S T A T E M E N T O F A C C O U N T S
2 0 1 1 / 1 2
Credit risk
Credit risk arises from deposits with banks and financial institutions, as well as credit exposures to the Council’s customers. This risk is minimised through the Annual Investment Strategy, which requires that deposits are not made with financial institutions unless they meet identified minimum credit criteria, in accordance with the Fitch, Moody’s and Standard & Poors Ratings Services. The Annual Investment Strategy also imposes maximum amounts and time limits in respect of each financial institution. Deposits are not made with banks and financial institutions unless they meet the minimum requirements of the investment criteria outlined above. Details of the Investment Strategy can be found on the Council’s website (www.lincoln.gov.uk). The key areas are that the minimum criteria for investment counterparties in 2011/12 included:
• Credit ratings of Short Term of F1, Long Term AA-, Support 2 and Individual B (Fitch or equivalent rating), with the lowest available rating being applied to the criteria.
• Part Government owned UK banks.
The full Investment Strategy for 2011/12 was approved by full Council on 1st March 2011 and is available on the Council’s website.
The following analysis summarises the Council’s potential maximum exposure to credit risk, based on experience of default assessed by Fitch credit rating agency (based on details of global corporate finance average cumulative default rates (including financial organisations) for the period 1990-2009 on investments out to 5 years) and the Council’s experience of its customer collection levels over the last five financial years, adjusted to reflect current market conditions:
Amount at 31/03/12
Historical experience of
default**
Adjustment for market
conditions at 31/03/12
Estimated maximum
exposure to default
£’000 % % £’000 a b c (a * c) Deposits with banks and financialinstitutions AAA* rated counterparties(investments up to 1 year) 14,645 0.00 0.00 0 AA* rated counterparties(investments up to 1 year) 0 0.003 0.03 2 A* rated counterparties(investments 1-2 years) 5,000 0.009 0.08 0 BBB rated counterparties(investments up to one year) 1,000 0.09 0.24 1 Other Investments 449 9.87 9.87 44 Debtors 8,723 7.17 7.17 625 29,817 672
*See Glossary for a definition of AAA, AA and A ratings
100
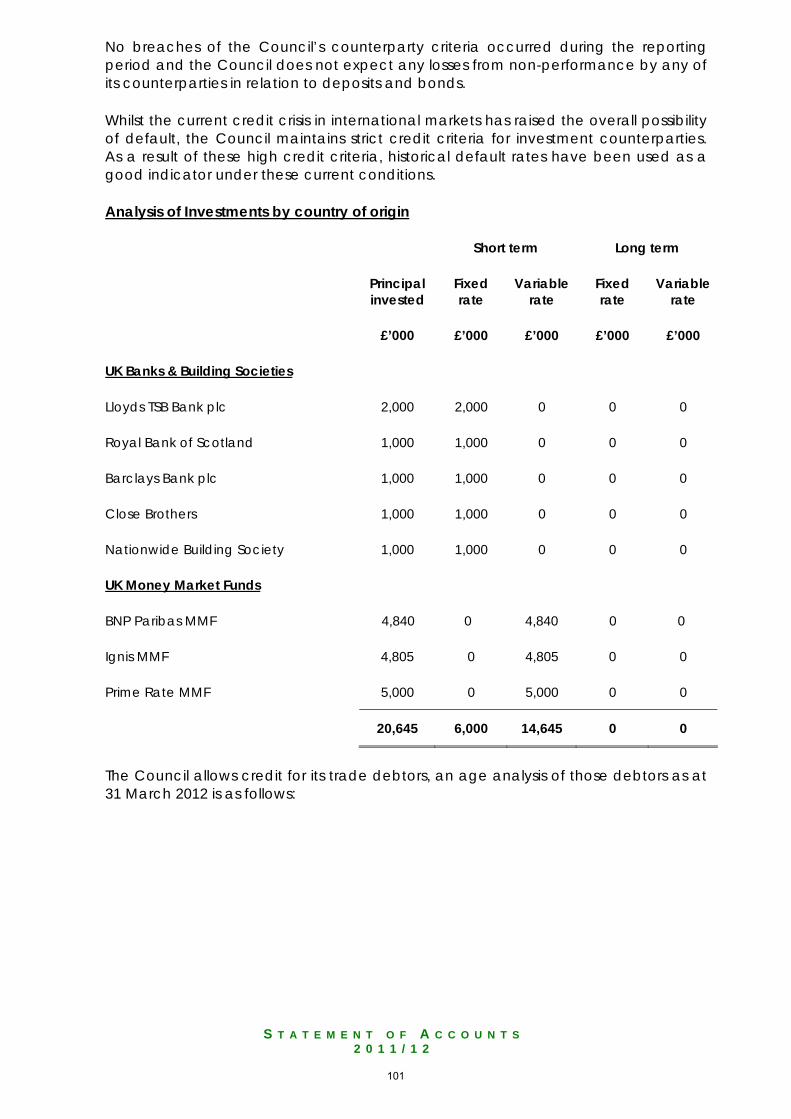
S T A T E M E N T O F A C C O U N T S
2 0 1 1 / 1 2
No breaches of the Council’s counterparty criteria occurred during the reporting period and the Council does not expect any losses from non-performance by any of its counterparties in relation to deposits and bonds.
Whilst the current credit crisis in international markets has raised the overall possibility of default, the Council maintains strict credit criteria for investment counterparties. As a result of these high credit criteria, historical default rates have been used as a good indicator under these current conditions.
Analysis of Investments by country of origin
Short term Long term
Principal invested
Fixed rate
Variable rate
Fixed rate
Variable rate
£’000 £’000 £’000 £’000 £’000
UK Banks & Building Societies
Lloyds TSB Bank plc 2,000 2,000 0 0 0
Royal Bank of Scotland 1,000 1,000 0 0 0
Barclays Bank plc 1,000 1,000 0 0 0
Close Brothers 1,000 1,000 0 0 0
Nationwide Building Society 1,000 1,000 0 0 0
UK Money Market Funds
BNP Paribas MMF 4,840 0 4,840 0 0
Ignis MMF 4,805 0 4,805 0 0
Prime Rate MMF 5,000 0 5,000 0 0
20,645 6,000 14,645 0 0
The Council allows credit for its trade debtors, an age analysis of those debtors as at 31 March 2012 is as follows:
101
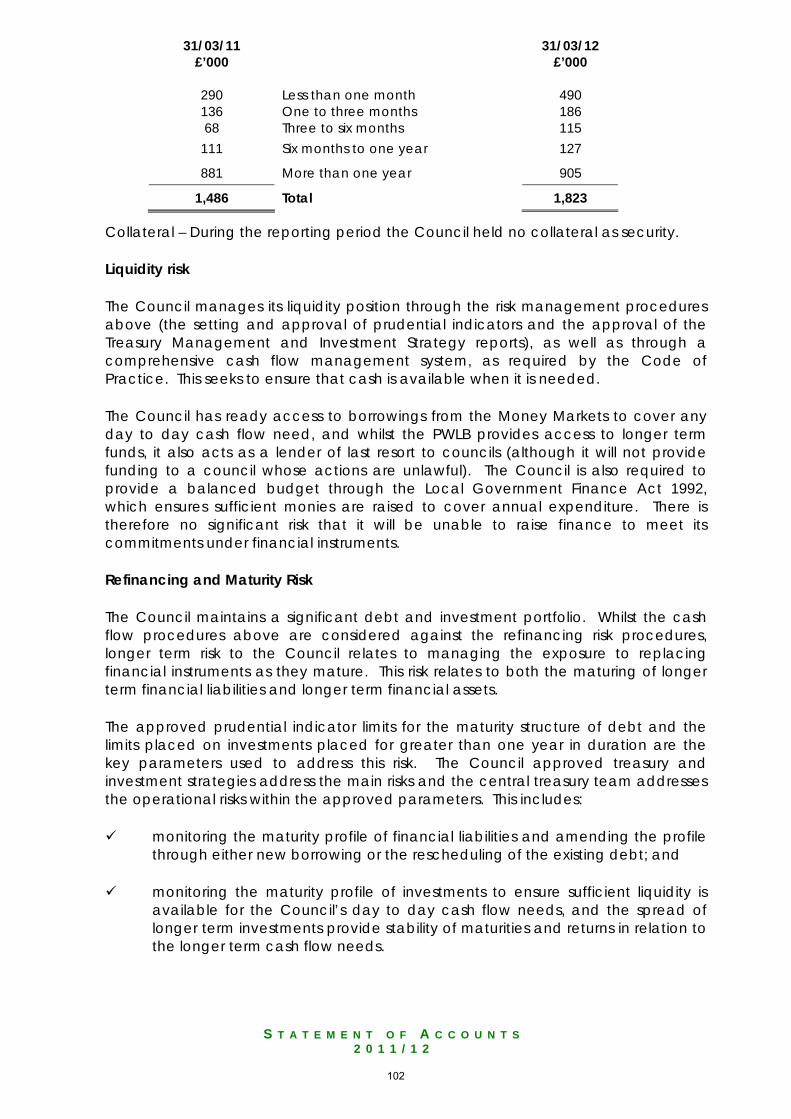
S T A T E M E N T O F A C C O U N T S
2 0 1 1 / 1 2
31/03/11 £’000
31/03/12 £’000
290 Less than one month 490 136 One to three months 186 68 Three to six months 115
111 Six months to one year 127
881 More than one year 905
1,486 Total 1,823
Collateral – During the reporting period the Council held no collateral as security.
Liquidity risk
The Council manages its liquidity position through the risk management procedures above (the setting and approval of prudential indicators and the approval of the Treasury Management and Investment Strategy reports), as well as through a comprehensive cash flow management system, as required by the Code of Practice. This seeks to ensure that cash is available when it is needed.
The Council has ready access to borrowings from the Money Markets to cover any day to day cash flow need, and whilst the PWLB provides access to longer term funds, it also acts as a lender of last resort to councils (although it will not provide funding to a council whose actions are unlawful). The Council is also required to provide a balanced budget through the Local Government Finance Act 1992, which ensures sufficient monies are raised to cover annual expenditure. There is therefore no significant risk that it will be unable to raise finance to meet its commitments under financial instruments.
Refinancing and Maturity Risk
The Council maintains a significant debt and investment portfolio. Whilst the cash flow procedures above are considered against the refinancing risk procedures, longer term risk to the Council relates to managing the exposure to replacing financial instruments as they mature. This risk relates to both the maturing of longer term financial liabilities and longer term financial assets.
The approved prudential indicator limits for the maturity structure of debt and the limits placed on investments placed for greater than one year in duration are the key parameters used to address this risk. The Council approved treasury and investment strategies address the main risks and the central treasury team addresses the operational risks within the approved parameters. This includes:
monitoring the maturity profile of financial liabilities and amending the profile through either new borrowing or the rescheduling of the existing debt; and
monitoring the maturity profile of investments to ensure sufficient liquidity is available for the Council’s day to day cash flow needs, and the spread of longer term investments provide stability of maturities and returns in relation to the longer term cash flow needs.
102
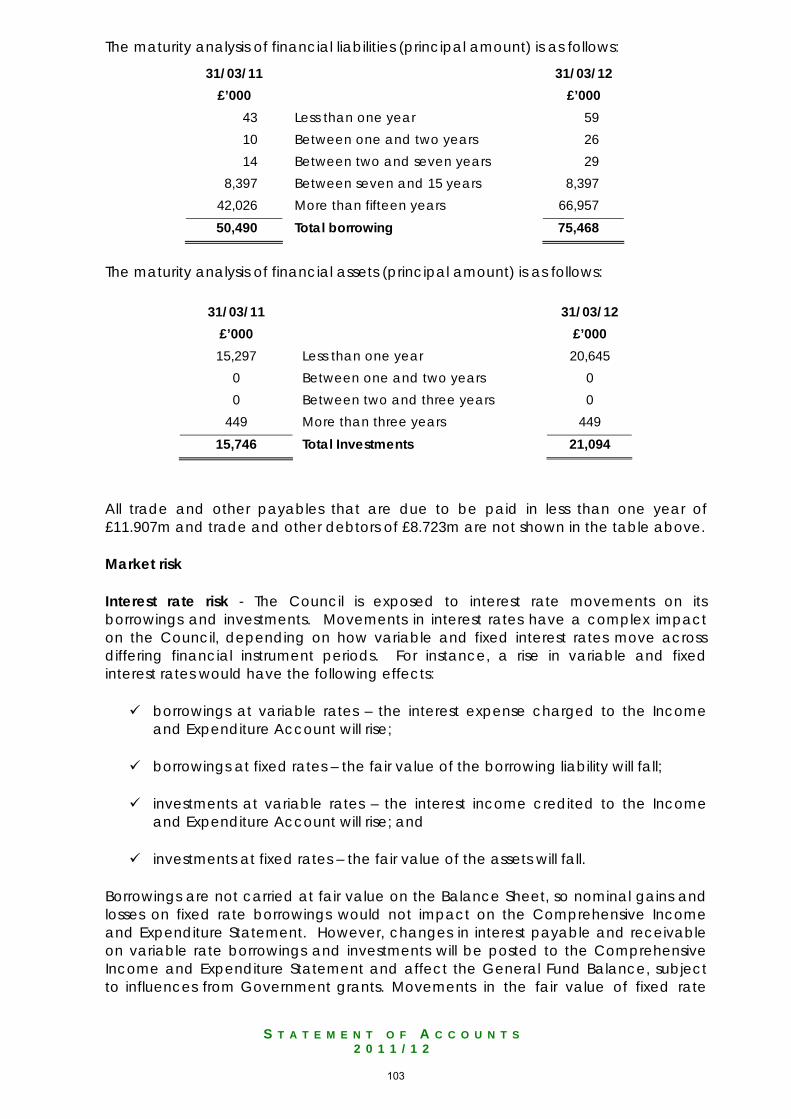
S T A T E M E N T O F A C C O U N T S
2 0 1 1 / 1 2
The maturity analysis of financial liabilities (principal amount) is as follows:
31/03/11 31/03/12 £’000 £’000
43 Less than one year 59 10 Between one and two years 26 14 Between two and seven years 29
8,397 Between seven and 15 years 8,397 42,026 More than fifteen years 66,957 50,490 Total borrowing 75,468
The maturity analysis of financial assets (principal amount) is as follows:
All trade and other payables that are due to be paid in less than one year of £11.907m and trade and other debtors of £8.723m are not shown in the table above.
Market risk
Interest rate risk - The Council is exposed to interest rate movements on its borrowings and investments. Movements in interest rates have a complex impact on the Council, depending on how variable and fixed interest rates move across differing financial instrument periods. For instance, a rise in variable and fixed interest rates would have the following effects:
borrowings at variable rates – the interest expense charged to the Income and Expenditure Account will rise;
borrowings at fixed rates – the fair value of the borrowing liability will fall;
investments at variable rates – the interest income credited to the Income and Expenditure Account will rise; and
investments at fixed rates – the fair value of the assets will fall.
Borrowings are not carried at fair value on the Balance Sheet, so nominal gains and losses on fixed rate borrowings would not impact on the Comprehensive Income and Expenditure Statement. However, changes in interest payable and receivable on variable rate borrowings and investments will be posted to the Comprehensive Income and Expenditure Statement and affect the General Fund Balance, subject to influences from Government grants. Movements in the fair value of fixed rate
31/03/11 31/03/12 £’000 £’000 15,297 Less than one year 20,645
0 Between one and two years 0 0 Between two and three years 0
449 More than three years 449 15,746 Total Investments 21,094
103
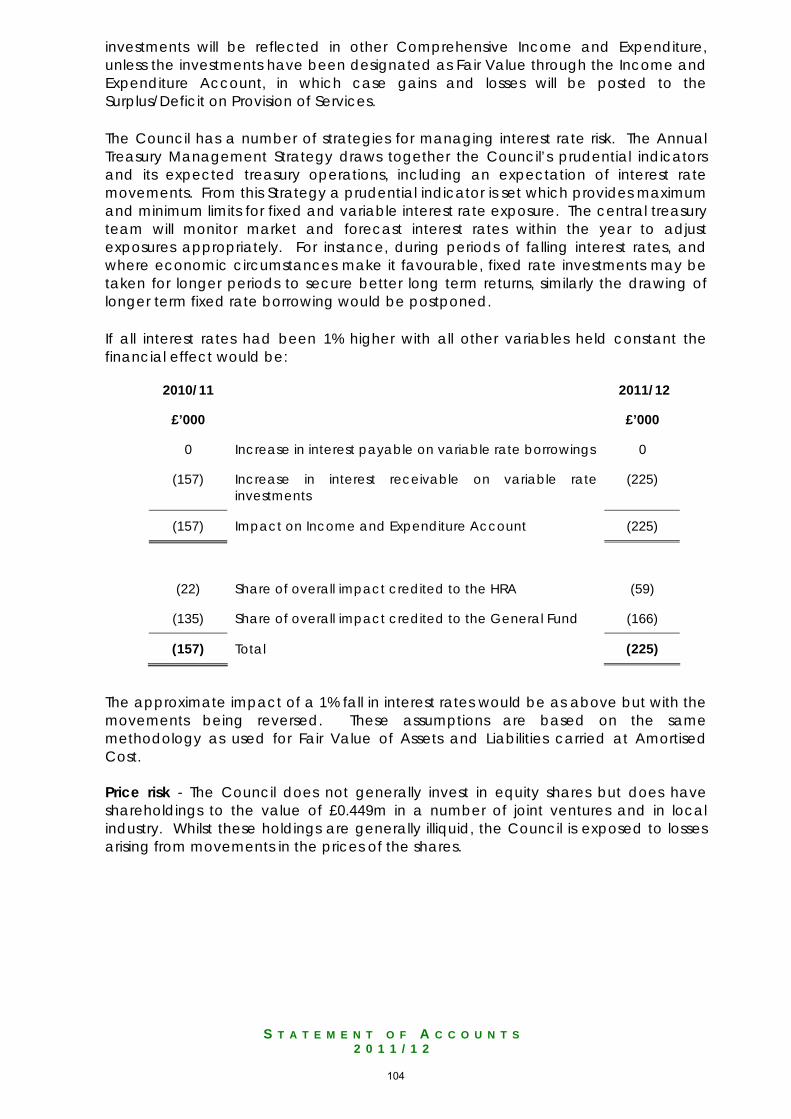
S T A T E M E N T O F A C C O U N T S
2 0 1 1 / 1 2
investments will be reflected in other Comprehensive Income and Expenditure, unless the investments have been designated as Fair Value through the Income and Expenditure Account, in which case gains and losses will be posted to the Surplus/Deficit on Provision of Services.
The Council has a number of strategies for managing interest rate risk. The Annual Treasury Management Strategy draws together the Council’s prudential indicators and its expected treasury operations, including an expectation of interest rate movements. From this Strategy a prudential indicator is set which provides maximum and minimum limits for fixed and variable interest rate exposure. The central treasury team will monitor market and forecast interest rates within the year to adjust exposures appropriately. For instance, during periods of falling interest rates, and where economic circumstances make it favourable, fixed rate investments may be taken for longer periods to secure better long term returns, similarly the drawing of longer term fixed rate borrowing would be postponed.
If all interest rates had been 1% higher with all other variables held constant the financial effect would be:
2010/11 2011/12
£’000 £’000
0 Increase in interest payable on variable rate borrowings 0
(157) Increase in interest receivable on variable rate investments
(225)
(157) Impact on Income and Expenditure Account (225)
(22) Share of overall impact credited to the HRA (59)
(135) Share of overall impact credited to the General Fund (166)
(157) Total (225)
The approximate impact of a 1% fall in interest rates would be as above but with the movements being reversed. These assumptions are based on the same methodology as used for Fair Value of Assets and Liabilities carried at Amortised Cost.
Price risk - The Council does not generally invest in equity shares but does have shareholdings to the value of £0.449m in a number of joint ventures and in local industry. Whilst these holdings are generally illiquid, the Council is exposed to losses arising from movements in the prices of the shares.
104
S T A T E M E N T O F A C C O U N T S
2 0 1 1 / 1 2
As the shareholdings have arisen in the acquisition of specific interests, the Council is not in a position to limit its exposure to price movements by diversifying its portfolio. The majority of the shareholdings are in the Dunham Bridge Company (£0.430m) and Investors in Lincoln (£0.014m). A representative of the Council sits on the Investors in Lincoln Board, enabling the Council to monitor factors that might cause a fall in the value of specific shareholdings.
The shares are all classified as Available-for-Sale, meaning that all movements in price will impact on gains and losses recognised in Other Comprehensive Income and Expenditure.
Foreign exchange risk - The Council has no financial assets or liabilities denominated in foreign currencies. It therefore has no exposure to loss arising from movements in exchange rates.
Note 47 – Heritage Assets: Summary of Transactions Transitional information on heritage assets is presented from 1 April 2010 onwards. Previous accounting rules do not require this disclosure and information on these transitions is not available for periods earlier than April 2010. There have been no additions or disposals of heritage assets since 1 April 2010. All Heritage assets recognised in the Balance Sheet at 1 April 2010 had been held by the Council for in excess of five years. Note 48 – Heritage Assets: Change in Accounting Policy Required by the Code of Practice for Local Authority Accounting in the United Kingdom
The code introduced a change to the treatment in accounting for heritage assets held by the Council. As set out in the Council’s accounting policies, the Council now requires heritage assets to be carried in the Balance Sheet at valuation.
For 2011/12 the Council is required to change its accounting policy for heritage assets and recognise them at valuation. Previously, heritage assets were recognised as community assets (at cost) in the property, plant and equipment classification in the Balance Sheet or were not recognised in the Balance Sheet as it was not possible to obtain cost information on the assets. Community Assets (that are now to be classed as heritage assets) that were donated to the Council were held at valuation as a proxy for historical cost. The Council’s accounting policies for recognition and measurement of heritage assets are set out in the Council’s Accounting Policies in note 1.
The Council will recognise an additional £4.667m for the value of heritage assets that were not previously recognised in the Balance Sheet. Of this, £4.652m has been recognised in the Revaluation Reserve. The remaining £0.015m relates to the fair value of the donated asset at acquisition and has been recognised in the Capital Adjustment Account. The 1 April 2010 and 31 March 2011 Balance Sheets and the 2010/11 comparative figures have been restated in the 2011/12 Statement of Accounts to apply the new policy.
105
S T A T E M E N T O F A C C O U N T S
2 0 1 1 / 1 2
The effects of the restatements are as follows:
• At 1 April 2010 the carrying amount of heritage assets is presented as its valuation of £4.667m. None of these assets had been previously recognised in property, plant and equipment. The Revaluation Reserve has been increased by £4.652m and £0.015m has been credited to the Capital Adjustment Account
• The fully restated 1 April 2010 Balance Sheet is provided on page 21. The adjustments that have been made to the Balance Sheet over the previously published version in the 2010/11 Statement of Accounts are as follows:
Effect on Opening Balance Sheet 1 April 2010
Opening balances as at 1/04/10
Restatement
Restatement required to
opening balances as
at 1 April 2010
£000 £000 £000 Property ,Plant & Equipment 306,427 0 306,427 Heritage Assets 0 4,667 4,667
Long –term assets 337,920 4,667 342,587
Total Net Assets 221,462 4,667 226,129 Unusable Reserves (200,787) (4,667) (205,454)
Total Reserves (221,462) (4,667) (226,129)
• The restatement of the relevant lines in the Movement in Reserves Statement as at 31 March 2011, as a result of the application of this new accounting policy is presented below:
106
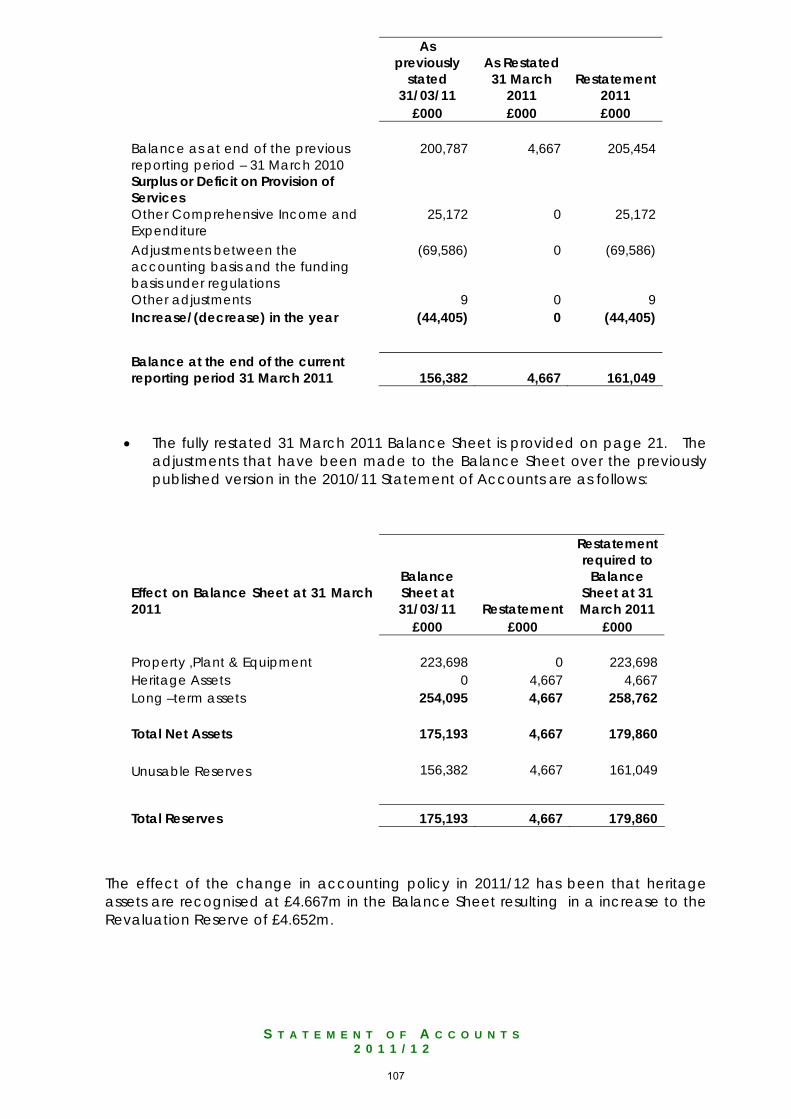
S T A T E M E N T O F A C C O U N T S
2 0 1 1 / 1 2
As previously
stated 31/03/11
As Restated 31 March
2011 Restatement
2011 £000 £000 £000 Balance as at end of the previous reporting period – 31 March 2010
200,787 4,667 205,454
Surplus or Deficit on Provision of Services
Other Comprehensive Income and Expenditure
25,172 0 25,172
Adjustments between the accounting basis and the funding basis under regulations
(69,586) 0 (69,586)
Other adjustments 9 0 9 Increase/(decrease) in the year (44,405) 0 (44,405)
Balance at the end of the current reporting period 31 March 2011 156,382 4,667 161,049
• The fully restated 31 March 2011 Balance Sheet is provided on page 21. The adjustments that have been made to the Balance Sheet over the previously published version in the 2010/11 Statement of Accounts are as follows:
Effect on Balance Sheet at 31 March 2011
Balance Sheet at 31/03/11 Restatement
Restatement required to
Balance Sheet at 31 March 2011
£000 £000 £000 Property ,Plant & Equipment 223,698 0 223,698 Heritage Assets 0 4,667 4,667 Long –term assets 254,095 4,667 258,762
Total Net Assets 175,193 4,667 179,860 Unusable Reserves 156,382 4,667 161,049
Total Reserves 175,193 4,667 179,860
The effect of the change in accounting policy in 2011/12 has been that heritage assets are recognised at £4.667m in the Balance Sheet resulting in a increase to the Revaluation Reserve of £4.652m.
107
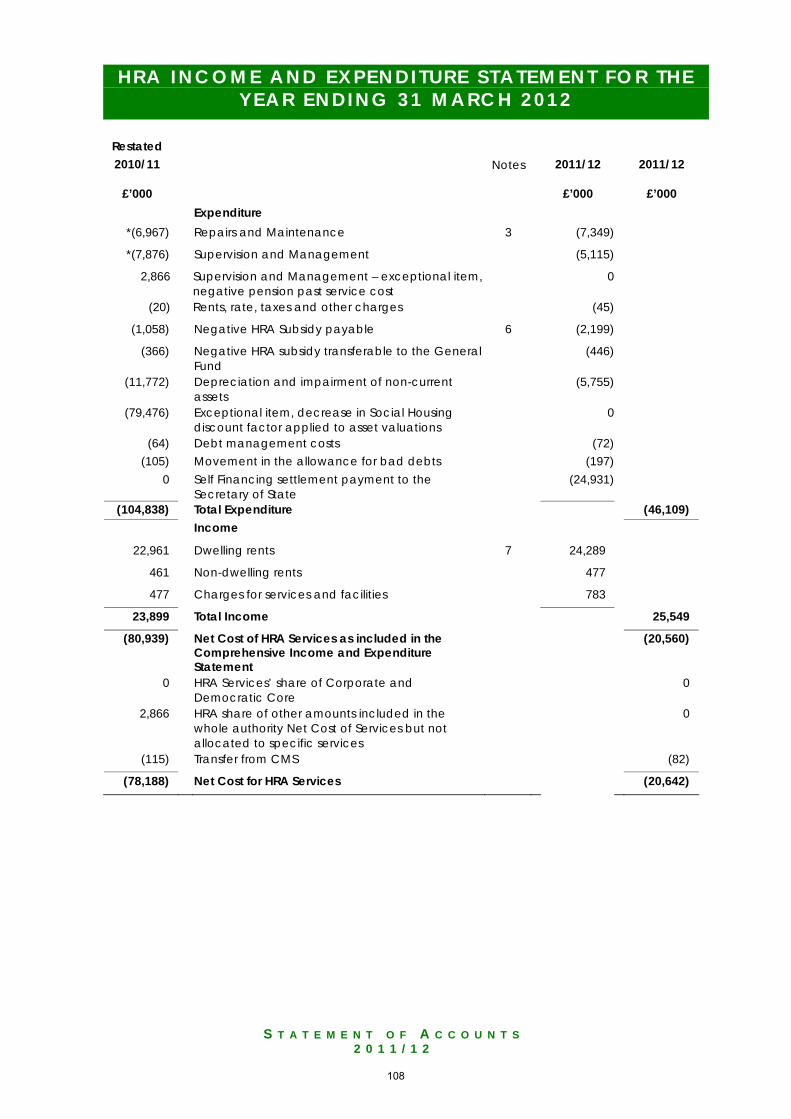
S T A T E M E N T O F A C C O U N T S
2 0 1 1 / 1 2
H R A I N C O M E A N D E X P E N D I T U R E S T A T E M E N T F O R T H E Y E A R E N D I N G 3 1 M A R C H 2 0 1 2
Restated 2010/11
Notes 2011/12 2011/12
£’000 £’000 £’000 Expenditure
*(6,967) Repairs and Maintenance 3 (7,349)
*(7,876) Supervision and Management (5,115)
2,866 Supervision and Management – exceptional item, negative pension past service cost
0
(20) Rents, rate, taxes and other charges (45)
(1,058) Negative HRA Subsidy payable 6 (2,199)
(366) Negative HRA subsidy transferable to the General Fund
(446)
(11,772) Depreciation and impairment of non-current assets
(5,755)
(79,476) Exceptional item, decrease in Social Housing discount factor applied to asset valuations
0
(64) Debt management costs (72) (105) Movement in the allowance for bad debts (197)
0 Self Financing settlement payment to the Secretary of State
(24,931)
(104,838) Total Expenditure (46,109) Income
22,961 Dwelling rents 7 24,289
461 Non-dwelling rents 477
477 Charges for services and facilities 783
23,899 Total Income 25,549
(80,939) Net Cost of HRA Services as included in the Comprehensive Income and Expenditure Statement
(20,560)
0 HRA Services’ share of Corporate and Democratic Core
0
2,866 HRA share of other amounts included in the whole authority Net Cost of Services but not allocated to specific services
0
(115) Transfer from CMS (82)
(78,188) Net Cost for HRA Services (20,642)
108
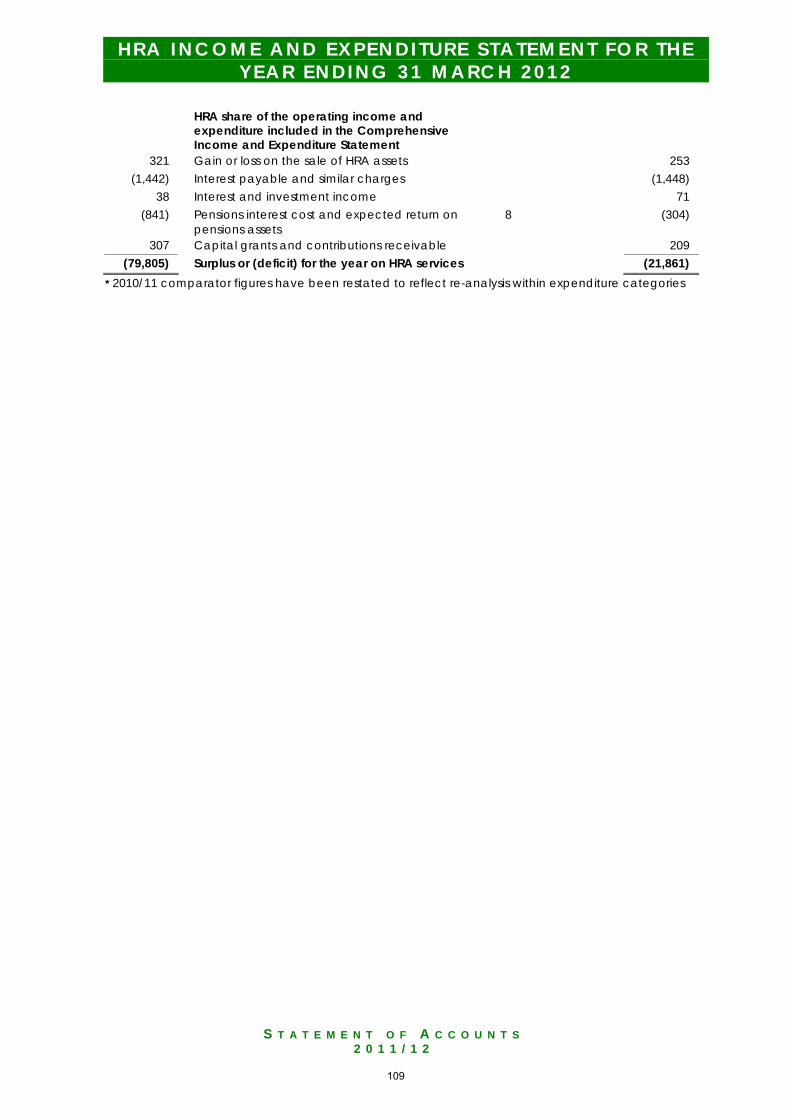
S T A T E M E N T O F A C C O U N T S
2 0 1 1 / 1 2
H R A I N C O M E A N D E X P E N D I T U R E S T A T E M E N T F O R T H E Y E A R E N D I N G 3 1 M A R C H 2 0 1 2
HRA share of the operating income and expenditure included in the Comprehensive Income and Expenditure Statement
321 Gain or loss on the sale of HRA assets 253 (1,442) Interest payable and similar charges (1,448)
38 Interest and investment income 71 (841) Pensions interest cost and expected return on
pensions assets 8 (304)
307 Capital grants and contributions receivable 209 (79,805) Surplus or (deficit) for the year on HRA services (21,861)
* 2010/11 comparator figures have been restated to reflect re-analysis within expenditure categories
109
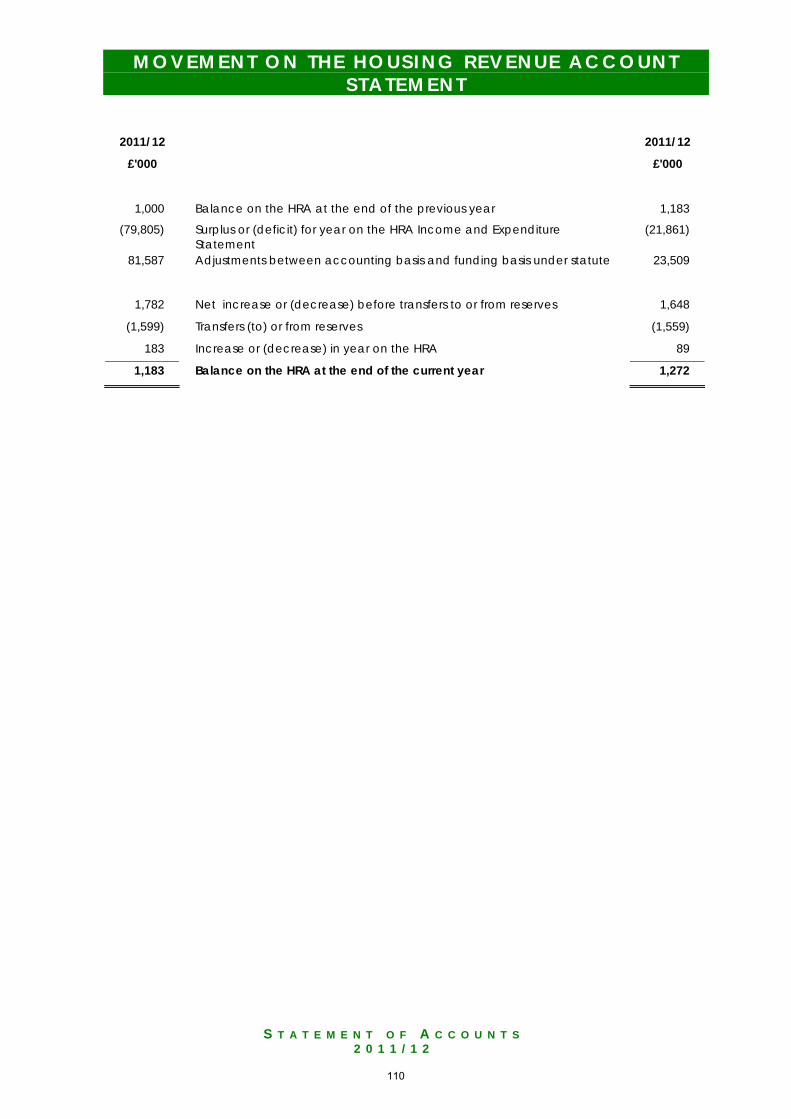
S T A T E M E N T O F A C C O U N T S
2 0 1 1 / 1 2
M O V E M E N T O N T H E H O U S I N G R E V E N U E A C C O U N T S T A T E M E N T
2011/12 2011/12
£'000 £'000
1,000 Balance on the HRA at the end of the previous year 1,183
(79,805) Surplus or (deficit) for year on the HRA Income and Expenditure Statement
(21,861)
81,587 Adjustments between accounting basis and funding basis under statute 23,509
1,782 Net increase or (decrease) before transfers to or from reserves 1,648
(1,599) Transfers (to) or from reserves (1,559)
183 Increase or (decrease) in year on the HRA 89
1,183 Balance on the HRA at the end of the current year 1,272
110
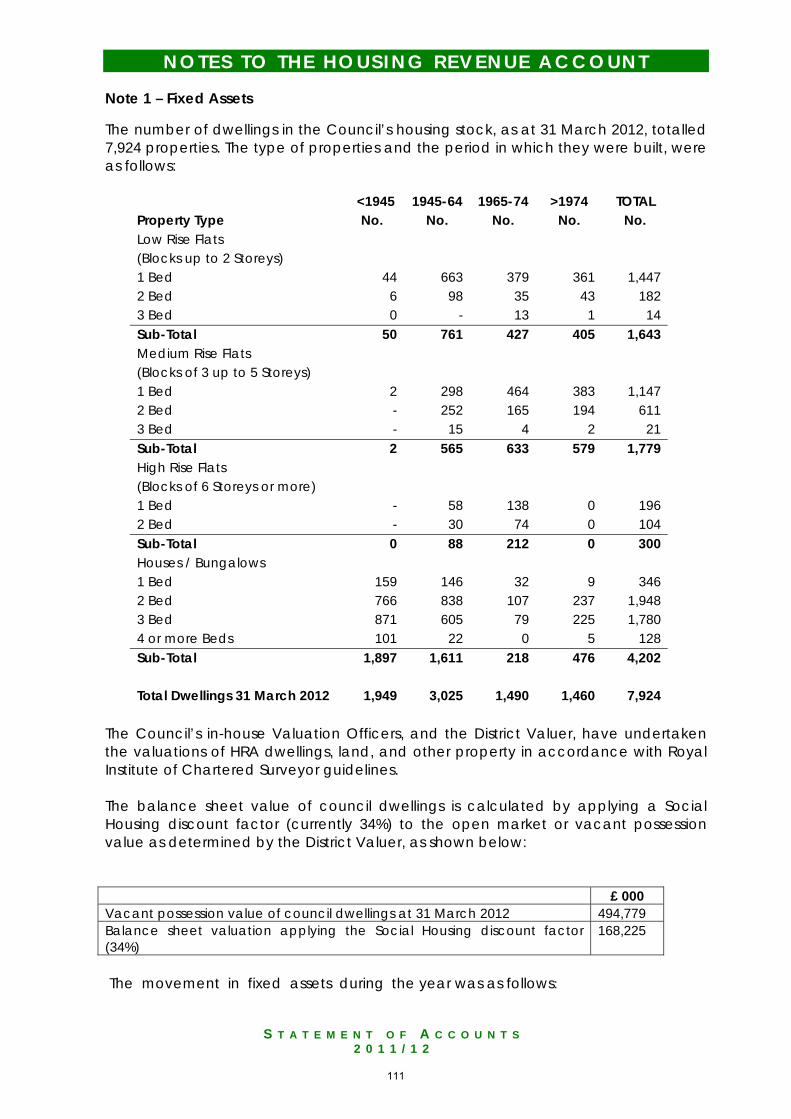
S T A T E M E N T O F A C C O U N T S
2 0 1 1 / 1 2
N O T E S T O T H E H O U S I N G R E V E N U E A C C O U N T Note 1 – Fixed Assets The number of dwellings in the Council’s housing stock, as at 31 March 2012, totalled 7,924 properties. The type of properties and the period in which they were built, were as follows:
<1945 1945-64 1965-74 >1974 TOTAL Property Type No. No. No. No. No. Low Rise Flats (Blocks up to 2 Storeys) 1 Bed 44 663 379 361 1,447 2 Bed 6 98 35 43 182 3 Bed 0 - 13 1 14 Sub-Total 50 761 427 405 1,643 Medium Rise Flats (Blocks of 3 up to 5 Storeys) 1 Bed 2 298 464 383 1,147 2 Bed - 252 165 194 611 3 Bed - 15 4 2 21 Sub-Total 2 565 633 579 1,779 High Rise Flats (Blocks of 6 Storeys or more) 1 Bed - 58 138 0 196 2 Bed - 30 74 0 104 Sub-Total 0 88 212 0 300 Houses / Bungalows 1 Bed 159 146 32 9 346 2 Bed 766 838 107 237 1,948 3 Bed 871 605 79 225 1,780 4 or more Beds 101 22 0 5 128 Sub-Total 1,897 1,611 218 476 4,202 Total Dwellings 31 March 2012 1,949 3,025 1,490 1,460 7,924
The Council’s in-house Valuation Officers, and the District Valuer, have undertaken the valuations of HRA dwellings, land, and other property in accordance with Royal Institute of Chartered Surveyor guidelines. The balance sheet value of council dwellings is calculated by applying a Social Housing discount factor (currently 34%) to the open market or vacant possession value as determined by the District Valuer, as shown below: £ 000 Vacant possession value of council dwellings at 31 March 2012 494,779 Balance sheet valuation applying the Social Housing discount factor (34%)
168,225
The movement in fixed assets during the year was as follows:
111
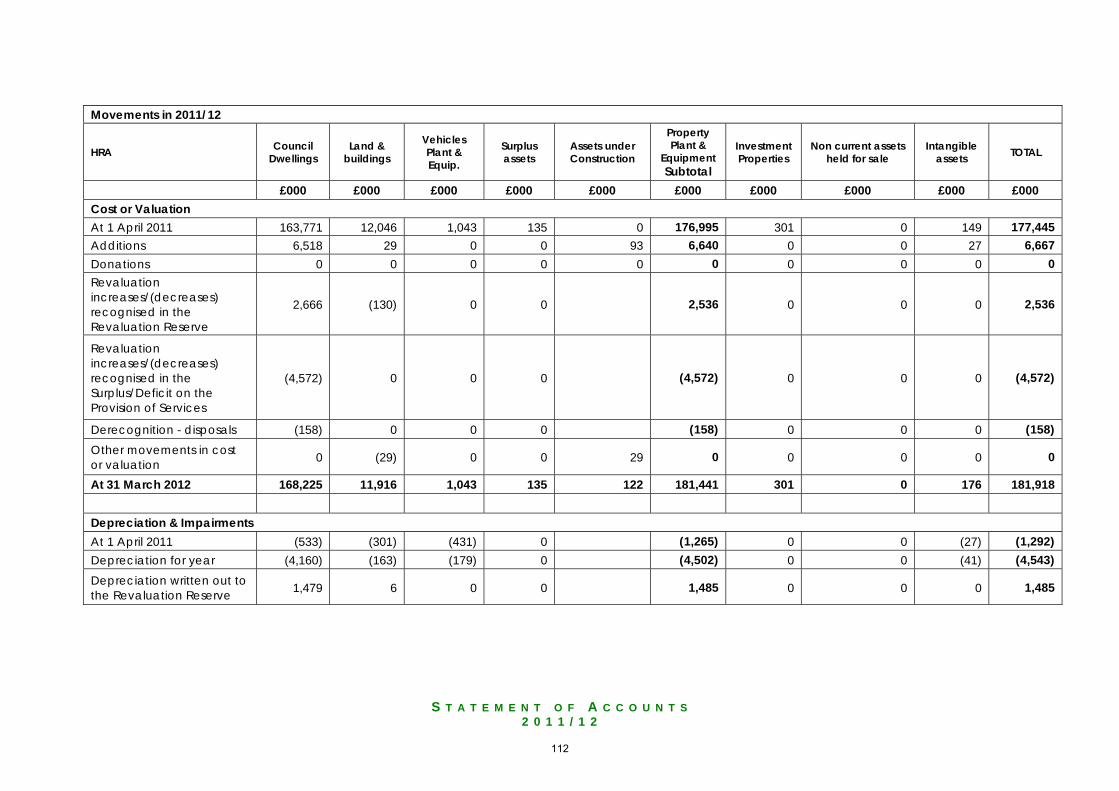
S T A T E M E N T O F A C C O U N T S
2 0 1 1 / 1 2
Movements in 2011/12
HRA Council Dwellings
Land & buildings
Vehicles Plant & Equip.
Surplus assets
Assets under Construction
Property Plant &
Equipment Subtotal
Investment Properties
Non current assets held for sale
Intangible assets TOTAL
£000 £000 £000 £000 £000 £000 £000 £000 £000 £000 Cost or Valuation At 1 April 2011 163,771 12,046 1,043 135 0 176,995 301 0 149 177,445 Additions 6,518 29 0 0 93 6,640 0 0 27 6,667 Donations 0 0 0 0 0 0 0 0 0 0 Revaluation increases/(decreases) recognised in the Revaluation Reserve
2,666 (130) 0 0 2,536 0 0 0 2,536
Revaluation increases/(decreases) recognised in the Surplus/Deficit on the Provision of Services
(4,572) 0 0 0 (4,572) 0 0 0 (4,572)
Derecognition - disposals (158) 0 0 0 (158) 0 0 0 (158) Other movements in cost or valuation 0 (29) 0 0 29 0 0 0 0 0
At 31 March 2012 168,225 11,916 1,043 135 122 181,441 301 0 176 181,918 Depreciation & Impairments At 1 April 2011 (533) (301) (431) 0 (1,265) 0 0 (27) (1,292) Depreciation for year (4,160) (163) (179) 0 (4,502) 0 0 (41) (4,543) Depreciation written out to the Revaluation Reserve 1,479 6 0 0 1,485 0 0 0 1,485
112
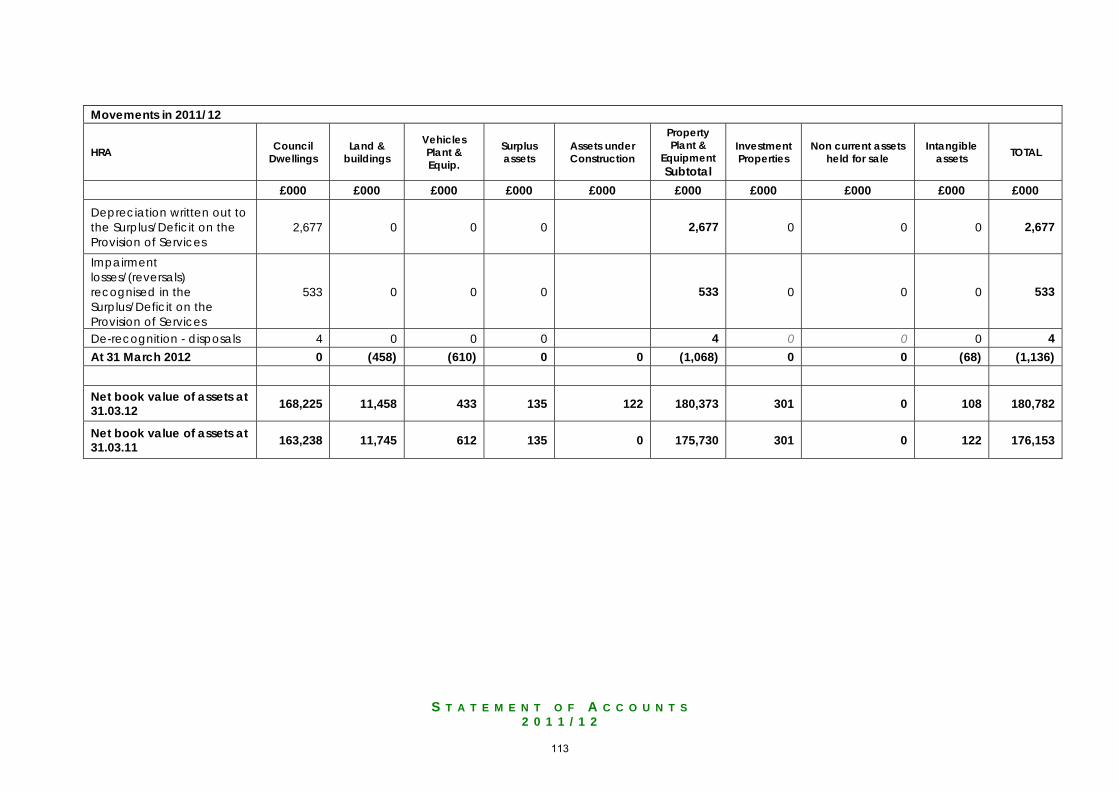
S T A T E M E N T O F A C C O U N T S
2 0 1 1 / 1 2
Movements in 2011/12
HRA Council Dwellings
Land & buildings
Vehicles Plant & Equip.
Surplus assets
Assets under Construction
Property Plant &
Equipment Subtotal
Investment Properties
Non current assets held for sale
Intangible assets TOTAL
£000 £000 £000 £000 £000 £000 £000 £000 £000 £000
Depreciation written out to the Surplus/Deficit on the Provision of Services
2,677 0 0 0 2,677 0 0 0 2,677
Impairment losses/(reversals) recognised in the Surplus/Deficit on the Provision of Services
533 0 0 0 533 0 0 0 533
De-recognition - disposals 4 0 0 0 4 0 0 0 4 At 31 March 2012 0 (458) (610) 0 0 (1,068) 0 0 (68) (1,136) Net book value of assets at 31.03.12 168,225 11,458 433 135 122 180,373 301 0 108 180,782
Net book value of assets at 31.03.11 163,238 11,745 612 135 0 175,730 301 0 122 176,153
113
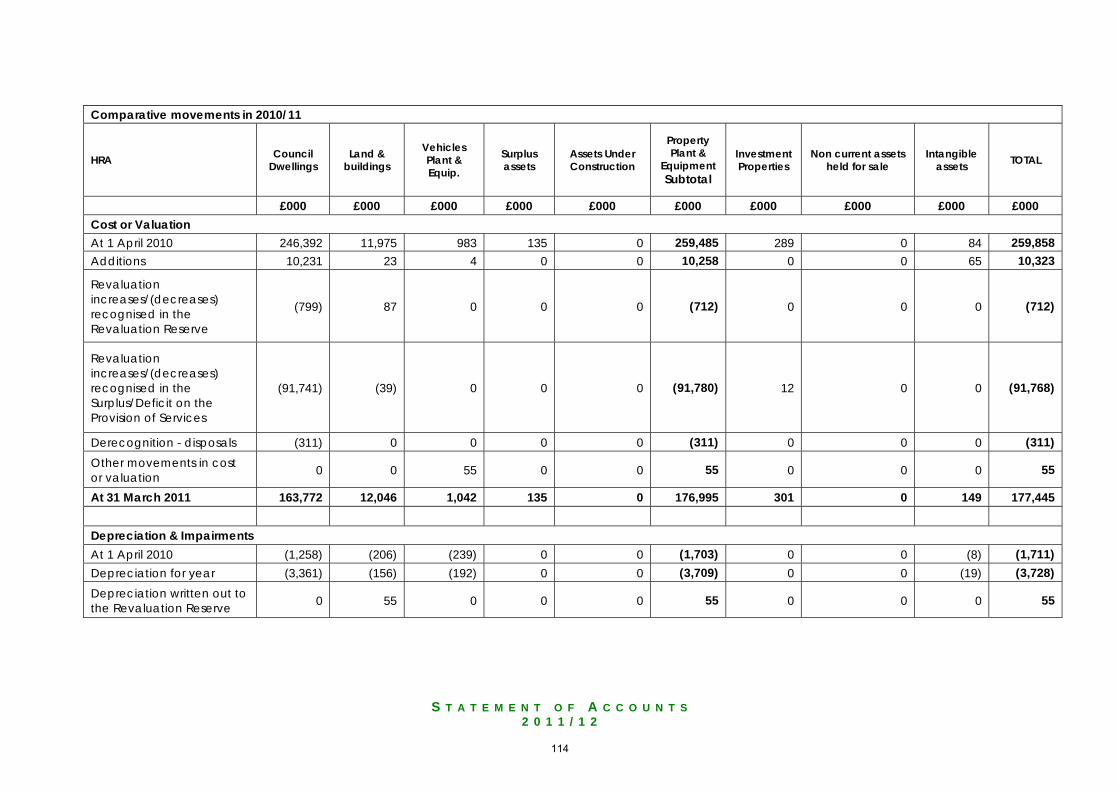
S T A T E M E N T O F A C C O U N T S
2 0 1 1 / 1 2
Comparative movements in 2010/11
HRA Council Dwellings
Land & buildings
Vehicles Plant & Equip.
Surplus assets
Assets Under Construction
Property Plant &
Equipment Subtotal
Investment Properties
Non current assets held for sale
Intangible assets TOTAL
£000 £000 £000 £000 £000 £000 £000 £000 £000 £000 Cost or Valuation At 1 April 2010 246,392 11,975 983 135 0 259,485 289 0 84 259,858 Additions 10,231 23 4 0 0 10,258 0 0 65 10,323
Revaluation increases/(decreases) recognised in the Revaluation Reserve
(799) 87 0 0 0 (712) 0 0 0 (712)
Revaluation increases/(decreases) recognised in the Surplus/Deficit on the Provision of Services
(91,741) (39) 0 0 0 (91,780) 12 0 0 (91,768)
Derecognition - disposals (311) 0 0 0 0 (311) 0 0 0 (311) Other movements in cost or valuation 0 0 55 0 0 55 0 0 0 55
At 31 March 2011 163,772 12,046 1,042 135 0 176,995 301 0 149 177,445 Depreciation & Impairments At 1 April 2010 (1,258) (206) (239) 0 0 (1,703) 0 0 (8) (1,711) Depreciation for year (3,361) (156) (192) 0 0 (3,709) 0 0 (19) (3,728) Depreciation written out to the Revaluation Reserve 0 55 0 0 0 55 0 0 0 55
114
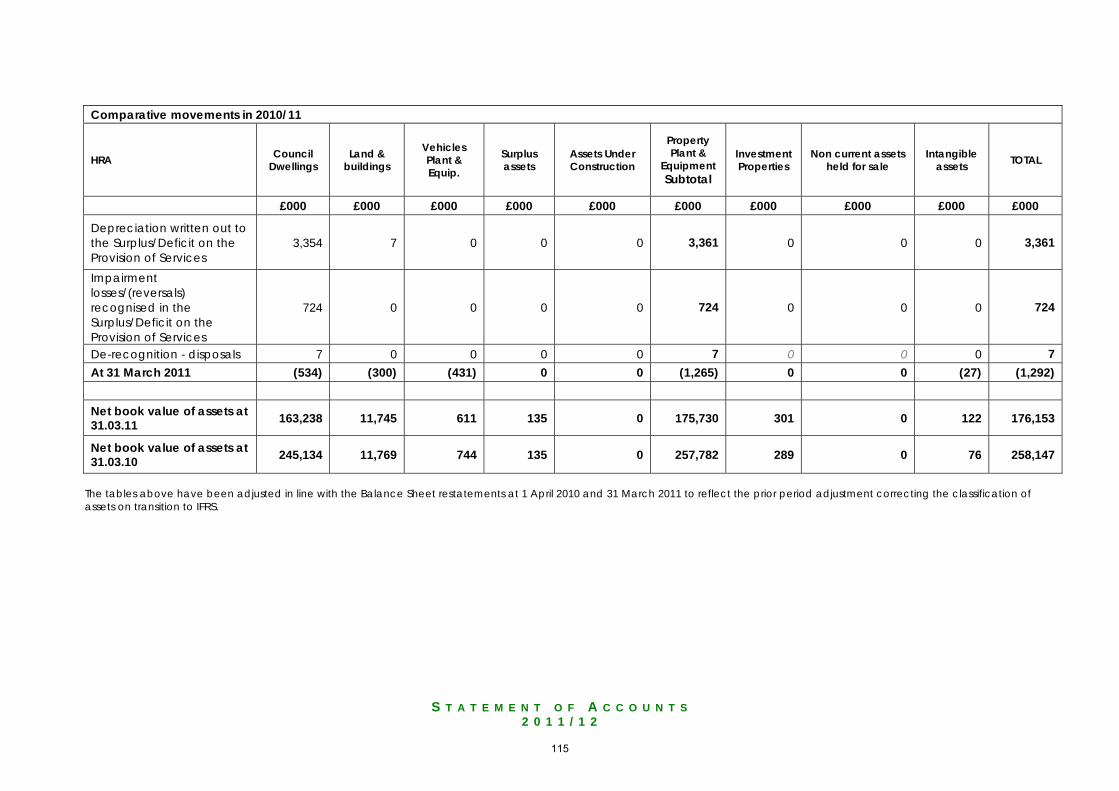
S T A T E M E N T O F A C C O U N T S
2 0 1 1 / 1 2
Comparative movements in 2010/11
HRA Council Dwellings
Land & buildings
Vehicles Plant & Equip.
Surplus assets
Assets Under Construction
Property Plant &
Equipment Subtotal
Investment Properties
Non current assets held for sale
Intangible assets TOTAL
£000 £000 £000 £000 £000 £000 £000 £000 £000 £000
Depreciation written out to the Surplus/Deficit on the Provision of Services
3,354 7 0 0 0 3,361 0 0 0 3,361
Impairment losses/(reversals) recognised in the Surplus/Deficit on the Provision of Services
724 0 0 0 0 724 0 0 0 724
De-recognition - disposals 7 0 0 0 0 7 0 0 0 7 At 31 March 2011 (534) (300) (431) 0 0 (1,265) 0 0 (27) (1,292) Net book value of assets at 31.03.11 163,238 11,745 611 135 0 175,730 301 0 122 176,153
Net book value of assets at 31.03.10 245,134 11,769 744 135 0 257,782 289 0 76 258,147
The tables above have been adjusted in line with the Balance Sheet restatements at 1 April 2010 and 31 March 2011 to reflect the prior period adjustment correcting the classification of assets on transition to IFRS.
115
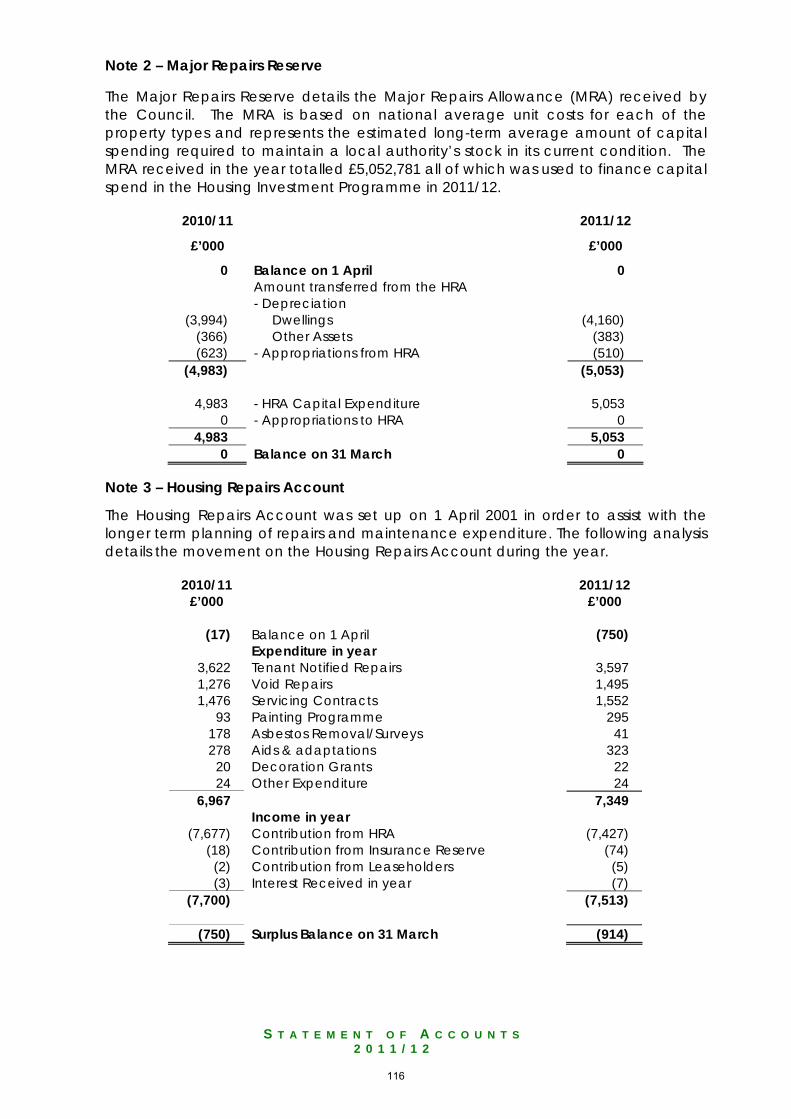
S T A T E M E N T O F A C C O U N T S
2 0 1 1 / 1 2
Note 2 – Major Repairs Reserve The Major Repairs Reserve details the Major Repairs Allowance (MRA) received by the Council. The MRA is based on national average unit costs for each of the property types and represents the estimated long-term average amount of capital spending required to maintain a local authority’s stock in its current condition. The MRA received in the year totalled £5,052,781 all of which was used to finance capital spend in the Housing Investment Programme in 2011/12.
2010/11 2011/12
£’000 £’000
0 Balance on 1 April 0 Amount transferred from the HRA - Depreciation
(3,994) Dwellings (4,160) (366) Other Assets (383) (623) - Appropriations from HRA (510)
(4,983) (5,053)
4,983 - HRA Capital Expenditure 5,053 0 - Appropriations to HRA 0
4,983 5,053 0 Balance on 31 March 0
Note 3 – Housing Repairs Account
The Housing Repairs Account was set up on 1 April 2001 in order to assist with the longer term planning of repairs and maintenance expenditure. The following analysis details the movement on the Housing Repairs Account during the year.
2010/11 2011/12 £’000 £’000
(17) Balance on 1 April (750)
Expenditure in year 3,622 Tenant Notified Repairs 3,597 1,276 Void Repairs 1,495 1,476 Servicing Contracts 1,552
93 Painting Programme 295 178 Asbestos Removal/Surveys 41 278 Aids & adaptations 323
20 Decoration Grants 22 24 Other Expenditure 24
6,967 7,349 Income in year
(7,677) Contribution from HRA (7,427) (18) Contribution from Insurance Reserve (74)
(2) Contribution from Leaseholders (5) (3) Interest Received in year (7)
(7,700) (7,513)
(750) Surplus Balance on 31 March (914)
116
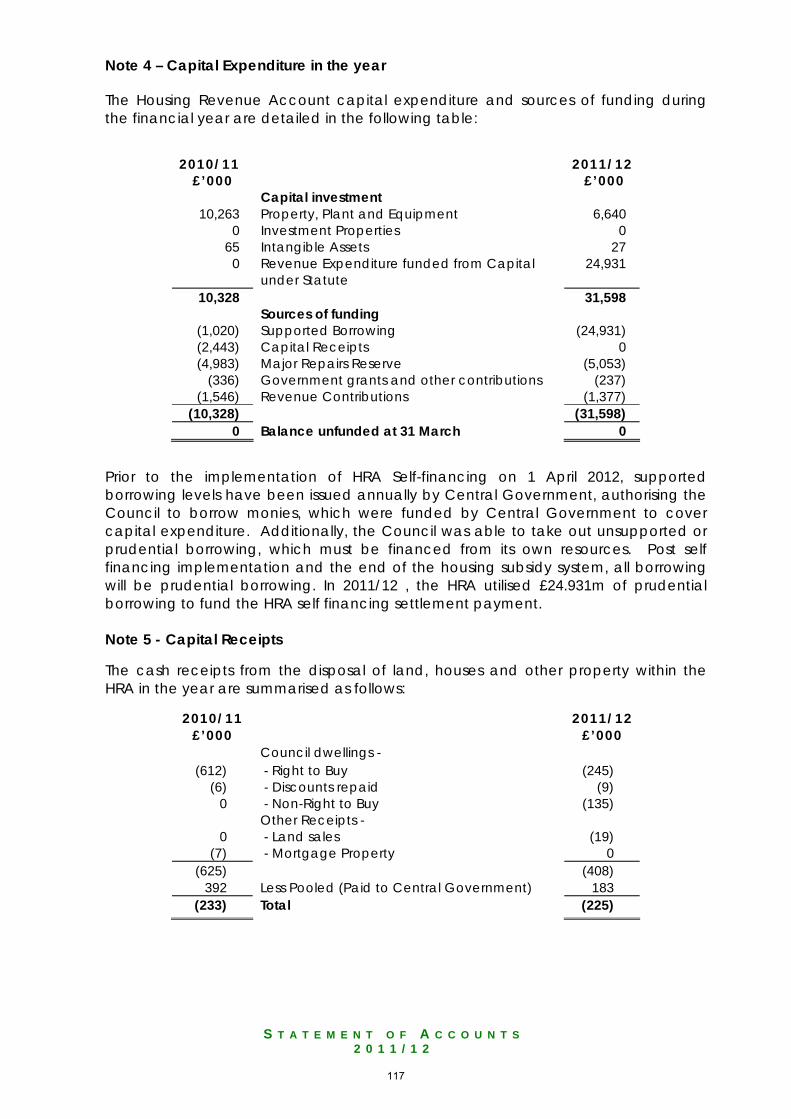
S T A T E M E N T O F A C C O U N T S
2 0 1 1 / 1 2
Note 4 – Capital Expenditure in the year The Housing Revenue Account capital expenditure and sources of funding during the financial year are detailed in the following table:
2010/11 2011/12 £’000 £’000
Capital investment 10,263 Property, Plant and Equipment 6,640
0 Investment Properties 0 65 Intangible Assets 27
0 Revenue Expenditure funded from Capital under Statute
24,931
10,328 31,598 Sources of funding
(1,020) Supported Borrowing (24,931) (2,443) Capital Receipts 0 (4,983) Major Repairs Reserve (5,053)
(336) Government grants and other contributions (237) (1,546) Revenue Contributions (1,377)
(10,328) (31,598) 0 Balance unfunded at 31 March 0
Prior to the implementation of HRA Self-financing on 1 April 2012, supported borrowing levels have been issued annually by Central Government, authorising the Council to borrow monies, which were funded by Central Government to cover capital expenditure. Additionally, the Council was able to take out unsupported or prudential borrowing, which must be financed from its own resources. Post self financing implementation and the end of the housing subsidy system, all borrowing will be prudential borrowing. In 2011/12 , the HRA utilised £24.931m of prudential borrowing to fund the HRA self financing settlement payment. Note 5 - Capital Receipts The cash receipts from the disposal of land, houses and other property within the HRA in the year are summarised as follows:
2010/11 2011/12 £’000 £’000
Council dwellings - (612) - Right to Buy (245)
(6) - Discounts repaid (9) 0 - Non-Right to Buy (135)
Other Receipts - 0 - Land sales (19)
(7) - Mortgage Property 0 (625) (408)
392 Less Pooled (Paid to Central Government) 183 (233) Total (225)
117
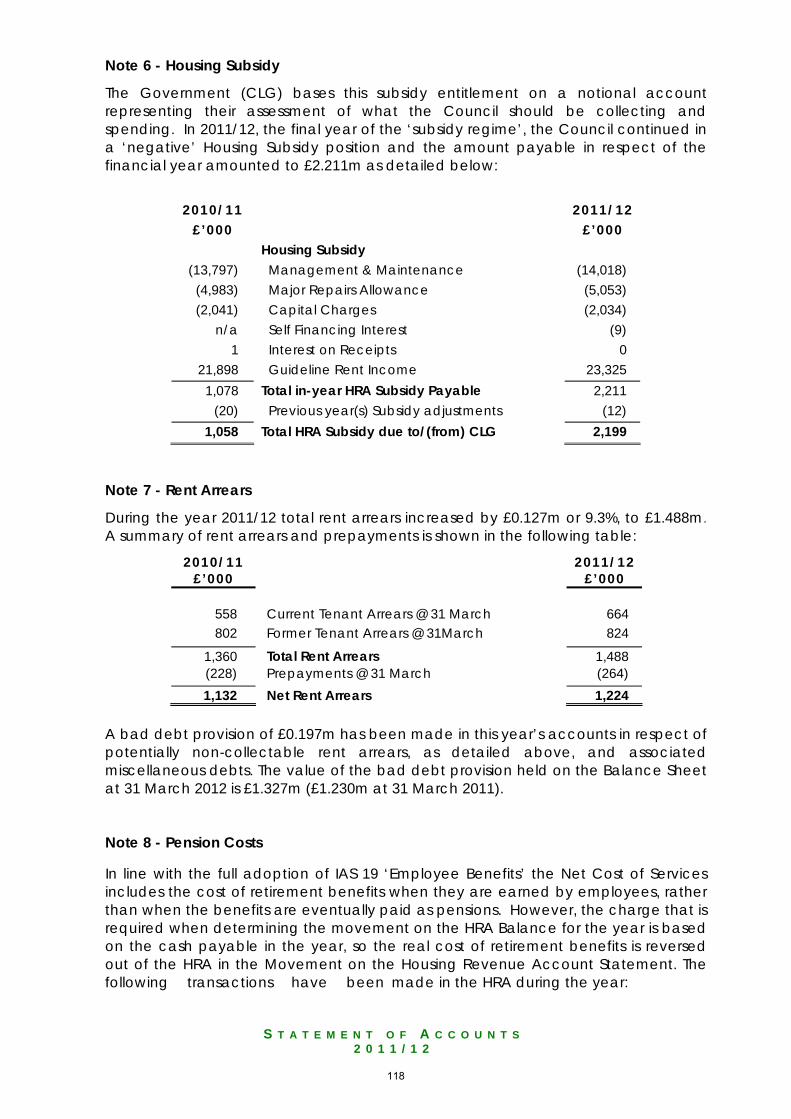
S T A T E M E N T O F A C C O U N T S
2 0 1 1 / 1 2
Note 6 - Housing Subsidy
The Government (CLG) bases this subsidy entitlement on a notional account representing their assessment of what the Council should be collecting and spending. In 2011/12, the final year of the ‘subsidy regime’, the Council continued in a ‘negative’ Housing Subsidy position and the amount payable in respect of the financial year amounted to £2.211m as detailed below:
2010/11 2011/12 £’000 £’000
Housing Subsidy (13,797) Management & Maintenance (14,018)
(4,983) Major Repairs Allowance (5,053) (2,041) Capital Charges (2,034)
n/a Self Financing Interest (9) 1 Interest on Receipts 0
21,898 Guideline Rent Income 23,325 1,078 Total in-year HRA Subsidy Payable 2,211
(20) Previous year(s) Subsidy adjustments (12) 1,058 Total HRA Subsidy due to/(from) CLG 2,199
Note 7 - Rent Arrears
During the year 2011/12 total rent arrears increased by £0.127m or 9.3%, to £1.488m. A summary of rent arrears and prepayments is shown in the following table:
2010/11 2011/12 £’000 £’000
558 Current Tenant Arrears @ 31 March 664 802 Former Tenant Arrears @ 31March 824
1,360 Total Rent Arrears 1,488 (228) Prepayments @ 31 March (264) 1,132 Net Rent Arrears 1,224
A bad debt provision of £0.197m has been made in this year’s accounts in respect of potentially non-collectable rent arrears, as detailed above, and associated miscellaneous debts. The value of the bad debt provision held on the Balance Sheet at 31 March 2012 is £1.327m (£1.230m at 31 March 2011). Note 8 - Pension Costs In line with the full adoption of IAS 19 ‘Employee Benefits’ the Net Cost of Services includes the cost of retirement benefits when they are earned by employees, rather than when the benefits are eventually paid as pensions. However, the charge that is required when determining the movement on the HRA Balance for the year is based on the cash payable in the year, so the real cost of retirement benefits is reversed out of the HRA in the Movement on the Housing Revenue Account Statement. The following transactions have been made in the HRA during the year:
118
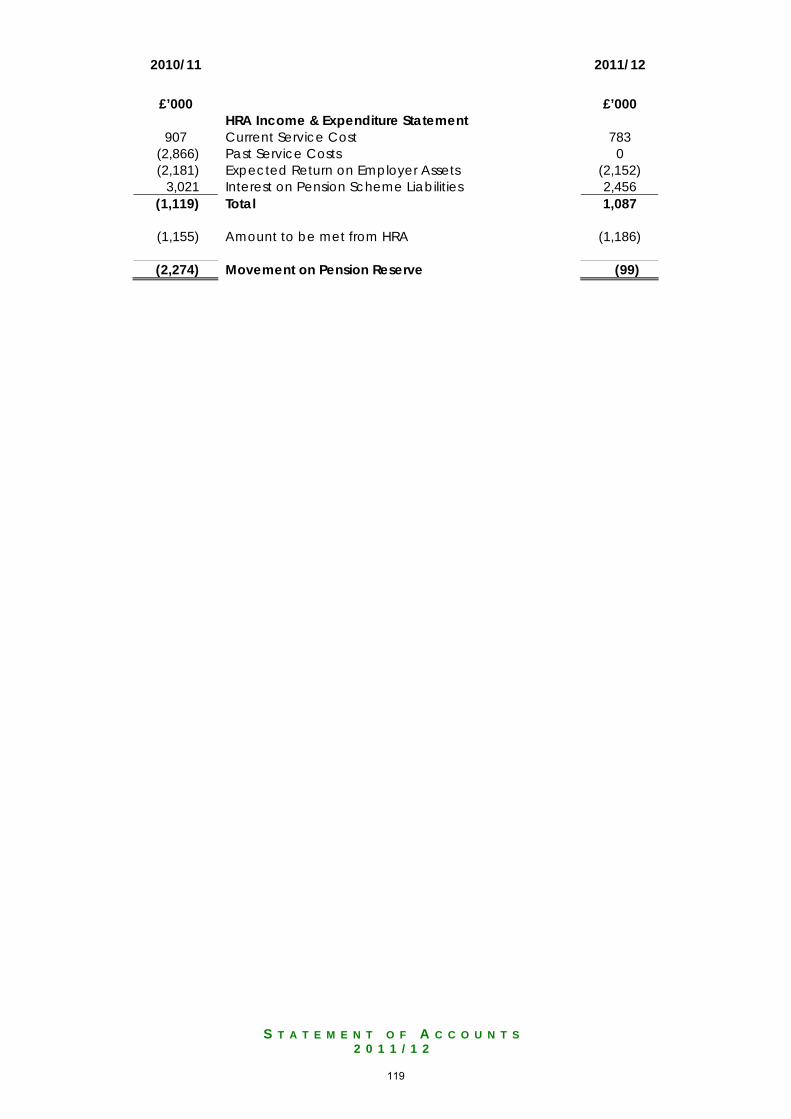
S T A T E M E N T O F A C C O U N T S
2 0 1 1 / 1 2
2010/11
2011/12
£’000 £’000 HRA Income & Expenditure Statement
907 Current Service Cost 783 (2,866) Past Service Costs 0 (2,181) Expected Return on Employer Assets (2,152)
3,021 Interest on Pension Scheme Liabilities 2,456 (1,119) Total
1,087
(1,155) Amount to be met from HRA
(1,186)
(2,274) Movement on Pension Reserve (99)
119
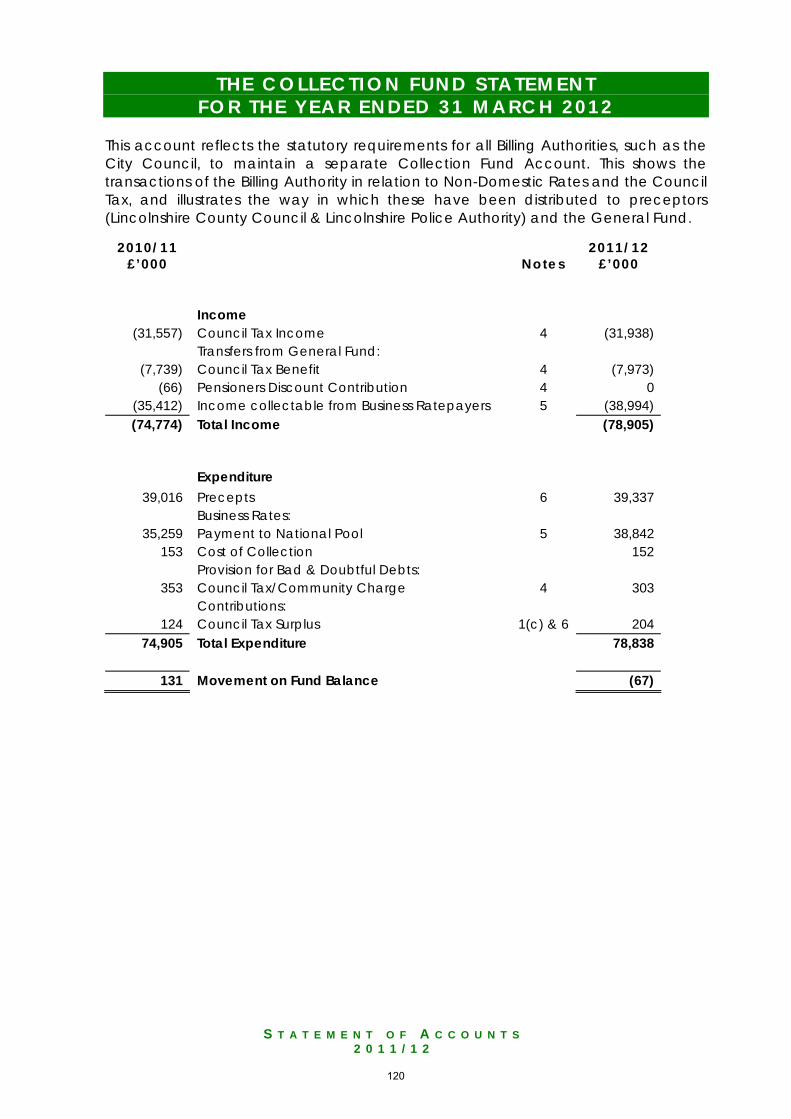
S T A T E M E N T O F A C C O U N T S
2 0 1 1 / 1 2
T H E C O L L E C T I O N F U N D S T A T E M E N T F O R T H E Y E A R E N D E D 3 1 M A R C H 2 0 1 2
This account reflects the statutory requirements for all Billing Authorities, such as the City Council, to maintain a separate Collection Fund Account. This shows the transactions of the Billing Authority in relation to Non-Domestic Rates and the Council Tax, and illustrates the way in which these have been distributed to preceptors (Lincolnshire County Council & Lincolnshire Police Authority) and the General Fund.
2010/11 £’000
Notes
2011/12 £’000
Income
(31,557) Council Tax Income 4 (31,938) Transfers from General Fund:
(7,739) Council Tax Benefit 4 (7,973) (66) Pensioners Discount Contribution 4 0
(35,412) Income collectable from Business Ratepayers 5 (38,994) (74,774) Total Income (78,905)
Expenditure
39,016 Precepts 6 39,337 Business Rates:
35,259 Payment to National Pool 5 38,842 153 Cost of Collection 152
Provision for Bad & Doubtful Debts: 353 Council Tax/Community Charge 4 303
Contributions: 124 Council Tax Surplus 1(c) & 6 204
74,905 Total Expenditure 78,838
131 Movement on Fund Balance (67)
120
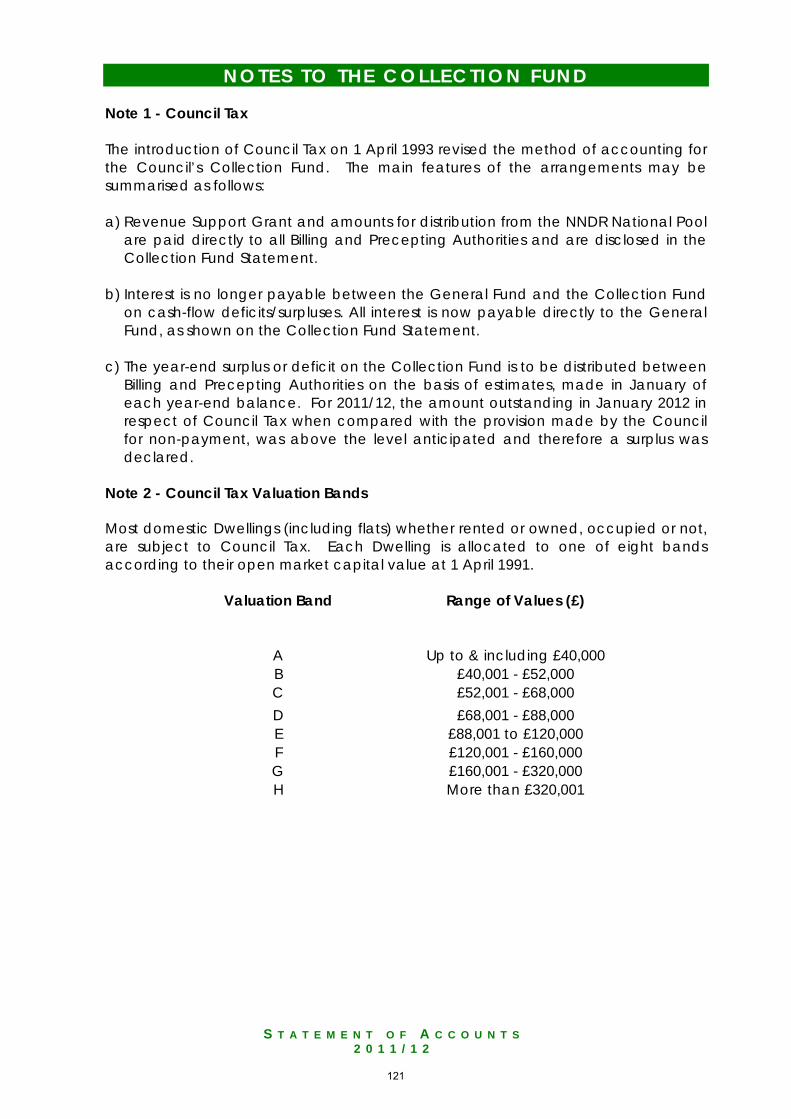
S T A T E M E N T O F A C C O U N T S
2 0 1 1 / 1 2
N O T E S T O T H E C O L L E C T I O N F U N D Note 1 - Council Tax The introduction of Council Tax on 1 April 1993 revised the method of accounting for the Council’s Collection Fund. The main features of the arrangements may be summarised as follows: a) Revenue Support Grant and amounts for distribution from the NNDR National Pool
are paid directly to all Billing and Precepting Authorities and are disclosed in the Collection Fund Statement.
b) Interest is no longer payable between the General Fund and the Collection Fund
on cash-flow deficits/surpluses. All interest is now payable directly to the General Fund, as shown on the Collection Fund Statement.
c) The year-end surplus or deficit on the Collection Fund is to be distributed between
Billing and Precepting Authorities on the basis of estimates, made in January of each year-end balance. For 2011/12, the amount outstanding in January 2012 in respect of Council Tax when compared with the provision made by the Council for non-payment, was above the level anticipated and therefore a surplus was declared.
Note 2 - Council Tax Valuation Bands Most domestic Dwellings (including flats) whether rented or owned, occupied or not, are subject to Council Tax. Each Dwelling is allocated to one of eight bands according to their open market capital value at 1 April 1991.
Valuation Band
Range of Values (£)
A Up to & including £40,000 B £40,001 - £52,000 C £52,001 - £68,000 D £68,001 - £88,000 E £88,001 to £120,000 F £120,001 - £160,000 G £160,001 - £320,000 H More than £320,001
121
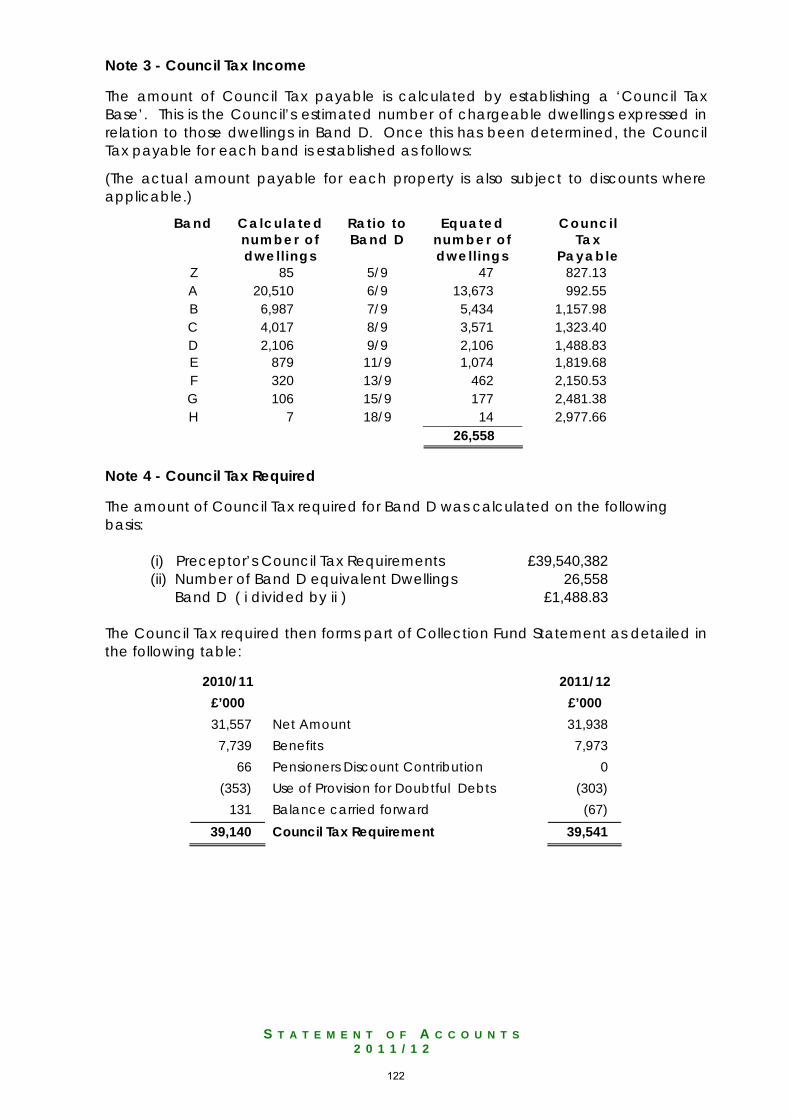
S T A T E M E N T O F A C C O U N T S
2 0 1 1 / 1 2
Note 3 - Council Tax Income The amount of Council Tax payable is calculated by establishing a ‘Council Tax Base’. This is the Council’s estimated number of chargeable dwellings expressed in relation to those dwellings in Band D. Once this has been determined, the Council Tax payable for each band is established as follows:
(The actual amount payable for each property is also subject to discounts where applicable.)
Band Calculated number of dwell ings
Rat io to Band D
Equated number of dwell ings
Counci l Tax
Payable Z 85 5/9 47 827.13 A 20,510 6/9 13,673 992.55 B 6,987 7/9 5,434 1,157.98 C 4,017 8/9 3,571 1,323.40 D 2,106 9/9 2,106 1,488.83 E 879 11/9 1,074 1,819.68 F 320 13/9 462 2,150.53 G 106 15/9 177 2,481.38 H 7 18/9 14 2,977.66 26,558
Note 4 - Council Tax Required The amount of Council Tax required for Band D was calculated on the following basis:
(i) Preceptor’s Council Tax Requirements £39,540,382 (ii) Number of Band D equivalent Dwellings 26,558 Band D ( i divided by ii ) £1,488.83
The Council Tax required then forms part of Collection Fund Statement as detailed in the following table:
2010/11 2011/12 £’000 £’000 31,557 Net Amount 31,938
7,739 Benefits 7,973 66 Pensioners Discount Contribution 0
(353) Use of Provision for Doubtful Debts (303) 131 Balance carried forward (67)
39,140 Council Tax Requirement 39,541
122
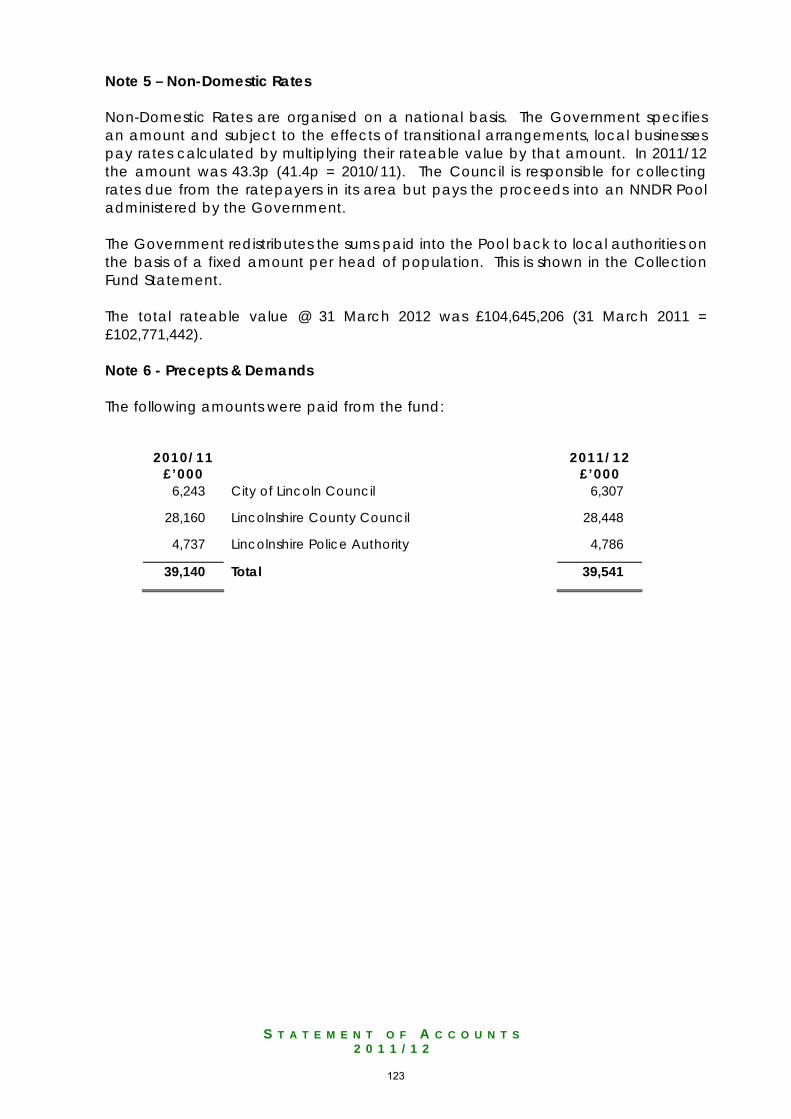
S T A T E M E N T O F A C C O U N T S
2 0 1 1 / 1 2
Note 5 – Non-Domestic Rates Non-Domestic Rates are organised on a national basis. The Government specifies an amount and subject to the effects of transitional arrangements, local businesses pay rates calculated by multiplying their rateable value by that amount. In 2011/12 the amount was 43.3p (41.4p = 2010/11). The Council is responsible for collecting rates due from the ratepayers in its area but pays the proceeds into an NNDR Pool administered by the Government. The Government redistributes the sums paid into the Pool back to local authorities on the basis of a fixed amount per head of population. This is shown in the Collection Fund Statement. The total rateable value @ 31 March 2012 was £104,645,206 (31 March 2011 = £102,771,442). Note 6 - Precepts & Demands The following amounts were paid from the fund:
2010/11 £’000
2011/12 £’000
6,243 City of Lincoln Council 6,307
28,160 Lincolnshire County Council 28,448
4,737 Lincolnshire Police Authority 4,786
39,140 Total 39,541
123
S T A T E M E N T O F A C C O U N T S
2 0 1 1 / 1 2
INDEPENDENT AUDITORS’ REPORT TO MEMBERS OF CITY OF LINCOLN COUNCIL
Opinion on the Authority financial statements I have audited the financial statements of City of Lincoln Council for the year ended 31 March 2012 under the Audit Commission Act 1998. The financial statements comprise the Movement in Reserves Statement, the Comprehensive Income and Expenditure Statement, the Balance Sheet, the Cash Flow Statement, the Housing Revenue Account Income and Expenditure Statement, the Movement on the Housing Revenue Account Statement and Collection Fund and the related notes. The financial reporting framework that has been applied in their preparation is applicable law and the CIPFA/LASAAC Code of Practice on Local Authority Accounting in the United Kingdom 2011/12. This report is made solely to the members of the City of Lincoln Council in accordance with Part II of the Audit Commission Act 1998 and for no other purpose, as set out in paragraph 48 of the Statement of Responsibilities of Auditors and Audited Bodies published by the Audit Commission in March 2010. Respective responsibilities of the Director of Resources and auditor As explained more fully in the Statement of the Director of Resources Responsibilities, the Director of Resources is responsible for the preparation of the Statement of Accounts, which includes the financial statements, in accordance with proper practices as set out in the CIPFA/LASAAC Code of Practice on Local Authority Accounting in the United Kingdom, and for being satisfied that they give a true and fair view. My responsibility is to audit and express an opinion on the accounting statements in accordance with applicable law and International Standards on Auditing (UK and Ireland). Those standards require me to comply with the Auditing Practices Board’s Ethical Standards for Auditors. Scope of the audit of the financial statements An audit involves obtaining evidence about the amounts and disclosures in the financial statements sufficient to give reasonable assurance that the financial statements are free from material misstatement, whether caused by fraud or error. This includes an assessment of: whether the accounting policies are appropriate to the Authority’s circumstances and have been consistently applied and adequately disclosed; the reasonableness of significant accounting estimates made by the Director of Resources; and the overall presentation of the financial statements. In addition, I read all the financial and non-financial information in the explanatory foreword and the annual report to identify material inconsistencies with the audited financial statements. If I become aware of any apparent material misstatements or inconsistencies I consider the implications for my report. Opinion on financial statements In my opinion the financial statements:
124
S T A T E M E N T O F A C C O U N T S
2 0 1 1 / 1 2
• give a true and fair view of the financial position of City of Lincoln Council as at 31 March 2012 and of its expenditure and income for the year then ended; and
• have been prepared properly in accordance with the CIPFA/LASAAC Code of Practice on Local Authority Accounting in the United Kingdom 2011/12.
Opinion on other matters In my opinion, the information given in the explanatory foreword and the content of the Annual Report for the financial year for which the financial statements are prepared is consistent with the accounting statements. Matters on which I report by exception I report to you if:
• in my opinion the annual governance statement does not reflect compliance with ‘Delivering Good Governance in Local Government: a Framework’ published by CIPFA/SOLACE in June 2007;
• I issue a report in the public interest under section 8 of the Audit Commission Act 1998;
• I designate under section 11 of the Audit Commission Act 1998 any recommendation as one that requires the Authority to consider it at a public meeting and to decide what action to take in response; or
• I exercise any other special powers of the auditor under the Audit Commission Act 1998.
I have nothing to report in these respects Conclusion on Authority’s arrangements for securing economy, efficiency and effectiveness in the use of resources Respective responsibilities of the Authority and the auditor The Authority is responsible for putting in place proper arrangements to secure economy, efficiency and effectiveness in its use of resources, to ensure proper stewardship and governance, and to review regularly the adequacy and effectiveness of these arrangements. I am required under Section 5 of the Audit Commission Act 1998 to satisfy myself that the Authority has made proper arrangements for securing economy, efficiency and effectiveness in its use of resources. The Code of Audit Practice issued by the Audit Commission requires me to report to you my conclusion relating to proper arrangements, having regard to relevant criteria specified by the Audit Commission. I report if significant matters have come to my attention which prevent me from concluding that the Authority has put in place proper arrangements for securing economy, efficiency and effectiveness in its use of resources. I am not required to consider, nor have I considered, whether all aspects of the Authority’s arrangements for securing economy, efficiency and effectiveness in its use of resources are operating effectively.
125
S T A T E M E N T O F A C C O U N T S
2 0 1 1 / 1 2
Scope of the review of arrangements for securing economy, efficiency and effectiveness in the use of resources I have undertaken my audit in accordance with the Code of Audit Practice, having regard to the guidance on the specified criteria, published by the Audit Commission in October 2011, as to whether the Authority has proper arrangements for:
• securing financial resilience; and • challenging how it secures economy, efficiency and effectiveness.
The Audit Commission has determined these two criteria as those necessary for me to consider under the Code of Audit Practice in satisfying myself whether the Authority put in place proper arrangements for securing economy, efficiency and effectiveness in its use of resources for the year ended 31 March 2012. I planned my work in accordance with the Code of Audit Practice. Based on my risk assessment, I undertook such work as I considered necessary to form a view on whether, in all significant respects, the Authority had put in place proper arrangements to secure economy, efficiency and effectiveness in its use of resources. Conclusion On the basis of my work, having regard to the guidance on the specified criteria published by the Audit Commission in October 2011, I am satisfied that, in all significant respects, the City of Lincoln Council put in place proper arrangements to secure economy, efficiency and effectiveness in its use of resources for the year ended 31 March 2012.
Certificate
I certify that I have completed the audit of the accounts of City of Lincoln Council in accordance with the requirements of the Audit Commission Act 1998 and the Code of Audit Practice issued by the Audit Commission. Mr Tony Crawley District Auditor Audit Commission, 4th Floor, Mill House, Brayford Wharf North, Lincoln, LN1 1YT Date 27 September 2012
126
S T A T E M E N T O F A C C O U N T S
2 0 1 1 / 1 2
GLOSSARY
AAA FITCH RATING Highest credit quality - ‘AAA’ ratings denote the lowest expectation of credit risk. They are assigned only in case of exceptionally strong capacity for timely payment of financial commitments. This capacity is highly unlikely to be adversely affected by foreseeable events. AA FITCH RATING Very high credit quality - ‘AA’ ratings denote a very low expectation of credit risk. They indicate very strong capacity for timely payment of financial commitments. This capacity is not significantly vulnerable to foreseeable events. A FITCH RATING High credit quality - ‘A’ ratings denote a low expectation of credit risk. The capacity for timely payment of financial commitments is considered strong. This capacity may, nevertheless, be more vulnerable to changes in circumstances or in economic conditions than is the case for higher ratings. ACCOUNTING PERIOD The period of time covered by the accounts, normally a period of twelve months commencing on 1 April. The end of the accounting period is the Balance Sheet date.
ACCRUALS Sums included in the final accounts to recognise revenue and capital income and expenditure earned or incurred in the financial year, but for which actual payment had not been received or made as at 31 March.
ACTUARIAL GAINS AND LOSSES For a defined benefit pension scheme, the changes in actuarial surpluses or deficits that arise because:
• Events have not coincided with the actuarial assumptions made for the last valuation (experience gains and losses); or
• The actuarial assumptions have changed
ASSET An item having value to the Council in monetary terms. Assets are categorised as either current or fixed:
• A current asset will be consumed or cease to have material value within the next financial year (e.g. cash and stock);
• A fixed asset provides benefits to the Council and to the services it provides for a period of more than one year and may be tangible e.g. a community centre, or intangible, e.g. computer software licences.
AUDIT OF ACCOUNTS An independent examination of the Council’s financial affairs.
BALANCE SHEET A statement of the recorded assets, liabilities and other balances at the end of the accounting period.
127
S T A T E M E N T O F A C C O U N T S
2 0 1 1 / 1 2
BORROWING Government support for capital investment is described as either Supported Capital Expenditure (Revenue) known as SCE(R) or Supported Capital Expenditure (Capital Grant) known as SCE(C). SCE can be further classified as either Single Capital Pot (SCP) or ring-fenced. BUDGET The forecast of net revenue and capital expenditure over the accounting period. CAPITAL EXPENDITURE Expenditure on the acquisition of a fixed asset, which will be used in providing services beyond the current accounting period, or expenditure which adds to and not merely maintains the value of an existing fixed asset. CAPITAL FINANCING Funds raised to pay for capital expenditure. There are various methods of financing capital expenditure including borrowing, leasing, direct revenue financing, usable capital receipts, capital grants, capital contributions, revenue reserves and earmarked reserves. CAPITAL PROGRAMME The capital schemes the Council intends to carry out over a specific period of time. CAPITAL RECEIPT The proceeds from the disposal of land or other fixed assets. Proportions of capital receipts can be used to finance new capital expenditure, within rules set down by the government but they cannot be used to finance revenue expenditure. CLAW-BACK Where average council house rents are set higher than the government’s prescribed average limit rent, used in the calculation of rent rebates, the percentage difference reduces the amount of rent rebate subsidy due to the Council, i.e. it is “clawed-back” by the government. CIPFA The Chartered Institute of Public Finance and Accountancy COLLECTION FUND A separate fund that records the income and expenditure relating to Council Tax and non-domestic rates. COMMUNITY ASSETS Assets that the Council intends to hold in perpetuity, that have no determinable useful life and that may have restrictions on their disposal. Examples of community assets are parks and historical buildings. CONSISTENCY The concept that the accounting treatment of like items within an accounting period and from one period to the next are the same. CONTINGENT ASSET A contingent asset is a possible asset arising from past events whose existence will
128
S T A T E M E N T O F A C C O U N T S
2 0 1 1 / 1 2
be confirmed only by the occurrence of one or more uncertain future events not wholly within the Council’s accounts. CONTINGENT LIABILITY A contingent liability is either:
• A possible obligation arising from past events whose existence will be confirmed only by the occurrence of one or more uncertain future events not wholly within the Council’s control; or
• A present obligation arising from past events where it is not probable that a transfer of economic benefits will be required, or the amount of the obligation cannot be measured with sufficient reliability.
CORPORATE AND DEMOCRATIC CORE The corporate and democratic core comprises all activities that local authorities engage in specifically because they are elected, multi-purpose authorities. The cost of these activities are thus over and above those which would be incurred by a series of independent single purpose, nominated bodies managing the same services. There is therefore no logical basis for apportioning these costs to services. CREDITOR Amount owed by the Council for work done, goods received or services rendered within the accounting period, but for which payment has not been made by the end of that accounting period. CURRENT SERVICE COST (PENSIONS) The increase in the present value of a defined benefits pension scheme’s liabilities, expected to arise from employee service in the current period. DEBTOR Amount owed to the Council for works done, goods received or services rendered within the accounting period, but for which payment has not been received by the end of that accounting period. DEFERRED CHARGES Expenditure which can be properly deferred (i.e. treated as capital in nature), but which does not result in, or remain matched with, a tangible asset. Examples of deferred charges are grants of a capital nature to voluntary organisations. DEFINED BENEFIT PENSION SCHEME Pension schemes in which the benefits received by the participants are independent of the contributions paid and are not directly related to the investments of the scheme. DEPRECIATION The measure of the cost of wearing out, consumption or other reduction in the useful economic life of the Council’s fixed assets during the accounting period, whether from use, the passage of time or obsolescence through technical or other changes. DISCRETIONARY BENEFITS (PENSIONS) Retirement benefits, which the employer has no legal, contractual or constructive obligation to award and are awarded under the Council’s discretionary powers
129
S T A T E M E N T O F A C C O U N T S
2 0 1 1 / 1 2
such as the Local Government (Discretionary Payments) Regulations 1996. EQUITY The Council’s value of total assets less total liabilities. EVENTS AFTER THE BALANCE SHEET DATE Events after the Balance Sheet date are those events, favourable or unfavourable, that occur between the Balance Sheet date and the date when the Statement of Accounts is authorised for issue. EXCEPTIONAL ITEMS Material items which derive from events or transactions that fall within the ordinary activities of the Council and which need to be disclosed separately by virtue of their size or incidence to give fair presentation of the accounts. EXPECTED RETURN ON PENSION ASSETS For a funded defined benefit scheme, this is the average rate of return, including both income and changes in fair value but net of scheme expenses, which is expected over the remaining life of the related obligation on the actual assets held by the scheme. EXTRAORDINARY ITEMS Material items, possessing a high degree of abnormality, which derive from events or transactions that fall outside the ordinary activities of the Council and which are not expected to recur. They do not include exceptional items, nor do they include prior period items merely because they relate to a prior period. FAIR VALUE The fair value of an asset is the price at which it could be exchanged in an arm’s length transaction less, where applicable, any grants receivable towards the purchase or use of the asset. FINANCE LEASE A lease that transfers substantially all of the risks and rewards of ownership of a fixed asset to the lessee. GOING CONCERN The concept that the Statement of Accounts is prepared on the assumption that the Council will continue in operational existence for the foreseeable future. GOVERNMENT GRANTS Grants made by the government towards either revenue or capital expenditure in return for past or future compliance with certain conditions relating to the activities of the Council. These grants may be specific to a particular scheme or may support the revenue spend of the Council in general. HOUSING BENEFITS A system of financial assistance to individuals towards certain housing costs administered by authorities and subsidised by central government. HOUSING REVENUE ACCOUNT (HRA) A separate account to the General Fund, which includes the income and
130
S T A T E M E N T O F A C C O U N T S
2 0 1 1 / 1 2
expenditure arising from the provision of housing accommodation by the Council. IMPAIRMENT A reduction in the value of a fixed asset to below its carrying amount on the Balance Sheet. INCOME AND EXPENDITURE ACCOUNT The revenue account of the Council that reports the net cost for the year of the functions for which it is responsible and demonstrates how that cost has been financed from precepts, grants and other income. INFRASTRUCTURE ASSETS Fixed assets belonging to the Council that cannot be transferred or sold, on which expenditure is only recoverable by the continued use of the asset created. Examples are highways, footpaths and bridges. INTANGIBLE ASSETS An intangible (non-physical) item may be defined as an asset when access to the future economic benefits it represents is controlled by the reporting entity. This Council’s intangible assets comprise computer software licences. INTEREST COST (PENSIONS) For a defined benefit scheme, the expected increase during the period of the present value of the scheme liabilities because the benefits are one period closer to settlement. INVESTMENTS (PENSION FUND) The investments of the Pension Fund will be accounted for in the statements of that fund. However, authorities are also required to disclose, as part of the disclosure requirements relating to retirement benefits, the attributable share of the pension scheme assets associated with their underlying obligations. LIABILITY A liability is where the Council owes payment to an individual or another organisation.
• A current liability is an amount which will become payable or could be called in within the next accounting period, e.g. creditors or cash overdrawn.
• A deferred liability is an amount which by arrangement is payable beyond the next year at some point in the future or to be paid off by an annual sum over a period of time.
LIQUID RESOURCES Current asset investments that are readily disposable by the Council without disrupting its business and are either:
• Readily convertible to known amounts of cash at or close to the carrying amount; or
• Traded in an active market LONG-TERM CONTRACT A contract entered into for the design, manufacture or construction of a single substantial asset or the provision of a service (or a combination of assets or services which together constitute a single project), where the time taken to substantially
131
S T A T E M E N T O F A C C O U N T S
2 0 1 1 / 1 2
complete the contract is such that the contract activity falls into more than one accounting period. MATERIALITY The concept that the Statement of Accounts should include all amounts which, if omitted, or mis-stated, could be expected to lead to a distortion of the financial statements and ultimately mislead a user of the accounts. MINIMUM REVENUE PROVISION (MRP) The minimum amount which must be charged to the revenue account each year in order to provide for the repayment of loans and other amounts borrowed by the Council. NEGATIVE SUBSIDY If the Subsidy Housing Revenue Account produces a result, which assumes that the Council’s income is higher than its expenditure, a “negative subsidy” situation arises. In this case the Council must pay an amount equivalent to the deficit, from its Housing Revenue Account to the government. NET BOOK VALUE The amount at which fixed assets are included in the Balance Sheet, i.e. their historical costs or current value less the cumulative amounts provided for depreciation. NET DEBT The Council’s borrowings less cash and liquid resources. NON-DISTRIBUTED COSTS These are overheads for which no user now benefits and as such are not apportioned to services NATIONAL NON-DOMESTIC RATES (NNDR) The National Non-Domestic Rate is a levy on businesses, based on a national rate in the pound set by the government and multiplied by the assessed rateable value of the premises they occupy. It is collected by the Council on behalf of central government and then redistributed back to support the cost of services. NON-OPERATIONAL ASSETS Fixed assets held by the Council but not directly occupied, used or consumed in the delivery of services. Examples are investment properties, assets under construction or assets surplus to requirements pending sale or redevelopment. OPERATING LEASE A lease where the ownership of the fixed asset remains with the lessor. OPERATIONAL ASSETS Fixed assets held and occupied, used or consumed by the Council in the pursuit of its strategy and in the direct delivery of those services for which it has either a statutory or discretionary responsibility.
132
S T A T E M E N T O F A C C O U N T S
2 0 1 1 / 1 2
PAST SERVICE COST (PENSIONS) For a defined benefit pension scheme, the increase in the present value of the scheme liabilities related to employee service in prior periods arising in the current period as a result of the introduction of, or improvement to retirement benefits. PENSION SCHEME LIABILITIES The liabilities of a defined benefit pension scheme for outgoings due after the valuation date. Scheme liabilities measured during the projected unit method reflect the benefits that the employer is committed to provide for service up to the valuation date. PRECEPT The levy made by precepting authorities by billing authorities, requiring the latter to collect income from Council Tax on their behalf. PRIOR YEAR ADJUSTMENT Material adjustments applicable to previous years arising from changes in accounting polices or from the correction of fundamental errors. This does not include normal recurring corrections or adjustments of accounting estimates made in prior years. PROVISION An amount put aside in the accounts for future liabilities or losses which are certain or very likely to occur but the amounts or dates of when they will arise are uncertain. PUBLIC WORKS LOAN BOARD (PWLB) A Central Government Agency, which provides loans for one year and above to authorities at interest rates only slightly higher than those at which the government can borrow itself. RATEABLE VALUE The annual assumed rental of a hereditament, which is used for NNDR purposes. RELATED PARTIES There is a detailed definition of related parties in FRS 8. For the Council’s purposes related parties are deemed to include the Council’s members, the Chief Executive, its Directors and their close family and household members. RELATED PARTY TRANSACTIONS The Statement Of Recommended Practice requires the disclosure of any material transactions between the Council and related parties to ensure that stakeholders are aware when these transactions occur and the amount and implications of such. REMUNERATION All sums paid to or receivable by an employee and sums due by way of expenses allowances (as far as those sums are chargeable to UK income tax) and the money value of any other benefits. Received other than in cash. Pension contributions payable by the employer are excluded. RESERVES The accumulation of surpluses, deficits and appropriations over past years. Reserves of a revenue nature are available and can be spent or earmarked at the discretion of the Council. Some capital reserves such as the fixed asset restatement account
133
S T A T E M E N T O F A C C O U N T S
2 0 1 1 / 1 2
cannot be used to meet current expenditure. RESIDUAL VALUE The net realisable value of an asset at the end of its useful life. RETIREMENT BENEFITS All forms of consideration given by an employer in exchange for services rendered by employees that are payable after the completion of employment. REVENUE EXPENDITURE The day-to-day expenses of providing services. REVENUE SUPPORT GRANT A grant paid by Central Government to authorities, contributing towards the general cost of their services. STOCKS Items of raw materials and stores an Council has procured and holds in expectation of future use. Examples are consumable stores, raw materials and products and services in intermediate stages of completion. TEMPORARY BORROWING Money borrowed for a period of less than one year. TRUST FUNDS Funds administered by the Council for such purposes as prizes, charities, specific projects and on behalf of minors. USEFUL ECONOMIC LIFE (UEL) The period over which the Council will derive benefits form the use of a fixed asset. WORK IN PROGRESS (WIP) The cost of work performed on an uncompleted project at the Balance Sheet date, which should be accounted for.
134