Embed Size (px)
Citation preview
Annual Report & FinancialStatements for the YearEnded 30 June 2009
1
THE
KEN
YA P
OWER
& L
IGH
TIN
G CO
MPA
NY
LTD.
Contents
Business Review Business & Performance Highlights 02 - 03Chairman’s Statement 12 - 14Managing Director & CEO’s Statement 16 - 26CSR & Environmental Report 27 - 33
Corporate GovernanceCorporate Information 05Board of Directors 06 - 07Management Team 08 - 09Corporate Governance Report 34 - 45Report of the Directors 46Statement of Directors’ Responsibilities 47Report of the Independent Auditors 48
Financial Statements and NotesIncome Statement 49Balance Sheet 50Statement of Changes in Equity 51Cash Flow Statement 52Notes to the Financial Statements 53 - 96
Statistical InformationTen Year Financial Statistics 98 - 99Power Operation Statistics 100Summary of Key Statistics 101Regional Statistics 102 - 106Numbers by Customer Category 107Revenue by Customer Category 108Staff Analysis 108Transmission and Distribution System 109
OthersNotice of the Annual General Meeting 10 - 11Form of Proxy
Annual Report & FinancialStatements for the YearEnded 30 June 2009
2TH
E KE
NYA
POW
ER &
LIG
HTI
NG
COM
PAN
Y LT
D.
Annual Report & FinancialStatements for the YearEnded 30 June 2009
3
THE
KEN
YA P
OWER
& L
IGH
TIN
G CO
MPA
NY
LTD.
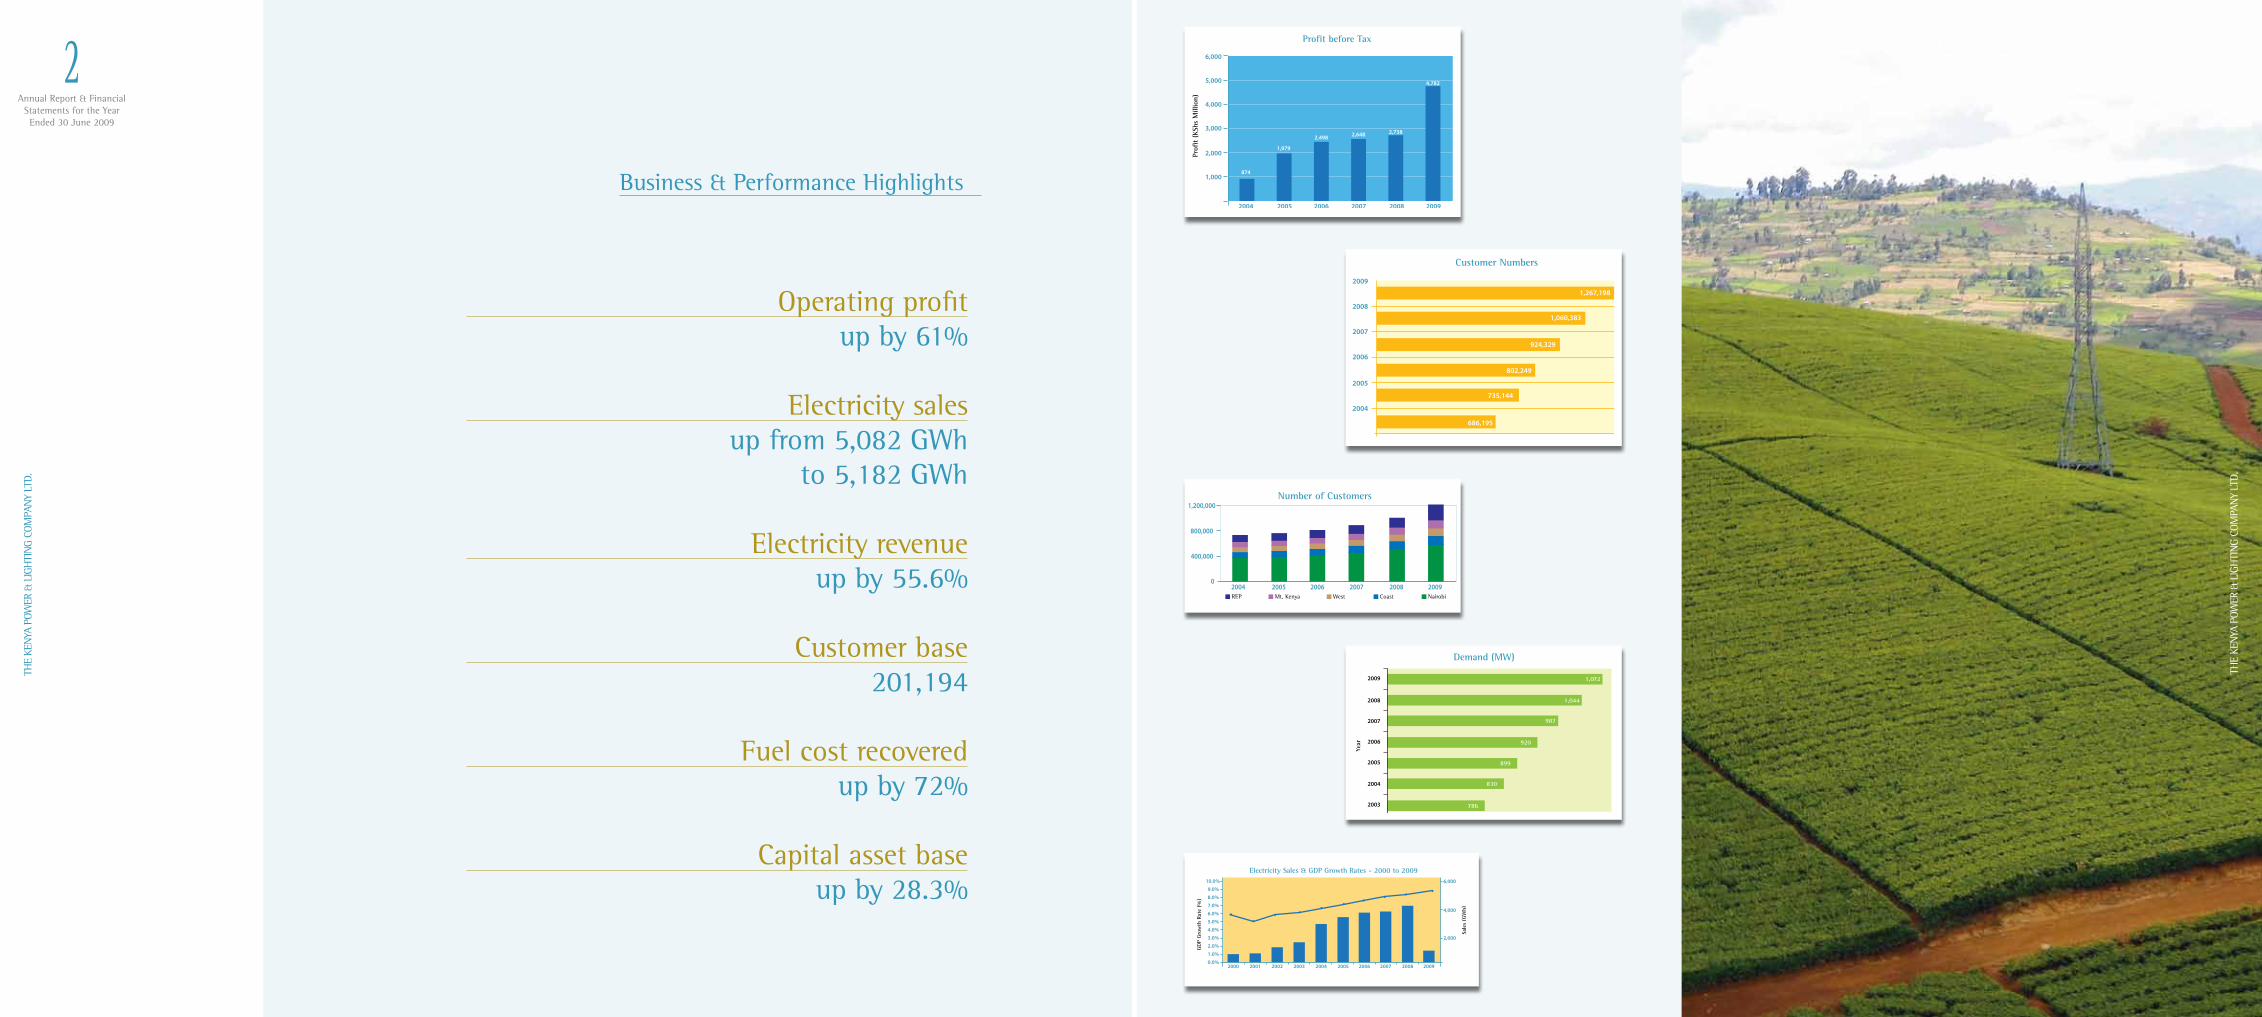
Operating profit up by 61%
Electricity sales up from 5,082 GWh
to 5,182 GWh
Electricity revenue up by 55.6%
Customer base 201,194
Fuel cost recovered up by 72%
Capital asset base up by 28.3%
Business & Performance Highlights

Annual Report & FinancialStatements for the YearEnded 30 June 2009
4TH
E KE
NYA
POW
ER &
LIG
HTI
NG
COM
PAN
Y LT
D.
Annual Report & FinancialStatements for the YearEnded 30 June 2009
5
THE
KEN
YA P
OWER
& L
IGH
TIN
G CO
MPA
NY
LTD.
Directors Dr. Crowther Pepela ChairmanEng. Joseph Njoroge Managing Director & Chief Executive OfficerMr. Joseph KinyuaMr. Patrick M NyoikeMr. Fidesius M NyagaMr. Aram M MbuiMr. Samuel M MwangiMr. Eliazar O OcholaMr. Esau K Kioni Dr. Theodorah Malla-Kilukumi Mr. Benn Khadiagala Alternate to Mr. Patrick NyoikeMr. Solomon Kitungu Alternate to Mr. Joseph Kinyua (Left on 16th June 2009) Mr. Joseph Kariuki Alternate to Mr. Joseph Kinyua (Appointed on 16th June 2009)
SecretaryMrs. Laurencia K Njagi | P O Box 30099 - 00100 Nairobi
Registered OfficeStima Plaza, Kolobot Road | P O Box 30099 - 00100 Nairobi
Country of IncorporationKenya
Main BankersStandard Chartered Bank Kenya Limited, Harambee Avenue | P O Box 20063 - 00200 NairobiKenya Commercial Bank Limited, Moi Avenue | P O Box 30081 - 00100 Nairobi Co-operative Bank of Kenya Limited | P O Box 48231 - 00100 NairobiCFC Stanbic Bank Kenya Limited Kenyatta Avenue | P O Box 30550 - 00100 NairobiBarclays Bank of Kenya Limited | P O Box 30120 - 00100 Nairobi Commercial Bank of Africa Mara/Ragatti Road | P O Box 30437 - 00100 NairobiEquity Bank Hospital Road | P O Box 75104 - 00200 NairobiCiti Bank NA Upper Hill Road | P O Box 30711 - 00100 Nairobi
Auditors Ernst & Young, Kenya-Re Towers, Upperhill Off Ragati Road | P O Box 44286 - 00100 Nairobi,on behalf of The Controller and Auditor-General | P O Box 30084 - 00100 Nairobi.
Principal Legal AdvisorsHamilton Harrison & Mathews, Advocates, ICEA Building | P O Box 30333 - 00100 Nairobi
Corporate Information
Satisfying our customers’ requirements and creating shareholder value remain
our cherished goals
Annual Report & FinancialStatements for the YearEnded 30 June 2009
6Annual Report & Financial
Statements for the YearEnded 30 June 2009
7The Board of Directors
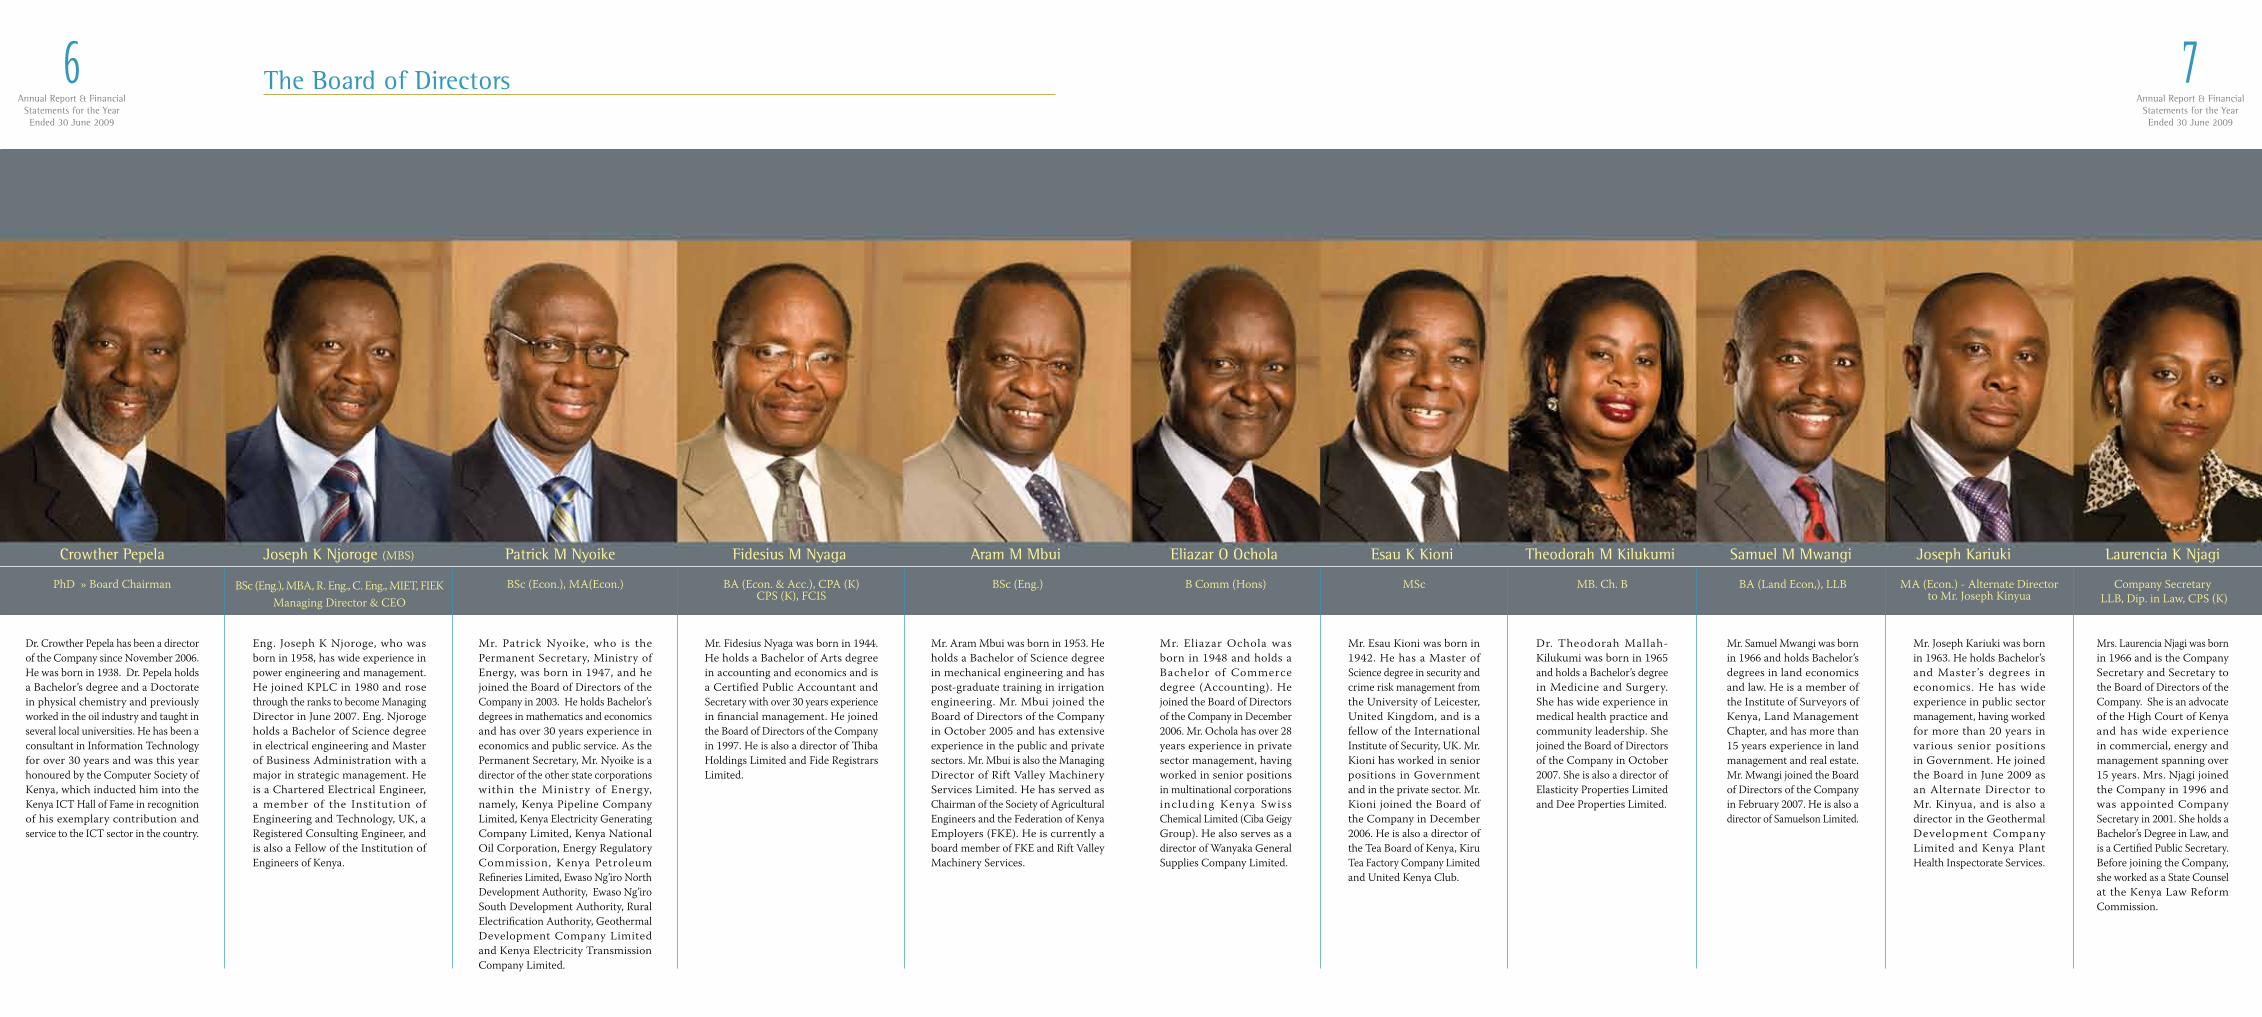
Crowther Pepela Joseph K Njoroge (MBS) Patrick M Nyoike Fidesius M Nyaga Eliazar O Ochola Samuel M Mwangi Joseph Kariuki Laurencia K NjagiTheodorah M KilukumiAram M Mbui Esau K Kioni
PhD » Board Chairman BSc (Eng.), MBA, R. Eng., C. Eng., MIET, FIEK Managing Director & CEO
BA (Econ. & Acc.), CPA (K)CPS (K), FCIS
BSc (Econ.), MA(Econ.) MSc MB. Ch. B BA (Land Econ,), LLB MA (Econ.) - Alternate Directorto Mr. Joseph Kinyua
Company Secretary LLB, Dip. in Law, CPS (K)
BSc (Eng.) B Comm (Hons)
Mr. Patrick Nyoike, who is the Permanent Secretary, Ministry of Energy, was born in 1947, and he joined the Board of Directors of the Company in 2003. He holds Bachelor’s degrees in mathematics and economics and has over 30 years experience in economics and public service. As the Permanent Secretary, Mr. Nyoike is a director of the other state corporations within the Ministry of Energy, namely, Kenya Pipeline Company Limited, Kenya Electricity Generating Company Limited, Kenya National Oil Corporation, Energy Regulatory Commission, Kenya Petroleum Refineries Limited, Ewaso Ng’iro North Development Authority, Ewaso Ng’iro South Development Authority, Rural Electrification Authority, Geothermal Development Company Limited and Kenya Electricity Transmission Company Limited.
Mr. Esau Kioni was born in 1942. He has a Master of Science degree in security and crime risk management from the University of Leicester, United Kingdom, and is a fellow of the International Institute of Security, UK. Mr. Kioni has worked in senior positions in Government and in the private sector. Mr. Kioni joined the Board of the Company in December 2006. He is also a director of the Tea Board of Kenya, Kiru Tea Factory Company Limited and United Kenya Club.
Mr. Fidesius Nyaga was born in 1944. He holds a Bachelor of Arts degree in accounting and economics and is a Certified Public Accountant and Secretary with over 30 years experience in financial management. He joined the Board of Directors of the Company in 1997. He is also a director of Thiba Holdings Limited and Fide Registrars Limited.
Mr. Aram Mbui was born in 1953. He holds a Bachelor of Science degree in mechanical engineering and has post-graduate training in irrigation engineering. Mr. Mbui joined the Board of Directors of the Company in October 2005 and has extensive experience in the public and private sectors. Mr. Mbui is also the Managing Director of Rift Valley Machinery Services Limited. He has served as Chairman of the Society of Agricultural Engineers and the Federation of Kenya Employers (FKE). He is currently a board member of FKE and Rift Valley Machinery Services.
Mr. Samuel Mwangi was born in 1966 and holds Bachelor’s degrees in land economics and law. He is a member of the Institute of Surveyors of Kenya, Land Management Chapter, and has more than 15 years experience in land management and real estate. Mr. Mwangi joined the Board of Directors of the Company in February 2007. He is also a director of Samuelson Limited.
Mr. Joseph Kariuki was born in 1963. He holds Bachelor’s and Master’s degrees in economics. He has wide experience in public sector management, having worked for more than 20 years in various senior positions in Government. He joined the Board in June 2009 as an Alternate Director to Mr. Kinyua, and is also a director in the Geothermal Development Company Limited and Kenya Plant Health Inspectorate Services.
Mrs. Laurencia Njagi was born in 1966 and is the Company Secretary and Secretary to the Board of Directors of the Company. She is an advocate of the High Court of Kenya and has wide experience in commercial, energy and management spanning over 15 years. Mrs. Njagi joined the Company in 1996 and was appointed Company Secretary in 2001. She holds a Bachelor’s Degree in Law, and is a Certified Public Secretary. Before joining the Company, she worked as a State Counsel at the Kenya Law Reform Commission.
Mr. Eliazar Ochola was born in 1948 and holds a Bachelor of Commerce degree (Accounting). He joined the Board of Directors of the Company in December 2006. Mr. Ochola has over 28 years experience in private sector management, having worked in senior positions in multinational corporations including Kenya Swiss Chemical Limited (Ciba Geigy Group). He also serves as a director of Wanyaka General Supplies Company Limited.
Dr. Theodorah Mallah-Kilukumi was born in 1965 and holds a Bachelor’s degree in Medicine and Surgery. She has wide experience in medical health practice and community leadership. She joined the Board of Directors of the Company in October 2007. She is also a director of Elasticity Properties Limited and Dee Properties Limited.
Eng. Joseph K Njoroge, who was born in 1958, has wide experience in power engineering and management. He joined KPLC in 1980 and rose through the ranks to become Managing Director in June 2007. Eng. Njoroge holds a Bachelor of Science degree in electrical engineering and Master of Business Administration with a major in strategic management. He is a Chartered Electrical Engineer, a member of the Institution of Engineering and Technology, UK, a Registered Consulting Engineer, and is also a Fellow of the Institution of Engineers of Kenya.
Dr. Crowther Pepela has been a director of the Company since November 2006. He was born in 1938. Dr. Pepela holds a Bachelor’s degree and a Doctorate in physical chemistry and previously worked in the oil industry and taught in several local universities. He has been a consultant in Information Technology for over 30 years and was this year honoured by the Computer Society of Kenya, which inducted him into the Kenya ICT Hall of Fame in recognition of his exemplary contribution and service to the ICT sector in the country.
Annual Report & FinancialStatements for the YearEnded 30 June 2009
8TH
E KE
NYA
POW
ER &
LIG
HTI
NG
COM
PAN
Y LT
D.
Annual Report & FinancialStatements for the YearEnded 30 June 2009
9
THE
KEN
YA P
OWER
& L
IGH
TIN
G CO
MPA
NY
LTD.
KPLC elis el utatum duiscin
vulluptatet iusto od miniamet
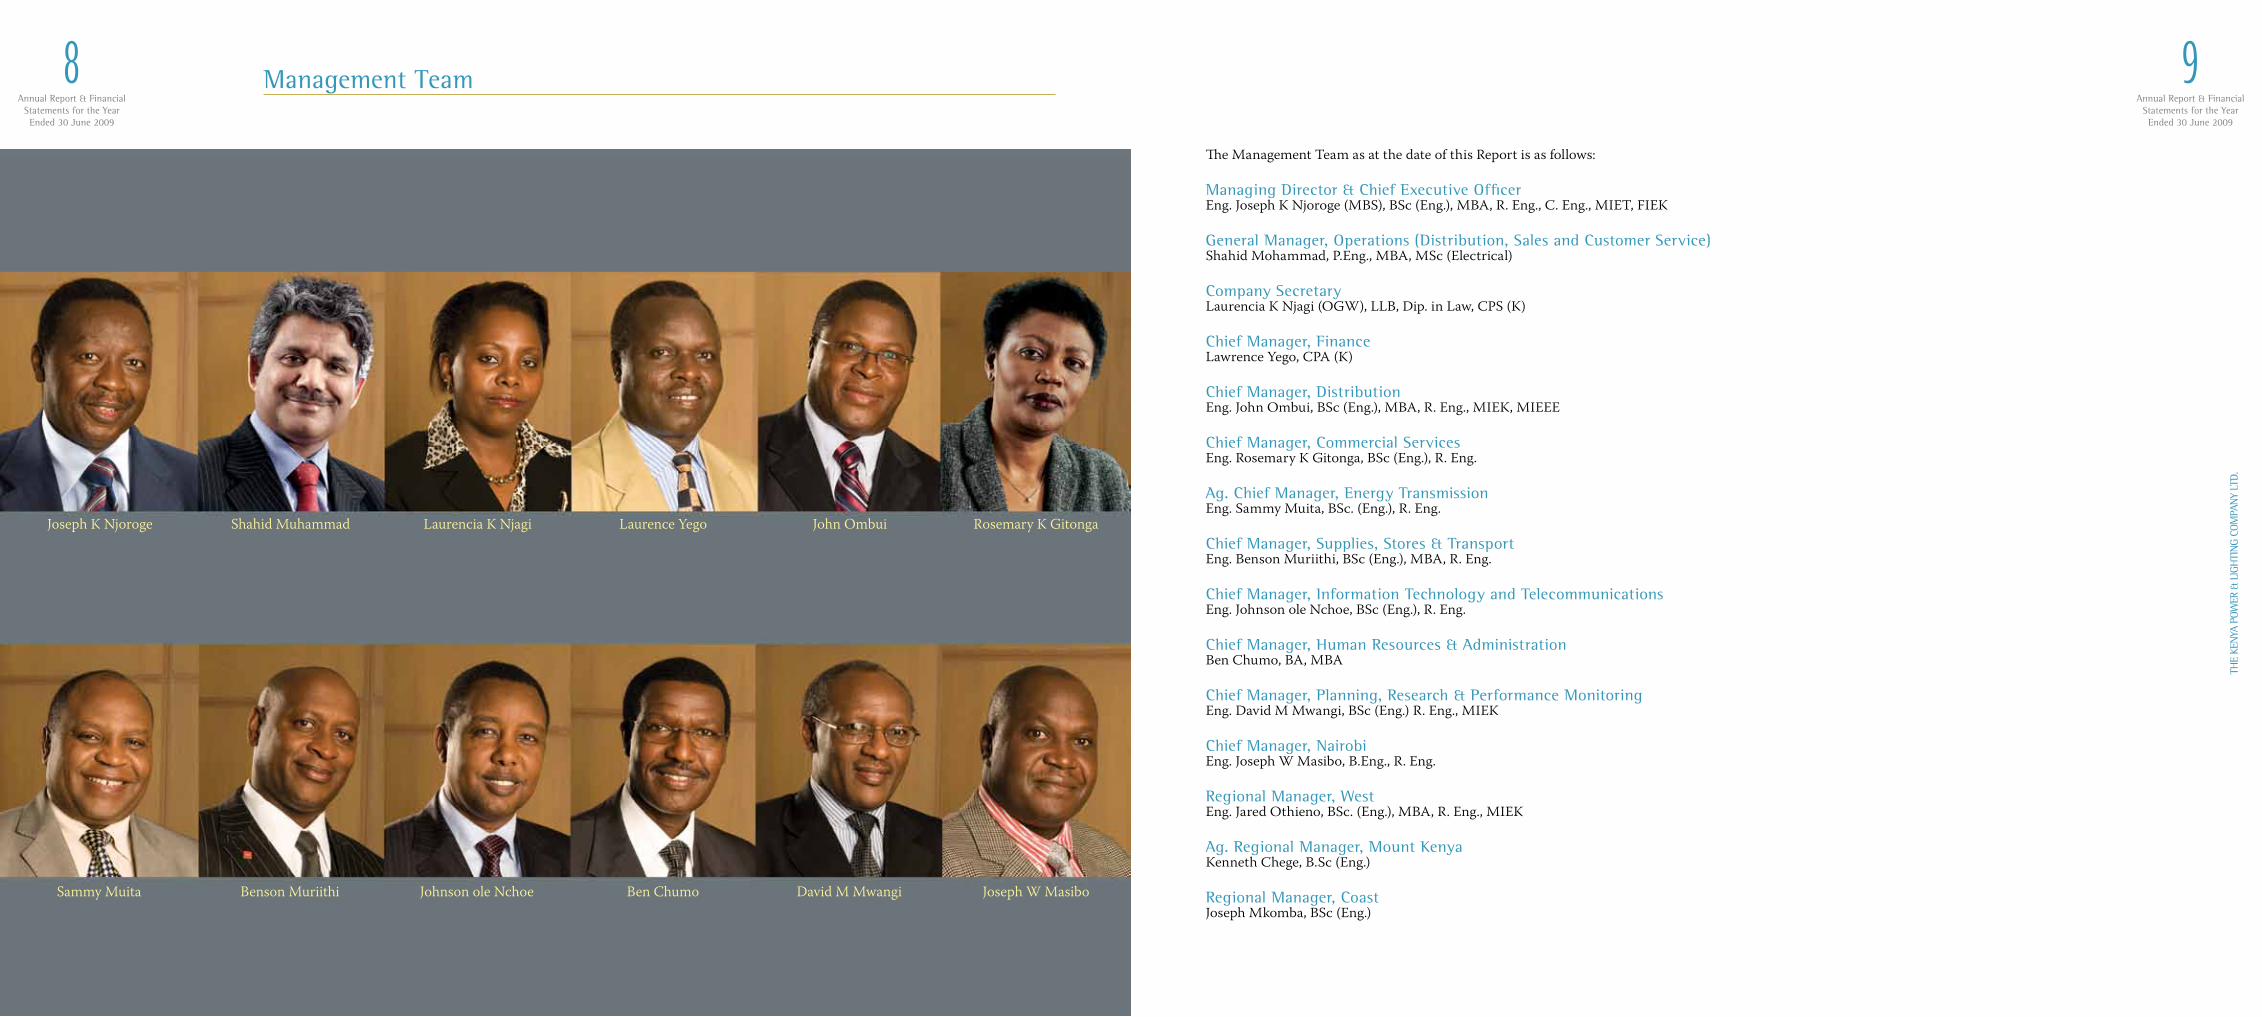
The Management Team as at the date of this Report is as follows:
Managing Director & Chief Executive Officer Eng. Joseph K Njoroge (MBS), BSc (Eng.), MBA, R. Eng., C. Eng., MIET, FIEK
General Manager, Operations (Distribution, Sales and Customer Service)Shahid Mohammad, P.Eng., MBA, MSc (Electrical)
Company Secretary Laurencia K Njagi (OGW), LLB, Dip. in Law, CPS (K)
Chief Manager, Finance Lawrence Yego, CPA (K)
Chief Manager, Distribution Eng. John Ombui, BSc (Eng.), MBA, R. Eng., MIEK, MIEEE
Chief Manager, Commercial Services Eng. Rosemary K Gitonga, BSc (Eng.), R. Eng.
Ag. Chief Manager, Energy Transmission Eng. Sammy Muita, BSc. (Eng.), R. Eng.
Chief Manager, Supplies, Stores & TransportEng. Benson Muriithi, BSc (Eng.), MBA, R. Eng.
Chief Manager, Information Technology and Telecommunications Eng. Johnson ole Nchoe, BSc (Eng.), R. Eng.
Chief Manager, Human Resources & Administration Ben Chumo, BA, MBA
Chief Manager, Planning, Research & Performance MonitoringEng. David M Mwangi, BSc (Eng.) R. Eng., MIEK
Chief Manager, Nairobi Eng. Joseph W Masibo, B.Eng., R. Eng.
Regional Manager, WestEng. Jared Othieno, BSc. (Eng.), MBA, R. Eng., MIEK
Ag. Regional Manager, Mount Kenya Kenneth Chege, B.Sc (Eng.)
Regional Manager, CoastJoseph Mkomba, BSc (Eng.)
Management Team
Joseph K Njoroge Laurencia K Njagi Laurence Yego John OmbuiShahid Muhammad
Johnson ole NchoeSammy Muita Ben Chumo
Rosemary K Gitonga
David M MwangiBenson Muriithi Joseph W Masibo
Annual Report & FinancialStatements for the YearEnded 30 June 2009
10TH
E KE
NYA
POW
ER &
LIG
HTI
NG
COM
PAN
Y LT
D.
Annual Report & FinancialStatements for the YearEnded 30 June 2009
11
THE
KEN
YA P
OWER
& L
IGH
TIN
G CO
MPA
NY
LTD.
ILANI INATOLEWA KWAMBA MKUTANO MKUU WA KILA MWAKA WA THEMANINI NA NANE WA WANACHAMA WA KAMPUNI utafanyika katika Kenya School of Monetary Studies, Thika Road, Nairobi, mnamo Ijumaa 18, Desemba 2009, saa 5.00 asubuhi kuendesha shughuli zifuatazo:
1. Kusoma Ilani ya kuandaa Mkutano na kutambua iwapo kuna idadi ya kutosha ya wanachama katika kikao. 2. Kupokea na kutathmini taarifa za Kampuni za kifedha zilizokaguliwa kwa mwaka uliomalizika Juni 30, 2009, pamoja na ripoti za Mwenyekiti, Wakurugenzi na Wahasibu. 3. Kuidhinisha malipo ya mgao wa mwisho wa Sh.6 kwa kila hisa ya kawaida, baada ya kuondoa ushuru inavyostahili, katika mwaka uliomalizika Juni 30, 2009 na kuidhinisha mgao wa muda wa Sh.2 kwa kila hisa ya kawaida ambao tayari umelipwa kwa kipindi hicho.
4. Kuchagua Wakurugenzi:(i) Bw. Aram Mbui anastaafu kwa zamu kwa mujibu wa Kifungu 120 cha Katiba ya Kampuni na, hajitokezi kuchaguliwa tena.(ii) Bw. Samuel Mwangi anastaafu kwa zamu kwa mujibu wa Kifungu 120 cha Katiba ya Kampuni na, hajitokezi kuchaguliwa tena.
5. Kupitisha azimio lifuatalo la kawaida: Notisi maalumu kwa mujibu wa Sehemu ya 142 na Sehemu 186 (5) ya Sheria ya Kampuni, Sura ya 486 ya Sheria za Kenya, kwa kuwa imepokelewa na Kampuni kuhusu nia ya kuwasilisha pendekezo kwamba Dkt Crowther Pepela, ambaye amefikisha umri wa miaka 70 achaguliwe tena kama Mkurugenzi licha ya kufikisha umri huo, kuchunguzwe na iwapo itaonekana inafaa, kupitishwe azimio lifuatalo kama azimio la kawaida: “Kwamba Dkt. Crowther Pepela ambaye amefikisha umri wa miaka 70, na anayestaafu kwa zamu, na sasa achaguliwe tena kama Mkurugenzi wa Kampuni hadi muda wake tena wakustaafu kwa zamu uwadie chini ya Katiba ya Kampuni.”
6. Kuidhinisha malipo ya ujira kwa Wakurugenzi wasio na mamlaka kwa mwaka unaomalizika Juni 30, 2009 kama ilivyoidhinishwa na Serikali ya Sh.600,000 kwa kila mkurugenzi, na hivyo kwa jumla Sh.5,400,000.
7. Wahasibu: Kutambua kwamba ukaguzi wa vitabu vya hesabu vya Kampuni utaendelea kutekelezwa na Msimamizi na Mhasibu Mkuu wa Serikali au kampuni ya uhasibu ambayo itateuliwa kwa mujibu wa Sehemu 11 ya Sheria ya Mashirika ya Umma ( kama ilivyorekebishwa na Mkusanyiko wa Sheria 2002), na Sehemu 14 na 39 (i) ya Sheria ya Uhasibu wa Umma 2003.
8. Kuidhinisha Wakurugenzi kuamua malipo ya Wahasibu.
9. Kuangalia shughuli zozote zile ambazo ilani imetolewa
Kwa Amri ya Bodi
Laurencia K Njagi Katibu wa KampuniP O Box 30099 - 00100Nairobi, KenyaOktoba 28 2009
MAELEZO:Mwanachama ambaye ana haki ya kuhudhuria na kupiga kura katika mkutano uliotangazwa juu anaweza kuteua mmoja au zaidi kuhudhuria na, endapo kutakuwa na kura, apige kwa niaba yake. Wakala si lazima awe mwanachama wa Kampuni. Fomu ya Wakala imeambatanishwa kwenye ripoti hii. Ili kuwa halali, Fomu ya Wakala ni lazima ijazwe na kuwasilishwa katika afisi rasmi ya Kampuni, Stima Plaza, au itumwe kupitia posta mapema ili ifike kabla ya saa 5 asubuhi, Desemba 16, 2009.
NOTICE IS HEREBY GIVEN THAT THE EIGHTY-EIGHTH ANNUAL GENERAL MEETING of Members of the Company will be held at Kenya School of Monetary Studies, Thika Road, Nairobi, on Friday 18th December 2009 at 11.00 a.m. to transact the following business:
1. To read the Notice convening the Meeting and note the presence of a quorum.
2. To receive and consider the Company’s audited financial statements for the year ended 30th June 2009, together with the Chairman’s, Directors’ and Auditors’ reports thereon.
3. To approve payment of a final dividend of Shs.6 per ordinary share, subject to withholding tax where applicable, in respect of the year ended 30th June 2009 and to ratify the interim dividend of Shs.2 per ordinary share already paid for the period.
4. To elect Directors:(i) Mr. Aram Mbui retires by rotation in accordance with Article 120 of the Memorandum and Articles of Association of the Company, and does not offer himself for re-election;(ii) Mr. Samuel Mwangi retires by rotation in accordance with Article 120 of the Memorandum and Articles of Association of the Company, and does not offer himself for re-election.
5. To pass the following ordinary resolution: Special notice pursuant to Section 142 and Section 186 (5) of the Companies Act, Cap 486 of the Laws of Kenya having been received by the Company of the intention to move a resolution that Dr Crowther Pepela who has attained the age of 70 years be re-elected as a Director of the Company notwithstanding his having attained such age, to consider and, if thought fit, pass the following resolution as an ordinary resolution: “That Dr Crowther Pepela who has attained the age of 70 years, and who retires by rotation be, and is hereby re-elected as a Director of the Company, until he comes up for retirement by rotation under the Company’s Memorandum and Articles of Association.”
6. To approve payment of fees to non-executive Directors for the year ended 30th June 2009, as approved by the Government, of Shs.600,000 per Director, totalling to Shs.5,400,000.
7. Auditors: To note that the audit of the Company’s books of accounts will continue to be undertaken by the Controller and Auditor-General or an audit firm appointed in accordance with Section 11 of the State Corporations Act (as amended by the Miscellaneous Law Amendment Act, 2002), and Sections 14 and 39 (i) of the Public Audit Act 2003.
8. To authorise the Directors to fix the Auditors’ remuneration.
9. To consider any other business for which due notice has been given.
By Order of the Board
Laurencia K Njagi Company SecretaryP O Box 30099 - 00100Nairobi, Kenya28th October 2009
NOTES:A member entitled to attend and vote at the above meeting may appoint one or more proxies to attend and, on a poll, to vote instead of him. A proxy need not be a member of the Company. A Form of Proxy is enclosed with this report. To be valid, the Form of Proxy must be duly completed and lodged at the office of the Company Secretary, Stima Plaza, or posted in time to be received not later than 11.00 a.m. on 16th December 2009.
Ilani ya Mkutano Mkuu wa Kila Mwaka (AGM)Notice of Annual General Meeting 2009
Annual Report & FinancialStatements for the YearEnded 30 June 2009
12TH
E KE
NYA
POW
ER &
LIG
HTI
NG
COM
PAN
Y LT
D.
Annual Report & FinancialStatements for the YearEnded 30 June 2009
13
THE
KEN
YA P
OWER
& L
IGH
TIN
G CO
MPA
NY
LTD.
Chairman’s Statement (Continued)Chairman’s Statement
General Overview
Financial PerformanceElectricity revenue increased by 55.6% from Shs.23,917 million the previous year, to Shs.36,459 million mainly due to the tariff increase effected from July 2008. The fuel cost recovered from customers rose by 72% from Shs.16,433 million the previous year, to Shs.28,269 million. The increase was attributable to high fuel prices in the international market during the first quarter of the year, and intensified generation from thermal based plant, due to reduced hydro generation arising from prolonged drought. Fuel revenue, which is recovered from customers, is a pass-through cost which is paid directly to thermal based bulk power suppliers.
A new capacity based bulk tariff was introduced with effect from 1st July 2008 for power purchased from Kenya Electricity Generating Company (KenGen). As a result of the application of the new tariff structure, the power purchase costs (excluding fuel costs) increased by Shs.6,807 million to Shs.18,770 million, from Shs.11,963 million the previous year. Fuel costs paid to bulk power suppliers increased by Shs.11,681 million to Shs.28,347 million, up from Shs.16,666 million the previous year. Transmission and distribution costs rose by Shs.3,955 million from Shs.9,615 million the previous year, to Shs.13,570 million. This was due to an increased provision for bad and doubtful debts amounting to Shs.1,990 million to match the rise in electricity revenues. The capital asset base rose by 28.3% from Shs.39,057 million the previous year, to
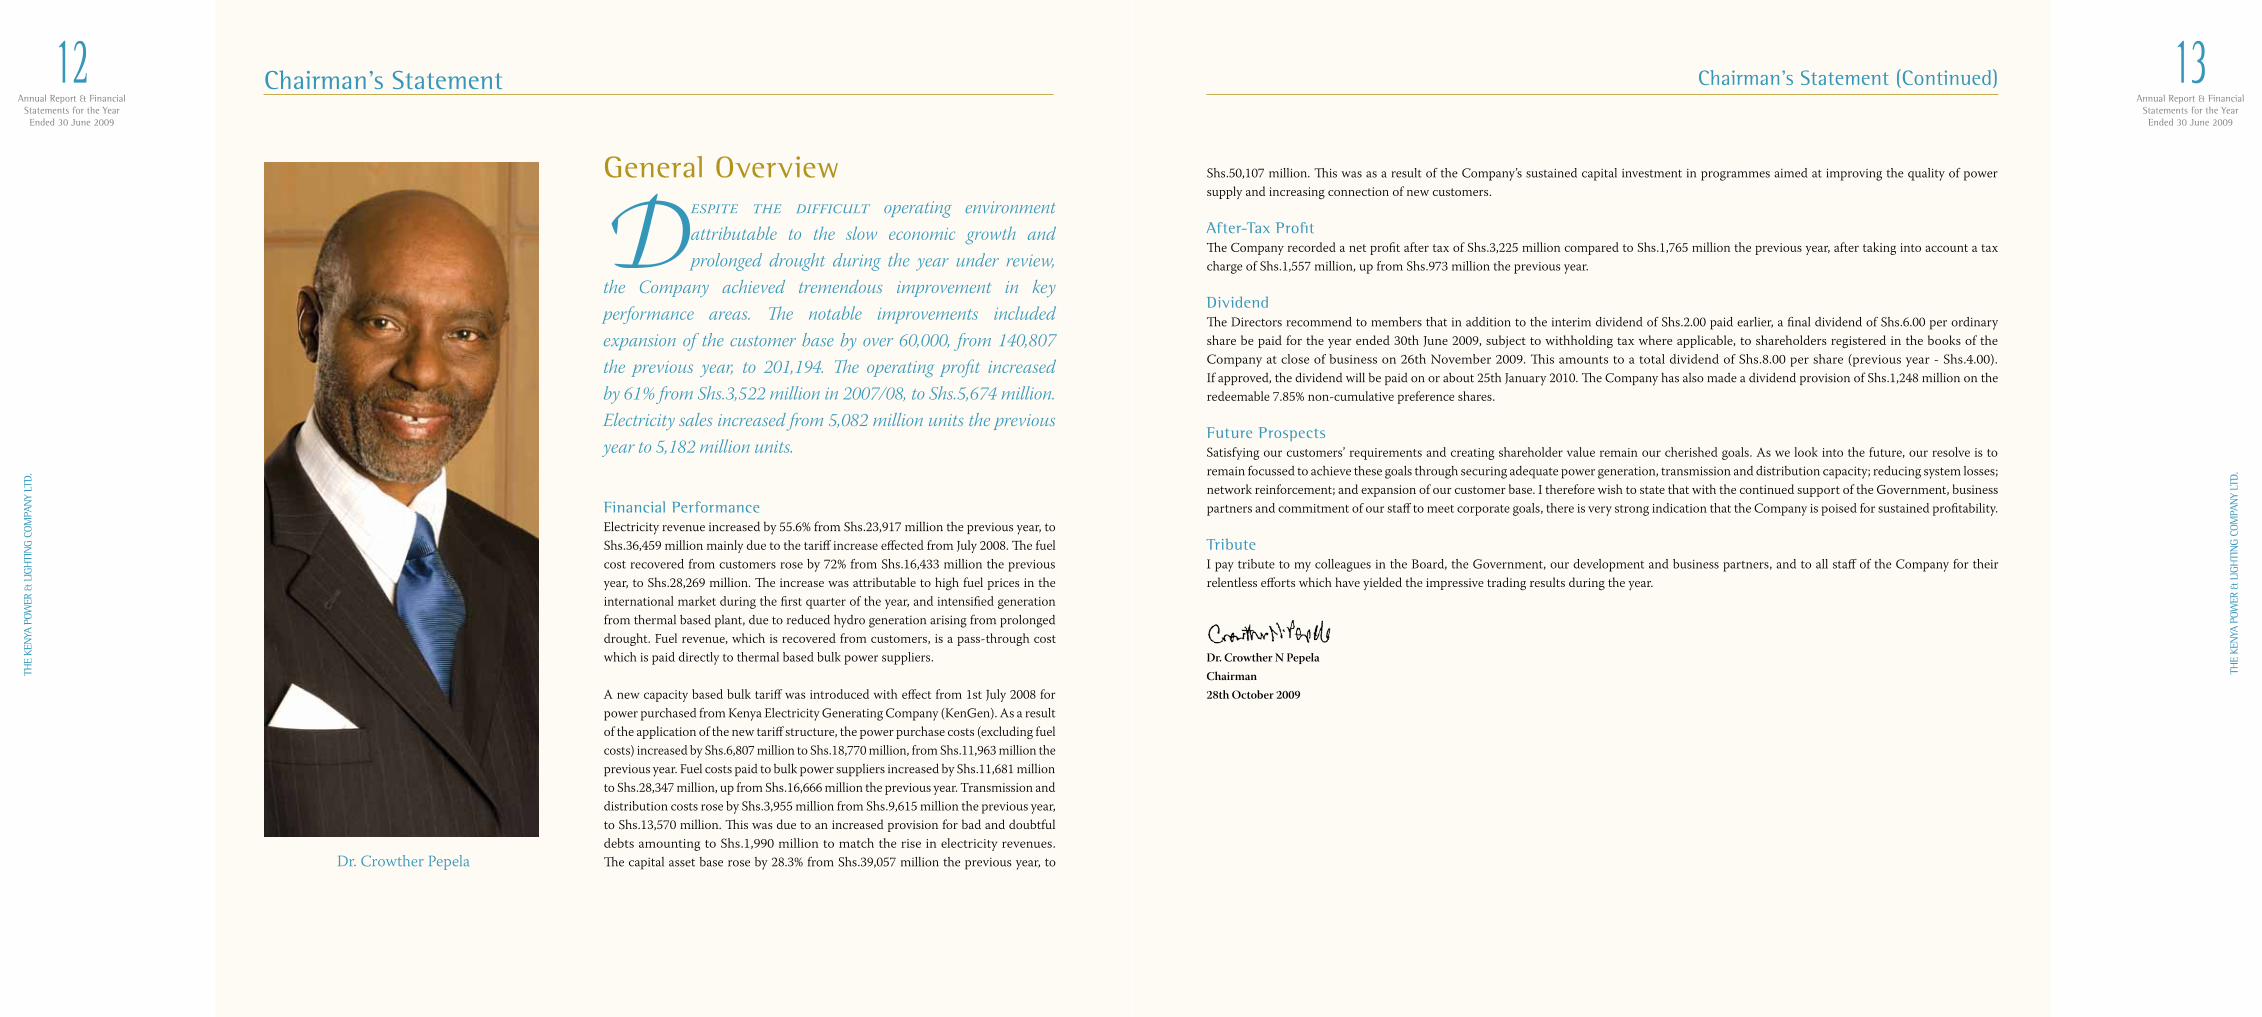
Despite the difficult operating environment attributable to the slow economic growth and prolonged drought during the year under review,
the Company achieved tremendous improvement in key performance areas. The notable improvements included expansion of the customer base by over 60,000, from 140,807 the previous year, to 201,194. The operating profit increased by 61% from Shs.3,522 million in 2007/08, to Shs.5,674 million. Electricity sales increased from 5,082 million units the previous year to 5,182 million units.
Shs.50,107 million. This was as a result of the Company’s sustained capital investment in programmes aimed at improving the quality of power supply and increasing connection of new customers.
After-Tax ProfitThe Company recorded a net profit after tax of Shs.3,225 million compared to Shs.1,765 million the previous year, after taking into account a tax charge of Shs.1,557 million, up from Shs.973 million the previous year.
DividendThe Directors recommend to members that in addition to the interim dividend of Shs.2.00 paid earlier, a final dividend of Shs.6.00 per ordinary share be paid for the year ended 30th June 2009, subject to withholding tax where applicable, to shareholders registered in the books of the Company at close of business on 26th November 2009. This amounts to a total dividend of Shs.8.00 per share (previous year - Shs.4.00). If approved, the dividend will be paid on or about 25th January 2010. The Company has also made a dividend provision of Shs.1,248 million on the redeemable 7.85% non-cumulative preference shares.
Future Prospects Satisfying our customers’ requirements and creating shareholder value remain our cherished goals. As we look into the future, our resolve is to remain focussed to achieve these goals through securing adequate power generation, transmission and distribution capacity; reducing system losses; network reinforcement; and expansion of our customer base. I therefore wish to state that with the continued support of the Government, business partners and commitment of our staff to meet corporate goals, there is very strong indication that the Company is poised for sustained profitability.
TributeI pay tribute to my colleagues in the Board, the Government, our development and business partners, and to all staff of the Company for their relentless efforts which have yielded the impressive trading results during the year.
Dr. Crowther N Pepela Chairman28th October 2009
Dr. Crowther Pepela
Annual Report & FinancialStatements for the YearEnded 30 June 2009
14TH
E KE
NYA
POW
ER &
LIG
HTI
NG
COM
PAN
Y LT
D.
THE
KEN
YA P
OWER
& L
IGH
TIN
G CO
MPA
NY
LTD.
Annual Report & FinancialStatements for the YearEnded 30 June 2009
15Maelezo kwa JumlaLicha ya hali ngumu ya kiuchumi na kiangazi cha muda mrefu wakati wa mwaka unaokaguliwa, Kampuni ilipata ufanisi mkubwa katika vitengo muhimu vya utenda kazi. Miongoni mwa mafanikio makubwa yaliyopatikana ni kuongezeka kwa idadi ya wateja kwa zaidi ya 60,000 kutoka 140,807 mwaka uliopita hadi 201,194. Faida ya kampuni iliongezeka kwa asilimia 61 kutoka Sh.3,522 milioni mnamo 2007/08 hadi Sh.5,674 milioni. Mauzo ya Stima yaliongezeka kutoka vipimo 5,082 mwaka uliopita hadi vipimo 5,182 milioni.
Matokeo ya KifedhaMapato ya stima yaliongezeka kwa asilimia 55.6 kutoka Sh.23,917 milioni mwaka uliopita, hadi Sh.36,459 milioni, hasa kutokana na nyongeza ya ada iliyotekelezwa kwanzia Julai 2008. Gharama ya mafuta iliyopatikana kutoka kwa wateja iliongezeka kwa asilimia 72 kutoka Sh.16,433 milioni mwaka uliopita, hadi Sh.28,269 milioni. Nyongeza hiyo ilitokana na bei za juu za mafuta katika soko la kimataifa wakati wa kipindi cha miezi mitatu ya kwanza mwaka huu, nyongeza ya uzalishaji kutoka kwa viwanda vya umemejoto, kutokana na kupungua kwa uzalishaji wa umeme kutokana na maji kuliotokana na kiangazi cha muda mrefu. Mapato ya mafuta, ambayo hupatikana kutoka kwa wateja, ni gharama inayopitishwa moja kwa moja kwa wazalishaji umemejoto. Ada mpya ya umeme wa kiasi kikubwa ilianzishwa kuanzia Julai 1, 2008 kwa umeme unaonunuliwa kutoka Kenya Electricity Generating Company (KenGen). Kutokana na utekelezaji wa muundo huo mpya, gharama za ununuzi wa umeme (bila kujumuisha gharama za mafuta) ziliongezeka kwa Sh.6,807 milioni hadi Sh.18,770 milioni kutoka Sh.11,963 milioni mwaka uliopita. Gharama za mafuta zinazolipwa wazalishaji wa kiwango kikubwa cha umeme ziliongezeka kwa Sh.11,681 milioni hadi Sh.28,347 milioni, kutoka Sh.16,666 milioni mwaka uliopita. Gharama za usambazaji na ugawaji ziliongezeka kwa Sh.3,955 milioni kutoka Sh.9,615 milioni mwaka uliopita, hadi Sh.13,570 milioni. Hii ilitokana na kuongezwa kwa kiwango cha madeni yasiyoweza kulipwa ya jumla ya Sh.1,990 milioni ili kukisawazisha na mapato ya stima yaliyo ongezeka.
Thamani ya mtaji wa kampuni iliongezeka kwa asilimia 28.3 kutoka Sh.39,057 milioni mwaka uliopita, hadi Sh.50,107 milioni. Hii ni kutokana na mipango kabambe ya uwekezaji wa mtaji katika miradi inayonuia kuimarisha ubora wa usambazaji umeme na kuongeza idadi ya wateja wapya.
Faida Baada ya Ushuru Kampuni ilipata faida baada ya ushuru ya Sh.3,225 milioni ikilinganishwa na Sh.1,765 milioni mwaka uliopita, baada ya kutilia maanani malipo ya ushuru ya Sh.1,557 milioni, ikilinganishwa na Sh.973 milioni mwaka uliopita.
MgaoWakurugenzi wanapendekeza kwa wanachama kwamba, mbali na mgao wa muda wa Sh.2.00 uliolipwa awali, mgao wa mwisho wa Sh.6.00 kwa kila hisa ya kawaida ulipwe katika kipindi cha mwaka uliomalizika Juni 30, 2009, baada ya kuondoa ushuru inavyostahili, kwa wenyehisa wote waliojiandikisha katika vitabu vya Kampuni kufikia mwisho wa Novemba 26, 2009. Hii inafikisha Sh.8.00 jumla ya mgao ikilinganishwa na Sh.4.00 mwaka uliopita. Iwapo utaidhinishwa, mgao huo utalipwa mnamo au karibu na Januari 25, 2010. Kampuni imetenga kwenye vitabu vya hesabu Sh.1,248 milioni kwa malipo ya mgao wa hisa za upendeleo za asilimia 7.85.
Matarajio ya Siku ZijazoKutosheleza mahitaji ya wateja na kuunda thamani kwa wenyehisa wetu bado ndio malengo tunayoenzi zaidi. Huku tukiangalia katika siku za baadaye, kusudio letu ni kukaa chonjo kuafikia malengo haya kupitia uzalishaji wa kutosha wa umeme, kuimarisha uwezo wetu wa kusambaza na kugawa umeme, kupunguza hasara kwenye mitambo yetu, kuimarisha mtandao na kuongeza idadi ya wateja wetu. Hivyo basi, ningependa kutaja kuwa kutokana na usaidizi wa Serikali, washirika wetu wa kibiashara na kujitolea kwa wafanya kazi wetu katika kufanikisha malengo yetu kama Kampuni, kuna kila ishara kwamba Kampuni itaendelea kupata faida.
ShukraniNawashukuru wenzangu katika Bodi, Serikali, washirika wetu wa maendeleo na biashara na wafanya kazi wote wa Kampuni kwa jitihada zao sisizo na kifani ambazo zilifanikisha matokeo haya ya kufana mwaka huu.
Dkt. Crowther N PepelaMwenyekiti28 Oktoba 2009
Tathmini ya Mwenyekiti
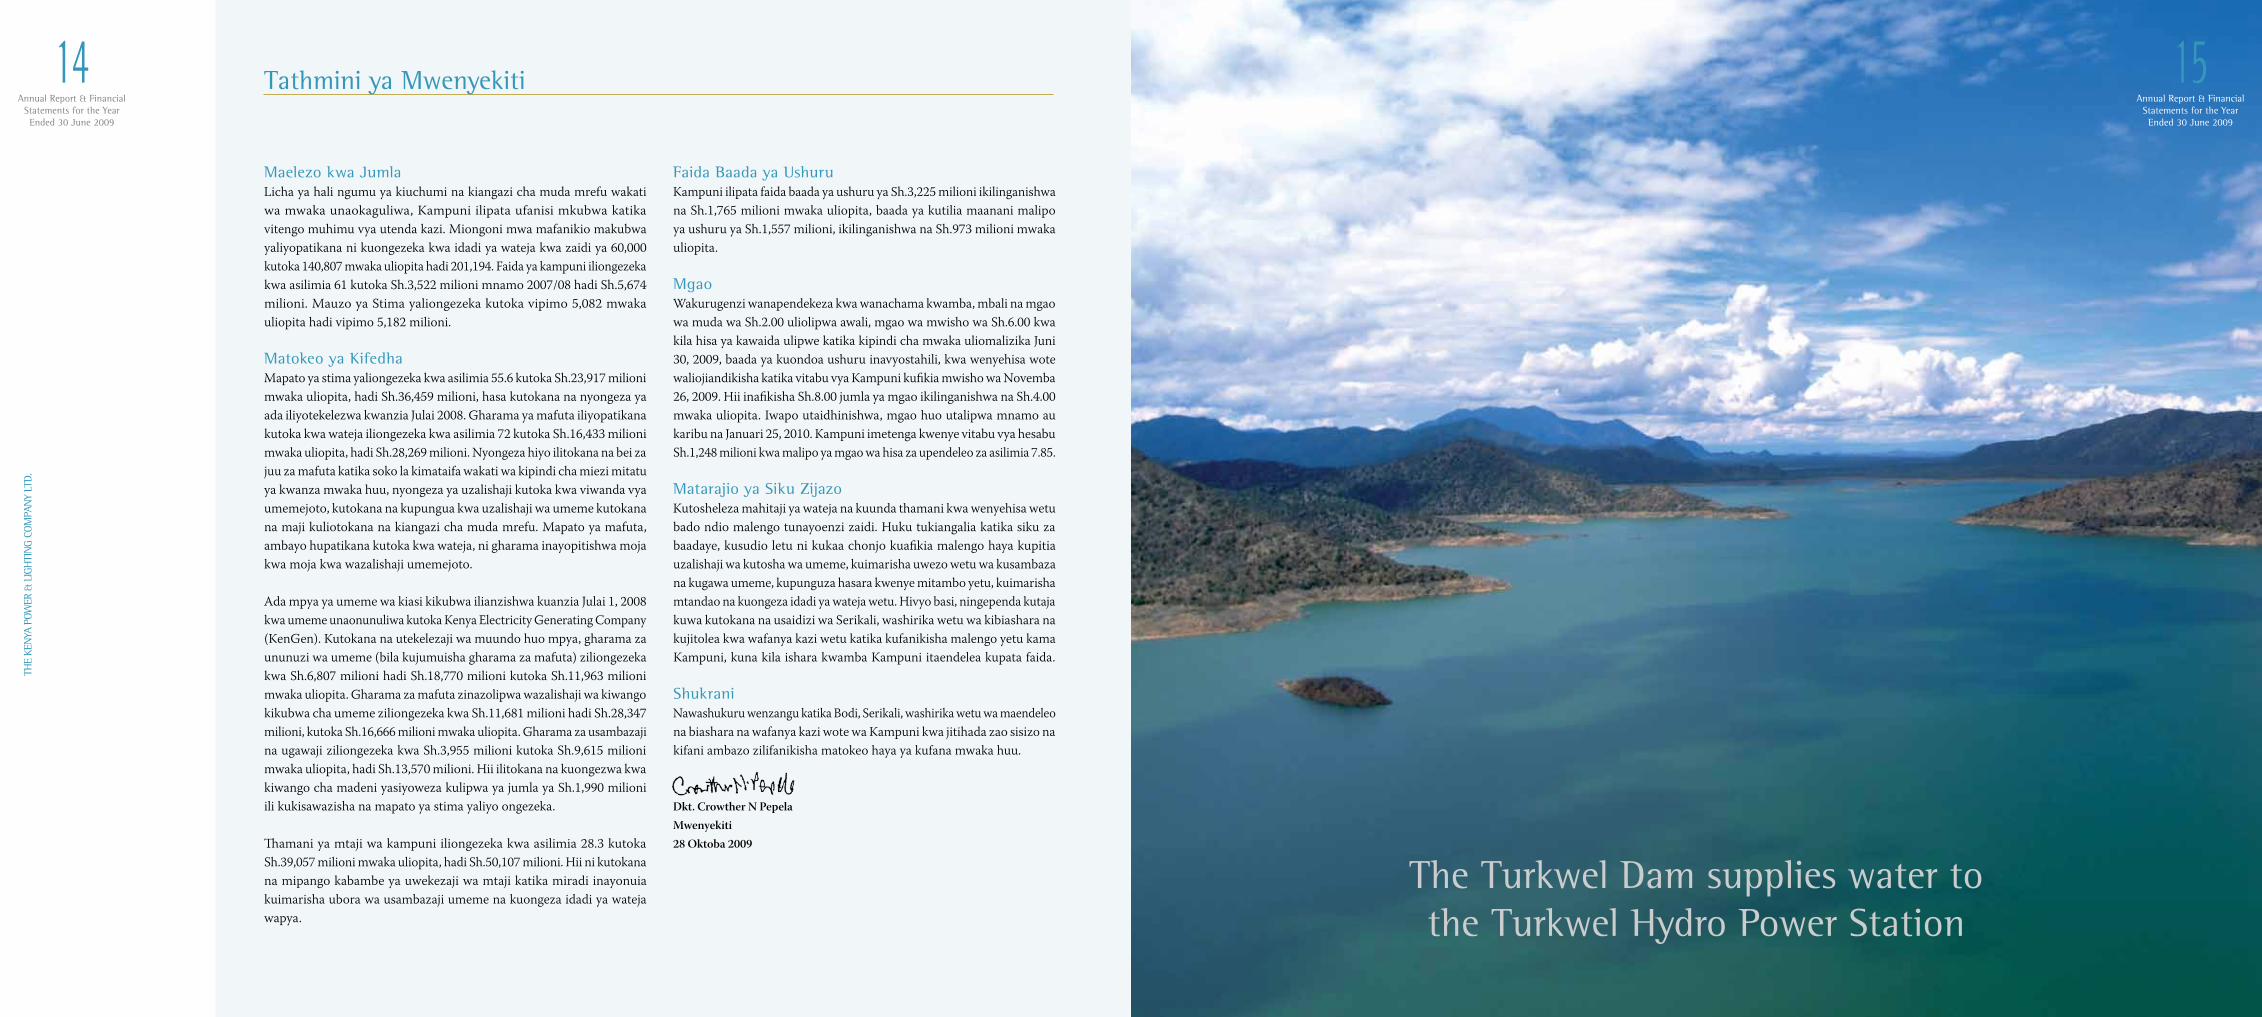
The Turkwel Dam supplies water to the Turkwel Hydro Power Station
Annual Report & FinancialStatements for the YearEnded 30 June 2009
16TH
E KE
NYA
POW
ER &
LIG
HTI
NG
COM
PAN
Y LT
D.
Annual Report & FinancialStatements for the YearEnded 30 June 2009
17
THE
KEN
YA P
OWER
& L
IGH
TIN
G CO
MPA
NY
LTD.
General Overview
Generation CapacityThe maximum daily electricity peak demand recorded was 1,072 MW during the year, compared to 1,044 MW the previous year, an increase of 2.7%. This is suppressed demand, and the actual demand is projected to be in the region of 1,180 MW. On the other hand, the total installed capacity increased from 1,310 MW to 1,345 MW, following the commissioning of 35 MW additional capacity by OrPower4 geothermal plant. The effective capacity rose from 1,267 MW to 1,280 MW, leaving a margin of 7.8%, which is however below the desired 15% margin required to provide for plant outages. Out of the effective capacity, KenGen supplied 964 MW or 74%, while the Independent Power Producers (IPPs) supplied the balance of 26%.
The prolonged drought that has affected the country for the last three years led to reduced hydropower generation. Masinga Dam, the main reservoir for the Seven Forks Hydropower Project, received very low water inflows, and severely reduced power production in the power plants in the entire cascade by 18.4% from 3,488GWh to 2,849GWh. This necessitated the stepping up of generation from thermal power plants, which led to an increase of the fuel cost by Shs.11,681 million to Shs.28,341 million, from Shs.16,666 million the previous year.
In the 2007/08 financial year, the Company signed power purchase agreements for development of a total of an additional 167.1 MW with Iberafrica Power (EA) Ltd. (52.5 MW), Rabai Power Ltd. (88.6 MW), and Mumias Sugar Co. Ltd. (26 MW). The commissioning of these power plants in the second half of 2009 has greatly enhanced the power supply capacity; and helped ease off the load management regime implemented in August/September 2009.
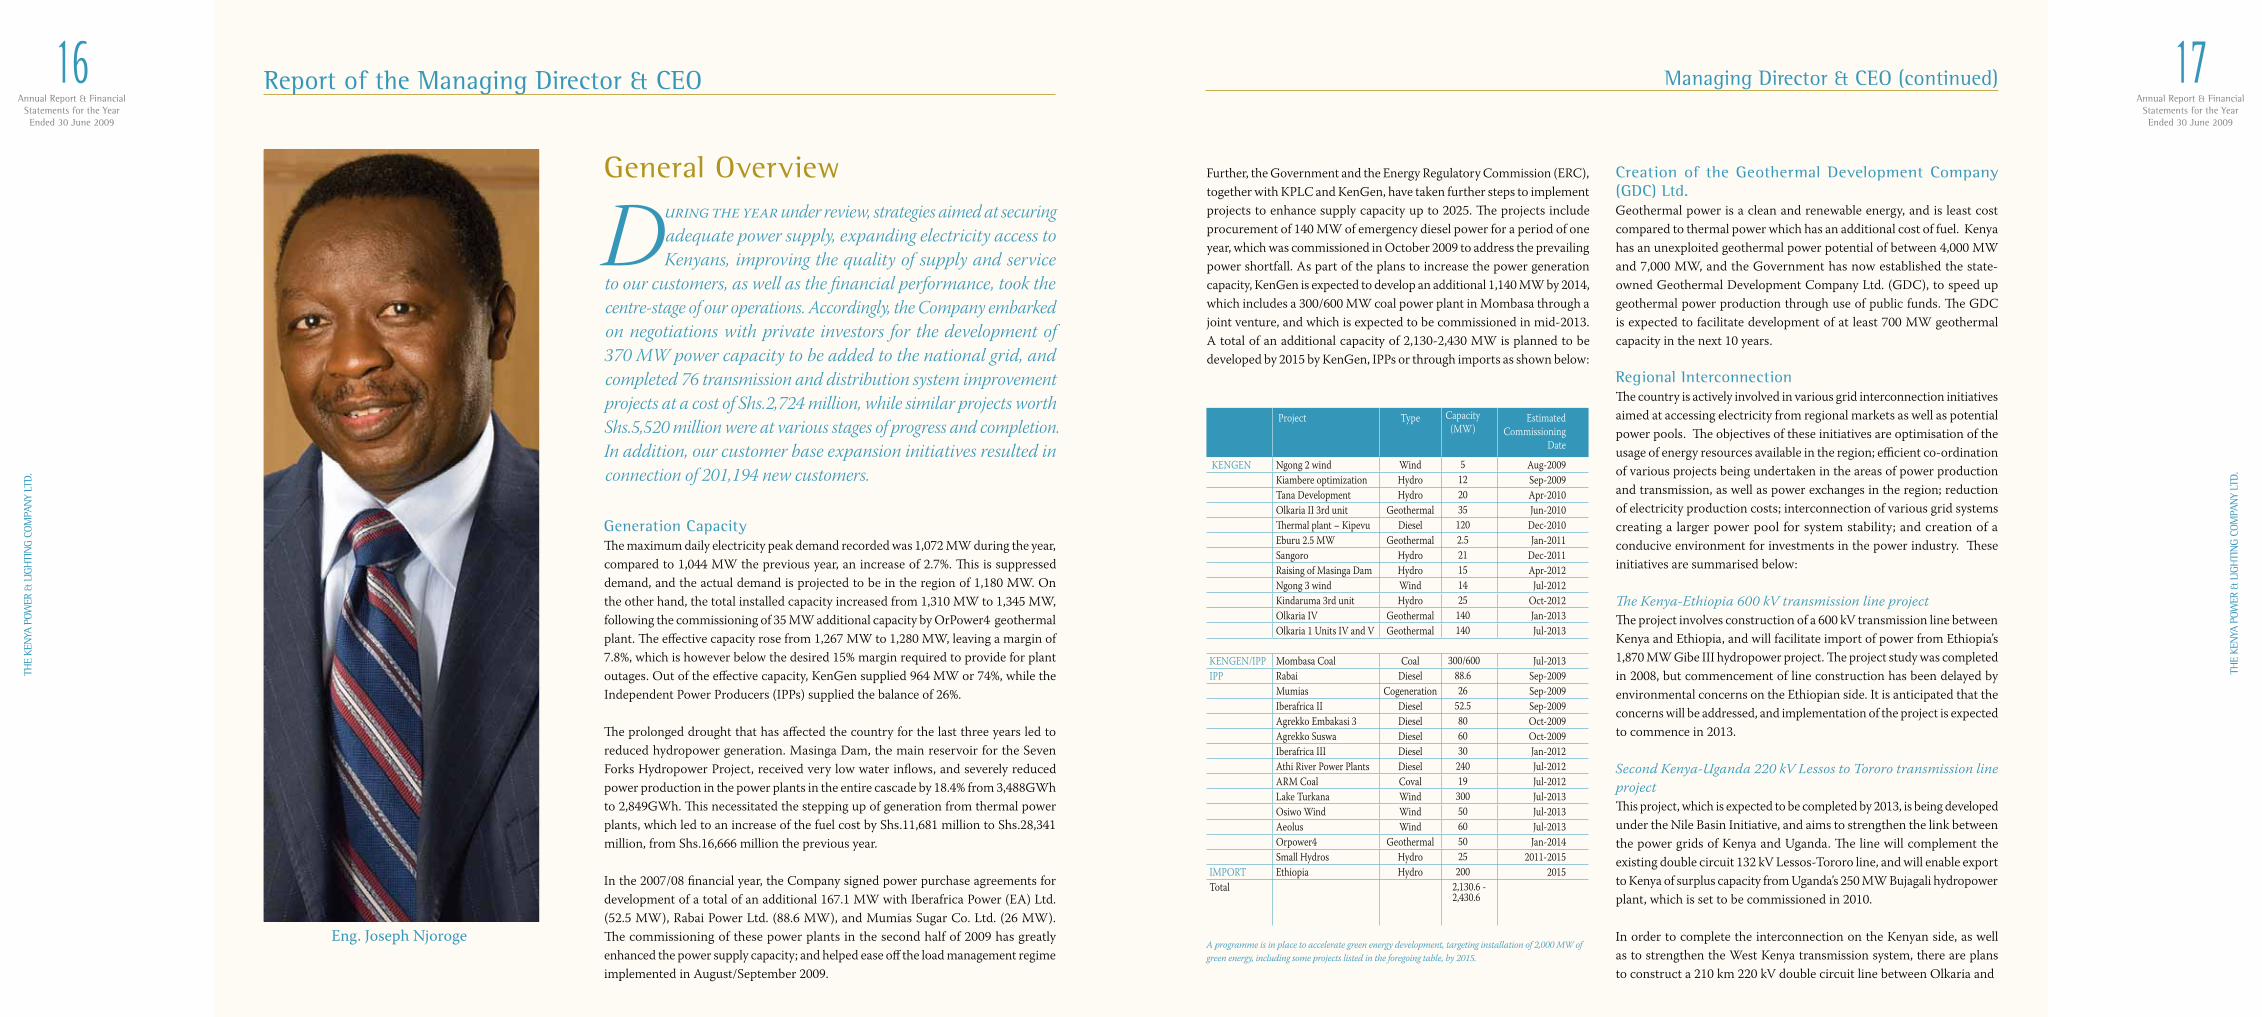
During the year under review, strategies aimed at securing adequate power supply, expanding electricity access to Kenyans, improving the quality of supply and service
to our customers, as well as the financial performance, took the centre-stage of our operations. Accordingly, the Company embarked on negotiations with private investors for the development of 370 MW power capacity to be added to the national grid, and completed 76 transmission and distribution system improvement projects at a cost of Shs.2,724 million, while similar projects worth Shs.5,520 million were at various stages of progress and completion. In addition, our customer base expansion initiatives resulted in connection of 201,194 new customers.
Further, the Government and the Energy Regulatory Commission (ERC), together with KPLC and KenGen, have taken further steps to implement projects to enhance supply capacity up to 2025. The projects include procurement of 140 MW of emergency diesel power for a period of one year, which was commissioned in October 2009 to address the prevailing power shortfall. As part of the plans to increase the power generation capacity, KenGen is expected to develop an additional 1,140 MW by 2014, which includes a 300/600 MW coal power plant in Mombasa through a joint venture, and which is expected to be commissioned in mid-2013. A total of an additional capacity of 2,130-2,430 MW is planned to be developed by 2015 by KenGen, IPPs or through imports as shown below:
Creation of the Geothermal Development Company (GDC) Ltd.Geothermal power is a clean and renewable energy, and is least cost compared to thermal power which has an additional cost of fuel. Kenya has an unexploited geothermal power potential of between 4,000 MW and 7,000 MW, and the Government has now established the state-owned Geothermal Development Company Ltd. (GDC), to speed up geothermal power production through use of public funds. The GDC is expected to facilitate development of at least 700 MW geothermal capacity in the next 10 years.
Regional InterconnectionThe country is actively involved in various grid interconnection initiatives aimed at accessing electricity from regional markets as well as potential power pools. The objectives of these initiatives are optimisation of the usage of energy resources available in the region; efficient co-ordination of various projects being undertaken in the areas of power production and transmission, as well as power exchanges in the region; reduction of electricity production costs; interconnection of various grid systems creating a larger power pool for system stability; and creation of a conducive environment for investments in the power industry. These initiatives are summarised below:
The Kenya-Ethiopia 600 kV transmission line projectThe project involves construction of a 600 kV transmission line between Kenya and Ethiopia, and will facilitate import of power from Ethiopia’s 1,870 MW Gibe III hydropower project. The project study was completed in 2008, but commencement of line construction has been delayed by environmental concerns on the Ethiopian side. It is anticipated that the concerns will be addressed, and implementation of the project is expected to commence in 2013.
Second Kenya-Uganda 220 kV Lessos to Tororo transmission line projectThis project, which is expected to be completed by 2013, is being developed under the Nile Basin Initiative, and aims to strengthen the link between the power grids of Kenya and Uganda. The line will complement the existing double circuit 132 kV Lessos-Tororo line, and will enable export to Kenya of surplus capacity from Uganda’s 250 MW Bujagali hydropower plant, which is set to be commissioned in 2010.
In order to complete the interconnection on the Kenyan side, as well as to strengthen the West Kenya transmission system, there are plans to construct a 210 km 220 kV double circuit line between Olkaria and
Managing Director & CEO (continued)
Project Type Capacity (MW)
Estimated Commissioning
Date
KENGEN Ngong 2 wind Wind 5 Aug-2009 Kiambere optimization Hydro 12 Sep-2009 Tana Development Hydro 20 Apr-2010 Olkaria II 3rd unit Geothermal 35 Jun-2010 Thermal plant – Kipevu Diesel 120 Dec-2010 Eburu 2.5 MW Geothermal 2.5 Jan-2011 Sangoro Hydro 21 Dec-2011 Raising of Masinga Dam Hydro 15 Apr-2012 Ngong 3 wind Wind 14 Jul-2012 Kindaruma 3rd unit Hydro 25 Oct-2012 Olkaria IV Geothermal 140 Jan-2013 Olkaria 1 Units IV and V Geothermal 140 Jul-2013
KENGEN/IPP Mombasa Coal Coal 300/600 Jul-2013IPP Rabai Diesel 88.6 Sep-2009 Mumias Cogeneration 26 Sep-2009 Iberafrica II Diesel 52.5 Sep-2009 Agrekko Embakasi 3 Diesel 80 Oct-2009 Agrekko Suswa Diesel 60 Oct-2009 Iberafrica III Diesel 30 Jan-2012 Athi River Power Plants Diesel 240 Jul-2012 ARM Coal Coval 19 Jul-2012 Lake Turkana Wind 300 Jul-2013 Osiwo Wind Wind 50 Jul-2013 Aeolus Wind 60 Jul-2013 Orpower4 Geothermal 50 Jan-2014 Small Hydros Hydro 25 2011-2015IMPORT Ethiopia Hydro 200 2015Total 2,130.6 -
2,430.6
A programme is in place to accelerate green energy development, targeting installation of 2,000 MW of green energy, including some projects listed in the foregoing table, by 2015.
Eng. Joseph Njoroge
Report of the Managing Director & CEO
Annual Report & FinancialStatements for the YearEnded 30 June 2009
18TH
E KE
NYA
POW
ER &
LIG
HTI
NG
COM
PAN
Y LT
D.
Annual Report & FinancialStatements for the YearEnded 30 June 2009
19
THE
KEN
YA P
OWER
& L
IGH
TIN
G CO
MPA
NY
LTD.
Lessos. A feasibility study on the proposed line, which was carried out in 2002, is currently being reviewed and updated by Nippon Consultants of Japan on behalf of Japan International Co-operation Agency (JICA), the potential financiers. Implementation of this project is scheduled to commence by 2013.
Electricity Supply System ImprovementThe Company has continued to invest in projects and initiatives aimed at achieving high quality power supply with a view to enhancing customer satisfaction, revenue collection and protection; as well as improving operational and financial performance. Following is a summary of some of the electricity supply system improvement projects which were implemented during the year under review.
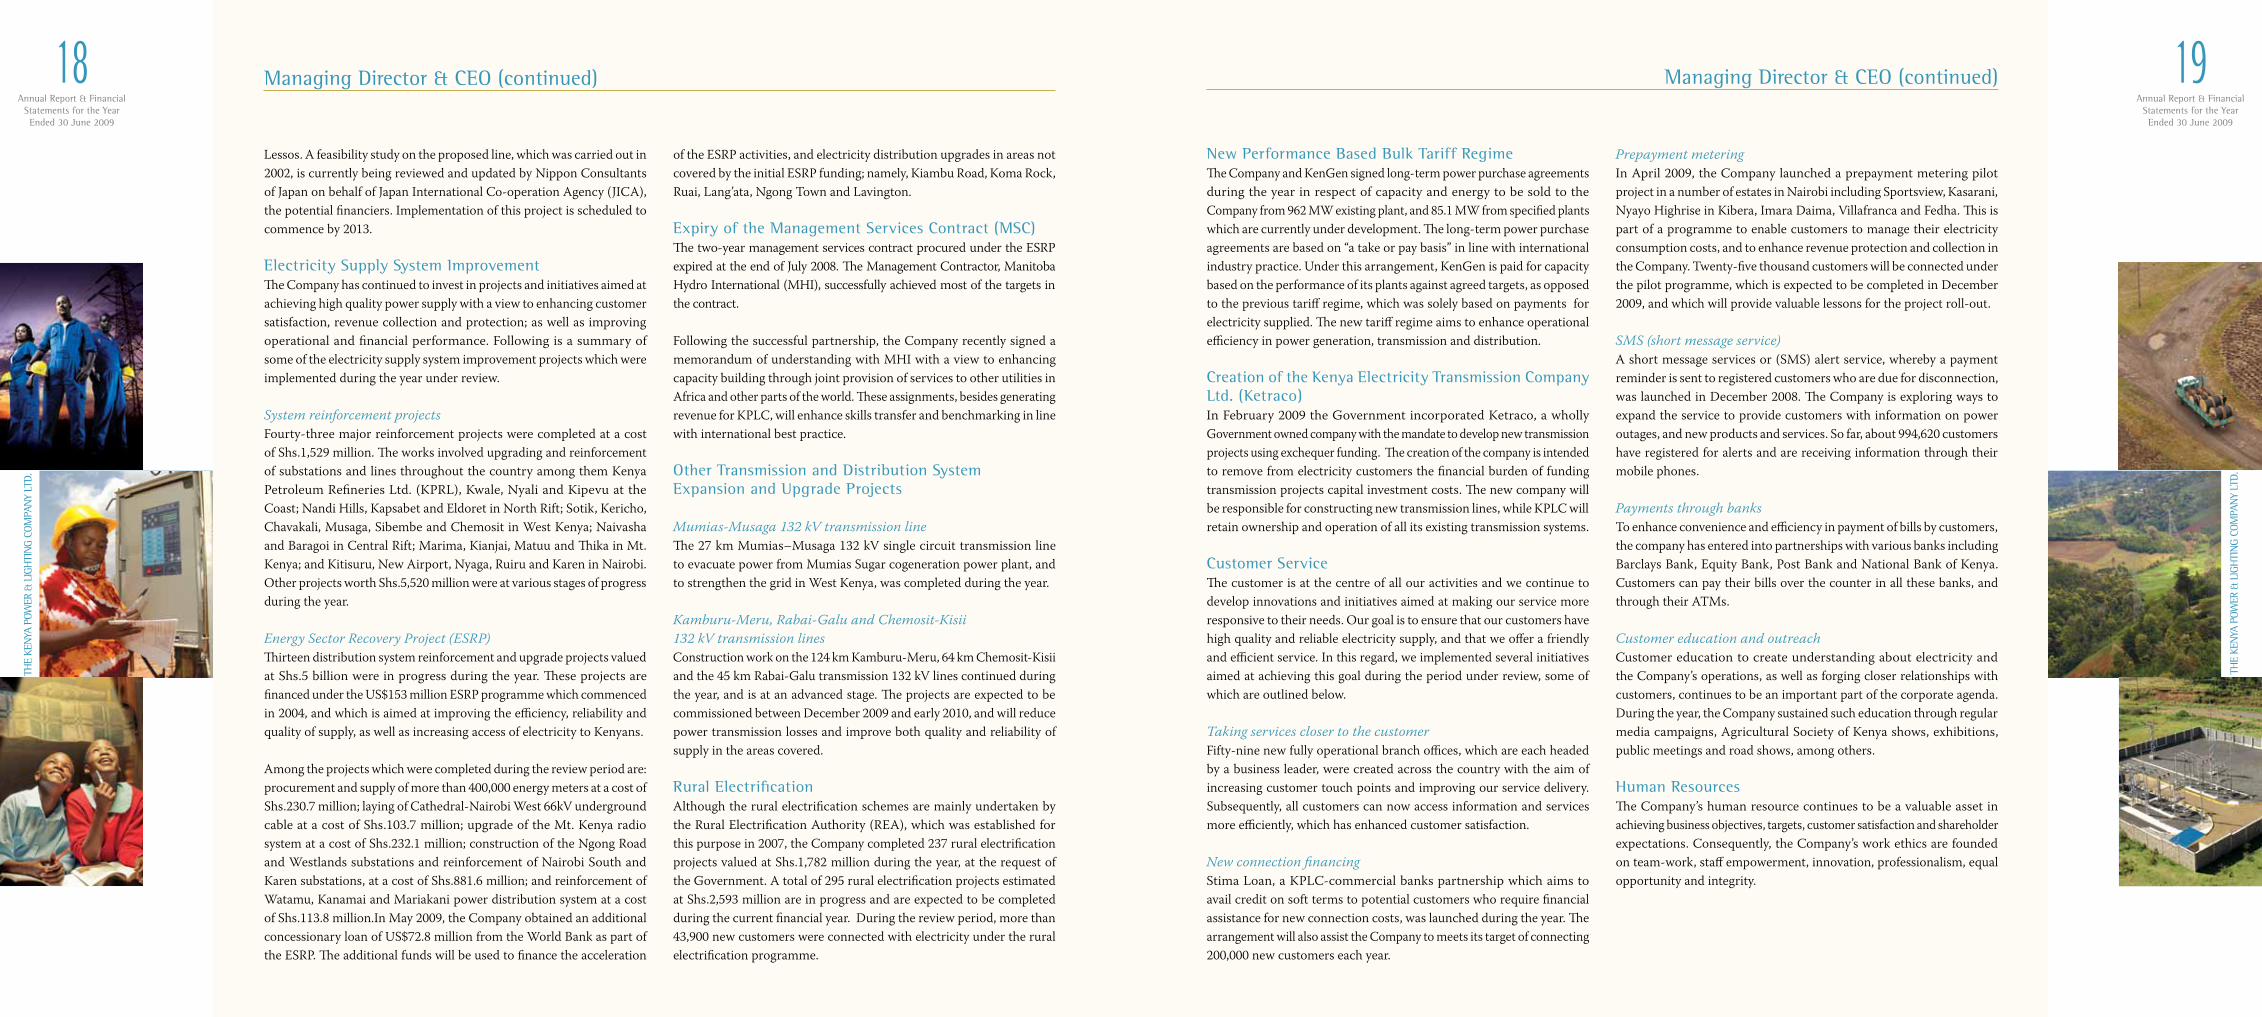
System reinforcement projectsFourty-three major reinforcement projects were completed at a cost of Shs.1,529 million. The works involved upgrading and reinforcement of substations and lines throughout the country among them Kenya Petroleum Refineries Ltd. (KPRL), Kwale, Nyali and Kipevu at the Coast; Nandi Hills, Kapsabet and Eldoret in North Rift; Sotik, Kericho, Chavakali, Musaga, Sibembe and Chemosit in West Kenya; Naivasha and Baragoi in Central Rift; Marima, Kianjai, Matuu and Thika in Mt. Kenya; and Kitisuru, New Airport, Nyaga, Ruiru and Karen in Nairobi. Other projects worth Shs.5,520 million were at various stages of progress during the year.
Energy Sector Recovery Project (ESRP)Thirteen distribution system reinforcement and upgrade projects valued at Shs.5 billion were in progress during the year. These projects are financed under the US$153 million ESRP programme which commenced in 2004, and which is aimed at improving the efficiency, reliability and quality of supply, as well as increasing access of electricity to Kenyans.
Among the projects which were completed during the review period are: procurement and supply of more than 400,000 energy meters at a cost of Shs.230.7 million; laying of Cathedral-Nairobi West 66kV underground cable at a cost of Shs.103.7 million; upgrade of the Mt. Kenya radio system at a cost of Shs.232.1 million; construction of the Ngong Road and Westlands substations and reinforcement of Nairobi South and Karen substations, at a cost of Shs.881.6 million; and reinforcement of Watamu, Kanamai and Mariakani power distribution system at a cost of Shs.113.8 million.In May 2009, the Company obtained an additional concessionary loan of US$72.8 million from the World Bank as part of the ESRP. The additional funds will be used to finance the acceleration
of the ESRP activities, and electricity distribution upgrades in areas not covered by the initial ESRP funding; namely, Kiambu Road, Koma Rock, Ruai, Lang’ata, Ngong Town and Lavington.
Expiry of the Management Services Contract (MSC)The two-year management services contract procured under the ESRP expired at the end of July 2008. The Management Contractor, Manitoba Hydro International (MHI), successfully achieved most of the targets in the contract.
Following the successful partnership, the Company recently signed a memorandum of understanding with MHI with a view to enhancing capacity building through joint provision of services to other utilities in Africa and other parts of the world. These assignments, besides generating revenue for KPLC, will enhance skills transfer and benchmarking in line with international best practice.
Other Transmission and Distribution System Expansion and Upgrade Projects
Mumias-Musaga 132 kV transmission lineThe 27 km Mumias–Musaga 132 kV single circuit transmission line to evacuate power from Mumias Sugar cogeneration power plant, and to strengthen the grid in West Kenya, was completed during the year.
Kamburu-Meru, Rabai-Galu and Chemosit-Kisii 132 kV transmission linesConstruction work on the 124 km Kamburu-Meru, 64 km Chemosit-Kisii and the 45 km Rabai-Galu transmission 132 kV lines continued during the year, and is at an advanced stage. The projects are expected to be commissioned between December 2009 and early 2010, and will reduce power transmission losses and improve both quality and reliability of supply in the areas covered.
Rural ElectrificationAlthough the rural electrification schemes are mainly undertaken by the Rural Electrification Authority (REA), which was established for this purpose in 2007, the Company completed 237 rural electrification projects valued at Shs.1,782 million during the year, at the request of the Government. A total of 295 rural electrification projects estimated at Shs.2,593 million are in progress and are expected to be completed during the current financial year. During the review period, more than 43,900 new customers were connected with electricity under the rural electrification programme.
New Performance Based Bulk Tariff RegimeThe Company and KenGen signed long-term power purchase agreements during the year in respect of capacity and energy to be sold to the Company from 962 MW existing plant, and 85.1 MW from specified plants which are currently under development. The long-term power purchase agreements are based on “a take or pay basis” in line with international industry practice. Under this arrangement, KenGen is paid for capacity based on the performance of its plants against agreed targets, as opposed to the previous tariff regime, which was solely based on payments for electricity supplied. The new tariff regime aims to enhance operational efficiency in power generation, transmission and distribution.
Creation of the Kenya Electricity Transmission Company Ltd. (Ketraco)In February 2009 the Government incorporated Ketraco, a wholly Government owned company with the mandate to develop new transmission projects using exchequer funding. The creation of the company is intended to remove from electricity customers the financial burden of funding transmission projects capital investment costs. The new company will be responsible for constructing new transmission lines, while KPLC will retain ownership and operation of all its existing transmission systems.
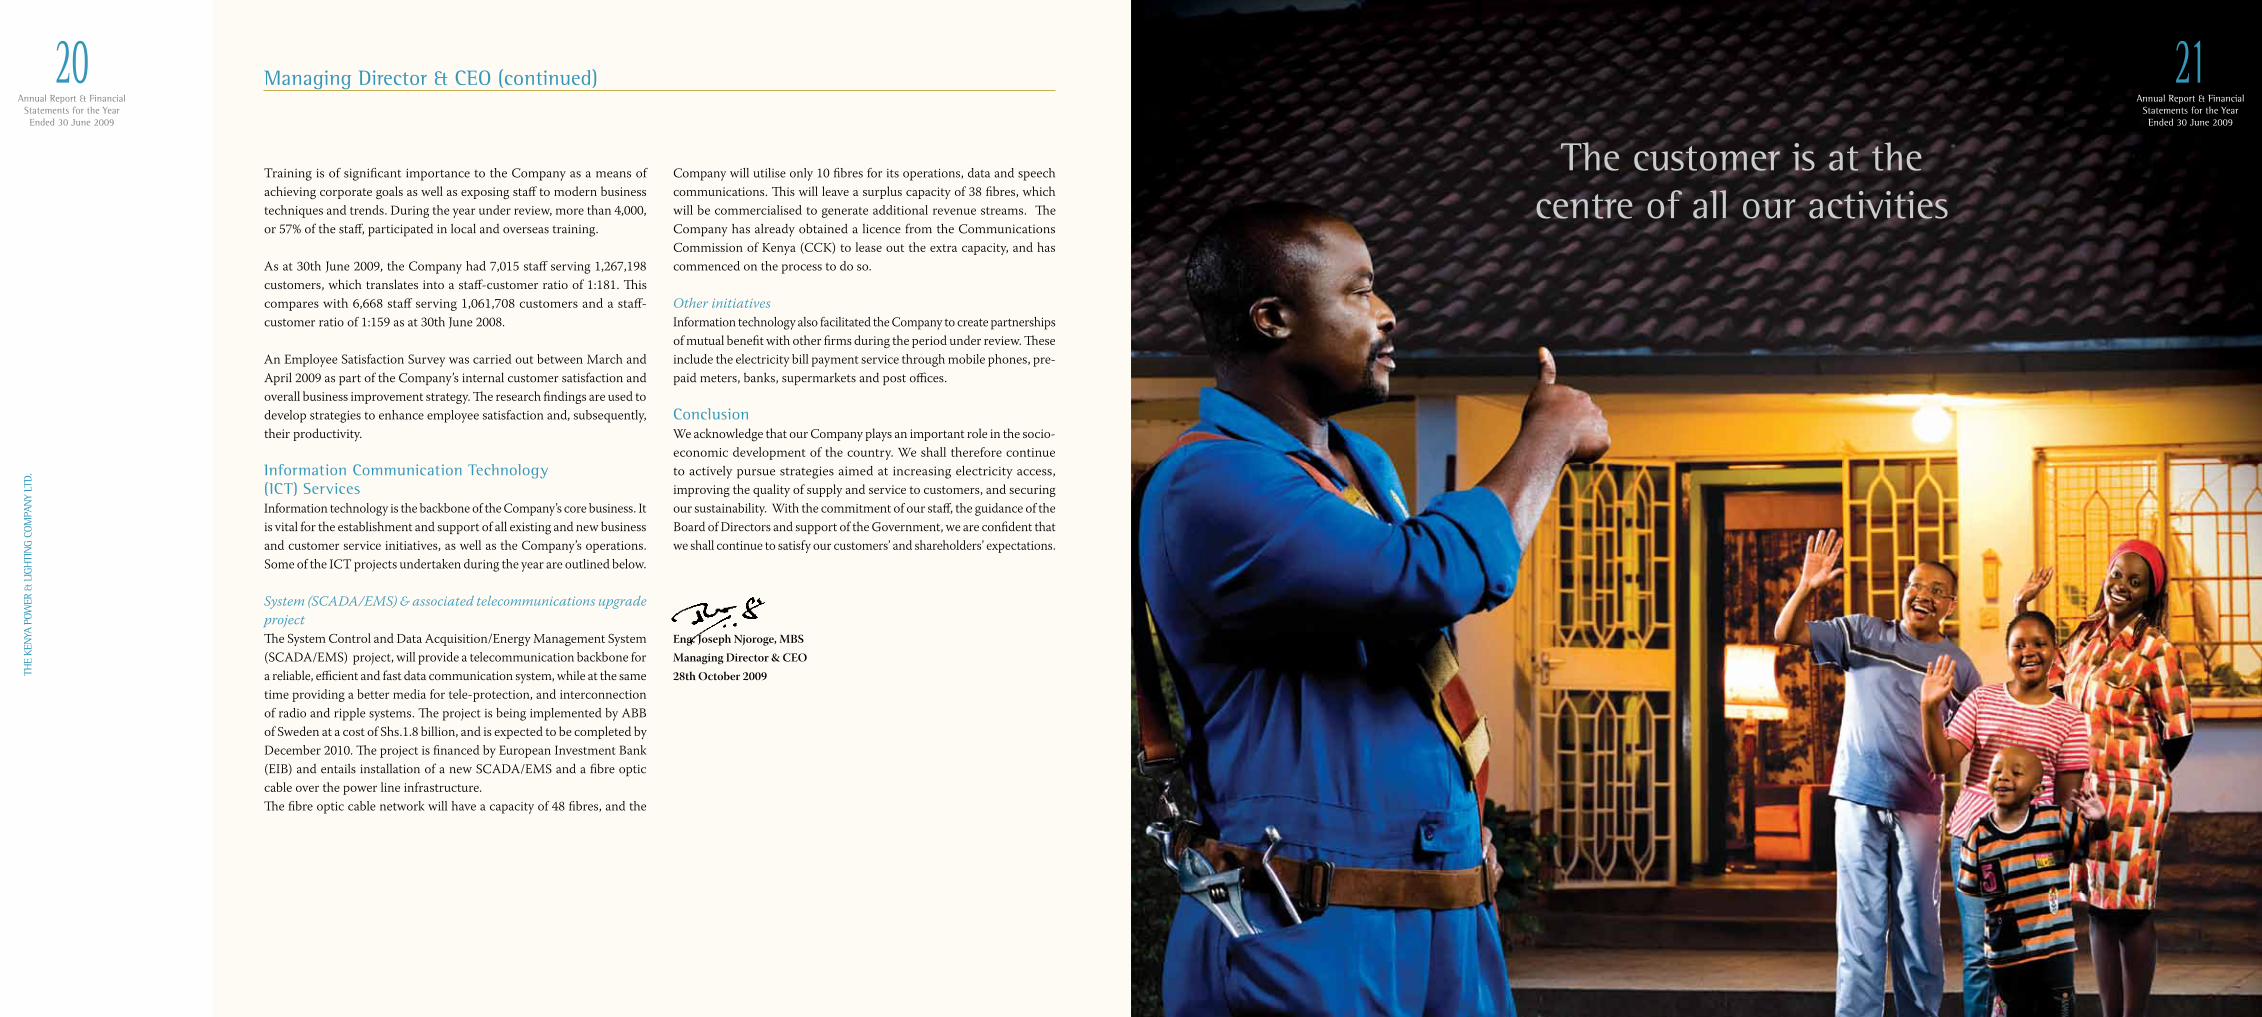
Customer Service The customer is at the centre of all our activities and we continue to develop innovations and initiatives aimed at making our service more responsive to their needs. Our goal is to ensure that our customers have high quality and reliable electricity supply, and that we offer a friendly and efficient service. In this regard, we implemented several initiatives aimed at achieving this goal during the period under review, some of which are outlined below.
Taking services closer to the customerFifty-nine new fully operational branch offices, which are each headed by a business leader, were created across the country with the aim of increasing customer touch points and improving our service delivery. Subsequently, all customers can now access information and services more efficiently, which has enhanced customer satisfaction.
New connection financing Stima Loan, a KPLC-commercial banks partnership which aims to avail credit on soft terms to potential customers who require financial assistance for new connection costs, was launched during the year. The arrangement will also assist the Company to meets its target of connecting 200,000 new customers each year.
Prepayment metering In April 2009, the Company launched a prepayment metering pilot project in a number of estates in Nairobi including Sportsview, Kasarani, Nyayo Highrise in Kibera, Imara Daima, Villafranca and Fedha. This is part of a programme to enable customers to manage their electricity consumption costs, and to enhance revenue protection and collection in the Company. Twenty-five thousand customers will be connected under the pilot programme, which is expected to be completed in December 2009, and which will provide valuable lessons for the project roll-out.
SMS (short message service) A short message services or (SMS) alert service, whereby a payment reminder is sent to registered customers who are due for disconnection, was launched in December 2008. The Company is exploring ways to expand the service to provide customers with information on power outages, and new products and services. So far, about 994,620 customers have registered for alerts and are receiving information through their mobile phones.
Payments through banks To enhance convenience and efficiency in payment of bills by customers, the company has entered into partnerships with various banks including Barclays Bank, Equity Bank, Post Bank and National Bank of Kenya. Customers can pay their bills over the counter in all these banks, and through their ATMs.
Customer education and outreachCustomer education to create understanding about electricity and the Company’s operations, as well as forging closer relationships with customers, continues to be an important part of the corporate agenda. During the year, the Company sustained such education through regular media campaigns, Agricultural Society of Kenya shows, exhibitions, public meetings and road shows, among others.
Human ResourcesThe Company’s human resource continues to be a valuable asset in achieving business objectives, targets, customer satisfaction and shareholder expectations. Consequently, the Company’s work ethics are founded on team-work, staff empowerment, innovation, professionalism, equal opportunity and integrity.
Managing Director & CEO (continued)Managing Director & CEO (continued)
Annual Report & FinancialStatements for the YearEnded 30 June 2009
20TH
E KE
NYA
POW
ER &
LIG
HTI
NG
COM
PAN
Y LT
D.
THE
KEN
YA P
OWER
& L
IGH
TIN
G CO
MPA
NY
LTD.
Annual Report & FinancialStatements for the YearEnded 30 June 2009
21Training is of significant importance to the Company as a means of achieving corporate goals as well as exposing staff to modern business techniques and trends. During the year under review, more than 4,000, or 57% of the staff, participated in local and overseas training.
As at 30th June 2009, the Company had 7,015 staff serving 1,267,198 customers, which translates into a staff-customer ratio of 1:181. This compares with 6,668 staff serving 1,061,708 customers and a staff-customer ratio of 1:159 as at 30th June 2008.
An Employee Satisfaction Survey was carried out between March and April 2009 as part of the Company’s internal customer satisfaction and overall business improvement strategy. The research findings are used to develop strategies to enhance employee satisfaction and, subsequently, their productivity.
Information Communication Technology (ICT) Services Information technology is the backbone of the Company’s core business. It is vital for the establishment and support of all existing and new business and customer service initiatives, as well as the Company’s operations. Some of the ICT projects undertaken during the year are outlined below.
System (SCADA/EMS) & associated telecommunications upgrade projectThe System Control and Data Acquisition/Energy Management System (SCADA/EMS) project, will provide a telecommunication backbone for a reliable, efficient and fast data communication system, while at the same time providing a better media for tele-protection, and interconnection of radio and ripple systems. The project is being implemented by ABB of Sweden at a cost of Shs.1.8 billion, and is expected to be completed by December 2010. The project is financed by European Investment Bank (EIB) and entails installation of a new SCADA/EMS and a fibre optic cable over the power line infrastructure. The fibre optic cable network will have a capacity of 48 fibres, and the
Company will utilise only 10 fibres for its operations, data and speech communications. This will leave a surplus capacity of 38 fibres, which will be commercialised to generate additional revenue streams. The Company has already obtained a licence from the Communications Commission of Kenya (CCK) to lease out the extra capacity, and has commenced on the process to do so.
Other initiatives Information technology also facilitated the Company to create partnerships of mutual benefit with other firms during the period under review. These include the electricity bill payment service through mobile phones, pre-paid meters, banks, supermarkets and post offices.
ConclusionWe acknowledge that our Company plays an important role in the socio-economic development of the country. We shall therefore continue to actively pursue strategies aimed at increasing electricity access, improving the quality of supply and service to customers, and securing our sustainability. With the commitment of our staff, the guidance of the Board of Directors and support of the Government, we are confident that we shall continue to satisfy our customers’ and shareholders’ expectations.
Eng. Joseph Njoroge, MBSManaging Director & CEO28th October 2009
Managing Director & CEO (continued)
The customer is at thecentre of all our activities
Annual Report & FinancialStatements for the YearEnded 30 June 2009
22TH
E KE
NYA
POW
ER &
LIG
HTI
NG
COM
PAN
Y LT
D.
Annual Report & FinancialStatements for the YearEnded 30 June 2009
23
THE
KEN
YA P
OWER
& L
IGH
TIN
G CO
MPA
NY
LTD.
MukhtasariWakati wa mwaka tunaotathmini, mikakati iliyonuia kupata kiwango cha kutosha cha umeme, kuwezesha Wakenya zaidi kupata umeme, kuimarisha kiwango cha usambazaji na huduma yetu kwa wateja, pamoja na matokeo ya kifedha, ilikuwa azima kuu katika huduma zetu. Hivyo basi, Kampuni ilianzisha mashauriano na wawekezaji wa kibinafsi kuhusiana na uzalishaji wa MW 370 ambazo zitaongezwa kwenye mfumo wa kitaifa wa waya za kusambaza stima, na kukamilisha miradi 76 ya kuboresha usambazaji wa umeme kwa gharama ya Sh.2,724 milioni, huku miradi kama hiyo ya thamani ya Sh.5,520 milioni ilikuwa kwenye awamu tofauti za ujenzi na ukamilishaji. Isitoshe, mipango yetu ya kuongeza idadi ya wateja wetu ilituwezesha kunasa wateja wapya 201,194.
Kiwango cha UzalishajiKatika mwaka uliokamilika, kiwango cha juu zaidi cha mahitaji ya umeme kilichorekodiwa ni MW 1,072, ikilinganishwa na MW 1,044 mwaka uliotangulia, nyongeza ya asilimia 2.7. Isipokuwa ni kuwa na upungufu wa kiwango cha uzalishaji, mahitaji ya umeme yangefikia MW 1,180.
Kwa upande mwingine, jumla ya kiwango cha uzalishaji umeme kiliongezeka kutoka MW 1,310 hadi MW 1,345, kufuatia kuzinduliwa kwa kiwanda cha umememvuke cha OrPower4 ambacho kilizalisha MW 35 zaidi. Hivyo uwezo wa uzalishaji umeme uliongezeka kutoka MW 1,267 hadi MW 1,280 na hivyo kuacha kiwango cha ziada cha asilimia 7.8, ambacho ni kidogo kuliko kile kinachohitajika cha asilimia 15 endapo mitambo itaharibika. Kati ya umeme unaosambazwa, KenGen ilizalisha MW 964 au asilimia 74, ilhali Kampuni za Kibinafsi za Uzalishaji Umeme (IPPs) zikazalisha masalio ya asilimia 26.
Kiangazi cha muda mrefu kilichokumba taifa kwa muda wa miaka mitatu iliyopita, kilipunguza uzalishaji wa umeme kutokana na maji. Bwawa kuu la uzalishaji umeme la Masinga, lililipokea kiwango kidogo zaidi cha maji, na hiyo iliathiri uwezo wa uzalishaji umeme kwenye vituo vyote vya uzalishaji umeme vya mto Tana kwa asilimia 18.4, kutoka GWh3,488 hadi GWh2,849. Kufuatia hali hii, ilihitaji uzalishaji zaidi uimarishwe kutokana na viwanda vya mafuta, na hii iliongeza gharama ya mafuta kwa Sh.11,681 milioni hadi Sh.28,341 milioni, kutoka Sh.16,666 milioni mwaka uliopita.
Katika mwaka wa fedha wa 2007/08, Kampuni ilitia sahini mikataba ya ununuzi wa umeme ili kuwezesha uwekezaji wa jumla ya MW 167.1 na Iberafrica Power (EA) Ltd. (MW52.5), Rabai Power Ltd. (MW 88.6), na Mumias Sugar Co. Ltd. (MW26), ambao uzinduzi wake katikati ya 2009 uliimarisha kikamilifu usambazaji wa umeme. Uzinduzi wa viwanda hivi vya umeme katika nusu ya pili ya 2009 umeimarisha maradufu uzalishaji wa umeme na kupunguza athari
za ugawaji umeme kwa vipimo uliotekelezwa mnamo Agosti/Septemba 2009. Serikali na Tume ya Kusimamia Kawi (ERC) pamoja na KPLC na KenGen, zimechukua hatua zaidi kutekeleza miradi ya kuongeza umeme hadi 2025. Miradi hiyo ni pamoja na ununuzi wa MW 140 za dharura kwa kipindi cha mwaka mmoja, ambayo ilizinduliwa mnamo Oktoba 2009 kushughulikia upungufu uliopo kwa sasa. Kama sehemu ya kuongeza uwezo wake wa uzalishaji umeme, KenGen inatarajiwa kukuza MW 1,140 zaidi kufikia 2014, ikiwa ni pamoja na kiwanda cha makaa cha kuzalisha MW 300/600 Mombasa kupitia mradi wa pamoja, na ambao unatarajiwa kuzinduliwa katikati ya 2013. Jumla ya MW 2,130 hadi 2,430 zaidi zinaratibiwa kukuzwa kufikia 2015 na KenGen na Kampuni huru za uzalishaji au kupitia uagizaji kutoka nje kama inavyoonyeshwa hapa chini:
Kuanzishwa kwa Geothermal Development Company (GDC) Ltd.Nguvu za umememvuke ni kawi safi na isiyoweza kuisha, na gharama yake ni nafuu ikilinganishwa na umemejoto ambayo ina gharama zaidi ya mafuta. Kenya ina uwezo wa kuzalisha kati ya MW 4,000 na MW 17,000 kutokana na umememvuke na Serikali sasa imeanzisha kampuni yake Geothermal Development Company Ltd. (GDC), kuharakisha uzalishaji wa umeme kupitia matumizi ya fedha za umma. GDC inatarajiwa kuwezesha utoaji wa angalau MW 700 kutokana na umememvuke katika kipindi cha miaka 10 ijayo.
Kuunganishwa kwa MaeneoNchi hii imo kwenye harakati za kuungana na mitandao mingine katika kanda hii kwa lengo la kunufaika na stima kutoka kwa masoko ya eneo hili. Malengo ya mipango hii ni kutumia ipasavyo raslimali za kawi zilizopo katika nchi jirani, uratibishaji ufaao wa miradi tofauti inayoendelea katika nyanja za uzalishaji umeme na usambazaji pamoja na ubadilishaji wa umeme katika kanda; kupunguza gharama za uzalishaji wa umeme; kuunganisha mitandao ya kanda hii ili kutosheleza mahitaji ya wote na kuboresha mitandao, na kubuniwa kwa mazingira yafaayo kwa uwekezaji katika sekta ya umeme. Mipango hii yote imeainishwa kwa mukhtasari hapa chini:
Mradi wa laini ya kV 600 za umeme wa Kenya-Ethiopia Mradi huu unahusisha ujenzi wa laini ya kusafirisha kV 600 za umeme kati ya Kenya na Ethiopia, na utawezesha uagizaji wa umeme kutoka kiwanda cha Ethiopia cha Gibe III cha MW 1,870. Tathmini kuhusu uwezekano wa mradi huo ilimalizika mnamo 2008, lakini shughuli ya ujenzi imecheleweshwa na masuala ya kimazingira kutoka upande wa Ethiopia. Malalamishi hayo yanatarajiwa kutatuliwa, na utekelezaji wa mradi unatarajiwa kuanza mnamo 2013.
Laini ya pili ya kusafirisha kV220 Kenya-Uganda kutoka Lessos hadi Tororo Mradi huu, ambao unatarajiwa kukamilika kufikia 2013, unastawishwa chini ya Mpango wa Bonde la Mto Nile (Nile Basin Initiative) na unanuia kuimarisha muungano wa mtandao wa nyaya za umeme za Kenya na Uganda. Laini hiyo itasaidia ile ya sasa ya kV132 ya kutoka Lessos hadi Tororo, na itawezesha Kenya kuagiza umeme wa ziada kutoka kiwanda cha Bujagali kitakachozalisha MW 250, wakati kikizinduliwa mnamo 2010.
Ili kukamilisha muungano huo wa nyaya katika upande wa Kenya, pamoja na kuimarisha mtandao wa usambazaji katika eneo la Magharibi mwa Kenya, laini ya kilomita 210 ya kusafirisha kV220 kati ya Olkaria na Lessos
inapangiwa kujengwa. Uchunguzi kuhusu uwezekano wa ujenzi wa laini hiyo ambao ulifanywa mnamo 2002, kwa sasa unaendelea kuangaliwa na kupigwa msasa na Nippon Consultants ya Japan kwa niaba ya Japan International Co-operation Agency (JICA), ambao huenda wakawa wafadhili wa mradi huo. Utekelezaji wa mradi huo unatazamiwa kuanza kufikia 2013.
Uimarishaji wa Mfumo wa Usambazaji Umeme Kampuni imeendelea kuwekeza katika miradi na mipango inayonuia kufikia usambazaji wa hali ya juu wa umeme kwa lengo la kutosheleza wateja wetu, kukusanya na kutunza mapato, pamoja na kuimarisha utendaji kazi na pato letu. Ufuatao ni mukhtasari wa baadhi ya miradi ya kuimarisha usambazaji umeme ambayo ilitekelezwa katika mwaka tunaouangazia.
Miradi ya kuimarisha mitambo yetuMiradi 43 mikubwa ya kuimarisha mitambo ilikamilika kwa gharama ya Sh.1,529 milioni. Miradi hiyo ilihusu uimarishaji na ukarabati wa vituo vyetu vidogo na laini za ugawaji umeme kote nchini miongoni mwao zikiwa zile za Kenya Petroleum Refineries Ltd. (KPRL), Kwale, Nyali na Kipevu eneo la Pwani; Nandi Hills, Kapsabet na Eldoret katika North Rift; Sotik, Kericho, Chavakali, Musaga, Sibembe na Chemosit Magharibi mwa Kenya; Naivasha na Baragoi katika Central Rift; Marima, Kianjai, Matuu na Thika katika Mlima Kenya; na Kitisuru, New Airport, Nyaga, Ruiru na Karen, Nairobi. Miradi mingine ya thamani ya Sh.5,520 milioni ilikuwa katika awamu tofauti za ujenzi katika kipindi hicho.
Miradi ya Ufufuzi wa Sekta ya Kawi (ESRP) Miradi mingine 13 ya kuimarisha na kustawisha mitambo ya ugawaji umeme ya thamani ya Sh.5 bilioni ilikuwa inaendelea katika mwaka uliomalizika. Miradi hii inafadhiliwa chini ya mpango wa ESRP wa thamani ya US$153 milioni ambao ulianza 2004, na unaolenga kuboresha utegemeaji na uimarishaji pamoja na ubora wa usambazaji, pamoja na kuongeza idadi ya Wakenya wanaopata nguvu za umeme. Miongoni mwa miradi iliyomalizika mwaka uliopita ni ununuzi wa mita 400,000 za kawi kwa gharama ya Sh.230.7 milioni, kuwekwa kwa kebo ya kV 66 chini ya ardhi kutoka kituo kidogo cha Cathedral hadi kile cha Nairobi West kwa gharama ya Sh.103.7 milioni; kuimarishwa kwa mitambo ya mawasiliano ya redio Mlima Kenya kwa gharama ya Sh.232.1 milioni; ujenzi wa vituo vidogo vya Ngong Road na Westlands na kuimarishwa kwa vituo vidogo vya Nairobi South na Karen kwa gharama ya Sh.881.6 milioni; na kuimarisha ufanisi wa mitambo ya ugawaji umeme ya Watamu, Kanamai na Mariakani kwa gharama ya Sh.113.8 milioni. Mnamo Mei 2009, Kampuni ilipokea mkopo wa masharti nafuu wa
Ripoti ya Mkurugenzi Mkuu na Afisa Mkuu Mtendaji Ripoti ya Mkurugenzi Mkuu na Afisa Mkuu Mtendaji (unaendelea)
Mradi Aina Kiwango (MW)
Tarehe inayokadiriwa
ya uzinduzi KENGEN Ngong 2 wind Wind 5 Agosti-2009 Kiambere optimization Hydro 12 Septemba-2009 Tana Development Hydro 20 Aprili-2010 Olkaria II 3rd unit Geothermal 35 Juni-2010 Thermal plant – Kipevu Diesel 120 Desemba-2010 Eburu 2.5 MW Geothermal 2.5 Januari-2011 Sangoro Hydro 21 Desemba-2011 Kuinua Bwawa la Masinga Hydro 15 Aprili-2012 Ngong 3 wind Wind 14 Julai-2012 Kindaruma 3rd unit Hydro 25 Oktoba-2012 Olkaria IV Geothermal 140 Januari-2013 Olkaria I Units IV and V Geothermal 140 Julai-2013
KENGEN/IPP Mombasa Coal Coal 300/600 Julai-2013IPP Rabai Diesel 88.6 Septemba-2009 Mumias Cogeneration 26 Septemba-2009 Iberafrica II Diesel 52.5 Septemba-2009 Agrekko Embakasi 3 Diesel 80 Oktoba-2009 Agrekko Suswa Diesel 60 Oktoba-2009 Iberafrica III Diesel 30 Januari-2012 Athi River Power Plants Diesel 240 Julai-2012 ARM Coal Coval 19 Julai-2012 Lake Turkana Wind 300 Julai-2013 Osiwo Wind Wind 50 Julai-2013 Aeolus Wind 60 Julai-2013 Orpower4 Geothermal 50 Januari-2014 Small Hydros Hydro 25 2011-2015Uigizaji kutoka inje
Ethiopia Hydro 200 2015
Jumla 2,130.6 - 2,430.6
Kuna mpango wa kuharakisha ustawishaji wa kawi isiyokuwa na athari kwa mazingira, inayolenga kuzalisha MW 2,000, ikiwemo baadhi ya miradi iliyoorodheshwa kwenye jedwali hapo juu kufikia 2015.
Annual Report & FinancialStatements for the YearEnded 30 June 2009
24TH
E KE
NYA
POW
ER &
LIG
HTI
NG
COM
PAN
Y LT
D.
Annual Report & FinancialStatements for the YearEnded 30 June 2009
25
THE
KEN
YA P
OWER
& L
IGH
TIN
G CO
MPA
NY
LTD.
US$72.8 milioni kutoka kwa Benki ya Dunia kama sehemu ya ESRP. Fedha hizo za ziada zitatumiwa kufadhili shughuli za ESRP, na kuimarisha mitambo ya usambaji umeme katika maeneo ambayo hayakunufaika na ufadhili wa awali wa ESRP; ambayo ni: Kiambu Road, Koma Rock, Ruai, Lang’ata, Ngong Town na Lavington.
Kumalizika kwa Kandarasi ya Usimamizi (MSC)Kandarasi ya usimamizi ya miaka miwili ambayo ilifanywa chini ya mpango wa ESRP ilimalizika mwishoni mwa Julai 2008. Mwanakandarasi huyo, Manitoba Hydro International, alitimiza mengi ya malengo kwenye mkataba. Kufuatia ushirikiano uliofaulu, Kampuni hivi majuzi ilitia sahihi Mkataba wa Maelewano na MHI kwa lengo la kuimarisha ujenzi wa miundo msingi kupitia utoaji huduma wa pamoja kwa mashirika mengine Afrika na sehemu zingine za dunia. Shughuli hiyo, mbali na kuingizia KPLC mapato, itasaidia katika ugawanaji maarifa na kutoa vigezo vya ubora sambamba na utenda kazi bora kimataifa.
Miradi Mingine ya Kupanua Mitambo ya Usafirishaji na Ugawaji Umeme
Laini ya kusafirisha umeme ya kV 132 ya Mumias-Musaga Ujenzi wa laini ya kV132 ya Mumias-Musaga ya kilomita 27 ambayo itahamisha umeme kutoka kiwanda cha sukari cha Mumias na pia kuimarisha mtandao wa usambazaji wa umeme katika eneo la Magharibi mwa Kenya, ulimalizika mwaka uliopita.
Laini za kusafirisha umeme kV132 za Kamburu-Meru, Rabai-Galu na Chemosit-Kisii Ujenzi wa laini ya kutoka Kamburu hadi Meru ya kilomita 124, na ile ya Chemosit hadi Kisii ya kilomita 64 pamoja na ile ya kutoka Rabai hadi Galu ya kilomita 45, uliendelea mwaka uliopita, na unakaribia kumalizika. Miradi hiyo inatazamiwa kuzinduliwa kati ya Desemba 2009 na mapema 2010, na itapunguza upoteaji wa umeme unaposafirishwa na kuboresha viwango na utegemeaji wa umeme katika maeneo husika.
Usambazaji Umeme Maeneo ya MashambaniIngawa miradi ya kusambaza umeme katika sehemu za mashambani inatekelezwa hasa na Rural Electrification Authority (REA) ambayo ilianzishwa kwa lengo hilo mnamo 2007, Kampuni ilikamilisha miradi 237 ya kusambaza umeme katika sehemu za mashambani kwa gharama ya Sh.1,782 milioni katika mwaka uliopita kufuatia ombi la Serikali. Jumla ya miradi 295 ya kusambaza umeme katika sehemu za mashambani inayokadiriwa kugharimu Sh.2,593 milioni inaendelea, na inatarajiwa
kumalizika katika kipindi cha sasa cha mwaka wa fedha. Katika kipindi tunachotathmini, zaidi ya wateja wapya 43,900 walipokea stima chini ya mpango wa usambazaji umeme katika sehemu za nyanjani.
Mfumo Mpya wa Orodha ya BeiKampuni na KenGen zilitia sahihi mikataba ya muda mrefu ya ununuzi wa umeme mnamo Juni 2009 kuhusiana na uzalishaji wa umeme ambao utauziwa Kampuni kutoka viwanda mbalimbali vya kuzalisha MW 962 na MW 85.1 kutoka kwa viwanda maalumu ambazo kwa sasa zinaendelea kujengwa. Mikataba hiyo ya muda mrefu inazingatia mfumo wa ‘chukua au ulipe’ sambamba na utaratibu wa kimataifa katika sekta hiyo. Chini ya mpango huu, KenGen italipwa kulingana na utenda kazi wa mitambo yake na pia inavyotimiza malengo yaliyokubaliwa, badala ya mfumo wa awali ambapo malipo yalitegemea kiwango cha umeme uliozalishwa na kusambaziwa Kampuni. Mpangilio huu mpya wa orodha ya bei unanuia kuimarisha utenda kazi katika uzalishaji wa umeme, usafirishaji na ugawaji.
Kubuniwa kwa Kenya Electricity Transmission Company Ltd. (Ketraco)Mnamo Februari 2009, Serikali ilianzisha kampuni ya Ketraco, shirika linalomilikiwa na Serikali, ambalo jukumu lake ni kuanzisha miradi mipya ya usafirishaji umeme kwa ufadhili wa fedha za umma. Hii inanuia kuondoa mzigo wa gharama za kufadhili ujenzi wa mitambo ya usafirishaji kutoka kwa wateja wa umeme. Kampuni hiyo mpya itahusika katika ujenzi wa laini mpya za usafirishaji huku KPLC ikimiliki mitambo yake yote ya sasa ya usafirishaji umeme.
Huduma kwa WatejaMteja ni muhimu katika shughuli zetu zote na huwa tunaendelea kubuni mbinu na njia za kuhudumia wateja wetu kwa njia bora hata zaidi. Lengo letu ni kuhakikisha kuwa wateja wetu wanasambaziwa umeme kwa njia ifaayo kila wakati, na kwamba tunatoa huduma bora na kwa njia ya kirafiki. Kwa mintaarafu hii, tulitekeleza taratibu kadha zinazolenga kufanikisha shabaha hii katika mwaka unaomalizika, baadhi yao zinafafanuliwa hapa chini.
Kupeleka huduma karibu na mtejaAfisi 59 mpya za matawi ambazo tayari zinafanya kazi, kila moja ikiwa chini ya kiongozi wa biashara, zilibuniwa kote nchini kwa lengo la kuwafikia wateja kwa urahisi na kuboresha utoaji huduma zetu. Kufuatia hali hiyo, wateja wote sasa wanaweza kupokea maelezo na huduma kwa njia ya rahisi, hali ambayo imetosheleza mahitaji ya wateja wetu.
Ufadhili kwa wateja wapya Mkopo wa Stima, ambao ni ushirikiano wa benki za biashara na KPLC wenye lengo la kuwapatia wale wateja wanaotafuta mikopo ya masharti nafuu kuwawezesha kusambaziwa umeme, ulianzishwa mwaka uliomalizika hivi punde. Mpango huo utawezesha Kampuni kufikia azima yake ya kuunganisha wateja 200,000 wapya kila mwaka.
Mita za kulipia kabla ya matumizi Mnamo Aprili 2009, Kampuni ilizindua mradi wa majaribio wa mita za kulipia kabla ya matumizi katika mitaa kadha ya Nairobi ikiwemo Sportsview, Kasarani, Nyayo Highrise, Kibera, Imara Daima, Villafranca na Fedha. Hii ni sehemu ya mpango unaolenga kuwezesha wateja kudhibiti gharama za matumizi yao ya stima na kuimarisha ukusanyaji na utunzaji wa mapato ya Kampuni. Wateja elfu 25 watakuwa wameshirikishwa kwenye mpango huu wa majaribio ambao unatarajiwa kumalizika Desemba 2009, na ambao unatazamiwa kutoa mafunzo muhimu yatakayotumiwa baadaye mradi huo utakaposhirikisha sehemu zote za nchi.
Huduma za Ujumbe Mfupi (SMS) Huduma za ujumbe mfupi au SMS, ambapo kumbusho kuhusu malipo inatumwa kwa wateja waliosajiliwa na ambao wanakaribia kukatiwa stima ilianzishwa Desemba 2008. Tunatathmini namna ya kupanua huduma hii kuwapa wateja maelezo kuhusu kupotea kwa umeme, na pia bidhaa na huduma mpya. Kufikia sasa, takribani wateja 994,620 wamejiandikisha kwa huduma hii na wanapokea taarifa kupitia simu zao.
Malipo kupitia benki Ili kurahisisha utaratibu wa wateja wa kulipa bili zao, Kampuni imefanya mikataba na benki mbalimbali zikiwemo Barclays Bank, Equity Bank, Post Bank na National Bank of Kenya. Wateja wanaweza kulipa bili zao kwenye benki hizi au kupitia mitambo yao ya ATM.
Mafunzo na ushirikiano na wateja Kuelimisha wateja ili kuwawezesha kuelewa kuhusu umeme na huduma zetu, pamoja na kukuza ushirikiano wa karibu na wateja wetu ni mojawapo ya ajenda yetu kuu kama shirika. Mwaka uliopita, tuliendesha mafunzo hayo kupitia kampeni za mara kwa mara kupitia vyombo vya habari, Maonyesho ya Kilimo nchini, mikutano ya hadhara na kwenye maonyesho ya barabarani, miongoni mwa zingine.
Wafanya KaziWafanya kazi wanaendelea kuwa kiungo muhimu katika kufanikisha malengo ya kibiashara ya Kampuni, kutosheleza matarajio ya wateja na
pia wenyehisa. Hivyo basi, mfumo wa maadili ya kazi yetu umejikita katika ushirikiano, mafunzo ya watumishi wetu, ubunifu, nafasi sawa na uadilifu.
Kampuni inaendelea kuwekeza katika ustawi wa wafanya kazi kupitia mafunzo. Mwaka uliopita, zaidi ya wafanya kazi 4,000 au asilimia 57 ya wahudumu wote walihudhuria mafunzo ya kiufundi na yasiyo ya kiufundi nchini na ng’ambo. Kufikia Juni 30, 2009, Kampuni ilikuwa na wafanya kazi 7,015 wanaohudumia wateja 1,267,198 na hivyo mfanya kazi mmoja kuhudumia wateja 181. Hii inalinganishwa na wafanya kazi 6,668 wakihudumia wateja 1,061,708, yaani mfanya kazi mmoja kuhudumia wateja 159 kufikia Juni 30, 2008.
Kampuni ilifanya uchunguzi wa maoni ya wafanya kazi kuhusu Kampuni kati ya Machi na Aprili 2009 kama sehemu ya kutosheleza matakwa ya wateja na ufanisi wa biashara kwa jumla. Kampuni inajitolea kutekeleza mapendekezo yaliyofanywa na wafanya kazi ili kuzidisha motisha na uzalishaji wao.
Huduma za Teknolojia ya Mawasiliano (ICT) Teknolojia ya mawasiliano ni nguzo kuu katika shughuli muhimu za Kampuni. Ni muhimu katika kuanzisha na kuunga mkono mipangilio mipya ya kibiashara na ile iliyopo na pia ya kusaidia wateja, pamoja na operesheni za Kampuni. Miongoni mwa miradi ya ICT ambayo ilitekelezwa mwaka uliopita ni kama ifutatavyo:
Mradi wa kuimarisha mitambo ya SCADA/EMS na mingine ya mawasiliano Mfumo wa kudhibiti Data na Usimamizi wa Kawi (SCADA/EMS) utatoa mfumo bora na ufaao wa kusambaza data, kuboresha operesheni za mitambo ya umeme na pia kuunganisha mitambo ya redio za mawasiliano za Kampuni miongoni mwa mengine . Mradi huo unaotekelezwa na ABB ya Sweden kwa gharama ya Sh.1.8 bilioni, unatarajiwa kukamilika Desemba 2010. Mradi huu unafadhiliwa na European Investment Bank (EIB) na unahusisha uwekaji wa kebo mpya ya fibre optic juu ya laini za umeme.
Mtandao wa kebo ya fibre optic utakuwa na nyuzi 48, na Kampuni itatumia nyuzi 10 pekee kwa operesheni zake, data na mawasiliano ya simu, na hivyo kuacha nyuzi zingine 38 za ziada, ambazo zitakodishwa kuiletea kampuni mapato zaidi. Kampuni tayari imepokea leseni kutoka kwa Tume ya Mawasiliano nchini (CCK) kukodisha nyuzi hizo za ziada, na imeanzisha utaratibu wa kufanya hivyo.
Ripoti ya Mkurugenzi Mkuu na Afisa Mkuu Mtendaji (unaendelea) Ripoti ya Mkurugenzi Mkuu na Afisa Mkuu Mtendaji (unaendelea)
Annual Report & FinancialStatements for the YearEnded 30 June 2009
26TH
E KE
NYA
POW
ER &
LIG
HTI
NG
COM
PAN
Y LT
D.
Annual Report & FinancialStatements for the YearEnded 30 June 2009
27
THE
KEN
YA P
OWER
& L
IGH
TIN
G CO
MPA
NY
LTD.
Mipango mingineTeknolojia ya mawasiliano pia iliwezesha Kampuni kuunda ushirika wenye manufaa na kampuni zingine katika kipindi kinachoangaziwa. Manufaa hayo ni pamoja na huduma ya malipo ya bili za stima kupitia simu za mkono, mita za malipo kabla ya kutumia, na malipo kupitia benki, maduka ya jumla na posta.
Hitimisho Tunatambua kwamba Kampuni yetu inatekeleza wajibu muhimu katika ustawi wa kiuchumi na kijamii nchini. Hivyo basi, tutaendelea kutafuta mikakati inayonuia kuwezesha wengi kupata umeme, kuimarisha viwango vya usambazaji na huduma kwa wateja na kuhakikisha ufanisi wa Kampuni siku za baadaye. Kutokana na kujitolea kwa wafanya kazi wetu, mwongozo wa Bodi ya Wakurugenzi na kuungwa mkono na Serikali, tuna imani kwamba tutaendelea kutosheleza matarajio ya wateja wetu na wenyehisa.
Mhandisi Joseph Njoroge, MBSMkurugenzi Mkuu Na Afisa Mkuu Mtendaji 28 Oktoba 2009
Corporate Social Responsibility & Environmental Report
Our CommitmentOur social and environmental responsibility means a continuing commitment to the millions of people who reside in our diverse operating environments. As a responsible and sensitive corporate citizen, we are driven by our host communities to ensure that our activities meet and exceed the social, environmental and economic expectations of all stakeholders. We are also driven by international and local strategies aimed at achieving social developmental milestones such as the UN’s Millennium Development Goals (MDG) and Kenya’s Vision 2030, whose aim is to produce annual economic growth rates of 10 percent.
The Company has an existing Corporate Social Responsibility Policy which acknowledges the following: • Thatwehavearesponsibilitytothesocietytoprovideadequateand reliable power supply throughout the country. • Thatourbusinessactivitieshavevaryingdirectandindirectimpacts on the environment and societies in which we operate.• Thatoursocial,economicandenvironmentalresponsibilitiesare integral to our business.• Thatwemustintegrateourbusinessvaluesandoperationstomeet the expectations of our stakeholders.• Thatourstakeholdersincludecustomers,employees,regulators, investors, suppliers, the general public and various communities.
In line with our Policy, during the year under review, we set aside one percent of our after-tax profit to support sustainable corporate social responsibility causes, events and individuals across the diverse areas of healthcare, education and the environment. Further, all our corporate policies, projects implementation, innovations and business practices reflect our commitment to being a socially responsible corporate entity. This commitment was apparent throughout the review period, and some of the CSR activities we undertook are outlined below:
Enabling Access to Electricity Access to electricity contributes to poverty reduction, and also to improvement of health and education of citizens. In line with this, the Company is fully committed to realise the Government’s commitment to provide electricity access to one million more Kenyans by 2012/2013. In this regard, we connected 201,194 new customers with electricity during the year under review. Additionally, the company has evolved group schemes
and negotiated loan facilities with local banks at low interest rates, to facilitate cheaper and faster connection of Kenyans with electricity.
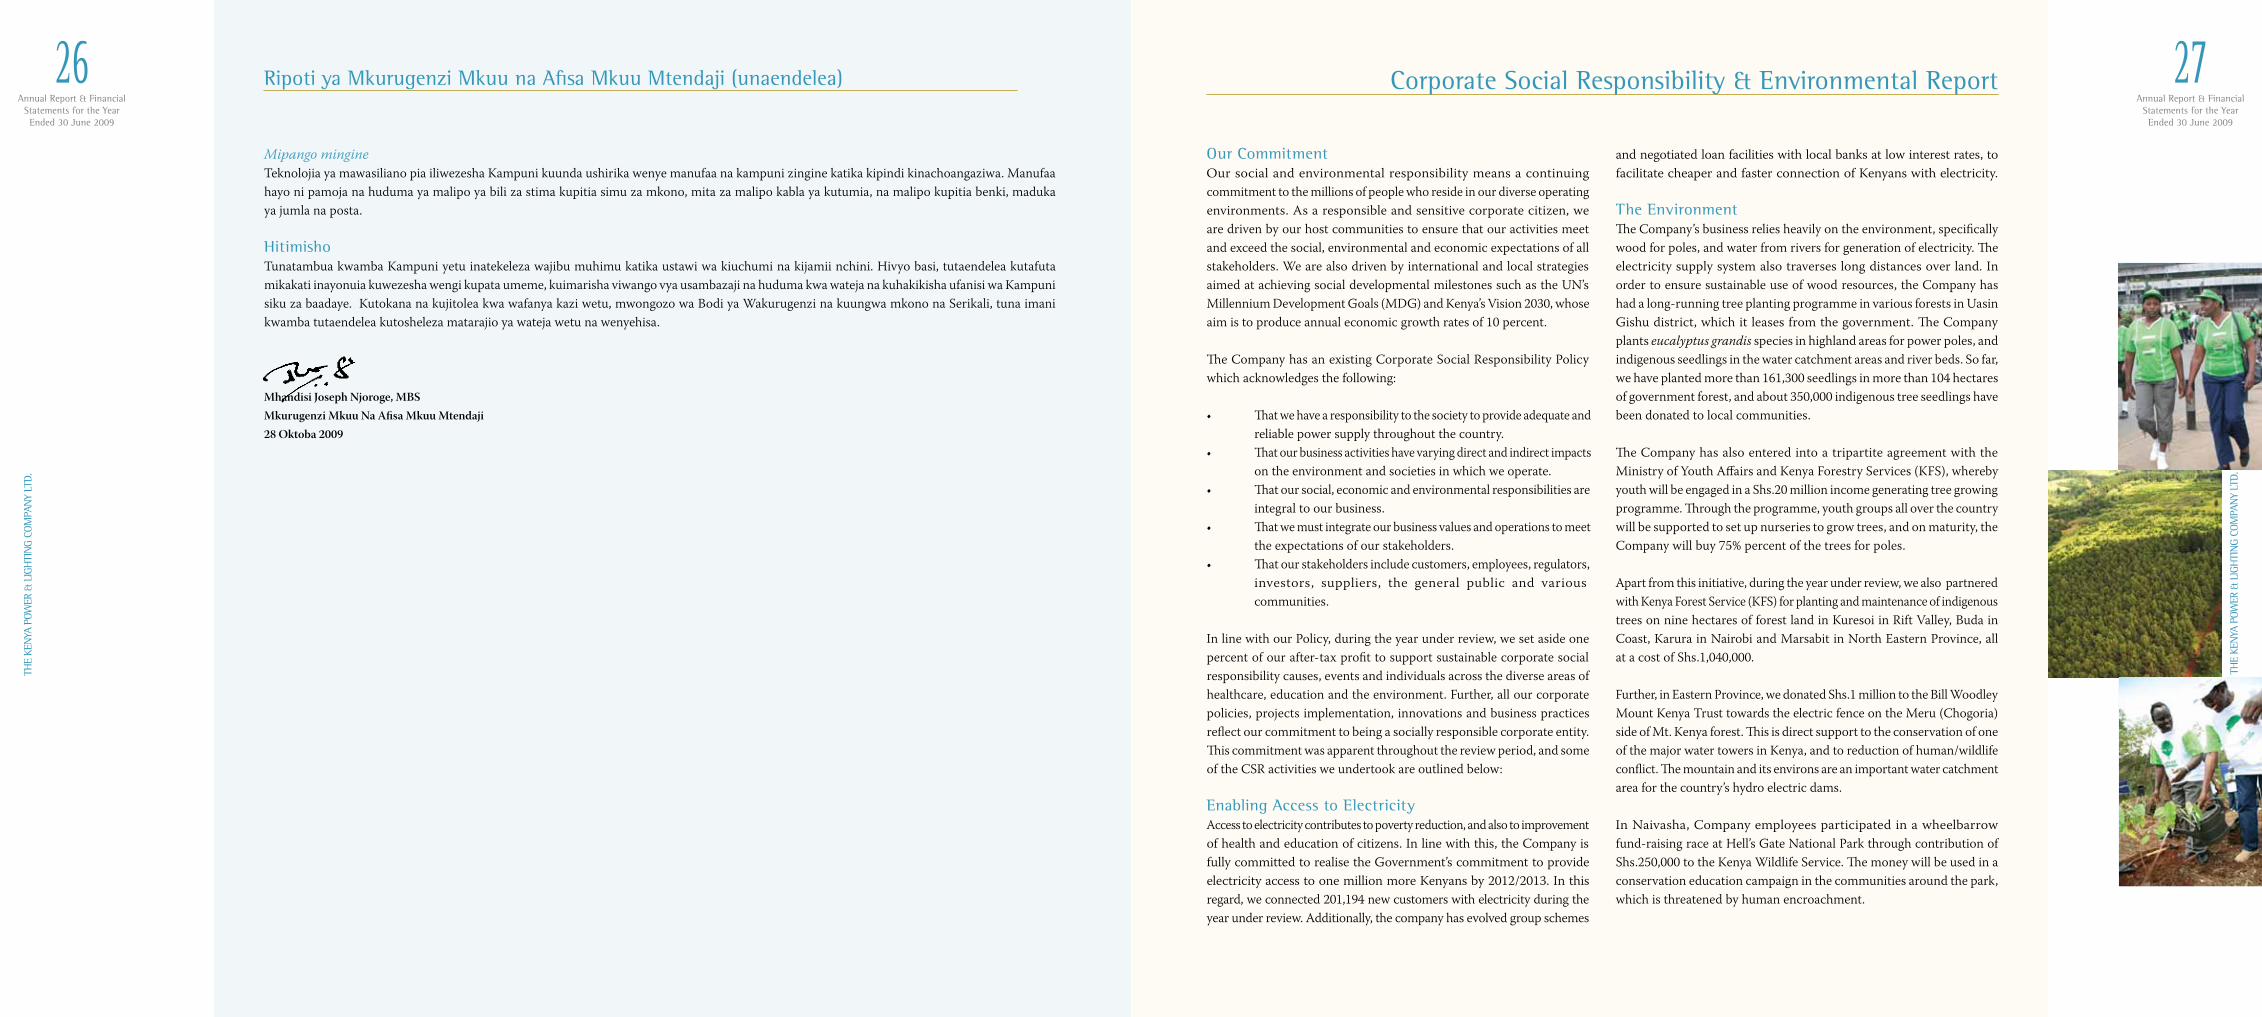
The EnvironmentThe Company’s business relies heavily on the environment, specifically wood for poles, and water from rivers for generation of electricity. The electricity supply system also traverses long distances over land. In order to ensure sustainable use of wood resources, the Company has had a long-running tree planting programme in various forests in Uasin Gishu district, which it leases from the government. The Company plants eucalyptus grandis species in highland areas for power poles, and indigenous seedlings in the water catchment areas and river beds. So far, we have planted more than 161,300 seedlings in more than 104 hectares of government forest, and about 350,000 indigenous tree seedlings have been donated to local communities.
The Company has also entered into a tripartite agreement with the Ministry of Youth Affairs and Kenya Forestry Services (KFS), whereby youth will be engaged in a Shs.20 million income generating tree growing programme. Through the programme, youth groups all over the country will be supported to set up nurseries to grow trees, and on maturity, the Company will buy 75% percent of the trees for poles. Apart from this initiative, during the year under review, we also partnered with Kenya Forest Service (KFS) for planting and maintenance of indigenous trees on nine hectares of forest land in Kuresoi in Rift Valley, Buda in Coast, Karura in Nairobi and Marsabit in North Eastern Province, all at a cost of Shs.1,040,000.
Further, in Eastern Province, we donated Shs.1 million to the Bill Woodley Mount Kenya Trust towards the electric fence on the Meru (Chogoria) side of Mt. Kenya forest. This is direct support to the conservation of one of the major water towers in Kenya, and to reduction of human/wildlife conflict. The mountain and its environs are an important water catchment area for the country’s hydro electric dams.
In Naivasha, Company employees participated in a wheelbarrow fund-raising race at Hell’s Gate National Park through contribution of Shs.250,000 to the Kenya Wildlife Service. The money will be used in a conservation education campaign in the communities around the park, which is threatened by human encroachment.
Ripoti ya Mkurugenzi Mkuu na Afisa Mkuu Mtendaji (unaendelea)
Annual Report & FinancialStatements for the YearEnded 30 June 2009
28TH
E KE
NYA
POW
ER &
LIG
HTI
NG
COM
PAN
Y LT
D.
Annual Report & FinancialStatements for the YearEnded 30 June 2009
29
THE
KEN
YA P
OWER
& L
IGH
TIN
G CO
MPA
NY
LTD.
Energy ConservationEnergy conservation in general, and conservation of electricity in particular, is important to the Company and its customers and, once again, the company sponsored the annual Energy Management Awards with Shs.1.5 million. During the annual event, Kenyan companies with the best energy efficient practices are honoured. In addition, an energy efficiency campaign targeted at our customers and the general public was carried in the media and through road shows throughout the year.
Safety and HealthDuring the year, the Company’s Safety and Health Department (SHE) carried out an environmental and health and safety audits companywide in line with the Company’s strategic objective of providing a safe and health work environment. The Company appoints numerous third party contractors, and the SHE department regularly trains them on appropriate environmental and health and safety standards in line with best practice.
Apart from the foregoing, the Company also uses non ozone-depleting (CFC free) transformer oils, and practices proper management of hazardous waste (e.g. waste oils from transformers), as stipulated in the Company’s Waste Disposal Policy.
Gender Equality and Empowerment of WomenThe Company promotes gender equality and affirmative action for women regarding employment in the technical fields, and has a Gender Committee headed by a manager, which is very active and which meets regularly. During the year, the committee mooted strategies for developing a gender policy, gender mainstreaming plan, awareness seminars and dissemination of information, harassment and discrimination and equal opportunities policies. These policies and plans will be implemented by June 2010.
Education
KPLC Training SchoolKPLC contributes to the country’s job market and skills through tertiary technical education at the Company’s Training School in Ruaraka, Nairobi, which also admits non-KPLC staff. Last year, 499 students were enrolled at the school, and 137 graduated with various diplomas and certificates.
Support to schoolsWith the education of thousands of pupils threatened by the current drought, we donated Shs.2.4 million to support school feeding programmes in primary schools in arid areas through a programme which is administered by the Ministry of Education and the World Food Programme.
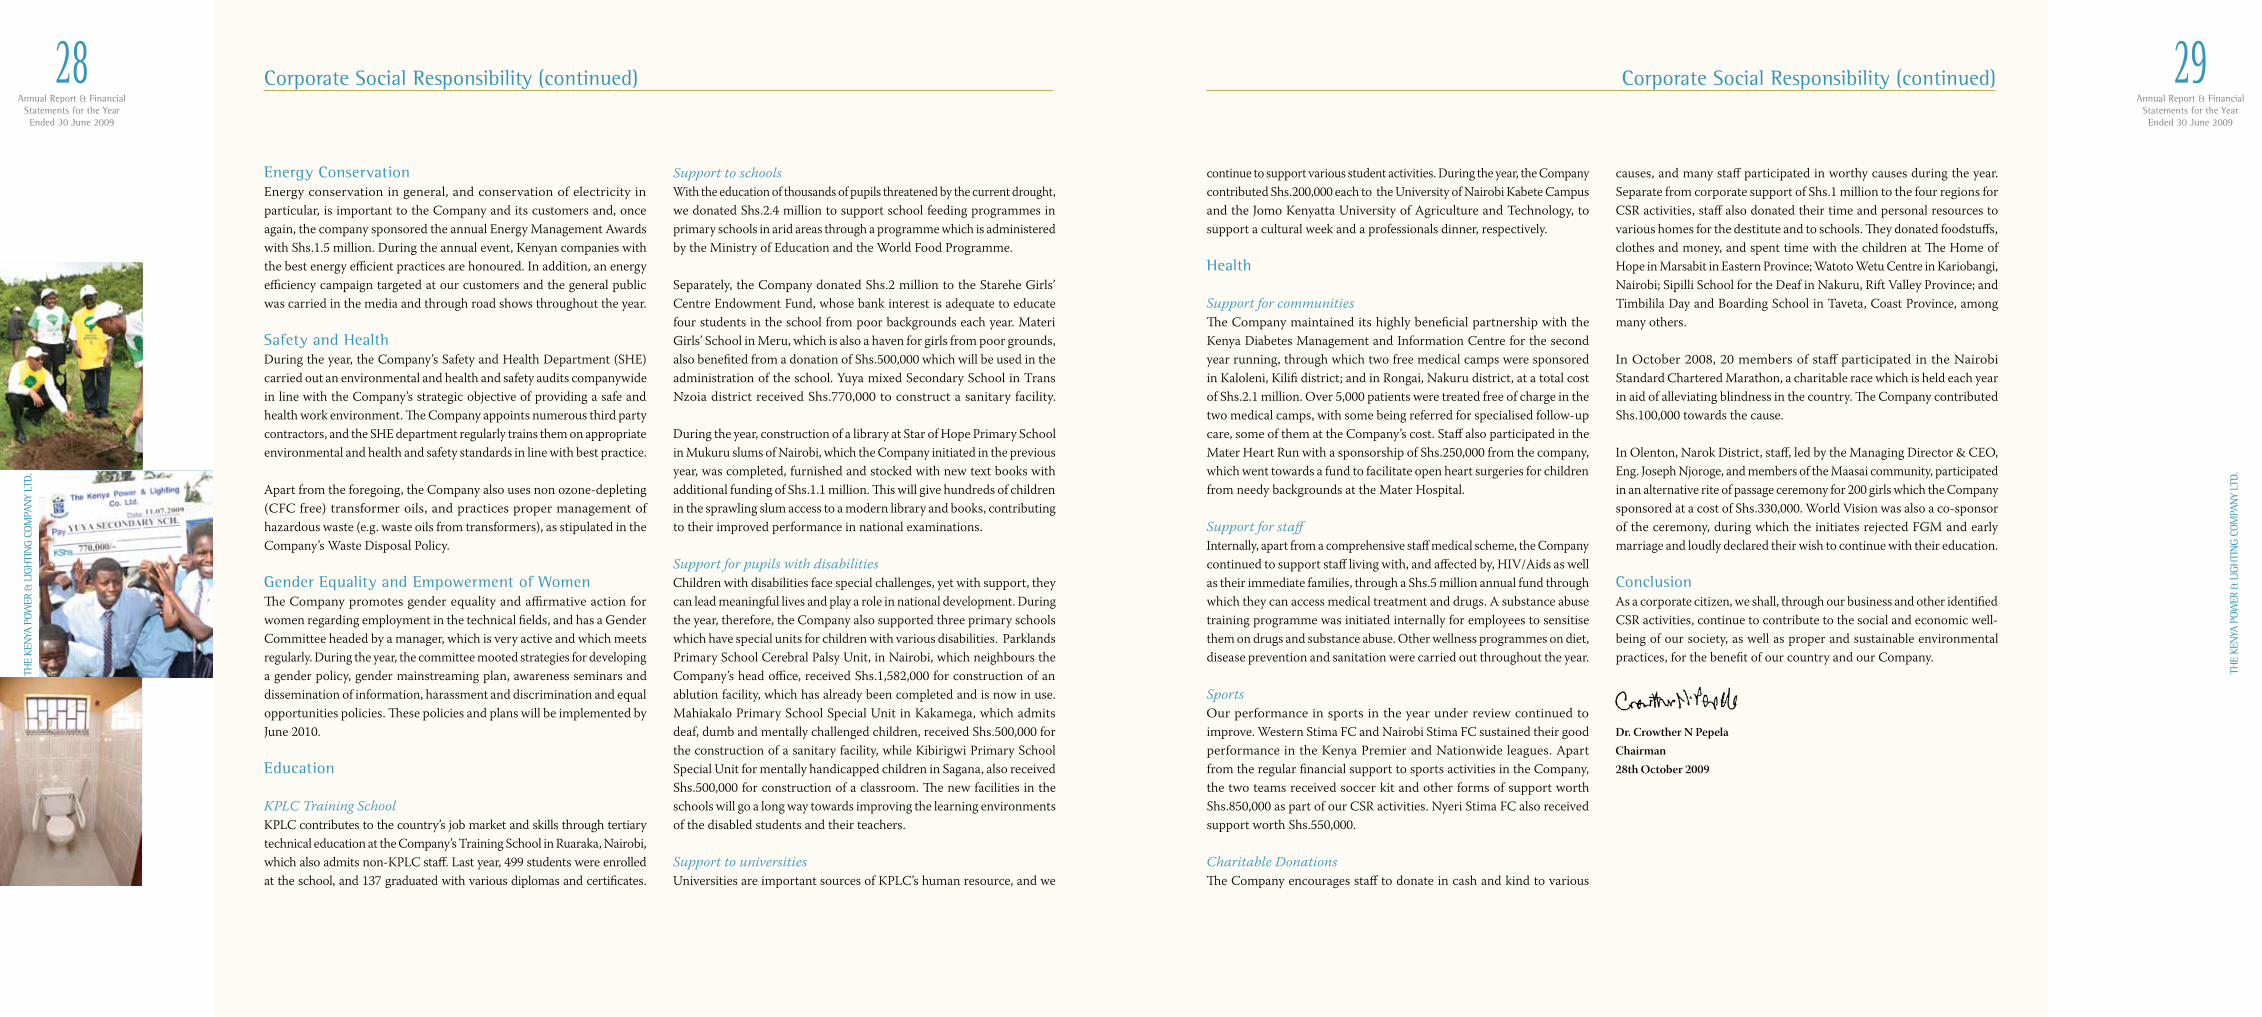
Separately, the Company donated Shs.2 million to the Starehe Girls’ Centre Endowment Fund, whose bank interest is adequate to educate four students in the school from poor backgrounds each year. Materi Girls’ School in Meru, which is also a haven for girls from poor grounds, also benefited from a donation of Shs.500,000 which will be used in the administration of the school. Yuya mixed Secondary School in Trans Nzoia district received Shs.770,000 to construct a sanitary facility.
During the year, construction of a library at Star of Hope Primary School in Mukuru slums of Nairobi, which the Company initiated in the previous year, was completed, furnished and stocked with new text books with additional funding of Shs.1.1 million. This will give hundreds of children in the sprawling slum access to a modern library and books, contributing to their improved performance in national examinations.
Support for pupils with disabilitiesChildren with disabilities face special challenges, yet with support, they can lead meaningful lives and play a role in national development. During the year, therefore, the Company also supported three primary schools which have special units for children with various disabilities. Parklands Primary School Cerebral Palsy Unit, in Nairobi, which neighbours the Company’s head office, received Shs.1,582,000 for construction of an ablution facility, which has already been completed and is now in use. Mahiakalo Primary School Special Unit in Kakamega, which admits deaf, dumb and mentally challenged children, received Shs.500,000 for the construction of a sanitary facility, while Kibirigwi Primary School Special Unit for mentally handicapped children in Sagana, also received Shs.500,000 for construction of a classroom. The new facilities in the schools will go a long way towards improving the learning environments of the disabled students and their teachers.
Support to universitiesUniversities are important sources of KPLC’s human resource, and we
Corporate Social Responsibility (continued) Corporate Social Responsibility (continued)
continue to support various student activities. During the year, the Company contributed Shs.200,000 each to the University of Nairobi Kabete Campus and the Jomo Kenyatta University of Agriculture and Technology, to support a cultural week and a professionals dinner, respectively.
Health
Support for communitiesThe Company maintained its highly beneficial partnership with the Kenya Diabetes Management and Information Centre for the second year running, through which two free medical camps were sponsored in Kaloleni, Kilifi district; and in Rongai, Nakuru district, at a total cost of Shs.2.1 million. Over 5,000 patients were treated free of charge in the two medical camps, with some being referred for specialised follow-up care, some of them at the Company’s cost. Staff also participated in the Mater Heart Run with a sponsorship of Shs.250,000 from the company, which went towards a fund to facilitate open heart surgeries for children from needy backgrounds at the Mater Hospital.
Support for staffInternally, apart from a comprehensive staff medical scheme, the Company continued to support staff living with, and affected by, HIV/Aids as well as their immediate families, through a Shs.5 million annual fund through which they can access medical treatment and drugs. A substance abuse training programme was initiated internally for employees to sensitise them on drugs and substance abuse. Other wellness programmes on diet, disease prevention and sanitation were carried out throughout the year. Sports Our performance in sports in the year under review continued to improve. Western Stima FC and Nairobi Stima FC sustained their good performance in the Kenya Premier and Nationwide leagues. Apart from the regular financial support to sports activities in the Company, the two teams received soccer kit and other forms of support worth Shs.850,000 as part of our CSR activities. Nyeri Stima FC also received support worth Shs.550,000.
Charitable DonationsThe Company encourages staff to donate in cash and kind to various
causes, and many staff participated in worthy causes during the year. Separate from corporate support of Shs.1 million to the four regions for CSR activities, staff also donated their time and personal resources to various homes for the destitute and to schools. They donated foodstuffs, clothes and money, and spent time with the children at The Home of Hope in Marsabit in Eastern Province; Watoto Wetu Centre in Kariobangi, Nairobi; Sipilli School for the Deaf in Nakuru, Rift Valley Province; and Timbilila Day and Boarding School in Taveta, Coast Province, among many others.
In October 2008, 20 members of staff participated in the Nairobi Standard Chartered Marathon, a charitable race which is held each year in aid of alleviating blindness in the country. The Company contributed Shs.100,000 towards the cause.
In Olenton, Narok District, staff, led by the Managing Director & CEO, Eng. Joseph Njoroge, and members of the Maasai community, participated in an alternative rite of passage ceremony for 200 girls which the Company sponsored at a cost of Shs.330,000. World Vision was also a co-sponsor of the ceremony, during which the initiates rejected FGM and early marriage and loudly declared their wish to continue with their education.
ConclusionAs a corporate citizen, we shall, through our business and other identified CSR activities, continue to contribute to the social and economic well-being of our society, as well as proper and sustainable environmental practices, for the benefit of our country and our Company.
Dr. Crowther N PepelaChairman28th October 2009
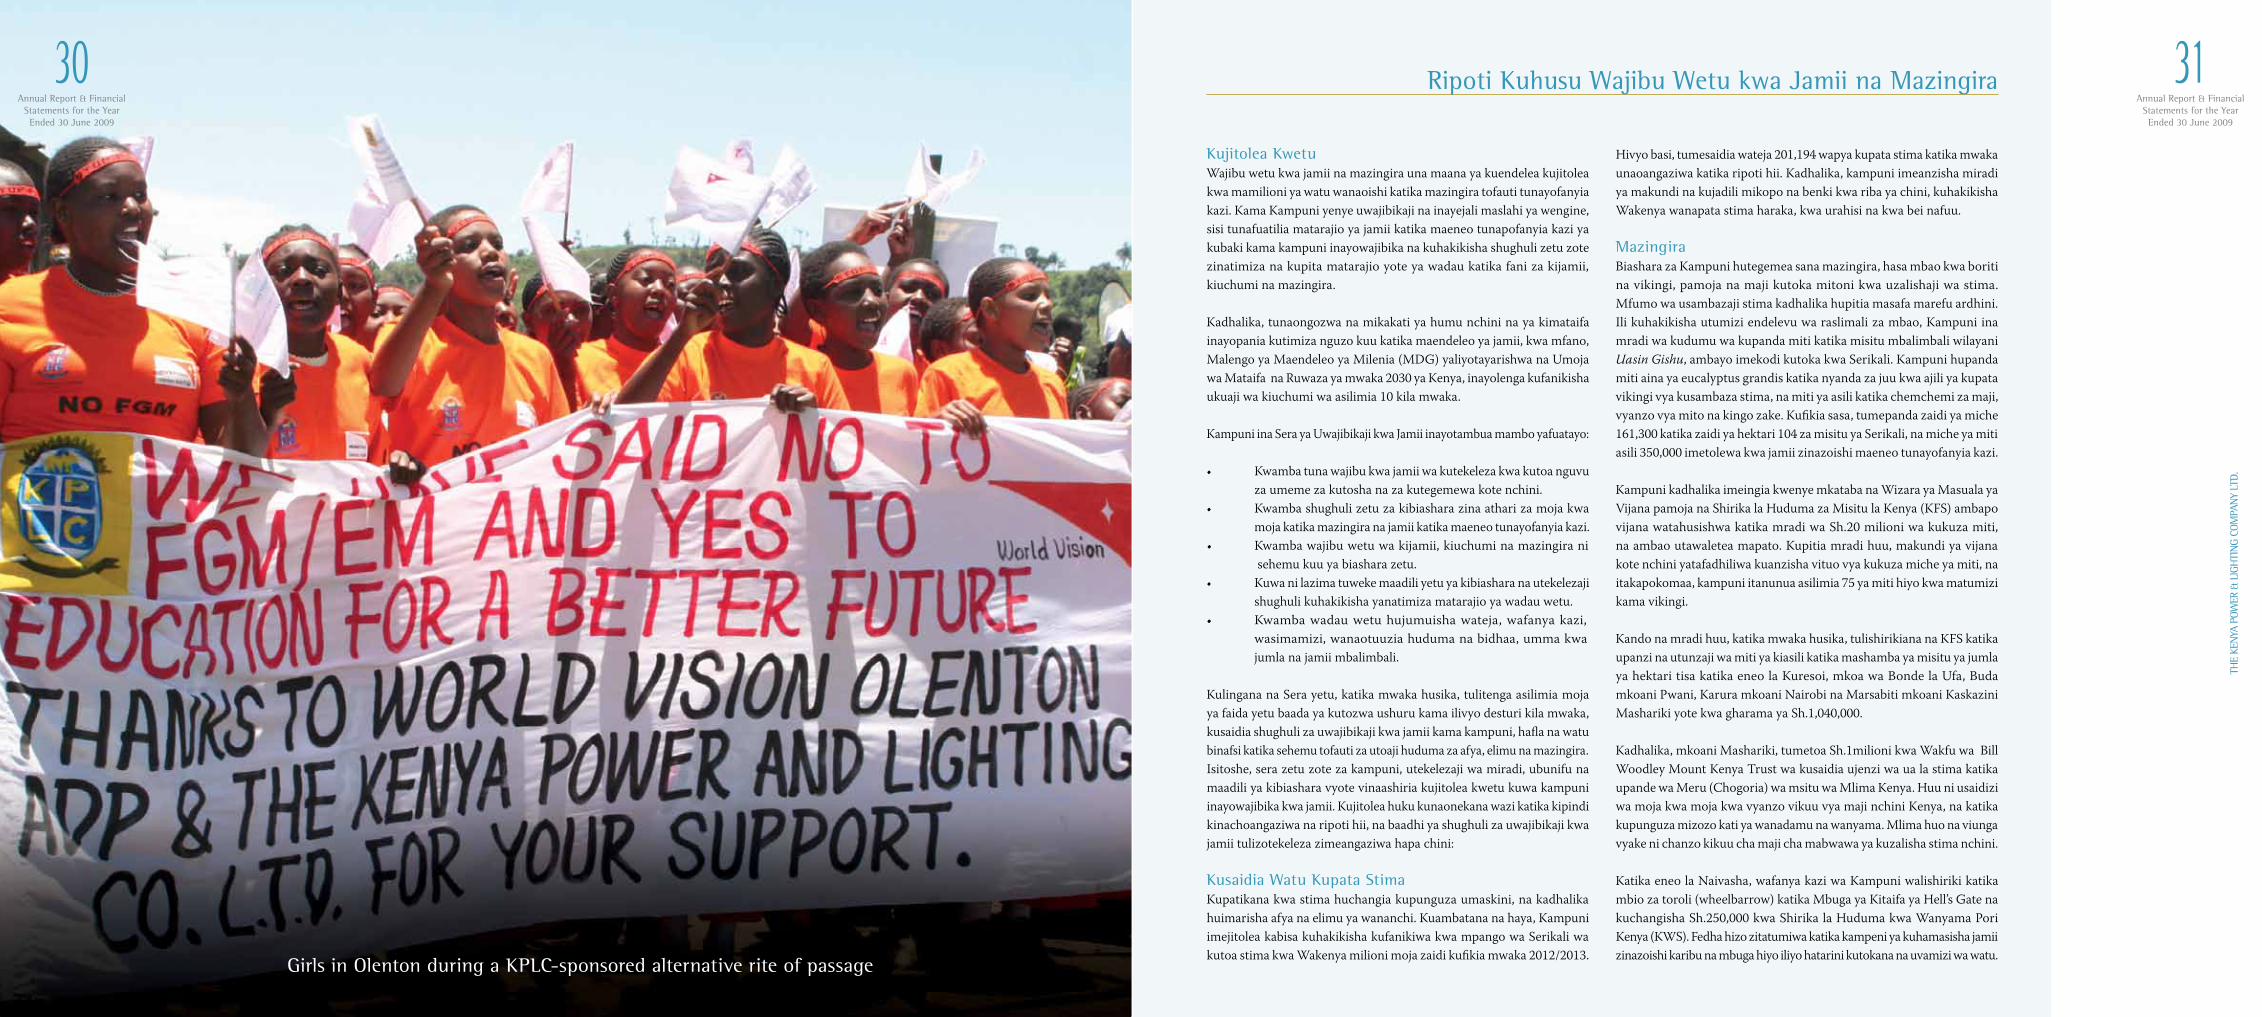
THE
KEN
YA P
OWER
& L
IGH
TIN
G CO
MPA
NY
LTD.
Annual Report & FinancialStatements for the YearEnded 30 June 2009
31
THE
KEN
YA P
OWER
& L
IGH
TIN
G CO
MPA
NY
LTD.
Annual Report & FinancialStatements for the YearEnded 30 June 2009
30Kujitolea KwetuWajibu wetu kwa jamii na mazingira una maana ya kuendelea kujitolea kwa mamilioni ya watu wanaoishi katika mazingira tofauti tunayofanyia kazi. Kama Kampuni yenye uwajibikaji na inayejali maslahi ya wengine, sisi tunafuatilia matarajio ya jamii katika maeneo tunapofanyia kazi ya kubaki kama kampuni inayowajibika na kuhakikisha shughuli zetu zote zinatimiza na kupita matarajio yote ya wadau katika fani za kijamii, kiuchumi na mazingira.
Kadhalika, tunaongozwa na mikakati ya humu nchini na ya kimataifa inayopania kutimiza nguzo kuu katika maendeleo ya jamii, kwa mfano, Malengo ya Maendeleo ya Milenia (MDG) yaliyotayarishwa na Umoja wa Mataifa na Ruwaza ya mwaka 2030 ya Kenya, inayolenga kufanikisha ukuaji wa kiuchumi wa asilimia 10 kila mwaka.
Kampuni ina Sera ya Uwajibikaji kwa Jamii inayotambua mambo yafuatayo: • Kwambatunawajibukwajamiiwakutekelezakwakutoanguvu za umeme za kutosha na za kutegemewa kote nchini.• Kwambashughulizetuzakibiasharazinaatharizamojakwa moja katika mazingira na jamii katika maeneo tunayofanyia kazi. • Kwambawajibuwetuwakijamii,kiuchuminamazingirani sehemu kuu ya biashara zetu.• Kuwanilazimatuwekemaadiliyetuyakibiasharanautekelezaji shughuli kuhakikisha yanatimiza matarajio ya wadau wetu.• Kwambawadauwetuhujumuishawateja,wafanyakazi, wasimamizi, wanaotuuzia huduma na bidhaa, umma kwa jumla na jamii mbalimbali.
Kulingana na Sera yetu, katika mwaka husika, tulitenga asilimia moja ya faida yetu baada ya kutozwa ushuru kama ilivyo desturi kila mwaka, kusaidia shughuli za uwajibikaji kwa jamii kama kampuni, hafla na watu binafsi katika sehemu tofauti za utoaji huduma za afya, elimu na mazingira. Isitoshe, sera zetu zote za kampuni, utekelezaji wa miradi, ubunifu na maadili ya kibiashara vyote vinaashiria kujitolea kwetu kuwa kampuni inayowajibika kwa jamii. Kujitolea huku kunaonekana wazi katika kipindi kinachoangaziwa na ripoti hii, na baadhi ya shughuli za uwajibikaji kwa jamii tulizotekeleza zimeangaziwa hapa chini:
Kusaidia Watu Kupata Stima Kupatikana kwa stima huchangia kupunguza umaskini, na kadhalika huimarisha afya na elimu ya wananchi. Kuambatana na haya, Kampuni imejitolea kabisa kuhakikisha kufanikiwa kwa mpango wa Serikali wa kutoa stima kwa Wakenya milioni moja zaidi kufikia mwaka 2012/2013.
Hivyo basi, tumesaidia wateja 201,194 wapya kupata stima katika mwaka unaoangaziwa katika ripoti hii. Kadhalika, kampuni imeanzisha miradi ya makundi na kujadili mikopo na benki kwa riba ya chini, kuhakikisha Wakenya wanapata stima haraka, kwa urahisi na kwa bei nafuu.
MazingiraBiashara za Kampuni hutegemea sana mazingira, hasa mbao kwa boriti na vikingi, pamoja na maji kutoka mitoni kwa uzalishaji wa stima. Mfumo wa usambazaji stima kadhalika hupitia masafa marefu ardhini. Ili kuhakikisha utumizi endelevu wa raslimali za mbao, Kampuni ina mradi wa kudumu wa kupanda miti katika misitu mbalimbali wilayani Uasin Gishu, ambayo imekodi kutoka kwa Serikali. Kampuni hupanda miti aina ya eucalyptus grandis katika nyanda za juu kwa ajili ya kupata vikingi vya kusambaza stima, na miti ya asili katika chemchemi za maji, vyanzo vya mito na kingo zake. Kufikia sasa, tumepanda zaidi ya miche 161,300 katika zaidi ya hektari 104 za misitu ya Serikali, na miche ya miti asili 350,000 imetolewa kwa jamii zinazoishi maeneo tunayofanyia kazi.
Kampuni kadhalika imeingia kwenye mkataba na Wizara ya Masuala ya Vijana pamoja na Shirika la Huduma za Misitu la Kenya (KFS) ambapo vijana watahusishwa katika mradi wa Sh.20 milioni wa kukuza miti, na ambao utawaletea mapato. Kupitia mradi huu, makundi ya vijana kote nchini yatafadhiliwa kuanzisha vituo vya kukuza miche ya miti, na itakapokomaa, kampuni itanunua asilimia 75 ya miti hiyo kwa matumizi kama vikingi.
Kando na mradi huu, katika mwaka husika, tulishirikiana na KFS katika upanzi na utunzaji wa miti ya kiasili katika mashamba ya misitu ya jumla ya hektari tisa katika eneo la Kuresoi, mkoa wa Bonde la Ufa, Buda mkoani Pwani, Karura mkoani Nairobi na Marsabiti mkoani Kaskazini Mashariki yote kwa gharama ya Sh.1,040,000.
Kadhalika, mkoani Mashariki, tumetoa Sh.1milioni kwa Wakfu wa Bill Woodley Mount Kenya Trust wa kusaidia ujenzi wa ua la stima katika upande wa Meru (Chogoria) wa msitu wa Mlima Kenya. Huu ni usaidizi wa moja kwa moja kwa vyanzo vikuu vya maji nchini Kenya, na katika kupunguza mizozo kati ya wanadamu na wanyama. Mlima huo na viunga vyake ni chanzo kikuu cha maji cha mabwawa ya kuzalisha stima nchini.
Katika eneo la Naivasha, wafanya kazi wa Kampuni walishiriki katika mbio za toroli (wheelbarrow) katika Mbuga ya Kitaifa ya Hell’s Gate na kuchangisha Sh.250,000 kwa Shirika la Huduma kwa Wanyama Pori Kenya (KWS). Fedha hizo zitatumiwa katika kampeni ya kuhamasisha jamii zinazoishi karibu na mbuga hiyo iliyo hatarini kutokana na uvamizi wa watu.
Ripoti Kuhusu Wajibu Wetu kwa Jamii na Mazingira
Girls in Olenton during a KPLC-sponsored alternative rite of passage
Annual Report & FinancialStatements for the YearEnded 30 June 2009
32TH
E KE
NYA
POW
ER &
LIG
HTI
NG
COM
PAN
Y LT
D.
Annual Report & FinancialStatements for the YearEnded 30 June 2009
33
THE
KEN
YA P
OWER
& L
IGH
TIN
G CO
MPA
NY
LTD.
Afya
Usaidizi kwa jamiiKampuni ilidumisha uhusiano wake wenye manufaa makuu na Kituo cha Habari na Usimamizi wa Kisukari cha Kenya (Kenya Diabetes Management and Information Centre) kwa mwaka wa pili mfululizo, ambapo kupitia uhusiano huu kambi mbili za matibabu zilifadhiliwa Kaloleni wilayani Kilifi na Rongai wilayani Nakuru, kwa gharama ya Sh.2.1 milioni. Zaidi ya wagonjwa 5,000 walitibiwa bila malipo, huku baadhi yao wakielekezwa kutafuta matibabu maalum, baadhi kwa gharama ya Kampuni. Wafanya kazi kadhalika walishiriki katika matembezi ya Mater Heart Run wakiwa na ufadhili wa Sh.250,000 kutoka kwa Kampuni ambazo zilienda kwa hazina ya kufanikisha upasuaji wa nyoyo za watoto kutoka kwa jamii maskini katika hospitali ya Mater.
Usaidizi kwa wafanya kaziKando na miradi mahsusi ya kutoa huduma za matibabu kwa wafanya kazi, Kampuni iliendelea kuunga mkono wafanya kazi wanaoishi na wanaoathiriwa na Ukimwi/Virusi vya HIV, pamoja na jamaa za karibu kupitia hazina ya kila mwaka ya Sh.5 milioni kupitia hazina hiyo ambapo wanaweza kupata matibabu na dawa. Mradi wa kufunza na kuwahamasisha wafanya kazi kuhusu ulanguzi wa dawa za kulevya ulianzishwa. Miradi mingine ya kuimarisha hali ya maisha kwa mfano kuhusu lishe, kinga dhidi ya magonjwa na usafi ilitekelezwa katika mwaka huo.
MichezoMatokeo yetu michezoni katika mwaka husika yaliendelea kuimarika. Klabu za kandanda za Western Stima FC na Nairobi Stima FC zilidumisha matokeo bora katika ligi ya Primia ya Kenya na ligi za kitaifa. Kando na ufadhili wa kawaida wa shughuli za michezo katika Kampuni, klabu hizo mbili zilipokea sare za michezo na vifaa vingine, pamoja na ufadhili wa aina zingine wa thamani ya Sh.850,000 kama sehemu ya shughuli zetu katika Uajibikaji kwa Jamii. Klabu ya Nyeri Stima FC kadhalika ilipokea usaidizi wa thamani ya Sh.550,000.
Misaada ya Heri Njema Kampuni huwahamasisha wafanya kazi watoe misaada ya kifedha na aina zingine kwa miradi mbalimbali, na wafanya kazi wengi walishiriki katika shughuli nyingi za kusaidia jamii katika mwaka huo. Kando na msaada wa kampuni wa Sh.1 milioni kwa maeneo manne ya Kampuni ya shughuli za Uajibikaji kwa Jamii, wafanya kazi kadhalika walitoa muda wao na raslimali za kibinafsi kusaidia nyumba na vituo mbalimbali vya watu fukara na shule. Walitoa chakula, nguo na pesa, pamoja na kuwatembelea na kukaa na watoto wa The Home of Hope mjini Marsabit katika mkoa wa Mashariki; Kituo cha Watoto Wetu Kariobangi, Nairobi; Shule ya
viziwi ya Sipilli, Nakuru, mkoa wa Bonde la Ufa; na Shule ya Mseto na Bweni ya Timbilila Taveta, mkoani Pwani, miongoni mwa zingine nyingi.
Mnamo Oktoba 2008, wafanya kazi 20 walishiriki kwenye mbio za Nairobi Standard Chartered Marathon, mbio za hisani zinazoandaliwa kila mwaka kusaidia kukabiliana na kupofuka nchini. Kampuni ilichangia Sh.100,000 kwa shughuli hii muhimu. Katika Olenton, wilayani Narok, wafanya kazi, wakiongozwa na Mkurugenzi Mkuu na Afisa Mkuu Mtendaji Mha. Joseph Njoroge, na watu wa jamii ya Masaai walishiriki kwenye kaida badala za tohara kwa wasichana 200 ambayo Kampuni ilidhamini kwa gharama ya Sh.330,000. World Vision pia ilikuwa mdhamini mshirika kwenye sherehe hiyo ambapo waliofuzu walipinga Ukeketaji wa Wanawake (FGM) na ndoa za mapema na kuelezea nia ya kuendelea na masomo yao.
HitimishoKama Kampuni, kupitia shughuli zetu tanzu na kupitia shughuli tulizoteua chini ya Uajibikaji kwa Jamii, tutaendelea kuchangia kuimarika kwa jamii, katika fani za kijamii na kiuchumi, na kuchangia shughuli bora na zinazofanikisha mazingira endelevu, kwa manufaa ya taifa na Kampuni yetu.
Dkt. Crowther N. PepelaMwenyekiti28 Oktoba 2009
Ripoti Kuhusu Wajibu Wetu kwa Jamii na Mazingira (unaendelea)Ripoti Kuhusu Wajibu Wetu kwa Jamii na Mazingira (unaendelea)
Uhifadhi wa KawiUhifadhi wa kawi kwa jumla na hasa uhifadhi wa stima, una umuhimu mkubwa kwa Kampuni na wateja wake, na kwa mara nyingine tena, kampuni ilidhamini tuzo za kila mwaka za Energy Management Awards kwa Sh.1.5 milioni. Katika hafla hiyo ya kila mwaka, kampuni za Kenya zilizo na kampeni bora za kuhifadhi kawi hutuzwa. Kadhalika, kampeni ya matumizi bora ya kawi inayolenga wateja wetu na umma kwa jumla ilifanywa katika vyombo vya habari na katika maonyesho ya barabarani humu nchini katika mwaka huo.
Usalama na AfyaKatika mwaka huo, Idara ya Kampuni inayohusika na Usalama na Afya (SHE) ilifanya ukaguzi wa mifumo ya mazingira, afya na usalama katika vituo vya kampuni kote nchini kuambatana na lengo kuu la Kampuni ya kutoa mazingira salama na yenye afya ya kufanyia kazi. Kampuni pia huteua wanakandarasi wengi kutoka nje kuifanyia kazi tofauti, na idara ya SHE iliwafunza kuhusu viwango vya juu vinavyoambatana na maadili ya mazingira, afya na usalama. Fauka ya haya, Kampuni hutumia mafuta ya transfoma ambayo hayana kemikali zinazochangia kumalizika kwa gesi ya ozone hewani (yasiyo na CFC), na hutumia njia bora za kushughulikia taka (kwa mfano mafuta kutoka kwa transfoma), kama inavyoelezwa katika Sera ya Utupaji Taka ya Kampuni.
Usawa wa Kijinsia na Kuwapa Uwezo WanawakeKampuni hueneza usawa wa jinsia na hujali wanawake katika masuala ya uajiri katika taaluma zinazohusu teknolojia, na ina Kamati ya Jinsia inayoongozwa na Meneja. Kamati hiyo hutekeleza shughuli nyingi na hukutana mara kwa mara. Katika mwaka huo, kamati ilijadili mikakati ya kutayarisha sera ya jinsia, mpango wa kulainisha masuala ya jinsia, warsha za kuhamasisha watu na kutoa habari, dhuluma na ubaguzi na sera za kutoa nafasi sawa kwa wote. Sera hizi na mipango husika zitatekelezwa kabla ya Juni 2010.
Elimu
Chuo cha Mafunzo cha KPLCKPLC huchangia sekta ya ufanya kazi na ujuzi nchini kupitia mafunzo ya kiufundi katika Chuo cha Mafunzo cha Kampuni kilichoko Ruaraka, Nairobi, na ambacho hutoa mafunzo kwa watu wasio wafanya kazi wa KPLC. Mwaka uliopita, wanafunzi 499 walijiunga na chuo, na 137 walifuzu wakiwa na shahada na vyeti mbalimbali.
Usaidizi kwa ShuleHuku elimu ya maelfu ya wanafunzi ikiwa hatarini kutokana na ukame unaokumba nchi kwa sasa, tulitoa msaada wa Sh.2.4 milioni kusaidia
miradi ya kutoa chakula shuleni katika shule za msingi zilizo katika maeneo kame, kupitia mradi unaosimamiwa na Wizara ya Elimu na Shirika la Chakula Duniani (WFP).
Kivyake, kampuni ilitoa msaada wa Sh.2 milioni kwa Hazina ya Kusaidia Shule ya upili ya Wasichana ya Starehe, ambao riba yake katika benki inatosha kuelimisha wanafunzi wanne kutoka familia maskini kila mwaka. Shule ya upili ya Wasichana ya Materi, Meru, ambayo pia husaidia wasichana kutoka familia maskini kadhalika ilinufaika na msaada wa Sh.500,000 ambazo zitatumiwa katika usimamizi wa shule hiyo. Shule ya Mseto ya Yuya wilayani Trans Nzoia ilipokea Sh.770,000 kujenga vyoo vya wanafunzi.
Katika mwaka huo, ujenzi wa maktaba katika shule ya msingi ya Star of Hope katika mtaa wa mabanda wa Mukuru, mkoani Nairobi, ambao ulianzishwa na kampuni mwaka uliopita, ulikamilishwa na maktaba ikajazwa vitabu vipya kutokana na ufadhili wa Sh.1.1 milioni. Hii itawapa mamia ya wanafunzi kutoka mtaa huo wa mabanda fursa ya kutumia maktaba ya kisasa na vitabu, na kuchangia kuimarisha matokeo yao katika mitihani ya kitaifa.
Usaidizi kwa wanafunzi walemavuWatoto walemavu hukabiliwa na changamoto za kipekee, lakini wakipata usaidizi, wanaweza kuishi maisha bora na kuchangia maendeleo ya kitaifa. Kutokana na haya, katika mwaka huo, Kampuni kadhalika ilisaidia shule tatu za msingi zenye vitengo maalum vya watoto wenye aina mbalimbali za ulemavu. Kitengo cha Shule ya Msingi ya Parklands cha Watoto wenye matatizo ya Kiakili, jijini Nairobi ambacho kinapakana na afisi kuu za Kampuni kilipokea Sh.1,582,000 za kujenga vyoo na bafu maalum, ambazo tayari zimekamilishwa na zinatumiwa. Kitengo maalum cha Shule ya Msingi ya Mahiakalo, Kakamega, ambacho hushughulikia viziwi, bubu na watoto wenye matatizo ya kiakili, kilipokea Sh.500,000 cha ujenzi wa choo, huku Kituo maalum cha Shule ya msingi ya Kibirigwi, Sagana, kinachoshughulikia watoto wenye matatizo ya kiakili kikipokea Sh.500,000 za kugharamia ujenzi wa darasa. Vifaa hivi vipya vitasaidia sana shule hizo kuimarisha mazingira ya masomo ya wanafunzi walemavu na walimu wao.
Usaidizi kwa Vyuo VikuuVyuo vikuu ni kiini muhimu cha wafanya kazi wa KPLC, na Kampuni inaendelea kuunga mkono shughuli mbalimbali za wanafunzi. Katika mwaka huo, Kampuni ilitoa Sh.200,000 kila moja kwa Bewa la Kabete la Chuo Kikuu cha Nairobi na Chuo Kikuu cha Kilimo na Teknolojia cha Jomo Kenyatta, kusaidia wiki ya kuadhimisha utamaduni na chakula cha jioni cha wataalam mtawalia.
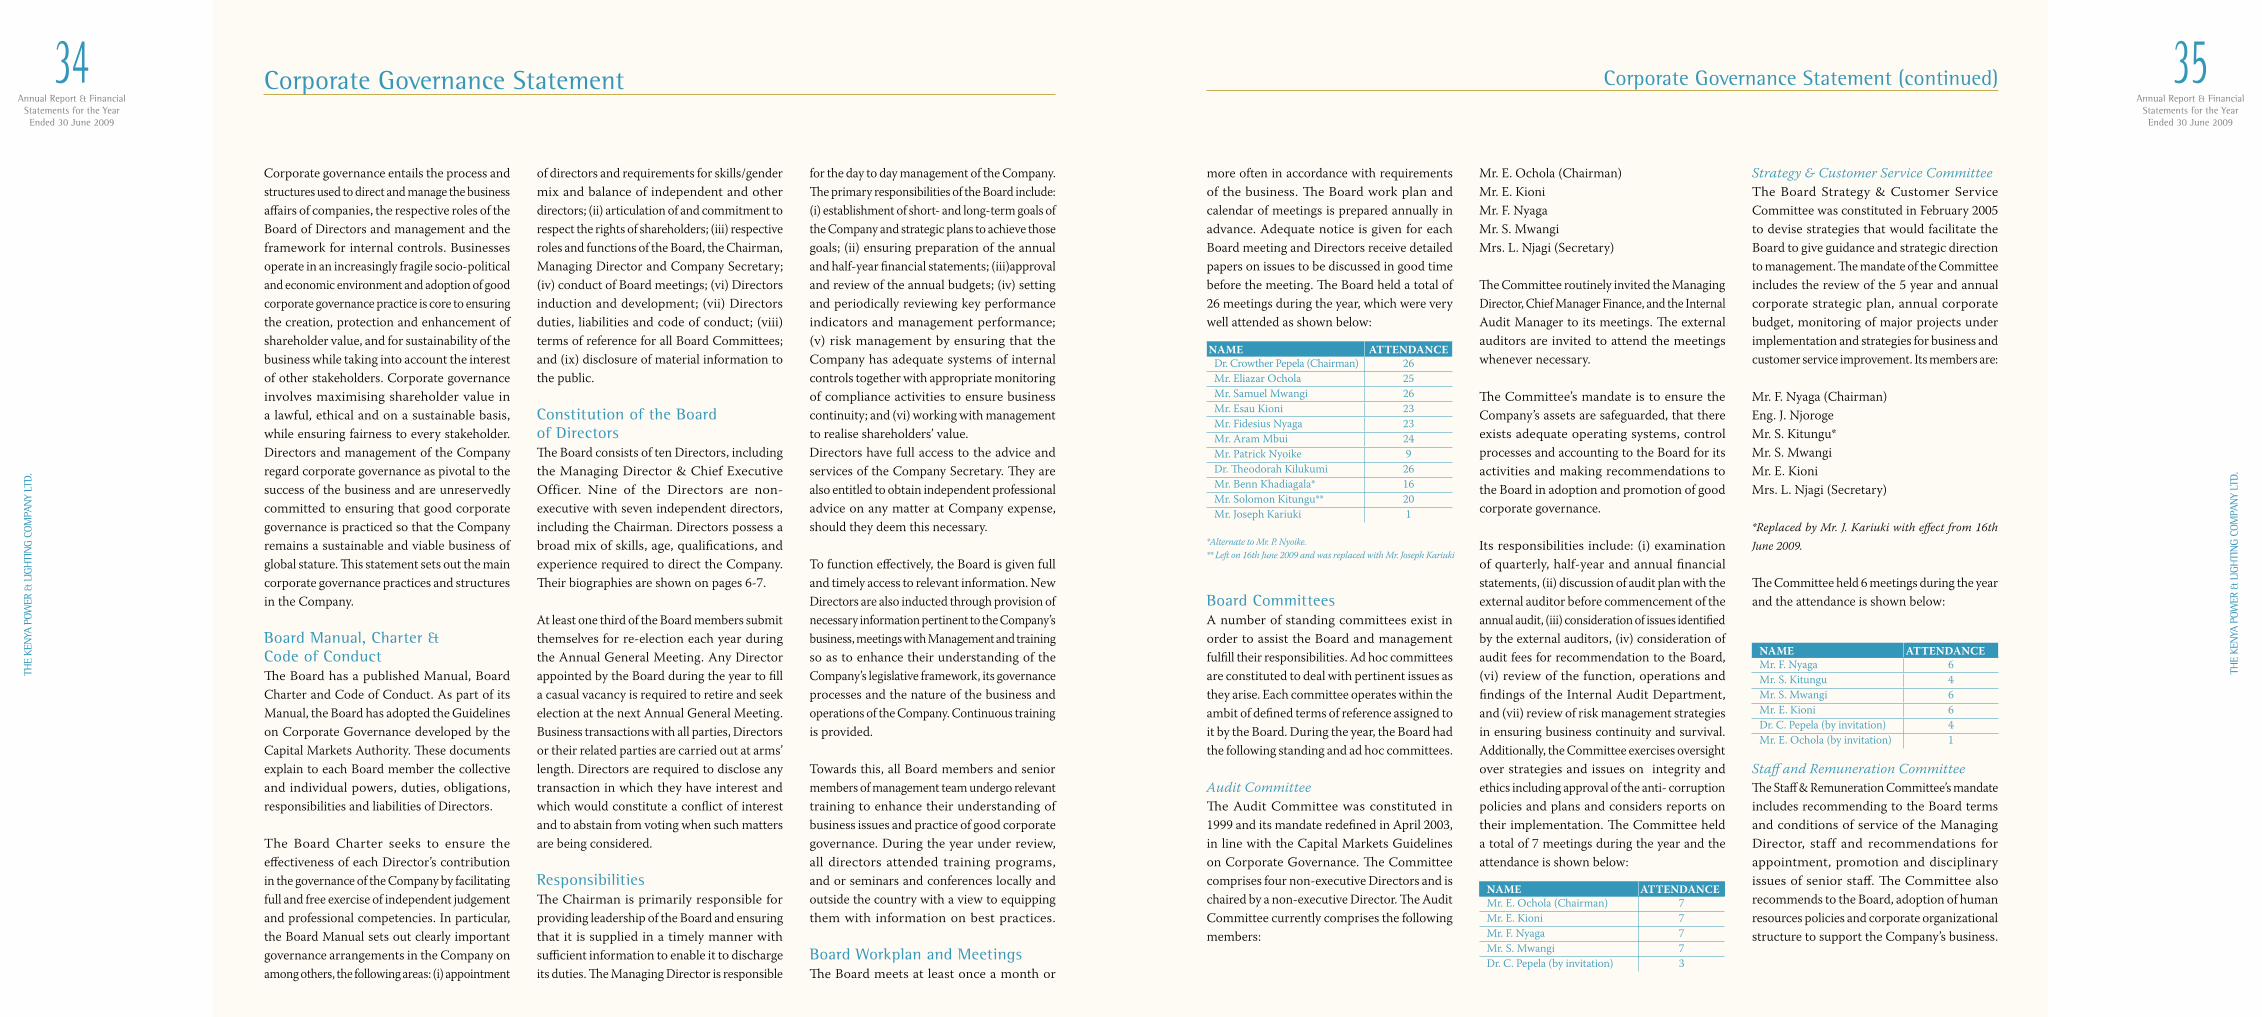
Annual Report & FinancialStatements for the YearEnded 30 June 2009
34TH
E KE
NYA
POW
ER &
LIG
HTI
NG
COM
PAN
Y LT
D.
Annual Report & FinancialStatements for the YearEnded 30 June 2009
35
THE
KEN
YA P
OWER
& L
IGH
TIN
G CO
MPA
NY
LTD.
more often in accordance with requirements of the business. The Board work plan and calendar of meetings is prepared annually in advance. Adequate notice is given for each Board meeting and Directors receive detailed papers on issues to be discussed in good time before the meeting. The Board held a total of 26 meetings during the year, which were very well attended as shown below:
Board CommitteesA number of standing committees exist in order to assist the Board and management fulfill their responsibilities. Ad hoc committees are constituted to deal with pertinent issues as they arise. Each committee operates within the ambit of defined terms of reference assigned to it by the Board. During the year, the Board had the following standing and ad hoc committees.
Audit CommitteeThe Audit Committee was constituted in 1999 and its mandate redefined in April 2003, in line with the Capital Markets Guidelines on Corporate Governance. The Committee comprises four non-executive Directors and is chaired by a non-executive Director. The Audit Committee currently comprises the following members:
Mr. E. Ochola (Chairman)Mr. E. KioniMr. F. NyagaMr. S. Mwangi Mrs. L. Njagi (Secretary)
The Committee routinely invited the Managing Director, Chief Manager Finance, and the Internal Audit Manager to its meetings. The external auditors are invited to attend the meetings whenever necessary.
The Committee’s mandate is to ensure the Company’s assets are safeguarded, that there exists adequate operating systems, control processes and accounting to the Board for its activities and making recommendations to the Board in adoption and promotion of good corporate governance.
Its responsibilities include: (i) examination of quarterly, half-year and annual financial statements, (ii) discussion of audit plan with the external auditor before commencement of the annual audit, (iii) consideration of issues identified by the external auditors, (iv) consideration of audit fees for recommendation to the Board, (vi) review of the function, operations and findings of the Internal Audit Department, and (vii) review of risk management strategies in ensuring business continuity and survival. Additionally, the Committee exercises oversight over strategies and issues on integrity and ethics including approval of the anti- corruption policies and plans and considers reports on their implementation. The Committee held a total of 7 meetings during the year and the attendance is shown below:
Strategy & Customer Service Committee The Board Strategy & Customer Service Committee was constituted in February 2005 to devise strategies that would facilitate the Board to give guidance and strategic direction to management. The mandate of the Committee includes the review of the 5 year and annual corporate strategic plan, annual corporate budget, monitoring of major projects under implementation and strategies for business and customer service improvement. Its members are:
Mr. F. Nyaga (Chairman)Eng. J. NjorogeMr. S. Kitungu*Mr. S. MwangiMr. E. KioniMrs. L. Njagi (Secretary)
*Replaced by Mr. J. Kariuki with effect from 16th June 2009.
The Committee held 6 meetings during the year and the attendance is shown below:
Staff and Remuneration CommitteeThe Staff & Remuneration Committee’s mandate includes recommending to the Board terms and conditions of service of the Managing Director, staff and recommendations for appointment, promotion and disciplinary issues of senior staff. The Committee also recommends to the Board, adoption of human resources policies and corporate organizational structure to support the Company’s business.
Corporate Governance Statement (continued)Corporate Governance Statement
Corporate governance entails the process and structures used to direct and manage the business affairs of companies, the respective roles of the Board of Directors and management and the framework for internal controls. Businesses operate in an increasingly fragile socio-political and economic environment and adoption of good corporate governance practice is core to ensuring the creation, protection and enhancement of shareholder value, and for sustainability of the business while taking into account the interest of other stakeholders. Corporate governance involves maximising shareholder value in a lawful, ethical and on a sustainable basis, while ensuring fairness to every stakeholder. Directors and management of the Company regard corporate governance as pivotal to the success of the business and are unreservedly committed to ensuring that good corporate governance is practiced so that the Company remains a sustainable and viable business of global stature. This statement sets out the main corporate governance practices and structures in the Company.
Board Manual, Charter & Code of ConductThe Board has a published Manual, Board Charter and Code of Conduct. As part of its Manual, the Board has adopted the Guidelines on Corporate Governance developed by the Capital Markets Authority. These documents explain to each Board member the collective and individual powers, duties, obligations, responsibilities and liabilities of Directors.
The Board Charter seeks to ensure the effectiveness of each Director’s contribution in the governance of the Company by facilitating full and free exercise of independent judgement and professional competencies. In particular, the Board Manual sets out clearly important governance arrangements in the Company on among others, the following areas: (i) appointment
of directors and requirements for skills/gender mix and balance of independent and other directors; (ii) articulation of and commitment to respect the rights of shareholders; (iii) respective roles and functions of the Board, the Chairman, Managing Director and Company Secretary; (iv) conduct of Board meetings; (vi) Directors induction and development; (vii) Directors duties, liabilities and code of conduct; (viii) terms of reference for all Board Committees; and (ix) disclosure of material information to the public.
Constitution of the Board of DirectorsThe Board consists of ten Directors, including the Managing Director & Chief Executive Officer. Nine of the Directors are non-executive with seven independent directors, including the Chairman. Directors possess a broad mix of skills, age, qualifications, and experience required to direct the Company. Their biographies are shown on pages 6-7.
At least one third of the Board members submit themselves for re-election each year during the Annual General Meeting. Any Director appointed by the Board during the year to fill a casual vacancy is required to retire and seek election at the next Annual General Meeting.Business transactions with all parties, Directors or their related parties are carried out at arms’ length. Directors are required to disclose any transaction in which they have interest and which would constitute a conflict of interest and to abstain from voting when such matters are being considered.
Responsibilities The Chairman is primarily responsible for providing leadership of the Board and ensuring that it is supplied in a timely manner with sufficient information to enable it to discharge its duties. The Managing Director is responsible
for the day to day management of the Company. The primary responsibilities of the Board include: (i) establishment of short- and long-term goals of the Company and strategic plans to achieve those goals; (ii) ensuring preparation of the annual and half-year financial statements; (iii)approval and review of the annual budgets; (iv) setting and periodically reviewing key performance indicators and management performance; (v) risk management by ensuring that the Company has adequate systems of internal controls together with appropriate monitoring of compliance activities to ensure business continuity; and (vi) working with management to realise shareholders’ value.Directors have full access to the advice and services of the Company Secretary. They are also entitled to obtain independent professional advice on any matter at Company expense, should they deem this necessary.
To function effectively, the Board is given full and timely access to relevant information. New Directors are also inducted through provision of necessary information pertinent to the Company’s business, meetings with Management and training so as to enhance their understanding of the Company’s legislative framework, its governance processes and the nature of the business and operations of the Company. Continuous training is provided.
Towards this, all Board members and senior members of management team undergo relevant training to enhance their understanding of business issues and practice of good corporate governance. During the year under review, all directors attended training programs, and or seminars and conferences locally and outside the country with a view to equipping them with information on best practices.
Board Workplan and MeetingsThe Board meets at least once a month or
NAME ATTENDANCEDr. Crowther Pepela (Chairman) 26Mr. Eliazar Ochola 25Mr. Samuel Mwangi 26Mr. Esau Kioni 23Mr. Fidesius Nyaga 23Mr. Aram Mbui 24Mr. Patrick Nyoike 9Dr. Theodorah Kilukumi 26Mr. Benn Khadiagala* 16Mr. Solomon Kitungu** 20Mr. Joseph Kariuki 1
*Alternate to Mr. P. Nyoike.** Left on 16th June 2009 and was replaced with Mr. Joseph Kariuki
NAME ATTENDANCEMr. F. Nyaga 6Mr. S. Kitungu 4Mr. S. Mwangi 6Mr. E. Kioni 6Dr. C. Pepela (by invitation) 4Mr. E. Ochola (by invitation) 1
NAME ATTENDANCEMr. E. Ochola (Chairman) 7Mr. E. Kioni 7Mr. F. Nyaga 7Mr. S. Mwangi 7Dr. C. Pepela (by invitation) 3
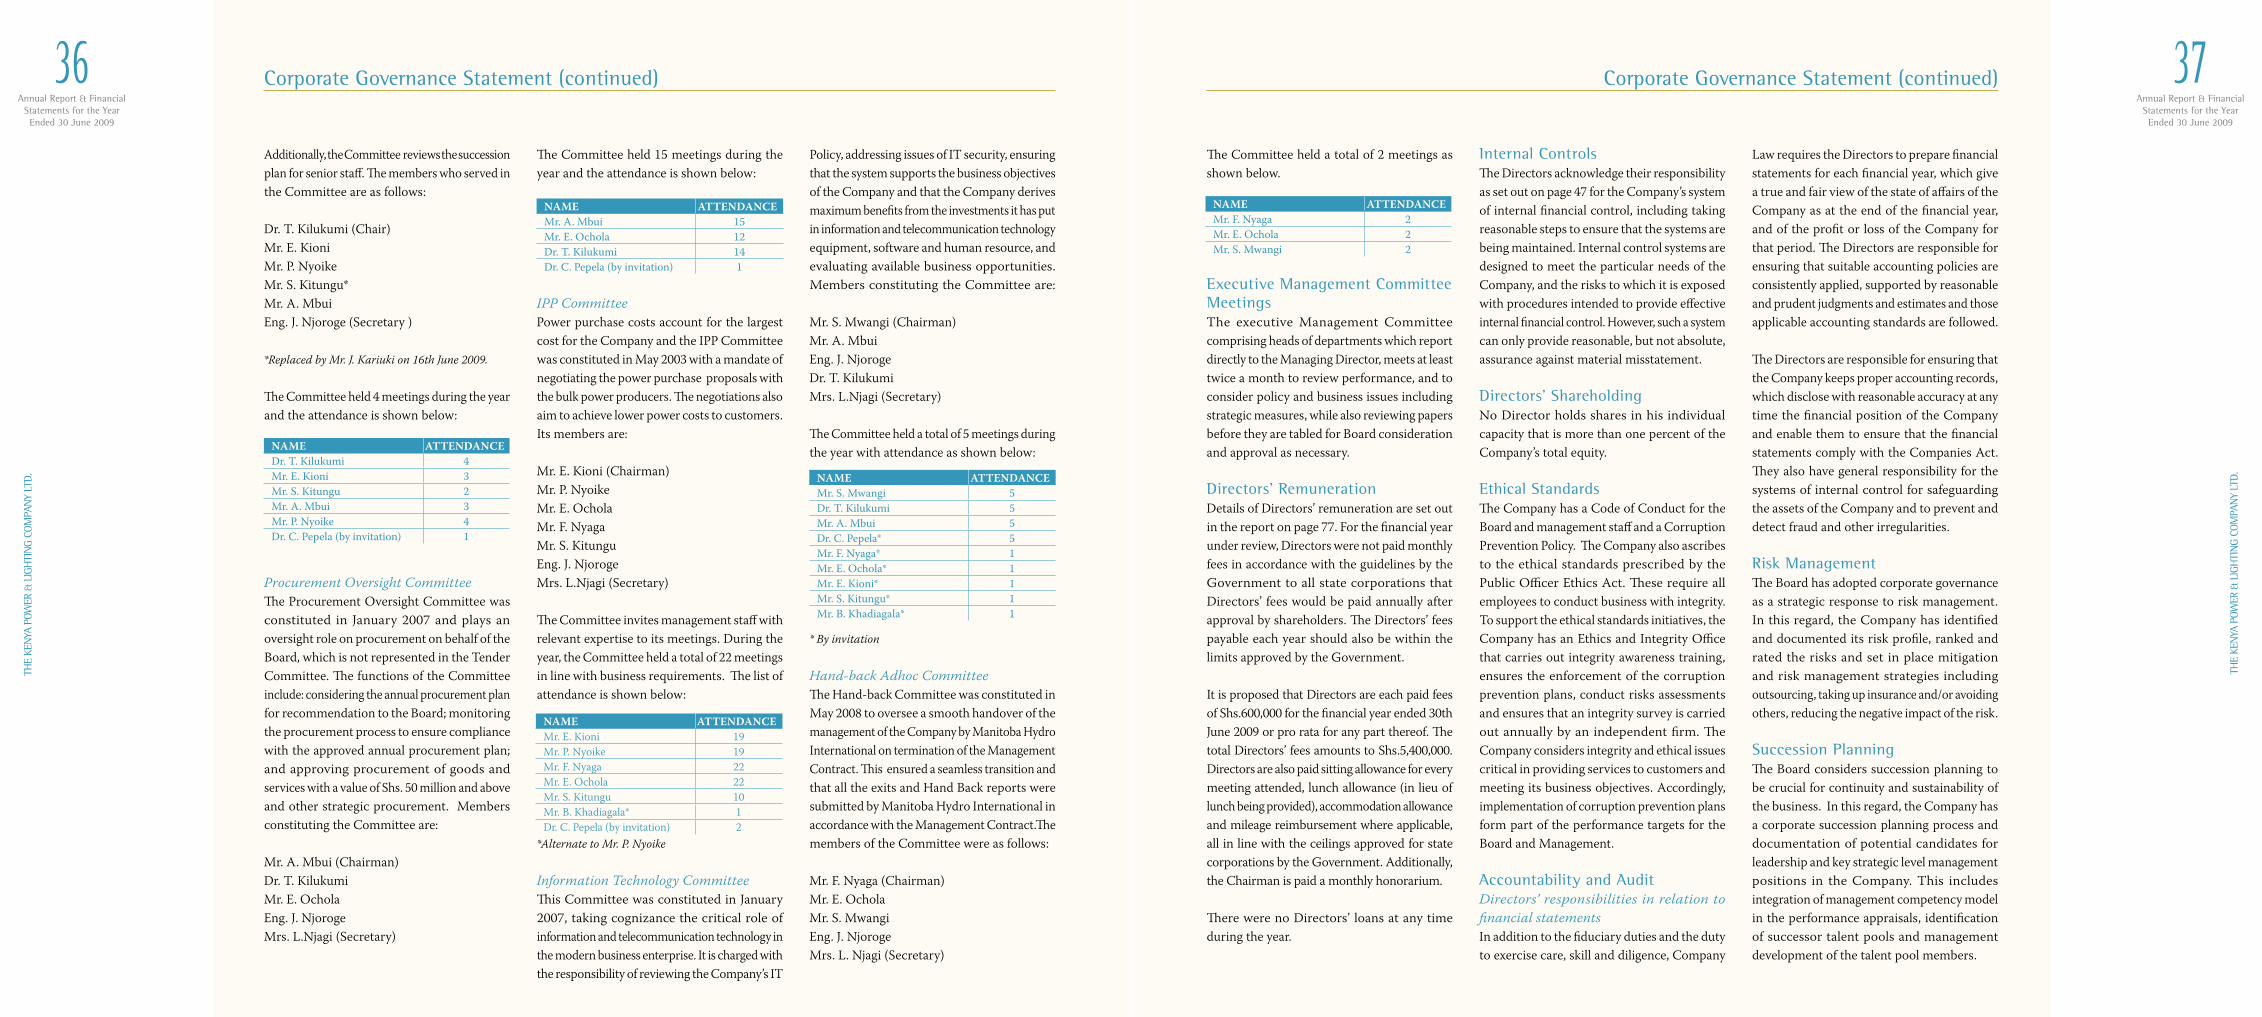
Annual Report & FinancialStatements for the YearEnded 30 June 2009
36TH
E KE
NYA
POW
ER &
LIG
HTI
NG
COM
PAN
Y LT
D.
Annual Report & FinancialStatements for the YearEnded 30 June 2009
37
THE
KEN
YA P
OWER
& L
IGH
TIN
G CO
MPA
NY
LTD.
The Committee held a total of 2 meetings as shown below.
Executive Management Committee MeetingsThe executive Management Committee comprising heads of departments which report directly to the Managing Director, meets at least twice a month to review performance, and to consider policy and business issues including strategic measures, while also reviewing papers before they are tabled for Board consideration and approval as necessary.
Directors’ RemunerationDetails of Directors’ remuneration are set out in the report on page 77. For the financial year under review, Directors were not paid monthly fees in accordance with the guidelines by the Government to all state corporations that Directors’ fees would be paid annually after approval by shareholders. The Directors’ fees payable each year should also be within the limits approved by the Government. It is proposed that Directors are each paid fees of Shs.600,000 for the financial year ended 30th June 2009 or pro rata for any part thereof. The total Directors’ fees amounts to Shs.5,400,000. Directors are also paid sitting allowance for every meeting attended, lunch allowance (in lieu of lunch being provided), accommodation allowance and mileage reimbursement where applicable, all in line with the ceilings approved for state corporations by the Government. Additionally, the Chairman is paid a monthly honorarium. There were no Directors’ loans at any time during the year.
Internal Controls The Directors acknowledge their responsibility as set out on page 47 for the Company’s system of internal financial control, including taking reasonable steps to ensure that the systems are being maintained. Internal control systems are designed to meet the particular needs of the Company, and the risks to which it is exposed with procedures intended to provide effective internal financial control. However, such a system can only provide reasonable, but not absolute, assurance against material misstatement.
Directors’ Shareholding No Director holds shares in his individual capacity that is more than one percent of the Company’s total equity.
Ethical StandardsThe Company has a Code of Conduct for the Board and management staff and a Corruption Prevention Policy. The Company also ascribes to the ethical standards prescribed by the Public Officer Ethics Act. These require all employees to conduct business with integrity. To support the ethical standards initiatives, the Company has an Ethics and Integrity Office that carries out integrity awareness training, ensures the enforcement of the corruption prevention plans, conduct risks assessments and ensures that an integrity survey is carried out annually by an independent firm. The Company considers integrity and ethical issues critical in providing services to customers and meeting its business objectives. Accordingly, implementation of corruption prevention plans form part of the performance targets for the Board and Management.
Accountability and AuditDirectors’ responsibilities in relation to financial statementsIn addition to the fiduciary duties and the duty to exercise care, skill and diligence, Company
Law requires the Directors to prepare financial statements for each financial year, which give a true and fair view of the state of affairs of the Company as at the end of the financial year, and of the profit or loss of the Company for that period. The Directors are responsible for ensuring that suitable accounting policies are consistently applied, supported by reasonable and prudent judgments and estimates and those applicable accounting standards are followed.
The Directors are responsible for ensuring that the Company keeps proper accounting records, which disclose with reasonable accuracy at any time the financial position of the Company and enable them to ensure that the financial statements comply with the Companies Act. They also have general responsibility for the systems of internal control for safeguarding the assets of the Company and to prevent and detect fraud and other irregularities.
Risk Management The Board has adopted corporate governance as a strategic response to risk management. In this regard, the Company has identified and documented its risk profile, ranked and rated the risks and set in place mitigation and risk management strategies including outsourcing, taking up insurance and/or avoiding others, reducing the negative impact of the risk.
Succession PlanningThe Board considers succession planning to be crucial for continuity and sustainability of the business. In this regard, the Company has a corporate succession planning process and documentation of potential candidates for leadership and key strategic level management positions in the Company. This includes integration of management competency model in the performance appraisals, identification of successor talent pools and management development of the talent pool members.
Additionally, the Committee reviews the succession plan for senior staff. The members who served in the Committee are as follows:
Dr. T. Kilukumi (Chair)Mr. E. Kioni Mr. P. NyoikeMr. S. Kitungu* Mr. A. MbuiEng. J. Njoroge (Secretary )
*Replaced by Mr. J. Kariuki on 16th June 2009.
The Committee held 4 meetings during the year and the attendance is shown below:
Procurement Oversight CommitteeThe Procurement Oversight Committee was constituted in January 2007 and plays an oversight role on procurement on behalf of the Board, which is not represented in the Tender Committee. The functions of the Committee include: considering the annual procurement plan for recommendation to the Board; monitoring the procurement process to ensure compliance with the approved annual procurement plan; and approving procurement of goods and services with a value of Shs. 50 million and above and other strategic procurement. Members constituting the Committee are:
Mr. A. Mbui (Chairman)Dr. T. Kilukumi Mr. E. OcholaEng. J. Njoroge Mrs. L.Njagi (Secretary)
The Committee held 15 meetings during the year and the attendance is shown below:
IPP Committee Power purchase costs account for the largest cost for the Company and the IPP Committee was constituted in May 2003 with a mandate of negotiating the power purchase proposals with the bulk power producers. The negotiations also aim to achieve lower power costs to customers. Its members are:
Mr. E. Kioni (Chairman)Mr. P. Nyoike Mr. E. OcholaMr. F. NyagaMr. S. KitunguEng. J. NjorogeMrs. L.Njagi (Secretary)
The Committee invites management staff with relevant expertise to its meetings. During the year, the Committee held a total of 22 meetings in line with business requirements. The list of attendance is shown below:
*Alternate to Mr. P. Nyoike
Information Technology CommitteeThis Committee was constituted in January 2007, taking cognizance the critical role of information and telecommunication technology in the modern business enterprise. It is charged with the responsibility of reviewing the Company’s IT
Policy, addressing issues of IT security, ensuring that the system supports the business objectives of the Company and that the Company derives maximum benefits from the investments it has put in information and telecommunication technology equipment, software and human resource, and evaluating available business opportunities. Members constituting the Committee are:
Mr. S. Mwangi (Chairman)Mr. A. MbuiEng. J. NjorogeDr. T. KilukumiMrs. L.Njagi (Secretary)
The Committee held a total of 5 meetings during the year with attendance as shown below:
* By invitation
Hand-back Adhoc CommitteeThe Hand-back Committee was constituted in May 2008 to oversee a smooth handover of the management of the Company by Manitoba Hydro International on termination of the Management Contract. This ensured a seamless transition and that all the exits and Hand Back reports were submitted by Manitoba Hydro International in accordance with the Management Contract.The members of the Committee were as follows:
Mr. F. Nyaga (Chairman)Mr. E. OcholaMr. S. MwangiEng. J. NjorogeMrs. L. Njagi (Secretary)
NAME ATTENDANCEMr. F. Nyaga 2Mr. E. Ochola 2Mr. S. Mwangi 2
Corporate Governance Statement (continued)Corporate Governance Statement (continued)
NAME ATTENDANCEMr. A. Mbui 15Mr. E. Ochola 12Dr. T. Kilukumi 14Dr. C. Pepela (by invitation) 1
NAME ATTENDANCEMr. E. Kioni 19Mr. P. Nyoike 19Mr. F. Nyaga 22Mr. E. Ochola 22Mr. S. Kitungu 10Mr. B. Khadiagala* 1Dr. C. Pepela (by invitation) 2
NAME ATTENDANCEMr. S. Mwangi 5Dr. T. Kilukumi 5Mr. A. Mbui 5Dr. C. Pepela* 5Mr. F. Nyaga* 1Mr. E. Ochola* 1Mr. E. Kioni* 1Mr. S. Kitungu* 1Mr. B. Khadiagala* 1
NAME ATTENDANCEDr. T. Kilukumi 4Mr. E. Kioni 3Mr. S. Kitungu 2Mr. A. Mbui 3Mr. P. Nyoike 4Dr. C. Pepela (by invitation) 1
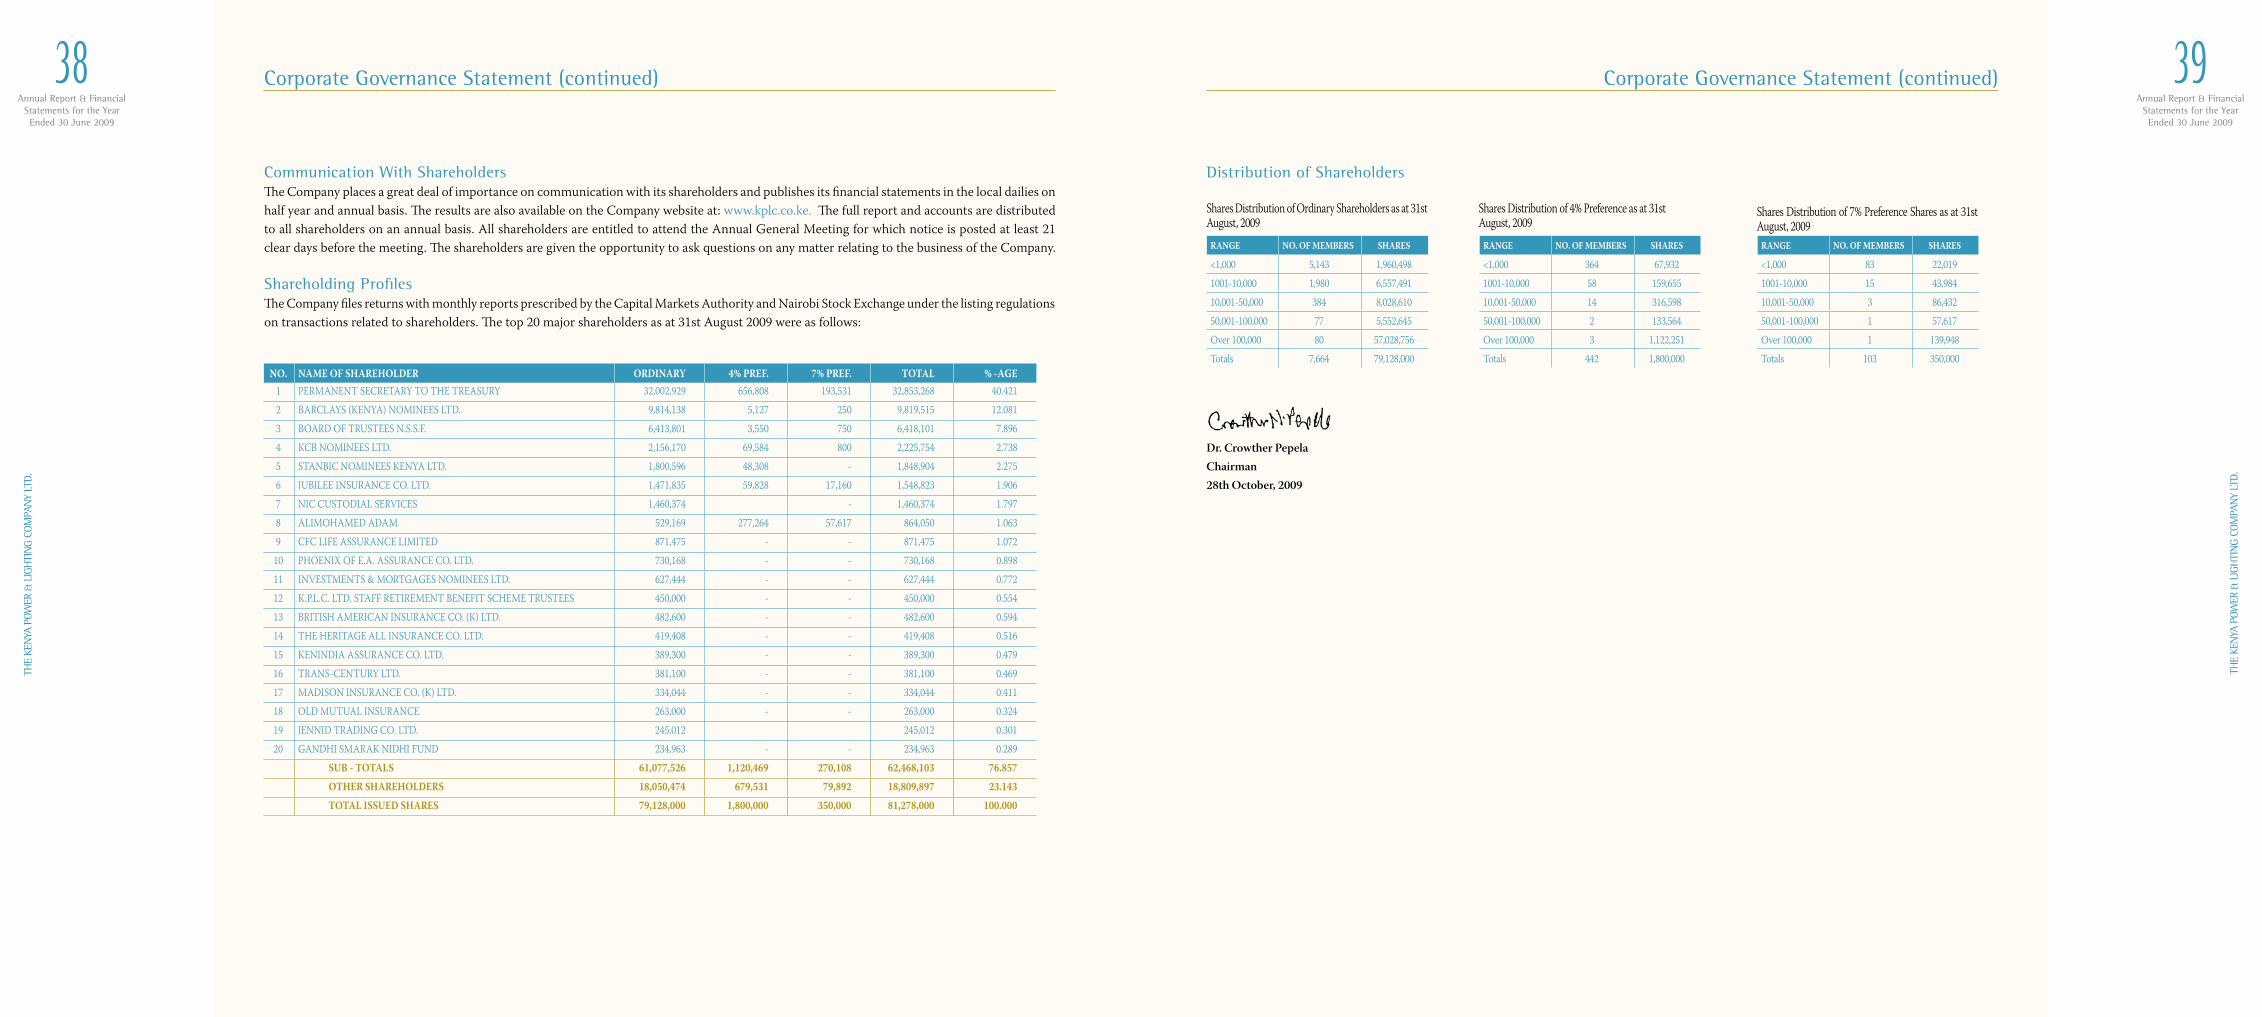
Annual Report & FinancialStatements for the YearEnded 30 June 2009
38TH
E KE
NYA
POW
ER &
LIG
HTI
NG
COM
PAN
Y LT
D.
Annual Report & FinancialStatements for the YearEnded 30 June 2009
39
THE
KEN
YA P
OWER
& L
IGH
TIN
G CO
MPA
NY
LTD.
NO. NAME OF SHAREHOLDER ORDINARY 4% PREF. 7% PREF. TOTAL % -AGE1 PERMANENT SECRETARY TO THE TREASURY 32,002,929 656,808 193,531 32,853,268 40.421
2 BARCLAYS (KENYA) NOMINEES LTD. 9,814,138 5,127 250 9,819,515 12.081
3 BOARD OF TRUSTEES N.S.S.F. 6,413,801 3,550 750 6,418,101 7.896
4 KCB NOMINEES LTD. 2,156,170 69,584 800 2,225,754 2.738
5 STANBIC NOMINEES KENYA LTD. 1,800,596 48,308 - 1,848,904 2.275
6 JUBILEE INSURANCE CO. LTD. 1,471,835 59,828 17,160 1,548,823 1.906
7 NIC CUSTODIAL SERVICES 1,460,374 - 1,460,374 1.797
8 ALIMOHAMED ADAM 529,169 277,264 57,617 864,050 1.063
9 CFC LIFE ASSURANCE LIMITED 871,475 - - 871,475 1.072
10 PHOENIX OF E.A. ASSURANCE CO. LTD. 730,168 - - 730,168 0.898
11 INVESTMENTS & MORTGAGES NOMINEES LTD. 627,444 - - 627,444 0.772
12 K.P.L.C. LTD. STAFF RETIREMENT BENEFIT SCHEME TRUSTEES 450,000 - - 450,000 0.554
13 BRITISH AMERICAN INSURANCE CO. (K) LTD. 482,600 - - 482,600 0.594
14 THE HERITAGE ALL INSURANCE CO. LTD. 419,408 - - 419,408 0.516
15 KENINDIA ASSURANCE CO. LTD. 389,300 - - 389,300 0.479
16 TRANS-CENTURY LTD. 381,100 - - 381,100 0.469
17 MADISON INSURANCE CO. (K) LTD. 334,044 - - 334,044 0.411
18 OLD MUTUAL INSURANCE 263,000 - - 263,000 0.324
19 JENNID TRADING CO. LTD. 245,012 245,012 0.301
20 GANDHI SMARAK NIDHI FUND 234,963 - - 234,963 0.289
SUB - TOTALS 61,077,526 1,120,469 270,108 62,468,103 76.857
OTHER SHAREHOLDERS 18,050,474 679,531 79,892 18,809,897 23.143
TOTAL ISSUED SHARES 79,128,000 1,800,000 350,000 81,278,000 100.000
Distribution of Shareholders
Shares Distribution of Ordinary Shareholders as at 31st August, 2009
Shares Distribution of 4% Preference as at 31st August, 2009
Shares Distribution of 7% Preference Shares as at 31st August, 2009
RANGE NO. OF MEMBERS SHARES
<1,000 5,143 1,960,498
1001-10,000 1,980 6,557,491
10,001-50,000 384 8,028,610
50,001-100,000 77 5,552,645
Over 100,000 80 57,028,756
Totals 7,664 79,128,000
RANGE NO. OF MEMBERS SHARES
<1,000 83 22,019
1001-10,000 15 43,984
10,001-50,000 3 86,432
50,001-100,000 1 57,617
Over 100,000 1 139,948
Totals 103 350,000
RANGE NO. OF MEMBERS SHARES
<1,000 364 67,932
1001-10,000 58 159,655
10,001-50,000 14 316,598
50,001-100,000 2 133,564
Over 100,000 3 1,122,251
Totals 442 1,800,000
Dr. Crowther PepelaChairman 28th October, 2009
Communication With ShareholdersThe Company places a great deal of importance on communication with its shareholders and publishes its financial statements in the local dailies on half year and annual basis. The results are also available on the Company website at: www.kplc.co.ke. The full report and accounts are distributed to all shareholders on an annual basis. All shareholders are entitled to attend the Annual General Meeting for which notice is posted at least 21 clear days before the meeting. The shareholders are given the opportunity to ask questions on any matter relating to the business of the Company.
Shareholding ProfilesThe Company files returns with monthly reports prescribed by the Capital Markets Authority and Nairobi Stock Exchange under the listing regulations on transactions related to shareholders. The top 20 major shareholders as at 31st August 2009 were as follows:
Corporate Governance Statement (continued)Corporate Governance Statement (continued)
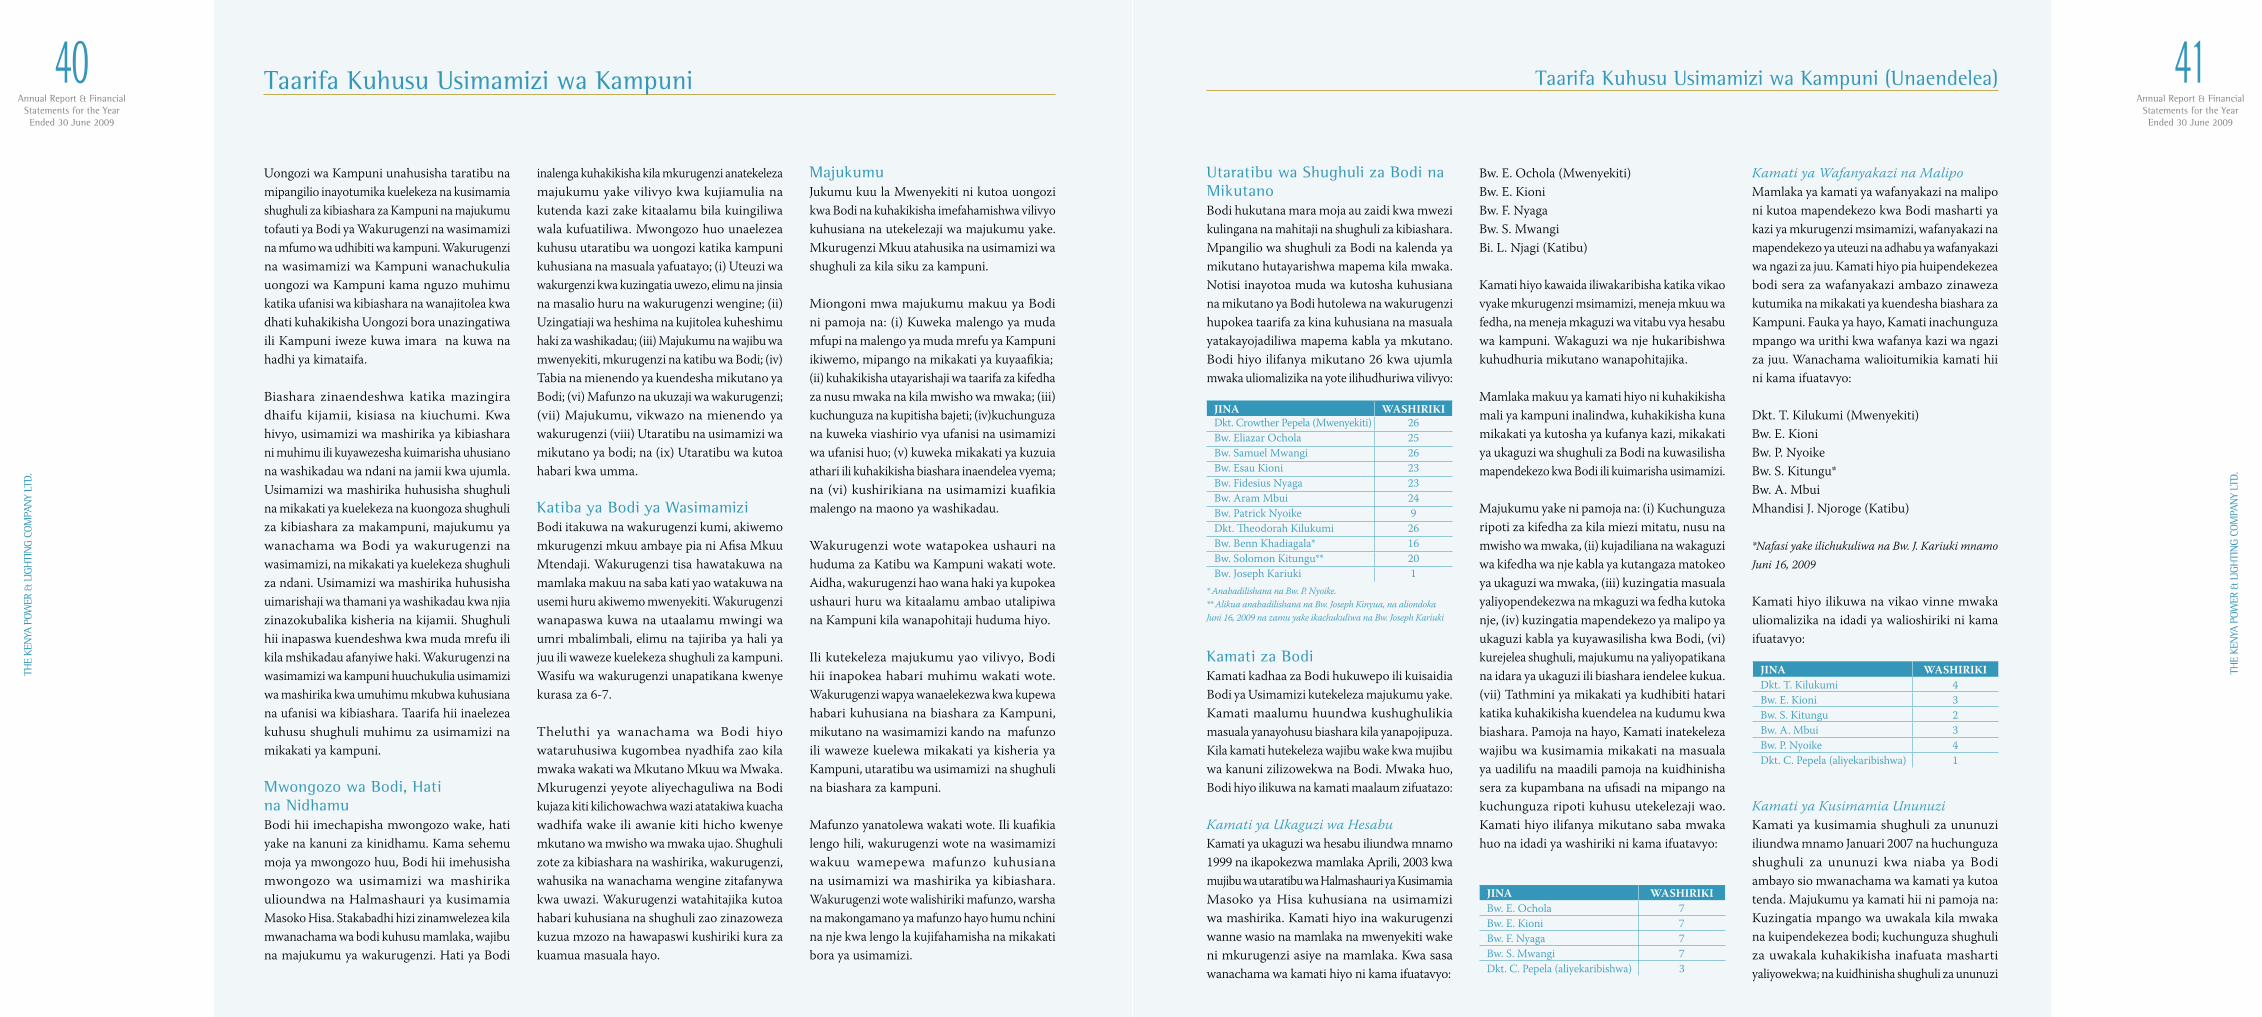
Annual Report & FinancialStatements for the YearEnded 30 June 2009
40TH
E KE
NYA
POW
ER &
LIG
HTI
NG
COM
PAN
Y LT
D.
Annual Report & FinancialStatements for the YearEnded 30 June 2009
41
THE
KEN
YA P
OWER
& L
IGH
TIN
G CO
MPA
NY
LTD.
Utaratibu wa Shughuli za Bodi na MikutanoBodi hukutana mara moja au zaidi kwa mwezi kulingana na mahitaji na shughuli za kibiashara. Mpangilio wa shughuli za Bodi na kalenda ya mikutano hutayarishwa mapema kila mwaka. Notisi inayotoa muda wa kutosha kuhusiana na mikutano ya Bodi hutolewa na wakurugenzi hupokea taarifa za kina kuhusiana na masuala yatakayojadiliwa mapema kabla ya mkutano. Bodi hiyo ilifanya mikutano 26 kwa ujumla mwaka uliomalizika na yote ilihudhuriwa vilivyo:
Kamati za BodiKamati kadhaa za Bodi hukuwepo ili kuisaidia Bodi ya Usimamizi kutekeleza majukumu yake. Kamati maalumu huundwa kushughulikia masuala yanayohusu biashara kila yanapojipuza. Kila kamati hutekeleza wajibu wake kwa mujibu wa kanuni zilizowekwa na Bodi. Mwaka huo, Bodi hiyo ilikuwa na kamati maalaum zifuatazo:
Kamati ya Ukaguzi wa HesabuKamati ya ukaguzi wa hesabu iliundwa mnamo 1999 na ikapokezwa mamlaka Aprili, 2003 kwa mujibu wa utaratibu wa Halmashauri ya Kusimamia Masoko ya Hisa kuhusiana na usimamizi wa mashirika. Kamati hiyo ina wakurugenzi wanne wasio na mamlaka na mwenyekiti wake ni mkurugenzi asiye na mamlaka. Kwa sasa wanachama wa kamati hiyo ni kama ifuatavyo:
Bw. E. Ochola (Mwenyekiti)Bw. E. KioniBw. F. NyagaBw. S. Mwangi Bi. L. Njagi (Katibu)
Kamati hiyo kawaida iliwakaribisha katika vikao vyake mkurugenzi msimamizi, meneja mkuu wa fedha, na meneja mkaguzi wa vitabu vya hesabu wa kampuni. Wakaguzi wa nje hukaribishwa kuhudhuria mikutano wanapohitajika.
Mamlaka makuu ya kamati hiyo ni kuhakikisha mali ya kampuni inalindwa, kuhakikisha kuna mikakati ya kutosha ya kufanya kazi, mikakati ya ukaguzi wa shughuli za Bodi na kuwasilisha mapendekezo kwa Bodi ili kuimarisha usimamizi.
Majukumu yake ni pamoja na: (i) Kuchunguza ripoti za kifedha za kila miezi mitatu, nusu na mwisho wa mwaka, (ii) kujadiliana na wakaguzi wa kifedha wa nje kabla ya kutangaza matokeo ya ukaguzi wa mwaka, (iii) kuzingatia masuala yaliyopendekezwa na mkaguzi wa fedha kutoka nje, (iv) kuzingatia mapendekezo ya malipo ya ukaguzi kabla ya kuyawasilisha kwa Bodi, (vi) kurejelea shughuli, majukumu na yaliyopatikana na idara ya ukaguzi ili biashara iendelee kukua. (vii) Tathmini ya mikakati ya kudhibiti hatari katika kuhakikisha kuendelea na kudumu kwa biashara. Pamoja na hayo, Kamati inatekeleza wajibu wa kusimamia mikakati na masuala ya uadilifu na maadili pamoja na kuidhinisha sera za kupambana na ufisadi na mipango na kuchunguza ripoti kuhusu utekelezaji wao. Kamati hiyo ilifanya mikutano saba mwaka huo na idadi ya washiriki ni kama ifuatavyo:
Kamati ya Wafanyakazi na Malipo Mamlaka ya kamati ya wafanyakazi na malipo ni kutoa mapendekezo kwa Bodi masharti ya kazi ya mkurugenzi msimamizi, wafanyakazi na mapendekezo ya uteuzi na adhabu ya wafanyakazi wa ngazi za juu. Kamati hiyo pia huipendekezea bodi sera za wafanyakazi ambazo zinaweza kutumika na mikakati ya kuendesha biashara za Kampuni. Fauka ya hayo, Kamati inachunguza mpango wa urithi kwa wafanya kazi wa ngazi za juu. Wanachama walioitumikia kamati hii ni kama ifuatavyo:
Dkt. T. Kilukumi (Mwenyekiti)Bw. E. KioniBw. P. NyoikeBw. S. Kitungu*Bw. A. MbuiMhandisi J. Njoroge (Katibu)
*Nafasi yake ilichukuliwa na Bw. J. Kariuki mnamo Juni 16, 2009
Kamati hiyo ilikuwa na vikao vinne mwaka uliomalizika na idadi ya walioshiriki ni kama ifuatavyo:
Kamati ya Kusimamia UnunuziKamati ya kusimamia shughuli za ununuzi iliundwa mnamo Januari 2007 na huchunguza shughuli za ununuzi kwa niaba ya Bodi ambayo sio mwanachama wa kamati ya kutoa tenda. Majukumu ya kamati hii ni pamoja na: Kuzingatia mpango wa uwakala kila mwaka na kuipendekezea bodi; kuchunguza shughuli za uwakala kuhakikisha inafuata masharti yaliyowekwa; na kuidhinisha shughuli za ununuzi
Taarifa Kuhusu Usimamizi wa Kampuni (Unaendelea)Taarifa Kuhusu Usimamizi wa Kampuni
Uongozi wa Kampuni unahusisha taratibu na mipangilio inayotumika kuelekeza na kusimamia shughuli za kibiashara za Kampuni na majukumu tofauti ya Bodi ya Wakurugenzi na wasimamizi na mfumo wa udhibiti wa kampuni. Wakurugenzi na wasimamizi wa Kampuni wanachukulia uongozi wa Kampuni kama nguzo muhimu katika ufanisi wa kibiashara na wanajitolea kwa dhati kuhakikisha Uongozi bora unazingatiwa ili Kampuni iweze kuwa imara na kuwa na hadhi ya kimataifa.
Biashara zinaendeshwa katika mazingira dhaifu kijamii, kisiasa na kiuchumi. Kwa hivyo, usimamizi wa mashirika ya kibiashara ni muhimu ili kuyawezesha kuimarisha uhusiano na washikadau wa ndani na jamii kwa ujumla. Usimamizi wa mashirika huhusisha shughuli na mikakati ya kuelekeza na kuongoza shughuli za kibiashara za makampuni, majukumu ya wanachama wa Bodi ya wakurugenzi na wasimamizi, na mikakati ya kuelekeza shughuli za ndani. Usimamizi wa mashirika huhusisha uimarishaji wa thamani ya washikadau kwa njia zinazokubalika kisheria na kijamii. Shughuli hii inapaswa kuendeshwa kwa muda mrefu ili kila mshikadau afanyiwe haki. Wakurugenzi na wasimamizi wa kampuni huuchukulia usimamizi wa mashirika kwa umuhimu mkubwa kuhusiana na ufanisi wa kibiashara. Taarifa hii inaelezea kuhusu shughuli muhimu za usimamizi na mikakati ya kampuni.
Mwongozo wa Bodi, Hati na Nidhamu Bodi hii imechapisha mwongozo wake, hati yake na kanuni za kinidhamu. Kama sehemu moja ya mwongozo huu, Bodi hii imehusisha mwongozo wa usimamizi wa mashirika ulioundwa na Halmashauri ya kusimamia Masoko Hisa. Stakabadhi hizi zinamwelezea kila mwanachama wa bodi kuhusu mamlaka, wajibu na majukumu ya wakurugenzi. Hati ya Bodi
inalenga kuhakikisha kila mkurugenzi anatekeleza majukumu yake vilivyo kwa kujiamulia na kutenda kazi zake kitaalamu bila kuingiliwa wala kufuatiliwa. Mwongozo huo unaelezea kuhusu utaratibu wa uongozi katika kampuni kuhusiana na masuala yafuatayo; (i) Uteuzi wa wakurgenzi kwa kuzingatia uwezo, elimu na jinsia na masalio huru na wakurugenzi wengine; (ii) Uzingatiaji wa heshima na kujitolea kuheshimu haki za washikadau; (iii) Majukumu na wajibu wa mwenyekiti, mkurugenzi na katibu wa Bodi; (iv) Tabia na mienendo ya kuendesha mikutano ya Bodi; (vi) Mafunzo na ukuzaji wa wakurugenzi; (vii) Majukumu, vikwazo na mienendo ya wakurugenzi (viii) Utaratibu na usimamizi wa mikutano ya bodi; na (ix) Utaratibu wa kutoa habari kwa umma.
Katiba ya Bodi ya WasimamiziBodi itakuwa na wakurugenzi kumi, akiwemo mkurugenzi mkuu ambaye pia ni Afisa Mkuu Mtendaji. Wakurugenzi tisa hawatakuwa na mamlaka makuu na saba kati yao watakuwa na usemi huru akiwemo mwenyekiti. Wakurugenzi wanapaswa kuwa na utaalamu mwingi wa umri mbalimbali, elimu na tajiriba ya hali ya juu ili waweze kuelekeza shughuli za kampuni. Wasifu wa wakurugenzi unapatikana kwenye kurasa za 6-7.
Theluthi ya wanachama wa Bodi hiyo wataruhusiwa kugombea nyadhifa zao kila mwaka wakati wa Mkutano Mkuu wa Mwaka. Mkurugenzi yeyote aliyechaguliwa na Bodi kujaza kiti kilichowachwa wazi atatakiwa kuacha wadhifa wake ili awanie kiti hicho kwenye mkutano wa mwisho wa mwaka ujao. Shughuli zote za kibiashara na washirika, wakurugenzi, wahusika na wanachama wengine zitafanywa kwa uwazi. Wakurugenzi watahitajika kutoa habari kuhusiana na shughuli zao zinazoweza kuzua mzozo na hawapaswi kushiriki kura za kuamua masuala hayo.
MajukumuJukumu kuu la Mwenyekiti ni kutoa uongozi kwa Bodi na kuhakikisha imefahamishwa vilivyo kuhusiana na utekelezaji wa majukumu yake. Mkurugenzi Mkuu atahusika na usimamizi wa shughuli za kila siku za kampuni.
Miongoni mwa majukumu makuu ya Bodi ni pamoja na: (i) Kuweka malengo ya muda mfupi na malengo ya muda mrefu ya Kampuni ikiwemo, mipango na mikakati ya kuyaafikia;(ii) kuhakikisha utayarishaji wa taarifa za kifedha za nusu mwaka na kila mwisho wa mwaka; (iii) kuchunguza na kupitisha bajeti; (iv)kuchunguza na kuweka viashirio vya ufanisi na usimamizi wa ufanisi huo; (v) kuweka mikakati ya kuzuia athari ili kuhakikisha biashara inaendelea vyema; na (vi) kushirikiana na usimamizi kuafikia malengo na maono ya washikadau.
Wakurugenzi wote watapokea ushauri na huduma za Katibu wa Kampuni wakati wote. Aidha, wakurugenzi hao wana haki ya kupokea ushauri huru wa kitaalamu ambao utalipiwa na Kampuni kila wanapohitaji huduma hiyo.
Ili kutekeleza majukumu yao vilivyo, Bodi hii inapokea habari muhimu wakati wote. Wakurugenzi wapya wanaelekezwa kwa kupewa habari kuhusiana na biashara za Kampuni, mikutano na wasimamizi kando na mafunzo ili waweze kuelewa mikakati ya kisheria ya Kampuni, utaratibu wa usimamizi na shughuli na biashara za kampuni.
Mafunzo yanatolewa wakati wote. Ili kuafikia lengo hili, wakurugenzi wote na wasimamizi wakuu wamepewa mafunzo kuhusiana na usimamizi wa mashirika ya kibiashara. Wakurugenzi wote walishiriki mafunzo, warsha na makongamano ya mafunzo hayo humu nchini na nje kwa lengo la kujifahamisha na mikakati bora ya usimamizi.
* Anabadilishana na Bw. P. Nyoike.** Alikua anabadilishana na Bw. Joseph Kinyua, na aliondoka Juni 16, 2009 na zamu yake ikachukuliwa na Bw. Joseph Kariuki
JINA WASHIRIKIDkt. Crowther Pepela (Mwenyekiti) 26Bw. Eliazar Ochola 25Bw. Samuel Mwangi 26Bw. Esau Kioni 23Bw. Fidesius Nyaga 23Bw. Aram Mbui 24Bw. Patrick Nyoike 9Dkt. Theodorah Kilukumi 26Bw. Benn Khadiagala* 16Bw. Solomon Kitungu** 20Bw. Joseph Kariuki 1
JINA WASHIRIKIDkt. T. Kilukumi 4Bw. E. Kioni 3Bw. S. Kitungu 2Bw. A. Mbui 3Bw. P. Nyoike 4Dkt. C. Pepela (aliyekaribishwa) 1
JINA WASHIRIKIBw. E. Ochola 7Bw. E. Kioni 7Bw. F. Nyaga 7Bw. S. Mwangi 7Dkt. C. Pepela (aliyekaribishwa) 3
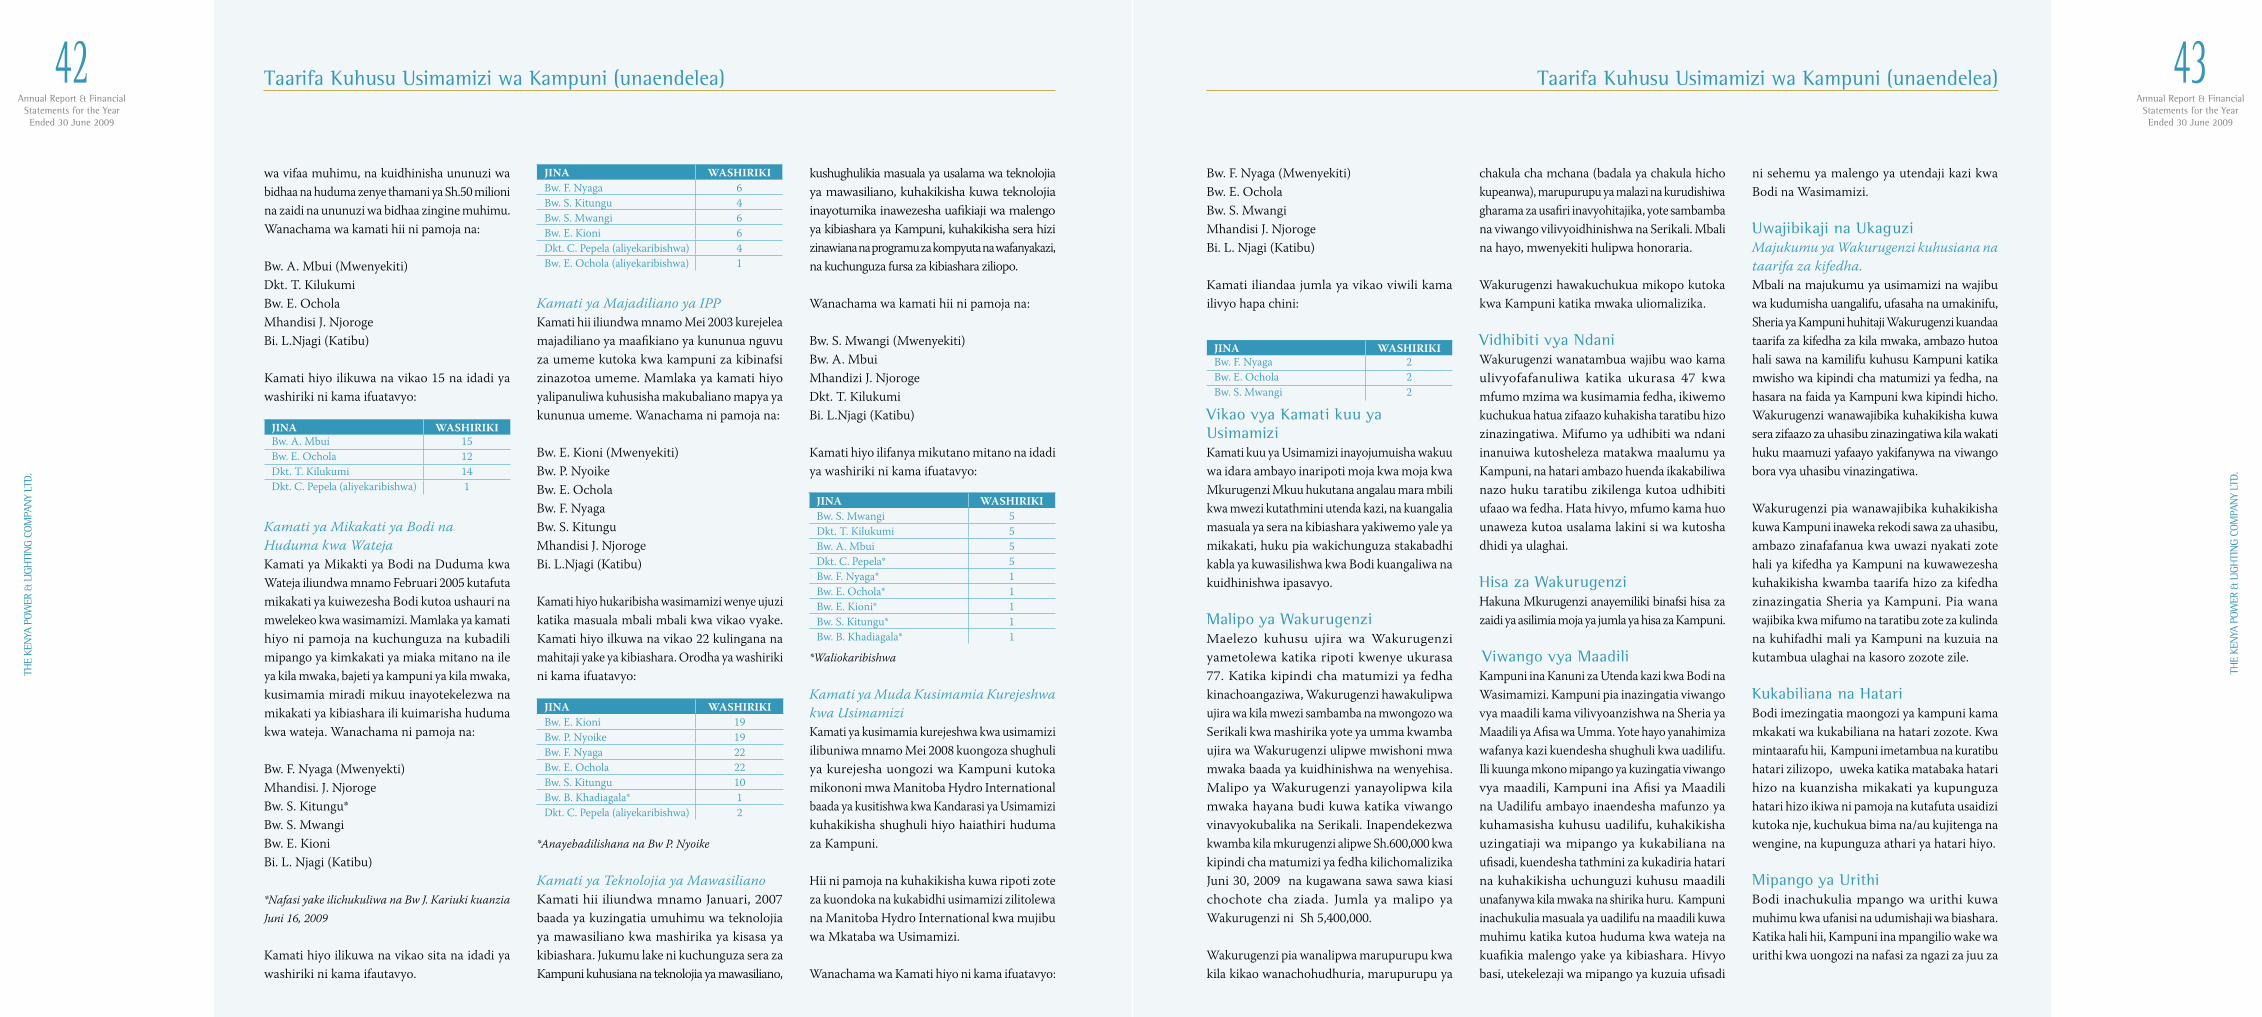
Annual Report & FinancialStatements for the YearEnded 30 June 2009
42TH
E KE
NYA
POW
ER &
LIG
HTI
NG
COM
PAN
Y LT
D.
Annual Report & FinancialStatements for the YearEnded 30 June 2009
43
THE
KEN
YA P
OWER
& L
IGH
TIN
G CO
MPA
NY
LTD.
wa vifaa muhimu, na kuidhinisha ununuzi wa bidhaa na huduma zenye thamani ya Sh.50 milioni na zaidi na ununuzi wa bidhaa zingine muhimu. Wanachama wa kamati hii ni pamoja na:
Bw. A. Mbui (Mwenyekiti)Dkt. T. KilukumiBw. E. OcholaMhandisi J. Njoroge Bi. L.Njagi (Katibu) Kamati hiyo ilikuwa na vikao 15 na idadi ya washiriki ni kama ifuatavyo:
Kamati ya Mikakati ya Bodi na Huduma kwa Wateja Kamati ya Mikakti ya Bodi na Duduma kwa Wateja iliundwa mnamo Februari 2005 kutafuta mikakati ya kuiwezesha Bodi kutoa ushauri na mwelekeo kwa wasimamizi. Mamlaka ya kamati hiyo ni pamoja na kuchunguza na kubadili mipango ya kimkakati ya miaka mitano na ile ya kila mwaka, bajeti ya kampuni ya kila mwaka, kusimamia miradi mikuu inayotekelezwa na mikakati ya kibiashara ili kuimarisha huduma kwa wateja. Wanachama ni pamoja na:
Bw. F. Nyaga (Mwenyekti)Mhandisi. J. NjorogeBw. S. Kitungu*Bw. S. MwangiBw. E. KioniBi. L. Njagi (Katibu)
*Nafasi yake ilichukuliwa na Bw J. Kariuki kuanzia Juni 16, 2009
Kamati hiyo ilikuwa na vikao sita na idadi ya washiriki ni kama ifautavyo.
Kamati ya Majadiliano ya IPPKamati hii iliundwa mnamo Mei 2003 kurejelea majadiliano ya maafikiano ya kununua nguvu za umeme kutoka kwa kampuni za kibinafsi zinazotoa umeme. Mamlaka ya kamati hiyo yalipanuliwa kuhusisha makubaliano mapya ya kununua umeme. Wanachama ni pamoja na:
Bw. E. Kioni (Mwenyekiti) Bw. P. Nyoike Bw. E. OcholaBw. F. NyagaBw. S. KitunguMhandisi J. NjorogeBi. L.Njagi (Katibu)
Kamati hiyo hukaribisha wasimamizi wenye ujuzi katika masuala mbali mbali kwa vikao vyake. Kamati hiyo ilkuwa na vikao 22 kulingana na mahitaji yake ya kibiashara. Orodha ya washiriki ni kama ifuatavyo:
*Anayebadilishana na Bw P. Nyoike
Kamati ya Teknolojia ya MawasilianoKamati hii iliundwa mnamo Januari, 2007 baada ya kuzingatia umuhimu wa teknolojia ya mawasiliano kwa mashirika ya kisasa ya kibiashara. Jukumu lake ni kuchunguza sera za Kampuni kuhusiana na teknolojia ya mawasiliano,
kushughulikia masuala ya usalama wa teknolojia ya mawasiliano, kuhakikisha kuwa teknolojia inayotumika inawezesha uafikiaji wa malengo ya kibiashara ya Kampuni, kuhakikisha sera hizi zinawiana na programu za kompyuta na wafanyakazi, na kuchunguza fursa za kibiashara ziliopo.
Wanachama wa kamati hii ni pamoja na:
Bw. S. Mwangi (Mwenyekiti)Bw. A. MbuiMhandizi J. NjorogeDkt. T. KilukumiBi. L.Njagi (Katibu)
Kamati hiyo ilifanya mikutano mitano na idadi ya washiriki ni kama ifuatavyo:
*Waliokaribishwa
Kamati ya Muda Kusimamia Kurejeshwa kwa Usimamizi Kamati ya kusimamia kurejeshwa kwa usimamizi ilibuniwa mnamo Mei 2008 kuongoza shughuli ya kurejesha uongozi wa Kampuni kutoka mikononi mwa Manitoba Hydro International baada ya kusitishwa kwa Kandarasi ya Usimamizi kuhakikisha shughuli hiyo haiathiri huduma za Kampuni.
Hii ni pamoja na kuhakikisha kuwa ripoti zote za kuondoka na kukabidhi usimamizi zilitolewa na Manitoba Hydro International kwa mujibu wa Mkataba wa Usimamizi.
Wanachama wa Kamati hiyo ni kama ifuatavyo:
Bw. F. Nyaga (Mwenyekiti)Bw. E. OcholaBw. S. MwangiMhandisi J. NjorogeBi. L. Njagi (Katibu)
Kamati iliandaa jumla ya vikao viwili kama ilivyo hapa chini:
Vikao vya Kamati kuu ya Usimamizi Kamati kuu ya Usimamizi inayojumuisha wakuu wa idara ambayo inaripoti moja kwa moja kwa Mkurugenzi Mkuu hukutana angalau mara mbili kwa mwezi kutathmini utenda kazi, na kuangalia masuala ya sera na kibiashara yakiwemo yale ya mikakati, huku pia wakichunguza stakabadhi kabla ya kuwasilishwa kwa Bodi kuangaliwa na kuidhinishwa ipasavyo.
Malipo ya WakurugenziMaelezo kuhusu ujira wa Wakurugenzi yametolewa katika ripoti kwenye ukurasa 77. Katika kipindi cha matumizi ya fedha kinachoangaziwa, Wakurugenzi hawakulipwa ujira wa kila mwezi sambamba na mwongozo wa Serikali kwa mashirika yote ya umma kwamba ujira wa Wakurugenzi ulipwe mwishoni mwa mwaka baada ya kuidhinishwa na wenyehisa. Malipo ya Wakurugenzi yanayolipwa kila mwaka hayana budi kuwa katika viwango vinavyokubalika na Serikali. Inapendekezwa kwamba kila mkurugenzi alipwe Sh.600,000 kwa kipindi cha matumizi ya fedha kilichomalizika Juni 30, 2009 na kugawana sawa sawa kiasi chochote cha ziada. Jumla ya malipo ya Wakurugenzi ni Sh 5,400,000.
Wakurugenzi pia wanalipwa marupurupu kwa kila kikao wanachohudhuria, marupurupu ya
chakula cha mchana (badala ya chakula hicho kupeanwa), marupurupu ya malazi na kurudishiwa gharama za usafiri inavyohitajika, yote sambamba na viwango vilivyoidhinishwa na Serikali. Mbali na hayo, mwenyekiti hulipwa honoraria.
Wakurugenzi hawakuchukua mikopo kutoka kwa Kampuni katika mwaka uliomalizika.
Vidhibiti vya NdaniWakurugenzi wanatambua wajibu wao kama ulivyofafanuliwa katika ukurasa 47 kwa mfumo mzima wa kusimamia fedha, ikiwemo kuchukua hatua zifaazo kuhakisha taratibu hizo zinazingatiwa. Mifumo ya udhibiti wa ndani inanuiwa kutosheleza matakwa maalumu ya Kampuni, na hatari ambazo huenda ikakabiliwa nazo huku taratibu zikilenga kutoa udhibiti ufaao wa fedha. Hata hivyo, mfumo kama huo unaweza kutoa usalama lakini si wa kutosha dhidi ya ulaghai.
Hisa za Wakurugenzi Hakuna Mkurugenzi anayemiliki binafsi hisa za zaidi ya asilimia moja ya jumla ya hisa za Kampuni.
Viwango vya MaadiliKampuni ina Kanuni za Utenda kazi kwa Bodi na Wasimamizi. Kampuni pia inazingatia viwango vya maadili kama vilivyoanzishwa na Sheria ya Maadili ya Afisa wa Umma. Yote hayo yanahimiza wafanya kazi kuendesha shughuli kwa uadilifu. Ili kuunga mkono mipango ya kuzingatia viwango vya maadili, Kampuni ina Afisi ya Maadili na Uadilifu ambayo inaendesha mafunzo ya kuhamasisha kuhusu uadilifu, kuhakikisha uzingatiaji wa mipango ya kukabiliana na ufisadi, kuendesha tathmini za kukadiria hatari na kuhakikisha uchunguzi kuhusu maadili unafanywa kila mwaka na shirika huru. Kampuni inachukulia masuala ya uadilifu na maadili kuwa muhimu katika kutoa huduma kwa wateja na kuafikia malengo yake ya kibiashara. Hivyo basi, utekelezaji wa mipango ya kuzuia ufisadi
ni sehemu ya malengo ya utendaji kazi kwa Bodi na Wasimamizi.
Uwajibikaji na UkaguziMajukumu ya Wakurugenzi kuhusiana na taarifa za kifedha. Mbali na majukumu ya usimamizi na wajibu wa kudumisha uangalifu, ufasaha na umakinifu, Sheria ya Kampuni huhitaji Wakurugenzi kuandaa taarifa za kifedha za kila mwaka, ambazo hutoa hali sawa na kamilifu kuhusu Kampuni katika mwisho wa kipindi cha matumizi ya fedha, na hasara na faida ya Kampuni kwa kipindi hicho. Wakurugenzi wanawajibika kuhakikisha kuwa sera zifaazo za uhasibu zinazingatiwa kila wakati huku maamuzi yafaayo yakifanywa na viwango bora vya uhasibu vinazingatiwa.
Wakurugenzi pia wanawajibika kuhakikisha kuwa Kampuni inaweka rekodi sawa za uhasibu, ambazo zinafafanua kwa uwazi nyakati zote hali ya kifedha ya Kampuni na kuwawezesha kuhakikisha kwamba taarifa hizo za kifedha zinazingatia Sheria ya Kampuni. Pia wana wajibika kwa mifumo na taratibu zote za kulinda na kuhifadhi mali ya Kampuni na kuzuia na kutambua ulaghai na kasoro zozote zile.
Kukabiliana na HatariBodi imezingatia maongozi ya kampuni kama mkakati wa kukabiliana na hatari zozote. Kwa mintaarafu hii, Kampuni imetambua na kuratibu hatari zilizopo, uweka katika matabaka hatari hizo na kuanzisha mikakati ya kupunguza hatari hizo ikiwa ni pamoja na kutafuta usaidizi kutoka nje, kuchukua bima na/au kujitenga na wengine, na kupunguza athari ya hatari hiyo.
Mipango ya UrithiBodi inachukulia mpango wa urithi kuwa muhimu kwa ufanisi na udumishaji wa biashara. Katika hali hii, Kampuni ina mpangilio wake wa urithi kwa uongozi na nafasi za ngazi za juu za
JINA WASHIRIKIBw. S. Mwangi 5Dkt. T. Kilukumi 5Bw. A. Mbui 5Dkt. C. Pepela* 5Bw. F. Nyaga* 1Bw. E. Ochola* 1Bw. E. Kioni* 1Bw. S. Kitungu* 1Bw. B. Khadiagala* 1
JINA WASHIRIKIBw. F. Nyaga 2Bw. E. Ochola 2Bw. S. Mwangi 2
JINA WASHIRIKIBw. E. Kioni 19Bw. P. Nyoike 19Bw. F. Nyaga 22Bw. E. Ochola 22Bw. S. Kitungu 10Bw. B. Khadiagala* 1Dkt. C. Pepela (aliyekaribishwa) 2
Taarifa Kuhusu Usimamizi wa Kampuni (unaendelea)Taarifa Kuhusu Usimamizi wa Kampuni (unaendelea)
JINA WASHIRIKIBw. F. Nyaga 6Bw. S. Kitungu 4Bw. S. Mwangi 6Bw. E. Kioni 6Dkt. C. Pepela (aliyekaribishwa) 4Bw. E. Ochola (aliyekaribishwa) 1
JINA WASHIRIKIBw. A. Mbui 15Bw. E. Ochola 12Dkt. T. Kilukumi 14Dkt. C. Pepela (aliyekaribishwa) 1
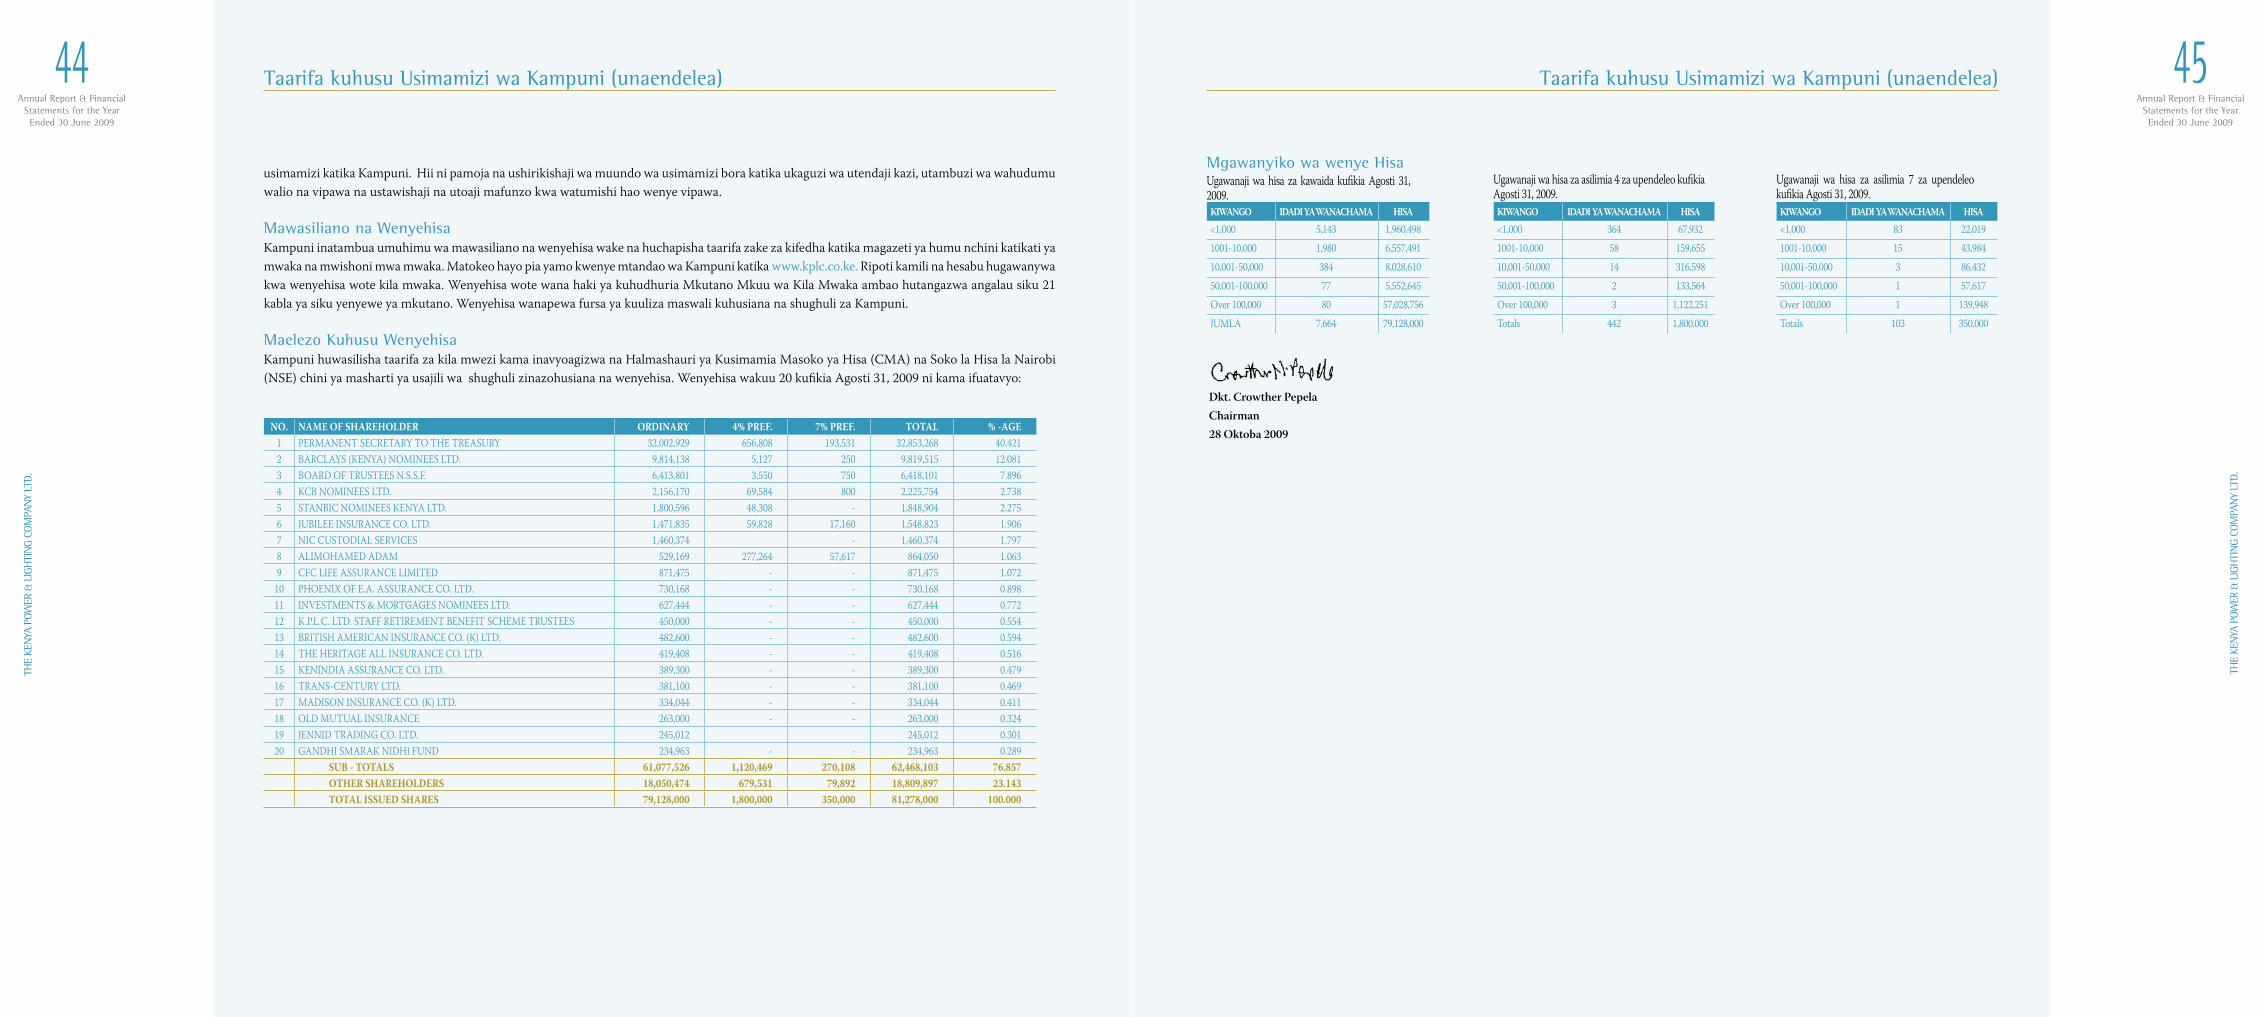
Annual Report & FinancialStatements for the YearEnded 30 June 2009
44TH
E KE
NYA
POW
ER &
LIG
HTI
NG
COM
PAN
Y LT
D.
Annual Report & FinancialStatements for the YearEnded 30 June 2009
45
THE
KEN
YA P
OWER
& L
IGH
TIN
G CO
MPA
NY
LTD.
Ugawanaji wa hisa za kawaida kufikia Agosti 31, 2009.
Ugawanaji wa hisa za asilimia 4 za upendeleo kufikia Agosti 31, 2009.
Ugawanaji wa hisa za asilimia 7 za upendeleo kufikia Agosti 31, 2009.
NO. NAME OF SHAREHOLDER ORDINARY 4% PREF. 7% PREF. TOTAL % -AGE1 PERMANENT SECRETARY TO THE TREASURY 32,002,929 656,808 193,531 32,853,268 40.4212 BARCLAYS (KENYA) NOMINEES LTD. 9,814,138 5,127 250 9,819,515 12.0813 BOARD OF TRUSTEES N.S.S.F. 6,413,801 3,550 750 6,418,101 7.8964 KCB NOMINEES LTD. 2,156,170 69,584 800 2,225,754 2.7385 STANBIC NOMINEES KENYA LTD. 1,800,596 48,308 - 1,848,904 2.2756 JUBILEE INSURANCE CO. LTD. 1,471,835 59,828 17,160 1,548,823 1.9067 NIC CUSTODIAL SERVICES 1,460,374 - 1,460,374 1.7978 ALIMOHAMED ADAM 529,169 277,264 57,617 864,050 1.0639 CFC LIFE ASSURANCE LIMITED 871,475 - - 871,475 1.072
10 PHOENIX OF E.A. ASSURANCE CO. LTD. 730,168 - - 730,168 0.89811 INVESTMENTS & MORTGAGES NOMINEES LTD. 627,444 - - 627,444 0.77212 K.P.L.C. LTD. STAFF RETIREMENT BENEFIT SCHEME TRUSTEES 450,000 - - 450,000 0.55413 BRITISH AMERICAN INSURANCE CO. (K) LTD. 482,600 - - 482,600 0.59414 THE HERITAGE ALL INSURANCE CO. LTD. 419,408 - - 419,408 0.51615 KENINDIA ASSURANCE CO. LTD. 389,300 - - 389,300 0.47916 TRANS-CENTURY LTD. 381,100 - - 381,100 0.46917 MADISON INSURANCE CO. (K) LTD. 334,044 - - 334,044 0.41118 OLD MUTUAL INSURANCE 263,000 - - 263,000 0.324 19 JENNID TRADING CO. LTD. 245,012 245,012 0.30120 GANDHI SMARAK NIDHI FUND 234,963 - - 234,963 0.289
SUB - TOTALS 61,077,526 1,120,469 270,108 62,468,103 76.857OTHER SHAREHOLDERS 18,050,474 679,531 79,892 18,809,897 23.143TOTAL ISSUED SHARES 79,128,000 1,800,000 350,000 81,278,000 100.000
Mgawanyiko wa wenye Hisa
KIWANGO IDADI YA WANACHAMA HISA
<1,000 5,143 1,960,498
1001-10,000 1,980 6,557,491
10,001-50,000 384 8,028,610
50,001-100,000 77 5,552,645
Over 100,000 80 57,028,756
JUMLA 7,664 79,128,000
KIWANGO IDADI YA WANACHAMA HISA
<1,000 364 67,932
1001-10,000 58 159,655
10,001-50,000 14 316,598
50,001-100,000 2 133,564
Over 100,000 3 1,122,251
Totals 442 1,800,000
Dkt. Crowther PepelaChairman 28 Oktoba 2009
KIWANGO IDADI YA WANACHAMA HISA
<1,000 83 22,019
1001-10,000 15 43,984
10,001-50,000 3 86,432
50,001-100,000 1 57,617
Over 100,000 1 139,948
Totals 103 350,000
Taarifa kuhusu Usimamizi wa Kampuni (unaendelea) Taarifa kuhusu Usimamizi wa Kampuni (unaendelea)
usimamizi katika Kampuni. Hii ni pamoja na ushirikishaji wa muundo wa usimamizi bora katika ukaguzi wa utendaji kazi, utambuzi wa wahudumu walio na vipawa na ustawishaji na utoaji mafunzo kwa watumishi hao wenye vipawa.
Mawasiliano na WenyehisaKampuni inatambua umuhimu wa mawasiliano na wenyehisa wake na huchapisha taarifa zake za kifedha katika magazeti ya humu nchini katikati ya mwaka na mwishoni mwa mwaka. Matokeo hayo pia yamo kwenye mtandao wa Kampuni katika www.kplc.co.ke. Ripoti kamili na hesabu hugawanywa kwa wenyehisa wote kila mwaka. Wenyehisa wote wana haki ya kuhudhuria Mkutano Mkuu wa Kila Mwaka ambao hutangazwa angalau siku 21 kabla ya siku yenyewe ya mkutano. Wenyehisa wanapewa fursa ya kuuliza maswali kuhusiana na shughuli za Kampuni.
Maelezo Kuhusu WenyehisaKampuni huwasilisha taarifa za kila mwezi kama inavyoagizwa na Halmashauri ya Kusimamia Masoko ya Hisa (CMA) na Soko la Hisa la Nairobi (NSE) chini ya masharti ya usajili wa shughuli zinazohusiana na wenyehisa. Wenyehisa wakuu 20 kufikia Agosti 31, 2009 ni kama ifuatavyo:
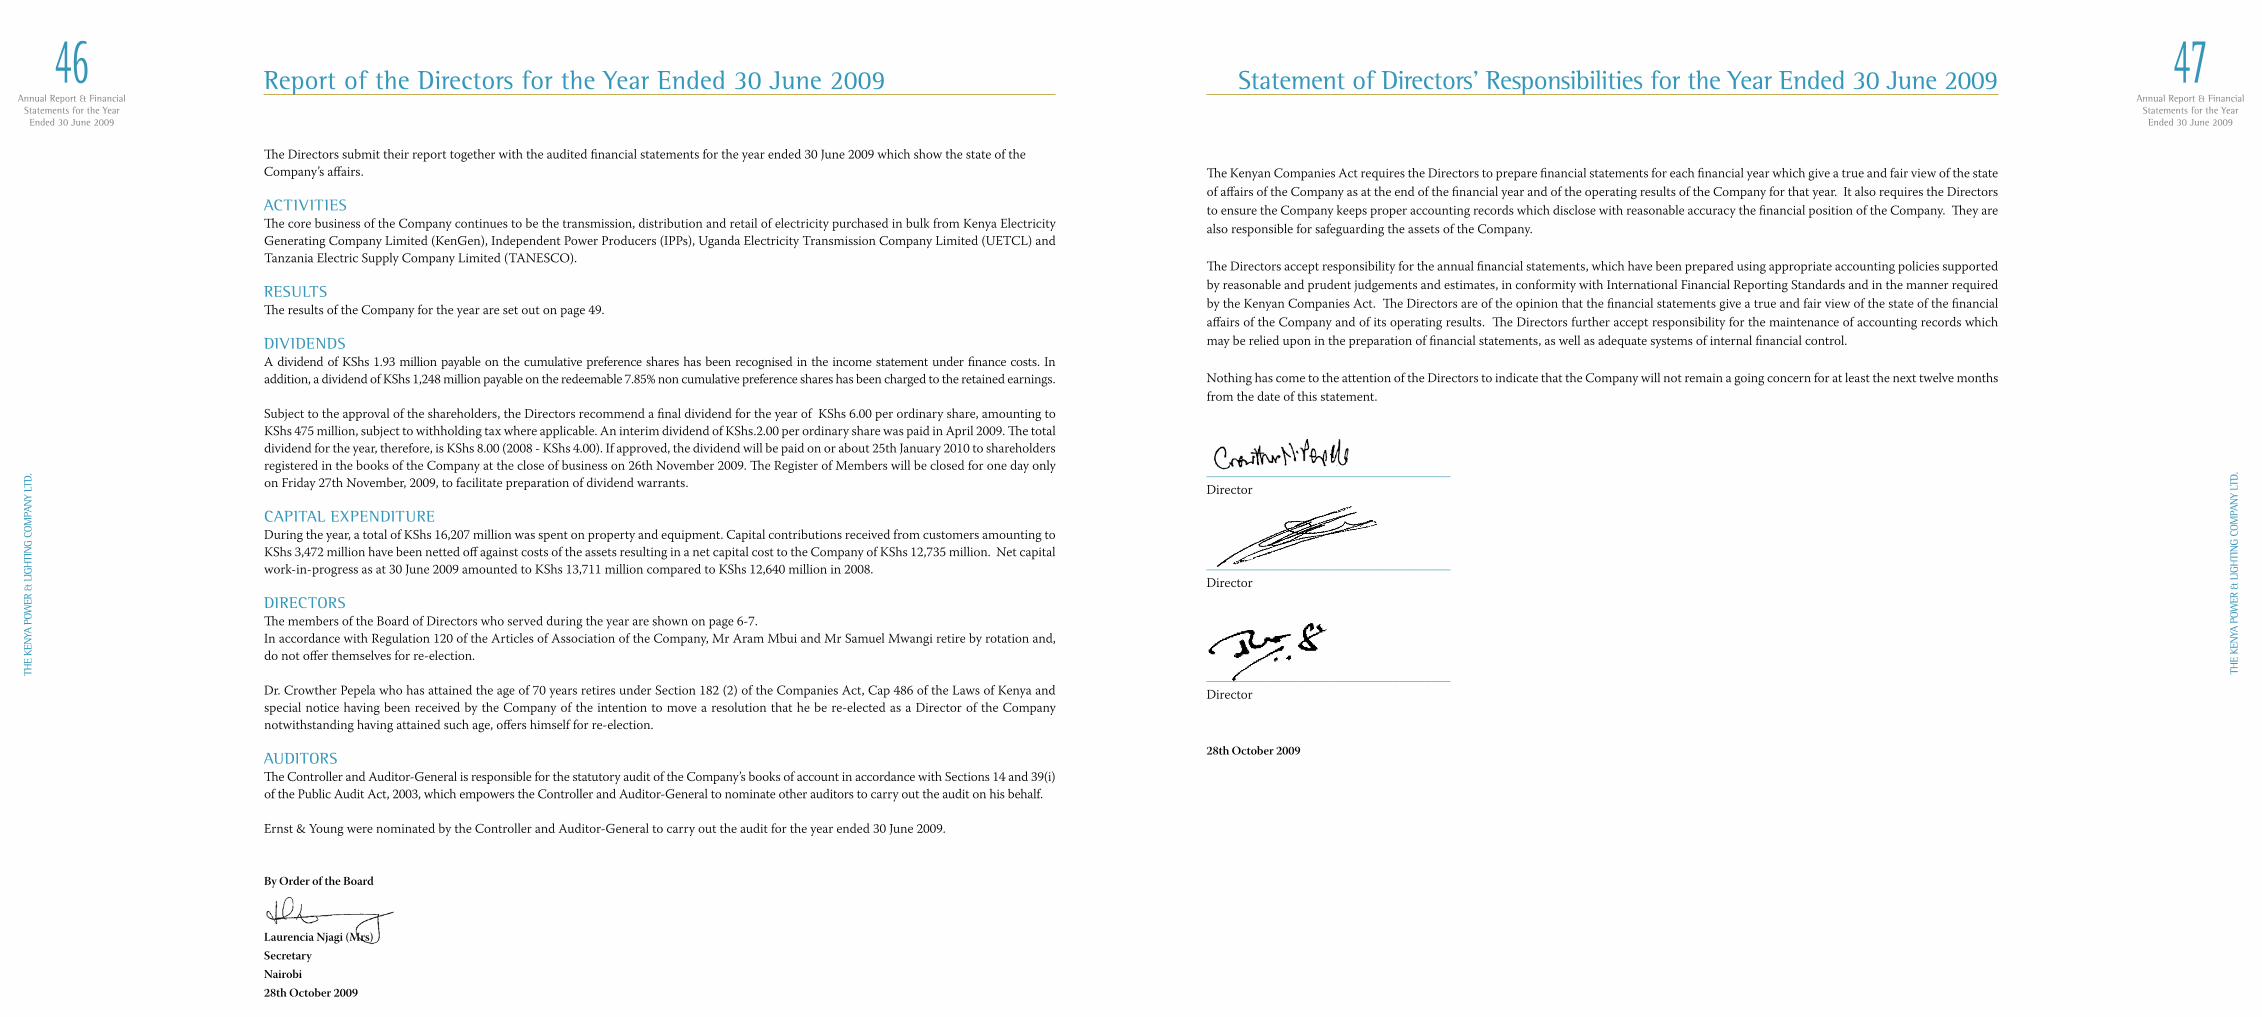
Annual Report & FinancialStatements for the YearEnded 30 June 2009
46TH
E KE
NYA
POW
ER &
LIG
HTI
NG
COM
PAN
Y LT
D.
Annual Report & FinancialStatements for the YearEnded 30 June 2009
47
THE
KEN
YA P
OWER
& L
IGH
TIN
G CO
MPA
NY
LTD.
The Directors submit their report together with the audited financial statements for the year ended 30 June 2009 which show the state of the Company’s affairs.
ACTIVITIESThe core business of the Company continues to be the transmission, distribution and retail of electricity purchased in bulk from Kenya Electricity Generating Company Limited (KenGen), Independent Power Producers (IPPs), Uganda Electricity Transmission Company Limited (UETCL) and Tanzania Electric Supply Company Limited (TANESCO).
RESULTSThe results of the Company for the year are set out on page 49.
DIVIDENDSA dividend of KShs 1.93 million payable on the cumulative preference shares has been recognised in the income statement under finance costs. In addition, a dividend of KShs 1,248 million payable on the redeemable 7.85% non cumulative preference shares has been charged to the retained earnings.
Subject to the approval of the shareholders, the Directors recommend a final dividend for the year of KShs 6.00 per ordinary share, amounting to KShs 475 million, subject to withholding tax where applicable. An interim dividend of KShs.2.00 per ordinary share was paid in April 2009. The total dividend for the year, therefore, is KShs 8.00 (2008 - KShs 4.00). If approved, the dividend will be paid on or about 25th January 2010 to shareholders registered in the books of the Company at the close of business on 26th November 2009. The Register of Members will be closed for one day only on Friday 27th November, 2009, to facilitate preparation of dividend warrants.
CAPITAL EXPENDITUREDuring the year, a total of KShs 16,207 million was spent on property and equipment. Capital contributions received from customers amounting to KShs 3,472 million have been netted off against costs of the assets resulting in a net capital cost to the Company of KShs 12,735 million. Net capital work-in-progress as at 30 June 2009 amounted to KShs 13,711 million compared to KShs 12,640 million in 2008.
DIRECTORSThe members of the Board of Directors who served during the year are shown on page 6-7.In accordance with Regulation 120 of the Articles of Association of the Company, Mr Aram Mbui and Mr Samuel Mwangi retire by rotation and, do not offer themselves for re-election.
Dr. Crowther Pepela who has attained the age of 70 years retires under Section 182 (2) of the Companies Act, Cap 486 of the Laws of Kenya and special notice having been received by the Company of the intention to move a resolution that he be re-elected as a Director of the Company notwithstanding having attained such age, offers himself for re-election.
AUDITORSThe Controller and Auditor-General is responsible for the statutory audit of the Company’s books of account in accordance with Sections 14 and 39(i) of the Public Audit Act, 2003, which empowers the Controller and Auditor-General to nominate other auditors to carry out the audit on his behalf.
Ernst & Young were nominated by the Controller and Auditor-General to carry out the audit for the year ended 30 June 2009.
By Order of the Board
Laurencia Njagi (Mrs)SecretaryNairobi28th October 2009
The Kenyan Companies Act requires the Directors to prepare financial statements for each financial year which give a true and fair view of the state of affairs of the Company as at the end of the financial year and of the operating results of the Company for that year. It also requires the Directors to ensure the Company keeps proper accounting records which disclose with reasonable accuracy the financial position of the Company. They are also responsible for safeguarding the assets of the Company.
The Directors accept responsibility for the annual financial statements, which have been prepared using appropriate accounting policies supported by reasonable and prudent judgements and estimates, in conformity with International Financial Reporting Standards and in the manner required by the Kenyan Companies Act. The Directors are of the opinion that the financial statements give a true and fair view of the state of the financial affairs of the Company and of its operating results. The Directors further accept responsibility for the maintenance of accounting records which may be relied upon in the preparation of financial statements, as well as adequate systems of internal financial control.
Nothing has come to the attention of the Directors to indicate that the Company will not remain a going concern for at least the next twelve months from the date of this statement.
______________________________________Director
______________________________________Director
______________________________________Director
28th October 2009
Report of the Directors for the Year Ended 30 June 2009 Statement of Directors’ Responsibilities for the Year Ended 30 June 2009
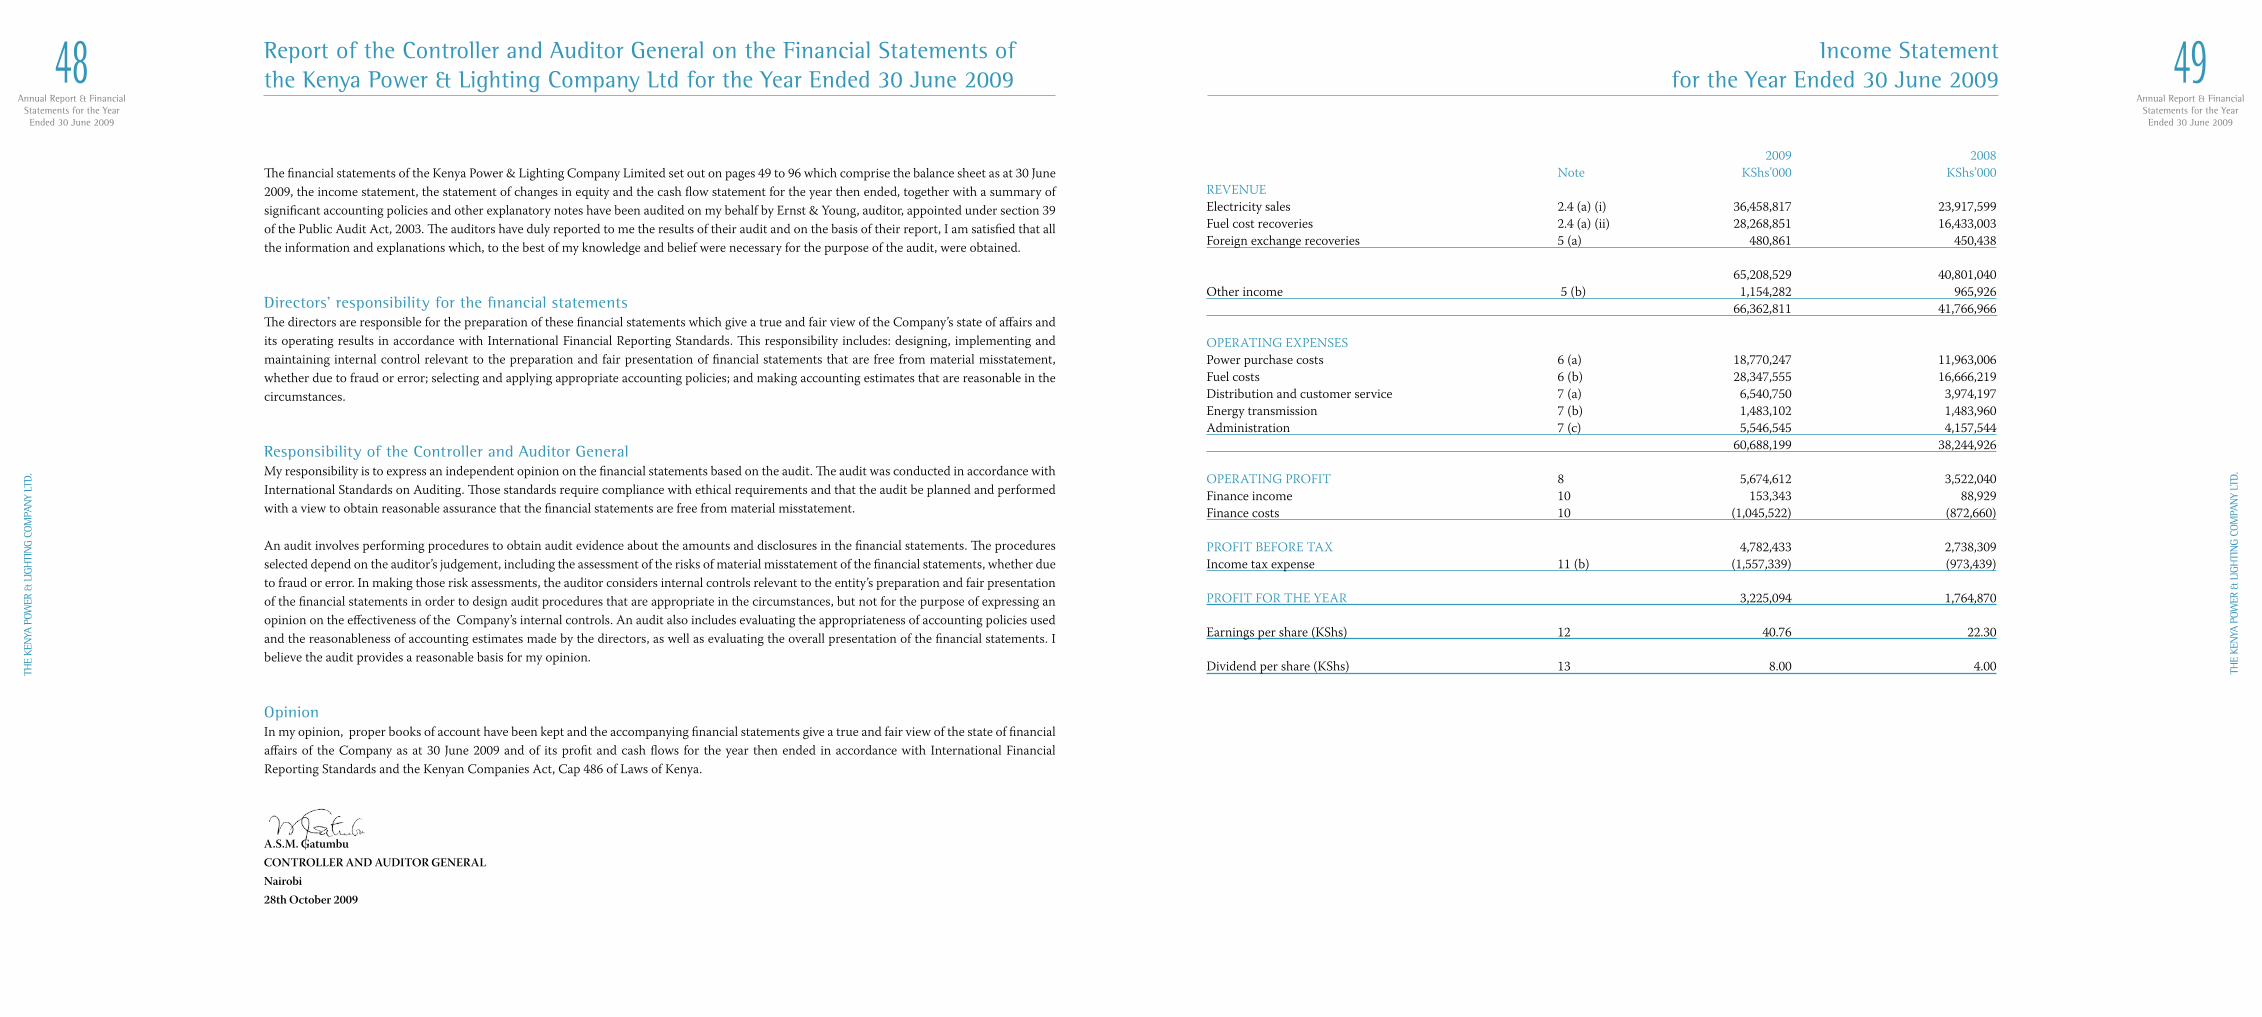
Annual Report & FinancialStatements for the YearEnded 30 June 2009
48TH
E KE
NYA
POW
ER &
LIG
HTI
NG
COM
PAN
Y LT
D.
Annual Report & FinancialStatements for the YearEnded 30 June 2009
49
THE
KEN
YA P
OWER
& L
IGH
TIN
G CO
MPA
NY
LTD.
2009 2008 Note KShs’000 KShs’000REVENUEElectricity sales 2.4 (a) (i) 36,458,817 23,917,599Fuel cost recoveries 2.4 (a) (ii) 28,268,851 16,433,003Foreign exchange recoveries 5 (a) 480,861 450,438 65,208,529 40,801,040Other income 5 (b) 1,154,282 965,926 66,362,811 41,766,966 OPERATING EXPENSESPower purchase costs 6 (a) 18,770,247 11,963,006Fuel costs 6 (b) 28,347,555 16,666,219Distribution and customer service 7 (a) 6,540,750 3,974,197Energy transmission 7 (b) 1,483,102 1,483,960Administration 7 (c) 5,546,545 4,157,544 60,688,199 38,244,926 OPERATING PROFIT 8 5,674,612 3,522,040Finance income 10 153,343 88,929Finance costs 10 (1,045,522) (872,660)
PROFIT BEFORE TAX 4,782,433 2,738,309Income tax expense 11 (b) (1,557,339) (973,439) PROFIT FOR THE YEAR 3,225,094 1,764,870
Earnings per share (KShs) 12 40.76 22.30
Dividend per share (KShs) 13 8.00 4.00
Income Statementfor the Year Ended 30 June 2009
The financial statements of the Kenya Power & Lighting Company Limited set out on pages 49 to 96 which comprise the balance sheet as at 30 June 2009, the income statement, the statement of changes in equity and the cash flow statement for the year then ended, together with a summary of significant accounting policies and other explanatory notes have been audited on my behalf by Ernst & Young, auditor, appointed under section 39 of the Public Audit Act, 2003. The auditors have duly reported to me the results of their audit and on the basis of their report, I am satisfied that all the information and explanations which, to the best of my knowledge and belief were necessary for the purpose of the audit, were obtained.
Directors’ responsibility for the financial statementsThe directors are responsible for the preparation of these financial statements which give a true and fair view of the Company’s state of affairs and its operating results in accordance with International Financial Reporting Standards. This responsibility includes: designing, implementing and maintaining internal control relevant to the preparation and fair presentation of financial statements that are free from material misstatement, whether due to fraud or error; selecting and applying appropriate accounting policies; and making accounting estimates that are reasonable in the circumstances.
Responsibility of the Controller and Auditor General My responsibility is to express an independent opinion on the financial statements based on the audit. The audit was conducted in accordance with International Standards on Auditing. Those standards require compliance with ethical requirements and that the audit be planned and performed with a view to obtain reasonable assurance that the financial statements are free from material misstatement.
An audit involves performing procedures to obtain audit evidence about the amounts and disclosures in the financial statements. The procedures selected depend on the auditor’s judgement, including the assessment of the risks of material misstatement of the financial statements, whether due to fraud or error. In making those risk assessments, the auditor considers internal controls relevant to the entity’s preparation and fair presentation of the financial statements in order to design audit procedures that are appropriate in the circumstances, but not for the purpose of expressing an opinion on the effectiveness of the Company’s internal controls. An audit also includes evaluating the appropriateness of accounting policies used and the reasonableness of accounting estimates made by the directors, as well as evaluating the overall presentation of the financial statements. I believe the audit provides a reasonable basis for my opinion.
Opinion In my opinion, proper books of account have been kept and the accompanying financial statements give a true and fair view of the state of financial affairs of the Company as at 30 June 2009 and of its profit and cash flows for the year then ended in accordance with International Financial Reporting Standards and the Kenyan Companies Act, Cap 486 of Laws of Kenya.
A.S.M. Gatumbu CONTROLLER AND AUDITOR GENERALNairobi28th October 2009
Report of the Controller and Auditor General on the Financial Statements of the Kenya Power & Lighting Company Ltd for the Year Ended 30 June 2009
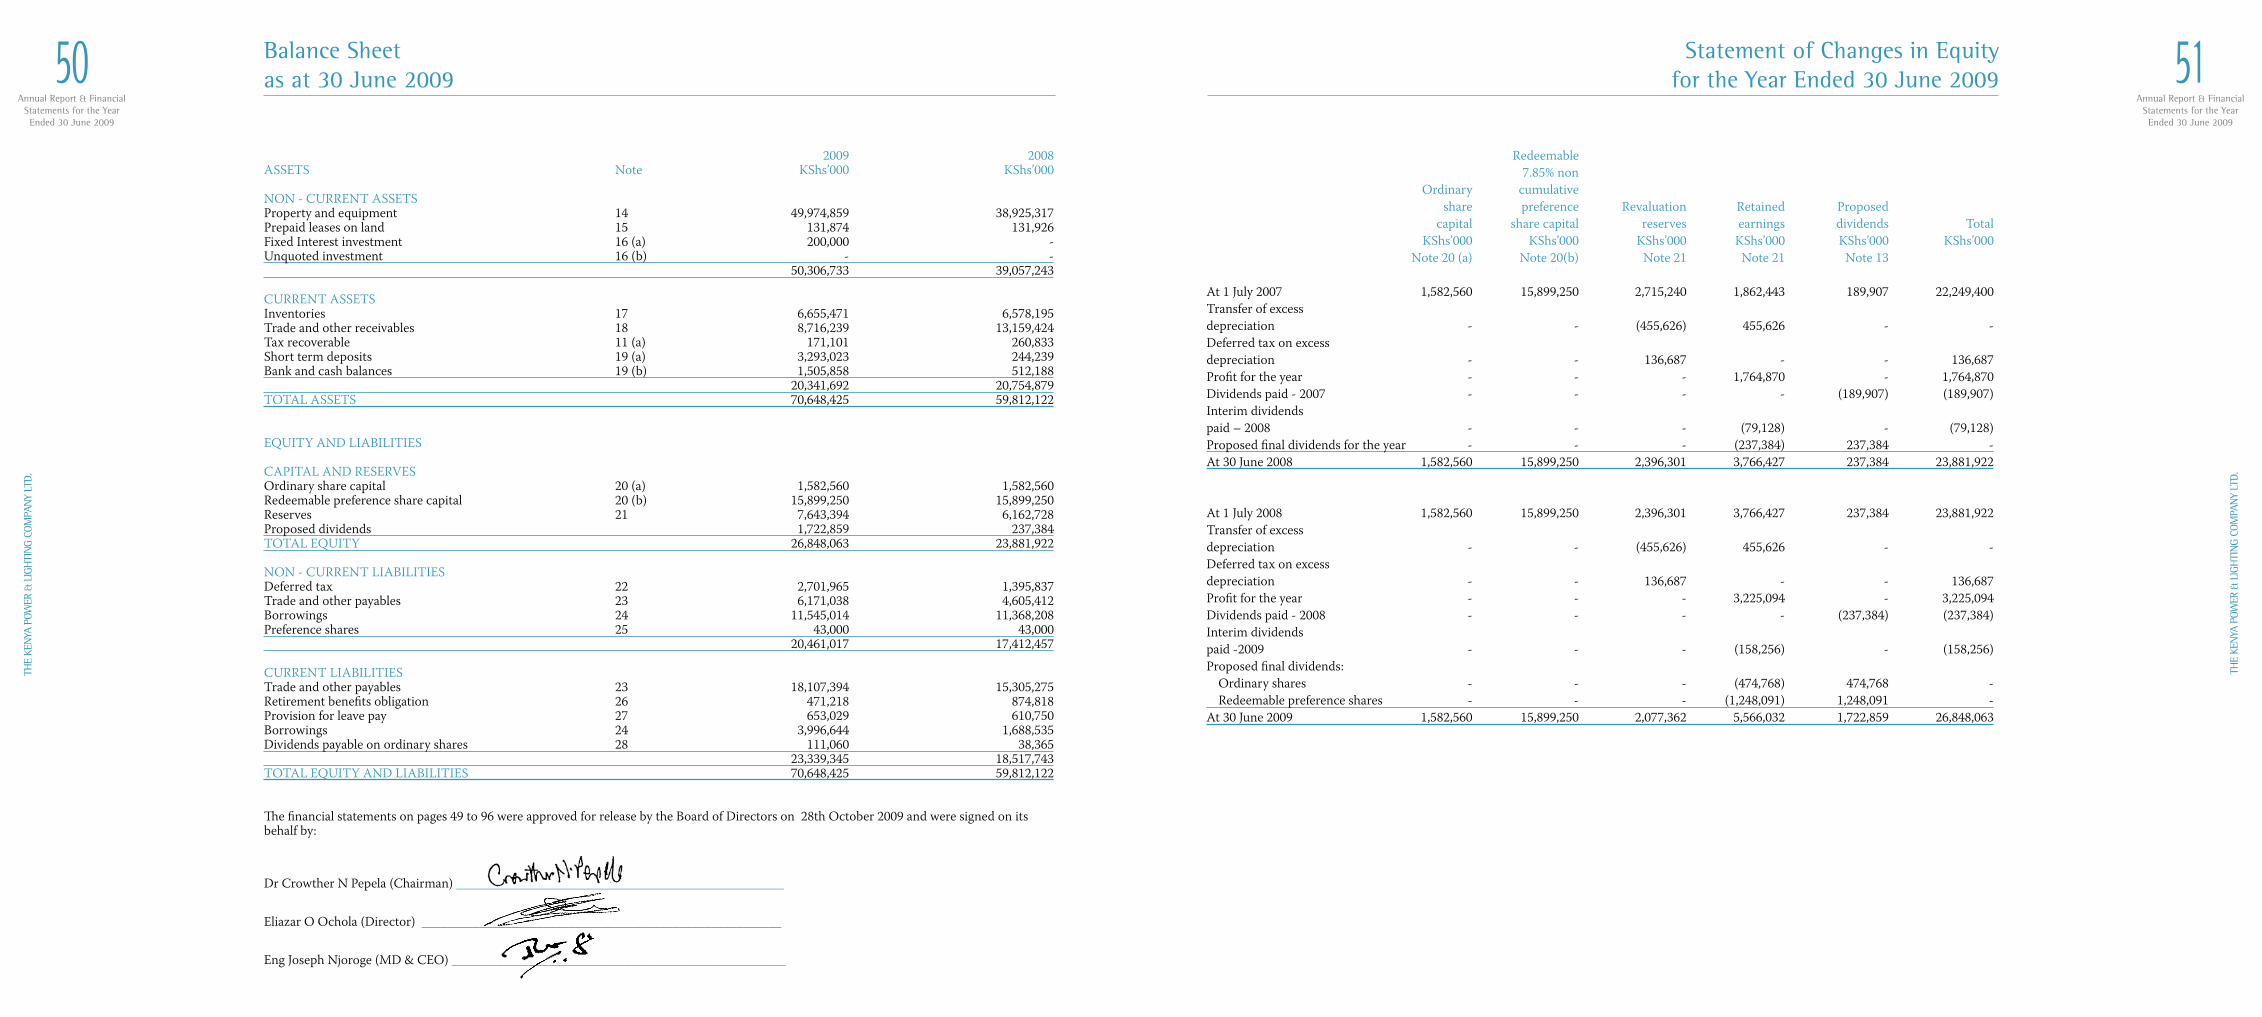
Annual Report & FinancialStatements for the YearEnded 30 June 2009
50TH
E KE
NYA
POW
ER &
LIG
HTI
NG
COM
PAN
Y LT
D.
Annual Report & FinancialStatements for the YearEnded 30 June 2009
51
THE
KEN
YA P
OWER
& L
IGH
TIN
G CO
MPA
NY
LTD.
Redeemable 7.85% non Ordinary cumulative
share preference Revaluation Retained Proposed capital share capital reserves earnings dividends Total KShs’000 KShs’000 KShs’000 KShs’000 KShs’000 KShs’000
Note 20 (a) Note 20(b) Note 21 Note 21 Note 13
At 1 July 2007 1,582,560 15,899,250 2,715,240 1,862,443 189,907 22,249,400Transfer of excess depreciation - - (455,626) 455,626 - -Deferred tax on excess depreciation - - 136,687 - - 136,687Profit for the year - - - 1,764,870 - 1,764,870Dividends paid - 2007 - - - - (189,907) (189,907)Interim dividendspaid – 2008 - - - (79,128) - (79,128)Proposed final dividends for the year - - - (237,384) 237,384 -At 30 June 2008 1,582,560 15,899,250 2,396,301 3,766,427 237,384 23,881,922 At 1 July 2008 1,582,560 15,899,250 2,396,301 3,766,427 237,384 23,881,922Transfer of excess depreciation - - (455,626) 455,626 - -Deferred tax on excessdepreciation - - 136,687 - - 136,687Profit for the year - - - 3,225,094 - 3,225,094Dividends paid - 2008 - - - - (237,384) (237,384)Interim dividends paid -2009 - - - (158,256) - (158,256)Proposed final dividends: Ordinary shares - - - (474,768) 474,768 - Redeemable preference shares - - - (1,248,091) 1,248,091 -At 30 June 2009 1,582,560 15,899,250 2,077,362 5,566,032 1,722,859 26,848,063
Statement of Changes in Equityfor the Year Ended 30 June 2009
2009 2008ASSETS Note KShs’000 KShs’000
NON - CURRENT ASSETSProperty and equipment 14 49,974,859 38,925,317Prepaid leases on land 15 131,874 131,926Fixed Interest investment 16 (a) 200,000 -Unquoted investment 16 (b) - - 50,306,733 39,057,243
CURRENT ASSETSInventories 17 6,655,471 6,578,195Trade and other receivables 18 8,716,239 13,159,424Tax recoverable 11 (a) 171,101 260,833Short term deposits 19 (a) 3,293,023 244,239Bank and cash balances 19 (b) 1,505,858 512,188 20,341,692 20,754,879TOTAL ASSETS 70,648,425 59,812,122
EQUITY AND LIABILITIES
CAPITAL AND RESERVESOrdinary share capital 20 (a) 1,582,560 1,582,560Redeemable preference share capital 20 (b) 15,899,250 15,899,250Reserves 21 7,643,394 6,162,728Proposed dividends 1,722,859 237,384TOTAL EQUITY 26,848,063 23,881,922
NON - CURRENT LIABILITIES Deferred tax 22 2,701,965 1,395,837Trade and other payables 23 6,171,038 4,605,412Borrowings 24 11,545,014 11,368,208Preference shares 25 43,000 43,000 20,461,017 17,412,457
CURRENT LIABILITIESTrade and other payables 23 18,107,394 15,305,275Retirement benefits obligation 26 471,218 874,818Provision for leave pay 27 653,029 610,750Borrowings 24 3,996,644 1,688,535Dividends payable on ordinary shares 28 111,060 38,365 23,339,345 18,517,743TOTAL EQUITY AND LIABILITIES 70,648,425 59,812,122
The financial statements on pages 49 to 96 were approved for release by the Board of Directors on 28th October 2009 and were signed on its behalf by:
Dr Crowther N Pepela (Chairman) ___________________________________________________
Eliazar O Ochola (Director) ________________________________________________________
Eng Joseph Njoroge (MD & CEO) ____________________________________________________
Balance Sheet as at 30 June 2009
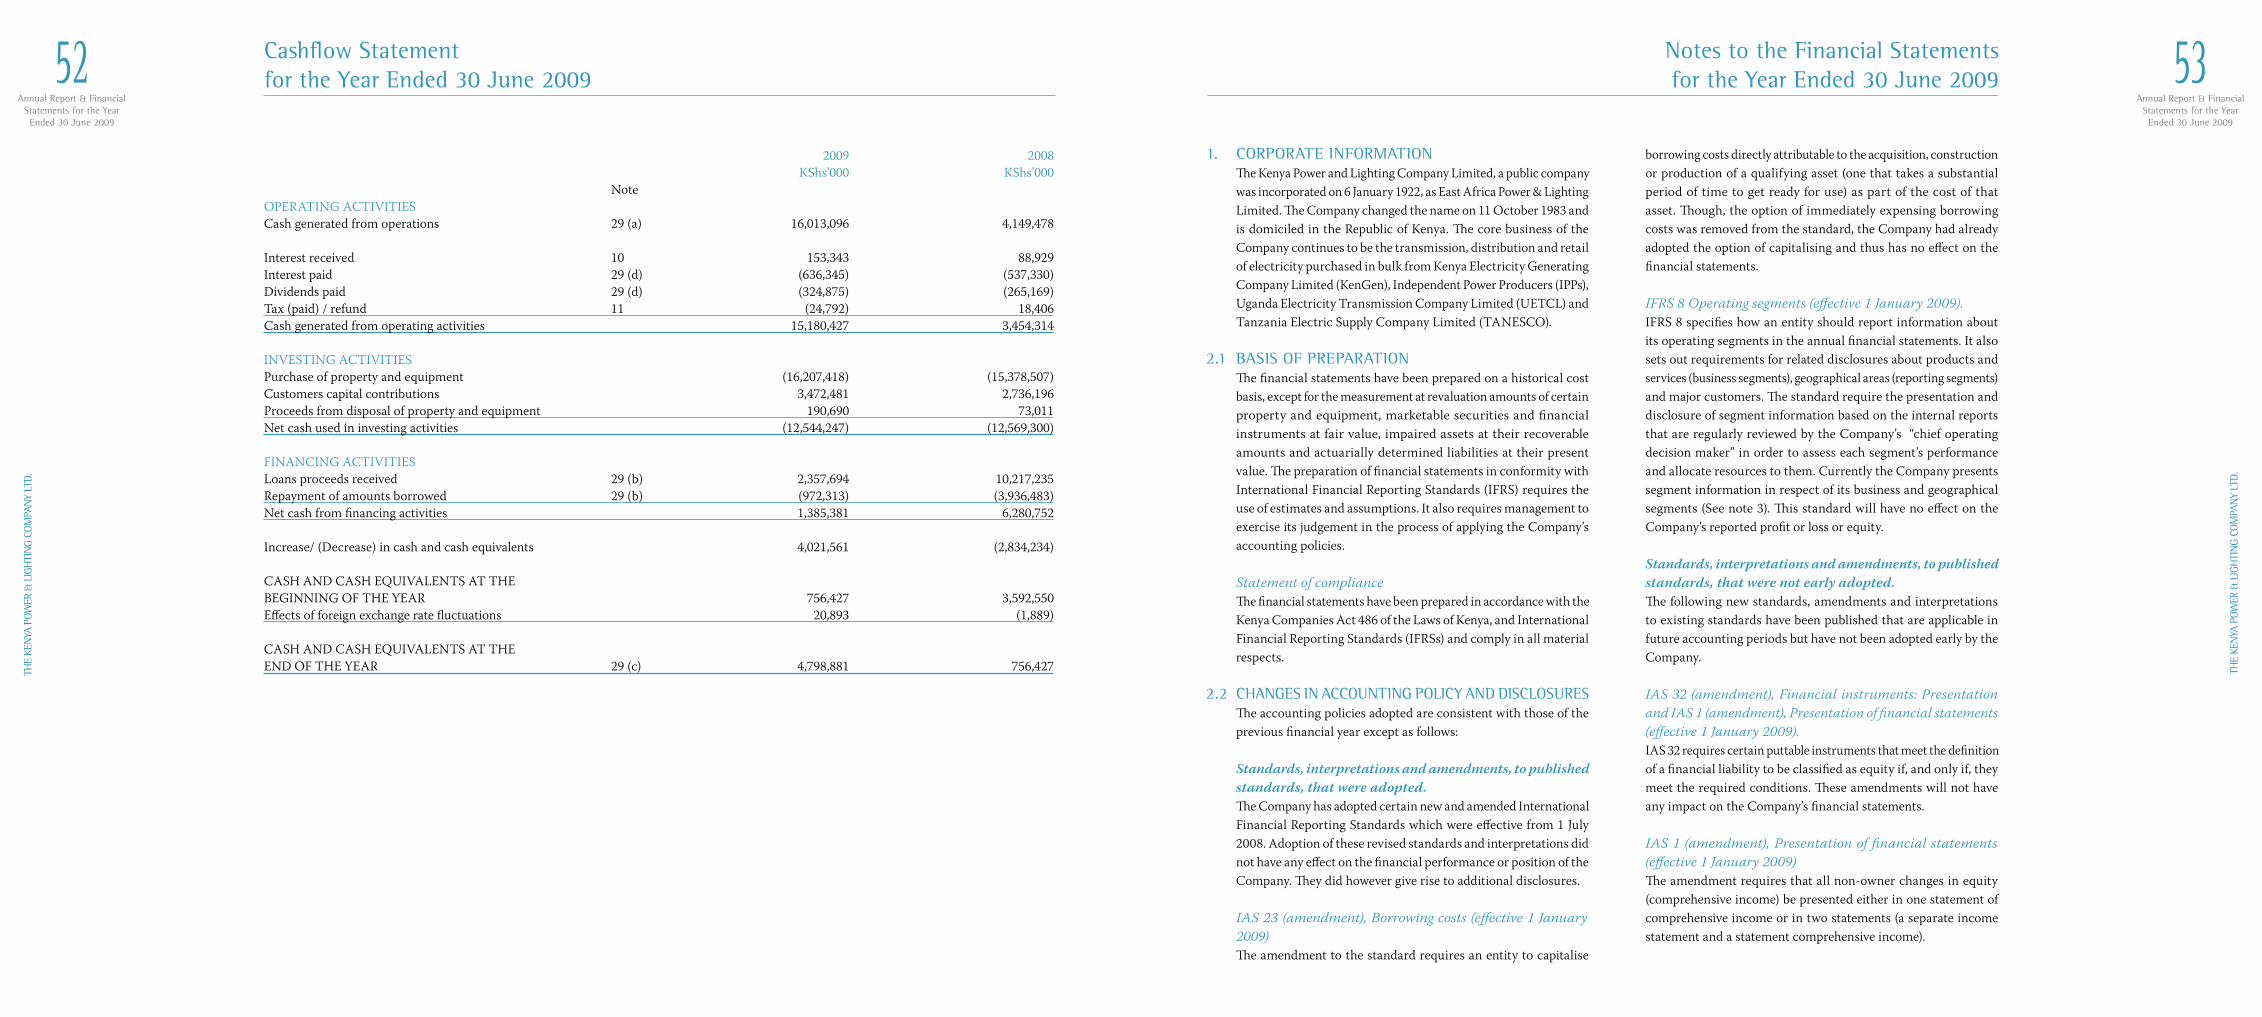
Annual Report & FinancialStatements for the YearEnded 30 June 2009
52TH
E KE
NYA
POW
ER &
LIG
HTI
NG
COM
PAN
Y LT
D.
Annual Report & FinancialStatements for the YearEnded 30 June 2009
53
THE
KEN
YA P
OWER
& L
IGH
TIN
G CO
MPA
NY
LTD.
1. CORPORATE INFORMATION The Kenya Power and Lighting Company Limited, a public company
was incorporated on 6 January 1922, as East Africa Power & Lighting Limited. The Company changed the name on 11 October 1983 and is domiciled in the Republic of Kenya. The core business of the Company continues to be the transmission, distribution and retail of electricity purchased in bulk from Kenya Electricity Generating Company Limited (KenGen), Independent Power Producers (IPPs), Uganda Electricity Transmission Company Limited (UETCL) and Tanzania Electric Supply Company Limited (TANESCO).
2.1 BASIS OF PREPARATION The financial statements have been prepared on a historical cost
basis, except for the measurement at revaluation amounts of certain property and equipment, marketable securities and financial instruments at fair value, impaired assets at their recoverable amounts and actuarially determined liabilities at their present value. The preparation of financial statements in conformity with International Financial Reporting Standards (IFRS) requires the use of estimates and assumptions. It also requires management to exercise its judgement in the process of applying the Company’s accounting policies.
Statement of compliance The financial statements have been prepared in accordance with the
Kenya Companies Act 486 of the Laws of Kenya, and International Financial Reporting Standards (IFRSs) and comply in all material respects.
2.2 CHANGES IN ACCOUNTING POLICY AND DISCLOSURES The accounting policies adopted are consistent with those of the
previous financial year except as follows: Standards, interpretations and amendments, to published
standards, that were adopted. The Company has adopted certain new and amended International
Financial Reporting Standards which were effective from 1 July 2008. Adoption of these revised standards and interpretations did not have any effect on the financial performance or position of the Company. They did however give rise to additional disclosures.
IAS 23 (amendment), Borrowing costs (effective 1 January
2009) The amendment to the standard requires an entity to capitalise
borrowing costs directly attributable to the acquisition, construction or production of a qualifying asset (one that takes a substantial period of time to get ready for use) as part of the cost of that asset. Though, the option of immediately expensing borrowing costs was removed from the standard, the Company had already adopted the option of capitalising and thus has no effect on the financial statements.
IFRS 8 Operating segments (effective 1 January 2009). IFRS 8 specifies how an entity should report information about
its operating segments in the annual financial statements. It also sets out requirements for related disclosures about products and services (business segments), geographical areas (reporting segments) and major customers. The standard require the presentation and disclosure of segment information based on the internal reports that are regularly reviewed by the Company’s “chief operating decision maker” in order to assess each segment’s performance and allocate resources to them. Currently the Company presents segment information in respect of its business and geographical segments (See note 3). This standard will have no effect on the Company’s reported profit or loss or equity.
Standards, interpretations and amendments, to published
standards, that were not early adopted. The following new standards, amendments and interpretations
to existing standards have been published that are applicable in future accounting periods but have not been adopted early by the Company.
IAS 32 (amendment), Financial instruments: Presentation and IAS 1 (amendment), Presentation of financial statements (effective 1 January 2009).
IAS 32 requires certain puttable instruments that meet the definition of a financial liability to be classified as equity if, and only if, they meet the required conditions. These amendments will not have any impact on the Company’s financial statements.
IAS 1 (amendment), Presentation of financial statements
(effective 1 January 2009) The amendment requires that all non-owner changes in equity
(comprehensive income) be presented either in one statement of comprehensive income or in two statements (a separate income statement and a statement comprehensive income).
Notes to the Financial Statementsfor the Year Ended 30 June 2009
2009 2008 KShs’000 KShs’000 NoteOPERATING ACTIVITIESCash generated from operations 29 (a) 16,013,096 4,149,478
Interest received 10 153,343 88,929Interest paid 29 (d) (636,345) (537,330)Dividends paid 29 (d) (324,875) (265,169)Tax (paid) / refund 11 (24,792) 18,406Cash generated from operating activities 15,180,427 3,454,314 INVESTING ACTIVITIESPurchase of property and equipment (16,207,418) (15,378,507)Customers capital contributions 3,472,481 2,736,196Proceeds from disposal of property and equipment 190,690 73,011Net cash used in investing activities (12,544,247) (12,569,300) FINANCING ACTIVITIESLoans proceeds received 29 (b) 2,357,694 10,217,235Repayment of amounts borrowed 29 (b) (972,313) (3,936,483)Net cash from financing activities 1,385,381 6,280,752
Increase/ (Decrease) in cash and cash equivalents 4,021,561 (2,834,234)
CASH AND CASH EQUIVALENTS AT THE BEGINNING OF THE YEAR 756,427 3,592,550Effects of foreign exchange rate fluctuations 20,893 (1,889)
CASH AND CASH EQUIVALENTS AT THE END OF THE YEAR 29 (c) 4,798,881 756,427
Cashflow Statement for the Year Ended 30 June 2009
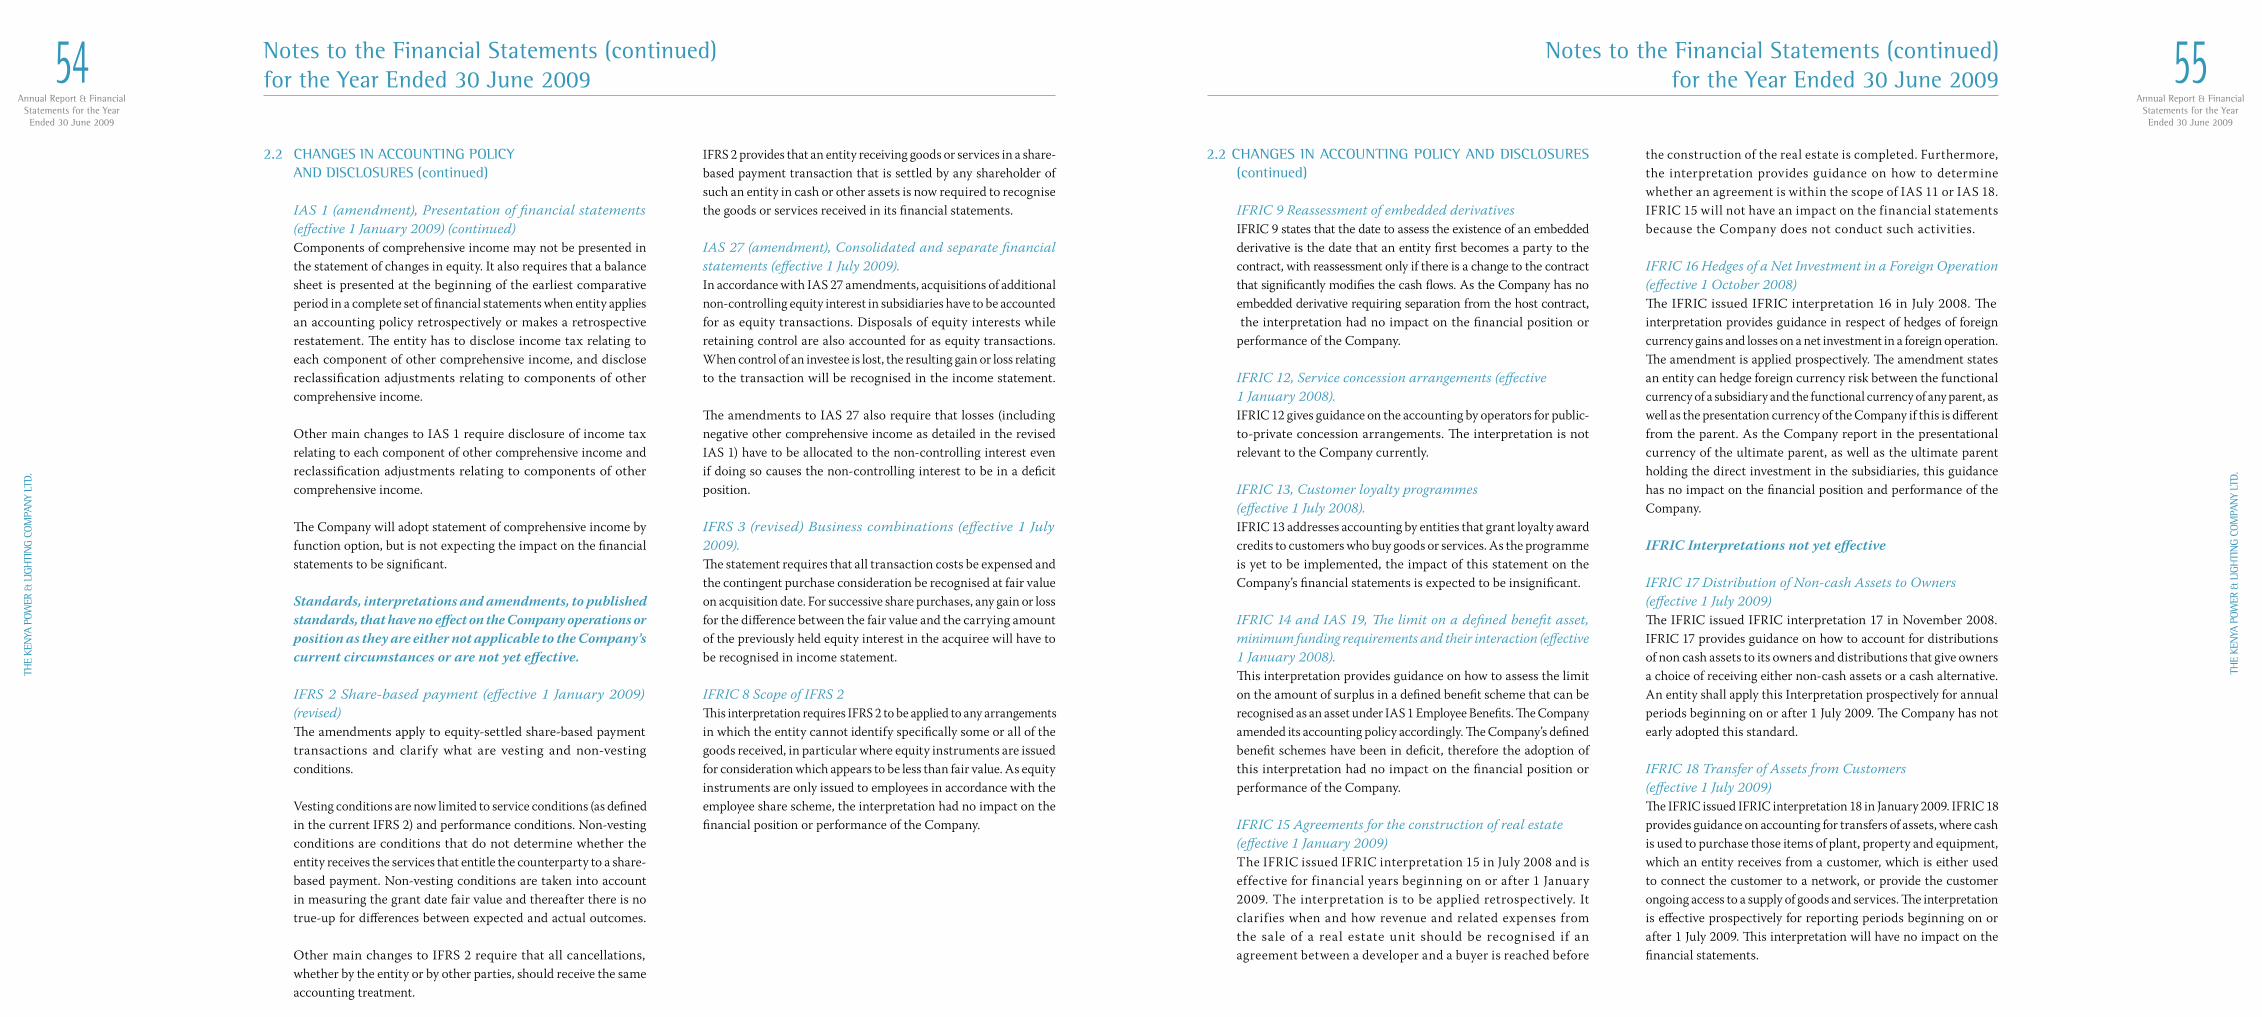
Annual Report & FinancialStatements for the YearEnded 30 June 2009
54TH
E KE
NYA
POW
ER &
LIG
HTI
NG
COM
PAN
Y LT
D.
Annual Report & FinancialStatements for the YearEnded 30 June 2009
55
THE
KEN
YA P
OWER
& L
IGH
TIN
G CO
MPA
NY
LTD.
2.2 CHANGES IN ACCOUNTING POLICY AND DISCLOSURES (continued)
IFRIC 9 Reassessment of embedded derivatives IFRIC 9 states that the date to assess the existence of an embedded
derivative is the date that an entity first becomes a party to the contract, with reassessment only if there is a change to the contract that significantly modifies the cash flows. As the Company has no embedded derivative requiring separation from the host contract, the interpretation had no impact on the financial position or performance of the Company.
IFRIC 12, Service concession arrangements (effective 1 January 2008). IFRIC 12 gives guidance on the accounting by operators for public-
to-private concession arrangements. The interpretation is not relevant to the Company currently.
IFRIC 13, Customer loyalty programmes (effective 1 July 2008). IFRIC 13 addresses accounting by entities that grant loyalty award
credits to customers who buy goods or services. As the programme is yet to be implemented, the impact of this statement on the Company’s financial statements is expected to be insignificant.
IFRIC 14 and IAS 19, The limit on a defined benefit asset, minimum funding requirements and their interaction (effective 1 January 2008).
This interpretation provides guidance on how to assess the limit on the amount of surplus in a defined benefit scheme that can be recognised as an asset under IAS 1 Employee Benefits. The Company amended its accounting policy accordingly. The Company’s defined benefit schemes have been in deficit, therefore the adoption of this interpretation had no impact on the financial position or performance of the Company.
IFRIC 15 Agreements for the construction of real estate (effective 1 January 2009) The IFRIC issued IFRIC interpretation 15 in July 2008 and is
effective for financial years beginning on or after 1 January 2009. The interpretation is to be applied retrospectively. It clarifies when and how revenue and related expenses from the sale of a real estate unit should be recognised if an agreement between a developer and a buyer is reached before
the construction of the real estate is completed. Furthermore, the interpretation provides guidance on how to determine whether an agreement is within the scope of IAS 11 or IAS 18. IFRIC 15 will not have an impact on the financial statements because the Company does not conduct such activities.
IFRIC 16 Hedges of a Net Investment in a Foreign Operation
(effective 1 October 2008) The IFRIC issued IFRIC interpretation 16 in July 2008. The
interpretation provides guidance in respect of hedges of foreign currency gains and losses on a net investment in a foreign operation. The amendment is applied prospectively. The amendment states an entity can hedge foreign currency risk between the functional currency of a subsidiary and the functional currency of any parent, as well as the presentation currency of the Company if this is different from the parent. As the Company report in the presentational currency of the ultimate parent, as well as the ultimate parent holding the direct investment in the subsidiaries, this guidance has no impact on the financial position and performance of the Company.
IFRIC Interpretations not yet effective IFRIC 17 Distribution of Non-cash Assets to Owners (effective 1 July 2009) The IFRIC issued IFRIC interpretation 17 in November 2008.
IFRIC 17 provides guidance on how to account for distributions of non cash assets to its owners and distributions that give owners a choice of receiving either non-cash assets or a cash alternative. An entity shall apply this Interpretation prospectively for annual periods beginning on or after 1 July 2009. The Company has not early adopted this standard.
IFRIC 18 Transfer of Assets from Customers (effective 1 July 2009) The IFRIC issued IFRIC interpretation 18 in January 2009. IFRIC 18
provides guidance on accounting for transfers of assets, where cash is used to purchase those items of plant, property and equipment, which an entity receives from a customer, which is either used to connect the customer to a network, or provide the customer ongoing access to a supply of goods and services. The interpretation is effective prospectively for reporting periods beginning on or after 1 July 2009. This interpretation will have no impact on the financial statements.
Notes to the Financial Statements (continued)for the Year Ended 30 June 2009
2.2 CHANGES IN ACCOUNTING POLICY AND DISCLOSURES (continued)
IAS 1 (amendment), Presentation of financial statements (effective 1 January 2009) (continued)
Components of comprehensive income may not be presented in the statement of changes in equity. It also requires that a balance sheet is presented at the beginning of the earliest comparative period in a complete set of financial statements when entity applies an accounting policy retrospectively or makes a retrospective restatement. The entity has to disclose income tax relating to each component of other comprehensive income, and disclose reclassification adjustments relating to components of other comprehensive income.
Other main changes to IAS 1 require disclosure of income tax relating to each component of other comprehensive income and reclassification adjustments relating to components of other comprehensive income.
The Company will adopt statement of comprehensive income by function option, but is not expecting the impact on the financial statements to be significant.
Standards, interpretations and amendments, to published standards, that have no effect on the Company operations or position as they are either not applicable to the Company’s current circumstances or are not yet effective.
IFRS 2 Share-based payment (effective 1 January 2009) (revised)
The amendments apply to equity-settled share-based payment transactions and clarify what are vesting and non-vesting conditions.
Vesting conditions are now limited to service conditions (as defined
in the current IFRS 2) and performance conditions. Non-vesting conditions are conditions that do not determine whether the entity receives the services that entitle the counterparty to a share-based payment. Non-vesting conditions are taken into account in measuring the grant date fair value and thereafter there is no true-up for differences between expected and actual outcomes.
Other main changes to IFRS 2 require that all cancellations, whether by the entity or by other parties, should receive the same accounting treatment.
IFRS 2 provides that an entity receiving goods or services in a share-based payment transaction that is settled by any shareholder of such an entity in cash or other assets is now required to recognise the goods or services received in its financial statements.
IAS 27 (amendment), Consolidated and separate financial statements (effective 1 July 2009).
In accordance with IAS 27 amendments, acquisitions of additional non-controlling equity interest in subsidiaries have to be accounted for as equity transactions. Disposals of equity interests while retaining control are also accounted for as equity transactions. When control of an investee is lost, the resulting gain or loss relating to the transaction will be recognised in the income statement.
The amendments to IAS 27 also require that losses (including negative other comprehensive income as detailed in the revised IAS 1) have to be allocated to the non-controlling interest even if doing so causes the non-controlling interest to be in a deficit position.
IFRS 3 (revised) Business combinations (effective 1 July 2009).
The statement requires that all transaction costs be expensed and the contingent purchase consideration be recognised at fair value on acquisition date. For successive share purchases, any gain or loss for the difference between the fair value and the carrying amount of the previously held equity interest in the acquiree will have to be recognised in income statement.
IFRIC 8 Scope of IFRS 2 This interpretation requires IFRS 2 to be applied to any arrangements
in which the entity cannot identify specifically some or all of the goods received, in particular where equity instruments are issued for consideration which appears to be less than fair value. As equity instruments are only issued to employees in accordance with the employee share scheme, the interpretation had no impact on the financial position or performance of the Company.
Notes to the Financial Statements (continued)for the Year Ended 30 June 2009
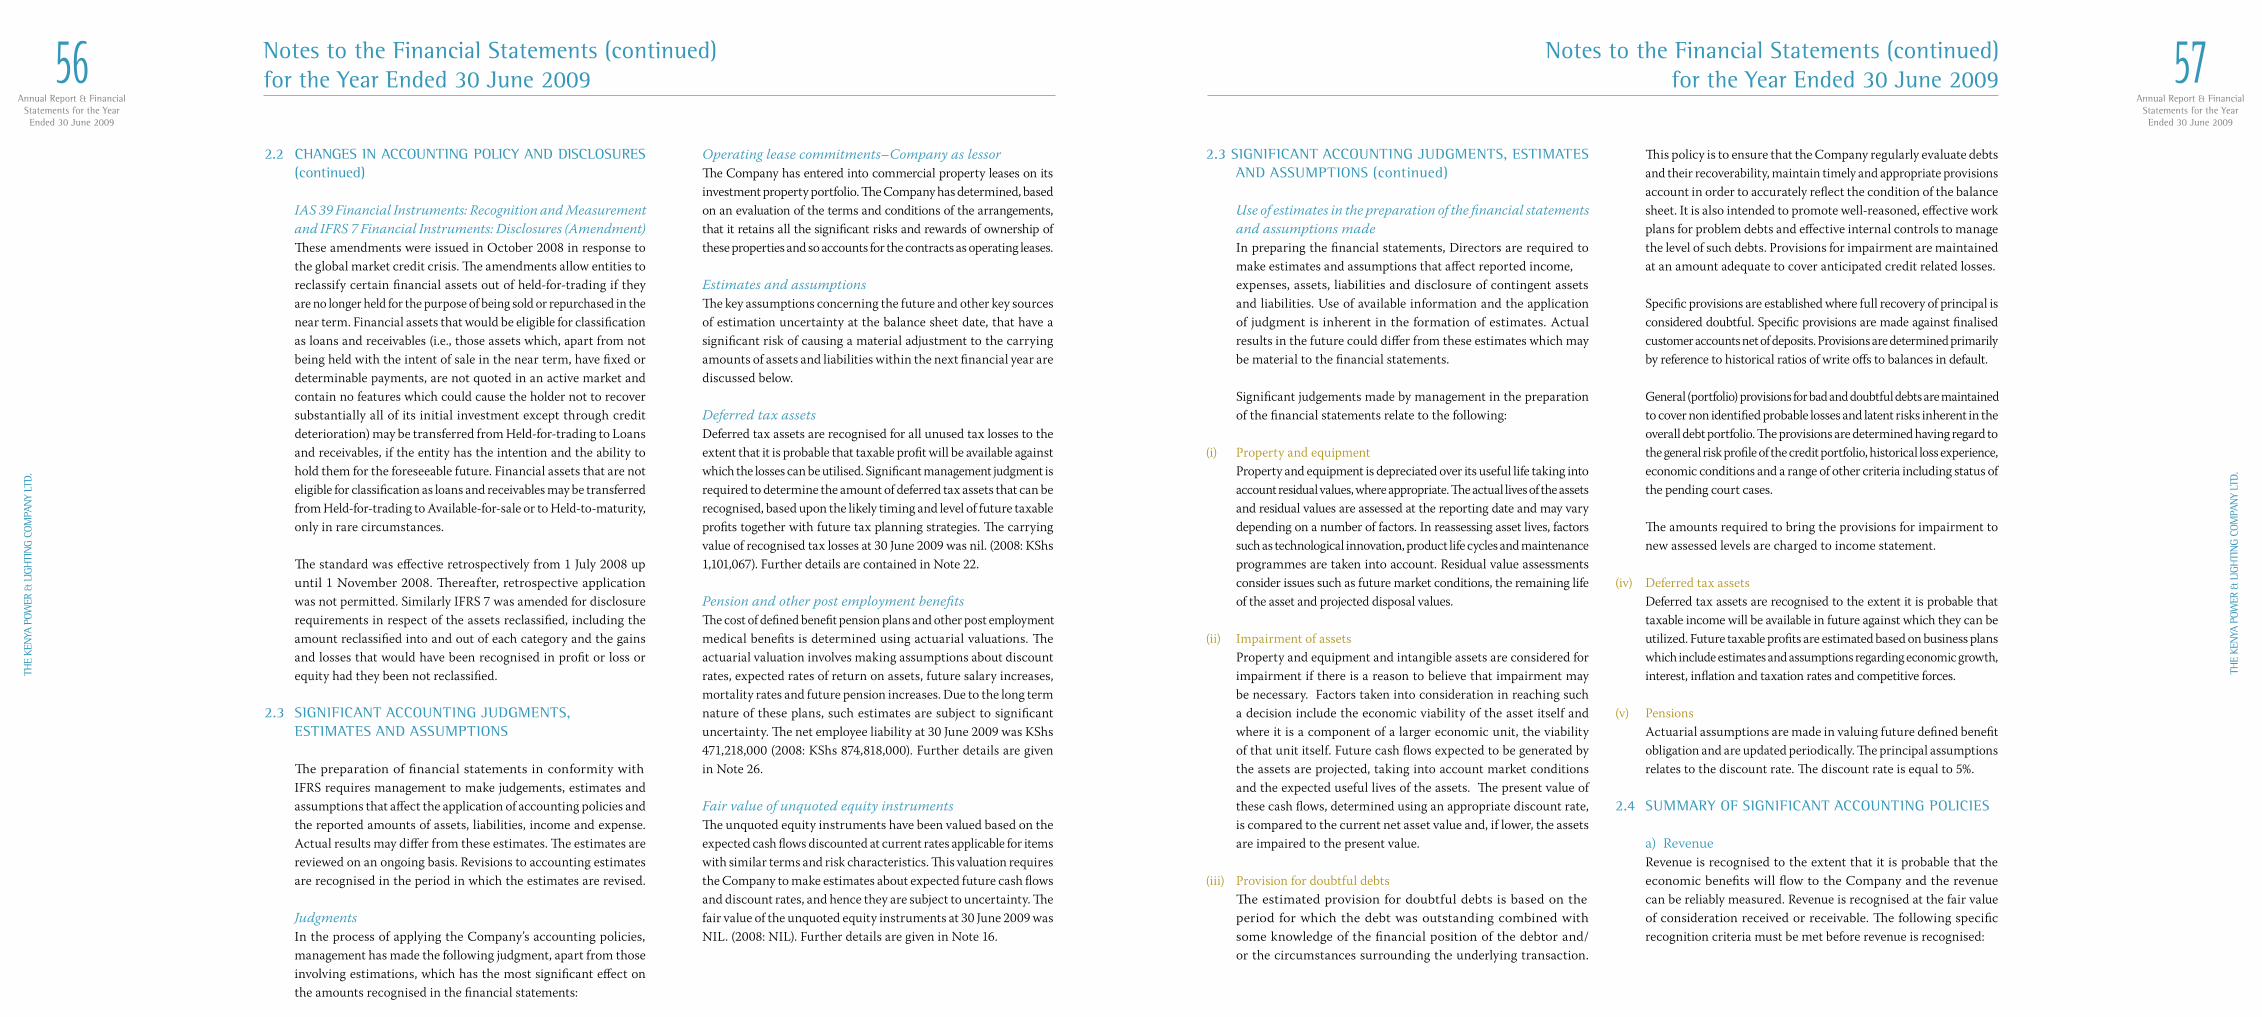
Annual Report & FinancialStatements for the YearEnded 30 June 2009
56TH
E KE
NYA
POW
ER &
LIG
HTI
NG
COM
PAN
Y LT
D.
Annual Report & FinancialStatements for the YearEnded 30 June 2009
57
THE
KEN
YA P
OWER
& L
IGH
TIN
G CO
MPA
NY
LTD.
2.3 SIGNIFICANT ACCOUNTING JUDGMENTS, ESTIMATES AND ASSUMPTIONS (continued)
Use of estimates in the preparation of the financial statements
and assumptions made In preparing the financial statements, Directors are required to
make estimates and assumptions that affect reported income, expenses, assets, liabilities and disclosure of contingent assets
and liabilities. Use of available information and the application of judgment is inherent in the formation of estimates. Actual results in the future could differ from these estimates which may be material to the financial statements.
Significant judgements made by management in the preparation of the financial statements relate to the following:
(i) Property and equipment Property and equipment is depreciated over its useful life taking into
account residual values, where appropriate. The actual lives of the assets and residual values are assessed at the reporting date and may vary depending on a number of factors. In reassessing asset lives, factors such as technological innovation, product life cycles and maintenance programmes are taken into account. Residual value assessments consider issues such as future market conditions, the remaining life of the asset and projected disposal values.
(ii) Impairment of assets Property and equipment and intangible assets are considered for
impairment if there is a reason to believe that impairment may be necessary. Factors taken into consideration in reaching such a decision include the economic viability of the asset itself and where it is a component of a larger economic unit, the viability of that unit itself. Future cash flows expected to be generated by the assets are projected, taking into account market conditions and the expected useful lives of the assets. The present value of these cash flows, determined using an appropriate discount rate, is compared to the current net asset value and, if lower, the assets are impaired to the present value.
(iii) Provision for doubtful debts The estimated provision for doubtful debts is based on the
period for which the debt was outstanding combined with some knowledge of the financial position of the debtor and/or the circumstances surrounding the underlying transaction.
This policy is to ensure that the Company regularly evaluate debts and their recoverability, maintain timely and appropriate provisions account in order to accurately reflect the condition of the balance sheet. It is also intended to promote well-reasoned, effective work plans for problem debts and effective internal controls to manage the level of such debts. Provisions for impairment are maintained at an amount adequate to cover anticipated credit related losses.
Specific provisions are established where full recovery of principal is considered doubtful. Specific provisions are made against finalised customer accounts net of deposits. Provisions are determined primarily by reference to historical ratios of write offs to balances in default.
General (portfolio) provisions for bad and doubtful debts are maintained to cover non identified probable losses and latent risks inherent in the overall debt portfolio. The provisions are determined having regard to the general risk profile of the credit portfolio, historical loss experience, economic conditions and a range of other criteria including status of the pending court cases.
The amounts required to bring the provisions for impairment to new assessed levels are charged to income statement.
(iv) Deferred tax assets Deferred tax assets are recognised to the extent it is probable that
taxable income will be available in future against which they can be utilized. Future taxable profits are estimated based on business plans which include estimates and assumptions regarding economic growth, interest, inflation and taxation rates and competitive forces.
(v) Pensions Actuarial assumptions are made in valuing future defined benefit
obligation and are updated periodically. The principal assumptions relates to the discount rate. The discount rate is equal to 5%.
2.4 SUMMARY OF SIGNIFICANT ACCOUNTING POLICIES
a) Revenue Revenue is recognised to the extent that it is probable that the
economic benefits will flow to the Company and the revenue can be reliably measured. Revenue is recognised at the fair value of consideration received or receivable. The following specific recognition criteria must be met before revenue is recognised:
Notes to the Financial Statements (continued)for the Year Ended 30 June 2009
2.2 CHANGES IN ACCOUNTING POLICY AND DISCLOSURES (continued)
IAS 39 Financial Instruments: Recognition and Measurement and IFRS 7 Financial Instruments: Disclosures (Amendment)
These amendments were issued in October 2008 in response to the global market credit crisis. The amendments allow entities to reclassify certain financial assets out of held-for-trading if they are no longer held for the purpose of being sold or repurchased in the near term. Financial assets that would be eligible for classification as loans and receivables (i.e., those assets which, apart from not being held with the intent of sale in the near term, have fixed or determinable payments, are not quoted in an active market and contain no features which could cause the holder not to recover substantially all of its initial investment except through credit deterioration) may be transferred from Held-for-trading to Loans and receivables, if the entity has the intention and the ability to hold them for the foreseeable future. Financial assets that are not eligible for classification as loans and receivables may be transferred from Held-for-trading to Available-for-sale or to Held-to-maturity, only in rare circumstances.
The standard was effective retrospectively from 1 July 2008 up until 1 November 2008. Thereafter, retrospective application was not permitted. Similarly IFRS 7 was amended for disclosure requirements in respect of the assets reclassified, including the amount reclassified into and out of each category and the gains and losses that would have been recognised in profit or loss or equity had they been not reclassified.
2.3 SIGNIFICANT ACCOUNTING JUDGMENTS, ESTIMATES AND ASSUMPTIONS
The preparation of financial statements in conformity with
IFRS requires management to make judgements, estimates and assumptions that affect the application of accounting policies and the reported amounts of assets, liabilities, income and expense. Actual results may differ from these estimates. The estimates are reviewed on an ongoing basis. Revisions to accounting estimates are recognised in the period in which the estimates are revised.
Judgments In the process of applying the Company’s accounting policies,
management has made the following judgment, apart from those involving estimations, which has the most significant effect on the amounts recognised in the financial statements:
Operating lease commitments–Company as lessor The Company has entered into commercial property leases on its
investment property portfolio. The Company has determined, based on an evaluation of the terms and conditions of the arrangements, that it retains all the significant risks and rewards of ownership of these properties and so accounts for the contracts as operating leases.
Estimates and assumptions The key assumptions concerning the future and other key sources
of estimation uncertainty at the balance sheet date, that have a significant risk of causing a material adjustment to the carrying amounts of assets and liabilities within the next financial year are discussed below.
Deferred tax assets Deferred tax assets are recognised for all unused tax losses to the
extent that it is probable that taxable profit will be available against which the losses can be utilised. Significant management judgment is required to determine the amount of deferred tax assets that can be recognised, based upon the likely timing and level of future taxable profits together with future tax planning strategies. The carrying value of recognised tax losses at 30 June 2009 was nil. (2008: KShs 1,101,067). Further details are contained in Note 22.
Pension and other post employment benefits The cost of defined benefit pension plans and other post employment
medical benefits is determined using actuarial valuations. The actuarial valuation involves making assumptions about discount rates, expected rates of return on assets, future salary increases, mortality rates and future pension increases. Due to the long term nature of these plans, such estimates are subject to significant uncertainty. The net employee liability at 30 June 2009 was KShs 471,218,000 (2008: KShs 874,818,000). Further details are given in Note 26.
Fair value of unquoted equity instruments The unquoted equity instruments have been valued based on the
expected cash flows discounted at current rates applicable for items with similar terms and risk characteristics. This valuation requires the Company to make estimates about expected future cash flows and discount rates, and hence they are subject to uncertainty. The fair value of the unquoted equity instruments at 30 June 2009 was NIL. (2008: NIL). Further details are given in Note 16.
Notes to the Financial Statements (continued)for the Year Ended 30 June 2009
Annual Report & FinancialStatements for the YearEnded 30 June 2009
58TH
E KE
NYA
POW
ER &
LIG
HTI
NG
COM
PAN
Y LT
D.
Annual Report & FinancialStatements for the YearEnded 30 June 2009
59
THE
KEN
YA P
OWER
& L
IGH
TIN
G CO
MPA
NY
LTD.
2.4 SUMMARY OF SIGNIFICANT ACCOUNTING POLICIES (continued)
(c) Tangible & Intangible Assets (continued)
Buildings The greater of 2% and the unexpired period of the leaseTransmission and distribution lines 2.5 - 20%Machinery 2.85 – 6.66%Motor vehicles 25%Furniture, equipment and fittings 6.66 - 20%Computers and photocopiers 30%
An item of property, plant and equipment is derecognised upon
disposal or when no future economic benefits are expected from its use or disposal. Any gain or loss arising on derecognition of the asset (calculated as the difference between the net disposal proceeds and the carrying amount of the asset) is included in the income statement in the year the asset is derecognised.
The asset’s residual values, useful lives and methods of depreciation are reviewed, and adjusted if appropriate, during and at each financial year end.
(ii) Capital work-in-progress Capital work-in-progress is included under property and equipment
and comprises of costs incurred on ongoing capital works relating to both customer and internal works. These costs include material, transport and labour cost incurred. Customer capital contributions towards the cost of projects are however offset against costs incurred in arriving at the costs of capital work-in-progress.
(iii) Intangible assets excluding goodwill Intangible assets acquired separately are measured on initial recognition
at cost. The cost of intangible assets acquired in a business combination is their fair value as at the date of acquisition. Following initial recognition, intangible assets are carried at cost less any accumulated amortisation and any accumulated impairment losses. Internally generated intangible assets, excluding capitalised development costs, are not capitalised and expenditure is reflected in the income statement in the year in which the expenditure is incurred. The useful lives of intangible assets are assessed to be either finite or indefinite.
Intangible assets with finite lives are amortised over the useful
economic life and assessed for impairment whenever there is an indication that the intangible asset may be impaired. The amortisation period and the amortisation method for an intangible asset with
a finite useful life are reviewed at least at each financial year end.Changes in the expected useful life or the expected pattern of consumption of future economic benefits embodied in the asset is accounted for by changing the amortisation period or method, as appropriate, and are treated as changes in accounting estimates. The amortisation expense on intangible assets with finite lives is recognised in the income statement in the expense category consistent with the intangible asset.
Intangible assets with indefinite useful lives are tested for impairment annually either individually or at the cash generating unit level. Such intangibles are not amortised. The useful life of an intangible asset with an indefinite life is reviewed annually to determine whether indefinite life assessment continues to be supportable. If not, the change in the useful life assessment from indefinite to finite is made on a prospective basis.
Gains or losses arising from derecognition of an intangible asset are measured as the difference between the net disposal proceeds and the carrying amount of the asset and are recognised in the income statement when the asset is derecognised.
(d) Taxation Current income tax Current income tax assets and liabilities for the current and prior
periods are measured at the amount expected to be recovered from or paid to the taxation authorities. The tax rates and tax laws used to compute the amount are those that are enacted or substantively enacted by the balance sheet date.
Current income tax relating to items recognised directly in equity is recognised in equity and not in the income statement.
Deferred income tax Deferred income tax is provided using the liability method on
temporary differences at the balance sheet date between the tax bases of assets and liabilities and their carrying amounts for financial reporting purposes.
Deferred income tax liabilities are recognised for all taxable temporary differences, except:
• where the deferred income tax liability arises from the initial recognition of goodwill or of an asset or liability in a transaction that is not a business combination and, at the time of the transaction, affects neither the accounting profit nor taxable profit or loss; and
Notes to the Financial Statements (continued)for the Year Ended 30 June 2009
2.4 SUMMARY OF SIGNIFICANT ACCOUNTING POLICIES (continued)
a) Revenue (continued) (i) Electricity sales Income is recognised upon billing of electricity supplied and
represents amounts billed excluding Value Added Tax and other Government levies.
(ii) Fuel cost recoveries Fuel costs are recognized at the actual amounts charged to the Company by the suppliers of power. Correspondingly, fuel costs
recoveries are recognized as the actual amounts passed to the customers to recover the fuel cost.
(iii) Foreign exchange recoveries Foreign exchange payments, arising from exchange rate differences
not factored in the retail tariffs, are recognized and charged to the consumers of power to recover the fluctuations in the foreign exchange rates.
(iv) Finance income Finance income comprises interest receivable from bank deposits
and investment in securities. Finance income is recognised as it accrues in the income statement, using the effective interest rate method.
(v) Dividends Dividend income is recognised when the shareholders’ right to
receive the payment is established.
(vi) Rental income Rental income is accounted for on a straight-line basis over the
lease term.
(b) Inventories Inventories are stated at the lower of cost and net realisable value.
The cost of inventories comprises purchase price, import duties, transport and handling charges and is determined on moving average price.
(c) Tangible & Intangible Assets (i) Property and equipment Transmission assets in existence as at 30 June 2002 are stated at
revalued amount, while subsequent additions are carried at cost
less accumulated depreciation and amortisation impairment losses. Other property and equipment is stated at cost less accumulated depreciation and accumulated impairment losses. Such cost includes the cost of replacing part of the property and equipment when that cost is incurred, if the recognition criteria are met. Likewise, when a major inspection is performed, its cost is recognised in the carrying amount of the property and equipment as a replacement if the recognition criteria are satisfied. All other repair and maintenance costs are recognised in the income statement as incurred.
Revaluations are performed frequently enough, but limited to a period of not more than five years, to ensure that the fair value of a revalued asset does not differ materially from its carrying amount.
Any revaluation surplus is credited to the assets revaluation reserve
included in the equity section of the balance sheet, except to the extent that it reverses a revaluation decrease of the same asset previously recognised in the income statement, in which case the increase is recognised in the income statement. A revaluation deficit is recognised in the income statement, except to the extent that it offsets an existing surplus on the same asset recognised in the asset revaluation reserve.
An annual transfer from the asset revaluation reserve to retained earnings is made for the difference between depreciation based on the revalued carrying amount of the assets and depreciation based on the assets original cost. Additionally, accumulated depreciation as at the revaluation date is eliminated against the gross carrying amount of the asset and the net amount is restated to the revalued amount of the asset. Upon disposal, any revaluation reserve relating to the particular asset being sold is transferred to retained earnings.
Additions to power distribution lines during the year are capitalised net of customers’ contributions i.e. nil basis of recognition of customer contributions as part of distribution lines. Due to the system reinforcement being carried out on the distribution lines and upgrading of associated substations under the Energy Sector Recovery Project, there was no need for a revaluation as the impaired lines and substations will be reinforced, replaced or upgraded.
No depreciation is provided on freehold land. Depreciation on other assets is calculated to write down their cost or valuation to their residual values, on a straight-line basis, over their expected useful lives. The depreciation rates used are as follows:
Notes to the Financial Statements (continued)for the Year Ended 30 June 2009
Annual Report & FinancialStatements for the YearEnded 30 June 2009
60TH
E KE
NYA
POW
ER &
LIG
HTI
NG
COM
PAN
Y LT
D.
Annual Report & FinancialStatements for the YearEnded 30 June 2009
61
THE
KEN
YA P
OWER
& L
IGH
TIN
G CO
MPA
NY
LTD.
2.4 SUMMARY OF SIGNIFICANT ACCOUNTING POLICIES (continued)
(f) Foreign currencies The financial statements are presented in Kenya shillings, which is
the Company’s functional and presentation currency. Transactions in foreign currencies are initially recorded at the functional currency rate ruling at the date of the transaction. Monetary assets and liabilities denominated in foreign currencies are retranslated at
the functional currency rate of exchange ruling at the balance sheet date. All differences are taken to the income statement. Non monetary items that are measured in terms of historical cost in a foreign currency are translated using the exchange rates as at the dates of the initial transactions. Non monetary items measured at fair value in a foreign currency are translated using the exchange rates at the date when the fair value is determined.
(g) Financial instruments Financial assets and liabilities are recognised on the Company’s
balance sheet when the Company has become a party to the contractual provisions of the instrument.
A financial asset (or, where applicable a part of a financial asset or part of a Company of similar financial assets) is derecognised when:
• the rights to receive cash flows from the asset have expired; or• the Company has transferred its rights to receive cash flows
from the asset or has assumed an obligation to pay the received cash flows in full without material delay to a third party under a ‘pass-through’ arrangement; and either (a) the Company has transferred substantially all the risks and rewards of the asset, or (b) the Company has neither transferred nor retained substantially all the risks and rewards of the asset, but has transferred control of the asset.
A financial liability is derecognised when the obligation under the liability is discharged or cancelled or expires.
Trade and other receivables Trade and other receivables are recognized at fair values less
allowances for any uncollectible amounts. These are assessed for impairment on a continuing basis.
This policy is to ensure that the Company regularly evaluate debts
and their recoverability, maintain timely and appropriate provisions
account in order to accurately reflect the condition of the balance sheet. It is also intended to promote well-reasoned, effective work plans for problem debts and effective internal controls to manage the level of such debts.
An estimate is made of doubtful receivables based on review of all outstanding amounts at year end. Bad debts are written off after all efforts of recovery have been exhausted.
Borrowings Interest bearing loans and overdrafts are initially recorded at fair
value being the received, net of issue costs associated with the borrowing. After initial recognition, interest bearing loans and borrowings are subsequently measured at amortised cost using the effective interest rate method. Amortised cost is calculated by taking into account any issue cost, and any discount or premium on settlement. Finance charges, including premiums payable on settlement or redemption, are accounted for on an accrual basis and are added to the carrying amount of the instrument to the extent that they are not settled in the period in which they arise. Loan interest accruing during the construction of a project is capitalised as part of the cost of the project.
Trade and other payables Trade and other payables are non interest bearing liabilities and
are carried at amortised cost, which is measured at the fair or contractual value of the consideration to be paid in future in respect of goods and services supplied by the suppliers, whether billed to the company or not, less any payments made to the suppliers.
Investments Investments are recognised on a trade-date basis and are initially
measured at fair value, including transaction costs.
At subsequent reporting dates, debt securities that the Company has expressed intention and ability to hold to maturity (held-to-maturity debt securities) are measured at amortised cost, less any impairment loss recognised to reflect irrecoverable amounts. The annual amortisation of any discount or premium on the acquisition of a held-to-maturity security is aggregated with other investment income receivable over the term of the instrument so that the revenue recognised in each period represents a constant yield on the investment.
Notes to the Financial Statements (continued)for the Year Ended 30 June 2009
2.4 SUMMARY OF SIGNIFICANT ACCOUNTING POLICIES (continued)
(d) Taxation (continued) Deferred income tax (continued)
• in respect of taxable temporary differences associated with investments in subsidiaries, associates and interests in joint ventures, where the timing of the reversal of the temporary differences can be controlled and it is probable that the temporary differences will not reverse in the foreseeable future.
Deferred income tax assets are recognised for all deductible temporary
differences, carry forward of unused tax credits and unused tax losses, to the extent that it is probable that taxable profit will be available against which the deductible temporary differences, and the carry forward of unused tax credits and unused tax losses can be utilised except:
• where the deferred income tax asset relating to the deductible temporary difference arises from the initial recognition of an asset or liability in a transaction that is not a business combination and, at the time of the transaction, affects neither the accounting profit nor taxable profit or loss; and
• in respect of deductible temporary differences associated with investments in subsidiaries, associates and interests in joint ventures, deferred income tax assets are recognised only to the extent that it is probable that the temporary differences will reverse in the foreseeable future and taxable profit will be available against which the temporary differences can be utilised.
The carrying amount of deferred income tax assets is reviewed at each balance sheet date and reduced to the extent that it is no longer probable that sufficient taxable profit will be available to allow all or part of the deferred income tax asset to be utilised. Unrecognised deferred income tax assets are reassessed at each balance sheet date and are recognised to the extent that it has become probable that future taxable profit will allow the deferred tax asset to be recovered.
Deferred income tax assets and liabilities are measured at the tax rates that are expected to apply to the year when the asset is realised or the liability is settled, based on tax rates (and tax laws) that have been enacted or substantively enacted at the balance sheet
date. Deferred income tax relating to items recognised directly in equity is recognised in equity and not in the income statement.
Deferred income tax assets and deferred income tax liabilities are offset, if a legally enforceable right exists to set off current tax assets against current income tax liabilities and the deferred income taxes relate to the same taxable entity and the same taxation authority.
(e) Leases The determination of whether an arrangement is, or contains a
lease is based on the substance of the arrangement at inception date of whether the fulfilment of the arrangement is dependent on the use of a specific asset or assets or the arrangement conveys a right to use the asset.
For arrangements entered into prior to 1 January 2005, the date of inception is deemed to be 1 January 2005 in accordance with the transitional requirements of IFRIC 4.
Company as a lessee
Finance leases, which transfer to the Company substantially all the risks and benefits incidental to ownership of the leased item, are capitalised at the inception of the lease at the fair value of the leased property or, if lower, at the present value of the minimum lease payments. Lease payments are apportioned between the finance charges and reduction of the lease liability so as to achieve a constant rate of interest on the remaining balance of the liability. Finance charges are reflected in the income statement.
Capitalised leased assets are depreciated over the shorter of the estimated useful life of the asset and the lease term, if there is no reasonable certainty that the Company will obtain ownership by the end of the lease term.
Operating lease payments are recognised as an expense in the income statement on a straight line basis over the lease term.
Company as a lessor Leases where the Company does not transfer substantially all
the risks and benefits of ownership of the asset are classified as operating leases. Initial direct costs incurred in negotiating an operating lease are added to the carrying amount of the leased asset and recognised over the lease term on the same bases as rental income. Contingent rents are recognised as revenue in the period in which they are earned.
Notes to the Financial Statements (continued)for the Year Ended 30 June 2009
Annual Report & FinancialStatements for the YearEnded 30 June 2009
62TH
E KE
NYA
POW
ER &
LIG
HTI
NG
COM
PAN
Y LT
D.
Annual Report & FinancialStatements for the YearEnded 30 June 2009
63
THE
KEN
YA P
OWER
& L
IGH
TIN
G CO
MPA
NY
LTD.
2.4 SUMMARY OF SIGNIFICANT ACCOUNTING POLICIES (continued) (j) Retirement benefits obligations (continued)
Pensioners and deferred pensioners (those who have left the employment of the Company but have not attained retirement age to qualify as pensioners) existing at 30 June 2006 are eligible for retirement benefits under a defined benefit scheme. For the defined benefit scheme, the pension costs are assessed using the unit credit method. Under this method, the cost of providing pensions is charged to the income statement so as to spread the regular cost over the lives of pensioners in accordance with the advice of the actuaries who carry out a full valuation of the scheme every three years. The next valuation will be carried out in December 2009. The pension obligation is measured as the present value of the estimated future cash outflows using interest rate of 5%.
Actuarial gains and losses are recognised as income or expense when cumulative unrecognised actuarial gains or losses exceed 10 per cent of the higher of the defined benefits obligations and the fair value of plan assets at that date. These gains or losses are recognised over the expected average remaining working lives of the participating employees.
The employees and the Company also contribute to the National Social Security Fund, a national defined contributions retirement benefits scheme. Contributions are determined by the country’s statutes and the Company’s contributions are charged to the income statement.
(k) Segment reporting The Company business is organised by regions (reporting segments),
comprising Nairobi, Mount Kenya, Coast and West Kenya. Business administration is by region as the Company deals in only supply of electricity. There are no inter-region sales.
Region results include revenue and expenses directly attributable to each region.
Region assets and liabilities comprise those operating assets and liabilities that are directly attributable to the region or can be allocated to the region on a reasonable basis. Capital expenditure
represents the total cost incurred during the year to acquire assets for the regions that are expected to be used during more than one period (property and equipment).
(l) Earnings per share Basic and diluted earnings per share (EPS) data for ordinary shares
are presented in the financial statements. Basic EPS is calculated by dividing the profit for the year attributable to ordinary shareholders of the Company by the weighted average number of ordinary shares outstanding during the period. Diluted EPS is determined by adjusting the profit or loss attributable to ordinary shareholders and the weighted average number of ordinary shares outstanding for the effects of all dilutive potential ordinary shares if any.
(m) Dividends Dividends on ordinary shares are charged to reserves in the period
in which they are declared. Proposed dividends are shown as a separate component of equity until declared.
(n) Government grants Government grants are recognized where there is a reasonable
assurance that the grant will be received and all attaching conditions will be complied with.
When the grant relates to an expense item, it is recognized as income over the period necessary to match the grant on a systematic basis to the costs that it is intended to compensate.
Where the grant relates to an asset the fair value is credited to a deferred income account and is released to the income statement over the expected useful life of the relevant asset by equal annual instalments.
(o) Cash and cash equivalents Cash and cash equivalents comprises of bank and cash balances
and short term deposits maturing within 3 months from the date of issue.
Notes to the Financial Statements (continued)for the Year Ended 30 June 2009
2.4 SUMMARY OF SIGNIFICANT ACCOUNTING POLICIES (continued)
(g) Financial instruments (continued)
Investments (continued) Investments other than held-to-maturity debt securities are classified
as either held-for-trading or available-for-sale, and are measured at subsequent reporting dates at fair value in cases where the fair value can be reliably established. Gains and losses arising from changes in fair value are included in equity for available for sale investments and in the income statement for held for trading investments.
Redeemable preference shares The component of redeemable preference shares that exhibits the
characteristics of a liability is recognised as a liability in the balance sheet, net of issue costs. The corresponding dividends on those shares are charged as interest expenses in the income statement.
(h) Leave accrual Employees’ entitlements to annual leave are recognised when they
accrue to employees. A provision is made for the estimated liability for annual leave at the balance sheet date.
(i) Impairment of tangible and intangible assets excluding goodwill The Company reviews the carrying amounts of its tangible and
intangible assets, to determine whether there is any indication that those assets have suffered an impairment loss at reporting date, or when there are indications of impairment. If any such indication exists, the recoverable amount of the asset is estimated and an impairment loss is recognised in the income statement whenever the carrying amount of the asset exceeds its recoverable amount.
An asset’s recoverable amount is the higher of an asset’s or cash-generating unit’s (CGU) fair value less costs to sell and its value in use. In assessing value in use, the estimated future cash flows are discounted to their present value using a pre-tax discount rate that reflects current market assessments of the time value of money and the risks specific to the asset. In determining fair value less costs to sell, an appropriate valuation model is used. Where it is not possible to estimate the recoverable amount of an individual asset, the Directors estimate the recoverable amount of the cash-generated unit to which the asset belongs.
Impairment of transmission and distribution lines A decline in the value of the transmission and distribution lines
could have a significant effect on the amounts recognised in the financial statements. Management assesses the impairment of the lines whenever events or changes in circumstances indicate that the carrying value may not be recoverable. Factors that are considered important which could make an impairment review necessary include the following:
i) Significant decline in the market value beyond that which would be expected from the passage of time and normal use.
ii) Evidence from internal reporting which indicates that the performance of the asset is, or will be, worse than expected.
iii) Significant changes with adverse effect on the Company have taken place during the period, or will take place in the near future, in the technology or market environment in which the Company operates, or in the market to which an asset is dedicated.
iv) The carrying amount of the net assets of the Company is more than its market capitalisation. v) Evidence is available of the obsolescence or physical damage of an asset.
vi) Significant changes with an adverse effect on the Company have taken place during the period, or are expected to take place in the near future, which impact the manner or the extent to which an asset is used. These changes include plans to discontinue or restructure the operation to which an asset belongs or to dispose of an asset before the previously expected date.
In management’s judgment, the impaired carrying values of the lines and substations are being reinforced, replaced or upgraded, under the Energy Sector Recovery Project, after considering the above key indicators of impairment.
(j) Retirement benefits obligations The Company employees are eligible for retirement benefits under a
defined contribution scheme from 1 July 2006. Payments to the defined contribution scheme are charged to the income statement as incurred.
Notes to the Financial Statements (continued)for the Year Ended 30 June 2009
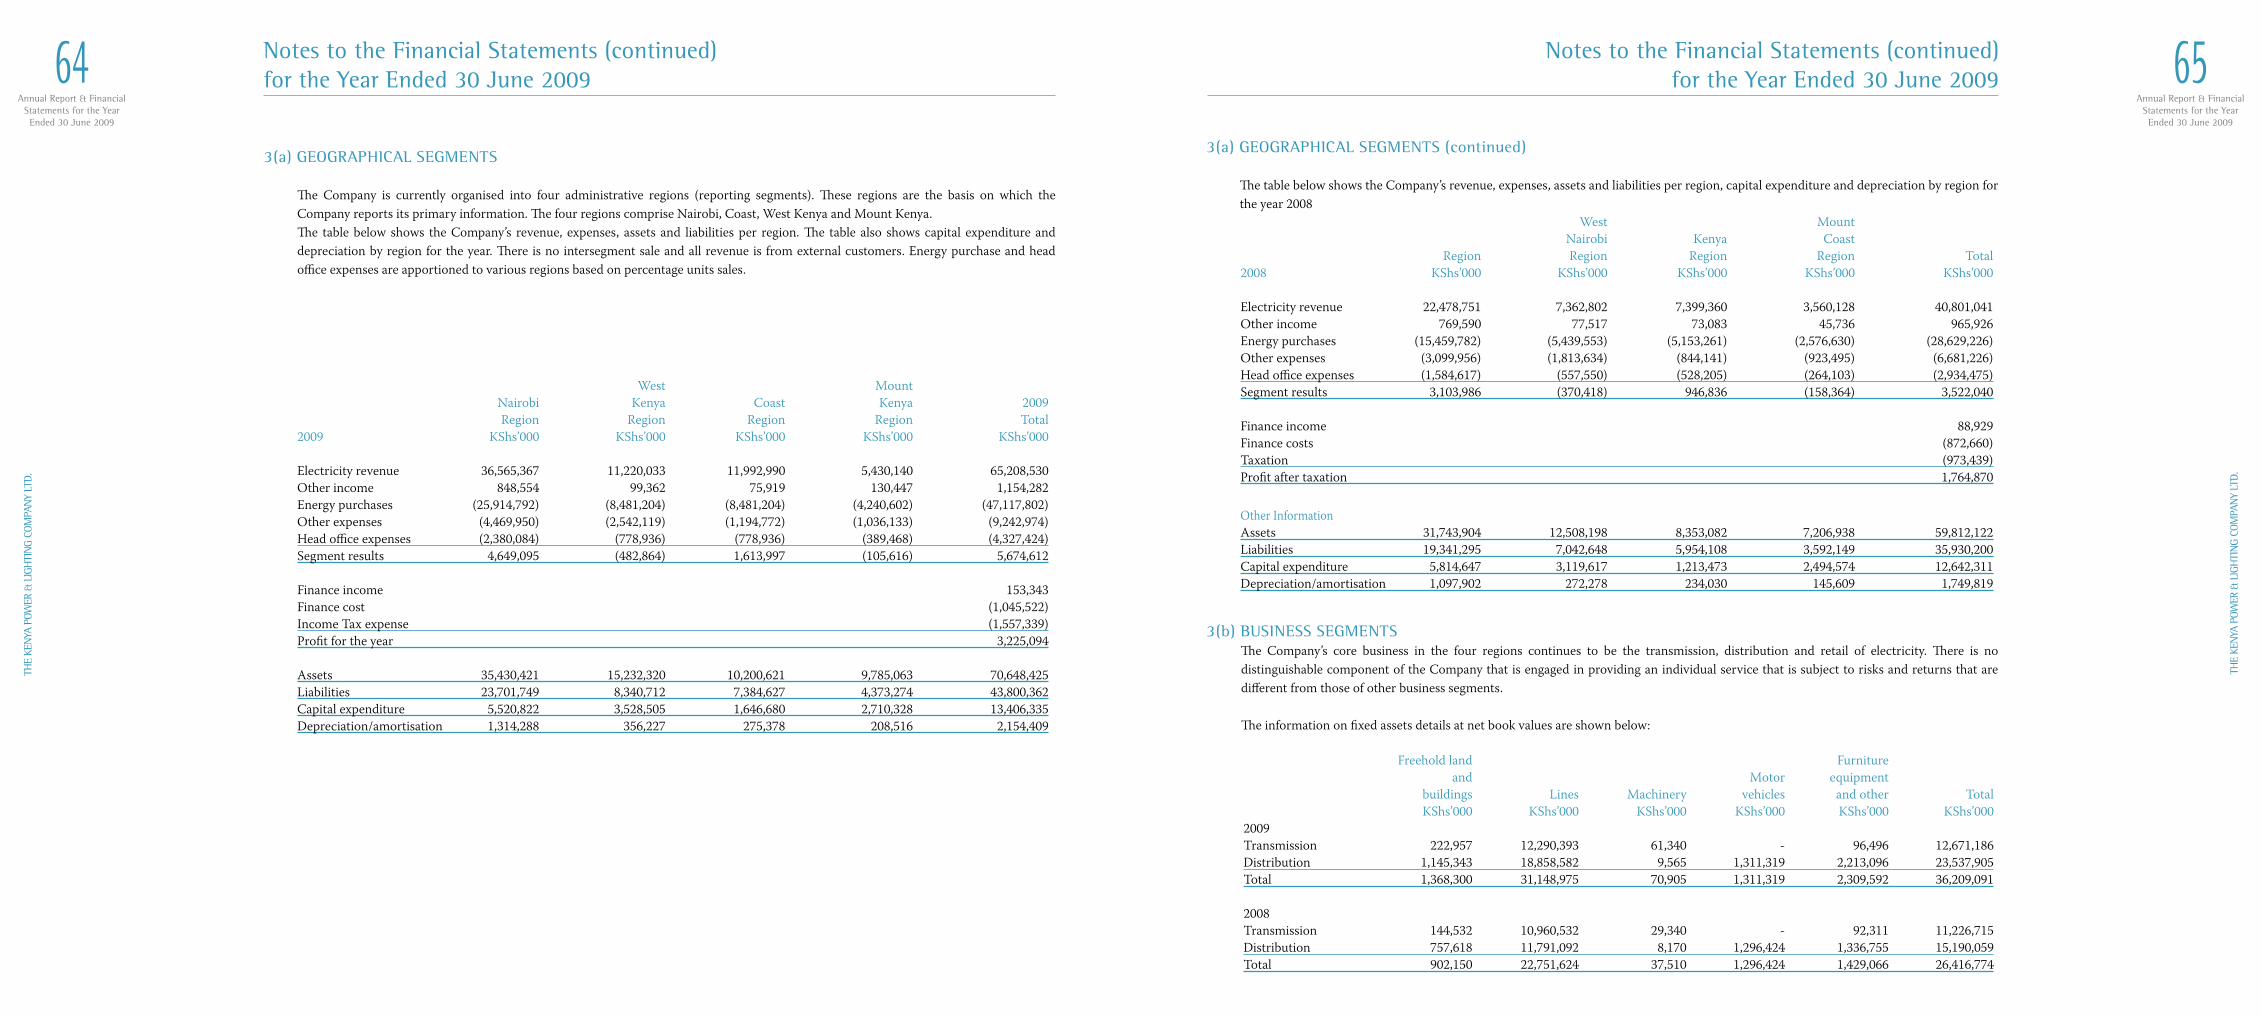
Annual Report & FinancialStatements for the YearEnded 30 June 2009
64TH
E KE
NYA
POW
ER &
LIG
HTI
NG
COM
PAN
Y LT
D.
Annual Report & FinancialStatements for the YearEnded 30 June 2009
65
THE
KEN
YA P
OWER
& L
IGH
TIN
G CO
MPA
NY
LTD.
3(a) GEOGRAPHICAL SEGMENTS (continued) The table below shows the Company’s revenue, expenses, assets and liabilities per region, capital expenditure and depreciation by region for the year 2008
West Mount Nairobi Kenya Coast Region Region Region Region Total2008 KShs’000 KShs’000 KShs’000 KShs’000 KShs’000 Electricity revenue 22,478,751 7,362,802 7,399,360 3,560,128 40,801,041Other income 769,590 77,517 73,083 45,736 965,926Energy purchases (15,459,782) (5,439,553) (5,153,261) (2,576,630) (28,629,226)Other expenses (3,099,956) (1,813,634) (844,141) (923,495) (6,681,226)Head office expenses (1,584,617) (557,550) (528,205) (264,103) (2,934,475)Segment results 3,103,986 (370,418) 946,836 (158,364) 3,522,040 Finance income 88,929Finance costs (872,660)Taxation (973,439)Profit after taxation 1,764,870
Other InformationAssets 31,743,904 12,508,198 8,353,082 7,206,938 59,812,122Liabilities 19,341,295 7,042,648 5,954,108 3,592,149 35,930,200Capital expenditure 5,814,647 3,119,617 1,213,473 2,494,574 12,642,311Depreciation/amortisation 1,097,902 272,278 234,030 145,609 1,749,819
3(b) BUSINESS SEGMENTSThe Company’s core business in the four regions continues to be the transmission, distribution and retail of electricity. There is no distinguishable component of the Company that is engaged in providing an individual service that is subject to risks and returns that are different from those of other business segments.
The information on fixed assets details at net book values are shown below:
Freehold land Furniture and Motor equipment buildings Lines Machinery vehicles and other Total KShs’000 KShs’000 KShs’000 KShs’000 KShs’000 KShs’0002009Transmission 222,957 12,290,393 61,340 - 96,496 12,671,186Distribution 1,145,343 18,858,582 9,565 1,311,319 2,213,096 23,537,905Total 1,368,300 31,148,975 70,905 1,311,319 2,309,592 36,209,091
2008Transmission 144,532 10,960,532 29,340 - 92,311 11,226,715Distribution 757,618 11,791,092 8,170 1,296,424 1,336,755 15,190,059Total 902,150 22,751,624 37,510 1,296,424 1,429,066 26,416,774
Notes to the Financial Statements (continued)for the Year Ended 30 June 2009
3(a) GEOGRAPHICAL SEGMENTS
The Company is currently organised into four administrative regions (reporting segments). These regions are the basis on which the Company reports its primary information. The four regions comprise Nairobi, Coast, West Kenya and Mount Kenya. The table below shows the Company’s revenue, expenses, assets and liabilities per region. The table also shows capital expenditure and depreciation by region for the year. There is no intersegment sale and all revenue is from external customers. Energy purchase and head office expenses are apportioned to various regions based on percentage units sales.
West Mount Nairobi Kenya Coast Kenya 2009 Region Region Region Region Total2009 KShs’000 KShs’000 KShs’000 KShs’000 KShs’000
Electricity revenue 36,565,367 11,220,033 11,992,990 5,430,140 65,208,530Other income 848,554 99,362 75,919 130,447 1,154,282Energy purchases (25,914,792) (8,481,204) (8,481,204) (4,240,602) (47,117,802)Other expenses (4,469,950) (2,542,119) (1,194,772) (1,036,133) (9,242,974)Head office expenses (2,380,084) (778,936) (778,936) (389,468) (4,327,424)Segment results 4,649,095 (482,864) 1,613,997 (105,616) 5,674,612 Finance income 153,343Finance cost (1,045,522)Income Tax expense (1,557,339)Profit for the year 3,225,094
Assets 35,430,421 15,232,320 10,200,621 9,785,063 70,648,425Liabilities 23,701,749 8,340,712 7,384,627 4,373,274 43,800,362Capital expenditure 5,520,822 3,528,505 1,646,680 2,710,328 13,406,335Depreciation/amortisation 1,314,288 356,227 275,378 208,516 2,154,409
Notes to the Financial Statements (continued)for the Year Ended 30 June 2009
Annual Report & FinancialStatements for the YearEnded 30 June 2009
66TH
E KE
NYA
POW
ER &
LIG
HTI
NG
COM
PAN
Y LT
D.
Annual Report & FinancialStatements for the YearEnded 30 June 2009
67
THE
KEN
YA P
OWER
& L
IGH
TIN
G CO
MPA
NY
LTD.
4. FINANCIAL RISK MANAGEMENT OBJECTIVES AND POLICIES (continued)
a) Credit Risk (continued) (i) Electricity receivables (continued) Electricity supply agreements are entered into with
all customers. All customers are required to deposit an amount equivalent to two and half times their monthly consumption being security in form of deposit depending on the load supplied, subject to a minimum of two thousand five hundred shillings. Industrial and large commercial customers have the option of providing a bank guarantee in lieu of cash deposit. Payment is enforced by way of disconnection of the supply if bills are not paid within twenty one days after billing. No interest is charged on balances in arrears.
The Company has well-established credit control procedures that monitor activity on customer accounts and allow for remedial action should the customer not comply with payment terms. These procedures include the issue of a notice for disconnection of supply, an internal collection process; follow up of the customer by telephone or in person, negations of mutually acceptable payment arrangements and letters of demand. Non payment will result in disconnection of supply and the account’s closure if the disconnection is done and there is no payment within three months. The legal collection process is pursued thereafter. The decision to impair overdue amounts is assessed on the probability of recovery based on the customer’s credit risk profile.
Progress on the collection process is reviewed on a regular basis and if it is evident that the amount will not be recovered, it is recommended for write-off in terms of the Company’s policy. The process of recovery continues unless it is confirmed that there is no prospect of recovery or the costs of such action will exceed the
benefits to be derived. Amounts written off are determined after taking into account the value of the security held.
The total cumulative provision for impairment for electricity
receivables at 30 June 2009 was KShs 4.743 billion (2008: KShs. 1.995 billion). Refer to note 18(c). A large portion relates to rebilling as result of meter tampering. The increase is partly due to tariff review which went up by 21%.
The Company is currently exploring the employment of pre-paid metering and automatic meter reading as strategies to minimise the risk of non-collection. In addition, the following strategies are currently in operation and are largely successful in other high risk areas of non-paying customers. These include:
• disconnections • conversiontoprepayment • increasedinternaldebtmanagementcapacity • useofdebtcollectors • focusonearlyidentificationandlettersofdemand • IncreasedSecurities • Automaticmeterreadingforlargecustomertoreducedisputes
ii) Other receivables Other receivables include recoverable VAT and fuel costs, employee
debtors, inter-company balances, recoverable work and tenants. Recoverable VAT is mainly amount refundable by tax authority in relation to overpaid taxes while recoverable fuel costs relate to fuel cost to be passed to electricity customers. The details of provision for impairment for other receivables at 30 June 2009 is as per note 18(d).
Notes to the Financial Statements (continued)for the Year Ended 30 June 2009
4. FINANCIAL RISK MANAGEMENT OBJECTIVES AND POLICIES
Information about the Company’s exposure to risks, its objectives, policies and processes for measuring and managing such risks, as well as quantitative disclosure, is discussed in this note. The management of capital is also discussed.
The Company has an integrated risk management framework. The Company’s approach to risk management is based on risk governance structures, risk management policies, risk identification, measurement and reporting. Three types of risks are reported as part of the risk profile, namely operational, strategic and business continuity risks.
Operational risks are events, hazards, variances or opportunities which could influence the achievement of the Company’s compliance and operational objectives.
For the Kenya Power and Lighting Company’s, a strategic risk is a significant unexpected or unpredictable change or outcome beyond what was factored into the organisation’s strategy and business model which could have an impact on the Company’s performance.
Business continuity risks are those events, hazards, variances
and opportunities which could influence the continuity of the Company.
One of the key risks for the Kenya Power and Lighting Company, identified both under the operational and strategic risk categories, is financial sustainability of the Company. The financial risk, as defined by IFRS 7, and the management thereof, form part of this key risk area.
The Board of Directors has delegated the management of the
Companywide risk to the Audit Committee. One of the committee’s responsibilities is to review risk management strategies in order to ensure business continuity and survival. Most of the financial risks arising from financial instruments are managed in the centralised finance function of the Company.
The Company’s exposure to risk, its objectives, policies and processes
for managing the risk and the methods used to measure it have been consistently applied in the years presented, unless otherwise stated.
The Company has exposure to the following risks as a result of its financial instruments:
a) Credit risk b) Liquidity risk c) Market risk d) Operational risk e) Compliance and regulatory risk f) Legal risk a) Credit Risk Credit risk is the risk of financial loss to the Company if a customer or
other counterparty (including government and financial institutions) to a financial instrument fails to meet its contractual obligations. Credit risk arises primarily from the sale of goods and services in the ordinary course of business and the centralised treasury activities. Credit risk includes counterparty risk and delivery or settlement risk.
Counterparty risk is the risk that a counterparty is unable to meet its financial and/or contractual obligations during the period of a transaction. Delivery or settlement risk is the risk that counterparty does not deliver on its contractual commitment on maturity date (including the settlement of money and delivery of securities).
Management of credit risk Financial instruments managed by the finance and commercial
services functions.
i) Electricity receivables The Company supplies electricity to customers in its licensed areas
of supply. A large proportion is small commercial and domestic customers who settle their accounts within twenty one days on receipt of the bill. The Company’s exposure to credit risk is influenced by the individual characteristics of each customer.
In monitoring credit risk, customers are grouped according to their credit characteristics, including whether they are large, small or domestic electricity users, profile, security (deposits and guarantees) held and payment history.
The main classes of electricity receivables are industrial, government ministries, local authorities, parastatals commercial and domestic customers.
Notes to the Financial Statements (continued)for the Year Ended 30 June 2009
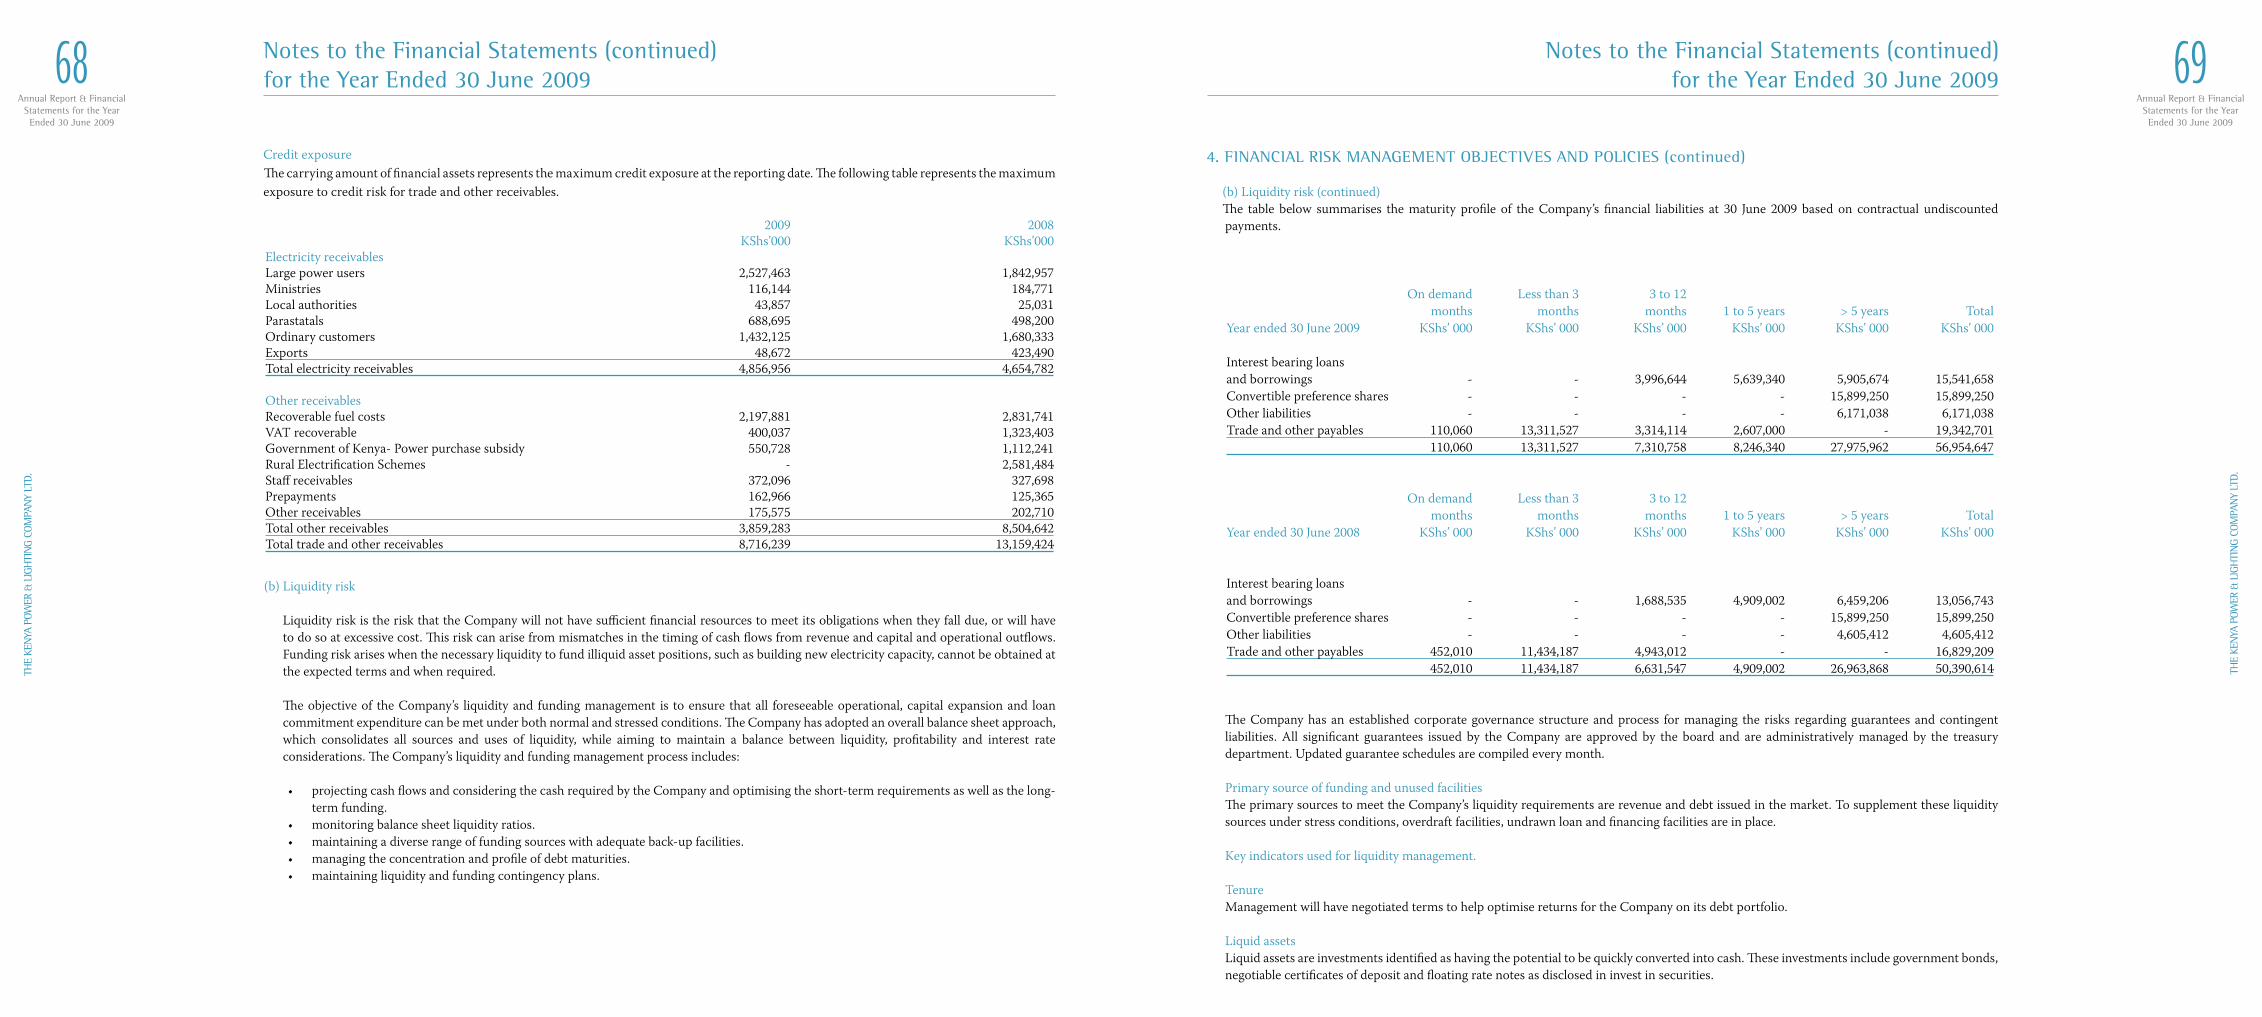
Annual Report & FinancialStatements for the YearEnded 30 June 2009
68TH
E KE
NYA
POW
ER &
LIG
HTI
NG
COM
PAN
Y LT
D.
Annual Report & FinancialStatements for the YearEnded 30 June 2009
69
THE
KEN
YA P
OWER
& L
IGH
TIN
G CO
MPA
NY
LTD.
4. FINANCIAL RISK MANAGEMENT OBJECTIVES AND POLICIES (continued)
(b) Liquidity risk (continued)The table below summarises the maturity profile of the Company’s financial liabilities at 30 June 2009 based on contractual undiscounted payments.
On demand Less than 3 3 to 12 months months months 1 to 5 years > 5 years TotalYear ended 30 June 2009 KShs’ 000 KShs’ 000 KShs’ 000 KShs’ 000 KShs’ 000 KShs’ 000
Interest bearing loans and borrowings - - 3,996,644 5,639,340 5,905,674 15,541,658Convertible preference shares - - - - 15,899,250 15,899,250Other liabilities - - - - 6,171,038 6,171,038Trade and other payables 110,060 13,311,527 3,314,114 2,607,000 - 19,342,701 110,060 13,311,527 7,310,758 8,246,340 27,975,962 56,954,647
On demand Less than 3 3 to 12 months months months 1 to 5 years > 5 years TotalYear ended 30 June 2008 KShs’ 000 KShs’ 000 KShs’ 000 KShs’ 000 KShs’ 000 KShs’ 000
Interest bearing loans and borrowings - - 1,688,535 4,909,002 6,459,206 13,056,743Convertible preference shares - - - - 15,899,250 15,899,250Other liabilities - - - - 4,605,412 4,605,412Trade and other payables 452,010 11,434,187 4,943,012 - - 16,829,209 452,010 11,434,187 6,631,547 4,909,002 26,963,868 50,390,614
The Company has an established corporate governance structure and process for managing the risks regarding guarantees and contingent
liabilities. All significant guarantees issued by the Company are approved by the board and are administratively managed by the treasury department. Updated guarantee schedules are compiled every month.
Primary source of funding and unused facilities The primary sources to meet the Company’s liquidity requirements are revenue and debt issued in the market. To supplement these liquidity
sources under stress conditions, overdraft facilities, undrawn loan and financing facilities are in place.
Key indicators used for liquidity management.
Tenure Management will have negotiated terms to help optimise returns for the Company on its debt portfolio.
Liquid assets Liquid assets are investments identified as having the potential to be quickly converted into cash. These investments include government bonds,
negotiable certificates of deposit and floating rate notes as disclosed in invest in securities.
Notes to the Financial Statements (continued)for the Year Ended 30 June 2009
(b) Liquidity risk
Liquidity risk is the risk that the Company will not have sufficient financial resources to meet its obligations when they fall due, or will have to do so at excessive cost. This risk can arise from mismatches in the timing of cash flows from revenue and capital and operational outflows. Funding risk arises when the necessary liquidity to fund illiquid asset positions, such as building new electricity capacity, cannot be obtained at the expected terms and when required.
The objective of the Company’s liquidity and funding management is to ensure that all foreseeable operational, capital expansion and loan commitment expenditure can be met under both normal and stressed conditions. The Company has adopted an overall balance sheet approach, which consolidates all sources and uses of liquidity, while aiming to maintain a balance between liquidity, profitability and interest rate considerations. The Company’s liquidity and funding management process includes:
• projecting cash flows and considering the cash required by the Company and optimising the short-term requirements as well as the long-term funding.
• monitoring balance sheet liquidity ratios.• maintaining a diverse range of funding sources with adequate back-up facilities.• managing the concentration and profile of debt maturities.• maintaining liquidity and funding contingency plans.
2009 2008 KShs’000 KShs’000Electricity receivables Large power users 2,527,463 1,842,957Ministries 116,144 184,771Local authorities 43,857 25,031Parastatals 688,695 498,200Ordinary customers 1,432,125 1,680,333Exports 48,672 423,490Total electricity receivables 4,856,956 4,654,782
Other receivables Recoverable fuel costs 2,197,881 2,831,741VAT recoverable 400,037 1,323,403Government of Kenya- Power purchase subsidy 550,728 1,112,241Rural Electrification Schemes - 2,581,484Staff receivables 372,096 327,698Prepayments 162,966 125,365Other receivables 175,575 202,710Total other receivables 3,859,283 8,504,642Total trade and other receivables 8,716,239 13,159,424
Credit exposureThe carrying amount of financial assets represents the maximum credit exposure at the reporting date. The following table represents the maximum exposure to credit risk for trade and other receivables.
Notes to the Financial Statements (continued)for the Year Ended 30 June 2009
Annual Report & FinancialStatements for the YearEnded 30 June 2009
70TH
E KE
NYA
POW
ER &
LIG
HTI
NG
COM
PAN
Y LT
D.
Annual Report & FinancialStatements for the YearEnded 30 June 2009
71
THE
KEN
YA P
OWER
& L
IGH
TIN
G CO
MPA
NY
LTD.
4. FINANCIAL RISK MANAGEMENT OBJECTIVES AND POLICIES (continued)
(c) Market risk (continued) iv) Sensitivity analysis (continued)
The calculation excludes borrowing costs capitalised in terms of the Company’s accounting policy. The analysis has been performed on the same basis as the prior year.
Using the end of the year figures, the sensitivity analysis indicates the impact on the income statement if current floating interest rates increases/decreases by one percentage point as KShs 85 million (2008: KShs 70 million). A rate increase/decrease of 5% would result in a decrease/increase of KShs 425 million (2008 - KShs 350 million)
(d) Operational risk Operational risk is the risk of direct or indirect loss arising from
a wide variety of causes associated with the Company’s processes, personnel, technology and infrastructure and from external factors other than credit, market and liquidity risks such as from legal and regulatory requirements and generally accepted standards of corporate behaviour. The Company seeks to ensure that key operational risks are managed in a timely and effective manner through a framework of policies, procedures and tools to identify, assess, monitor, control and report such risks.
The Company’s objective is to manage operational risk so as to balance the avoidance of financial losses and damage to the Company’s reputation with overall cost effectiveness and to avoid control procedures that restrict initiative and creativity.
The primary responsibility for the development and implementation of
controls to address operational risk is assigned to senior management. This responsibility is supported by the development of overall Company standards for the management of operational risk in the following areas:
• requirements for appropriate segregation of duties,
including the independent authorisation of transactions • requirements for the reconciliation and monitoring of
transactions • compliance with regulatory and legal requirements• documentation of controls and procedures
• requirements for the yearly assessment of operational risk faced, and the adequacy of controls and procedures to address the risks identified
• requirements for the reporting of operational losses and proposed remedial action
• development of contingency plans• training and professional development • ethical and business standards• risk mitigation, including insurance where this is effective.
Operational risk is managed by a programme of regular reviews undertaken by the Internal Audit and the results of the reviews are discussed with the management, with summaries submitted to the Audit Committee and senior management of the Company.
(e) Compliance and regulatory risk Compliance and regulatory risk includes the risk of non-compliance
with regulatory requirements. Electricity Regulatory Commission (ERC) sets and monitors retail and bulk tariffs, additional surcharges and levies for the power sub sector industry. Various parameters are applied in arriving at monthly surcharge and levies passed on to customers. ERC also requires monthly surcharges to be gazetted. The Company has complied with all externally imposed requirements throughout the year.
(f) Legal risk Legal risk is the risk of unexpected loss, including reputational
loss, arising from defective transactions or contracts, claims being made or some other event resulting in a liability or other loss for the Company, failure to protect the title to and ability to control the rights to assets of the Company (including intellectual property rights), changes in law, or jurisdictional risk.
The Company manages legal risk through the legal function, legal risk policies and procedures and effective use of its internal controls and external lawyers.
Capital management The primary objective of the Company’s capital management is to
ensure that it maintains healthy capital ratios in order to support its business and maximise shareholder value.
The Company manages its capital structure and makes adjustments to it, in light of changes in economic conditions.
Notes to the Financial Statements (continued)for the Year Ended 30 June 2009
4. FINANCIAL RISK MANAGEMENT OBJECTIVES AND POLICIES (continued) (b) Liquidity risk (continued)
Capital expenditure ratio The capital expenditure ratio measures whether there are liquid funds
available to invest in capital expenditure. The capital expenditure ratio for the period was as follows:
2009 2008 % % Continuing activities 119 27 The ratio is calculated as net cash from trading operations divided
by capital expenditure (excluding effects of foreign exchange rate fluctuations and borrowing costs capitalised) on property, plant and equipment and intangible assets.
(c) Market risk Market risk is the risk that the fair value or future cash flow of financial
instruments will fluctuate because of changes in foreign exchange rates, commodity prices and interest rates. The objective of market risk management policy is to protect and enhance the balance sheet and income statement by managing and controlling market risk exposures within acceptable parameters and to optimise the funding of business operations and facilitate capital expansion.
The Company is exposed to the following risks: i) Currency risk Currency risk arises primarily from purchasing imported goods and
services directly from overseas or indirectly via local suppliers and foreign borrowings. The Company is exposed to foreign exchange risk arising from future commercial transactions and recognised assets and liabilities that are denominated in a currency other than the functional currency of the Company.
Management of currency risk Exposure due to foreign currency risk is managed by recovering
from customers the realised fluctuations in the exchange rates not factored in the retail tariffs.
ii) Commodity risk The Company is exposed to price risk on the fuel that is used for
the generation of electricity to the extent that the customers are not able to pay for the additional costs passed on to them.
Management of commodity risk Exposure due to commodity risk is managed by passing the cost
of fuel used in generation to customers. In addition the Company has well-established credit control procedures that monitor activity on customer accounts and allow for remedial action should the customer not comply with payment terms. These procedures include the issue of a notice of disconnection of supply, an internal collection process; follow up of the customer telephonically or in person, negations of mutually acceptable payment arrangements and letters of demand. Non payment will result in disconnection of supply and the customer’s account being closed. The legal collection process is pursued thereafter.
The decision to impair overdue amounts is assessed on the probability
of recovery based on the customer’s credit risk profile.
iii) Interest rate risk Interest rate risk is the risk that the Company’s financial condition
may be adversely affected as a result of changes in interest rate levels. The Company’s interest rate risk arises from short-term borrowings. Borrowings issued at variable rates expose the Company to cash flow interest rate risk. Long-term borrowings issued at fixed rates expose the Company to fair value interest rate risk.
The interest rate risk exposure arises mainly from interest rate movements on the Company’s borrowings.
Management of interest rate risk To manage the interest rate risk, management has endeavoured
to only sign and obtain borrowings from institutions that offer contracts with fixed interest rates. Based on the various scenarios, the Company also manages its fair value interest rate risk by using floating -to- fixed interest rate swaps.
iv) Sensitivity analysis The Company analyses its interest rate exposure on a dynamic basis
by conducting a sensitivity analysis. This involves determining the impact on income statement of defined rate shifts. The sensitivity analysis for interest rate risk assumes that all other variables, in particular foreign exchange rates, remain constant.
Notes to the Financial Statements (continued)for the Year Ended 30 June 2009
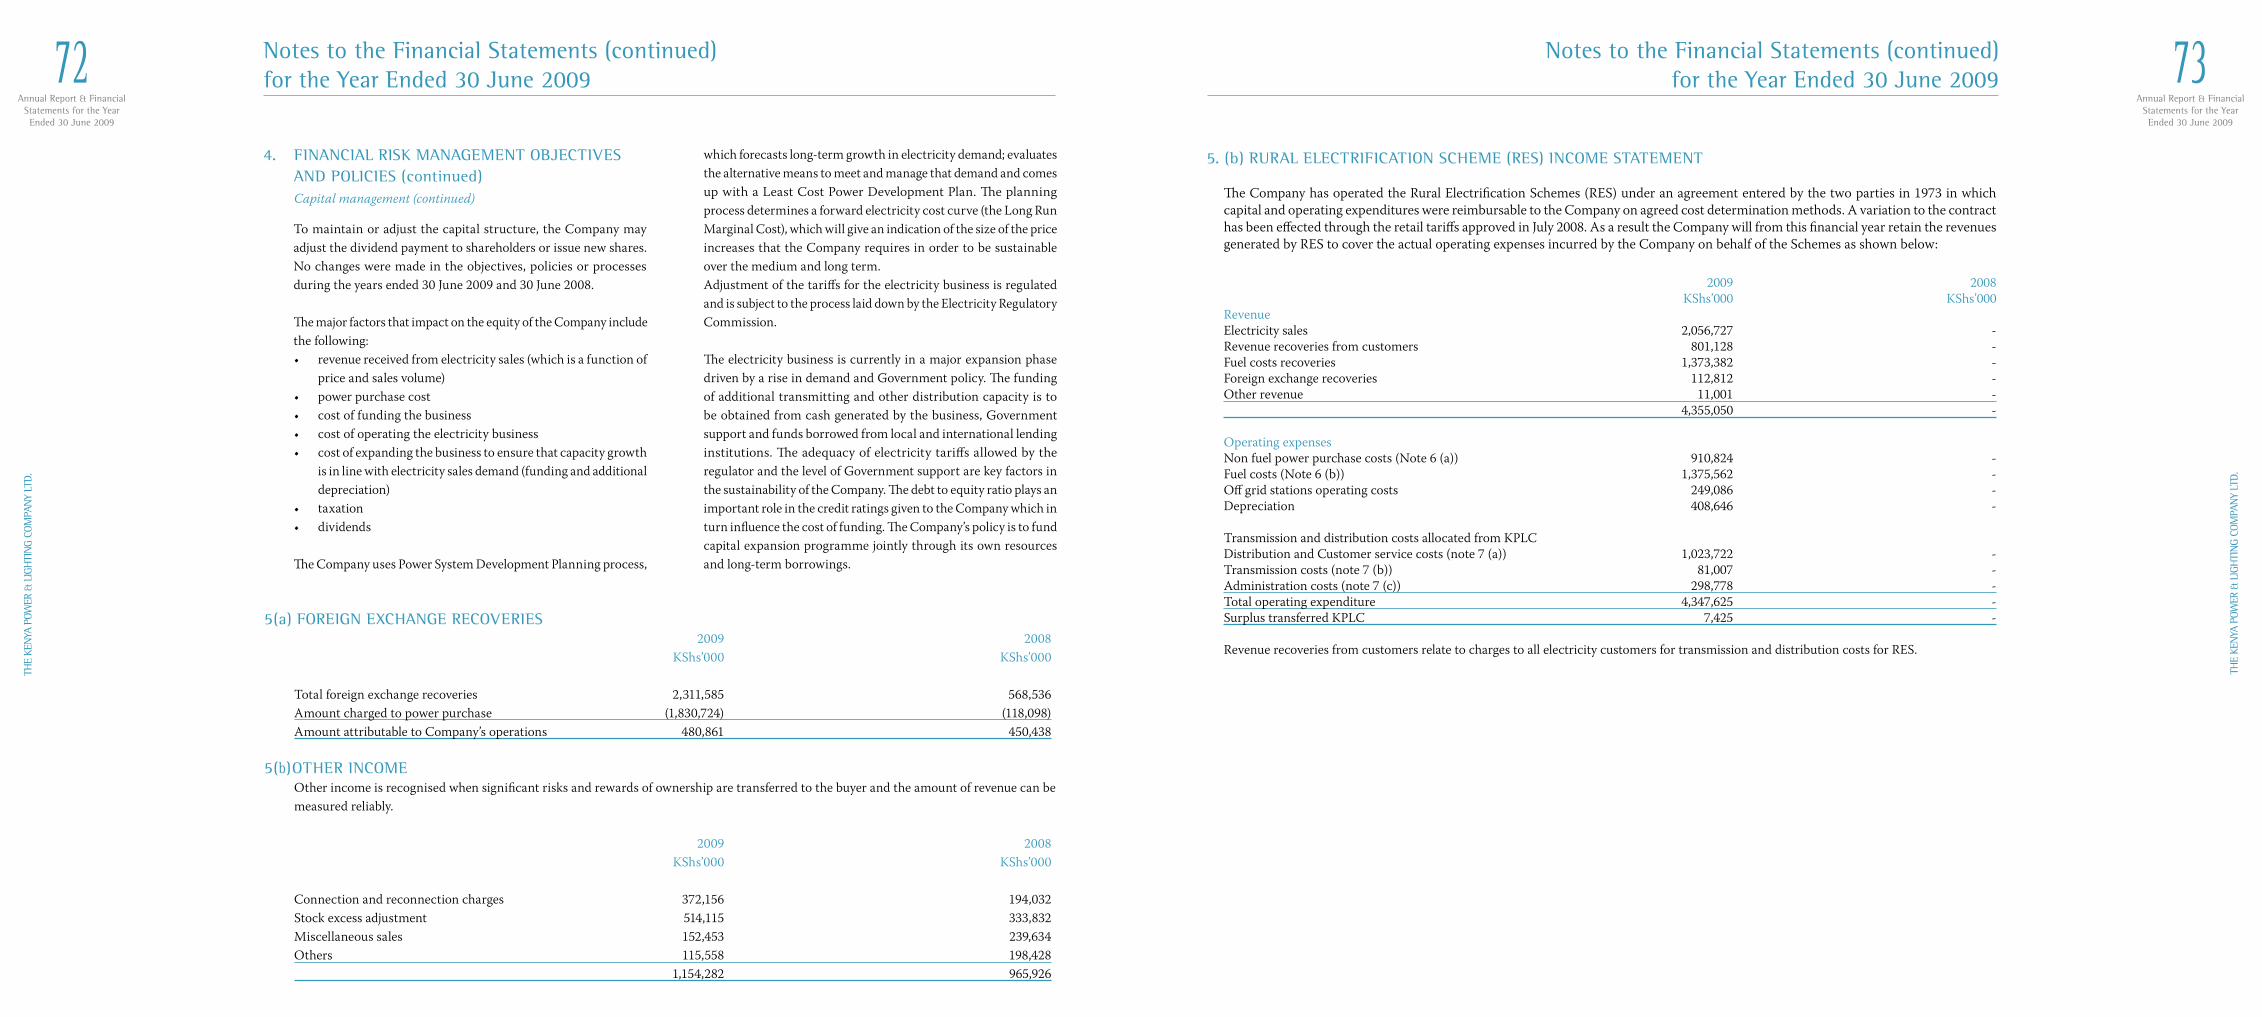
Annual Report & FinancialStatements for the YearEnded 30 June 2009
72TH
E KE
NYA
POW
ER &
LIG
HTI
NG
COM
PAN
Y LT
D.
Annual Report & FinancialStatements for the YearEnded 30 June 2009
73
THE
KEN
YA P
OWER
& L
IGH
TIN
G CO
MPA
NY
LTD.
5. (b) RURAL ELECTRIFICATION SCHEME (RES) INCOME STATEMENT
The Company has operated the Rural Electrification Schemes (RES) under an agreement entered by the two parties in 1973 in which capital and operating expenditures were reimbursable to the Company on agreed cost determination methods. A variation to the contract has been effected through the retail tariffs approved in July 2008. As a result the Company will from this financial year retain the revenues generated by RES to cover the actual operating expenses incurred by the Company on behalf of the Schemes as shown below:
2009 2008 KShs’000 KShs’000
RevenueElectricity sales 2,056,727 -Revenue recoveries from customers 801,128 -Fuel costs recoveries 1,373,382 -Foreign exchange recoveries 112,812 -Other revenue 11,001 - 4,355,050 -
Operating expenses Non fuel power purchase costs (Note 6 (a)) 910,824 -Fuel costs (Note 6 (b)) 1,375,562 -Off grid stations operating costs 249,086 -Depreciation 408,646 -
Transmission and distribution costs allocated from KPLCDistribution and Customer service costs (note 7 (a)) 1,023,722 -Transmission costs (note 7 (b)) 81,007 -Administration costs (note 7 (c)) 298,778 -Total operating expenditure 4,347,625 -Surplus transferred KPLC 7,425 -
Revenue recoveries from customers relate to charges to all electricity customers for transmission and distribution costs for RES.
Notes to the Financial Statements (continued)for the Year Ended 30 June 2009
5(a) FOREIGN EXCHANGE RECOVERIES 2009 2008 KShs’000 KShs’000
Total foreign exchange recoveries 2,311,585 568,536 Amount charged to power purchase (1,830,724) (118,098) Amount attributable to Company’s operations 480,861 450,438
5(b)OTHER INCOME Other income is recognised when significant risks and rewards of ownership are transferred to the buyer and the amount of revenue can be
measured reliably. 2009 2008 KShs’000 KShs’000
Connection and reconnection charges 372,156 194,032 Stock excess adjustment 514,115 333,832 Miscellaneous sales 152,453 239,634 Others 115,558 198,428 1,154,282 965,926
Notes to the Financial Statements (continued)for the Year Ended 30 June 2009
4. FINANCIAL RISK MANAGEMENT OBJECTIVES AND POLICIES (continued)
Capital management (continued)
To maintain or adjust the capital structure, the Company may adjust the dividend payment to shareholders or issue new shares.
No changes were made in the objectives, policies or processes during the years ended 30 June 2009 and 30 June 2008.
The major factors that impact on the equity of the Company include
the following:• revenue received from electricity sales (which is a function of
price and sales volume)• power purchase cost• cost of funding the business• cost of operating the electricity business• cost of expanding the business to ensure that capacity growth
is in line with electricity sales demand (funding and additional depreciation)
• taxation• dividends
The Company uses Power System Development Planning process,
which forecasts long-term growth in electricity demand; evaluates the alternative means to meet and manage that demand and comes up with a Least Cost Power Development Plan. The planning process determines a forward electricity cost curve (the Long Run Marginal Cost), which will give an indication of the size of the price increases that the Company requires in order to be sustainable over the medium and long term.
Adjustment of the tariffs for the electricity business is regulated and is subject to the process laid down by the Electricity Regulatory Commission.
The electricity business is currently in a major expansion phase driven by a rise in demand and Government policy. The funding of additional transmitting and other distribution capacity is to be obtained from cash generated by the business, Government support and funds borrowed from local and international lending institutions. The adequacy of electricity tariffs allowed by the regulator and the level of Government support are key factors in the sustainability of the Company. The debt to equity ratio plays an important role in the credit ratings given to the Company which in turn influence the cost of funding. The Company’s policy is to fund capital expansion programme jointly through its own resources and long-term borrowings.
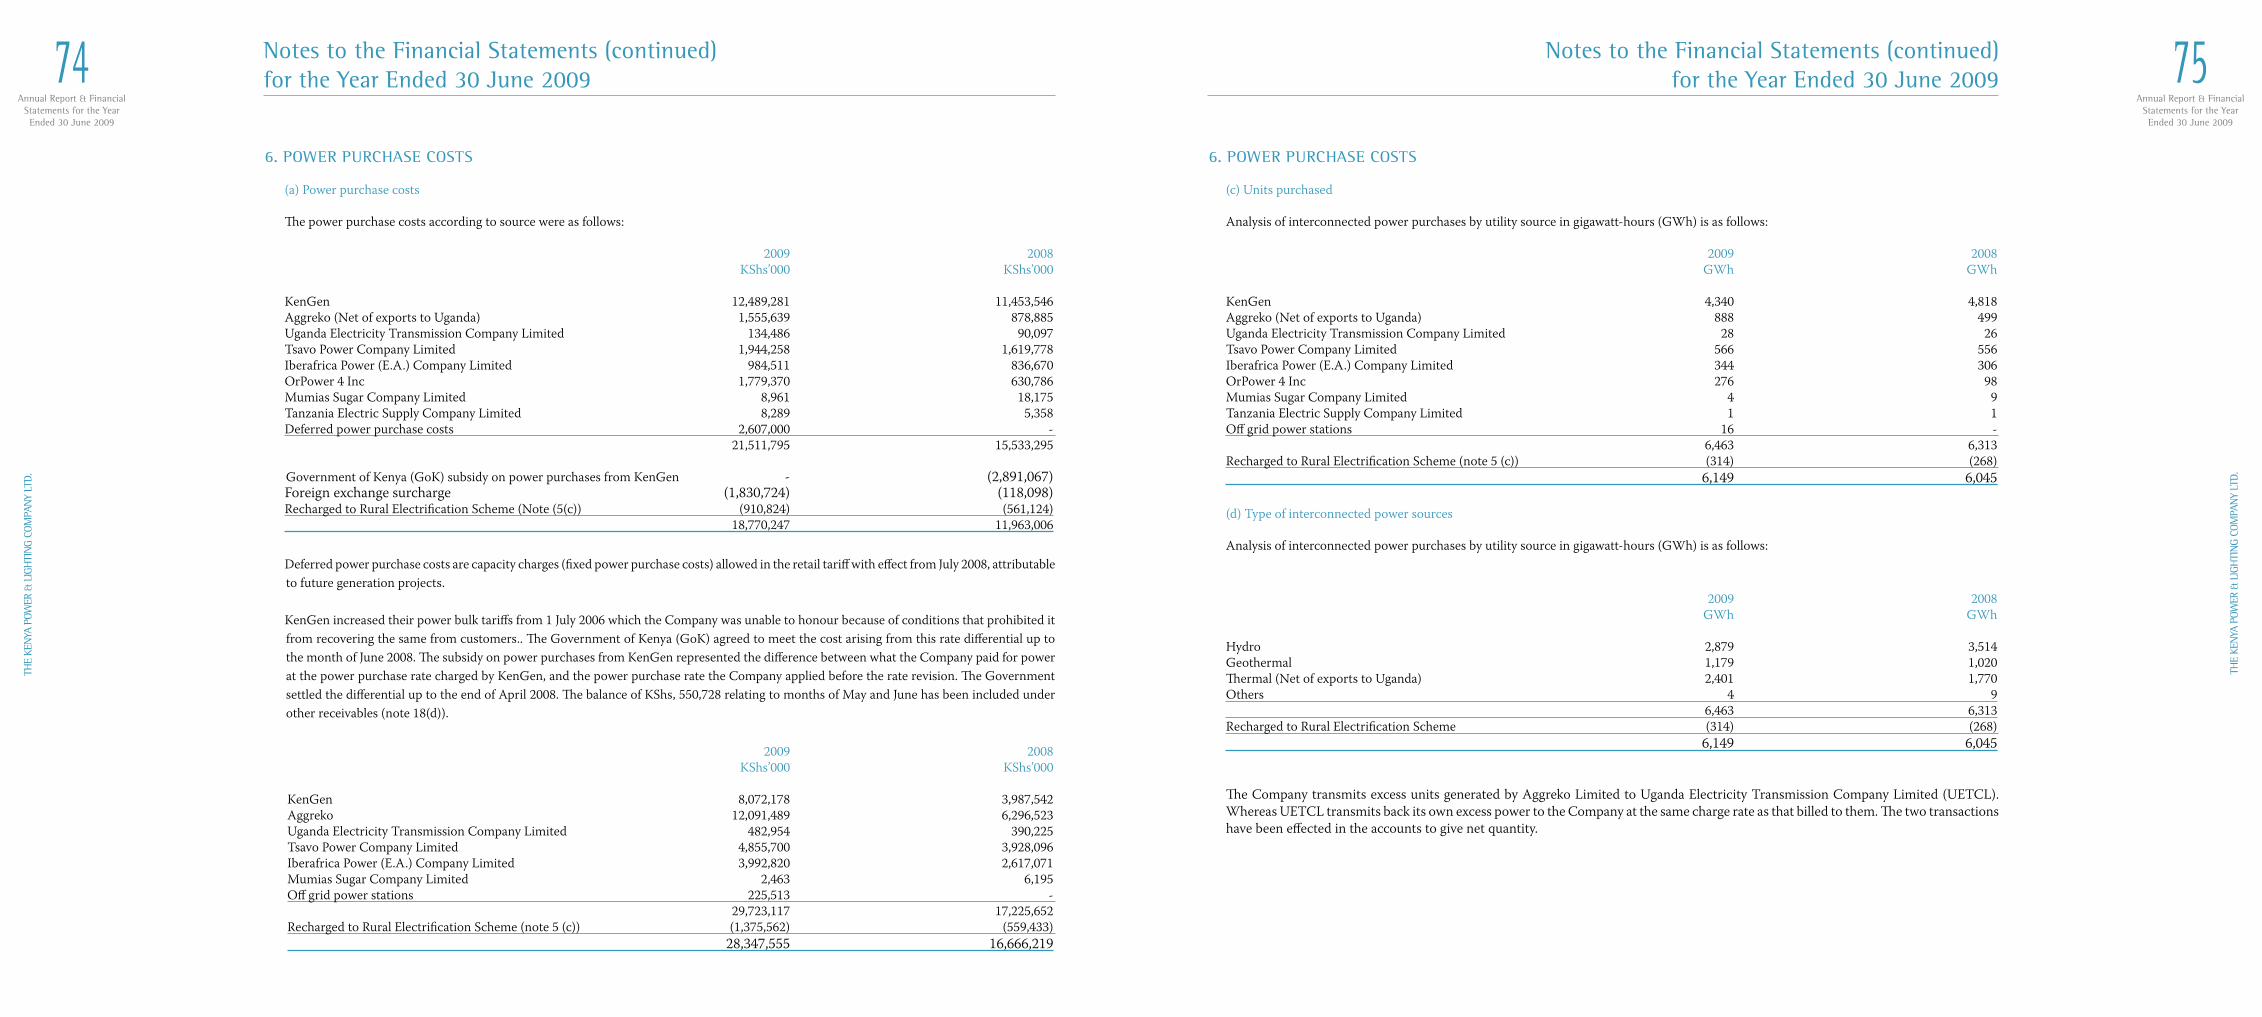
Annual Report & FinancialStatements for the YearEnded 30 June 2009
74TH
E KE
NYA
POW
ER &
LIG
HTI
NG
COM
PAN
Y LT
D.
Annual Report & FinancialStatements for the YearEnded 30 June 2009
75
THE
KEN
YA P
OWER
& L
IGH
TIN
G CO
MPA
NY
LTD.
6. POWER PURCHASE COSTS
(c) Units purchased
Analysis of interconnected power purchases by utility source in gigawatt-hours (GWh) is as follows: 2009 2008 GWh GWh KenGen 4,340 4,818Aggreko (Net of exports to Uganda) 888 499Uganda Electricity Transmission Company Limited 28 26Tsavo Power Company Limited 566 556Iberafrica Power (E.A.) Company Limited 344 306OrPower 4 Inc 276 98Mumias Sugar Company Limited 4 9Tanzania Electric Supply Company Limited 1 1Off grid power stations 16 - 6,463 6,313Recharged to Rural Electrification Scheme (note 5 (c)) (314) (268) 6,149 6,045
(d) Type of interconnected power sources
Analysis of interconnected power purchases by utility source in gigawatt-hours (GWh) is as follows:
2009 2008 GWh GWh Hydro 2,879 3,514Geothermal 1,179 1,020Thermal (Net of exports to Uganda) 2,401 1,770Others 4 9 6,463 6,313Recharged to Rural Electrification Scheme (314) (268) 6,149 6,045
The Company transmits excess units generated by Aggreko Limited to Uganda Electricity Transmission Company Limited (UETCL). Whereas UETCL transmits back its own excess power to the Company at the same charge rate as that billed to them. The two transactions have been effected in the accounts to give net quantity.
Notes to the Financial Statements (continued)for the Year Ended 30 June 2009
6. POWER PURCHASE COSTS
(a) Power purchase costs
The power purchase costs according to source were as follows: 2009 2008 KShs’000 KShs’000 KenGen 12,489,281 11,453,546Aggreko (Net of exports to Uganda) 1,555,639 878,885Uganda Electricity Transmission Company Limited 134,486 90,097Tsavo Power Company Limited 1,944,258 1,619,778Iberafrica Power (E.A.) Company Limited 984,511 836,670OrPower 4 Inc 1,779,370 630,786Mumias Sugar Company Limited 8,961 18,175Tanzania Electric Supply Company Limited 8,289 5,358Deferred power purchase costs 2,607,000 - 21,511,795 15,533,295
Government of Kenya (GoK) subsidy on power purchases from KenGen - (2,891,067)Foreign exchange surcharge (1,830,724) (118,098)Recharged to Rural Electrification Scheme (Note (5(c)) (910,824) (561,124) 18,770,247 11,963,006
Deferred power purchase costs are capacity charges (fixed power purchase costs) allowed in the retail tariff with effect from July 2008, attributable to future generation projects.
KenGen increased their power bulk tariffs from 1 July 2006 which the Company was unable to honour because of conditions that prohibited it from recovering the same from customers.. The Government of Kenya (GoK) agreed to meet the cost arising from this rate differential up to the month of June 2008. The subsidy on power purchases from KenGen represented the difference between what the Company paid for power at the power purchase rate charged by KenGen, and the power purchase rate the Company applied before the rate revision. The Government settled the differential up to the end of April 2008. The balance of KShs, 550,728 relating to months of May and June has been included under other receivables (note 18(d)).
2009 2008 KShs’000 KShs’000
KenGen 8,072,178 3,987,542Aggreko 12,091,489 6,296,523Uganda Electricity Transmission Company Limited 482,954 390,225Tsavo Power Company Limited 4,855,700 3,928,096Iberafrica Power (E.A.) Company Limited 3,992,820 2,617,071Mumias Sugar Company Limited 2,463 6,195 Off grid power stations 225,513 - 29,723,117 17,225,652Recharged to Rural Electrification Scheme (note 5 (c)) (1,375,562) (559,433) 28,347,555 16,666,219
Notes to the Financial Statements (continued)for the Year Ended 30 June 2009
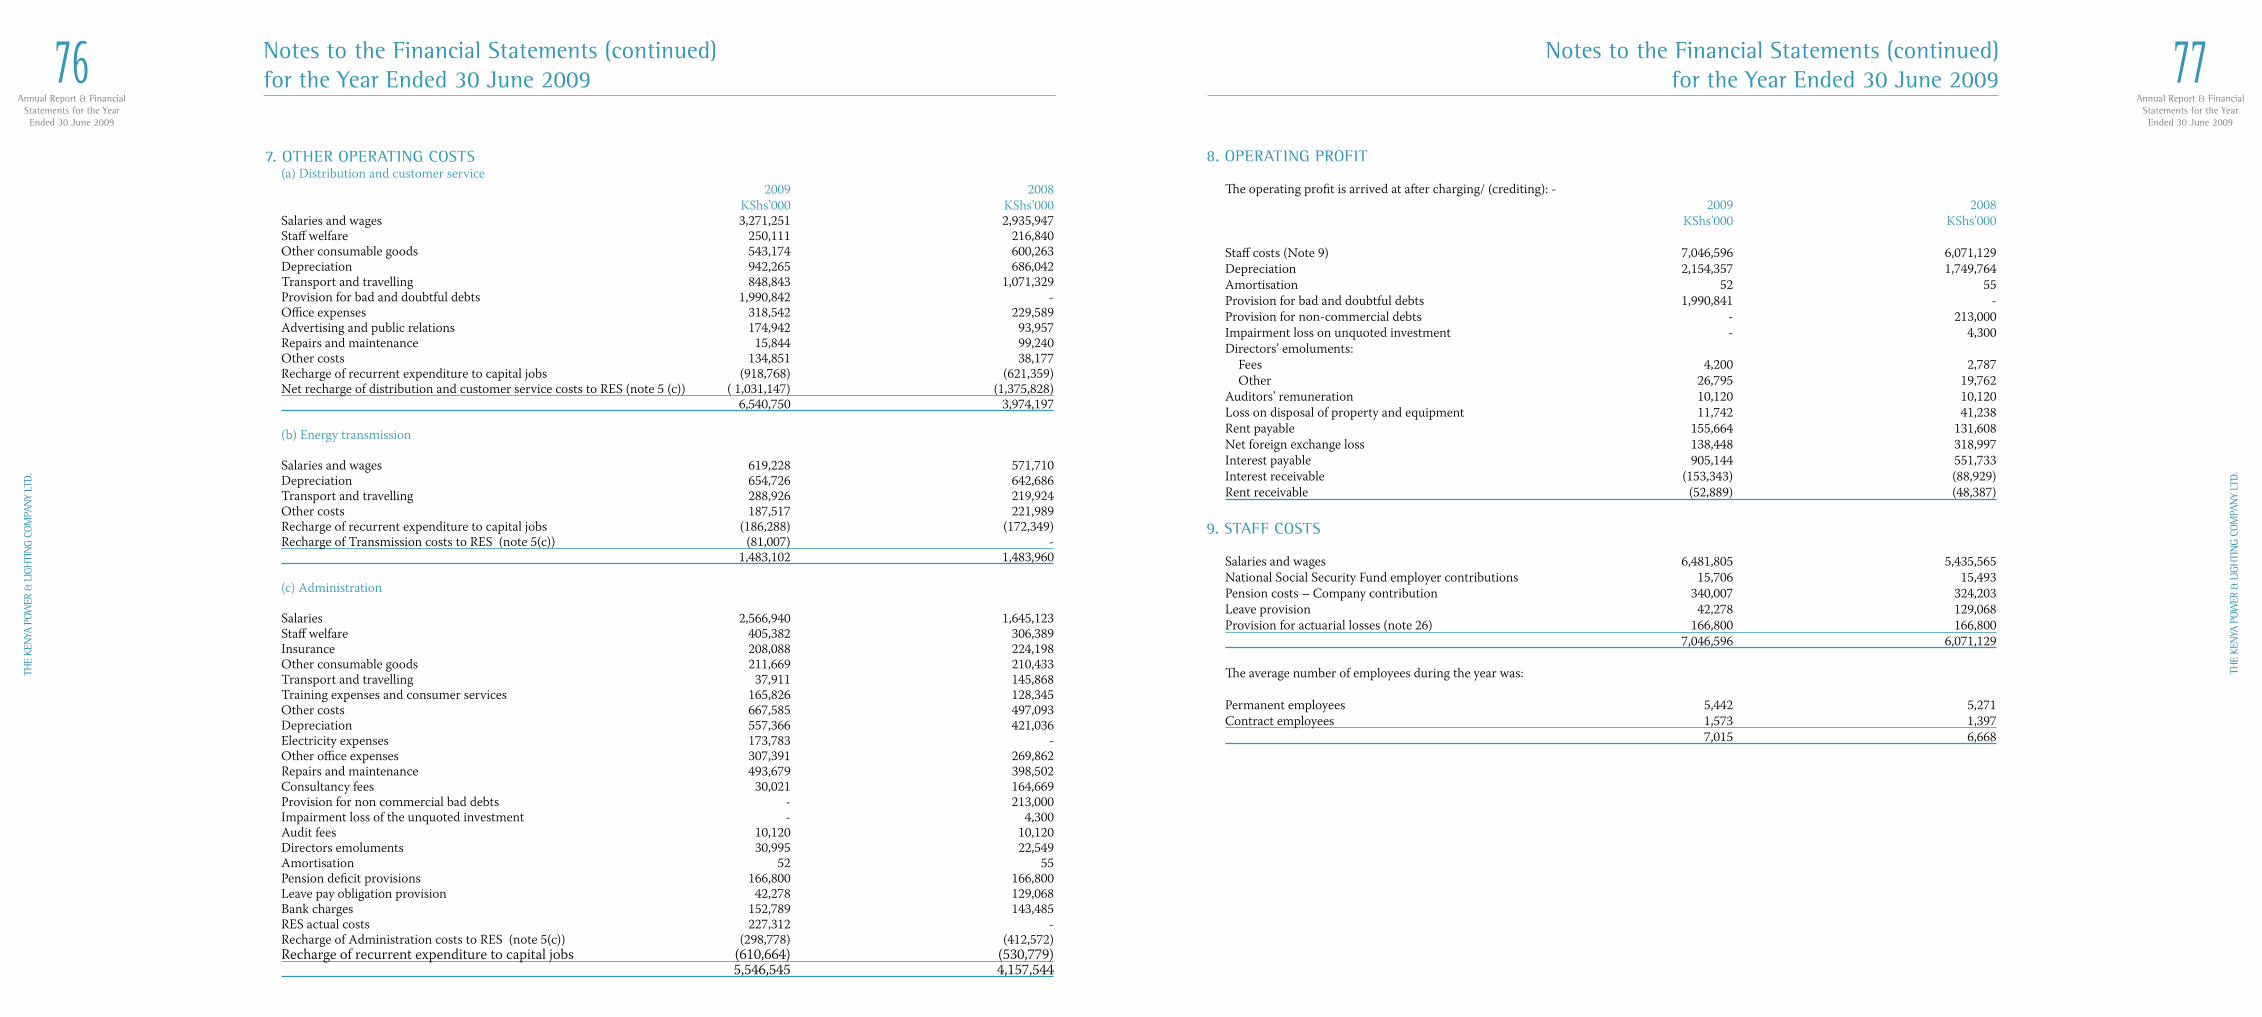
Annual Report & FinancialStatements for the YearEnded 30 June 2009
76TH
E KE
NYA
POW
ER &
LIG
HTI
NG
COM
PAN
Y LT
D.
Annual Report & FinancialStatements for the YearEnded 30 June 2009
77
THE
KEN
YA P
OWER
& L
IGH
TIN
G CO
MPA
NY
LTD.
8. OPERATING PROFIT
The operating profit is arrived at after charging/ (crediting): - 2009 2008 KShs’000 KShs’000 Staff costs (Note 9) 7,046,596 6,071,129Depreciation 2,154,357 1,749,764Amortisation 52 55Provision for bad and doubtful debts 1,990,841 -Provision for non-commercial debts - 213,000Impairment loss on unquoted investment - 4,300Directors’ emoluments: Fees 4,200 2,787 Other 26,795 19,762Auditors’ remuneration 10,120 10,120Loss on disposal of property and equipment 11,742 41,238Rent payable 155,664 131,608Net foreign exchange loss 138,448 318,997Interest payable 905,144 551,733Interest receivable (153,343) (88,929)Rent receivable (52,889) (48,387)
9. STAFF COSTS
Salaries and wages 6,481,805 5,435,565National Social Security Fund employer contributions 15,706 15,493Pension costs – Company contribution 340,007 324,203Leave provision 42,278 129,068Provision for actuarial losses (note 26) 166,800 166,800 7,046,596 6,071,129 The average number of employees during the year was: Permanent employees 5,442 5,271Contract employees 1,573 1,397 7,015 6,668
Notes to the Financial Statements (continued)for the Year Ended 30 June 2009
7. OTHER OPERATING COSTS(a) Distribution and customer service 2009 2008 KShs’000 KShs’000Salaries and wages 3,271,251 2,935,947Staff welfare 250,111 216,840Other consumable goods 543,174 600,263Depreciation 942,265 686,042Transport and travelling 848,843 1,071,329Provision for bad and doubtful debts 1,990,842 -Office expenses 318,542 229,589Advertising and public relations 174,942 93,957Repairs and maintenance 15,844 99,240Other costs 134,851 38,177Recharge of recurrent expenditure to capital jobs (918,768) (621,359)Net recharge of distribution and customer service costs to RES (note 5 (c)) ( 1,031,147) (1,375,828) 6,540,750 3,974,197
(b) Energy transmission
Salaries and wages 619,228 571,710Depreciation 654,726 642,686Transport and travelling 288,926 219,924Other costs 187,517 221,989Recharge of recurrent expenditure to capital jobs (186,288) (172,349)Recharge of Transmission costs to RES (note 5(c)) (81,007) - 1,483,102 1,483,960
(c) Administration
Salaries 2,566,940 1,645,123Staff welfare 405,382 306,389Insurance 208,088 224,198Other consumable goods 211,669 210,433Transport and travelling 37,911 145,868Training expenses and consumer services 165,826 128,345Other costs 667,585 497,093Depreciation 557,366 421,036Electricity expenses 173,783 -Other office expenses 307,391 269,862Repairs and maintenance 493,679 398,502Consultancy fees 30,021 164,669Provision for non commercial bad debts - 213,000Impairment loss of the unquoted investment - 4,300Audit fees 10,120 10,120Directors emoluments 30,995 22,549Amortisation 52 55Pension deficit provisions 166,800 166,800Leave pay obligation provision 42,278 129,068Bank charges 152,789 143,485RES actual costs 227,312 -Recharge of Administration costs to RES (note 5(c)) (298,778) (412,572)Recharge of recurrent expenditure to capital jobs (610,664) (530,779) 5,546,545 4,157,544
Notes to the Financial Statements (continued)for the Year Ended 30 June 2009
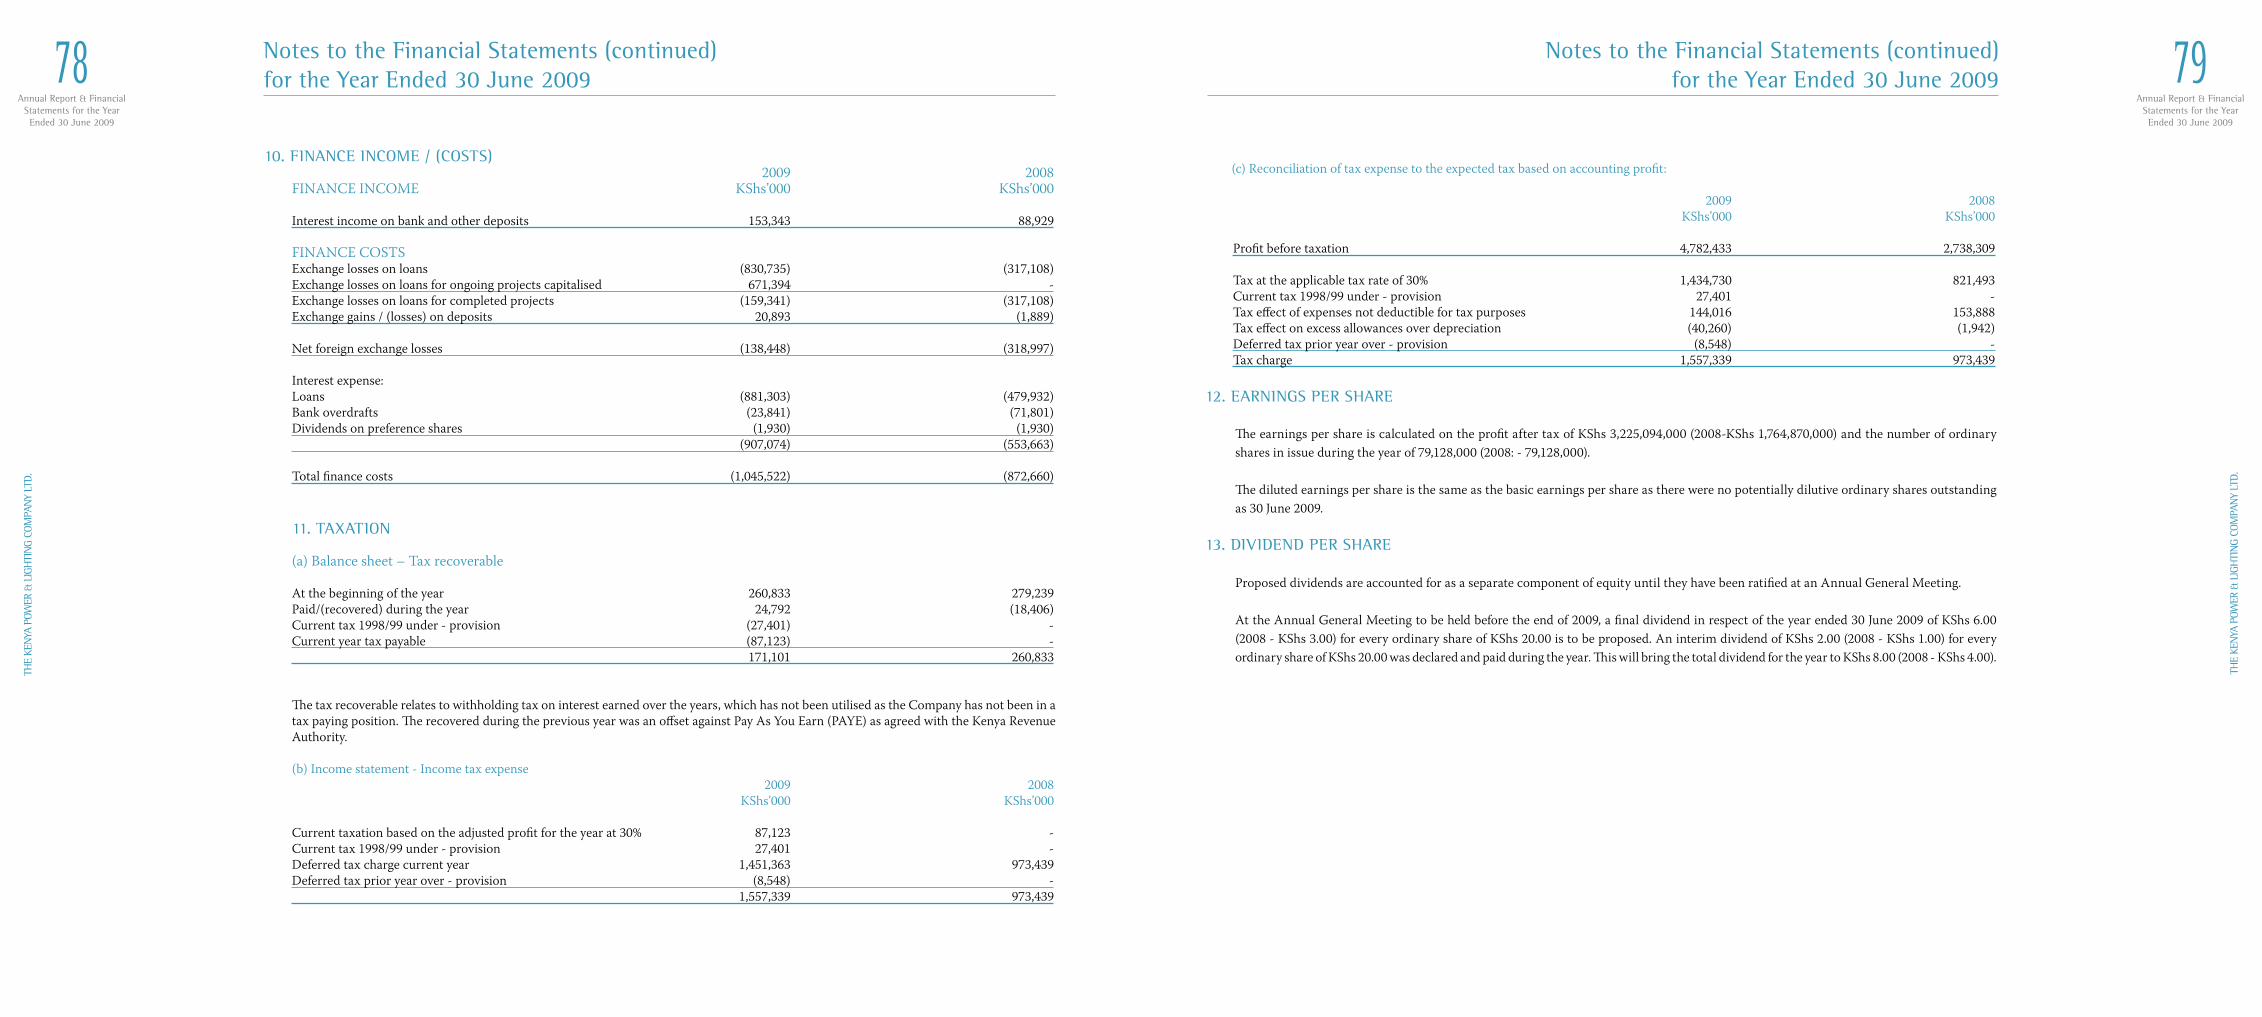
Annual Report & FinancialStatements for the YearEnded 30 June 2009
78TH
E KE
NYA
POW
ER &
LIG
HTI
NG
COM
PAN
Y LT
D.
Annual Report & FinancialStatements for the YearEnded 30 June 2009
79
THE
KEN
YA P
OWER
& L
IGH
TIN
G CO
MPA
NY
LTD.
(c) Reconciliation of tax expense to the expected tax based on accounting profit:
2009 2008 KShs’000 KShs’000
Profit before taxation 4,782,433 2,738,309 Tax at the applicable tax rate of 30% 1,434,730 821,493Current tax 1998/99 under - provision 27,401 -Tax effect of expenses not deductible for tax purposes 144,016 153,888Tax effect on excess allowances over depreciation (40,260) (1,942)Deferred tax prior year over - provision (8,548) -Tax charge 1,557,339 973,439
12. EARNINGS PER SHARE
The earnings per share is calculated on the profit after tax of KShs 3,225,094,000 (2008-KShs 1,764,870,000) and the number of ordinary shares in issue during the year of 79,128,000 (2008: - 79,128,000).
The diluted earnings per share is the same as the basic earnings per share as there were no potentially dilutive ordinary shares outstanding as 30 June 2009.
13. DIVIDEND PER SHARE
Proposed dividends are accounted for as a separate component of equity until they have been ratified at an Annual General Meeting.
At the Annual General Meeting to be held before the end of 2009, a final dividend in respect of the year ended 30 June 2009 of KShs 6.00 (2008 - KShs 3.00) for every ordinary share of KShs 20.00 is to be proposed. An interim dividend of KShs 2.00 (2008 - KShs 1.00) for every ordinary share of KShs 20.00 was declared and paid during the year. This will bring the total dividend for the year to KShs 8.00 (2008 - KShs 4.00).
Notes to the Financial Statements (continued)for the Year Ended 30 June 2009
10. FINANCE INCOME / (COSTS) 2009 2008
FINANCE INCOME KShs’000 KShs’000
Interest income on bank and other deposits 153,343 88,929
FINANCE COSTS Exchange losses on loans (830,735) (317,108)Exchange losses on loans for ongoing projects capitalised 671,394 -Exchange losses on loans for completed projects (159,341) (317,108)Exchange gains / (losses) on deposits 20,893 (1,889) Net foreign exchange losses (138,448) (318,997) Interest expense: Loans (881,303) (479,932)Bank overdrafts (23,841) (71,801)Dividends on preference shares (1,930) (1,930) (907,074) (553,663)
Total finance costs (1,045,522) (872,660)
11. TAXATION
(a) Balance sheet – Tax recoverable At the beginning of the year 260,833 279,239Paid/(recovered) during the year 24,792 (18,406)Current tax 1998/99 under - provision (27,401) -Current year tax payable (87,123) - 171,101 260,833
The tax recoverable relates to withholding tax on interest earned over the years, which has not been utilised as the Company has not been in a tax paying position. The recovered during the previous year was an offset against Pay As You Earn (PAYE) as agreed with the Kenya Revenue Authority.
(b) Income statement - Income tax expense 2009 2008 KShs’000 KShs’000
Current taxation based on the adjusted profit for the year at 30% 87,123 -Current tax 1998/99 under - provision 27,401 -Deferred tax charge current year 1,451,363 973,439Deferred tax prior year over - provision (8,548) - 1,557,339 973,439
Notes to the Financial Statements (continued)for the Year Ended 30 June 2009
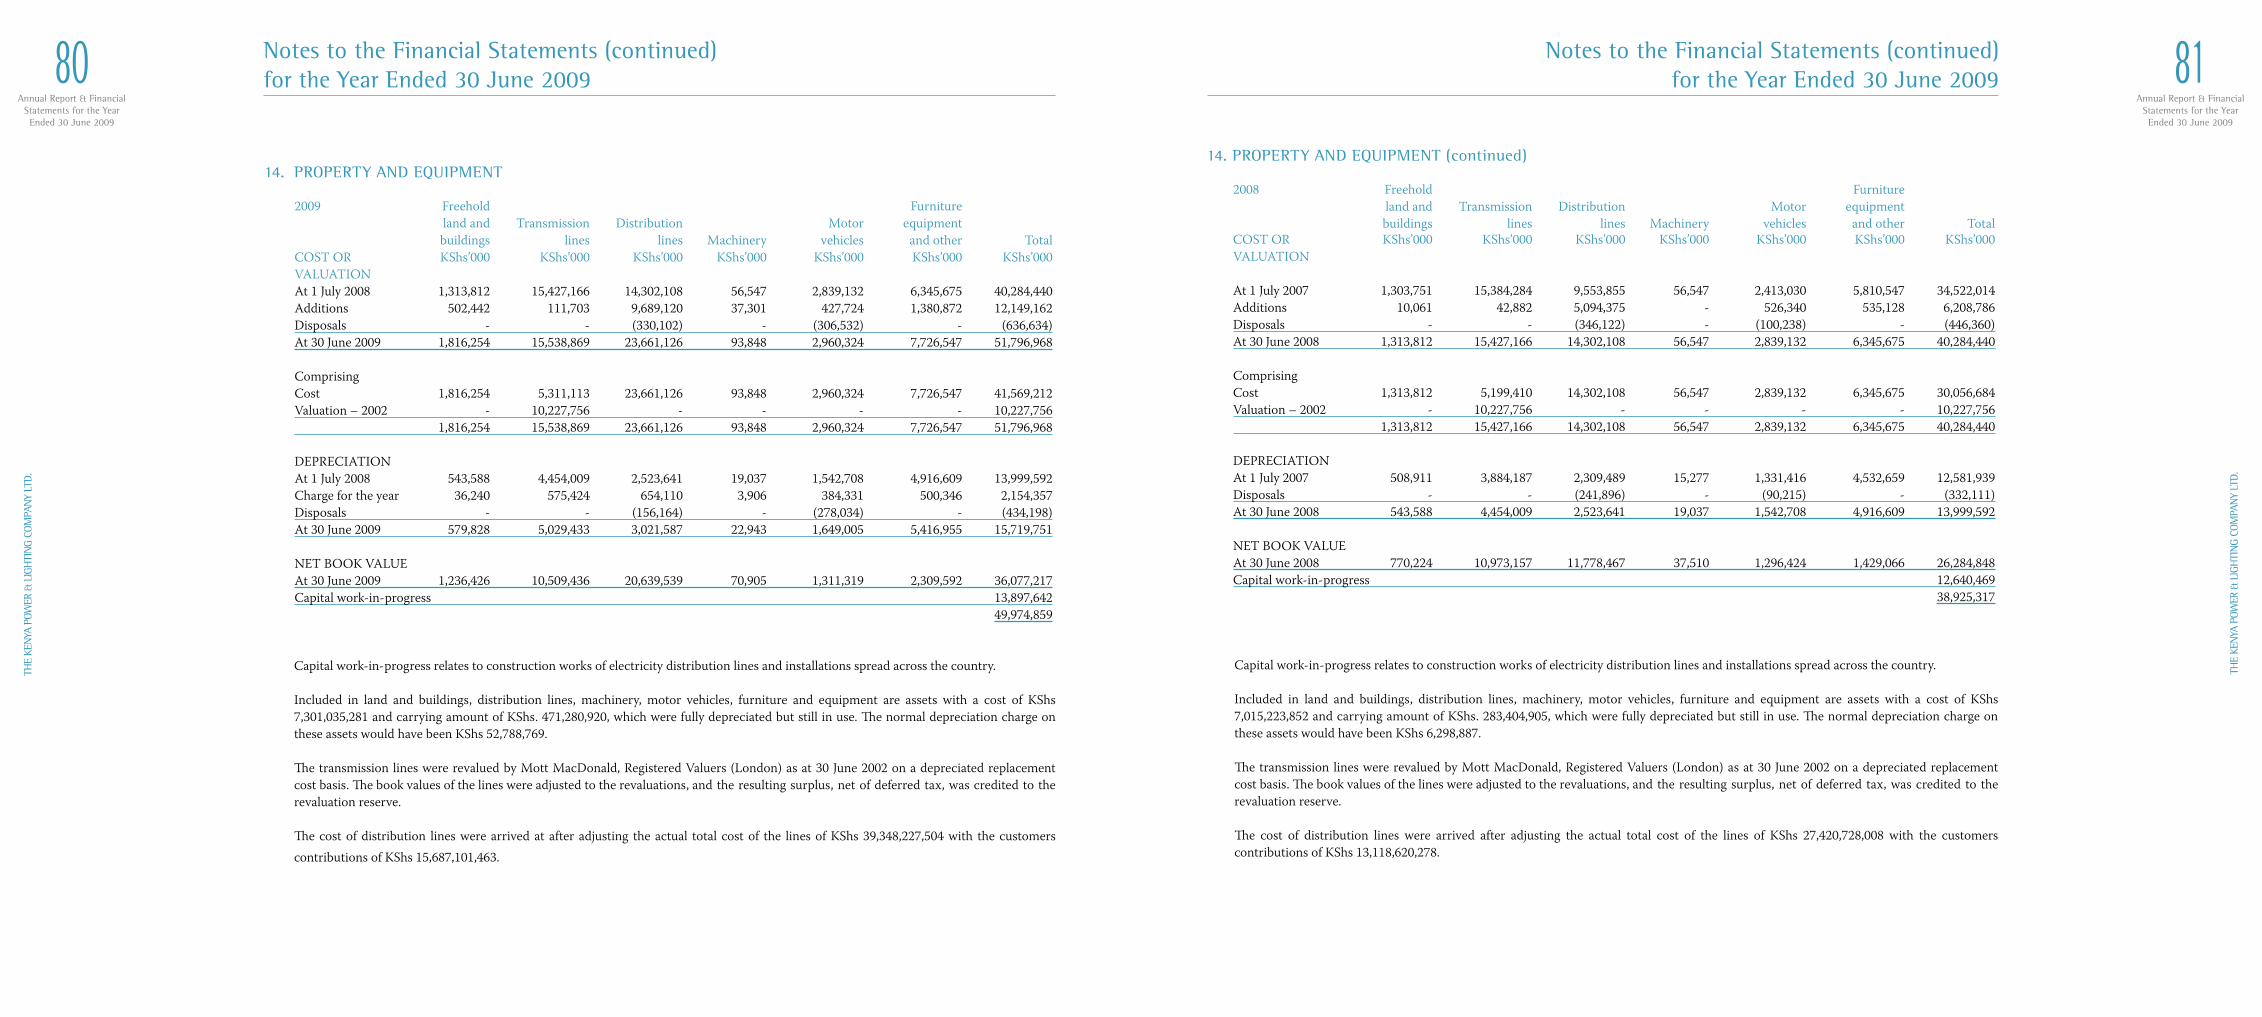
Annual Report & FinancialStatements for the YearEnded 30 June 2009
80TH
E KE
NYA
POW
ER &
LIG
HTI
NG
COM
PAN
Y LT
D.
Annual Report & FinancialStatements for the YearEnded 30 June 2009
81
THE
KEN
YA P
OWER
& L
IGH
TIN
G CO
MPA
NY
LTD.
14. PROPERTY AND EQUIPMENT (continued)
2008 Freehold Furniture land and Transmission Distribution Motor equipment buildings lines lines Machinery vehicles and other Total COST OR KShs’000 KShs’000 KShs’000 KShs’000 KShs’000 KShs’000 KShs’000 VALUATION
At 1 July 2007 1,303,751 15,384,284 9,553,855 56,547 2,413,030 5,810,547 34,522,014 Additions 10,061 42,882 5,094,375 - 526,340 535,128 6,208,786 Disposals - - (346,122) - (100,238) - (446,360) At 30 June 2008 1,313,812 15,427,166 14,302,108 56,547 2,839,132 6,345,675 40,284,440
Comprising Cost 1,313,812 5,199,410 14,302,108 56,547 2,839,132 6,345,675 30,056,684 Valuation – 2002 - 10,227,756 - - - - 10,227,756 1,313,812 15,427,166 14,302,108 56,547 2,839,132 6,345,675 40,284,440
DEPRECIATION At 1 July 2007 508,911 3,884,187 2,309,489 15,277 1,331,416 4,532,659 12,581,939 Disposals - - (241,896) - (90,215) - (332,111) At 30 June 2008 543,588 4,454,009 2,523,641 19,037 1,542,708 4,916,609 13,999,592 NET BOOK VALUE At 30 June 2008 770,224 10,973,157 11,778,467 37,510 1,296,424 1,429,066 26,284,848 Capital work-in-progress 12,640,469 38,925,317
Capital work-in-progress relates to construction works of electricity distribution lines and installations spread across the country.
Included in land and buildings, distribution lines, machinery, motor vehicles, furniture and equipment are assets with a cost of KShs 7,015,223,852 and carrying amount of KShs. 283,404,905, which were fully depreciated but still in use. The normal depreciation charge on these assets would have been KShs 6,298,887.
The transmission lines were revalued by Mott MacDonald, Registered Valuers (London) as at 30 June 2002 on a depreciated replacement cost basis. The book values of the lines were adjusted to the revaluations, and the resulting surplus, net of deferred tax, was credited to the revaluation reserve.
The cost of distribution lines were arrived after adjusting the actual total cost of the lines of KShs 27,420,728,008 with the customers contributions of KShs 13,118,620,278.
Notes to the Financial Statements (continued)for the Year Ended 30 June 2009
14. PROPERTY AND EQUIPMENT
2009 Freehold Furniture land and Transmission Distribution Motor equipment buildings lines lines Machinery vehicles and other Total COST OR KShs’000 KShs’000 KShs’000 KShs’000 KShs’000 KShs’000 KShs’000 VALUATION At 1 July 2008 1,313,812 15,427,166 14,302,108 56,547 2,839,132 6,345,675 40,284,440 Additions 502,442 111,703 9,689,120 37,301 427,724 1,380,872 12,149,162 Disposals - - (330,102) - (306,532) - (636,634) At 30 June 2009 1,816,254 15,538,869 23,661,126 93,848 2,960,324 7,726,547 51,796,968
Comprising Cost 1,816,254 5,311,113 23,661,126 93,848 2,960,324 7,726,547 41,569,212 Valuation – 2002 - 10,227,756 - - - - 10,227,756 1,816,254 15,538,869 23,661,126 93,848 2,960,324 7,726,547 51,796,968
DEPRECIATION At 1 July 2008 543,588 4,454,009 2,523,641 19,037 1,542,708 4,916,609 13,999,592 Charge for the year 36,240 575,424 654,110 3,906 384,331 500,346 2,154,357 Disposals - - (156,164) - (278,034) - (434,198) At 30 June 2009 579,828 5,029,433 3,021,587 22,943 1,649,005 5,416,955 15,719,751 NET BOOK VALUE At 30 June 2009 1,236,426 10,509,436 20,639,539 70,905 1,311,319 2,309,592 36,077,217 Capital work-in-progress 13,897,642 49,974,859
Capital work-in-progress relates to construction works of electricity distribution lines and installations spread across the country.
Included in land and buildings, distribution lines, machinery, motor vehicles, furniture and equipment are assets with a cost of KShs 7,301,035,281 and carrying amount of KShs. 471,280,920, which were fully depreciated but still in use. The normal depreciation charge on these assets would have been KShs 52,788,769.
The transmission lines were revalued by Mott MacDonald, Registered Valuers (London) as at 30 June 2002 on a depreciated replacement cost basis. The book values of the lines were adjusted to the revaluations, and the resulting surplus, net of deferred tax, was credited to the revaluation reserve.
The cost of distribution lines were arrived at after adjusting the actual total cost of the lines of KShs 39,348,227,504 with the customers contributions of KShs 15,687,101,463.
Notes to the Financial Statements (continued)for the Year Ended 30 June 2009
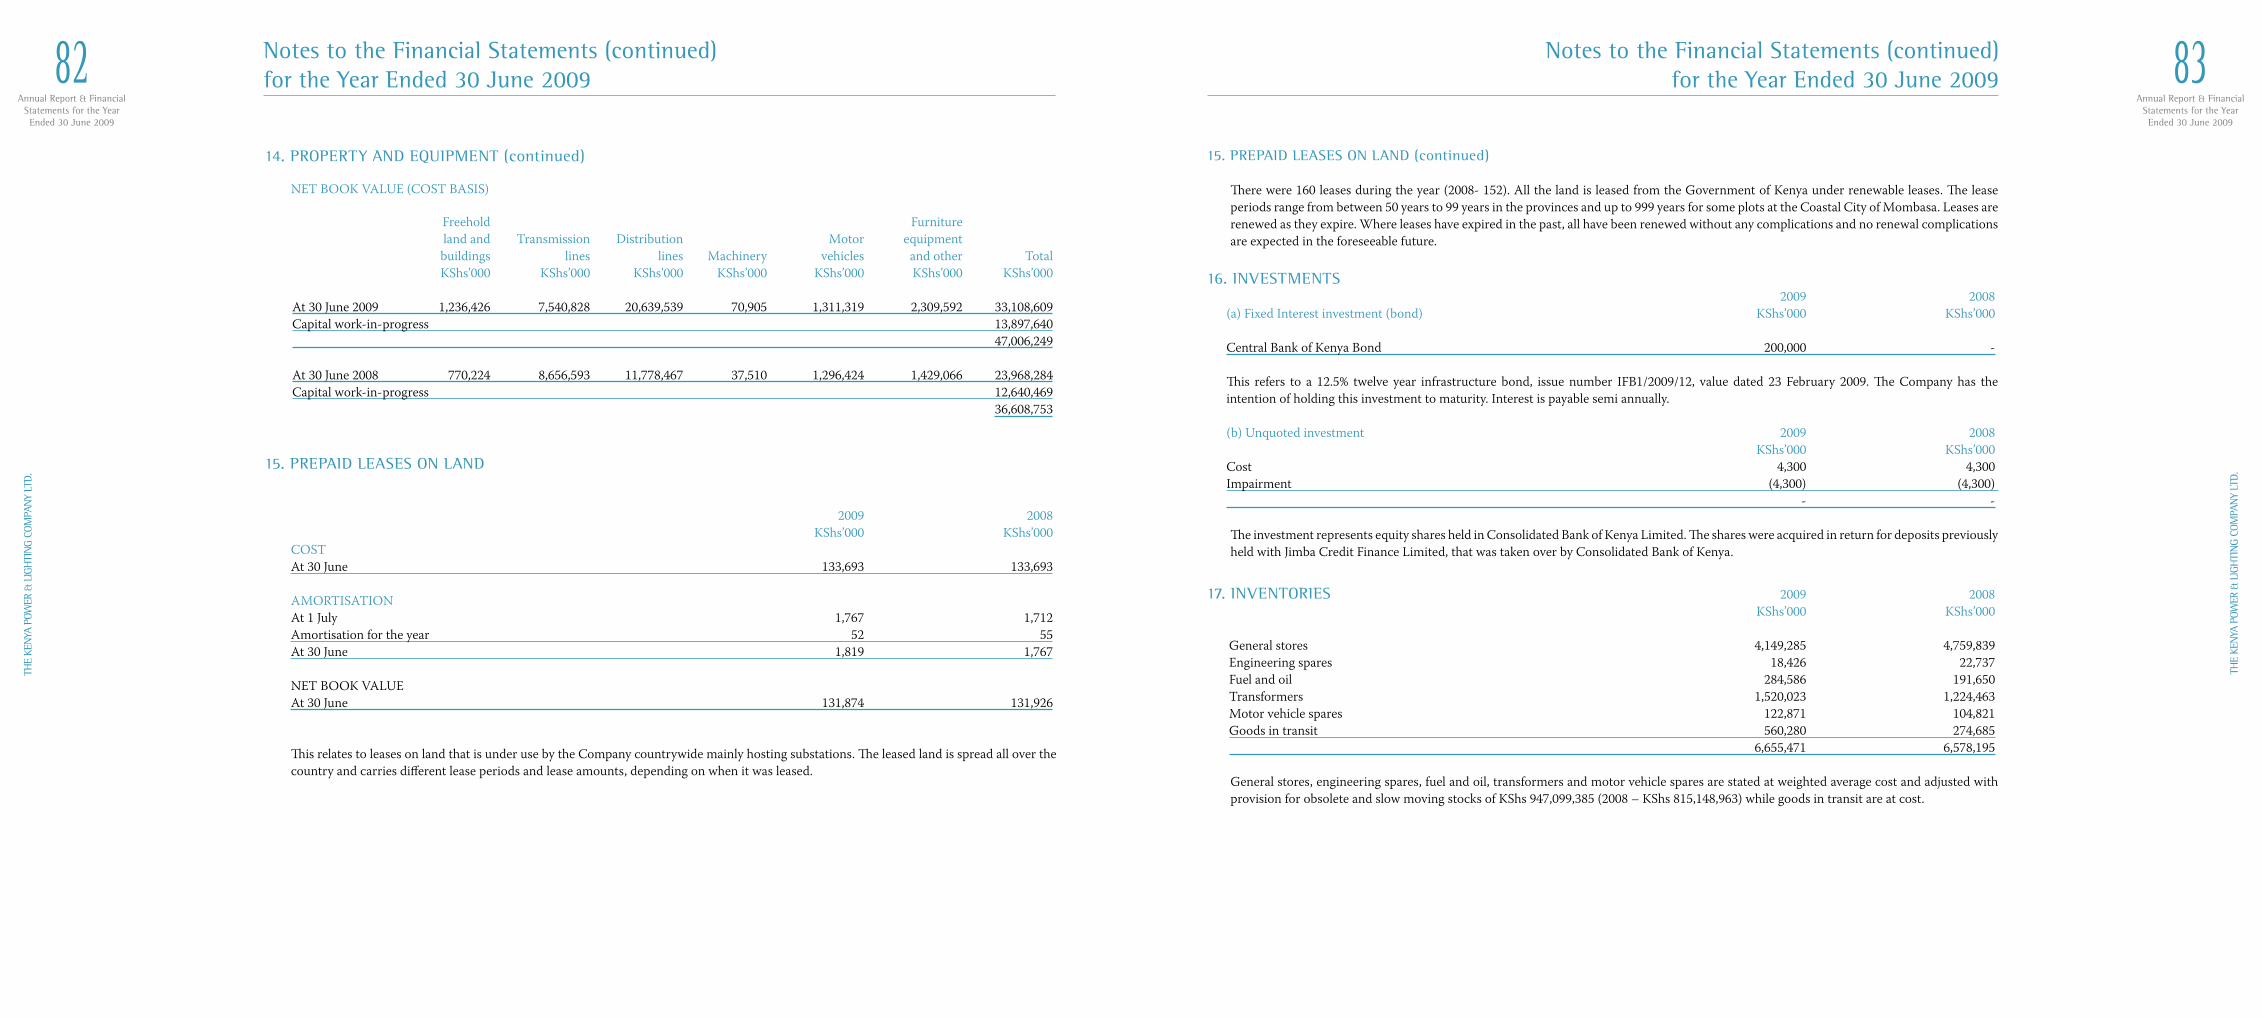
Annual Report & FinancialStatements for the YearEnded 30 June 2009
82TH
E KE
NYA
POW
ER &
LIG
HTI
NG
COM
PAN
Y LT
D.
Annual Report & FinancialStatements for the YearEnded 30 June 2009
83
THE
KEN
YA P
OWER
& L
IGH
TIN
G CO
MPA
NY
LTD.
15. PREPAID LEASES ON LAND (continued)
There were 160 leases during the year (2008- 152). All the land is leased from the Government of Kenya under renewable leases. The lease periods range from between 50 years to 99 years in the provinces and up to 999 years for some plots at the Coastal City of Mombasa. Leases are renewed as they expire. Where leases have expired in the past, all have been renewed without any complications and no renewal complications are expected in the foreseeable future.
16. INVESTMENTS 2009 2008 (a) Fixed Interest investment (bond) KShs’000 KShs’000 Central Bank of Kenya Bond 200,000 -
This refers to a 12.5% twelve year infrastructure bond, issue number IFB1/2009/12, value dated 23 February 2009. The Company has the intention of holding this investment to maturity. Interest is payable semi annually.
(b) Unquoted investment 2009 2008 KShs’000 KShs’000 Cost 4,300 4,300 Impairment (4,300) (4,300) - -
The investment represents equity shares held in Consolidated Bank of Kenya Limited. The shares were acquired in return for deposits previously held with Jimba Credit Finance Limited, that was taken over by Consolidated Bank of Kenya.
17. INVENTORIES 2009 2008 KShs’000 KShs’000
General stores 4,149,285 4,759,839 Engineering spares 18,426 22,737 Fuel and oil 284,586 191,650 Transformers 1,520,023 1,224,463 Motor vehicle spares 122,871 104,821 Goods in transit 560,280 274,685 6,655,471 6,578,195
General stores, engineering spares, fuel and oil, transformers and motor vehicle spares are stated at weighted average cost and adjusted with provision for obsolete and slow moving stocks of KShs 947,099,385 (2008 – KShs 815,148,963) while goods in transit are at cost.
Notes to the Financial Statements (continued)for the Year Ended 30 June 2009
14. PROPERTY AND EQUIPMENT (continued)
NET BOOK VALUE (COST BASIS) Freehold Furniture land and Transmission Distribution Motor equipment buildings lines lines Machinery vehicles and other Total KShs’000 KShs’000 KShs’000 KShs’000 KShs’000 KShs’000 KShs’000
At 30 June 2009 1,236,426 7,540,828 20,639,539 70,905 1,311,319 2,309,592 33,108,609 Capital work-in-progress 13,897,640 47,006,249 At 30 June 2008 770,224 8,656,593 11,778,467 37,510 1,296,424 1,429,066 23,968,284 Capital work-in-progress 12,640,469 36,608,753
15. PREPAID LEASES ON LAND
2009 2008 KShs’000 KShs’000 COST At 30 June 133,693 133,693
AMORTISATION At 1 July 1,767 1,712 Amortisation for the year 52 55 At 30 June 1,819 1,767
NET BOOK VALUE At 30 June 131,874 131,926
This relates to leases on land that is under use by the Company countrywide mainly hosting substations. The leased land is spread all over the country and carries different lease periods and lease amounts, depending on when it was leased.
Notes to the Financial Statements (continued)for the Year Ended 30 June 2009
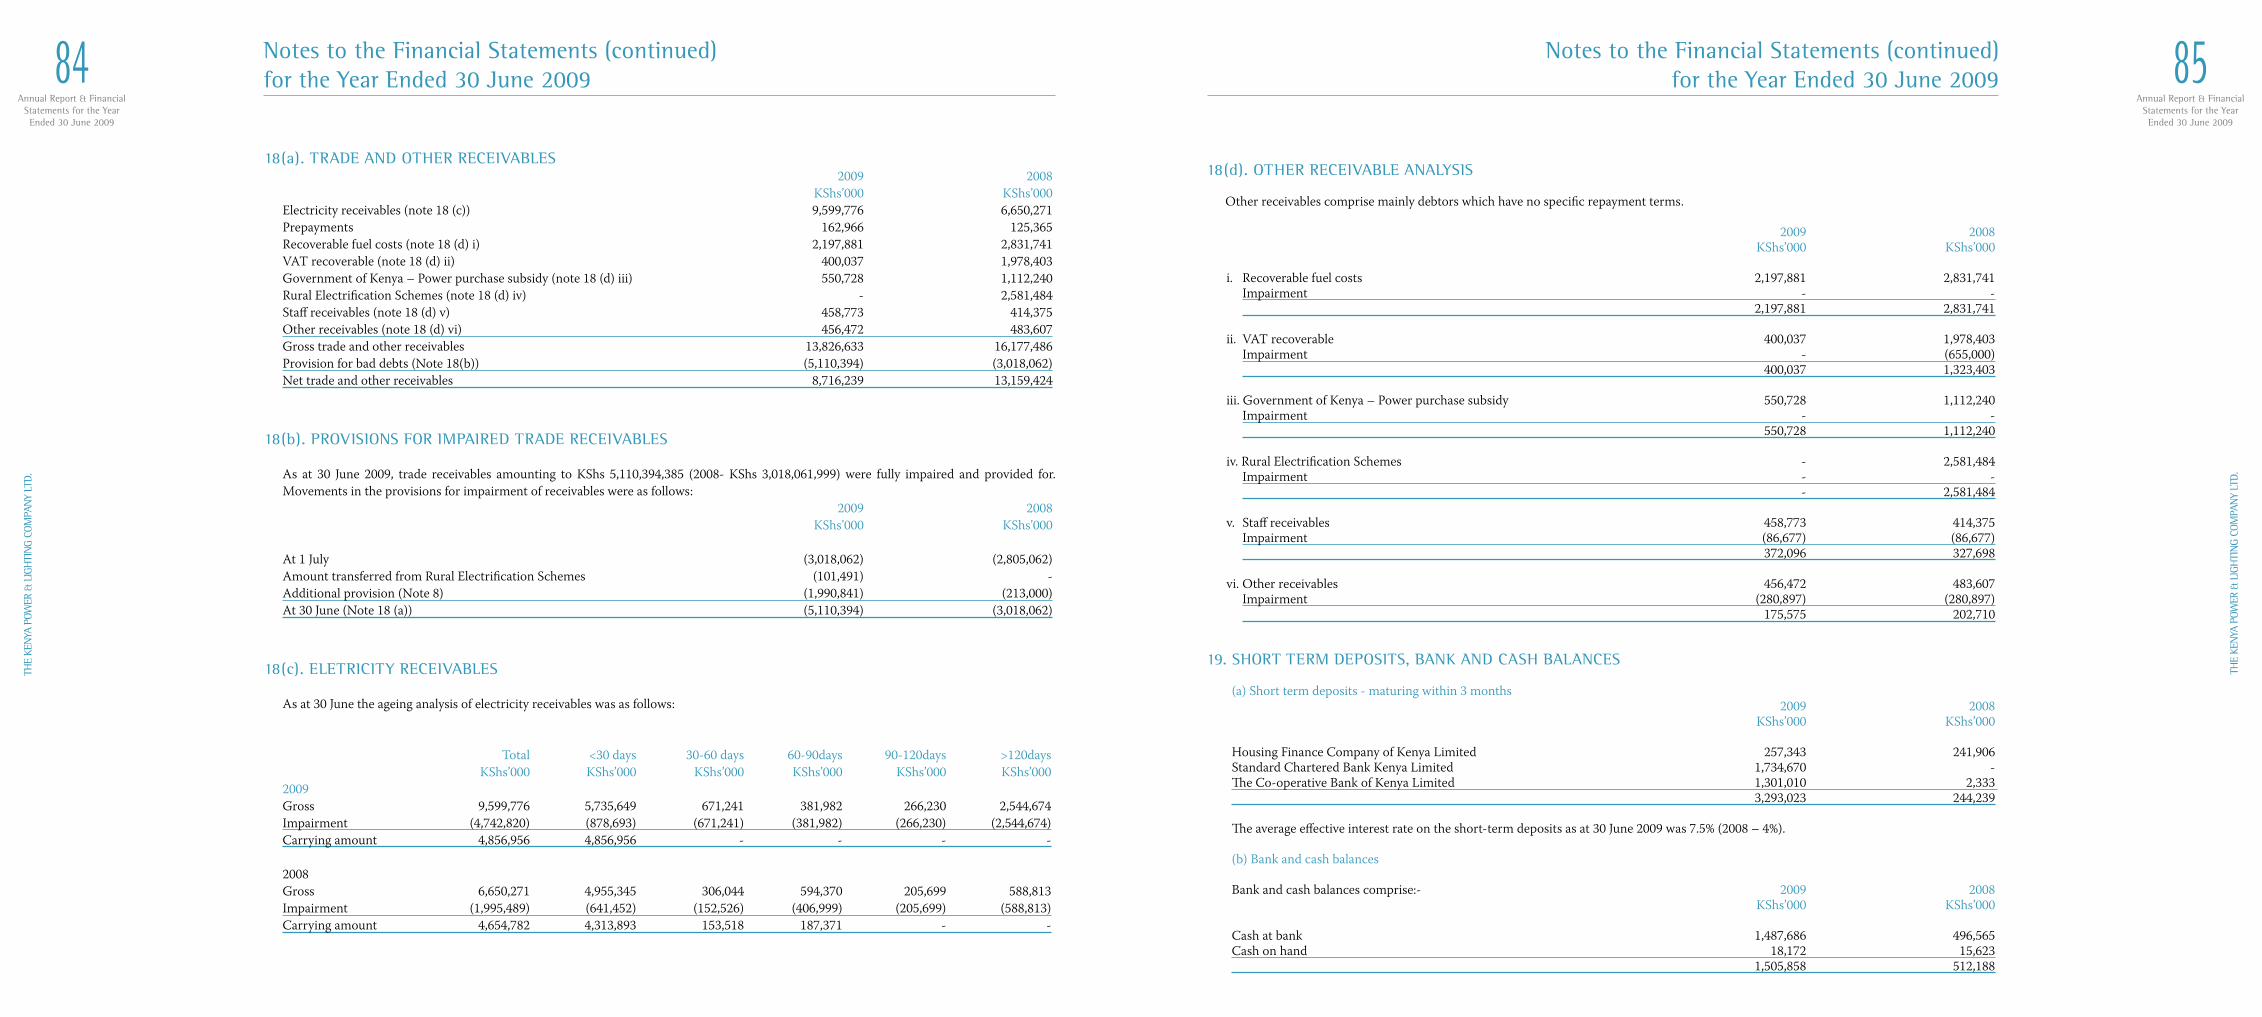
Annual Report & FinancialStatements for the YearEnded 30 June 2009
84TH
E KE
NYA
POW
ER &
LIG
HTI
NG
COM
PAN
Y LT
D.
Annual Report & FinancialStatements for the YearEnded 30 June 2009
85
THE
KEN
YA P
OWER
& L
IGH
TIN
G CO
MPA
NY
LTD.
18(d). OTHER RECEIVABLE ANALYSIS Other receivables comprise mainly debtors which have no specific repayment terms.
2009 2008 KShs’000 KShs’000
i. Recoverable fuel costs 2,197,881 2,831,741 Impairment - - 2,197,881 2,831,741
ii. VAT recoverable 400,037 1,978,403 Impairment - (655,000) 400,037 1,323,403
iii. Government of Kenya – Power purchase subsidy 550,728 1,112,240 Impairment - - 550,728 1,112,240
iv. Rural Electrification Schemes - 2,581,484 Impairment - - - 2,581,484
v. Staff receivables 458,773 414,375 Impairment (86,677) (86,677) 372,096 327,698
vi. Other receivables 456,472 483,607 Impairment (280,897) (280,897) 175,575 202,710
19. SHORT TERM DEPOSITS, BANK AND CASH BALANCES (a) Short term deposits - maturing within 3 months 2009 2008 KShs’000 KShs’000 Housing Finance Company of Kenya Limited 257,343 241,906 Standard Chartered Bank Kenya Limited 1,734,670 - The Co-operative Bank of Kenya Limited 1,301,010 2,333 3,293,023 244,239
The average effective interest rate on the short-term deposits as at 30 June 2009 was 7.5% (2008 – 4%).
(b) Bank and cash balances
Bank and cash balances comprise:- 2009 2008 KShs’000 KShs’000
Cash at bank 1,487,686 496,565 Cash on hand 18,172 15,623 1,505,858 512,188
Notes to the Financial Statements (continued)for the Year Ended 30 June 2009
18(a). TRADE AND OTHER RECEIVABLES 2009 2008
KShs’000 KShs’000 Electricity receivables (note 18 (c)) 9,599,776 6,650,271 Prepayments 162,966 125,365 Recoverable fuel costs (note 18 (d) i) 2,197,881 2,831,741 VAT recoverable (note 18 (d) ii) 400,037 1,978,403 Government of Kenya – Power purchase subsidy (note 18 (d) iii) 550,728 1,112,240 Rural Electrification Schemes (note 18 (d) iv) - 2,581,484 Staff receivables (note 18 (d) v) 458,773 414,375 Other receivables (note 18 (d) vi) 456,472 483,607 Gross trade and other receivables 13,826,633 16,177,486 Provision for bad debts (Note 18(b)) (5,110,394) (3,018,062) Net trade and other receivables 8,716,239 13,159,424
18(b). PROVISIONS FOR IMPAIRED TRADE RECEIVABLES
As at 30 June 2009, trade receivables amounting to KShs 5,110,394,385 (2008- KShs 3,018,061,999) were fully impaired and provided for. Movements in the provisions for impairment of receivables were as follows: 2009 2008 KShs’000 KShs’000 At 1 July (3,018,062) (2,805,062)Amount transferred from Rural Electrification Schemes (101,491) -Additional provision (Note 8) (1,990,841) (213,000)At 30 June (Note 18 (a)) (5,110,394) (3,018,062)
18(c). ELETRICITY RECEIVABLES
As at 30 June the ageing analysis of electricity receivables was as follows:
Total <30 days 30-60 days 60-90days 90-120days >120days KShs’000 KShs’000 KShs’000 KShs’000 KShs’000 KShs’0002009 Gross 9,599,776 5,735,649 671,241 381,982 266,230 2,544,674Impairment (4,742,820) (878,693) (671,241) (381,982) (266,230) (2,544,674)Carrying amount 4,856,956 4,856,956 - - - - 2008 Gross 6,650,271 4,955,345 306,044 594,370 205,699 588,813Impairment (1,995,489) (641,452) (152,526) (406,999) (205,699) (588,813)Carrying amount 4,654,782 4,313,893 153,518 187,371 - -
Notes to the Financial Statements (continued)for the Year Ended 30 June 2009
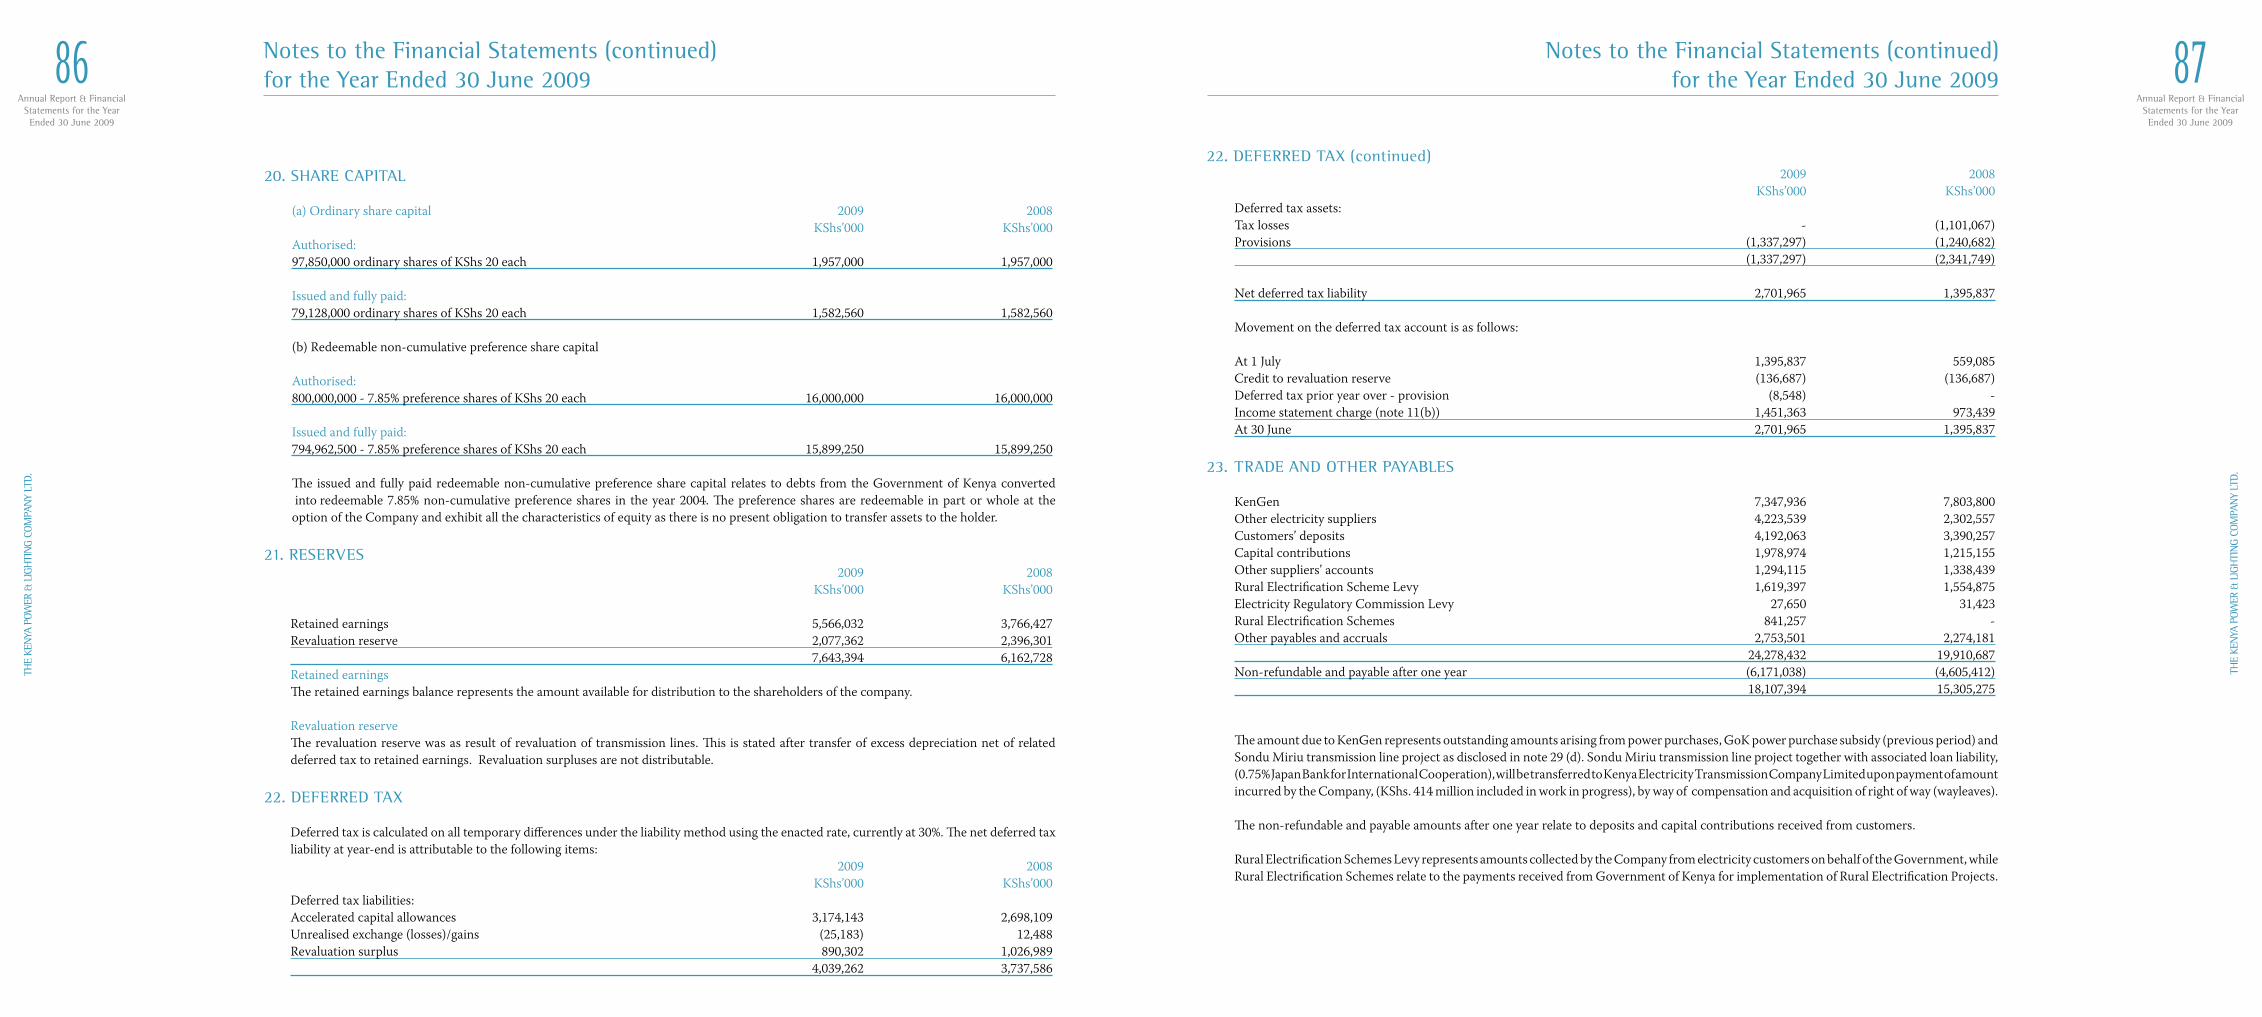
Annual Report & FinancialStatements for the YearEnded 30 June 2009
86TH
E KE
NYA
POW
ER &
LIG
HTI
NG
COM
PAN
Y LT
D.
Annual Report & FinancialStatements for the YearEnded 30 June 2009
87
THE
KEN
YA P
OWER
& L
IGH
TIN
G CO
MPA
NY
LTD.
22. DEFERRED TAX (continued) 2009 2008 KShs’000 KShs’000 Deferred tax assets: Tax losses - (1,101,067) Provisions (1,337,297) (1,240,682) (1,337,297) (2,341,749)
Net deferred tax liability 2,701,965 1,395,837
Movement on the deferred tax account is as follows:
At 1 July 1,395,837 559,085 Credit to revaluation reserve (136,687) (136,687) Deferred tax prior year over - provision (8,548) - Income statement charge (note 11(b)) 1,451,363 973,439 At 30 June 2,701,965 1,395,837
23. TRADE AND OTHER PAYABLES
KenGen 7,347,936 7,803,800 Other electricity suppliers 4,223,539 2,302,557 Customers’ deposits 4,192,063 3,390,257 Capital contributions 1,978,974 1,215,155 Other suppliers’ accounts 1,294,115 1,338,439 Rural Electrification Scheme Levy 1,619,397 1,554,875 Electricity Regulatory Commission Levy 27,650 31,423 Rural Electrification Schemes 841,257 - Other payables and accruals 2,753,501 2,274,181 24,278,432 19,910,687 Non-refundable and payable after one year (6,171,038) (4,605,412) 18,107,394 15,305,275
The amount due to KenGen represents outstanding amounts arising from power purchases, GoK power purchase subsidy (previous period) and Sondu Miriu transmission line project as disclosed in note 29 (d). Sondu Miriu transmission line project together with associated loan liability, (0.75% Japan Bank for International Cooperation), will be transferred to Kenya Electricity Transmission Company Limited upon payment of amount incurred by the Company, (KShs. 414 million included in work in progress), by way of compensation and acquisition of right of way (wayleaves). The non-refundable and payable amounts after one year relate to deposits and capital contributions received from customers.
Rural Electrification Schemes Levy represents amounts collected by the Company from electricity customers on behalf of the Government, while Rural Electrification Schemes relate to the payments received from Government of Kenya for implementation of Rural Electrification Projects.
Notes to the Financial Statements (continued)for the Year Ended 30 June 2009
20. SHARE CAPITAL
(a) Ordinary share capital 2009 2008 KShs’000 KShs’000 Authorised: 97,850,000 ordinary shares of KShs 20 each 1,957,000 1,957,000
Issued and fully paid: 79,128,000 ordinary shares of KShs 20 each 1,582,560 1,582,560 (b) Redeemable non-cumulative preference share capital
Authorised: 800,000,000 - 7.85% preference shares of KShs 20 each 16,000,000 16,000,000 Issued and fully paid: 794,962,500 - 7.85% preference shares of KShs 20 each 15,899,250 15,899,250
The issued and fully paid redeemable non-cumulative preference share capital relates to debts from the Government of Kenya converted into redeemable 7.85% non-cumulative preference shares in the year 2004. The preference shares are redeemable in part or whole at the option of the Company and exhibit all the characteristics of equity as there is no present obligation to transfer assets to the holder.
21. RESERVES 2009 2008 KShs’000 KShs’000
Retained earnings 5,566,032 3,766,427 Revaluation reserve 2,077,362 2,396,301 7,643,394 6,162,728 Retained earnings The retained earnings balance represents the amount available for distribution to the shareholders of the company.
Revaluation reserve The revaluation reserve was as result of revaluation of transmission lines. This is stated after transfer of excess depreciation net of related deferred tax to retained earnings. Revaluation surpluses are not distributable.
22. DEFERRED TAX
Deferred tax is calculated on all temporary differences under the liability method using the enacted rate, currently at 30%. The net deferred tax liability at year-end is attributable to the following items: 2009 2008 KShs’000 KShs’000 Deferred tax liabilities: Accelerated capital allowances 3,174,143 2,698,109 Unrealised exchange (losses)/gains (25,183) 12,488 Revaluation surplus 890,302 1,026,989 4,039,262 3,737,586
Notes to the Financial Statements (continued)for the Year Ended 30 June 2009
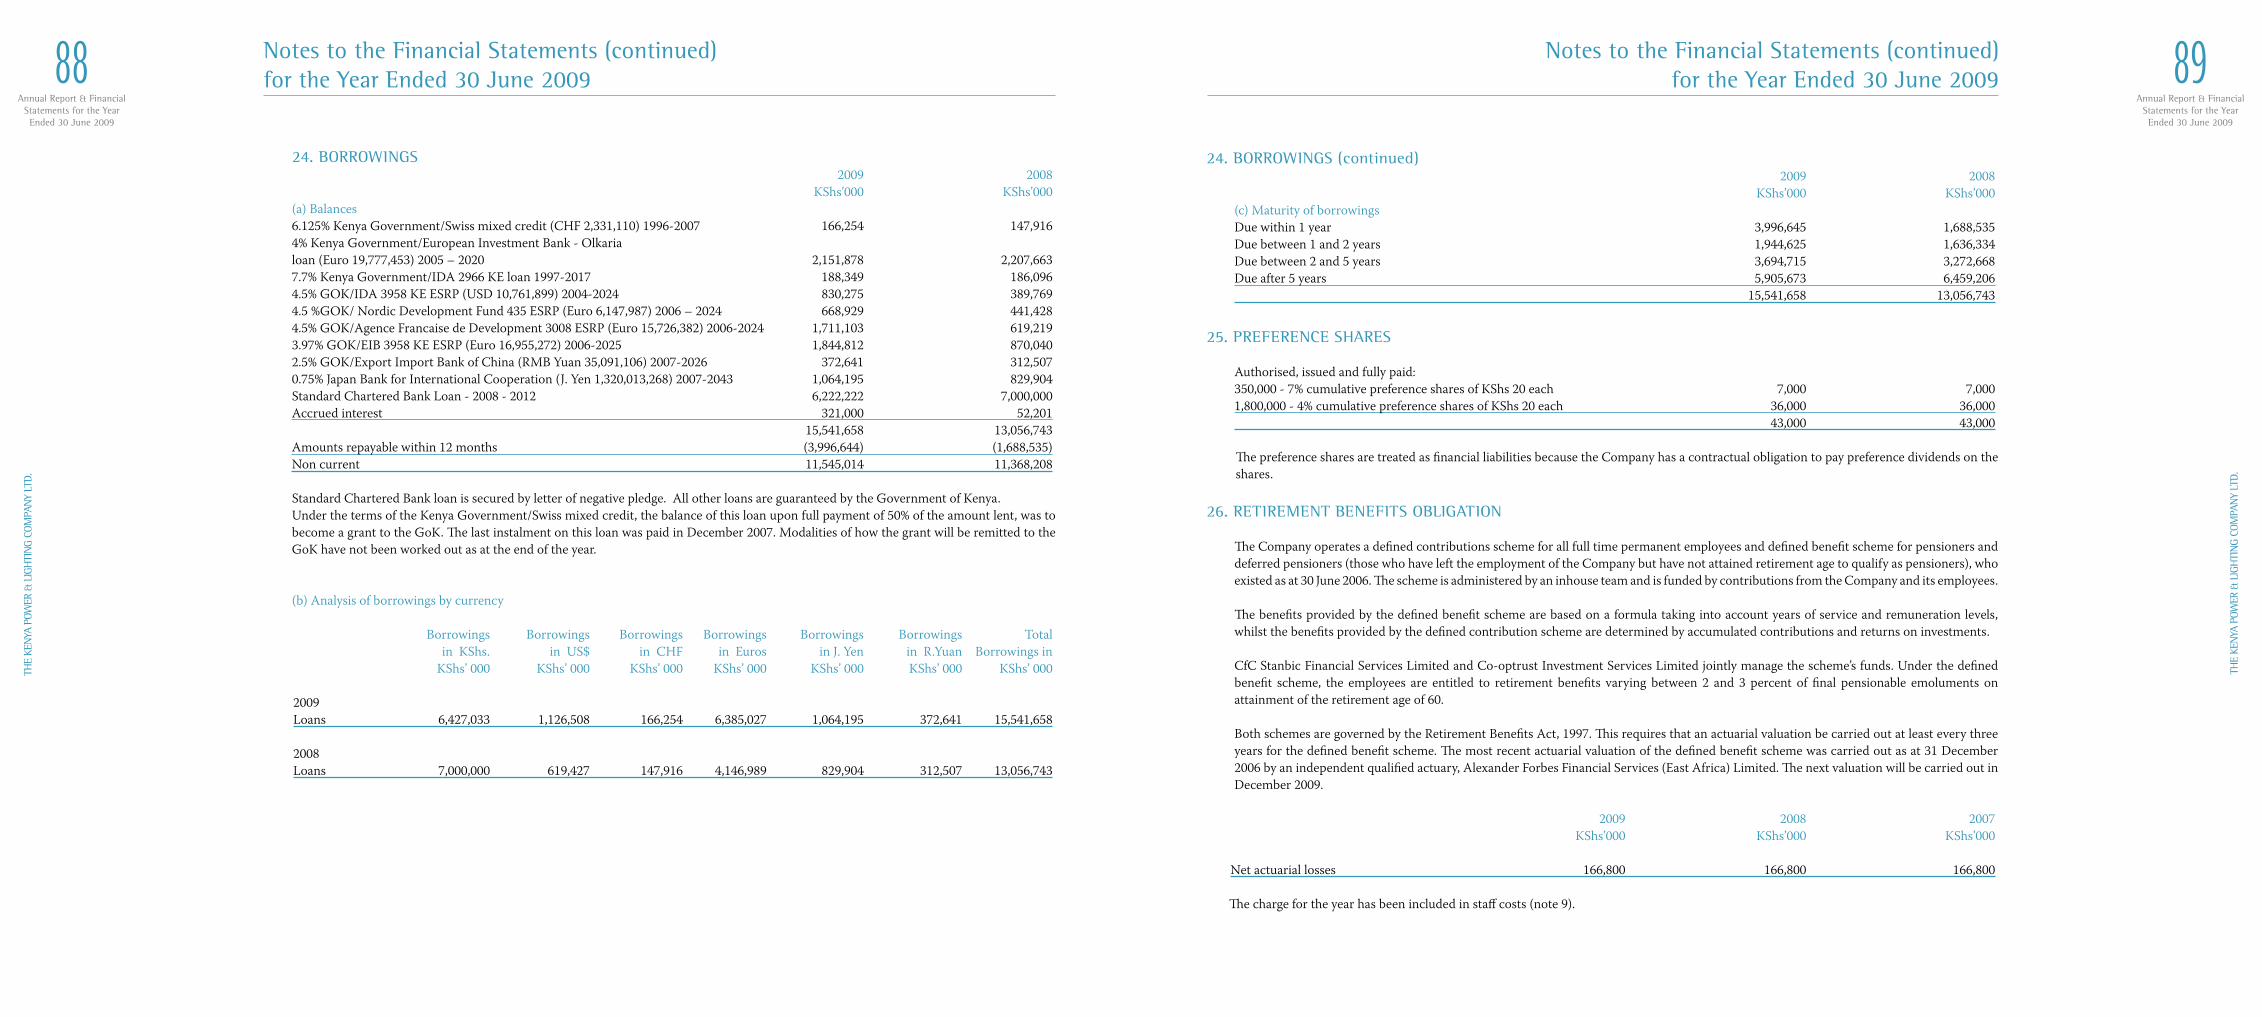
Annual Report & FinancialStatements for the YearEnded 30 June 2009
88TH
E KE
NYA
POW
ER &
LIG
HTI
NG
COM
PAN
Y LT
D.
Annual Report & FinancialStatements for the YearEnded 30 June 2009
89
THE
KEN
YA P
OWER
& L
IGH
TIN
G CO
MPA
NY
LTD.
24. BORROWINGS (continued) 2009 2008 KShs’000 KShs’000 (c) Maturity of borrowings Due within 1 year 3,996,645 1,688,535 Due between 1 and 2 years 1,944,625 1,636,334 Due between 2 and 5 years 3,694,715 3,272,668 Due after 5 years 5,905,673 6,459,206 15,541,658 13,056,743
25. PREFERENCE SHARES
Authorised, issued and fully paid: 350,000 - 7% cumulative preference shares of KShs 20 each 7,000 7,000 1,800,000 - 4% cumulative preference shares of KShs 20 each 36,000 36,000 43,000 43,000
The preference shares are treated as financial liabilities because the Company has a contractual obligation to pay preference dividends on the shares.
26. RETIREMENT BENEFITS OBLIGATION
The Company operates a defined contributions scheme for all full time permanent employees and defined benefit scheme for pensioners and deferred pensioners (those who have left the employment of the Company but have not attained retirement age to qualify as pensioners), who existed as at 30 June 2006. The scheme is administered by an inhouse team and is funded by contributions from the Company and its employees.
The benefits provided by the defined benefit scheme are based on a formula taking into account years of service and remuneration levels, whilst the benefits provided by the defined contribution scheme are determined by accumulated contributions and returns on investments. CfC Stanbic Financial Services Limited and Co-optrust Investment Services Limited jointly manage the scheme’s funds. Under the defined benefit scheme, the employees are entitled to retirement benefits varying between 2 and 3 percent of final pensionable emoluments on attainment of the retirement age of 60.
Both schemes are governed by the Retirement Benefits Act, 1997. This requires that an actuarial valuation be carried out at least every three years for the defined benefit scheme. The most recent actuarial valuation of the defined benefit scheme was carried out as at 31 December 2006 by an independent qualified actuary, Alexander Forbes Financial Services (East Africa) Limited. The next valuation will be carried out in December 2009.
2009 2008 2007 KShs’000 KShs’000 KShs’000
Net actuarial losses 166,800 166,800 166,800
The charge for the year has been included in staff costs (note 9).
Notes to the Financial Statements (continued)for the Year Ended 30 June 2009
24. BORROWINGS 2009 2008 KShs’000 KShs’000 (a) Balances 6.125% Kenya Government/Swiss mixed credit (CHF 2,331,110) 1996-2007 166,254 147,916 4% Kenya Government/European Investment Bank - Olkaria loan (Euro 19,777,453) 2005 – 2020 2,151,878 2,207,663 7.7% Kenya Government/IDA 2966 KE loan 1997-2017 188,349 186,096 4.5% GOK/IDA 3958 KE ESRP (USD 10,761,899) 2004-2024 830,275 389,769 4.5 %GOK/ Nordic Development Fund 435 ESRP (Euro 6,147,987) 2006 – 2024 668,929 441,428 4.5% GOK/Agence Francaise de Development 3008 ESRP (Euro 15,726,382) 2006-2024 1,711,103 619,219 3.97% GOK/EIB 3958 KE ESRP (Euro 16,955,272) 2006-2025 1,844,812 870,040 2.5% GOK/Export Import Bank of China (RMB Yuan 35,091,106) 2007-2026 372,641 312,507 0.75% Japan Bank for International Cooperation (J. Yen 1,320,013,268) 2007-2043 1,064,195 829,904 Standard Chartered Bank Loan - 2008 - 2012 6,222,222 7,000,000 Accrued interest 321,000 52,201 15,541,658 13,056,743 Amounts repayable within 12 months (3,996,644) (1,688,535) Non current 11,545,014 11,368,208
Standard Chartered Bank loan is secured by letter of negative pledge. All other loans are guaranteed by the Government of Kenya. Under the terms of the Kenya Government/Swiss mixed credit, the balance of this loan upon full payment of 50% of the amount lent, was to become a grant to the GoK. The last instalment on this loan was paid in December 2007. Modalities of how the grant will be remitted to the GoK have not been worked out as at the end of the year.
(b) Analysis of borrowings by currency
Borrowings Borrowings Borrowings Borrowings Borrowings Borrowings Total in KShs. in US$ in CHF in Euros in J. Yen in R.Yuan Borrowings in KShs’ 000 KShs’ 000 KShs’ 000 KShs’ 000 KShs’ 000 KShs’ 000 KShs’ 000 2009 Loans 6,427,033 1,126,508 166,254 6,385,027 1,064,195 372,641 15,541,658 2008 Loans 7,000,000 619,427 147,916 4,146,989 829,904 312,507 13,056,743
Notes to the Financial Statements (continued)for the Year Ended 30 June 2009
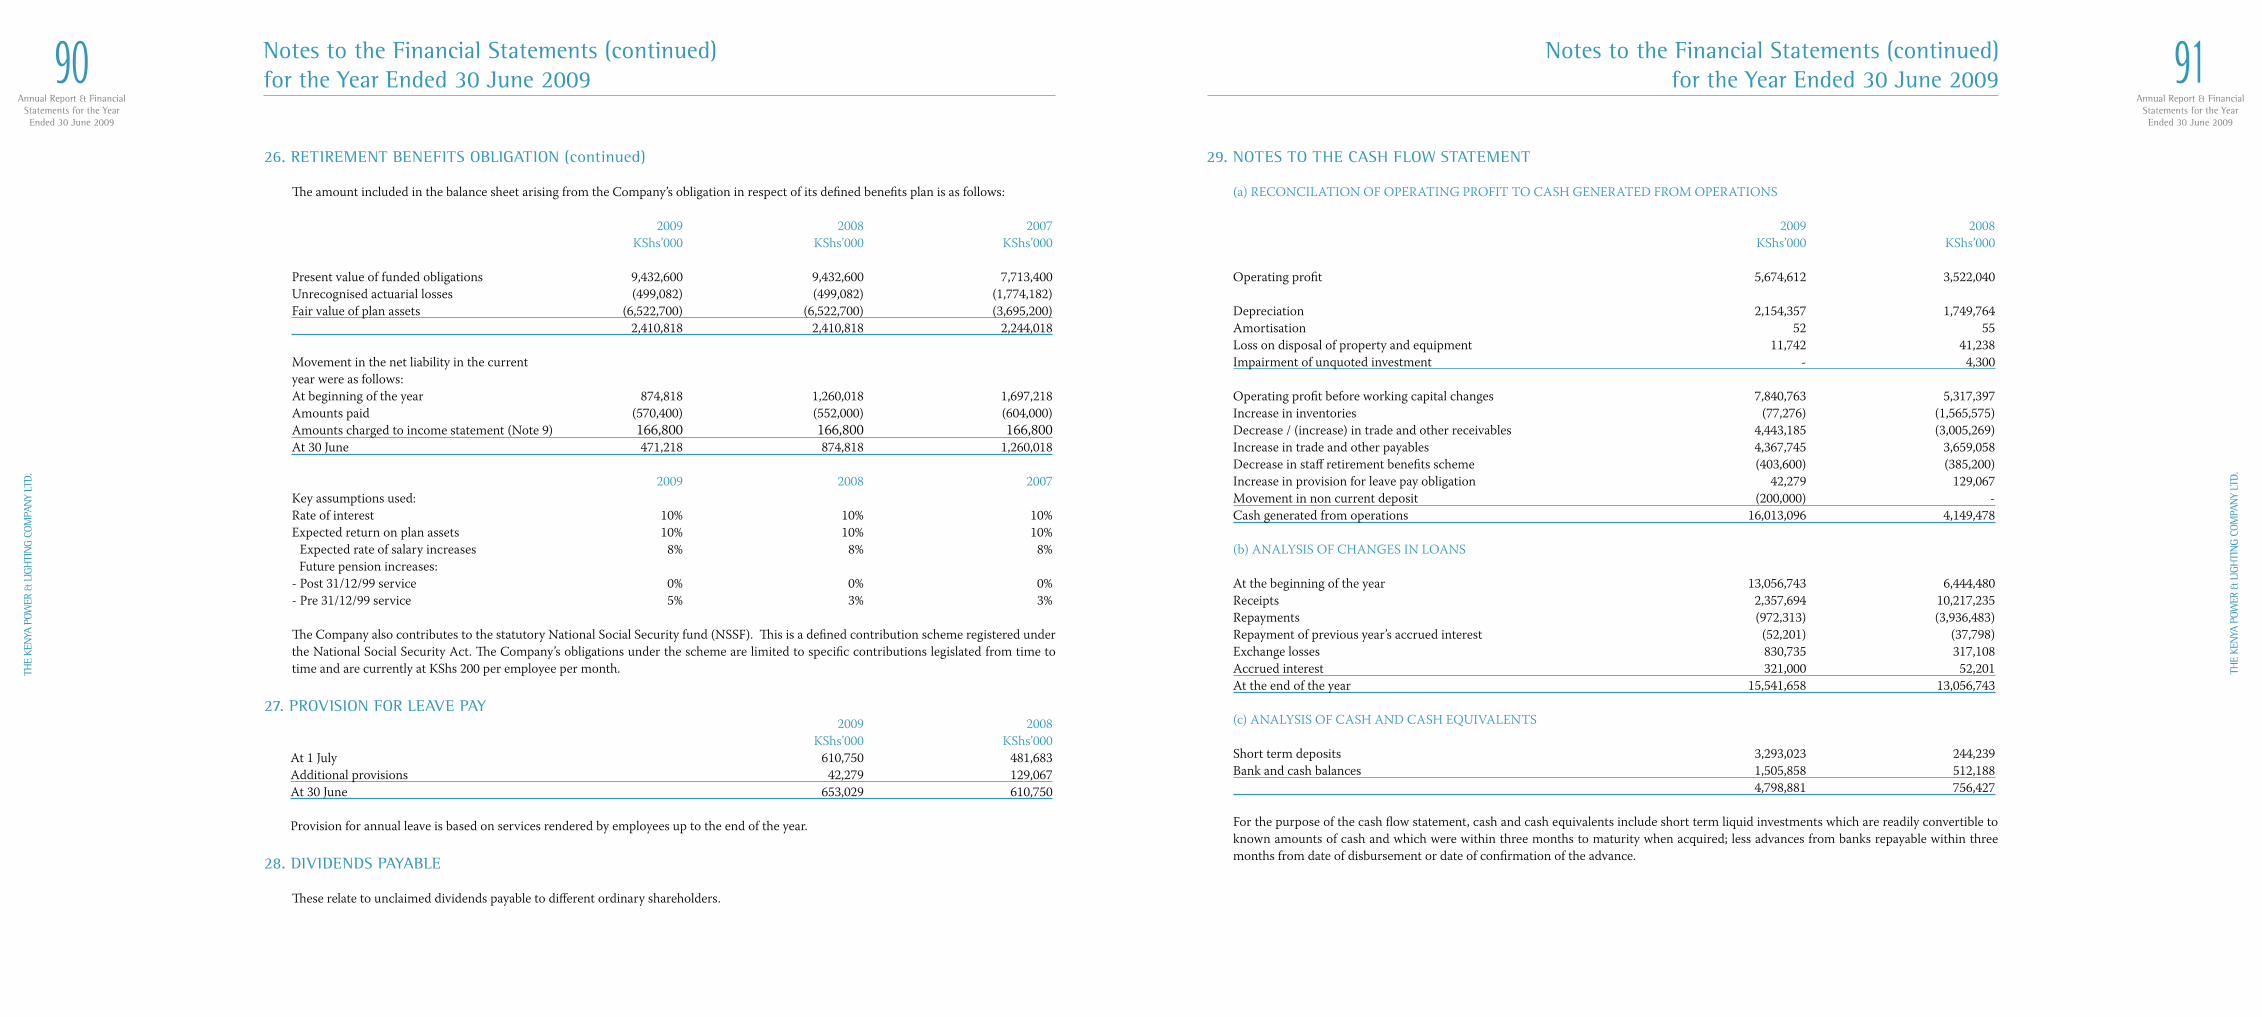
Annual Report & FinancialStatements for the YearEnded 30 June 2009
90TH
E KE
NYA
POW
ER &
LIG
HTI
NG
COM
PAN
Y LT
D.
Annual Report & FinancialStatements for the YearEnded 30 June 2009
91
THE
KEN
YA P
OWER
& L
IGH
TIN
G CO
MPA
NY
LTD.
29. NOTES TO THE CASH FLOW STATEMENT
(a) RECONCILATION OF OPERATING PROFIT TO CASH GENERATED FROM OPERATIONS
2009 2008 KShs’000 KShs’000
Operating profit 5,674,612 3,522,040
Depreciation 2,154,357 1,749,764 Amortisation 52 55 Loss on disposal of property and equipment 11,742 41,238 Impairment of unquoted investment - 4,300 Operating profit before working capital changes 7,840,763 5,317,397 Increase in inventories (77,276) (1,565,575) Decrease / (increase) in trade and other receivables 4,443,185 (3,005,269) Increase in trade and other payables 4,367,745 3,659,058 Decrease in staff retirement benefits scheme (403,600) (385,200) Increase in provision for leave pay obligation 42,279 129,067 Movement in non current deposit (200,000) - Cash generated from operations 16,013,096 4,149,478
(b) ANALYSIS OF CHANGES IN LOANS
At the beginning of the year 13,056,743 6,444,480 Receipts 2,357,694 10,217,235 Repayments (972,313) (3,936,483) Repayment of previous year’s accrued interest (52,201) (37,798) Exchange losses 830,735 317,108 Accrued interest 321,000 52,201 At the end of the year 15,541,658 13,056,743
(c) ANALYSIS OF CASH AND CASH EQUIVALENTS
Short term deposits 3,293,023 244,239 Bank and cash balances 1,505,858 512,188 4,798,881 756,427
For the purpose of the cash flow statement, cash and cash equivalents include short term liquid investments which are readily convertible to known amounts of cash and which were within three months to maturity when acquired; less advances from banks repayable within three months from date of disbursement or date of confirmation of the advance.
Notes to the Financial Statements (continued)for the Year Ended 30 June 2009
26. RETIREMENT BENEFITS OBLIGATION (continued)
The amount included in the balance sheet arising from the Company’s obligation in respect of its defined benefits plan is as follows: 2009 2008 2007 KShs’000 KShs’000 KShs’000 Present value of funded obligations 9,432,600 9,432,600 7,713,400 Unrecognised actuarial losses (499,082) (499,082) (1,774,182) Fair value of plan assets (6,522,700) (6,522,700) (3,695,200) 2,410,818 2,410,818 2,244,018
Movement in the net liability in the current year were as follows: At beginning of the year 874,818 1,260,018 1,697,218 Amounts paid (570,400) (552,000) (604,000) Amounts charged to income statement (Note 9) 166,800 166,800 166,800 At 30 June 471,218 874,818 1,260,018 2009 2008 2007 Key assumptions used: Rate of interest 10% 10% 10% Expected return on plan assets 10% 10% 10% Expected rate of salary increases 8% 8% 8% Future pension increases: - Post 31/12/99 service 0% 0% 0% - Pre 31/12/99 service 5% 3% 3%
The Company also contributes to the statutory National Social Security fund (NSSF). This is a defined contribution scheme registered under the National Social Security Act. The Company’s obligations under the scheme are limited to specific contributions legislated from time to time and are currently at KShs 200 per employee per month.
27. PROVISION FOR LEAVE PAY 2009 2008 KShs’000 KShs’000 At 1 July 610,750 481,683 Additional provisions 42,279 129,067 At 30 June 653,029 610,750 Provision for annual leave is based on services rendered by employees up to the end of the year.
28. DIVIDENDS PAYABLE
These relate to unclaimed dividends payable to different ordinary shareholders.
Notes to the Financial Statements (continued)for the Year Ended 30 June 2009
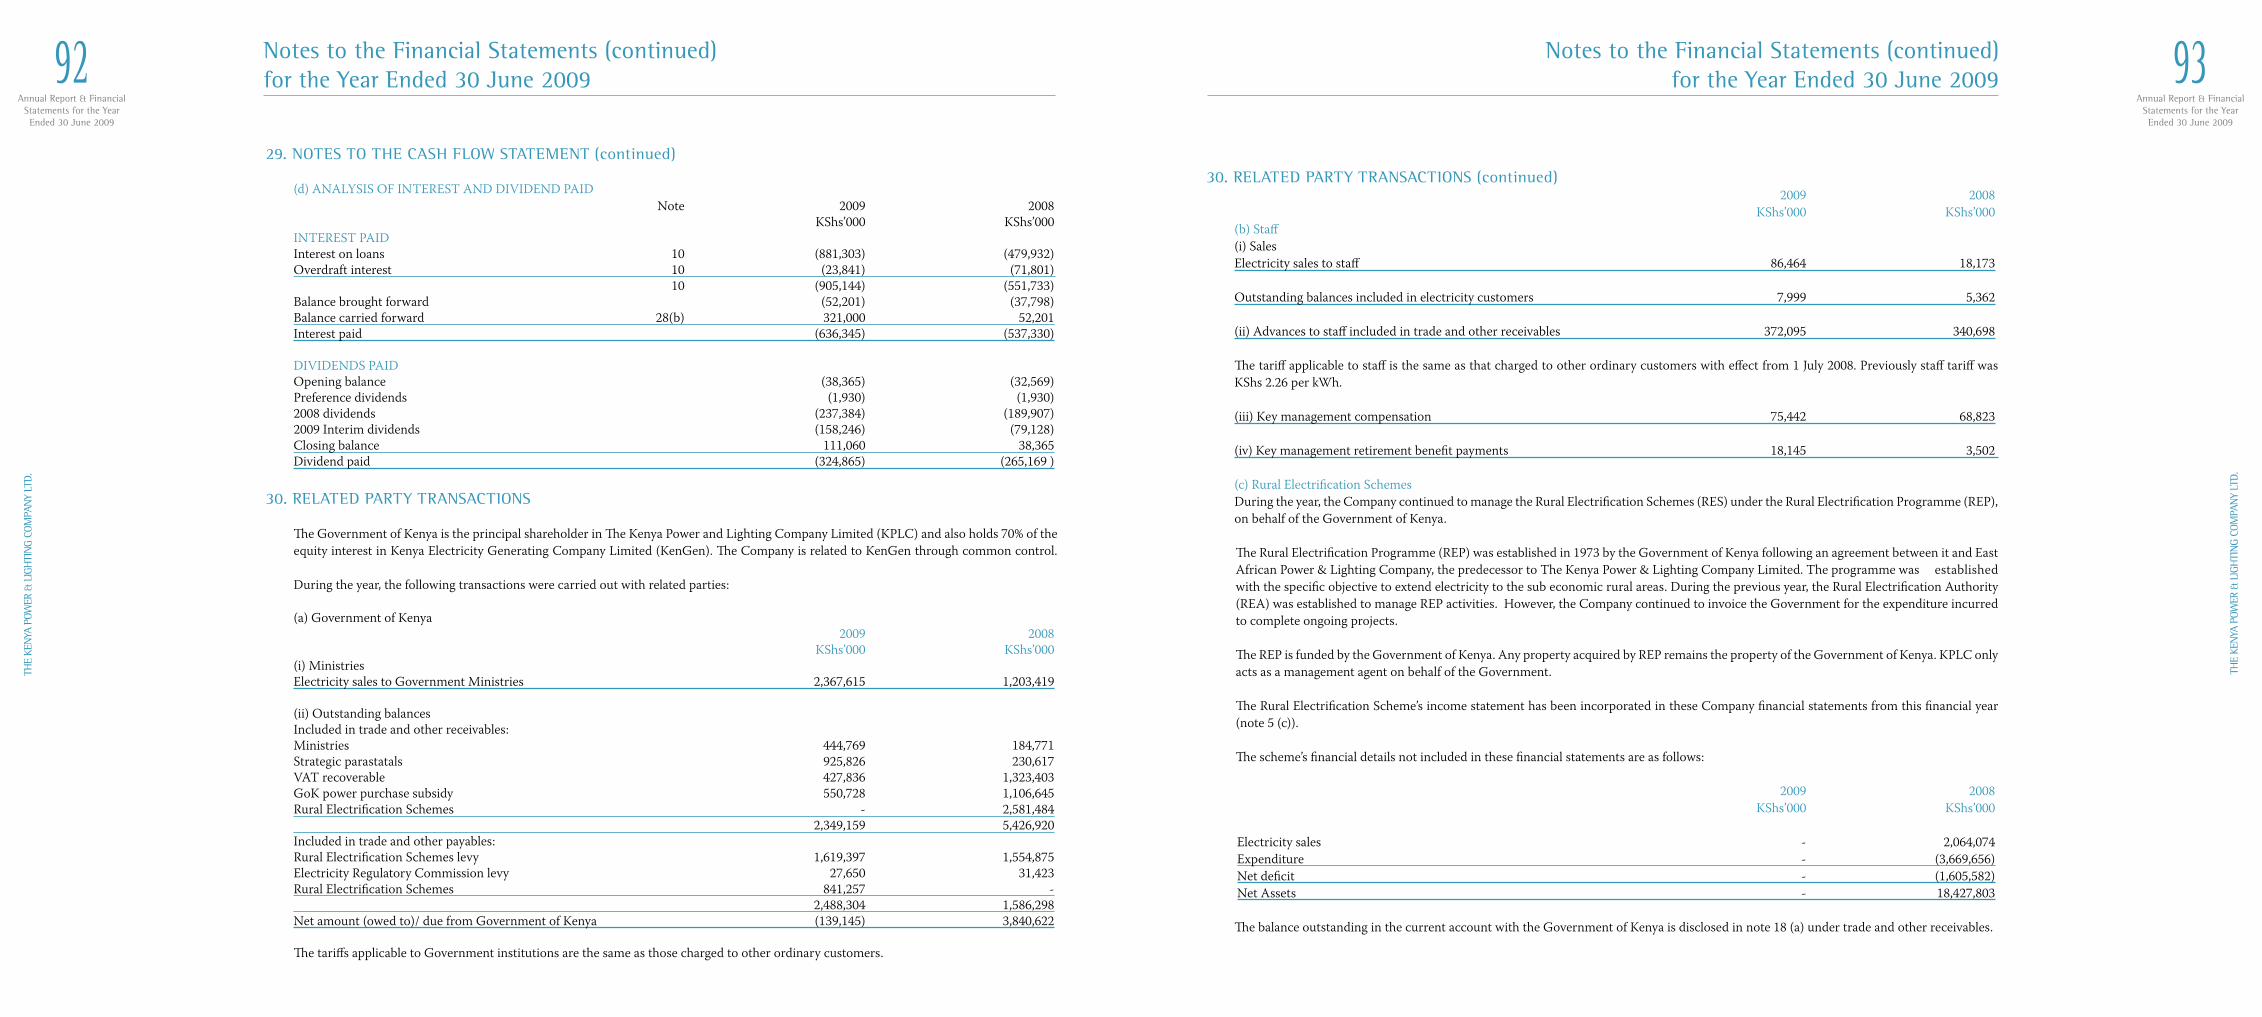
Annual Report & FinancialStatements for the YearEnded 30 June 2009
92TH
E KE
NYA
POW
ER &
LIG
HTI
NG
COM
PAN
Y LT
D.
Annual Report & FinancialStatements for the YearEnded 30 June 2009
93
THE
KEN
YA P
OWER
& L
IGH
TIN
G CO
MPA
NY
LTD.
30. RELATED PARTY TRANSACTIONS (continued) 2009 2008 KShs’000 KShs’000 (b) Staff (i) Sales Electricity sales to staff 86,464 18,173
Outstanding balances included in electricity customers 7,999 5,362 (ii) Advances to staff included in trade and other receivables 372,095 340,698 The tariff applicable to staff is the same as that charged to other ordinary customers with effect from 1 July 2008. Previously staff tariff was KShs 2.26 per kWh.
(iii) Key management compensation 75,442 68,823
(iv) Key management retirement benefit payments 18,145 3,502 (c) Rural Electrification Schemes During the year, the Company continued to manage the Rural Electrification Schemes (RES) under the Rural Electrification Programme (REP), on behalf of the Government of Kenya.
The Rural Electrification Programme (REP) was established in 1973 by the Government of Kenya following an agreement between it and East African Power & Lighting Company, the predecessor to The Kenya Power & Lighting Company Limited. The programme was established with the specific objective to extend electricity to the sub economic rural areas. During the previous year, the Rural Electrification Authority (REA) was established to manage REP activities. However, the Company continued to invoice the Government for the expenditure incurred to complete ongoing projects.
The REP is funded by the Government of Kenya. Any property acquired by REP remains the property of the Government of Kenya. KPLC only acts as a management agent on behalf of the Government.
The Rural Electrification Scheme’s income statement has been incorporated in these Company financial statements from this financial year (note 5 (c)).
The scheme’s financial details not included in these financial statements are as follows:
2009 2008 KShs’000 KShs’000 Electricity sales - 2,064,074 Expenditure - (3,669,656) Net deficit - (1,605,582) Net Assets - 18,427,803 The balance outstanding in the current account with the Government of Kenya is disclosed in note 18 (a) under trade and other receivables.
Notes to the Financial Statements (continued)for the Year Ended 30 June 2009
29. NOTES TO THE CASH FLOW STATEMENT (continued) (d) ANALYSIS OF INTEREST AND DIVIDEND PAID Note 2009 2008 KShs’000 KShs’000 INTEREST PAID Interest on loans 10 (881,303) (479,932) Overdraft interest 10 (23,841) (71,801) 10 (905,144) (551,733) Balance brought forward (52,201) (37,798) Balance carried forward 28(b) 321,000 52,201 Interest paid (636,345) (537,330) DIVIDENDS PAID Opening balance (38,365) (32,569) Preference dividends (1,930) (1,930) 2008 dividends (237,384) (189,907) 2009 Interim dividends (158,246) (79,128) Closing balance 111,060 38,365 Dividend paid (324,865) (265,169 )
30. RELATED PARTY TRANSACTIONS
The Government of Kenya is the principal shareholder in The Kenya Power and Lighting Company Limited (KPLC) and also holds 70% of the equity interest in Kenya Electricity Generating Company Limited (KenGen). The Company is related to KenGen through common control.
During the year, the following transactions were carried out with related parties:
(a) Government of Kenya 2009 2008 KShs’000 KShs’000 (i) Ministries Electricity sales to Government Ministries 2,367,615 1,203,419 (ii) Outstanding balances Included in trade and other receivables: Ministries 444,769 184,771 Strategic parastatals 925,826 230,617 VAT recoverable 427,836 1,323,403 GoK power purchase subsidy 550,728 1,106,645 Rural Electrification Schemes - 2,581,484 2,349,159 5,426,920 Included in trade and other payables: Rural Electrification Schemes levy 1,619,397 1,554,875 Electricity Regulatory Commission levy 27,650 31,423 Rural Electrification Schemes 841,257 - 2,488,304 1,586,298 Net amount (owed to)/ due from Government of Kenya (139,145) 3,840,622
The tariffs applicable to Government institutions are the same as those charged to other ordinary customers.
Notes to the Financial Statements (continued)for the Year Ended 30 June 2009
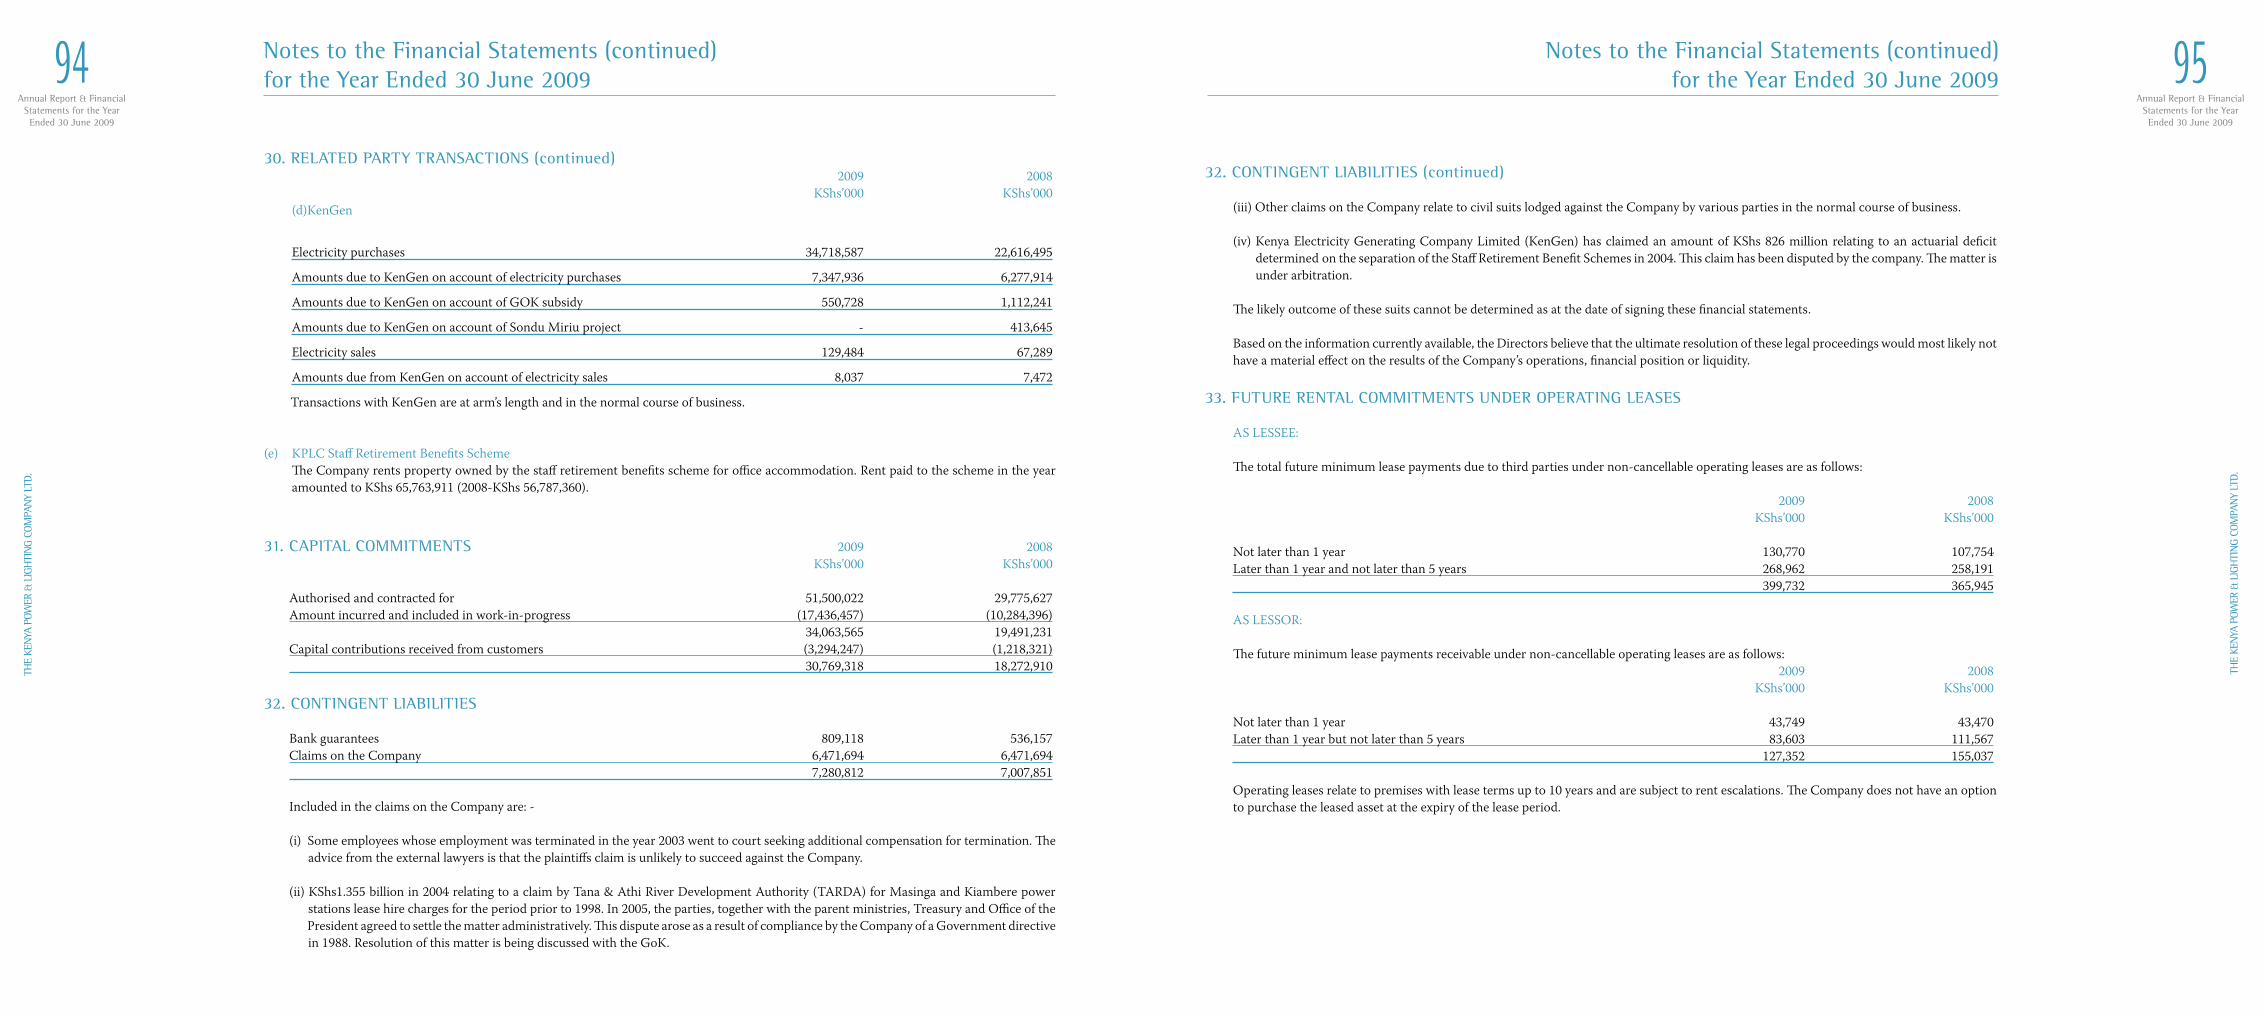
Annual Report & FinancialStatements for the YearEnded 30 June 2009
94TH
E KE
NYA
POW
ER &
LIG
HTI
NG
COM
PAN
Y LT
D.
Annual Report & FinancialStatements for the YearEnded 30 June 2009
95
THE
KEN
YA P
OWER
& L
IGH
TIN
G CO
MPA
NY
LTD.
32. CONTINGENT LIABILITIES (continued)
(iii) Other claims on the Company relate to civil suits lodged against the Company by various parties in the normal course of business.
(iv) Kenya Electricity Generating Company Limited (KenGen) has claimed an amount of KShs 826 million relating to an actuarial deficit determined on the separation of the Staff Retirement Benefit Schemes in 2004. This claim has been disputed by the company. The matter is under arbitration.
The likely outcome of these suits cannot be determined as at the date of signing these financial statements.
Based on the information currently available, the Directors believe that the ultimate resolution of these legal proceedings would most likely not have a material effect on the results of the Company’s operations, financial position or liquidity.
33. FUTURE RENTAL COMMITMENTS UNDER OPERATING LEASES
AS LESSEE:
The total future minimum lease payments due to third parties under non-cancellable operating leases are as follows: 2009 2008 KShs’000 KShs’000
Not later than 1 year 130,770 107,754 Later than 1 year and not later than 5 years 268,962 258,191 399,732 365,945
AS LESSOR:
The future minimum lease payments receivable under non-cancellable operating leases are as follows: 2009 2008 KShs’000 KShs’000
Not later than 1 year 43,749 43,470 Later than 1 year but not later than 5 years 83,603 111,567 127,352 155,037
Operating leases relate to premises with lease terms up to 10 years and are subject to rent escalations. The Company does not have an option to purchase the leased asset at the expiry of the lease period.
Notes to the Financial Statements (continued)for the Year Ended 30 June 2009
30. RELATED PARTY TRANSACTIONS (continued) 2009 2008 KShs’000 KShs’000 (d)KenGen
Electricity purchases 34,718,587 22,616,495
Amounts due to KenGen on account of electricity purchases 7,347,936 6,277,914
Amounts due to KenGen on account of GOK subsidy 550,728 1,112,241
Amounts due to KenGen on account of Sondu Miriu project - 413,645
Electricity sales 129,484 67,289
Amounts due from KenGen on account of electricity sales 8,037 7,472
Transactions with KenGen are at arm’s length and in the normal course of business.
(e) KPLC Staff Retirement Benefits Scheme The Company rents property owned by the staff retirement benefits scheme for office accommodation. Rent paid to the scheme in the year amounted to KShs 65,763,911 (2008-KShs 56,787,360).
31. CAPITAL COMMITMENTS 2009 2008 KShs’000 KShs’000 Authorised and contracted for 51,500,022 29,775,627
Amount incurred and included in work-in-progress (17,436,457) (10,284,396) 34,063,565 19,491,231 Capital contributions received from customers (3,294,247) (1,218,321) 30,769,318 18,272,910
32. CONTINGENT LIABILITIES Bank guarantees 809,118 536,157 Claims on the Company 6,471,694 6,471,694 7,280,812 7,007,851 Included in the claims on the Company are: -
(i) Some employees whose employment was terminated in the year 2003 went to court seeking additional compensation for termination. The advice from the external lawyers is that the plaintiffs claim is unlikely to succeed against the Company.
(ii) KShs1.355 billion in 2004 relating to a claim by Tana & Athi River Development Authority (TARDA) for Masinga and Kiambere power stations lease hire charges for the period prior to 1998. In 2005, the parties, together with the parent ministries, Treasury and Office of the President agreed to settle the matter administratively. This dispute arose as a result of compliance by the Company of a Government directive in 1988. Resolution of this matter is being discussed with the GoK.
Notes to the Financial Statements (continued)for the Year Ended 30 June 2009

Annual Report & FinancialStatements for the YearEnded 30 June 2009
96TH
E KE
NYA
POW
ER &
LIG
HTI
NG
COM
PAN
Y LT
D.
Annual Report & FinancialStatements for the YearEnded 30 June 2009
97
THE
KEN
YA P
OWER
& L
IGH
TIN
G CO
MPA
NY
LTD.
34. WORLD BANK FINANCING
(a) The Company received financial support from the World Bank through Credit No. 3958 – KE dated 4 August 2004 to support implementation of the Energy Sector Recovery Project. Summary information on transactions during the year are as follows:
2009 2008 KShs’000 KShs’000 Balance at the beginning of the year 35,740 51,448 Amounts received during the year 106,192 182,298 Net interest income 109 80 Expenditure during the year (66,754) (198,086) Balance at the end of the year 75,287 35,740
(b) The closing balances shown above are included in cash and cash equivalents and represent balances on the World Bank funded Special Account No. 024/00/800521/01 held at CfC Stanbic Bank of Kenya Limited. Included in the long term liabilities is also an amount of KShs. 830,274,704 (US$ 10,761,899) in respect of the amounts disbursed under the loan to date.
(c) The proceeds of the World Bank loan have been expended in accordance with the intended purpose as specified in the loan agreement.
35. EUROPEAN INVESTMENT BANK (EIB) FINANCING
The Company received financial support from EIB for Grid development. The Company has set aside KShs. 28,259,644 Revolving Credit Fund (RCF) as per clause 6.14 of the finance contract. The proceeds of this fund will be used to facilitate new connections to the electricity network for low income customers. The amount is included under creditors awaiting opening of Special Bank Account.
36. COMPARATIVES
Where necessary, comparative figures have been adjusted to conform with changes in presentation in the current year.
37. INCORPORATION
The Company is incorporated in Kenya under the Kenyan Companies Act and is domiciled in Kenya.
38. CURRENCY
These financial statements are prepared in Kenya shillings thousands (KShs’000).
Notes to the Financial Statements (continued)for the Year Ended 30 June 2009 We are confident that we shall
satisfy customer and shareholderexpectations
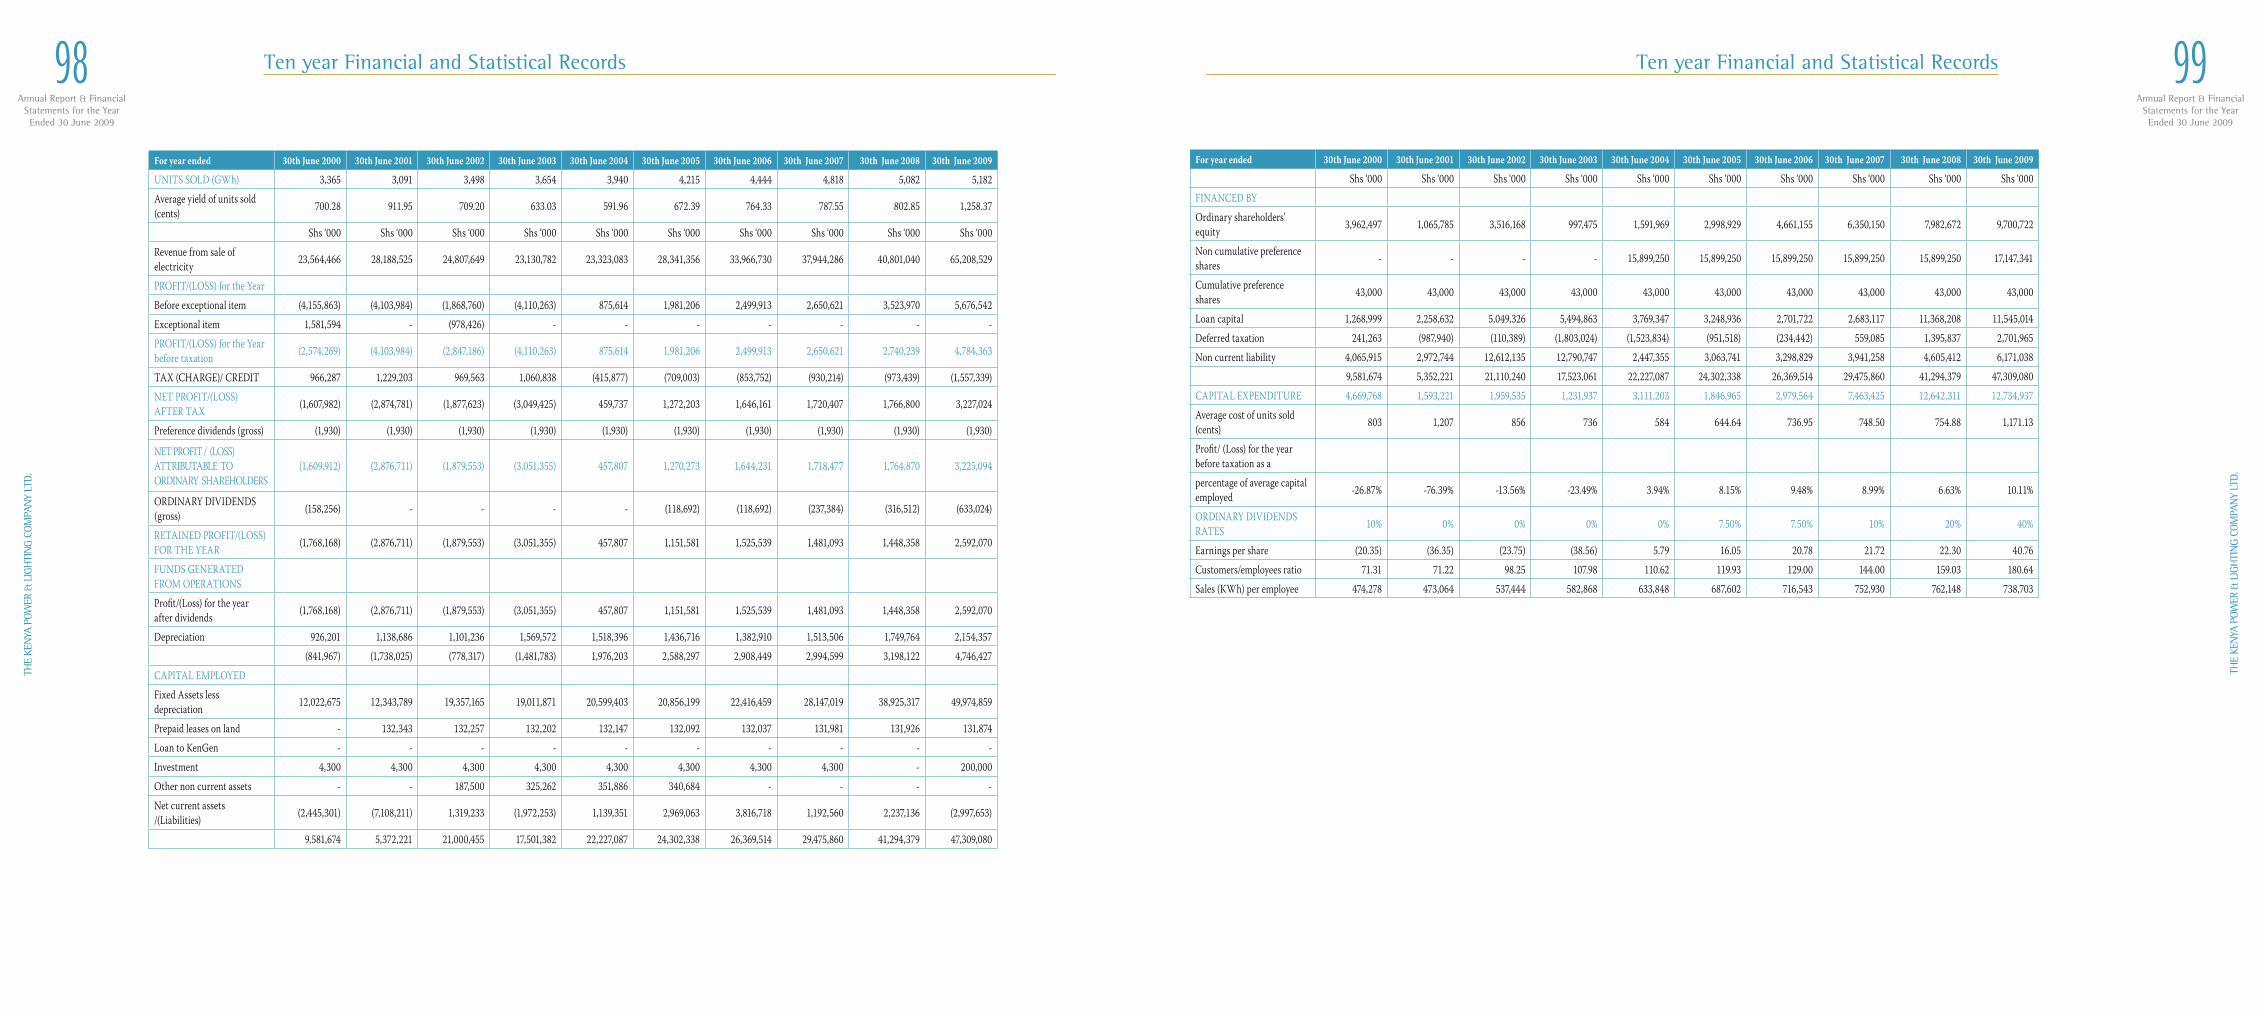
Annual Report & FinancialStatements for the YearEnded 30 June 2009
98TH
E KE
NYA
POW
ER &
LIG
HTI
NG
COM
PAN
Y LT
D.
Annual Report & FinancialStatements for the YearEnded 30 June 2009
99
THE
KEN
YA P
OWER
& L
IGH
TIN
G CO
MPA
NY
LTD.
For year ended 30th June 2000 30th June 2001 30th June 2002 30th June 2003 30th June 2004 30th June 2005 30th June 2006 30th June 2007 30th June 2008 30th June 2009
UNITS SOLD (GWh) 3,365 3,091 3,498 3,654 3,940 4,215 4,444 4,818 5,082 5,182 Average yield of units sold (cents) 700.28 911.95 709.20 633.03 591.96 672.39 764.33 787.55 802.85 1,258.37
Shs ‘000 Shs ‘000 Shs ‘000 Shs ‘000 Shs ‘000 Shs ‘000 Shs ‘000 Shs ‘000 Shs ‘000 Shs ‘000Revenue from sale of electricity 23,564,466 28,188,525 24,807,649 23,130,782 23,323,083 28,341,356 33,966,730 37,944,286 40,801,040 65,208,529
PROFIT/(LOSS) for the YearBefore exceptional item (4,155,863) (4,103,984) (1,868,760) (4,110,263) 875,614 1,981,206 2,499,913 2,650,621 3,523,970 5,676,542 Exceptional item 1,581,594 - (978,426) - - - - - - - PROFIT/(LOSS) for the Year before taxation (2,574,269) (4,103,984) (2,847,186) (4,110,263) 875,614 1,981,206 2,499,913 2,650,621 2,740,239 4,784,363
TAX (CHARGE)/ CREDIT 966,287 1,229,203 969,563 1,060,838 (415,877) (709,003) (853,752) (930,214) (973,439) (1,557,339)NET PROFIT/(LOSS) AFTER TAX (1,607,982) (2,874,781) (1,877,623) (3,049,425) 459,737 1,272,203 1,646,161 1,720,407 1,766,800 3,227,024
Preference dividends (gross) (1,930) (1,930) (1,930) (1,930) (1,930) (1,930) (1,930) (1,930) (1,930) (1,930)
NET PROFIT / (LOSS) ATTRIBUTABLE TOORDINARY SHAREHOLDERS
(1,609,912) (2,876,711) (1,879,553) (3,051,355) 457,807 1,270,273 1,644,231 1,718,477 1,764,870 3,225,094
ORDINARY DIVIDENDS (gross) (158,256) - - - - (118,692) (118,692) (237,384) (316,512) (633,024)
RETAINED PROFIT/(LOSS) FOR THE YEAR (1,768,168) (2,876,711) (1,879,553) (3,051,355) 457,807 1,151,581 1,525,539 1,481,093 1,448,358 2,592,070
FUNDS GENERATED FROM OPERATIONSProfit/(Loss) for the year after dividends (1,768,168) (2,876,711) (1,879,553) (3,051,355) 457,807 1,151,581 1,525,539 1,481,093 1,448,358 2,592,070
Depreciation 926,201 1,138,686 1,101,236 1,569,572 1,518,396 1,436,716 1,382,910 1,513,506 1,749,764 2,154,357 (841,967) (1,738,025) (778,317) (1,481,783) 1,976,203 2,588,297 2,908,449 2,994,599 3,198,122 4,746,427
CAPITAL EMPLOYEDFixed Assets less depreciation 12,022,675 12,343,789 19,357,165 19,011,871 20,599,403 20,856,199 22,416,459 28,147,019 38,925,317 49,974,859
Prepaid leases on land - 132,343 132,257 132,202 132,147 132,092 132,037 131,981 131,926 131,874 Loan to KenGen - - - - - - - - - - Investment 4,300 4,300 4,300 4,300 4,300 4,300 4,300 4,300 - 200,000 Other non current assets - - 187,500 325,262 351,886 340,684 - - - - Net current assets/(Liabilities) (2,445,301) (7,108,211) 1,319,233 (1,972,253) 1,139,351 2,969,063 3,816,718 1,192,560 2,237,136 (2,997,653)
9,581,674 5,372,221 21,000,455 17,501,382 22,227,087 24,302,338 26,369,514 29,475,860 41,294,379 47,309,080
For year ended 30th June 2000 30th June 2001 30th June 2002 30th June 2003 30th June 2004 30th June 2005 30th June 2006 30th June 2007 30th June 2008 30th June 2009
Shs ‘000 Shs ‘000 Shs ‘000 Shs ‘000 Shs ‘000 Shs ‘000 Shs ‘000 Shs ‘000 Shs ‘000 Shs ‘000FINANCED BYOrdinary shareholders’ equity 3,962,497 1,065,785 3,516,168 997,475 1,591,969 2,998,929 4,661,155 6,350,150 7,982,672 9,700,722
Non cumulative preference shares - - - - 15,899,250 15,899,250 15,899,250 15,899,250 15,899,250 17,147,341
Cumulative preference shares 43,000 43,000 43,000 43,000 43,000 43,000 43,000 43,000 43,000 43,000
Loan capital 1,268,999 2,258,632 5,049,326 5,494,863 3,769,347 3,248,936 2,701,722 2,683,117 11,368,208 11,545,014 Deferred taxation 241,263 (987,940) (110,389) (1,803,024) (1,523,834) (951,518) (234,442) 559,085 1,395,837 2,701,965 Non current liability 4,065,915 2,972,744 12,612,135 12,790,747 2,447,355 3,063,741 3,298,829 3,941,258 4,605,412 6,171,038
9,581,674 5,352,221 21,110,240 17,523,061 22,227,087 24,302,338 26,369,514 29,475,860 41,294,379 47,309,080 CAPITAL EXPENDITURE 4,669,768 1,593,221 1,959,535 1,231,937 3,111,203 1,846,965 2,979,564 7,463,425 12,642,311 12,734,937 Average cost of units sold (cents) 803 1,207 856 736 584 644.64 736.95 748.50 754.88 1,171.13
Profit/ (Loss) for the year before taxation as apercentage of average capital employed -26.87% -76.39% -13.56% -23.49% 3.94% 8.15% 9.48% 8.99% 6.63% 10.11%
ORDINARY DIVIDENDS RATES 10% 0% 0% 0% 0% 7.50% 7.50% 10% 20% 40%
Earnings per share (20.35) (36.35) (23.75) (38.56) 5.79 16.05 20.78 21.72 22.30 40.76 Customers/employees ratio 71.31 71.22 98.25 107.98 110.62 119.93 129.00 144.00 159.03 180.64 Sales (KWh) per employee 474,278 473,064 537,444 582,868 633,848 687,602 716,543 752,930 762,148 738,703
Ten year Financial and Statistical Records Ten year Financial and Statistical Records
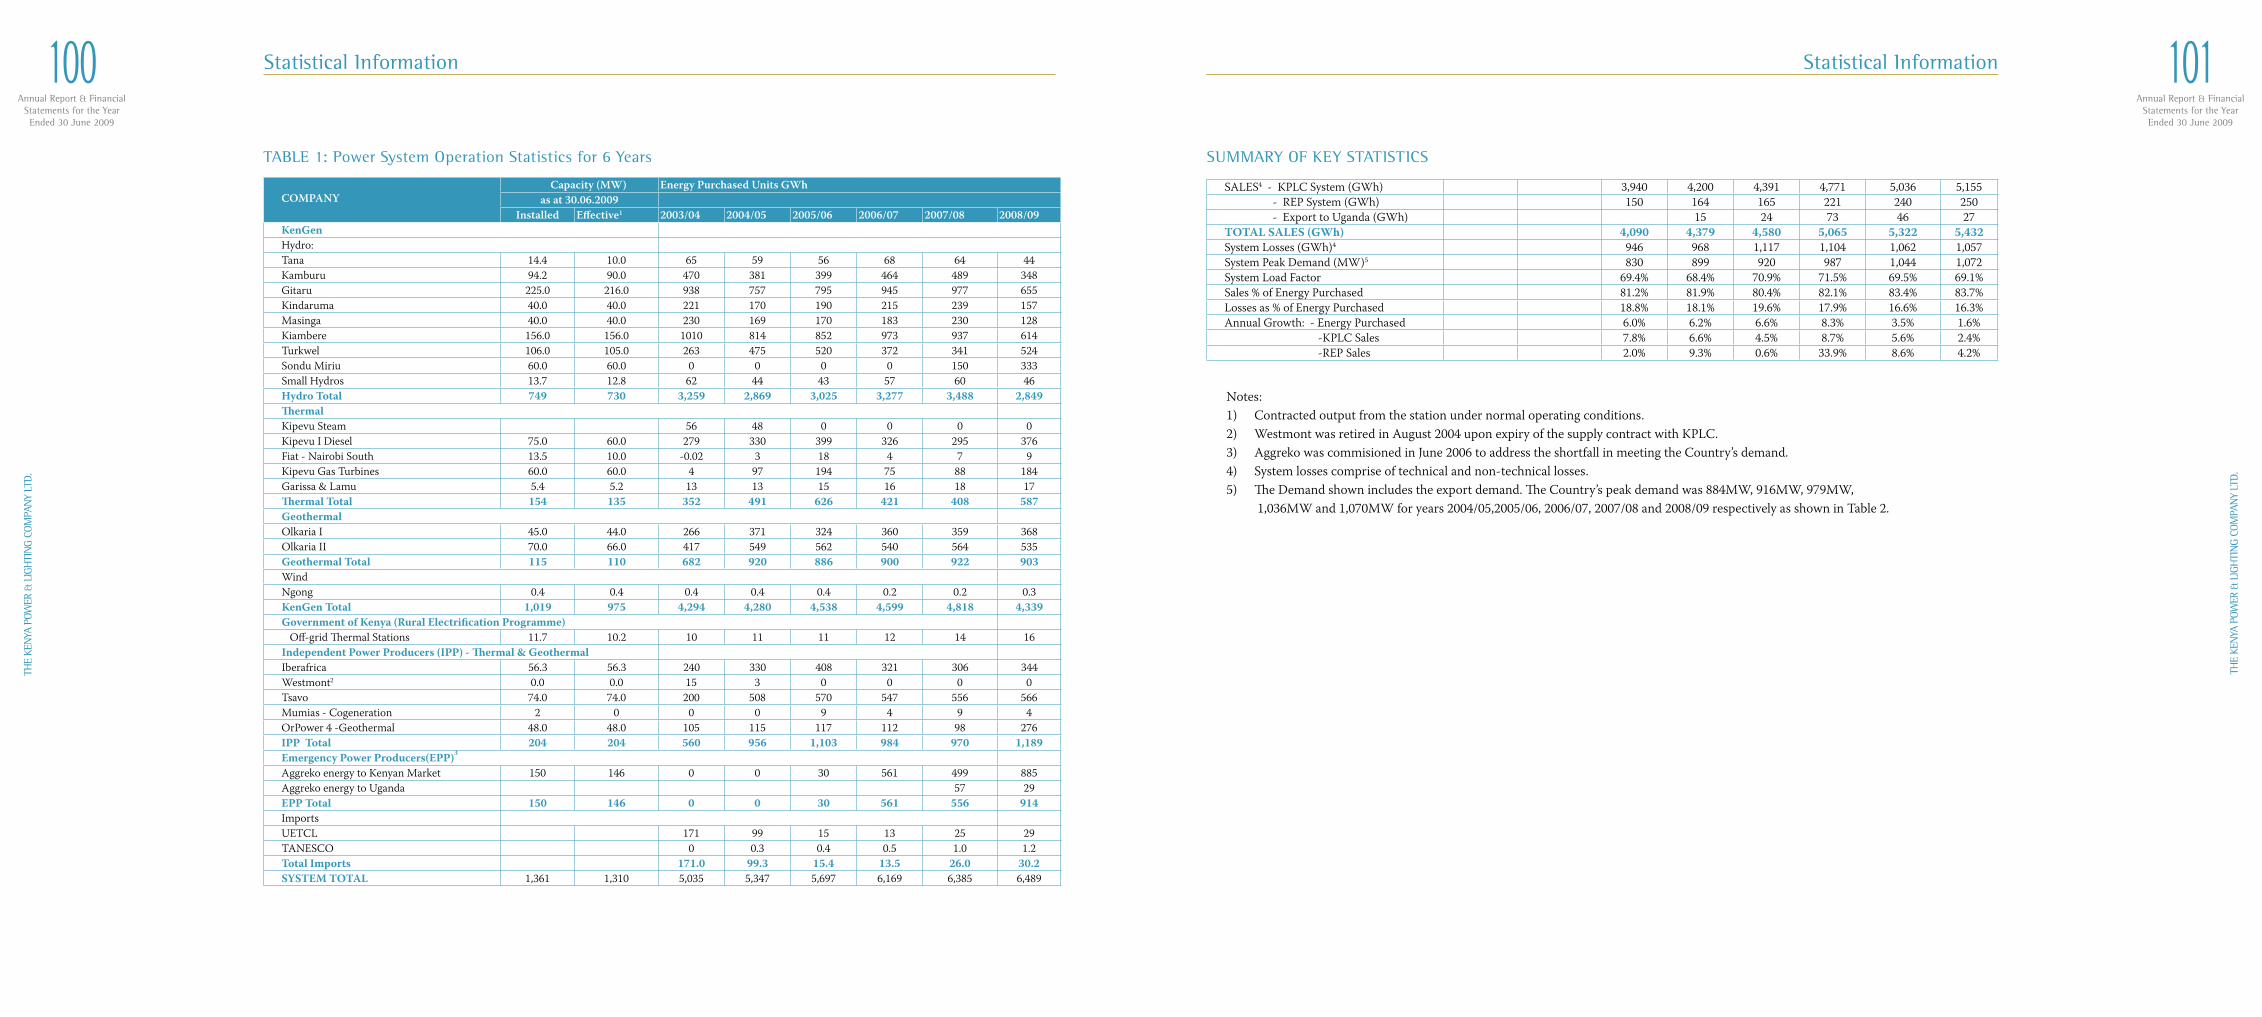
Annual Report & FinancialStatements for the YearEnded 30 June 2009
100TH
E KE
NYA
POW
ER &
LIG
HTI
NG
COM
PAN
Y LT
D.
Annual Report & FinancialStatements for the YearEnded 30 June 2009
101
THE
KEN
YA P
OWER
& L
IGH
TIN
G CO
MPA
NY
LTD.
COMPANY
Capacity (MW) Energy Purchased Units GWh as at 30.06.2009
Installed Effective1 2003/04 2004/05 2005/06 2006/07 2007/08 2008/09KenGen Hydro: Tana 14.4 10.0 65 59 56 68 64 44Kamburu 94.2 90.0 470 381 399 464 489 348Gitaru 225.0 216.0 938 757 795 945 977 655Kindaruma 40.0 40.0 221 170 190 215 239 157Masinga 40.0 40.0 230 169 170 183 230 128Kiambere 156.0 156.0 1010 814 852 973 937 614Turkwel 106.0 105.0 263 475 520 372 341 524Sondu Miriu 60.0 60.0 0 0 0 0 150 333Small Hydros 13.7 12.8 62 44 43 57 60 46Hydro Total 749 730 3,259 2,869 3,025 3,277 3,488 2,849Thermal Kipevu Steam 56 48 0 0 0 0Kipevu I Diesel 75.0 60.0 279 330 399 326 295 376Fiat - Nairobi South 13.5 10.0 -0.02 3 18 4 7 9Kipevu Gas Turbines 60.0 60.0 4 97 194 75 88 184Garissa & Lamu 5.4 5.2 13 13 15 16 18 17Thermal Total 154 135 352 491 626 421 408 587Geothermal Olkaria I 45.0 44.0 266 371 324 360 359 368Olkaria II 70.0 66.0 417 549 562 540 564 535Geothermal Total 115 110 682 920 886 900 922 903Wind Ngong 0.4 0.4 0.4 0.4 0.4 0.2 0.2 0.3KenGen Total 1,019 975 4,294 4,280 4,538 4,599 4,818 4,339Government of Kenya (Rural Electrification Programme) Off-grid Thermal Stations 11.7 10.2 10 11 11 12 14 16Independent Power Producers (IPP) - Thermal & Geothermal Iberafrica 56.3 56.3 240 330 408 321 306 344Westmont2 0.0 0.0 15 3 0 0 0 0Tsavo 74.0 74.0 200 508 570 547 556 566Mumias - Cogeneration 2 0 0 0 9 4 9 4OrPower 4 -Geothermal 48.0 48.0 105 115 117 112 98 276IPP Total 204 204 560 956 1,103 984 970 1,189Emergency Power Producers(EPP)3 Aggreko energy to Kenyan Market 150 146 0 0 30 561 499 885Aggreko energy to Uganda 57 29 EPP Total 150 146 0 0 30 561 556 914Imports UETCL 171 99 15 13 25 29TANESCO 0 0.3 0.4 0.5 1.0 1.2Total Imports 171.0 99.3 15.4 13.5 26.0 30.2SYSTEM TOTAL 1,361 1,310 5,035 5,347 5,697 6,169 6,385 6,489
TABLE 1: Power System Operation Statistics for 6 Years
Statistical Information
SALES4 - KPLC System (GWh) 3,940 4,200 4,391 4,771 5,036 5,155 - REP System (GWh) 150 164 165 221 240 250 - Export to Uganda (GWh) 15 24 73 46 27TOTAL SALES (GWh) 4,090 4,379 4,580 5,065 5,322 5,432System Losses (GWh)4 946 968 1,117 1,104 1,062 1,057System Peak Demand (MW)5 830 899 920 987 1,044 1,072System Load Factor 69.4% 68.4% 70.9% 71.5% 69.5% 69.1%Sales % of Energy Purchased 81.2% 81.9% 80.4% 82.1% 83.4% 83.7%Losses as % of Energy Purchased 18.8% 18.1% 19.6% 17.9% 16.6% 16.3%Annual Growth: - Energy Purchased 6.0% 6.2% 6.6% 8.3% 3.5% 1.6% -KPLC Sales 7.8% 6.6% 4.5% 8.7% 5.6% 2.4% -REP Sales 2.0% 9.3% 0.6% 33.9% 8.6% 4.2%
Notes:1) Contracted output from the station under normal operating conditions.2) Westmont was retired in August 2004 upon expiry of the supply contract with KPLC.3) Aggreko was commisioned in June 2006 to address the shortfall in meeting the Country’s demand.4) System losses comprise of technical and non-technical losses.5) The Demand shown includes the export demand. The Country’s peak demand was 884MW, 916MW, 979MW, 1,036MW and 1,070MW for years 2004/05,2005/06, 2006/07, 2007/08 and 2008/09 respectively as shown in Table 2.
SUMMARY OF KEY STATISTICS
Statistical Information
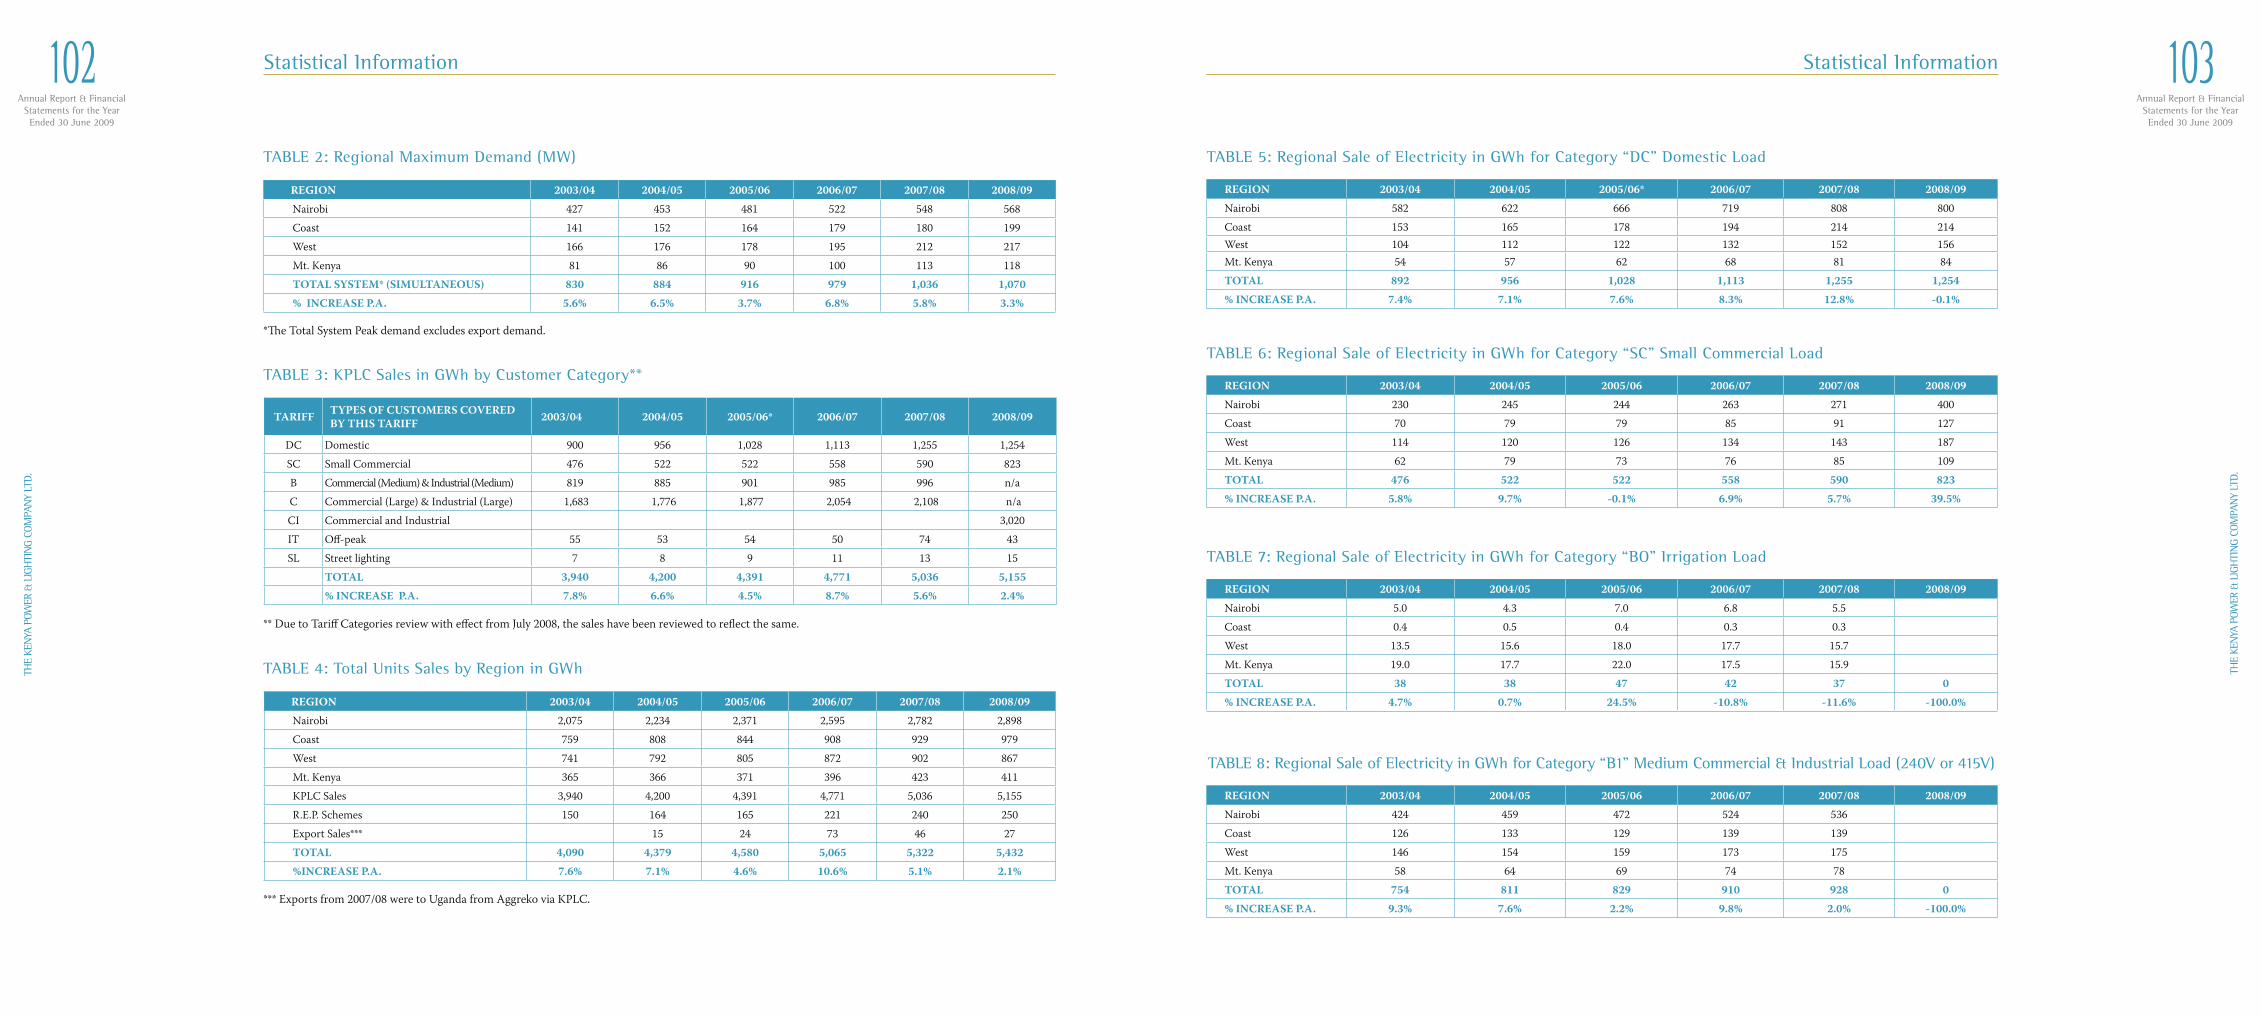
Annual Report & FinancialStatements for the YearEnded 30 June 2009
102TH
E KE
NYA
POW
ER &
LIG
HTI
NG
COM
PAN
Y LT
D.
Annual Report & FinancialStatements for the YearEnded 30 June 2009
103
THE
KEN
YA P
OWER
& L
IGH
TIN
G CO
MPA
NY
LTD.
REGION 2003/04 2004/05 2005/06 2006/07 2007/08 2008/09
Nairobi 427 453 481 522 548 568
Coast 141 152 164 179 180 199
West 166 176 178 195 212 217
Mt. Kenya 81 86 90 100 113 118
TOTAL SYSTEM* (SIMULTANEOUS) 830 884 916 979 1,036 1,070
% INCREASE P.A. 5.6% 6.5% 3.7% 6.8% 5.8% 3.3%
TABLE 2: Regional Maximum Demand (MW)
TABLE 3: KPLC Sales in GWh by Customer Category**
TABLE 4: Total Units Sales by Region in GWh
*The Total System Peak demand excludes export demand.
** Due to Tariff Categories review with effect from July 2008, the sales have been reviewed to reflect the same.
*** Exports from 2007/08 were to Uganda from Aggreko via KPLC.
TARIFF TYPES OF CUSTOMERS COVERED BY THIS TARIFF 2003/04 2004/05 2005/06* 2006/07 2007/08 2008/09
DC Domestic 900 956 1,028 1,113 1,255 1,254
SC Small Commercial 476 522 522 558 590 823
B Commercial (Medium) & Industrial (Medium) 819 885 901 985 996 n/a
C Commercial (Large) & Industrial (Large) 1,683 1,776 1,877 2,054 2,108 n/a
CI Commercial and Industrial 3,020
IT Off-peak 55 53 54 50 74 43
SL Street lighting 7 8 9 11 13 15
TOTAL 3,940 4,200 4,391 4,771 5,036 5,155
% INCREASE P.A. 7.8% 6.6% 4.5% 8.7% 5.6% 2.4%
REGION 2003/04 2004/05 2005/06 2006/07 2007/08 2008/09
Nairobi 2,075 2,234 2,371 2,595 2,782 2,898
Coast 759 808 844 908 929 979
West 741 792 805 872 902 867
Mt. Kenya 365 366 371 396 423 411
KPLC Sales 3,940 4,200 4,391 4,771 5,036 5,155
R.E.P. Schemes 150 164 165 221 240 250
Export Sales*** 15 24 73 46 27
TOTAL 4,090 4,379 4,580 5,065 5,322 5,432
%INCREASE P.A. 7.6% 7.1% 4.6% 10.6% 5.1% 2.1%
Statistical Information
TABLE 5: Regional Sale of Electricity in GWh for Category “DC” Domestic Load
TABLE 6: Regional Sale of Electricity in GWh for Category “SC” Small Commercial Load
TABLE 7: Regional Sale of Electricity in GWh for Category “BO” Irrigation Load
TABLE 8: Regional Sale of Electricity in GWh for Category “B1” Medium Commercial & Industrial Load (240V or 415V)
REGION 2003/04 2004/05 2005/06* 2006/07 2007/08 2008/09
Nairobi 582 622 666 719 808 800
Coast 153 165 178 194 214 214West 104 112 122 132 152 156Mt. Kenya 54 57 62 68 81 84
TOTAL 892 956 1,028 1,113 1,255 1,254
% INCREASE P.A. 7.4% 7.1% 7.6% 8.3% 12.8% -0.1%
REGION 2003/04 2004/05 2005/06 2006/07 2007/08 2008/09
Nairobi 230 245 244 263 271 400
Coast 70 79 79 85 91 127
West 114 120 126 134 143 187
Mt. Kenya 62 79 73 76 85 109
TOTAL 476 522 522 558 590 823
% INCREASE P.A. 5.8% 9.7% -0.1% 6.9% 5.7% 39.5%
REGION 2003/04 2004/05 2005/06 2006/07 2007/08 2008/09
Nairobi 5.0 4.3 7.0 6.8 5.5
Coast 0.4 0.5 0.4 0.3 0.3
West 13.5 15.6 18.0 17.7 15.7
Mt. Kenya 19.0 17.7 22.0 17.5 15.9
TOTAL 38 38 47 42 37 0
% INCREASE P.A. 4.7% 0.7% 24.5% -10.8% -11.6% -100.0%
REGION 2003/04 2004/05 2005/06 2006/07 2007/08 2008/09
Nairobi 424 459 472 524 536
Coast 126 133 129 139 139
West 146 154 159 173 175
Mt. Kenya 58 64 69 74 78
TOTAL 754 811 829 910 928 0
% INCREASE P.A. 9.3% 7.6% 2.2% 9.8% 2.0% -100.0%
Statistical Information
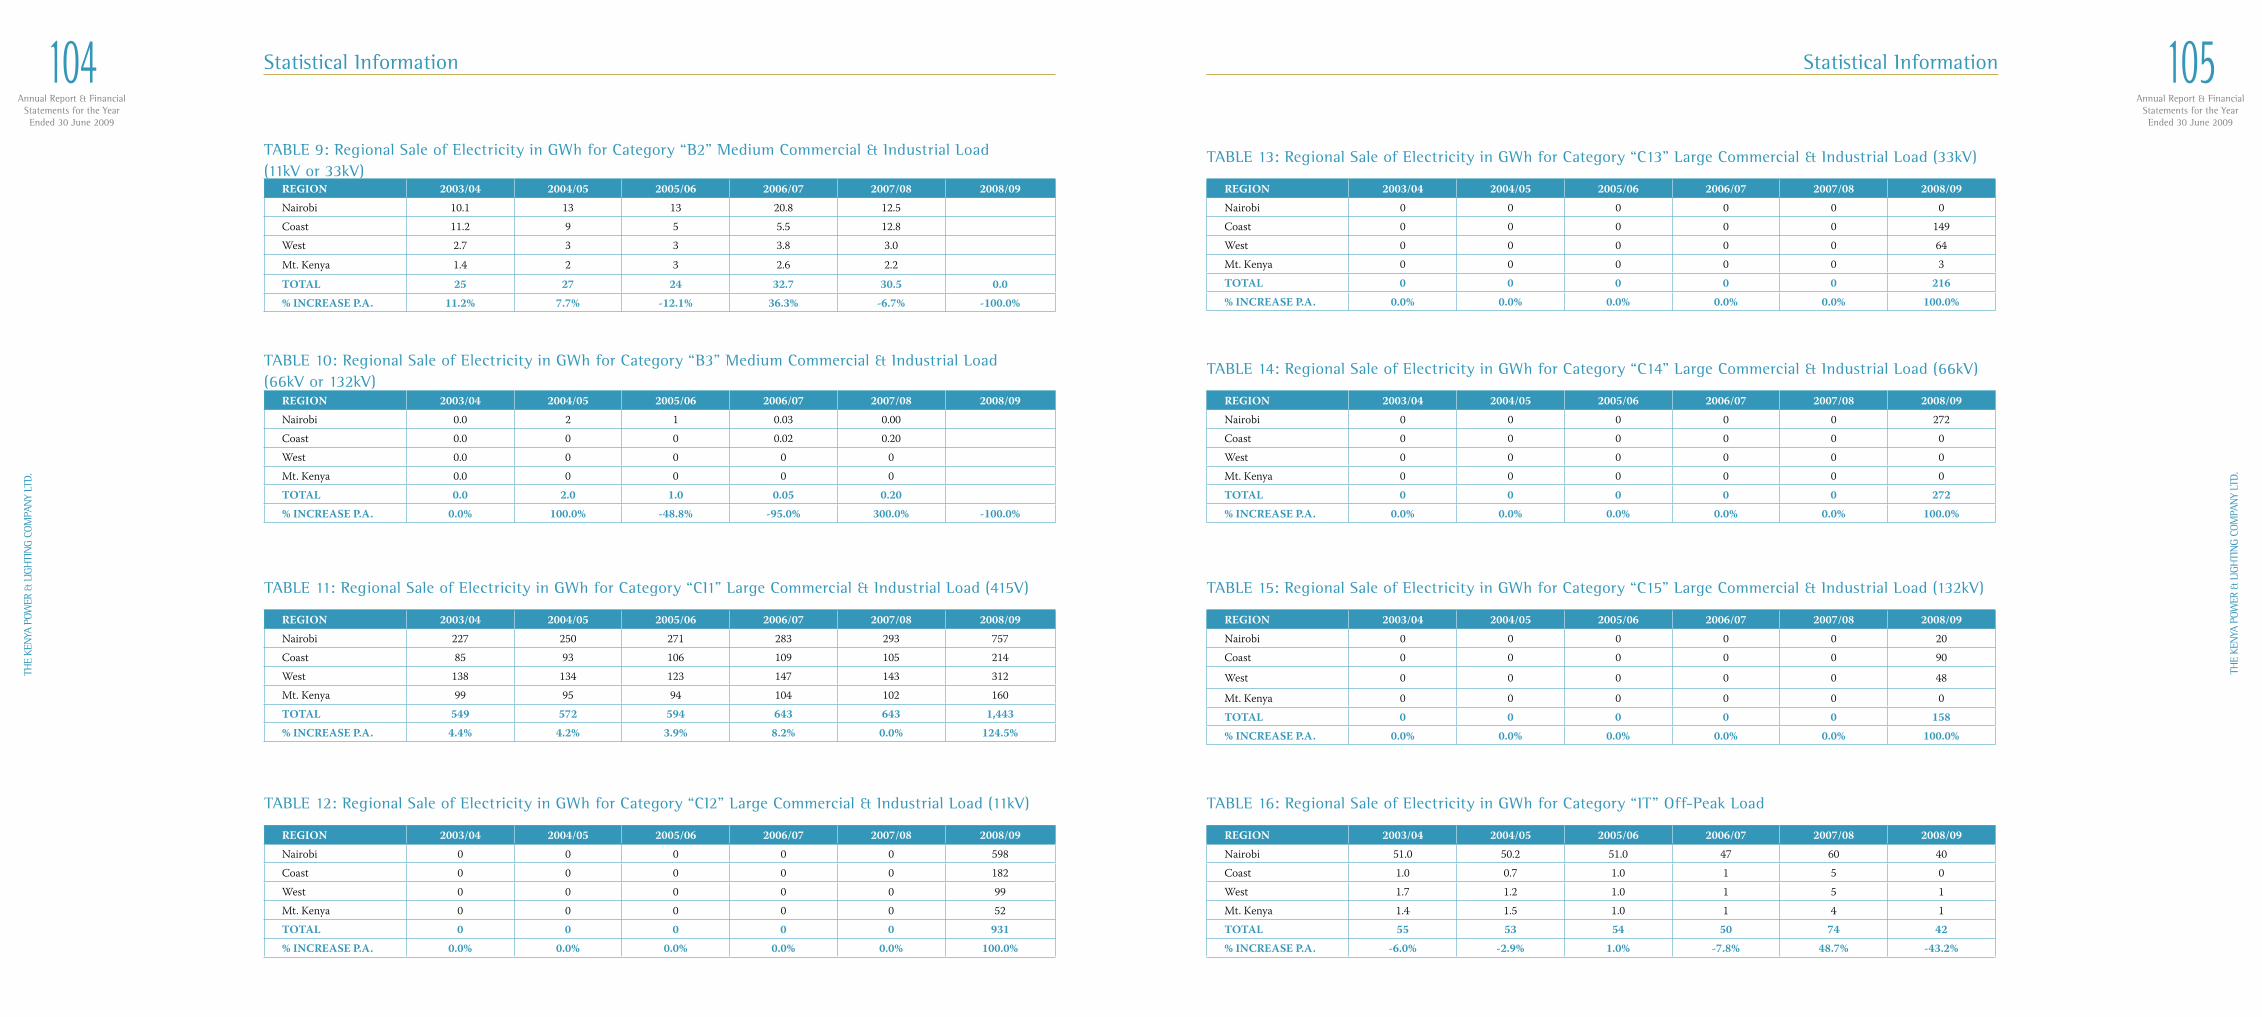
Annual Report & FinancialStatements for the YearEnded 30 June 2009
104TH
E KE
NYA
POW
ER &
LIG
HTI
NG
COM
PAN
Y LT
D.
Annual Report & FinancialStatements for the YearEnded 30 June 2009
105
THE
KEN
YA P
OWER
& L
IGH
TIN
G CO
MPA
NY
LTD.
TABLE 9: Regional Sale of Electricity in GWh for Category “B2” Medium Commercial & Industrial Load (11kV or 33kV)
TABLE 10: Regional Sale of Electricity in GWh for Category “B3” Medium Commercial & Industrial Load (66kV or 132kV)
TABLE 11: Regional Sale of Electricity in GWh for Category “CI1” Large Commercial & Industrial Load (415V)
TABLE 12: Regional Sale of Electricity in GWh for Category “CI2” Large Commercial & Industrial Load (11kV)
REGION 2003/04 2004/05 2005/06 2006/07 2007/08 2008/09
Nairobi 10.1 13 13 20.8 12.5
Coast 11.2 9 5 5.5 12.8
West 2.7 3 3 3.8 3.0
Mt. Kenya 1.4 2 3 2.6 2.2
TOTAL 25 27 24 32.7 30.5 0.0
% INCREASE P.A. 11.2% 7.7% -12.1% 36.3% -6.7% -100.0%
REGION 2003/04 2004/05 2005/06 2006/07 2007/08 2008/09
Nairobi 0.0 2 1 0.03 0.00
Coast 0.0 0 0 0.02 0.20
West 0.0 0 0 0 0
Mt. Kenya 0.0 0 0 0 0
TOTAL 0.0 2.0 1.0 0.05 0.20
% INCREASE P.A. 0.0% 100.0% -48.8% -95.0% 300.0% -100.0%
REGION 2003/04 2004/05 2005/06 2006/07 2007/08 2008/09
Nairobi 227 250 271 283 293 757
Coast 85 93 106 109 105 214
West 138 134 123 147 143 312
Mt. Kenya 99 95 94 104 102 160
TOTAL 549 572 594 643 643 1,443
% INCREASE P.A. 4.4% 4.2% 3.9% 8.2% 0.0% 124.5%
REGION 2003/04 2004/05 2005/06 2006/07 2007/08 2008/09
Nairobi 0 0 0 0 0 598
Coast 0 0 0 0 0 182
West 0 0 0 0 0 99
Mt. Kenya 0 0 0 0 0 52
TOTAL 0 0 0 0 0 931
% INCREASE P.A. 0.0% 0.0% 0.0% 0.0% 0.0% 100.0%
Statistical Information
TABLE 13: Regional Sale of Electricity in GWh for Category “C13” Large Commercial & Industrial Load (33kV)
TABLE 14: Regional Sale of Electricity in GWh for Category “C14” Large Commercial & Industrial Load (66kV)
TABLE 15: Regional Sale of Electricity in GWh for Category “C15” Large Commercial & Industrial Load (132kV)
TABLE 16: Regional Sale of Electricity in GWh for Category “IT” Off-Peak Load
REGION 2003/04 2004/05 2005/06 2006/07 2007/08 2008/09
Nairobi 0 0 0 0 0 0
Coast 0 0 0 0 0 149
West 0 0 0 0 0 64
Mt. Kenya 0 0 0 0 0 3
TOTAL 0 0 0 0 0 216
% INCREASE P.A. 0.0% 0.0% 0.0% 0.0% 0.0% 100.0%
REGION 2003/04 2004/05 2005/06 2006/07 2007/08 2008/09
Nairobi 0 0 0 0 0 272
Coast 0 0 0 0 0 0
West 0 0 0 0 0 0
Mt. Kenya 0 0 0 0 0 0
TOTAL 0 0 0 0 0 272
% INCREASE P.A. 0.0% 0.0% 0.0% 0.0% 0.0% 100.0%
REGION 2003/04 2004/05 2005/06 2006/07 2007/08 2008/09
Nairobi 0 0 0 0 0 20
Coast 0 0 0 0 0 90
West 0 0 0 0 0 48
Mt. Kenya 0 0 0 0 0 0
TOTAL 0 0 0 0 0 158
% INCREASE P.A. 0.0% 0.0% 0.0% 0.0% 0.0% 100.0%
REGION 2003/04 2004/05 2005/06 2006/07 2007/08 2008/09
Nairobi 51.0 50.2 51.0 47 60 40
Coast 1.0 0.7 1.0 1 5 0
West 1.7 1.2 1.0 1 5 1
Mt. Kenya 1.4 1.5 1.0 1 4 1
TOTAL 55 53 54 50 74 42
% INCREASE P.A. -6.0% -2.9% 1.0% -7.8% 48.7% -43.2%
Statistical Information
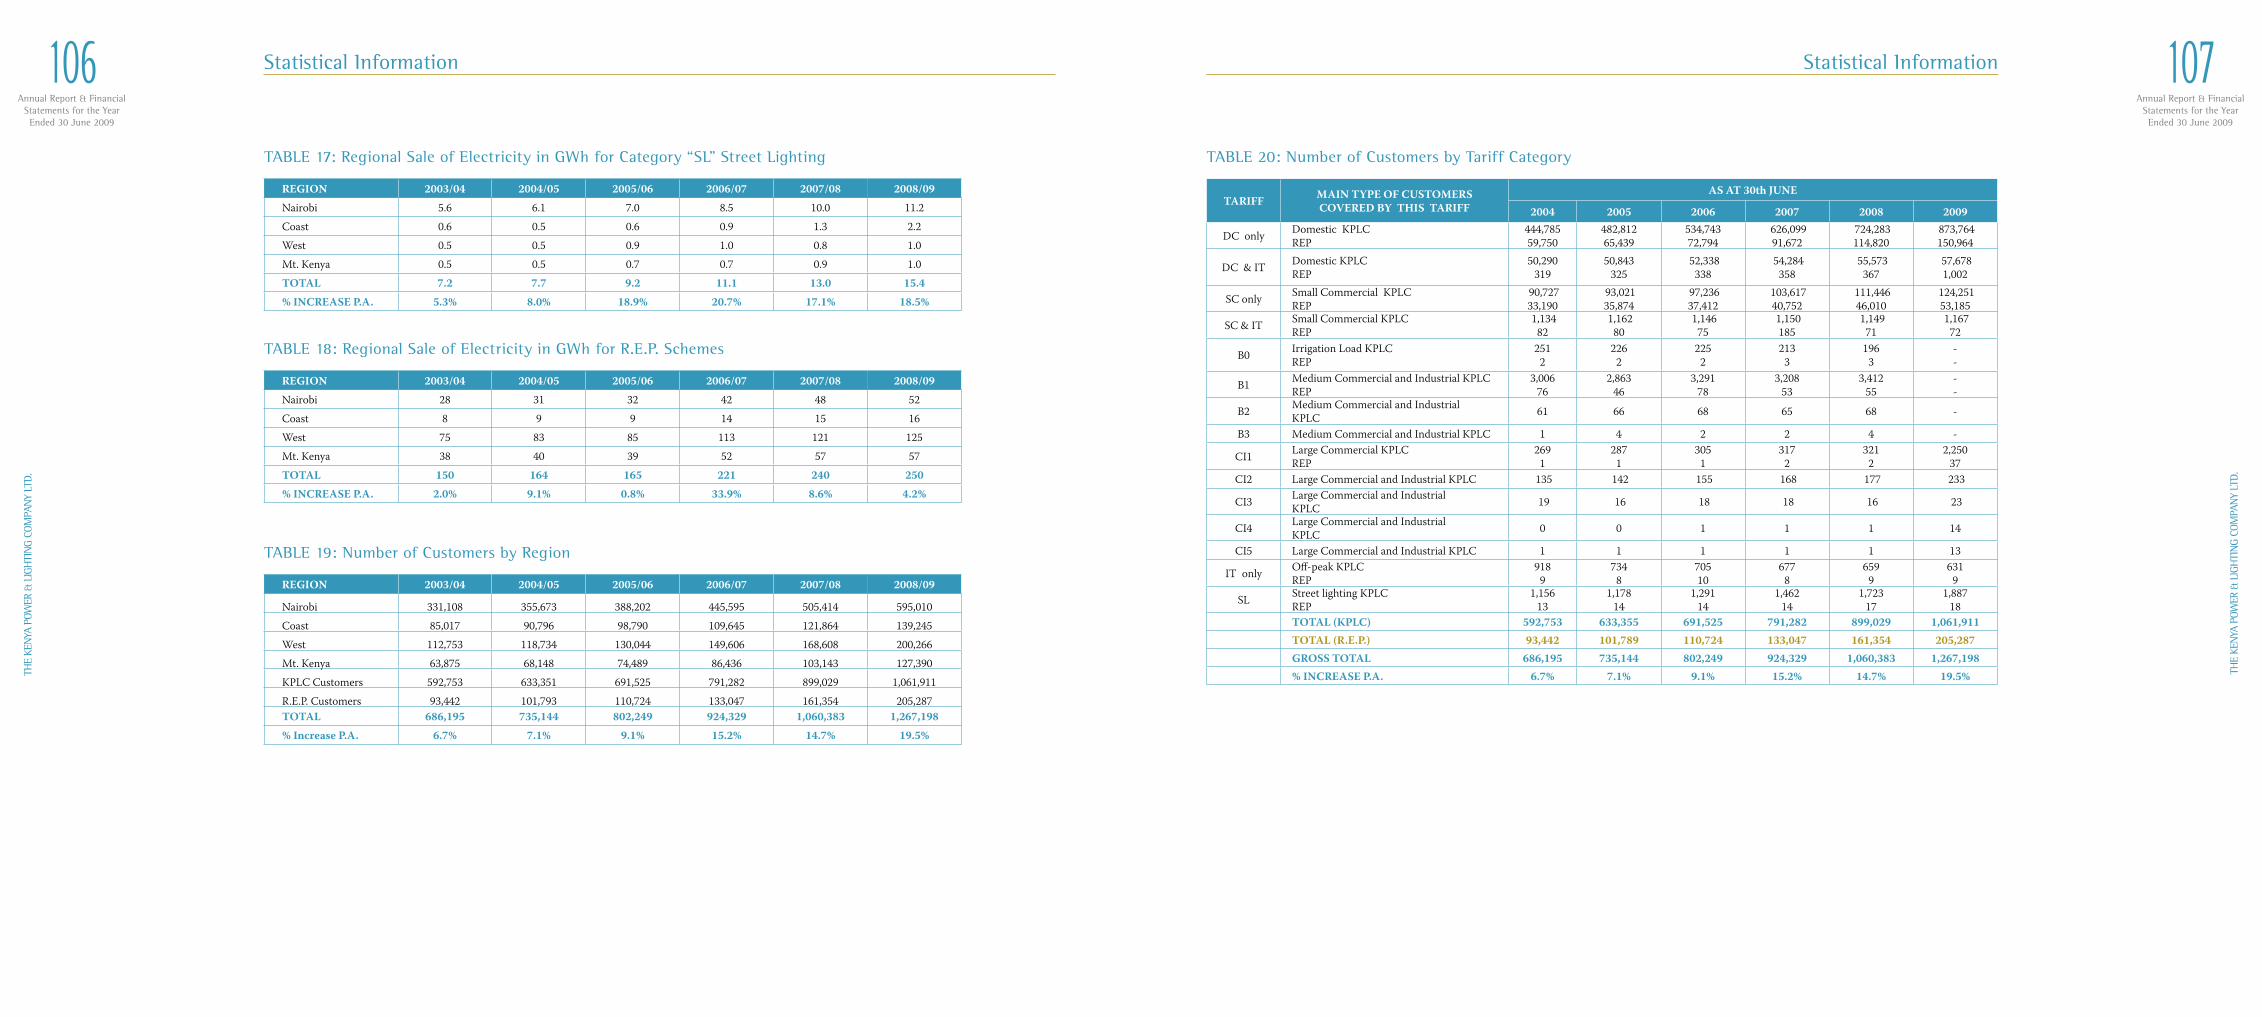
Annual Report & FinancialStatements for the YearEnded 30 June 2009
106TH
E KE
NYA
POW
ER &
LIG
HTI
NG
COM
PAN
Y LT
D.
Annual Report & FinancialStatements for the YearEnded 30 June 2009
107
THE
KEN
YA P
OWER
& L
IGH
TIN
G CO
MPA
NY
LTD.
TABLE 17: Regional Sale of Electricity in GWh for Category “SL” Street Lighting
TABLE 18: Regional Sale of Electricity in GWh for R.E.P. Schemes
TABLE 19: Number of Customers by Region
REGION 2003/04 2004/05 2005/06 2006/07 2007/08 2008/09
Nairobi 28 31 32 42 48 52
Coast 8 9 9 14 15 16
West 75 83 85 113 121 125
Mt. Kenya 38 40 39 52 57 57
TOTAL 150 164 165 221 240 250
% INCREASE P.A. 2.0% 9.1% 0.8% 33.9% 8.6% 4.2%
REGION 2003/04 2004/05 2005/06 2006/07 2007/08 2008/09
Nairobi 5.6 6.1 7.0 8.5 10.0 11.2
Coast 0.6 0.5 0.6 0.9 1.3 2.2
West 0.5 0.5 0.9 1.0 0.8 1.0
Mt. Kenya 0.5 0.5 0.7 0.7 0.9 1.0
TOTAL 7.2 7.7 9.2 11.1 13.0 15.4
% INCREASE P.A. 5.3% 8.0% 18.9% 20.7% 17.1% 18.5%
REGION 2003/04 2004/05 2005/06 2006/07 2007/08 2008/09
Nairobi 331,108 355,673 388,202 445,595 505,414 595,010
Coast 85,017 90,796 98,790 109,645 121,864 139,245
West 112,753 118,734 130,044 149,606 168,608 200,266
Mt. Kenya 63,875 68,148 74,489 86,436 103,143 127,390
KPLC Customers 592,753 633,351 691,525 791,282 899,029 1,061,911
R.E.P. Customers 93,442 101,793 110,724 133,047 161,354 205,287TOTAL 686,195 735,144 802,249 924,329 1,060,383 1,267,198
% Increase P.A. 6.7% 7.1% 9.1% 15.2% 14.7% 19.5%
Statistical Information
TARIFF MAIN TYPE OF CUSTOMERSCOVERED BY THIS TARIFF
AS AT 30th JUNE
2004 2005 2006 2007 2008 2009
DC only Domestic KPLC REP
444,78559,750
482,81265,439
534,74372,794
626,09991,672
724,283114,820
873,764150,964
DC & IT Domestic KPLC REP
50,290319
50,843325
52,338338
54,284358
55,573367
57,6781,002
SC only Small Commercial KPLC REP
90,72733,190
93,02135,874
97,23637,412
103,61740,752
111,44646,010
124,25153,185
SC & IT Small Commercial KPLC REP
1,13482
1,16280
1,14675
1,150185
1,14971
1,16772
B0 Irrigation Load KPLC REP
2512
2262
2252
2133
1963
- -
B1 Medium Commercial and Industrial KPLC REP
3,00676
2,86346
3,29178
3,20853
3,41255
- -
B2 Medium Commercial and IndustrialKPLC 61 66 68 65 68 -
B3 Medium Commercial and Industrial KPLC 1 4 2 2 4 -
CI1 Large Commercial KPLC REP
2691
2871
3051
3172
3212
2,25037
CI2 Large Commercial and Industrial KPLC 135 142 155 168 177 233
CI3 Large Commercial and IndustrialKPLC 19 16 18 18 16 23
CI4 Large Commercial and IndustrialKPLC 0 0 1 1 1 14
CI5 Large Commercial and Industrial KPLC 1 1 1 1 1 13
IT only Off-peak KPLC REP
9189
7348
70510
6778
6599
6319
SL Street lighting KPLC REP
1,15613
1,17814
1,29114
1,46214
1,72317
1,88718
TOTAL (KPLC) 592,753 633,355 691,525 791,282 899,029 1,061,911 TOTAL (R.E.P.) 93,442 101,789 110,724 133,047 161,354 205,287 GROSS TOTAL 686,195 735,144 802,249 924,329 1,060,383 1,267,198 % INCREASE P.A. 6.7% 7.1% 9.1% 15.2% 14.7% 19.5%
TABLE 20: Number of Customers by Tariff Category
Statistical Information
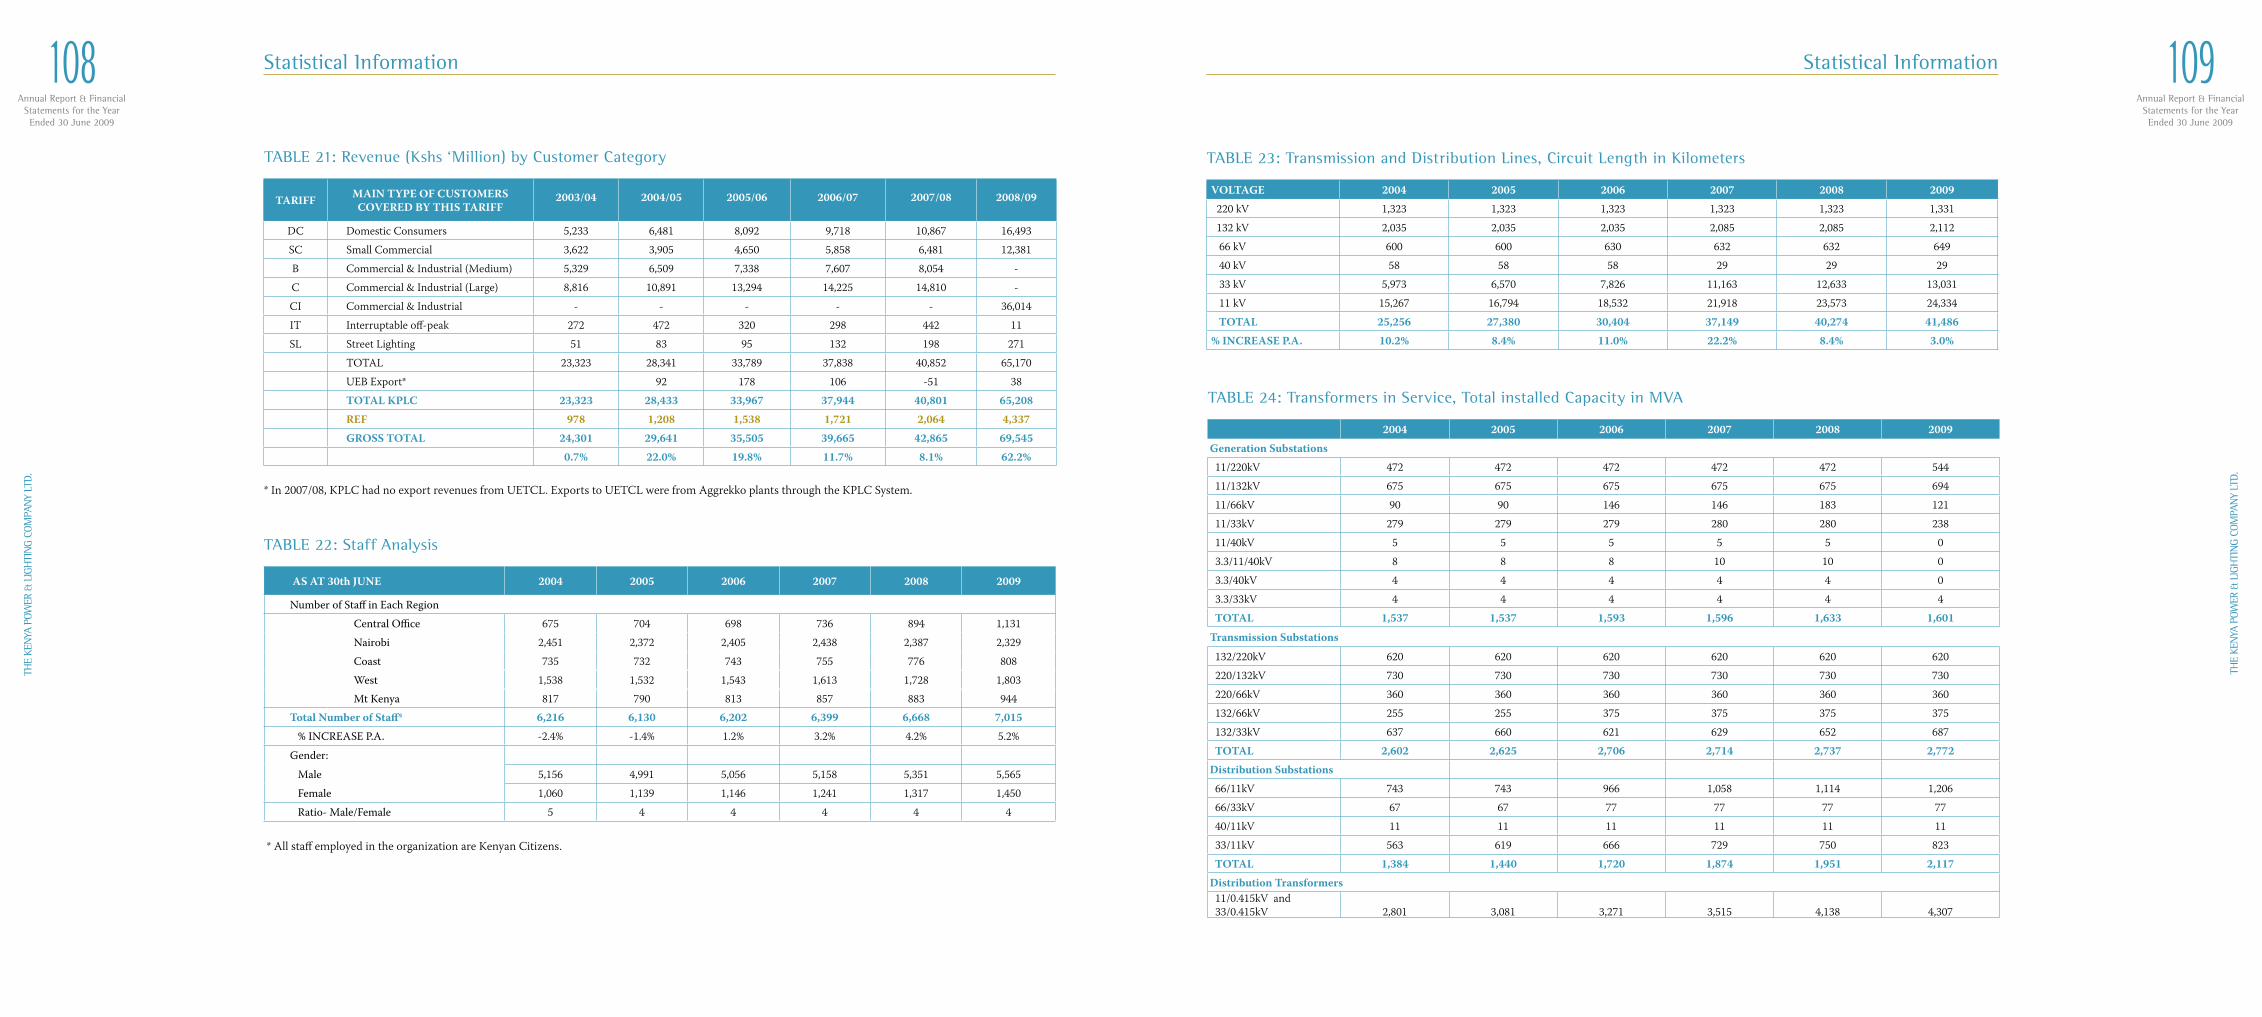
Annual Report & FinancialStatements for the YearEnded 30 June 2009
108TH
E KE
NYA
POW
ER &
LIG
HTI
NG
COM
PAN
Y LT
D.
Annual Report & FinancialStatements for the YearEnded 30 June 2009
109
THE
KEN
YA P
OWER
& L
IGH
TIN
G CO
MPA
NY
LTD.
TARIFF MAIN TYPE OF CUSTOMERSCOVERED BY THIS TARIFF
2003/04
2004/05
2005/06
2006/07
2007/08
2008/09
DC Domestic Consumers 5,233 6,481 8,092 9,718 10,867 16,493
SC Small Commercial 3,622 3,905 4,650 5,858 6,481 12,381
B Commercial & Industrial (Medium) 5,329 6,509 7,338 7,607 8,054 -
C Commercial & Industrial (Large) 8,816 10,891 13,294 14,225 14,810 -
CI Commercial & Industrial - - - - - 36,014
IT Interruptable off-peak 272 472 320 298 442 11
SL Street Lighting 51 83 95 132 198 271
TOTAL 23,323 28,341 33,789 37,838 40,852 65,170
UEB Export* 92 178 106 -51 38
TOTAL KPLC 23,323 28,433 33,967 37,944 40,801 65,208
REF 978 1,208 1,538 1,721 2,064 4,337
GROSS TOTAL 24,301 29,641 35,505 39,665 42,865 69,545
0.7% 22.0% 19.8% 11.7% 8.1% 62.2%
* In 2007/08, KPLC had no export revenues from UETCL. Exports to UETCL were from Aggrekko plants through the KPLC System.
* All staff employed in the organization are Kenyan Citizens.
AS AT 30th JUNE 2004 2005 2006 2007 2008 2009
Number of Staff in Each Region
Central Office 675 704 698 736 894 1,131
Nairobi 2,451 2,372 2,405 2,438 2,387 2,329
Coast 735 732 743 755 776 808
West 1,538 1,532 1,543 1,613 1,728 1,803 Mt Kenya 817 790 813 857 883 944 Total Number of Staff* 6,216 6,130 6,202 6,399 6,668 7,015
% INCREASE P.A. -2.4% -1.4% 1.2% 3.2% 4.2% 5.2%
Gender:
Male 5,156 4,991 5,056 5,158 5,351 5,565
Female 1,060 1,139 1,146 1,241 1,317 1,450
Ratio- Male/Female 5 4 4 4 4 4
TABLE 21: Revenue (Kshs ‘Million) by Customer Category
TABLE 22: Staff Analysis
Statistical Information
TABLE 23: Transmission and Distribution Lines, Circuit Length in Kilometers
VOLTAGE 2004 2005 2006 2007 2008 2009
220 kV 1,323 1,323 1,323 1,323 1,323 1,331
132 kV 2,035 2,035 2,035 2,085 2,085 2,112
66 kV 600 600 630 632 632 649
40 kV 58 58 58 29 29 29
33 kV 5,973 6,570 7,826 11,163 12,633 13,031
11 kV 15,267 16,794 18,532 21,918 23,573 24,334
TOTAL 25,256 27,380 30,404 37,149 40,274 41,486
% INCREASE P.A. 10.2% 8.4% 11.0% 22.2% 8.4% 3.0%
2004 2005 2006 2007 2008 2009
Generation Substations
11/220kV 472 472 472 472 472 544
11/132kV 675 675 675 675 675 694
11/66kV 90 90 146 146 183 121
11/33kV 279 279 279 280 280 238
11/40kV 5 5 5 5 5 0
3.3/11/40kV 8 8 8 10 10 0
3.3/40kV 4 4 4 4 4 0
3.3/33kV 4 4 4 4 4 4
TOTAL 1,537 1,537 1,593 1,596 1,633 1,601
Transmission Substations
132/220kV 620 620 620 620 620 620
220/132kV 730 730 730 730 730 730
220/66kV 360 360 360 360 360 360
132/66kV 255 255 375 375 375 375
132/33kV 637 660 621 629 652 687
TOTAL 2,602 2,625 2,706 2,714 2,737 2,772
Distribution Substations
66/11kV 743 743 966 1,058 1,114 1,206
66/33kV 67 67 77 77 77 77
40/11kV 11 11 11 11 11 11
33/11kV 563 619 666 729 750 823
TOTAL 1,384 1,440 1,720 1,874 1,951 2,117
Distribution Transformers 11/0.415kV and 33/0.415kV
2,801
3,081
3,271
3,515
4,138
4,307
TABLE 24: Transformers in Service, Total installed Capacity in MVA
Statistical Information

Annual Report & FinancialStatements for the YearEnded 30 June 2009
110TH
E KE
NYA
POW
ER &
LIG
HTI
NG
COM
PAN
Y LT
D.
NOTES