Embed Size (px)
Citation preview
33
STATES/UTS & CPFS POLICE STRENGTH
State Wise Data on :l Sanctioned and Actual Police
Strength(Civil + Armed)
l Police - Population & Police - Area Ratio
l Officers to Constabulary Ratio
l Women Police Strength(Civil + Armed)
l Traffic Police Strength
l Sanctioned & Actual Strength of SpecialBranch dealing with Intelligence.
l Sanctioned & Actual Strength of CID ofCrime Branch
l Sanctioned & Actual Strength of SpecialTask Force
l Sanctioned Strength of Civil & ArmedPolice in Metro cities with PoliceCommissioner System.
l Sanctioned & Actual Strength of SomeCentral Police Forces (CPFs)
This chapter gives information on State/UTwise sanctioned & actual strength of Civil Policeincluding District Armed Police, State Armed Policeand Total strength of Police; Police-PopulationRatio for sanctioned & actual police strength; CivilPolice and Total Police-Area Ratio ; Rank wisesanctioned & actual strength of Police Force andOfficers to Constabulary Ratio; Rankwisesanctioned & actual strength of some CentralPolice Forces (CPFs). It also tells about Rankwise strength of Women Police and Traffic Police;Rank wise strength of Civil and Armed Police;Officers to Constabulary Ratio in Metro Cities withpopulation more than 10 lakhs or and havingPolice Commissionrate system.
An attempt has been made to collect andcompile the information on Rankwise Sanctioned& Actual Strength of Special Branch dealing withIntelligence; rank wise Sanctioned & Actual Strengthof CID of Crime Branch with Investigation of Crime;and Sanctioned & Actual Strength of Special Task
Force to deal with Insurgents/Extremists/Terrorists/organized Criminal Gangs. The requiredinformation has been received from a number ofStates/UTs and the same has been indicatedaccordingly.
Sanctioned strength
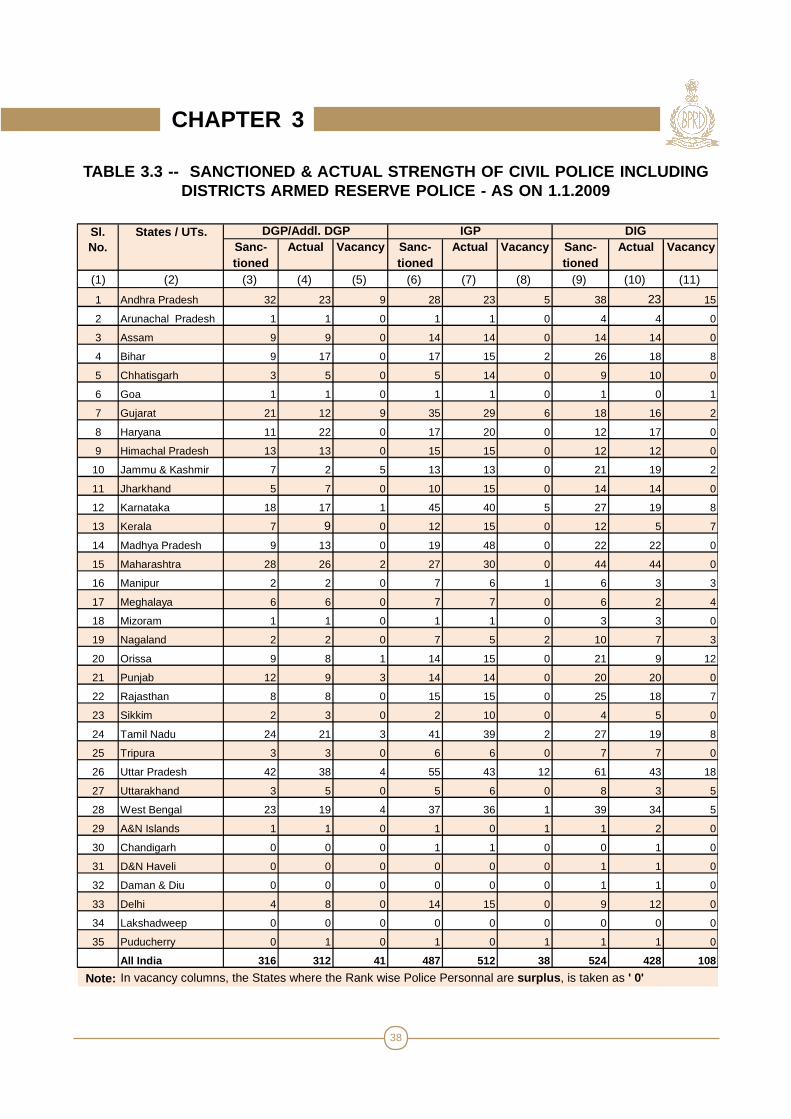
Analysis of the data on sanctioned strengthof State Police Forces shows that as on 01.01.2009out of 20.56 lakhs (2.056 millions) of total policeforce in the entire country 16.19 lakhs (1.619millions) was Civil Police including District ArmedPolice and the remaining 4.37 lakhs (0.437 million)was State Armed Police. Strength of Civil Policewas highest in Uttar Pradesh (3,31,796), followedby Maharashtra (1,85,118) and Andhra Pradesh(1,02,765).
The strength of Armed Police was maximumin Assam (53,450), followed by Uttar Pradesh(36,214) and Jammu & Kashmir (25,787). State-wise details are given in Table - 3.1. (Page No. 36)
Actual Strength
Data on rank wise Actual strength of CivilPolice, Armed Police and Total Police receivedhas been tabulated and analyzed with referenceto the Actual Strength vis-à-vis SanctionedStrength. According to this at National level thefollowing trends are visible from this data:
State-wise details are given in Table - 3.2 (PageNo. 37)
Total Police - Population Ratio
The total Police - Population Ratio {totalsanctioned number of police personnel available
Sr. No. Items Sanctioned Actual
(i) Civil Police per 139.92 103.20lakh of Population
(ii) Total Police per 177.67 134.28lakh of Population
(iii) Civil Police per 51.14 37.72100 Sq. Kms. of Area
(iv) Total Police per 64.93 49.08100 Sq. kms. of Area
CHAPTER 3
34
CHAPTER 3
per lakh (one hundred thousand) of statepopulation} has shown wide variations across thecountry. Sparsely populated States of Tripura(1162), Nagaland (1038) and Mizoram (1029)have the maximum Police-Population Ratio ascompared to national average of 178 policepersonnel per lakh (one hundred thousand) ofpopulation. Details are given in Table - 3.2. (PageNo. 37)
However, more populous states haverelatively much less sanctioned strength of policeforce than warranted by their total population i.e.Bihar (90), West Bengal (100) Madhya Pradesh(111) and Rajasthan (120) per one lakh ofpopulation.
Total Police - Area Ratio
An important criteria for effective and efficientpolice working is the number of policemen availableper 100 sq. km. - popularly known as Police - AreaRatio.
As expected smaller States/UTs have higherpolice-area ratio than bigger States.Consequently for sanctioned strength themaximum number of policemen available per 100sq. kms. as on 01.01.2009 was in Delhi (5055)followed by Chandigarh (4060) and Lakshadweep(1091).
This ratio is minimum in Arunachal Pradesh(9), Rajasthan (23) and Madhya Pradesh (25).Details are given in Table - 3.2. (Page No. 37)
Rank wise Sanctioned Strength & Officers toConstabulary Ratio
It is popularly known as teeth to tail ratio .It is an important indicator of the relative strengthbetween rank and officers of a force. It is also animportant criteria for management and planningfor the correct composition of the Police Force.Officers include Police Officers of the rank ofAssistant Sub-Inspector (ASI) and above andconstabulary ranks include Head constables andConstables only.
This teeth to tail ratio as on 1.1.2009 forsanctioned strength of Civil Police was 1:6.1 while,for Armed Police was 1:12.7 and for total (civil +armed) police forces it was 1:6.9 Details aregiven in Table - 3.4. (Page No. 42)
Strength of Women Police
There were 56,667 women police personnelas on 01.01.2009, showing a marginal decreaseof 799 (1.4%) women police personnel over thestrength of 57,466 as on 01.01.2008. At States/UTs level the maximum 9,105 women policepersonnel were working in Maharashtra alone,followed by 7,728 in Tamil Nadu and 3,580 inDelhi. Details are given in Table - 3.7 (Page No.51)
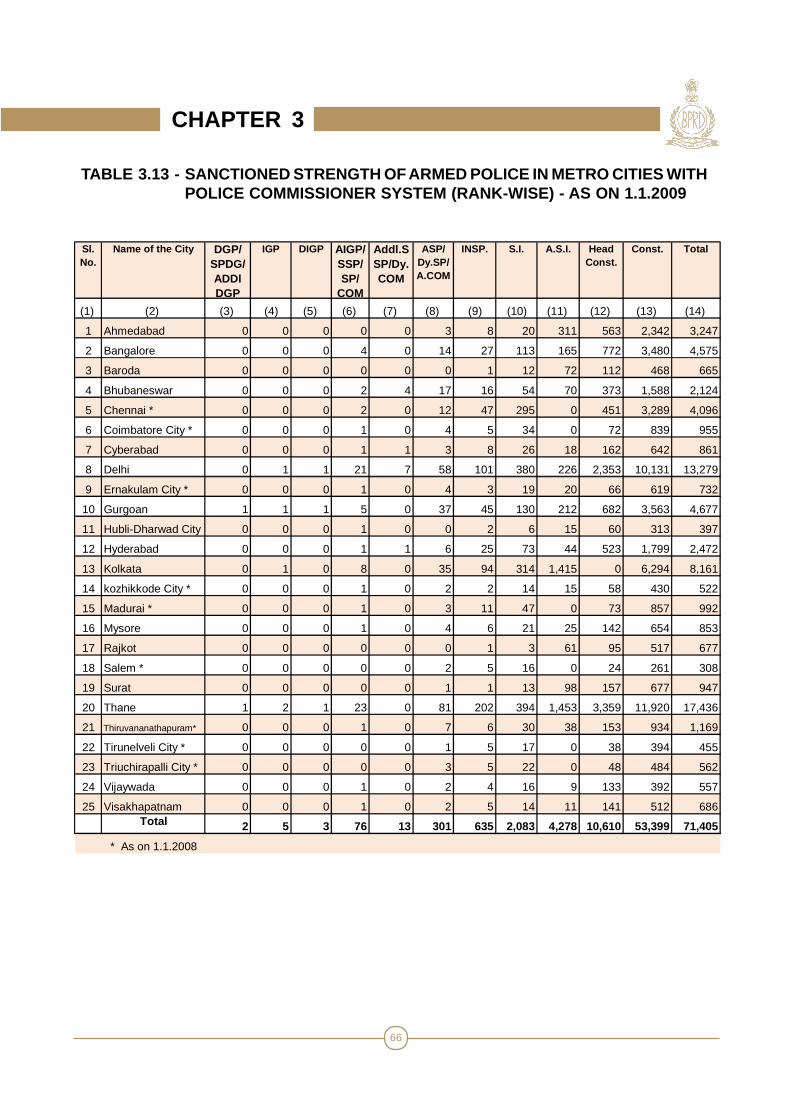
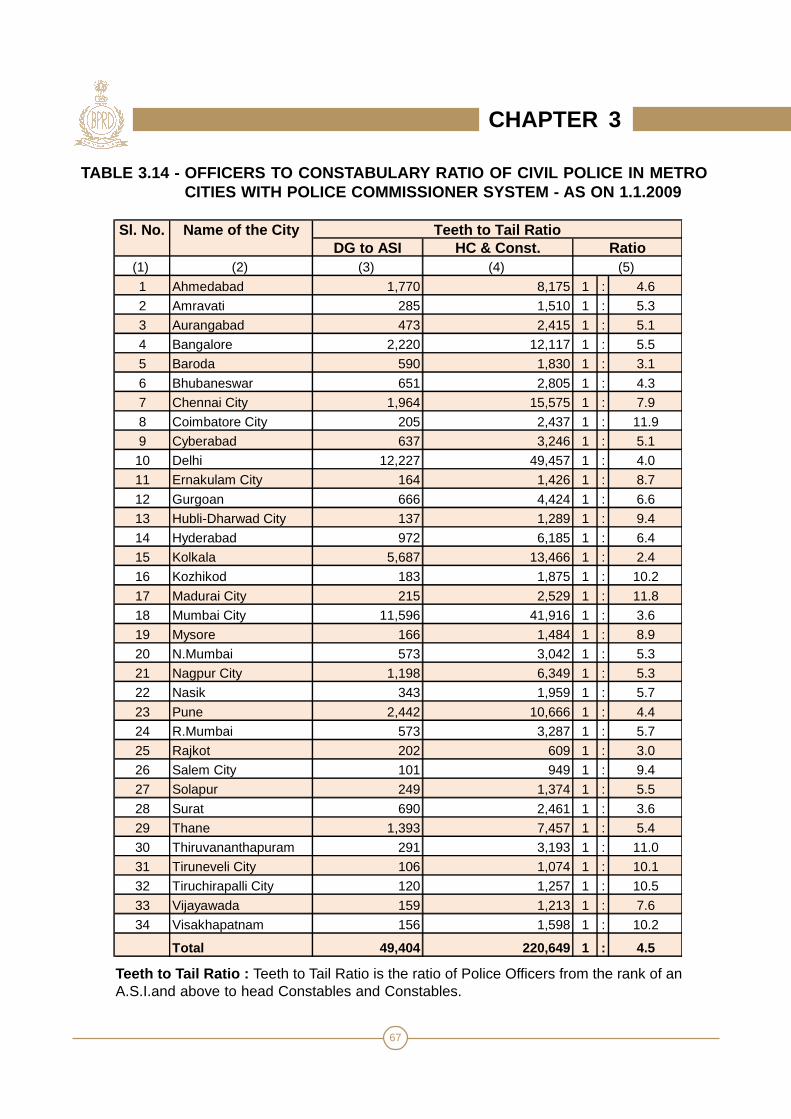
Strength of Civil & Armed Police in Metrocities
Out of all the metro cities in the country ason 1.1.2009, 34 such cities are having PoliceCommissioner system. These 34 metro cities havea total of 1,271 Police Stations. The rank wisestrength of Civil Police personnel in all these citieswas 2,70,053 and that of Armed Police was 71,405.The maximum Civil Police strength 61,684 was inDelhi followed by 53,512 in Mumbai city and 19,153in Kolkata. Maximum strength of Armed Police17,436 was in Thane (Maharashtra), followed by13,279 in Delhi and 8,161 in Kolkata. The officersto constabulary ratio of Civil Police in total for allthese metro cities works out to be 1:4.5 as againstAll India average of 1:6.1. Details are given inTable - 3.14. (Page No. 67)
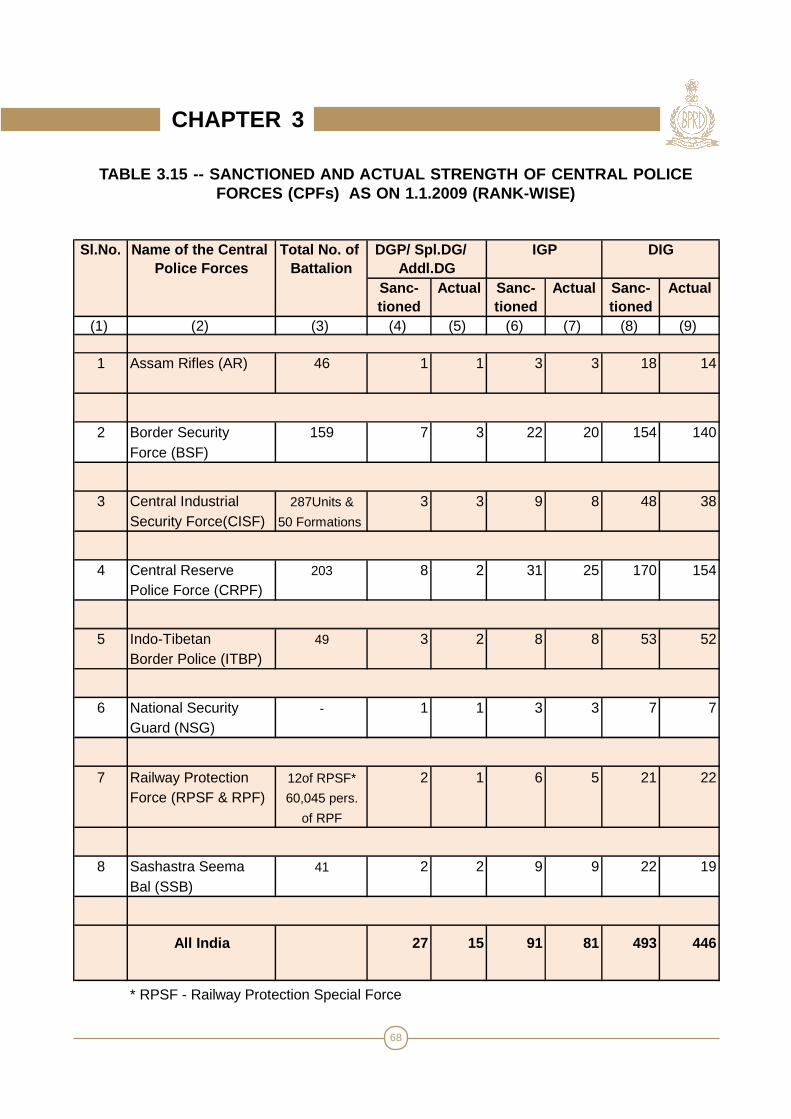
Strength of some Central Police Forces(CPFs)
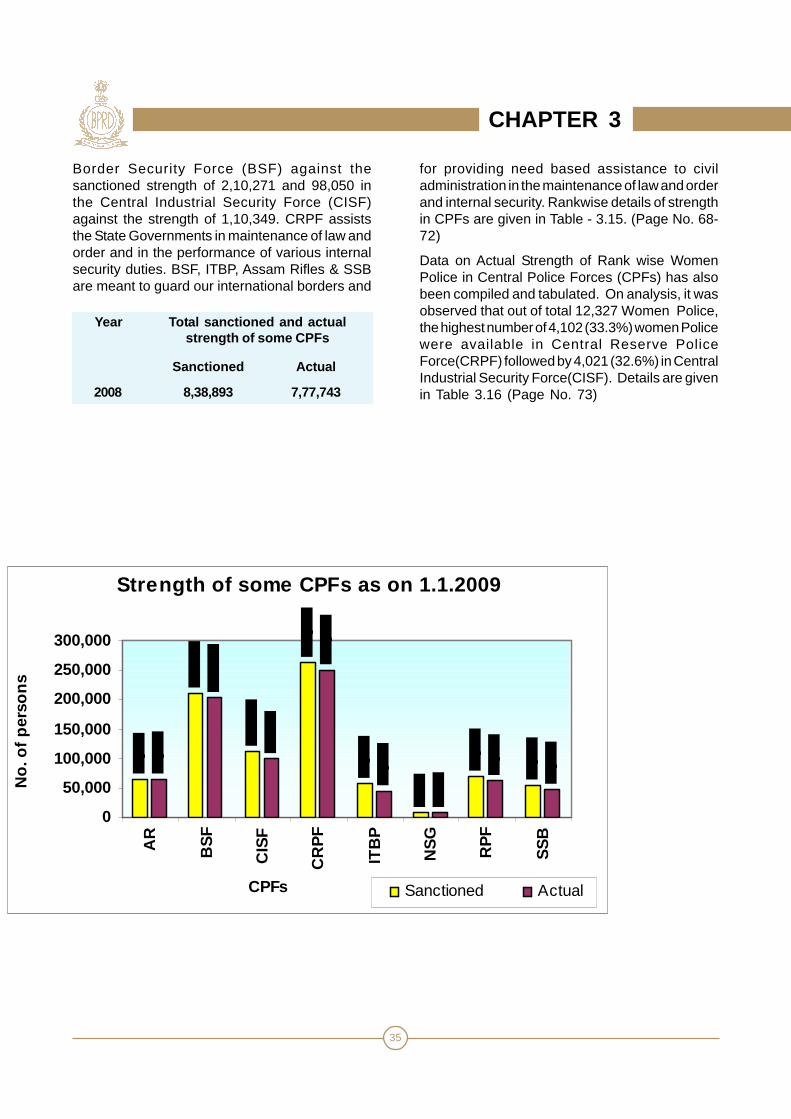
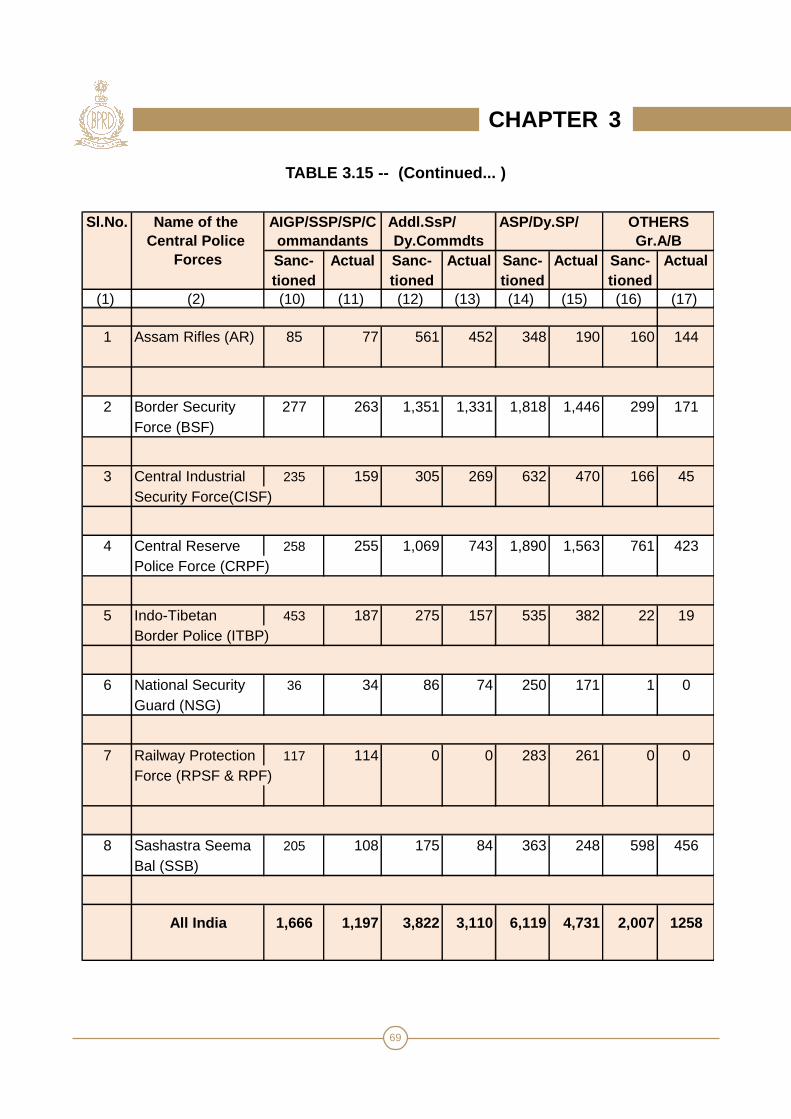
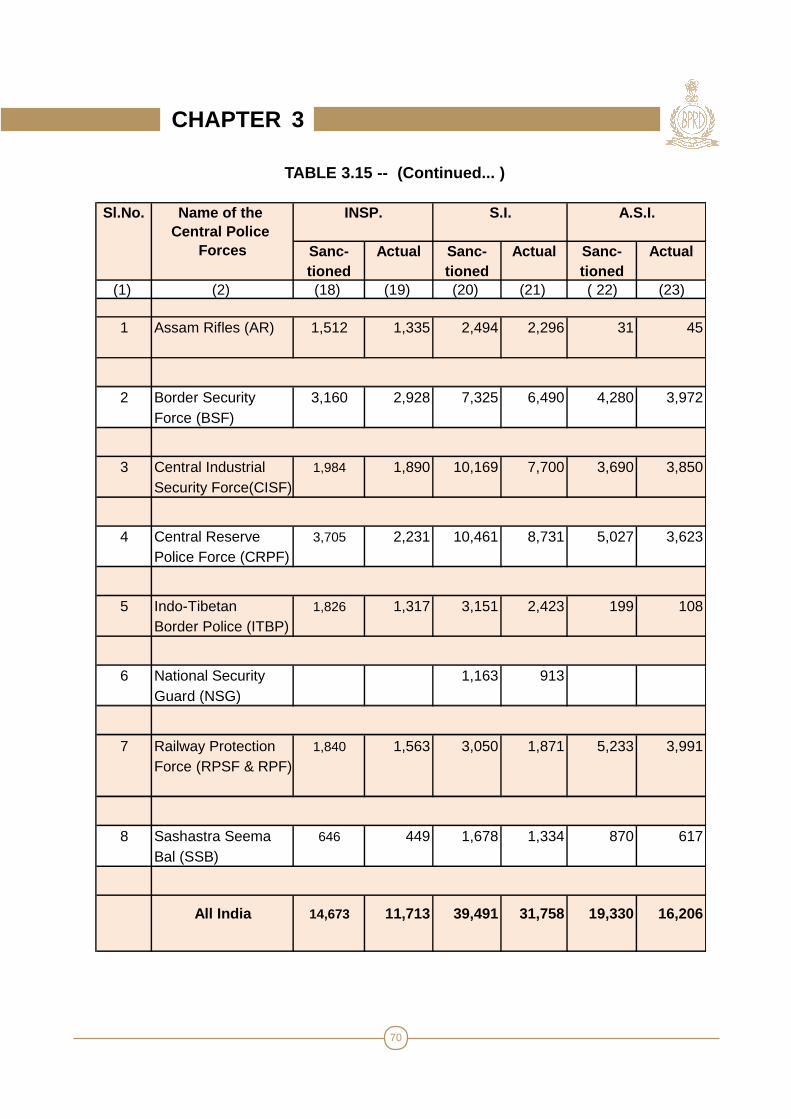
Rankwise sanctioned & actual strength ofsome Central Police Forces (CPFs) have beencompiled. The analysis of data shows that therewere 14,225 Gazetted and 8,24,668 Non-Gazettedofficers adding upto a total sanctioned strengthof 8,38,893 Police Personnel in the CPFs in ourcountry. However, the actual strength was 10,838of Gazetted and 7,66,905 of non Gazetted officers(all ranks) adding up to a total of 7,77,743 policepersonnel available in the CPFs as on 1.1.2009.The maximum number of 2,50,394 policepersonnel were available in the Central ReservePolice Force (CRPF) against the sanctionedstrength of 2,63,598 followed by 2,04,178 in the
Year ASI & H.C. & Ratio above Constables Civil Police 2.29,473 13,89,690 1: 6.1 Armed Police 31,974 4,04,904 1: 12.7 Total 2,61,447 17,94,594 1: 6.9
35
Border Security Force (BSF) against thesanctioned strength of 2,10,271 and 98,050 inthe Central Industrial Security Force (CISF)against the strength of 1,10,349. CRPF assiststhe State Governments in maintenance of law andorder and in the performance of various internalsecurity duties. BSF, ITBP, Assam Rifles & SSBare meant to guard our international borders and
CHAPTER 3
for providing need based assistance to civiladministration in the maintenance of law and orderand internal security. Rankwise details of strengthin CPFs are given in Table - 3.15. (Page No. 68-72)
Data on Actual Strength of Rank wise WomenPolice in Central Police Forces (CPFs) has alsobeen compiled and tabulated. On analysis, it wasobserved that out of total 12,327 Women Police,the highest number of 4,102 (33.3%) women Policewere available in Central Reserve PoliceForce(CRPF) followed by 4,021 (32.6%) in CentralIndustrial Security Force(CISF). Details are givenin Table 3.16 (Page No. 73)
Strength of some CPFs as on 1.1.2009
0
50,000
100,000
150,000
200,000
250,000
300,000
AR
BS
F
CIS
F
CR
PF
ITB
P
NS
G
RP
F
SS
B
CPFs
No.
of p
erso
ns
Sanctioned Actual
Year Total sanctioned and actualstrength of some CPFs
Sanctioned Actual
2008 8,38,893 7,77,743

36
TABLE 3.1- SANCTIONED AND ACTUAL STRENGTH OF TOTALPOLICE FORCE - AS ON 1.1.2009
Sanctioned Actual Sanctioned Actual Sanctioned Actual
(1) (2) (3) (4) (5) (6) (7) (8) 1 Andhra Pradesh 102,765 84,876 18,956 16,505 121,721 101,381
2 Arunachal Pradesh 3,440 3,312 3,754 3,565 7,194 6,877
3 Assam 31,018 17,280 53,450 45,491 84,468 62,771
4 Bihar 67,224 47,324 18,307 12,675 85,531 59,999
5 Chhatisgarh 29,474 22,852 16,929 10,127 46,403 32,979
6 Goa 4,163 3,962 1,788 661 5,951 4,623
7 Gujarat 59,207 44,278 16,831 12,533 76,038 56,811
8 Haryana 54,779 40,467 4,702 5,984 59,481 46,451
9 Himachal Pradesh 10,782 9,805 5,399 3,270 16,181 13,075
10 Jammu & Kashmir 68,977 60,101 25,787 22,620 94,764 82,721
11 Jharkhand 39,793 30,188 15,165 12,172 54,958 42,360
12 Karnataka 86,568 68,847 11,390 8,497 97,958 77,344
13 Kerala 36,533 34,483 7,528 4,676 44,061 39,159
14 Madhya Pradesh 56,293 51,365 21,333 19,228 77,626 70,593
15 Maharashtra 185,118 160,093 17,436 13,308 202,554 173,401
16 Manipur 10,660 5,477 11,444 9,796 22,104 15,273
17 Meghalaya 6,468 5,997 4,867 4,241 11,335 10,238
18 Mizoram 3,677 3,269 6,468 7,429 10,145 10,698
19 Nagaland 8,544 8,505 14,326 14,289 22,870 22,794
20 Orissa 32,900 27,922 18,677 12,088 51,577 40,010
21 Punjab 52,206 48,427 19,663 18,071 71,869 66,498
22 Rajasthan 65,812 61,890 12,414 11,398 78,226 73,288
23 Sikkim 2,181 1,985 1,704 1,619 3,885 3,604
24 Tamil Nadu 87,671 74,483 15,427 15,249 103,098 89,732
25 Tripura 26,179 21,289 14,890 11,823 41,069 33,112
26 Uttar Pradesh 331,796 113,426 36,214 30,774 368,010 144,200
27 Uttarakhand 16,649 13,598 4,977 2,796 21,626 16,394
28 West Bengal 66,979 59,871 21,770 19,161 88,749 79,032
29 A&N Islands 2,184 2,101 718 529 2,902 2,630
30 Chandigarh 4,209 4,033 419 419 4,628 4,452
31 D&N Haveli 110 123 102 84 212 207
32 Daman & Diu 246 212 - - 246 212
33 Delhi 61,684 60,008 13,279 7,873 74,963 67,881
34 Lakshadweep 349 295 - - 349 295
35 Puducherry 2,525 2,175 764 648 3,289 2,823 All India 1,619,163 1,194,319 436,878 359,599 2,056,041 1,553,918
Sl. No.
States / UTs. Strength of State Armed Police
Total Strength of State Police (Civil & Armed)
Strength of Civil & Distt.Armed Police
CHAPTER 3

37
TABLE 3.2 -- POLICE - POPULA TION AND AREA RATIO - AS ON 1.1.2009(SANCTIONED AND ACTUAL)
Sanctioned Actual Sanctioned Actual Sanctioned Actual Sanctioned Actual
(1) (2) (3) (4) (5) (6) (7) (8) (9) (10)
1 Andhra Pradesh 124.30 102.66 147.23 122.63 37.36 30.86 44.25 36.86
2 Arunachal Pradesh 284.53 273.95 595.04 568.82 4.11 3.95 8.59 8.21
3 Assam 102.73 57.23 279.76 207.90 39.54 22.03 107.69 80.03
4 Bihar 71.01 49.99 90.35 63.38 71.39 50.26 90.83 63.72
5 Chhatisgarh 123.48 95.74 194.40 138.16 21.80 16.90 34.32 24.39
6 Goa 251.39 239.25 359.36 279.17 112.45 107.02 160.75 124.88
7 Gujarat 104.13 77.87 133.73 99.91 30.20 22.59 38.79 28.98
8 Haryana 228.45 168.76 248.05 193.72 123.90 91.53 134.54 105.06
9 Himachal Pradesh 163.74 148.90 245.73 198.56 19.37 17.61 29.06 23.49
10 Jammu & Kashmir 547.18 476.77 751.74 656.20 68.03 59.28 93.47 81.59
11 Jharkhand 131.57 99.81 181.71 140.06 49.92 37.87 68.94 53.14
12 Karnataka 149.89 119.21 169.61 133.92 45.14 35.90 51.08 40.33
13 Kerala 106.13 100.18 128.00 113.76 94.00 88.73 113.38 100.76
14 Madhya Pradesh 80.43 73.39 110.91 100.86 18.26 16.66 25.18 22.90
15 Maharashtra 171.90 148.66 188.09 161.02 60.16 52.03 65.83 56.35
16 Manipur 403.02 207.07 835.69 577.43 47.74 24.53 99.00 68.41
17 Meghalaya 253.25 234.81 443.81 400.86 28.84 26.74 50.54 45.65
18 Mizoram 372.92 331.54 1028.90 1084.99 17.44 15.51 48.12 50.75
19 Nagaland 387.83 386.06 1038.13 1034.68 51.54 51.30 137.95 137.49
20 Orissa 81.97 69.57 128.51 99.69 21.13 17.93 33.12 25.70
21 Punjab 195.07 180.95 268.54 248.47 103.66 96.16 142.70 132.04
22 Rajasthan 100.84 94.83 119.86 112.30 19.23 18.08 22.86 21.41
23 Sikkim 364.72 331.94 649.67 602.68 30.74 27.97 54.75 50.79
24 Tamil Nadu 131.42 111.65 154.54 134.51 67.41 57.27 79.27 68.99
25 Tripura 740.57 602.23 1161.78 936.69 249.66 203.02 391.66 315.77
26 Uttar Pradesh 171.98 58.79 190.75 74.74 137.72 47.08 152.75 59.85
27 Uttarakhand 173.84 141.99 225.81 171.18 31.13 25.42 40.44 30.65
28 West Bengal 75.71 67.68 100.32 89.34 75.47 67.46 100.00 89.05
29 A&N Islands 525.00 505.05 697.60 632.21 26.48 25.47 35.18 31.88
30 Chandigarh 390.45 374.12 429.31 412.99 3692.11 3537.72 4059.65 3905.26
31 D&N Haveli 41.20 46.07 79.40 77.53 22.40 25.05 43.18 42.16
32 Daman & Diu 128.80 110.99 128.80 110.99 219.64 189.29 219.64 189.29
33 Delhi 354.89 345.25 431.29 390.55 4159.41 4046.39 5054.82 4577.28
34 Lakshadweep 491.55 415.49 491.55 415.49 1090.63 921.88 1090.63 921.88
35 Puducherry 232.72 200.46 303.13 260.18 526.04 453.13 685.21 588.13
All India 139.92 103.20 177.67 134.28 51.14 37.72 64.93 49 .08
Civil Police per 100 Sq. Km. of
Area
Total Police per 100 Sq. Km. of Area
Sl.No. States / UTs. Civil Police per lakh of Population
Total Police per lakh of Population
CHAPTER 3
38
TABLE 3.3 -- SANCTIONED & ACTUAL STRENGTH OF CIVIL POLICE INCLUDINGDISTRICTS ARMED RESERVE POLICE - AS ON 1.1.2009
Sanc-tioned
Actual Vacancy Sanc-tioned
Actual Vacancy Sanc-tioned
Actual Vacancy
(1) (2) (3) (4) (5) (6) (7) (8) (9) (10) (11)
1 Andhra Pradesh 32 23 9 28 23 5 38 23 15
2 Arunachal Pradesh 1 1 0 1 1 0 4 4 0
3 Assam 9 9 0 14 14 0 14 14 0
4 Bihar 9 17 0 17 15 2 26 18 8
5 Chhatisgarh 3 5 0 5 14 0 9 10 0
6 Goa 1 1 0 1 1 0 1 0 1
7 Gujarat 21 12 9 35 29 6 18 16 2
8 Haryana 11 22 0 17 20 0 12 17 0
9 Himachal Pradesh 13 13 0 15 15 0 12 12 0
10 Jammu & Kashmir 7 2 5 13 13 0 21 19 2
11 Jharkhand 5 7 0 10 15 0 14 14 0
12 Karnataka 18 17 1 45 40 5 27 19 8
13 Kerala 7 9 0 12 15 0 12 5 7
14 Madhya Pradesh 9 13 0 19 48 0 22 22 0
15 Maharashtra 28 26 2 27 30 0 44 44 0
16 Manipur 2 2 0 7 6 1 6 3 3
17 Meghalaya 6 6 0 7 7 0 6 2 4
18 Mizoram 1 1 0 1 1 0 3 3 0
19 Nagaland 2 2 0 7 5 2 10 7 3
20 Orissa 9 8 1 14 15 0 21 9 12
21 Punjab 12 9 3 14 14 0 20 20 0
22 Rajasthan 8 8 0 15 15 0 25 18 7
23 Sikkim 2 3 0 2 10 0 4 5 0
24 Tamil Nadu 24 21 3 41 39 2 27 19 8
25 Tripura 3 3 0 6 6 0 7 7 0
26 Uttar Pradesh 42 38 4 55 43 12 61 43 18
27 Uttarakhand 3 5 0 5 6 0 8 3 5
28 West Bengal 23 19 4 37 36 1 39 34 5
29 A&N Islands 1 1 0 1 0 1 1 2 0
30 Chandigarh 0 0 0 1 1 0 0 1 0
31 D&N Haveli 0 0 0 0 0 0 1 1 0
32 Daman & Diu 0 0 0 0 0 0 1 1 0
33 Delhi 4 8 0 14 15 0 9 12 0
34 Lakshadweep 0 0 0 0 0 0 0 0 0
35 Puducherry 0 1 0 1 0 1 1 1 0
All India 316 312 41 487 512 38 524 428 108
Note: In vacancy columns, the States where the Rank wise Police Personnal are surplus , is taken as ' 0'
Sl. No.
States / UTs. DGP/Addl. DGP IGP DIG
CHAPTER 3

39
TABLE 3.3 -- (Continued . . .)
Sanc-tioned
Actual Vacancy Sanc-tioned
Actual Vacancy Sanc-tioned
Actual Vacancy
(1) (2) (12) (13) (14) (15) (16) (17) (18) (19) (20)
1 Andhra Pradesh 101 91 10 0 0 0 746 465 281
2 Arunachal Pradesh 29 21 8 19 19 0 19 18 1
3 Assam 60 51 9 67 54 13 175 131 44
4 Bihar 73 59 14 3 0 3 314 212 102
5 Chhatisgarh 35 35 0 42 62 0 164 210 0
6 Goa 10 14 0 0 0 0 25 25 0
7 Gujarat 84 58 26 0 0 0 219 156 63
8 Haryana 53 59 0 18 0 18 186 197 0
9 Himachal Pradesh 44 44 0 26 26 0 99 99 0
10 Jammu & Kashmir 193 186 7 0 0 0 473 394 79
11 Jharkhand 30 45 0 0 0 0 281 281 0
12 Karnataka 190 172 18 0 0 0 437 436 1
13 Kerala 66 64 2 8 8 0 275 264 11
14 Madhya Pradesh 150 65 85 119 103 16 625 481 144
15 Maharashtra 263 179 84 48 37 11 804 438 366
16 Manipur 19 14 5 20 10 10 67 38 29
17 Meghalaya 20 20 0 0 0 0 37 35 2
18 Mizoram 20 20 0 20 20 0 44 44 0
19 Nagaland 23 22 1 18 15 3 66 56 10
20 Orissa 109 50 59 29 43 0 374 144 230
21 Punjab 125 118 7 22 0 22 255 146 109
22 Rajasthan 136 112 24 0 0 0 683 586 97
23 Sikkim 40 31 9 0 0 0 44 29 15
24 Tamil Nadu 216 187 29 0 0 0 685 625 60
25 Tripura 37 27 10 41 64 0 218 126 92
26 Uttar Pradesh 137 125 12 241 224 17 921 670 251
27 Uttarakhand 17 20 0 30 18 12 97 52 45
28 West Bengal 101 98 3 55 45 10 308 265 43
29 A&N Islands 2 4 0 0 0 0 11 16 0
30 Chandigarh 4 3 1 0 0 0 12 13 0
31 D&N Haveli 1 1 0 1 1 0 1 1 0
32 Daman & Diu 2 1 1 0 0 0 2 2 0
33 Delhi 49 39 10 24 29 0 281 242 39
34 Lakshadweep 1 1 0 0 0 0 1 1 0
35 Puducherry 2 2 0 0 0 0 21 20 1
All India 2,442 2,038 434 851 778 135 8,970 6,918 2,115
Note: In vacancy columns, the States where the Rank wise Police Personnal are surplus , is taken as ' 0'
Sl. No.
States / UTs. AIGP/SSP/SP Addl.SP/Dy. COMN ASP/DY.SP
CHAPTER 3
40
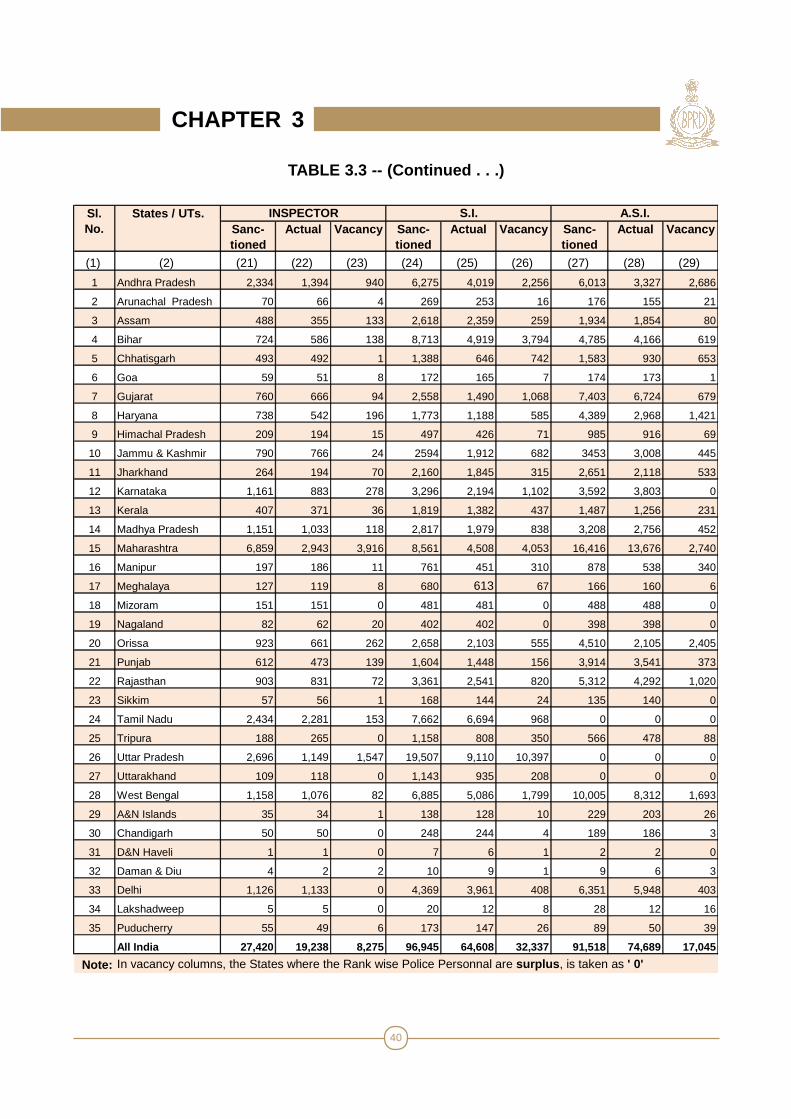
TABLE 3.3 -- (Continued . . .)
Sanc-tioned
Actual Vacancy Sanc-tioned
Actual Vacancy Sanc-tioned
Actual Vacancy
(1) (2) (21) (22) (23) (24) (25) (26) (27) (28) (29)
1 Andhra Pradesh 2,334 1,394 940 6,275 4,019 2,256 6,013 3,327 2,686
2 Arunachal Pradesh 70 66 4 269 253 16 176 155 21
3 Assam 488 355 133 2,618 2,359 259 1,934 1,854 80
4 Bihar 724 586 138 8,713 4,919 3,794 4,785 4,166 619
5 Chhatisgarh 493 492 1 1,388 646 742 1,583 930 653
6 Goa 59 51 8 172 165 7 174 173 1
7 Gujarat 760 666 94 2,558 1,490 1,068 7,403 6,724 679
8 Haryana 738 542 196 1,773 1,188 585 4,389 2,968 1,421
9 Himachal Pradesh 209 194 15 497 426 71 985 916 69
10 Jammu & Kashmir 790 766 24 2594 1,912 682 3453 3,008 445
11 Jharkhand 264 194 70 2,160 1,845 315 2,651 2,118 533
12 Karnataka 1,161 883 278 3,296 2,194 1,102 3,592 3,803 0
13 Kerala 407 371 36 1,819 1,382 437 1,487 1,256 231
14 Madhya Pradesh 1,151 1,033 118 2,817 1,979 838 3,208 2,756 452
15 Maharashtra 6,859 2,943 3,916 8,561 4,508 4,053 16,416 13,676 2,740
16 Manipur 197 186 11 761 451 310 878 538 340
17 Meghalaya 127 119 8 680 613 67 166 160 6
18 Mizoram 151 151 0 481 481 0 488 488 0
19 Nagaland 82 62 20 402 402 0 398 398 0
20 Orissa 923 661 262 2,658 2,103 555 4,510 2,105 2,405
21 Punjab 612 473 139 1,604 1,448 156 3,914 3,541 373
22 Rajasthan 903 831 72 3,361 2,541 820 5,312 4,292 1,020
23 Sikkim 57 56 1 168 144 24 135 140 0
24 Tamil Nadu 2,434 2,281 153 7,662 6,694 968 0 0 0
25 Tripura 188 265 0 1,158 808 350 566 478 88
26 Uttar Pradesh 2,696 1,149 1,547 19,507 9,110 10,397 0 0 0
27 Uttarakhand 109 118 0 1,143 935 208 0 0 0
28 West Bengal 1,158 1,076 82 6,885 5,086 1,799 10,005 8,312 1,693
29 A&N Islands 35 34 1 138 128 10 229 203 26
30 Chandigarh 50 50 0 248 244 4 189 186 3
31 D&N Haveli 1 1 0 7 6 1 2 2 0
32 Daman & Diu 4 2 2 10 9 1 9 6 3
33 Delhi 1,126 1,133 0 4,369 3,961 408 6,351 5,948 403
34 Lakshadweep 5 5 0 20 12 8 28 12 16
35 Puducherry 55 49 6 173 147 26 89 50 39
All India 27,420 19,238 8,275 96,945 64,608 32,3 37 91,518 74,689 17,045
Note: In vacancy columns, the States where the Rank wise Police Personnal are surplus , is taken as ' 0'
S.I. A.S.I.Sl. No.
States / UTs. INSPECTOR
CHAPTER 3
41
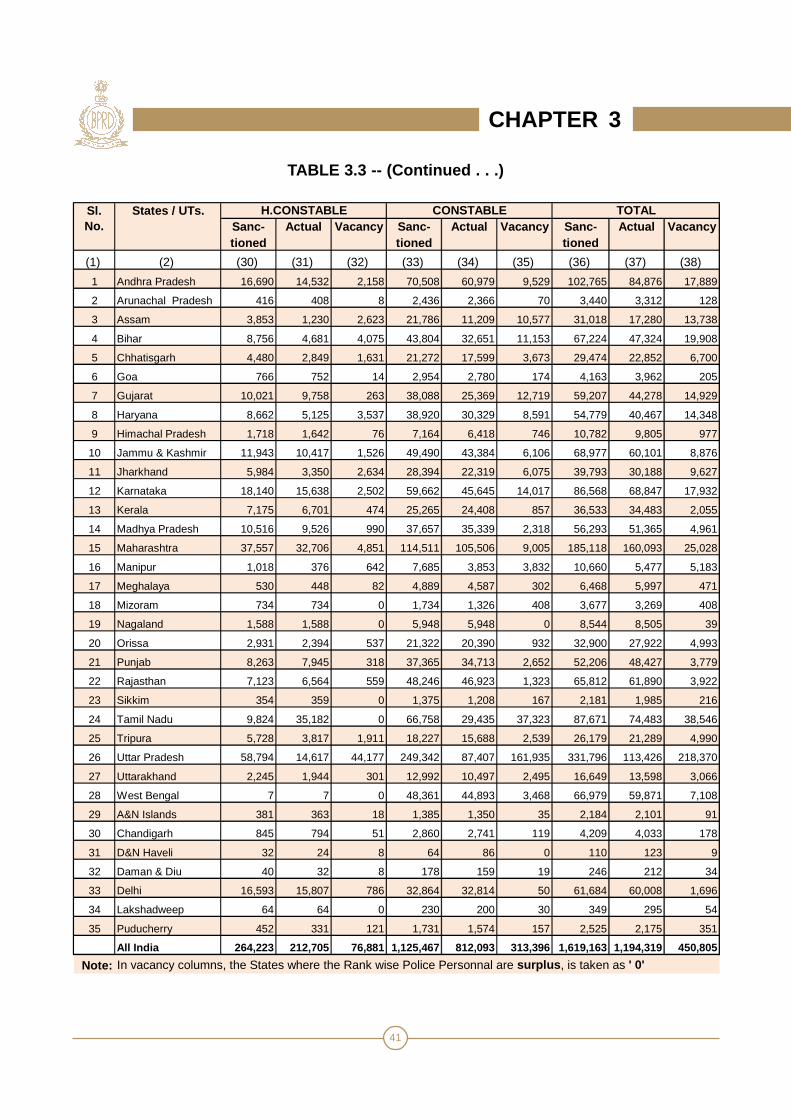
TABLE 3.3 -- (Continued . . .)
Sanc-tioned
Actual Vacancy Sanc-tioned
Actual Vacancy Sanc-tioned
Actual Vacancy
(1) (2) (30) (31) (32) (33) (34) (35) (36) (37) (38)
1 Andhra Pradesh 16,690 14,532 2,158 70,508 60,979 9,529 102,765 84,876 17,889
2 Arunachal Pradesh 416 408 8 2,436 2,366 70 3,440 3,312 128
3 Assam 3,853 1,230 2,623 21,786 11,209 10,577 31,018 17,280 13,738
4 Bihar 8,756 4,681 4,075 43,804 32,651 11,153 67,224 47,324 19,908
5 Chhatisgarh 4,480 2,849 1,631 21,272 17,599 3,673 29,474 22,852 6,700
6 Goa 766 752 14 2,954 2,780 174 4,163 3,962 205
7 Gujarat 10,021 9,758 263 38,088 25,369 12,719 59,207 44,278 14,929
8 Haryana 8,662 5,125 3,537 38,920 30,329 8,591 54,779 40,467 14,348
9 Himachal Pradesh 1,718 1,642 76 7,164 6,418 746 10,782 9,805 977
10 Jammu & Kashmir 11,943 10,417 1,526 49,490 43,384 6,106 68,977 60,101 8,876
11 Jharkhand 5,984 3,350 2,634 28,394 22,319 6,075 39,793 30,188 9,627
12 Karnataka 18,140 15,638 2,502 59,662 45,645 14,017 86,568 68,847 17,932
13 Kerala 7,175 6,701 474 25,265 24,408 857 36,533 34,483 2,055
14 Madhya Pradesh 10,516 9,526 990 37,657 35,339 2,318 56,293 51,365 4,961
15 Maharashtra 37,557 32,706 4,851 114,511 105,506 9,005 185,118 160,093 25,028
16 Manipur 1,018 376 642 7,685 3,853 3,832 10,660 5,477 5,183
17 Meghalaya 530 448 82 4,889 4,587 302 6,468 5,997 471
18 Mizoram 734 734 0 1,734 1,326 408 3,677 3,269 408
19 Nagaland 1,588 1,588 0 5,948 5,948 0 8,544 8,505 39
20 Orissa 2,931 2,394 537 21,322 20,390 932 32,900 27,922 4,993
21 Punjab 8,263 7,945 318 37,365 34,713 2,652 52,206 48,427 3,779
22 Rajasthan 7,123 6,564 559 48,246 46,923 1,323 65,812 61,890 3,922
23 Sikkim 354 359 0 1,375 1,208 167 2,181 1,985 216
24 Tamil Nadu 9,824 35,182 0 66,758 29,435 37,323 87,671 74,483 38,546
25 Tripura 5,728 3,817 1,911 18,227 15,688 2,539 26,179 21,289 4,990
26 Uttar Pradesh 58,794 14,617 44,177 249,342 87,407 161,935 331,796 113,426 218,370
27 Uttarakhand 2,245 1,944 301 12,992 10,497 2,495 16,649 13,598 3,066
28 West Bengal 7 7 0 48,361 44,893 3,468 66,979 59,871 7,108
29 A&N Islands 381 363 18 1,385 1,350 35 2,184 2,101 91
30 Chandigarh 845 794 51 2,860 2,741 119 4,209 4,033 178
31 D&N Haveli 32 24 8 64 86 0 110 123 9
32 Daman & Diu 40 32 8 178 159 19 246 212 34
33 Delhi 16,593 15,807 786 32,864 32,814 50 61,684 60,008 1,696
34 Lakshadweep 64 64 0 230 200 30 349 295 54
35 Puducherry 452 331 121 1,731 1,574 157 2,525 2,175 351
All India 264,223 212,705 76,881 1,125,467 812,0 93 313,396 1,619,163 1,194,319 450,805
Note: In vacancy columns, the States where the Rank wise Police Personnal are surplus , is taken as ' 0'
H.CONSTABLE CONSTABLE TOTALSl. No.
States / UTs.
CHAPTER 3

42
TABLE 3.4 -- OFFICERS T O CONSTABULAR Y RATIO OF SANCTIONED &ACTUAL STRENGTH OF CIVIL POLICE INCLUDING DISTRICTS
ARMED RESERVE POLICE - AS ON 1.1.2009
Teeth to T ail Ratio : Teeth to Tail Ratio is the ratio of Police Officers from the rank of an Asstt.Sub-Inspector and above to Head Constables and Constables.
D.G. To A.S.I.
H.C. & Const.
D.G. To A.S.I.
H.C. & Const.
(1) (2) (3) (4) (6) (7) 1 Andhra Pradesh 15,567 87,198 1 : 5.6 9,365 75,511 1 : 8.12 Arunachal Pradesh 588 2,852 1 : 4.9 538 2,774 1 : 5.23 Assam 5,379 25,639 1 : 4.8 4,841 12,439 1 : 2.64 Bihar 14,664 52,560 1 : 3.6 9,992 37,332 1 : 3.75 Chhatisgarh 3,722 25,752 1 : 6.9 2,404 20,448 1 : 8.56 Goa 443 3,720 1 : 8.4 430 3,532 1 : 8.27 Gujarat 11,098 48,109 1 : 4.3 9,151 35,127 1 : 3.88 Haryana 7,197 47,582 1 : 6.6 5,013 35,454 1 : 7.19 Himachal Pradesh 1,900 8,882 1 : 4.7 1,745 8,060 1 : 4.610 Jammu & Kashmir 7,544 61,433 1 : 8.1 6,300 53,801 1 : 8.511 Jharkhand 5,415 34,378 1 : 6.3 4,519 25,669 1 : 5.712 Karnataka 8,766 77,802 1 : 8.9 7,564 61,283 1 : 8.113 Kerala 4,093 32,440 1 : 7.9 3,374 31,109 1 : 9.214 Madhya Pradesh 8,120 48,173 1 : 5.9 6,500 44,865 1 : 6.915 Maharashtra 33,050 152,068 1 : 4.6 21,881 138,212 1 : 6.316 Manipur 1,957 8,703 1 : 4.4 1,248 4,229 1 : 3.417 Meghalaya 1,049 5,419 1 : 5.2 962 5,035 1 : 5.218 Mizoram 1,209 2,468 1 : 2.0 1,209 2,060 1 : 1.719 Nagaland 1,008 7,536 1 : 7.5 969 7,536 1 : 7.820 Orissa 8,647 24,253 1 : 2.8 5,138 22,784 1 : 4.421 Punjab 6,578 45,628 1 : 6.9 5,769 42,658 1 : 7.422 Rajasthan 10,443 55,369 1 : 5.3 8,403 53,487 1 : 6.423 Sikkim 452 1,729 1 : 3.8 418 1,567 1 : 3.724 Tamil Nadu 11,089 76,582 1 : 6.9 9,866 64,617 1 : 6.525 Tripura 2,224 23,955 1 : 10.8 1,784 19,505 1 : 10.926 Uttar Pradesh 23,660 308,136 1 : 13.0 11,402 102,024 1 : 8.927 Uttarakhand 1,412 15,237 1 : 10.8 1,157 12,441 1 : 10.828 West Bengal 18,611 48,368 1 : 2.6 14,971 44,900 1 : 3.029 A&N Islands 418 1,766 1 : 4.2 388 1,713 1 : 4.430 Chandigarh 504 3,705 1 : 7.4 498 3,535 1 : 7.131 D&N Haveli 14 96 1 : 6.9 13 110 1 : 8.532 Daman & Diu 28 218 1 : 7.8 21 191 1 : 9.133 Delhi 12,227 49,457 1 : 4.0 11,387 48,621 1 : 4.334 Lakshadweep 55 294 1 : 5.3 31 264 1 : 8.535 Puducherry 342 2,183 1 : 6.4 270 1,905 1 : 7.1
All India** 229,473 1,389,690 1 : 6.1 169,521 1,024,798 1 : 6.0
Sl. No.
States / UTs. Actual Police Strength
Teeth to Tail (8) (5)
Sanctioned Police Strength
Teeth to Tail
CHAPTER 3

43
TABLE 3.5 -SANCTIONED & ACTUAL STRENGTH OF STATE ARMEDPOLICE-AS ON 1.1.2009
Sanc-tioned
Actual Vacancy Sanc-tioned
Actual Vacancy Sanc-tioned
Actual Vacancy
(1) (2) (3) (4) (5) (6) (7) (8) (9) (10) (11)
1 Andhra Pradesh 1 1 0 1 1 0 2 2 0
2 Arunachal Pradesh 0 0 0 0 0 0 0 0 0
3 Assam 1 1 0 1 1 0 2 2 0
4 Bihar 1 1 0 1 1 0 2 2 0
5 Chhatisgarh 1 1 0 1 1 0 5 5 0
6 Goa 0 0 0 0 0 0 0 0 0
7 Gujarat 1 1 0 0 0 0 2 2 0
8 Haryana 1 1 0 1 1 0 1 1 0
9 Himachal Pradesh 1 0 1 1 1 0 3 1 2
10 Jammu & Kashmir 1 0 1 1 1 0 2 4 0
11 Jharkhand 0 0 0 1 1 0 1 1 0
12 Karnataka 1 1 0 1 1 0 1 2 0
13 Kerala 0 1 0 1 1 0 2 1 1
14 Madhya Pradesh 1 1 0 1 5 0 8 2 6
15 Maharashtra 1 1 0 2 2 0 1 1 0
16 Manipur 1 0 1 1 1 0 2 1 1
17 Meghalaya 0 0 0 0 0 0 0 0 0
18 Mizoram 0 0 0 0 0 0 0 0 0
19 Nagaland 1 1 0 1 1 0 2 2 0
20 Orissa 0 0 0 0 0 0 0 0 0
21 Punjab 1 1 0 3 3 0 5 4 1
22 Rajasthan 1 1 0 1 1 0 3 0 3
23 Sikkim 0 0 0 1 1 0 0 0 0
24 Tamil Nadu 0 0 0 1 1 0 2 2 0
25 Tripura 0 0 0 1 1 0 2 2 0
26 Uttar Pradesh 1 1 0 5 5 0 8 7 1
27 Uttarakhand 0 0 0 0 1 0 1 1 0
28 West Bengal 1 1 0 3 3 0 5 4 1
29 A&N Islands 0 0 0 0 0 0 1 0 1
30 Chandigarh 0 0 0 0 0 0 0 0 0
31 D&N Haveli 0 0 0 0 0 0 0 0 0
32 Daman & Diu 0 0 0 0 0 0 0 0 0
33 Delhi 0 0 0 1 1 0 1 1 0
34 Lakshadweep 0 0 0 0 0 0 0 0 0
35 Puducherry 0 0 0 0 0 0 0 0 0
All India 17 15 3 31 36 0 64 50 17
Note: In vacancy columns, the States where the Rank wise Police Personnal are surplus , is taken as ' 0'
Sl. No.
States / UTs. DGP/Addl. DGP IGP DIG
CHAPTER 3

44
TABLE 3.5 -- (Continued . . .)
Sanc-tioned
Actual Vacancy Sanc-tioned
Actual Vacancy Sanc-tioned
Actual Vacancy
(1) (2) (12) (13) (14) (15) (16) (17) (18) (19) (20)
1 Andhra Pradesh 32 29 3 0 0 0 79 73 6
2 Arunachal Pradesh 11 6 5 0 0 0 31 20 11
3 Assam 33 32 1 24 16 8 224 81 143
4 Bihar 19 16 3 0 0 0 103 29 74
5 Chhatisgarh 21 12 9 32 10 22 101 32 69
6 Goa 2 0 2 0 0 0 20 0 20
7 Gujarat 15 0 15 0 0 0 57 25 32
8 Haryana 0 0 0 5 5 0 16 37 0
9 Himachal Pradesh 7 4 3 16 7 9 20 16 4
10 Jammu & Kashmir 83 25 58 0 54 0 195 54 141
11 Jharkhand 16 10 6 0 0 0 101 28 73
12 Karnataka 14 13 1 0 0 0 51 47 4
13 Kerala 9 9 0 8 8 0 34 32 2
14 Madhya Pradesh 44 22 22 0 0 0 80 72 8
15 Maharashtra 23 20 3 0 0 0 81 28 53
16 Manipur 14 15 0 33 8 25 94 68 26
17 Meghalaya 5 5 0 0 0 0 48 30 18
18 Mizoram 9 9 0 22 18 4 54 39 15
19 Nagaland 15 14 1 42 42 0 84 59 25
20 Orissa 13 4 9 48 30 18 154 56 98
21 Punjab 70 70 0 0 0 0 139 75 64
22 Rajasthan 4 4 0 0 0 0 97 61 36
23 Sikkim 2 2 0 4 3 1 12 9 3
24 Tamil Nadu 33 22 11 0 0 0 55 7 48
25 Tripura 13 13 0 13 13 0 104 50 54
26 Uttar Pradesh 33 22 11 0 0 0 147 96 51
27 Uttarakhand 5 4 1 10 2 8 24 3 21
28 West Bengal 30 27 3 13 5 8 132 84 48
29 A&N Islands 0 0 0 0 0 0 2 1 1
30 Chandigarh 0 0 0 0 0 0 1 1 0
31 D&N Haveli 0 0 0 0 0 0 0 0 0
32 Daman & Diu 0 0 0 0 0 0 0 0 0
33 Delhi 21 3 18 7 4 3 58 17 41
34 Lakshadweep 0 0 0 0 0 0 0 0 0
35 Puducherry 0 0 0 0 0 0 1 1 0
All India 596 412 185 277 225 106 2,399 1,231 1,189Note: In vacancy columns, the States where the Rank wise Police Personnal are surplus , is taken as ' 0'
Sl. No.
AIGP/SSP/SPStates / UTs. Addl.SP/Dy. COMN ASP/DY.SP
CHAPTER 3
45
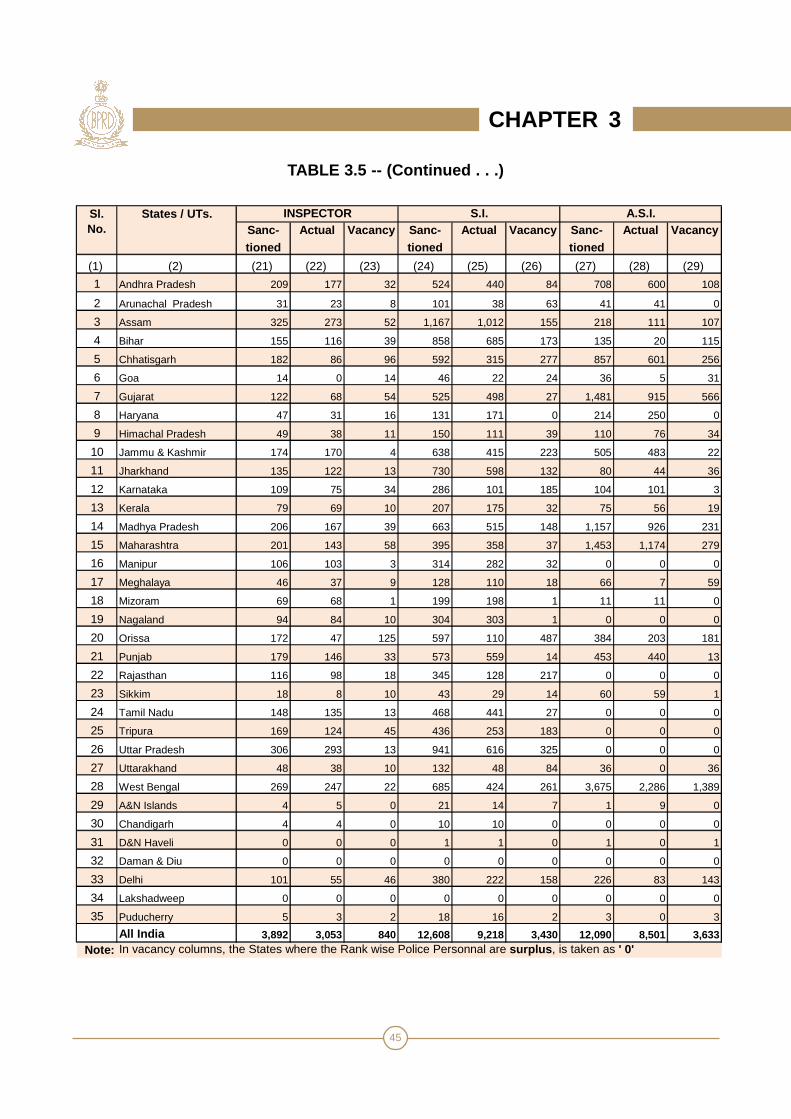
TABLE 3.5 -- (Continued . . .)
Sanc-tioned
Actual Vacancy Sanc-tioned
Actual Vacancy Sanc-tioned
Actual Vacancy
(1) (2) (21) (22) (23) (24) (25) (26) (27) (28) (29)
1 Andhra Pradesh 209 177 32 524 440 84 708 600 108
2 Arunachal Pradesh 31 23 8 101 38 63 41 41 0
3 Assam 325 273 52 1,167 1,012 155 218 111 107
4 Bihar 155 116 39 858 685 173 135 20 115
5 Chhatisgarh 182 86 96 592 315 277 857 601 256
6 Goa 14 0 14 46 22 24 36 5 31
7 Gujarat 122 68 54 525 498 27 1,481 915 566
8 Haryana 47 31 16 131 171 0 214 250 0
9 Himachal Pradesh 49 38 11 150 111 39 110 76 34
10 Jammu & Kashmir 174 170 4 638 415 223 505 483 22
11 Jharkhand 135 122 13 730 598 132 80 44 36
12 Karnataka 109 75 34 286 101 185 104 101 3
13 Kerala 79 69 10 207 175 32 75 56 19
14 Madhya Pradesh 206 167 39 663 515 148 1,157 926 231
15 Maharashtra 201 143 58 395 358 37 1,453 1,174 279
16 Manipur 106 103 3 314 282 32 0 0 0
17 Meghalaya 46 37 9 128 110 18 66 7 59
18 Mizoram 69 68 1 199 198 1 11 11 0
19 Nagaland 94 84 10 304 303 1 0 0 0
20 Orissa 172 47 125 597 110 487 384 203 181
21 Punjab 179 146 33 573 559 14 453 440 13
22 Rajasthan 116 98 18 345 128 217 0 0 0
23 Sikkim 18 8 10 43 29 14 60 59 1
24 Tamil Nadu 148 135 13 468 441 27 0 0 0
25 Tripura 169 124 45 436 253 183 0 0 0
26 Uttar Pradesh 306 293 13 941 616 325 0 0 0
27 Uttarakhand 48 38 10 132 48 84 36 0 36
28 West Bengal 269 247 22 685 424 261 3,675 2,286 1,389
29 A&N Islands 4 5 0 21 14 7 1 9 0
30 Chandigarh 4 4 0 10 10 0 0 0 0
31 D&N Haveli 0 0 0 1 1 0 1 0 1
32 Daman & Diu 0 0 0 0 0 0 0 0 0
33 Delhi 101 55 46 380 222 158 226 83 143
34 Lakshadweep 0 0 0 0 0 0 0 0 0
35 Puducherry 5 3 2 18 16 2 3 0 3
All India 3,892 3,053 840 12,608 9,218 3,430 12,090 8,501 3,633Note: In vacancy columns, the States where the Rank wise Police Personnal are surplus , is taken as ' 0'
A.S.I.Sl. No.
States / UTs. INSPECTOR S.I.
CHAPTER 3

46
TABLE 3.5 -- (Continued . . .)
Sanc-tioned
Actual Vacancy Sanc-tioned
Actual Vacancy Sanc-tioned
Actual Vacancy
(1) (2) (30) (31) (32) (33) (34) (35) (36) (37) (38)
1 Andhra Pradesh 4,253 3,180 1,073 13,147 12,002 1,145 18,956 16,505 2,451
2 Arunachal Pradesh 562 545 17 2,977 2,892 85 3,754 3,565 189
3 Assam 10,041 9,092 949 41,414 34,870 6,544 53,450 45,491 7,959
4 Bihar 3,345 2,517 828 13,688 9,288 4,400 18,307 12,675 5,632
5 Chhatisgarh 2,918 2,204 714 12,219 6,860 5,359 16,929 10,127 6,802
6 Goa 320 5 315 1,350 629 721 1,788 661 1,127
7 Gujarat 1,498 1,109 389 13,130 9,915 3,215 16,831 12,533 4,298
8 Haryana 688 545 143 3,598 4,942 0 4,702 5,984 159
9 Himachal Pradesh 981 564 417 4,061 2,452 1,609 5,399 3,270 2,129
10 Jammu & Kashmir 4,210 4,174 36 19,978 17,240 2,738 25,787 22,620 3,223
11 Jharkhand 2,829 2,162 667 11,272 9,206 2,066 15,165 12,172 2,993
12 Karnataka 2,154 1,862 292 8,669 6,294 2,375 11,390 8,497 2,894
13 Kerala 1224 953 271 5889 3,371 2,518 7,528 4,676 2,853
14 Madhya Pradesh 3,685 3,426 259 15,488 14,092 1,396 21,333 19,228 2,109
15 Maharashtra 3,359 2,164 1,195 11,920 9,417 2,503 17,436 13,308 4,128
16 Manipur 2,367 1,775 592 8,512 7,543 969 11,444 9,796 1,649
17 Meghalaya 744 522 222 3,830 3,530 300 4,867 4,241 626
18 Mizoram 1,155 1,155 0 4,949 5,931 0 6,468 7,429 21
19 Nagaland 1,134 1,134 0 12,649 12,649 0 14,326 14,289 37
20 Orissa 2,795 1,029 1,766 14,514 10,609 3,905 18,677 12,088 6,589
21 Punjab 3,510 3,454 56 14,730 13,319 1,411 19,663 18,071 1,592
22 Rajasthan 1,988 1,745 243 9,859 9,360 499 12,414 11,398 1,016
23 Sikkim 87 87 0 1,477 1,421 56 1,704 1,619 85
24 Tamil Nadu 1,580 1,580 0 13,140 13,061 79 15,427 15,249 178
25 Tripura 4,526 3,012 1,514 9,626 8,355 1,271 14,890 11,823 3,067
26 Uttar Pradesh 6,315 5,416 899 28,458 24,318 4,140 36,214 30,774 5,440
27 Uttarakhand 892 639 253 3,829 2,060 1,769 4,977 2,796 2,182
28 West Bengal 0 0 0 16,957 16,080 877 21,770 19,161 2,609
29 A&N Islands 127 93 34 562 407 155 718 529 198
30 Chandigarh 61 61 0 343 343 0 419 419 0
31 D&N Haveli 18 14 4 82 69 13 102 84 18
32 Daman & Diu 0 0 0 0 0 0 0 0 0
33 Delhi 2,353 1,877 476 10,131 5,610 4,521 13,279 7,873 5,406
34 Lakshadweep 0 0 0 0 0 0 0 0 0
35 Puducherry 100 50 50 637 578 59 764 648 116
All India 71,819 58,145 13,674 333,085 278,713 56,698 436,878 359,599 79,775Note: In vacancy columns, the States where the Rank wise Police Personnal are surplus , is taken as ' 0'
CONSTABLE TOTALSl. No.
States / UTs. H.CONSTABLE
CHAPTER 3
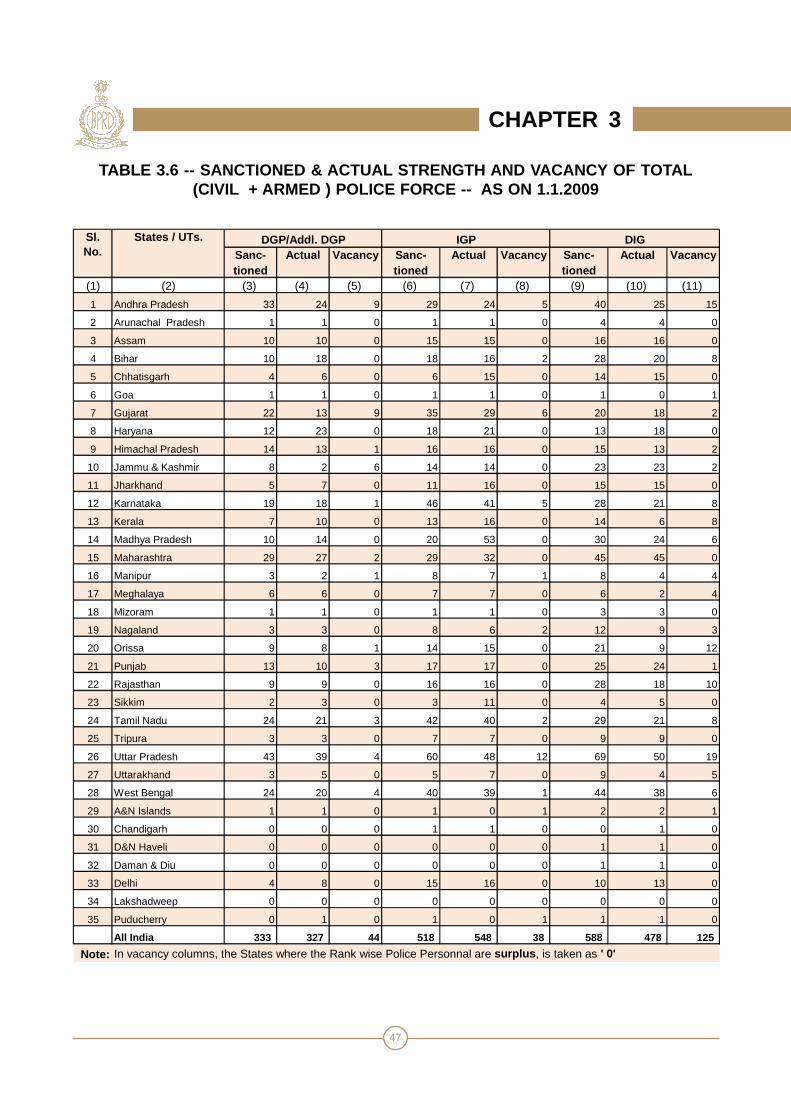
47
TABLE 3.6 -- SANCTIONED & ACTUAL STRENGTH AND VACANCY OF TOTAL(CIVIL + ARMED ) POLICE FORCE -- AS ON 1.1.2009
Sanc-tioned
Actual Vacancy Sanc-tioned
Actual Vacancy Sanc-tioned
Actual Vacancy
(1) (2) (3) (4) (5) (6) (7) (8) (9) (10) (11)
1 Andhra Pradesh 33 24 9 29 24 5 40 25 15
2 Arunachal Pradesh 1 1 0 1 1 0 4 4 0
3 Assam 10 10 0 15 15 0 16 16 0
4 Bihar 10 18 0 18 16 2 28 20 8
5 Chhatisgarh 4 6 0 6 15 0 14 15 0
6 Goa 1 1 0 1 1 0 1 0 1
7 Gujarat 22 13 9 35 29 6 20 18 2
8 Haryana 12 23 0 18 21 0 13 18 0
9 Himachal Pradesh 14 13 1 16 16 0 15 13 2
10 Jammu & Kashmir 8 2 6 14 14 0 23 23 2
11 Jharkhand 5 7 0 11 16 0 15 15 0
12 Karnataka 19 18 1 46 41 5 28 21 8
13 Kerala 7 10 0 13 16 0 14 6 8
14 Madhya Pradesh 10 14 0 20 53 0 30 24 6
15 Maharashtra 29 27 2 29 32 0 45 45 0
16 Manipur 3 2 1 8 7 1 8 4 4
17 Meghalaya 6 6 0 7 7 0 6 2 4
18 Mizoram 1 1 0 1 1 0 3 3 0
19 Nagaland 3 3 0 8 6 2 12 9 3
20 Orissa 9 8 1 14 15 0 21 9 12
21 Punjab 13 10 3 17 17 0 25 24 1
22 Rajasthan 9 9 0 16 16 0 28 18 10
23 Sikkim 2 3 0 3 11 0 4 5 0
24 Tamil Nadu 24 21 3 42 40 2 29 21 8
25 Tripura 3 3 0 7 7 0 9 9 0
26 Uttar Pradesh 43 39 4 60 48 12 69 50 19
27 Uttarakhand 3 5 0 5 7 0 9 4 5
28 West Bengal 24 20 4 40 39 1 44 38 6
29 A&N Islands 1 1 0 1 0 1 2 2 1
30 Chandigarh 0 0 0 1 1 0 0 1 0
31 D&N Haveli 0 0 0 0 0 0 1 1 0
32 Daman & Diu 0 0 0 0 0 0 1 1 0
33 Delhi 4 8 0 15 16 0 10 13 0
34 Lakshadweep 0 0 0 0 0 0 0 0 0
35 Puducherry 0 1 0 1 0 1 1 1 0
All India 333 327 44 518 548 38 588 478 125
Note: In vacancy columns, the States where the Rank wise Police Personnal are surplus , is taken as ' 0'
DGP/Addl. DGP IGP DIGSl. No.
States / UTs.
CHAPTER 3

48
TABLE 3.6 -- (Continued . . .)
Sanc-tioned
Actual Vacancy Sanc-tioned
Actual Vacancy Sanc-tioned
Actual Vacancy
(1) (2) (12) (13) (14) (15) (16) (17) (18) (19) (20)
1 Andhra Pradesh 133 120 13 0 0 0 825 538 287
2 Arunachal Pradesh 40 27 13 19 19 0 50 38 12
3 Assam 93 83 10 91 70 21 399 212 187
4 Bihar 92 75 17 3 0 3 417 241 176
5 Chhatisgarh 56 47 9 74 72 22 265 242 69
6 Goa 12 14 2 0 0 0 45 25 20
7 Gujarat 99 58 41 0 0 0 276 181 95
8 Haryana 53 59 0 23 5 18 202 234 0
9 Himachal Pradesh 51 48 3 42 33 9 119 115 4
10 Jammu & Kashmir 276 211 65 0 54 0 668 448 220
11 Jharkhand 46 55 6 0 0 0 382 309 73
12 Karnataka 204 185 19 0 0 0 488 483 5
13 Kerala 75 73 2 16 16 0 309 296 13
14 Madhya Pradesh 194 87 107 119 103 16 705 553 152
15 Maharashtra 286 199 87 48 37 11 885 466 419
16 Manipur 33 29 5 53 18 35 161 106 55
17 Meghalaya 25 25 0 0 0 0 85 65 20
18 Mizoram 29 29 0 42 38 4 98 83 15
19 Nagaland 38 36 2 60 57 3 150 115 35
20 Orissa 122 54 68 77 73 18 528 200 328
21 Punjab 195 188 7 22 0 22 394 221 173
22 Rajasthan 140 116 24 0 0 0 780 647 133
23 Sikkim 42 33 9 4 3 1 56 38 18
24 Tamil Nadu 249 209 40 0 0 0 740 632 108
25 Tripura 50 40 10 54 77 0 322 176 146
26 Uttar Pradesh 170 147 23 241 224 17 1,068 766 302
27 Uttarakhand 22 24 1 40 20 20 121 55 66
28 West Bengal 131 125 6 68 50 18 440 349 91
29 A&N Islands 2 4 0 0 0 0 13 17 1
30 Chandigarh 4 3 1 0 0 0 13 14 0
31 D&N Haveli 1 1 0 1 1 0 1 1 0
32 Daman & Diu 2 1 1 0 0 0 2 2 0
33 Delhi 70 42 28 31 33 3 339 259 80
34 Lakshadweep 1 1 0 0 0 0 1 1 0
35 Puducherry 2 2 0 0 0 0 22 21 1
All India 3,038 2,450 619 1,128 1,003 241 11,369 8,149 3,304
Note: In vacancy columns, the States where the Rank wise Police Personnal are surplus , is taken as ' 0'
AIGP/SSP/SP Addl.SP/Dy. COMN ASP/DY.SP Sl. No.
States / UTs.
CHAPTER 3
49
TABLE 3.6 -- (Continued . . .)
Sanc-tioned
Actual Vacancy Sanc-tioned
Actual Vacancy Sanc-tioned
Actual Vacancy
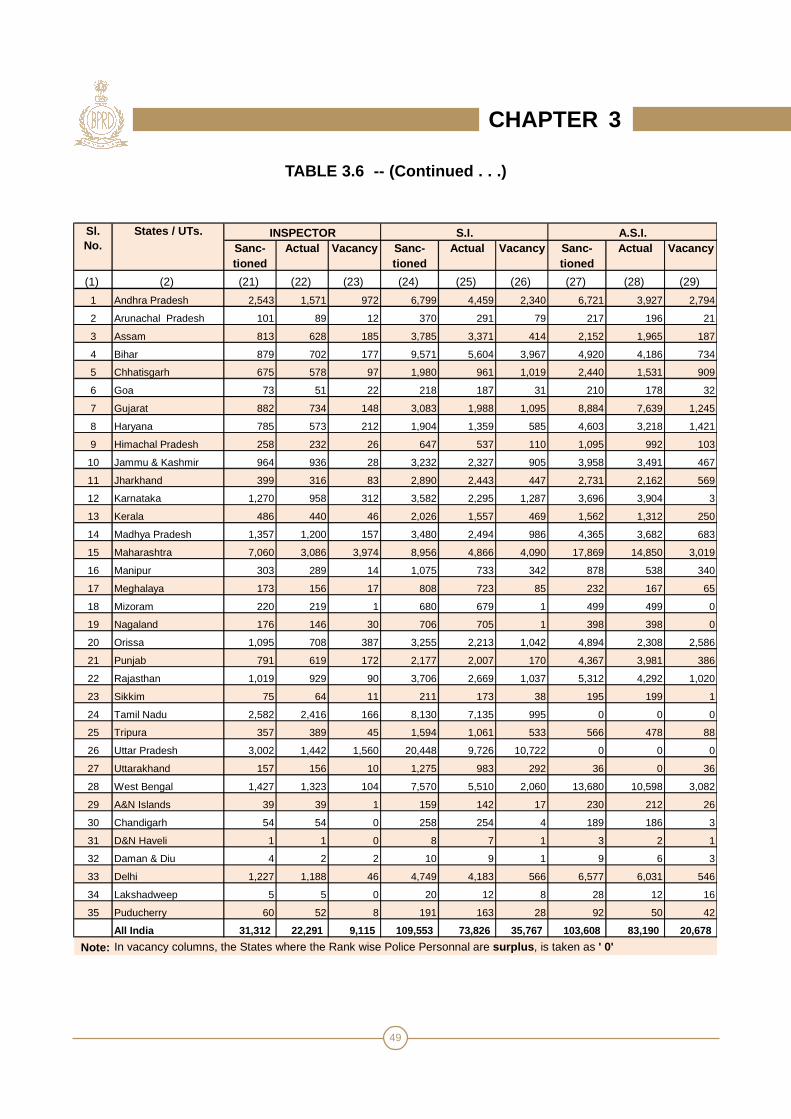
(1) (2) (21) (22) (23) (24) (25) (26) (27) (28) (29)
1 Andhra Pradesh 2,543 1,571 972 6,799 4,459 2,340 6,721 3,927 2,794
2 Arunachal Pradesh 101 89 12 370 291 79 217 196 21
3 Assam 813 628 185 3,785 3,371 414 2,152 1,965 187
4 Bihar 879 702 177 9,571 5,604 3,967 4,920 4,186 734
5 Chhatisgarh 675 578 97 1,980 961 1,019 2,440 1,531 909
6 Goa 73 51 22 218 187 31 210 178 32
7 Gujarat 882 734 148 3,083 1,988 1,095 8,884 7,639 1,245
8 Haryana 785 573 212 1,904 1,359 585 4,603 3,218 1,421
9 Himachal Pradesh 258 232 26 647 537 110 1,095 992 103
10 Jammu & Kashmir 964 936 28 3,232 2,327 905 3,958 3,491 467
11 Jharkhand 399 316 83 2,890 2,443 447 2,731 2,162 569
12 Karnataka 1,270 958 312 3,582 2,295 1,287 3,696 3,904 3
13 Kerala 486 440 46 2,026 1,557 469 1,562 1,312 250
14 Madhya Pradesh 1,357 1,200 157 3,480 2,494 986 4,365 3,682 683
15 Maharashtra 7,060 3,086 3,974 8,956 4,866 4,090 17,869 14,850 3,019
16 Manipur 303 289 14 1,075 733 342 878 538 340
17 Meghalaya 173 156 17 808 723 85 232 167 65
18 Mizoram 220 219 1 680 679 1 499 499 0
19 Nagaland 176 146 30 706 705 1 398 398 0
20 Orissa 1,095 708 387 3,255 2,213 1,042 4,894 2,308 2,586
21 Punjab 791 619 172 2,177 2,007 170 4,367 3,981 386
22 Rajasthan 1,019 929 90 3,706 2,669 1,037 5,312 4,292 1,020
23 Sikkim 75 64 11 211 173 38 195 199 1
24 Tamil Nadu 2,582 2,416 166 8,130 7,135 995 0 0 0
25 Tripura 357 389 45 1,594 1,061 533 566 478 88
26 Uttar Pradesh 3,002 1,442 1,560 20,448 9,726 10,722 0 0 0
27 Uttarakhand 157 156 10 1,275 983 292 36 0 36
28 West Bengal 1,427 1,323 104 7,570 5,510 2,060 13,680 10,598 3,082
29 A&N Islands 39 39 1 159 142 17 230 212 26
30 Chandigarh 54 54 0 258 254 4 189 186 3
31 D&N Haveli 1 1 0 8 7 1 3 2 1
32 Daman & Diu 4 2 2 10 9 1 9 6 3
33 Delhi 1,227 1,188 46 4,749 4,183 566 6,577 6,031 546
34 Lakshadweep 5 5 0 20 12 8 28 12 16
35 Puducherry 60 52 8 191 163 28 92 50 42
All India 31,312 22,291 9,115 109,553 73,826 35,767 103,608 83,190 20,678
Note: In vacancy columns, the States where the Rank wise Police Personnal are surplus , is taken as ' 0'
Sl. No.
States / UTs. A.S.I.INSPECTOR S.I.
CHAPTER 3
50
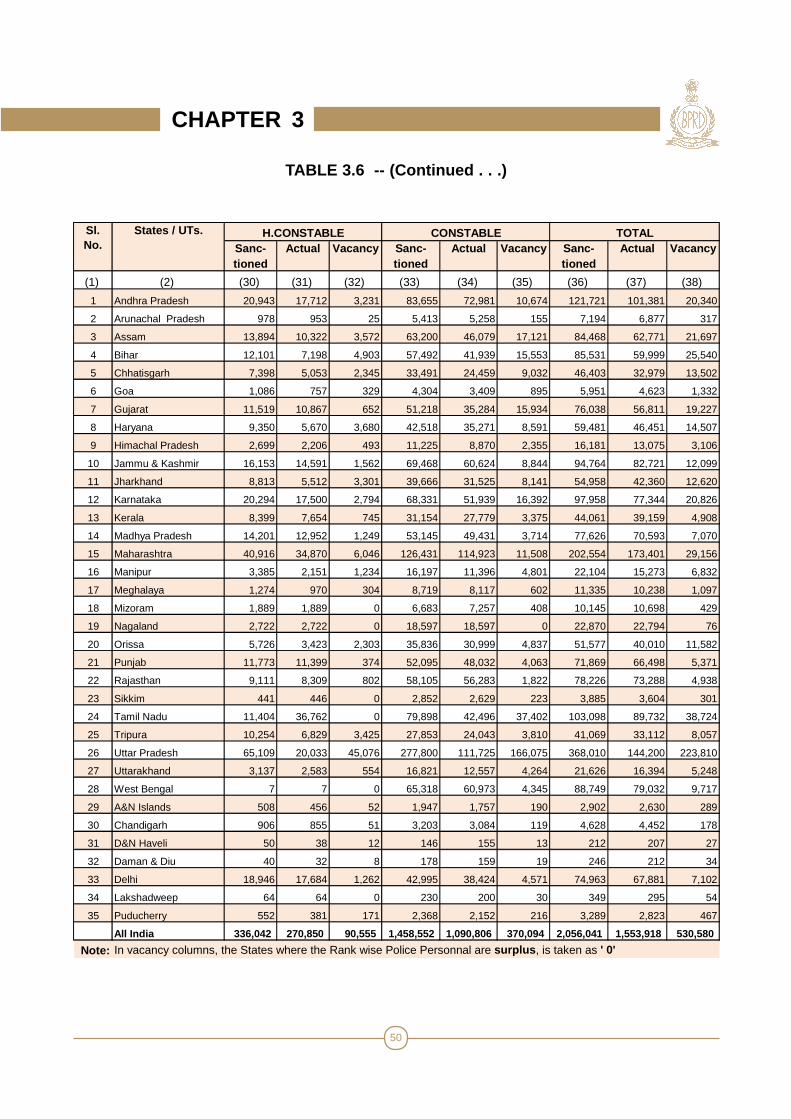
TABLE 3.6 -- (Continued . . .)
Sanc-tioned
Actual Vacancy Sanc-tioned
Actual Vacancy Sanc-tioned
Actual Vacancy
(1) (2) (30) (31) (32) (33) (34) (35) (36) (37) (38)
1 Andhra Pradesh 20,943 17,712 3,231 83,655 72,981 10,674 121,721 101,381 20,340
2 Arunachal Pradesh 978 953 25 5,413 5,258 155 7,194 6,877 317
3 Assam 13,894 10,322 3,572 63,200 46,079 17,121 84,468 62,771 21,697
4 Bihar 12,101 7,198 4,903 57,492 41,939 15,553 85,531 59,999 25,540
5 Chhatisgarh 7,398 5,053 2,345 33,491 24,459 9,032 46,403 32,979 13,502
6 Goa 1,086 757 329 4,304 3,409 895 5,951 4,623 1,332
7 Gujarat 11,519 10,867 652 51,218 35,284 15,934 76,038 56,811 19,227
8 Haryana 9,350 5,670 3,680 42,518 35,271 8,591 59,481 46,451 14,507
9 Himachal Pradesh 2,699 2,206 493 11,225 8,870 2,355 16,181 13,075 3,106
10 Jammu & Kashmir 16,153 14,591 1,562 69,468 60,624 8,844 94,764 82,721 12,099
11 Jharkhand 8,813 5,512 3,301 39,666 31,525 8,141 54,958 42,360 12,620
12 Karnataka 20,294 17,500 2,794 68,331 51,939 16,392 97,958 77,344 20,826
13 Kerala 8,399 7,654 745 31,154 27,779 3,375 44,061 39,159 4,908
14 Madhya Pradesh 14,201 12,952 1,249 53,145 49,431 3,714 77,626 70,593 7,070
15 Maharashtra 40,916 34,870 6,046 126,431 114,923 11,508 202,554 173,401 29,156
16 Manipur 3,385 2,151 1,234 16,197 11,396 4,801 22,104 15,273 6,832
17 Meghalaya 1,274 970 304 8,719 8,117 602 11,335 10,238 1,097
18 Mizoram 1,889 1,889 0 6,683 7,257 408 10,145 10,698 429
19 Nagaland 2,722 2,722 0 18,597 18,597 0 22,870 22,794 76
20 Orissa 5,726 3,423 2,303 35,836 30,999 4,837 51,577 40,010 11,582
21 Punjab 11,773 11,399 374 52,095 48,032 4,063 71,869 66,498 5,371
22 Rajasthan 9,111 8,309 802 58,105 56,283 1,822 78,226 73,288 4,938
23 Sikkim 441 446 0 2,852 2,629 223 3,885 3,604 301
24 Tamil Nadu 11,404 36,762 0 79,898 42,496 37,402 103,098 89,732 38,724
25 Tripura 10,254 6,829 3,425 27,853 24,043 3,810 41,069 33,112 8,057
26 Uttar Pradesh 65,109 20,033 45,076 277,800 111,725 166,075 368,010 144,200 223,810
27 Uttarakhand 3,137 2,583 554 16,821 12,557 4,264 21,626 16,394 5,248
28 West Bengal 7 7 0 65,318 60,973 4,345 88,749 79,032 9,717
29 A&N Islands 508 456 52 1,947 1,757 190 2,902 2,630 289
30 Chandigarh 906 855 51 3,203 3,084 119 4,628 4,452 178
31 D&N Haveli 50 38 12 146 155 13 212 207 27
32 Daman & Diu 40 32 8 178 159 19 246 212 34
33 Delhi 18,946 17,684 1,262 42,995 38,424 4,571 74,963 67,881 7,102
34 Lakshadweep 64 64 0 230 200 30 349 295 54
35 Puducherry 552 381 171 2,368 2,152 216 3,289 2,823 467
All India 336,042 270,850 90,555 1,458,552 1,090,806 370,094 2,056,041 1,553,918 530,580
Note: In vacancy columns, the States where the Rank wise Police Personnal are surplus , is taken as ' 0'
CONSTABLE TOTALH.CONSTABLESl. No.
States / UTs.
CHAPTER 3

51
TABLE 3.7 - ACTUAL STRENGTH OF WOMEN POLICE (RANK- WISE) AS ON 1.1.2009
(1) (2) (3) (4) (5) (6) (7) (8) (9) (10) (11) (12) (13) (14)
1 Andhra Pradesh 1 1 2 8 0 2 8 76 21 97 1,503 1,719
2 Arunachal Pradesh 0 0 0 0 0 0 3 12 3 17 346 381
3 Assam 0 0 0 4 1 6 12 24 28 71 414 560
4 Bihar 0 1 1 1 0 5 1 47 33 33 951 1,073
5 Chhatisgarh 0 0 0 1 2 23 49 24 25 73 1,335 1,532
6 Goa 0 0 0 0 0 2 6 11 3 119 169 310
7 Gujarat 0 0 0 0 0 0 2 12 186 288 1,021 1,509
8 Haryana 0 0 0 6 0 4 16 73 64 53 1,657 1,873
9 Himachal Pradesh 0 0 0 4 3 3 12 12 13 48 642 737
10 Jammu & Kashmir 0 1 1 3 0 14 27 88 49 131 1,339 1,653
11 Jharkhand 1 1 2 1 0 1 6 53 57 116 1,206 1,444
12 Karnataka 1 1 1 3 0 12 30 35 53 380 1,272 1,788
13 Kerala 0 0 0 0 0 1 21 73 0 178 2,375 2,648
14 Madhya Pradesh 0 3 2 10 4 51 22 309 375 222 1,306 2,304
15 Maharashtra* 1 1 4 7 0 18 51 168 298 423 8,134 9,105
16 Manipur 0 0 0 5 0 11 3 3 2 39 411 474
17 Meghalaya 0 0 0 2 0 2 9 7 2 2 156 180
18 Mizoram 0 0 0 0 0 1 3 8 19 4 187 222
19 Nagaland 0 0 0 2 9 15 5 24 36 11 148 250
20 Orissa 0 1 1 8 0 7 32 272 38 3 2,902 3,264
21 Punjab 0 0 1 4 0 6 21 51 111 187 1,087 1,468
22 Rajasthan 0 1 0 10 0 25 10 98 40 58 3,318 3,560
23 Sikkim 0 0 0 2 0 2 10 21 1 0 143 179
24 Tamil Nadu 3 2 0 31 0 15 100 1,331 0 588 5,658 7,728
25 Tripura 0 0 0 1 0 3 6 32 38 0 582 662
26 Uttar Pradesh 0 1 4 8 0 37 12 341 0 156 1,995 2,554
27 Uttarakhand 0 0 1 1 1 6 1 29 0 55 1,171 1,265
28 West Bengal 0 1 0 1 1 9 6 68 72 0 1,717 1,875
29 A&N Islands 0 0 0 0 0 0 4 15 1 23 193 236
30 Chandigarh 0 0 0 0 0 0 4 21 9 16 280 330
31 D&N Haveli 0 0 0 0 0 0 0 2 0 3 17 22
32 Daman & Diu 0 0 0 0 0 0 0 0 0 2 7 9
33 Delhi 0 1 0 3 0 31 71 175 561 763 1,975 3,580
34 Lakshadweep 0 0 0 0 0 0 0 0 0 1 15 16
35 Puducherry 0 0 0 1 0 1 1 4 0 8 142 157
All India 7 16 20 127 21 313 564 3,519 2,138 4,168 45,774 56,667
* As on 1.1.2008
S.I. Head Const.
ADDLSP/ Dy.
COM
A.S.I.DIG AIGP/SSP/S
P/ COM
Sl.No. States / UTs. DGP/ADGP
IGP ASP/ Dy.SP/ Asst. COM
Const. Total INSP.
CHAPTER 3
52
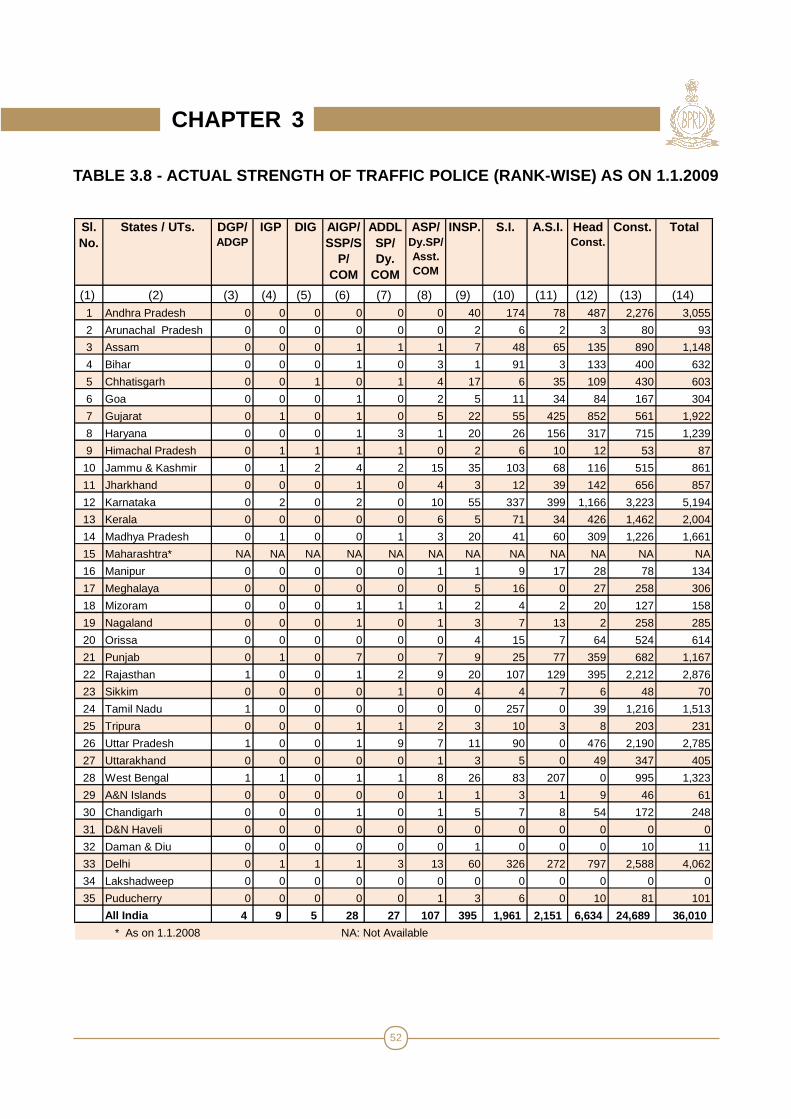
TABLE 3.8 - ACTUAL STRENGTH OF TRAFFIC POLICE (RANK-WISE) AS ON 1.1.2009
(1) (2) (3) (4) (5) (6) (7) (8) (9) (10) (11) (12) (13) (14) 1 Andhra Pradesh 0 0 0 0 0 0 40 174 78 487 2,276 3,055
2 Arunachal Pradesh 0 0 0 0 0 0 2 6 2 3 80 93
3 Assam 0 0 0 1 1 1 7 48 65 135 890 1,148
4 Bihar 0 0 0 1 0 3 1 91 3 133 400 632
5 Chhatisgarh 0 0 1 0 1 4 17 6 35 109 430 603
6 Goa 0 0 0 1 0 2 5 11 34 84 167 304
7 Gujarat 0 1 0 1 0 5 22 55 425 852 561 1,922
8 Haryana 0 0 0 1 3 1 20 26 156 317 715 1,239
9 Himachal Pradesh 0 1 1 1 1 0 2 6 10 12 53 87
10 Jammu & Kashmir 0 1 2 4 2 15 35 103 68 116 515 861
11 Jharkhand 0 0 0 1 0 4 3 12 39 142 656 857
12 Karnataka 0 2 0 2 0 10 55 337 399 1,166 3,223 5,194
13 Kerala 0 0 0 0 0 6 5 71 34 426 1,462 2,004
14 Madhya Pradesh 0 1 0 0 1 3 20 41 60 309 1,226 1,661
15 Maharashtra* NA NA NA NA NA NA NA NA NA NA NA NA
16 Manipur 0 0 0 0 0 1 1 9 17 28 78 134
17 Meghalaya 0 0 0 0 0 0 5 16 0 27 258 306
18 Mizoram 0 0 0 1 1 1 2 4 2 20 127 158
19 Nagaland 0 0 0 1 0 1 3 7 13 2 258 285
20 Orissa 0 0 0 0 0 0 4 15 7 64 524 614
21 Punjab 0 1 0 7 0 7 9 25 77 359 682 1,167
22 Rajasthan 1 0 0 1 2 9 20 107 129 395 2,212 2,876
23 Sikkim 0 0 0 0 1 0 4 4 7 6 48 70
24 Tamil Nadu 1 0 0 0 0 0 0 257 0 39 1,216 1,513
25 Tripura 0 0 0 1 1 2 3 10 3 8 203 231
26 Uttar Pradesh 1 0 0 1 9 7 11 90 0 476 2,190 2,785
27 Uttarakhand 0 0 0 0 0 1 3 5 0 49 347 405
28 West Bengal 1 1 0 1 1 8 26 83 207 0 995 1,323
29 A&N Islands 0 0 0 0 0 1 1 3 1 9 46 61
30 Chandigarh 0 0 0 1 0 1 5 7 8 54 172 248
31 D&N Haveli 0 0 0 0 0 0 0 0 0 0 0 0
32 Daman & Diu 0 0 0 0 0 0 1 0 0 0 10 11
33 Delhi 0 1 1 1 3 13 60 326 272 797 2,588 4,062
34 Lakshadweep 0 0 0 0 0 0 0 0 0 0 0 0
35 Puducherry 0 0 0 0 0 1 3 6 0 10 81 101
All India 4 9 5 28 27 107 395 1,961 2,151 6,634 24,689 36,010
* As on 1.1.2008
Head Const.
Const.ASP/ Dy.SP/ Asst. COM
ADDLSP/ Dy.
COM
INSP. A.S.I.
NA: Not Available
Sl.No.
States / UTs. DGP/ADGP
IGP DIG AIGP/SSP/S
P/ COM
Total S.I.
CHAPTER 3

53
TABLE 3.9 - SANCTIONED & ACTUAL STRENGTH OF SPECIAL BRANCHDEALING WITH INTELLIGENCE- AS ON 1.1.2009
Sanc-tioned
Actual Sanc-tioned
Actual Sanc-tioned
Actual
(1) (2) (3) (4) (5) (6) (7) (8) 1 Andhra Pradesh 1 0 2 2 3 32 Arunachal Pradesh 0 0 0 0 0 0
3 Assam 1 0 3 3 2 2
4 Bihar 1 1 1 1 2 2
5 Chhatisgarh 1 1 1 1 2 2
6 Goa 0 0 0 0 0 0
7 Gujarat 1 1 2 2 2 1
8 Haryana 1 1 1 1 3 3
9 Himachal Pradesh 0 0 1 1 0 0
10 Jammu & Kashmir 0 0 1 1 1 1
11 Jharkhand 2 2 2 2 2 1
12 Karnataka 0 0 2 2 2 2
13 Kerala 1 1 3 3 1 1
14 Madhya Pradesh 1 1 3 3 2 2
15 Maharashtra 1 NA 2 NA 0 NA
16 Manipur 0 0 1 1 1 0
17 Meghalaya 0 0 1 0 1 1
18 Mizoram 0 0 0 0 1 1
19 Nagaland 0 1 1 1 1 0
20 Orissa 1 1 1 1 1 1
21 Punjab 1 1 1 1 3 3
22 Rajasthan 1 1 2 1 3 1
23 Sikkim 0 1 0 1 1 0
24 Tamil Nadu 1 0 1 1 1 1
25 Tripura 0 0 1 1 1 1
26 Uttar Pradesh 0 0 0 0 0 0
27 Uttarakhand 1 0 0 1 1 1
28 West Bengal 2 2 2 2 2 2
29 A&N Islands 0 0 0 0 0 0
30 Chandigarh 0 0 0 0 0 0
31 D&N Haveli 0 0 0 0 0 0
32 Daman & Diu 0 0 0 0 0 0
33 Delhi 1 0 0 1 1 1
34 Lakshadweep 0 0 0 0 0 0
35 Puducherry 0 0 0 0 0 0
All India 19 15 35 34 40 33NA: Not Available
Sl. No.
States / UTs. DGP/Addl. DGP IGP DIG
CHAPTER 3

54
TABLE 3.9 -- (Continued . . .)
Sanc-tioned
Actual Sanc-tioned
Actual Sanc-tioned
Actual
(1) (2) (9) (10) (11) (12) (13) (14) 1 Andhra Pradesh 20 18 12 9 65 46
2 Arunachal Pradesh 1 1 1 1 1 0
3 Assam 8 6 2 2 34 26
4 Bihar 5 0 0 0 57 0
5 Chhatisgarh 2 5 3 4 8 12
6 Goa 0 0 1 1 1 1
7 Gujarat 8 7 0 0 8 0
8 Haryana 4 4 6 6 19 19
9 Himachal Pradesh 1 1 0 0 3 3
10 Jammu & Kashmir 5 2 0 2 8 6
11 Jharkhand 7 2 12 2 48 32
12 Karnataka 11 9 0 0 40 33
13 Kerala 8 8 0 0 31 31
14 Madhya Pradesh 3 2 5 5 28 22
15 Maharashtra 8 NA 21 NA 0 NA
16 Manipur 2 1 1 0 9 6
17 Meghalaya 2 2 0 0 5 5
18 Mizoram 1 1 1 1 3 1
19 Nagaland 3 3 1 1 14 12
20 Orissa 2 2 2 2 13 13
21 Punjab 16 17 0 0 45 34
22 Rajasthan 7 6 21 18 11 16
23 Sikkim 0 3 0 0 0 3
24 Tamil Nadu 1 1 2 2 7 7
25 Tripura 1 1 3 2 8 4
26 Uttar Pradesh 0 0 0 0 0 0
27 Uttarakhand 0 0 4 2 13 7
28 West Bengal 5 5 0 0 15 11
29 A&N Islands 0 0 0 0 1 0
30 Chandigarh 0 0 0 0 1 1
31 D&N Haveli 0 0 0 0 0 0
32 Daman & Diu 0 0 0 0 0 0
33 Delhi 1 2 1 1 9 10
34 Lakshadweep 0 0 0 0 0 0
35 Puducherry 0 0 0 0 1 1
All India 132 109 99 61 506 362 NA: Not Available
Sl. No.
States / UTs. AIGP/SSP/SP Addl.SP/Dy. COMN ASP/DY.SP
CHAPTER 3
55
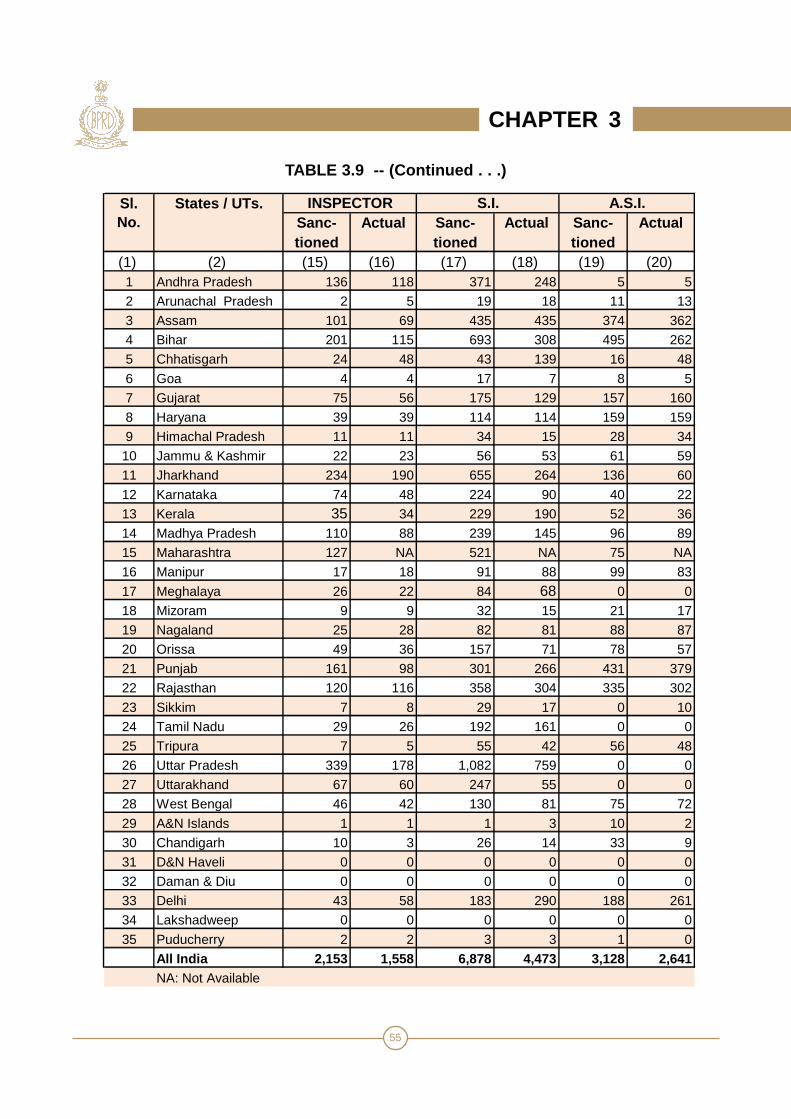
TABLE 3.9 -- (Continued . . .)
Sanc-tioned
Actual Sanc-tioned
Actual Sanc-tioned
Actual
(1) (2) (15) (16) (17) (18) (19) (20) 1 Andhra Pradesh 136 118 371 248 5 5
2 Arunachal Pradesh 2 5 19 18 11 13
3 Assam 101 69 435 435 374 362
4 Bihar 201 115 693 308 495 262
5 Chhatisgarh 24 48 43 139 16 48
6 Goa 4 4 17 7 8 5
7 Gujarat 75 56 175 129 157 160
8 Haryana 39 39 114 114 159 159
9 Himachal Pradesh 11 11 34 15 28 34
10 Jammu & Kashmir 22 23 56 53 61 59
11 Jharkhand 234 190 655 264 136 60
12 Karnataka 74 48 224 90 40 22
13 Kerala 35 34 229 190 52 36
14 Madhya Pradesh 110 88 239 145 96 89
15 Maharashtra 127 NA 521 NA 75 NA
16 Manipur 17 18 91 88 99 83
17 Meghalaya 26 22 84 68 0 0
18 Mizoram 9 9 32 15 21 17
19 Nagaland 25 28 82 81 88 87
20 Orissa 49 36 157 71 78 57
21 Punjab 161 98 301 266 431 379
22 Rajasthan 120 116 358 304 335 302
23 Sikkim 7 8 29 17 0 10
24 Tamil Nadu 29 26 192 161 0 0
25 Tripura 7 5 55 42 56 48
26 Uttar Pradesh 339 178 1,082 759 0 0
27 Uttarakhand 67 60 247 55 0 0
28 West Bengal 46 42 130 81 75 72
29 A&N Islands 1 1 1 3 10 2
30 Chandigarh 10 3 26 14 33 9
31 D&N Haveli 0 0 0 0 0 0
32 Daman & Diu 0 0 0 0 0 0
33 Delhi 43 58 183 290 188 261
34 Lakshadweep 0 0 0 0 0 0
35 Puducherry 2 2 3 3 1 0
All India 2,153 1,558 6,878 4,473 3,128 2,641NA: Not Available
Sl. No.
States / UTs. INSPECTOR S.I. A.S.I.
CHAPTER 3

56
TABLE 3.9 -- (Continued . . .)
Sanc-tioned
Actual Sanc-tioned
Actual Sanc-tioned
Actual
(1) (2) (21) (22) (23) (24) (25) (26) 1 Andhra Pradesh 668 567 714 557 1,997 1,573
2 Arunachal Pradesh 22 23 115 175 172 236
3 Assam 342 268 677 595 1,979 1,768
4 Bihar 143 135 590 441 2,188 1,265
5 Chhatisgarh 26 195 73 175 199 630
6 Goa 34 33 29 57 94 108
7 Gujarat 0 0 0 0 428 356
8 Haryana 620 620 394 394 1,360 1,360
9 Himachal Pradesh 22 25 74 53 174 143
10 Jammu & Kashmir 209 180 470 382 833 709
11 Jharkhand 182 66 1,210 438 2,490 1,059
12 Karnataka 305 225 592 386 1,290 817
13 Kerala 620 560 245 242 1,225 1,106
14 Madhya Pradesh 282 253 208 276 977 886
15 Maharashtra 356 NA 470 NA 1,581 NA
16 Manipur 74 24 617 273 912 494
17 Meghalaya 28 19 147 147 294 264
18 Mizoram 28 28 60 60 156 133
19 Nagaland 231 233 392 392 838 839
20 Orissa 2 1 175 167 481 352
21 Punjab 588 557 1,015 982 2,562 2,338
22 Rajasthan 160 142 710 623 1,728 1,530
23 Sikkim 27 21 36 61 100 125
24 Tamil Nadu 220 210 271 260 725 669
25 Tripura 7 8 235 167 374 279
26 Uttar Pradesh 1,281 913 1,287 1,159 3,989 3,009
27 Uttarakhand 306 255 419 595 1,058 976
28 West Bengal 0 0 330 303 607 520
29 A&N Islands 5 20 27 30 45 56
30 Chandigarh 56 29 72 74 198 130
31 D&N Haveli 0 0 0 0 0 0
32 Daman & Diu 0 0 0 0 0 0
33 Delhi 173 273 86 192 686 1,089
34 Lakshadweep 0 0 0 0 0 0
35 Puducherry 18 18 3 3 28 27All India 7,035 5,901 11,743 9,659 31,768 24,846NA: Not Available
Sl. No.
CONSTABLE TOTALStates / UTs. H.CONSTABLE
CHAPTER 3

57
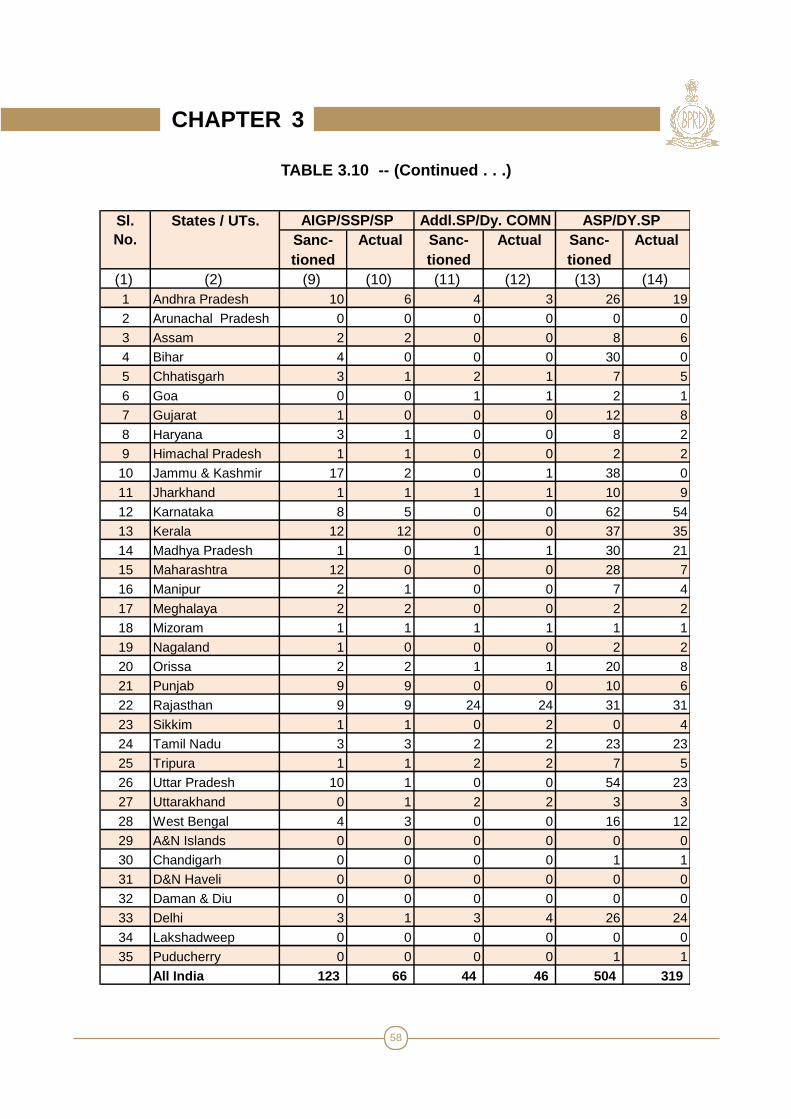
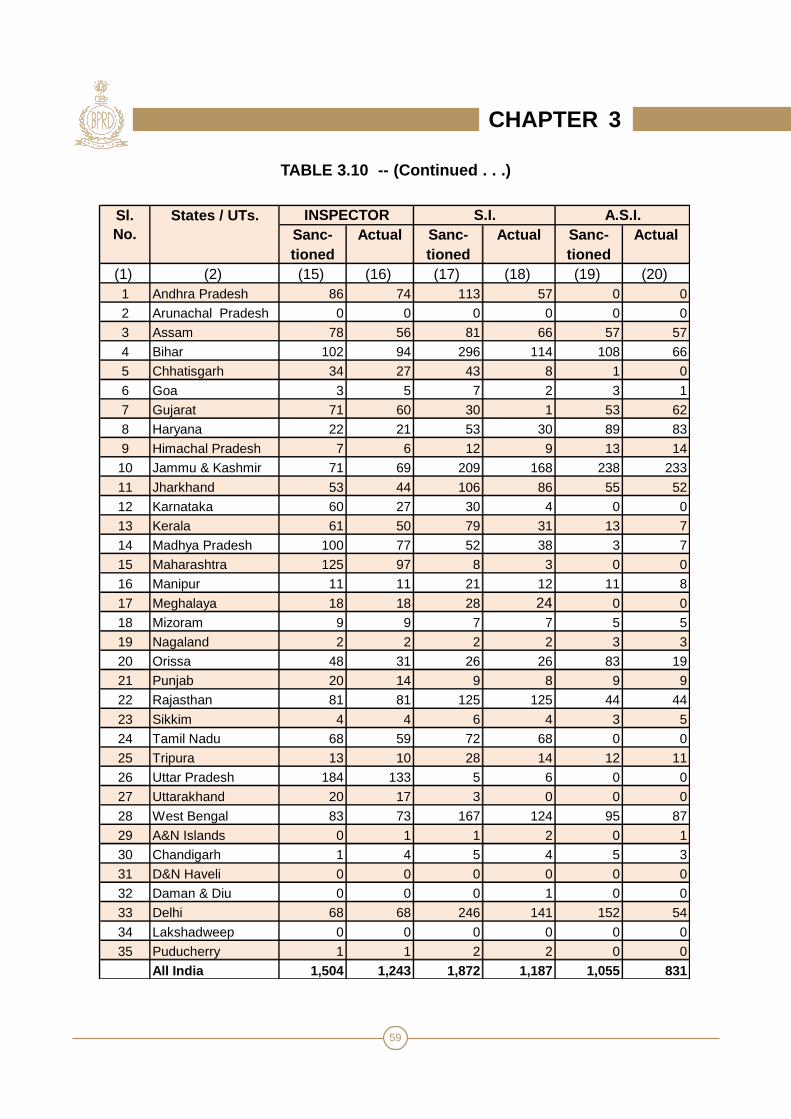
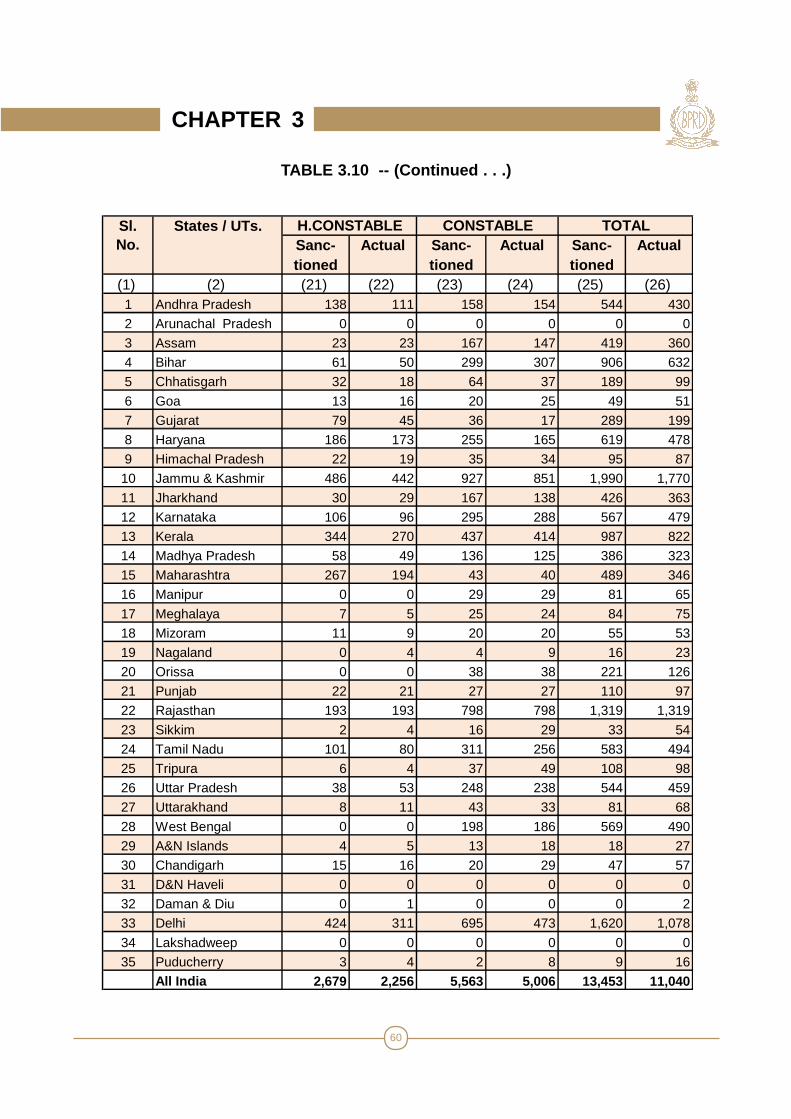
TABLE 3.10 - SANCTIONED & ACTUAL STRENGTH OF C.I.D. OF CRIME BRANCHDEALING WITH INVESTIGATION OF CRIME - AS ON 1.1.2009
Sanc-tioned
Actual Sanc-tioned
Actual Sanc-tioned
Actual
(1) (2) (3) (4) (5) (6) (7) (8) 1 Andhra Pradesh 1 1 4 3 4 22 Arunachal Pradesh 0 0 0 0 0 0
3 Assam 1 1 1 1 1 1
4 Bihar 1 1 3 0 2 0
5 Chhatisgarh 1 1 1 0 1 1
6 Goa 0 0 0 0 0 0
7 Gujarat 1 1 4 3 2 2
8 Haryana 1 1 1 1 1 1
9 Himachal Pradesh 1 1 1 1 1 0
10 Jammu & Kashmir 1 1 1 1 2 2
11 Jharkhand 1 1 1 1 1 1
12 Karnataka 2 1 2 2 2 2
13 Kerala 1 1 1 2 2 0
14 Madhya Pradesh 1 1 3 3 1 1
15 Maharashtra 1 1 3 3 2 1
16 Manipur 0 0 0 0 0 0
17 Meghalaya 1 0 1 0 0 0
18 Mizoram 0 0 0 0 0 0
19 Nagaland 0 0 1 1 1 0
20 Orissa 1 0 1 1 1 0
21 Punjab 1 1 1 1 2 1
22 Rajasthan 3 3 6 6 5 5
23 Sikkim 0 1 1 0 0 0
24 Tamil Nadu 1 1 1 1 1 1
25 Tripura 0 0 1 1 1 1
26 Uttar Pradesh 1 2 2 1 2 2
27 Uttarakhand 1 1 0 0 1 0
28 West Bengal 1 1 2 2 3 2
29 A&N Islands 0 0 0 0 0 0
30 Chandigarh 0 0 0 0 0 0
31 D&N Haveli 0 0 0 0 0 0
32 Daman & Diu 0 0 0 0 0 0
33 Delhi 0 0 1 1 2 1
34 Lakshadweep 0 0 0 0 0 0
35 Puducherry 0 0 0 0 0 0
All India 24 23 44 36 41 27
Sl. No.
States / UTs. DGP/Addl. DGP IGP DIG
CHAPTER 3
58
TABLE 3.10 -- (Continued . . .)
Sanc-tioned
Actual Sanc-tioned
Actual Sanc-tioned
Actual
(1) (2) (9) (10) (11) (12) (13) (14) 1 Andhra Pradesh 10 6 4 3 26 19
2 Arunachal Pradesh 0 0 0 0 0 0
3 Assam 2 2 0 0 8 6
4 Bihar 4 0 0 0 30 0
5 Chhatisgarh 3 1 2 1 7 5
6 Goa 0 0 1 1 2 1
7 Gujarat 1 0 0 0 12 8
8 Haryana 3 1 0 0 8 2
9 Himachal Pradesh 1 1 0 0 2 2
10 Jammu & Kashmir 17 2 0 1 38 0
11 Jharkhand 1 1 1 1 10 9
12 Karnataka 8 5 0 0 62 54
13 Kerala 12 12 0 0 37 35
14 Madhya Pradesh 1 0 1 1 30 21
15 Maharashtra 12 0 0 0 28 7
16 Manipur 2 1 0 0 7 4
17 Meghalaya 2 2 0 0 2 2
18 Mizoram 1 1 1 1 1 1
19 Nagaland 1 0 0 0 2 2
20 Orissa 2 2 1 1 20 8
21 Punjab 9 9 0 0 10 6
22 Rajasthan 9 9 24 24 31 31
23 Sikkim 1 1 0 2 0 4
24 Tamil Nadu 3 3 2 2 23 23
25 Tripura 1 1 2 2 7 5
26 Uttar Pradesh 10 1 0 0 54 23
27 Uttarakhand 0 1 2 2 3 3
28 West Bengal 4 3 0 0 16 12
29 A&N Islands 0 0 0 0 0 0
30 Chandigarh 0 0 0 0 1 1
31 D&N Haveli 0 0 0 0 0 0
32 Daman & Diu 0 0 0 0 0 0
33 Delhi 3 1 3 4 26 24
34 Lakshadweep 0 0 0 0 0 0
35 Puducherry 0 0 0 0 1 1
All India 123 66 44 46 504 319
Sl. No.
States / UTs. AIGP/SSP/SP Addl.SP/Dy. COMN ASP/DY.SP
CHAPTER 3
59
TABLE 3.10 -- (Continued . . .)
Sanc-tioned
Actual Sanc-tioned
Actual Sanc-tioned
Actual
(1) (2) (15) (16) (17) (18) (19) (20) 1 Andhra Pradesh 86 74 113 57 0 0
2 Arunachal Pradesh 0 0 0 0 0 0
3 Assam 78 56 81 66 57 57
4 Bihar 102 94 296 114 108 66
5 Chhatisgarh 34 27 43 8 1 0
6 Goa 3 5 7 2 3 1
7 Gujarat 71 60 30 1 53 62
8 Haryana 22 21 53 30 89 83
9 Himachal Pradesh 7 6 12 9 13 14
10 Jammu & Kashmir 71 69 209 168 238 233
11 Jharkhand 53 44 106 86 55 52
12 Karnataka 60 27 30 4 0 0
13 Kerala 61 50 79 31 13 7
14 Madhya Pradesh 100 77 52 38 3 7
15 Maharashtra 125 97 8 3 0 0
16 Manipur 11 11 21 12 11 8
17 Meghalaya 18 18 28 24 0 0
18 Mizoram 9 9 7 7 5 5
19 Nagaland 2 2 2 2 3 3
20 Orissa 48 31 26 26 83 19
21 Punjab 20 14 9 8 9 9
22 Rajasthan 81 81 125 125 44 44
23 Sikkim 4 4 6 4 3 5
24 Tamil Nadu 68 59 72 68 0 0
25 Tripura 13 10 28 14 12 11
26 Uttar Pradesh 184 133 5 6 0 0
27 Uttarakhand 20 17 3 0 0 0
28 West Bengal 83 73 167 124 95 87
29 A&N Islands 0 1 1 2 0 1
30 Chandigarh 1 4 5 4 5 3
31 D&N Haveli 0 0 0 0 0 0
32 Daman & Diu 0 0 0 1 0 0
33 Delhi 68 68 246 141 152 54
34 Lakshadweep 0 0 0 0 0 0
35 Puducherry 1 1 2 2 0 0
All India 1,504 1,243 1,872 1,187 1,055 831
Sl. No.
States / UTs. INSPECTOR S.I. A.S.I.
CHAPTER 3
60
TABLE 3.10 -- (Continued . . .)
Sanc-tioned
Actual Sanc-tioned
Actual Sanc-tioned
Actual
(1) (2) (21) (22) (23) (24) (25) (26) 1 Andhra Pradesh 138 111 158 154 544 430
2 Arunachal Pradesh 0 0 0 0 0 0
3 Assam 23 23 167 147 419 360
4 Bihar 61 50 299 307 906 632
5 Chhatisgarh 32 18 64 37 189 99
6 Goa 13 16 20 25 49 51
7 Gujarat 79 45 36 17 289 199
8 Haryana 186 173 255 165 619 478
9 Himachal Pradesh 22 19 35 34 95 87
10 Jammu & Kashmir 486 442 927 851 1,990 1,770
11 Jharkhand 30 29 167 138 426 363
12 Karnataka 106 96 295 288 567 479
13 Kerala 344 270 437 414 987 822
14 Madhya Pradesh 58 49 136 125 386 323
15 Maharashtra 267 194 43 40 489 346
16 Manipur 0 0 29 29 81 65
17 Meghalaya 7 5 25 24 84 75
18 Mizoram 11 9 20 20 55 53
19 Nagaland 0 4 4 9 16 23
20 Orissa 0 0 38 38 221 126
21 Punjab 22 21 27 27 110 97
22 Rajasthan 193 193 798 798 1,319 1,319
23 Sikkim 2 4 16 29 33 54
24 Tamil Nadu 101 80 311 256 583 494
25 Tripura 6 4 37 49 108 98
26 Uttar Pradesh 38 53 248 238 544 459
27 Uttarakhand 8 11 43 33 81 68
28 West Bengal 0 0 198 186 569 490
29 A&N Islands 4 5 13 18 18 27
30 Chandigarh 15 16 20 29 47 57
31 D&N Haveli 0 0 0 0 0 0
32 Daman & Diu 0 1 0 0 0 2
33 Delhi 424 311 695 473 1,620 1,078
34 Lakshadweep 0 0 0 0 0 0
35 Puducherry 3 4 2 8 9 16All India 2,679 2,256 5,563 5,006 13,453 11,040
Sl. No.
States / UTs. H.CONSTABLE CONSTABLE TOTAL
CHAPTER 3
61
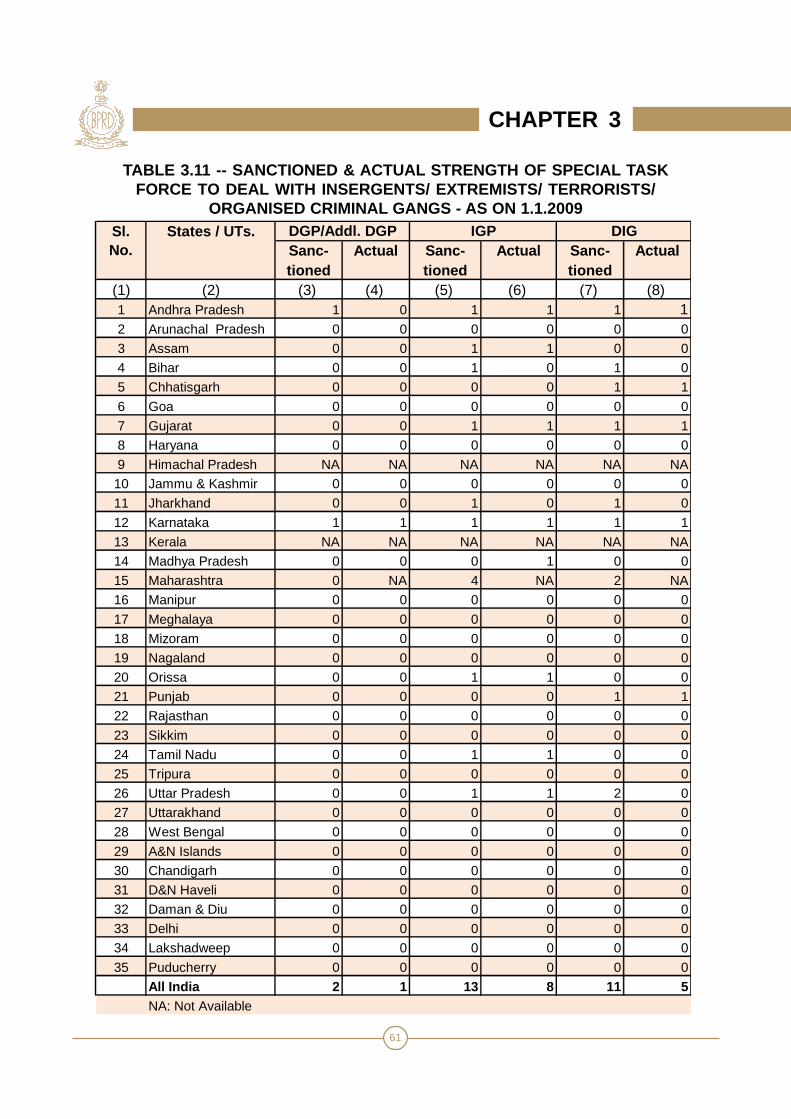
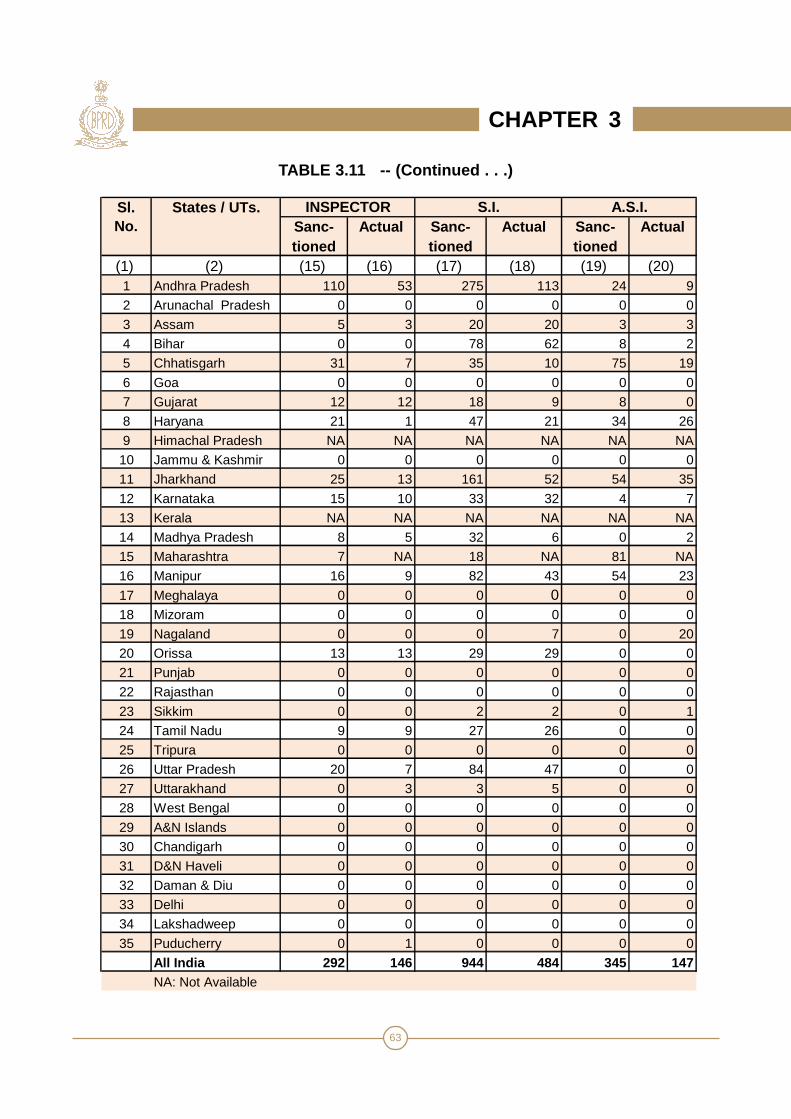
TABLE 3.11 -- SANCTIONED & ACTUAL STRENGTH OF SPECIAL TASKFORCE TO DEAL WITH INSERGENTS/ EXTREMISTS/ TERRORISTS/
ORGANISED CRIMINAL GANGS - AS ON 1.1.2009
Sanc-tioned
Actual Sanc-tioned
Actual Sanc-tioned
Actual
(1) (2) (3) (4) (5) (6) (7) (8) 1 Andhra Pradesh 1 0 1 1 1 12 Arunachal Pradesh 0 0 0 0 0 0
3 Assam 0 0 1 1 0 0
4 Bihar 0 0 1 0 1 0
5 Chhatisgarh 0 0 0 0 1 1
6 Goa 0 0 0 0 0 0
7 Gujarat 0 0 1 1 1 1
8 Haryana 0 0 0 0 0 0
9 Himachal Pradesh NA NA NA NA NA NA
10 Jammu & Kashmir 0 0 0 0 0 0
11 Jharkhand 0 0 1 0 1 0
12 Karnataka 1 1 1 1 1 1
13 Kerala NA NA NA NA NA NA
14 Madhya Pradesh 0 0 0 1 0 0
15 Maharashtra 0 NA 4 NA 2 NA
16 Manipur 0 0 0 0 0 0
17 Meghalaya 0 0 0 0 0 0
18 Mizoram 0 0 0 0 0 0
19 Nagaland 0 0 0 0 0 0
20 Orissa 0 0 1 1 0 0
21 Punjab 0 0 0 0 1 1
22 Rajasthan 0 0 0 0 0 0
23 Sikkim 0 0 0 0 0 0
24 Tamil Nadu 0 0 1 1 0 0
25 Tripura 0 0 0 0 0 0
26 Uttar Pradesh 0 0 1 1 2 0
27 Uttarakhand 0 0 0 0 0 0
28 West Bengal 0 0 0 0 0 0
29 A&N Islands 0 0 0 0 0 0
30 Chandigarh 0 0 0 0 0 0
31 D&N Haveli 0 0 0 0 0 0
32 Daman & Diu 0 0 0 0 0 0
33 Delhi 0 0 0 0 0 0
34 Lakshadweep 0 0 0 0 0 0
35 Puducherry 0 0 0 0 0 0
All India 2 1 13 8 11 5NA: Not Available
Sl. No.
States / UTs. DGP/Addl. DGP IGP DIG
CHAPTER 3

62
TABLE 3.11 -- (Continued . . .)
CHAPTER 3
Sanc-tioned
Actual Sanc-tioned
Actual Sanc-tioned
Actual
(1) (2) (9) (10) (11) (12) (13) (14) 1 Andhra Pradesh 7 2 9 5 44 34
2 Arunachal Pradesh 0 0 0 0 0 0
3 Assam 0 0 1 1 3 1
4 Bihar 2 1 0 0 25 15
5 Chhatisgarh 3 0 3 0 20 2
6 Goa 0 0 0 0 0 0
7 Gujarat 1 1 0 0 6 6
8 Haryana 0 0 0 0 4 1
9 Himachal Pradesh NA NA NA NA NA NA
10 Jammu & Kashmir 0 0 0 0 0 0
11 Jharkhand 2 1 0 0 22 6
12 Karnataka 3 2 0 0 10 6
13 Kerala NA NA NA NA NA NA
14 Madhya Pradesh 0 1 0 0 0 0
15 Maharashtra 2 NA 0 NA 3 NA
16 Manipur 0 0 0 0 8 3
17 Meghalaya 0 0 0 0 0 0
18 Mizoram 0 0 0 0 0 0
19 Nagaland 0 0 0 0 0 0
20 Orissa 1 1 6 6 9 9
21 Punjab 0 0 0 0 0 0
22 Rajasthan 0 0 0 0 0 0
23 Sikkim 0 0 0 0 1 0
24 Tamil Nadu 2 1 1 0 7 0
25 Tripura 0 0 0 0 0 0
26 Uttar Pradesh 1 1 10 5 19 8
27 Uttarakhand 0 1 0 0 2 2
28 West Bengal 0 0 0 0 0 0
29 A&N Islands 0 0 0 0 0 0
30 Chandigarh 0 0 0 0 0 0
31 D&N Haveli 0 0 0 0 0 0
32 Daman & Diu 0 0 0 0 0 0
33 Delhi 0 0 0 0 0 0
34 Lakshadweep 0 0 0 0 0 0
35 Puducherry 0 0 0 0 0 0
All India 24 12 30 17 183 93 NA: Not Available
Sl. No.
States / UTs. AIGP/SSP/SP Addl.SP/Dy. COMN ASP/DY.SP
63
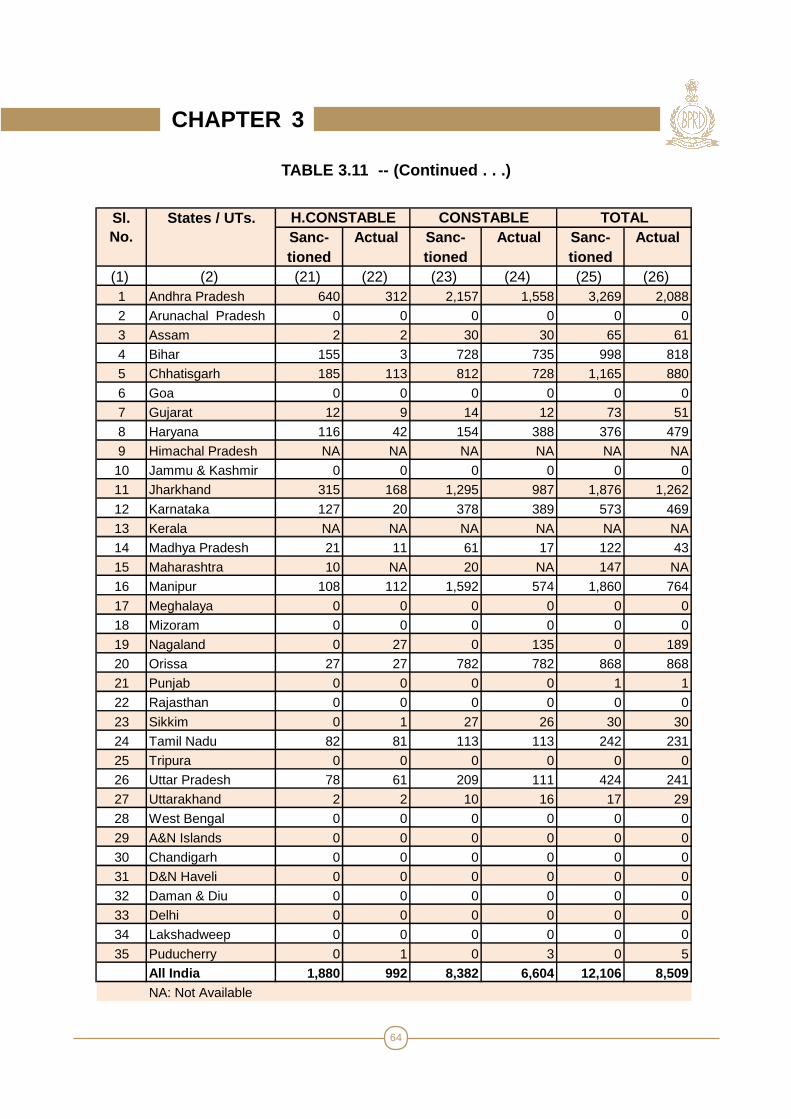
TABLE 3.11 -- (Continued . . .)
Sanc-tioned
Actual Sanc-tioned
Actual Sanc-tioned
Actual
(1) (2) (15) (16) (17) (18) (19) (20) 1 Andhra Pradesh 110 53 275 113 24 9
2 Arunachal Pradesh 0 0 0 0 0 0
3 Assam 5 3 20 20 3 3
4 Bihar 0 0 78 62 8 2
5 Chhatisgarh 31 7 35 10 75 19
6 Goa 0 0 0 0 0 0
7 Gujarat 12 12 18 9 8 0
8 Haryana 21 1 47 21 34 26
9 Himachal Pradesh NA NA NA NA NA NA
10 Jammu & Kashmir 0 0 0 0 0 0
11 Jharkhand 25 13 161 52 54 35
12 Karnataka 15 10 33 32 4 7
13 Kerala NA NA NA NA NA NA
14 Madhya Pradesh 8 5 32 6 0 2
15 Maharashtra 7 NA 18 NA 81 NA
16 Manipur 16 9 82 43 54 23
17 Meghalaya 0 0 0 0 0 0
18 Mizoram 0 0 0 0 0 0
19 Nagaland 0 0 0 7 0 20
20 Orissa 13 13 29 29 0 0
21 Punjab 0 0 0 0 0 0
22 Rajasthan 0 0 0 0 0 0
23 Sikkim 0 0 2 2 0 1
24 Tamil Nadu 9 9 27 26 0 0
25 Tripura 0 0 0 0 0 0
26 Uttar Pradesh 20 7 84 47 0 0
27 Uttarakhand 0 3 3 5 0 0
28 West Bengal 0 0 0 0 0 0
29 A&N Islands 0 0 0 0 0 0
30 Chandigarh 0 0 0 0 0 0
31 D&N Haveli 0 0 0 0 0 0
32 Daman & Diu 0 0 0 0 0 0
33 Delhi 0 0 0 0 0 0
34 Lakshadweep 0 0 0 0 0 0
35 Puducherry 0 1 0 0 0 0
All India 292 146 944 484 345 147NA: Not Available
Sl. No.
States / UTs. INSPECTOR S.I. A.S.I.
CHAPTER 3
64
TABLE 3.11 -- (Continued . . .)
Sanc-tioned
Actual Sanc-tioned
Actual Sanc-tioned
Actual
(1) (2) (21) (22) (23) (24) (25) (26) 1 Andhra Pradesh 640 312 2,157 1,558 3,269 2,088
2 Arunachal Pradesh 0 0 0 0 0 0
3 Assam 2 2 30 30 65 61
4 Bihar 155 3 728 735 998 818
5 Chhatisgarh 185 113 812 728 1,165 880
6 Goa 0 0 0 0 0 0
7 Gujarat 12 9 14 12 73 51
8 Haryana 116 42 154 388 376 479
9 Himachal Pradesh NA NA NA NA NA NA
10 Jammu & Kashmir 0 0 0 0 0 0
11 Jharkhand 315 168 1,295 987 1,876 1,262
12 Karnataka 127 20 378 389 573 469
13 Kerala NA NA NA NA NA NA
14 Madhya Pradesh 21 11 61 17 122 43
15 Maharashtra 10 NA 20 NA 147 NA
16 Manipur 108 112 1,592 574 1,860 764
17 Meghalaya 0 0 0 0 0 0
18 Mizoram 0 0 0 0 0 0
19 Nagaland 0 27 0 135 0 189
20 Orissa 27 27 782 782 868 868
21 Punjab 0 0 0 0 1 1
22 Rajasthan 0 0 0 0 0 0
23 Sikkim 0 1 27 26 30 30
24 Tamil Nadu 82 81 113 113 242 231
25 Tripura 0 0 0 0 0 0
26 Uttar Pradesh 78 61 209 111 424 241
27 Uttarakhand 2 2 10 16 17 29
28 West Bengal 0 0 0 0 0 0
29 A&N Islands 0 0 0 0 0 0
30 Chandigarh 0 0 0 0 0 0
31 D&N Haveli 0 0 0 0 0 0
32 Daman & Diu 0 0 0 0 0 0
33 Delhi 0 0 0 0 0 0
34 Lakshadweep 0 0 0 0 0 0
35 Puducherry 0 1 0 3 0 5All India 1,880 992 8,382 6,604 12,106 8,509NA: Not Available
Sl. No.
States / UTs. H.CONSTABLE CONSTABLE TOTAL
CHAPTER 3
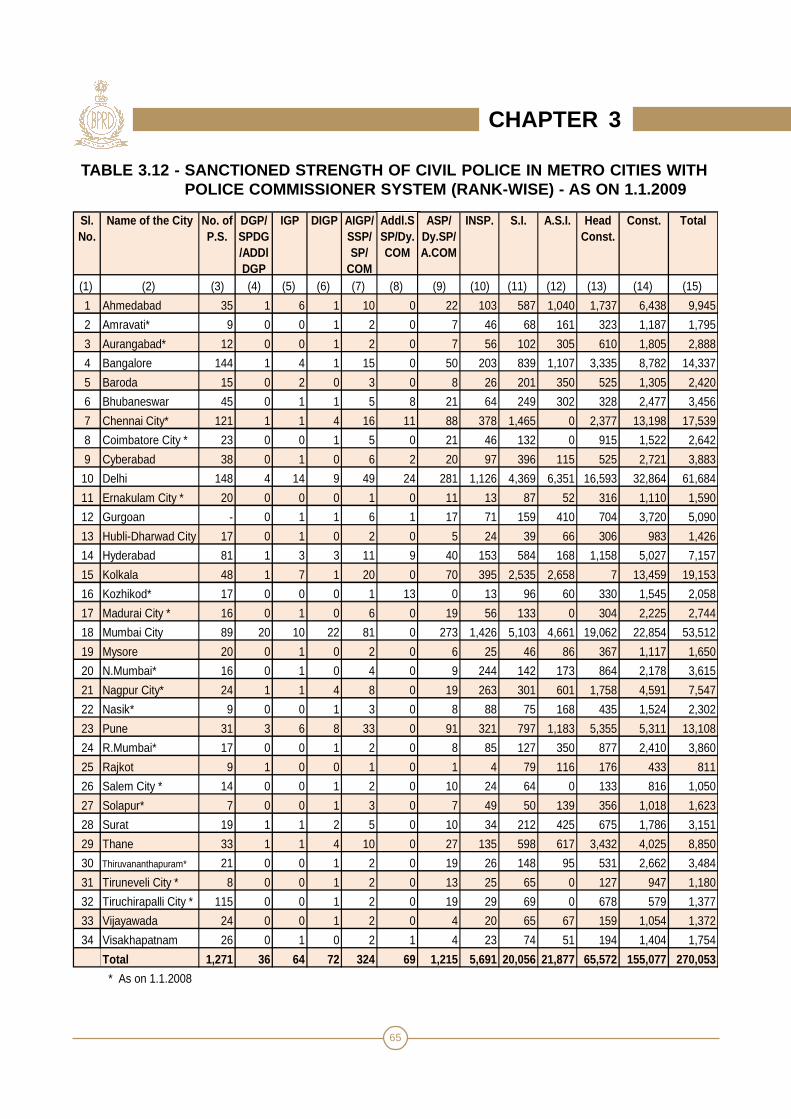
65
TABLE 3.12 - SANCTIONED STRENGTH OF CIVIL POLICE IN METRO CITIES WITHPOLICE COMMISSIONER SYSTEM (RANK-WISE) - AS ON 1.1.2009
CHAPTER 3
Sl. No.
Name of the City No. of P.S.
DGP/ SPDG/ADDl DGP
IGP DIGP AIGP/ SSP/ SP/
COM
Addl.SSP/Dy.COM
ASP/ Dy.SP/A.COM
INSP. S.I. A.S.I. Head Const.
Const. Total
(1) (2) (3) (4) (5) (6) (7) (8) (9) (10) (11) (12) (13) (14) (15)
1 Ahmedabad 35 1 6 1 10 0 22 103 587 1,040 1,737 6,438 9,945
2 Amravati* 9 0 0 1 2 0 7 46 68 161 323 1,187 1,795
3 Aurangabad* 12 0 0 1 2 0 7 56 102 305 610 1,805 2,888
4 Bangalore 144 1 4 1 15 0 50 203 839 1,107 3,335 8,782 14,337
5 Baroda 15 0 2 0 3 0 8 26 201 350 525 1,305 2,420
6 Bhubaneswar 45 0 1 1 5 8 21 64 249 302 328 2,477 3,456
7 Chennai City* 121 1 1 4 16 11 88 378 1,465 0 2,377 13,198 17,539
8 Coimbatore City * 23 0 0 1 5 0 21 46 132 0 915 1,522 2,642
9 Cyberabad 38 0 1 0 6 2 20 97 396 115 525 2,721 3,883
10 Delhi 148 4 14 9 49 24 281 1,126 4,369 6,351 16,593 32,864 61,684
11 Ernakulam City * 20 0 0 0 1 0 11 13 87 52 316 1,110 1,590
12 Gurgoan - 0 1 1 6 1 17 71 159 410 704 3,720 5,090
13 Hubli-Dharwad City 17 0 1 0 2 0 5 24 39 66 306 983 1,426
14 Hyderabad 81 1 3 3 11 9 40 153 584 168 1,158 5,027 7,157
15 Kolkala 48 1 7 1 20 0 70 395 2,535 2,658 7 13,459 19,153
16 Kozhikod* 17 0 0 0 1 13 0 13 96 60 330 1,545 2,058
17 Madurai City * 16 0 1 0 6 0 19 56 133 0 304 2,225 2,744
18 Mumbai City 89 20 10 22 81 0 273 1,426 5,103 4,661 19,062 22,854 53,512
19 Mysore 20 0 1 0 2 0 6 25 46 86 367 1,117 1,650
20 N.Mumbai* 16 0 1 0 4 0 9 244 142 173 864 2,178 3,615
21 Nagpur City* 24 1 1 4 8 0 19 263 301 601 1,758 4,591 7,547
22 Nasik* 9 0 0 1 3 0 8 88 75 168 435 1,524 2,302
23 Pune 31 3 6 8 33 0 91 321 797 1,183 5,355 5,311 13,108
24 R.Mumbai* 17 0 0 1 2 0 8 85 127 350 877 2,410 3,860
25 Rajkot 9 1 0 0 1 0 1 4 79 116 176 433 811
26 Salem City * 14 0 0 1 2 0 10 24 64 0 133 816 1,050
27 Solapur* 7 0 0 1 3 0 7 49 50 139 356 1,018 1,623
28 Surat 19 1 1 2 5 0 10 34 212 425 675 1,786 3,151
29 Thane 33 1 1 4 10 0 27 135 598 617 3,432 4,025 8,850
30 Thiruvananthapuram* 21 0 0 1 2 0 19 26 148 95 531 2,662 3,484
31 Tiruneveli City * 8 0 0 1 2 0 13 25 65 0 127 947 1,180
32 Tiruchirapalli City * 115 0 0 1 2 0 19 29 69 0 678 579 1,377
33 Vijayawada 24 0 0 1 2 0 4 20 65 67 159 1,054 1,372
34 Visakhapatnam 26 0 1 0 2 1 4 23 74 51 194 1,404 1,754
Total 1,271 36 64 72 324 69 1,215 5,691 20,056 21,877 65,572 15 5,077 270,053
* As on 1.1.2008
66
TABLE 3.13 - SANCTIONED STRENGTH OF ARMED POLICE IN METRO CITIES WITHPOLICE COMMISSIONER SYSTEM (RANK-WISE) - AS ON 1.1.2009
Sl. No.
Name of the City DGP/ SPDG/ADDl DGP
IGP DIGP AIGP/ SSP/ SP/
COM
Addl.SSP/Dy.COM
ASP/ Dy.SP/A.COM
INSP. S.I. A.S.I. Head Const.
Const. Total
(1) (2) (3) (4) (5) (6) (7) (8) (9) (10) (11) (12) (13) (14)
1 Ahmedabad 0 0 0 0 0 3 8 20 311 563 2,342 3,247
2 Bangalore 0 0 0 4 0 14 27 113 165 772 3,480 4,575
3 Baroda 0 0 0 0 0 0 1 12 72 112 468 665
4 Bhubaneswar 0 0 0 2 4 17 16 54 70 373 1,588 2,124
5 Chennai * 0 0 0 2 0 12 47 295 0 451 3,289 4,096
6 Coimbatore City * 0 0 0 1 0 4 5 34 0 72 839 955
7 Cyberabad 0 0 0 1 1 3 8 26 18 162 642 861
8 Delhi 0 1 1 21 7 58 101 380 226 2,353 10,131 13,279
9 Ernakulam City * 0 0 0 1 0 4 3 19 20 66 619 732
10 Gurgoan 1 1 1 5 0 37 45 130 212 682 3,563 4,677
11 Hubli-Dharwad City 0 0 0 1 0 0 2 6 15 60 313 397
12 Hyderabad 0 0 0 1 1 6 25 73 44 523 1,799 2,472
13 Kolkata 0 1 0 8 0 35 94 314 1,415 0 6,294 8,161
14 kozhikkode City * 0 0 0 1 0 2 2 14 15 58 430 522
15 Madurai * 0 0 0 1 0 3 11 47 0 73 857 992
16 Mysore 0 0 0 1 0 4 6 21 25 142 654 853
17 Rajkot 0 0 0 0 0 0 1 3 61 95 517 677
18 Salem * 0 0 0 0 0 2 5 16 0 24 261 308
19 Surat 0 0 0 0 0 1 1 13 98 157 677 947
20 Thane 1 2 1 23 0 81 202 394 1,453 3,359 11,920 17,436
21 Thiruvananathapuram* 0 0 0 1 0 7 6 30 38 153 934 1,169
22 Tirunelveli City * 0 0 0 0 0 1 5 17 0 38 394 455
23 Triuchirapalli City * 0 0 0 0 0 3 5 22 0 48 484 562
24 Vijaywada 0 0 0 1 0 2 4 16 9 133 392 557
25 Visakhapatnam 0 0 0 1 0 2 5 14 11 141 512 686Total 2 5 3 76 13 301 635 2,083 4,278 10,610 53,399 71,405
* As on 1.1.2008
CHAPTER 3
67
TABLE 3.14 - OFFICERS TO CONSTABULAR Y RATIO OF CIVIL POLICE IN METROCITIES WITH POLICE COMMISSIONER SYSTEM - AS ON 1.1.2009
DG to ASI HC & Const.(1) (2) (3) (4)
1 Ahmedabad 1,770 8,175 1 : 4.6
2 Amravati 285 1,510 1 : 5.3
3 Aurangabad 473 2,415 1 : 5.1
4 Bangalore 2,220 12,117 1 : 5.5
5 Baroda 590 1,830 1 : 3.1
6 Bhubaneswar 651 2,805 1 : 4.3
7 Chennai City 1,964 15,575 1 : 7.9
8 Coimbatore City 205 2,437 1 : 11.9
9 Cyberabad 637 3,246 1 : 5.1
10 Delhi 12,227 49,457 1 : 4.0
11 Ernakulam City 164 1,426 1 : 8.7
12 Gurgoan 666 4,424 1 : 6.6
13 Hubli-Dharwad City 137 1,289 1 : 9.4
14 Hyderabad 972 6,185 1 : 6.4
15 Kolkala 5,687 13,466 1 : 2.4
16 Kozhikod 183 1,875 1 : 10.2
17 Madurai City 215 2,529 1 : 11.8
18 Mumbai City 11,596 41,916 1 : 3.6
19 Mysore 166 1,484 1 : 8.9
20 N.Mumbai 573 3,042 1 : 5.3
21 Nagpur City 1,198 6,349 1 : 5.3
22 Nasik 343 1,959 1 : 5.7
23 Pune 2,442 10,666 1 : 4.4
24 R.Mumbai 573 3,287 1 : 5.7
25 Rajkot 202 609 1 : 3.0
26 Salem City 101 949 1 : 9.4
27 Solapur 249 1,374 1 : 5.5
28 Surat 690 2,461 1 : 3.6
29 Thane 1,393 7,457 1 : 5.4
30 Thiruvananthapuram 291 3,193 1 : 11.0
31 Tiruneveli City 106 1,074 1 : 10.1
32 Tiruchirapalli City 120 1,257 1 : 10.5
33 Vijayawada 159 1,213 1 : 7.6
34 Visakhapatnam 156 1,598 1 : 10.2
Total 49,404 220,649 1 : 4.5
Sl. No. Name of the City Teeth to Tail Ratio
(5) Ratio
Teeth to T ail Ratio : Teeth to Tail Ratio is the ratio of Police Officers from the rank of anA.S.I.and above to head Constables and Constables.
CHAPTER 3
68
TABLE 3.15 -- SANCTIONED AND ACTUAL STRENGTH OF CENTRAL POLICEFORCES (CPFs) AS ON 1.1.2009 (RANK-WISE)
Sanc-tioned
Actual Sanc-tioned
Actual Sanc-tioned
Actual
(1) (2) (3) (4) (5) (6) (7) (8) (9)
1 Assam Rifles (AR) 46 1 1 3 3 18 14
2 Border Security 159 7 3 22 20 154 140Force (BSF)
3 Central Industrial 287Units & 3 3 9 8 48 38 Security Force(CISF) 50 Formations
4 Central Reserve 203 8 2 31 25 170 154Police Force (CRPF)
5 Indo-Tibetan 49 3 2 8 8 53 52Border Police (ITBP)
6 National Security - 1 1 3 3 7 7Guard (NSG)
7 Railway Protection 12of RPSF* 2 1 6 5 21 22Force (RPSF & RPF) 60,045 pers.
of RPF
8 Sashastra Seema 41 2 2 9 9 22 19Bal (SSB)
All India 27 15 91 81 493 446
* RPSF - Railway Protection Special Force
Sl.No. Name of the Central Police Forces
Total No. of Battalion
DGP/ Spl.DG/ Addl.DG
IGP DIG
CHAPTER 3
69
TABLE 3.15 -- (Continued... )
Sanc-tioned
Actual Sanc-tioned
Actual Sanc-tioned
Actual Sanc-tioned
Actual
(1) (2) (10) (11) (12) (13) (14) (15) (16) (17)
1 Assam Rifles (AR) 85 77 561 452 348 190 160 144
2 Border Security 277 263 1,351 1,331 1,818 1,446 299 171Force (BSF)
3 Central Industrial 235 159 305 269 632 470 166 45 Security Force(CISF)
4 Central Reserve 258 255 1,069 743 1,890 1,563 761 423Police Force (CRPF)
5 Indo-Tibetan 453 187 275 157 535 382 22 19Border Police (ITBP)
6 National Security 36 34 86 74 250 171 1 0Guard (NSG)
7 Railway Protection 117 114 0 0 283 261 0 0Force (RPSF & RPF)
8 Sashastra Seema 205 108 175 84 363 248 598 456Bal (SSB)
All India 1,666 1,197 3,822 3,110 6,119 4,731 2,007 1258
Sl.No. Name of the Central Police
Forces
ASP/Dy.SP/
Addl.SsP/ Dy.Commdts
OTHERS Gr.A/B
AIGP/SSP/SP/Commandants
CHAPTER 3
70
TABLE 3.15 -- (Continued... )
CHAPTER 3
Sanc-tioned
Actual Sanc-tioned
Actual Sanc-tioned
Actual
(1) (2) (18) (19) (20) (21) ( 22) (23)
1 Assam Rifles (AR) 1,512 1,335 2,494 2,296 31 45
2 Border Security 3,160 2,928 7,325 6,490 4,280 3,972Force (BSF)
3 Central Industrial 1,984 1,890 10,169 7,700 3,690 3,850 Security Force(CISF)
4 Central Reserve 3,705 2,231 10,461 8,731 5,027 3,623Police Force (CRPF)
5 Indo-Tibetan 1,826 1,317 3,151 2,423 199 108Border Police (ITBP)
6 National Security 1,163 913Guard (NSG)
7 Railway Protection 1,840 1,563 3,050 1,871 5,233 3,991Force (RPSF & RPF)
8 Sashastra Seema 646 449 1,678 1,334 870 617Bal (SSB)
All India 14,673 11,713 39,491 31,758 19,330 16,206
INSP.Sl.No. Name of the Central Police
Forces
S.I. A.S.I.

71
TABLE 3.15 -- (Continued... )
CHAPTER 3
-Sanctioned
Actual -Sanctioned
Actual -Sanctioned
Actual Sanc-tioned
Actual
(1) (2) (24) (25) (26) (27) (28) (29) (30) (31)
1 Assam Rifles (AR) 16,283 15,015 42,811 43,349 880 856 65,187 63777
2 Border Security 41,485 39,704 133,199 131,702 16,894 16,008 210,271 204178Force (BSF)
3 Central Industrial 23,016 22,535 63,760 55,073 6,332 6,010 110,349 98050 Security Force(CISF)
4 Central Reserve 54,827 53,034 166,081 160,963 19,310 18,647 263,598 250394Police Force (CRPF)
5 Indo-Tibetan 15,106 13,384 35,766 27,257 78 68 57,475 45364Border Police (ITBP)
6 National Security 5,767 5,719 7,314 6922Guard (NSG)
7 Railway Protection 20,958 17,615 35,622 34,304 2,170 1,789 69,302 61536Force (RPSF & RPF)
8 Sashastra Seema 7,539 3,570 39,123 37,536 4,167 3,090 55,397 47522Bal (SSB)
All India 179,214 164,857 522,129 495,903 49,831 46,468 838,893 777743
Sl.No. Name of the Central Police
Forces
H.CONSTABLE CONSTABLE TOTAL OTHERS

72
TABLE 3.15 -- (Continued... )
CHAPTER 3
Gazetted Non-Gazetted
Total Gazetted Non-Gazetted
Total
(1) (2) (32) (33) (34) (35) (36) (37)
1 Assam Rifles (AR) 1,176 64,011 65,187 881 62,896 63,777
2 Border Security 3,928 206,343 210,271 3,374 200,804 204,178Force (BSF)
3 Central Industrial 1,398 108,951 110,349 992 97,058 98,050 Security Force(CISF)
4 Central Reserve 4,187 259,411 263,598 3,165 247,229 250,394Police Force (CRPF)
5 Indo-Tibetan 1,349 56,126 57,475 807 44,557 45,364Border Police (ITBP)
6 National Security 384 6,930 7,314 290 6,632 6,922Guard (NSG)
7 Railway Protection 429 68,873 69,302 403 61,133 61,536Force (RPSF & RPF)
8 Sashastra Seema 1,374 54,023 55,397 926 46,596 47,522Bal (SSB)
All India 14,225 824,668 838,893 10,838 766,905 777,743
Sanctioned strength Actual StrengthSl.No. Name of the Central Police
Forces

73
TABLE 3.16 -- ACTUAL STRENGTH OF WOMEN POLICE IN CENTRAL POLICEFORCES (CPFs) AS ON 1.1.2009 (RANK-WISE)
CHAPTER 3
Sl.No. Name of the Central Police
Forces
Total No. of Battalions
DGP/SplDG/Addl DG
IGP DIG AIGP/SSP/Com
m
ADSP/DY.Comm
ASP/DySP/ACom
Oth-ers Gr.A&B
INSP. S.I. A.S.I. Head Const
.
Const. Oth-ers
Total
(1) (2) (3) (4) (5) (6) (7) (8) (9) (10) (11) (12) (13) (14) (15) (16) (17)
1 Assam Rifles (AR) 46 0 0 0 0 0 14 0 0 0 0 0 0 515 529
2 Border Security 159 0 0 1 7 24 18 33 16 73 95 71 706 86 1130
Force (BSF)
3 Central Industrial 287Units & 1 0 0 11 5 3 8 25 386 99 102 3200 181 4021
Security Force (CISF) 50 Formations
4 Central Reserve 203 0 0 1 4 26 74 72 123 489 149 689 2101 374 4102
5 Indo-Tibetan 49 0 0 1 26 0 2 1 56 44 8 112 111 22 383
6 National Security - 0 0 0 2 1 0 1 4 20 0 6 11 0 45
Guard (NSG)
7 Railway Protection 12 of RPSF 0 0 1 6 0 0 0 2 2 6 102 1127 0 1246
Force(RPSF)&(RPF) 60,045 pers.
of RPF
8 Sashastra Seema 41 0 1 0 7 5 11 0 0 0 0 0 847 0 871
Bal (SSB)
All India 1 1 4 63 61 122 115 226 1014 357 1082 8103 1178 12327
Police Force (CRPF)
Border Police (ITBP)