Embed Size (px)
Citation preview
International Journal of Engineering Technology, Management and Applied Sciences
www.ijetmas.com May 2016, Volume 4, Issue 5, ISSN 2349-4476
183 Deepak Anand, Yogesh Kaushik and Vipin Mann
Static and Dynamic Analysis of U-Shaped Building
Deepak Ananda, Yogesh Kaushik
a and Vipin Mann
b
aDepartment of Civil Engineering, Amity University, Uttar Pradesh, Noida, INDIA
b Border Security Force, Ministry of Home Affairs, New Delhi, INDIA
Abstract
The present study deals with the static and dynamic analysis of U-Shaped buildings. Basic geometries in arrangement
performs well in amid solid tremors then those with re-contestant corners like L, Y, U and + formed in arrangement as
they tend to bend amid a quake shaking. The present study considers a building intended in Zone IV with multi-story
inflexible jointed plane edge. The primary concern of the study is to minimize torsion because of tremor in a four story
U-shaped formed uneven building by situating the shear divider at most favorablearea in the structure. Static and
element examination are done using STAAD.Pro.2008. The manual figuring is done for diverse sorts of loads, materials
and measurements of segments i.e. column, beam, slab and wall is chosen. The self-weight for various components and
the seismic weight for every floor is computed. For assessing the outline seismic power, static examination is finished by
figuring the base shear, nodal and seismic powers at every level and torsional shear in both the sidelong bearings. To
calculate the characteristic recurrence and mode shape, dynamic investigation is finished by ascertaining modular mass,
modular interest component and parallel burdens for both horizontal headings. Toward the end, examination of base
shear of both static and element investigation for all levels in both courses is contemplated and at last the aftereffects of
manual and programming figuring are analyzed.
Keywords- Asymmetrical shape, Static analysis, Dynamic analysis, Torsional shear, Base shear,Lateral load
distribution
1. Introduction
Buildings are considered asymmetric in plan due to heavy mass at eccentric position, re-entrant corner, and
diaphragm irregularity and/or in elevation due to mass irregularity and geometric irregularity. Structures with
a deviated distribution of stiffness and posture in plan arrangement experience coupled sidelong and torsional
movements amid tremors. In numerous structures the center of resistance does not correspond with the center
of mass. In this study, by placing the shear wall at adequate positions, torsional impacts ought to be minimized.
The stiffness attributes control the dynamic reaction of the building structure.Lateral loads are live loads
whose principle component is a horizontal force acting on the structure.These lateral loads differ in intensity
of earthquake depending on the building's geographic location, structural materials, height and shape. The
horizontal components of this movement are usually considered critical in a structural analysis, so the lateral
load is calculated in both X and Y directions by modal analysis based on different mode shapes to study the
distribution on these loads.Seismic forces accumulate downward in a building known as Base shear which are
greatest at the base of the building and need to be evaluated for strengthening of the structure
A review of previous studies on asymmetric building systems reveals many aspects and conclusions. The
effects of asymmetry on the response of multistorey buildings to earthquakes using a computer based
procedure which accounts for lateral load analysis of asymmetric buildingsis presented by Thambiratnam and
Corderoy [14]. A method of seismic analysis of three-dimensional asymmetric multistorey buildings with
flexible foundations is given by Sivakumaran and Balendra [13]. The behavior of asymmetric building
systems under monotonic load considering that the coupled inelastic lateral and torsional deformations could
be the governing factors in their design when buildings are subjected to a large intensity ground motion is
studied by Ferhi and Truman [8]. The dynamic responses of a multi-storey irregular building under actual
earthquake records have been investigated and the variation of the building height on the structural response
of the shear wall building is analyzed by Bagheri et.al. [1]. The seismic performance assessment of a 21-story
building having an asymmetrical plan by using in-situ measurements is done by Bui et.al. [3]. Behavior of
frame-wall irregularity on established existing reinforced concrete (RC) structures subjected to the earthquake
force through nonlinear static analysis and nonlinear dynamic analysis is studied by Kocak et.al. [10]. The
International Journal of Engineering Technology, Management and Applied Sciences
www.ijetmas.com May 2016, Volume 4, Issue 5, ISSN 2349-4476
184 Deepak Anand, Yogesh Kaushik and Vipin Mann
seismic demands of two-way asymmetric-plan 15-storey building subjected to bi-directional seismic ground
motions with the effects of higher modes and torsion through Consecutive Modal Pushover procedure is
estimated by Poursha et.al. [11]. Statistical analysis of the time-history earthquake response of asymmetric
building model in terms of the lateral shear and storey torque developed due to earthquake base loading is
presented by Chandler and Hutchinson [5].
To account for torsional shear effect of low rise buildings having some lesser modes, static analysis gave good
results which assumes that the building responds in its fundamental mode. Buildings with torsional
irregularities, or non-orthogonal systems, a dynamic procedure is required. This method holds good if higher
modes can be considered. On the bases of work done on asymmetric building earlier by other researchers, the
project is to do the static and dynamic analysis of an unsymmetrical U-Shape building. While doing analysis,
use of different method, software, and equations which has been inculcated in the study has been discussed
later on in this paper. The design of footing and slab has also been done and all other aspects have been taken
care of which come forward while designing and analyzing the building.
2. Methodology
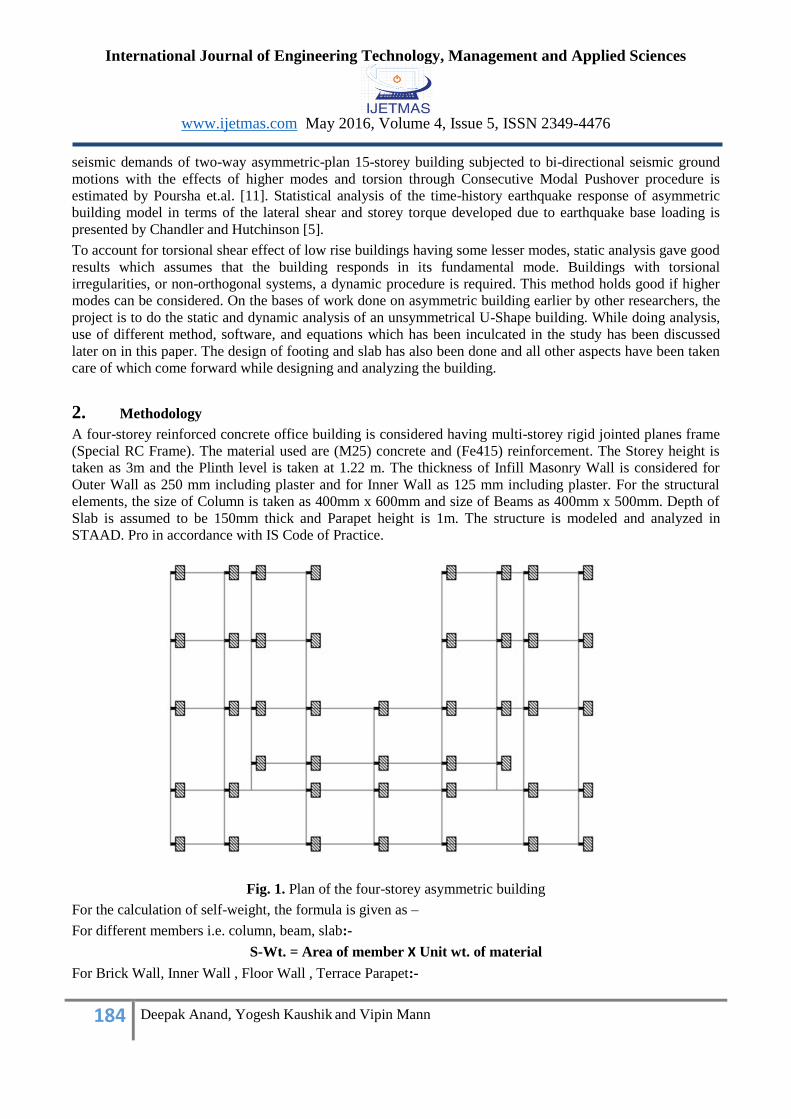
A four-storey reinforced concrete office building is considered having multi-storey rigid jointed planes frame
(Special RC Frame). The material used are (M25) concrete and (Fe415) reinforcement. The Storey height is
taken as 3m and the Plinth level is taken at 1.22 m. The thickness of Infill Masonry Wall is considered for
Outer Wall as 250 mm including plaster and for Inner Wall as 125 mm including plaster. For the structural
elements, the size of Column is taken as 400mm x 600mm and size of Beams as 400mm x 500mm. Depth of
Slab is assumed to be 150mm thick and Parapet height is 1m. The structure is modeled and analyzed in
STAAD. Pro in accordance with IS Code of Practice.
Fig. 1. Plan of the four-storey asymmetric building
For the calculation of self-weight, the formula is given as –
For different members i.e. column, beam, slab:-
S-Wt. = Area of member X Unit wt. of material
For Brick Wall, Inner Wall , Floor Wall , Terrace Parapet:-
International Journal of Engineering Technology, Management and Applied Sciences
www.ijetmas.com May 2016, Volume 4, Issue 5, ISSN 2349-4476
185 Deepak Anand, Yogesh Kaushik and Vipin Mann
S-Wt. = Major dimension of element X Unit wt. of material
The Slab load Calculation for (D.L. + L.L.) is done
The seismic weights are calculated in a manner similar to gravity loads. The seismic weight of each floor is its
full dead load in addition to appropriate amount of imposed load. The weight of columns and wall in a storey
is equally distributed to the floors above and below the storey. Reduced live loads are used for analysis: zero
on terrace and 50% on other floors as per I.S: 1893(Part-1):2002, Clause 7.4
2.1Static Analysis
This methodology characterizes a progression of strengths following up on a working to speak to the impact
of tremor ground movement, regularly characterized by a seismic outline reaction range. It expect that the
building reacts in its central mode. For this to be valid, the building must be low-ascent and must not wind
altogether when the ground moves. The reaction is perused from an outline reaction range, given the common
recurrence of the building (either ascertained or characterized by the construction regulation). The
appropriateness of this strategy is stretched out in numerous construction laws by applying variables to
represent higher structures with some higher modes, and for low levels of bending. Static calculations is done
by applying the procedures defined in the Indian Standard Code I.S: 1893(Part-1):2002 for this building. The
Base Shear (Vb) of the building is calculated by-
Vb = Ah x W
where, Ah = Design Horizontal Seismic coefficient. For the Base shear force, the Design Horizontal Seismic
Coefficient (Ah) has to be calculated which is given by:
where, Z is Zone Factor as per IS-1893 (Part- I): 2002, Table-2, I is Importance Factor as per IS-1893 (Part-
I): 2002, Table-6, R is Response Reduction Factor as per IS-1893 (Part- I): 2002, Table-7 and (Sa/g) is
Medium soil site and 5% Damping as per IS-1893 (Part- I): 2002, Figure-2. After accessing all these values,
the Nodal forces and seismic shear forces at various levels are calculated and the force (Qi) is expressed as:
Qi = (Vb x Wi x Hi2 ) / ( ∑ Wi x Hi
2 )
where, Vb is the Base Shear force, Wi is Seismic Weight at „i th‟ storey and H is the Cumulative Height at „i
th‟
storey. The degre of asymmetry of the structure is measured or defined in terms of structural eccentricity,
which are necessary to evaluate the torsional behavior, the maximum displacement and the seismic elastic
response of the structure. The procedure for evaluating the eccentricities of column EX and EY may be
arranged according to the following steps:
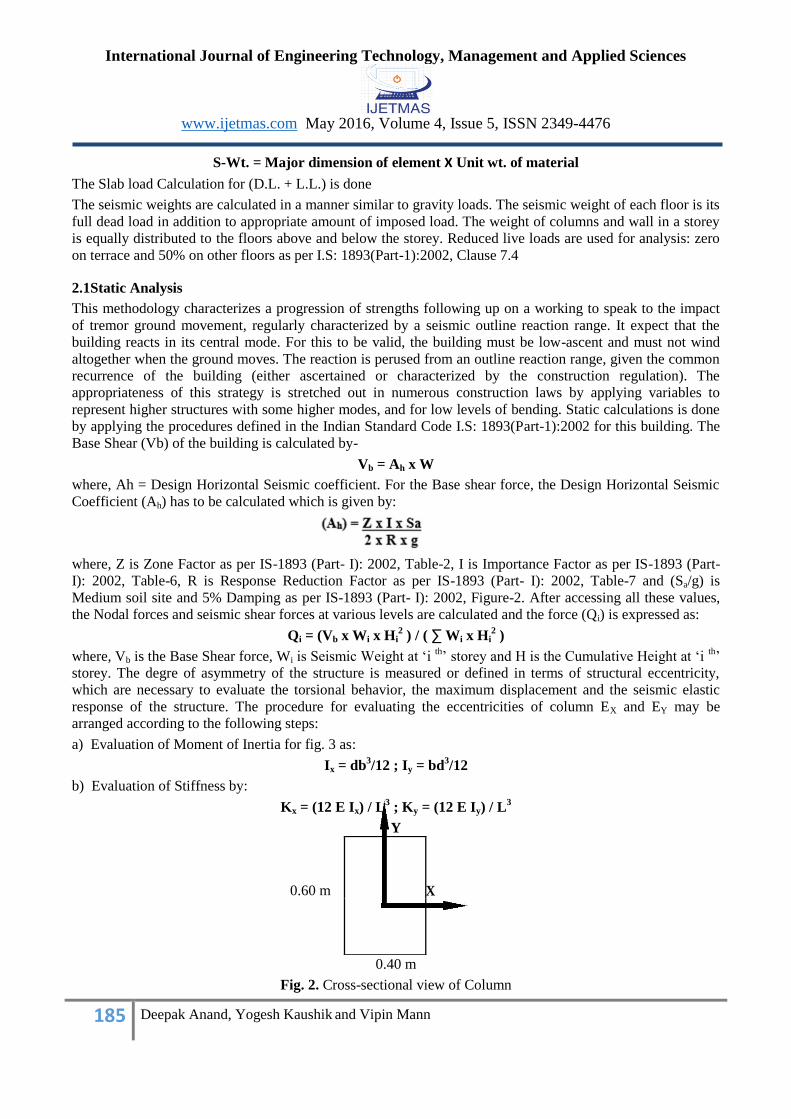
a) Evaluation of Moment of Inertia for fig. 3 as:
Ix = db3/12 ; Iy = bd
3/12
b) Evaluation of Stiffness by:
Kx = (12 E Ix) / L3 ; Ky = (12 E Iy) / L
3
Y
0.40 m
Fig. 2. Cross-sectional view of Column
0.60 m X
International Journal of Engineering Technology, Management and Applied Sciences
www.ijetmas.com May 2016, Volume 4, Issue 5, ISSN 2349-4476
186 Deepak Anand, Yogesh Kaushik and Vipin Mann
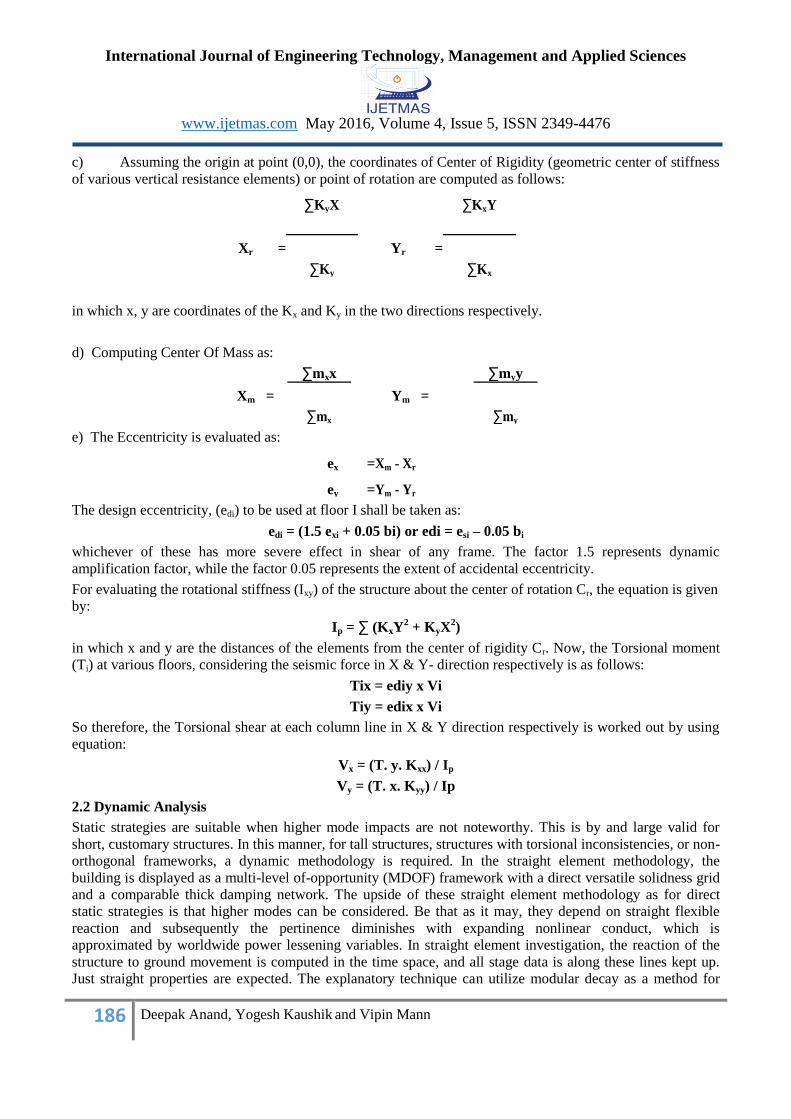
c) Assuming the origin at point (0,0), the coordinates of Center of Rigidity (geometric center of stiffness
of various vertical resistance elements) or point of rotation are computed as follows:
Xr =
∑KyX
Yr =
∑KxY
∑Ky ∑Kx
in which x, y are coordinates of the Kx and Ky in the two directions respectively.
d) Computing Center Of Mass as:
Xm =
∑mxx
Ym =
∑myy
∑mx ∑my
e) The Eccentricity is evaluated as:
ex = Xm - Xr
ey = Ym - Yr
The design eccentricity, (edi) to be used at floor I shall be taken as:
edi = (1.5 exi + 0.05 bi) or edi = esi – 0.05 bi
whichever of these has more severe effect in shear of any frame. The factor 1.5 represents dynamic
amplification factor, while the factor 0.05 represents the extent of accidental eccentricity.
For evaluating the rotational stiffness (Ixy) of the structure about the center of rotation Cr, the equation is given
by:
Ip = ∑ (KxY2 + KyX
2)
in which x and y are the distances of the elements from the center of rigidity Cr. Now, the Torsional moment
(Ti) at various floors, considering the seismic force in X & Y- direction respectively is as follows:
Tix = ediy x Vi
Tiy = edix x Vi
So therefore, the Torsional shear at each column line in X & Y direction respectively is worked out by using
equation:
Vx = (T. y. Kxx) / Ip
Vy = (T. x. Kyy) / Ip
2.2 Dynamic Analysis
Static strategies are suitable when higher mode impacts are not noteworthy. This is by and large valid for
short, customary structures. In this manner, for tall structures, structures with torsional inconsistencies, or non-
orthogonal frameworks, a dynamic methodology is required. In the straight element methodology, the
building is displayed as a multi-level of-opportunity (MDOF) framework with a direct versatile solidness grid
and a comparable thick damping network. The upside of these straight element methodology as for direct
static strategies is that higher modes can be considered. Be that as it may, they depend on straight flexible
reaction and subsequently the pertinence diminishes with expanding nonlinear conduct, which is
approximated by worldwide power lessening variables. In straight element investigation, the reaction of the
structure to ground movement is computed in the time space, and all stage data is along these lines kept up.
Just straight properties are expected. The explanatory technique can utilize modular decay as a method for
International Journal of Engineering Technology, Management and Applied Sciences
www.ijetmas.com May 2016, Volume 4, Issue 5, ISSN 2349-4476
187 Deepak Anand, Yogesh Kaushik and Vipin Mann
decreasing the degrees of opportunity in the investigation.
The Holzer‟s method is used to determine the natural frequencies and mode shapes of the structure. This
method falls under the determinant search technique and starts by assuming a trial frequency. Displacement of
unit amplitude is assumed at one end, and the forces and the displacements of different masses are then
calculated in a progressive manner. If the force or the displacement at the other end is compatible with the
conditions prevailing there, the assumed frequency is one of the natural frequencies of the system. The
dynamic analysis of the assumed structure is done in both X-direction and Y- direction and the method can be
easily programmed in a computer. The steps are as follows:
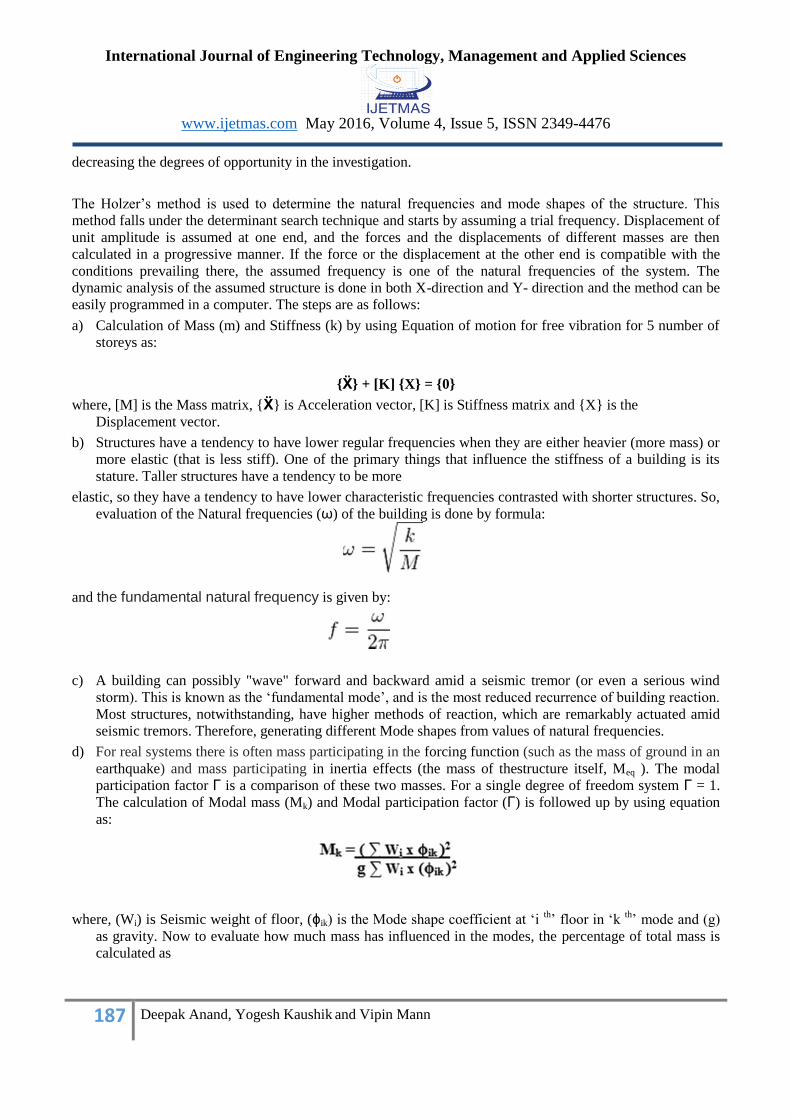
a) Calculation of Mass (m) and Stiffness (k) by using Equation of motion for free vibration for 5 number of
storeys as:
{Ẍ} + [K] {X} = {0}
where, [M] is the Mass matrix, {Ẍ} is Acceleration vector, [K] is Stiffness matrix and {X} is the
Displacement vector.
b) Structures have a tendency to have lower regular frequencies when they are either heavier (more mass) or
more elastic (that is less stiff). One of the primary things that influence the stiffness of a building is its
stature. Taller structures have a tendency to be more
elastic, so they have a tendency to have lower characteristic frequencies contrasted with shorter structures. So,
evaluation of the Natural frequencies (ω) of the building is done by formula:
and the fundamental natural frequency is given by:
c) A building can possibly "wave" forward and backward amid a seismic tremor (or even a serious wind
storm). This is known as the „fundamental mode‟, and is the most reduced recurrence of building reaction.
Most structures, notwithstanding, have higher methods of reaction, which are remarkably actuated amid
seismic tremors. Therefore, generating different Mode shapes from values of natural frequencies.
d) For real systems there is often mass participating in the forcing function (such as the mass of ground in an
earthquake) and mass participating in inertia effects (the mass of thestructure itself, Meq ). The modal
participation factor Γ is a comparison of these two masses. For a single degree of freedom system Γ = 1.
The calculation of Modal mass (Mk) and Modal participation factor (Γ) is followed up by using equation
as:
where, (Wi) is Seismic weight of floor, (ϕik) is the Mode shape coefficient at „i th‟ floor in „k
th‟ mode and (g)
as gravity. Now to evaluate how much mass has influenced in the modes, the percentage of total mass is
calculated as
International Journal of Engineering Technology, Management and Applied Sciences
www.ijetmas.com May 2016, Volume 4, Issue 5, ISSN 2349-4476
188 Deepak Anand, Yogesh Kaushik and Vipin Mann
and the Modal Participation factor as:
e) For illustration, the all five modes of vibration are considered and the lateral load (Qik) acting at ith floor in
the kth mode is computed by
Qik = Ahk x Ǿik x Pk x Wi
which is in accordance with clause 7.8.4.5 c of IS: 1893 (Part 1) and the value of (Ahk) for different modes is
obtained from clause 6.4.2. Since all of the modes are well
separated (clause 3.2), the contribution of different modes is combined by the SRSS method (square root of
the sum of the square) as per clause 7.8.4.4a of IS:1893 (Part 1) as
Vi = √∑ (Vik) 2
f) Now the Lateral forces at each floors due to all modes considered or the externally applied design loads
are then obtained as is calculated as
Q roof = Vroof
Qi = Vi – Vi+1
According to clause 7.8.2 requires that the base shear obtained by dynamic analysis be compared with that
obtained from empirical fundamental period as per Clause 7.6. If VB is less than that from empirical value,
which is true in this case, the response quantities are to be scaled up.
3. Results and Discussion
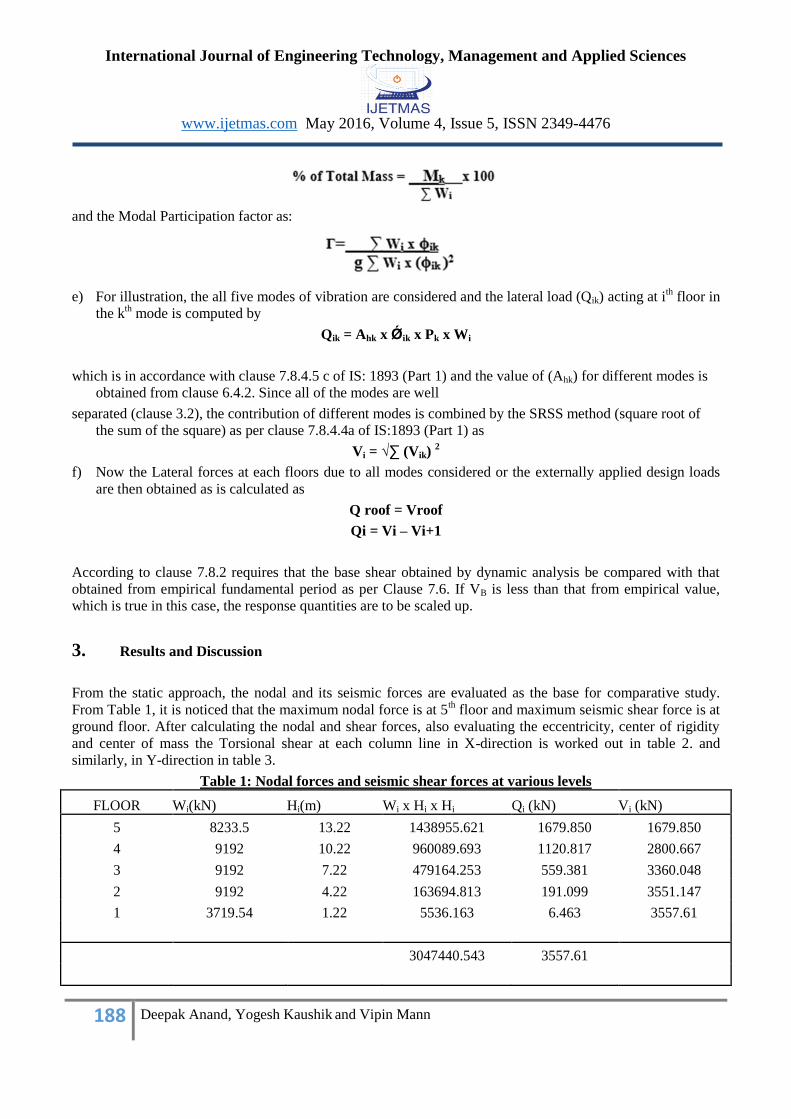
From the static approach, the nodal and its seismic forces are evaluated as the base for comparative study.
From Table 1, it is noticed that the maximum nodal force is at 5th floor and maximum seismic shear force is at
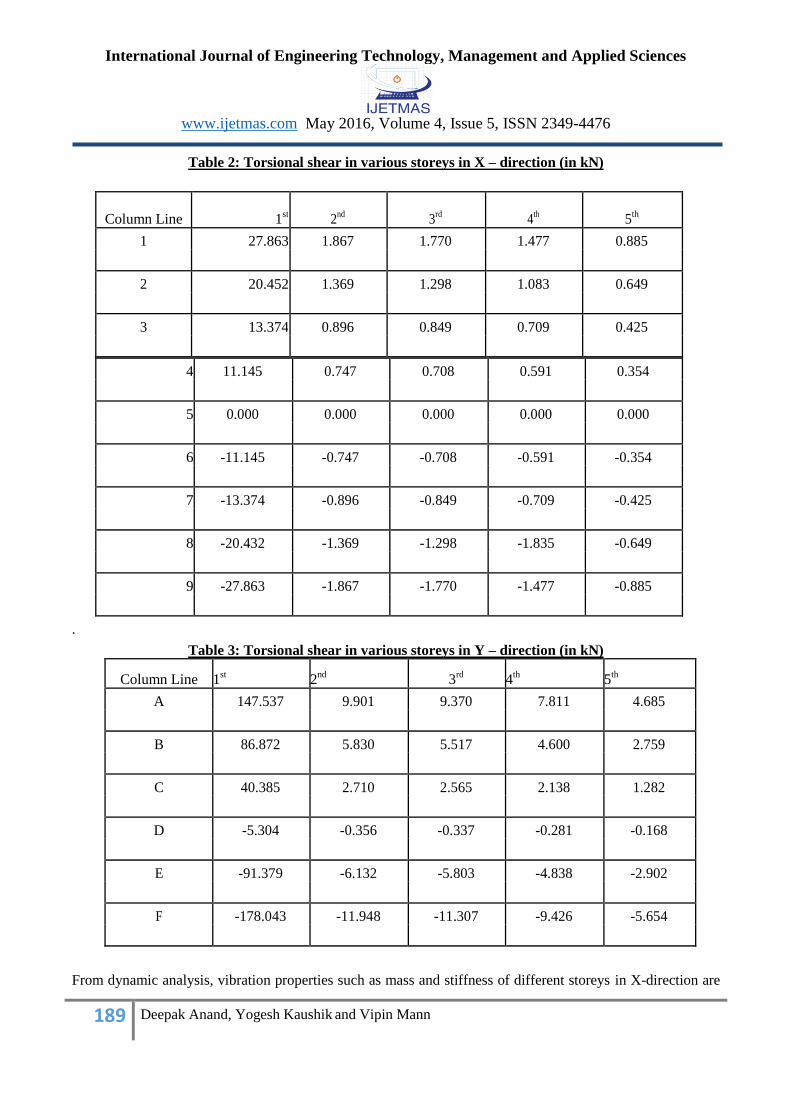
ground floor. After calculating the nodal and shear forces, also evaluating the eccentricity, center of rigidity
and center of mass the Torsional shear at each column line in X-direction is worked out in table 2. and
similarly, in Y-direction in table 3.
Table 1: Nodal forces and seismic shear forces at various levels
FLOOR Wi(kN) Hi(m) Wi x Hi x Hi Qi (kN) Vi (kN)
5 8233.5 13.22 1438955.621 1679.850 1679.850
4 9192 10.22 960089.693 1120.817 2800.667
3 9192 7.22 479164.253 559.381 3360.048
2 9192 4.22 163694.813 191.099 3551.147
1 3719.54 1.22 5536.163 6.463 3557.61
3047440.543 3557.61
International Journal of Engineering Technology, Management and Applied Sciences
www.ijetmas.com May 2016, Volume 4, Issue 5, ISSN 2349-4476
189 Deepak Anand, Yogesh Kaushik and Vipin Mann
Table 2: Torsional shear in various storeys in X – direction (in kN)
Column Line 1st 2
nd 3
rd 4
th 5
th
1 27.863 1.867 1.770 1.477 0.885
2 20.452 1.369 1.298 1.083 0.649
3 13.374 0.896 0.849 0.709 0.425
4 11.145 0.747 0.708 0.591 0.354
5 0.000 0.000 0.000 0.000 0.000
6 -11.145 -0.747 -0.708 -0.591 -0.354
7 -13.374 -0.896 -0.849 -0.709 -0.425
8 -20.432 -1.369 -1.298 -1.835 -0.649
9 -27.863 -1.867 -1.770 -1.477 -0.885
.
Table 3: Torsional shear in various storeys in Y – direction (in kN)
Column Line 1st 2
nd 3
rd 4
th 5
th
A 147.537 9.901 9.370 7.811 4.685
B 86.872 5.830 5.517 4.600 2.759
C 40.385 2.710 2.565 2.138 1.282
D -5.304 -0.356 -0.337 -0.281 -0.168
E -91.379 -6.132 -5.803 -4.838 -2.902
F -178.043 -11.948 -11.307 -9.426 -5.654
From dynamic analysis, vibration properties such as mass and stiffness of different storeys in X-direction are
International Journal of Engineering Technology, Management and Applied Sciences
www.ijetmas.com May 2016, Volume 4, Issue 5, ISSN 2349-4476
190 Deepak Anand, Yogesh Kaushik and Vipin Mann
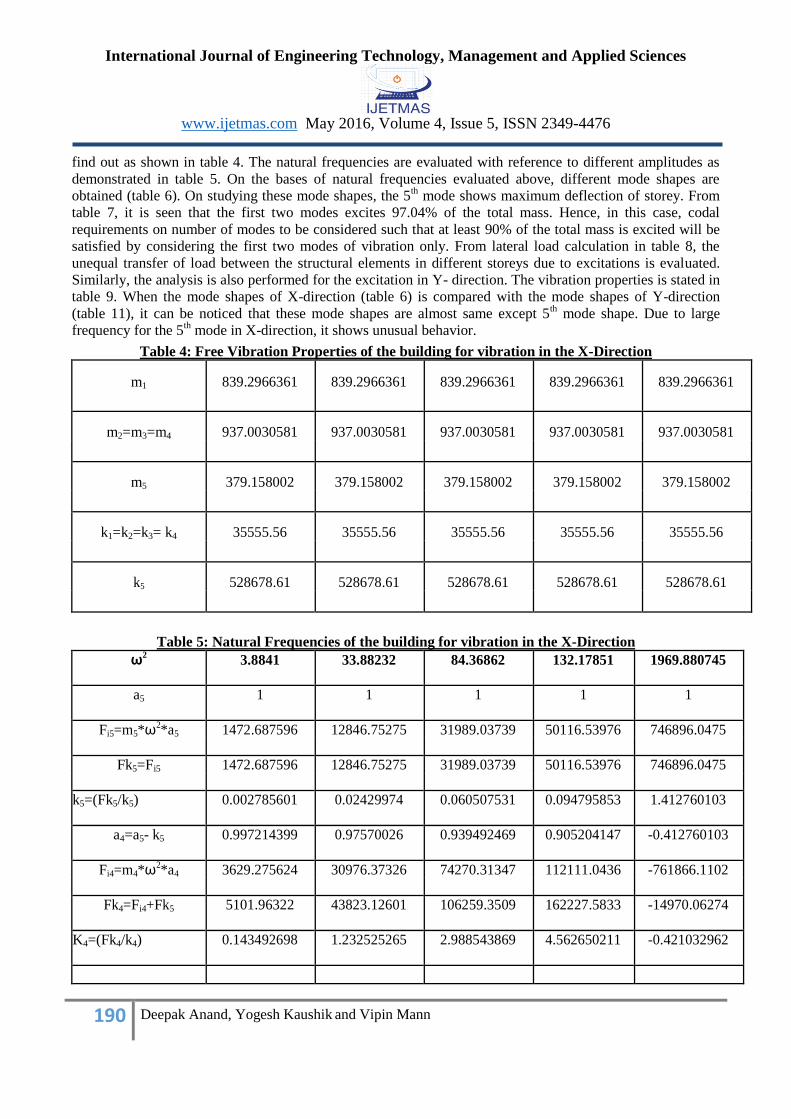
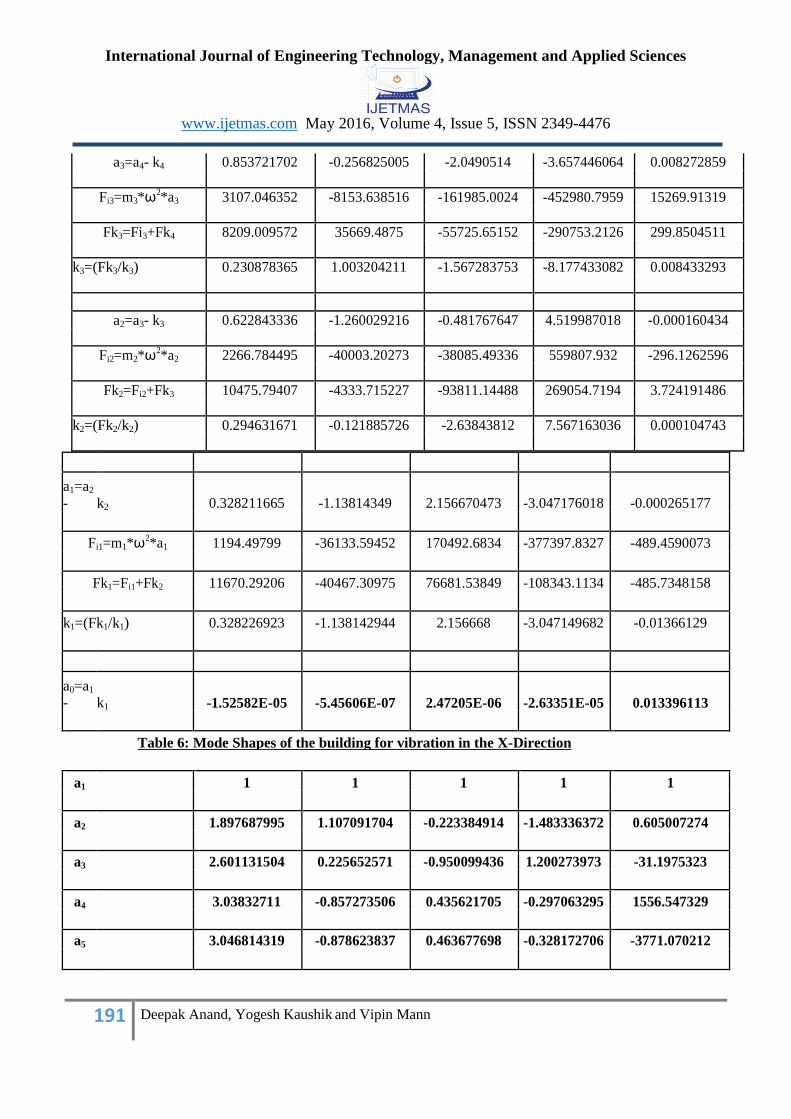
find out as shown in table 4. The natural frequencies are evaluated with reference to different amplitudes as
demonstrated in table 5. On the bases of natural frequencies evaluated above, different mode shapes are
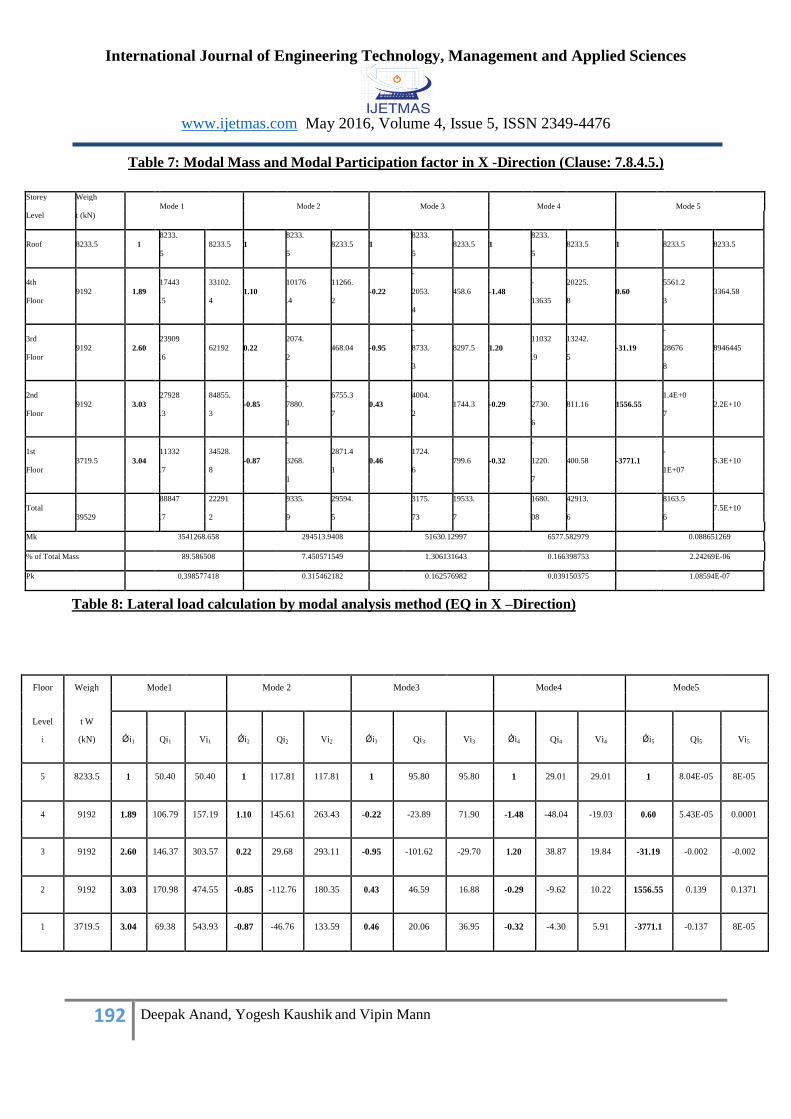
obtained (table 6). On studying these mode shapes, the 5th mode shows maximum deflection of storey. From
table 7, it is seen that the first two modes excites 97.04% of the total mass. Hence, in this case, codal
requirements on number of modes to be considered such that at least 90% of the total mass is excited will be
satisfied by considering the first two modes of vibration only. From lateral load calculation in table 8, the
unequal transfer of load between the structural elements in different storeys due to excitations is evaluated.
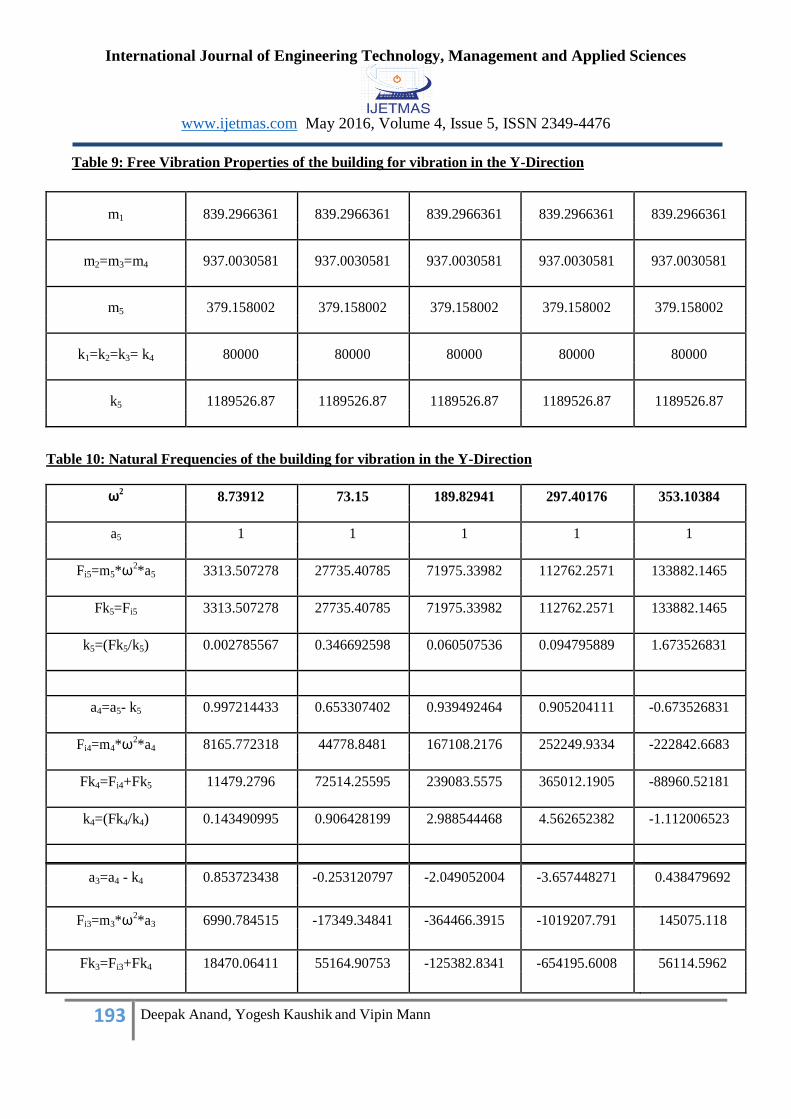
Similarly, the analysis is also performed for the excitation in Y- direction. The vibration properties is stated in
table 9. When the mode shapes of X-direction (table 6) is compared with the mode shapes of Y-direction
(table 11), it can be noticed that these mode shapes are almost same except 5th mode shape. Due to large
frequency for the 5th mode in X-direction, it shows unusual behavior.
Table 4: Free Vibration Properties of the building for vibration in the X-Direction
m1 839.2966361 839.2966361 839.2966361 839.2966361 839.2966361
m2=m3=m4 937.0030581 937.0030581 937.0030581 937.0030581 937.0030581
m5 379.158002 379.158002 379.158002 379.158002 379.158002
k1=k2=k3= k4 35555.56 35555.56 35555.56 35555.56 35555.56
k5 528678.61 528678.61 528678.61 528678.61 528678.61
Table 5: Natural Frequencies of the building for vibration in the X-Direction
ω2 3.8841 33.88232 84.36862 132.17851 1969.880745
a5 1 1 1 1 1
Fi5=m5*ω2*a5 1472.687596 12846.75275 31989.03739 50116.53976 746896.0475
Fk5=Fi5 1472.687596 12846.75275 31989.03739 50116.53976 746896.0475
k5=(Fk5/k5) 0.002785601 0.02429974 0.060507531 0.094795853 1.412760103
a4=a5- k5 0.997214399 0.97570026 0.939492469 0.905204147 -0.412760103
Fi4=m4*ω2*a4 3629.275624 30976.37326 74270.31347 112111.0436 -761866.1102
Fk4=Fi4+Fk5 5101.96322 43823.12601 106259.3509 162227.5833 -14970.06274
K4=(Fk4/k4) 0.143492698 1.232525265 2.988543869 4.562650211 -0.421032962
International Journal of Engineering Technology, Management and Applied Sciences
www.ijetmas.com May 2016, Volume 4, Issue 5, ISSN 2349-4476
191 Deepak Anand, Yogesh Kaushik and Vipin Mann
a3=a4- k4 0.853721702 -0.256825005 -2.0490514 -3.657446064 0.008272859
Fi3=m3*ω2*a3 3107.046352 -8153.638516 -161985.0024 -452980.7959 15269.91319
Fk3=Fi3+Fk4 8209.009572 35669.4875 -55725.65152 -290753.2126 299.8504511
k3=(Fk3/k3) 0.230878365 1.003204211 -1.567283753 -8.177433082 0.008433293
a2=a3- k3 0.622843336 -1.260029216 -0.481767647 4.519987018 -0.000160434
Fi2=m2*ω2*a2 2266.784495 -40003.20273 -38085.49336 559807.932 -296.1262596
Fk2=Fi2+Fk3 10475.79407 -4333.715227 -93811.14488 269054.7194 3.724191486
k2=(Fk2/k2) 0.294631671 -0.121885726 -2.63843812 7.567163036 0.000104743
a1=a2
- k2 0.328211665 -1.13814349 2.156670473 -3.047176018 -0.000265177
Fi1=m1*ω2*a1 1194.49799 -36133.59452 170492.6834 -377397.8327 -489.4590073
Fk1=Fi1+Fk2 11670.29206 -40467.30975 76681.53849 -108343.1134 -485.7348158
k1=(Fk1/k1) 0.328226923 -1.138142944 2.156668 -3.047149682 -0.01366129
a0=a1
- k1 -1.52582E-05 -5.45606E-07 2.47205E-06 -2.63351E-05 0.013396113
Table 6: Mode Shapes of the building for vibration in the X-Direction
a1 1 1 1 1 1
a2 1.897687995 1.107091704 -0.223384914 -1.483336372 0.605007274
a3 2.601131504 0.225652571 -0.950099436 1.200273973 -31.1975323
a4 3.03832711 -0.857273506 0.435621705 -0.297063295 1556.547329
a5 3.046814319 -0.878623837 0.463677698 -0.328172706 -3771.070212
International Journal of Engineering Technology, Management and Applied Sciences
www.ijetmas.com May 2016, Volume 4, Issue 5, ISSN 2349-4476
192 Deepak Anand, Yogesh Kaushik and Vipin Mann
Table 7: Modal Mass and Modal Participation factor in X -Direction (Clause: 7.8.4.5.)
Storey Weigh
Mode 1
Mode 2
Mode 3
Mode 4
Mode 5
Level t (kN)
Roof 8233.5 1
8233.
8233.5 1
8233.
8233.5 1
8233.
8233.5 1
8233.
8233.5 1
8233.5 8233.5
5
5
5
5
4th
17443
33102.
10176 11266.
-
- 20225.
5561.2
9192 1.89
1.10
-0.22
2053. 458.6 -1.48
0.60
3364.58
Floor
.5
4
.4 2
13635 8
3
4
3rd
23909
2074.
-
11032 13242.
-
9192 2.60
62192 0.22
468.04 -0.95
8733. 8297.5 1.20
-31.19
28676 8946445
Floor
.6
2
.9 5
3
8
2nd
27928
84855.
-
6755.3
4004.
-
1.4E+0
9192 3.03
-0.85
7880. 0.43
1744.3 -0.29
2730. 811.16 1556.55
2.2E+10
Floor
.3
3
7
2
7
1
6
1st
11332
34528.
-
2871.4
1724.
-
-
3719.5 3.04
-0.87
3268. 0.46
799.6 -0.32
1220. 400.58 -3771.1
5.3E+10
Floor
.7
8
1
6
1E+07
1
7
Total
88847 22291 9335. 29594. 3175. 19533. 1680. 42913. 8163.5
7.5E+10
39529
.7
2
9 5
73 7
08 6
6
Mk 3541268.658 294513.9408 51630.12997 6577.582979 0.088651269
% of Total Mass 89.586508 7.450571549 1.306131643 0.166398753 2.24269E-06
Pk 0.398577418 0.315462182 0.162576982 0.039150375 1.08594E-07
Table 8: Lateral load calculation by modal analysis method (EQ in X –Direction)
Floor Weigh Mode1 Mode 2 Mode3 Mode4 Mode5
Level t W
Ǿi1 Qi1 Vi1 Ǿi2 Qi2 Vi2 Ǿi3 Qi3 Vi3 Ǿi4 Qi4 Vi4 Ǿi5 Qi5 Vi5
i (kN)
5 8233.5 1 50.40 50.40 1 117.81 117.81 1 95.80 95.80 1 29.01 29.01 1 8.04E-05 8E-05
4 9192 1.89 106.79 157.19 1.10 145.61 263.43 -0.22 -23.89 71.90 -1.48 -48.04 -19.03 0.60 5.43E-05 0.0001
3 9192 2.60 146.37 303.57 0.22 29.68 293.11 -0.95 -101.62 -29.70 1.20 38.87 19.84 -31.19 -0.002 -0.002
2 9192 3.03 170.98 474.55 -0.85 -112.76 180.35 0.43 46.59 16.88 -0.29 -9.62 10.22 1556.55 0.139 0.1371
1 3719.5 3.04 69.38 543.93 -0.87 -46.76 133.59 0.46 20.06 36.95 -0.32 -4.30 5.91 -3771.1 -0.137 8E-05
International Journal of Engineering Technology, Management and Applied Sciences
www.ijetmas.com May 2016, Volume 4, Issue 5, ISSN 2349-4476
193 Deepak Anand, Yogesh Kaushik and Vipin Mann
Table 9: Free Vibration Properties of the building for vibration in the Y-Direction
m1 839.2966361 839.2966361 839.2966361 839.2966361 839.2966361
m2=m3=m4 937.0030581 937.0030581 937.0030581 937.0030581 937.0030581
m5 379.158002 379.158002 379.158002 379.158002 379.158002
k1=k2=k3= k4 80000 80000 80000 80000 80000
k5 1189526.87 1189526.87 1189526.87 1189526.87 1189526.87
Table 10: Natural Frequencies of the building for vibration in the Y-Direction
ω2 8.73912 73.15 189.82941 297.40176 353.10384
a5 1 1 1 1 1
Fi5=m5*ω2*a5 3313.507278 27735.40785 71975.33982 112762.2571 133882.1465
Fk5=Fi5 3313.507278 27735.40785 71975.33982 112762.2571 133882.1465
k5=(Fk5/k5) 0.002785567 0.346692598 0.060507536 0.094795889 1.673526831
a4=a5- k5 0.997214433 0.653307402 0.939492464 0.905204111 -0.673526831
Fi4=m4*ω2*a4 8165.772318 44778.8481 167108.2176 252249.9334 -222842.6683
Fk4=Fi4+Fk5 11479.2796 72514.25595 239083.5575 365012.1905 -88960.52181
k4=(Fk4/k4) 0.143490995 0.906428199 2.988544468 4.562652382 -1.112006523
a3=a4 - k4 0.853723438 -0.253120797 -2.049052004 -3.657448271 0.438479692
Fi3=m3*ω2*a3 6990.784515 -17349.34841 -364466.3915 -1019207.791 145075.118
Fk3=Fi3+Fk4 18470.06411 55164.90753 -125382.8341 -654195.6008 56114.5962
International Journal of Engineering Technology, Management and Applied Sciences
www.ijetmas.com May 2016, Volume 4, Issue 5, ISSN 2349-4476
194 Deepak Anand, Yogesh Kaushik and Vipin Mann
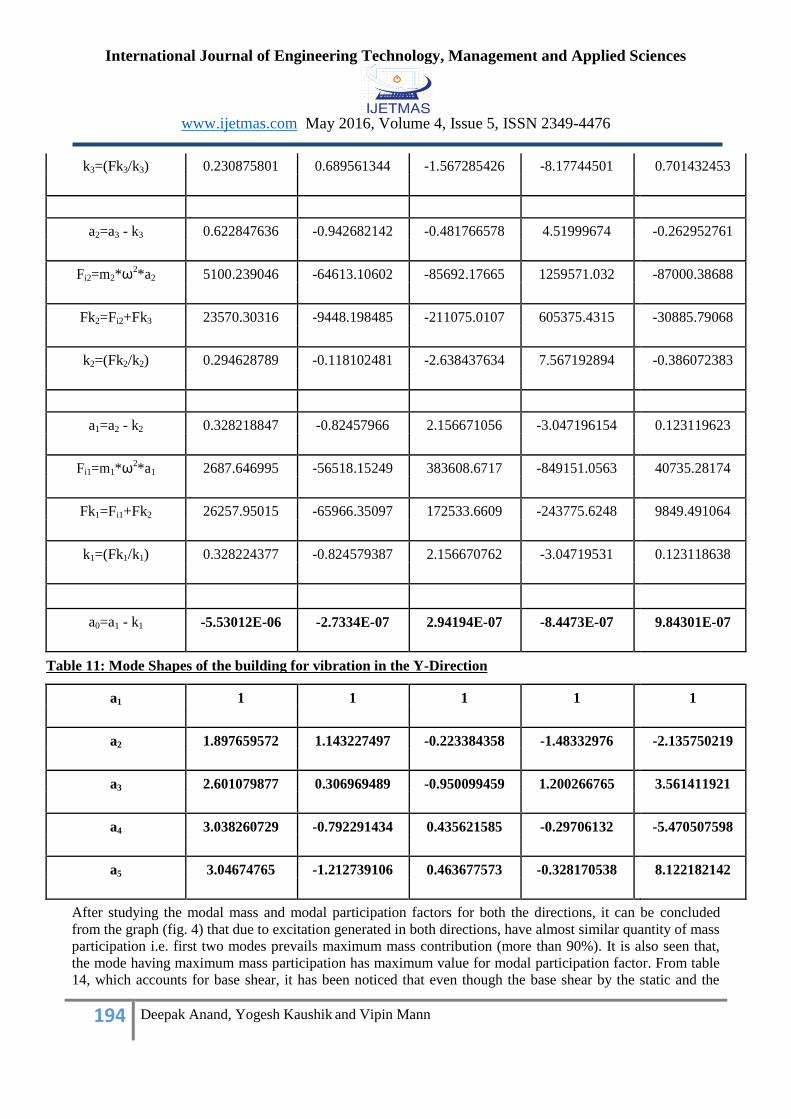
k3=(Fk3/k3) 0.230875801 0.689561344 -1.567285426 -8.17744501 0.701432453
a2=a3 - k3 0.622847636 -0.942682142 -0.481766578 4.51999674 -0.262952761
Fi2=m2*ω2*a2 5100.239046 -64613.10602 -85692.17665 1259571.032 -87000.38688
Fk2=Fi2+Fk3 23570.30316 -9448.198485 -211075.0107 605375.4315 -30885.79068
k2=(Fk2/k2) 0.294628789 -0.118102481 -2.638437634 7.567192894 -0.386072383
a1=a2 - k2 0.328218847 -0.82457966 2.156671056 -3.047196154 0.123119623
Fi1=m1*ω2*a1 2687.646995 -56518.15249 383608.6717 -849151.0563 40735.28174
Fk1=Fi1+Fk2 26257.95015 -65966.35097 172533.6609 -243775.6248 9849.491064
k1=(Fk1/k1) 0.328224377 -0.824579387 2.156670762 -3.04719531 0.123118638
a0=a1 - k1 -5.53012E-06 -2.7334E-07 2.94194E-07 -8.4473E-07 9.84301E-07
Table 11: Mode Shapes of the building for vibration in the Y-Direction
a1 1 1 1 1 1
a2 1.897659572 1.143227497 -0.223384358 -1.48332976 -2.135750219
a3 2.601079877 0.306969489 -0.950099459 1.200266765 3.561411921
a4 3.038260729 -0.792291434 0.435621585 -0.29706132 -5.470507598
a5 3.04674765 -1.212739106 0.463677573 -0.328170538 8.122182142
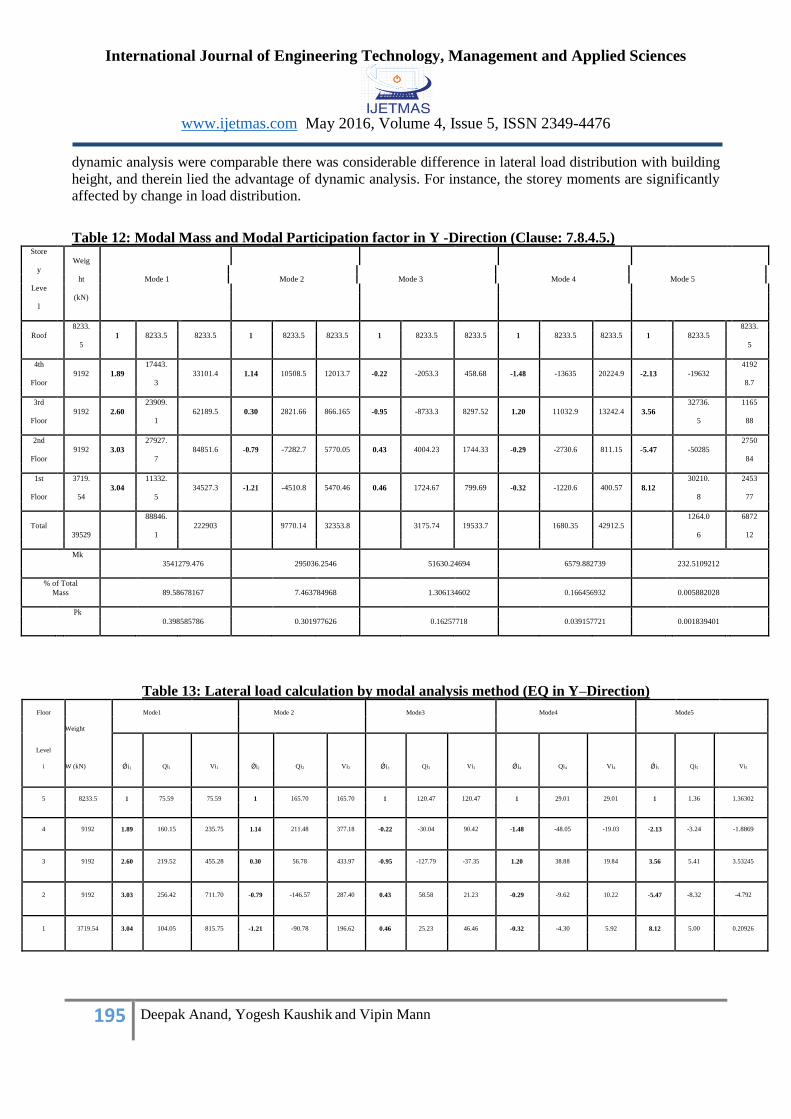
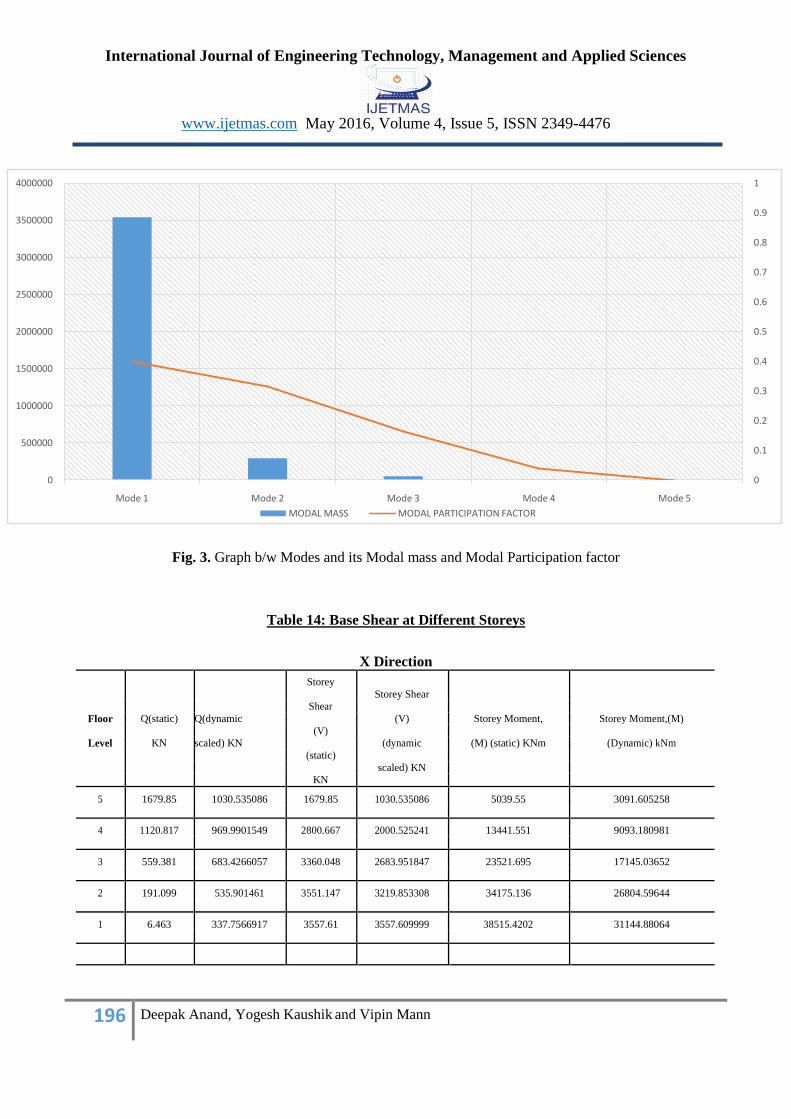
After studying the modal mass and modal participation factors for both the directions, it can be concluded
from the graph (fig. 4) that due to excitation generated in both directions, have almost similar quantity of mass
participation i.e. first two modes prevails maximum mass contribution (more than 90%). It is also seen that,
the mode having maximum mass participation has maximum value for modal participation factor. From table
14, which accounts for base shear, it has been noticed that even though the base shear by the static and the
International Journal of Engineering Technology, Management and Applied Sciences
www.ijetmas.com May 2016, Volume 4, Issue 5, ISSN 2349-4476
195 Deepak Anand, Yogesh Kaushik and Vipin Mann
dynamic analysis were comparable there was considerable difference in lateral load distribution with building
height, and therein lied the advantage of dynamic analysis. For instance, the storey moments are significantly
affected by change in load distribution.
Table 12: Modal Mass and Modal Participation factor in Y -Direction (Clause: 7.8.4.5.) Store
Weig
y
ht
Mode 1
Mode 2
Mode 3
Mode 4
Mode 5
Leve
(kN)
l
Roof
8233.
1 8233.5
8233.5 1 8233.5 8233.5 1 8233.5 8233.5 1 8233.5 8233.5 1
8233.5
8233.
5
5
4th
9192 1.89
17443.
33101.4 1.14 10508.5 12013.7 -0.22 -2053.3 458.68 -1.48 -13635 20224.9 -2.13
-19632
4192
Floor
3
8.7
3rd
9192 2.60
23909.
62189.5 0.30 2821.66 866.165 -0.95 -8733.3 8297.52 1.20 11032.9 13242.4 3.56
32736. 1165
Floor
1
5
88
2nd
9192 3.03
27927.
84851.6 -0.79 -7282.7 5770.05 0.43 4004.23 1744.33 -0.29 -2730.6 811.15 -5.47
-50285
2750
Floor
7
84
1st 3719.
3.04
11332.
34527.3 -1.21 -4510.8 5470.46 0.46 1724.67 799.69 -0.32 -1220.6 400.57 8.12
30210. 2453
Floor
54 5
8
77
Total
88846.
222903
9770.14 32353.8
3175.74 19533.7
1680.35 42912.5
1264.0 6872
39529
1
6
12
Mk
3541279.476
295036.2546
51630.24694
6579.882739
232.5109212
% of Total
Mass 89.58678167 7.463784968 1.306134602 0.166456932 0.005882028
Pk
0.398585786
0.301977626
0.16257718
0.039157721
0.001839401
Table 13: Lateral load calculation by modal analysis method (EQ in Y–Direction)
Floor
Weight
Mode1 Mode 2 Mode3 Mode4 Mode5
Level
W (kN) Ǿi1 Qi1 Vi1 Ǿi2 Qi2 Vi2 Ǿi3 Qi3 Vi3 Ǿi4 Qi4 Vi4 Ǿi5 Qi5
Vi5
i
5 8233.5 1 75.59 75.59 1 165.70 165.70 1 120.47 120.47 1 29.01 29.01 1 1.36 1.36302
4 9192 1.89 160.15 235.75 1.14 211.48 377.18 -0.22 -30.04 90.42 -1.48 -48.05 -19.03 -2.13 -3.24 -1.8869
3 9192 2.60 219.52 455.28 0.30 56.78 433.97 -0.95 -127.79 -37.35 1.20 38.88 19.84 3.56 5.41 3.53245
2 9192 3.03 256.42 711.70 -0.79 -146.57 287.40 0.43 58.58 21.23 -0.29 -9.62 10.22 -5.47 -8.32 -4.792
1 3719.54 3.04 104.05 815.75 -1.21 -90.78 196.62 0.46 25.23 46.46 -0.32 -4.30 5.92 8.12 5.00 0.20926
International Journal of Engineering Technology, Management and Applied Sciences
www.ijetmas.com May 2016, Volume 4, Issue 5, ISSN 2349-4476
196 Deepak Anand, Yogesh Kaushik and Vipin Mann
Fig. 3. Graph b/w Modes and its Modal mass and Modal Participation factor
Table 14: Base Shear at Different Storeys
X Direction
Storey
Storey Shear
Shear
Floor Q(static) Q(dynamic (V) Storey Moment, Storey Moment,(M)
(V)
Level KN scaled) KN (dynamic (M) (static) KNm (Dynamic) kNm
(static)
scaled) KN
KN
5 1679.85 1030.535086 1679.85 1030.535086 5039.55 3091.605258
4 1120.817 969.9901549 2800.667 2000.525241 13441.551 9093.180981
3 559.381 683.4266057 3360.048 2683.951847 23521.695 17145.03652
2 191.099 535.901461 3551.147 3219.853308 34175.136 26804.59644
1 6.463 337.7566917 3557.61 3557.609999 38515.4202 31144.88064
0
0.1
0.2
0.3
0.4
0.5
0.6
0.7
0.8
0.9
1
0
500000
1000000
1500000
2000000
2500000
3000000
3500000
4000000
Mode 1 Mode 2 Mode 3 Mode 4 Mode 5
MODAL MASS MODAL PARTICIPATION FACTOR
International Journal of Engineering Technology, Management and Applied Sciences
www.ijetmas.com May 2016, Volume 4, Issue 5, ISSN 2349-4476
197 Deepak Anand, Yogesh Kaushik and Vipin Mann
Y Direction
Storey
Storey Shear
Shear
Floor Q(static) Q(dynamic (V) Storey Moment, Storey Moment,(M)
(V)
Level KN scaled) KN (dynamic (M) (static) KNm (Dynamic) kNm
(static)
scaled) KN
KN
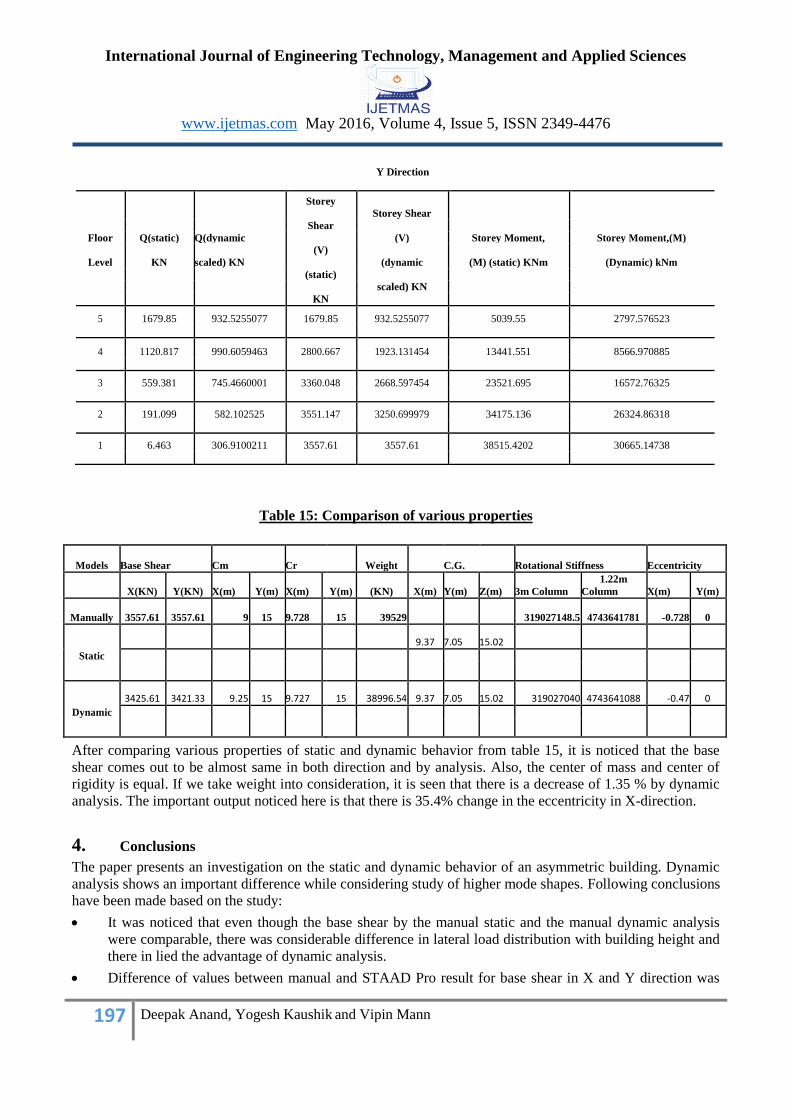
5 1679.85 932.5255077 1679.85 932.5255077 5039.55 2797.576523
4 1120.817 990.6059463 2800.667 1923.131454 13441.551 8566.970885
3 559.381 745.4660001 3360.048 2668.597454 23521.695 16572.76325
2 191.099 582.102525 3551.147 3250.699979 34175.136 26324.86318
1 6.463 306.9100211 3557.61 3557.61 38515.4202 30665.14738
Table 15: Comparison of various properties
Models Base Shear Cm Cr Weight C.G. Rotational Stiffness Eccentricity
1.22m
X(KN) Y(KN) X(m) Y(m) X(m) Y(m) (KN) X(m) Y(m) Z(m) 3m Column Column X(m) Y(m)
Manually 3557.61 3557.61 9 15 9.728 15 39529 319027148.5 4743641781 -0.728 0
Static
9.37 7.05 15.02
Dynamic
3425.61 3421.33 9.25 15 9.727 15 38996.54 9.37 7.05 15.02 319027040 4743641088 -0.47 0
After comparing various properties of static and dynamic behavior from table 15, it is noticed that the base
shear comes out to be almost same in both direction and by analysis. Also, the center of mass and center of
rigidity is equal. If we take weight into consideration, it is seen that there is a decrease of 1.35 % by dynamic
analysis. The important output noticed here is that there is 35.4% change in the eccentricity in X-direction.
4. Conclusions
The paper presents an investigation on the static and dynamic behavior of an asymmetric building. Dynamic
analysis shows an important difference while considering study of higher mode shapes. Following conclusions
have been made based on the study:
It was noticed that even though the base shear by the manual static and the manual dynamic analysis
were comparable, there was considerable difference in lateral load distribution with building height and
there in lied the advantage of dynamic analysis.
Difference of values between manual and STAAD Pro result for base shear in X and Y direction was
International Journal of Engineering Technology, Management and Applied Sciences
www.ijetmas.com May 2016, Volume 4, Issue 5, ISSN 2349-4476
198 Deepak Anand, Yogesh Kaushik and Vipin Mann
observed to be 3.71% and 3.83% respectively.
For center of mass, center of rigidity and rotational stiffness, negligible difference was observed.
Weight calculations by manual and STAAD Pro showed the difference of 1.35%.
As per the results obtained, the change in eccentricity of the building in X-direction is observed.
For future study, Consecutive Modal Pushover analysis can be done to enhance the high torsion capacity of
asymmetric building. Also Base Isolation technique may come handy for unsymmetrical building to study the
seismic behavior of the structure. Moreover, Seismic investigation between various irregular shape structures
should be possible and contrasting the consequences of seismic reaction of each shape with can help in
accessing better decision of lopsided shape depending on seismic execution.
References 1. Bagheri. B; Firoozabad. S. E; and Yahyaei. M.; “Comparative Study of the Static andDynamic Analysis of Multi-
Storey Irregular Building”; World Academy of Science, Engineering and Technology 71: 1920-1924, Nov 2012
2. Bosco. M; Ferrara. F. A. G; Ghersi. A; Marino. M. E and Rossi. P. P; “Predictingdisplacement demand of multi-
storey asymmetric buildings by nonlinear static analysis and corrective eccentricities”; Engineering Structures, 23
May 2015, Pages-373–387
3. Bui. B. Q; Hans. S and Boutin. C.; “Dynamic behavior of an asymmetric building:Experimental and numerical
studies”; Case Studies in Nondestructive Testing and Evaluation, 8 July 2014, Pages-38–48
4. Calderoni. B; Aveni. D. A; Ghersi. A and Rinaldi. Z.; “Static vs. Modal Analysis ofAsymmetric Buildings:
Effectiveness of Dynamic Eccentricity Formulations”; Earthquake Spectra, Volume 18, No. 2, May 2002, Pages
219–231
5. Chandler. M. A and Hutchinson. L. G.; “Effect of structural period and ground motionparameters on the earthquake
response of asymmetric buildings”; Engineering Structures, Volume 14, Number 6, 1992, Pages-354-360
6. Chen. P. and Collins. R. K.; “Some observations on performance-based and reliability-based seismic design of
asymmetric building structures”; Engineering Structures, 2001, Pages- 1005–1010
7. Dutta. S. and Roy. R; “Seismic Demand of Low-Rise Multistory Systems with GeneralAsymmetry”; Journal of
Engineering Mechanics , January 2012, Vol. 138, No. 1,Pages- 1-11
8. Ferhi. A and Truman. Z. K.; “Behaviour of asymmetric building systems under amonotonic load-1”; Engineering
Structures, Volume 18, Number 2, 1996, Pages-133-141
9. Ile. N. And Reynouard. M. J.; “Behaviour of U-Shaped Walls subjected to Uniaxial andBiaxial Cyclic Lateral
loading”; Journal of Earthquake Engineering, Vol. 9, No. 1, Sept. 2005, Pages- 67–94
10. Kocak. A; Zengin. B and Kadioglu. F; “Performance assessment of irregular RC buildingswith shear walls after
Earthquake”; Engineering Failure Analysis, 3 June 2015, Pages-157– 168
11. Poursha. M; Khoshnoudian. F and Moghadam. S. A; “The extended consecutive modalpush over procedure for
estimating the seismic demands of two-way unsymmetric-plan tall buildings under influence of two horizontal
components of ground motions”; Soil Dynamics and Earthquake Engineering, 24 April 2014, Pages-162-173
12. Sikaroudi. H. and A. M. Chandler.; ”Structure-foundation interaction in the earthquakeresponse of torsional
asymmetric buildings”; Soil Dynamics and Earthquake Engineering, Volume 11, Issue 1, 1992, Pages 1-16
13. Sivakumaran. S. K. and Balendra. T; “Seismic analysis of asymmetric multistoreybuildings including foundation
interaction and P- effects”; Engineering Structures, Volume 16, Number 8, 1994, Pages-609-624
14. Thambiratnam. P. D. and Corderoy. B. J. H; “Effects of asymmetry on the response ofmultistorey buildings to
earthquakes”; Engineering Structures, Volume 16, Number 3, 1994, Pages-210-221
15. Wakchaure. M. R. and Ped S. P.; “Earthquake Analysis of High Rise Building with andWithout In filled Walls”;
International Journal of Engineering and Innovative Technology (IJEIT), Volume 2, Issue 2, August 2012