Embed Size (px)
Citation preview

�������� ����� ��
Static and fatigue performance of resin injected bolts for a slip and fatigueresistant connection in FRP bridge engineering
Behrouz Zafari, Jawed Qureshi, J. Toby Mottram, Rusi Rusev
PII: S2352-0124(16)30025-XDOI: doi: 10.1016/j.istruc.2016.05.004Reference: ISTRUC 109
To appear in:
Received date: 8 February 2016Revised date: 9 May 2016Accepted date: 10 May 2016
Please cite this article as: Zafari Behrouz, Qureshi Jawed, Mottram J. Toby, Rusev Rusi,Static and fatigue performance of resin injected bolts for a slip and fatigue resistantconnection in FRP bridge engineering, (2016), doi: 10.1016/j.istruc.2016.05.004
This is a PDF file of an unedited manuscript that has been accepted for publication.As a service to our customers we are providing this early version of the manuscript.The manuscript will undergo copyediting, typesetting, and review of the resulting proofbefore it is published in its final form. Please note that during the production processerrors may be discovered which could affect the content, and all legal disclaimers thatapply to the journal pertain.

ACC
EPTE
D M
ANU
SCR
IPT
ACCEPTED MANUSCRIPT
1
Paper Title: Static and Fatigue Performance of Resin Injected Bolts for a Slip
and Fatigue Resistant Connection in FRP Bridge Engineering
Authors:
1. Behrouz Zafari (Corresponding author)
Address: Dr Behrouz Zafari
Lecturer in Civil Engineering Structures, Department of Civil Engineering
The Faculty of Science, Engineering and Computing
Kingston University London
Surrey, KT1 2EE.
T: +44 (0) 2084179000; Ex: 64820
2. Jawed Qureshi
Senior Lecturer in Structural Engineering and Design
School of Architecture, Computing and Engineering (ACE)
University of East London
4-6 University Way, Beckton
London E16 2RD.
T: +44 (0) 20 8223 2363
F: +44 (0) 20 8223 2963
3. J Toby Mottram
Professor and Stream Leader for Civil Engineering
School of Engineering
The University of Warwick,
Coventry, CV4 7AL.
T: +44 (0) 24 76 522 528
F: +44 (0) 24 76 418 922
4. Rusi Rusev
Mott MacDonald
Mott MacDonald House
8-10 Sydenham Road
Croydon, CR0 2EE, UK
T: +44 (0)20 8774 2736

ACC
EPTE
D M
ANU
SCR
IPT
ACCEPTED MANUSCRIPT
2
Static and Fatigue Performance of Resin Injected Bolts for a Slip and Fatigue
Resistant Connection in FRP Bridge Engineering
Behrouz Zafaria *, Jawed Qureshi
b, J Toby Mottram
c and Rusi Rusev
d
a Department of Civil Engineering, The Faculty of Science, Engineering and Computing, Kingston
University London, KT1 2EE, UK. b
School of Architecture, Computing and Engineering (ACE),University of East London
4-6 University Way, Beckton, London E16 2RD, UK. c
Civil Research Group, School of Engineering, University of Warwick, Coventry, CV4 7AL, UK. d
Mott MacDonald, Mott MacDonald House, 8-10 Sydenham Road, Croydon CR0 2EE, UK.
* Corresponding author
Abstract
This paper presents test results to evaluate the slip and fatigue performance of Resin Injected Bolted
Joints (RIBJs) for pultruded Fibre Reinforced Polymer (FRP) material. The objective of the test
series is to provide a robust method of connection for structural engineering that is both fatigue and
slip resistant. Forty-six joints (using 23 specimens) were subjected to either static or combined
static/cyclic loading at ambient room temperature. Ten specimens (five batches of two) had bolted
connections without injected resin and were included to provide baseline static joint strengths.
Sikadur®-30 and RenGel®-SW404 were the two cold-curing epoxy based resins used to fabricate
the 13 RIBJ specimens. Testing was conducted with double lap-shear joints in accordance with
modified guidance from Annex G and Annex K in standard BS EN 1090-2:2008. The specimen’s
geometry was established using this British Standard and an American Society of Civil Engineers
pre-standard for pultruded thin-walled structures. Rectangular plates for the lap joints were cut from
either a wide flange section of size 254×254×9.53 mm or a flat sheet of 6.35 mm thickness. Bolting
was with either M16 or M20 steel threaded bolts of Grade 8.8. Sixteen specimens, for eight batches
of two specimens were failed in a short duration for static strength. Four RIBJ specimens had static
load cycling to an assumed service load level. Three specimens out of 23 were subjected to staged
static and cyclic fatigue loadings to determine stiffness changes, life-time ‘slip’ load and residual
joint strength. The reported results are evaluated for slip and fatigue performance and the main
finding is that resin injection shows much promise as a mechanical method of connection in
pultruded FRP structures.
KEYWORDS: FRP structures; bolted connections; resin injection; slip and fatigue resistance
ACC
EPTE
D M
ANU
SCR
IPT
ACCEPTED MANUSCRIPT
3
1. Introduction
Steel, concrete, masonry and timber have been the dominant structural materials in bridge
engineering for over a century. With 50 years of successful implementation in aerospace and marine
applications, the newer structural material of Fibre Reinforced Polymer (FRP) is becoming
increasingly popular for new bridge structures and for footbridges in particular. Reduced mass,
chemical and corrosion resistance, electromagnetic transparency and a lower ecological impact give
FRP structures advantages in bridge engineering. Examples of where FRP components have been
employed include: Bonds Mill Lift Bridge, Stroud, in England; Miyun Bridge in China; Medway
Bridge in USA; the 2014 Frampton Cotterell Bridge, near Bristol, England. Lack of familiarity
amongst the bridge engineer community, and no agreed design standards are two factors preventing
the materials’ wider use [1].
The design and detailing of connections for any structural material and structural form is of critical
importance. Because the stiffness and strength of FRP joints are influenced by various parameters
and an FRP material is virtually linear elastic to rupture, the challenge of having strong, reliable and
safe methods of connection increases for structures comprising of FRP laminates [2]. The three
conventional methods for forming a connection between two components are: mechanical fasteners
(including bolts, screws, rivets and interlocks (or snap-fit)); adhesive bonding; hybrid system that
combines both mechanical and bonding methods. The various factors that make mechanical fasteners
attractive include: familiarity with the method; relatively low cost; ability to disassemble the
structure. Depending on the strength properties of the FRP material, bearing failure in-front of the
bearing steel bolt can be progressive [3], giving a warning before the joint’s ultimate failure.
It is standard practice in bridge engineering to have non-slip connections that satisfy design against
Serviceability and Fatigue Limit States [4]. For modern bridges of steel a conventional way to
achieve this is to use preloaded High Strength Friction Grip (HSFG) bolts. In historic steel bridges,
riveting was the connection method to achieve the same structural engineering outcome. Hot riveting
is unsuitable when connecting FRP elements because the polymeric composite cannot tolerate the
high temperatures of 1200-1500oC. Fitted bolts [5] are expensive, and hardly practical because of the
very tight geometric tolerances they require to work. HSFG bolts transfer the shear forces between
panels through friction over the contact surfaces generated by the ‘clamping’ action from the
preloaded bolts. Previous research [6] with a pultruded FRP has shown that preloading standard

ACC
EPTE
D M
ANU
SCR
IPT
ACCEPTED MANUSCRIPT
4
bolting cannot be relied upon to transfer connection force by friction because the tension force is lost
over time due to through-the-thickness viscoelastic creep/relaxation.
An alternative to fitted or HSFG bolting is resin injection, in which the voiding surrounding the bolt
shaft is filled with a freshly mixed two-part resin that is cold curing. The shaft can be threaded and so
does not need to be smooth. Injection bolts have been employed to repair old riveted metallic railway
and road bridges when rivets need replacing [7]. This method of connection is practiced in the
Netherlands for the execution of new steel bridges. One reason for choosing resin injection is that
their design for steel structures is scoped in standard BS EN 1993-1-8:2005 [8]. The method can
offer a number of advantages, such as: slip resistance against normal/shock loading; higher design
resistance in bearing; no need to control bolt tightening as with HSFG bolting to ensure appropriate
slip resistance [9]. Based on prior knowledge it can be proposed that injection bolts would make a
suitable mechanical fastener to achieve acceptable slip and fatigue performance in FRP bridge
engineering. Confidence in having joints with a structural performance that satisfy what design
engineers need will lead to new applications of FRPs in larger structures. It is envisaged that this will
help the UK to meet the Government’s strategy for sustainable construction [10].
To investigate the structural performance of Resin Injected Bolted Joints (RIBJs) for pultruded FRP
material there’s a need for a fatigue test programme. This requires the consideration of several
parameters, namely: loading pattern; stress ratio; cyclic load frequency; control mode; test
temperature. Each of these parameters can affect the test results obtained to a greater or lesser extent
[11]. The majority of experimental data reported on fatigue testing [11] has been determined with
constant (stress) amplitude loading, but in some test programmes the loading patterns can have
variable amplitude or block loading. Fatigue tests are most often conducted under controlled load or
displacement, with the former mode control leading to material failure after fewer cycles. Since the
cyclic load is kept constant, deformation will continually increase after damage has initiated and
during its progression [11]. Another important parameter that affects the fatigue behaviour of
structures is the stress ratio Rσ (= σmin/σmax).
Shown in Figures 1(a) to 1(c) are generic samples of sinusoidal stress histories with maximum stress
(σmax) and minimum stress (σmin). In Figure 1(a) the sample history is for tension–tension stress,
having 0 < Rσ < 1. In Figure 1(b) the stress is in tension–compression for Rσ = -1, and in Figure 1(c)
it is for compression–compression with Rσ > 1. The failure mechanism for FRP materials can be
different under tensile or compressive loading, and so any fatigue test programme needs to plan for
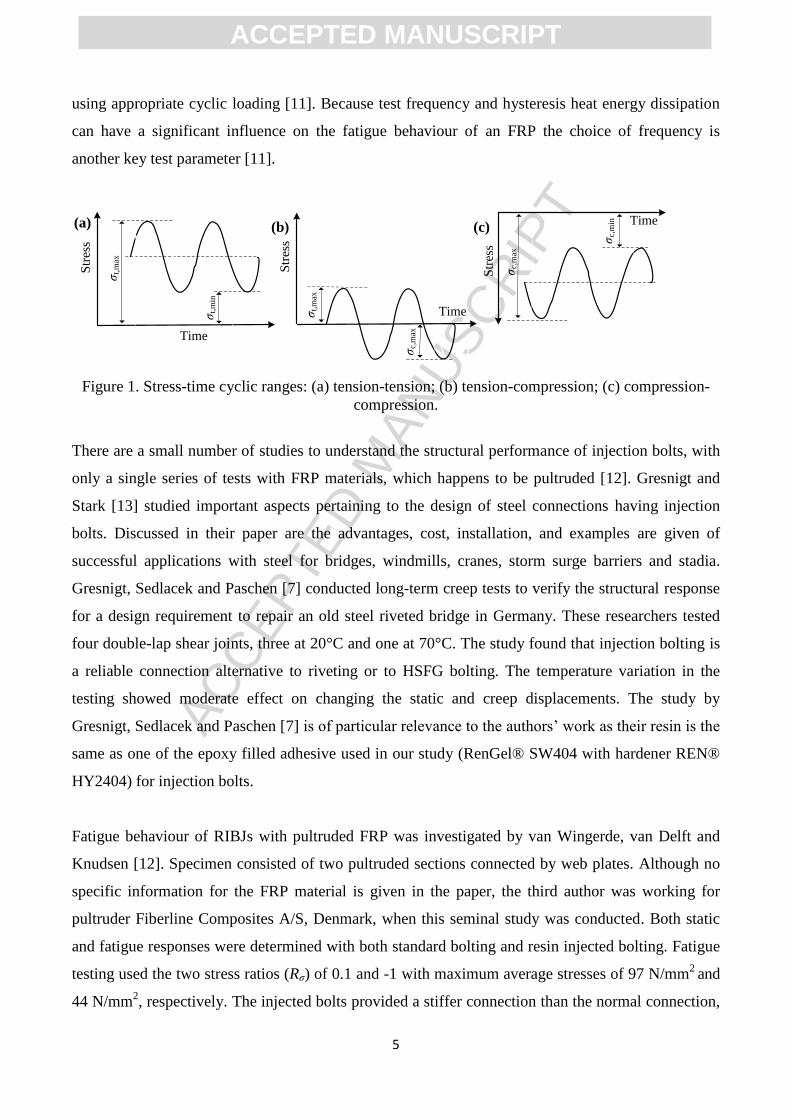
ACC
EPTE
D M
ANU
SCR
IPT
ACCEPTED MANUSCRIPT
5
using appropriate cyclic loading [11]. Because test frequency and hysteresis heat energy dissipation
can have a significant influence on the fatigue behaviour of an FRP the choice of frequency is
another key test parameter [11].
Figure 1. Stress-time cyclic ranges: (a) tension-tension; (b) tension-compression; (c) compression-
compression.
There are a small number of studies to understand the structural performance of injection bolts, with
only a single series of tests with FRP materials, which happens to be pultruded [12]. Gresnigt and
Stark [13] studied important aspects pertaining to the design of steel connections having injection
bolts. Discussed in their paper are the advantages, cost, installation, and examples are given of
successful applications with steel for bridges, windmills, cranes, storm surge barriers and stadia.
Gresnigt, Sedlacek and Paschen [7] conducted long-term creep tests to verify the structural response
for a design requirement to repair an old steel riveted bridge in Germany. These researchers tested
four double-lap shear joints, three at 20°C and one at 70°C. The study found that injection bolting is
a reliable connection alternative to riveting or to HSFG bolting. The temperature variation in the
testing showed moderate effect on changing the static and creep displacements. The study by
Gresnigt, Sedlacek and Paschen [7] is of particular relevance to the authors’ work as their resin is the
same as one of the epoxy filled adhesive used in our study (RenGel® SW404 with hardener REN®
HY2404) for injection bolts.
Fatigue behaviour of RIBJs with pultruded FRP was investigated by van Wingerde, van Delft and
Knudsen [12]. Specimen consisted of two pultruded sections connected by web plates. Although no
specific information for the FRP material is given in the paper, the third author was working for
pultruder Fiberline Composites A/S, Denmark, when this seminal study was conducted. Both static
and fatigue responses were determined with both standard bolting and resin injected bolting. Fatigue
testing used the two stress ratios (Rσ) of 0.1 and -1 with maximum average stresses of 97 N/mm2
and
44 N/mm2, respectively. The injected bolts provided a stiffer connection than the normal connection,
Str
ess
Time
σt,
min
σt,
max
Str
ess
Timeσt,
max
σc,
max
Str
ess
σc,
max
σc,
min Time
(a) (b) (c)
ACC
EPTE
D M
ANU
SCR
IPT
ACCEPTED MANUSCRIPT
6
with 1.1 mm clearance hole, as slip appeared in the standard connection at stress level of 22 N/mm2.
There is no fatigue specimen repetition. The fatigue life of injection bolts did not show much of an
improvement for Rσ = 0.1, but for the reversed cyclic loading of Rσ = -1 it was 100 times higher.
To represent joints in old riveted steel railway bridges found in Portugal, the researchers de Jesus, da
Silva, Figueiredo, Ribeiro, Fernandes and Correia [5] performed fatigue tests with double (Rσ is 0.0)
and single lap (Rσ is 0.1) shear joints. Bolting was both standard and resin injected. This study by
Jesus et al. [5] is of specific relevance to the authors’ work as in both studies Sikadur-30® resin is
used for injection.
The authors found that injected bolting gave consistent fatigue strength reduction when compared
with the standard steel bolted connections. This is contrary to the provision given in Eurocode 3 [8]
where no distinction is made between preloaded bolted connections and preloaded resin-injected
bolted connections. Based on a preliminary series of tests, Jesus et al. [5] recommended the need for
further numerical and testing research to understand the fatigue behaviour of resin-injected bolts for
application in steel structures.
The aim of this paper is to report slip and fatigue test results for plate-to-plate pultruded FRP joints
having resin injected bolted connections. All tests had specimens with the double lap shear joint
configuration and bolting is of steel. Two epoxy resins were used, and a new top steel washer was
developed to ensure smooth filling of the cavity with resin when fabricating the RIBJs. For
comparison, there are static test results from equivalent specimens with standard bolting, with and
without bolt clearance holes. To determine the structural performance of the resin injected method a
total of twenty-three tests (forty-six joints with two per specimen) were conducted by way of eight
different specimens and three different loading procedures.
The test procedure was carried out following appropriate modification to the guidelines given in
ECCS Nº79-1994 [14] and BS EN 1090-2:2008 [15]. It is important to understand that for the
reported test results the word ‘slip’ is used for the measured axial displacements in standard
connections with bolting (and clearance), and for connections with injection bolts, although slip
cannot occur when the bolt is surrounded by cast resin. As a consequence the terms ‘slip’ and
‘displacement’ can be used interchangeably for the measured movement/translation of the outer
pultruded FRP plate with respect to the inner pultruded FRP plate at the bolt centreline.
ACC
EPTE
D M
ANU
SCR
IPT
ACCEPTED MANUSCRIPT
7
2. Materials and Specimens
Figures 2(a) and 2(b) show photographs of the two specimen types having M16 or M20 bolting.
Each specimen has two double-lap shear joints with two bolts aligned in the direction of applied
axial load. Specimen dimensions are given, not to scale, in Figures 3 and 4. The plate width is 80
mm and (cover plates) length for the two joints is 265 mm. A length of 100 mm for the two inner
plates extends beyond the joint ends for gipping in the hydraulic testing machine. In Figure 3 the
geometries for Type 1 specimens having M16 bolts are in accordance with the normative Annex G
of BS EN 1090-2:2008 [15], whereas the dimensions for Type 2 specimens in Figure 4 are in
accordance with guidelines in the ASCE pre-standard for the design of pultruded structures [16]. The
design rules for preparing injected bolt specimens for steel structures are also found in ECCS Nº79-
1994 [14].
Employing M16 Grade 8.8 steel hexagonal bolts and a 18 mm diameter hole for 2 mm clearance,
Type 1 specimens shown in Figures 2(a) and 3 comprise inner plates cut from the flanges of a Wide
Flange (WF) pultruded Creative Pultrsuions Inc. 1525 series SuperStructural® of size 254×254×9.53
mm [17] and outer ‘cover’ plates cut from a Strongwell EXTREN® [18] flat sheet of nominal
thickness 6.35 mm. In this preliminary fact finding study the choice of plate materials was for
convenience and based on thicknesses to have the inner plates as the weakest. The inner plate
material has a polyester based matrix, whilst the beige colour of the flat sheet of the cover plates
informs us the matrix is a vinyl ester resin. The reinforcement is glass fibres and the continuous
unidirectional rovings are parallel to the longer sides of the inner and cover plates.
For the Type 2 specimens shown in Figures 2(b) and Figure 4 the dimensions were chosen using the
guidance in the 2010 ASCE pre-standard for pultruded structures [16]. Both inner and cover plates
were cut from the flanges of the same pultruded WF shape as for the inner plates in Type 1. This
choice ensures the weakness part in the joint remains the inner plates. M20 Grade 8.8 steel bolts had
a 2.4 mm clearance hole. The hexagonal headed steel bolts are threaded along their entire length.

ACC
EPTE
D M
ANU
SCR
IPT
ACCEPTED MANUSCRIPT
8
Figure 2. RIBJ test configurations: (a) Type 1; (b) Type 2.
Figure 3. Geometry for Type 1 (M16) specimen; dimension in mm.
Figure 4. Geometry for Type 2 (M20) RIBJ specimens; dimension in mm.
(a) (b)
M16 Grade 8.8 steel bolting
M20 Grade 8.8 steel bolting
100
6.3
6.3
9.53
40
35 50 35 25 35 50 35 100
40
Inner plate Inner plate Cover plate
Hole to fit M16 bolt
25 gap
265
80
100
9.53
9.53
9.53
40
40 80 40 25 40 80 40 100
40
Inner plate Inner plate Cover plate
Hole to fit M20 bolt
25 gap
345
80

ACC
EPTE
D M
ANU
SCR
IPT
ACCEPTED MANUSCRIPT
9
Sikadur®-30 and RenGel® SW404 (with hardener REN® HY2404), are the two epoxy based resin
systems used. They were chosen after a thorough technical assessment of adhesive systems that
could provide cold curing, a viscosity for injection, and acceptable pot life and acceptable
mechanical properties. They are both structural two part adhesives. Sikadur® -30 is a thixotropic,
based on a combination of epoxy resins and special filler, with on mixing Parts A and B has a light-
grey colour. Two of its characteristic advantages are high creep resistance under permanent load and
that it is impermeable to liquids or water vapour. The service temperature range is -40oC to +45
oC
when cured at > 23oC. On mixing the RenGel epoxy filled adhesive, supplied by Huntsman
Advanced Materials, has a blue colour and its key properties are greater hardness and good chemical
resistance. This technical information is from the supplier’s datasheet.
Standard steel washers having a diameter of 35 mm and thickness of 3 mm are used in Type 1. The
equivalent washer dimensions in Type 2 were 40 mm and 3.2 mm.
Table 1. Specimen batches and their test parameters.
Batch labelling Hole size
(mm) Resin type
Clearance
hole (mm)
Number of
specimens
(joints)
Number of
RIBJ
specimens
(1) (2) (3) (4) (5) (6)
M16
(Type 1)
18HL 18 — 2 3 (6) 0
16HL 16 — — 3 (6) 0
RG 18 RenGel 2 4 (8) 1
SK 18 Sikadur 2 4 (8) 1
M20
(Type 2)
22.4HL 22.4 — 2.4 2 (4) 0
20HL 20 — — 2 (4) 0
RG 22.4 RenGel 2.4 3 (6) 1
SK 22.4 Sikadur 2.4 2 (4) 0
Table 1 summarizes the eight different specimen configurations. Column 1 in the tables defines the
labelling scheme. The test series includes non-injected specimens that will be, in this paper, referred
to as standard bolted joints (which for pultruded FRP are bearing connections [9]). Each specimen
identifier starts with M16 or M20 for bolt size, and is followed by the hole diameter of either 18, 16,
22.4 or 20, with either HL (HoLe) for the standard bolted connection, or RG, or SK, for injection
bolts with RenGel or SiKadur adhesive systems. Columns (2) to (4) list hole sizes in mm, resin type
and clearance hole sizes in mm. When there is a long dash symbol there is either no resin or no hole

ACC
EPTE
D M
ANU
SCR
IPT
ACCEPTED MANUSCRIPT
10
clearance, which are for the two specimens with tight fitted bolting. Column (5) gives the number of
nominally identical specimens (and in brackets number of joints). Finally, column 6 is used to
identify which specimen configurations are for the three RIBJ specimens in the static/fatigue loading
programme.
3. Details of Resin Injected Bolted Joints
To ensure a constant (radial) thickness of a resin around the threaded bolt shaft the specific bolt
location jig, shown in Figure 5, was designed and made in-house. This location jig forces the bolts to
be centrally placed in their holes, and thereby guarantees identically fabricated specimens. The
location of the shaft’s centreline in Type 1 specimens, having M16 bolting, was at the hole centre
[19], thereby the radial clearance when hole is 18 mm is uniform at 1 mm. The position of a bolt
shaft’s centreline in Type 2 specimens was changed so that the four bolts had the maximum radial
thickness of resin on the bearing side (for highest tension load) and in alignment with this loading.
As a result of this change, intended to capture the ‘worse’ possible fabrication in the field, the
maximum resin thickness could be 2.4 mm (for batches M20_RG and M20_SK in Table 1).
The M16 bolts were tightened to a bolt torque of 80 Nm, which was calculated using the bolt tension
formula given in Smith, Ashby and Pascoe [20]. The equivalent torque for the M20 bolting is 88 Nm.
These two torques generated, immediately on tightening, a predicted average compression stress of
80 N/mm2
and 88 N/mm2 over the surface area of the steel washers, and is from guidance
recommendation number 4 on page 717 in [6]. Testing of a specimen happened days to weeks after
resin curing and bolt tightening. The resin was fully cured and the effect of viscoelasticity
creep/relaxation will have reduced the steel bolt tension of an unknown value. It is worthy to
mention that the cure time for RenGel SW404 and Sikadur-30 resins, from the manufacturers, are 1
day and 7 days at normal ambient temperature, respectively, and all specimens were tested 7 to 35
days after resin injection.
A technical reason for the bolt tightening was to minimise the likelihood that there would be an
adhesive bond from resin flowing between the mating FRP plates. This test conditions was
established when the specimens were disassembled.
ACC
EPTE
D M
ANU
SCR
IPT
ACCEPTED MANUSCRIPT
11
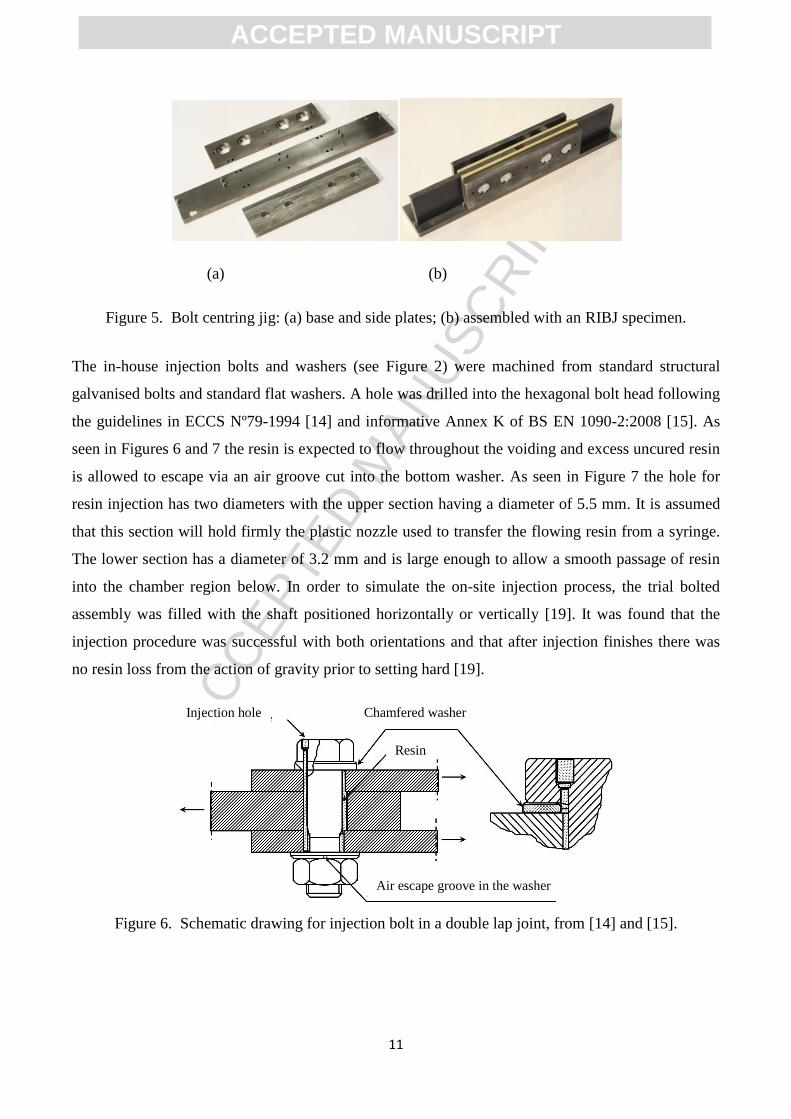
Figure 5. Bolt centring jig: (a) base and side plates; (b) assembled with an RIBJ specimen.
The in-house injection bolts and washers (see Figure 2) were machined from standard structural
galvanised bolts and standard flat washers. A hole was drilled into the hexagonal bolt head following
the guidelines in ECCS Nº79-1994 [14] and informative Annex K of BS EN 1090-2:2008 [15]. As
seen in Figures 6 and 7 the resin is expected to flow throughout the voiding and excess uncured resin
is allowed to escape via an air groove cut into the bottom washer. As seen in Figure 7 the hole for
resin injection has two diameters with the upper section having a diameter of 5.5 mm. It is assumed
that this section will hold firmly the plastic nozzle used to transfer the flowing resin from a syringe.
The lower section has a diameter of 3.2 mm and is large enough to allow a smooth passage of resin
into the chamber region below. In order to simulate the on-site injection process, the trial bolted
assembly was filled with the shaft positioned horizontally or vertically [19]. It was found that the
injection procedure was successful with both orientations and that after injection finishes there was
no resin loss from the action of gravity prior to setting hard [19].
Figure 6. Schematic drawing for injection bolt in a double lap joint, from [14] and [15].
(a) (b)
hard [19].
Figure 6. Schematic drawing for injection bolt in a double lap joint, from [14] and [15].
Injection hole Chamfered washer
Resin
Air escape groove in the washer
ACC
EPTE
D M
ANU
SCR
IPT
ACCEPTED MANUSCRIPT
12
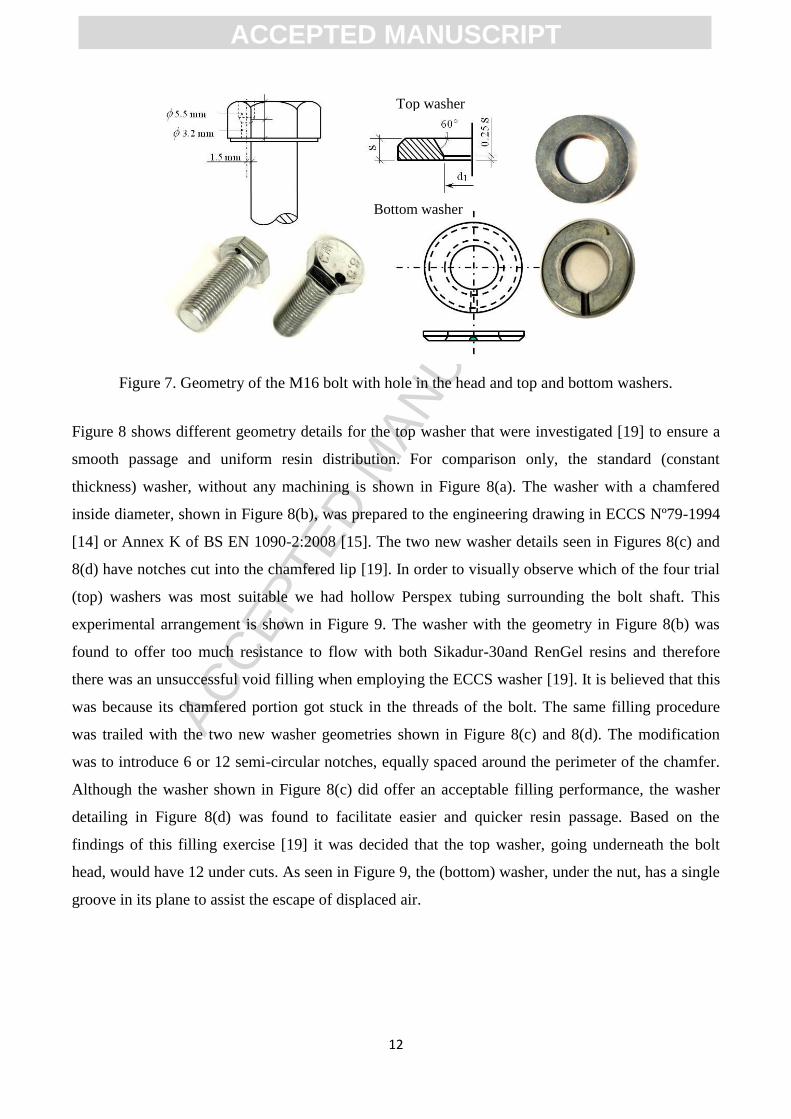
Figure 7. Geometry of the M16 bolt with hole in the head and top and bottom washers.
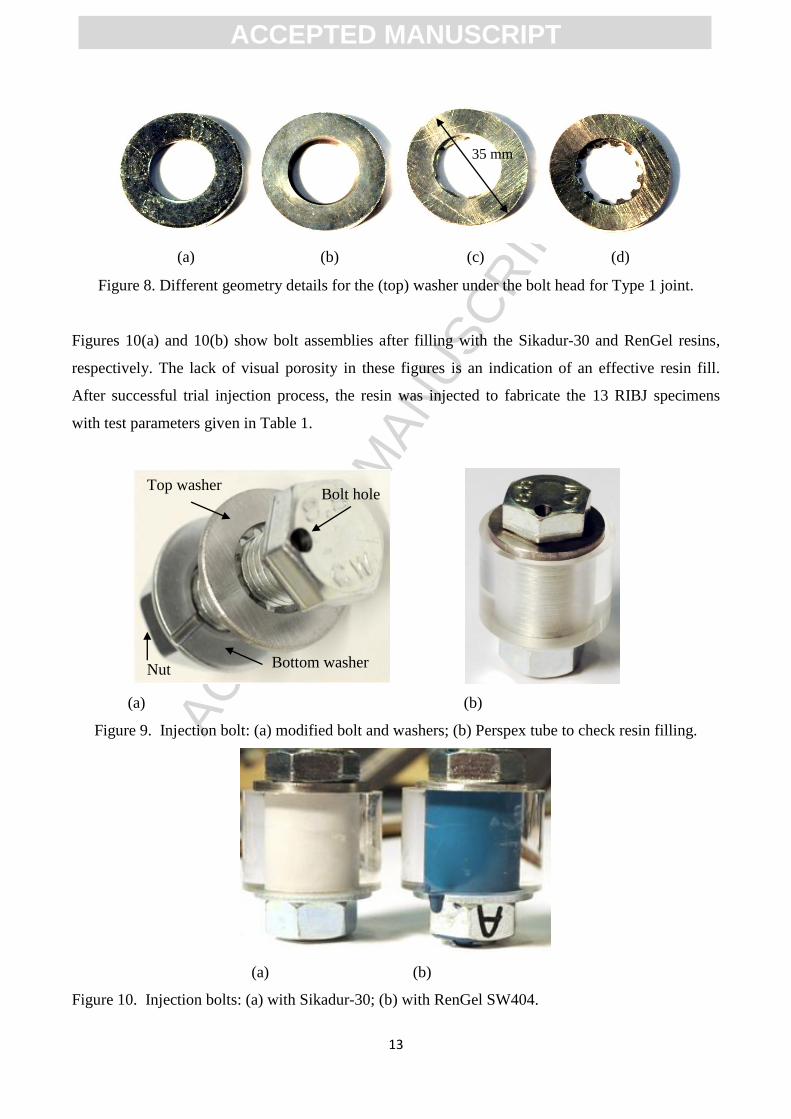
Figure 8 shows different geometry details for the top washer that were investigated [19] to ensure a
smooth passage and uniform resin distribution. For comparison only, the standard (constant
thickness) washer, without any machining is shown in Figure 8(a). The washer with a chamfered
inside diameter, shown in Figure 8(b), was prepared to the engineering drawing in ECCS Nº79-1994
[14] or Annex K of BS EN 1090-2:2008 [15]. The two new washer details seen in Figures 8(c) and
8(d) have notches cut into the chamfered lip [19]. In order to visually observe which of the four trial
(top) washers was most suitable we had hollow Perspex tubing surrounding the bolt shaft. This
experimental arrangement is shown in Figure 9. The washer with the geometry in Figure 8(b) was
found to offer too much resistance to flow with both Sikadur-30and RenGel resins and therefore
there was an unsuccessful void filling when employing the ECCS washer [19]. It is believed that this
was because its chamfered portion got stuck in the threads of the bolt. The same filling procedure
was trailed with the two new washer geometries shown in Figure 8(c) and 8(d). The modification
was to introduce 6 or 12 semi-circular notches, equally spaced around the perimeter of the chamfer.
Although the washer shown in Figure 8(c) did offer an acceptable filling performance, the washer
detailing in Figure 8(d) was found to facilitate easier and quicker resin passage. Based on the
findings of this filling exercise [19] it was decided that the top washer, going underneath the bolt
head, would have 12 under cuts. As seen in Figure 9, the (bottom) washer, under the nut, has a single
groove in its plane to assist the escape of displaced air.
Top washer
Bottom washer
ACC
EPTE
D M
ANU
SCR
IPT
ACCEPTED MANUSCRIPT
13
Figure 8. Different geometry details for the (top) washer under the bolt head for Type 1 joint.
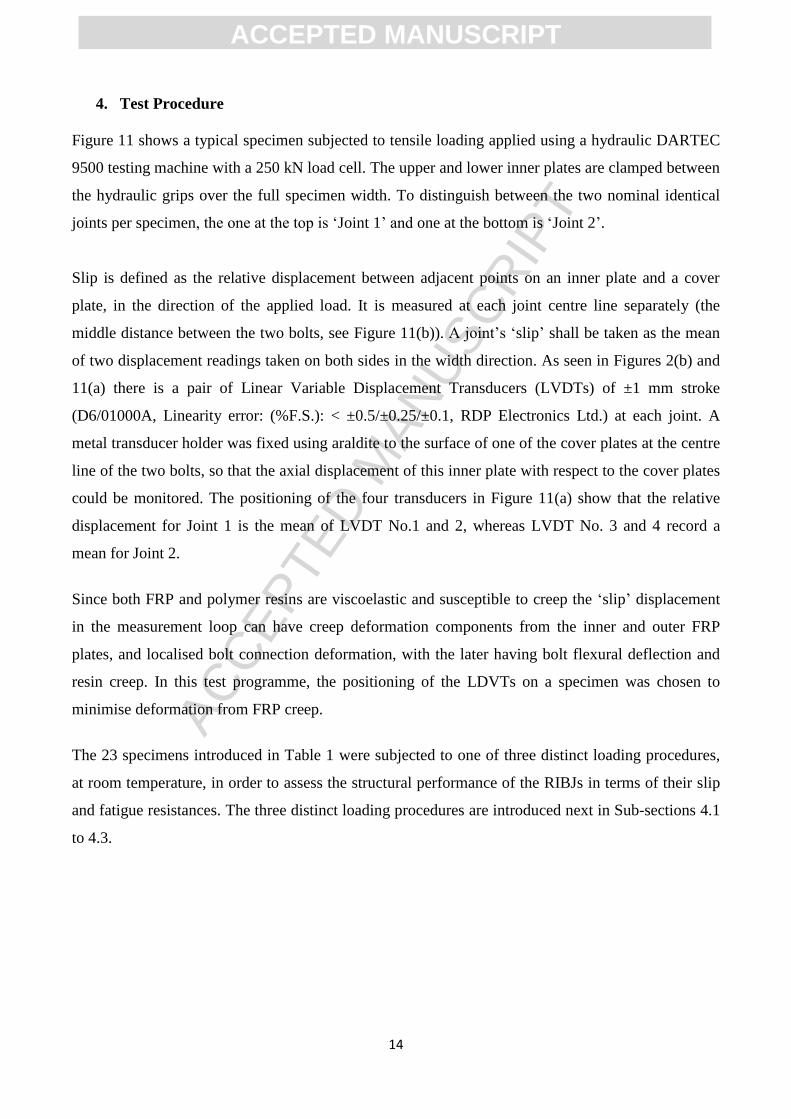
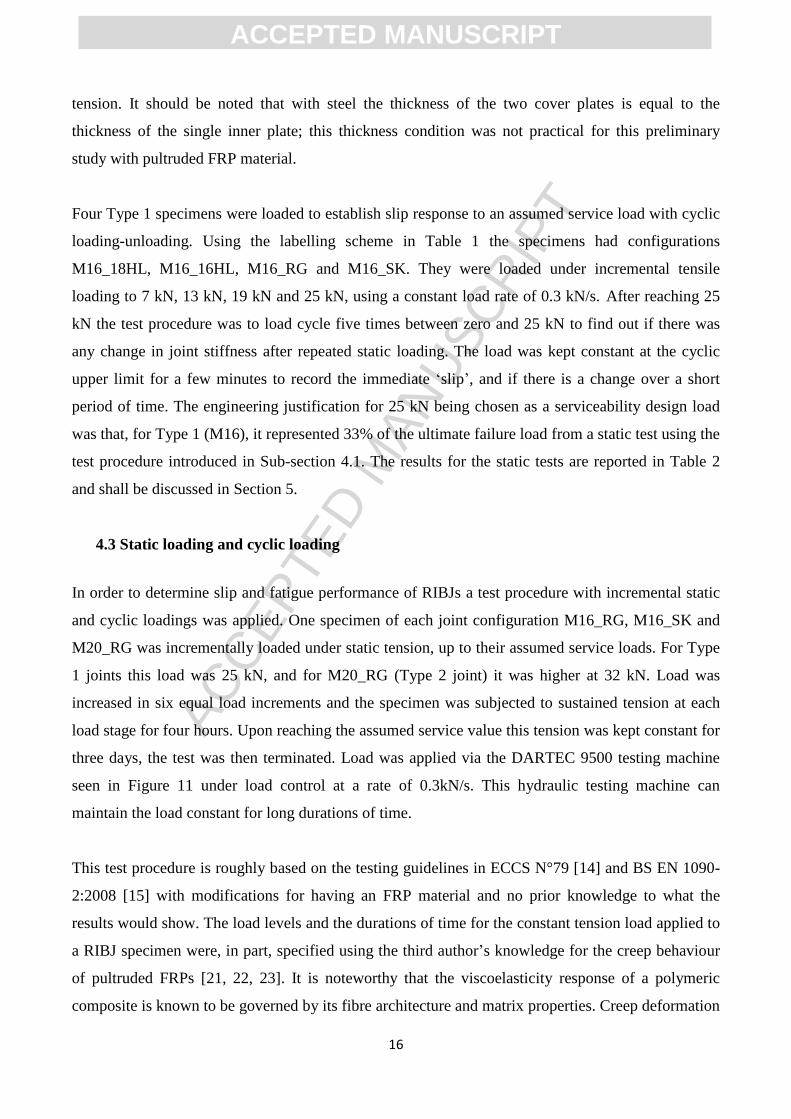
Figures 10(a) and 10(b) show bolt assemblies after filling with the Sikadur-30 and RenGel resins,
respectively. The lack of visual porosity in these figures is an indication of an effective resin fill.
After successful trial injection process, the resin was injected to fabricate the 13 RIBJ specimens
with test parameters given in Table 1.
(a) (b)
Figure 9. Injection bolt: (a) modified bolt and washers; (b) Perspex tube to check resin filling.
(a) (b)
Figure 10. Injection bolts: (a) with Sikadur-30; (b) with RenGel SW404.
(a) (b) (c) (d)
Bottom washer
Top washer Bolt hole
Nut
35 mm
ACC
EPTE
D M
ANU
SCR
IPT
ACCEPTED MANUSCRIPT
14
4. Test Procedure
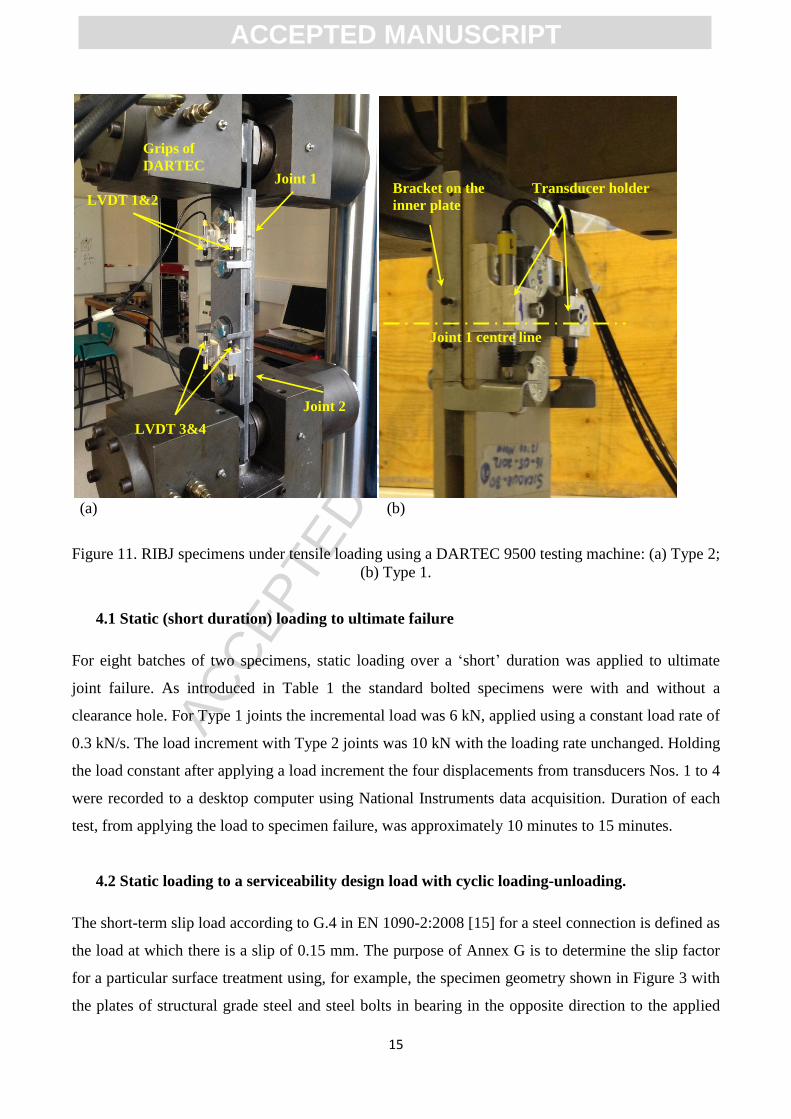
Figure 11 shows a typical specimen subjected to tensile loading applied using a hydraulic DARTEC
9500 testing machine with a 250 kN load cell. The upper and lower inner plates are clamped between
the hydraulic grips over the full specimen width. To distinguish between the two nominal identical
joints per specimen, the one at the top is ‘Joint 1’ and one at the bottom is ‘Joint 2’.
Slip is defined as the relative displacement between adjacent points on an inner plate and a cover
plate, in the direction of the applied load. It is measured at each joint centre line separately (the
middle distance between the two bolts, see Figure 11(b)). A joint’s ‘slip’ shall be taken as the mean
of two displacement readings taken on both sides in the width direction. As seen in Figures 2(b) and
11(a) there is a pair of Linear Variable Displacement Transducers (LVDTs) of ±1 mm stroke
(D6/01000A, Linearity error: (%F.S.): < ±0.5/±0.25/±0.1, RDP Electronics Ltd.) at each joint. A
metal transducer holder was fixed using araldite to the surface of one of the cover plates at the centre
line of the two bolts, so that the axial displacement of this inner plate with respect to the cover plates
could be monitored. The positioning of the four transducers in Figure 11(a) show that the relative
displacement for Joint 1 is the mean of LVDT No.1 and 2, whereas LVDT No. 3 and 4 record a
mean for Joint 2.
Since both FRP and polymer resins are viscoelastic and susceptible to creep the ‘slip’ displacement
in the measurement loop can have creep deformation components from the inner and outer FRP
plates, and localised bolt connection deformation, with the later having bolt flexural deflection and
resin creep. In this test programme, the positioning of the LDVTs on a specimen was chosen to
minimise deformation from FRP creep.
The 23 specimens introduced in Table 1 were subjected to one of three distinct loading procedures,
at room temperature, in order to assess the structural performance of the RIBJs in terms of their slip
and fatigue resistances. The three distinct loading procedures are introduced next in Sub-sections 4.1
to 4.3.
ACC
EPTE
D M
ANU
SCR
IPT
ACCEPTED MANUSCRIPT
15
(a) (b)
Figure 11. RIBJ specimens under tensile loading using a DARTEC 9500 testing machine: (a) Type 2;
(b) Type 1.
4.1 Static (short duration) loading to ultimate failure
For eight batches of two specimens, static loading over a ‘short’ duration was applied to ultimate
joint failure. As introduced in Table 1 the standard bolted specimens were with and without a
clearance hole. For Type 1 joints the incremental load was 6 kN, applied using a constant load rate of
0.3 kN/s. The load increment with Type 2 joints was 10 kN with the loading rate unchanged. Holding
the load constant after applying a load increment the four displacements from transducers Nos. 1 to 4
were recorded to a desktop computer using National Instruments data acquisition. Duration of each
test, from applying the load to specimen failure, was approximately 10 minutes to 15 minutes.
4.2 Static loading to a serviceability design load with cyclic loading-unloading.
The short-term slip load according to G.4 in EN 1090-2:2008 [15] for a steel connection is defined as
the load at which there is a slip of 0.15 mm. The purpose of Annex G is to determine the slip factor
for a particular surface treatment using, for example, the specimen geometry shown in Figure 3 with
the plates of structural grade steel and steel bolts in bearing in the opposite direction to the applied
Transducer holder
Joint 1 centre line
Bracket on the
inner plate
Grips of
DARTEC
LVDT 1&2
Joint 1
Joint 2
LVDT 3&4
ACC
EPTE
D M
ANU
SCR
IPT
ACCEPTED MANUSCRIPT
16
tension. It should be noted that with steel the thickness of the two cover plates is equal to the
thickness of the single inner plate; this thickness condition was not practical for this preliminary
study with pultruded FRP material.
Four Type 1 specimens were loaded to establish slip response to an assumed service load with cyclic
loading-unloading. Using the labelling scheme in Table 1 the specimens had configurations
M16_18HL, M16_16HL, M16_RG and M16_SK. They were loaded under incremental tensile
loading to 7 kN, 13 kN, 19 kN and 25 kN, using a constant load rate of 0.3 kN/s. After reaching 25
kN the test procedure was to load cycle five times between zero and 25 kN to find out if there was
any change in joint stiffness after repeated static loading. The load was kept constant at the cyclic
upper limit for a few minutes to record the immediate ‘slip’, and if there is a change over a short
period of time. The engineering justification for 25 kN being chosen as a serviceability design load
was that, for Type 1 (M16), it represented 33% of the ultimate failure load from a static test using the
test procedure introduced in Sub-section 4.1. The results for the static tests are reported in Table 2
and shall be discussed in Section 5.
4.3 Static loading and cyclic loading
In order to determine slip and fatigue performance of RIBJs a test procedure with incremental static
and cyclic loadings was applied. One specimen of each joint configuration M16_RG, M16_SK and
M20_RG was incrementally loaded under static tension, up to their assumed service loads. For Type
1 joints this load was 25 kN, and for M20_RG (Type 2 joint) it was higher at 32 kN. Load was
increased in six equal load increments and the specimen was subjected to sustained tension at each
load stage for four hours. Upon reaching the assumed service value this tension was kept constant for
three days, the test was then terminated. Load was applied via the DARTEC 9500 testing machine
seen in Figure 11 under load control at a rate of 0.3kN/s. This hydraulic testing machine can
maintain the load constant for long durations of time.
This test procedure is roughly based on the testing guidelines in ECCS N°79 [14] and BS EN 1090-
2:2008 [15] with modifications for having an FRP material and no prior knowledge to what the
results would show. The load levels and the durations of time for the constant tension load applied to
a RIBJ specimen were, in part, specified using the third author’s knowledge for the creep behaviour
of pultruded FRPs [21, 22, 23]. It is noteworthy that the viscoelasticity response of a polymeric
composite is known to be governed by its fibre architecture and matrix properties. Creep deformation

ACC
EPTE
D M
ANU
SCR
IPT
ACCEPTED MANUSCRIPT
17
will be a minimum in the RIBJ specimens because the pultruded FRP plates have their unidirectional
roving reinforcement parallel to the tension action. Our understanding is that after 3 days (72 hours),
and any constant stress, about 80% of the maximum long-term creep deformation would have
occurred. The rate of the creep increasing is known to decay exponentially, and that, even after a few
days, it can appear to an observer that there is no discernible increase in structural deformation [21].
Consequently, the time in the test procedure for the long duration static loading, given in the clause
G.4 of Annex G of BS EN 1090-2:2008 [15], has been extended from 3 hours and 5 minutes to a
total of 4 days (with 3 days at constant load). It is worth taking into consideration that according to
the clause G.5 of the same Annex the “displacement – log time curve” may be extrapolated to
demonstrate the long-term characterisation work and it is more convenient to plot such a curve, with
sufficient accuracy, using longer duration test results.
After a sustained static loading (one day for loading stages and three days at constant stress) of 96
hours an RIBJ specimen was subjected to 2 million fatigue cycles at a relatively low frequency of 2
Hz. A fatigue loading procedure takes 12 days to complete. The stress ratio was 0.1. As an example a
load range is given by lower and upper tension limits of 3.2 and 32 kN, where 32 kN is for the Type
2 joint assumed service load and the lower value is prescribed by the Rσ ratio. The justification for
choosing Rσ equal to 0.1 (tension-tension) is to have a relatively high tension stress range so that
interaction between fatigue and creep is most severe. In other words because there is no stress
reversal the viscoelasticity response cannot include relaxation and the low frequency will enhance
creep deformation [7].
A cyclic frequency much less than 10 Hz is common when applying fatigue loading on FRP material
because the testing machine’s grips must accommodate high amplitudes in movement and
viscoelasticity hysteresis can cause heat energy and a temperature build-up to be avoided. The
relationship between the number of cycles and the displacement/creep response of the two joints per
specimen was recorded using the four LVDTs (see Figure 11) in real time. Following the first 2
million fatigue cycles, testing continued with a similar test procedure for at least one or two more
load stages with an increased maximum tension force and Rσ = 0.1. Because the loading stages were
specific to a RIBJ specimen further discussion is given, separately, in Section 5, when the new test
results are presented and discussed. One reason that the loading procedure was specimen dependent
is that the authors gained knowledge and understanding as the test series progressed.
ACC
EPTE
D M
ANU
SCR
IPT
ACCEPTED MANUSCRIPT
18
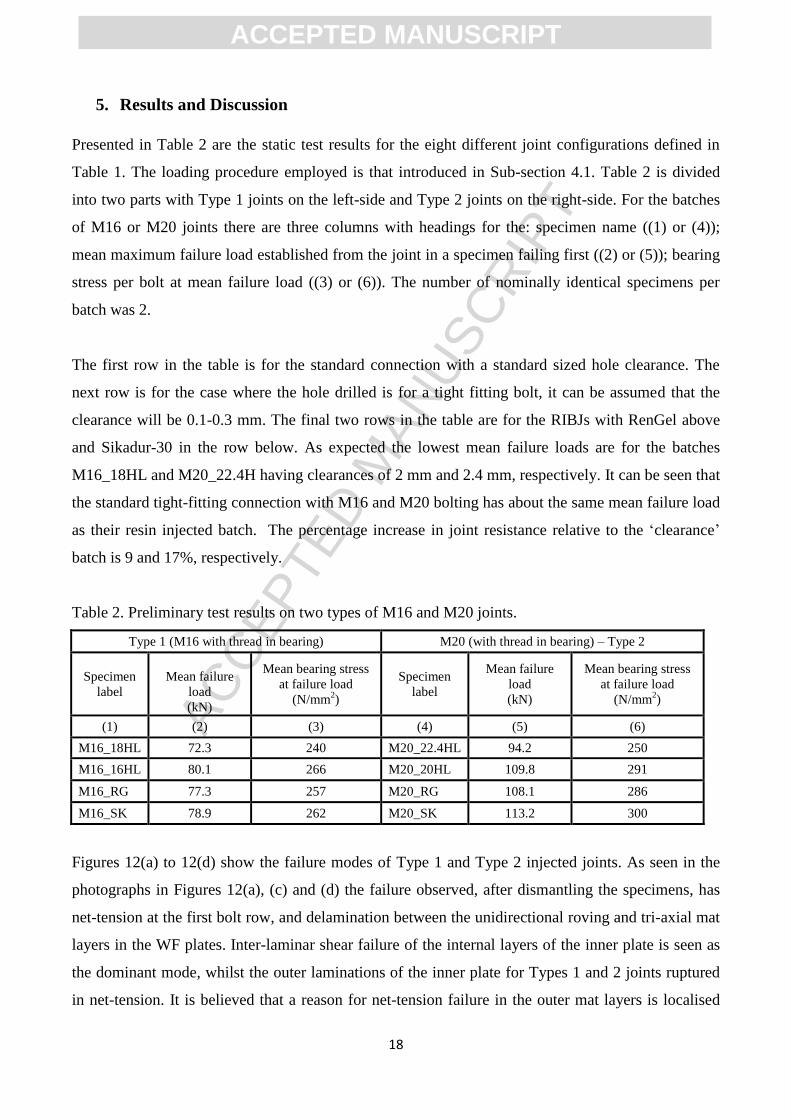
5. Results and Discussion
Presented in Table 2 are the static test results for the eight different joint configurations defined in
Table 1. The loading procedure employed is that introduced in Sub-section 4.1. Table 2 is divided
into two parts with Type 1 joints on the left-side and Type 2 joints on the right-side. For the batches
of M16 or M20 joints there are three columns with headings for the: specimen name ((1) or (4));
mean maximum failure load established from the joint in a specimen failing first ((2) or (5)); bearing
stress per bolt at mean failure load ((3) or (6)). The number of nominally identical specimens per
batch was 2.
The first row in the table is for the standard connection with a standard sized hole clearance. The
next row is for the case where the hole drilled is for a tight fitting bolt, it can be assumed that the
clearance will be 0.1-0.3 mm. The final two rows in the table are for the RIBJs with RenGel above
and Sikadur-30 in the row below. As expected the lowest mean failure loads are for the batches
M16_18HL and M20_22.4H having clearances of 2 mm and 2.4 mm, respectively. It can be seen that
the standard tight-fitting connection with M16 and M20 bolting has about the same mean failure load
as their resin injected batch. The percentage increase in joint resistance relative to the ‘clearance’
batch is 9 and 17%, respectively.
Table 2. Preliminary test results on two types of M16 and M20 joints.
Type 1 (M16 with thread in bearing) M20 (with thread in bearing) – Type 2
Specimen
label
Mean failure
load
(kN)
Mean bearing stress
at failure load
(N/mm2)
Specimen
label
Mean failure
load
(kN)
Mean bearing stress
at failure load
(N/mm2)
(1) (2) (3) (4) (5) (6)
M16_18HL 72.3 240 M20_22.4HL 94.2 250
M16_16HL 80.1 266 M20_20HL 109.8 291
M16_RG 77.3 257 M20_RG 108.1 286
M16_SK 78.9 262 M20_SK 113.2 300
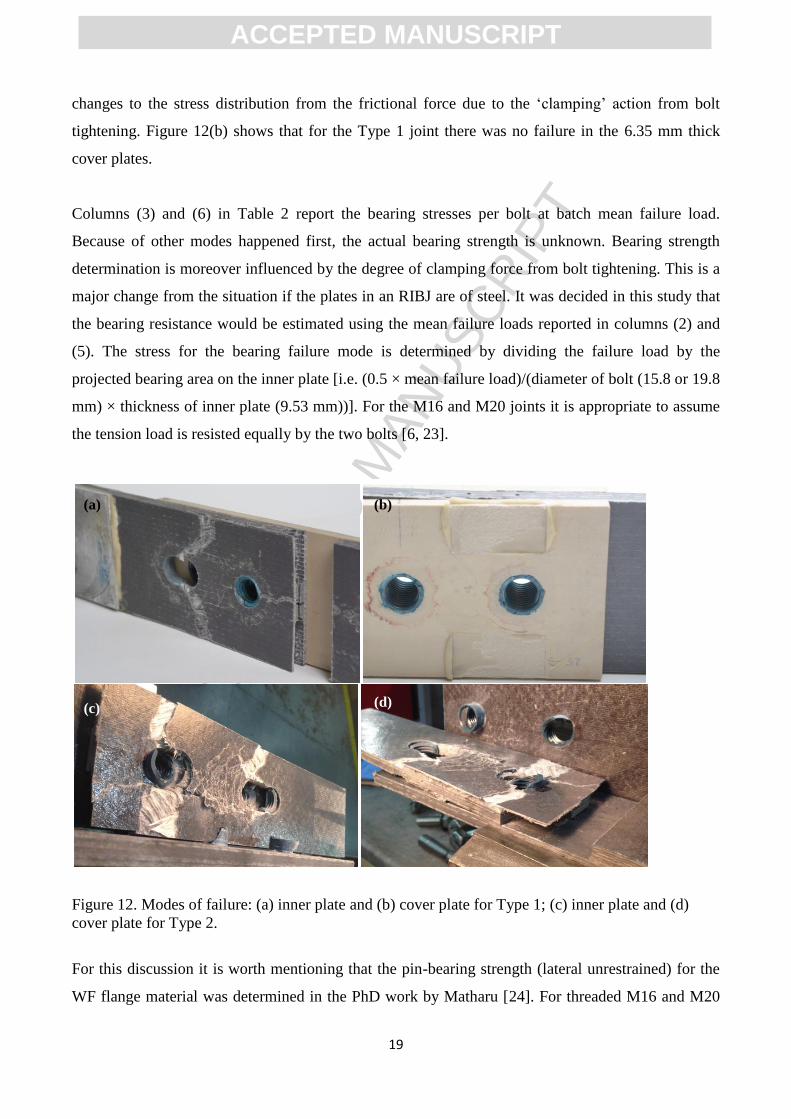
Figures 12(a) to 12(d) show the failure modes of Type 1 and Type 2 injected joints. As seen in the
photographs in Figures 12(a), (c) and (d) the failure observed, after dismantling the specimens, has
net-tension at the first bolt row, and delamination between the unidirectional roving and tri-axial mat
layers in the WF plates. Inter-laminar shear failure of the internal layers of the inner plate is seen as
the dominant mode, whilst the outer laminations of the inner plate for Types 1 and 2 joints ruptured
in net-tension. It is believed that a reason for net-tension failure in the outer mat layers is localised
ACC
EPTE
D M
ANU
SCR
IPT
ACCEPTED MANUSCRIPT
19
changes to the stress distribution from the frictional force due to the ‘clamping’ action from bolt
tightening. Figure 12(b) shows that for the Type 1 joint there was no failure in the 6.35 mm thick
cover plates.
Columns (3) and (6) in Table 2 report the bearing stresses per bolt at batch mean failure load.
Because of other modes happened first, the actual bearing strength is unknown. Bearing strength
determination is moreover influenced by the degree of clamping force from bolt tightening. This is a
major change from the situation if the plates in an RIBJ are of steel. It was decided in this study that
the bearing resistance would be estimated using the mean failure loads reported in columns (2) and
(5). The stress for the bearing failure mode is determined by dividing the failure load by the
projected bearing area on the inner plate [i.e. (0.5 × mean failure load)/(diameter of bolt (15.8 or 19.8
mm) × thickness of inner plate (9.53 mm))]. For the M16 and M20 joints it is appropriate to assume
the tension load is resisted equally by the two bolts [6, 23].
Figure 12. Modes of failure: (a) inner plate and (b) cover plate for Type 1; (c) inner plate and (d)
cover plate for Type 2.
For this discussion it is worth mentioning that the pin-bearing strength (lateral unrestrained) for the
WF flange material was determined in the PhD work by Matharu [24]. For threaded M16 and M20
(a) (b)
(c) (d)
ACC
EPTE
D M
ANU
SCR
IPT
ACCEPTED MANUSCRIPT
20
bolting and clearance holes of 1.6 mm and 2.4 mm, the mean strengths he determined from batches
of ten specimens were 161 N/mm2 and 141 N/mm
2 [24]. Making a comparison with the results from
batches M16_18HL and M20_22.4 HL in columns (3) and (6) in Table 2 reveals that the bearing
stress at joint failure is higher by 32% and 43%. This increase can be attributed to the positive effect
of clamping, and because of the percentage increase is up to 40% it is not unreasonable to propose
that initiation of bearing failure could have been the ultimate failure mode in an RIBJ specimen.
If it is assumed that had there been no bolt tightening the pin-bearing strengths for joint
configurations M16_RG and M16_SK can be 250-260 N/mm2 reduced by 32%, and for M20_RG
and 20_SK they would be 280-300 N/mm2 reduced by 43%. Estimates for these pin-bearing
strengths are therefore 170-177 N/mm2 for Type 1 and 160-171 N/mm
2 for Type 2.
Using the test procedure introduced in Section 4.2 the second series of tests determined ‘slip’
resistance and the slip load for a single specimen of the four Type 1 joints M16_18HL, M16_16HL,
M16_SK and M16_RG. A serviceability design (working service) load had to be established, starting
with the mean failure load of 72.3kN from the M16_18HL batch. By deciding that a pragmatic
choice would be 1/3rd
of the mean failure load for M16_18HL the testing was carried out with an
upper load of 25 kN (from 72.3/3 = 24.1 ≈ 25 kN).
When the displacement at Joint 1 or Joint 2 is presented in a plot it is the mean of the readings from
the two LVDTs located on that joint. Details of the test method are given in Section 3 and the set-up
is seen in the photograph for Figure 11(a).
Plotted in Figures 13(a) and 13(b) are the (Joint 1) load-displacement curves for standard M16 joints
with and without clearance hole. To allow a direct comparison by inspection the axes have the same
scale. To find the slip load a vertical solid blue line is drawn for a ‘slip’ displacement of 0.15 mm
(BS EN1090-2:2008). The curve in Figure 13(a) shows that with the 2 mm clearances there will be
significant slippage once a certain load level has been reached. The slip loads are found to be 11.5
kN for Joint 1 (results shown in 13(a)) and 10.2 kN for Joint 2. Slip loads are identified in the plots
by a horizontal blue dashed line. The final slip displacement is 3 mm (bolt is in full bearing with
inner and cover plates) after the five load cycles to 25 kN using the loading programme in Sub-
section 4.2. The specimen with tight-fitting bolting (M16_16HL) exhibited, at 25 kN, limited slip of
no more than 0.3 mm. This can be seen from the curve’s characteristics in Figure 13(b). The slip load
for Joint 1 is 19 kN and for Joint 2 it is 18.2 kN.

ACC
EPTE
D M
ANU
SCR
IPT
ACCEPTED MANUSCRIPT
21
The load-displacement curves for M16_RG Joint 1 and M16_SK Joint 2 are reported in Figures
14(a) and 14(b). The plots have the same axis scales as in Figure 13 and the vertical solid blue line is
at 0.15 mm. Both RIBJs have a slip load that is greater than their assumed service load. Mean slip
was no more than 0.08 mm at 25 kN with RenGel. Tensile loading was further increased to have
displacement > 0.15 mm for the determination of the slip load in accordance with BS EN 1090-
2:2008 [15]. It was found to be 39 kN for Joint 1 and 33 kN for Joint 2 (mean of 36 kN). In Figure 14
the slip load is given by a horizontal blue dashed line. Similarly, for the Sikadur-30 specimen the slip
loads were found to be 40 kN for Joint 1 and 42 kN for Joint 2 (mean of 41 kN). When expressed as
a ratio of the mean failure load of 72.3 kN, these slip loads are at 0.45 and 0.58 higher than the force
for serviceability limit state design. The test results presented in Figures 14(a) and 14(b) confirm that
injection bolts do offer a slip resistant method of connection for FRP structures.
0
10
20
30
40
50
0.0 0.5 1.0 1.5 2.0 2.5 3.0 3.5 4.0
Loa
d (
kN
)
Displacement at Joint 1 (mm)
0
10
20
30
40
50
0.0 0.5 1.0 1.5 2.0 2.5 3.0 3.5 4.0
Loa
d (
kN
)
Displacement at Joint 1 (mm)
Figure 13. Load-slip curves for: (a) M16_18HL (Joint 1); (b) M16_16HL (Joint 1).
0
10
20
30
40
50
0.0 0.5 1.0 1.5 2.0 2.5 3.0 3.5 4.0
Loa
d (
kN
)
Displacement at Joint 1 (mm)
0
10
20
30
40
50
0.0 0.5 1.0 1.5 2.0 2.5 3.0 3.5 4.0
Loa
d (
kN
)
Displacement at Joint 2 (mm)
Figure 14. Load-displacement curves for: (a) M16_RG Joint 1; (b) M16_SK Joint 2.
The main part to the series of tests to be reported, evaluated and discussed is for the cyclic loading
procedure introduced in Sub-section 4.3. To characterise both static creep and cyclic fatigue
M16_18HL_Joint 1 M16_16HL_Joint 1
M16_RG_Joint 1 M16_SK_Joint 2
ACC
EPTE
D M
ANU
SCR
IPT
ACCEPTED MANUSCRIPT
22
performances of RIBJs the testing was conducted with a single specimen for joint configurations
M16_RG, M16_SK and M20_RG. Each specimen was subjected to an incremental loading with
static and cyclic load stages, starting at the assumed service load of 25 kN for Type 1 (M16) and of
32 kN for Type 2 (M20) joints. As with Type 1, the assumed service load for Type 2 is taken to be
33% of the mean failure load for the M20_22.4HL batch reported in Table 2. The load is therefore
established by 94.2/3 = 31.4 ≈ 32 kN.
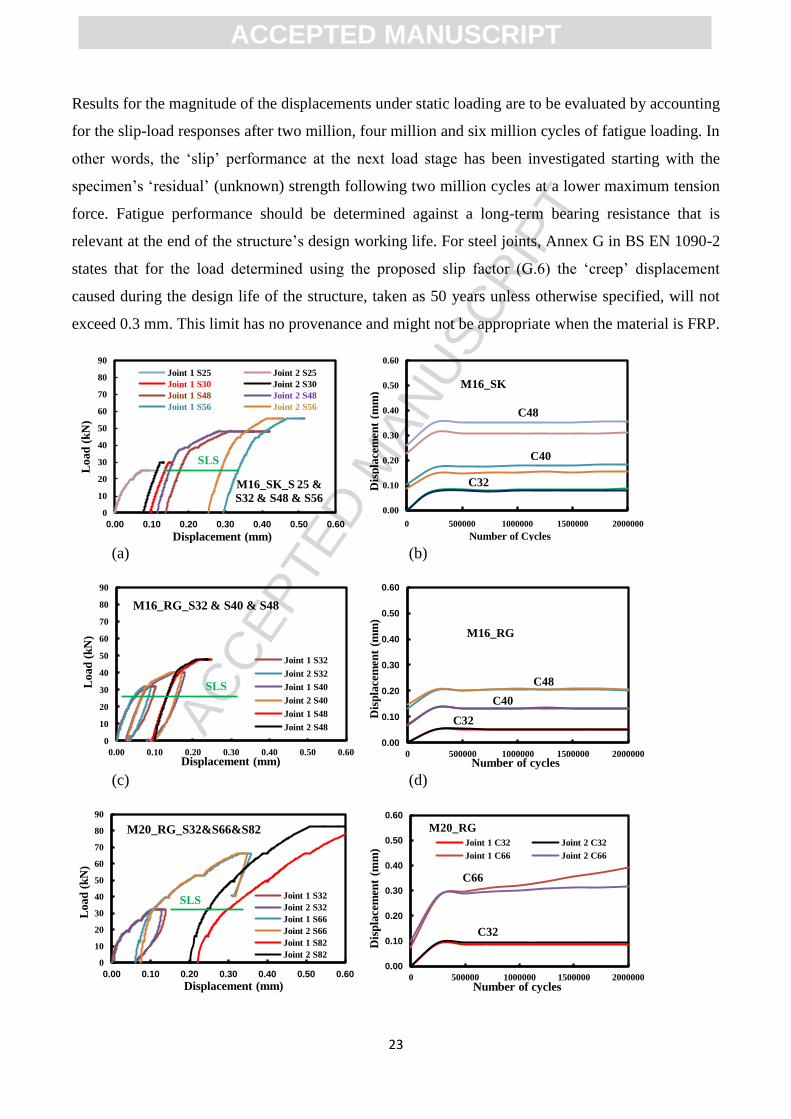
Figures 15(a) to 15(f) are plots for the load-displacement or displacement-number of cycles test
results for specimen configurations M16_RG, M16_SK and M20_RG. These six figures have, at
each load level, a pair of curves for Joints 1 and 2. Figures 15(a), 15(c) and 15(e) present load-
displacement curves for an increasing static load. A horizontal solid green line with label SLS is for
the assumed Serviceability (Limit State) load. In these figure parts the static loads have prefix ‘S’.
Figures 15(b), 15(d) and 15(f) present changes in displacements with number of cycles for three (or
two) stages of 2 million cycles of fatigue loading. The cyclic loads have prefix ‘C’ and the following
number is for the maximum tensile force (in kN) in the fatigue cycle with stress ratio Rσ = 0.1.
Because of the preliminary nature of this test series the load stages were modified as the testing
progressed and this is one reason why there are marked differences found when comparing the
results presented in Figure 15 for the three different RIBJ specimens. Figure 15(a) shows that with
M16_SK the static load increments were 25 kN (33%) to 32 kN (44%), 48 kN (66%) and 56 kN
(77%). The values in brackets are for the loads as a percentage of the mean failure load (i.e. is 72.3
kN from Table 1) for the standard bolted joint with hole clearance (M16_HL18). Fatigue testing had
different upper limits with C40 and C48.
When characterising M16_RG (Figure 15(c)) the first load was, at 32 kN, higher by 6 kN than the
assumed service load. This load is about 41% of the mean failure load and the two higher loads were
set at 40 kN (51%) and 48 kN (62%). Fatigue testing was with the same three load levels; i.e. C32,
C40 and C48.
Finally, for the single Type 2 specimen M20_RG, Figure 15(e) shows there were three load levels of
32 kN (33%), 66 kN (71%) and 82 kN (89%). Fatigue testing was only practical for the two loads
of C32 and C66.
ACC
EPTE
D M
ANU
SCR
IPT
ACCEPTED MANUSCRIPT
23
Results for the magnitude of the displacements under static loading are to be evaluated by accounting
for the slip-load responses after two million, four million and six million cycles of fatigue loading. In
other words, the ‘slip’ performance at the next load stage has been investigated starting with the
specimen’s ‘residual’ (unknown) strength following two million cycles at a lower maximum tension
force. Fatigue performance should be determined against a long-term bearing resistance that is
relevant at the end of the structure’s design working life. For steel joints, Annex G in BS EN 1090-2
states that for the load determined using the proposed slip factor (G.6) the ‘creep’ displacement
caused during the design life of the structure, taken as 50 years unless otherwise specified, will not
exceed 0.3 mm. This limit has no provenance and might not be appropriate when the material is FRP.
(a) (b)
(c) (d)
0
10
20
30
40
50
60
70
80
90
0.00 0.10 0.20 0.30 0.40 0.50 0.60
M16_SK_S 25 &
S32 & S48 & S56
Joint 1 S25 Joint 2 S25
Joint 1 S30 Joint 2 S30
Joint 1 S48 Joint 2 S48
Joint 1 S56 Joint 2 S56
Displacement (mm)
Load
(k
N)
0.00
0.10
0.20
0.30
0.40
0.50
0.60
0 500000 1000000 1500000 2000000
M16_SK
Number of Cycles
Dis
pla
cem
ent
(mm
)
C32
C40
0
10
20
30
40
50
60
70
80
90
0.00 0.10 0.20 0.30 0.40 0.50 0.60
M16_RG_S32 & S40 & S48
Joint 1 S32
Joint 2 S32
Joint 1 S40
Joint 2 S40
Joint 1 S48
Joint 2 S48
Displacement (mm)
Load
(k
N)
SLS
0.00
0.10
0.20
0.30
0.40
0.50
0.60
0 500000 1000000 1500000 2000000
M16_RG
Number of cycles
Dis
pla
cem
ent
(mm
)
C32
C40
C48
0
10
20
30
40
50
60
70
80
90
0.00 0.10 0.20 0.30 0.40 0.50 0.60
M20_RG_S32&S66&S82
Joint 1 S32
Joint 2 S32
Joint 1 S66
Joint 2 S66
Joint 1 S82
Joint 2 S82
Displacement (mm)
Load
(k
N)
SLS
0.00
0.10
0.20
0.30
0.40
0.50
0.60
0 500000 1000000 1500000 2000000
M20_RG
Joint 1 C32 Joint 2 C32
Joint 1 C66 Joint 2 C66
Number of cycles
Dis
pla
cem
ent
(mm
)
C32
C66
SLS
C48

ACC
EPTE
D M
ANU
SCR
IPT
ACCEPTED MANUSCRIPT
24
(e) (f)
Figure 15. Plots of load-displacement and displacement-number of cycles: (a) and (b) for M16_RG;
(c) and (d) for M16_SK; (e) and (f) M20_RG.
Our analysis and discussion of the RIBJ results will first concentrate on those from static testing. The
measured joint displacements under increased tension held constant for ‘96 hours’ are reported in
Tables 3 to 5. In these tables column (1) gives the specimen label and Joint number, and column (2)
defines the static tension load. The third column presents the final recorded displacements at Joint 1
and Joint 2.
Table 3. Displacements for Joints 1 and 2 for M16_SK after four days of tensile loading.
Specimen Tension
(kN)
Displacement
(mm)
(1) (2) (3)
M16_SK
Joint 1 25 0.11
Joint 2 25 0.09
Joint 1 32 0.15
Joint 2 32 0.13
Joint 1 48 0.43
Joint 2 48 0.39
Joint 1 56 0.52
Joint 2 56 0.47
Displacements for M16_SK in Table 3 show the two joints deform similarly and that on increasing
tension from 25 kN ( 33%) to 56 kN (77%) the change is from 0.10 mm to 0.50 mm. A linear
interpolation using the final displacements at 32 kN and 48 kN has been employed to find out the
missing test data at tension of 40 kN. The results indicate that at 40 kN (55%) the displacements
could be 0.29 mm for Joint 1 and 0.26 mm for Joint 2.
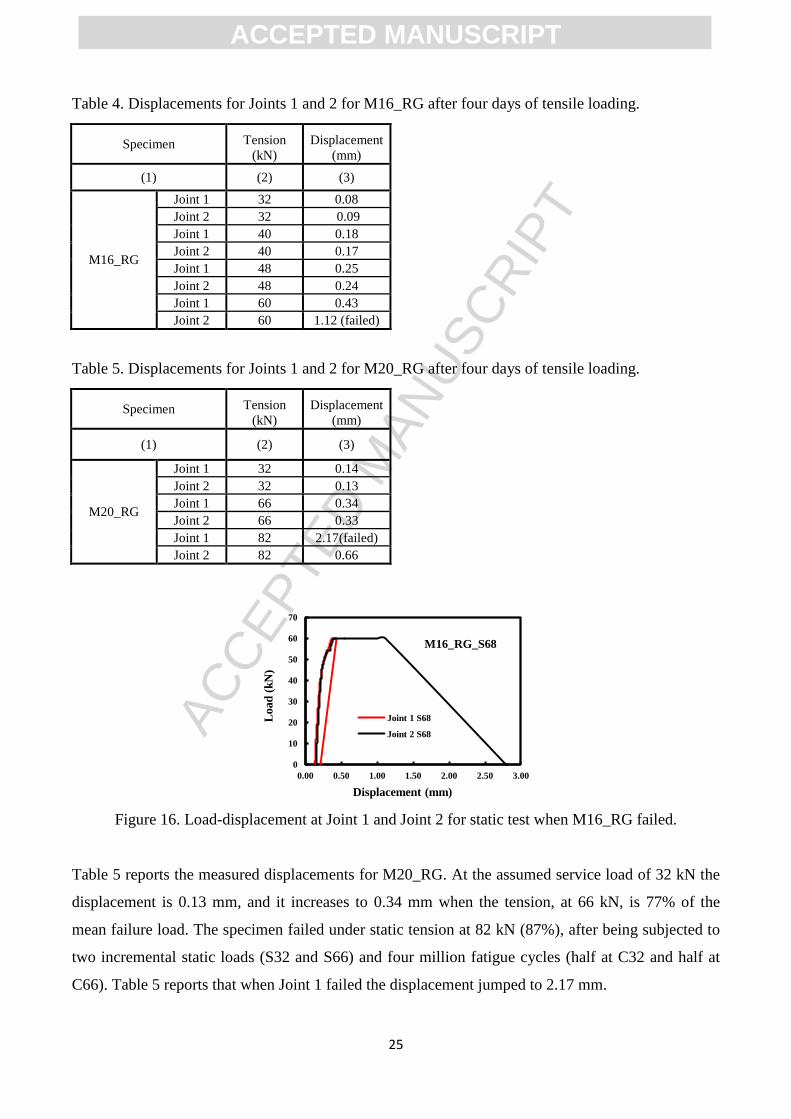
The displacements in Table 4 for M16_RG show the RenGel resin offers, for Type 1 joints, a higher
stiffness than when the RIBJ is with the Sikadur-30 resin. For a load of 48 kN (66%) the stiffness is
found to be 1.5 times higher and the maximum ‘slip’ was only 0.25 mm for Joint 1. Following the
application of the three static load levels and the six millions cycles of fatigue loading the specimen
failed under a static load test, using test procedure in Sub-section 4.1, at 60 kN (see Table 4). The
load-displacement curves for Joints 1 and 2 in Figure 16 show a gradual failure in Joint 2, when the
displacement was 1.12 mm. Figure 12(a) shows the failure mode of Joint 2 for M16_RG.
ACC
EPTE
D M
ANU
SCR
IPT
ACCEPTED MANUSCRIPT
25
Table 4. Displacements for Joints 1 and 2 for M16_RG after four days of tensile loading.
Specimen Tension
(kN)
Displacement
(mm)
(1) (2) (3)
M16_RG
Joint 1 32 0.08
Joint 2 32 0.09
Joint 1 40 0.18
Joint 2 40 0.17
Joint 1 48 0.25
Joint 2 48 0.24
Joint 1 60 0.43
Joint 2 60 1.12 (failed)
Table 5. Displacements for Joints 1 and 2 for M20_RG after four days of tensile loading.
Specimen Tension
(kN)
Displacement
(mm)
(1) (2) (3)
M20_RG
Joint 1 32 0.14
Joint 2 32 0.13
Joint 1 66 0.34
Joint 2 66 0.33
Joint 1 82 2.17(failed)
Joint 2 82 0.66
Figure 16. Load-displacement at Joint 1 and Joint 2 for static test when M16_RG failed.
Table 5 reports the measured displacements for M20_RG. At the assumed service load of 32 kN the
displacement is 0.13 mm, and it increases to 0.34 mm when the tension, at 66 kN, is 77% of the
mean failure load. The specimen failed under static tension at 82 kN (87%), after being subjected to
two incremental static loads (S32 and S66) and four million fatigue cycles (half at C32 and half at
C66). Table 5 reports that when Joint 1 failed the displacement jumped to 2.17 mm.
0
10
20
30
40
50
60
70
0.00 0.50 1.00 1.50 2.00 2.50 3.00
M16_RG_S68
Joint 1 S68
Joint 2 S68
Displacement (mm)
Load
(k
N)

ACC
EPTE
D M
ANU
SCR
IPT
ACCEPTED MANUSCRIPT
26
It can be concluded from the above discussion that the three RIBJs had displacements (for ‘slip’) that
are < 0.15 mm when they are subjected to their assumed service load, taken to be 1/3rd
of the mean
failure load for the standard bolted joint configuration with hole clearance. The range in the
displacements, after 96 hours of constant tension, is from 0.08 mm to 0.14 mm.
Let us compare the slip loads in Figures 14(a) and 14(b) for a specimen of M16_SK and M16_RG
tested with short duration static loading with the equivalent slip loads that can be obtained from
Figures 15(a) and 15(c)) for nominal identical specimens subjected to the combine static and fatigue
loading. Using the load procedure in Sub-section 4.2 the slip loads for M16_SK were 40 kN for Joint
1 and 42 kN for Joint 2. After applying the load procedure of Sub-section 4.3 the slip loads, at a
displacement of 0.15 mm, were found to be lower at 32 kN and 34 kN, respectively. The test results
for M16_RG gave the opposite trend with these slip loads found to have increased when the testing
included the fatigue loading. Currently there is no physical explanation to justify this finding.
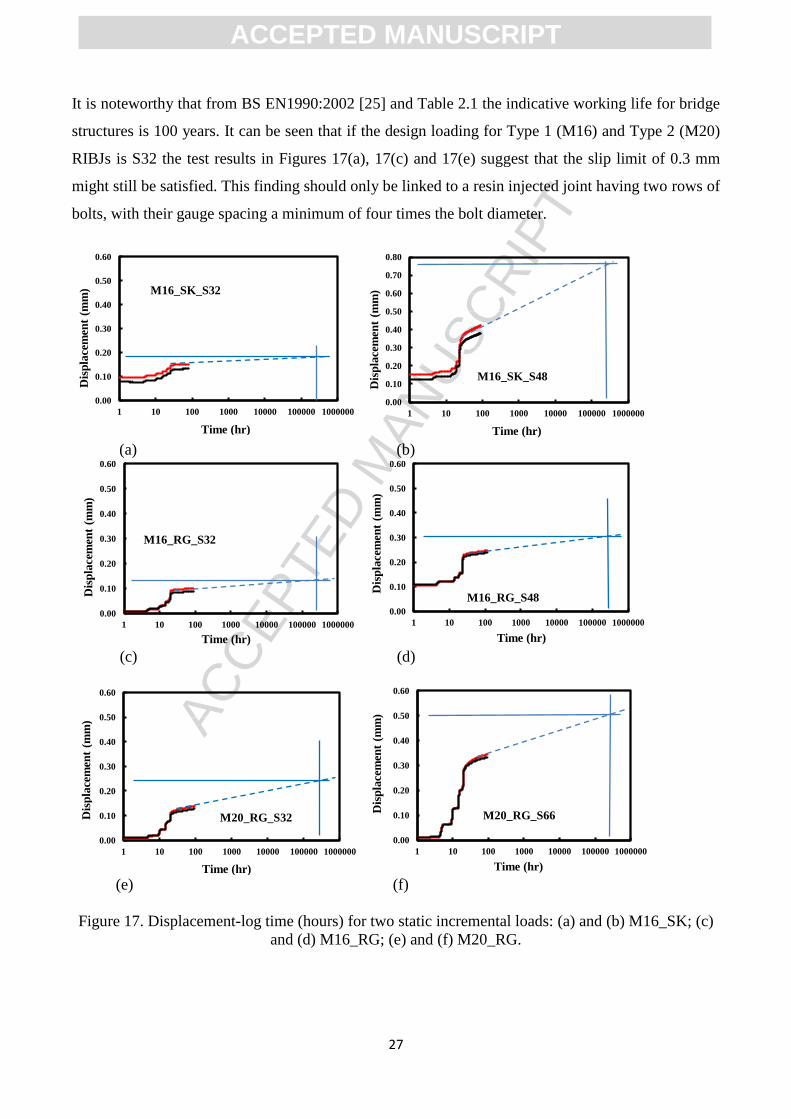
Presented in Figures 17(a) to 17(f) are displacement-log time curves for the three specimens
M16_SK, M16_RG and M20_RG at two levels of constant static load. The red and black curves are
for Joints 1 and 2, and as can be seen their results are similar and can be assumed to be the same.
According to BS EN 1090-2:2008 [15] the curve can be linearly extrapolated to find out if the life-
time displacement will not exceed 0.3 mm should the joint be subjected to its design working load
over the full service life of the structure, taken to be 50 years (or 438k hours). Figures 17(a) and
17(b) are for the M16_SK specimen with static loads of S32 (44%) and S48 (66%). By estimating
the tangent to the curves a straight line is extrapolated to 438k hours; this service life is shown in a
plot by a vertical blue solid line. Where the dashed blue line cuts this vertical line the predicted life-
time displacement can be read off, and its value is shown in the plots as the horizontal blue solid line.
For joint configuration M16_SK it can be seen that the life-time displacement for 32 kN (44%) is, at
0.19 mm, < 0.3 mm, whereas, should the service (working) load be increased to 48 kN (66%) the slip
limit of 0.3 mm is exceeded by about 0.45 mm. The equivalent slip displacements M16_RG are
presented in Figures 17(c) and 17(d), and are about 0.13 mm and 0.3 mm for the same two tension
loads. In the case of the single Type 2 joint, the results for M20_RG in Figure 17(e) and 17(f)
indicate that for loads of 32 kN ( 33%) and 66 kN (66%) the 50 year slip displacements would be
0.24 mm and 0.50 mm.
ACC
EPTE
D M
ANU
SCR
IPT
ACCEPTED MANUSCRIPT
27
It is noteworthy that from BS EN1990:2002 [25] and Table 2.1 the indicative working life for bridge
structures is 100 years. It can be seen that if the design loading for Type 1 (M16) and Type 2 (M20)
RIBJs is S32 the test results in Figures 17(a), 17(c) and 17(e) suggest that the slip limit of 0.3 mm
might still be satisfied. This finding should only be linked to a resin injected joint having two rows of
bolts, with their gauge spacing a minimum of four times the bolt diameter.
(a) (b)
(c) (d)
(e) (f)
Figure 17. Displacement-log time (hours) for two static incremental loads: (a) and (b) M16_SK; (c)
and (d) M16_RG; (e) and (f) M20_RG.
0.00
0.10
0.20
0.30
0.40
0.50
0.60
1 10 100 1000 10000 100000 1000000
M16_SK_S32
Time (hr)
Dis
pla
cem
ent
(mm
)
0.00
0.10
0.20
0.30
0.40
0.50
0.60
0.70
0.80
1 10 100 1000 10000 100000 1000000
M16_SK_S48
Time (hr)
Dis
pla
cem
ent
(mm
)
0.00
0.10
0.20
0.30
0.40
0.50
0.60
1 10 100 1000 10000 100000 1000000
M16_RG_S32
Time (hr)
Dis
pla
cem
ent
(mm
)
0.00
0.10
0.20
0.30
0.40
0.50
0.60
1 10 100 1000 10000 100000 1000000
M16_RG_S48
Time (hr)
Dis
pla
cem
ent
(mm
)
0.00
0.10
0.20
0.30
0.40
0.50
0.60
1 10 100 1000 10000 100000 1000000
M20_RG_S32
Time (hr)
Dis
pla
cem
ent
(mm
)
0.00
0.10
0.20
0.30
0.40
0.50
0.60
1 10 100 1000 10000 100000 1000000
M20_RG_S66
Time (hr)
Dis
pla
cem
ent
(mm
)

ACC
EPTE
D M
ANU
SCR
IPT
ACCEPTED MANUSCRIPT
28
We shall now return to a discussion of the importance of fatigue test results and the plots in Figures
15(b), 15 (d) and 15(f) that present how the ‘slip’ displacements at Joints 1 and 2 are altered during
cyclic loading for Rσ = 0.1 and 2 million cycles.
Curves in Figures 15(b) are for Joints 1 and 2 of an M16_SK specimen after being subjected to the
three cyclic loads of C32, C40 and C48 using the test procedure in Sub-section 4.3. The first
observation is that, after the initial shakedown period over 200k cycles, there is virtually no
displacement change over the next 1.8 million cycles. In fact, the curves show that after 500k cycles
the displacement slightly reduces and a continual constant joint stiffness suggests there is no
deterioration in the injected resin connections. It can be seen from the figure that the maximum
displacement is about 0.35 mm for C48, which at 60% of the mean failure load is going to be higher
than the design working load.
After applying a very similar load procedure to the M16_RG specimen it is observed from the
fatigue results in Figure 15(d) that both Joints 1 and 2 have an identical maximum slip of 0.19 mm.
This slip is 55% of the maximum displacement for Joint 1 in the M16_SK specimen.
With cycle load C66, equal to 77% of the mean failure load from Table 1, the slip at Joint 1 in
specimen M20_SK is about 0.40 mm. From Figure 15(f) it can be seen that there is a progressive
increase in this joint’s displacement with number of cycles above 500k, and the explanation has to be
that there is FRP material damage. At the end of the test the specimen was disassembled and the
failure observed is seen in Figures 12(c) and 12(d).
What is very promising for RIBJs to be transferred into practice is that the displacement measured
was between 0.04 and 0.09 mm when three different pultruded FRP specimens had been subjected to
the assumed service load for two millions cycles of fatigue load.
In this study the slip and fatigue performance of RIBJs with pultruded FRP has been evaluated using
the guidance found in BS EN 1090-2:2008 [15]. This standard is specific in giving consensus
technical information for the execution of steel and aluminium structures. The authors believe that
there is no major obstacle to us using the overall methodology given in the clauses to evaluate
injected bolts for FRP structures. For structural grades of steel it is known that the only contribution
to the creep deformation is from the layer of injected resin since structural steel does not creep. This
is not the situation with a polymer composite material [9, 21, 22], and so it might be necessary, on

ACC
EPTE
D M
ANU
SCR
IPT
ACCEPTED MANUSCRIPT
29
sound engineering reasons, to increase the limit on slip displacement to satisfy design for actual
working lives of up to 100 years. Although the instrumentation set-up in the test series was designed
to reduce the influence of FRP creep on the measured displacements it could not be entirely
eliminated. The authors therefore recommended that the 0.15 mm and 0.3 mm slip limits for short
(static) and life-time performance should be thoroughly analysed against the requirements for
transfer into practice. In this regards, it might be justifiable to accept a life time slip of 0.5 mm or
0.75 mm; these slips are based on the results reported in Figures 17(f) and 17(b) from testing a
M20_RG and M16_SK specimen, respectively.
6. Concluding Remarks
Evaluation of the results from a preliminary experimental study with Resin Injected Bolted Joints
(RIBJs) for pultruded Fibre Reinforced Polymer (FRP) materials has shown that this connection
method is slip and fatigue resistant. The investigation used three loading procedures for both static
and cyclic fatigue. Static strength tests were performed with standard bolted connections to provide
baseline joint strengths. Static creep and fatigue tests with injection bolted connections were
conducted to establish joint response for two epoxy resins that have properties for injected bolts. The
test series had the two steel bolt sizes of M16 and M20, and used available pultruded FRP materials
for cover and inner plates. Using a double lap shear joint configuration, 46 joints (or twenty-three
specimens) were characterised using a modified test methodology based on guidance in annexes in
BS EN 1090-2:2008. Differences in the loading procedures from the standard should not have
influenced the outcomes reported in this paper.
The structural performance of the RIBJs was determined by applying three loading procedures, and
these were:
1. Static loading of 16 specimens in batches of 2 over a short duration to joint failure (Sub-
section 4.1).
2. Static loading of two standard bolted and two RIBJs over a short duration to a joint
displacement of 0.15 mm, followed by five loading-unloading cycles to an assumed service
load that was taken to be 33% of the mean failure load for the joint configuration with
standard bolting and hole clearance (Sub-section 4.2).
ACC
EPTE
D M
ANU
SCR
IPT
ACCEPTED MANUSCRIPT
30
3. Static creep and cyclic long-term loadings of three different RIBJs, starting with the assumed
service load; this loading procedure was specimen dependent since the authors were gaining
new knowledge and understanding as the test series progressed (Sub-section 4.3).
From our evaluation of the new results the main findings can be summarised as:
The RIBJs showed much promise for application in FRP structures that have the dual design
requirements of slip and fatigue resistance.
It is found that the joint ‘slip’ displacement limits of 0.3 mm (life-time) given in the guidelines of
Annex G of BS EN 1090-2:2008 for application in steel structures might be too low for FRPs,
one reason is because polymeric materials have viscoelasticitic properties.
For the joint details studied it is estimated from the test results that 0.75 mm could be the
maximum slip displacement after 100 years under a constant service load.
There were no signs of fatigue failure after an RIBJ specimen had been subjected to four million
fatigue cycles having a stress ratio of 0.1 and a maximum tension up to 60% of the strength
(mean failure load) of the standard bolted configuration with standard hole clearance.
Although lower than the original static joint strength, the residual static strength of an RIBJ after
the fatigue loading was significantly higher (doubled) than the assumed service load, which was
chosen to be conservative with respect to what the actual working load on the joint detailing is
likely to be.
Further testing with RIBJs will be required to establish design guidance that is equivalent to that
available now for steel structures via standards EN 1090-2:2008 and EN 1993-1-8:2005.
The absence of observable material deterioration after 2 million cycles with load at the assumed
service load level is very promising in establishing a cost-effective, robust and resilient method
of connection for FRP bridge engineering. A successful proof of concept for RIBJs in FRP
structures should lead to a sustainable, simple and viable connection for FRP structures requiring
fatigue and/or slip resistance.

ACC
EPTE
D M
ANU
SCR
IPT
ACCEPTED MANUSCRIPT
31
7. Acknowledgements
The authors wish to thank EPSRC (Connections and Joints for Buildings and Bridges of Fibre
Reinforced Polymer (EP/H042628/1)) for project funding. Industry support from Access Engineering
and Design, Telford, UK and the Bridge Division of Mott MacDonald (East Croydon) is also
acknowledged. The authors would also like to express their gratitude to Mr C. Banks, Mr R. Bromley
and Mr G. Canham in the School of Engineering for providing (exceptional) technical support.
8. References
[1] Bank, L. C., Composites for construction - Structural design with FRP materials. John Wiley &
Sons, New Jersey, 2006.
[2] Godwin EW and Matthews FL. A review of the strength of joints in fibre-reinforced plastics:
Part 1. Mechanically fastened joints. Composites 11.3 (1980): 155-160.
[3] Thoppul, S. D., Finegan, J., and Gibson, R. F. 2009. Mechanics of mechanically fastened joints
in polymer-matrix composites—A review. Compos. Sci. Technol., 69, 301–329.
[4] American Association of State Highway and Transportation Officials. Standard Specifications
for Highway Bridges, 17th
Edition, 2002, Washington D.C.
[5] de Jesus AMP, da Silva JFN, Figueiredo MV, Ribeiro AS, Fernandes AA, Correia JAFO, da
Silva ALL, Maeiro JMC. Fatigue behaviour of resin-injected bolts: An experimental approach.
Iberian Conference on Fracture and Structural Integrity 2010. 17-19 March 2010, Porto, Portugal.
[6] Clarke JL (Ed.). Structural design of polymer composites - EUROCOMP design code and
handbook. S. & F. N. Spon, London, 1996, 703-718.
[7] Gresnigt AM, Sedlacek G and Paschen M. Injection bolts to repair old bridges, pp. 349-360,
(http://www.epicuro.co.uk/uploads/349.pdf) (December 22, 2012)
[8] British Standards Institution. Eurocode 3: Design of steel structures – Part 1-9: Fatigue. BS EN
1993-1-9:2005. United Kingdom.

ACC
EPTE
D M
ANU
SCR
IPT
ACCEPTED MANUSCRIPT
32
[9] Mottram, J T. Friction and load transfer in bolted joints of pultruded fibre reinforced polymer
section. 2nd International Conference on FRP Composites in Civil Engineering (CICE04), Taylor
and Francis plc, London, 2005, pp 845-850.
[10] Anonymous. The Strategy for Sustainable Construction. HM Government in Association with
Strategic Forum for Construction. June 2008. (www.berr.gov.uk/files/file46535.pdf ) (November 11,
2015)
[11] Vassilopoulos AP. Fatigue life Prediction of Composites and Composites Structures. Woodhead
Publishing Limited and CRC Press, USA, 2010.
[12] van Wingerde AM, van Delft DRV and Knudsen ES. Fatigue behaviour of bolted connections
in pultruded FRP profiles. Plastics, Rubber and Composites. 2003; 32(2): 71-76.
[13] Gresnigt AM and Stark J WB. Design of bolted connections with injection bolts. Connections
in Steel Structures III, Behaviour, Strength & Design, Proceedings of the Third International
Workshop. Trento, Italy, 29-31 May 1995, Pergamon, pp 77-87.
[14] European Convention for Constructional Steelwork (ECCS). European Recommendations for
bolted connections with injection bolts. ECCS Publication No. 79, 1994.
[15] British Standards Institution. Execution of steel structures and aluminium structures Part 2:
Technical requirements for the execution of steel structures, BS EN 1090-2:2008. United Kingdom.
[16] Pre-standard for Load and Resistance Factor Design (LRFD) of pultruded Fiber Reinforced
Polymer (FRP) structures (Final). American Composites Manufacturers Association, American
Society of Civil Engineers, November 9, 2010.
[17] The new and improved Pultex® pultrusion design manual. Creative Pultrusions Inc., Alum
Bank, PA. (www.creativepultrusions.com/library.html) (December 22, 2015).
[18] Anonymous. Strongwell design manual. Strongwell, Bristol, VA. (www.strongwell.com/)
(December 22, 2015).

ACC
EPTE
D M
ANU
SCR
IPT
ACCEPTED MANUSCRIPT
33
[19] Qureshi J and Mottram JT. Resin injected bolted connections: A step towards achieving slip-
resistant joints in FRP bridge engineering. Halliwell, S. and Whysall, C. (Eds.). Proceedings FRP
Bridges 2012, NetComposites, Chesterfield, 2012, 56-66.
[20] Smith PA, Ashby MF and Pascoe K J. Modelling clamp-up effects in composite bolted joints.
Journal of Composite Materials, 1987; 21(10): pp 878-897.
[21] Mottram JT. Short- and long-term structural properties of pultruded beam assemblies fabricated
using adhesive bonding. Compos. Struct., 1993; 25(1-4): pp 387-395.
[22] Scott DW. Lai JS. and Zureick. A-H. Creep behavior of fiber-reinforced polymeric composites:
A review of technical literature. Reinf Plast Compos J, 1995; 14(6), pp 590-617.
[23] Mottram J T. Prediction of net–tension strength for multi-row bolted connections of pultruded
material using the Hart-Smith semi-empirical modeling approach. J. Compos. Constr., 2010; 14(1),
pp 105-114.
[24] Matharu NS. Aspects of bolted connections in pultruded fibre reinforced polymer structures.
PhD thesis, The University of Warwick, September, 2014.
[25] British Standards Institution. Eurocode 0 - Basis of structural design. BS EN 1990:2002.
United Kingdom.