Embed Size (px)
Citation preview

u n i ve r s i t y o f co pe n h ag e n
Københavns Universitet
Metabolic adaptation to different protein supply in mink (Neovison vison)
Larsson, Caroline; Fink, Rikke; Matthiesen, Connie Marianne Frank; Thomsen, PrebenDybdahl; Tauson, Anne-HelenePublished in:Baltic Journal of Comparative & Clinical Systems Biology
DOI:10.7136/bjccsb.2012.2.0046
Publication date:2012
Document VersionPublisher's PDF, also known as Version of record
Citation for published version (APA):Larsson, C., Fink, R., Matthiesen, C. M. F., Thomsen, P. D., & Tauson, A-H. (2012). Metabolic adaptation todifferent protein supply in mink (Neovison vison). Baltic Journal of Comparative & Clinical Systems Biology, 2,46-67. https://doi.org/10.7136/bjccsb.2012.2.0046
Download date: 16. aug.. 2019

Metabolic adaptation to different protein supply in mink (Neovison vison)Caroline Larsson (MSc), Rikke Fink (PhD), Connie Frank Matthiesen (PhD), Preben Dybdahl Thomsen (PhD) and Anne-Helene Tauson (PhD)
Abstract Background: Strict carnivores such as the mink are considered to have limited ability to adapt protein metabolism to varied protein provision. However, some metabolic adaptation has previously been observed in lactating minks. This was further investigated in this study. Methods: quantitative metabolism (balance and respiration experiments), kit growth, and plasma amino acids concentrations and liver mass in lactating dams, as well as relative mRNA abundance of some key hepatic enzymes (qPCR) after weaning of the kits, were studied. Lactating mink dams were assigned to one of three diets [high- (HP: 60% of metabolisable energy (ME)), medium- (MP: 45% of ME), or low- (LP: 30% of ME) protein], from parturition until ten weeks post partum. Tissue samples were collected 2, 3, 4 and 10 weeks post partum. Results: Diet did not affect (P > 0.05) heat production. The protein provision was clearly reflected in the protein oxidation, and dams fed the HP diet had a higher N excretion, larger liver mass, and tended to have higher weight loss and lower estimated milk production through the four first lactation weeks. Plasma amino acid profiles and liver weights 10 weeks post partum were generally unaffected by dietary protein provision. Besides, the diets did not affect relative abundance of the studied mRNAs in hepatic tissue. Conclusion: Metabolic adaptation in lactating mink dams seems limited mainly to adjustment of liver mass, but that the relative abundance of mRNA for key gluconeogenic enzymes is unaffected by diet indicates that these animals’ capacity to regulate enzyme activity is limited. Key words: Metabolic adaptation, protein metabolism, plasma amino acids, enzyme expression, liver mass.
IntroductionStrict carnivores such as the mink (Neovison vison) are usually fed diets high in protein and low in carbohydrates. This suggests that much of the digested amino acids are used as an energy source, and that the glucose homeostasis is largely supported by gluconeogenesis. In most species, maintenance of nitrogen (N) balance when protein intake varies is achieved by a variety of adaptive mechanisms, including changes in protein oxidation and protein turnover1. This metabolic regulation, and the mechanisms promoting nitrogen conservation when low-protein diets are fed, and preventing adverse effects arising from toxic concentrations of certain non-protein amino acids, when protein consumption exceeds the requirements, is essential. However, a generally accepted view has
BJCCSB.ORG
Baltic Journal of Comparative & Clinical Systems Biologypage 46
Department of Veterinary Clinical and Animal Sciences, Faculty of Health and Medical
Sciences, University of Copenhagen,
Grønnegårdsvej 3, DK-1870 Frederiksberg
C, Denmark.
Corresponding author: Professor Anne-Helene
Tauson, e-mail: [email protected]
sProf. Anne-Helene Tauson, PhD.Animal, 6(1): 50-60, 2012. Archives of Animal Nutrition, 66(3): 237-255, 2012.
doi: 10.7136/bjccsb.2012.2.0046
PAGE 46-67
2012 VOLUME 2

been that strictly carnivorous animals with high protein requirements have a very limited capacity to adapt to a varied dietary nutrient supply, since they constantly have a high activity of hepatic gluconeogenic enzymes, and a high rate of hepatic gluconeogenesis2. Previous studies have though demonstrated some metabolic flexibility in a few strict carnivores, and that cats3,4 and mink5,6,7 are able to adapt to different protein supplies by regulating the protein oxidation rate. Cats have been suggested to be able to adapt their protein oxidation to the level of dietary protein supply if the protein requirement is met, but not if the protein supply is below this requirement4. Results from studies with mink, however, indicate that rates of decarboxylation and oxidation of amino acids may be regulated according to the protein supply, although the dietary protein is low or even below the requirement5,7,8. Also, improved performance (i.e. improved milk yield and reduced weight loss) in the lactating dam during the first four weeks of lactation has been demonstrated when protein supply was reduced below currently recommended levels, and replaced with readily available carbohydrates5,6. Restricted protein supply has been associated with reduced liver mass in rats9 and mink7, and also with reduced gene expression of fructose-1,6-biphosphatase (Fru-1,6-P2ase) and pyruvate kinase (PKM2) mRNA, in foetal hepatic mink tissue(7). However, the mink’s ability to adapt to varying protein supply is still not well understood, and one of the objectives of the present study was to investigate if the metabolic adaptation indicated in lactating minks fed high- (HP), medium- (MP), or low-protein (LP) diets was driven by changes in liver mass during the suckling period. Another objective was to reveal if possible changes in liver mass remained and also could be detected at the transcriptional level of key hepatic enzymes in dams after weaning of their kits. Our working hypothesis was that liver mass adapts to the level of dietary protein provision, and that this is the main mechanism with which mink adapts to level of protein supply.
Material and methodsThe experimental procedures complied with Danish national legislation and the guidelines approved by the Member States of the Council of Europe for the Protection of Vertebrate Animals used for Experimental and Other Scientific Purposes10.
Experiment 1Animals and dietsTwelve two-year-old mink dams of the standard brown genotype11 were divided into three dietary treatment groups and fed ad libitum, from parturition until ten weeks post partum, with diets high (HP: 60% of metabolisable energy; ME), medium (MP: 45% of ME), or low (LP: 30% of ME) in protein content. Each litter was standardized to seven kits (eighty-four kits in total) by cross-fostering within 48 h of birth. The feed mixtures for the diets were prepared on a single occasion, weighed out into plastic bags, and immediately frozen. The feed was taken out of the freezer the day before use and thawed over night. Feed samples
BJCCSB.ORG
Baltic Journal of Comparative & Clinical Systems Biologypage 47
s
were collected daily, pooled for each week, and stored at –18ºC until analysis. The ingredient and chemical compositions of the diets are presented in Table 1, and the amino acid compositions are shown in Table 2. The animals had free access to drinking water. Dams and kits were weighed at parturition, and thereafter at weekly intervals.
Balance and respiration experimentsTwo days after parturition, the animals were transferred from the experimental farm to an intensive care unit where they were kept under natural daylight conditions (May, 55ºN 12ºE). The animals were placed in individual metabolic cages, equipped with devices for feeding and drinking water supply, quantitative
BJCCSB.ORG
Baltic Journal of Comparative & Clinical Systems Biologypage 48
s
Table 1. Ingredient and chemical composition of diets fed to lactating mink dams, providing a high- (HP), medium-(MP) or low protein (LP) supply.
Dietary treatment
HP MP LPPlanned protein:fat:carbohydrate ratio (% of ME) 60:35:5 45:40:15 30:45:25
Ingredient composition, g/kg
Cod offal 500 350 250
Cod, whole 100 100 100
Fish meal 80 60 0
Chicken, whole1 200 250 300
Barley and wheat (heat treated) (1:1) 20 40 80
Steamed rolled oats 0 20 40
Potato mash powder 5 25 40
Rape-seed oil 0 10 20
Vitamin/mineral mixture2 2.5 2.5 2.5
Water 92.5 142.5 167.5
Chemical composition
Dry matter (DM), g/kg 292 312 335
Ash, g/kg DM 174 130 103
Crude protein, g/kg DM 605 513 325
Fat, g/kg DM 125 159 171
Carbohydrates, g/kg DM 96 198 401
Gross energy (GE), MJ/kg DM 20.8 21.8 21.9
Digestibility of nutrients
Protein; fat; carbohydrates 80; 96; 86 81; 97; 81 78; 96; 84
Metabolisable energy (ME)
ME, MJ/kg DM3 15.1 16.6 17.1
Protein:fat:carbohydrate ratio, (% of ME) 59:31:10 46:37:17 27:38:35
1Chicken prepared for human consumption, i.e. without head, feet, feather, or entrails.2Containing, in mg/kg: α-tocopherol 21840, thiamine 10000, riboflavin 4800, pyridoxine 3200, D-pantothenic acid 3200, nicotinic acid 8000, betain anhydrous 33600, folic acid 240, biotin 80, cyanocobalamin 16, para-aminobenzoic acid 800, Fe 19712, Zn 12560, Mn 6237, and Cu 1025; in i.u. g: retinol 2800 and cholecalciferol 280.3Calculated using individual coefficients of digestibility for the diets, the amount of digestible nutrient/kg diet, and metabolisable energy coefficients (18.4 kJ, 39.8 kJ, and 17.6 kJ/g digested protein, fat, and carbohydrate).
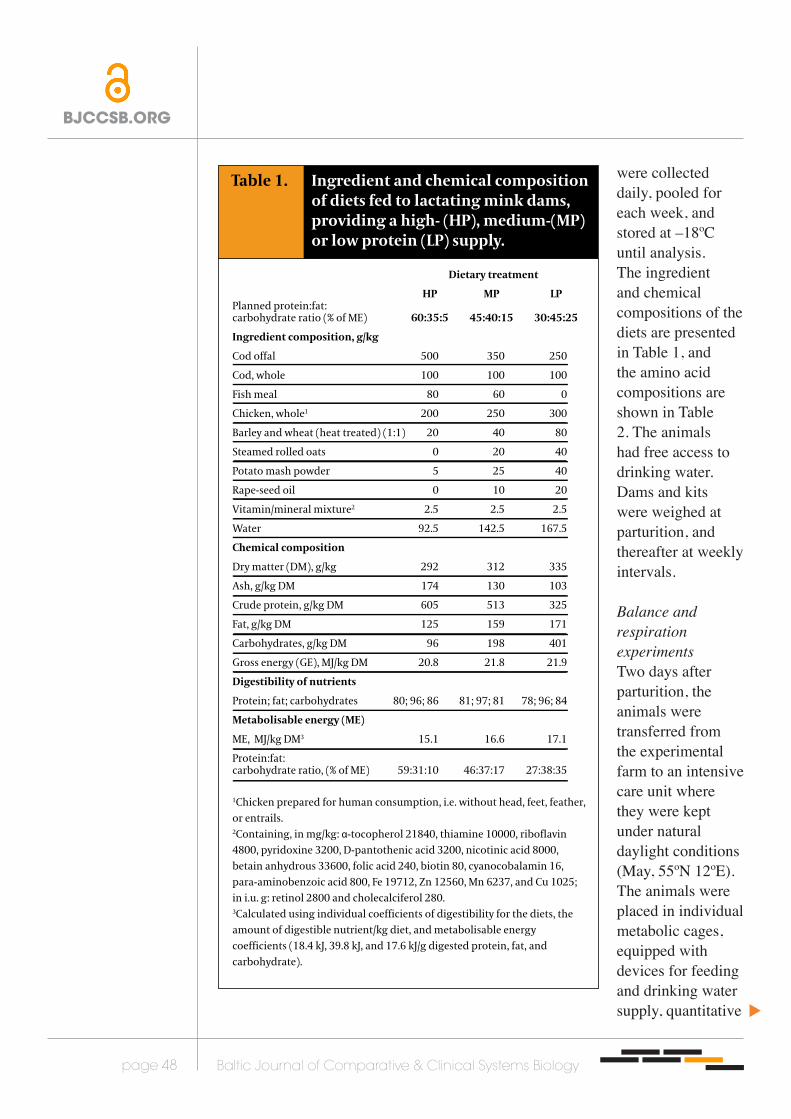
Table 2.
Dietary treatment
HP MP LP
Essential amino acids
Lysine 40.7 32.5 21.2
Phenylalanine 22.0 18.2 12.7
Methionine 16.9 13.1 8.5
Histidine 16.2 14.2 10.4
Valine 30.2 24.9 16.7
Isoleucine 24.6 20.3 13.9
Leucine 40.4 33.5 23.0
Threonine 24.7 19.9 13.2
Arginine 40.1 31.8 21.5
Tryptophan 5.8 4.9 3.3
All essential 255.8 207.4 141.1
Non-essential amino acids Cystine 5.2 4.7 3.8
Glycine 57.4 42.1 27.3
Aspartate 53.8 43.7 29.2
Alanine 40.0 31.1 20.4
Tyrosine 18.9 15.5 10.8
Glutamate 79.1 66.6 49.0
Proline 33.9 25.7 19.7
Serine 29.5 23.1 15.7
All non-essential 317.8 252.5 175.9
Sum of amino acids 573.6 459.9 317.8
Table 2: Amino acid (g/kg dry matter) composition of the experimental diets; (high protein (HP), medium protein (MP), and low protein (LP)).
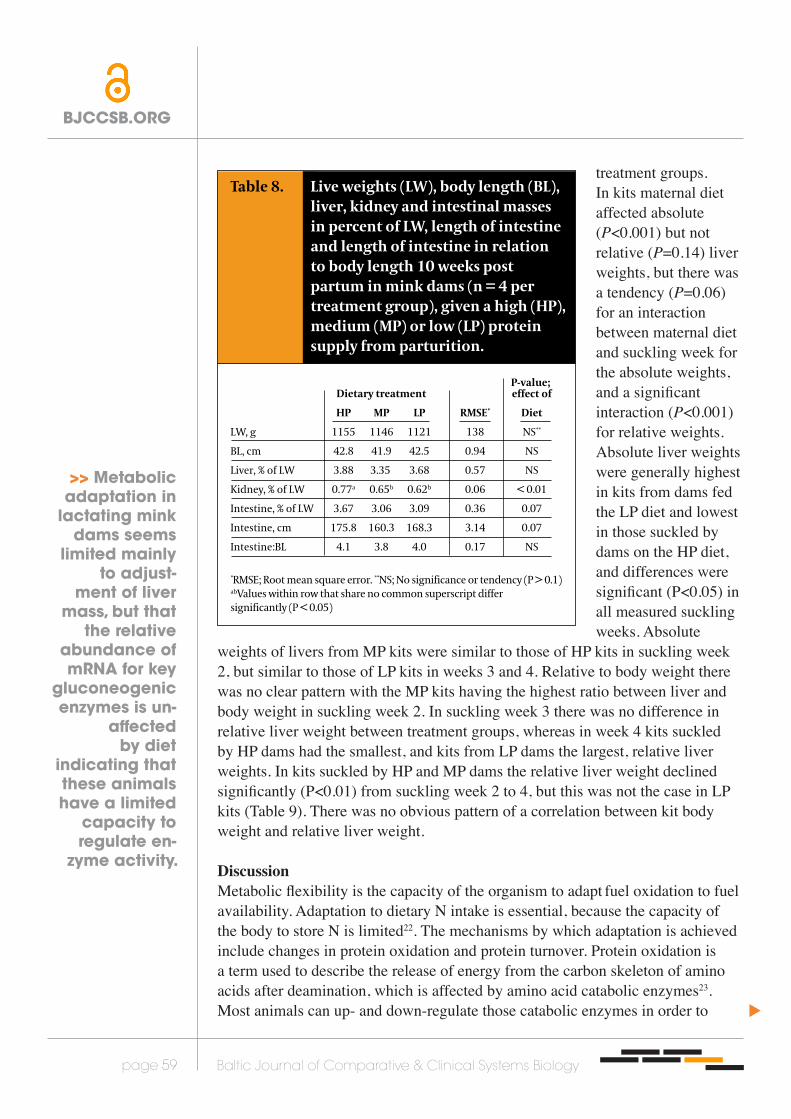
Table 8. Live weights (LW), body length (BL), liver, kidney and intestinal masses in percent of LW, length of intestine and length of intestine in relation to body length 10 weeks post partum in mink dams (n = 4 per treatment group), given a high (HP), medium (MP) or low (LP) protein supply from parturition.
Dietary treatment
HP MP LP RMSE* Diet
LW, g 1155 1146 1121 138 NS**
BL, cm 42.8 41.9 42.5 0.94 NS
Liver, % of LW 3.88 3.35 3.68 0.57 NS
Kidney, % of LW 0.77a 0.65b 0.62b 0.06 < 0.01
Intestine, % of LW 3.67 3.06 3.09 0.36 0.07
Intestine, cm 175.8 160.3 168.3 3.14 0.07
Intestine:BL 4.1 3.8 4.0 0.17 NS
*RMSE; Root mean square error. **NS; No significance or tendency (P > 0.1)abValues within row that share no common superscript differ significantly (P < 0.05)
P-value; effect of
collection of feed residues, faeces and urine12, and with nest boxes containing bedding of wood shavings. Balance and respiration experiments were performed in weeks 1, 2, 3, and 4 post partum. After the fourth week of lactation, the animals were housed under conventional farm conditions, the kits being allowed to supplement their milk intake with the feed given to the dams. Seven weeks post partum the kits were weaned, and thereafter the dams were housed individually.
Quantitative collection of feed residues and excreta13 took place once daily between 08.30 and 12.00 a.m., and the pooled amounts collected each week were stored at -18ºC until analysis. Each balance period included a 22-h respiration experiment, using indirect calorimetry in an open-air circulation system14.
The dams were anaesthetized ten weeks post partum, using 0.4 mL of Narcoxyl® Vet. (20 mg/mL Xylazin; Intervet Scandinavia
AS, Skovlunde, Denmark) and 0.8 mL of Ketaminol® Vet. (50 mg/mL Ketamin; Intervet International BV, Boxmeer, The Netherlands). Blood was sampled by means of heart puncture, whereupon the dams were killed. The liver, kidneys and intestines were quickly removed and their weights were recorded, as well as the length of the intestines. The livers were flash frozen in liquid nitrogen. The blood samples were centrifuged for 15 min at 3300 g to separate the plasma, and the plasma samples were stored at -18˚C until the analysis of amino acid profiles.
Analytical proceduresChemical analyses of diets and excreta: Diets, feed residues, and faeces were
BJCCSB.ORG
Baltic Journal of Comparative & Clinical Systems Biologypage 49
>> Strict carnivores such as the mink are
considered to have limited
ability to adapt protein
metabolism to varied protein
provision.
s
Table 1. Ingredient and chemical composition of diets fed to lactating mink dams, providing a high- (HP), medium-(MP) or low protein (LP) supply.
Dietary treatment
HP MP LPPlanned protein:fat:carbohydrate ratio (% of ME) 60:35:5 45:40:15 30:45:25
Ingredient composition, g/kg
Cod offal 500 350 250
Cod, whole 100 100 100
Fish meal 80 60 0
Chicken, whole1 200 250 300
Barley and wheat (heat treated) (1:1) 20 40 80
Steamed rolled oats 0 20 40
Potato mash powder 5 25 40
Rape-seed oil 0 10 20
Vitamin/mineral mixture2 2.5 2.5 2.5
Water 92.5 142.5 167.5
Chemical composition
Dry matter (DM), g/kg 292 312 335
Ash, g/kg DM 174 130 103
Crude protein, g/kg DM 605 513 325
Fat, g/kg DM 125 159 171
Carbohydrates, g/kg DM 96 198 401
Gross energy (GE), MJ/kg DM 20.8 21.8 21.9
Digestibility of nutrients
Protein; fat; carbohydrates 80; 96; 86 81; 97; 81 78; 96; 84
Metabolisable energy (ME)
ME, MJ/kg DM3 15.1 16.6 17.1
Protein:fat:carbohydrate ratio, (% of ME) 59:31:10 46:37:17 27:38:35
1Chicken prepared for human consumption, i.e. without head, feet, feather, or entrails.2Containing, in mg/kg: α-tocopherol 21840, thiamine 10000, riboflavin 4800, pyridoxine 3200, D-pantothenic acid 3200, nicotinic acid 8000, betain anhydrous 33600, folic acid 240, biotin 80, cyanocobalamin 16, para-aminobenzoic acid 800, Fe 19712, Zn 12560, Mn 6237, and Cu 1025; in i.u. g: retinol 2800 and cholecalciferol 280.3Calculated using individual coefficients of digestibility for the diets, the amount of digestible nutrient/kg diet, and metabolisable energy coefficients (18.4 kJ, 39.8 kJ, and 17.6 kJ/g digested protein, fat, and carbohydrate).
Table 2.
Dietary treatment
HP MP LP
Essential amino acids
Lysine 40.7 32.5 21.2
Phenylalanine 22.0 18.2 12.7
Methionine 16.9 13.1 8.5
Histidine 16.2 14.2 10.4
Valine 30.2 24.9 16.7
Isoleucine 24.6 20.3 13.9
Leucine 40.4 33.5 23.0
Threonine 24.7 19.9 13.2
Arginine 40.1 31.8 21.5
Tryptophan 5.8 4.9 3.3
All essential 255.8 207.4 141.1
Non-essential amino acids Cystine 5.2 4.7 3.8
Glycine 57.4 42.1 27.3
Aspartate 53.8 43.7 29.2
Alanine 40.0 31.1 20.4
Tyrosine 18.9 15.5 10.8
Glutamate 79.1 66.6 49.0
Proline 33.9 25.7 19.7
Serine 29.5 23.1 15.7
All non-essential 317.8 252.5 175.9
Sum of amino acids 573.6 459.9 317.8
Table 2: Amino acid (g/kg dry matter) composition of the experimental diets; (high protein (HP), medium protein (MP), and low protein (LP)).
Table 8. Live weights (LW), body length (BL), liver, kidney and intestinal masses in percent of LW, length of intestine and length of intestine in relation to body length 10 weeks post partum in mink dams (n = 4 per treatment group), given a high (HP), medium (MP) or low (LP) protein supply from parturition.
Dietary treatment
HP MP LP RMSE* Diet
LW, g 1155 1146 1121 138 NS**
BL, cm 42.8 41.9 42.5 0.94 NS
Liver, % of LW 3.88 3.35 3.68 0.57 NS
Kidney, % of LW 0.77a 0.65b 0.62b 0.06 < 0.01
Intestine, % of LW 3.67 3.06 3.09 0.36 0.07
Intestine, cm 175.8 160.3 168.3 3.14 0.07
Intestine:BL 4.1 3.8 4.0 0.17 NS
*RMSE; Root mean square error. **NS; No significance or tendency (P > 0.1)abValues within row that share no common superscript differ significantly (P < 0.05)
P-value; effect of

analysed for dry matter (DM) by evaporation to constant weight at 105˚C, and ash by combustion at 525˚C for six hours. Nitrogen (N) content was determined by means of the micro-Kjeldahl technique using the Tecator-Kjeltec system 1030 (Tecator AB, Höganäs, Sweden). Crude protein (CP) was calculated as N x 6.25. Fat content was determined by means of petroleum ether extraction after HCl hydrolysis, and gross energy (GE) was determined by use of an adiabatic bomb calorimeter (IKA C5000, IKA Labortechnik, Janke & Kunkel GMBH, Staufen, Germany). Carbohydrates (CHO) were calculated by difference as follows: CHO = DM – ash – CP – fat. Amino acid content of diets were determined by oxidation with a performic acid/phenol mixture and hydrolysed with HCl (6 N) for 23 hours, and the hydrolysate adjusted to pH 2.20. The amino acids were separated by means of ion exchange chromatography and determined by reaction with ninhydrin using photometric detection at 570nm (440nm for proline). Energy in urine (UE) was estimated from the N content in urine (UN) as described elsewhere7.
Amino acids in plasma: Free amino acids in mink plasma were analysed by means of micellar electro-kinetic capillary chromatography (MECC)(15) of the 2.4-dinitrobenzene (2.4-DNB) derivatives of the amino acids. Plasma samples (500 µL) were mixed and shaken for 10 min with acetonitrile (1.5 mL; Sigma-Aldrich, Steinheim, Germany) and internal standard (30 µL N-Val, 4.60 µmol x µL-1), after which they were centrifuged at 15000 g for 10 min. The supernatant (1 mL) was then reacted with 75 µL of 70 µM 2.4-dinitroflurobenzene (DNFB), or Sangers reagent (13 mg per mL ethanol; Sigma-Aldrich), 100 µL of ethanol, and 100 µL of 100 mM aqueous Na2B4O7, 10 H2O (Sigma-Aldrich). After reaction for 40 min at 50˚C, evaporation to dryness and dissolution in 200 µL of 20% methanol in water, a 2-mL sample of this solution was used for MECC in a mixture of 60 mM tetradecyl-trimethyl-ammonium bromide (TTAB), 20 mM Na2HPO4, 2H2O, 18 mM Na2B4O7, and 13% 1-propanol (pH 9.6). All chemicals and solvents were at least of analytical quality. Reference amino acids came from the laboratory collection16, and individual amino acids determinations were based on spiking.
Assessment of gene expression: Total RNA was isolated from homogenized liver samples using the RNeasy Mini Kit (Qiagen NV, Venlo, the Netherlands) and transcribed into cDNA in 8.6 µL of reverse transcriptase (RT) mix containing 5 µL of RT buffer (Promega GmbH, Mannheim, Germany), 0.5 of µM dNTPs, 32 U RNasin® ribonuclease inhibitor (Promega), 200 U of M-MLV RT (Promega), and 1 µg of random hexamer primers (Amersham Biosciences, Copenhagen, Denmark). PCR primer oligonucleotides were designed from canine mRNA sequences for phosphoenolpyruvate carboxykinase (PEPCK), fructose-1,6-biphosphatase (Fru-1,6-P2ase), pyruvate kinase (PKM2), and glucose-6-phosphatase (G-6-Pase), and tested by means of conventional PCR on mink and canine liver cDNA samples,
BJCCSB.ORG
Baltic Journal of Comparative & Clinical Systems Biologypage 50
s

using canine genomic DNA samples as the control. 18S rRNA was chosen as the reference gene (Table 3). The PCR conditions for each primer pair were optimized by determining the MgCl2 concentration and annealing temperature at which only the specific product was found. Furthermore, PCR products generated from mink liver cDNA were sequenced to confirm product identity. The relative quantification of enzyme mRNA was done by means of q PCR, using SYBR Green I detection and the LightCycler 480 Real-Time PCR System (Roche Diagnostics A/S, Copenhagen, Denmark). Reactions were carried out in 20-µL volumes consisting of FastStart Master SYBR Green I Mix, 3 mM MgCl2, and 0.5 µM gene specific primer. Each run consisted of serial dilutions of a pool of liver cDNA to generate a standard curve (5 x). Dilutions of liver cDNA generated, using the same RNA extraction method, were chosen as standards to ensure that diluted (10 x) cDNA were amplified. The amplification program consisted of pre-incubation for FastStart polymerase activation at 95˚C for 10 min, followed by 45 amplification cycles, as follows: 95˚C at 5 sec (20˚C/sec), 60-69˚C for 10 sec (20˚C/sec), and 72˚C for 4-18 sec (20˚C/sec). SYBR Green fluorescence was acquired at 72˚C in each amplification cycle. After the last cycle, the melting curve was generated by starting the fluorescence acquisition at 65˚C, and making measurements every 0.1 sec until 95˚C was reached. A calibrator comprising a diluted (10 x) pool of liver cDNA was measured in triplicate and included in every run. Furthermore, the PCR efficiency was calculated for both the target and reference gene by determining the fitting coefficients of a relative standard curve. The final relative quantification was efficiency corrected.
CalculationsMetabolisable energy (ME) was calculated as follows: GE – energy in faeces
BJCCSB.ORG
Baltic Journal of Comparative & Clinical Systems Biologypage 51
s
Table 3. Sequence of gene specific q PCR primers.
Gene Primer sequence Product size (bp) Genebankaccession No.
G-6-Pase F* 5’-primer: CCG AAT CTA CCT TGC TGC TC
R** 5’-primer: AGT GTC CAC AGG AGG TCC AC AC 207 NM1002993
Fru-1.6-Pase F 5’-primer: TAC CTG GAA GGC ACT TTG CT
R 5’-primer: GAT GCC TCC TCC TCA CTC TG 176 XM547066
PKM2 F 5’-primer: AAGATCACCCTGGACAATGC
R 5’-primer: GGAAGTCAGCACCTTTCTGC 247 XM535531
PEPCK F 5’-primer: GAT GTT CAA TCG CAT CAA CG
R 5’-primer: GGC TGA TTC TTT GCT TCA GG 245 XM_543068
18S rRNA F 5’-primer: GAT ACC GCA GCT AGG AAT
R 5’-primer: ATC TGT CAA TCC TGT CCG 450 AY265350
*F: forward primer **R: reverse primer
Table 4.
Live weights, kg
1200 1255 1237 1263a 1197b 56.4 0.08 < 0.01
Feed intake, g/day
294a 273ab 240b 223a 315b 54.1 0.03 < 0.001
Energy metabolism, kJ/kg0.75/day
ME 1021 1203 1305 950a 1402b 291 0.08 < 0.001
HE 638 628 607 612 637 58.3 NS** NS
LE 666 863 736 486a 1025b 203 0.08 < 0.001
RE -281 -287 -43 -148 -260 291 0.06 NS
RQ 0.756a 0.796b 0.783b 0.777 0.780 0.03 0.03 NS
Substrate oxidation, % of HE
OXP 40a 33b 19c 32 30 3.9 < 0.001 0.06
OXF 55ab 48a 61b 55 55 11.5 0.03 NS
OXCHO 5a 19b 24b 15 17 9.5 < 0.001 NS*RMSE; Root mean square error**NS; No significance or tendency (P > 0.1)abc Values within row that share no common superscript differ significantly (P < 0.05)
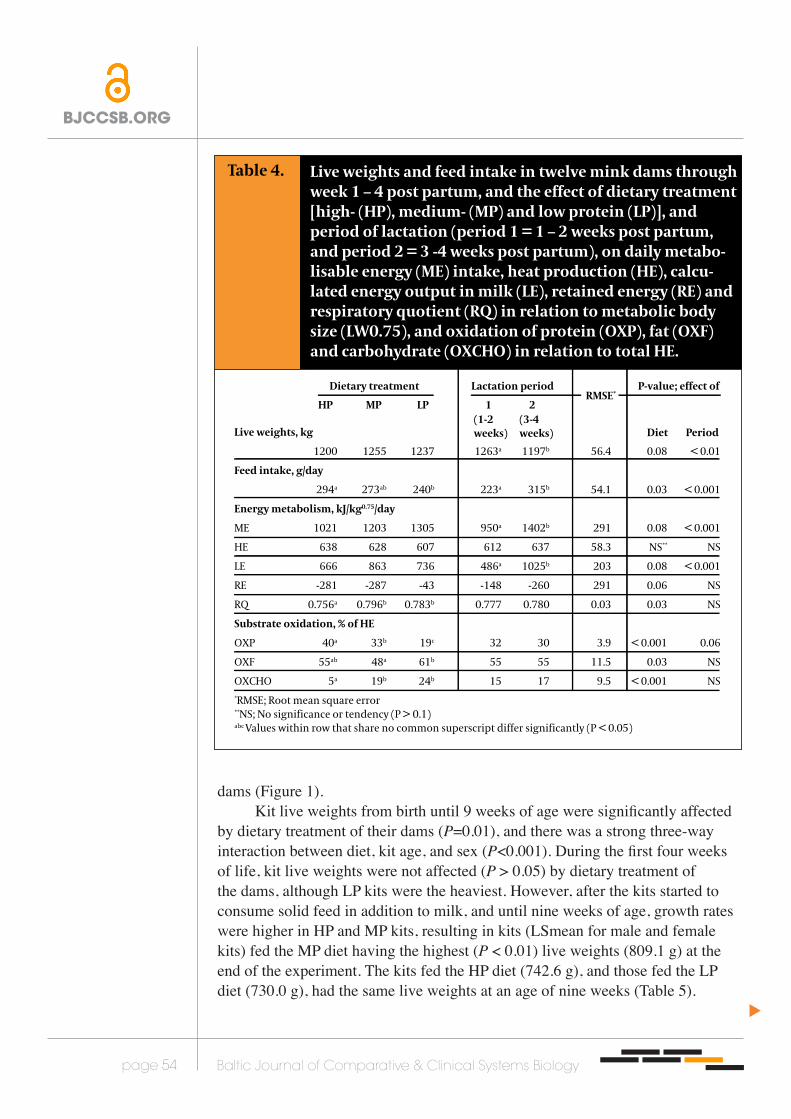
Live weights and feed intake in twelve mink dams through week 1 – 4 post partum, and the effect of dietary treatment [high- (HP), medium- (MP) and low protein (LP)], and period of lactation (period 1 = 1 – 2 weeks post partum, and period 2 = 3 -4 weeks post partum), on daily metabo-lisable energy (ME) intake, heat production (HE), calcu-lated energy output in milk (LE), retained energy (RE) and respiratory quotient (RQ) in relation to metabolic body size (LW0.75), and oxidation of protein (OXP), fat (OXF) and carbohydrate (OXCHO) in relation to total HE.
RMSE*
HP MP LP 1 2
Dietary treatment Lactation period P-value; effect of
Diet Period(1-2 weeks)
(3-4 weeks)
Table 5.
Sex Male kits Female kits
Dietary treatment HP MP LP HP MP LP
Kit age, weeks
Birth 12.3 11.2 13.0 10.5 11.6 12.5 50.99
2 80.5 73.9 81.5 67.1 67.9 76.0
4 167.4 168.6 178.4 135.3 154.8 170.3
7 494.3 536.3 498.3 399.5b 461.0a 431.4b
9 844.3 880.1 820.5 640.8b 738.2a 639.5b
a, b Values that share no common superscript differ significantly P<0.05.
Square rootof residuals
Live weights in mink kits (n=84) at birth, 2 and 4 weeks of age, nursed by dams fed high- (HP), medium- (MP), or low protein (LP) diets from parturition, and at seven and nine weeks of age (n=72) where the offspring continued with the same diet as the dam after weaning
Statistical significance; effect of
Diet 0.01 Week <0.001 Sex <0.001 Diet * Week 0.07 Diet * Week * Sex <0.001
Table 6. Intake of amino acids (g/day) in lactating mink dams (n = 4 per treatment group), fed high- (HP), medium- (MP), or low protein (LP) diets, during period 1 (1 - 2 weeks post partum), and period 2 (3 – 4 weeks post partum), calculated in relation to metabolic live weights (kg0.75).
SUMof
EAA
SUMof
NEAAMink Dams(n=12)
Essential amino acids, (EEA) EAA Non-essential amino acids, (NEAA)
Lys Phe Met His Val Ile Leu Thr Arg Trp Cys Gly Asp Ala Tyr Glu Pro Ser
Period 1
HP 2.00 1.08 0.83 0.80 1.49 1.21 1.99 1.21 1.97 0.29 12.9 0.26 2.82 2.65 1.97 0.93 3.89 1.67 1.45 15.6
MP 1.59 0.89 0.64 0.70 1.22 1.00 1.64 0.98 1.56 0.24 10.5 0.23 2.06 2.14 1.53 0.76 3.27 1.26 1.13 12.4
LP 0.92 0.55 0.37 0.45 0.72 0.60 1.00 0.57 0.93 0.14 6.3 0.16 1.18 1.26 0.88 0.47 2.12 0.85 0.68 7.6
Period 2
HP 3.06 1.65 1.27 1.22 2.27 1.85 3.03 1.85 3.01 0.44 19.6 0.39 4.31 4.04 3.00 1.42 5.94 2.55 2.22 23.9
MP 2.32 1.30 0.94 1.01 1.78 1.45 2.39 1.42 2.27 0.35 15.2 0.34 3.01 3.12 2.22 1.11 4.76 1.84 1.65 18.1
LP 1.50 0.90 0.60 0.73 1.18 0.98 1.63 0.93 1.52 0.23 10.2 0.27 1.93 2.06 1.44 0.76 3.46 1.39 1.11 12.4
(FE) – UE. Heat production (HE) was calculated from O2 consumption, CO2 production, and nitrogen in urine (UN), using the following formula: HE, kJ = 16.18 * O2, L + 5.02 * CO2, L – 5.99 * UN, g (17). Retained energy (RE) was calculated as: RE, kJ = ME – HE. The respiratory quotient (RQ) was calculated as: RQ = CO2, L /O2, L. Quantitative oxidation of protein (OXP), fat (OXF), and carbohydrate (OXCHO) were calculated from measurements of gas exchange and excretion of N in urine18 as follows:
OXP, kJ = UN, g * 6.25 * 18.42OXF, kJ = (1.719 * O2, L – 1.719 * CO2, L – 1.963 * UN, g) * 39.76OXCHO, kJ = (-2.968 * O2, L + 4.174 * CO2, L – 2.446 * UN, g) * 17.58
Provided the RQnp value is between 0.707 and 1.00, the above method can be used to calculate the oxidation of the various nutrients18. However, some animals had RQnp values below 0.707. In such cases, OXCHO = 0 and OXF includes both the net oxidation and cost of fat mobilization; OXF was then calculated as oxidation of fat plus the value of the CHO oxidation14.
Milk production (g/day) was calculated by using estimates for milk intake in relation to gained live weight (3.5 g, 4.2 g, 5.0 g, and 5.3 g milk/g gained weight in week 1, 2, 3, and 4, respectively19. Energy output (LE) and output of nutrients in the milk were calculated, using the chemical composition of mink milk5.
Experiment 2Animals and dietsA total of 27 two-year-old female mink of the standard brown genotype, each nursing six kits, were used together with 3 kits per dam. The dams were allocated to three dietary treatments, HP, MP and LP at parturition and fed ad libitum until euthanasia. The diets had the same ingredient composition as diets in Experiment 1, and differences in chemical composition as compared to the values in Table 1 were small. These dams were part of an experiment into amino-acid requirements of lactating mink dams, and results on quantitative metabolism traits, milk yield, and estimated amino- acid requirement have been reported by Fink et al. (2006). These particular dams and kits were intended for hepatic enzyme activity analyses and protein turnover studies, but the reporting here is limited to organ weights.
Tissue collectionThree dams from each dietary treatment, and three kits from each dam, were euthanized in lactation weeks 2, 3, and 4 (at each occasion 9 dams and 27 kits). Procedures for dam euthanasia were as described above, and kits were killed by decapitation after anaesthesia. Livers were quickly excised, weighed, flash frozen in liquid nitrogen, and stored at -80 oC pending further analyses.Statistical analysesExperiment 1: Statistical analyses of dam live weights, feed intake, energy and
BJCCSB.ORG
Baltic Journal of Comparative & Clinical Systems Biologypage 52
>> Protein provision was
clearly reflected in the
protein oxidation, and
dams fed the high protein
diet had a higher
nitrogen excretion, a larger liver
mass, and a tendency
towards higher weight loss and
lower estimated milk
production during the first four weeks of
lactation.
s

nitrogen metabolism, liver and kidney masses, intestinal mass and length, and q-PCR data were carried out using the GLM procedure in SAS20 according to a model comprising the fixed effects of treatment group and period, and their interactions. The model was reduced for non-significant interaction effects. Plasma amino-acid profiles and kit live weights were analysed as repeated measures analyses according to the MIXED procedure in SAS(21), according to a model comprising the fixed effects of treatment group, sampling week, and their interactions, with sampling week as repeated measure. For kit live weights, sex was included as fixed effect, and the three way interaction between treatment group, week, and sex was included in the analysis. Results are presented as least square means (LS-means), and the root mean square error (GLM-procedure) and square root of residuals (MIXED procedure) were used as measures of variance. Effects were considered significant if P < 0.05, and as a tendency if 0.05 < P < 0.10.
Experiment 2: Data were analysed by the GLM procedure in SAS20 according to a model comprising the fixed effects of treatment group and period, and their interactions. Results are presented as least square means (LS-means), and the root mean square error was used as a measure of variance. Effects were considered significant if P < 0.05, and as a tendency if 0.05 < P < 0.10.
ResultsExperiment 1
Live weightsThe live weights tended to differ (P = 0.08) between treatment groups among dams through week 1 to 4 post partum, where dams fed the HP diet had a lower live weight than dams fed the MP diet. In all dams live weights decreased (P < 0.01) with progressive stage of lactation (Table 4). Ten weeks post partum, three weeks after the kits were weaned there were no differences (P > 0.05) in live weights between
BJCCSB.ORG
Baltic Journal of Comparative & Clinical Systems Biologypage 53
s
Figure 1.
800
900
1000
1100
1200
1300
1400
Figure 2.
-7,5
-5,0
-2,5
0,0
2,5
5,0
7,5
Figure 3.
0
1
2
3
4
5
Body weight of mink dams fed high (HP), medium (MP) or low (LP) protein diets through weeks 1 – 10 post partum.
Nitrogen metabolism in lactating mink dams (n = 4 per treatment group) through week 1-4 post partum fed high (HP), medium (MP) or low (LP) protein diets. The presented data are digested nitrogen (DN), urinary nitrogen (UN), retained nitrogen (RN), nitrogen excreted in milk (LN). LS mean values are shown with standard errors of the mean represented by vertical bars. a,b,c LS mean values within measured parameter with unlike lower-case superscript letters were significantly different (P-value < 0.05) between dietary treatment.
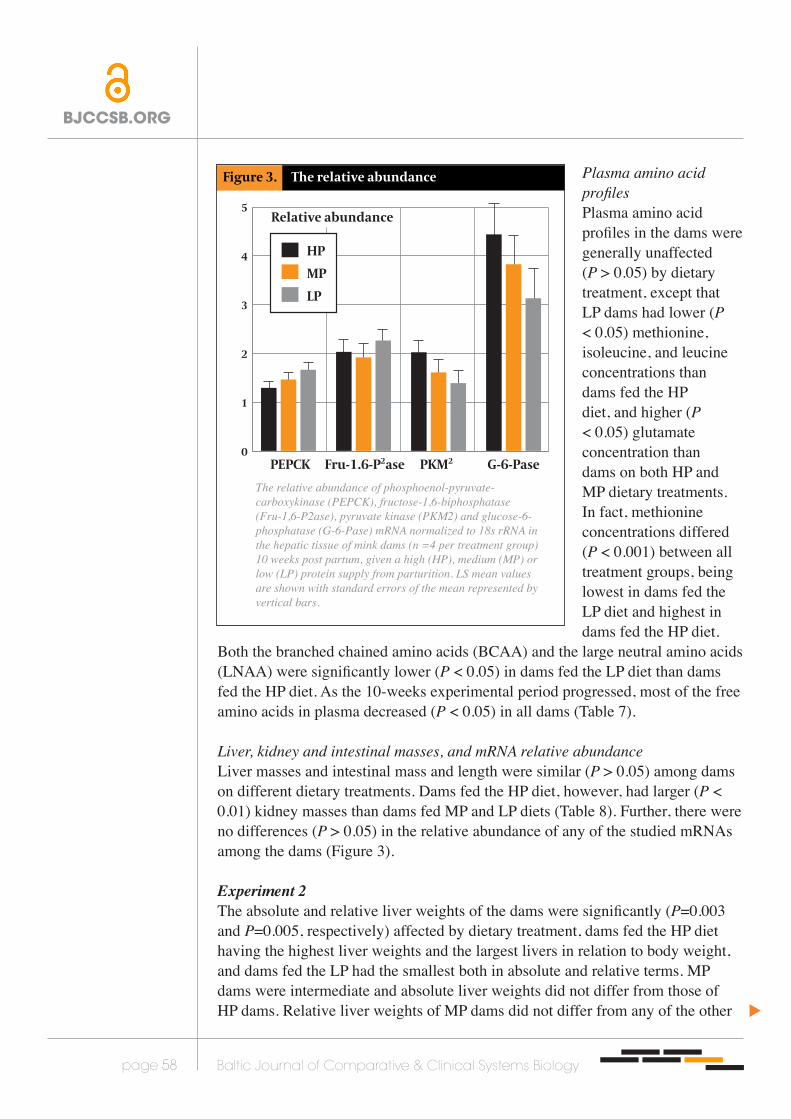
The relative abundance of phosphoenol-pyruvate-carboxykinase (PEPCK), fructose-1,6-biphosphatase (Fru-1,6-P2ase), pyruvate kinase (PKM2) and glucose-6-phosphatase (G-6-Pase) mRNA normalized to 18s rRNA in the hepatic tissue of mink dams (n =4 per treatment group) 10 weeks post partum, given a high (HP), medium (MP) or low (LP) protein supply from parturition. LS mean values are shown with standard errors of the mean represented by vertical bars.
Body weight of mink Nitrogen metabolism The relative abundance
0 2 4 6 8 10
Week
Live weight, g g/day Relative abundance
HP
a
a
a
b
c
cb
b
a
MP PEPCK Fru-1.6-P2ase PKM2 G-6-PaseLP
HPMPLP
DN
UN
LN
RNHP
MP
LP
dams (Figure 1).Kit live weights from birth until 9 weeks of age were significantly affected
by dietary treatment of their dams (P=0.01), and there was a strong three-way interaction between diet, kit age, and sex (P<0.001). During the first four weeks of life, kit live weights were not affected (P > 0.05) by dietary treatment of the dams, although LP kits were the heaviest. However, after the kits started to consume solid feed in addition to milk, and until nine weeks of age, growth rates were higher in HP and MP kits, resulting in kits (LSmean for male and female kits) fed the MP diet having the highest (P < 0.01) live weights (809.1 g) at the end of the experiment. The kits fed the HP diet (742.6 g), and those fed the LP diet (730.0 g), had the same live weights at an age of nine weeks (Table 5).
BJCCSB.ORG
Baltic Journal of Comparative & Clinical Systems Biologypage 54
s
Table 3. Sequence of gene specific q PCR primers.
Gene Primer sequence Product size (bp) Genebankaccession No.
G-6-Pase F* 5’-primer: CCG AAT CTA CCT TGC TGC TC
R** 5’-primer: AGT GTC CAC AGG AGG TCC AC AC 207 NM1002993
Fru-1.6-Pase F 5’-primer: TAC CTG GAA GGC ACT TTG CT
R 5’-primer: GAT GCC TCC TCC TCA CTC TG 176 XM547066
PKM2 F 5’-primer: AAGATCACCCTGGACAATGC
R 5’-primer: GGAAGTCAGCACCTTTCTGC 247 XM535531
PEPCK F 5’-primer: GAT GTT CAA TCG CAT CAA CG
R 5’-primer: GGC TGA TTC TTT GCT TCA GG 245 XM_543068
18S rRNA F 5’-primer: GAT ACC GCA GCT AGG AAT
R 5’-primer: ATC TGT CAA TCC TGT CCG 450 AY265350
*F: forward primer **R: reverse primer
Table 4.
Live weights, kg
1200 1255 1237 1263a 1197b 56.4 0.08 < 0.01
Feed intake, g/day
294a 273ab 240b 223a 315b 54.1 0.03 < 0.001
Energy metabolism, kJ/kg0.75/day
ME 1021 1203 1305 950a 1402b 291 0.08 < 0.001
HE 638 628 607 612 637 58.3 NS** NS
LE 666 863 736 486a 1025b 203 0.08 < 0.001
RE -281 -287 -43 -148 -260 291 0.06 NS
RQ 0.756a 0.796b 0.783b 0.777 0.780 0.03 0.03 NS
Substrate oxidation, % of HE
OXP 40a 33b 19c 32 30 3.9 < 0.001 0.06
OXF 55ab 48a 61b 55 55 11.5 0.03 NS
OXCHO 5a 19b 24b 15 17 9.5 < 0.001 NS*RMSE; Root mean square error**NS; No significance or tendency (P > 0.1)abc Values within row that share no common superscript differ significantly (P < 0.05)
Live weights and feed intake in twelve mink dams through week 1 – 4 post partum, and the effect of dietary treatment [high- (HP), medium- (MP) and low protein (LP)], and period of lactation (period 1 = 1 – 2 weeks post partum, and period 2 = 3 -4 weeks post partum), on daily metabo-lisable energy (ME) intake, heat production (HE), calcu-lated energy output in milk (LE), retained energy (RE) and respiratory quotient (RQ) in relation to metabolic body size (LW0.75), and oxidation of protein (OXP), fat (OXF) and carbohydrate (OXCHO) in relation to total HE.
RMSE*
HP MP LP 1 2
Dietary treatment Lactation period P-value; effect of
Diet Period(1-2 weeks)
(3-4 weeks)
Table 5.
Sex Male kits Female kits
Dietary treatment HP MP LP HP MP LP
Kit age, weeks
Birth 12.3 11.2 13.0 10.5 11.6 12.5 50.99
2 80.5 73.9 81.5 67.1 67.9 76.0
4 167.4 168.6 178.4 135.3 154.8 170.3
7 494.3 536.3 498.3 399.5b 461.0a 431.4b
9 844.3 880.1 820.5 640.8b 738.2a 639.5b
a, b Values that share no common superscript differ significantly P<0.05.
Square rootof residuals
Live weights in mink kits (n=84) at birth, 2 and 4 weeks of age, nursed by dams fed high- (HP), medium- (MP), or low protein (LP) diets from parturition, and at seven and nine weeks of age (n=72) where the offspring continued with the same diet as the dam after weaning
Statistical significance; effect of
Diet 0.01 Week <0.001 Sex <0.001 Diet * Week 0.07 Diet * Week * Sex <0.001
Table 6. Intake of amino acids (g/day) in lactating mink dams (n = 4 per treatment group), fed high- (HP), medium- (MP), or low protein (LP) diets, during period 1 (1 - 2 weeks post partum), and period 2 (3 – 4 weeks post partum), calculated in relation to metabolic live weights (kg0.75).
SUMof
EAA
SUMof
NEAAMink Dams(n=12)
Essential amino acids, (EEA) EAA Non-essential amino acids, (NEAA)
Lys Phe Met His Val Ile Leu Thr Arg Trp Cys Gly Asp Ala Tyr Glu Pro Ser
Period 1
HP 2.00 1.08 0.83 0.80 1.49 1.21 1.99 1.21 1.97 0.29 12.9 0.26 2.82 2.65 1.97 0.93 3.89 1.67 1.45 15.6
MP 1.59 0.89 0.64 0.70 1.22 1.00 1.64 0.98 1.56 0.24 10.5 0.23 2.06 2.14 1.53 0.76 3.27 1.26 1.13 12.4
LP 0.92 0.55 0.37 0.45 0.72 0.60 1.00 0.57 0.93 0.14 6.3 0.16 1.18 1.26 0.88 0.47 2.12 0.85 0.68 7.6
Period 2
HP 3.06 1.65 1.27 1.22 2.27 1.85 3.03 1.85 3.01 0.44 19.6 0.39 4.31 4.04 3.00 1.42 5.94 2.55 2.22 23.9
MP 2.32 1.30 0.94 1.01 1.78 1.45 2.39 1.42 2.27 0.35 15.2 0.34 3.01 3.12 2.22 1.11 4.76 1.84 1.65 18.1
LP 1.50 0.90 0.60 0.73 1.18 0.98 1.63 0.93 1.52 0.23 10.2 0.27 1.93 2.06 1.44 0.76 3.46 1.39 1.11 12.4

Nutrient intake, energy metabolism, nitrogen metabolism and substrate oxidationDams fed the HP diet had the highest feed intake (g/day) (Table 4). Intake reflected dietary composition and contents of amino acids, resulting in higher intake of essential and non-essential amino acids in dams fed the HP diet than in dams fed the LP diet (Table 6). However, the metabolisable energy (ME) of the diets ranged from 15.1 MJ/kg DM in the HP diet to 17.1 MJ/kg DM in the LP diet (Table 1), and the intake of ME per kg metabolic body size was significantly (P <
BJCCSB.ORG
Baltic Journal of Comparative & Clinical Systems Biologypage 55
s
Table 3. Sequence of gene specific q PCR primers.
Gene Primer sequence Product size (bp) Genebankaccession No.
G-6-Pase F* 5’-primer: CCG AAT CTA CCT TGC TGC TC
R** 5’-primer: AGT GTC CAC AGG AGG TCC AC AC 207 NM1002993
Fru-1.6-Pase F 5’-primer: TAC CTG GAA GGC ACT TTG CT
R 5’-primer: GAT GCC TCC TCC TCA CTC TG 176 XM547066
PKM2 F 5’-primer: AAGATCACCCTGGACAATGC
R 5’-primer: GGAAGTCAGCACCTTTCTGC 247 XM535531
PEPCK F 5’-primer: GAT GTT CAA TCG CAT CAA CG
R 5’-primer: GGC TGA TTC TTT GCT TCA GG 245 XM_543068
18S rRNA F 5’-primer: GAT ACC GCA GCT AGG AAT
R 5’-primer: ATC TGT CAA TCC TGT CCG 450 AY265350
*F: forward primer **R: reverse primer
Table 4.
Live weights, kg
1200 1255 1237 1263a 1197b 56.4 0.08 < 0.01
Feed intake, g/day
294a 273ab 240b 223a 315b 54.1 0.03 < 0.001
Energy metabolism, kJ/kg0.75/day
ME 1021 1203 1305 950a 1402b 291 0.08 < 0.001
HE 638 628 607 612 637 58.3 NS** NS
LE 666 863 736 486a 1025b 203 0.08 < 0.001
RE -281 -287 -43 -148 -260 291 0.06 NS
RQ 0.756a 0.796b 0.783b 0.777 0.780 0.03 0.03 NS
Substrate oxidation, % of HE
OXP 40a 33b 19c 32 30 3.9 < 0.001 0.06
OXF 55ab 48a 61b 55 55 11.5 0.03 NS
OXCHO 5a 19b 24b 15 17 9.5 < 0.001 NS*RMSE; Root mean square error**NS; No significance or tendency (P > 0.1)abc Values within row that share no common superscript differ significantly (P < 0.05)
Live weights and feed intake in twelve mink dams through week 1 – 4 post partum, and the effect of dietary treatment [high- (HP), medium- (MP) and low protein (LP)], and period of lactation (period 1 = 1 – 2 weeks post partum, and period 2 = 3 -4 weeks post partum), on daily metabo-lisable energy (ME) intake, heat production (HE), calcu-lated energy output in milk (LE), retained energy (RE) and respiratory quotient (RQ) in relation to metabolic body size (LW0.75), and oxidation of protein (OXP), fat (OXF) and carbohydrate (OXCHO) in relation to total HE.
RMSE*
HP MP LP 1 2
Dietary treatment Lactation period P-value; effect of
Diet Period(1-2 weeks)
(3-4 weeks)
Table 5.
Sex Male kits Female kits
Dietary treatment HP MP LP HP MP LP
Kit age, weeks
Birth 12.3 11.2 13.0 10.5 11.6 12.5 50.99
2 80.5 73.9 81.5 67.1 67.9 76.0
4 167.4 168.6 178.4 135.3 154.8 170.3
7 494.3 536.3 498.3 399.5b 461.0a 431.4b
9 844.3 880.1 820.5 640.8b 738.2a 639.5b
a, b Values that share no common superscript differ significantly P<0.05.
Square rootof residuals
Live weights in mink kits (n=84) at birth, 2 and 4 weeks of age, nursed by dams fed high- (HP), medium- (MP), or low protein (LP) diets from parturition, and at seven and nine weeks of age (n=72) where the offspring continued with the same diet as the dam after weaning
Statistical significance; effect of
Diet 0.01 Week <0.001 Sex <0.001 Diet * Week 0.07 Diet * Week * Sex <0.001
Table 6. Intake of amino acids (g/day) in lactating mink dams (n = 4 per treatment group), fed high- (HP), medium- (MP), or low protein (LP) diets, during period 1 (1 - 2 weeks post partum), and period 2 (3 – 4 weeks post partum), calculated in relation to metabolic live weights (kg0.75).
SUMof
EAA
SUMof
NEAAMink Dams(n=12)
Essential amino acids, (EEA) EAA Non-essential amino acids, (NEAA)
Lys Phe Met His Val Ile Leu Thr Arg Trp Cys Gly Asp Ala Tyr Glu Pro Ser
Period 1
HP 2.00 1.08 0.83 0.80 1.49 1.21 1.99 1.21 1.97 0.29 12.9 0.26 2.82 2.65 1.97 0.93 3.89 1.67 1.45 15.6
MP 1.59 0.89 0.64 0.70 1.22 1.00 1.64 0.98 1.56 0.24 10.5 0.23 2.06 2.14 1.53 0.76 3.27 1.26 1.13 12.4
LP 0.92 0.55 0.37 0.45 0.72 0.60 1.00 0.57 0.93 0.14 6.3 0.16 1.18 1.26 0.88 0.47 2.12 0.85 0.68 7.6
Period 2
HP 3.06 1.65 1.27 1.22 2.27 1.85 3.03 1.85 3.01 0.44 19.6 0.39 4.31 4.04 3.00 1.42 5.94 2.55 2.22 23.9
MP 2.32 1.30 0.94 1.01 1.78 1.45 2.39 1.42 2.27 0.35 15.2 0.34 3.01 3.12 2.22 1.11 4.76 1.84 1.65 18.1
LP 1.50 0.90 0.60 0.73 1.18 0.98 1.63 0.93 1.52 0.23 10.2 0.27 1.93 2.06 1.44 0.76 3.46 1.39 1.11 12.4
Figure 1.
800
900
1000
1100
1200
1300
1400
Figure 2.
-7,5
-5,0
-2,5
0,0
2,5
5,0
7,5
Figure 3.
0
1
2
3
4
5
Body weight of mink dams fed high (HP), medium (MP) or low (LP) protein diets through weeks 1 – 10 post partum.
Nitrogen metabolism in lactating mink dams (n = 4 per treatment group) through week 1-4 post partum fed high (HP), medium (MP) or low (LP) protein diets. The presented data are digested nitrogen (DN), urinary nitrogen (UN), retained nitrogen (RN), nitrogen excreted in milk (LN). LS mean values are shown with standard errors of the mean represented by vertical bars. a,b,c LS mean values within measured parameter with unlike lower-case superscript letters were significantly different (P-value < 0.05) between dietary treatment.
The relative abundance of phosphoenol-pyruvate-carboxykinase (PEPCK), fructose-1,6-biphosphatase (Fru-1,6-P2ase), pyruvate kinase (PKM2) and glucose-6-phosphatase (G-6-Pase) mRNA normalized to 18s rRNA in the hepatic tissue of mink dams (n =4 per treatment group) 10 weeks post partum, given a high (HP), medium (MP) or low (LP) protein supply from parturition. LS mean values are shown with standard errors of the mean represented by vertical bars.
Body weight of mink Nitrogen metabolism The relative abundance
0 2 4 6 8 10
Week
Live weight, g g/day Relative abundance
HP
a
a
a
b
c
cb
b
a
MP PEPCK Fru-1.6-P2ase PKM2 G-6-PaseLP
HPMPLP
DN
UN
LN
RNHP
MP
LP

0.05) higher in dams fed the LP diet than dams fed the HP diet, and was increasing (P < 0.001) in all dams with progressive stage of lactation (Table 4). Dams fed the HP diet had higher (P < 0.001) N intakes, and higher (P < 0.01) N excretion via faeces and urine than did dams fed the MP or LP diet. The calculated N excretion in milk did not differ significantly between dams fed HP and MP diets, but was lower in dams fed the LP diet. The amount of retained N (g/day) did neither differ (P > 0.05) between the treatment groups, nor between the two periods of lactation (Figure 2).
Dietary treatment did not affect (P > 0.05) the HE, though the OXP was approximately twice as high (P < 0.001) in dams fed the HP diet as in dams fed the LP diet. The fat oxidation was lowest in the dams fed the MP diet and highest in dams fed the LP diet (P = 0.03). There was no difference between dams fed MP and LP diets in terms of OXCHO, but dams fed the HP diet had a significantly lower OXCHO (P < 0.001).
The LE tended to
BJCCSB.ORG
Baltic Journal of Comparative & Clinical Systems Biologypage 56
s
Table 3. Sequence of gene specific q PCR prim
ers.
Gene
Prim
er sequence Product size (bp)
Genebankaccession N
o.
G-6-Pase
F*
5’-primer: CCG
AAT CTA
CCT TGC TG
C TC
R
** 5’-prim
er: AG
T GTC CA
C AG
G A
GG
TCC AC A
C 207
NM
1002993
Fru-1.6-Pase F
5’-primer: TA
C CTG G
AA
GG
C ACT TTG
CT
R
5’-primer: G
AT GCC TCC TCC TCA
CTC TG
176 X
M547066
PKM2
F 5’-prim
er: AA
GATCA
CCCTGG
ACA
ATGC
R
5’-primer: G
GA
AG
TCAG
CACCTTTCTG
C 247
XM
535531
PEPCK F
5’-primer: G
AT GTT CA
A TCG
CAT CAA
CG
R
5’-primer: G
GC TG
A TTC TTT G
CT TCA G
G
245 X
M_543068
18S rRNA
F
5’-primer: G
AT ACC G
CA G
CT AG
G A
AT
R
5’-primer: ATC TG
T CAA
TCC TGT CCG
450
AY265350
*F: forward prim
er **R: reverse primer
Table 4.
Live weights, kg
1200
1255 1237
1263a
1197b
56.4 0.08
< 0.01
Feed intake, g/day
294
a 273
ab 240
b 223
a 315
b 54.1
0.03 <
0.001
Energy metabolism
, kJ/kg0.75/day
ME
1021 1203
1305 950
a 1402
b 291
0.08 <
0.001
HE
638 628
607 612
637 58.3
NS
** N
S
LE 666
863 736
486a
1025b
203 0.08
< 0.001
RE -281
-287 -43
-148 -260
291 0.06
NS
RQ
0.756a
0.796b
0.783b
0.777 0.780
0.03 0.03
NS
Substrate oxidation, % of H
E
OX
P 40
a 33
b 19
c 32
30 3.9
< 0.001
0.06
OX
F 55
ab 48
a 61
b 55
55 11.5
0.03 N
S
OX
CHO
5
a 19
b 24
b 15
17 9.5
< 0.001
NS
*RMSE; Root m
ean square error**N
S; No significance or tendency (P >
0.1)abc Values w
ithin row that share no com
mon superscript differ significantly (P <
0.05)
Live weights and feed intake in tw
elve mink dam
s through w
eek 1 – 4 post partum, and the effect of dietary treatm
ent [high- (H
P), medium
- (MP) and low
protein (LP)], and period of lactation (period 1 = 1 – 2 w
eeks post partum,
and period 2 = 3 -4 weeks post partum
), on daily metabo-
lisable energy (ME) intake, heat production (H
E), calcu-lated energy output in m
ilk (LE), retained energy (RE) and respiratory quotient (RQ
) in relation to metabolic body
size (LW0.75), and oxidation of protein (O
XP), fat (OXF)
and carbohydrate (OXCH
O) in relation to total H
E.
RMSE
*
HP
MP
LP 1
2
Dietary treatm
ent Lactation period
P-value; effect of
Diet Period
(1-2 w
eeks)(3-4 w
eeks)
Table 5.
Sex M
ale kits Fem
ale kits
Dietary
treatment
HP
MP
LP H
P M
P LP
Kit age, w
eeks
Birth 12.3
11.2 13.0
10.5 11.6
12.5 50.99
2 80.5
73.9 81.5
67.1 67.9
76.0
4 167.4
168.6 178.4 135.3
154.8 170.3
7 494.3
536.3 498.3 399.5
b 461.0
a 431.4
b
9 844.3
880.1 820.5 640.8
b 738.2
a 639.5
b
a, b Values that share no comm
on superscript differ significantly P<0.05. Square root
of residuals
Live weights in m
ink kits (n=84) at birth, 2 and 4 weeks of
age, nursed by dams fed high- (H
P), medium
- (MP), or low
protein (LP) diets from
parturition, and at seven and nine w
eeks of age (n=72) where the offspring continued w
ith the sam
e diet as the dam after w
eaning
Statistical significance; effect of
Diet
0.01
W
eek <
0.001
Sex <
0.001
Diet * W
eek
0.07
Diet * W
eek * Sex <0.001
Table 6. Intake of am
ino acids (g/day) in lactating mink dam
s (n = 4 per treatment group), fed high- (H
P),
medium
- (MP), or low
protein (LP) diets, during period 1 (1 - 2 weeks post partum
), and period 2
(3 – 4 weeks post partum
), calculated in relation to metabolic live w
eights (kg0.75).
SUMof
EAA
SUMof
NEAA
Mink
Dam
s(n=12)
Essential amino acids, (EEA)
EAA Non-essential am
ino acids, (NEAA)
Lys
Phe M
et H
is Val
Ile Leu
Thr Arg
Trp
Cys G
ly Asp
Ala Tyr
Glu
Pro Ser
Period 1
HP
2.00 1.08
0.83 0.80
1.49 1.21
1.99 1.21
1.97 0.29
12.9 0.26
2.82 2.65
1.97 0.93
3.89 1.67
1.45 15.6
MP
1.59 0.89
0.64 0.70
1.22 1.00
1.64 0.98
1.56 0.24
10.5 0.23
2.06 2.14
1.53 0.76
3.27 1.26
1.13 12.4
LP 0.92
0.55 0.37
0.45 0.72
0.60 1.00
0.57 0.93
0.14 6.3
0.16 1.18
1.26 0.88
0.47 2.12
0.85 0.68
7.6
Period 2
HP
3.06 1.65
1.27 1.22
2.27 1.85
3.03 1.85
3.01 0.44
19.6 0.39
4.31 4.04
3.00 1.42
5.94 2.55
2.22 23.9
MP
2.32 1.30
0.94 1.01
1.78 1.45
2.39 1.42
2.27 0.35
15.2 0.34
3.01 3.12
2.22 1.11
4.76 1.84
1.65 18.1
LP 1.50
0.90 0.60
0.73 1.18
0.98 1.63
0.93 1.52
0.23 10.2
0.27 1.93
2.06 1.44
0.76 3.46
1.39 1.11
12.4
be higher (P = 0.08) in dams fed the MP diet, than dams on other treatments. However, LE increased (P < 0.001) in all dams as lactation progressed. Dams on all treatments were in negative energy balance during lactation, but dams fed the LP diet tended (P = 0.06) to lose less energy than dams fed the HP and MP diets (Table 4).
BJCCSB.ORG
Baltic Journal of Comparative & Clinical Systems Biologypage 57
s
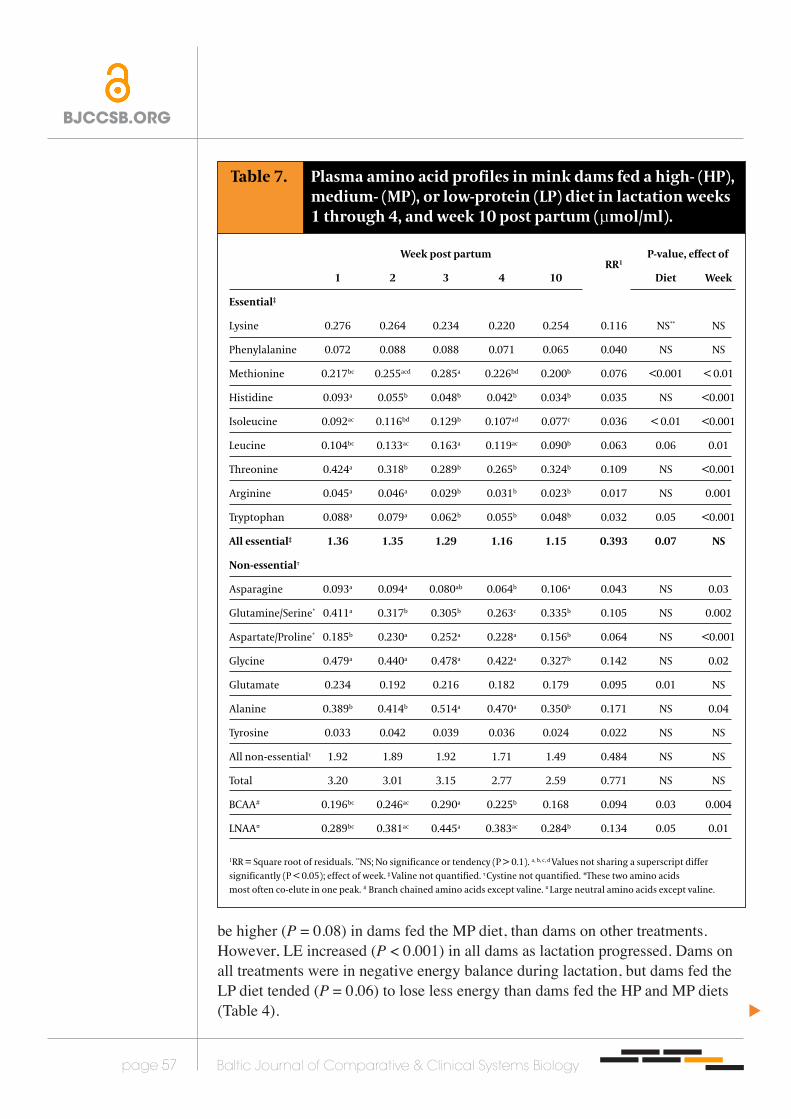
Table 7. Plasma amino acid profiles in mink dams fed a high- (HP), medium- (MP), or low-protein (LP) diet in lactation weeks 1 through 4, and week 10 post partum (µmol/ml).
Week post partum RR1
P-value, effect of
1 2 3 4 10 Diet Week
Essential‡
Lysine 0.276 0.264 0.234 0.220 0.254 0.116 NS** NS
Phenylalanine 0.072 0.088 0.088 0.071 0.065 0.040 NS NS
Methionine 0.217bc 0.255acd 0.285a 0.226bd 0.200b 0.076 <0.001 < 0.01
Histidine 0.093a 0.055b 0.048b 0.042b 0.034b 0.035 NS <0.001
Isoleucine 0.092ac 0.116bd 0.129b 0.107ad 0.077c 0.036 < 0.01 <0.001
Leucine 0.104bc 0.133ac 0.163a 0.119ac 0.090b 0.063 0.06 0.01
Threonine 0.424a 0.318b 0.289b 0.265b 0.324b 0.109 NS <0.001
Arginine 0.045a 0.046a 0.029b 0.031b 0.023b 0.017 NS 0.001
Tryptophan 0.088a 0.079a 0.062b 0.055b 0.048b 0.032 0.05 <0.001
All essential‡ 1.36 1.35 1.29 1.16 1.15 0.393 0.07 NS
Non-essentialτ
Asparagine 0.093a 0.094a 0.080ab 0.064b 0.106a 0.043 NS 0.03
Glutamine/Serine* 0.411a 0.317b 0.305b 0.263c 0.335b 0.105 NS 0.002
Aspartate/Proline* 0.185b 0.230a 0.252a 0.228a 0.156b 0.064 NS <0.001
Glycine 0.479a 0.440a 0.478a 0.422a 0.327b 0.142 NS 0.02
Glutamate 0.234 0.192 0.216 0.182 0.179 0.095 0.01 NS
Alanine 0.389b 0.414b 0.514a 0.470a 0.350b 0.171 NS 0.04
Tyrosine 0.033 0.042 0.039 0.036 0.024 0.022 NS NS
All non-essentialτ 1.92 1.89 1.92 1.71 1.49 0.484 NS NS
Total 3.20 3.01 3.15 2.77 2.59 0.771 NS NS
BCAA# 0.196bc 0.246ac 0.290a 0.225b 0.168 0.094 0.03 0.004
LNAA¤ 0.289bc 0.381ac 0.445a 0.383ac 0.284b 0.134 0.05 0.01
1RR = Square root of residuals. **NS; No significance or tendency (P > 0.1). a, b, c, d Values not sharing a superscript differ significantly (P < 0.05); effect of week. ‡ Valine not quantified. τ Cystine not quantified. *These two amino acids most often co-elute in one peak. # Branch chained amino acids except valine. ¤ Large neutral amino acids except valine.
Table 9.
Dams
Body weight, g 1082 1114 1099 96.2 NS** 0.02 NS
Liver, g 38.0a 34.1a 28.6b 4.70 0.003 0.07 NS
Liver, % of BW 3.52a 3.07ab 2.60b 0.50 0.005 NS NS
Kits
Body weight, g 2 44.8b 51.7b 74.2a 23.69 <0.001 <0.001 0.004
3 63.2b 103.0a 86.5a
4 139.0 152.9 146.8
Liver, g 2 1.72b 2.27b 2.77a 0.99 <0.001 <0.001 0.06
3 2.61b 3.84a 3.20a
4 4.59b 5.44a 6.24a
Liver, % of BW 2 4.11b 4.68a 3.75c 0.60 0.14 <0.001 <0.001
3 3.84 3.72 3.69
4 3.30b 3.57b 4.23a
*RMSE; Root mean square error. **NS; No significance or tendency (P > 0.1)a, b, c Values that share no common superscript differ significantly (P<0.05) as an effect of dam dietary treatment group.
Experiment 2. Dam and kit liver weights in lactation weeks 2 through 4
Diet P-value; effect of
HP MP LP Diet (D) Week (W) D*WRMSE*Week
Plasma amino acid profilesPlasma amino acid profiles in the dams were generally unaffected (P > 0.05) by dietary treatment, except that LP dams had lower (P < 0.05) methionine, isoleucine, and leucine concentrations than dams fed the HP diet, and higher (P < 0.05) glutamate concentration than dams on both HP and MP dietary treatments. In fact, methionine concentrations differed (P < 0.001) between all treatment groups, being lowest in dams fed the LP diet and highest in dams fed the HP diet.
Both the branched chained amino acids (BCAA) and the large neutral amino acids (LNAA) were significantly lower (P < 0.05) in dams fed the LP diet than dams fed the HP diet. As the 10-weeks experimental period progressed, most of the free amino acids in plasma decreased (P < 0.05) in all dams (Table 7).
Liver, kidney and intestinal masses, and mRNA relative abundanceLiver masses and intestinal mass and length were similar (P > 0.05) among dams on different dietary treatments. Dams fed the HP diet, however, had larger (P < 0.01) kidney masses than dams fed MP and LP diets (Table 8). Further, there were no differences (P > 0.05) in the relative abundance of any of the studied mRNAs among the dams (Figure 3).
Experiment 2The absolute and relative liver weights of the dams were significantly (P=0.003 and P=0.005, respectively) affected by dietary treatment, dams fed the HP diet having the highest liver weights and the largest livers in relation to body weight, and dams fed the LP had the smallest both in absolute and relative terms. MP dams were intermediate and absolute liver weights did not differ from those of HP dams. Relative liver weights of MP dams did not differ from any of the other
BJCCSB.ORG
Baltic Journal of Comparative & Clinical Systems Biologypage 58
s
Figure 1.
800
900
1000
1100
1200
1300
1400
Figure 2.
-7,5
-5,0
-2,5
0,0
2,5
5,0
7,5
Figure 3.
0
1
2
3
4
5
Body weight of mink dams fed high (HP), medium (MP) or low (LP) protein diets through weeks 1 – 10 post partum.
Nitrogen metabolism in lactating mink dams (n = 4 per treatment group) through week 1-4 post partum fed high (HP), medium (MP) or low (LP) protein diets. The presented data are digested nitrogen (DN), urinary nitrogen (UN), retained nitrogen (RN), nitrogen excreted in milk (LN). LS mean values are shown with standard errors of the mean represented by vertical bars. a,b,c LS mean values within measured parameter with unlike lower-case superscript letters were significantly different (P-value < 0.05) between dietary treatment.
The relative abundance of phosphoenol-pyruvate-carboxykinase (PEPCK), fructose-1,6-biphosphatase (Fru-1,6-P2ase), pyruvate kinase (PKM2) and glucose-6-phosphatase (G-6-Pase) mRNA normalized to 18s rRNA in the hepatic tissue of mink dams (n =4 per treatment group) 10 weeks post partum, given a high (HP), medium (MP) or low (LP) protein supply from parturition. LS mean values are shown with standard errors of the mean represented by vertical bars.
Body weight of mink Nitrogen metabolism The relative abundance
0 2 4 6 8 10
Week
Live weight, g g/day Relative abundance
HP
a
a
a
b
c
cb
b
a
MP PEPCK Fru-1.6-P2ase PKM2 G-6-PaseLP
HPMPLP
DN
UN
LN
RNHP
MP
LP
treatment groups. In kits maternal diet affected absolute (P<0.001) but not relative (P=0.14) liver weights, but there was a tendency (P=0.06) for an interaction between maternal diet and suckling week for the absolute weights, and a significant interaction (P<0.001) for relative weights. Absolute liver weights were generally highest in kits from dams fed the LP diet and lowest in those suckled by dams on the HP diet, and differences were significant (P<0.05) in all measured suckling weeks. Absolute
weights of livers from MP kits were similar to those of HP kits in suckling week 2, but similar to those of LP kits in weeks 3 and 4. Relative to body weight there was no clear pattern with the MP kits having the highest ratio between liver and body weight in suckling week 2. In suckling week 3 there was no difference in relative liver weight between treatment groups, whereas in week 4 kits suckled by HP dams had the smallest, and kits from LP dams the largest, relative liver weights. In kits suckled by HP and MP dams the relative liver weight declined significantly (P<0.01) from suckling week 2 to 4, but this was not the case in LP kits (Table 9). There was no obvious pattern of a correlation between kit body weight and relative liver weight.
DiscussionMetabolic flexibility is the capacity of the organism to adapt fuel oxidation to fuel availability. Adaptation to dietary N intake is essential, because the capacity of the body to store N is limited22. The mechanisms by which adaptation is achieved include changes in protein oxidation and protein turnover. Protein oxidation is a term used to describe the release of energy from the carbon skeleton of amino acids after deamination, which is affected by amino acid catabolic enzymes23. Most animals can up- and down-regulate those catabolic enzymes in order to
BJCCSB.ORG
Baltic Journal of Comparative & Clinical Systems Biologypage 59
>> Metabolic adaptation in
lactating mink dams seems
limited mainly to adjust-
ment of liver mass, but that
the relative abundance of mRNA for key
gluconeogenic enzymes is un-
affected by diet
indicating that these animals have a limited
capacity to regulate en-
zyme activity.
s
Table 1. Ingredient and chemical composition of diets fed to lactating mink dams, providing a high- (HP), medium-(MP) or low protein (LP) supply.
Dietary treatment
HP MP LPPlanned protein:fat:carbohydrate ratio (% of ME) 60:35:5 45:40:15 30:45:25
Ingredient composition, g/kg
Cod offal 500 350 250
Cod, whole 100 100 100
Fish meal 80 60 0
Chicken, whole1 200 250 300
Barley and wheat (heat treated) (1:1) 20 40 80
Steamed rolled oats 0 20 40
Potato mash powder 5 25 40
Rape-seed oil 0 10 20
Vitamin/mineral mixture2 2.5 2.5 2.5
Water 92.5 142.5 167.5
Chemical composition
Dry matter (DM), g/kg 292 312 335
Ash, g/kg DM 174 130 103
Crude protein, g/kg DM 605 513 325
Fat, g/kg DM 125 159 171
Carbohydrates, g/kg DM 96 198 401
Gross energy (GE), MJ/kg DM 20.8 21.8 21.9
Digestibility of nutrients
Protein; fat; carbohydrates 80; 96; 86 81; 97; 81 78; 96; 84
Metabolisable energy (ME)
ME, MJ/kg DM3 15.1 16.6 17.1
Protein:fat:carbohydrate ratio, (% of ME) 59:31:10 46:37:17 27:38:35
1Chicken prepared for human consumption, i.e. without head, feet, feather, or entrails.2Containing, in mg/kg: α-tocopherol 21840, thiamine 10000, riboflavin 4800, pyridoxine 3200, D-pantothenic acid 3200, nicotinic acid 8000, betain anhydrous 33600, folic acid 240, biotin 80, cyanocobalamin 16, para-aminobenzoic acid 800, Fe 19712, Zn 12560, Mn 6237, and Cu 1025; in i.u. g: retinol 2800 and cholecalciferol 280.3Calculated using individual coefficients of digestibility for the diets, the amount of digestible nutrient/kg diet, and metabolisable energy coefficients (18.4 kJ, 39.8 kJ, and 17.6 kJ/g digested protein, fat, and carbohydrate).
Table 2.
Dietary treatment
HP MP LP
Essential amino acids
Lysine 40.7 32.5 21.2
Phenylalanine 22.0 18.2 12.7
Methionine 16.9 13.1 8.5
Histidine 16.2 14.2 10.4
Valine 30.2 24.9 16.7
Isoleucine 24.6 20.3 13.9
Leucine 40.4 33.5 23.0
Threonine 24.7 19.9 13.2
Arginine 40.1 31.8 21.5
Tryptophan 5.8 4.9 3.3
All essential 255.8 207.4 141.1
Non-essential amino acids Cystine 5.2 4.7 3.8
Glycine 57.4 42.1 27.3
Aspartate 53.8 43.7 29.2
Alanine 40.0 31.1 20.4
Tyrosine 18.9 15.5 10.8
Glutamate 79.1 66.6 49.0
Proline 33.9 25.7 19.7
Serine 29.5 23.1 15.7
All non-essential 317.8 252.5 175.9
Sum of amino acids 573.6 459.9 317.8
Table 2: Amino acid (g/kg dry matter) composition of the experimental diets; (high protein (HP), medium protein (MP), and low protein (LP)).
Table 8. Live weights (LW), body length (BL), liver, kidney and intestinal masses in percent of LW, length of intestine and length of intestine in relation to body length 10 weeks post partum in mink dams (n = 4 per treatment group), given a high (HP), medium (MP) or low (LP) protein supply from parturition.
Dietary treatment
HP MP LP RMSE* Diet
LW, g 1155 1146 1121 138 NS**
BL, cm 42.8 41.9 42.5 0.94 NS
Liver, % of LW 3.88 3.35 3.68 0.57 NS
Kidney, % of LW 0.77a 0.65b 0.62b 0.06 < 0.01
Intestine, % of LW 3.67 3.06 3.09 0.36 0.07
Intestine, cm 175.8 160.3 168.3 3.14 0.07
Intestine:BL 4.1 3.8 4.0 0.17 NS
*RMSE; Root mean square error. **NS; No significance or tendency (P > 0.1)abValues within row that share no common superscript differ significantly (P < 0.05)
P-value; effect of

maintain amino acid homeostasis. This regulation may occur by changing the rate of enzyme degradation or, more generally, by changing the rate of enzyme synthesis through increasing the rate of mRNA synthesis2,24,25. Although it is generally accepted that the hepatic ureagenic, gluconeogenic and catabolic enzymes of strictly carnivorous animals have a very limited capacity to adapt effectively to a varied dietary protein supply, findings in mink5, 7, 26, 27 and cat3, 4,
24, 28, 29 have demonstrated that metabolic adaptation may be less limited in such animals than earlier suggested. In the present study we investigated whether the metabolic adaptation previously indicated in lactating minks may be reflected in changes in functional liver mass of the lactating dam, and if any such changes remain after weaning off the kits. Further, we investigated whether the post-weaning transcriptional level of key hepatic enzymes indicates ability to adapt mRNA abundance to substrate availability.
Although dams fed the HP diet had higher feed intake than LP dams, their ME intake (kJ/kg0.75/day) was lower, and these dams lost more weight than LP and MP dams during the first four weeks of lactation. The excess protein content of the HP diet was also indicated by the high amount of excess N excreted in urine. In the present study, indirect calorimetry was used to assess substrate oxidation.
BJCCSB.ORG
Baltic Journal of Comparative & Clinical Systems Biologypage 60
s
Table 7. Plasma amino acid profiles in mink dams fed a high- (HP), medium- (MP), or low-protein (LP) diet in lactation weeks 1 through 4, and week 10 post partum (µmol/ml).
Week post partum RR1
P-value, effect of
1 2 3 4 10 Diet Week
Essential‡
Lysine 0.276 0.264 0.234 0.220 0.254 0.116 NS** NS
Phenylalanine 0.072 0.088 0.088 0.071 0.065 0.040 NS NS
Methionine 0.217bc 0.255acd 0.285a 0.226bd 0.200b 0.076 <0.001 < 0.01
Histidine 0.093a 0.055b 0.048b 0.042b 0.034b 0.035 NS <0.001
Isoleucine 0.092ac 0.116bd 0.129b 0.107ad 0.077c 0.036 < 0.01 <0.001
Leucine 0.104bc 0.133ac 0.163a 0.119ac 0.090b 0.063 0.06 0.01
Threonine 0.424a 0.318b 0.289b 0.265b 0.324b 0.109 NS <0.001
Arginine 0.045a 0.046a 0.029b 0.031b 0.023b 0.017 NS 0.001
Tryptophan 0.088a 0.079a 0.062b 0.055b 0.048b 0.032 0.05 <0.001
All essential‡ 1.36 1.35 1.29 1.16 1.15 0.393 0.07 NS
Non-essentialτ
Asparagine 0.093a 0.094a 0.080ab 0.064b 0.106a 0.043 NS 0.03
Glutamine/Serine* 0.411a 0.317b 0.305b 0.263c 0.335b 0.105 NS 0.002
Aspartate/Proline* 0.185b 0.230a 0.252a 0.228a 0.156b 0.064 NS <0.001
Glycine 0.479a 0.440a 0.478a 0.422a 0.327b 0.142 NS 0.02
Glutamate 0.234 0.192 0.216 0.182 0.179 0.095 0.01 NS
Alanine 0.389b 0.414b 0.514a 0.470a 0.350b 0.171 NS 0.04
Tyrosine 0.033 0.042 0.039 0.036 0.024 0.022 NS NS
All non-essentialτ 1.92 1.89 1.92 1.71 1.49 0.484 NS NS
Total 3.20 3.01 3.15 2.77 2.59 0.771 NS NS
BCAA# 0.196bc 0.246ac 0.290a 0.225b 0.168 0.094 0.03 0.004
LNAA¤ 0.289bc 0.381ac 0.445a 0.383ac 0.284b 0.134 0.05 0.01
1RR = Square root of residuals. **NS; No significance or tendency (P > 0.1). a, b, c, d Values not sharing a superscript differ significantly (P < 0.05); effect of week. ‡ Valine not quantified. τ Cystine not quantified. *These two amino acids most often co-elute in one peak. # Branch chained amino acids except valine. ¤ Large neutral amino acids except valine.
Table 9.
Dams
Body weight, g 1082 1114 1099 96.2 NS** 0.02 NS
Liver, g 38.0a 34.1a 28.6b 4.70 0.003 0.07 NS
Liver, % of BW 3.52a 3.07ab 2.60b 0.50 0.005 NS NS
Kits
Body weight, g 2 44.8b 51.7b 74.2a 23.69 <0.001 <0.001 0.004
3 63.2b 103.0a 86.5a
4 139.0 152.9 146.8
Liver, g 2 1.72b 2.27b 2.77a 0.99 <0.001 <0.001 0.06
3 2.61b 3.84a 3.20a
4 4.59b 5.44a 6.24a
Liver, % of BW 2 4.11b 4.68a 3.75c 0.60 0.14 <0.001 <0.001
3 3.84 3.72 3.69
4 3.30b 3.57b 4.23a
*RMSE; Root mean square error. **NS; No significance or tendency (P > 0.1)a, b, c Values that share no common superscript differ significantly (P<0.05) as an effect of dam dietary treatment group.
Experiment 2. Dam and kit liver weights in lactation weeks 2 through 4
Diet P-value; effect of
HP MP LP Diet (D) Week (W) D*WRMSE*Week

Since the protein oxidation measured by indirect calorimetry in fact is a measure of protein deamination, measurement of amino acids used in gluconeogenesis, and consequently amino acids lost from protein metabolism, is included. Similar to previous findings in mink5,7,8, we found that the differences between the protein and carbohydrate contents of the diets were clearly reflected in the substrate oxidation, resulting in LP dams having the lowest OXP and highest OXCHO, and dams fed the HP diet having the highest OXP and lowest OXCHO as a percentage of HE. The OXP in LP dams was though higher (19 %) than the 13 % of HE seen for lactating sows fed balanced diets30. Since the N-balances did not reflect mobilization of lean tissue mass, this level of OXP indicates that the LP diet sustained the protein requirement of the lactating mink. Thus, these results support the suggestion that lactating mink dams have some ability to regulate its protein oxidation rate when protein supply is reduced.
The kidney mass was greater in dams fed the HP diet than those fed the LP diet. The kidneys have two primary functions, i.e. waste excretion and water excretion regulation. The main waste compound of protein metabolism is urea, and increased protein intake is known to cause renal hypertrophy and increase the glomerular filtration rate31. Thus, the increased kidney size in the animals fed the HP diet reflects an adaptive response to filtration induced by increased protein intake. This is also found in rats32 and mice33. As well, although not to the same extent as in the liver, gluconeogenesis also occurs in the cortex of the kidneys. It has been demonstrated that rats allocated to low carbohydrate diets have increased rates of gluconeogenesis in kidney tissue34. In the present study, renal enzyme activities were not investigated. However, the increased kidney mass in dams fed the HP diets may indicate more gluconeogenetic activity in these animals.
High protein diets have been demonstrated to increase liver weight in rat35, pig36, 37 and cat38, and protein restriction has tended to reduce the functional liver mass in mink7 and in suckling rats9. These adaptations in liver weights will, despite unchanged activity of the amino acid degrading enzymes per gram of liver, increase the rate of amino acid catabolism39. The present study gave diverging results since liver weights (both absolute weights and in percent of live weights) did not differ among dams exposed to different dietary treatments in Experiment 1, while a clear diet effects for dams was shown in Experiment 2 with those fed the HP diet having significantly higher liver mass than those fed the LP diet. However, the livers from the dams in Experiment 1 were collected after weaning of the kits, whereas those from Experiment 2 derived from lactating dams. This may explain the seen differences. Furthermore, dietary treatment did not affect the abundance of the studied mRNAs in dam hepatic tissue, suggesting that the level of transcript did not respond to dietary protein provision. If the level of transcript could be directly translated to enzyme activity, our results would have corroborated the view that mink, like cat, cannot regulate the rate of hepatic enzyme activity, including gluconeogenesis, but this needs to be confirmed. Mink even seems to have higher glycolytic and gluconeogenic enzyme activities
BJCCSB.ORG
Baltic Journal of Comparative & Clinical Systems Biologypage 61
s
compared to the corresponding activities in rat and cat40. However, it may be other enzymes than those investigated in the present study that are of more importance for metabolic regulation in mink, such as the trans-aminating and de-aminating enzymes. Furthermore, tissue collection and evaluation of gene expression occurred in dams three weeks after weaning of their kits, and thus the metabolic pressure on the dams was less than during lactation. Therefore it cannot be excluded that results had been different if the dams were still lactating.
Other mechanisms of importance for adaptation to dietary N intake in humans include salvage of urea-N by the gastrointestinal microflora41, 42. It has been suggested that when the dietary protein intake is low, a larger proportion of the urea production is transferred to the gut, followed by hydrolysis to NH3 that can be used to support the intestinal microbial population. These microbes can then provide a source of amino acid and nucleic acid-N to non-ruminant animals43 and humans41, 44. An increased entry of urea into the gastro-intestinal tract during low dietary protein intakes will then, potentially, enable more urea-N to be retained which might be beneficial under conditions where the protein supply is low(41). This salvage of urea-N has been shown to contribute to positive N-balance in rats43. However, high-protein-fed (70 % energy from protein) cats showed an increased urea production, but a very low rate of gut entry of urea-N, and cats fed a moderate (20 % energy from protein) protein diet had no increased urea recycling24. The authors suggested that carnivore species with the very short gastro-intestinal tract have a low microbial urease activity and may therefore not be able to salvage urea-N when the protein supply is low. It is though possible that adaptation of these mechanisms first come into force when the protein supply is below the requirement. In the present study, the amount of retained N did not differ among the dams. This supports the suggestion that mink, like cat, is not able to adapt to different protein levels by changes in the microbial urease activity. However, if such adaptations first occur when the protein supply is below the requirement, the result from the present study supports the assumption that the LP diet sustained the protein requirement of the lactating mink.
It has been demonstrated that the rate of protein turnover in adult cats may adapt to the dietary protein level29. Furthermore, by increasing the dietary content of bacterial protein meal, the protein turnover rate increased in male mink45. However, only a very limited impact on protein turnover has been indicated in lactating mink when feeding medium or low protein diets46, 47. Similar to earlier findings in lactating mink5,6, dams fed the LP diet in Experiment 1 seemed to raise the heaviest kits over the first four weeks of lactation, but the effects were non-significant. As well, live weights among dams tended to differ during the first four weeks of lactation, where dams fed the HP diet lost more of their body weight than dams fed the LP diet. In the fourth week of lactation, dams fed the LP diet had intakes of some amino acids (leucine and cystine) which were lower than the previously estimated requirements6. Nevertheless, this was not reflected in the plasma amino-acid profiles. The plasma amino-acid profile is mainly the
BJCCSB.ORG
Baltic Journal of Comparative & Clinical Systems Biologypage 62
s

result of the dietary protein concentration and the pattern of the protein ingested, the catabolism of amino acids, and protein turnover48. For the most limiting amino acids in a diet the observed concentration in plasma parallels their rank in dietary protein49. Ten weeks post partum, three weeks after weaning, live weights among dams did not differ, and we did not find any association between concentrations of amino acids supplied by the diet and the concentration of free amino acids in plasma. These findings support prior suggestions that diets with restricted protein content may be beneficial during lactation, since such diets may be more efficiently used for milk production, and also preventing weight loss. An explanation for this improved performance may be reduced energetic costs for glucose production by less amino acids being used in gluconeogenesis and as energy source. In addition, the results may also indicate that the LP diet was providing sufficient protein and energy supply to the dams in this period.
ConclusionThe dietary protein provision in the present study was clearly reflected in the rate of protein oxidation and in hepatic tissue mass during lactation, but when dams were euthanized three weeks after weaning, diet did not affect the abundance of the studied mRNAs in hepatic tissue or tissue mass. Lactating, but not dry, dams on the HP diet had larger relative liver mass than those fed LP. It may therefore be that the metabolic adaptation in lactating dams is not caused by any significant capacity to regulate the rate of gluconeogenesis, but may be caused by changes in relative liver mass. Further, protein turnover seems little affected by protein provision, and salvage of urea-N by the gastro-intestinal microflora is probably negligible. It is possible that other enzymes than those investigated in the present study are more important for N conservation in mink. To clarify the metabolic adaptation in mink further studies are needed, among those investigations to reveal if the level of transcript is mirrored by the level of the corresponding protein, and into the adaptability of ureagenic, transaminating, and deaminating enzymes.
AcknowledgementsExperiment 1 was part of project no. 2013-01-0027 of the Committee on Innovative Post Docs, Danish Research Agency, “Reduced protein supply to lactating mink: animal performance and environmental aspects” to Rikke Fink, financially co-supported by the Danish Fur Breeders Research Centre. Experiment 2 was part of the Nordic Joint Committee for Agricultural Research Project No. 100 “Stable isotopes in comparative studies of milk production and energy requirement in pigs, mink and foxes” to Anne-Helene Tauson, financially supported by The Danish Veterinary and Agricultural Research Council, Grant No. 9701275. The authors wish to thank Merethe Stubgaard for skilled technical assistance throughout the experiment, Abdalla Ali for performing the respiration experiments, and Hilmer Sørensen for performing the amino acid analyses in plasma.
BJCCSB.ORG
Baltic Journal of Comparative & Clinical Systems Biologypage 63
s

Author contributionsRF performed Experiment 1 as part of her post doc, and participated in Experiment 2. She drafted the first manuscript which was later rewritten and finalized by CL. The qPCR studies were supervised by PDT who critically revised the manuscript and in a later phase by CFM who likewise participated in writing up and revising the manuscript. AHT, supervisor of RF, CFM and CL, supervised the design of the studies, led the group, critically discussed and revised the manuscript. The authors declare that there are no conflicts of interest.
References1. Waterlow JC. The mysteries of nitrogen balance. Nutr Res Rev 1999; 12:
25-54. DOI:10.1079/0954422991087288572. Rogers QR, Morris JG, Freedland RA.Lack of hepatic enzymatic
adaptation to low and high levels of dietary protein in the adult cat. Enzyme 1977; 22: 348-356.
3. Russell K, Murgatroyd PR & Batt RM. Net protein oxidation is adapted to dietary protein intake in domestic cats (Felis silvestris catus). J Nutr 2002; 132: 456-460.
4. Green AS, Ramsey JJ, Villaverde C, et al. Cats are able to adapt protein oxidation to protein intake provided their requirement for dietary protein is met. J Nutr 2008; 138: 1053–1060.
5. Fink R, Tauson A-H, Chwalibog A, et al. Effects of substitution of dietary protein with carbohydrate on lactation performance in the mink (Mustela vison). J Anim Feed Sci 2004; 13: 647-664.
6. Fink R, Tauson A-H, Chwalibog A, et al. A first estimate of the amino acid requirement for milk production of the high-producing female mink (Mustela vison). J Anim Physiol Anim Nutr 2006; 90: 60-69.DOI: 10.1111/j.1439-0396.2005.00564.x
7. Matthiesen CF, Blache D, Thomsen PD, et al. Effect of late gestation low protein supply to mink (Mustela vison) dams on reproductive performance and metabolism of dam and offspring. Arch Anim Nutr 2010; 64: 56-769. DOI: 10.1080/17450390903299141
8. Tauson A-H, Fink R & Chwalibog A. Protein as an energy source for lactating mink (Mustela vison) estimated by breath test measurements of decarboxylation of 1-13C-labelled leucine. In: Energy metabolism in animals, EAAP Publication 2001;103: 261-264.
9. Desai M, Crowther NJ, Lucas A, et al. Organ-selective growth in the offspring of protein-restricted mothers. Brit J Nutr 1996; 76: 591-603. DOI: 10.1079/BJN19960065
10. European convention for the protection of vertebrate animals used for experimental and other scientific purposes. Strasbourg, Council of Europe. European Treaty Series 1986; 123.
11. Nes N, Einarsson EJ, Lohi O. Beautiful fur animals and their colour
BJCCSB.ORG
Baltic Journal of Comparative & Clinical Systems Biologypage 64
s

genetics. Denmark: Scientifur Hillerød 1987.12. Jørgensen G, Glem-Hansen N. A cage designed for metabolism and
nitrogen balance trials with mink. Acta Agric Scand 1973; 23: 3-5.13. Wamberg S, Tauson A-H, Elnif J. Effects of feeding and short-term
fasting on water and electrolyte turnover in female mink (Mustela vison). Br J Nutr 1996; 76: 711-725. DOI: 10.1079/BJN19960078
14. Chwalibog A, Tauson A-H, Thorbek G.. Energy metabolism and substrate oxidation in pigs during feeding, starvation and re-feeding. J Anim Physiol Anim Nutr 2004; 88: 101-112. DOI: 10.1111/j.1439-0396.2003.00465.x
15. Sørensen H, Sørensen S, Bjergegaard C, et al. (1999) Chromatography and Capillary Electrophoresis in Food Analysis. 1999. RSC Publishing, Cambridge, UK.
16. Eggum BO, Sørensen H. Chemistry and analysis of amino acids. In: Absorption and Utilization of Amino Acids 1989; III: 265-295. [M Friedman, editor]. CRC Press, Boca Raton, FL.
17. Brouwer E. Report of Sub-committe on Constants and Factors. EAAP Publication 1965; 11. Academic Press, London.
18. Chwalibog A, Jakobsen K, Henckel S, et al. (1992) Estimation of quantitative oxidation and fat retention from carbohydrate, protein and fat in growing pigs. J Anim Physiol Anim Nutr 1992; 68: 123-135.
19. Tauson A-H, Fink R, Hansen KB, et al. Utilization of milk energy by suckling mink kits. Arch Anim Nutr 2004; 58: 181-194. DOI: 10.1080/00039420410001667539
20. SAS Institute Inc., SAS/STAT® User´s Guide, Version 6, Fourth Edition, 1989; 2. Cary, NC: SAS Institute Inc.
21. Littell RC, Milliken GA, Stroup WW, et al. SAS® for Mixed Models 1996. Cary, NC: SAS Institute Inc. pp. 663.
22. Millward DJ (1995) A protein-stat mechanism for regulation of growth and maintenance of the lean body mass. Nutr Res Rev 1995; 8: 93-120. DOI: 10.1079/NRR19950008
23. Stryer L. Biochemistry, 4th ed. 1995: W.H. Freeman and Company, New York, USA.
24. Russell K, Lobley GE, Rawlings J, et al. Urea kinetics of a carnivore, Felis silvestris catus. Br J Nutr 2000; 84: 597-604.
25. Rogers QR & Morris JG. Up-regulation of nitrogen catabolic enzymes is not required to readily oxidize excess protein in cats. J Nutr 2002; 132: 2819-2820.
26. Fink R, Børsting CF. Quantitative glucose metabolism in lactating mink (Mustela vison) - Effect of dietary levels of protein, fat and carbohydrates. Acta Agric Scand A Anim Sci 2002; 52: 34-42.
27. Fink R, Børsting CF, Damgaard BM. Glucose metabolism and regulation in lactating mink (Mustela vison) - Effects of low dietary
BJCCSB.ORG
Baltic Journal of Comparative & Clinical Systems Biologypage 65
s

protein supply. Arch Anim Nutr 2002; 56: 155-166.28. Kettelhut IC, Foss MC & Migliorini RH. Glucose homeostasis in a
carnivorous animal (cat) and in rats fed a high-protein diet. Am J Phys 1980; 239: R437-R444.
29. Russell K, Lobley GE & Millward DJ. Whole-body protein turnover of a carnivore, Felis silvestris catus. Br J Nutr 2003; 89: 29-37. DOI: 10.1079/BJN2002735
30. Theil PK, Jørgensen H & Jakobsen K. Energy and protein metabolism in pregnant sows fed two levels of dietary protein. J Anim Physiol Anim Nutr 2002; 86: 399-413. DOI: 10.1046/j.1439-0396.2002.00404.x
31. Klahr S. Effects of protein intake on the progression of renal disease. Ann Rev Nutr 1989; 9: 87-108. DOI: 10.1146/annurev.nu.09.070189.000511
32. Murray BM, Campos SP, Schoenl M, et al. Effect of dietary protein intake on renal growth: possible role of insulin-like growth factor-I. J Lab Clin Med 1993; 122: 677-685.
33. Hammond KA & Janes DN. The effects of increased protein intake on kidney size and function. J Exp Biol 1998; 201: 2081-2090.
34. Krebs HA, Bennet DAH, De Gasquet P, et al. Renal Gluconeogenesis: The effect of diet on the gluconeogenic capacity of rat-kidney-cortex slices. Biochem J 1963; 86: 22-27.
35. Das TK & Waterlow JC. The rate of adaptation of urea cycle enzymes, aminotransferases and glutamic dehydrogenase to changes in dietary protein intake. Br J Nutr 1974; 32: 353-373.
36. Rosebrough RW, Steel NC, McMurtry JP. Effect of protein level and supplemental lysine on growth and urea cycle enzyme activity in the pig. Growth 1983; 47: 348-360.
37. Chen HY, Lewis AJ, Miller PS et al. The effect of excess protein on growth performance and protein metabolism of finishing barrows and gilts. J Anim Sci 1999; 77: 3238-3247.
38. Park T, Rogers QR & Morris JG High dietary protein and taurine increase cysteine desulfhydration in kittens. J Nutr 1999; 129: 2225-2230.
39. Morris JG Idiosyncratic nutrient requirements of cats appear to be diet-induced evolutionary adaptations. Nutr Res Rev 2002; 15: 153-168. DOI: 10.1079/NRR200238
40. Sørensen PG, Petersen IM & Sand O. Activities of carbohydrate and amino acid metabolizing enzymes from liver of mink (Mustela vison) and preliminary observations on steady state kinetics of the enzymes. Comp Biochem Physiol 1995; 112B: 59-64.
41. Langran M, Moran B, Murphy J, et al. Adaptation to a diet low in protein: Effect of complex carbohydrate upon urea kinetics in normal men. Clin Sci 1992; 82: 191-198.
BJCCSB.ORG
Baltic Journal of Comparative & Clinical Systems Biologypage 66
s

42. Jackson AA, Danielsen MS, Boyes S. A noninvasive method for measuring urea kinetics with a single dose of [15N15N]urea in free-living humans. J Nutr 1993; 123: 2129-2136.
43. Torralladona D, Harris CI, Coates ME, et al. Microbial amino acid synthesis and utilization in rats: incorporation of 15N and 15NH4Cl into lysine in the tissues of germ-free and conventional rats. Br J Nutr 1996; 76: 689-700.
44. Metges CC, Petzke KJ, El-Khoury AE, et al. Incorporation of urea and ammonia nitrogen into ileal and fecal microbial proteins and plasma free amino acids in normal men and ileostomates. Am J Clin Nutr 1999; 70: 1046-1058.
45. Hellwing ALF, Tauson A-H, Skrede, A, et al. Bacterial protein meal in diets for pigs and minks: Comparative studies on protein turnover rate and urinary excretion of purine base derivatives. Arch Anim Nutr 2007; 61: 425-443. DOI: 10.1080/17450390701565248
46. Tauson A-H, Fink R, Chwalibog A, et al. Protein turnover in lactating mink (Mustela vison) is not affected by dietary protein supply. J Nutr 2006; 136: 2061S-2062S.
47. Fink R, Thomsen PD. Tauson A-H. Metabolic flexibility of lactating mink (Mustela vison) is not reflected at transcriptional level but changes in functional liver mass. In: Energy and protein metabolism and nutrition, pp. 277-278, EAAP publication 2007; 124: 277-278.
48. Munro HN. Mammalian Protein Metabolism 1974, Vol. 4, p. 299. Academic Press, New York and London.
49. Fernández-Fígares I, Prieto C, Nieto R, et al. Free amino acid concentrations in plasma, muscle and liver as indirect measures of protein adequacy in growing chickens. Animal Sci 1997; 64: 529-541. DOI: 10.1017/S1357729800016167
BJCCSB.ORG
Baltic Journal of Comparative & Clinical Systems Biologypage 67


![curis.ku.dkcuris.ku.dk/ws/files/70769816/DamPaperBJCCSB.pdf · of ME), or low- (LP: 30% of ME) protein], from parturition until ten weeks post partum. Tissue samples were collected](https://img.pdfslide.net/doc/110x75/5e527b2d9e58475f0d52b7dd/curisku-of-me-or-low-lp-30-of-me-protein-from-parturition-until-ten-weeks.jpg)