Embed Size (px)
Citation preview

Static Softening in a Ni-30Fe Austenitic Model AlloyAfter Hot Deformation: Microstructure and TextureEvolution
HOSSEIN BELADI, PAVEL CIZEK, ADAM S. TAYLOR, GREGORY S. ROHRER,and PETER D. HODGSON
In the current study, the microstructure and texture characteristics of a model Ni-30Feaustenitic alloy were investigated during hot deformation and subsequent isothermal holding.The deformation led to the formation of self-screening arrays of microbands within a majorityof grains. The microbands characteristics underwent rather modest changes during thepost-deformation annealing, which suggests that limited dislocation annihilation occurs withinthe corresponding dislocation walls. The fraction of statically recrystallized (SRX) grainsprogressively increased with the holding time and closely matched the softening fractionmeasured from the offset flow stress approach. The corresponding texture was weak andpreserved its character with the holding time. There was no pronounced temperature effect onthe grain boundary character distribution after the completion of SRX. The R3 and R9coincidence site lattice boundaries were characterized as (111) pure twist and (1!14) symmetrictilt types, respectively. Nonetheless, the recrystallization temperature slightly affected the grainboundary network.
DOI: 10.1007/s11661-016-3880-1! The Minerals, Metals & Materials Society and ASM International 2016
I. INTRODUCTION
STATIC recrystallization (SRX) is one of the mostcommon and important restoration mechanisms takingplace during thermomechanical processing of steels.[1]
This process involves the nucleation and growth ofdislocation-free grains in the deformed matrix, whichsimultaneously undergoes recovery/dislocation annihi-lation, during the post-deformation annealing. SRX hasattracted a significant attention among different researchgroups around the world, largely focusing on themechanical response, kinetics, and grain size changesas a function of thermomechanical parameters e.g.References 2 through 4. However, for the case of steelsin the austenite state, there is currently a limitedunderstanding of the evolution of the dislocationsubstructure characteristics of the deformed (staticallyrecovered) matrix, which coexists with recrystallizedgrains and is progressively consumed during SRXprocess. In addition, more information is requiredregarding the crystallographic texture evolution forboth the deformed austenite matrix and SRX grainsduring the post-deformation annealing. This is largelyfor the reason that the phase transformation occurring
in steels on cooling prevents the direct investigation ofthe austenite microstructure and texture behavior duringdeformation and post-deformation annealing process.This has led to the design of model austenitic alloys(e.g., Ni-30Fe alloy), which do not transform on coolingand have similar stacking fault energy to low-carbonlow-alloy steels in the high-temperature austeniteregime.[5–8] The latter ensures similar deformationbehavior to the steel at high deformation temperatureswhile the former enables us to study the hot deformedaustenite microstructure at ambient temperature.The austenitic model alloys have been widely used to
study the deformed microstructure obtained underdifferent thermomechanical processing conditions, e.g.References 6 through 14. These studies have revealedthat the deformation of austenite, in the hot workingtemperature range employed for steel, largely leads tothe formation of arrays of extended parallel planardislocation walls bounding so called ‘‘microbands’’(MBs) within a majority of grain interiors. These MBarrays are typically characterized by systematicallyalternating misorientations across consecutive extendedboundaries.[12–17] It is of interest to elucidate how suchunique self-screening dislocation arrangements impacton the dislocation annihilation processes during thepost-deformation annealing.It has been demonstrated that the MB characteristics
(i.e., misorientation and boundary spacing), whichgovern the deformation stored energy within hotdeformed austenite, are significantly influenced by theaustenite grain orientation.[12,13,17] However, it is notclear how the orientation dependence of the substruc-ture characteristics influences the restoration processes
HOSSEIN BELADI, PAVEL CIZEK, ADAM S. TAYLOR, andPETER D. HODGSON are with the Institute for Frontier Materials,Deakin University, Geelong, VIC 3216, Australia. Contact e-mail:[email protected] GREGORY S. ROHRER is with theDepartment of Materials Science and Engineering, Carnegie MellonUniversity, Pittsburgh, PA 15213-3890.
Manuscript submitted May 30, 2016.Article published online November 29, 2016
METALLURGICAL AND MATERIALS TRANSACTIONS A VOLUME 48A, FEBRUARY 2017—855

(i.e., recovery/dislocation annihilation and recrystalliza-tion) taking place during the post-deformation anneal-ing. Indeed, the variation in the initial stored energybetween differently oriented grains may potentially leadto differences in the rate of deformed matrix consump-tion by the dislocation-free SRX grains during therecrystallization process. This may affect the crystallo-graphic texture of the remaining unrecrystallized matrixand, consequently, also the overall texture of partiallyrecrystallized material.
In addition, SRX is one of the main routes tomanipulate the grain boundary network in metals.[18]
The extent of the coincident site lattice (CSL) bound-aries development, which may contribute to the charac-teristics of the final phase transformed product in steels,is significantly influenced by the thermomechanicalprocessing parameters (i.e., strain and deformationtemperature).[18] Among different thermomechanicalparameters, the deformation temperature has to datereceived limited attention, though it is known to alterthe stacking fault energy of austenite,[19] potentiallyresulting in different CSL boundaries development.
The aim of the current work was to investigate thedeformed state characteristics, as well as the post-de-formation static softening processes, in a model Ni-30Feaustenitic alloy deformed under similar conditions tothose used in the hot working of low-carbon steels. Theinvestigation used interrupted hot torsion tests compris-ing two deformation passes separated by varied isother-mal holding. The second pass was used to determinehow much softening occurred during the holding. Aparallel set of samples were water quenched after theholding step, so that the microstructure could beevaluated. Electron back-scattered diffraction (EBSD)in conjunction with transmission electron microscopy(TEM) was used to study the hot deformationmicrostructure and texture characteristics along withthe evolution of grain structure, dislocation substruc-ture, and crystallographic texture during post-deforma-tion annealing. The EBSD technique also facilitated themeasurement of the grain boundary character distribu-tion for two SRX grain structures, obtained at differenttemperatures, using the five-parameter crystallographicapproach.[20]
II. EXPERIMENTAL METHODS
An austenitic model alloy with a composition ofNi-29.5Fe-0.01C-0.02Mn (in wt pct) was used in thecurrent study. As already mentioned above, this alloy iswell suited for modeling of the microstructure evolutionduring hot deformation of low-carbon steels.[5–8,21] Ahot torsion deformation simulator, described else-where,[22] was used to deform the samples. The speci-mens had a gauge length of 20 mm and a gauge diameterof 6.7 mm. Von Mises equivalent stress-strain valueswere derived from the torque-twist data using themethod based on the analysis by Fields andBackofen.[23]
The specimens were reheated to 1473 K (1200 "C),held for 80 seconds and then subjected to two roughing
deformation steps using equal strains of 0.4 andperformed at a strain rate of 1 s!1. Each deformationstep was followed by holding for 40 seconds duringwhich the microstructure became fully recrystallized(Figure 1). This led to a homogeneous grain distributionwith an average grain size of about 49 lm. Thespecimens were subsequently cooled (2 K/s) to 1273 K(1000 "C), and held for 120 seconds. Afterwards, inter-rupted torsion tests (i.e., double hit deformation) werecarried out to study the kinetics of post-deformationsoftening. Each experiment involved deforming at1273 K (1000 "C) to a strain of 0.3 (i.e., the firstdeformation) at a strain rate of 1 s!1, followed byholding for a given time and then re-deforming to astrain of 0.2 (i.e., the second deformation, Figure 1).The softening fraction, SF, at a given thermomechanicalcondition was estimated as
SF ¼ ðr3! r2Þ=ðr3! r1Þð Þ % 100 ½pct'; ½1'
where r1 is the yield stress of the first deformation; r2 isthe yield stress of the second deformation, and r3 is theflow stress at the end of first deformation. Some samplesdeformed to a strain of 0.3 were water quenched eitherimmediately after deformation or at a given post-defor-mation holding time to examine the microstructure/tex-ture development during post-deformation softening.Microstructural characterization was performed on
tangential sections at a depth of ~100 lm below thesurface of the gauge length using EBSD and TEMtechniques. Samples for EBSD were prepared by stan-dard mechanical polishing finished with a colloidal silicaslurry polish. EBSD study was carried out using theZeiss LEO 1530 FEG SEM and FEI Quanta 3D FEGSEM/FIB instruments both operated at 20 kV. Theformer instrument was equipped with the fully auto-matic HKL Technology EBSD attachment (i.e., theHKL Channel 5 software), mainly used for character-ization of substructure and crystallographic texture. Thelatter employed the TexSEM Laboratories (TSL) EBSDhardware and software for data acquisition and
5 K/s
1473 K (1200ºC)
ε =0.4 ε =0.4
ε =0.3 ε =0.2t1273 K(1000ºC)
5 K
1 K/s
80 s 40 s 40 s
120 s
Water Quenched
Tem
pera
ture
, K
Time, s
0º
d
Fig. 1—Schematic representation of thermomechanical processingroutes. t represents the post-deformation holding time, varying from0 to 150 s.
856—VOLUME 48A, FEBRUARY 2017 METALLURGICAL AND MATERIALS TRANSACTIONS A

post-processing to characterize the distribution of grainboundary planes.
EBSD maps were acquired using a step size of 0.1 lmand 3 lm for characterization of the grain substructureand the crystallographic texture, respectively. Patternsolving efficiencies generally varied between 95 and98 pct depending upon the step size and deformationcondition of a given sample. An area of about10 9 1 mm2 was scanned at each thermomechanicalprocessing condition (i.e., holding time) to investigatethe evolution of crystallographic texture of both thestatically recrystallized and deformed (recovered) matrixgrains during hot deformation. The EBSD maps wereinitially cleaned using the Kuwahara filtering routine toenhance the sub-boundaries and reduce the orientation
noise. SRX grains were then separated from thedeformed matrix using the subsetting routine in theChannel 5 software, based on the internal averagemisorientation angle within a grain. If the averagemisorientation angle did not exceed 0.2 deg, the grainwas considered recrystallized. This facilitated the deter-mination of the SRX fraction. The mean SRX grain sizewas determined as an average of the mean linearintercepts measured in the horizontal and verticaldirections. The crystallographic texture was describedusing the orientation distribution function (ODF),[24]
calculated from the EBSD data adopting the monoclinicsymmetry of the torsion specimens. Each texture com-ponent was specified by its Euler angles, with 15 degdeviation from the ideal orientation, and presented as a
(a) (b)
(c)
Fig. 2—Microstructure (a) and ODF texture (b) of SRX grains formed at 1473 K (1200 "C). The black, red, and blue lines represent grainboundaries with misorientations above 15 deg, R3, and R9 boundaries, respectively. (c) Misorientation angle distribution of grain boundaries atdifferent conditions, SRX at 1473 K (1200 "C, starting microstructure) and deformed at a strain of 0.3 at 1273 K (1000 "C), together with thecorresponding misorientation axis vectors in the crystal lattice coordinates. The numbers on the standard stereographic triangles represent thecontour intensity in multiples of a random distribution (Color figure online).
METALLURGICAL AND MATERIALS TRANSACTIONS A VOLUME 48A, FEBRUARY 2017—857

given color in the EBSD orientation maps using theChannel 5 software.
In order to characterize the distribution of grainboundary planes, multiple EBSD maps were acquiredusing a step size of 1 lm on a hexagonal grid using TSLsoftware for the fully recrystallized structures at 1473 Kand 1273 K (1200 "C and 1000 "C), covering a totalarea of approximately 1 9 12 mm2. The average confi-dence index generally varied between 0.80 and 0.85. Agrain dilation clean-up function in TSL software wasemployed for all the orientation maps to removeambiguous data. A single orientation was then assignedto a given grain through averaging all orientation databelonging to that grain. Boundary line traces/segmentswere extracted after smoothing of uneven grain bound-aries using the reconstruction grain boundary functionin TSL software and employing a boundary deviationlimit of 2 pixels (i.e., 2 lm). There were more than50,000 line traces after excluding the boundary segmentsof less than 3 lm. These line traces were employed tocalculate the five-parameter grain boundary characterdistribution using an automated stereological approachdescribed in detail elsewhere.[20] The analysis wasimplemented at 9 bins per 90 deg level of discretization,offering about 8.2 deg resolution (i.e., 97 pct of the binscontained at least ten observations).
To produce TEM foils, disks of 3 mm in diameterwere taken from tangential sections at a depth of~100 lm below the surface of the gauge length. Subse-quently, they were mechanically ground to a thicknessof about 70 lm and then twin-jet electropolished using asolution containing 5 pct perchloric acid and 95 pctmethanol at a temperature of about 243 K (!30 "C) anda voltage of 20 V. TEM examination of the foils wasperformed using a JEM 2100F microscope operated at200 kV.
III. RESULTS AND DISCUSSION
A. Starting Recrystallized State
The microstructure of the material subjected to twoSRX cycles at 1473 K (1200 "C), taking place duringtwo-pass roughing deformation with a strain of 0.4 ineach pass followed by holding for 40 seconds, displayedan average grain size of ~49 lm (Figure 2(a)). Thecorresponding crystallographic texture was relativelyweak, being characterized by a maximum of 3.1 timesrandom (Figure 2(b)). There was a pronounced peakcentered at about 60 deg in the misorientation his-togram for the above SRX microstructure (Figure 2(c)).The misorientation axis vectors related to high-angleboundaries were strongly clustered around the h111idirection in the standard stereographic triangle(Figure 2(c)). This demonstrates that R3 first-order twinboundaries characterized by 60 deg/h111i misorienta-tion represented a significant volume fraction of thepre-existing high-angle boundaries.
B. Hot Deformed State
The stress-strain curve obtained at 1273 K (1000 "C)displayed a pronounced work hardening behavior(Figure 3). The flow curves of the first deformation(i.e., e = 0.3) for all holding times were very similar,indicating that the experiments were well duplicated. Inother words, the specimens subjected to different inter-rupted torsion tests reflected the expected progress ofsoftening with the incremented holding time after thefirst-pass deformation.The initial coarse grains became elongated along the
shear direction at a strain of 0.3 (Figure 4(a)). The
Table I. Ideal Torsion Texture Components in Austenite for u2 = 0 and 45 deg Sections[25]
Orientation (hkl)[uvw] u1 F u2
A1 (1!11)[110] 0.0 35.3 45.0A2 (!11!1)[!1!10] 180.0 35.3 45.0A1* (111)[!1!12] 35.3
125.345.090.0
0.0/90.045.0
A2* (111)[11!2] 144.754.7
45.090.0
0.0/90.045.0
B1 (1!12)[110] 0.0/120.0 54.7 45.0B2 (!11!2)[!1!10] 60.0/180.0 54.7 45.0C {001}h110i 90.0
0.0/180.045.090.0
0.0/90.045.0
R (100)[011] 45 0.0 0.0
Fig. 3—Double-deformation flow curves obtained at a temperatureof 1273 K (1000 "C) and a strain rate of 1 s!1 for different holdingtimes.
858—VOLUME 48A, FEBRUARY 2017 METALLURGICAL AND MATERIALS TRANSACTIONS A

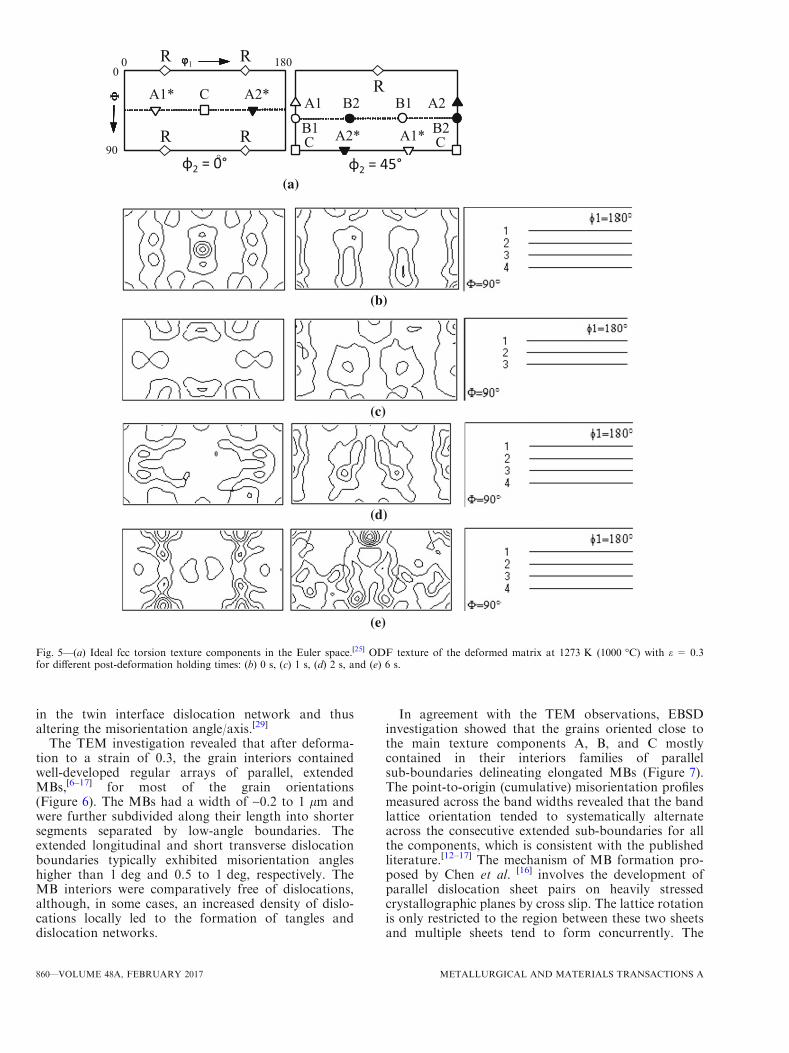
corresponding hot deformation texture showed astrength of 3.8 times random (Figure 5(b)). It wascomposed of the A1, A2, A1*, and A2* componentslocated along the {111}huvwi fiber as well as the B1, B2,and C components situated on the {hkl}h110i fiber in theEuler space, which is typical of fcc simple shear texturesproduced by crystallographic slip (Figures 5(a) and (b);Table I).[25] It is seen that the C texture componentdominated the orientation distribution.
The pre-existing grain boundaries commonly exhib-ited serration/bulging, which is a result of the strain-in-duced boundary migration (SIBM) mechanismoperating during hot deformation.[26] However, theserration amplitude was different for each boundarydepending mostly on the boundary type. The serrationamplitude of annealing twin boundaries was relativelysmall in comparison with the general high-angle bound-aries due to the minimum energy of the former,[27,28]
which lowers their mobility. There were also few newlyformed fine grains located mostly in the triple junctionsof the pre-existing grain boundaries (shown by thearrow in Figure 4(a)), which may be formed during
deformation (i.e., dynamically, DRX) or on quenching(i.e., statically, SRX).The deformation had a strong effect on the annealing
twin boundary characteristics. By a strain of 0.3, sometwin boundaries already started losing their coherencyand their angle/axis misorientation relationships beganto deviate from the original R3 twin misorientation (i.e.,60 deg h111i, Figure 4(a)). The deviations were inho-mogeneously distributed along the twin boundary facets(Figure 4(a)). Some twin boundary segments have losttheir coherency completely while others exhibited min-imal distortions. The misorientation axis vectors dis-played a tendency to deviate from the [111] direction inthe standard stereographic triangle (Figure 2(c)). Fur-thermore, the population of boundaries with misorien-tation angles of about 60 deg in the misorientationhistogram for high-angle boundaries significantlydecreased and the corresponding maximum shifted fromabout 60 deg towards lower angles at a strain of 0.3(Figure 2(c)). This is due to an interaction betweenextrinsic (i.e., glide) dislocations and the intrinsicdislocations of a twin boundary, leading to the change
(a)
(d)
(b)
(e)
(c)
(f)
Fig. 4—EBSD maps obtained after deformation at 1273 K (1000 "C) with e = 0.3 and holding for different post-deformation annealing times,followed by water-quenching: (a) 0 s, (b) 1 s, (c) 2 s, (d) 6 s, (e) 20 s, and (f) 150 s. The green regions represent the deformed grains. The blackand red lines indicate grain boundaries with misorientations above 15 deg and R3 boundaries, respectively, on the band contrast background.The macroscopic shear direction is vertical (Color figure online).
METALLURGICAL AND MATERIALS TRANSACTIONS A VOLUME 48A, FEBRUARY 2017—859
in the twin interface dislocation network and thusaltering the misorientation angle/axis.[29]
The TEM investigation revealed that after deforma-tion to a strain of 0.3, the grain interiors containedwell-developed regular arrays of parallel, extendedMBs,[6–17] for most of the grain orientations(Figure 6). The MBs had a width of ~0.2 to 1 lm andwere further subdivided along their length into shortersegments separated by low-angle boundaries. Theextended longitudinal and short transverse dislocationboundaries typically exhibited misorientation angleshigher than 1 deg and 0.5 to 1 deg, respectively. TheMB interiors were comparatively free of dislocations,although, in some cases, an increased density of dislo-cations locally led to the formation of tangles anddislocation networks.
In agreement with the TEM observations, EBSDinvestigation showed that the grains oriented close tothe main texture components A, B, and C mostlycontained in their interiors families of parallelsub-boundaries delineating elongated MBs (Figure 7).The point-to-origin (cumulative) misorientation profilesmeasured across the band widths revealed that the bandlattice orientation tended to systematically alternateacross the consecutive extended sub-boundaries for allthe components, which is consistent with the publishedliterature.[12–17] The mechanism of MB formation pro-posed by Chen et al. [16] involves the development ofparallel dislocation sheet pairs on heavily stressedcrystallographic planes by cross slip. The lattice rotationis only restricted to the region between these two sheetsand multiple sheets tend to form concurrently. The
B1A1
A1*A2*
B1B2 A2
CCB2
R
(a)
A1* C A2*
0810
90
01
°
R R
RR
(b)
(c)
(d)
(e)
Fig. 5—(a) Ideal fcc torsion texture components in the Euler space.[25] ODF texture of the deformed matrix at 1273 K (1000 "C) with e = 0.3for different post-deformation holding times: (b) 0 s, (c) 1 s, (d) 2 s, and (e) 6 s.
860—VOLUME 48A, FEBRUARY 2017 METALLURGICAL AND MATERIALS TRANSACTIONS A

above mechanism might account for the observations ofthe ‘‘organized, self-screening’’ families of parallel MBs(Figure 7).
The substructure characteristics (i.e., size and misori-entation) revealed a slight change with the grainorientation. The average subgrain size (linear interceptlength) was about 4.0 ± 0.8 lm for the orientation Aand decreased to 3.7 ± 0.45 and 3.3 ± 0.74 lm fororientations B and C, respectively. The average misori-entation angle was 0.82 ± 0.33 deg, 0.91 ± 0.46 deg,and 0.96 ± 0.7 deg for orientations A, B, and C,respectively. The change in the substructure character-istics as a function of grain orientation agrees well withthe corresponding Taylor factor values; orientations Aand C are associated with the lowest (i.e., 1) and highest(i.e., #3) Taylor factor, respectively.[30] An orientationwith a higher Taylor factor (e.g., C) generally requires ahigher slip activity to achieve a given strain levelcompared to its lower Taylor factor counterpart (e.g.,A). As a result, it develops a higher dislocationdensity (i.e., smaller mean subgrain size and highermisorientation) and thus higher stored energy duringdeformation.[30]
C. Post-Deformation Annealed State
The interrupted torsion tests clearly showed theimpact of the post-deformation holding time on thebehavior of the second deformation flow curves(Figure 3). At a short holding time (e.g., 0.1 seconds),the second flow curve exhibited very little work hard-ening followed by a stress plateau. This resulted in asmall softening fraction (SF) value (£10 pct, Figure 8)estimated using Eq. [1]. The second (reloading) flow
curve behavior progressively changed, revealing morework hardening, with an increase in the holding time. Asa result, the softening fraction progressively increasedwith time, the maximum softening (i.e., 100 pct) beingobtained at a holding time of 150 seconds (Figure 8).These changes can be directly associated with the grainstructure and dislocation substructure changes takingplace during the holding time.During the post-deformation annealing, the deformed
structure became gradually replaced by newly formedSRX grains (Figure 4). These grains were initiallyformed at the triple junctions of the pre-existing grainboundaries, where the maximum strain exists to main-tain the strain compatibility between neighboring grains(Figure 4(b)). This was followed by nucleation at grainboundaries, gradually occupying most of the generalboundaries (Figures 4(c) and (d)). The pre-existing
P3
boundaries were mainly free of SRX grains even atthe holding time of 6 seconds, where ~60 pct of the ini-tial microstructure was replaced by these grains(Figure 4(d)). In addition, there were hardly any intra-granular SRX grains observed in the deformedmicrostructure. Interestingly, SRX volume fractionclosely matched the softening fraction estimated usingthe offset flow stress approach (Figure 8). The averageSRX grain size was nearly constant (~18 lm) at earlierstages of recrystallization (i.e., up to 10 seconds holdingtime) and then significantly increased with the holdingtime reaching ~27 lm at 150 seconds, when SRXprocess was completed (Figures 4(f) and 8).Figures 5(c) through (e) show the effect of post-de-
formation annealing on the crystallographic texturecharacteristics of the deformed (recovered) matrix. Itshould be kept in mind that the above characteristicswere significantly influenced by the way in which thematrix became consumed during the annealing process.It is seen that the pre-existing strong C texture compo-nent (see Figure 5(a)) became essentially eliminated fromthe orientation distribution by annealing (Figures 5(c)through (e)). Thus, this component appeared to becomepreferentially consumed during post-deformationannealing, in line with its comparatively high storedenergy associated with the high Taylor factor. Further-more, the orientation distribution became more complexand, interestingly, the rotated cube component Rbecame more discernible with increasing annealing time(Figure 5). In general, the overall texture strengthmarginally increased from 3.8 times random at theas-deformed condition to 4.4 times random at 6 secondsholding time (Figure 5(e)), where about 60 pct of thedeformed matrix was consumed through SRX(Figure 8). The crystallographic texture of SRX grainswas rather weak, having a strength in a range of 2 to 2.2times random, and maintained its character irrespectiveof the post-deformation holding time (Figure 9).EBSD observations revealed that there were rather
modest changes in the substructure characteristics of thedeformed (recovered) matrix during the post-deforma-tion holding (Figure 10). The presence of MBs waslargely maintained in the deformed regions even whennearly 80 pct of the deformed structure became con-sumed by SRX grains (i.e., at 20 seconds holding time,
Fig. 6—TEM bright-field micrograph of the deformation substruc-ture obtained at 1273 K (1000 "C) with e = 0.3, consisting of MBs,within a grain oriented close to the A texture component. The dou-ble arrow indicates the macroscopic shear direction.
METALLURGICAL AND MATERIALS TRANSACTIONS A VOLUME 48A, FEBRUARY 2017—861

Figure 10(c)). The mean misorientation angle estimatedfor texture component A as a function of holding timeremained after 2 seconds holding still equal to thestarting value of about 0.82 deg, and reached values ofabout 0.80 deg and 0.76 deg for the holding time of 6and 20 seconds, respectively. TEM observations furtherconfirmed that the dislocation walls delineating MB
arrays generally maintained their integrity duringpost-deformation annealing, although the dislocationspacing within these walls progressively increased withincreasing holding time (Figure 11), in line with thegradual reduction in misorientation angles observed byEBSD. This suggests that the extent of dislocationannihilation through the static recovery processes [1] was
(a)
(b)
(c)
Fig. 7—EBSD maps showing the substructure developed at 1273 K (1000 "C) and e = 0.3 within grains having different orientations, togetherwith the corresponding misorientation profiles along the indicated arrows: (a) A, (b) B, and (c) C. The thin and thick black lines indicate bound-aries with misorientations 0.5 deg< h< 15 deg and h> 15 deg, respectively. The background color density is inversely proportional to the devi-ation from the exact texture component. The macroscopic shear direction is vertical. The black and red lines in the line scan profiles representthe point-to-point and point-to-origin misorientations, respectively (Color figure online).
862—VOLUME 48A, FEBRUARY 2017 METALLURGICAL AND MATERIALS TRANSACTIONS A

not sufficient to bring about complete disintegration ofthe dislocation walls. In other words, the MB arrayswithin the deformed (recovered) matrix were mostlypreserved up to the point when the latter was almostcompletely consumed by SRX grains. Consequently, thesoftening obtained during post-deformation annealingappears to have mainly originated from the
consumption of the deformed matrix by newly formedSRX grains, rather than from dislocation annihilation(i.e., static recovery). This conjecture is consistent withthe abovementioned current observation that softeningfractions on annealing, determined using the offset flowstress technique, closely matched the measured SRXvolume fractions (Figure 8).The stability of the present deformation substructure,
largely consisting of MBs, on annealing appears to bemarkedly higher than that displayed by the randomcell/subgrain substructure present within the austenitedynamically recrystallized (DRX) grains.[10] The dislo-cation arrangements within DRX grains of the samealloy as the one used in the present study were observedto rapidly annihilate during holding at 1273 K(1000 "C), i.e., under conditions similar to those usedin the current work.[11] In fact, dislocations becamealmost completely removed from the DRX grain inte-riors after only 10 seconds of post-deformation anneal-ing. This suggests that the nature of the dislocationsubstructure might govern the dislocation annihilationkinetics during annealing treatment. The organizedself-screening MB arrays with mutually compensatedlattice rotations appear to represent the dislocation
Fig. 9—ODF texture of SRX grains formed at different post-deformation holding times, following deformation at 1273 K (1000 "C) withe = 0.3: (a) 1 s, (b) 2 s, (c) 6 s, (d) 20 s, and (e) 150 s.
Fig. 8—Softening (SF) and recrystallized (VSRX) fractions togetherwith SRX grain size as a function of post-deformation holding time,following deformation at 1273 K (1000 "C) with e = 0.3.
METALLURGICAL AND MATERIALS TRANSACTIONS A VOLUME 48A, FEBRUARY 2017—863

substructure being in a markedly lower energy state (i.e.,closer to equilibrium) than the random cell/subgrainsubstructure type present within DRX grains. There-fore, it would be expected that the organized MB arraysmight be considerably more stable against the disloca-tion annihilation, accompanying the recovery processes
on annealing, compared with the random cell/subgrainsubstructure.
D. SRX Grain Boundary Character Distribution
The grain boundary character distribution was mea-sured for both SRX conditions [i.e., 1273 K (1000 "C)and 1473 K (1200 "C)] using the five-parameter crystal-lographic approach.[20] The distribution of grain bound-ary plane normals for all misorientations was plotted inthe crystal reference frame, where the relative density ofthe normals was expressed in multiples of a random
(a)
(b)
(c)
Fig. 10—EBSD maps showing the substructure of the deformed matrix grains having orientations close to the A texture component for differentpost-deformation holding times, following deformation at 1273 K (1000 "C) with e = 0.3: (a) 2 s, (b) 6 s and (c) 20 s. The thin black, thickblack, and red lines indicate boundaries with misorientations 0.5 deg< h< 15 deg, h>15 deg and R3 twin boundaries, respectively. The back-ground blue color density is inversely proportional to the deviation from the exact A orientation. The macroscopic shear direction is vertical(Color figure online).
Fig. 11—TEM bright-field micrograph showing a family of MBswithin a deformed (recovered) matrix grain oriented close to the Atexture component, after 20-s post-deformation annealing, followingdeformation at 1273 K (1000 "C) with e = 0.3. The MBs are boun-ded by planar walls consisting of dislocations that are coarselyspaced, presumably as a result of their annihilation through staticrecovery. The double arrow indicates the macroscopic shear direc-tion.
(a) (b)
Fig. 12—The distribution of grain boundary planes ignoring misori-entation angle for different SRX conditions: (a) 1273 K (1000 "C)and (b) 1473 K (1200 "C). MRD represents multiples of a randomdistribution.
864—VOLUME 48A, FEBRUARY 2017 METALLURGICAL AND MATERIALS TRANSACTIONS A

distribution (MRD). The distributions revealed a stronganisotropy having a maximum at the (111) position witha value of ~6.4 and 6.72 MRD for 1273 K (1000 "C) and1473 K (1200 "C) conditions, respectively (Figure 12).This means that the population of (111) planes was morethan 500 pct higher than expected in a random distri-bution. By contrast, the distribution at (101) and (100)orientations was ~1 MRD and ~0.5 MRD, respectively,for both conditions. This is not surprising, as (111)planes generally represent low energy interfaces inmaterials with the fcc crystal structure.[27,28]
In the current study, the relative grain boundarycharacter distribution was analyzed for certain specificCSL misorientations of R3 and R9. The distributionswere drawn in the bicrystal reference frame, having the[001] direction placed perpendicular to the paper and the[100] crystal axis horizontally pointed in the plane of thepaper to the right. Interestingly, the grain boundaryplane distributions revealed similar characteristics forboth SRX conditions. For R3 misorientation (i.e.,60 deg/[111]), the grain boundary plane distributionshowed a pronounced maximum at the (111) pure twistposition with a significant population of ~2800 MRDand ~3000 MRD for 1273 K and 1473 K (1000 "C and1200 "C), respectively (Figures 13(a) and (b)). The{111}//{111} symmetric twist grain boundary representsthe coherent twin for the R3 misorientation in fccmaterials,[27,28] having the highest grain boundary pop-ulation in the distribution. By contrast, they have thelowest energy.[27,28] However, all R3 boundaries do not
represent coherent R3 boundaries, even if they fulfillBrandon’s criterion.[31] In the current study, the R3boundaries with grain boundary plane orientationswithin ±10 deg deviation of the ideal twin planeorientation were classified as coherent R3 boundaries.This analysis revealed that the population and lengthfractions of the coherent R3 boundaries were verysimilar for both conditions (Figure 14(a)). The coherentto incoherent boundary population ratio was 1.89 and1.73 at 1273 K and 1473 K (1000 "C and 1200 "C),respectively. The coherent to incoherent length fractionratio was 5.83 at 1273 K (1000 "C) and 6.43 at 1473 K(1200 "C) (Figure 14(b)).Interestingly, both microstructures reveal relatively
similar R3 boundary populations, despite distinct ther-momechanical processing routes. This can be explainedthrough the examination of factors influencing the grainboundary network, including: texture, grain morphol-ogy (formation mechanism[32,33]), processing route (tem-perature[27] and strain[34]), grain size[35] and composition(i.e. SFE[18]). Here, the composition is identical for bothconditions and there are no phase changes (e.g.,precipitation) in the temperature range between theprocess temperature [1273 K and 1473 K (1000 "C and1200 "C)] and room temperature for the Ni-30Fe alloy.In addition, both microstructures are produced throughstatic recrystallization having equiaxed grain morphol-ogy (Figures 2(a) and 4(f)) and relatively week texture(Figures 2(b) and 9(e)).It should be emphasized that the 1273 K (1000 "C)
condition experiences an extra recrystallization cycle,i.e., straining at 0.3 and holding at 1273 K (1000 "C) for150 seconds, compared with 1473 K (1200 "C). There-fore, it would be expected that there will be greaterpopulation of R3 boundaries at 1273 K (1000 "C)compared with 1473 K (1200 "C), as the R3 boundarypopulation increases with the number of recrystalliza-tion cycles.[36] A decrease in the grain size, i.e., from~49 lm at 1473 K (1200 "C) to ~27 lm at 1273 K(1000 "C), should also enhance the CSL boundarypopulations.[35] Surprisingly, this is not the case for thecurrent result as the CSL boundary populations remainrelatively similar for both thermomechanical routes.Another difference in these processing routes is the
recrystallization temperature, which influences thestacking fault energy (SFE) of material. Here, the SFEof Ni-30Fe alloy was calculated for both temperaturesusing an approach described in Reference 37. It appearsthat the SFE slightly increases with a decrease intemperature, from ~97 mJ/m2 at 1473 K (1200 "C) to~100 mJ/m2 at 1273 K (1000 "C) in the Ni-30Fe alloy.The materials with lower SFE [i.e. 1473 K (1200 "C)]are, in general, expected to have a greater CSL bound-ary population than those with higher SFE [i.e., 1273 K(1000 "C)].[36] In fact, relatively similar R3 boundarypopulations for two distinct thermomechanical process-ing routes appear to be a result of the trade off betweendifferent factors influencing the grain boundary network(i.e., extra recrystallization cycle, grain size, and recrys-tallization temperature/SFE).For R9 misorientation (i.e., 38.9 deg/[110]), the
boundaries were mostly positioned on the zone of pure
(a)
MRD
0 1 2 3 4 5 6 7 8
0 400 800 1200 1600 2000 2400 2800
(b)
(d)
MRD
(c)[100]
[010]
Position of tilt boundaries
Fig. 13—The distribution of grain boundary planes at fixed misori-entations of (a), (b) R3=60 deg/[111] and (c), (d) R9 = 38.9 deg/[110] for different static recrystallization conditions: (a), (c) 1273 K(1000 "C) and (b), (d) 1473 K (1200 "C). The circle mark in (a) rep-resents the position of twist boundary. The triangle and squaremarks in (c) reveal the positions of twist and tilt boundaries, respec-tively. MRD is multiples of a random distribution.
METALLURGICAL AND MATERIALS TRANSACTIONS A VOLUME 48A, FEBRUARY 2017—865

tilt boundaries having maxima mainly centered on the(1!14)//(1!14) symmetric tilt boundary for both ther-momechanical routes (Figures 13(c) and (d)). However,the maximum intensity was much greater for 1273 K(1000 "C) (i.e., 8.18 MRD) compared with 1473 K(1200 "C) condition (i.e., 4.5 MRD). The R9 populationis greater at the 1273 K (1000 "C) (i.e., 2.5 pct) than the1473 K (1200 "C) condition (i.e., 1.6 pct). One mecha-nism for the formation of R9 is the intersection of twoR3 boundaries (see Figure 2(a)) which do not share acommon rotation axis. This is known as multipletwinning commonly observed during the microstructureevolution (i.e., recrystallization and/or grain growth)of fcc materials. The R9 population in both conditions isconsistent with the analysis of grain boundarytriple junctions in both recrystallization conditions(Figure 15). The result revealed that there is a smallerfraction of triple junctions, which are made ofR3-R3-R9, at 1473 K (1200 "C) compared with 1273 K(1000 "C). This means that the extent of multipletwinning is smaller at the 1473 K (1200 "C) than atthe 1273 K (1000 "C) SRX condition, which can berelated to the aforementioned factors influencing thegrain boundary network evolution.
IV. CONCLUSIONS
1. Deformed grains largely contained organizedself-screening arrays of MBs. The MB characteris-tics appeared to depend on the grain orientation,the energy stored within the MB arrays beingprincipally consistent with the correspondingTaylor factor values.
2. The above characteristics underwent only modestchanges during the post-deformation annealing.This suggests that the MB arrays had a moderatestability and the corresponding dislocation wallsexperienced limited dislocation annihilation.
3. SRX volume fraction closely matched the softeningfraction estimated using the offset flow stressapproach.
4. SRX texture was relatively weak and maintained itscharacter independent of the holding time.
5. SRX temperature did not appear to have a signif-icant effect on the character of CSL boundaries.The grain boundary plane distribution for R3 andR9 boundaries showed pronounced maxima for the(111) pure twist and (1!14) symmetric tilt boundarycharacter, respectively. Nevertheless, the grainboundary network displayed a slight change withthe recrystallization temperature.
ACKNOWLEDGMENT
This research was supported by grants through theAustralian Research Council including an ARC Feder-ation Fellowship (PH). This work was carried out withthe support of the Deakin Advanced CharacterizationFacility.
REFERENCES1. F.J. Humphreys and M. Hatherly: Recrystallization and Related
Annealing Phenomena, 2nd ed., Elsevier Science, New York, 2004.
0
10
20
30
40
50
60
70
Leng
th F
ract
ion
(%)
Coh. 333 Boundary Types
1000oC 1200oC
Non- 30
10
20
30
40
50
60
Popu
latio
n Fr
actio
n (%
)
3 Boundary Types
1000oC 1200oC
Non- 3 3 Coh. 3
(b)(a)
1273K1473K
1273K1473K
Fig. 14—The length (a) and population (b) fractions of different R3 boundary types for different SRX conditions. The coherent, non-coherent,and all R3 twin boundaries are referred to as Coh. R3, Non-R3, and R3, respectively.
0
10
20
30
40
50
60
- -- -R-R-RR-R-R
Frac
tion
(%)
Triple Junction Types
1000oC 1200oC
3-3-9
1273K1473K
Fig. 15—The triple junction types for different SRX conditions. 3, 9,R, and R represent R3, R9, CSL boundaries, and random bound-aries, respectively.
866—VOLUME 48A, FEBRUARY 2017 METALLURGICAL AND MATERIALS TRANSACTIONS A
2. C.M. Sellars and J.A. Whiteman: Met. Sci., 1979, vol. 13,pp. 187–94.
3. S.-H. Cho, K.-B. Kang, and J.J. Jonas: ISIJ Intern., 2001, vol. 41,pp. 766–73.
4. H. Beladi and P.D. Hodgson: Scripta Mater., 2007, vol. 56,pp. 1059–62.
5. P.J. Hurley, B.C. Muddle, and P.D. Hodgson: Metall. Mater.Trans. A, 2001, vol. 32A, pp. 1507–17.
6. W.M. Rainforth, M.P. Black, R.L. Higginson, E.J. Palmiere, C.M.Sellars, I. Prabst, P. Warbichler, and F. Hofer: Acta Mater., 2002,vol. 50, pp. 735–47.
7. Y. Adachi, M. Wakita, H. Beladi, and P.D. Hodgson: Acta Ma-ter., 2007, vol. 55, pp. 4925–34.
8. A.S. Taylor, P. Cizek, and P.D. Hodgson: Acta Mater., 2011,vol. 59, pp. 5832–44.
9. H. Beladi, P. Cizek, and P.D. Hodgson: Metall. Mater. Trans. A,2009, vol. 40A, pp. 1175–89.
10. H. Beladi, P. Cizek, and P.D. Hodgson: Acta Mater., 2010, vol. 58,pp. 3531–41.
11. H. Beladi, P. Cizek, and P.D. Hodgson: Acta Mater., 2011, vol. 59,pp. 1482–92.
12. A.S. Taylor, P. Cizek, and P.D. Hodgson: Acta Mater., 2012,vol. 60, pp. 1548–69.
13. D. Poddar, P. Cizek, H. Beladi, and P.D. Hodgson:Metall. Mater.Trans. A, 2015, vol. 46A, pp. 5933–51.
14. D. Poddar, P. Cizek, H. Beladi, and P.D. Hodgson: Acta Mater.,2015, vol. 99, pp. 347–62.
15. Q. Liu and D. Juul: Jensen, and NHansen. Acta Mater., 1998,vol. 46, pp. 5819–38.
16. Q.Z. Chen, A.H.W. Ngan, and B.J. Duggan: Proc. R. Soc. Lond.A, 2003, vol. 459, pp. 1661–85.
17. P. Cizek, F. Bai, E.J. Palmiere, and W.M. Rainforth: J. Microsc.,2005, vol. 217, pp. 138–51.
18. V. Randle: Acta Mater., 1999, vol. 47, pp. 4187–96.19. A. Saeed-Akbari, J. Imlau, U. Prahl, and W. Bleck:Metall. Mater.
Trans. A, 2009, vol. 40A, pp. 3076–90.
20. G.S. Rohrer, D.M. Saylor, B. El Dasher, B.L. Adams, A.D.Rollett, and P. Wynblatt: Z. Metallkd., 2004, vol. 95,pp. 1–18.
21. W. Charnock and J. Nutting:Met. Sci. J., 1967, vol. 1, pp. 123–27.22. P.D. Hodgson, D.C. Collinson, and B. Perrett: Proc. of the Int.
Symp. on Physical Simulation, NRIM, Tsukuba, 1997, pp.219–23.
23. D.S. Fields and W.A. Backofen: Proc. Am. Soc. Test. Mater.,1957, vol. 75, pp. 1259–72.
24. H.J. Bunge: Texture Analysis in Materials Science: MathematicalMethods, Butterworths, London, 1982.
25. L.S. Toth, P. Gilormini, and J.J. Jonas: Acta Metall., 1988, vol. 36,pp. 3077–91.
26. A.M. Wusatowska-Sarnek, H. Miura, and T. Sakai: Mater. Sci.Eng. A, 2002, vol. 323, pp. 177–86.
27. H. Beladi, N.T. Nuhfer, and G.S. Rohrer: Acta Mater., 2014,vol. 70, pp. 281–89.
28. J. Li, S.J. Dillon, and G.S. Rohrer: Acta Mater., 2009, vol. 57,pp. 4304–11.
29. S. Poulat, B. Decamps, and L. Priester: Philos. Mag. A, 1998,vol. 77, pp. 1381–97.
30. J.J. Jonas and L.S. Toth: Scripta Metall. Mater., 1992, vol. 27,pp. 1575–80.
31. D.G. Brandon: Acta Metall., 1966, vol. 14, pp. 1479–84.32. H. Beladi, G.S. Rohrer, A.D. Rollett, V. Tari, and P.D. Hodgson:
Acta Mater., 2014, vol. 63, pp. 86–98.33. V. Randle, G.S. Rohrer, and Y. Hu: Scripta Mater., 2008, vol. 58,
pp. 183–86.34. W. Form, G. Gindraux, and V. Mlyncar: Met. Sci., 1980, vol. 14,
pp. 16–20.35. T. Watanabe, H. Fujii, H. Oikawa, and K.I. Arai: Acta Metall.,
1989, vol. 37, pp. 941–52.36. G.S. Rohrer, V. Randle, C.-S. Kim, and Y. Hu: Acta Mater., 2006,
vol. 54, pp. 4489–4502.37. S.L. Shang, C.L. Zacherl, H.Z. Fang, Y. Wang, Y. Du, and Z.K.
Liu: J. Phys. Cond. Matter, 2012, vol. 24, pp. 1–14.
METALLURGICAL AND MATERIALS TRANSACTIONS A VOLUME 48A, FEBRUARY 2017—867