Embed Size (px)
Citation preview
DOT HS 810 961 June 2008
Static Testing Method for Assessing Quality of Indirect Visibility on Heavy TrucksFinal Report (Phase 1, Track 1)
Development of a Performance Specification For Indirect Visibility on Heavy Trucks
This document is available to the public from the National Technical Information Service, Springfield, Virginia 22161

This publication is distributed by the U.S. Department of Transportation, National Highway Traffic Safety Administration, in the interest of information exchange. The opinions, findings and conclusions expressed in this publication are those of the author(s) and not necessarily those of the Department of Transportation or the National Highway Traffic Safety Administration. The United States Government assumes no liability for its content or use thereof. If trade or manufacturer’s names or products are mentioned, it is because they are considered essential to the object of the publication and should not be construed as an endorsement. The United States Government does not endorse products or manufacturers.

Technical Report Documentation Page
1. Report No. 2. Government Accession No. 3. Recipient’s Catalog No. DOT HS 810 961
4. Title and Subtitle 5. Report Date Static Testing Method for Assessing Quality of Indirect Visibility on Heavy Trucks
June 2008
6. Performing Organization
7. Author(s) James W. Jenness, Robert E. Llaneras, and Richard W. Huey
8. Performing Organization Report No.
9. Performing Organization Name and Address 10. Work Unit No. Westat, Inc. Rockville, Maryland
11. Contract or Grant No. DTNH22-98-D-25079 12. Sponsoring Agency Name and Address 13. Type of Report and Period National Highway Traffic Safety Administration Office of Vehicle Safety Research 1200 New Jersey Avenue SE. Washington, DC 20590
Final Report
14. Sponsoring Agency Code 15. Supplementary Notes
16. Abstract The most important functional aspects of any indirect visibility system for use on heavy trucks are how quickly and accurately it enables drivers to detect, locate, and identify targets that are likely to be encountered around the vehicle. As video-based indirect visibility systems are considered as supplements to conventional truck mirror systems, there is a need to develop functional assessment strategies that may be used to evaluate drivers’ performance with the new systems. Understanding the functional performance of these new systems will require comparisons to performance with conventional mirror systems. Therefore, baseline behavioral performance measures are needed for truck drivers using conventional mirrors. These behavioral measures should resemble aspects of common driving tasks, but must be performed in a safe way that imposes minimal risk on participants and experimenters. The objective of this study was to establish a safe, repeatable procedure for measuring functional fields of view for indirect visibility systems on heavy trucks.
17. Key Words 18. Distribution Statement Impaired driving, drinking driving, DWI, DUI, OUI, recidivism, traffic crashes, BAC, repeat offenders, traffic law legislation
This report is free of charge from the NHTSA Web site at www.nhtsa.dot.gov
19. Security Classif. (of this report) 20. Security Classif. (of this page) 21. No. of Pages 22Unclassified Form DOT F 1700.7 (8-72) Reproduction of completed page authorized

iii
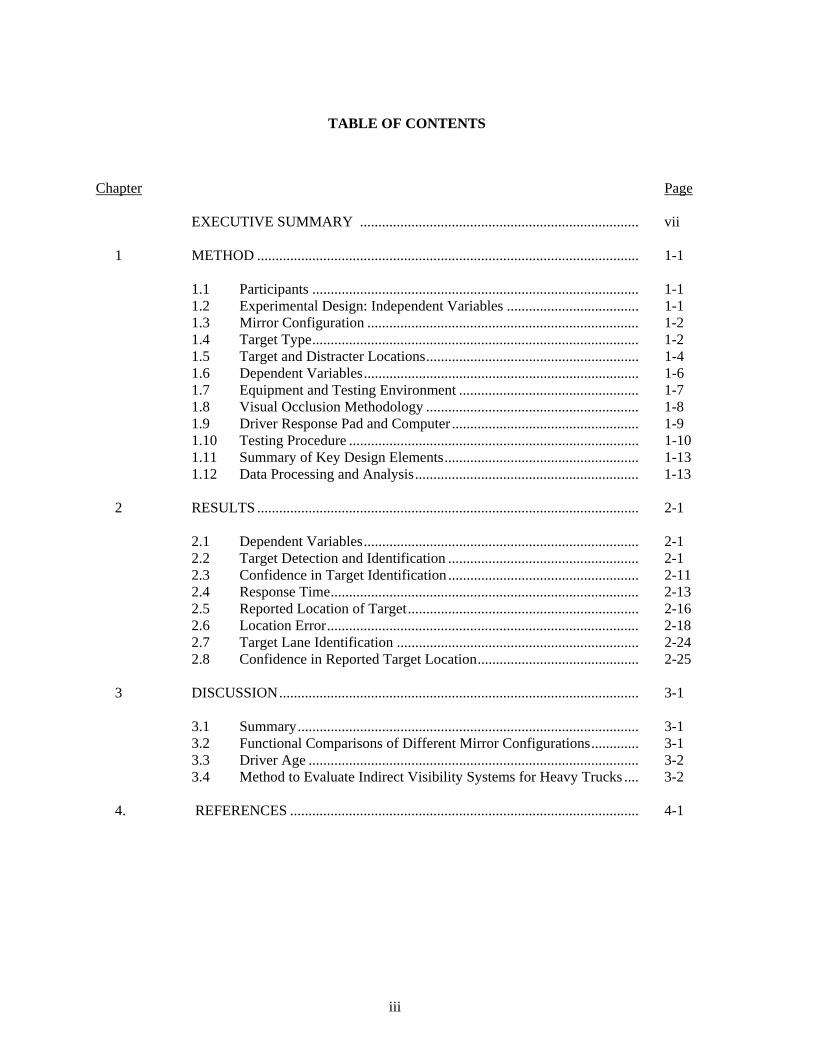
TABLE OF CONTENTS
Chapter Page EXECUTIVE SUMMARY ............................................................................ vii 1 METHOD ........................................................................................................ 1-1
1.1 Participants ......................................................................................... 1-1 1.2 Experimental Design: Independent Variables .................................... 1-1 1.3 Mirror Configuration .......................................................................... 1-2 1.4 Target Type......................................................................................... 1-2 1.5 Target and Distracter Locations.......................................................... 1-4 1.6 Dependent Variables........................................................................... 1-6 1.7 Equipment and Testing Environment ................................................. 1-7 1.8 Visual Occlusion Methodology .......................................................... 1-8 1.9 Driver Response Pad and Computer ................................................... 1-9 1.10 Testing Procedure ............................................................................... 1-10 1.11 Summary of Key Design Elements..................................................... 1-13 1.12 Data Processing and Analysis............................................................. 1-13
2 RESULTS ........................................................................................................ 2-1
2.1 Dependent Variables........................................................................... 2-1 2.2 Target Detection and Identification .................................................... 2-1 2.3 Confidence in Target Identification .................................................... 2-11 2.4 Response Time.................................................................................... 2-13 2.5 Reported Location of Target............................................................... 2-16 2.6 Location Error..................................................................................... 2-18 2.7 Target Lane Identification .................................................................. 2-24 2.8 Confidence in Reported Target Location............................................ 2-25
3 DISCUSSION.................................................................................................. 3-1
3.1 Summary............................................................................................. 3-1 3.2 Functional Comparisons of Different Mirror Configurations............. 3-1 3.3 Driver Age .......................................................................................... 3-2 3.4 Method to Evaluate Indirect Visibility Systems for Heavy Trucks .... 3-2
4. REFERENCES ............................................................................................... 4-1
iv
TABLE OF CONTENTS (continued)
List of Appendices
Appendix Page
A Informed Consent and Study Summary........................................................... A-1 B Frequencies of Missed Detections, Misidentifications, and Correct Identifications for Each Mirror Configuration and Target Location ............... B-1 C Federal Motor Vehicle Safety Standards for Rearview Mirrors ...................... C-1
List of Tables
Table
1-1 Mirror configurations used in the study........................................................... 1-3 2-1 Percentage of targets detected at each location and with each mirror configuration.................................................................................................... 2-2 2-2 Parameter estimates from logistic regression model predicting the probability of target detection.......................................................................... 2-8 2-3 Overall frequencies of identification confidence ratings ................................. 2-11 2-4 Analysis of variance tests for confidence in target identification .................... 2-12 2-5 Identification confidence ratings using different mirror configurations .......... 2-13 2-6 Analysis of variance tests for log response time............................................. 2-14 2-7 Mean log response times for younger and older drivers .................................. 2-15 2-8 Multiple comparisons of mean log response times for different mirror configurations ....................................................................................... 2-15 2-9 Multiple comparisons of mean log response times for different target types .. 2-16 2-10 Multiple comparisons of mean log response times for different target locations ........................................................................................................... 2-17 2-11 Analysis of variance tests for location error .................................................... 2-18
v
TABLE OF CONTENTS (continued)
List of Tables
Table
2-12 Mean location error for each target location.................................................... 2-24 2-13 Parameter estimates from logistic regression model predicting the probability of correct lane identification.......................................................... 2-25 2-14 Overall frequencies of location confidence ratings.......................................... 2-26 2-15 Analysis of variance tests for confidence in target location ............................ 2-26
List of Figures
Figure
1-1 Experimental design: distribution of test trials across subjects ....................... 1-2 1-2 Peterbilt truck, motorcycle, car, and minivan used in the study ...................... 1-4 1-3 Target and distracter locations relative to mapped mirror fields of view as measured on the Peterbilt Tractor-Trailer by Wierwille et al., 2004........... 1-5 1-4 Cab view of the window surfaces with panels in their opaque state (left), and with the panels clarified (right) ................................................................. 1-8 1-5 Driver response pad used to indicate target type, location, and confidence ratings .............................................................................................................. 1-10 2-1 Proportion of missed detections, misidentifications, and correct identifications using flat mirrors only.............................................................. 2-3 2-2 Proportion of missed detections, misidentifications, and correct identifications using flat and convex mirrors................................................... 2-4 2-3 Proportion of missed detections, misidentifications, and correct identifications using flat mirrors, convex mirrors, and look-down mirrors ..... 2-5 2-4 Proportion of missed detections, misidentifications, and correct identifications using flat mirrors, convex mirrors, and fender-mounted mirrors.............................................................................................................. 2-6
vi
TABLE OF CONTENTS (continued)
List of Figures
Figure
2-5 Proportion of missed detections, misidentifications, and correct identifications using convex mirrors only........................................................ 2-7 2-6 Mean reported positions of targets using flat mirrors only .............................. 2-19 2-7 Mean reported positions of targets using flat and convex mirrors (See description for Figure 2-6.)...................................................................... 2-20 2-8 Mean reported positions of targets using flat mirrors, convex mirrors, and look-down mirror (See description for Figure 2-6.).................................. 2-21 2-9 Mean reported positions of targets using flat mirrors, convex mirrors, and fender-mounted mirrors (See description for Figure 2-6.) ........................ 2-22 2-10 Mean reported positions of targets using convex mirrors only (See description for Figure 2-6.)...................................................................... 2-23
vii
EXECUTIVE SUMMARY
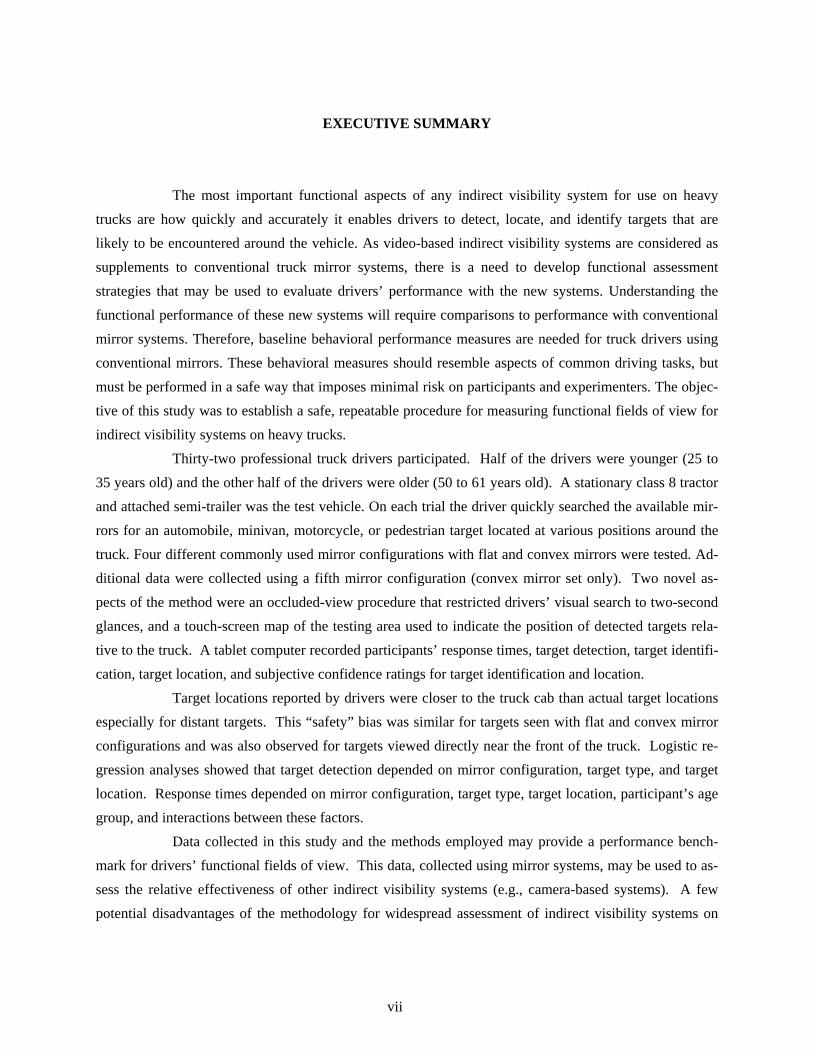
The most important functional aspects of any indirect visibility system for use on heavy trucks are how quickly and accurately it enables drivers to detect, locate, and identify targets that are likely to be encountered around the vehicle. As video-based indirect visibility systems are considered as supplements to conventional truck mirror systems, there is a need to develop functional assessment strategies that may be used to evaluate drivers’ performance with the new systems. Understanding the functional performance of these new systems will require comparisons to performance with conventional mirror systems. Therefore, baseline behavioral performance measures are needed for truck drivers using conventional mirrors. These behavioral measures should resemble aspects of common driving tasks, but must be performed in a safe way that imposes minimal risk on participants and experimenters. The objec-tive of this study was to establish a safe, repeatable procedure for measuring functional fields of view for indirect visibility systems on heavy trucks.
Thirty-two professional truck drivers participated. Half of the drivers were younger (25 to 35 years old) and the other half of the drivers were older (50 to 61 years old). A stationary class 8 tractor and attached semi-trailer was the test vehicle. On each trial the driver quickly searched the available mir-rors for an automobile, minivan, motorcycle, or pedestrian target located at various positions around the truck. Four different commonly used mirror configurations with flat and convex mirrors were tested. Ad-ditional data were collected using a fifth mirror configuration (convex mirror set only). Two novel as-pects of the method were an occluded-view procedure that restricted drivers’ visual search to two-second glances, and a touch-screen map of the testing area used to indicate the position of detected targets rela-tive to the truck. A tablet computer recorded participants’ response times, target detection, target identifi-cation, target location, and subjective confidence ratings for target identification and location.
Target locations reported by drivers were closer to the truck cab than actual target locations especially for distant targets. This “safety” bias was similar for targets seen with flat and convex mirror configurations and was also observed for targets viewed directly near the front of the truck. Logistic re-gression analyses showed that target detection depended on mirror configuration, target type, and target location. Response times depended on mirror configuration, target type, target location, participant’s age group, and interactions between these factors.
Data collected in this study and the methods employed may provide a performance bench-mark for drivers’ functional fields of view. This data, collected using mirror systems, may be used to as-sess the relative effectiveness of other indirect visibility systems (e.g., camera-based systems). A few potential disadvantages of the methodology for widespread assessment of indirect visibility systems on

viii
vehicles were noted. One potential disadvantage is that the techniques used in this study are moderately complex and would require a substantial amount of preparation before a similar experiment could be per-formed. The time and cost required to set up these procedures may limit their widespread use. Another potential difficulty with the procedure concerns the static nature of the testing procedure that does not involve driving under “real-world” conditions. At this time it is not known how well results obtained from the static testing procedures developed here will generalize to real driving conditions.
1-1
1. METHOD
1.1 Participants
Thirty-two CDL-licensed heavy-vehicle operators between the ages of 25 to 35 years old and 50 to 61 years old were recruited from the VTTI driver database. Two participants were women (one older, one younger), and the other 30 participants were men. In order to be included in the study, each driver must have had at least five years of driving experience (approximately 400,000 miles) in a heavy truck (with trailer), and no known visual impairments or eye disease. Drivers each were paid $75 for their participation.
1.2 Experimental Design: Independent Variables
This study uses a mixed factorial design with three within-subject factors and one between-subject factor (a 4x4x14x2 split-plot design) to assess the quality and quantity of FOV of truck mirror systems under static conditions. The independent variables include:
Within-Subject Factors: 1. Mirror configuration, four levels;
2. Target type, four levels;
3. Target location, 14 levels; and
Between-Subject Factor: 4. Age (25-35 years and 50-61 years).
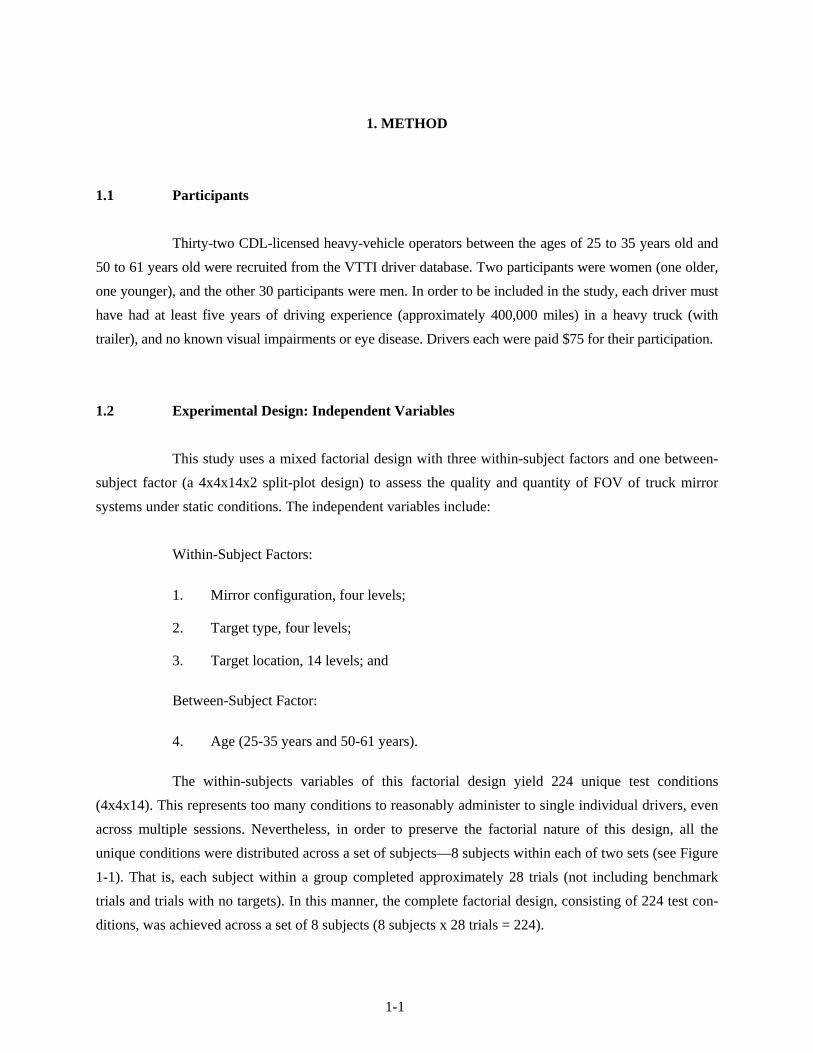
The within-subjects variables of this factorial design yield 224 unique test conditions (4x4x14). This represents too many conditions to reasonably administer to single individual drivers, even across multiple sessions. Nevertheless, in order to preserve the factorial nature of this design, all the unique conditions were distributed across a set of subjects—8 subjects within each of two sets (see Figure 1-1). That is, each subject within a group completed approximately 28 trials (not including benchmark trials and trials with no targets). In this manner, the complete factorial design, consisting of 224 test con-ditions, was achieved across a set of 8 subjects (8 subjects x 28 trials = 224).
1-2
32 Drivers
16 Younger 16 Older
8 8 88
(28 trials each = 224)
(28 trials each = 224)
(28 trials each = 224)
(28 trials each = 224)
32 Drivers
16 Younger 16 Older
8 8 88
(28 trials each = 224)
(28 trials each = 224)
(28 trials each = 224)
(28 trials each = 224)
Figure 1-1. Experimental design: distribution of test trials across subjects
1.3 Mirror Configuration
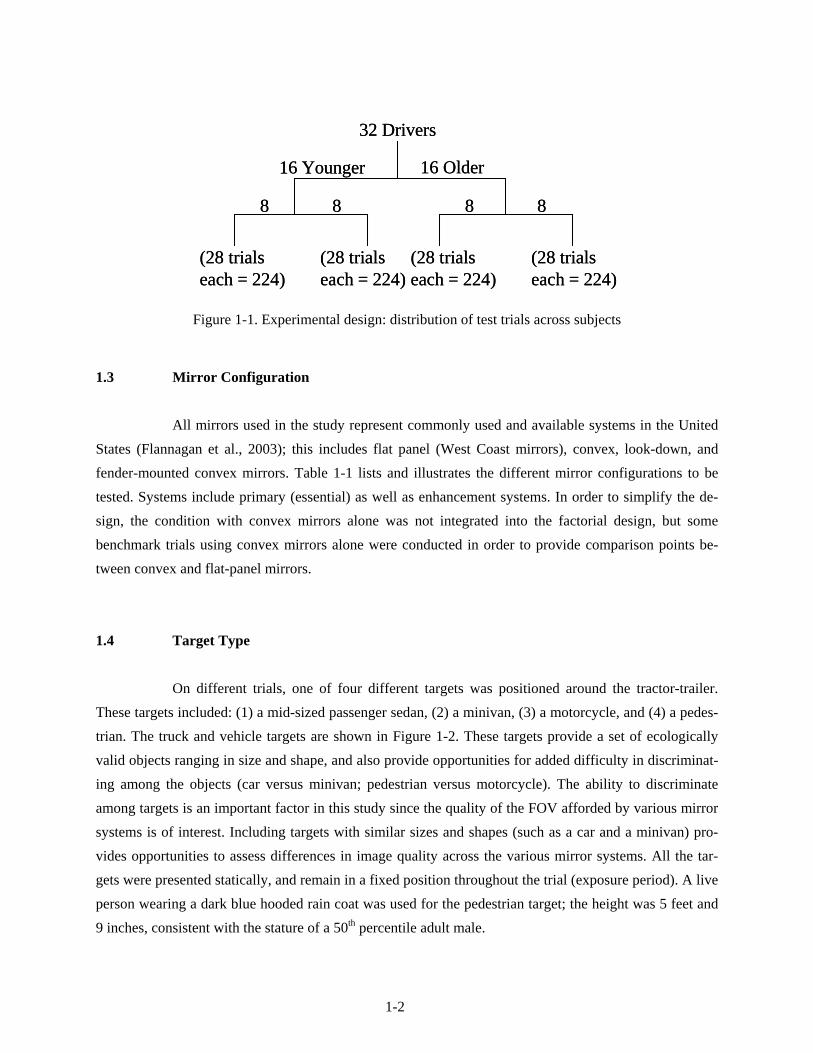
All mirrors used in the study represent commonly used and available systems in the United States (Flannagan et al., 2003); this includes flat panel (West Coast mirrors), convex, look-down, and fender-mounted convex mirrors. Table 1-1 lists and illustrates the different mirror configurations to be tested. Systems include primary (essential) as well as enhancement systems. In order to simplify the de-sign, the condition with convex mirrors alone was not integrated into the factorial design, but some benchmark trials using convex mirrors alone were conducted in order to provide comparison points be-tween convex and flat-panel mirrors.
1.4 Target Type
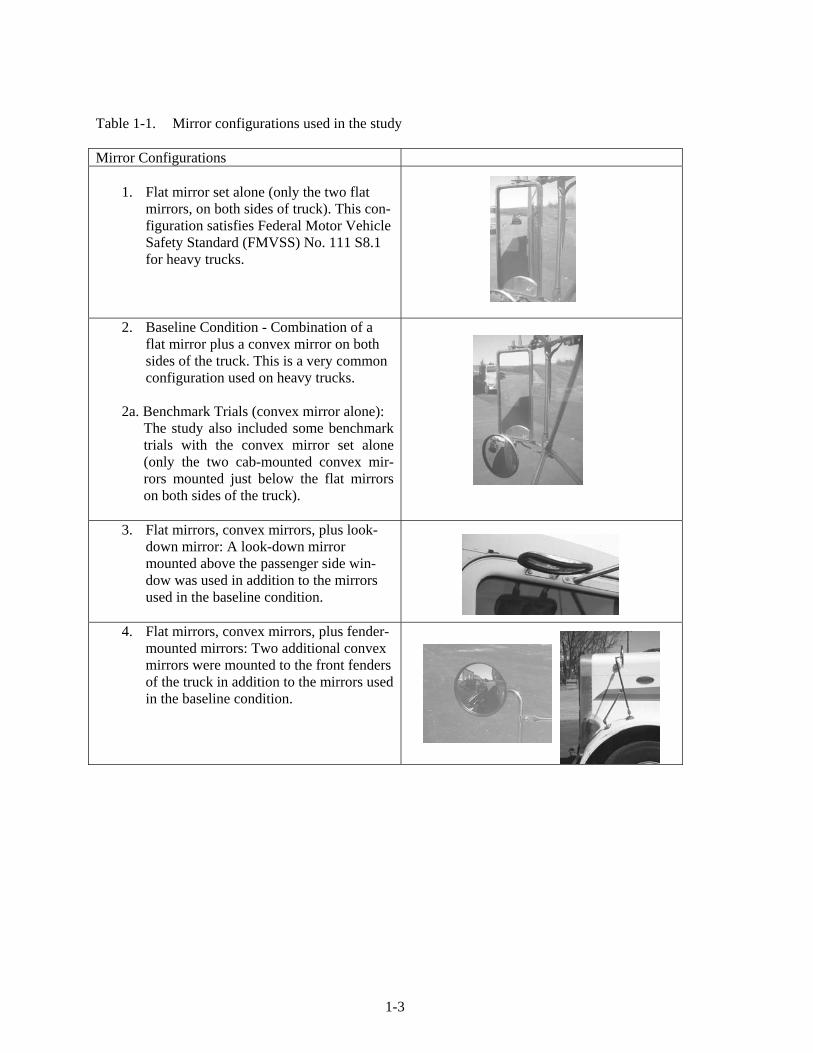
On different trials, one of four different targets was positioned around the tractor-trailer. These targets included: (1) a mid-sized passenger sedan, (2) a minivan, (3) a motorcycle, and (4) a pedes-trian. The truck and vehicle targets are shown in Figure 1-2. These targets provide a set of ecologically valid objects ranging in size and shape, and also provide opportunities for added difficulty in discriminat-ing among the objects (car versus minivan; pedestrian versus motorcycle). The ability to discriminate among targets is an important factor in this study since the quality of the FOV afforded by various mirror systems is of interest. Including targets with similar sizes and shapes (such as a car and a minivan) pro-vides opportunities to assess differences in image quality across the various mirror systems. All the tar-gets were presented statically, and remain in a fixed position throughout the trial (exposure period). A live person wearing a dark blue hooded rain coat was used for the pedestrian target; the height was 5 feet and 9 inches, consistent with the stature of a 50th percentile adult male.
1-3
Table 1-1. Mirror configurations used in the study Mirror Configurations
1. Flat mirror set alone (only the two flat
mirrors, on both sides of truck). This con-figuration satisfies Federal Motor Vehicle Safety Standard (FMVSS) No. 111 S8.1 for heavy trucks.
2. Baseline Condition - Combination of a flat mirror plus a convex mirror on both sides of the truck. This is a very common configuration used on heavy trucks.
2a. Benchmark Trials (convex mirror alone):
The study also included some benchmark trials with the convex mirror set alone (only the two cab-mounted convex mir-rors mounted just below the flat mirrors on both sides of the truck).
3. Flat mirrors, convex mirrors, plus look-down mirror: A look-down mirror mounted above the passenger side win-dow was used in addition to the mirrors used in the baseline condition.
4. Flat mirrors, convex mirrors, plus fender-mounted mirrors: Two additional convex mirrors were mounted to the front fenders of the truck in addition to the mirrors used in the baseline condition.
1-4
Figure 1-2. Peterbilt truck, motorcycle, car, and minivan used in the study
Targets were presented amidst a field of six distracter targets to provide a more visually clut-tered and challenging environment. Distracter targets were located in fixed positions around the tractor-trailer. In order to simplify the logistics of running the study, the set of distracter targets remained in fixed locations throughout the study. Varying the location of the distracter targets within a session would have added too much complexity to an already complex design (the presentation of the test targets and trials were randomized, and counterbalanced across subjects). All distracter targets had a similar size (1.5 ft x 1.5 ft), shape (square), and color (green). The distracter targets spanned approximately 36 to 54 inches in height, corresponding to the typical height of a car’s hood (36 inches) and roof line (54 inches).
1.5 Target and Distracter Locations
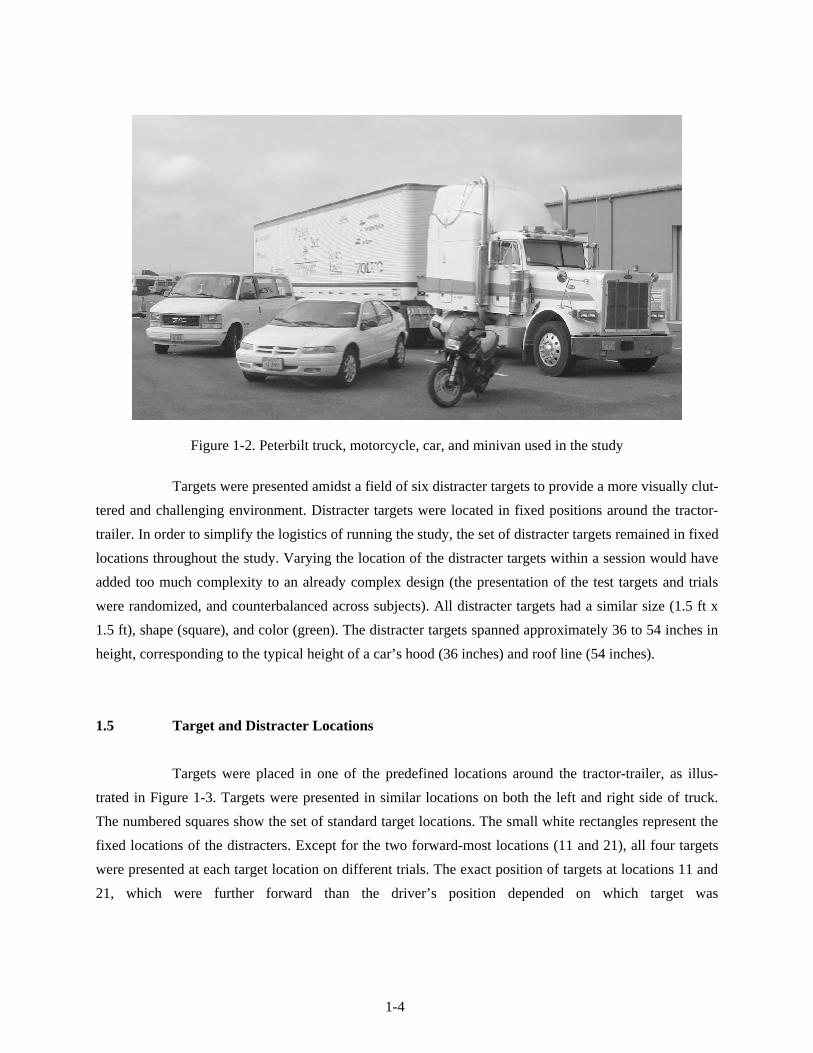
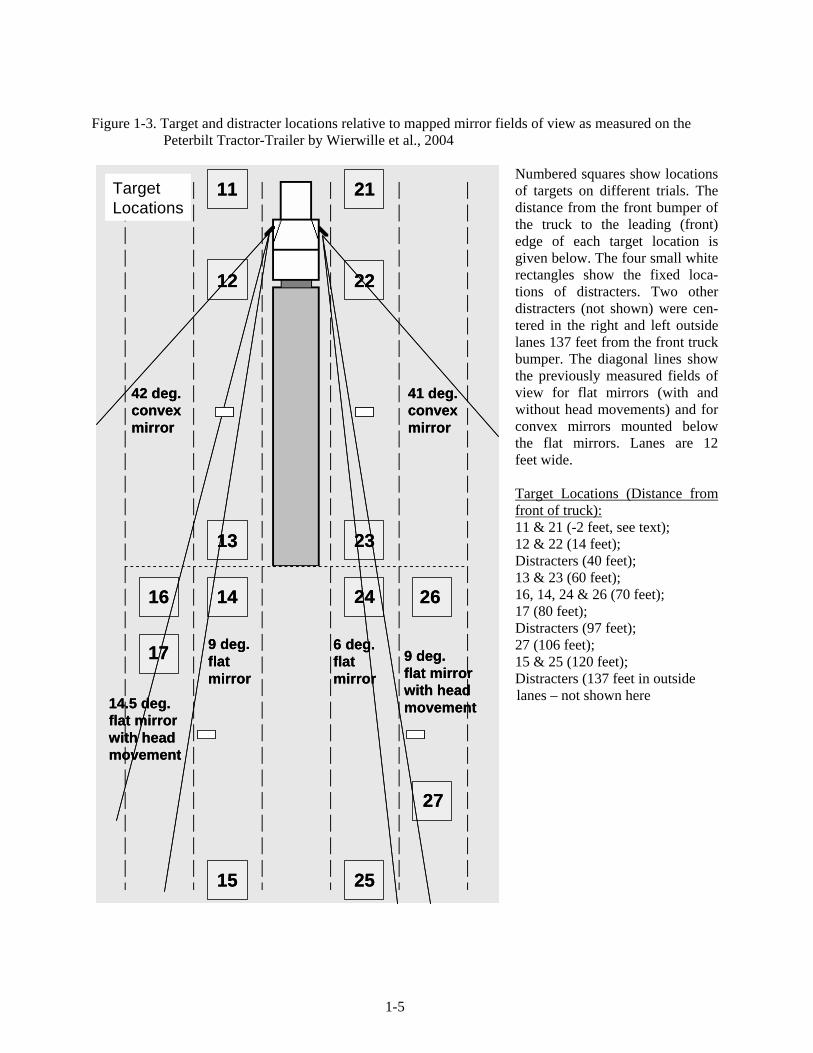
Targets were placed in one of the predefined locations around the tractor-trailer, as illus-trated in Figure 1-3. Targets were presented in similar locations on both the left and right side of truck. The numbered squares show the set of standard target locations. The small white rectangles represent the fixed locations of the distracters. Except for the two forward-most locations (11 and 21), all four targets were presented at each target location on different trials. The exact position of targets at locations 11 and 21, which were further forward than the driver’s position depended on which target was
1-5
Figure 1-3. Target and distracter locations relative to mapped mirror fields of view as measured on the Peterbilt Tractor-Trailer by Wierwille et al., 2004
Target Locations
11
23
14 24 26
15 25
21
12
13
22
16
17
27
41 deg.convexmirror
42 deg.convexmirror
14.5 deg.flat mirrorwith head movement
9 deg.flat mirror
6 deg.flatmirror
9 deg.flat mirrorwith headmovement
Target Locations
11
23
14 24 26
15 25
21
12
13
22
16
17
27
Target Locations
11
23
14 24 26
15 25
21
12
13
22
16
17
27
Target LocationsTarget Locations
11
23
14 24 26
15 25
21
12
13
22
16
17
27
11
23
14 24 26
15 25
21
12
13
22
16
17
27
41 deg.convexmirror
42 deg.convexmirror
14.5 deg.flat mirrorwith head movement
9 deg.flat mirror
6 deg.flatmirror
9 deg.flat mirrorwith headmovement
41 deg.convexmirror
42 deg.convexmirror
14.5 deg.flat mirrorwith head movement
9 deg.flat mirror
6 deg.flatmirror
9 deg.flat mirrorwith headmovement
Numbered squares show locations of targets on different trials. The distance from the front bumper of the truck to the leading (front) edge of each target location is given below. The four small white rectangles show the fixed loca-tions of distracters. Two other distracters (not shown) were cen-tered in the right and left outside lanes 137 feet from the front truck bumper. The diagonal lines show the previously measured fields of view for flat mirrors (with and without head movements) and for convex mirrors mounted below the flat mirrors. Lanes are 12 feet wide. Target Locations (Distance from front of truck): 11 & 21 (-2 feet, see text); 12 & 22 (14 feet); Distracters (40 feet); 13 & 23 (60 feet); 16, 14, 24 & 26 (70 feet); 17 (80 feet); Distracters (97 feet); 27 (106 feet); 15 & 25 (120 feet); Distracters (137 feet in outside lanes – not shown here
1-6
being presented. The large targets (car and minivan) were positioned so that the front of each vehicle was at -2 feet (slightly forward of the truck bumper), and the small targets (pedestrian and motorcycle) were positioned so that the front of the target was at 8 feet (behind the truck bumper). These different distances were used so that the rear (trailing edge) of the large targets would be close to the position of the rear (trailing edge) of the two smaller targets (pedestrian and motorcycle). The data obtained from the -2 feet and 8 feet target locations were pooled for all analyses.
The specific target locations were selected to correspond to drivers’ field of view (FOV) as-
sociated with the different individual mirrors as mapped from inside the Peterbilt truck cab (Weirwille et al., 2004). In Figure 1-3, the diagonal lines illustrate the outer limits of the FOV for the flat mirrors as well as the wider FOV for the convex mirrors mounted just below the flat mirrors. These fields of view vary not only by mirror type, but also in terms of their placement (the left or right side of the truck). For example, the FOV on the convex mirror is 42 degrees to the left, and 41 degrees to the right. Differences between left and right sides of the truck are more striking for the flat panel mirrors where FOV is ap-proximately 9 degrees on the left (14.5 degrees with head movement), and 6 degrees on the right (9 de-grees with head movement). The fields of view for the convex mirrors overlap the fields of view for the flat mirrors.
1.6 Dependent Variables
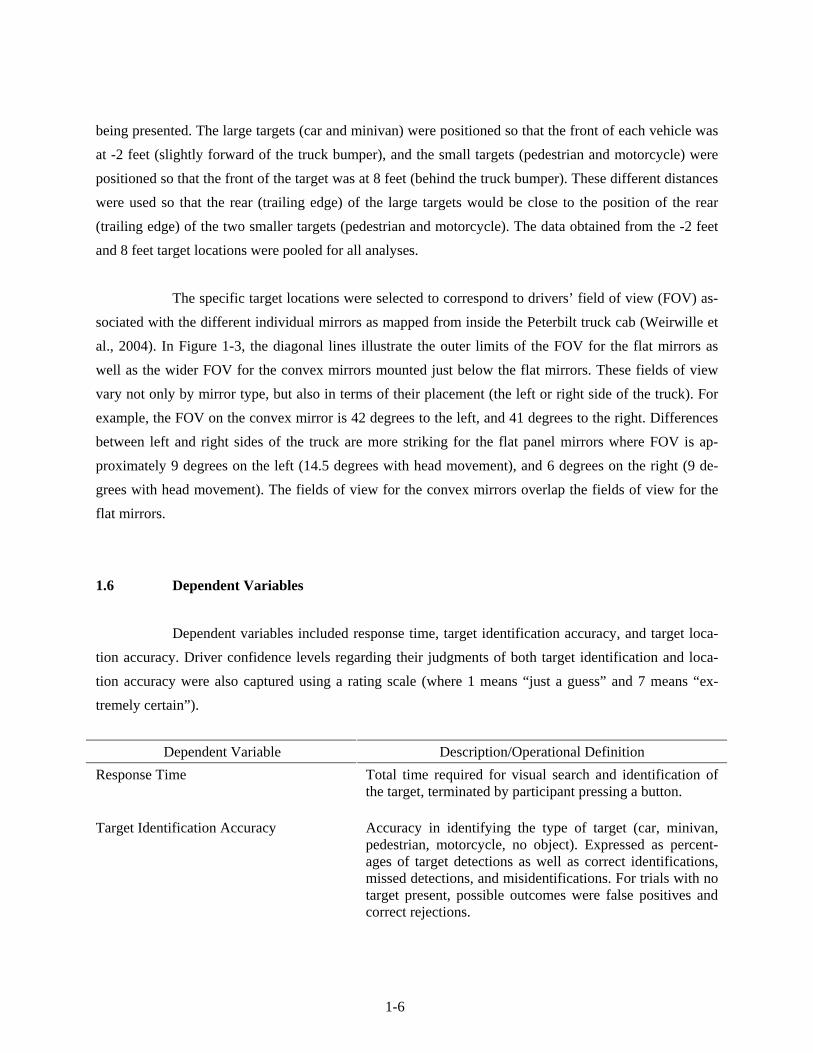
Dependent variables included response time, target identification accuracy, and target loca-tion accuracy. Driver confidence levels regarding their judgments of both target identification and loca-tion accuracy were also captured using a rating scale (where 1 means “just a guess” and 7 means “ex-tremely certain”).
Dependent Variable Description/Operational Definition
Response Time Total time required for visual search and identification of the target, terminated by participant pressing a button.
Target Identification Accuracy Accuracy in identifying the type of target (car, minivan, pedestrian, motorcycle, no object). Expressed as percent-ages of target detections as well as correct identifications, missed detections, and misidentifications. For trials with no target present, possible outcomes were false positives and correct rejections.
1-7
Dependent Variable Description/Operational Definition
Target Location Accuracy Error in estimating the true position of the target (when pre-sent). Expressed as an error score relative to the actual posi-tion of the target measured as a distance in feet. Also, accu-racy in identification of the target’s lane was measured.
Confidence in Target Type Level of confidence rated on a 7 point scale (1= just a guess, 7 = extremely certain)
Confidence in Target Location Level of confidence rated on a 7 point scale (1= just a guess, 7 = extremely certain)
1.7 Equipment and Testing Environment
A 1995 Peterbilt 379 Class 8 tractor with an attached 48 ft. (14.6 m) semitrailer was used in the study. During testing, the truck remained stationary and was parked outside on a flat asphalt test pad marked with white lane tape to simulate five adjacent highway travel lanes. Each lane was 12 ft. (3.7 m) wide. The truck was parked in the center lane with two lanes on either side. The truck was equipped with standard flat mirrors mounted on the driver’s side and passenger’s side of the truck cab along with smaller convex mirrors mounted just below each of the flat mirrors. An additional set of convex mirrors was mounted on the right and left front fenders of the truck, and a “look down” mirror was mounted above the passenger side window. A small clear window near the bottom of the passenger side door was occluded for the duration of the study. All mirrors remained in-place throughout testing; testing of the various mir-ror configurations (as prescribed by the experimental conditions) was accomplished by covering combina-tions of individual mirrors on different trials with black cloth so they could not be viewed by drivers.
All experimental sessions were conducted during July and August, during daylight hours (8
a.m. to 5 p.m.) while the sun was at various angles overhead. Weather conditions on the day of each ses-sion were noted. No experimental sessions were conducted at times when visibility was reduced by such conditions as rain or fog.
1-8
1.8 Visual Occlusion Methodology
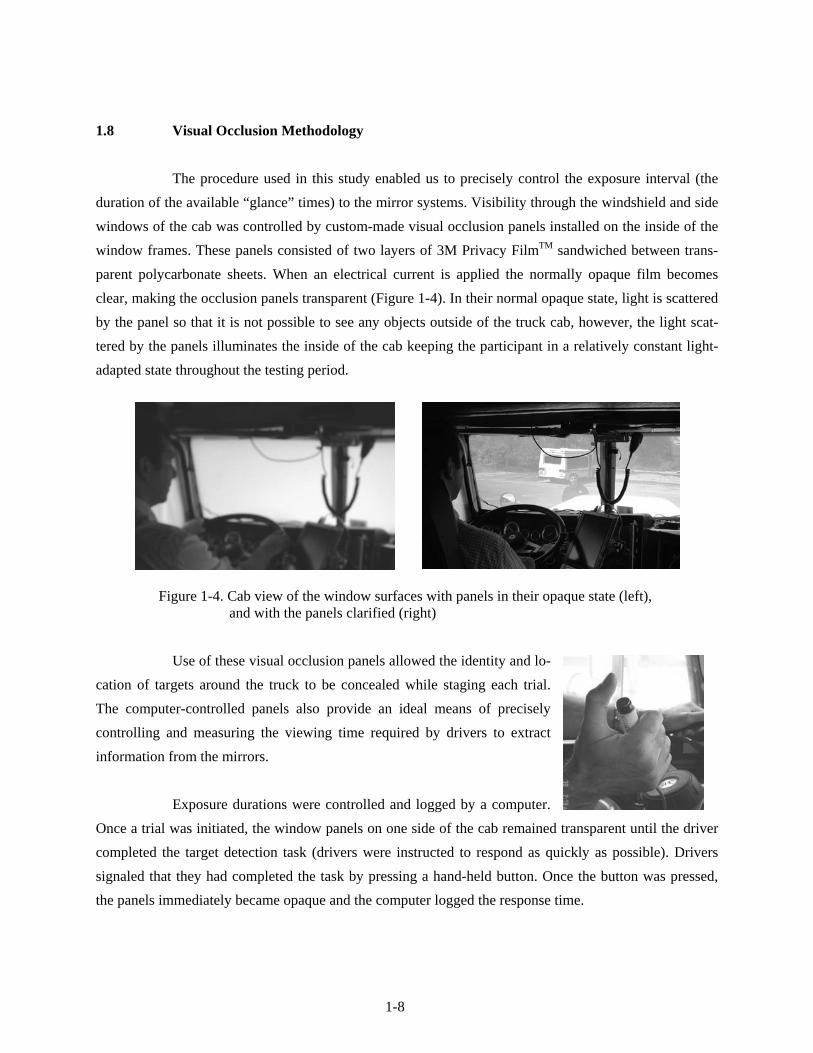
The procedure used in this study enabled us to precisely control the exposure interval (the duration of the available “glance” times) to the mirror systems. Visibility through the windshield and side windows of the cab was controlled by custom-made visual occlusion panels installed on the inside of the window frames. These panels consisted of two layers of 3M Privacy FilmTM sandwiched between trans-parent polycarbonate sheets. When an electrical current is applied the normally opaque film becomes clear, making the occlusion panels transparent (Figure 1-4). In their normal opaque state, light is scattered by the panel so that it is not possible to see any objects outside of the truck cab, however, the light scat-tered by the panels illuminates the inside of the cab keeping the participant in a relatively constant light-adapted state throughout the testing period.
Figure 1-4. Cab view of the window surfaces with panels in their opaque state (left), and with the panels clarified (right)
Use of these visual occlusion panels allowed the identity and lo-
cation of targets around the truck to be concealed while staging each trial. The computer-controlled panels also provide an ideal means of precisely controlling and measuring the viewing time required by drivers to extract information from the mirrors.
Exposure durations were controlled and logged by a computer.
Once a trial was initiated, the window panels on one side of the cab remained transparent until the driver completed the target detection task (drivers were instructed to respond as quickly as possible). Drivers signaled that they had completed the task by pressing a hand-held button. Once the button was pressed, the panels immediately became opaque and the computer logged the response time.
1-9
In order to preclude drivers from continuously staring in the mirrors (which is not consistent with routine or safe driving practices), a method of interrupted vision (visual occlusion) was used. Al-though there was no time limit to complete a trial, the length of each exposure was limited to 2 seconds – corresponding to the generally acceptable maximum glance duration while driving. That is, the duration of each individual exposure had an upper threshold (2 seconds) at which point the panels became opaque for a brief “visual occlusion” interval (1.5 seconds) before once again clarifying. This shutter open/closed cycle repeated until the driver pressed the hand-held button (the number of exposures per trial depended on how long it took the driver to detect, locate, and identify the target). This visual occlusion procedure is consistent with the SAE recommended practice J2364.
1.9 Driver Response Pad and Computer
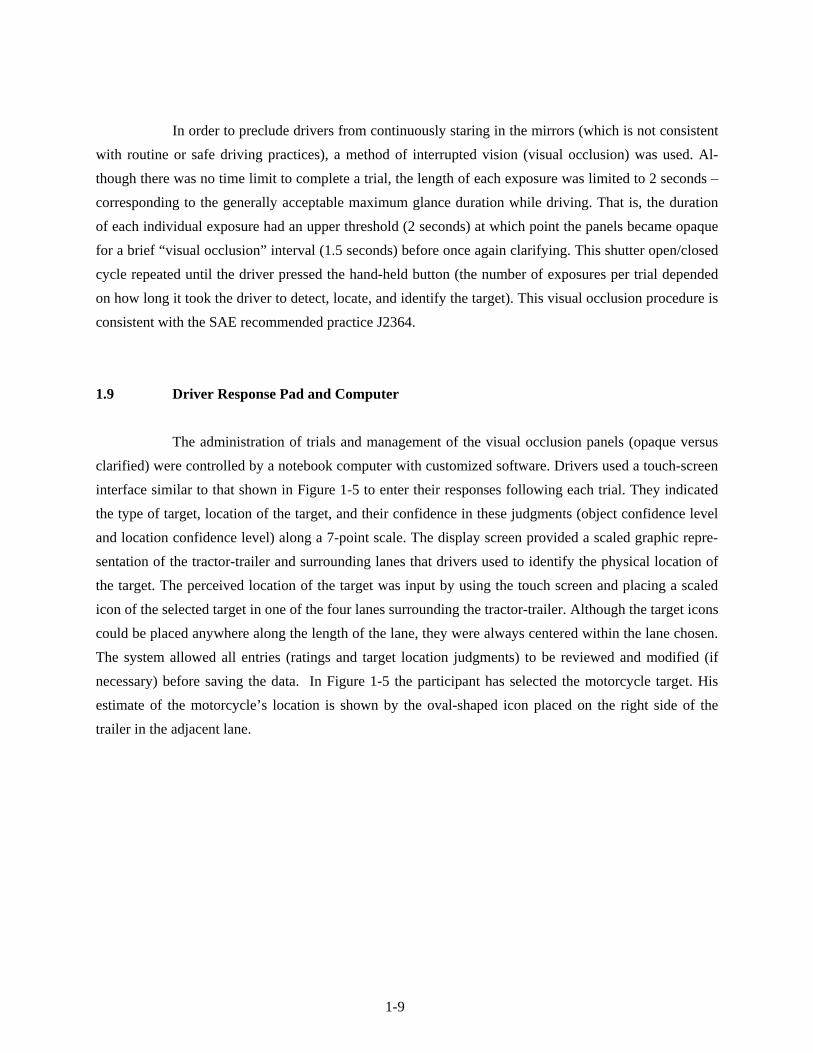
The administration of trials and management of the visual occlusion panels (opaque versus clarified) were controlled by a notebook computer with customized software. Drivers used a touch-screen interface similar to that shown in Figure 1-5 to enter their responses following each trial. They indicated the type of target, location of the target, and their confidence in these judgments (object confidence level and location confidence level) along a 7-point scale. The display screen provided a scaled graphic repre-sentation of the tractor-trailer and surrounding lanes that drivers used to identify the physical location of the target. The perceived location of the target was input by using the touch screen and placing a scaled icon of the selected target in one of the four lanes surrounding the tractor-trailer. Although the target icons could be placed anywhere along the length of the lane, they were always centered within the lane chosen. The system allowed all entries (ratings and target location judgments) to be reviewed and modified (if necessary) before saving the data. In Figure 1-5 the participant has selected the motorcycle target. His estimate of the motorcycle’s location is shown by the oval-shaped icon placed on the right side of the trailer in the adjacent lane.
1-10
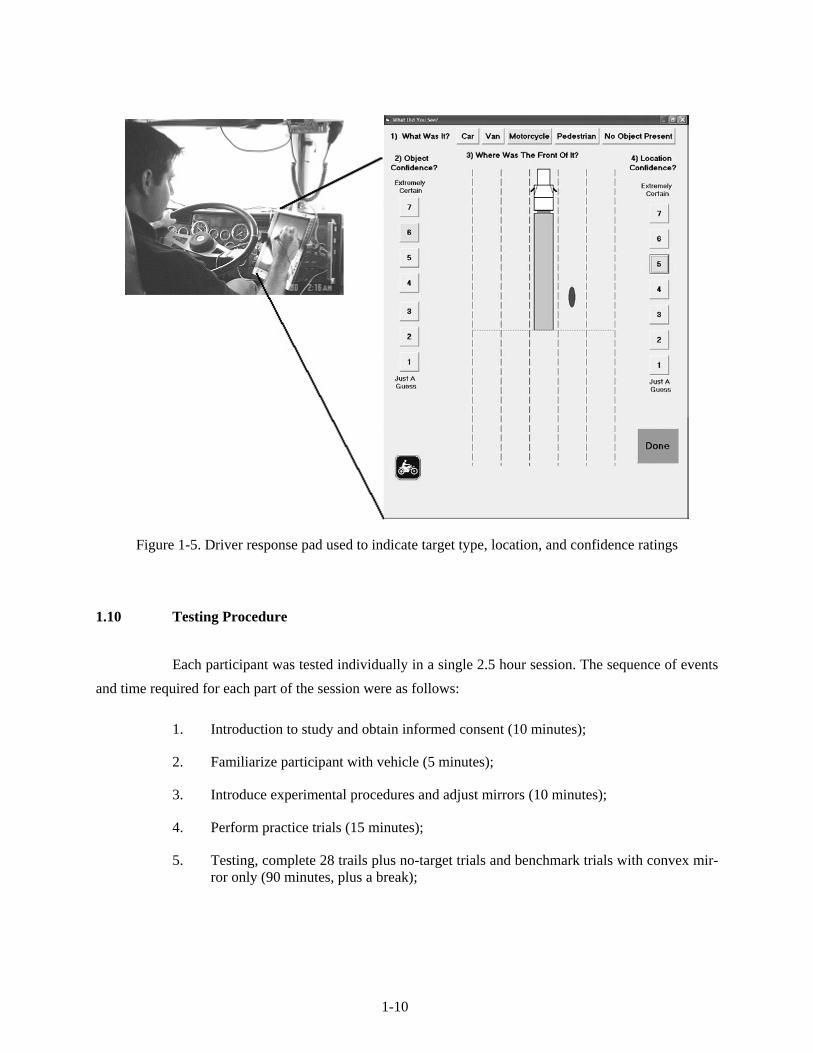
Figure 1-5. Driver response pad used to indicate target type, location, and confidence ratings
1.10 Testing Procedure
Each participant was tested individually in a single 2.5 hour session. The sequence of events and time required for each part of the session were as follows:
1. Introduction to study and obtain informed consent (10 minutes);
2. Familiarize participant with vehicle (5 minutes);
3. Introduce experimental procedures and adjust mirrors (10 minutes);
4. Perform practice trials (15 minutes);
5. Testing, complete 28 trails plus no-target trials and benchmark trials with convex mir-ror only (90 minutes, plus a break);

1-11
6. Administer post-study questionnaire (10 minutes); and
7. Debriefing and payment to participant (10 minutes).
Upon arrival, participants were required to review and sign an informed consent form (see Appendix A) outlining the study purpose, research procedures, foreseeable risks, benefits of the research, and confidentiality. The experimenter verified that the participant is a licensed CDL truck driver. The par-ticipant then had an opportunity to familiarize himself or herself with the research vehicle (1995 Peter-bilt). Since participants were not actually driving the truck, the familiarization stage focused on adjusting the seat and mirrors. Mirror adjustments were made to each driver’s preferences to ensure that all avail-able mirror systems were appropriately aimed. Once this had been accomplished, drivers were introduced to the experimental procedures and provided a set of practice trials.
All trials (including practice) were performed with the vehicle engine off. (An air condition-
ing unit was installed to maintain a comfortable temperature inside the cab.) The experimenter first dem-onstrated the steps required to complete the task (required judgments and how to input them using the response pad) and then presented each of the four test targets to be used. Drivers were informed that some trials may not include the presentation of a test target. They were given an opportunity to practice the task and to input responses into the system following the initial demonstration. Practice continued until drivers were comfortable with the procedures for completing the detection task and using the touch-screen pad to input their responses. Formal testing commenced following the practice trials. Drivers were asked to wear their seat belts and remain seated (as if they were driving) throughout the testing procedure (normal head/body movements were allowed). Each trial consisted of the following sequence:
1. Verbal cue from the experimenter signaling that the next trial is about to begin.
-
-
-
Drivers were asked to face forward and adopt a normal seated driving posture.
Drivers were instructed to hold the hand-held response button in advance of the start of the trial. (Drivers did not hold the stylus for the touch-screen re-sponse pad).
Drivers were instructed to search for the target using the available mirrors and then to respond as quickly as possible by pressing the handheld button once they had acquired the needed information (target type and location).
2. Initiation of the trial followed a random interval of between 2 and 5 seconds.
- The window panels became clear on either the right or left side of the cab only (including the side window and half of the front windshield).
1-12
-
-
-
Drivers searched the available mirrors to perform the detection, recognition, and localization task. Before each trial, the driver did not know which mirror configuration would be available or which windows would be clarified.
If the target detection, recognition, and localization task was not completed within the first 2 seconds, the computer automatically shut the window panels (occluding the mirror views) for 1.5 seconds after which time the panels clari-fied again for another 2-second interval. This sequence continued until the driver had acquired the needed information and terminated the trial (as outlined in step #3 below).
Targets appeared in any of the predefined positions within the four simulated travel lanes next to the tractor trailer. The driver was not informed that a fixed number of predefined positions would be used.
3. Termination of the trial by the driver pressing the hand-held “detection response” but-ton to signify that they had located and identified the target, (or concluded that no tar-get was present).
- Once the button was pressed, all of the window panels immediately became opaque; they remained opaque until the next trial.
4. Driver responses were entered using the touch-screen response pad.
-
-
Judgments related to the type of target, location of the target, and confidence levels for target type and location were entered.
Driver confirmed the entries and saved the responses.
5. An experimenter (seated in the cab behind the driver) engaged the driver in conversa-tion while the next trial was staged outside.
- A recording of truck engine noise was played continuously through in-cab speakers in order to mask any possible auditory cues from outside the cab that may have occurred as targets were positioned between trials.
Experimental trials were randomized (i.e., not blocked by target type, target location, mirror configuration, or presentation side) across subjects using a set of matched random sequences. Four differ-ent random trial sequences were created then an additional four sequences were generated by taking the reverse order of the first set of random sequences. This yielded a total of eight different matched random sequences. The resulting eight random orders were distributed over the sample of 32 drivers; each age group of 16 drivers experienced two complete sets of the eight random trial orders. Prior to each trial, drivers did not know which window panels would clarify (left or right side), or which mirrors would be available (uncovered). This approach may have introduced some “noise” (variability) into the response time data because of the need to search the environment to find out what mirrors were available.
1-13
1.11 Summary of Key Design Elements
Drivers were seated in the truck with seat belts on, allowing normal body/head movements during mirror search.
Drivers were instructed to search for the target as quickly as possible and press a hand-held button once they had located and identified the target (if present).
Trials were randomized across subjects. One target (automobile, passenger van, motorcycle, or pedestrian) was presented per trial, although some trials included no targets.
Individual “glances” to mirrors were limited to 2-second exposures. On each trial drivers searched mirrors on only one side of the truck through multiple 2-second ex-posures, if necessary.
The test target was embedded within a field of distracter targets.
Drivers entered responses (target type, location, and confidence judgments) using a touch-screen computer.
1.12 Data Processing and Analysis
Driver performance and response data were recorded automatically on the tablet-PC. The data were written to an external flat file and were analyzed using SAS statistical software. Key measures for each trial include:
1. Response time. (For multiple exposures this includes all open and closed times until
response button was pressed.)
2. Accuracy in detecting and identifying the target included correct detections, missed detections (saying that no target was present when a target was present), correct iden-tifications (of target type), misidentifications, and false positives (saying that a target was present on a trial that contained no target). Perceived location of the target, as in-dicated by the driver on the touch screen’s map view of the truck and adjacent lanes, was encoded by lane and by in-lane distance from the front bumper of the truck.
3. Location error was defined as the in-lane distance (in feet) between the actual target location and the perceived target location. Location error has a value less than 0.0 when the perceived target location is closer to the front of the truck than the actual target location, and it has a value greater than 0.0 when the perceived target location is
1-14
farther back from the front of the truck than the actual location. Note that location er-ror may be small or equal to 0.0 even when the lane selected is incorrect.
4. Confidence level for identification of target type (rated on a 7-point scale)
5. Confidence level for location (rated on a 7-point scale)
Distributions of response times were examined for extreme values (outliers) that might un-duly influence statistical analyses. For all trials on which a target was present, response times that were further than three standard deviations from the mean were trimmed to a value that was three standard de-viations from the mean. Similarly, for trials on which no target was present, outliers were trimmed to +/- 3 standard deviations from the mean response time for all no-target trials. Response times for 14 out of 1,056 trials (1.3%) were adjusted in this way. Location Error data were examined separately for each tar-get location and a similar procedure was used to adjust outliers. Location error data on five out of 1,056 trials (0.5%) were trimmed to +/- 3 standard deviations from the mean location error for the target loca-tion used on the trial. Examination of the trials resulting in outlier values showed that they were distrib-uted across several different experimental conditions and participants.
2-1
2. RESULTS
2.1 Dependent Variables
The following description of results is organized around analyses of target detection and tar-get identification, confidence in target identification, response time, reported target location, and confi-dence in target location. Reported target location was the dependent measure that yielded the most unex-pected results. These results are described in separate sections on location error (defined as reported posi-tion of the target compared to actual position of target measured parallel to the travel lanes) and target lane identification (either correct or incorrect).
2.2 Target Detection and Identification
Data from 1,056 valid trials were obtained in this study. Of these trials, 993 (94%) contained a target and the remaining 63 (6%) were “blank” trials on which no target was presented. Results for each trial were classified according to one of five possible outcomes:
Correct ID: Target was present, target was detected, and the target type was correctly identified.
Misidentification: Target was present and detected but misidentified.
Missed detection: Target was present but not detected.
Correct rejection: Target was not present, and participant reported that no target was present.
False positive: Target was not present, but participant reported seeing a target.
All 63 trials with no target present resulted in correct rejections, so there were no trials with a false positive outcome. Of the 993 trials on which a target was present, 866 (87%) resulted in correct identifications, 18 (1.8%) resulted in misidentifications, and 109 (11%) resulted in missed detections. Par-ticipants varied in the number of missed targets. The two participants with the greatest number of missed targets correctly identified targets on only 60 percent and 72 percent of trials. At the other extreme, there were two participants who correctly identified 100 percent of their targets. These differences may reflect differences in search abilities however, the subset of target viewing conditions (mirror configuration x

2-2
target type x target location) was not the same for all participants, and some participants may have had more difficult combinations of these factors.
The trials resulting in missed detections were not distributed uniformly across mirror con-
figurations, target types, or target locations. Approximately 49 percent of all trials with missed detections occurred with the flat mirrors-only configuration. Approximately 75 percent of missed detections oc-curred with the smaller targets (pedestrian, motorcycle) as opposed to larger targets (car, minivan). Target locations with the greatest number of missed detections were Locations 16, 22, and 26, followed by Loca-tions 21, 12, and 17. For each target location and mirror configuration, the percentage of targets is shown in Table 2-1. These percentages include detected but misidentified targets.
Table 2-1. Percentage of targets detected at each location and with each mirror configuration
Location (left side of truck)Mirrors 11 12 13 14 15 16 17Flat Only 93% 50% 94% 100% 100% 63% 56%Flat & Convex 100% 82% 100% 100% 100% 86% 100%Flat, Convex, & Look-Down 100% 100% 100% 100% 100% 100% 100%Flat, Convex, & Fender 100% 94% 100% 100% 100% 69% 100%Convex Only 100% 100% 100% 88% 100% 100% 88%Overall 99% 81% 99% 99% 99% 74% 86%
Location (right side of truck)Mirrors 21 22 23 24 25 26 27 All LocationsFlat Only 80% 19% 100% 93% 100% 25% 88% 76%Flat & Convex 75% 93% 100% 100% 100% 94% 82% 94%Flat, Convex, & Look-Down 100% 100% 100% 100% 100% 88% 88% 92%Flat, Convex, & Fender 82% 100% 100% 100% 94% 82% 93% 94%Convex Only 75% 75% 100% 88% 75% 100% 100% 92%Overall 80% 74% 99% 97% 96% 75% 89% 89%
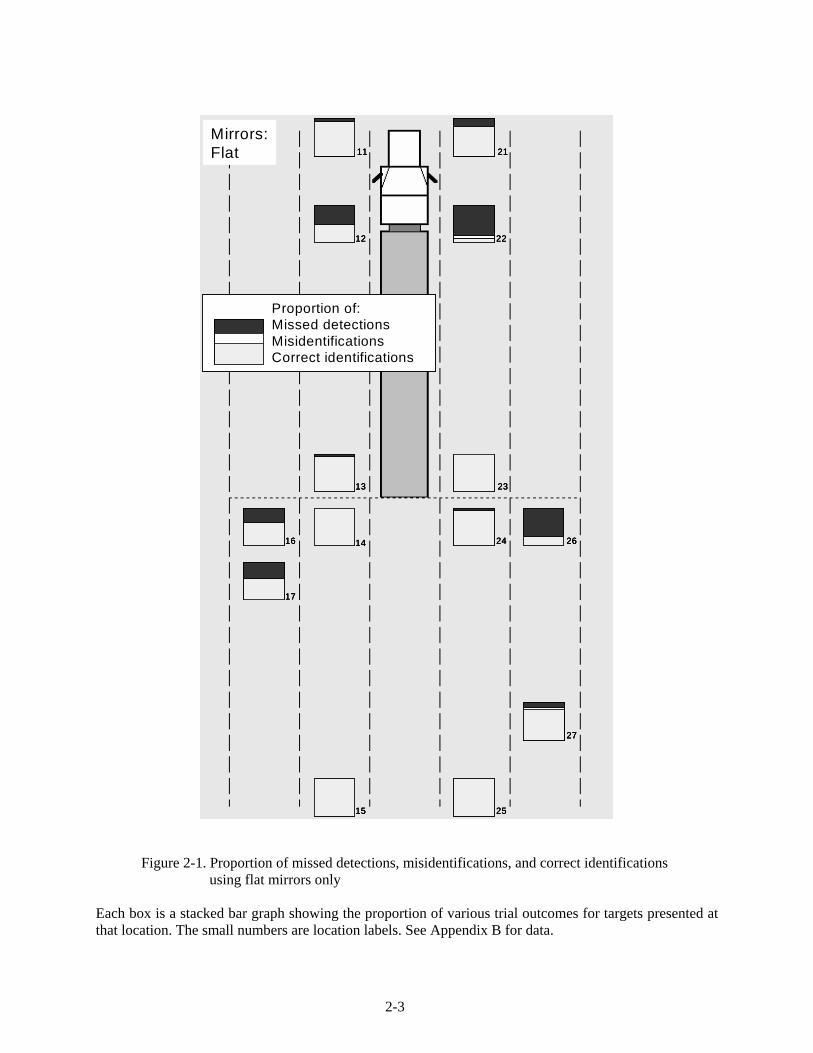
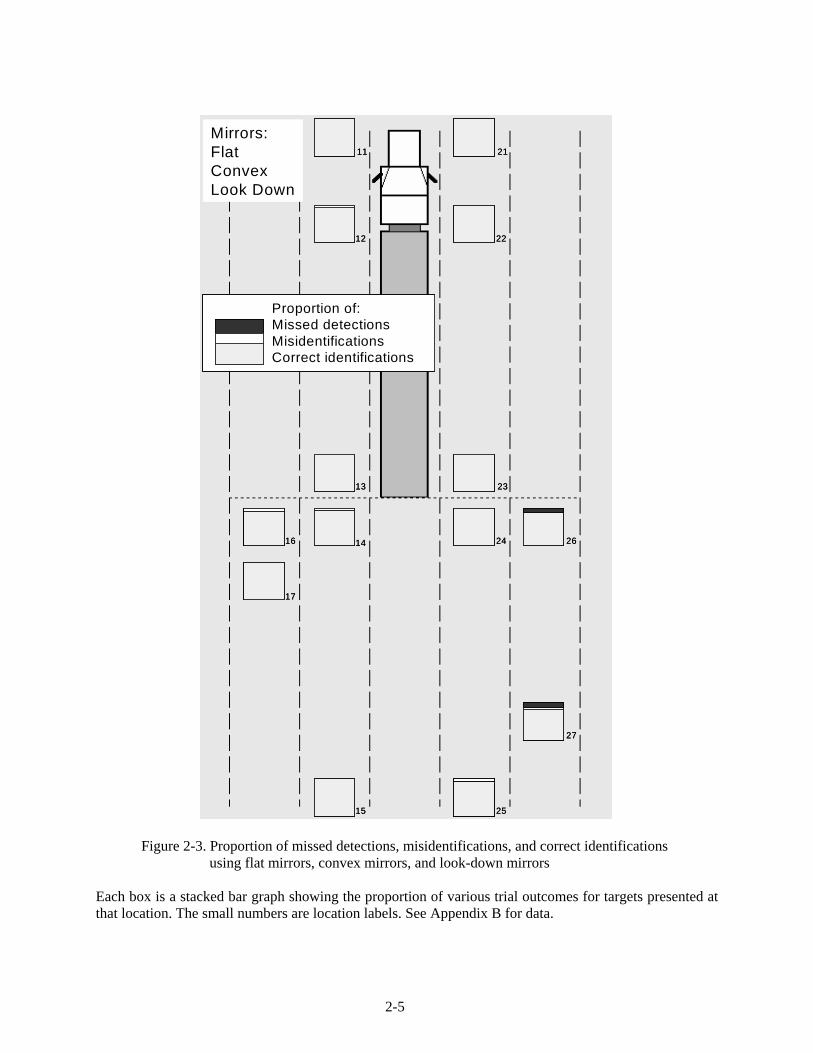
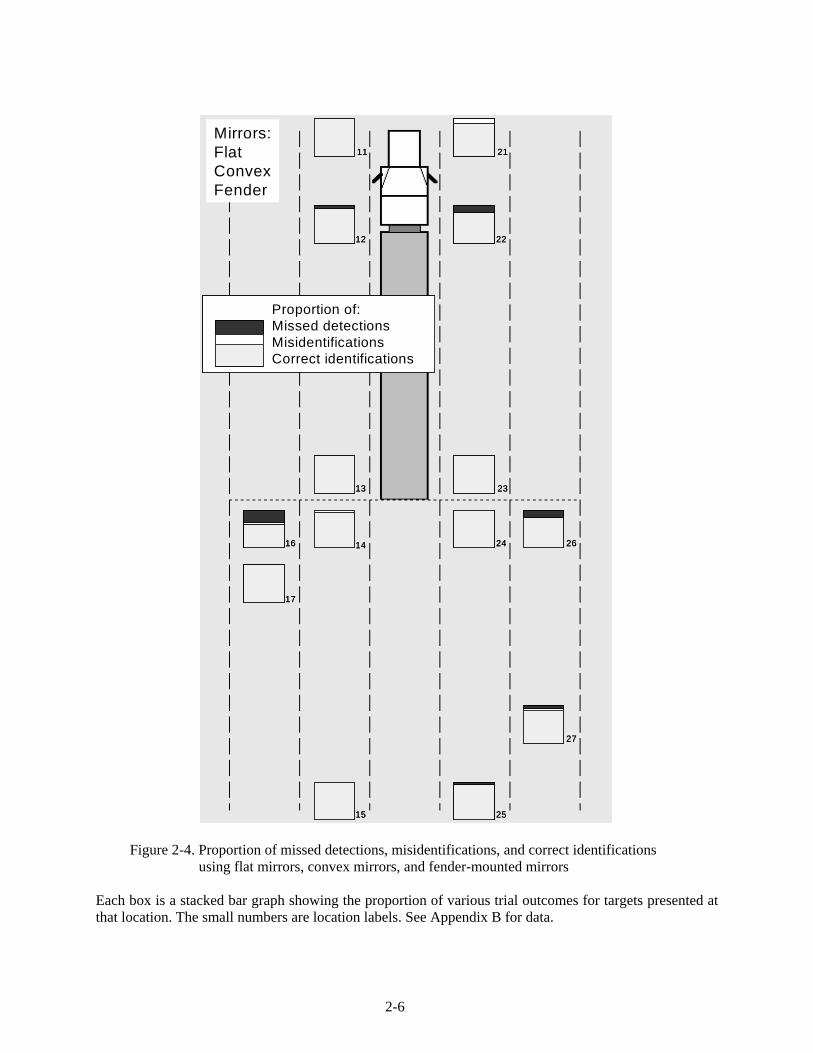
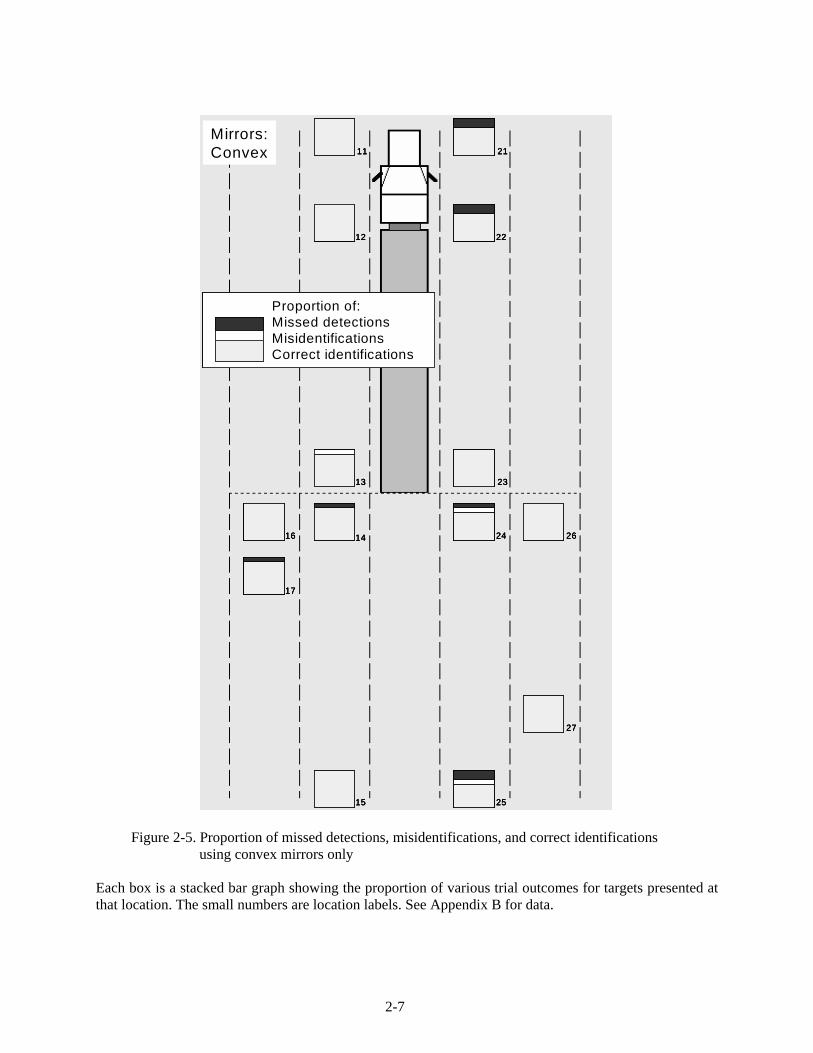
Figures 2-1 – 2-5 show a graphical representation of the proportions of missed detections,
misidentifications, and correct identifications at each target location for each mirror configuration tested. The frequencies for each of these outcomes are given in Appendix B. Using flat mirrors alone resulted in the greatest number of missed targets. This result was expected due to the narrow field of view available from the flat mirrors that may result in large functional blind spots. Although participants were free to make compensatory head movements to make best use of the available mirrors on each trial, the results show that targets in several locations often were not detected or were misidentified.
2-3
Mirrors:Flat 11
12
13
14
15
16
17
27
26
25
24
23
22
21
Proportion of:Missed detectionsMisidentificationsCorrect identifications
Mirrors:Flat 11
12
13
14
15
16
17
27
26
25
24
23
22
21
Mirrors:FlatMirrors:Flat 11
12
13
14
15
16
17
27
26
25
24
23
22
2111
12
13
14
15
16
17
27
26
25
24
23
22
2111
12
13
14
15
16
17
27
26
25
24
23
22
21
Proportion of:Missed detectionsMisidentificationsCorrect identifications
Proportion of:Missed detectionsMisidentificationsCorrect identifications
Figure 2-1. Proportion of missed detections, misidentifications, and correct identifications using flat mirrors only
Each box is a stacked bar graph showing the proportion of various trial outcomes for targets presented at that location. The small numbers are location labels. See Appendix B for data.
2-4
Mirrors:FlatConvex
11
12
13
14
15
16
17
27
26
25
24
23
22
21
Proportion of:Missed detectionsMisidentificationsCorrect identifications
Mirrors:FlatConvex
11
12
13
14
15
16
17
27
26
25
24
23
22
21Mirrors:FlatConvex
11
12
13
14
15
16
17
27
26
25
24
23
22
2111
12
13
14
15
16
17
27
26
25
24
23
22
21
Proportion of:Missed detectionsMisidentificationsCorrect identifications
Proportion of:Missed detectionsMisidentificationsCorrect identifications
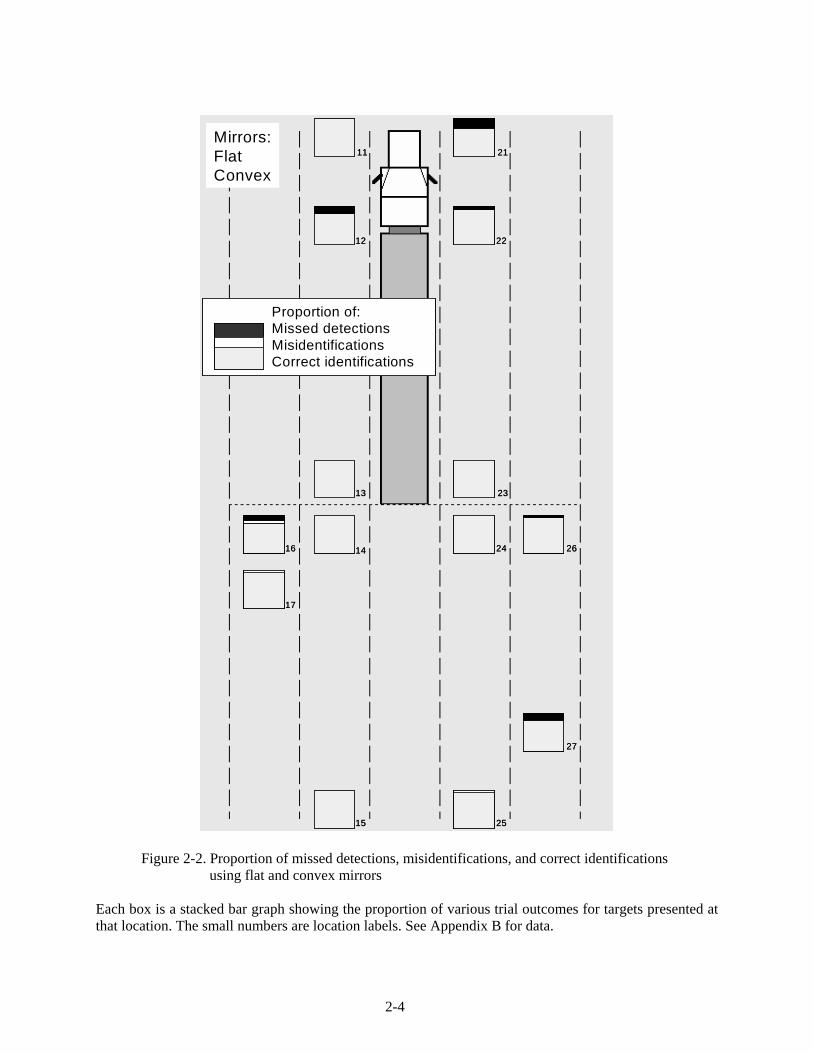
Figure 2-2. Proportion of missed detections, misidentifications, and correct identifications using flat and convex mirrors
Each box is a stacked bar graph showing the proportion of various trial outcomes for targets presented at that location. The small numbers are location labels. See Appendix B for data.
2-5
Mirrors:FlatConvexLook Down
11
12
13
14
15
16
17
27
26
25
24
23
22
21
Proportion of:Missed detectionsMisidentificationsCorrect identifications
Mirrors:FlatConvexLook Down
11
12
13
14
15
16
17
27
26
25
24
23
22
21
Mirrors:FlatConvexLook Down
11
12
13
14
15
16
17
27
26
25
24
23
22
2111
12
13
14
15
16
17
27
26
25
24
23
22
21
Proportion of:Missed detectionsMisidentificationsCorrect identifications
Proportion of:Missed detectionsMisidentificationsCorrect identifications
Figure 2-3. Proportion of missed detections, misidentifications, and correct identifications using flat mirrors, convex mirrors, and look-down mirrors
Each box is a stacked bar graph showing the proportion of various trial outcomes for targets presented at that location. The small numbers are location labels. See Appendix B for data.
2-6
Mirrors:Flat ConvexFender
11
12
13
14
15
16
17
27
26
25
24
23
22
21
Proportion of:Missed detectionsMisidentificationsCorrect identifications
Mirrors:Flat ConvexFender
11
12
13
14
15
16
17
27
26
25
24
23
22
21
Mirrors:Flat ConvexFender
11
12
13
14
15
16
17
27
26
25
24
23
22
2111
12
13
14
15
16
17
27
26
25
24
23
22
21
Proportion of:Missed detectionsMisidentificationsCorrect identifications
Proportion of:Missed detectionsMisidentificationsCorrect identifications
Figure 2-4. Proportion of missed detections, misidentifications, and correct identifications using flat mirrors, convex mirrors, and fender-mounted mirrors
Each box is a stacked bar graph showing the proportion of various trial outcomes for targets presented at that location. The small numbers are location labels. See Appendix B for data.
2-7
11
12
13
14
15
16
17
27
26
25
24
23
22
21
Mirrors:Convex
Proportion of:Missed detectionsMisidentificationsCorrect identifications
11
12
13
14
15
16
17
27
26
25
24
23
22
21
Mirrors:Convex 11
12
13
14
15
16
17
27
26
25
24
23
22
2111
12
13
14
15
16
17
27
26
25
24
23
22
2111
12
13
14
15
16
17
27
26
25
24
23
22
2111
12
13
14
15
16
17
27
26
25
24
23
22
21
Mirrors:Convex
Proportion of:Missed detectionsMisidentificationsCorrect identifications
Proportion of:Missed detectionsMisidentificationsCorrect identifications
Figure 2-5. Proportion of missed detections, misidentifications, and correct identifications using convex mirrors only
Each box is a stacked bar graph showing the proportion of various trial outcomes for targets presented at that location. The small numbers are location labels. See Appendix B for data.
2-8
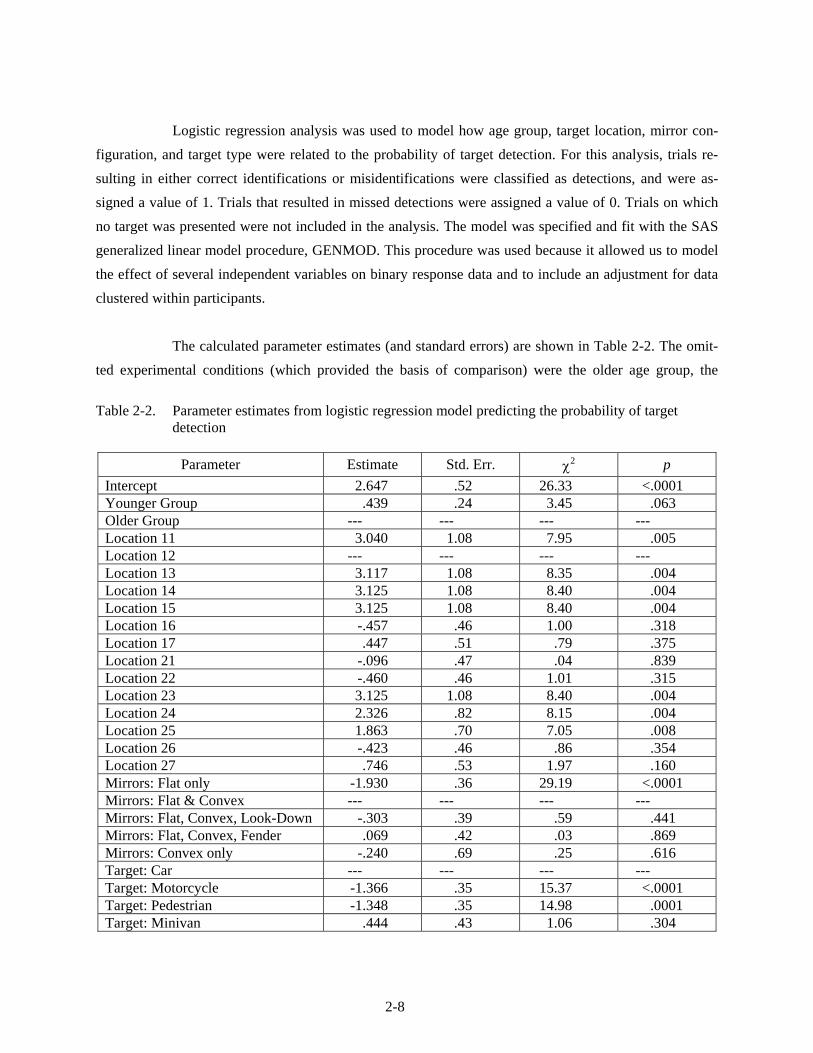
Logistic regression analysis was used to model how age group, target location, mirror con-figuration, and target type were related to the probability of target detection. For this analysis, trials re-sulting in either correct identifications or misidentifications were classified as detections, and were as-signed a value of 1. Trials that resulted in missed detections were assigned a value of 0. Trials on which no target was presented were not included in the analysis. The model was specified and fit with the SAS generalized linear model procedure, GENMOD. This procedure was used because it allowed us to model the effect of several independent variables on binary response data and to include an adjustment for data clustered within participants.
The calculated parameter estimates (and standard errors) are shown in Table 2-2. The omit-
ted experimental conditions (which provided the basis of comparison) were the older age group, the
Table 2-2. Parameter estimates from logistic regression model predicting the probability of target
detection
Parameter Estimate Std. Err. χ2 p Intercept 2.647 .52 26.33 <.0001Younger Group .439 .24 3.45 .063 Older Group --- --- --- --- Location 11 3.040 1.08 7.95 .005 Location 12 --- --- --- --- Location 13 3.117 1.08 8.35 .004 Location 14 3.125 1.08 8.40 .004 Location 15 3.125 1.08 8.40 .004 Location 16 -.457 .46 1.00 .318 Location 17 .447 .51 .79 .375 Location 21 -.096 .47 .04 .839 Location 22 -.460 .46 1.01 .315 Location 23 3.125 1.08 8.40 .004 Location 24 2.326 .82 8.15 .004 Location 25 1.863 .70 7.05 .008 Location 26 -.423 .46 .86 .354 Location 27 .746 .53 1.97 .160 Mirrors: Flat only -1.930 .36 29.19 <.0001 Mirrors: Flat & Convex --- --- --- --- Mirrors: Flat, Convex, Look-Down -.303 .39 .59 .441 Mirrors: Flat, Convex, Fender .069 .42 .03 .869 Mirrors: Convex only -.240 .69 .25 .616 Target: Car --- --- --- --- Target: Motorcycle -1.366 .35 15.37 <.0001 Target: Pedestrian -1.348 .35 14.98 .0001 Target: Minivan .444 .43 1.06 .304
2-9
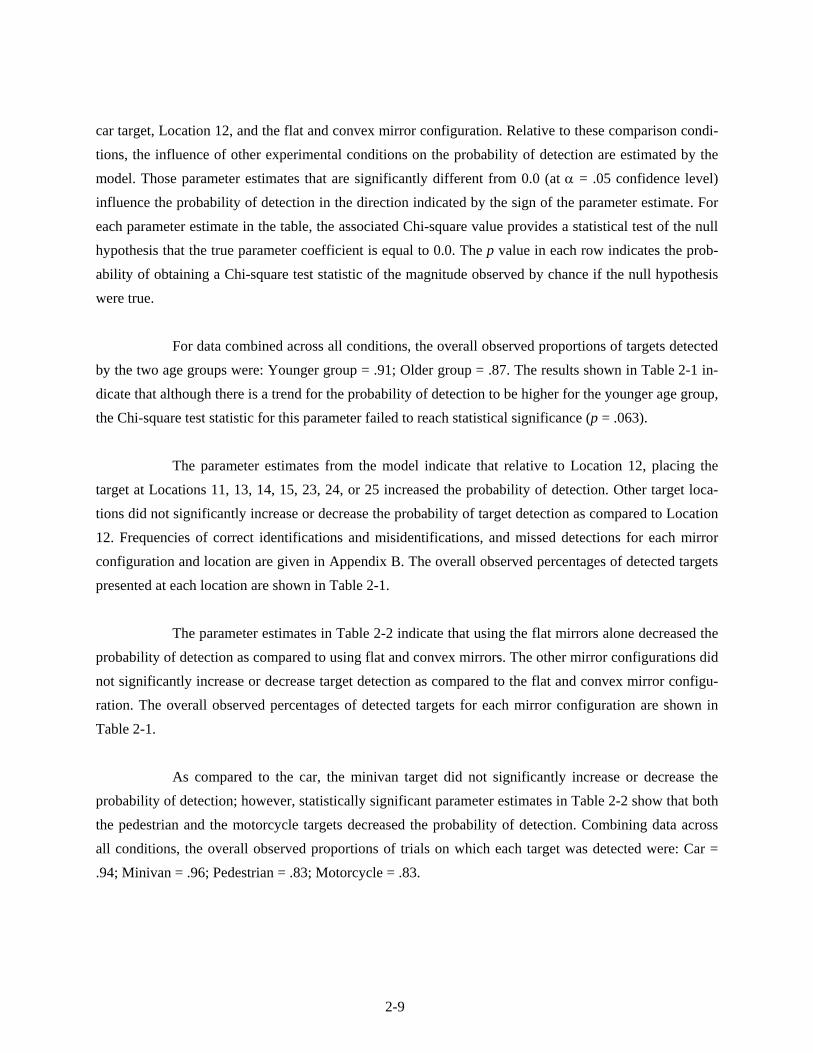
car target, Location 12, and the flat and convex mirror configuration. Relative to these comparison condi-tions, the influence of other experimental conditions on the probability of detection are estimated by the model. Those parameter estimates that are significantly different from 0.0 (at α = .05 confidence level) influence the probability of detection in the direction indicated by the sign of the parameter estimate. For each parameter estimate in the table, the associated Chi-square value provides a statistical test of the null hypothesis that the true parameter coefficient is equal to 0.0. The p value in each row indicates the prob-ability of obtaining a Chi-square test statistic of the magnitude observed by chance if the null hypothesis were true.
For data combined across all conditions, the overall observed proportions of targets detected
by the two age groups were: Younger group = .91; Older group = .87. The results shown in Table 2-1 in-dicate that although there is a trend for the probability of detection to be higher for the younger age group, the Chi-square test statistic for this parameter failed to reach statistical significance (p = .063).
The parameter estimates from the model indicate that relative to Location 12, placing the
target at Locations 11, 13, 14, 15, 23, 24, or 25 increased the probability of detection. Other target loca-tions did not significantly increase or decrease the probability of target detection as compared to Location 12. Frequencies of correct identifications and misidentifications, and missed detections for each mirror configuration and location are given in Appendix B. The overall observed percentages of detected targets presented at each location are shown in Table 2-1.
The parameter estimates in Table 2-2 indicate that using the flat mirrors alone decreased the
probability of detection as compared to using flat and convex mirrors. The other mirror configurations did not significantly increase or decrease target detection as compared to the flat and convex mirror configu-ration. The overall observed percentages of detected targets for each mirror configuration are shown in Table 2-1.
As compared to the car, the minivan target did not significantly increase or decrease the
probability of detection; however, statistically significant parameter estimates in Table 2-2 show that both the pedestrian and the motorcycle targets decreased the probability of detection. Combining data across all conditions, the overall observed proportions of trials on which each target was detected were: Car = .94; Minivan = .96; Pedestrian = .83; Motorcycle = .83.
2-10
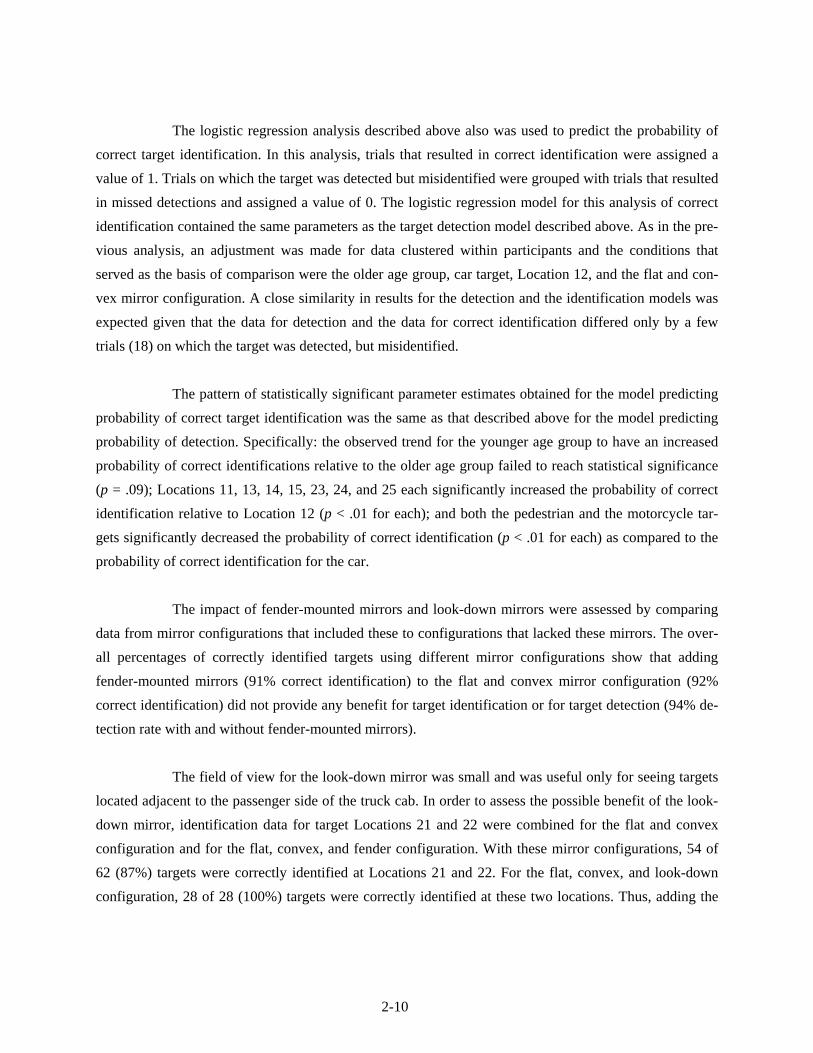
The logistic regression analysis described above also was used to predict the probability of correct target identification. In this analysis, trials that resulted in correct identification were assigned a value of 1. Trials on which the target was detected but misidentified were grouped with trials that resulted in missed detections and assigned a value of 0. The logistic regression model for this analysis of correct identification contained the same parameters as the target detection model described above. As in the pre-vious analysis, an adjustment was made for data clustered within participants and the conditions that served as the basis of comparison were the older age group, car target, Location 12, and the flat and con-vex mirror configuration. A close similarity in results for the detection and the identification models was expected given that the data for detection and the data for correct identification differed only by a few trials (18) on which the target was detected, but misidentified.
The pattern of statistically significant parameter estimates obtained for the model predicting
probability of correct target identification was the same as that described above for the model predicting probability of detection. Specifically: the observed trend for the younger age group to have an increased probability of correct identifications relative to the older age group failed to reach statistical significance (p = .09); Locations 11, 13, 14, 15, 23, 24, and 25 each significantly increased the probability of correct identification relative to Location 12 (p < .01 for each); and both the pedestrian and the motorcycle tar-gets significantly decreased the probability of correct identification (p < .01 for each) as compared to the probability of correct identification for the car.
The impact of fender-mounted mirrors and look-down mirrors were assessed by comparing
data from mirror configurations that included these to configurations that lacked these mirrors. The over-all percentages of correctly identified targets using different mirror configurations show that adding fender-mounted mirrors (91% correct identification) to the flat and convex mirror configuration (92% correct identification) did not provide any benefit for target identification or for target detection (94% de-tection rate with and without fender-mounted mirrors).
The field of view for the look-down mirror was small and was useful only for seeing targets
located adjacent to the passenger side of the truck cab. In order to assess the possible benefit of the look-down mirror, identification data for target Locations 21 and 22 were combined for the flat and convex configuration and for the flat, convex, and fender configuration. With these mirror configurations, 54 of 62 (87%) targets were correctly identified at Locations 21 and 22. For the flat, convex, and look-down configuration, 28 of 28 (100%) targets were correctly identified at these two locations. Thus, adding the
2-11
look-down mirror to the mirror configuration was associated with a greater proportion of correct target identifications on the right side of the truck cab at Locations 21 and 22 (z = 1.99, p < .05).
2.3 Confidence in Target Identification
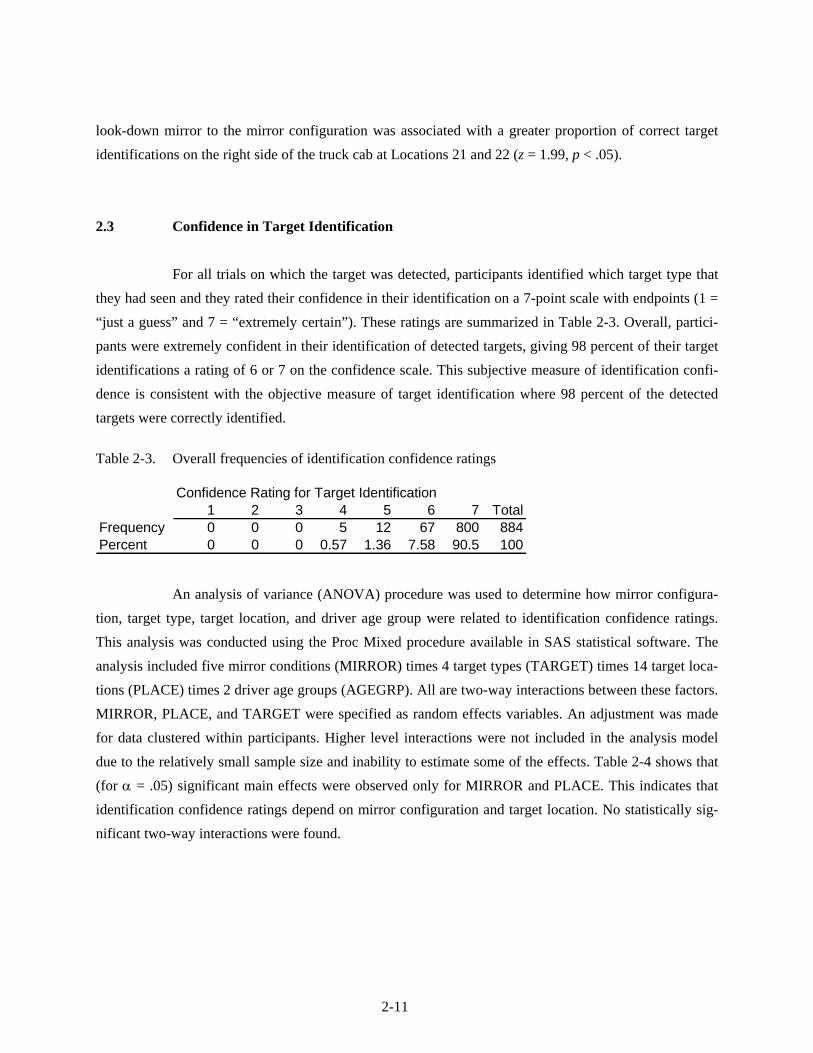
For all trials on which the target was detected, participants identified which target type that they had seen and they rated their confidence in their identification on a 7-point scale with endpoints (1 = “just a guess” and 7 = “extremely certain”). These ratings are summarized in Table 2-3. Overall, partici-pants were extremely confident in their identification of detected targets, giving 98 percent of their target identifications a rating of 6 or 7 on the confidence scale. This subjective measure of identification confi-dence is consistent with the objective measure of target identification where 98 percent of the detected targets were correctly identified.
Table 2-3. Overall frequencies of identification confidence ratings
Confidence Rating for Target Identification1 2 3 4 5 6 7 Total
Frequency 0 0 0 5 12 67 800 884Percent 0 0 0 0.57 1.36 7.58 90.5 100
An analysis of variance (ANOVA) procedure was used to determine how mirror configura-
tion, target type, target location, and driver age group were related to identification confidence ratings. This analysis was conducted using the Proc Mixed procedure available in SAS statistical software. The analysis included five mirror conditions (MIRROR) times 4 target types (TARGET) times 14 target loca-tions (PLACE) times 2 driver age groups (AGEGRP). All are two-way interactions between these factors. MIRROR, PLACE, and TARGET were specified as random effects variables. An adjustment was made for data clustered within participants. Higher level interactions were not included in the analysis model due to the relatively small sample size and inability to estimate some of the effects. Table 2-4 shows that (for α = .05) significant main effects were observed only for MIRROR and PLACE. This indicates that identification confidence ratings depend on mirror configuration and target location. No statistically sig-nificant two-way interactions were found.
2-12
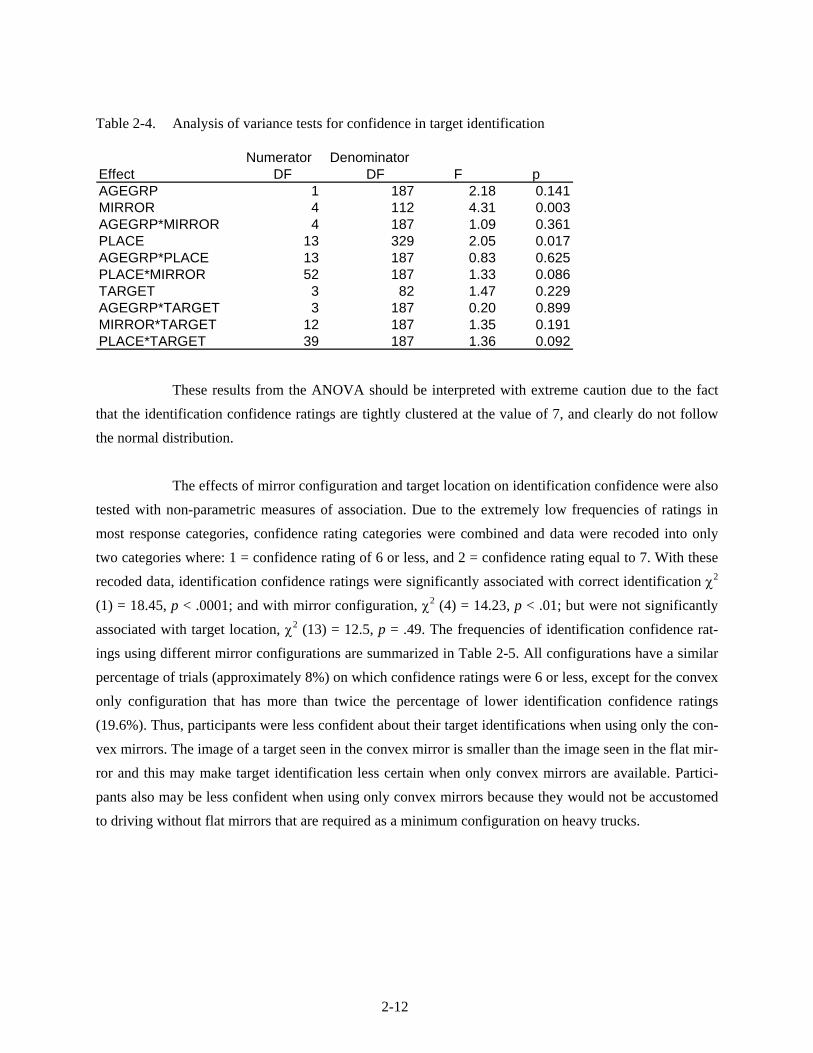
Table 2-4. Analysis of variance tests for confidence in target identification
Numerator DenominatorEffect DF DF F pAGEGRP 1 187 2.18 0.141MIRROR 4 112 4.31 0.003AGEGRP*MIRROR 4 187 1.09 0.361PLACE 13 329 2.05 0.017AGEGRP*PLACE 13 187 0.83 0.625PLACE*MIRROR 52 187 1.33 0.086TARGET 3 82 1.47 0.229AGEGRP*TARGET 3 187 0.20 0.899MIRROR*TARGET 12 187 1.35 0.191PLACE*TARGET 39 187 1.36 0.092
These results from the ANOVA should be interpreted with extreme caution due to the fact
that the identification confidence ratings are tightly clustered at the value of 7, and clearly do not follow the normal distribution.
The effects of mirror configuration and target location on identification confidence were also
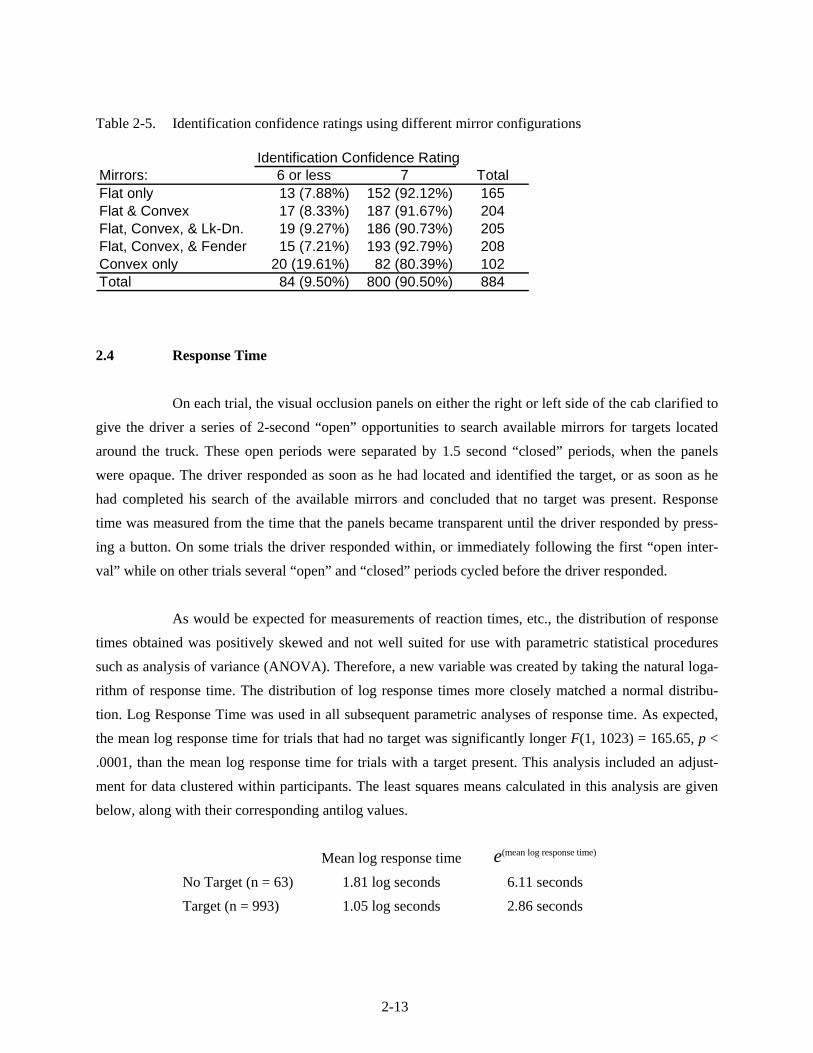
tested with non-parametric measures of association. Due to the extremely low frequencies of ratings in most response categories, confidence rating categories were combined and data were recoded into only two categories where: 1 = confidence rating of 6 or less, and 2 = confidence rating equal to 7. With these recoded data, identification confidence ratings were significantly associated with correct identification χ2 (1) = 18.45, p < .0001; and with mirror configuration, χ2 (4) = 14.23, p < .01; but were not significantly associated with target location, χ2 (13) = 12.5, p = .49. The frequencies of identification confidence rat-ings using different mirror configurations are summarized in Table 2-5. All configurations have a similar percentage of trials (approximately 8%) on which confidence ratings were 6 or less, except for the convex only configuration that has more than twice the percentage of lower identification confidence ratings (19.6%). Thus, participants were less confident about their target identifications when using only the con-vex mirrors. The image of a target seen in the convex mirror is smaller than the image seen in the flat mir-ror and this may make target identification less certain when only convex mirrors are available. Partici-pants also may be less confident when using only convex mirrors because they would not be accustomed to driving without flat mirrors that are required as a minimum configuration on heavy trucks.
2-13
Table 2-5. Identification confidence ratings using different mirror configurations
Identification Confidence RatingMirrors: 6 or less 7 TotalFlat only 13 (7.88%) 152 (92.12%) 165Flat & Convex 17 (8.33%) 187 (91.67%) 204Flat, Convex, & Lk-Dn. 19 (9.27%) 186 (90.73%) 205Flat, Convex, & Fender 15 (7.21%) 193 (92.79%) 208Convex only 20 (19.61%) 82 (80.39%) 102Total 84 (9.50%) 800 (90.50%) 884
2.4 Response Time
On each trial, the visual occlusion panels on either the right or left side of the cab clarified to give the driver a series of 2-second “open” opportunities to search available mirrors for targets located around the truck. These open periods were separated by 1.5 second “closed” periods, when the panels were opaque. The driver responded as soon as he had located and identified the target, or as soon as he had completed his search of the available mirrors and concluded that no target was present. Response time was measured from the time that the panels became transparent until the driver responded by press-ing a button. On some trials the driver responded within, or immediately following the first “open inter-val” while on other trials several “open” and “closed” periods cycled before the driver responded.
As would be expected for measurements of reaction times, etc., the distribution of response
times obtained was positively skewed and not well suited for use with parametric statistical procedures such as analysis of variance (ANOVA). Therefore, a new variable was created by taking the natural loga-rithm of response time. The distribution of log response times more closely matched a normal distribu-tion. Log Response Time was used in all subsequent parametric analyses of response time. As expected, the mean log response time for trials that had no target was significantly longer F(1, 1023) = 165.65, p < .0001, than the mean log response time for trials with a target present. This analysis included an adjust-ment for data clustered within participants. The least squares means calculated in this analysis are given below, along with their corresponding antilog values.
Mean log response time e(mean log response time)
No Target (n = 63) 1.81 log seconds 6.11 seconds Target (n = 993) 1.05 log seconds 2.86 seconds
2-14
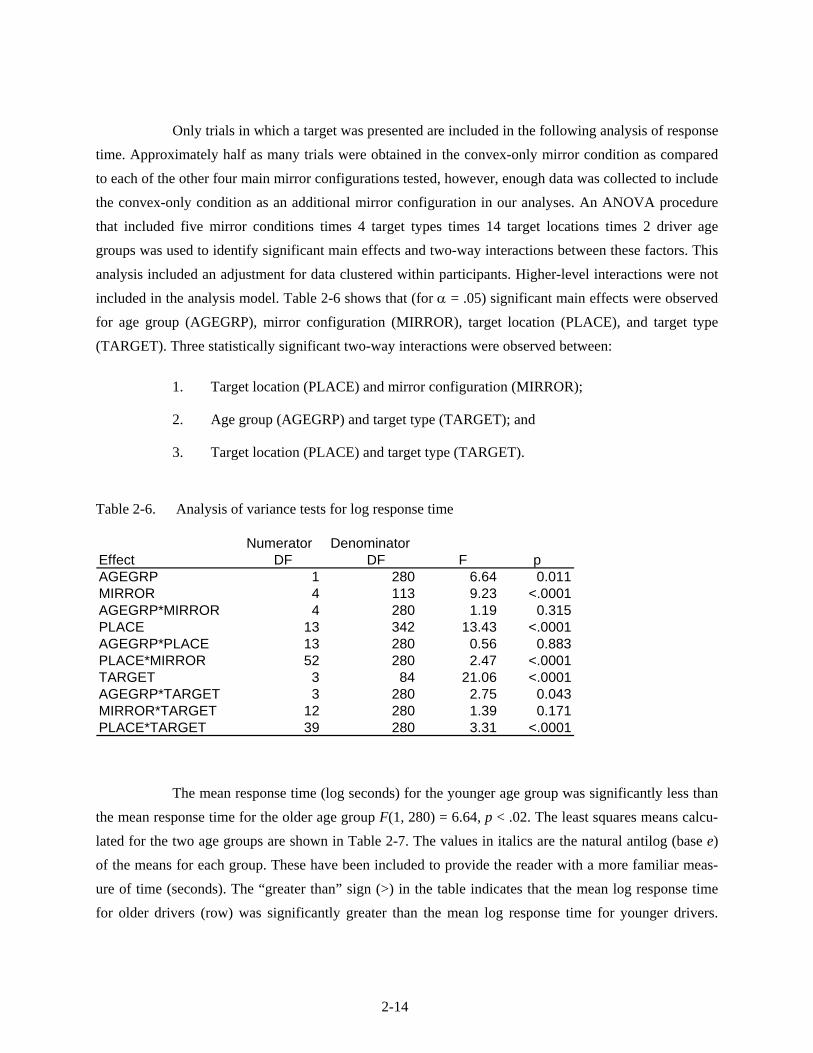
Only trials in which a target was presented are included in the following analysis of response time. Approximately half as many trials were obtained in the convex-only mirror condition as compared to each of the other four main mirror configurations tested, however, enough data was collected to include the convex-only condition as an additional mirror configuration in our analyses. An ANOVA procedure that included five mirror conditions times 4 target types times 14 target locations times 2 driver age groups was used to identify significant main effects and two-way interactions between these factors. This analysis included an adjustment for data clustered within participants. Higher-level interactions were not included in the analysis model. Table 2-6 shows that (for α = .05) significant main effects were observed for age group (AGEGRP), mirror configuration (MIRROR), target location (PLACE), and target type (TARGET). Three statistically significant two-way interactions were observed between:
1. Target location (PLACE) and mirror configuration (MIRROR);
2. Age group (AGEGRP) and target type (TARGET); and
3. Target location (PLACE) and target type (TARGET).
Table 2-6. Analysis of variance tests for log response time
Numerator DenominatorEffect DF DF F pAGEGRP 1 280 6.64 0.011MIRROR 4 113 9.23 <.0001AGEGRP*MIRROR 4 280 1.19 0.315PLACE 13 342 13.43 <.0001AGEGRP*PLACE 13 280 0.56 0.883PLACE*MIRROR 52 280 2.47 <.0001TARGET 3 84 21.06 <.0001AGEGRP*TARGET 3 280 2.75 0.043MIRROR*TARGET 12 280 1.39 0.171PLACE*TARGET 39 280 3.31 <.0001
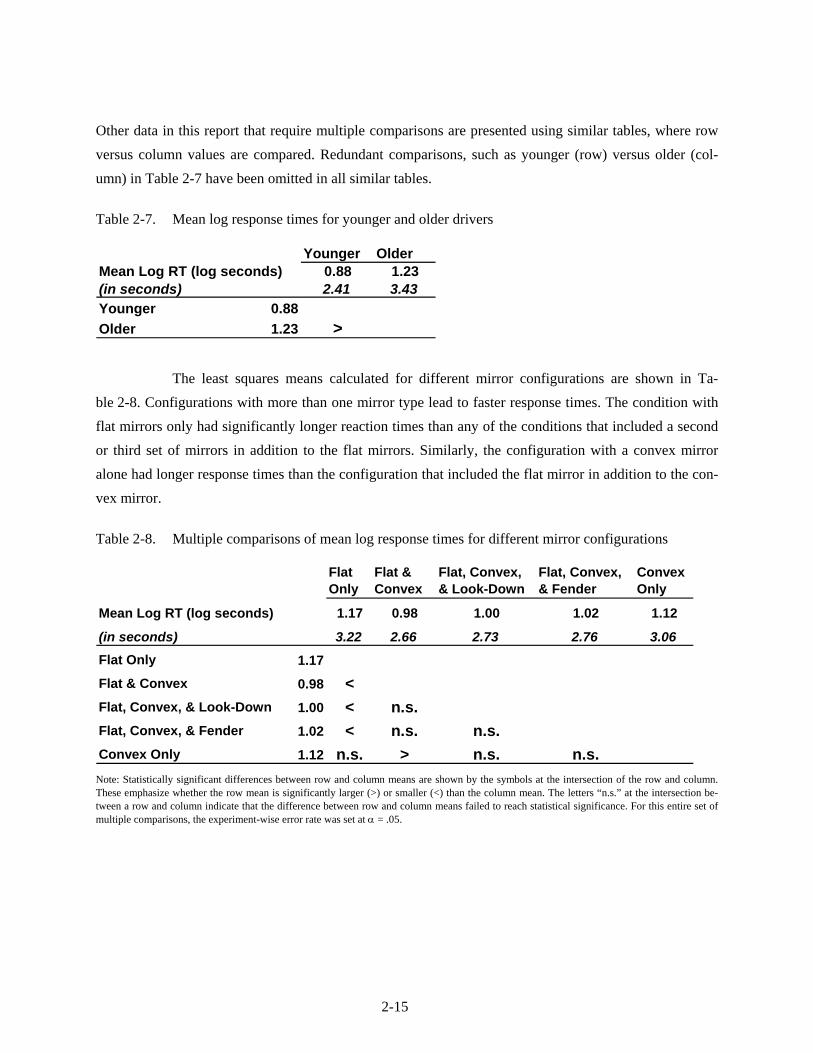
The mean response time (log seconds) for the younger age group was significantly less than
the mean response time for the older age group F(1, 280) = 6.64, p < .02. The least squares means calcu-lated for the two age groups are shown in Table 2-7. The values in italics are the natural antilog (base e) of the means for each group. These have been included to provide the reader with a more familiar meas-ure of time (seconds). The “greater than” sign (>) in the table indicates that the mean log response time for older drivers (row) was significantly greater than the mean log response time for younger drivers.
2-15
Other data in this report that require multiple comparisons are presented using similar tables, where row versus column values are compared. Redundant comparisons, such as younger (row) versus older (col-umn) in Table 2-7 have been omitted in all similar tables.
Table 2-7. Mean log response times for younger and older drivers
Younger OlderMean Log RT (log seconds) 0.88 1.23(in seconds) 2.41 3.43Younger 0.88Older 1.23 >
The least squares means calculated for different mirror configurations are shown in Ta-
ble 2-8. Configurations with more than one mirror type lead to faster response times. The condition with flat mirrors only had significantly longer reaction times than any of the conditions that included a second or third set of mirrors in addition to the flat mirrors. Similarly, the configuration with a convex mirror alone had longer response times than the configuration that included the flat mirror in addition to the con-vex mirror.
Table 2-8. Multiple comparisons of mean log response times for different mirror configurations
Flat Only
Flat & Convex
Flat, Convex, & Look-Down
Flat, Convex, & Fender
Convex Only
Mean Log RT (log seconds) 1.17 0.98 1.00 1.02 1.12
(in seconds) 3.22 2.66 2.73 2.76 3.06Flat Only 1.17Flat & Convex 0.98 <Flat, Convex, & Look-Down 1.00 < n.s.Flat, Convex, & Fender 1.02 < n.s. n.s.Convex Only 1.12 n.s. > n.s. n.s.
Note: Statistically significant differences between row and column means are shown by the symbols at the intersection of the row and column. These emphasize whether the row mean is significantly larger (>) or smaller (<) than the column mean. The letters “n.s.” at the intersection be-tween a row and column indicate that the difference between row and column means failed to reach statistical significance. For this entire set of multiple comparisons, the experiment-wise error rate was set at α = .05.
2-16
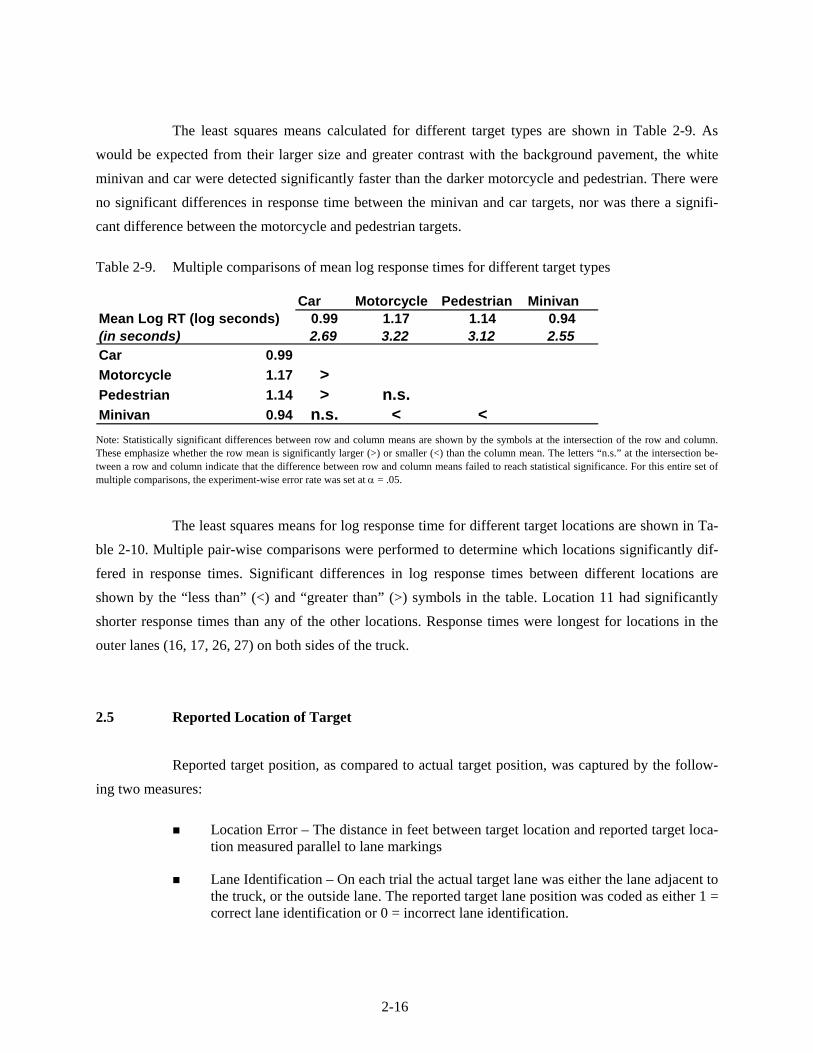
The least squares means calculated for different target types are shown in Table 2-9. As would be expected from their larger size and greater contrast with the background pavement, the white minivan and car were detected significantly faster than the darker motorcycle and pedestrian. There were no significant differences in response time between the minivan and car targets, nor was there a signifi-cant difference between the motorcycle and pedestrian targets.
Table 2-9. Multiple comparisons of mean log response times for different target types
Car Motorcycle Pedestrian MinivanMean Log RT (log seconds) 0.99 1.17 1.14 0.94(in seconds) 2.69 3.22 3.12 2.55Car 0.99Motorcycle 1.17 >Pedestrian 1.14 > n.s.Minivan 0.94 n.s. < <
Note: Statistically significant differences between row and column means are shown by the symbols at the intersection of the row and column. These emphasize whether the row mean is significantly larger (>) or smaller (<) than the column mean. The letters “n.s.” at the intersection be-tween a row and column indicate that the difference between row and column means failed to reach statistical significance. For this entire set of multiple comparisons, the experiment-wise error rate was set at α = .05.
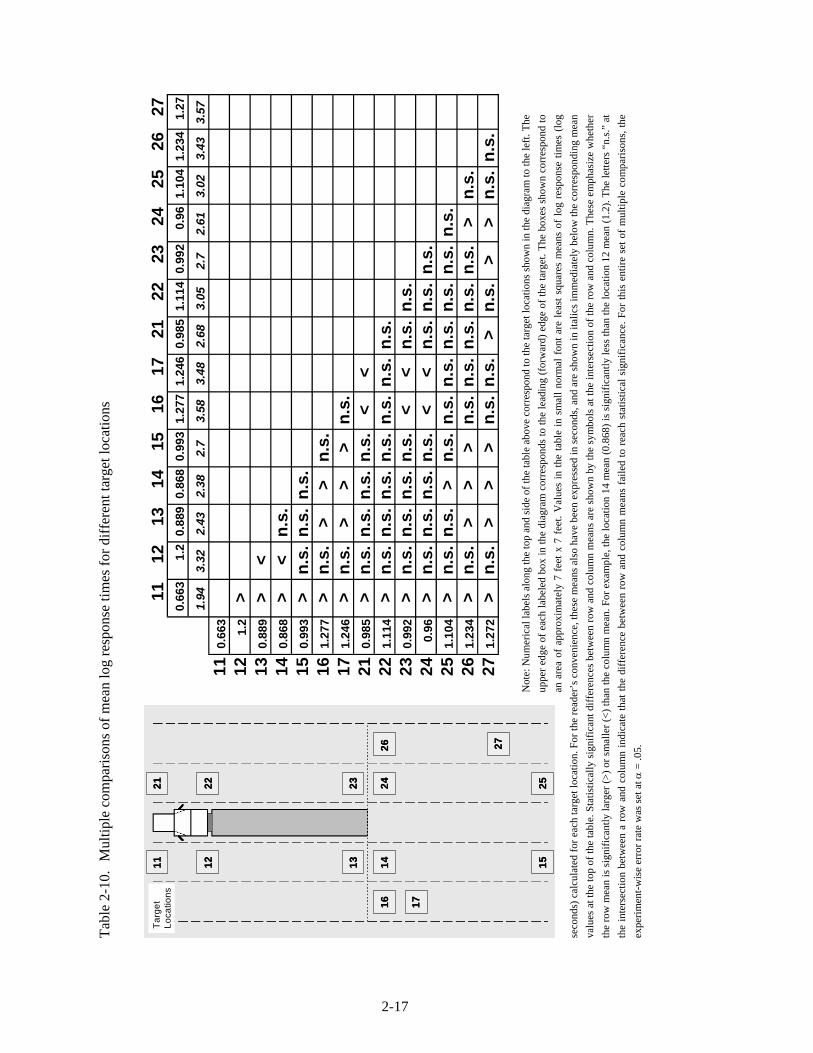
The least squares means for log response time for different target locations are shown in Ta-
ble 2-10. Multiple pair-wise comparisons were performed to determine which locations significantly dif-fered in response times. Significant differences in log response times between different locations are shown by the “less than” (<) and “greater than” (>) symbols in the table. Location 11 had significantly shorter response times than any of the other locations. Response times were longest for locations in the outer lanes (16, 17, 26, 27) on both sides of the truck.
2.5 Reported Location of Target
Reported target position, as compared to actual target position, was captured by the follow-ing two measures:
Location Error – The distance in feet between target location and reported target loca-tion measured parallel to lane markings
Lane Identification – On each trial the actual target lane was either the lane adjacent to the truck, or the outside lane. The reported target lane position was coded as either 1 = correct lane identification or 0 = incorrect lane identification.
Tabl
e 2-
10.
Mul
tiple
com
paris
ons o
f mea
n lo
g re
spon
se ti
mes
for d
iffer
ent t
arge
t loc
atio
ns
1112
1314
1516
1721
2223
2425
2627
0.66
31.
20.
889
0.86
80.
993
1.27
71.
246
0.98
51.
114
0.99
20.
961.
104
1.23
41.
27
1.94
3.32
2.43
2.38
2.7
3.58
3.48
2.68
3.05
2.7
2.61
3.02
3.43
3.57
110.
663
121.
2>
130.
889
><
140.
868
><
n.s.
150.
993
>n.
s.n.
s.n.
s.16
1.27
7>
n.s.
>>
n.s.
171.
246
>n.
s.>
>>
n.s.
210.
985
>n.
s.n.
s.n.
s.n.
s.<
<22
1.11
4>
n.s.
n.s.
n.s.
n.s.
n.s.
n.s.
n.s.
230.
992
>n.
s.n.
s.n.
s.n.
s.<
<n.
s.n.
s.24
0.96
>n.
s.n.
s.n.
s.n.
s.<
<n.
s.n.
s.n.
s.25
1.10
4>
n.s.
n.s.
>n.
s.n.
s.n.
s.n.
s.n.
s.n.
s.n.
s.26
1.23
4>
n.s.
>>
>n.
s.n.
s.n.
s.n.
s.n.
s.>
n.s.
271.
272
>n.
s.>
>>
n.s.
n.s.
>n.
s.>
>n.
s.n.
s.
Not
e: N
umer
ical
labe
ls a
long
the
top
and
side
of t
he ta
ble
abov
e co
rres
pond
to th
e ta
rget
loca
tions
show
n in
the
diag
ram
to th
e le
ft. T
he
uppe
r edg
e of
eac
h la
bele
d bo
x in
the
diag
ram
cor
resp
onds
to th
e le
adin
g (f
orw
ard)
edg
e of
the
targ
et. T
he b
oxes
sho
wn
corr
espo
nd to
an
are
a of
app
roxi
mat
ely
7 fe
et x
7 f
eet.
Val
ues
in th
e ta
ble
in s
mal
l nor
mal
fon
t are
leas
t squ
ares
mea
ns o
f lo
g re
spon
se ti
mes
(lo
g se
cond
s) c
alcu
late
d fo
r eac
h ta
rget
loca
tion.
For
the
read
er’s
con
veni
ence
, the
se m
eans
als
o ha
ve b
een
expr
esse
d in
seco
nds,
and
are
show
n in
ital
ics i
mm
edia
tely
bel
ow th
e co
rres
pond
ing
mea
n va
lues
at t
he to
p of
the
tabl
e. S
tatis
tical
ly si
gnifi
cant
diff
eren
ces b
etw
een
row
and
col
umn
mea
ns a
re sh
own
by th
e sy
mbo
ls a
t the
inte
rsec
tion
of th
e ro
w a
nd c
olum
n. T
hese
em
phas
ize
whe
ther
th
e ro
w m
ean
is si
gnifi
cant
ly la
rger
(>) o
r sm
alle
r (<)
than
the
colu
mn
mea
n. F
or e
xam
ple,
the
loca
tion
14 m
ean
(0.8
68) i
s sig
nific
antly
less
than
the
loca
tion
12 m
ean
(1.2
). Th
e le
tters
“n.
s.” a
t th
e in
ters
ectio
n be
twee
n a
row
and
col
umn
indi
cate
that
the
diff
eren
ce b
etw
een
row
and
col
umn
mea
ns f
aile
d to
rea
ch s
tatis
tical
sig
nific
ance
. For
this
ent
ire s
et o
f m
ultip
le c
ompa
rison
s, th
e ex
perim
ent-w
ise
erro
r rat
e w
as se
t at α
= .0
5.
Targ
et
Loca
tions
11
23
1424
26
152521
12 13
22
16 17
27
Targ
et
Loca
tions
Targ
et
Loca
tions
11
23
1424
26
152521
12 13
22
16 17
27
11
23
1424
26
152521
12 13
22
16 17
27
2-17
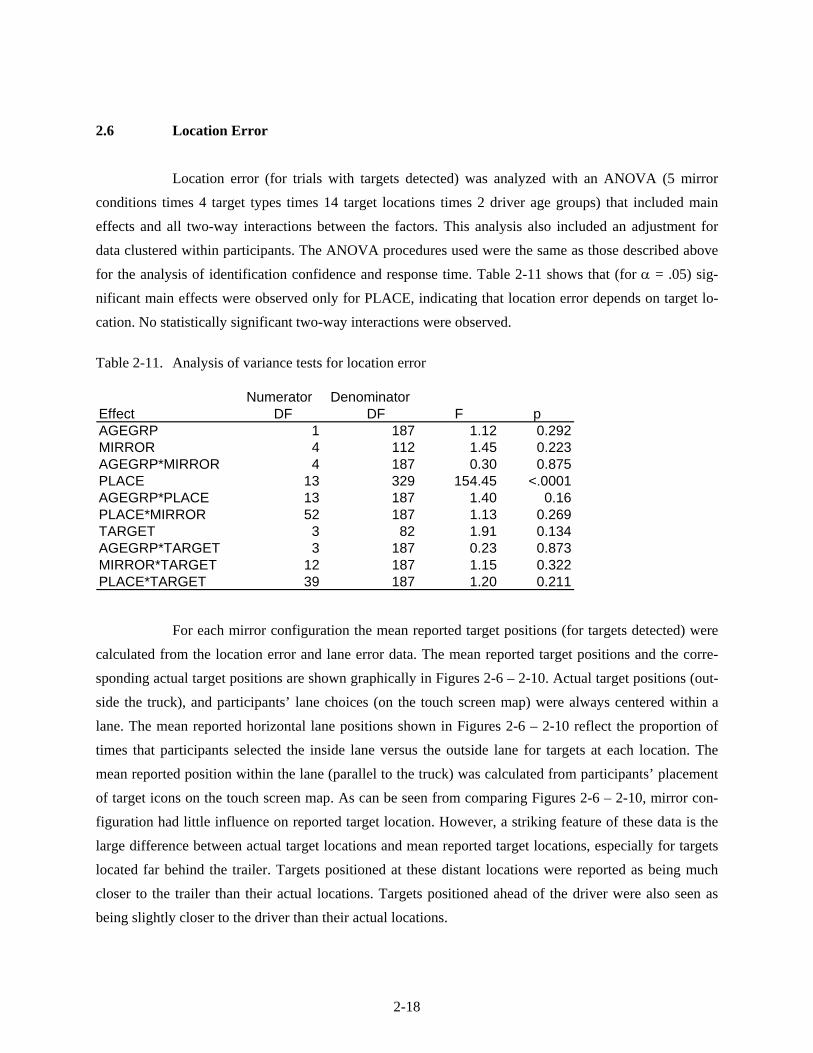
2-18
2.6 Location Error
Location error (for trials with targets detected) was analyzed with an ANOVA (5 mirror conditions times 4 target types times 14 target locations times 2 driver age groups) that included main effects and all two-way interactions between the factors. This analysis also included an adjustment for data clustered within participants. The ANOVA procedures used were the same as those described above for the analysis of identification confidence and response time. Table 2-11 shows that (for α = .05) sig-nificant main effects were observed only for PLACE, indicating that location error depends on target lo-cation. No statistically significant two-way interactions were observed.
Table 2-11. Analysis of variance tests for location error
Numerator DenominatorEffect DF DF F pAGEGRP 1 187 1.12 0.292MIRROR 4 112 1.45 0.223AGEGRP*MIRROR 4 187 0.30 0.875PLACE 13 329 154.45 <.0001AGEGRP*PLACE 13 187 1.40 0.16PLACE*MIRROR 52 187 1.13 0.269TARGET 3 82 1.91 0.134AGEGRP*TARGET 3 187 0.23 0.873MIRROR*TARGET 12 187 1.15 0.322PLACE*TARGET 39 187 1.20 0.211
For each mirror configuration the mean reported target positions (for targets detected) were
calculated from the location error and lane error data. The mean reported target positions and the corre-sponding actual target positions are shown graphically in Figures 2-6 – 2-10. Actual target positions (out-side the truck), and participants’ lane choices (on the touch screen map) were always centered within a lane. The mean reported horizontal lane positions shown in Figures 2-6 – 2-10 reflect the proportion of times that participants selected the inside lane versus the outside lane for targets at each location. The mean reported position within the lane (parallel to the truck) was calculated from participants’ placement of target icons on the touch screen map. As can be seen from comparing Figures 2-6 – 2-10, mirror con-figuration had little influence on reported target location. However, a striking feature of these data is the large difference between actual target locations and mean reported target locations, especially for targets located far behind the trailer. Targets positioned at these distant locations were reported as being much closer to the trailer than their actual locations. Targets positioned ahead of the driver were also seen as being slightly closer to the driver than their actual locations.
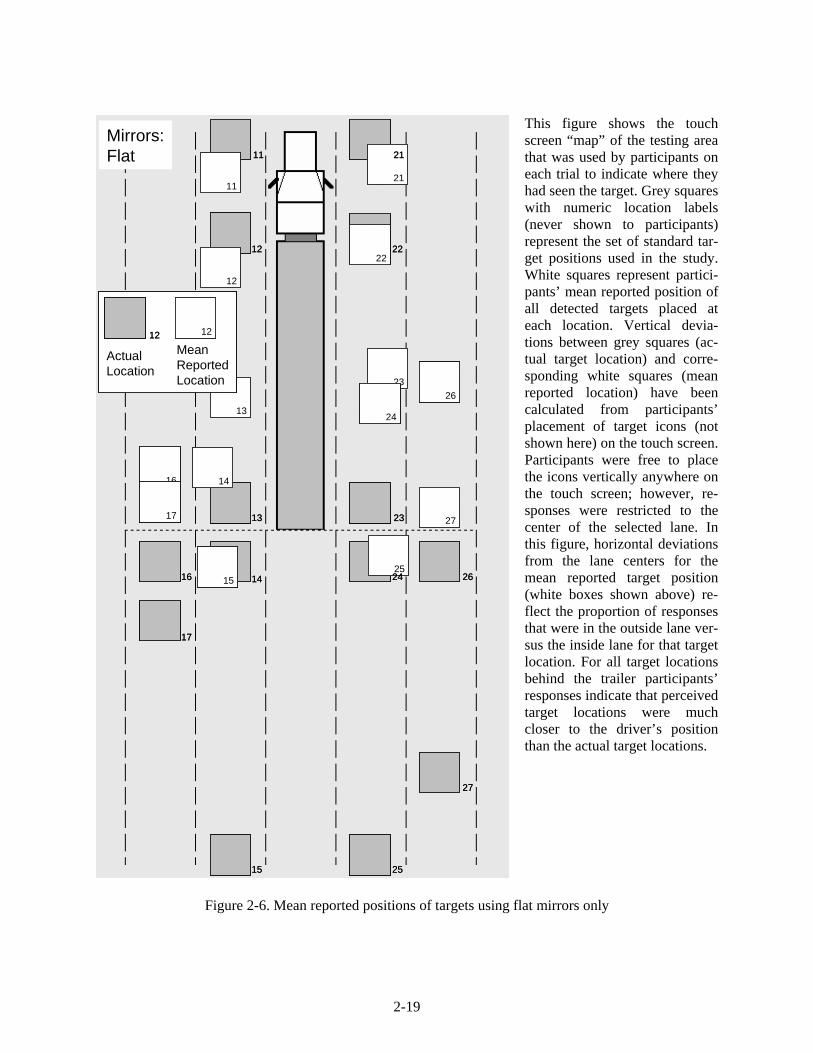
2-19
Mirrors:Flat
11
12
13
14
15
16
17
21
22
23
24
25
26
27
11
12
13
14
15
16
17
27
26
25
24
23
22
21
Mean Reported Location
1212
ActualLocation
Mirrors:Flat
11
12
13
14
15
16
17
21
22
23
24
25
26
27
11
12
13
14
15
16
17
27
26
25
24
23
22
21
Mirrors:Flat
11
12
13
14
15
16
17
21
22
23
24
25
26
27
Mirrors:FlatMirrors:Flat
11
12
13
14
15
16
17
21
22
23
24
25
26
27
1111
1212
1313
1414
1515
1616
1717
2121
2222
2323
2424
2525
2626
2727
11
12
13
14
15
16
17
27
26
25
24
23
22
2111
12
13
14
15
16
17
27
26
25
24
23
22
21
Mean Reported Location
1212
ActualLocation
Mean Reported Location
12121212
ActualLocation
This figure shows the touch screen “map” of the testing area that was used by participants on each trial to indicate where they had seen the target. Grey squares with numeric location labels (never shown to participants) represent the set of standard tar-get positions used in the study. White squares represent partici-pants’ mean reported position of all detected targets placed at each location. Vertical devia-tions between grey squares (ac-tual target location) and corre-sponding white squares (mean reported location) have been calculated from participants’ placement of target icons (not shown here) on the touch screen. Participants were free to place the icons vertically anywhere on the touch screen; however, re-sponses were restricted to the center of the selected lane. In this figure, horizontal deviations from the lane centers for the mean reported target position (white boxes shown above) re-flect the proportion of responses that were in the outside lane ver-sus the inside lane for that target location. For all target locations behind the trailer participants’ responses indicate that perceived target locations were much closer to the driver’s position than the actual target locations.
Figure 2-6. Mean reported positions of targets using flat mirrors only
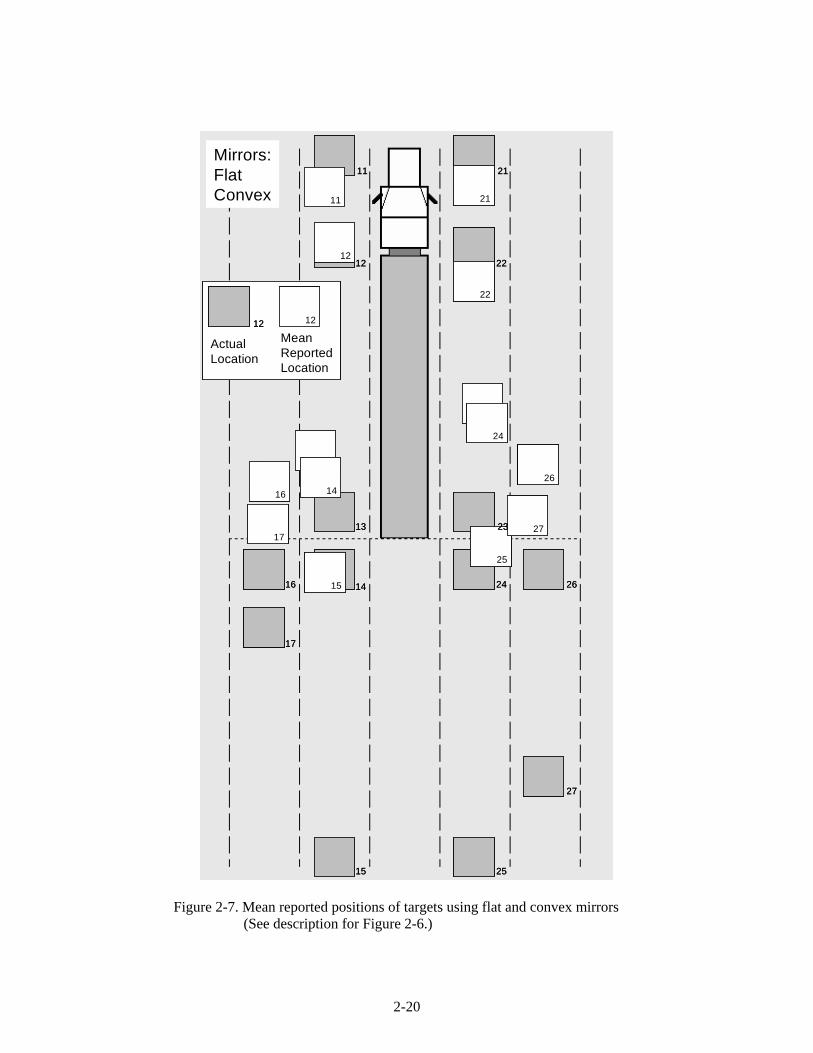
2-20
Mirrors:FlatConvex 11
12
13
14
15
16
17
21
22
23
24
25
26
27
11
12
13
14
15
16
17
27
26
25
24
23
22
21
Mean Reported Location
1212
ActualLocation
Mirrors:FlatConvex 11
12
13
14
15
16
17
21
22
23
24
25
26
27
11
12
13
14
15
16
17
27
26
25
24
23
22
21Mirrors:FlatConvex 11
12
13
14
15
16
17
21
22
23
24
25
26
27
Mirrors:FlatConvex 11
12
13
14
15
16
17
21
22
23
24
25
26
27
1111
1212
1313
1414
1515
1616
1717
2121
2222
2323
2424
2525
2626
2727
11
12
13
14
15
16
17
27
26
25
24
23
22
2111
12
13
14
15
16
17
27
26
25
24
23
22
21
Mean Reported Location
1212
ActualLocation
Mean Reported Location
12121212
ActualLocation
Figure 2-7. Mean reported positions of targets using flat and convex mirrors (See description for Figure 2-6.)
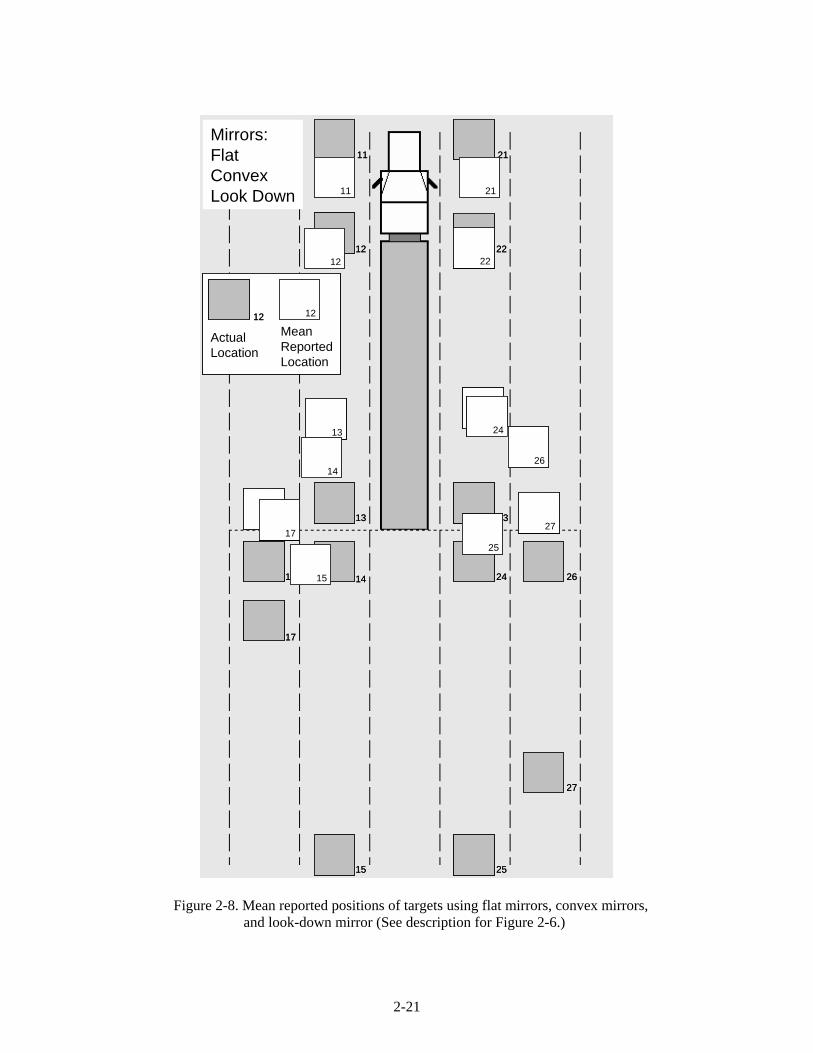
2-21
Mirrors:FlatConvexLook Down
11
12
13
14
15
16
17
27
26
25
24
23
22
21
11
12
13
14
15
1617
21
22
2324
25
26
27
Mean Reported Location
1212
ActualLocation
Mirrors:FlatConvexLook Down
11
12
13
14
15
16
17
27
26
25
24
23
22
21
11
12
13
14
15
1617
21
22
2324
25
26
27
Mirrors:FlatConvexLook Down
11
12
13
14
15
16
17
27
26
25
24
23
22
2111
12
13
14
15
16
17
27
26
25
24
23
22
21
11
12
13
14
15
1617
21
22
2324
25
26
27
1111
1212
1313
1414
1515
16161717
2121
2222
23232424
2525
2626
2727
Mean Reported Location
1212
ActualLocation
Mean Reported Location
12121212
ActualLocation
Figure 2-8. Mean reported positions of targets using flat mirrors, convex mirrors, and look-down mirror (See description for Figure 2-6.)
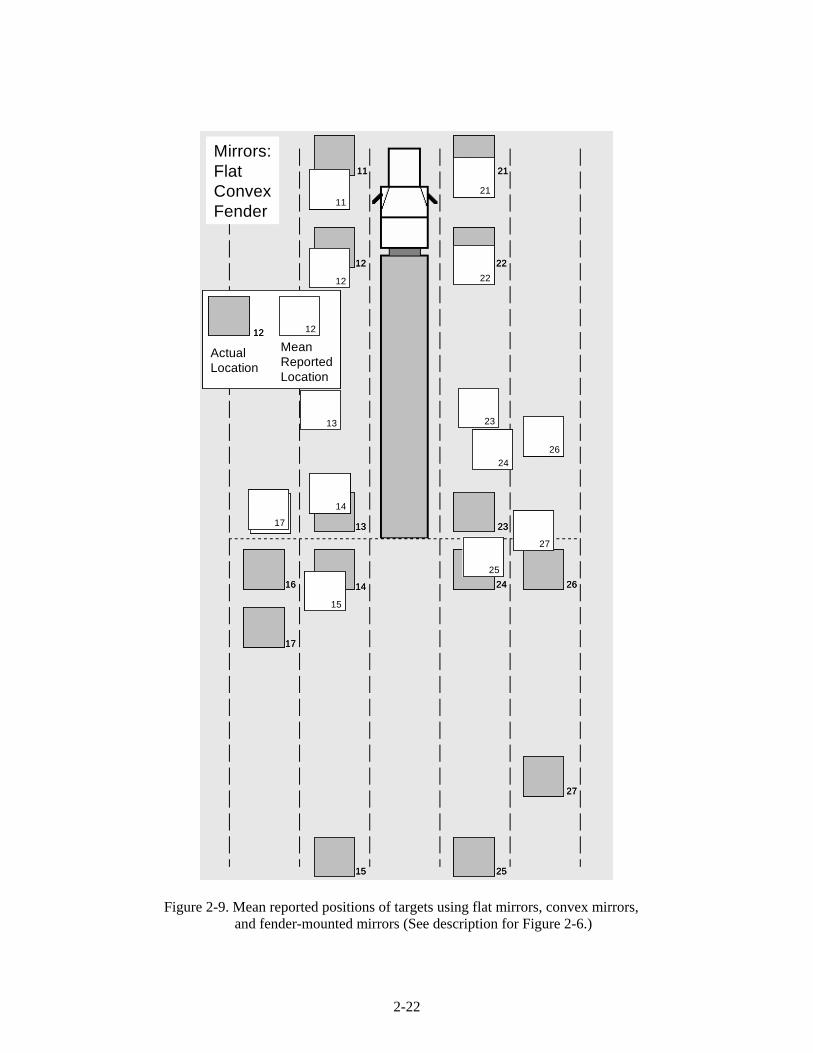
2-22
Mirrors:Flat ConvexFender
11
12
13
14
15
16
17
27
26
25
24
23
22
21
11
12
13
14
15
1617
21
22
23
24
25
26
27
Mean Reported Location
1212
ActualLocation
Mirrors:Flat ConvexFender
11
12
13
14
15
16
17
27
26
25
24
23
22
21
11
12
13
14
15
1617
21
22
23
24
25
26
27
Mirrors:Flat ConvexFender
11
12
13
14
15
16
17
27
26
25
24
23
22
2111
12
13
14
15
16
17
27
26
25
24
23
22
21
11
12
13
14
15
1617
21
22
23
24
25
26
27
1111
1212
1313
1414
1515
16161717
2121
2222
2323
2424
2525
2626
2727
Mean Reported Location
1212
ActualLocation
Mean Reported Location
12121212
ActualLocation
Figure 2-9. Mean reported positions of targets using flat mirrors, convex mirrors, and fender-mounted mirrors (See description for Figure 2-6.)
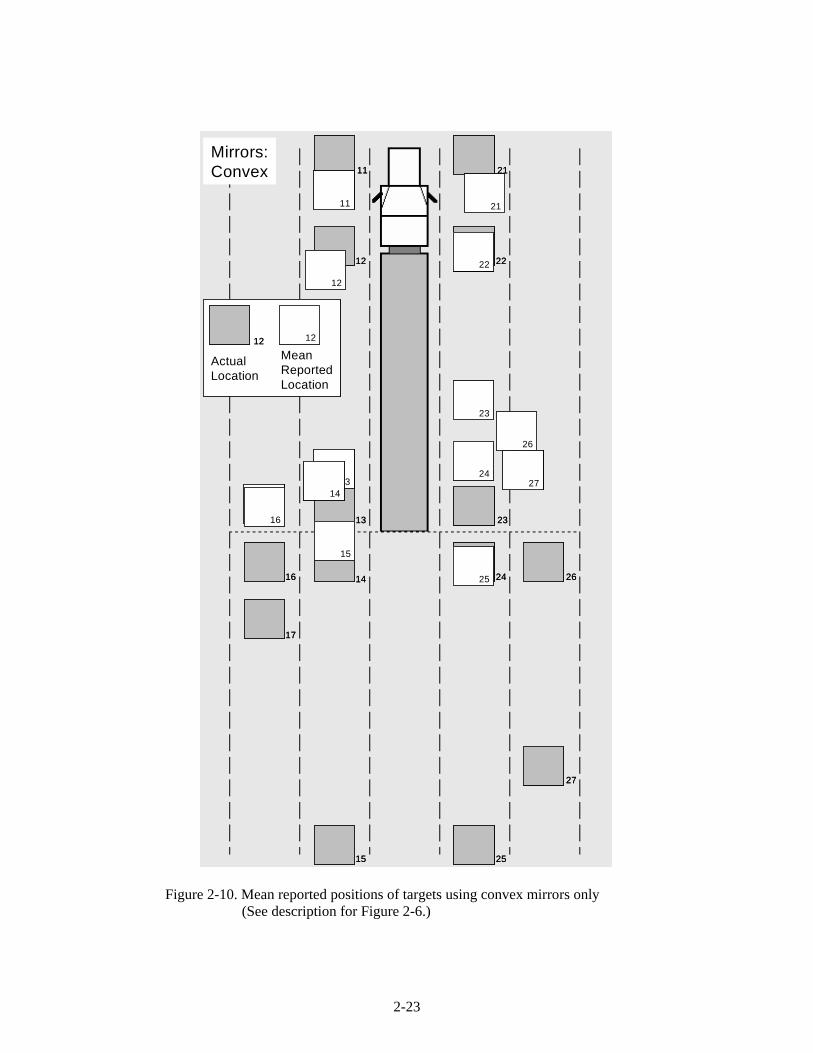
2-23
15
11
12
13
14
15
16
17
27
26
25
24
23
22
21
Mirrors:Convex
Mean Reported Location
1212
ActualLocation
11
12
1314
17
21
22
23
24
25
26
27
16
151515
11
12
13
14
15
16
17
27
26
25
24
23
22
21
Mirrors:Convex
Mean Reported Location
1212
ActualLocation
11
12
1314
17
21
22
23
24
25
26
27
16
15
11
12
13
14
15
16
17
27
26
25
24
23
22
21
Mirrors:Convex 11
12
13
14
15
16
17
27
26
25
24
23
22
2111
12
13
14
15
16
17
27
26
25
24
23
22
21
Mirrors:Convex
Mean Reported Location
1212
ActualLocation
Mean Reported Location
12121212
ActualLocation
11
12
1314
17
21
22
23
24
25
26
27
16
15
11
12
1314
17
21
22
23
24
25
26
27
1111
1212
13131414
1717
2121
2222
2323
2424
2525
2626
2727
1616
1515
Figure 2-10. Mean reported positions of targets using convex mirrors only (See description for Figure 2-6.)
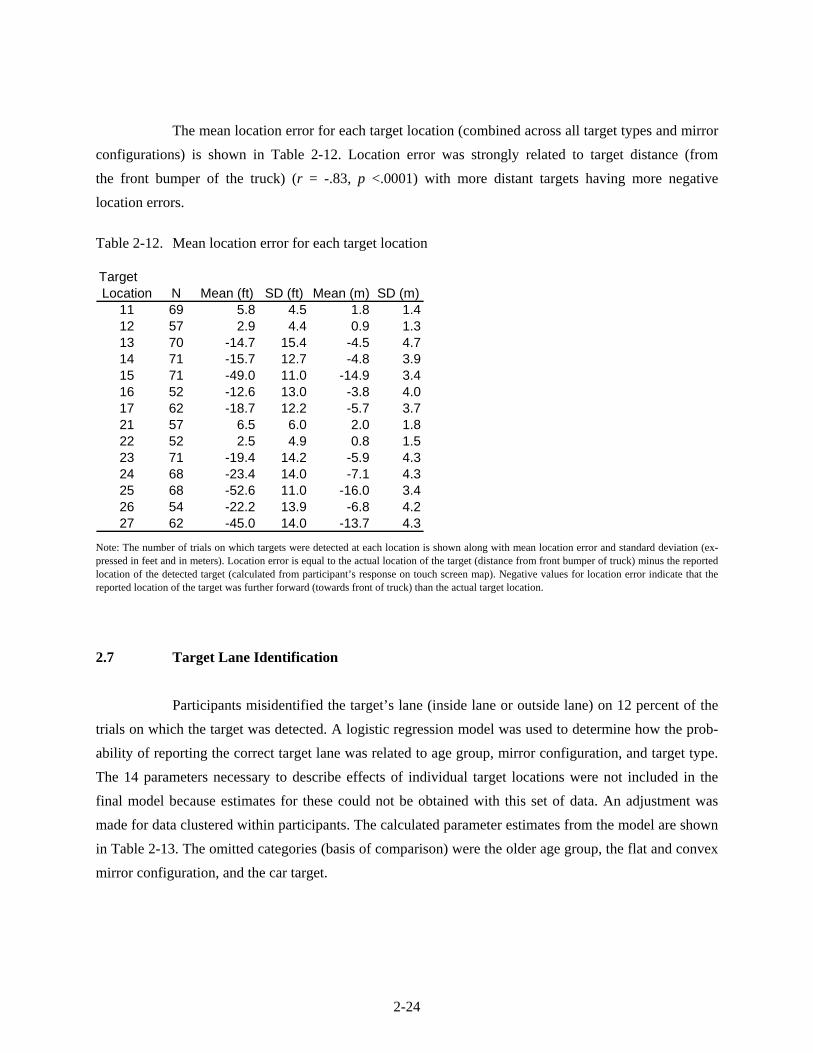
2-24
The mean location error for each target location (combined across all target types and mirror configurations) is shown in Table 2-12. Location error was strongly related to target distance (from the front bumper of the truck) (r = -.83, p <.0001) with more distant targets having more negative location errors.
Table 2-12. Mean location error for each target location TargetLocation N Mean (ft) SD (ft) Mean (m) SD (m)
11 69 5.8 4.5 1.8 1.412 57 2.9 4.4 0.9 1.313 70 -14.7 15.4 -4.5 4.714 71 -15.7 12.7 -4.8 3.915 71 -49.0 11.0 -14.9 3.416 52 -12.6 13.0 -3.8 4.017 62 -18.7 12.2 -5.7 3.721 57 6.5 6.0 2.0 1.822 52 2.5 4.9 0.8 1.523 71 -19.4 14.2 -5.9 4.324 68 -23.4 14.0 -7.1 4.325 68 -52.6 11.0 -16.0 3.426 54 -22.2 13.9 -6.8 4.227 62 -45.0 14.0 -13.7 4.3
Note: The number of trials on which targets were detected at each location is shown along with mean location error and standard deviation (ex-pressed in feet and in meters). Location error is equal to the actual location of the target (distance from front bumper of truck) minus the reported location of the detected target (calculated from participant’s response on touch screen map). Negative values for location error indicate that the reported location of the target was further forward (towards front of truck) than the actual target location.
2.7 Target Lane Identification
Participants misidentified the target’s lane (inside lane or outside lane) on 12 percent of the trials on which the target was detected. A logistic regression model was used to determine how the prob-ability of reporting the correct target lane was related to age group, mirror configuration, and target type. The 14 parameters necessary to describe effects of individual target locations were not included in the final model because estimates for these could not be obtained with this set of data. An adjustment was made for data clustered within participants. The calculated parameter estimates from the model are shown in Table 2-13. The omitted categories (basis of comparison) were the older age group, the flat and convex mirror configuration, and the car target.
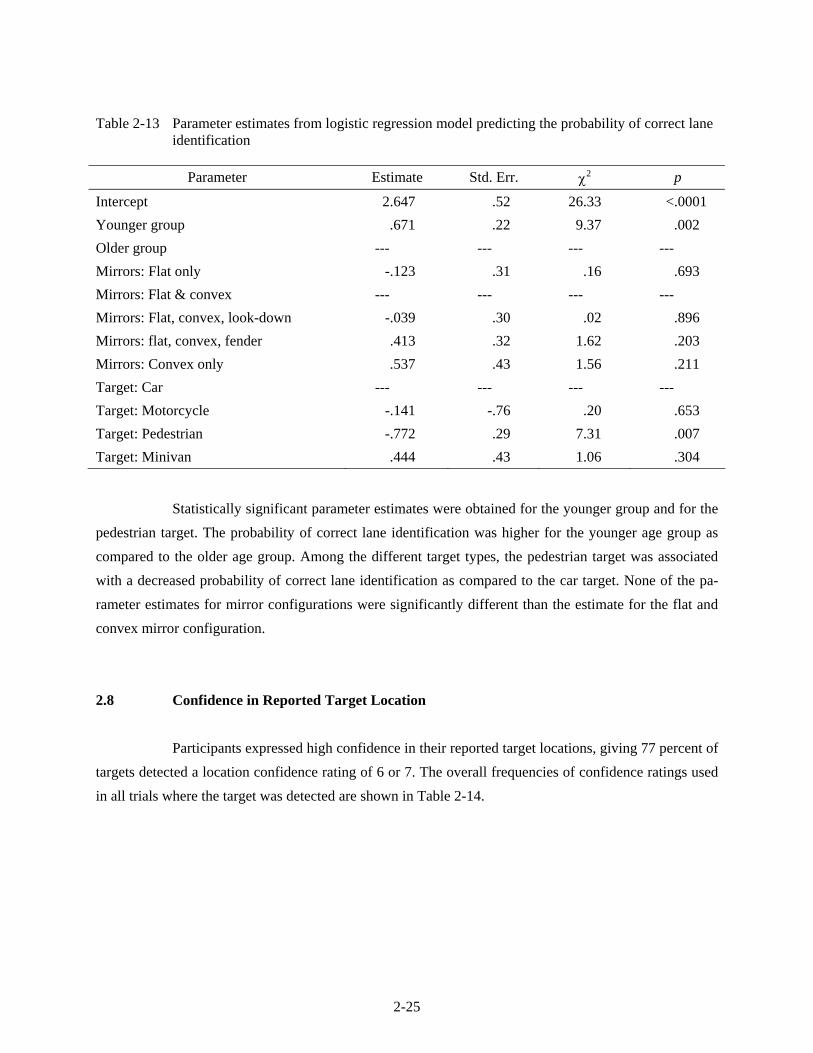
2-25
Table 2-13 Parameter estimates from logistic regression model predicting the probability of correct lane identification
Parameter Estimate Std. Err. χ2 p
Intercept 2.647 .52 26.33 <.0001Younger group .671 .22 9.37 .002 Older group --- --- --- --- Mirrors: Flat only -.123 .31 .16 .693 Mirrors: Flat & convex --- --- --- --- Mirrors: Flat, convex, look-down -.039 .30 .02 .896 Mirrors: flat, convex, fender .413 .32 1.62 .203 Mirrors: Convex only .537 .43 1.56 .211 Target: Car --- --- --- --- Target: Motorcycle -.141 -.76 .20 .653 Target: Pedestrian -.772 .29 7.31 .007 Target: Minivan .444 .43 1.06 .304
Statistically significant parameter estimates were obtained for the younger group and for the
pedestrian target. The probability of correct lane identification was higher for the younger age group as compared to the older age group. Among the different target types, the pedestrian target was associated with a decreased probability of correct lane identification as compared to the car target. None of the pa-rameter estimates for mirror configurations were significantly different than the estimate for the flat and convex mirror configuration.
2.8 Confidence in Reported Target Location
Participants expressed high confidence in their reported target locations, giving 77 percent of targets detected a location confidence rating of 6 or 7. The overall frequencies of confidence ratings used in all trials where the target was detected are shown in Table 2-14.
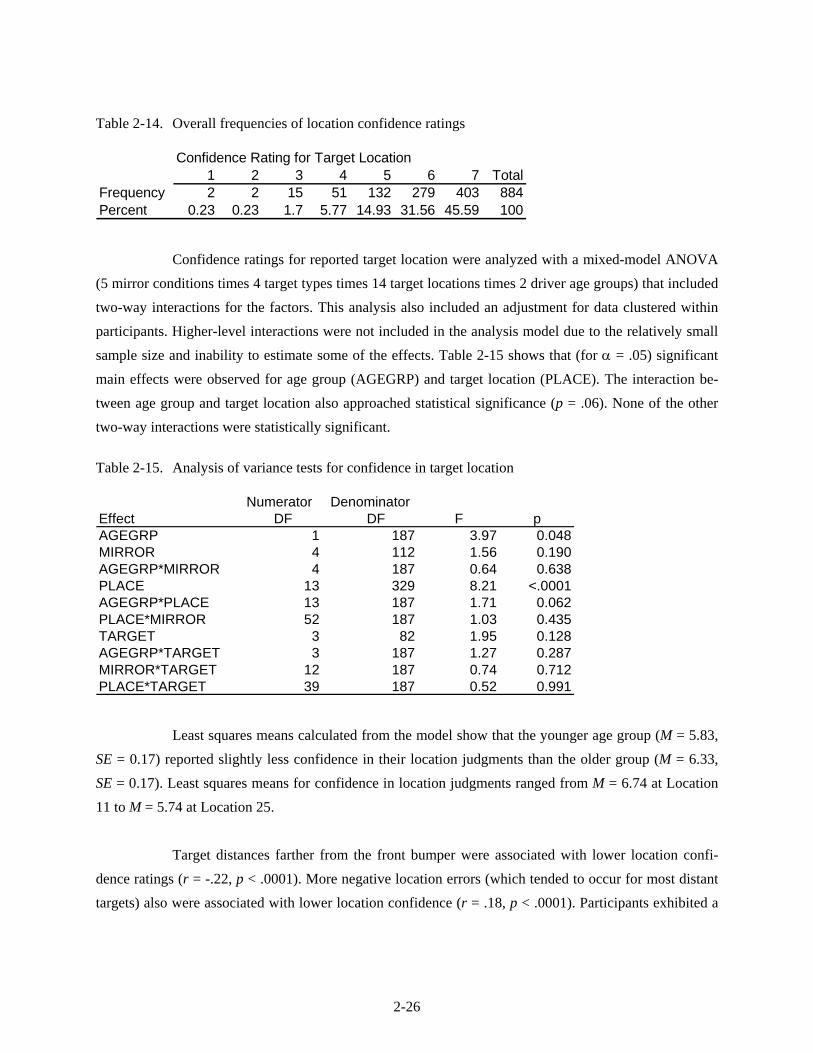
2-26
Table 2-14. Overall frequencies of location confidence ratings
Confidence Rating for Target Location1 2 3 4 5 6 7 Total
Frequency 2 2 15 51 132 279 403 884Percent 0.23 0.23 1.7 5.77 14.93 31.56 45.59 100
Confidence ratings for reported target location were analyzed with a mixed-model ANOVA
(5 mirror conditions times 4 target types times 14 target locations times 2 driver age groups) that included two-way interactions for the factors. This analysis also included an adjustment for data clustered within participants. Higher-level interactions were not included in the analysis model due to the relatively small sample size and inability to estimate some of the effects. Table 2-15 shows that (for α = .05) significant main effects were observed for age group (AGEGRP) and target location (PLACE). The interaction be-tween age group and target location also approached statistical significance (p = .06). None of the other two-way interactions were statistically significant.
Table 2-15. Analysis of variance tests for confidence in target location
Numerator DenominatorEffect DF DF F pAGEGRP 1 187 3.97 0.048MIRROR 4 112 1.56 0.190AGEGRP*MIRROR 4 187 0.64 0.638PLACE 13 329 8.21 <.0001AGEGRP*PLACE 13 187 1.71 0.062PLACE*MIRROR 52 187 1.03 0.435TARGET 3 82 1.95 0.128AGEGRP*TARGET 3 187 1.27 0.287MIRROR*TARGET 12 187 0.74 0.712PLACE*TARGET 39 187 0.52 0.991
Least squares means calculated from the model show that the younger age group (M = 5.83,
SE = 0.17) reported slightly less confidence in their location judgments than the older group (M = 6.33, SE = 0.17). Least squares means for confidence in location judgments ranged from M = 6.74 at Location 11 to M = 5.74 at Location 25.
Target distances farther from the front bumper were associated with lower location confi-
dence ratings (r = -.22, p < .0001). More negative location errors (which tended to occur for most distant targets) also were associated with lower location confidence (r = .18, p < .0001). Participants exhibited a

2-27
strong tendency to report distant targets as being much closer than they were, and their confidence ratings for distant targets tended to be lower than for closer targets.
3-1
3. DISCUSSION
3.1 Summary
Data from 1,056 valid trials were obtained in this study. Of these trials, 993 trials (94%) con-tained a target and the remaining 63 (6%) were “blank” trials on which no target was presented. The out-come of each trial was classified as a correct identification, misidentification (with detection), missed de-tection, correct rejection, or false positive.
All 63 trials with no target present were correctly reported (correct rejections), so no false
positives occurred. Of the remaining 993 trials containing a target, 866 (87%) of these resulted in correct identifications, 18 (1.8%) were misidentifications, and 109 (11%) were missed detections.
Using flat mirrors alone resulted in the greatest number of missed targets. This result was
expected due to the narrow field of view available from the flat mirrors that results in large functional blind spots. Although participants were free to make compensatory head movements to make best use of the available mirrors on each trial, the results show that targets in several locations often were not de-tected or were misidentified.
Drivers tended to substantially underestimate the actual position of objects seen in mirrors,
reporting the targets to be closer to them than they actually were, particularly when targets were located far behind the trailer. This result was reliable and not dependent upon the mirror configuration used. In practical terms, this suggests that drivers should demonstrate more conservative lane-changing practices since targets located beyond or near the rear of the trailer were generally perceived to be within the boundary of the trailer itself. Regardless, this result suggests that distance judgments using existing mirror systems are not very accurate and could be improved.
3.2 Functional Comparisons of Different Mirror Configurations
For each combination of mirror configuration and target location tested, at least a few trials resulted in target detection. This indicates that functional fields of view for mirror systems measured with natural head and body movements (across a sample of drivers) are variable and larger than would be pre-
3-2
dicted from viewing geometry that assumes a fixed eye position. However, despite being able to make head and body movements to improve their detection and identification of targets, participants using flat mirrors alone had low detection rates at some locations.
Detection and identification were improved by mirror configurations that included convex
mirrors mounted below the flat mirrors, and response times were not increased by adding a second mirror type to the configuration. A look-down mirror mounted above the passenger side window increased the rates of detection and identification for targets located close to the cab in the adjacent travel lane. Under the conditions tested, there was no evidence that fender-mounted mirrors (added to the standard flat and convex mirror configuration) improved target detection or identification.
3.3 Driver Age
The probability of target detection was higher for younger drivers, although by the usual cri-terion (α = .05); this effect was not quite statistically significant (p = .063). Older drivers and younger drivers differed significantly in response time (with older drivers taking longer to respond). The two age groups did not differ in specifying target locations (with location errors measured parallel to the travel lanes). However, the probability of correctly identifying the target’s lane was higher for younger drivers, even though they reported significantly less confidence in their target location estimates than did older drivers.
3.4 Method to Evaluate Indirect Visibility Systems for Heavy Trucks
This study has demonstrated a safe method for testing the function of multiple indirect visi-bility systems on heavy trucks under static conditions with controlled glance durations. The methodology is performance-based. As in real driving situations, participants had to search for targets located around the truck and often had to integrate search information across several glances. Overall, few targets were misidentified suggesting that targets reported as being detected were actually seen. Confidence ratings for target identification and target location were generally very high, and there were no false positives re-ported on trials that did not contain a target. Together, these results suggest that participants took their tasks quite seriously.

3-3
Similar testing methodology could be used to evaluate other indirect visibility systems such as video-based systems. Of the dependent measures used in the present study, the response time discrimi-nated among the greatest number of variables, showing sensitivity to the effects of driver age, mirror con-figuration, target location, target type, and various two-way interactions between these factors. This measure is recommended for use in future research on indirect visibility systems along with other behav-ioral measures.
Participants in the present study were able to adjust their head and body positions as they
searched available mirrors. A functional aspect of mirror systems is that fields of view and availability of certain depth cues depend on dynamic changes in driver’s eye position during search tasks. For mirrors, behavioral interactions with the indirect visibility system may help drivers to detect and identify targets that are near the edge of the field of view, and may aid them in making distance judgments. Views ob-tained from simple camera-based indirect visibility systems will not be altered with changes such as in driver’s eye position. Thus, as video systems are developed, it will be important to evaluate them with functional tasks to determine how drivers interact with these systems. The tasks and procedures used in the present study could be applied uniformly by human factors engineers at various organizations and may serve as a starting point for designing future behavioral studies, or measurement standards that evaluate the performance of indirect visibility systems for heavy trucks.
A few potential disadvantages of the methodology for widespread assessment of indirect
visibility systems on vehicles were noted. One potential disadvantage is that the techniques used in this study are moderately complex and would require a substantial amount of preparation before a similar ex-periment could be performed. The time and cost required to set up these procedures may limit their wide-spread use. Another potential difficulty with the procedure concerns the static nature of the testing proce-dure that does not involve driving under “real-world” conditions. At this time it is not known how well results obtained from the static testing procedures developed here will generalize to real driving condi-tions. As new indirect visibility systems are developed and as further research confirms the real world validity of static testing procedures for these systems, it may be desirable to include static testing proce-dures for heavy trucks in FMVSS. For example, detailed static testing procedures already have been specified in FMVSS 517.111 S13 to test indirect visibility systems on school buses.
Another potential difficulty with the current methods concerns the transparency of the win-
dow panels. In the clear state, the window panels have a slightly hazy appearance, similar to a dirty win-dow. It is not known whether this biased the results of the tests in any way. However, the overall target
3-4
detection and target identification rates in the study were very high, approaching 100 percent for some target locations. None of the drivers complained about visibility being affected by the window panels.
An opportunity for further research concerns the surprisingly large errors in reported target
location found in this study. Participants perceived targets as being much closer to them than their actual locations. It is unknown whether this phenomenon is an artifact of the testing procedures or whether it reflects an interesting aspect of drivers’ on-road perceptual behavior. There are several possible explana-tions to investigate. For example, the restricted field of view in both horizontal and vertical directions and the height of mirrors and observer may not provide adequate depth cue information from the nearby ground surface to be able to accurately estimate the distance to more distant targets (Wu, Ooi, & He, 2004). Also, the frame introduced by the edges of the mirror may flatten perceptual depth in the scene (Eby & Braunstein, 1995).
Another possibility is that the apparent haze from the window panels may have influenced
distance perception. In the absence of strong depth cues for targets seen through mirrors, participants may have a tendency to use image quality (contrast) as a cue to target distance. For targets viewed through at-mospheric haze (or fog) visibility depends on such effects as physical properties of the particles in the air or positions of light sources and targets. However, contrast decreases approximately as an exponential function of distance. The result is that under naturally occurring foggy or hazy conditions, objects that are closer to the observer tend to have higher contrast than objects that are farther away from the observer. For truck drivers highly experienced with driving in various weather conditions, the relation between tar-get distance and contrast reduction due to atmospheric effects may be a well learned feature of their per-ceptual processing.
Unlike naturally occurring atmospheric effects, the mild scattering and filtering effects of the
window panels in the present study likely caused a fixed amount of contrast reduction for targets located at various distances from the observer. If contrast reductions due to the atmospheric phenomena influence distance judgments and if participants perceptually processed the contrast reduction caused by the panels as atmospheric haze (with its tendency to decrease contrast exponentially with target distance), then the perceived locations of distant targets may have been biased to closer locations because of the relative clar-ity with which they were seen (with similar contrast as nearby objects). Distant targets seen under hazy or foggy conditions with nearly the same (unnaturally high) contrast as close objects may be perceived as being closer than their actual locations.

4-1
4. REFERENCES
Eby, D.W., and Braunstein, M.L. (1995). The perceptual flattening of three-dimensional scenes enclosed by a frame. Perception, 24, 981-993.
Flannagan, M.J., Reed, M.P., Owens, J.M., Lehto Way, M., & Blower, D.F. (2003). Optimizing the Per-formance and Use of Indirect Visibility Systems on Heavy Trucks: Interim Report. Task Order No. 8 under DTNH22-00-C-07007. Washington, DC: National Highway Traffic Safety Administration.
Money, D.M. (2000). Mirror system safety for roadway construction vehicles. Heavy Equipment News, pp. 20-23
Society of Automotive Engineers (2002). Information Report SAE J2364: Navigation and Route Guid-ance Function Accessibility While Driving. Warrendale, PA: SAE
Technology and Maintenance Council (1999). Mirror positioning and aiming guidelines. Vehicle Mainte-nance Reporting Standard 002, Recommended Practice 425, pp. 1-3. Alexandria, VA: American Trucking Associations.
Wierwille, W.W., Spaulding, J.M., Hanowski, R.J., Koepfle, B.J., & Olson, R.L. (2003). Task 1 Report Workplan. Development of a Performance Specification for Camera/Video Imaging Systems on Heavy Vehicles. Draft Version, December 15, 2003.
Wu, B., Ooi, T. L., & He, Z. J. (2004). Perceiving distance accurately by a directional process of integrat-ing ground information. Nature, 428, no. 6978, 73–77.

Appendix A
Informed Consent and Study Summary

A-1
APPENDIX A
INFORMED CONSENT AND STUDY SUMMARY (PROJECT 7790.18)
Purpose of Research: Thank you for volunteering to participate in this study. The purpose of this research is to collect information about the ease with which drivers can detect, locate, and recog-nize objects using a range of different mirror systems common in trucks today. Data collected as part of this study will help identify blind spots and contribute to the development of improved indirect vision systems including camera-based systems.
Research Procedures: You will be seated in a parked tractor-trailer, and asked to perform some target detection tasks using available mirror systems to locate and recognize objects placed around the periphery of the truck. At no time will you be actually driving the truck; all of the tasks will be per-formed with the engine off. (Air conditioning will be available.) You will be accompanied by a trained research investigator who will be in the rear compartment of the cab and providing you instructions throughout the experimental session. The entire study should take no more than 2.5 hours and you will receive $75 for your participation. A computer will be used to record your responses, and in-cab cameras will be recording your head and eye-glance movements. (This will provide information on scan patterns.)
Foreseeable Risk: Since you will not be driving, the risks inherent in this study are ex-tremely low. The vehicle is located in a secure and controlled facility, and an experimenter will always be present in the test vehicle.
Benefits of the Research: This study is part of a larger effort intended to assess the effec-tiveness of video-based indirect visibility systems that may one day serve as replacements for, or supple-ments to conventional truck mirror systems. This study represents an important first step in assessing the utility and possible effectiveness of mirror replacements.
Confidentiality: We will be asking you for some basic descriptive information about your-self. This includes your age, driving history and habits (how long have you been driving, how much do you drive, etc.), and certain questions about physical status and health that may relate to your driving (your vision, arthritic difficulties in turning your head, medicines that may affect driving, etc.). This in-formation is confidential, and no published reports of the research will identify any participants. Like-wise, all information collected during the study is confidential and will not be presented in any form that

A-2
identifies individuals. All data will be treated with anonymity; you will be assigned a number and all identifying information separated from your name. Any videotapes of the data, which will include video of your head, will be kept strictly confidential and will be protected.
Contact Person: If you have any questions about the research or the rights of research par-ticipants contact Dr. Eddy Llaneras, 301-315-5953, or Dr. Jim Jenness, 240-314-2424, at Westat, Inc., 1650 Research Blvd., Rockville, Maryland 20850.
Voluntary Withdrawal From the Experiment: Your cooperation in this study is entirely voluntary. Refusal to participate will involve no penalty or loss of benefits to which you are otherwise entitled. You may discontinue participation at any time without penalty or loss of benefits. If you with-draw from the study, you will be paid on a prorated basis for the time you did participate.
Authorization: By agreeing to participate, you certify that you possess a valid, unrestricted, U.S. CDL driver license (except for corrective eyeglasses), have a minimum of 3 years of driving experi-ence, be 21 years of age or older, have normal hearing and vision (with correction allowed), are able to give informed consent and are not under the influence of alcohol, drugs, or any other substances (e.g., antihistamines) that may impair your ability to drive. You also certify that you do not have a history of heart condition or prior heart attack; lingering effects of brain damage from stroke, tumor, head injury, or infection; epileptic seizures in the past 12 months; shortness of breath or chronic medical therapy for res-piratory disorders; a history of motion sickness; a history of inner ear problems; dizziness, vertigo, or balance problems; diabetes for which insulin is required; chronic migraine or tension headaches; or are pregnant.
By signing this form you certify, to the best of your knowledge, you have no physical ailments or conditions that could either be further aggravated or adversely affected by participation in this study.
I have read the above and recognize the risks of this study. I agree to participate as a partici-pant in the research. I understand that participation is voluntary and I may withdraw from the study at any time. I have received a copy of this consent for my records.
Signature of Participant: _____________________________________ Date: ___________________ Signature of Investigator: ______________________________________ Date: ___________________

Appendix B
Frequencies of Missed Detections, Misidentifications, And Correct Identifications for Each Mirror
Configuration and Target Location
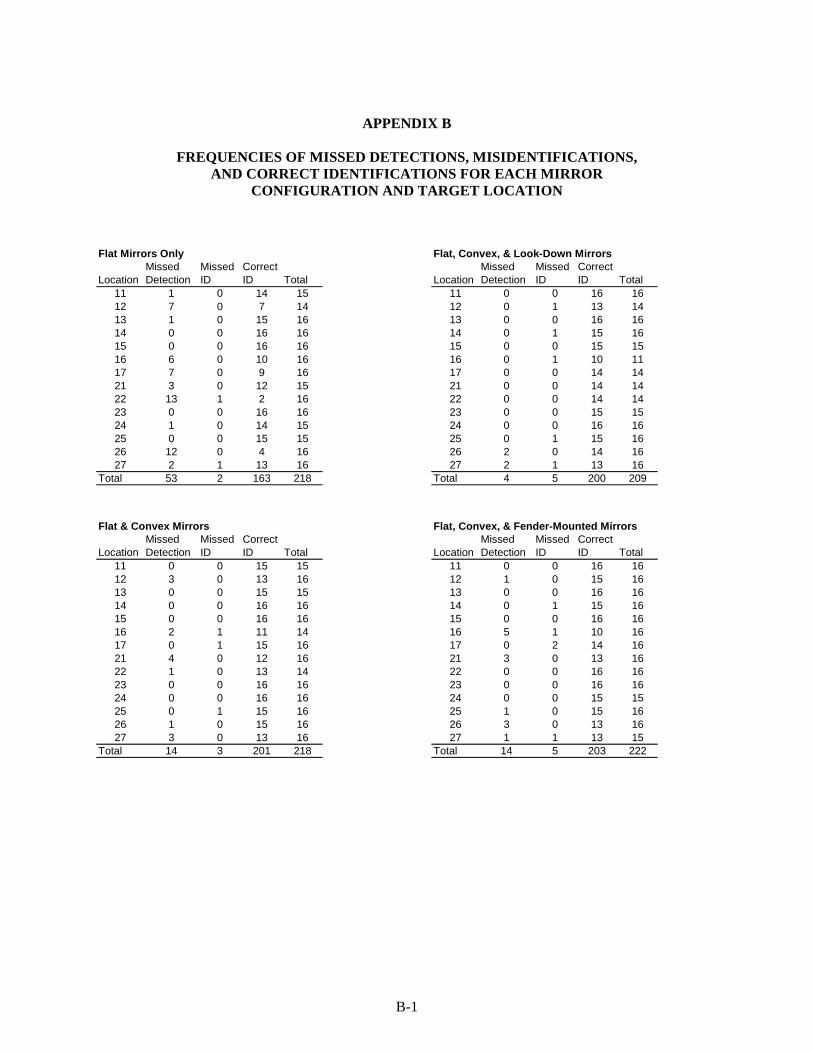
B-1
APPENDIX B
FREQUENCIES OF MISSED DETECTIONS, MISIDENTIFICATIONS, AND CORRECT IDENTIFICATIONS FOR EACH MIRROR
CONFIGURATION AND TARGET LOCATION
Flat Mirrors Only
LocationMissed Detection
Missed ID
Correct ID Total
11 1 0 14 1512 7 0 7 1413 1 0 15 1614 0 0 16 1615 0 0 16 1616 6 0 10 1617 7 0 9 1621 3 0 12 1522 13 1 2 1623 0 0 16 1624 1 0 14 1525 0 0 15 1526 12 0 4 1627 2 1 13 16
Total 53 2 163 218
Flat & Convex Mirrors
LocationMissed Detection
Missed ID
Correct ID Total
11 0 0 15 1512 3 0 13 1613 0 0 15 1514 0 0 16 1615 0 0 16 1616 2 1 11 1417 0 1 15 1621 4 0 12 1622 1 0 13 1423 0 0 16 1624 0 0 16 1625 0 1 15 1626 1 0 15 1627 3 0 13 16
Total 14 3 201 218
Flat, Convex, & Look-Down Mirrors
LocationMissed Detection
Missed ID
Correct ID Total
11 0 0 16 1612 0 1 13 1413 0 0 16 1614 0 1 15 1615 0 0 15 1516 0 1 10 1117 0 0 14 1421 0 0 14 1422 0 0 14 1423 0 0 15 1524 0 0 16 1625 0 1 15 1626 2 0 14 1627 2 1 13 16
Total 4 5 200 209 Flat, Convex, & Fender-Mounted Mirrors
LocationMissed Detection
Missed ID
Correct ID Total
11 0 0 16 1612 1 0 15 1613 0 0 16 1614 0 1 15 1615 0 0 16 1616 5 1 10 1617 0 2 14 1621 3 0 13 1622 0 0 16 1623 0 0 16 1624 0 0 15 1525 1 0 15 1626 3 0 13 1627 1 1 13 15
Total 14 5 203 222
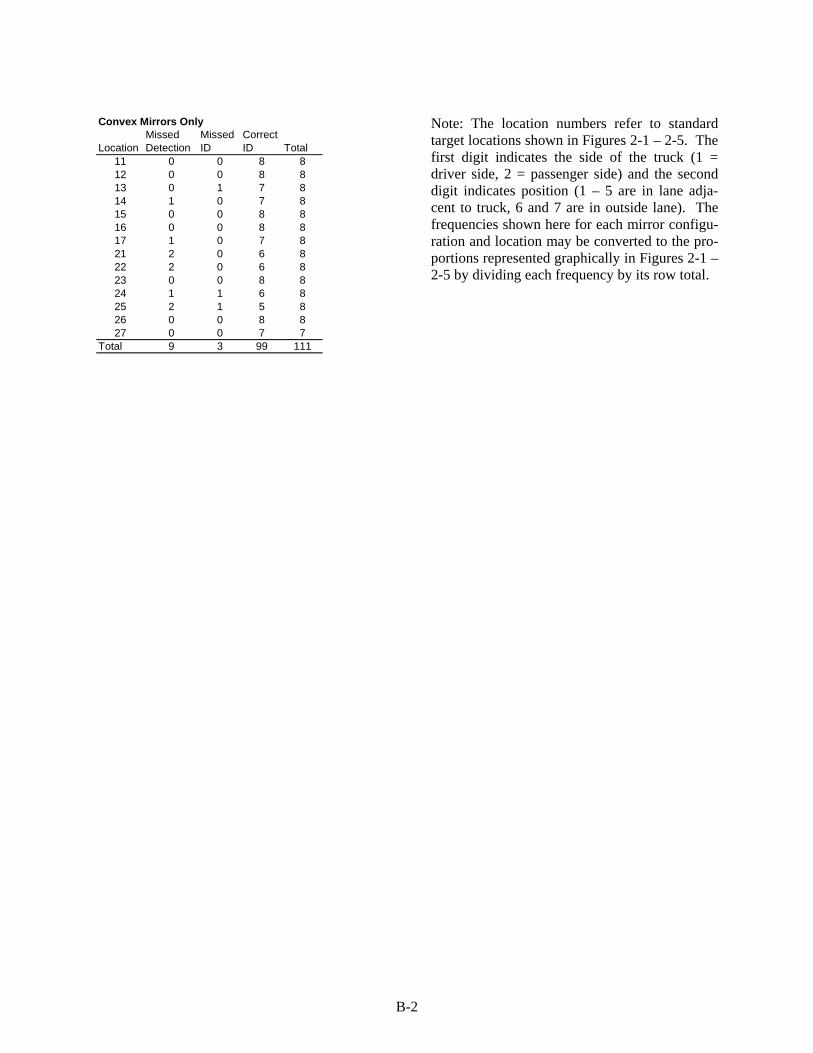
B-2
Convex Mirrors Only
LocationMissed Detection
Missed ID
Correct ID Total
11 0 0 8 812 0 0 8 813 0 1 7 814 1 0 7 815 0 0 8 816 0 0 8 817 1 0 7 821 2 0 6 822 2 0 6 823 0 0 8 824 1 1 6 825 2 1 5 826 0 0 8 827 0 0 7 7
Total 9 3 99 111
Note: The location numbers refer to standard target locations shown in Figures 2-1 – 2-5. The first digit indicates the side of the truck (1 = driver side, 2 = passenger side) and the second digit indicates position (1 – 5 are in lane adja-cent to truck, 6 and 7 are in outside lane). The frequencies shown here for each mirror configu-ration and location may be converted to the pro-portions represented graphically in Figures 2-1 – 2-5 by dividing each frequency by its row total.

Appendix C
Federal Motor Vehicle Safety Standards for Rearview Mirrors
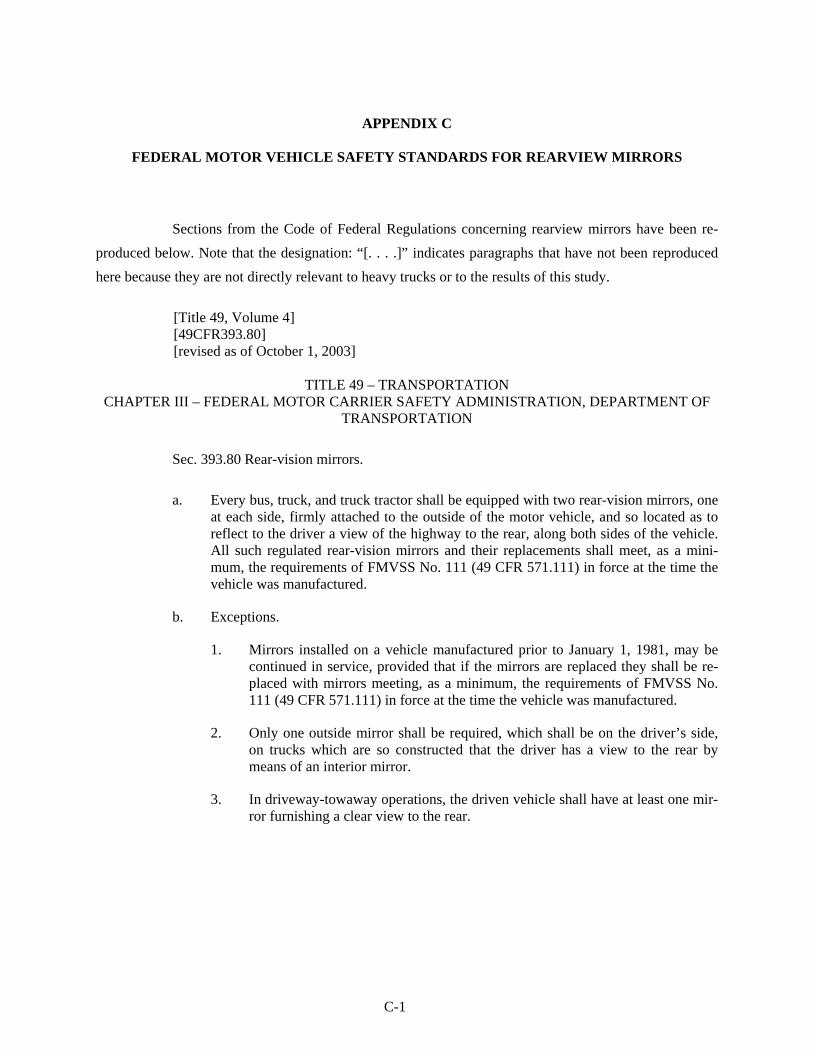
C-1
APPENDIX C
FEDERAL MOTOR VEHICLE SAFETY STANDARDS FOR REARVIEW MIRRORS
Sections from the Code of Federal Regulations concerning rearview mirrors have been re-produced below. Note that the designation: “[. . . .]” indicates paragraphs that have not been reproduced here because they are not directly relevant to heavy trucks or to the results of this study.
[Title 49, Volume 4] [49CFR393.80] [revised as of October 1, 2003]
TITLE 49 – TRANSPORTATION CHAPTER III – FEDERAL MOTOR CARRIER SAFETY ADMINISTRATION, DEPARTMENT OF
TRANSPORTATION
Sec. 393.80 Rear-vision mirrors. a. Every bus, truck, and truck tractor shall be equipped with two rear-vision mirrors, one
at each side, firmly attached to the outside of the motor vehicle, and so located as to reflect to the driver a view of the highway to the rear, along both sides of the vehicle. All such regulated rear-vision mirrors and their replacements shall meet, as a mini-mum, the requirements of FMVSS No. 111 (49 CFR 571.111) in force at the time the vehicle was manufactured.
b. Exceptions.
1. Mirrors installed on a vehicle manufactured prior to January 1, 1981, may be continued in service, provided that if the mirrors are replaced they shall be re-placed with mirrors meeting, as a minimum, the requirements of FMVSS No. 111 (49 CFR 571.111) in force at the time the vehicle was manufactured.
2. Only one outside mirror shall be required, which shall be on the driver’s side, on trucks which are so constructed that the driver has a view to the rear by means of an interior mirror.
3. In driveway-towaway operations, the driven vehicle shall have at least one mir-ror furnishing a clear view to the rear.
C-2
[Title 49, Volume 5] [49CFR571.111] [revised as of October 1, 2003]
TITLE 49 –TRANSPORTATION CHAPTER V – NATIONAL HIGHWAY SAFETY ADMINISTRATION, DEPARTMENT OF TRANS-
PORTATION
Sec. 571.111 Standard No. 111; Rearview mirrors.
S1. Scope. This standard specifies requirements for the performance and location of rear-view mirrors.
S2. Purpose. The purpose of this standard is to reduce the number of deaths and injuries that
occur when the driver of a motor vehicle does not have a clear and reasonably unobstructed view to the rear.
S3. Application. This standard applies to multipurpose passenger vehicles, trucks, buses,
school buses and motorcycles. S4. Definitions. Convex mirror means a mirror having a curved reflective surface whose
shape is the same as that of the exterior surface of a section of a sphere. Effective mirror surface means the portions of a mirror that reflect images, excluding the
mirror rim or mounting brackets. Unit magnification mirror means a plane or flat mirror with a reflective surface through which the angular height and width of the image of an object is equal to the angular height and width of the object when viewed directly at the same distance except for flaws that do not ex-ceed normal manufacturing tolerances. For the purposes of this regulation a prismatic day-night adjust-ment rearview mirror one of whose positions provides unit magnification is considered a unit magnifica-tion mirror.
S5. Requirements for passenger cars [ . . . .] S6. Requirements for multipurpose passenger vehicles, trucks, and buses, other than school
buses, with GVWR of 4,536 kg or less. [. . . .]

C-3
S7. Requirements for multipurpose passenger vehicles and trucks with a GVWR of more than 4,536 kg and less than 11,340 kg and buses, other than school buses, with a GVWR of more than 4,536 kg. [. . . .]
S8. Requirements for multipurpose passenger vehicles and trucks with a GVWR of 11,340
kg or more. S8.1 Each multipurpose passenger vehicle and truck with a GVWR of 11,340 kg or more
shall have outside mirrors of unit magnification, each with not less than 323 cm2 of reflective surface, installed with stable supports on both sides of the vehicle. The mirrors shall be located so as to provide the driver a view to the rear along both sides of the vehicle and shall be adjustable both in the horizontal and vertical directions to view the rearward scene.
S9. Requirements for school buses. [. . . .] S10. Requirements for motorcycles. [. . . .] S11. Mirror Construction. The average reflectance of any mirror required by this standard
shall be determined in accordance with SAE Recommended Practice J964, OCT84. All single reflectance mirrors shall have an average reflectance of at least 35 percent. [. . . .]
S12. Determination of radius of curvature. [. . . .] S13. School bus mirror test procedures. [. . . .]


DOT HS 810 961 June 2008