Embed Size (px)
Citation preview

STATISTIC

• Statistika Ilmu mengumpulkan, menata, menyajikan, menganalisis, dan menginterprestasikan data menjadi informasi untuk membantu pengambilan keputusan yang efektif.
• StatistikSuatu kumpulan angka yang tersusun lebih dari satu angka.
DEFINISI

Cara mendapatkan Data 1. Pengamatan 2. Wawancara 3. Kuis 4. Mengukur 5. Mencacah

POPULASI DAN SAMPEL
POPULASI POPULASI Sebuah kumpulan dari semua Sebuah kumpulan dari semua kemungkinan orang-orang, benda-kemungkinan orang-orang, benda-benda dan ukuran lain dari objek yang benda dan ukuran lain dari objek yang menjadi perhatian.menjadi perhatian.
SAMPELSAMPEL Suatu bagian dari populasi tertentu Suatu bagian dari populasi tertentu yang menjadi perhatian.yang menjadi perhatian.


Mean, Median, Mode, and Range

Mean is the average of a set of data. To calculate the mean, find the sum of the data and then divide by the number of data.
12, 15, 11, 11, 7, 13
12 + 15 +11 + 11 + 7 + 13 = 69
69 / 6 = 11.5
First, find the sum of the data.
Then divide by the number of data.
The mean is 11.5

You try the next one!
You can remember that “mean” means to average because the “mean teacher averages your grade.”

An electronics store sells CD players at the following prices: $350, $275, $500, $325, $100, $375, and $300. What is the mean price?
Find your answer before clicking!

$350 + $275 + $500 + $325 + $100 +$375 + $300 =
$2225
$2225 / 7 = $317.86
The mean or average price of a CD player is $317.86.

Median is the middle number in a set of data when the data is arranged in numerical order.

12, 15, 11, 11, 7, 13First, arrange the data in numerical order. 7, 11, 11, 12, 13, 15
Then find the number in the middle or the average of the two numbers in the middle.
11 + 12 = 23 23 / 2 = 11.5
The median is 11.5

Find your answer before clicking!
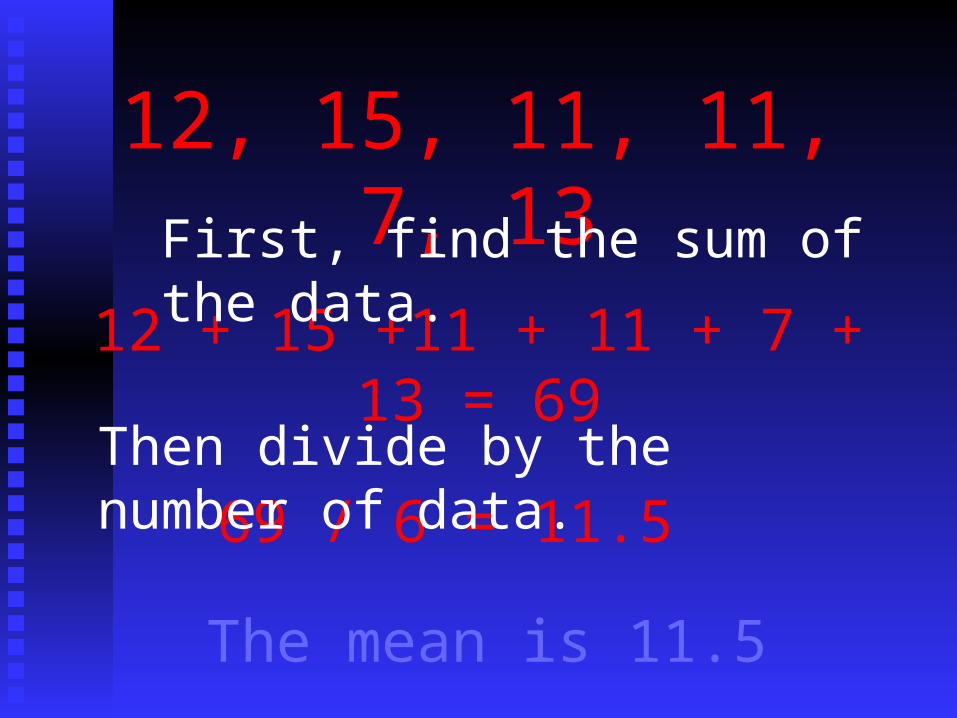
An electronics store sells CD players at the following prices: $350, $275, $500, $325, $100, $375, and $300. What is the median price?
First place the prices in numerical order.
$100, $275, $300, $325, $350, $375, $500
The price in the middle is the median price.
The median price is $325.

The mode is the number that occurs the most.

12, 15, 11, 11, 7, 13
The mode is 11.

Sometimes a set of data will have more than one mode.
For example, in the following set the numbers both the numbers 5 and 7 appear twice.
2, 9, 5, 7, 8, 6, 4, 7, 5
5 and 7 are both the mode and this set is said to be bimodal.

Sometimes there is no mode in a set of data.
3, 8, 7, 6, 12, 11, 2, 1
All the numbers in this set occur only once therefore there is no mode in this
set.

$100, $275, $300, $325, $350, $375, $500
What is the mode ?
Find your answer before clicking!

$100, $275, $300, $325, $350, $375, $500
There is no mode!
You can remember that mode means the number that occurs the most because “mode” and “most” sound alike!

The range of a set of data is the difference between the largest and the smallest number in the set.
For example, consider the following set:
40, 30, 43, 48, 26, 50, 55, 40, 34, 42, 47, and 50
To find the range you would take the largest number, 55, and subtract the smallest number, 26.
55 – 26 = 29
The range is 29!

Mean The average
Median The number or average of the numbers in the middle
Mode The number that occurs most

Creating Graphs
BY ARFANI ,S.Pd

Where Does the Information Come From?
A question is asked.A question is asked.
What kind of ice cream doeseveryone like in our class?

How Is the InformationGathered?
A survey is made.A survey is made.ChocolateChocolate 1111 1111 66
VanillaVanilla 111 111 33
StrawberryStrawberry 11111111 55
Mint & ChipMint & Chip 1111 111111 11 77
Rocky RoadRocky Road 1111 22
Bubble GumBubble Gum 11 22

How Is the InformationPresented?
A bar graph is made.A bar graph is made.
0
1
2
3
4
5
6
7
Chocolat Vanilla Strawberr Mint & C Rocky R Bubble G
Students

How Is the InformationPresented?
A bar graph is made.A bar graph is made.
0
1
2
3
4
5
6
7
Students
ChocolateVanillaStrawberryMint & ChipRocky RoadBubble Gum

For Pie chart
Chocolate 6/15 x 360 ° = 144 ° Chocolate 6/15 x 360 ° = 144 ° Vanilla 3/15 X 360 ° = 72 °Vanilla 3/15 X 360 ° = 72 ° Strawberry 5/15 x 360 ° = 120 °Strawberry 5/15 x 360 ° = 120 ° Mint & Chip 7/15 x 360 ° = 168 °Mint & Chip 7/15 x 360 ° = 168 ° Rocky Road 2/15 x 360 ° = 48 °Rocky Road 2/15 x 360 ° = 48 ° Bubble Gum 1/15 x 360 ° = 24 °Bubble Gum 1/15 x 360 ° = 24 °

How Is the InformationPresented?
A pie chart is made.A pie chart is made.
Chocolate
Vanilla
Strawberry
Mint & Chip
Rocky RoadBubble Gum

How Is the InformationPresented?
A pie chart is made.A pie chart is made.Students
Chocolate
Vanilla
Strawberry
Mint & Chip
Rocky Road
Bubble Gum

How Is the InformationPresented?
A line graph is made.A line graph is made.
0
1
2
3
4
5
6
7
Chocolate Vanilla Strawberr Mint & Ch Rocky Ro Bubble G
Students

How Is the InformationPresented?
A pictograph is made.A pictograph is made.ChocolateChocolate
VanillaVanilla
StrawberryStrawberry
Mint & ChipMint & Chip
Rocky RoadRocky Road
Bubble GumBubble Gum