Embed Size (px)
Citation preview
1
Statistical analysis of a one-semester general chemistry approach for students entering the pharmacy field
Taylor OwingsMarcy TownsPurdue University
2
Goal
•The goal of this research was to evaluate the newly introduced CHM 109 on its effectiveness for preparing students for organic chemistry
3
Introduction• Change in the MCAT encourages more
biochemistry for premedical and pre-pharmacy students▫AAMC mandated
• Recommendation for a 1-2-1 format, with inclusion of Biochemistry in place of a second semester of general chemistry
• CHM 109 implemented at Purdue to accommodate the one semester general chemistry requirement▫5 credit hours, 3 lectures a week
4
Background on the CHM 109 course• 5 credit hour course
• Created to replace the 2 semester equivalent (CHM 115 and CHM 116)
• Designed to be part of new 1-2-1 chemistry series for students▫1 general chemistry course CHM 109▫2 organic courses (MCMP (Medicinal Chemistry
& Molecular Pharmacology) 204-205)▫1 biochemistry course
5
Participants
•Students enrolled in MCMP 204/205 from fall 2002 - fall 2011▫Classified by year enrolled in MCMP 204▫Information collected on all chemistry
classes students had enrolled in

6
Data collection
•Data collected included▫Demographic information▫SAT/ACT scores▫Grades in all Purdue chemistry courses
7
Research question
•How do students enrolled in MCMP 204/205 perform in organic chemistry based on prior enrollment in CHM 109 and CHM 115-116?
8
Statistical analysis
•Analysis to determine if comparisons can be made between student groups
•Analysis to determine if students course outcomes in MCMP 204/205 varied based on prior enrollment in CHM 115-116 or CHM 109
9
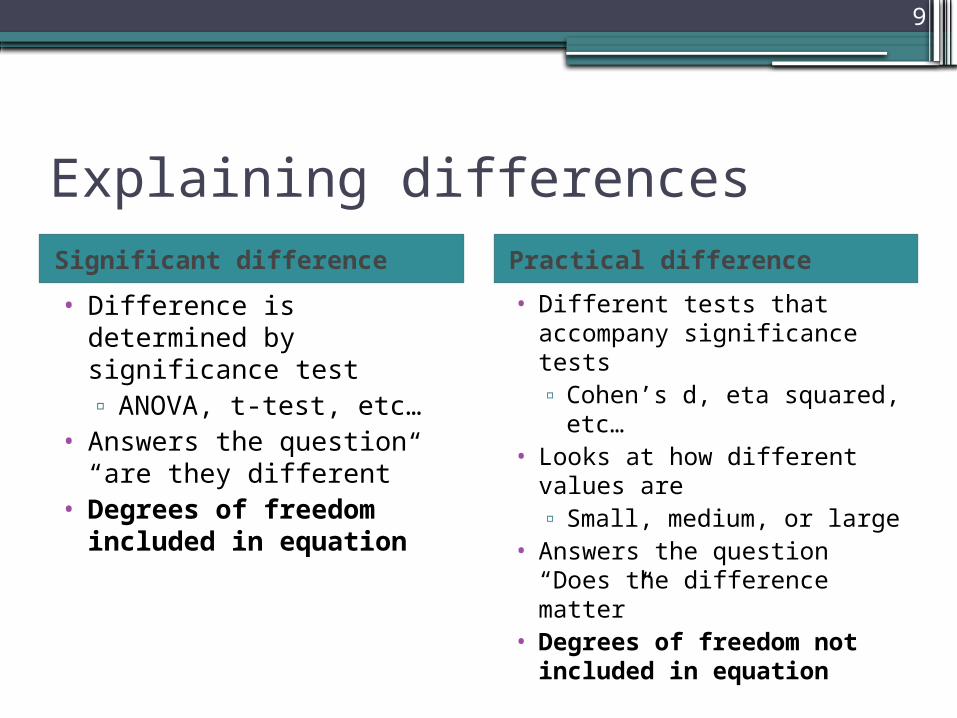
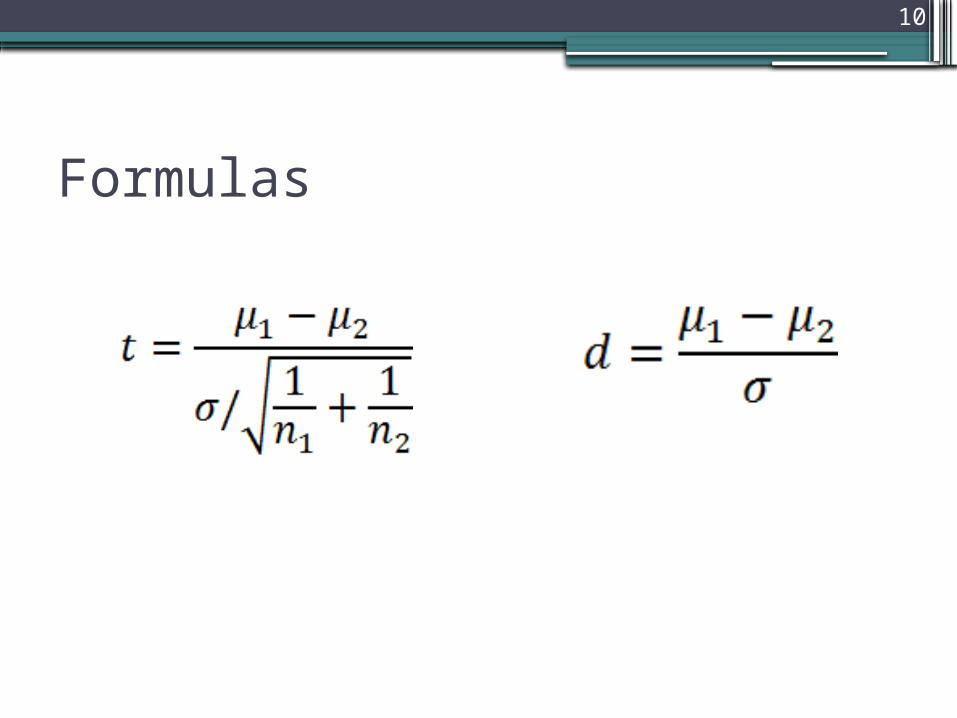
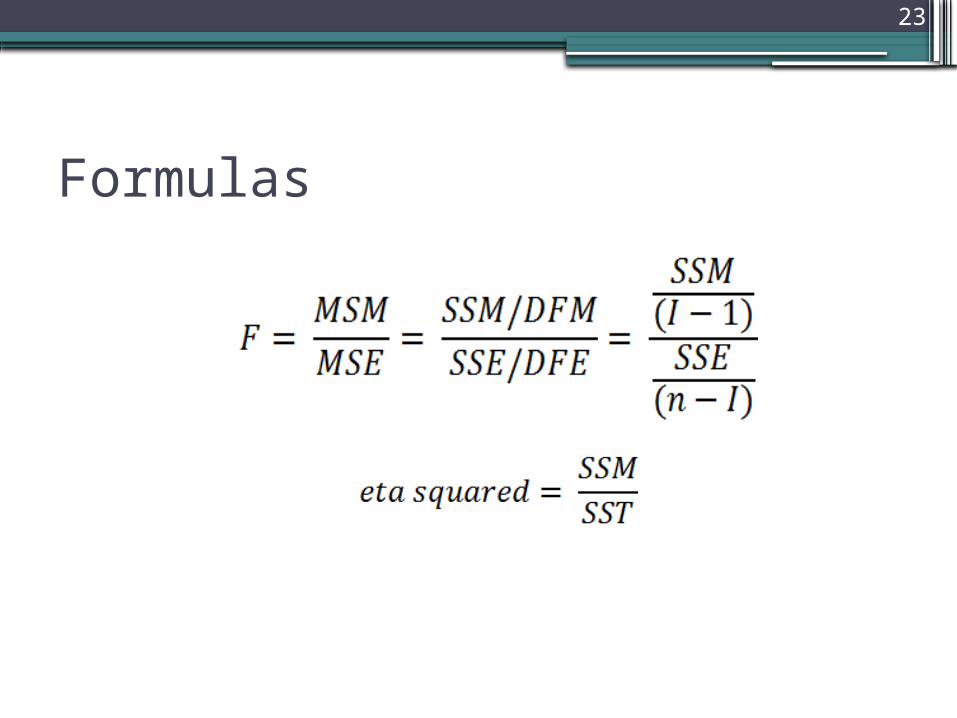
Explaining differencesSignificant difference Practical difference
• Difference is determined by significance test▫ ANOVA, t-test, etc…
• Answers the question “are they different”
• Degrees of freedom included in equation
• Different tests that accompany significance tests▫ Cohen’s d, eta squared,
etc…• Looks at how different
values are▫ Small, medium, or large
• Answers the question “Does the difference matter”
• Degrees of freedom not included in equation
10
Formulas
11
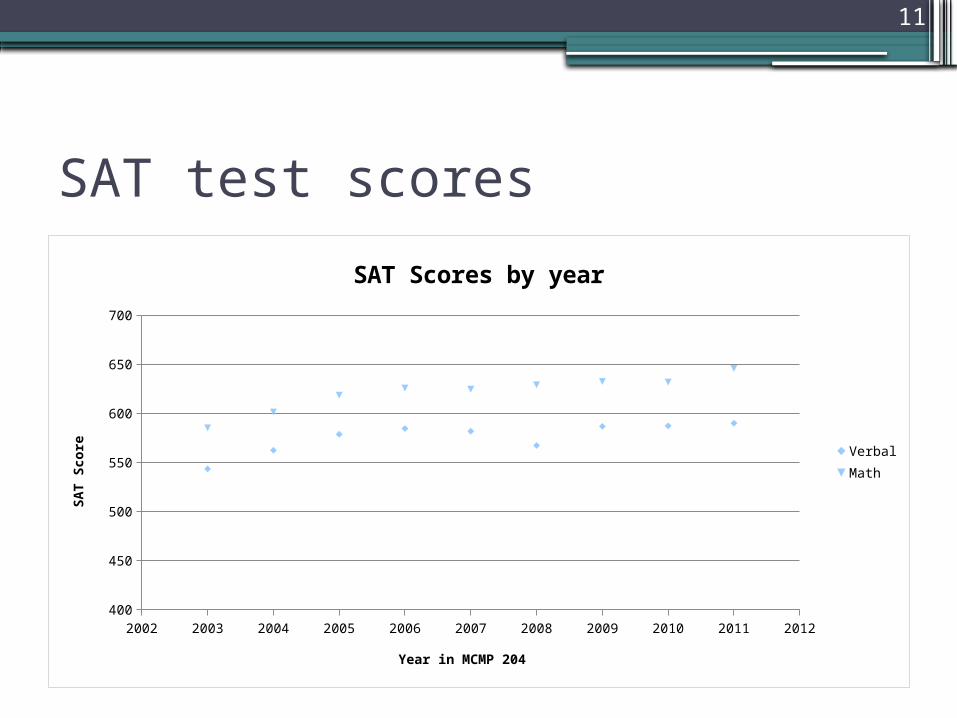
SAT test scores
2002 2003 2004 2005 2006 2007 2008 2009 2010 2011 2012400
450
500
550
600
650
700
SAT Scores by year
VerbalMath
Year in MCMP 204
SA
T S
core
12
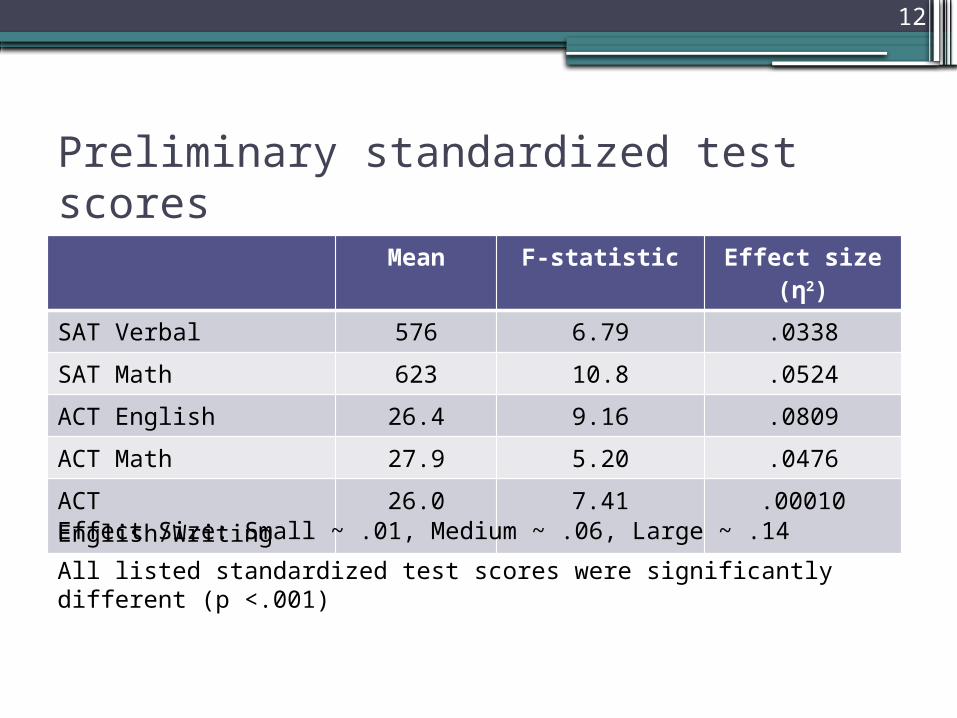
Preliminary standardized test scores
Mean F-statistic Effect size (η2)
SAT Verbal 576 6.79 .0338
SAT Math 623 10.8 .0524
ACT English 26.4 9.16 .0809
ACT Math 27.9 5.20 .0476
ACT English/Writing 26.0 7.41 .00010
Effect Size: Small ~ .01, Medium ~ .06, Large ~ .14
All listed standardized test scores were significantly different (p <.001)
13
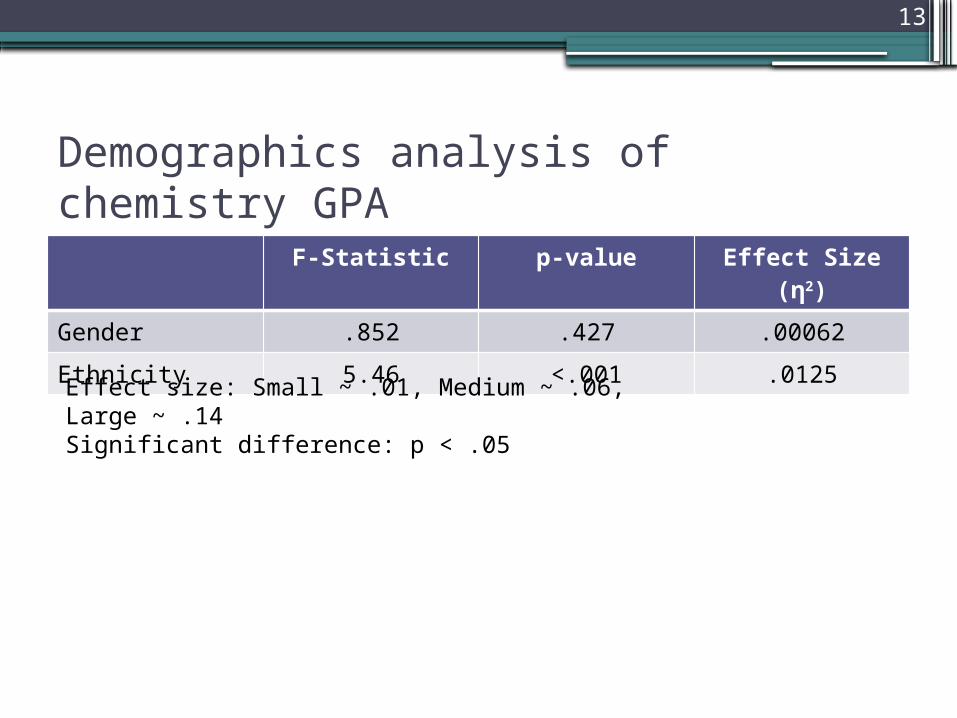
Demographics analysis of chemistry GPA
F-Statistic p-value Effect Size (η2)
Gender .852 .427 .00062
Ethnicity 5.46 <.001 .0125Effect size: Small ~ .01, Medium ~ .06, Large ~ .14Significant difference: p < .05
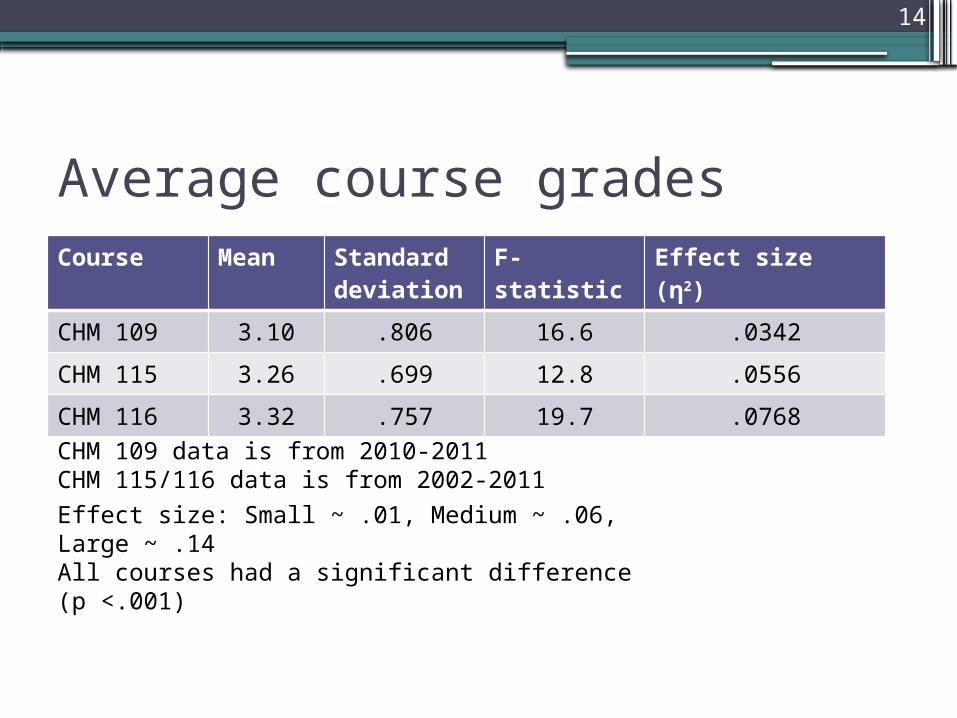
14
Average course gradesCourse Mean Standard
deviationF-statistic Effect size (η2)
CHM 109 3.10 .806 16.6 .0342
CHM 115 3.26 .699 12.8 .0556
CHM 116 3.32 .757 19.7 .0768
CHM 109 data is from 2010-2011CHM 115/116 data is from 2002-2011
Effect size: Small ~ .01, Medium ~ .06, Large ~ .14All courses had a significant difference (p <.001)
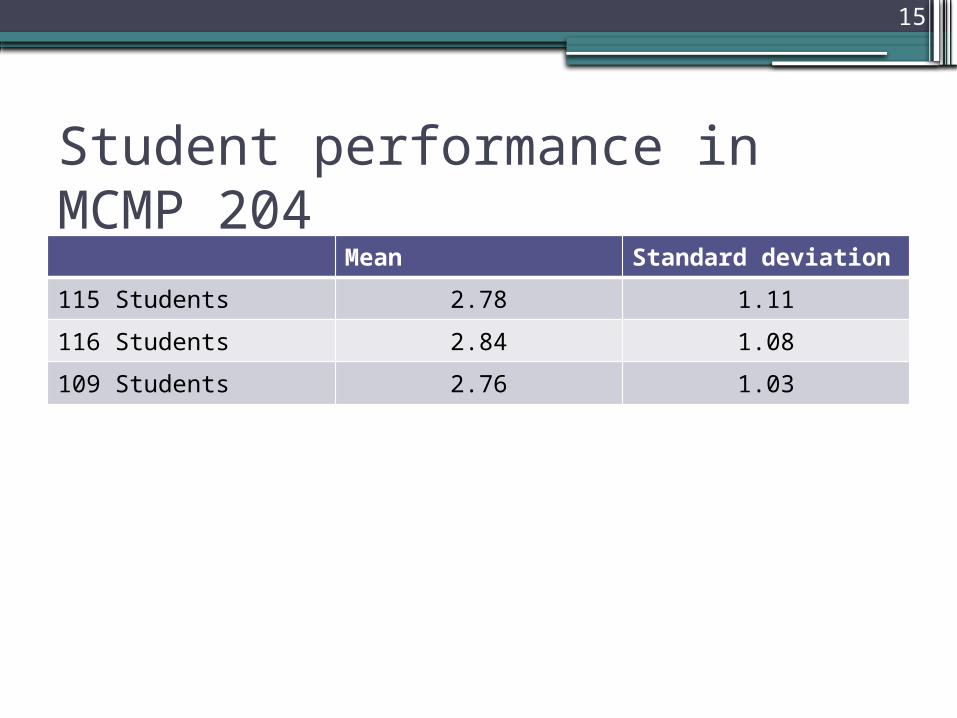
15
Student performance in MCMP 204
Mean Standard deviation
115 Students 2.78 1.11
116 Students 2.84 1.08
109 Students 2.76 1.03
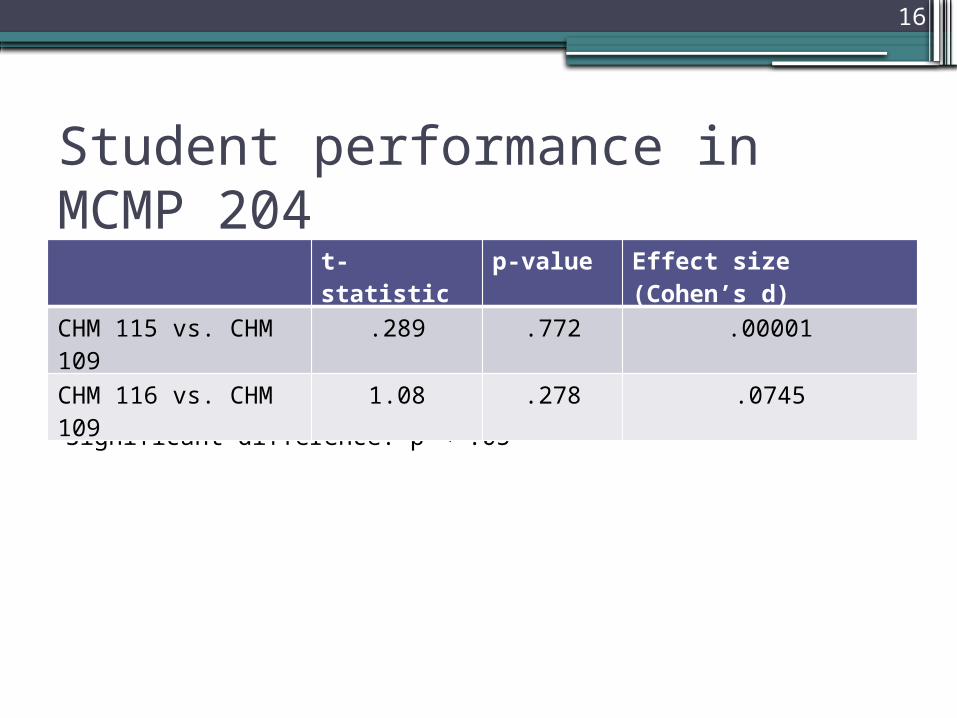
16
Student performance in MCMP 204
Effect size: Small = .1, Medium = .25, Large = .4Significant difference: p < .05
t-statistic p-value Effect size (Cohen’s d)
CHM 115 vs. CHM 109
.289 .772 .00001
CHM 116 vs. CHM 109
1.08 .278 .0745
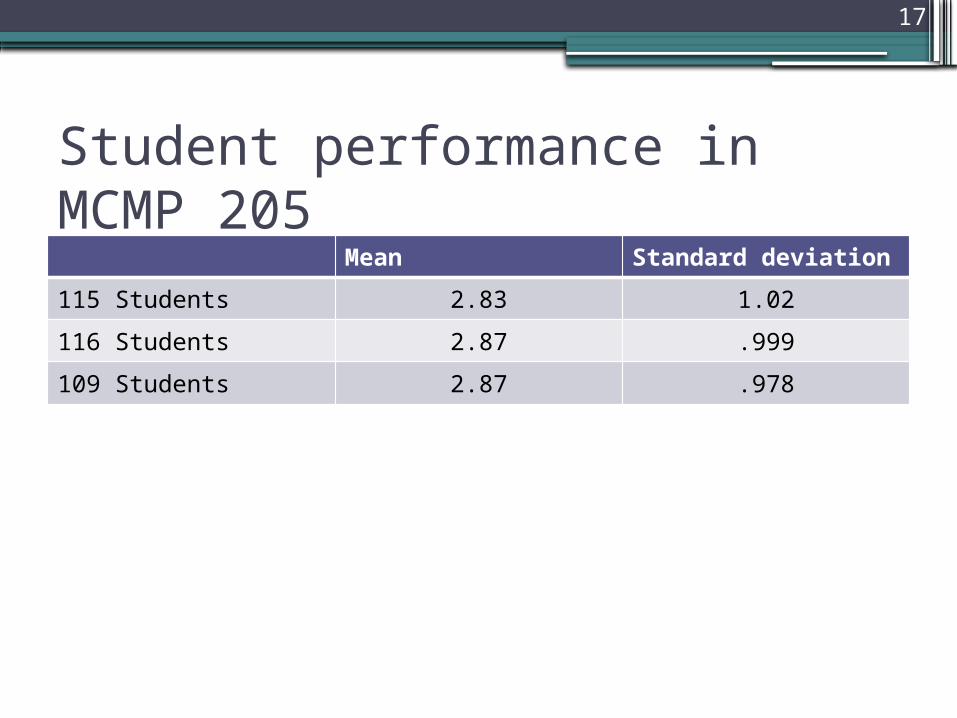
17
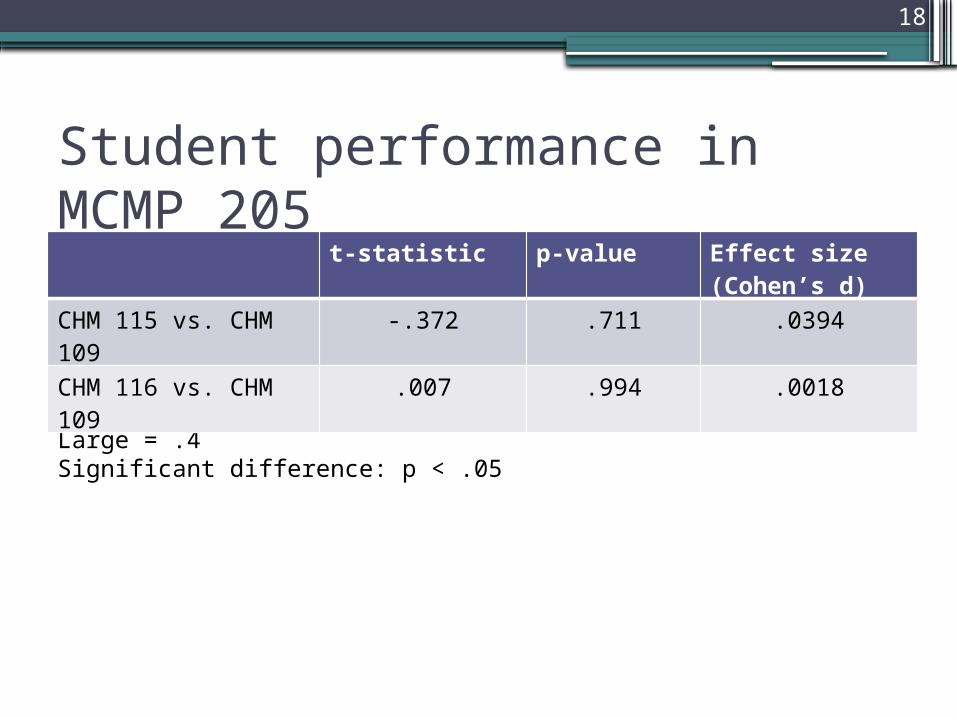
Student performance in MCMP 205
Mean Standard deviation
115 Students 2.83 1.02
116 Students 2.87 .999
109 Students 2.87 .978
18
Student performance in MCMP 205
Effect size: Small = .1, Medium = .25, Large = .4Significant difference: p < .05
t-statistic p-value Effect size (Cohen’s d)
CHM 115 vs. CHM 109
-.372 .711 .0394
CHM 116 vs. CHM 109
.007 .994 .0018
19
Conclusion
•Analysis demonstrates no significant or practical differences exist in performance in MCMP 204/205 based upon general chemistry preparation in CHM 109 and CHM 115/116.
•Thus, the new course sequence (one semester general chemistry) supports student success in Purdue’s pre-pharmacy curriculum.
20
Implications
•Demonstrates efficacy of one semester gen chemistry course in pre-medical and pre-pharmacy curriculum
•Research finding provide research based support for curriculum augmentation

21
Acknowledgements
•HHMI Nexus team at Purdue▫Dr. Marc Loudon▫Dr. Chris Hrycyna
•Research and assessment grant 2011•Towns research group
▫Dr. Marcy Towns
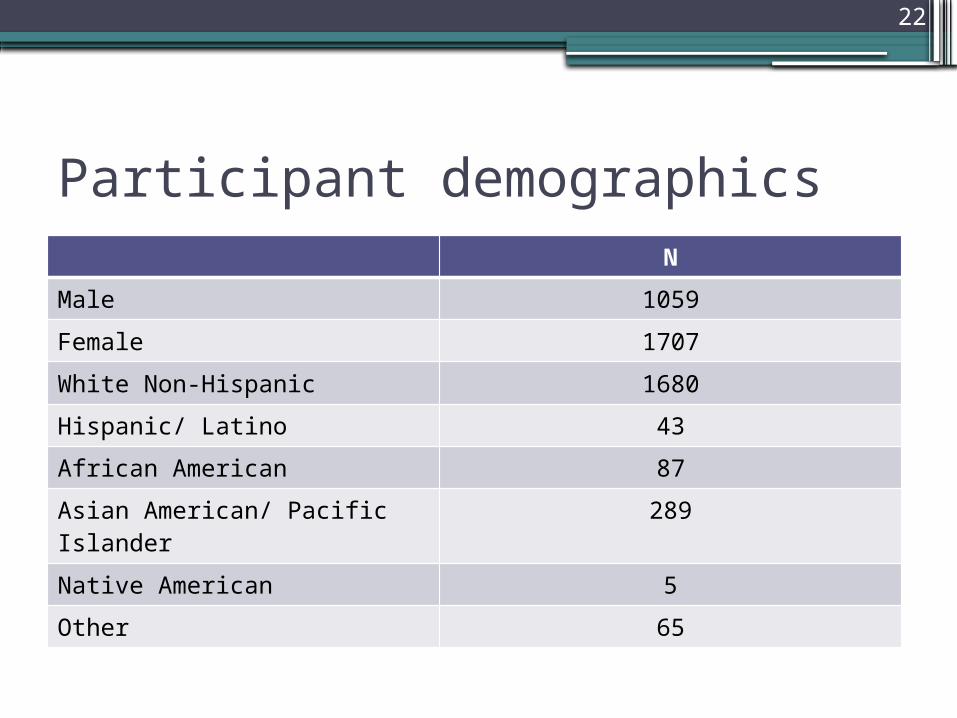
22
Participant demographicsN
Male 1059
Female 1707
White Non-Hispanic 1680
Hispanic/ Latino 43
African American 87
Asian American/ Pacific Islander
289
Native American 5
Other 65
23
Formulas
24
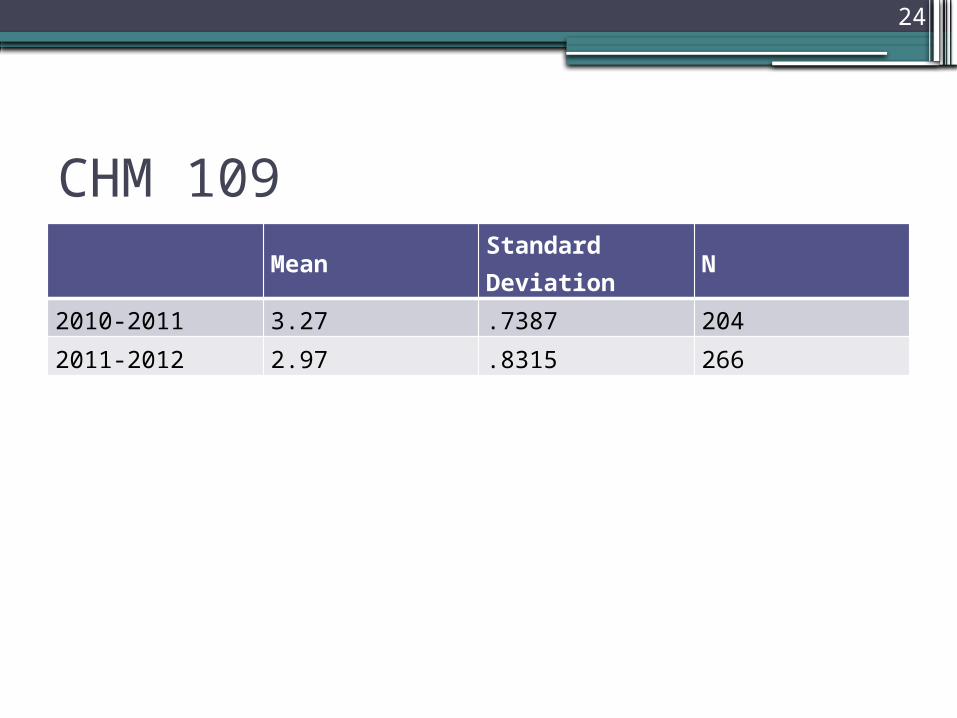
CHM 109Mean Standard Deviation N
2010-2011 3.27 .7387 204
2011-2012 2.97 .8315 266
25
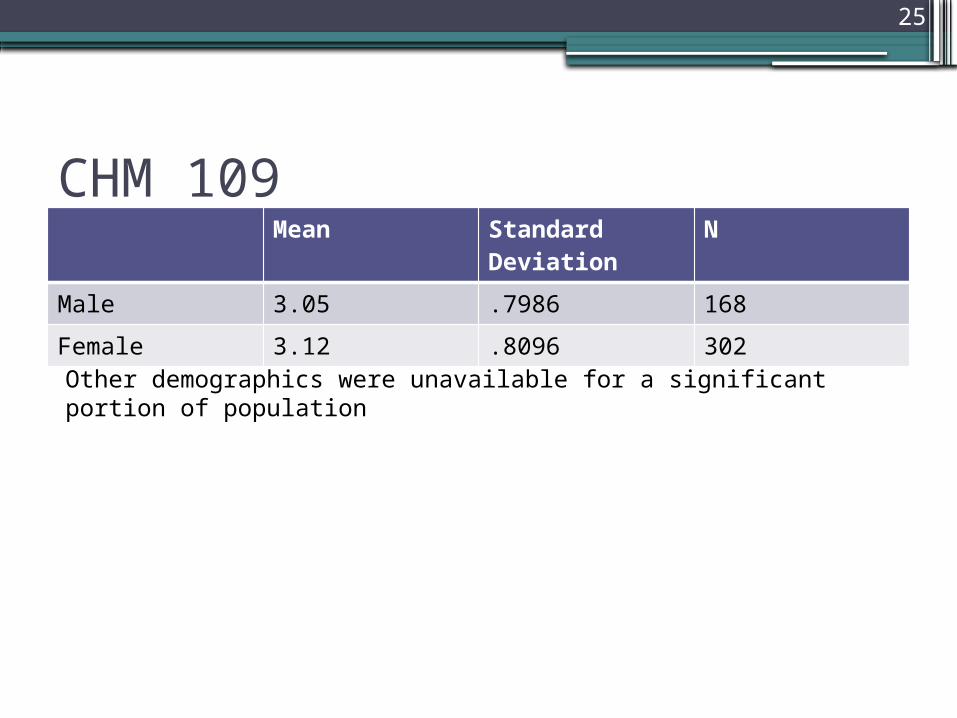
CHM 109Mean Standard
DeviationN
Male 3.05 .7986 168
Female 3.12 .8096 302
Other demographics were unavailable for a significant portion of population
26
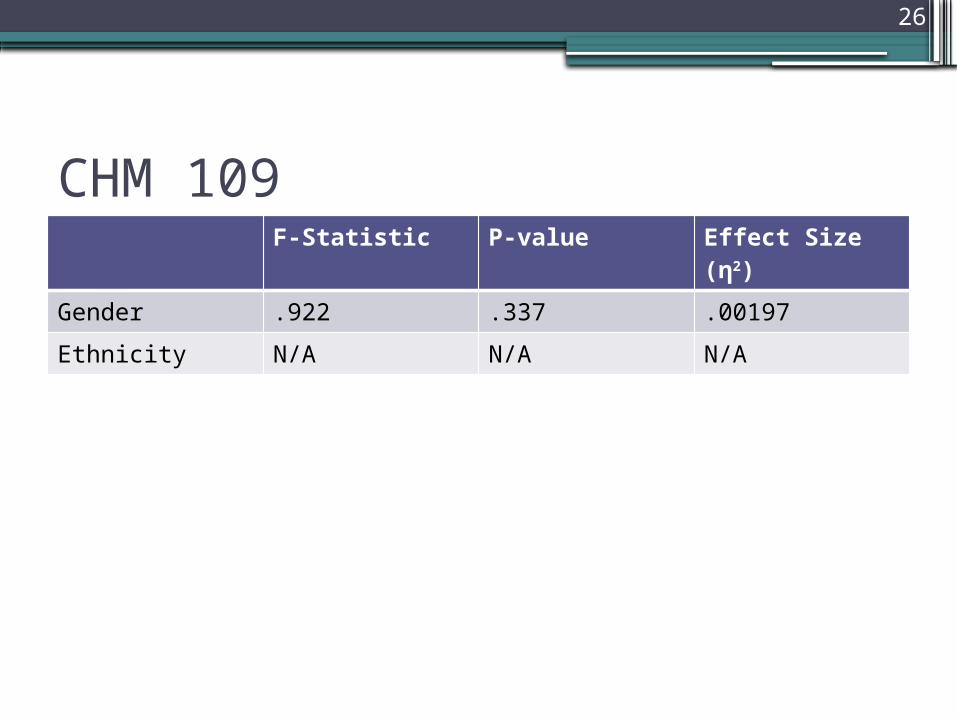
CHM 109F-Statistic P-value Effect Size
(η2)
Gender .922 .337 .00197
Ethnicity N/A N/A N/A
27
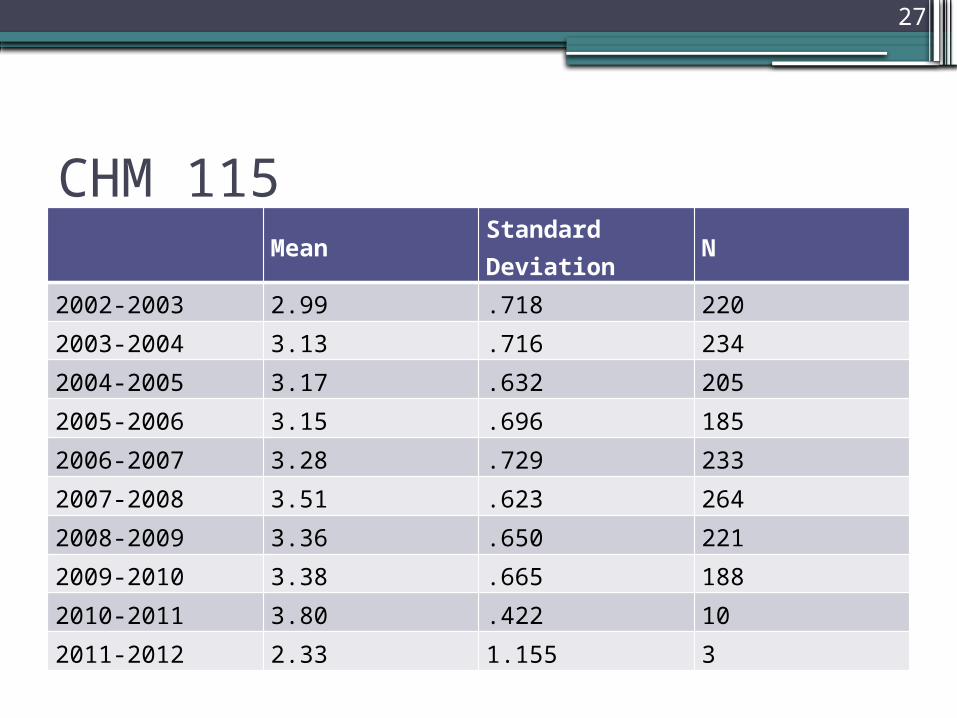
CHM 115Mean Standard Deviation N
2002-2003 2.99 .718 220
2003-2004 3.13 .716 234
2004-2005 3.17 .632 205
2005-2006 3.15 .696 185
2006-2007 3.28 .729 233
2007-2008 3.51 .623 264
2008-2009 3.36 .650 221
2009-2010 3.38 .665 188
2010-2011 3.80 .422 10
2011-2012 2.33 1.155 3
28
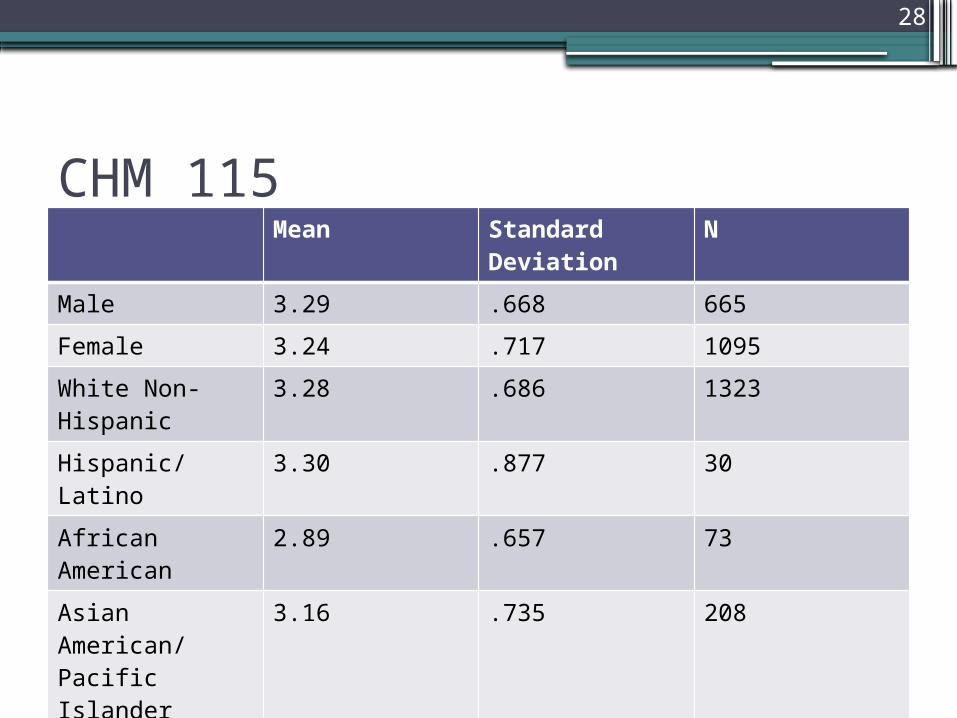
CHM 115Mean Standard
DeviationN
Male 3.29 .668 665
Female 3.24 .717 1095
White Non-Hispanic
3.28 .686 1323
Hispanic/ Latino
3.30 .877 30
African American
2.89 .657 73
Asian American/ Pacific Islander
3.16 .735 208
Other 3.50 6.79 40
29
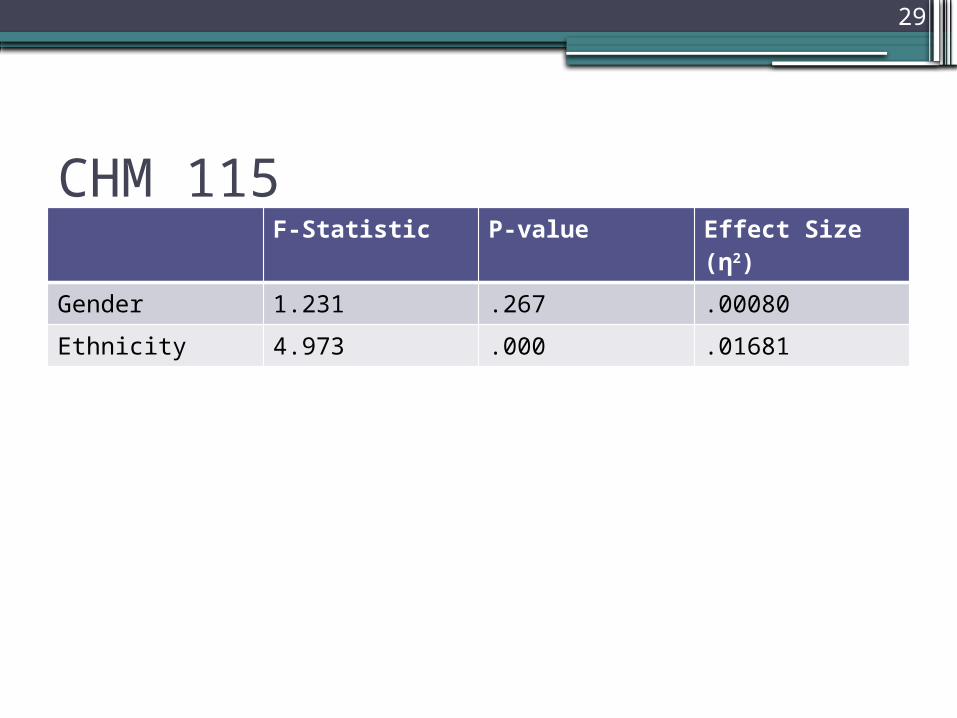
CHM 115F-Statistic P-value Effect Size
(η2)
Gender 1.231 .267 .00080
Ethnicity 4.973 .000 .01681
30
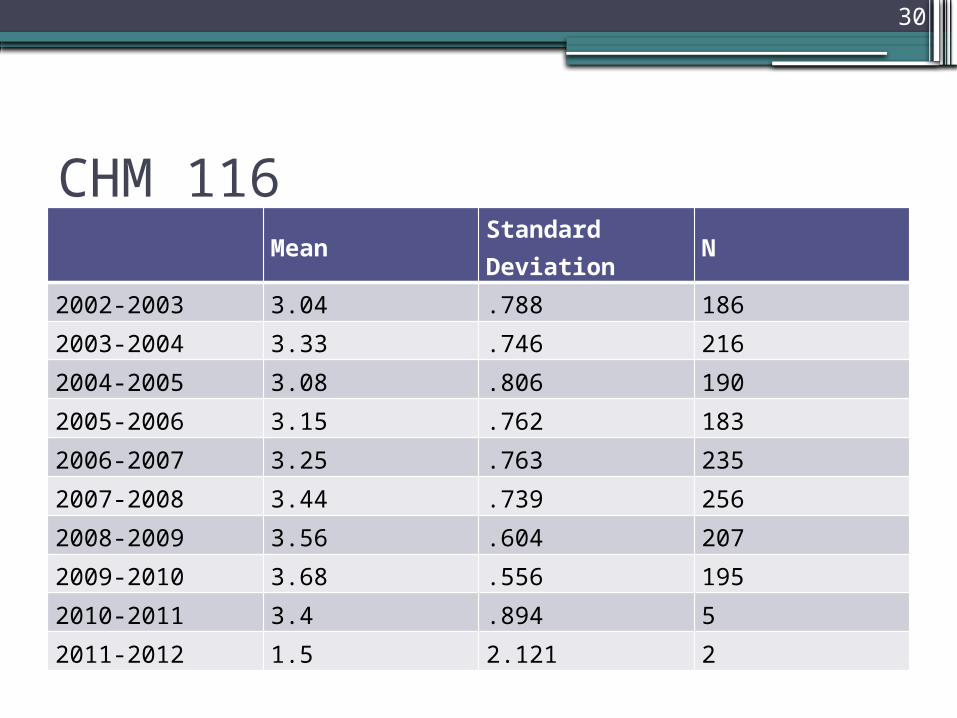
CHM 116Mean Standard Deviation N
2002-2003 3.04 .788 186
2003-2004 3.33 .746 216
2004-2005 3.08 .806 190
2005-2006 3.15 .762 183
2006-2007 3.25 .763 235
2007-2008 3.44 .739 256
2008-2009 3.56 .604 207
2009-2010 3.68 .556 195
2010-2011 3.4 .894 5
2011-2012 1.5 2.121 2
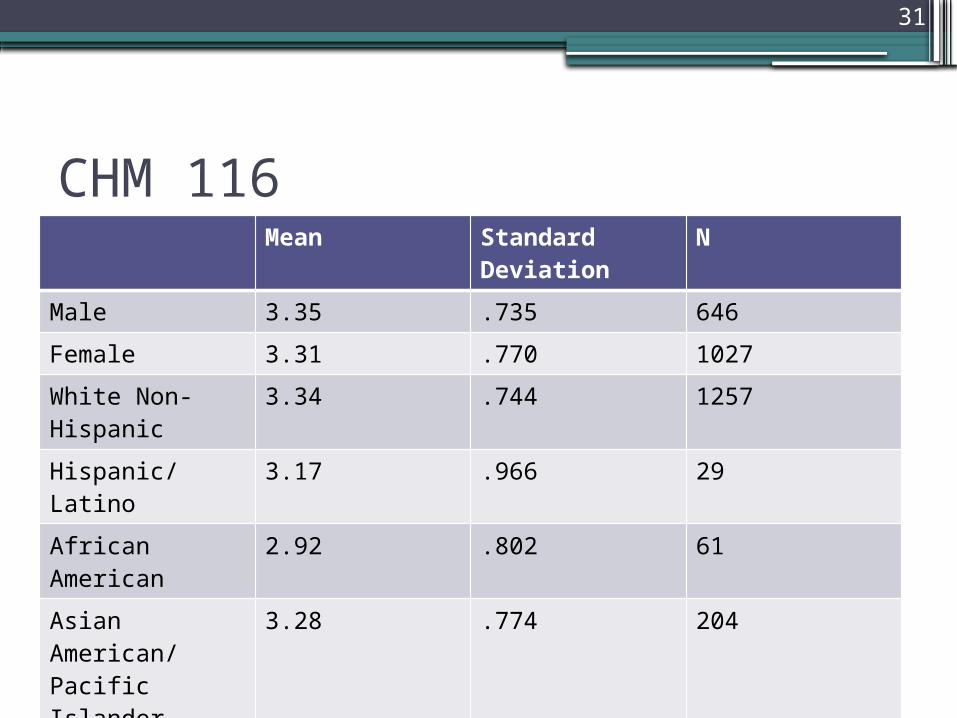
31
CHM 116Mean Standard
DeviationN
Male 3.35 .735 646
Female 3.31 .770 1027
White Non-Hispanic
3.34 .744 1257
Hispanic/ Latino
3.17 .966 29
African American
2.92 .802 61
Asian American/ Pacific Islander
3.28 .774 204
Other 3.53 .726 45

32
CHM 116F-Statistic P-value Effect Size
(η2)
Gender 1.036 .309 .00065
Ethnicity 5.734 .000 .01421
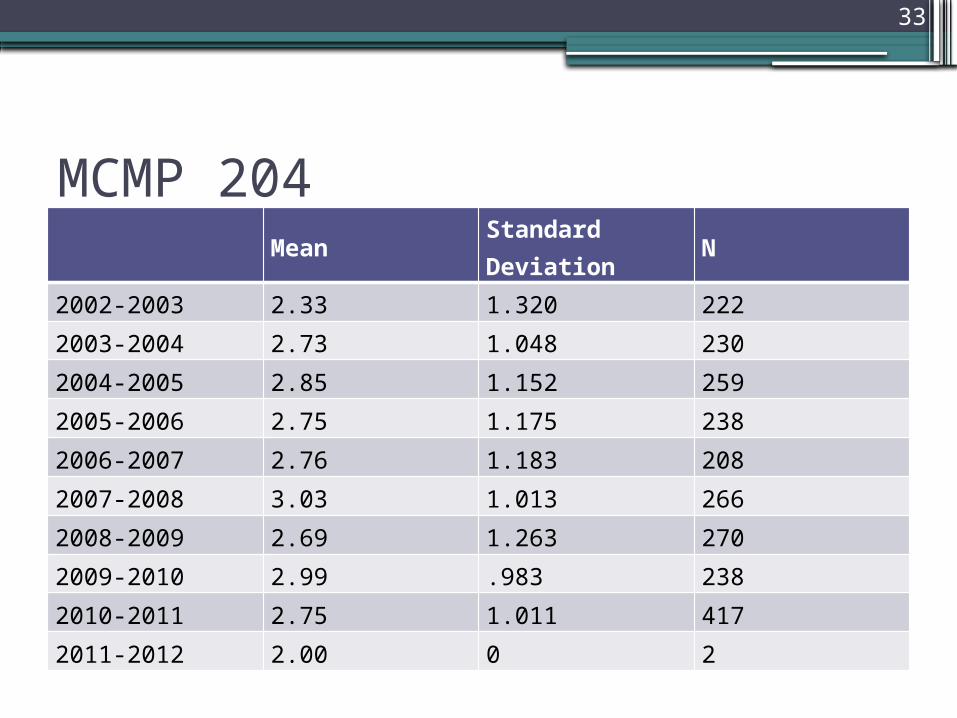
33
MCMP 204Mean Standard Deviation N
2002-2003 2.33 1.320 222
2003-2004 2.73 1.048 230
2004-2005 2.85 1.152 259
2005-2006 2.75 1.175 238
2006-2007 2.76 1.183 208
2007-2008 3.03 1.013 266
2008-2009 2.69 1.263 270
2009-2010 2.99 .983 238
2010-2011 2.75 1.011 417
2011-2012 2.00 0 2
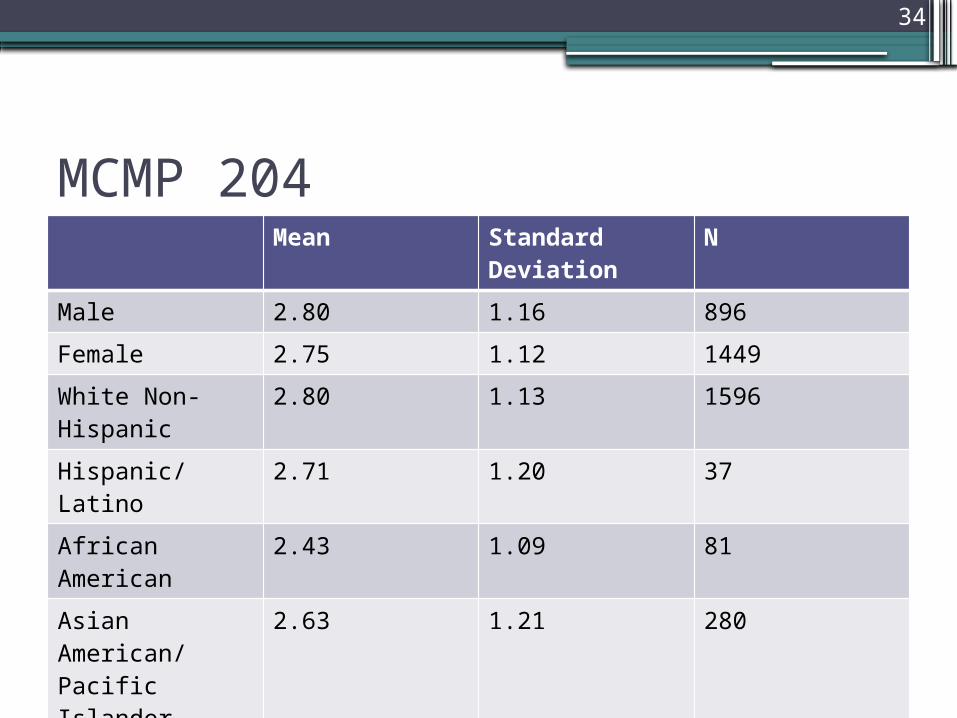
34
MCMP 204Mean Standard
DeviationN
Male 2.80 1.16 896
Female 2.75 1.12 1449
White Non-Hispanic
2.80 1.13 1596
Hispanic/ Latino
2.71 1.20 37
African American
2.43 1.09 81
Asian American/ Pacific Islander
2.63 1.21 280
Other 3.05 1.18 61

35
MCMP 204F-Statistic P-value Effect Size
(η2)
Gender 1.749 .186 .00085
Ethnicity 4.141 .002 .0080
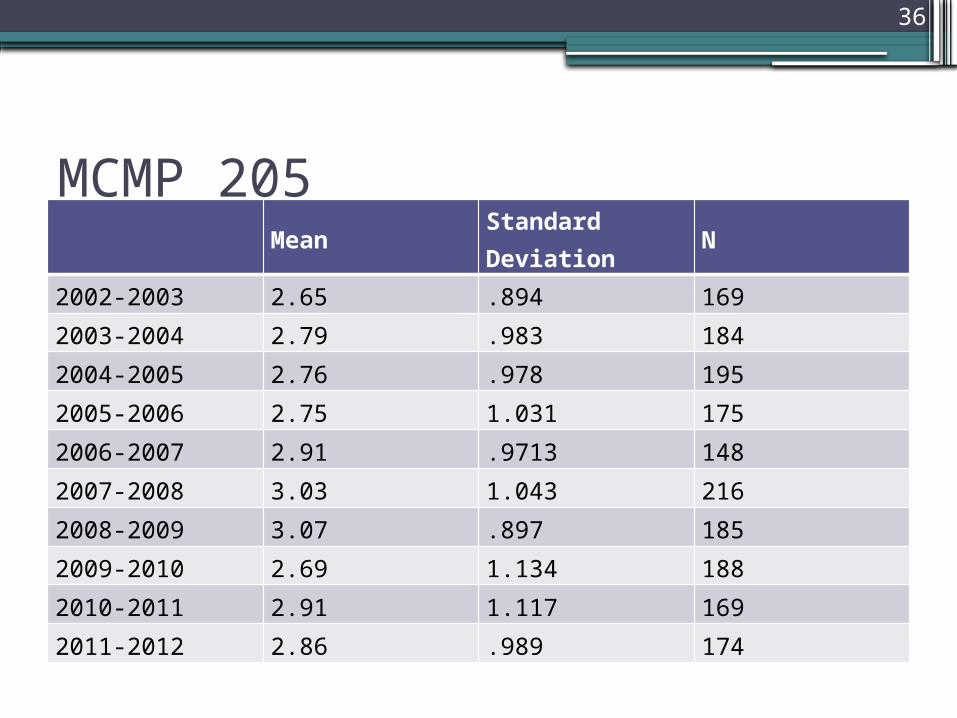
36
MCMP 205Mean Standard Deviation N
2002-2003 2.65 .894 169
2003-2004 2.79 .983 184
2004-2005 2.76 .978 195
2005-2006 2.75 1.031 175
2006-2007 2.91 .9713 148
2007-2008 3.03 1.043 216
2008-2009 3.07 .897 185
2009-2010 2.69 1.134 188
2010-2011 2.91 1.117 169
2011-2012 2.86 .989 174
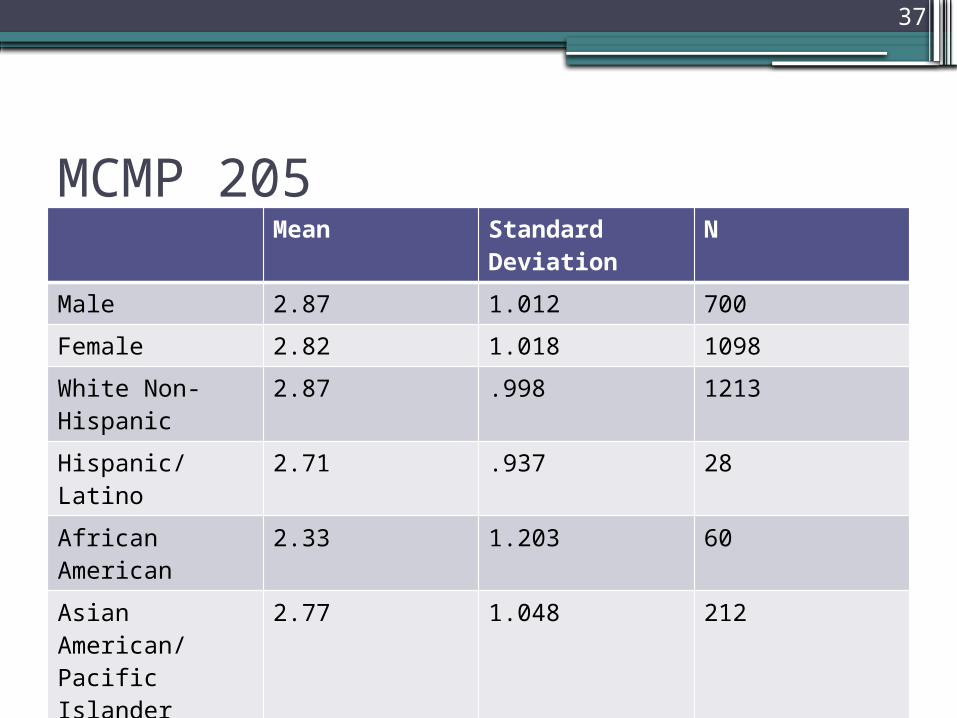
37
MCMP 205Mean Standard
DeviationN
Male 2.87 1.012 700
Female 2.82 1.018 1098
White Non-Hispanic
2.87 .998 1213
Hispanic/ Latino
2.71 .937 28
African American
2.33 1.203 60
Asian American/ Pacific Islander
2.77 1.048 212
Other 3.14 .833 50
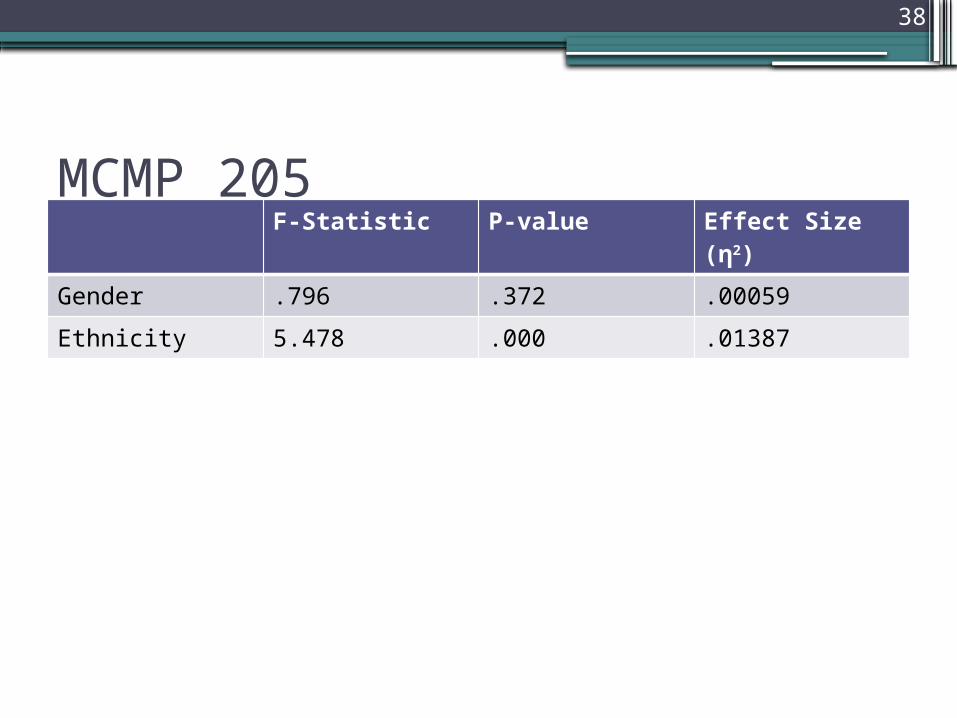
38
MCMP 205F-Statistic P-value Effect Size
(η2)
Gender .796 .372 .00059
Ethnicity 5.478 .000 .01387