Embed Size (px)
Citation preview
J Pharm Pharmaceut Sci (www.ualberta.ca/~csps) 5(2):190-198, 2002
Statistical analysis of tablet breakability methods
Lieven Van Vooren, Bart De SpiegeleerHealth Engineering and Assurance (HEA), Gent, Belgium
Thomas Thonissen, Philippe Joye, Joost Van Durme, Guido SlegersFaculty of Pharmaceutical Sciences, Ghent University (RUG), Gent, Belgium
Received 4 February, 2002, Revised 18 June 2002, Accepted 24 June 2002
Abstract Purpose: Using a model tablet, the influence ofbreakability methodology on mass uniformity of half- andquarter-tablets as well as the comparison of different dataacquisition and evaluation approaches were investigated.Moreover, different breakability evaluation criteria werecompared based upon distribution as well as distribution-free models. Methods: A cross-scored tablet, i.e. havingtwo break-marks, was broken by different methods by dif-ferent persons, and the masses determined for the whole(unbroken) tablets, the half-tablets and quarter-tablets.Results: Beside the possible interaction between themethodology and the person breaking the tablets, themajor factor significantly influencing the mass uniformityof broken tablets is the breakability methodology. The bestresults, i.e. smallest loss and smallest variability, areobtained when the breaking force applied by the thumbs isdirected towards the score side of the tablet, i.e. by "open-ing" the score. Using our model tablet, significant differ-ences between the different evaluation criteria areobserved, with the USP/NF approach being best in linewith the detailed analysis of all broken tablets. Conclu-sions: Assuming that for this model tablet the variance is alinear function of the break-line length, the standard devia-tion of quarter-tablets is theoretically calculated to be 0.87times the standard deviation of the half-tablets. As theabsolute standard deviation, expressed in mass units, willthus remain approximately identical, the relative standarddeviation will nearly double as the mean mass of the quar-ter-tablets will be half of the mean mass of the half-tablets.This was experimentally confirmed.
INTRODUCTION
Tablets with single or multiple score lines allow the admin-istration of a proportion of the tablet. In general, pharma-
copoeial mass or weight uniformity compliance criteria (1-2) do not consider the specific broken-tablet situation, andconsequently the general unit-dose criteria are generallybelieved to be applicable to half-tablets and quarter-tabletsas well. Only recently, there is the explicit addition that thesubdivided parts of a tablet should indeed also complywith the content or mass uniformity requirements (3).
In the literature, a number of alternative criteria (4-7) havebeen proposed, generally allowing mass variations of bro-ken tablets to be higher than intact tablets. Only littleinformation in the literature is available describing standar-dised breakability test methods (6). The use of quarter-tab-lets is hardly investigated because it is expected that theirvariability is significantly higher than that of half-tablets(4, 7). A recent overview article summarises the scarce lit-erature data available (8).
The aim of this study is to investigate the influence ofbreakability methodology on mass uniformity of half- andquarter tablets, as well as to compare different data acquisi-tions and evaluation approaches, using a discriminativemodel tablet.
MATERIALS AND METHODS
Drug dosage form tested
The tablets applied for this study are cross-scored on oneside, weighing 400 mg and containing 22% m/m drug sub-stance. The tablets are intended for veterinary use in thetreatment of dogs. The large weight variety in the targetanimal species justifies the requirement of a cross-scoredtablet for the intended purpose.
The tablet is manufactured by wet granulation followed bycompression. The tablet consists of microcrystalline cellu-lose, sorbitol and dried yeast lysate as main excipients. Pre-liminary data showed that this tablet was suitable as adiscriminative model tablet relative to breakability.
Corresponding Author: Bart De Spiegeleer, Health Engineering andAssurance (HEA), Keizer Karelstraat 228, 9000 Gent, [email protected]
190
J Pharm Pharmaceut Sci (www.ualberta.ca/~csps) 5(2):190-198, 2002
The tablets are flat and round, with a diameter of 11 mmand a height of 3.7 mm. Both score lines (break-marks)applied in this cross-score have the following characteris-tics (9): W (width) = 0.88 mm, D (depth) = 0.42 mm, θ =45° and R (engraving cut radius) = 0.05 mm.
Breakability test methods
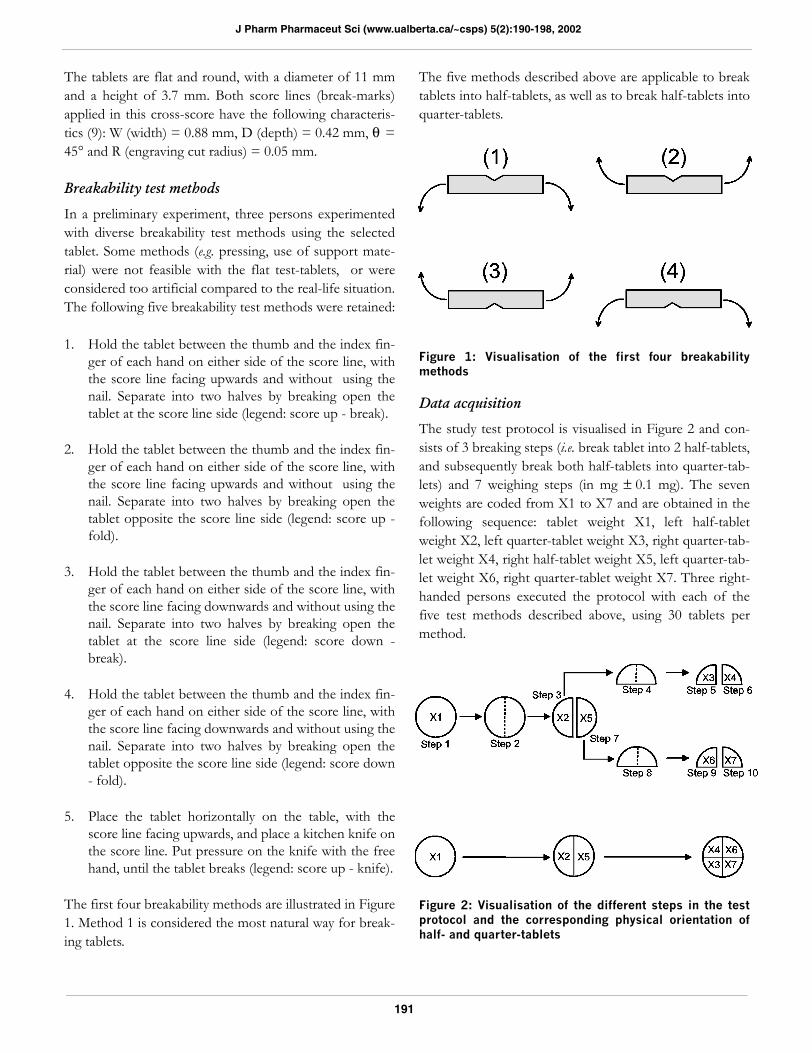
In a preliminary experiment, three persons experimentedwith diverse breakability test methods using the selectedtablet. Some methods (e.g. pressing, use of support mate-rial) were not feasible with the flat test-tablets, or wereconsidered too artificial compared to the real-life situation.The following five breakability test methods were retained:
1. Hold the tablet between the thumb and the index fin-ger of each hand on either side of the score line, withthe score line facing upwards and without using thenail. Separate into two halves by breaking open thetablet at the score line side (legend: score up - break).
2. Hold the tablet between the thumb and the index fin-ger of each hand on either side of the score line, withthe score line facing upwards and without using thenail. Separate into two halves by breaking open thetablet opposite the score line side (legend: score up -fold).
3. Hold the tablet between the thumb and the index fin-ger of each hand on either side of the score line, withthe score line facing downwards and without using thenail. Separate into two halves by breaking open thetablet at the score line side (legend: score down -break).
4. Hold the tablet between the thumb and the index fin-ger of each hand on either side of the score line, withthe score line facing downwards and without using thenail. Separate into two halves by breaking open thetablet opposite the score line side (legend: score down- fold).
5. Place the tablet horizontally on the table, with thescore line facing upwards, and place a kitchen knife onthe score line. Put pressure on the knife with the freehand, until the tablet breaks (legend: score up - knife).
The first four breakability methods are illustrated in Figure1. Method 1 is considered the most natural way for break-ing tablets.
The five methods described above are applicable to breaktablets into half-tablets, as well as to break half-tablets intoquarter-tablets.
Figure 1: Visualisation of the first four breakabilitymethods
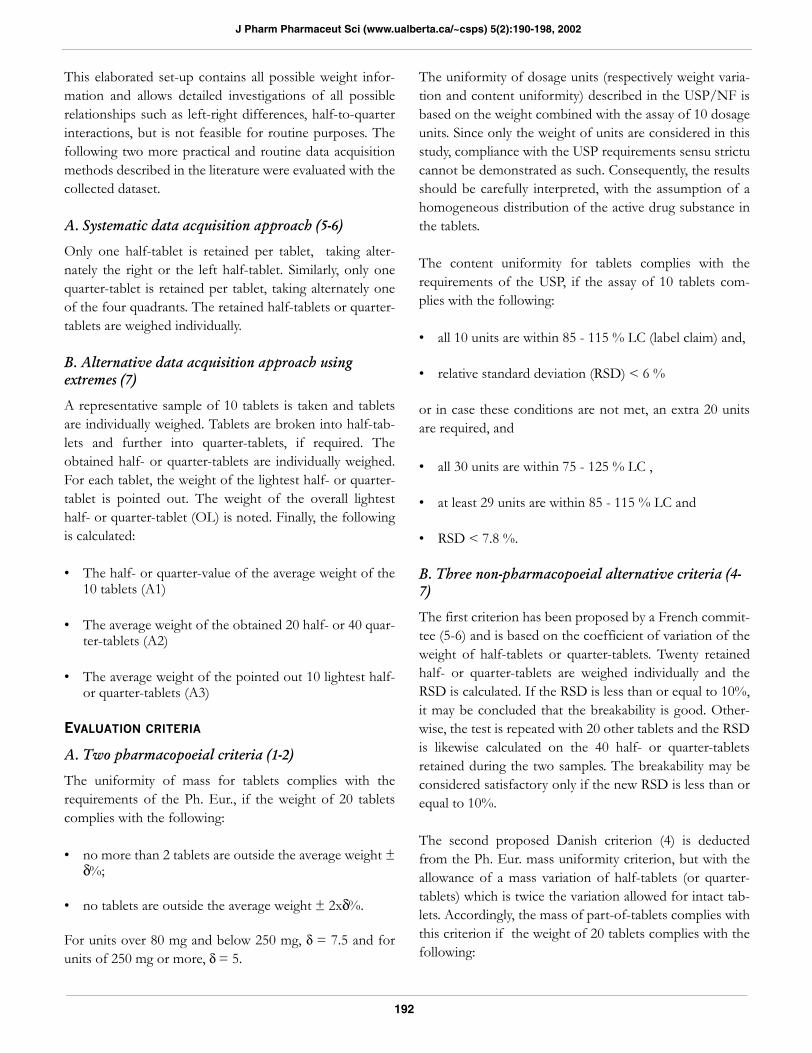
Data acquisition
The study test protocol is visualised in Figure 2 and con-sists of 3 breaking steps (i.e. break tablet into 2 half-tablets,and subsequently break both half-tablets into quarter-tab-lets) and 7 weighing steps (in mg ± 0.1 mg). The sevenweights are coded from X1 to X7 and are obtained in thefollowing sequence: tablet weight X1, left half-tabletweight X2, left quarter-tablet weight X3, right quarter-tab-let weight X4, right half-tablet weight X5, left quarter-tab-let weight X6, right quarter-tablet weight X7. Three right-handed persons executed the protocol with each of thefive test methods described above, using 30 tablets permethod.
Figure 2: Visualisation of the different steps in the testprotocol and the corresponding physical orientation ofhalf- and quarter-tablets
191
J Pharm Pharmaceut Sci (www.ualberta.ca/~csps) 5(2):190-198, 2002
This elaborated set-up contains all possible weight infor-mation and allows detailed investigations of all possiblerelationships such as left-right differences, half-to-quarterinteractions, but is not feasible for routine purposes. Thefollowing two more practical and routine data acquisitionmethods described in the literature were evaluated with thecollected dataset.
A. Systematic data acquisition approach (5-6)
Only one half-tablet is retained per tablet, taking alter-nately the right or the left half-tablet. Similarly, only onequarter-tablet is retained per tablet, taking alternately oneof the four quadrants. The retained half-tablets or quarter-tablets are weighed individually.
B. Alternative data acquisition approach using extremes (7)
A representative sample of 10 tablets is taken and tabletsare individually weighed. Tablets are broken into half-tab-lets and further into quarter-tablets, if required. Theobtained half- or quarter-tablets are individually weighed.For each tablet, the weight of the lightest half- or quarter-tablet is pointed out. The weight of the overall lightesthalf- or quarter-tablet (OL) is noted. Finally, the followingis calculated:
• The half- or quarter-value of the average weight of the10 tablets (A1)
• The average weight of the obtained 20 half- or 40 quar-ter-tablets (A2)
• The average weight of the pointed out 10 lightest half-or quarter-tablets (A3)
EVALUATION CRITERIA
A. Two pharmacopoeial criteria (1-2)
The uniformity of mass for tablets complies with therequirements of the Ph. Eur., if the weight of 20 tabletscomplies with the following:
• no more than 2 tablets are outside the average weight ±δ%;
• no tablets are outside the average weight ± 2xδ%.
For units over 80 mg and below 250 mg, δ = 7.5 and forunits of 250 mg or more, δ = 5.
The uniformity of dosage units (respectively weight varia-tion and content uniformity) described in the USP/NF isbased on the weight combined with the assay of 10 dosageunits. Since only the weight of units are considered in thisstudy, compliance with the USP requirements sensu strictucannot be demonstrated as such. Consequently, the resultsshould be carefully interpreted, with the assumption of ahomogeneous distribution of the active drug substance inthe tablets.
The content uniformity for tablets complies with therequirements of the USP, if the assay of 10 tablets com-plies with the following:
• all 10 units are within 85 - 115 % LC (label claim) and,
• relative standard deviation (RSD) < 6 %
or in case these conditions are not met, an extra 20 unitsare required, and
• all 30 units are within 75 - 125 % LC ,
• at least 29 units are within 85 - 115 % LC and
• RSD < 7.8 %.
B. Three non-pharmacopoeial alternative criteria (4-7)
The first criterion has been proposed by a French commit-tee (5-6) and is based on the coefficient of variation of theweight of half-tablets or quarter-tablets. Twenty retainedhalf- or quarter-tablets are weighed individually and theRSD is calculated. If the RSD is less than or equal to 10%,it may be concluded that the breakability is good. Other-wise, the test is repeated with 20 other tablets and the RSDis likewise calculated on the 40 half- or quarter-tabletsretained during the two samples. The breakability may beconsidered satisfactory only if the new RSD is less than orequal to 10%.
The second proposed Danish criterion (4) is deductedfrom the Ph. Eur. mass uniformity criterion, but with theallowance of a mass variation of half-tablets (or quarter-tablets) which is twice the variation allowed for intact tab-lets. Accordingly, the mass of part-of-tablets complies withthis criterion if the weight of 20 tablets complies with thefollowing:
192
J Pharm Pharmaceut Sci (www.ualberta.ca/~csps) 5(2):190-198, 2002
• no more than 2 units are outside the average weight ±δ%;
• no tablets are outside the average weight ± 2xδ%.
For units over 80 mg and below 250 mg, δ = 15 and forunits of 250 mg or more, δ = 10.
The third criterion for acceptance of secability (7) is met, ifthe following conditions are fulfilled using 10 tablets (see'alternative data acquisition approach using extremes' inthe previous section):
• 0.97 x A1 < A2 < 1.03 x A1
• A3 > 0.85 x A2
• OL > 0.80 x A2
If one unit is outside the third condition, but above 0.75 xA2, the test is repeated on 20 additional tablets. Therequirements are met if no more than one unit of the 30lowest units is below 0.80 x A2 and above 0.75 x A2.
Data analysis
Excel® was used for the data preparation and data pro-cessing. Statistical analyses were performed with SPSS®9.0. Data exploration was performed with box-and-whis-ker plots, in which the box percentile limits are respectively25% and 75%. Outlier values (symbol ° ) and extreme val-ues (symbol *) are defined respectively as deviating morethan 1.5 and 3 times the box length starting from the boxboundaries. The lower and upper whiskers are defined asrespectively the lowest and highest non-outlier values.Mixed model ANOVA analyses were obtained with theGeneral Linear Model (GLM) procedure in SPSS® 9.0.For all statistical tests, a critical significance level α = 0.05was chosen.
RESULTS
Analysis of breaking losses
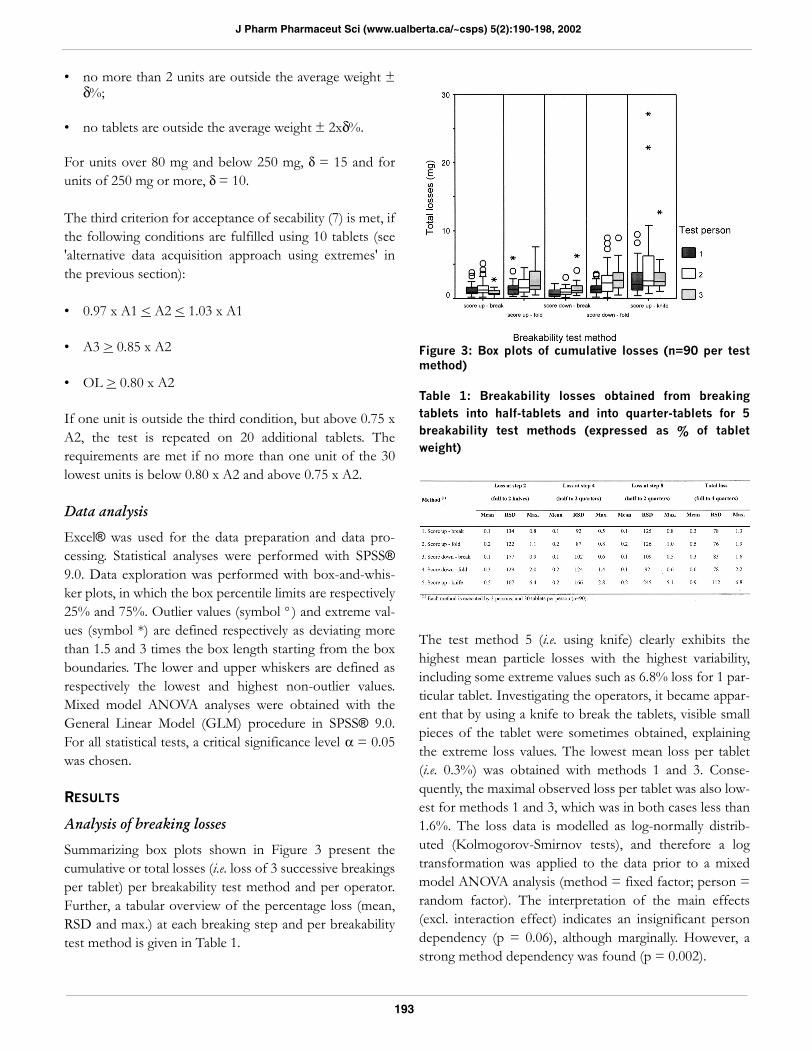
Summarizing box plots shown in Figure 3 present thecumulative or total losses (i.e. loss of 3 successive breakingsper tablet) per breakability test method and per operator.Further, a tabular overview of the percentage loss (mean,RSD and max.) at each breaking step and per breakabilitytest method is given in Table 1.
Figure 3: Box plots of cumulative losses (n=90 per testmethod)
Table 1: Breakability losses obtained from breakingtablets into half-tablets and into quarter-tablets for 5breakability test methods (expressed as % of tabletweight)
The test method 5 (i.e. using knife) clearly exhibits thehighest mean particle losses with the highest variability,including some extreme values such as 6.8% loss for 1 par-ticular tablet. Investigating the operators, it became appar-ent that by using a knife to break the tablets, visible smallpieces of the tablet were sometimes obtained, explainingthe extreme loss values. The lowest mean loss per tablet(i.e. 0.3%) was obtained with methods 1 and 3. Conse-quently, the maximal observed loss per tablet was also low-est for methods 1 and 3, which was in both cases less than1.6%. The loss data is modelled as log-normally distrib-uted (Kolmogorov-Smirnov tests), and therefore a logtransformation was applied to the data prior to a mixedmodel ANOVA analysis (method = fixed factor; person =random factor). The interpretation of the main effects(excl. interaction effect) indicates an insignificant persondependency (p = 0.06), although marginally. However, astrong method dependency was found (p = 0.002).
193
J Pharm Pharmaceut Sci (www.ualberta.ca/~csps) 5(2):190-198, 2002
Multiple post-hoc comparison of mean total loss for the 5methods (Duncan test) resulted in the following threehomogeneous subsets, significantly different from eachother: 5; (4, 2); (1, 3).
Therefore, it is concluded that the visibility of the scoreline (score line up versus score line down) is not a criticalfactor to minimise losses, however, that the direction ofthe breaking forces towards the score (break open versusfold up) is the determining factor to minimise losses. Thescore should be "opened" to obtain the best result.
Half-tablets and quarter-tablets weight variability investigation
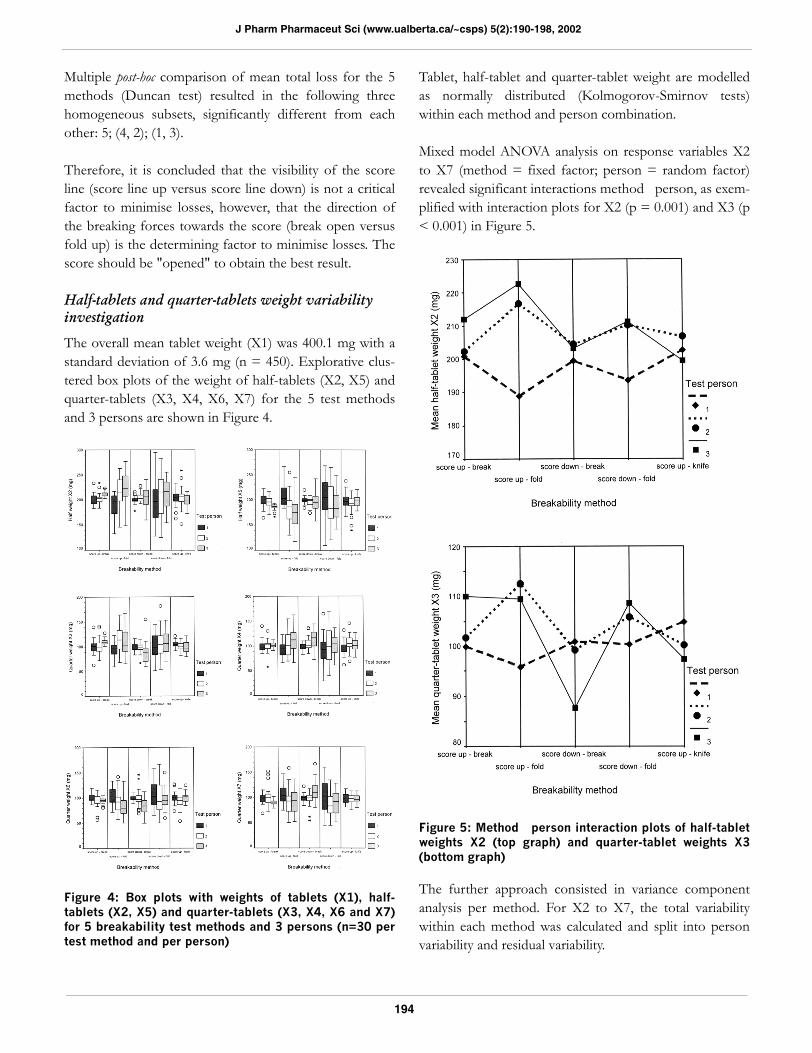
The overall mean tablet weight (X1) was 400.1 mg with astandard deviation of 3.6 mg (n = 450). Explorative clus-tered box plots of the weight of half-tablets (X2, X5) andquarter-tablets (X3, X4, X6, X7) for the 5 test methodsand 3 persons are shown in Figure 4.
Figure 4: Box plots with weights of tablets (X1), half-tablets (X2, X5) and quarter-tablets (X3, X4, X6 and X7)for 5 breakability test methods and 3 persons (n=30 pertest method and per person)
Tablet, half-tablet and quarter-tablet weight are modelledas normally distributed (Kolmogorov-Smirnov tests)within each method and person combination.
Mixed model ANOVA analysis on response variables X2to X7 (method = fixed factor; person = random factor)revealed significant interactions method person, as exem-plified with interaction plots for X2 (p = 0.001) and X3 (p< 0.001) in Figure 5.
Figure 5: Method person interaction plots of half-tabletweights X2 (top graph) and quarter-tablet weights X3(bottom graph)
The further approach consisted in variance componentanalysis per method. For X2 to X7, the total variabilitywithin each method was calculated and split into personvariability and residual variability.
194
J Pharm Pharmaceut Sci (www.ualberta.ca/~csps) 5(2):190-198, 2002
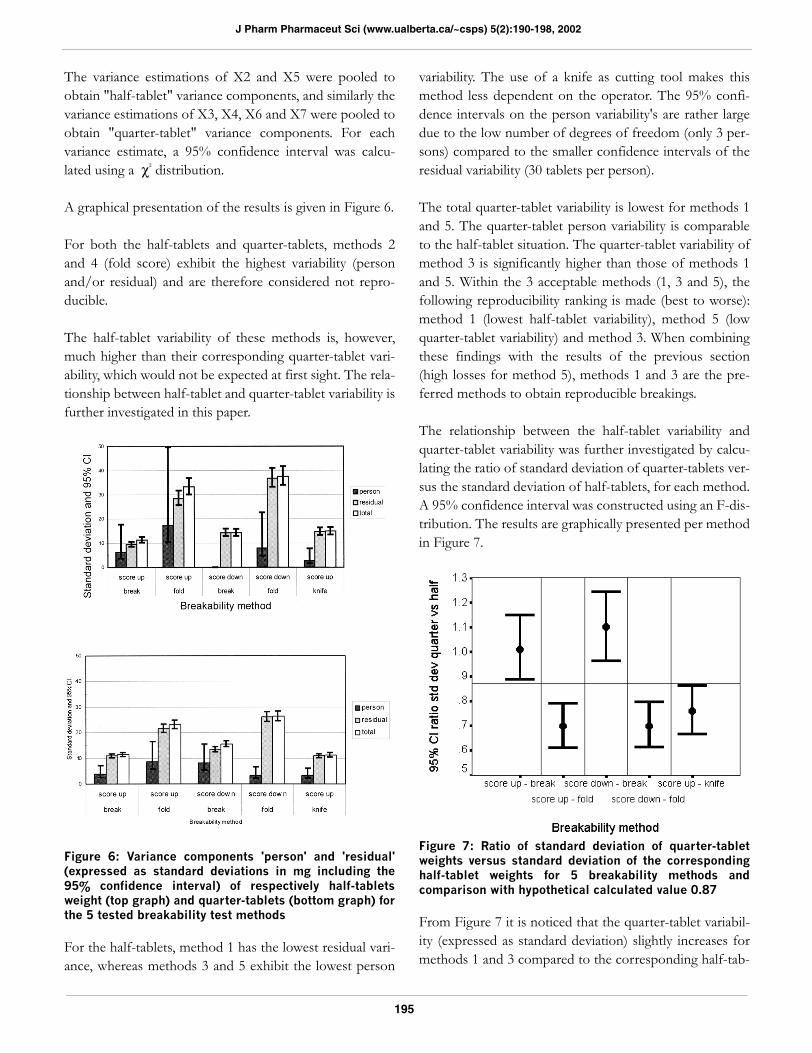
The variance estimations of X2 and X5 were pooled toobtain "half-tablet" variance components, and similarly thevariance estimations of X3, X4, X6 and X7 were pooled toobtain "quarter-tablet" variance components. For eachvariance estimate, a 95% confidence interval was calcu-lated using a χ² distribution.
A graphical presentation of the results is given in Figure 6.
For both the half-tablets and quarter-tablets, methods 2and 4 (fold score) exhibit the highest variability (personand/or residual) and are therefore considered not repro-ducible.
The half-tablet variability of these methods is, however,much higher than their corresponding quarter-tablet vari-ability, which would not be expected at first sight. The rela-tionship between half-tablet and quarter-tablet variability isfurther investigated in this paper.
Figure 6: Variance components 'person' and 'residual'(expressed as standard deviations in mg including the95% confidence interval) of respectively half-tabletsweight (top graph) and quarter-tablets (bottom graph) forthe 5 tested breakability test methods
For the half-tablets, method 1 has the lowest residual vari-ance, whereas methods 3 and 5 exhibit the lowest person
variability. The use of a knife as cutting tool makes thismethod less dependent on the operator. The 95% confi-dence intervals on the person variability's are rather largedue to the low number of degrees of freedom (only 3 per-sons) compared to the smaller confidence intervals of theresidual variability (30 tablets per person).
The total quarter-tablet variability is lowest for methods 1and 5. The quarter-tablet person variability is comparableto the half-tablet situation. The quarter-tablet variability ofmethod 3 is significantly higher than those of methods 1and 5. Within the 3 acceptable methods (1, 3 and 5), thefollowing reproducibility ranking is made (best to worse):method 1 (lowest half-tablet variability), method 5 (lowquarter-tablet variability) and method 3. When combiningthese findings with the results of the previous section(high losses for method 5), methods 1 and 3 are the pre-ferred methods to obtain reproducible breakings.
The relationship between the half-tablet variability andquarter-tablet variability was further investigated by calcu-lating the ratio of standard deviation of quarter-tablets ver-sus the standard deviation of half-tablets, for each method.A 95% confidence interval was constructed using an F-dis-tribution. The results are graphically presented per methodin Figure 7.
Figure 7: Ratio of standard deviation of quarter-tabletweights versus standard deviation of the correspondinghalf-tablet weights for 5 breakability methods andcomparison with hypothetical calculated value 0.87
From Figure 7 it is noticed that the quarter-tablet variabil-ity (expressed as standard deviation) slightly increases formethods 1 and 3 compared to the corresponding half-tab-
195
J Pharm Pharmaceut Sci (www.ualberta.ca/~csps) 5(2):190-198, 2002
let variability, whereas it decreases for the other methods.This phenomenon was further explored by testing thehypothesis that the variability of part-of-tablets (expressedas variance) is a linear function of the length of the score(i.e. the longer the score, the higher the variability of thecorresponding part-of-tablet's weight).
If the variabilities of tablets, half-tablets and quarter-tablets
are respectively called , and , then the followingmathematical relationships exists:
(1)
(2)
With : Intrinsic variability of half-tablets inheritedfrom tablets, with hence half the standard deviation of thetablets’ standard deviation.
: Additional variability due to breaking a tablet intohalf-tablets.
: Intrinsic variability of quarter-tablets inherited fromhalf-tablets.
: Additional variability due to breaking a half-tablet intoquarter-tablets.
Specifically for the tablets used in this study, the tablet
variability is contributing only very little (i.e. always less
than 3%) in the half-tablet variability , therefore the
tablet variability is not considered in the further calcula-
tions. Together with the above hypothesis (i.e. is half of
because the half-tablet score length is half of the tabletscore length), equations (1) and (2) can be combined to
give the following relationship between and :
(3)
From equation (3), the theoretical expected ratio of quar-ter-tablet to half-tablet variability, expressed as standarddeviation, is 0.87. The overall experimental results are in-line with this theoretical value. Consequently, it may be
concluded that the variability of broken tablets is mainlydetermined by the half-tablet variability, and that breakinghalf-tablets into quarter-tablets does not imply that thevariability increases. However, if relative standard devia-tions are considered, the RSD of quarter-tablets is aroundtwice the variability of half-tablets.
Breaking symmetry investigation
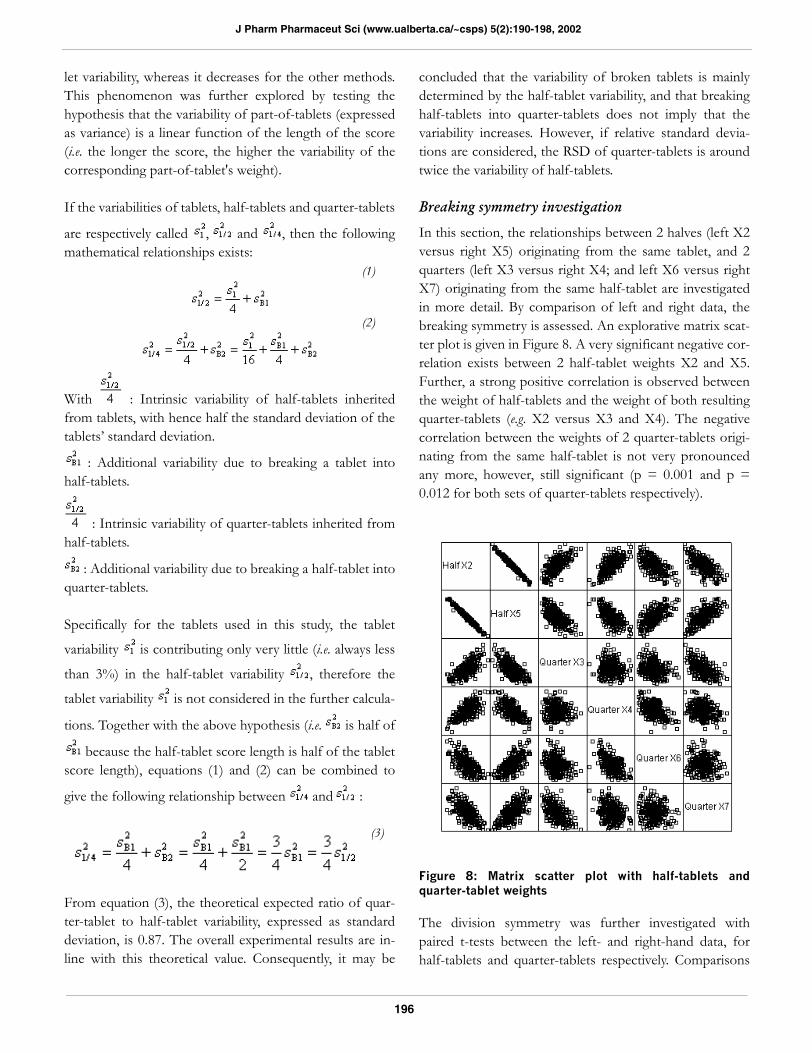
In this section, the relationships between 2 halves (left X2versus right X5) originating from the same tablet, and 2quarters (left X3 versus right X4; and left X6 versus rightX7) originating from the same half-tablet are investigatedin more detail. By comparison of left and right data, thebreaking symmetry is assessed. An explorative matrix scat-ter plot is given in Figure 8. A very significant negative cor-relation exists between 2 half-tablet weights X2 and X5.Further, a strong positive correlation is observed betweenthe weight of half-tablets and the weight of both resultingquarter-tablets (e.g. X2 versus X3 and X4). The negativecorrelation between the weights of 2 quarter-tablets origi-nating from the same half-tablet is not very pronouncedany more, however, still significant (p = 0.001 and p =0.012 for both sets of quarter-tablets respectively).
Figure 8: Matrix scatter plot with half-tablets andquarter-tablet weights
The division symmetry was further investigated withpaired t-tests between the left- and right-hand data, forhalf-tablets and quarter-tablets respectively. Comparisons
196
J Pharm Pharmaceut Sci (www.ualberta.ca/~csps) 5(2):190-198, 2002
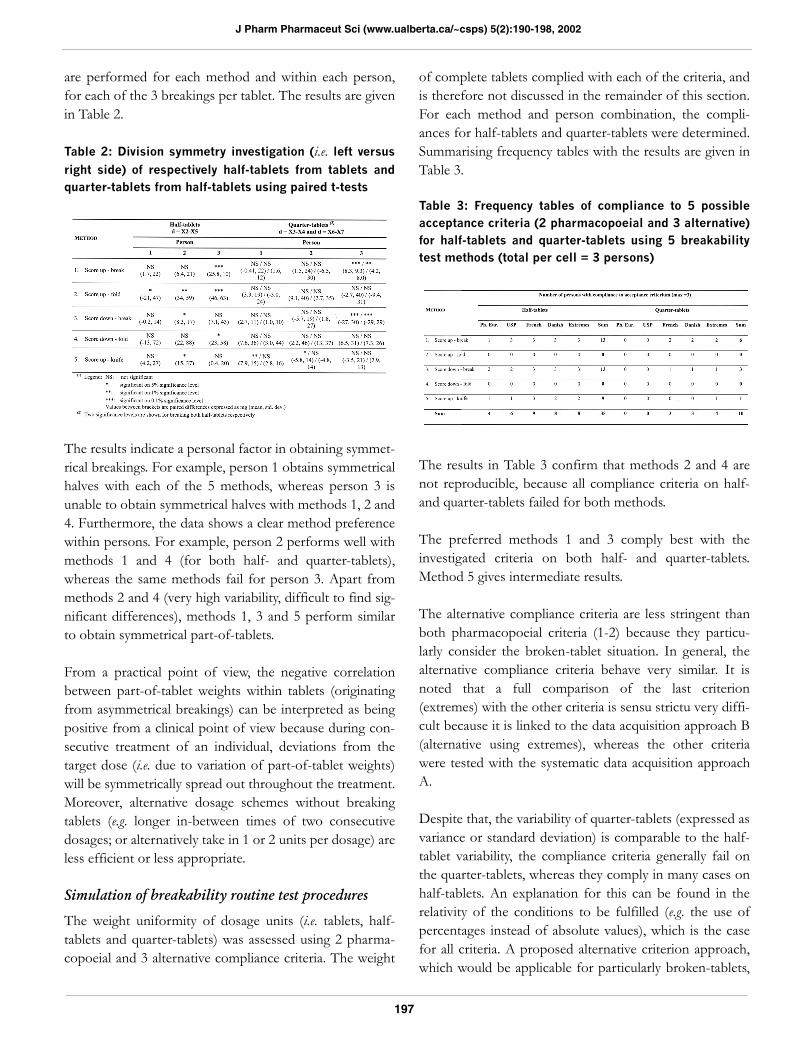
are performed for each method and within each person,for each of the 3 breakings per tablet. The results are givenin Table 2.
Table 2: Division symmetry investigation (i.e. left versus
right side) of respectively half-tablets from tablets andquarter-tablets from half-tablets using paired t-tests
The results indicate a personal factor in obtaining symmet-rical breakings. For example, person 1 obtains symmetricalhalves with each of the 5 methods, whereas person 3 isunable to obtain symmetrical halves with methods 1, 2 and4. Furthermore, the data shows a clear method preferencewithin persons. For example, person 2 performs well withmethods 1 and 4 (for both half- and quarter-tablets),whereas the same methods fail for person 3. Apart frommethods 2 and 4 (very high variability, difficult to find sig-nificant differences), methods 1, 3 and 5 perform similarto obtain symmetrical part-of-tablets.
From a practical point of view, the negative correlationbetween part-of-tablet weights within tablets (originatingfrom asymmetrical breakings) can be interpreted as beingpositive from a clinical point of view because during con-secutive treatment of an individual, deviations from thetarget dose (i.e. due to variation of part-of-tablet weights)will be symmetrically spread out throughout the treatment.Moreover, alternative dosage schemes without breakingtablets (e.g. longer in-between times of two consecutivedosages; or alternatively take in 1 or 2 units per dosage) areless efficient or less appropriate.
Simulation of breakability routine test procedures
The weight uniformity of dosage units (i.e. tablets, half-tablets and quarter-tablets) was assessed using 2 pharma-copoeial and 3 alternative compliance criteria. The weight
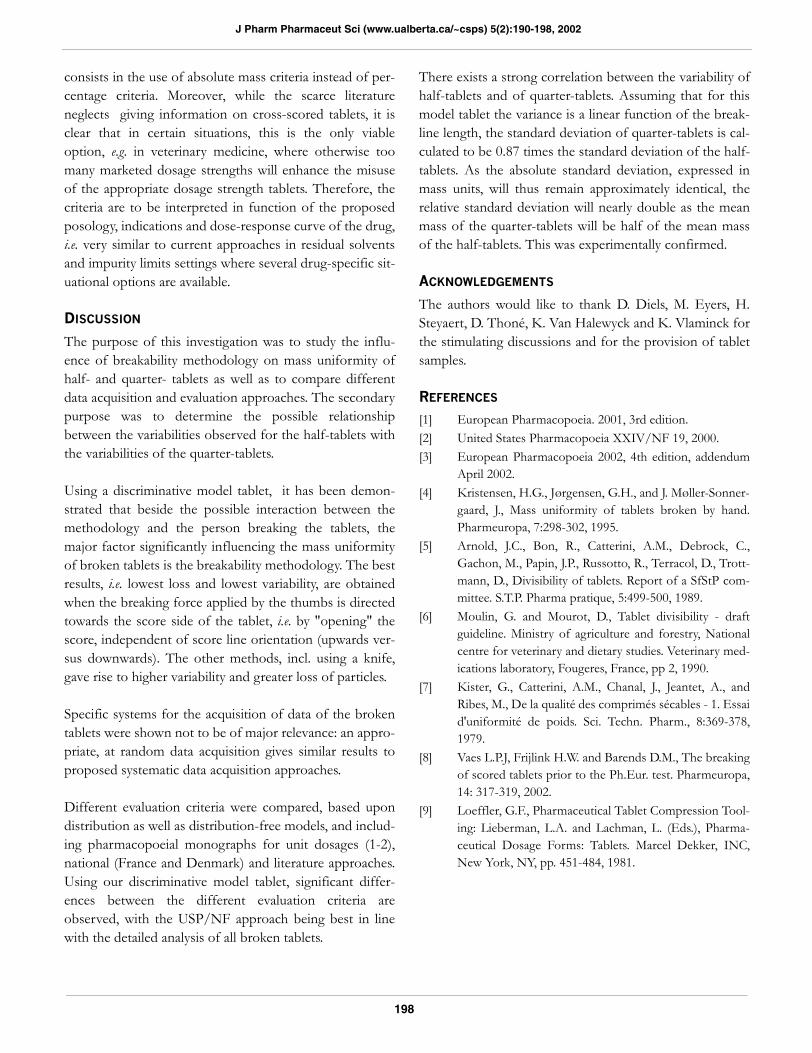
of complete tablets complied with each of the criteria, andis therefore not discussed in the remainder of this section.For each method and person combination, the compli-ances for half-tablets and quarter-tablets were determined.Summarising frequency tables with the results are given inTable 3.
Table 3: Frequency tables of compliance to 5 possibleacceptance criteria (2 pharmacopoeial and 3 alternative)for half-tablets and quarter-tablets using 5 breakabilitytest methods (total per cell = 3 persons)
The results in Table 3 confirm that methods 2 and 4 arenot reproducible, because all compliance criteria on half-and quarter-tablets failed for both methods.
The preferred methods 1 and 3 comply best with theinvestigated criteria on both half- and quarter-tablets.Method 5 gives intermediate results.
The alternative compliance criteria are less stringent thanboth pharmacopoeial criteria (1-2) because they particu-larly consider the broken-tablet situation. In general, thealternative compliance criteria behave very similar. It isnoted that a full comparison of the last criterion(extremes) with the other criteria is sensu strictu very diffi-cult because it is linked to the data acquisition approach B(alternative using extremes), whereas the other criteriawere tested with the systematic data acquisition approachA.
Despite that, the variability of quarter-tablets (expressed asvariance or standard deviation) is comparable to the half-tablet variability, the compliance criteria generally fail onthe quarter-tablets, whereas they comply in many cases onhalf-tablets. An explanation for this can be found in therelativity of the conditions to be fulfilled (e.g. the use ofpercentages instead of absolute values), which is the casefor all criteria. A proposed alternative criterion approach,which would be applicable for particularly broken-tablets,
197
J Pharm Pharmaceut Sci (www.ualberta.ca/~csps) 5(2):190-198, 2002
consists in the use of absolute mass criteria instead of per-centage criteria. Moreover, while the scarce literatureneglects giving information on cross-scored tablets, it isclear that in certain situations, this is the only viableoption, e.g. in veterinary medicine, where otherwise toomany marketed dosage strengths will enhance the misuseof the appropriate dosage strength tablets. Therefore, thecriteria are to be interpreted in function of the proposedposology, indications and dose-response curve of the drug,i.e. very similar to current approaches in residual solventsand impurity limits settings where several drug-specific sit-uational options are available.
DISCUSSION
The purpose of this investigation was to study the influ-ence of breakability methodology on mass uniformity ofhalf- and quarter- tablets as well as to compare differentdata acquisition and evaluation approaches. The secondarypurpose was to determine the possible relationshipbetween the variabilities observed for the half-tablets withthe variabilities of the quarter-tablets.
Using a discriminative model tablet, it has been demon-strated that beside the possible interaction between themethodology and the person breaking the tablets, themajor factor significantly influencing the mass uniformityof broken tablets is the breakability methodology. The bestresults, i.e. lowest loss and lowest variability, are obtainedwhen the breaking force applied by the thumbs is directedtowards the score side of the tablet, i.e. by "opening" thescore, independent of score line orientation (upwards ver-sus downwards). The other methods, incl. using a knife,gave rise to higher variability and greater loss of particles.
Specific systems for the acquisition of data of the brokentablets were shown not to be of major relevance: an appro-priate, at random data acquisition gives similar results toproposed systematic data acquisition approaches.
Different evaluation criteria were compared, based upondistribution as well as distribution-free models, and includ-ing pharmacopoeial monographs for unit dosages (1-2),national (France and Denmark) and literature approaches.Using our discriminative model tablet, significant differ-ences between the different evaluation criteria areobserved, with the USP/NF approach being best in linewith the detailed analysis of all broken tablets.
There exists a strong correlation between the variability ofhalf-tablets and of quarter-tablets. Assuming that for thismodel tablet the variance is a linear function of the break-line length, the standard deviation of quarter-tablets is cal-culated to be 0.87 times the standard deviation of the half-tablets. As the absolute standard deviation, expressed inmass units, will thus remain approximately identical, therelative standard deviation will nearly double as the meanmass of the quarter-tablets will be half of the mean massof the half-tablets. This was experimentally confirmed.
ACKNOWLEDGEMENTS
The authors would like to thank D. Diels, M. Eyers, H.Steyaert, D. Thoné, K. Van Halewyck and K. Vlaminck forthe stimulating discussions and for the provision of tabletsamples.
REFERENCES
[1] European Pharmacopoeia. 2001, 3rd edition.[2] United States Pharmacopoeia XXIV/NF 19, 2000.[3] European Pharmacopoeia 2002, 4th edition, addendum
April 2002.[4] Kristensen, H.G., Jørgensen, G.H., and J. Møller-Sonner-
gaard, J., Mass uniformity of tablets broken by hand.Pharmeuropa, 7:298-302, 1995.
[5] Arnold, J.C., Bon, R., Catterini, A.M., Debrock, C.,Gachon, M., Papin, J.P., Russotto, R., Terracol, D., Trott-mann, D., Divisibility of tablets. Report of a SfStP com-mittee. S.T.P. Pharma pratique, 5:499-500, 1989.
[6] Moulin, G. and Mourot, D., Tablet divisibility - draftguideline. Ministry of agriculture and forestry, Nationalcentre for veterinary and dietary studies. Veterinary med-ications laboratory, Fougeres, France, pp 2, 1990.
[7] Kister, G., Catterini, A.M., Chanal, J., Jeantet, A., andRibes, M., De la qualité des comprimés sécables - 1. Essaid'uniformité de poids. Sci. Techn. Pharm., 8:369-378,1979.
[8] Vaes L.P.J, Frijlink H.W. and Barends D.M., The breakingof scored tablets prior to the Ph.Eur. test. Pharmeuropa,14: 317-319, 2002.
[9] Loeffler, G.F., Pharmaceutical Tablet Compression Tool-ing: Lieberman, L.A. and Lachman, L. (Eds.), Pharma-ceutical Dosage Forms: Tablets. Marcel Dekker, INC,New York, NY, pp. 451-484, 1981.
198