Embed Size (px)
Citation preview
Statistical Analysis PlanVerona Pharma
RPL554-CO-203
Document:U:\My documents\ad hoc\Mark\Final SAP\Verona RPL554-CO-203 SAP v1.0.docxAuthor: Eleonora Chiossi Version: 1.0Page 1 of 37 Version Date: 6 March 2018
STATISTICAL ANALYSIS PLAN
A Phase IIb, Randomized,
Double Blind, Placebo Controlled Dose Ranging Study to
Assess the Effect of RPL554 in Patients with Moderate to
Severe COPD
Study No. RPL554-CO-203
Version 1.0 – 6 March 2018

Statistical Analysis Plan
Verona Pharma
RPL554-CO-203
Document:U:\My documents\ad hoc\Mark\Final SAP\Verona RPL554-CO-203 SAP v1.0.docx Author: Eleonora Chiossi Version: 1.0 Page 3 of 37 Version Date: 6 March 2018
Modification History
Unique Identifier for this Version
Date of the Document
Version
Author Significant Changes from Previous Authorized Version
1.0 6 March 2018 Eleonora Chiossi Final Version for implementation after DB lock

Statistical Analysis Plan
Verona Pharma
RPL554-CO-203
Document:U:\My documents\ad hoc\Mark\Final SAP\Verona RPL554-CO-203 SAP v1.0.docx Author: Eleonora Chiossi Version: 1.0 Page 4 of 37 Version Date: 6 March 2018
LIST OF ABBREVIATIONS AND DEFINITION OF TERMS Abbreviation or special term
Explanation/Definition
AEs Adverse Events ANCOVA Analysis of Covariance ATS American Thoracic Society AUC Area under the curve BDI Baseline Dyspnea Index BID Twice a day BMI Body Mass Index Bpm Beats per Minute CIs Confidence Intervals COPD Chronic Obstructive Pulmonary Disease CRF Case Report Form ECG Electrocardiogram eCRF Electronic Case Report Form E-RS Evaluating – Respiratory Symptoms ERS European Respiratory Society EXACT-PRO Exacerbations of Chronic Pulmonary Disease Tool Patient-Reported Outcome FEV1 Forced expiratory volume in 1 second FVC Forced Vital Capacity ICS Inhaled corticosteroids Kg Kilograms LABA Long Acting Beta2 Agonist LAMA Long Acting Muscarinic Antagonist LDL Low-density Lipoprotein LOCF Last Observation Carried Forward MedDRA Medical Dictionary for Regulatory Activities m Meters mL Milliliters MMRM Mixed Model for Repeated Measures MRC Medical Research Council msec Milliseconds N Number of patients PGAC Patient Global Assessment of Change PT Preferred Term QTcF QT interval corrected for heart rate using Friderica’s formula SAE Serious Adverse Event SAS Statistical Analysis Software SD Standard Deviation SOC System Organ Class SGRQ-C St George’s Respiratory Questionnaire – COPD specific TDI Transition Dyspnea Index
Statistical Analysis Plan
Verona Pharma
RPL554-CO-203
Document:U:\My documents\ad hoc\Mark\Final SAP\Verona RPL554-CO-203 SAP v1.0.docx Author: Eleonora Chiossi Version: 1.0 Page 5 of 37 Version Date: 6 March 2018
Table of Content
1. Introduction ......................................................................................................................... 7
2. Study objectives ................................................................................................................... 7 2.1. Primary objective ........................................................................................................ 7 2.2. Secondary objectives .................................................................................................. 7 2.3. Exploratory Objectives ............................................................................................... 7
3. Study design ......................................................................................................................... 8 3.1. General Description .................................................................................................... 8 3.2. Treatments .................................................................................................................. 8
3.2.1. Treatments Administered ............................................................................... 8 3.2.2. Method of Assigning Patients to Treatment Groups...................................... 9 3.2.3. Blinding ......................................................................................................... 9
3.3. Determination of Sample Size .................................................................................... 9 3.4. Changes in the Conduct of the Study or Planned Analyses ........................................ 9 3.5. Analysis Sets ............................................................................................................... 9 3.6. Major Protocol Deviations ........................................................................................ 10 3.7. General Methodology ............................................................................................... 10
3.7.1. Baseline ....................................................................................................... 10 3.7.2. End of Study ................................................................................................ 11 3.7.3. Visit Windows ............................................................................................. 11 3.7.4. Duration ....................................................................................................... 11 3.7.5. Treatment period .......................................................................................... 11
3.8. Handling of Dropouts or Missing Data ..................................................................... 11 3.8.1. Missing data in efficacy analysis ................................................................. 11 3.8.2. Missing data in safety analysis .................................................................... 11 3.8.3. Partial Date Imputation ................................................................................ 11 3.8.4. Partial Dates for AEs ................................................................................... 12 3.8.5. Partial Dates for Concomitant Medications ................................................. 12
3.9. Interim Analyses and Data Monitoring .................................................................... 12 3.10. Pooled country/region ............................................................................................... 12
4. Patient disposition, demographic and baseline characteristics, medical history, prior and concomitant medications, treatment compliance and exposure .................. 12 4.1. Patient disposition ..................................................................................................... 12 4.2. Demographic and Other Baseline Characteristics .................................................... 12 4.3. Medical History ........................................................................................................ 13 4.4. Prior COPD, Prior and Concomitant Medications .................................................... 13
4.4.1. Special grouping of medications.................................................................. 13 4.5. Exposure and compliance ......................................................................................... 15
4.5.1. Treatment Compliance ................................................................................. 15 4.5.2. Extent of Exposure ...................................................................................... 15
5. Efficacy Endpoints ............................................................................................................ 15

Statistical Analysis Plan
Verona Pharma
RPL554-CO-203
Document:U:\My documents\ad hoc\Mark\Final SAP\Verona RPL554-CO-203 SAP v1.0.docx Author: Eleonora Chiossi Version: 1.0 Page 6 of 37 Version Date: 6 March 2018
5.1. Primary Efficacy Endpoint ....................................................................................... 15 5.2. Secondary Efficacy Endpoints .................................................................................. 16 5.3. Exploratory Efficacy Endpoints ................................................................................ 16 5.4. Selected secondary endpoints ................................................................................... 17 5.5. Efficacy Endpoints details ........................................................................................ 17
5.5.1. Pulmonary Function Tests ........................................................................... 17 5.5.2. Symptom Diary [EXACT-PRO] .................................................................. 17 5.5.3. St. George’s Respiratory Questionnaire – COPD specific (SGRQ-C) ........ 18 5.5.4. Medical Research Council (MRC) Breathlessness Scale ............................ 19 5.5.5. Patient Global Assessment of Change (PGAC) ........................................... 19 5.5.6. Baseline and Transition Dyspnea Indices (BDI and TDI) ........................... 19
5.6. Efficacy Endpoint Analysis ...................................................................................... 20 5.6.1. General consideration on the analysis of efficacy ....................................... 20 5.6.2. Analysis of Primary Endpoint ..................................................................... 20 5.6.3. Analyses of Secondary and exploratory Endpoints ..................................... 21 5.6.4. Multiple Comparison Adjustment for the Primary Efficacy Endpoint ........ 21 5.6.5. Multiple Comparison Adjustment for the Secondary Efficacy Endpoints .. 21 5.6.6. Examination of Subgroups .......................................................................... 22
6. Safety Endpoints ............................................................................................................... 22 6.1. Adverse Events ......................................................................................................... 22
6.1.1. Analysis of Adverse Events ......................................................................... 22 6.2. Clinical Laboratory Evaluations ............................................................................... 23
6.2.1. Analysis of Clinical Laboratory Evaluation ................................................ 23 6.3. Electrocardiograms ................................................................................................... 24
6.3.1. Analysis of ECG Evaluations ...................................................................... 24 6.3.2. Holter Monitors ........................................................................................... 24
6.4. Vital Signs ................................................................................................................ 24 6.4.1. Analysis of Vital Signs ................................................................................ 25
6.5. Physical Findings ...................................................................................................... 25 6.6. Drug induced bronchospasm .................................................................................... 25
6.6.1. Analysis of drug induced bronchospasm ..................................................... 25
7. Pharmacokinetic ............................................................................................................... 25 7.1. Analysis of pharmacokinetic .................................................................................... 25
8. REFERENCES .................................................................................................................. 27
9. Appendices ......................................................................................................................... 28 9.1. Appendix 1: Schedule of Events ............................................................................... 28 9.2. Appendix 2: EXACT-PRO Scoring Instructions ...................................................... 31 9.3. Appendix 3: SGRQ-C ............................................................................................... 36 9.4. Appendix 4: SAS code for efficacy analysis ............................................................ 38

Statistical Analysis Plan
Verona Pharma
RPL554-CO-203
Document:U:\My documents\ad hoc\Mark\Final SAP\Verona RPL554-CO-203 SAP v1.0.docx Author: Eleonora Chiossi Version: 1.0 Page 7 of 37 Version Date: 6 March 2018
1. Introduction
This document describes the rules and conventions to be used in the presentation and analysis of efficacy and safety data for protocol RPL554-CO-203. It describes, in detail, the data to be summarized and analyzed, including specifics of the statistical analyses to be performed. This statistical analysis plan is based on the final protocol version 2.0, dated 18th of April 2017.
2. Study objectives
The purpose of this study is to investigate the dose response of RPL554 in patients with Chronic Obstructive Pulmonary Disease (COPD) over 4 weeks. Clinical practice indicates that this length of time should allow for the study of the bronchodilator response (measured predominantly by peak FEV1) and the anti-inflammatory response (measured predominantly by trough FEV1).
2.1. Primary objective
The primary objective of this study is to investigate the placebo-corrected effect of RPL554 administered by nebulizer on change from baseline in peak FEV1 (maximum over 3 hours following dosing) over 4 weeks when administered to patients with moderate to severe COPD.
2.2. Secondary objectives
The secondary objectives of this study are as follows:
To investigate the placebo-corrected effect of RPL554 administered by nebulizer on change from baseline in morning trough FEV1 over 4 weeks when administered to patients with moderate to severe COPD
To investigate the bronchodilator placebo-corrected effect of RPL554 administered by nebulizer on AUC0-12 hours FEV1 after 4 weeks of dosing
To investigate the single-dose bronchodilator placebo-corrected effect of RPL554 on peak and average FEV1 at Visit 2 (first dose)
To investigate the bronchodilator placebo-corrected effect of RPL554 on peak and average FEV1 over 3 hours at Visits 3 to- 6 (Weeks 1 to 4)
To investigate the placebo-corrected effects of RPL554 on COPD symptoms, as measured by daily diary (E-RS from the Exacerbations of Chronic Pulmonary Disease Tool Patient-Reported Outcomes [EXACT-PRO+], Transition Dyspnea Index [TDI], St George’s Respiratory Questionnaire – COPD specific [SGRQ-C], Medical Research Council [MRC] scale, and patient global assessment of change (PGAC)
To investigate the safety of RPL554 when administered for 4 weeks in patients with COPD, as measured by adverse events, electrocardiograms (ECGs), Holter monitoring and vital signs
To compare the amount of rescue albuterol/salbutamol use required
2.3. Exploratory Objectives
Additional, exploratory objectives of this study are as follows: To compare peak and AUC0-12 hour FEV1 at the final study visit (visit 6) to baseline (Day 1) To correlate trough pharmacokinetics with pharmacodynamics effects

Statistical Analysis Plan
Verona Pharma
RPL554-CO-203
Document:U:\My documents\ad hoc\Mark\Final SAP\Verona RPL554-CO-203 SAP v1.0.docx Author: Eleonora Chiossi Version: 1.0 Page 8 of 37 Version Date: 6 March 2018
3. Study design
This is a phase IIb, randomized, double-blind, placebo-controlled, parallel group study designed to evaluate the efficacy and safety of nebulized RPL554 in patients with moderate to severe COPD over 4 weeks.
3.1. General Description
A total of approximately 400 patients between the ages of 40 and 75 years, inclusive, with a clinical diagnosis of COPD, as defined by the American Thoracic Society (ATS)/European Respiratory Society (ERS) guidelines and symptoms compatible with COPD for at least 1 year prior to screening will be enrolled. Patients will be seen at approximately 50 sites throughout the European Union. The study comprises six visits: screening (visit 1), randomization (visit 2), and weekly visits for 4 weeks (visit 3 to visit 6, Week 1 to Week 4). Patients will be screened for eligibility (visit 1), including a reversibility test with albuterol/salbutamol between 7 and 14 days before the first dose of study medication.
3.2. Treatments
3.2.1. Treatments Administered
Patients will be randomized to either RPL554 or placebo. Those assigned to RPL554 will receive one of four active strengths, as described in the table below:
Table 1: RPL554 Doses
Substance Dose Level (mg) Concentration (mg/mL) RPL554 0.75 0.3 RPL554 1.5 0.6 RPL554 3.0 1.2 RPL554 6.0 2.4 Placebo N/A N/A
N/A = Not Applicable
All study medications will be administered twice daily, using a standard jet nebulizer.
3.2.2. Method of Assigning Patients to Treatment Groups
At the screening visit, the investigator will assign a unique patient number to each enrolled patient. This patient number is made up of three digits unique to each study site and 3 digits for each consecutively enrolled patient at the trial site, provided an informed consent form is signed by the patient. This number should be entered into the electronic data capture (EDC) system and maintained throughout the study. Once the patient meets inclusion and exclusion criteria, the study site will request the study medication assignment using the Interactive Response System (IXRS).
3.2.3. Blinding
This is a randomized, double-blind, placebo-controlled study. Placebo will be similar to
Statistical Analysis Plan
Verona Pharma
RPL554-CO-203
Document:U:\My documents\ad hoc\Mark\Final SAP\Verona RPL554-CO-203 SAP v1.0.docx Author: Eleonora Chiossi Version: 1.0 Page 9 of 37 Version Date: 6 March 2018
RPL554, except for the omission of the active ingredient. Because a visually matching placebo could not be developed, the dosing cup on each nebulizer administered at the study center will be obscured with opaque tape to visually blind the study medication.
3.3. Determination of Sample Size
The standard deviation for peak FEV1 is estimated to be 250 mL. With a 2-sided test at a 5% significance level and 80 evaluable patients per group, there will be an 80% power to detect a true difference of 111 mL between any two treatments. This detectable limit has been considered sufficient to conclusively identify a minimal effective dose of RPL554. Thus 80 patients per group will be randomized for a total of 400 patients.
3.4. Changes in the Conduct of the Study or Planned Analyses
The method for analysis the primary efficacy endpoint has been changed from LOCF ANCOVA to mixed model for repeated measures (MMRM). The change was led by the superiority of MMRM with respect to LOCF in avoiding some type of bias as suggested by Siddiqui et al. (Siddiqui O, 2009)
Introduction of Per Protocol analysis set. This is an analysis set of interest for a phase II study.
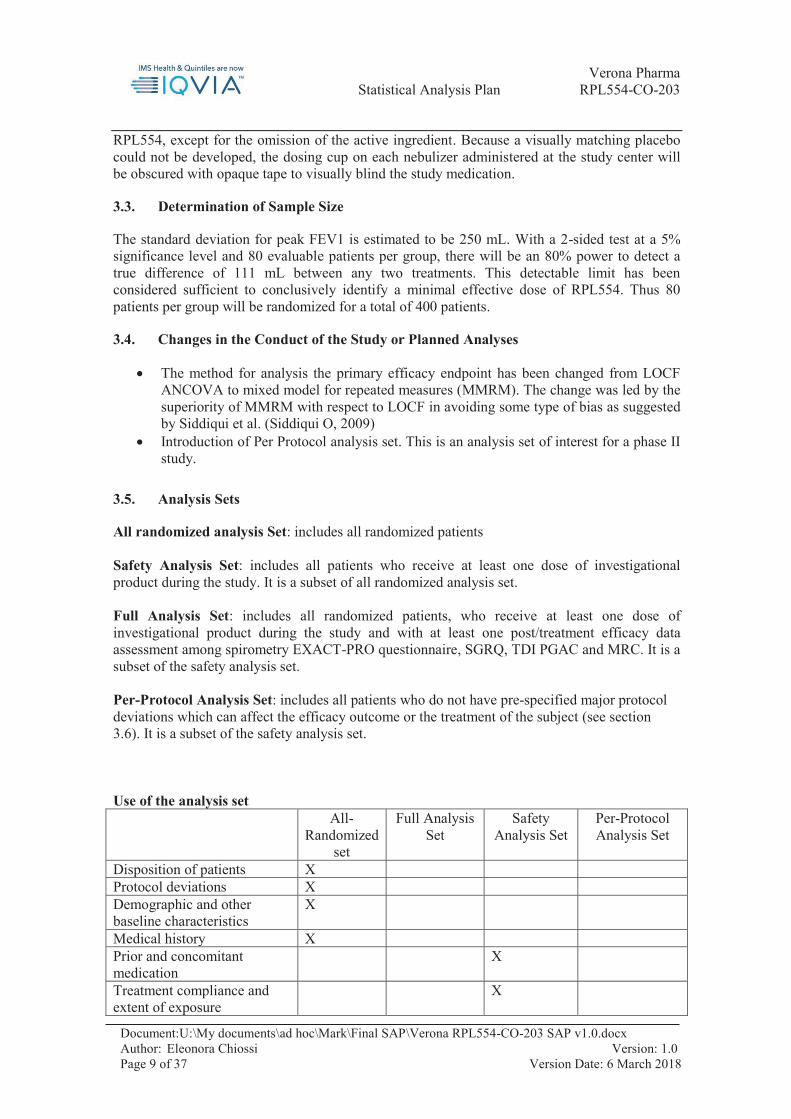
3.5. Analysis Sets
All randomized analysis Set: includes all randomized patients Safety Analysis Set: includes all patients who receive at least one dose of investigational product during the study. It is a subset of all randomized analysis set. Full Analysis Set: includes all randomized patients, who receive at least one dose of investigational product during the study and with at least one post/treatment efficacy data assessment among spirometry EXACT-PRO questionnaire, SGRQ, TDI PGAC and MRC. It is a subset of the safety analysis set. Per-Protocol Analysis Set: includes all patients who do not have pre-specified major protocol deviations which can affect the efficacy outcome or the treatment of the subject (see section 3.6). It is a subset of the safety analysis set. Use of the analysis set
All-Randomized
set
Full Analysis Set
Safety Analysis Set
Per-Protocol Analysis Set
Disposition of patients X Protocol deviations X Demographic and other baseline characteristics
X
Medical history X Prior and concomitant medication
X
Treatment compliance and extent of exposure
X
Statistical Analysis Plan
Verona Pharma
RPL554-CO-203
Document:U:\My documents\ad hoc\Mark\Final SAP\Verona RPL554-CO-203 SAP v1.0.docx Author: Eleonora Chiossi Version: 1.0 Page 10 of 37 Version Date: 6 March 2018
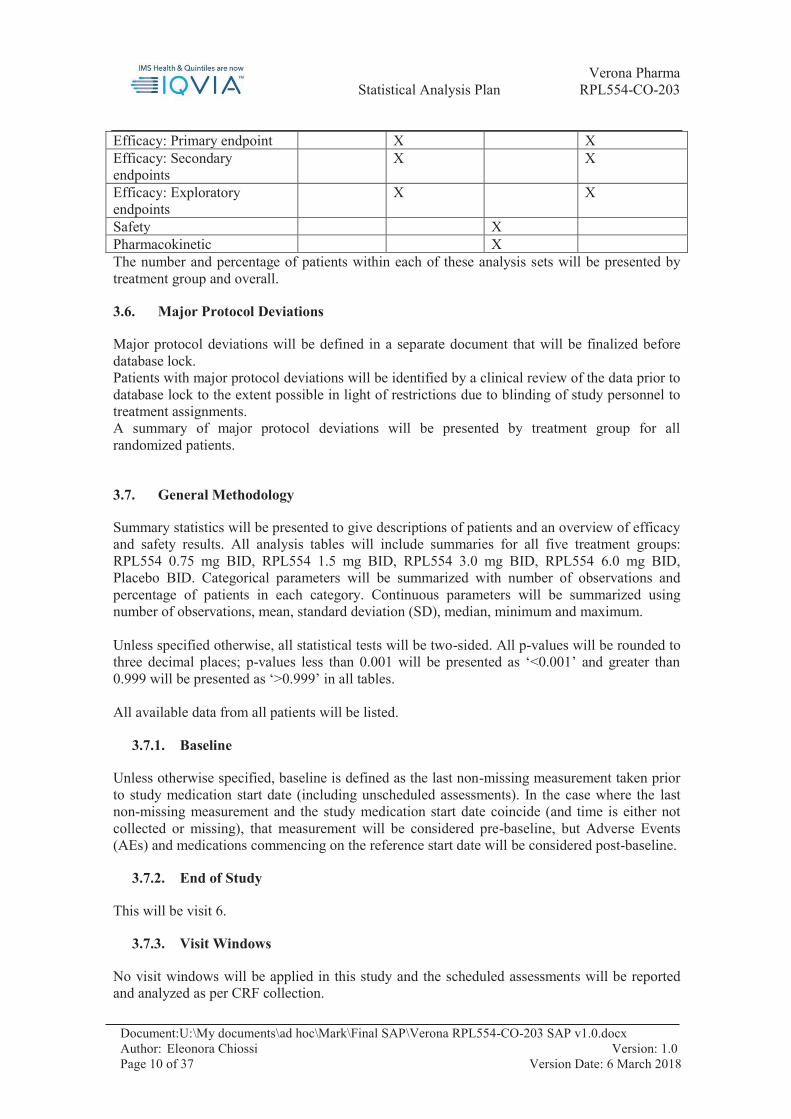
Efficacy: Primary endpoint X X Efficacy: Secondary endpoints
X X
Efficacy: Exploratory endpoints
X X
Safety X Pharmacokinetic X The number and percentage of patients within each of these analysis sets will be presented by treatment group and overall.
3.6. Major Protocol Deviations
Major protocol deviations will be defined in a separate document that will be finalized before database lock. Patients with major protocol deviations will be identified by a clinical review of the data prior to database lock to the extent possible in light of restrictions due to blinding of study personnel to treatment assignments. A summary of major protocol deviations will be presented by treatment group for all randomized patients.
3.7. General Methodology
Summary statistics will be presented to give descriptions of patients and an overview of efficacy and safety results. All analysis tables will include summaries for all five treatment groups: RPL554 0.75 mg BID, RPL554 1.5 mg BID, RPL554 3.0 mg BID, RPL554 6.0 mg BID, Placebo BID. Categorical parameters will be summarized with number of observations and percentage of patients in each category. Continuous parameters will be summarized using number of observations, mean, standard deviation (SD), median, minimum and maximum.
Unless specified otherwise, all statistical tests will be two-sided. All p-values will be rounded to three decimal places; p-values less than 0.001 will be presented as ‘<0.001’ and greater than 0.999 will be presented as ‘>0.999’ in all tables.
All available data from all patients will be listed.
3.7.1. Baseline
Unless otherwise specified, baseline is defined as the last non-missing measurement taken prior to study medication start date (including unscheduled assessments). In the case where the last non-missing measurement and the study medication start date coincide (and time is either not collected or missing), that measurement will be considered pre-baseline, but Adverse Events (AEs) and medications commencing on the reference start date will be considered post-baseline.
3.7.2. End of Study
This will be visit 6.
3.7.3. Visit Windows
No visit windows will be applied in this study and the scheduled assessments will be reported and analyzed as per CRF collection.
Statistical Analysis Plan
Verona Pharma
RPL554-CO-203
Document:U:\My documents\ad hoc\Mark\Final SAP\Verona RPL554-CO-203 SAP v1.0.docx Author: Eleonora Chiossi Version: 1.0 Page 11 of 37 Version Date: 6 March 2018
3.7.4. Duration
For the purposes of calculating durations expressed in months, a month will be considered as one-twelfth of a year, or 365.25 / 12 = 30.4375 days. As for duration in days, the calculation will go as follows: (stop date – start date) + 1 if start date is same as first dose date or later; (stop date – start date) if start date is before first dose date.
3.7.5. Treatment period
Treatment period is defined as the time elapsed between the first and last dose intake date plus 1 day. Assessments will be included in the safety and efficacy analysis if performed during the treatment period.
3.8. Handling of Dropouts or Missing Data
3.8.1. Missing data in efficacy analysis
MMRM model will be used as a strategy to deal with missing data. Last observation carried forward approach (LOCF) will be used a sensitivity analysis of the primary endpoint only. No other imputation will be applied.
3.8.2. Missing data in safety analysis
Any missing safety parameter will be considered missing for purposes of any summary statistics and analysis.
3.8.3. Partial Date Imputation
Dates are essential for the classification of AEs as treatment-emergent and medications as having been taken prior to the start of study medication and/or concomitantly with study medication.
3.8.4. Partial Dates for AEs
Adverse event start date (references to month are the month of the AE start date): 1. If only month and year are known and study medication started during that month then set
start date equal to study medication start date. 2. If month and year are known and study medication started prior to or after that month then
set start date equal to 1st day of month. 3. If only year is known, and it is the same as study medication start year, assume it is the
study medication start date/year. If it is different from study medication start year, assume it is the first day of the year.
4. If full start date (i.e. day, month, and year are missing) is unknown impute start date as the study medication start date. If imputed start date is greater than stop date, it will be imputed as stop date.
Statistical Analysis Plan
Verona Pharma
RPL554-CO-203
Document:U:\My documents\ad hoc\Mark\Final SAP\Verona RPL554-CO-203 SAP v1.0.docx Author: Eleonora Chiossi Version: 1.0 Page 12 of 37 Version Date: 6 March 2018
3.8.5. Partial Dates for Concomitant Medications
Concomitant therapy start date (references to month are the month of the concomitant therapy start date). Partial date imputation will follow the same pattern as for AEs in section 3.8.4 above.
Concomitant therapy stop date (references to month are the month of the concomitant therapy stop date): 1. If only day is unknown, then set equal to last day of month. 2. If only year is known, assume it is the last day of the year. 3. Otherwise (i.e. day, month and year are missing) leave as missing.
3.9. Interim Analyses and Data Monitoring
There are no planned interim analyses of data from this study.
3.10. Pooled country/region
For all analyses, sites will be pooled within countries. This will be detailed and approved prior to database lock.
4. Patient disposition, demographic and baseline characteristics, medical history, prior and concomitant medications, treatment compliance and exposure
4.1. Patient disposition
The final patient disposition will be presented by treatment group and overall. The total number of patients randomized, treated, completed and discontinued (including reason for discontinuation as recorded on the CRF) from the study will be summarized by treatment group and overall. The total number of patients prematurely discontinued will be presented overall and by visit. If the patient has discontinued between Visit 2 and Visit 3 it will be counted on those discontinued up to Week 1, and so on.
4.2. Demographic and Other Baseline Characteristics
Demographics including age, age group, gender, ethnicity and race will be presented by treatment group and overall. Also, presented by treatment group and overall are the following baseline characteristics: post-bronchodilator FEV1 (both in liters and in percentage of predicted normal), post-bronchodilator FVC, FEV1/FVC, FEV1 reversibility test results, duration of COPD (from diagnosis to randomization), smoking habits. Statistical testing will not be performed on these parameters.
4.3. Medical History
The number and percentage of patients in the SAF with at least one medical condition, diagnosis or surgery will be presented by treatment group and overall. Furthermore, the incidence for each System Organ Class (SOC) and Preferred Term (PT) will be presented. For each patient, multiple events that map to a SOC and PT will be counted only once for incidence counts. Events will be in descending frequency of SOC and PT in summaries. A listing of all medical history will also be presented.
Statistical Analysis Plan
Verona Pharma
RPL554-CO-203
Document:U:\My documents\ad hoc\Mark\Final SAP\Verona RPL554-CO-203 SAP v1.0.docx Author: Eleonora Chiossi Version: 1.0 Page 13 of 37 Version Date: 6 March 2018
4.4. Prior COPD, Prior and Concomitant Medications
Prior medications are defined as medications taken prior to first study medication dose. Concomitant medications are defined as medications with onset dates on or after the first dose of study medication, or medications with onset dates prior to first dose of study medication without a stop date or with a stop date after first dose of study medication. Partial date imputation for medications is described in section 3.8.5.
Prior and concomitant medications will be classified by WHO Drug Dictionary that identifies the active ingredient. .
Prior and concomitant medications will be summarized by therapeutic subgroup (ATC level 2), active ingredient and treatment group (for prior COPD medications and prior medications the overall column will also be presented), displaying frequencies and percentages. The denominators for the percentages will be the numbers of patients in each treatment group. Medications will be sorted by decreasing order of frequency of the therapeutic subgroup and active ingredient within subgroup. A separate summary of patient taking COPD medications prior to the study by therapeutic class will also be presented. COPD medications are identified as those with ‘Indication=’COPD’ on the medication log.
4.4.1. Special grouping of medications
Special grouping of beta agonist will be done as follows and will replace the ATC2 code classification.
LAMAs ATC4=R03BB and active ingredient equal to
o tiotropium
o umeclidinium
o aclidinium
ATC4=A03AB and active ingredient equal
o glycopyrronium
LABAs
ATC4=R03AC and active ingredient equal to
o salmeterol
o formoterol
o indacaterol
o olodaterol
ATC4=R03AK and active ingredient equal to
o vilanterol and fluticasone furoate
ATC4=R03AL3 and active ingredient equal to o vilanterol and umeclidinium bromide
Statistical Analysis Plan
Verona Pharma
RPL554-CO-203
Document:U:\My documents\ad hoc\Mark\Final SAP\Verona RPL554-CO-203 SAP v1.0.docx Author: Eleonora Chiossi Version: 1.0 Page 14 of 37 Version Date: 6 March 2018
o vilanterol, umeclidinium bromide and fluticasone furoate
Inhaled corticosteroids (ICS)
ATC4 = R03BA or
ATC4= R03AK and active ingredient equal
o beclometasone
o budesonide
o flunisolide
o betamethasone
o fluticasone
o triamcinolone
o mometasone
o ciclesonide
o fluticasone furoate
LABA/LAMA
Active ingredient includes
o ‘glycopyrronium’ and ‘indacaterol’
o ‘olodaterol’ and ‘tiotropium’
o ‘aclidinium’ and ‘formoterol’
o ‘umeclidinium’ and ‘vilanterol’
LABA/ICS
Active ingredient includes
o ‘budesonide’ and ‘formoterol’
o ‘fluticasone’ and ‘salmeterol’
o ‘fluticasone’ and ‘vilanterol’
o ‘beclomethasone’ and ‘formoterol’
o ‘mometasone’ and ‘formoterol’
Statistical Analysis Plan
Verona Pharma
RPL554-CO-203
Document:U:\My documents\ad hoc\Mark\Final SAP\Verona RPL554-CO-203 SAP v1.0.docx Author: Eleonora Chiossi Version: 1.0 Page 15 of 37 Version Date: 6 March 2018
4.5. Exposure and compliance
4.5.1. Treatment Compliance
Treatment compliance will be summarized by treatment group in 2 ways: 1. 100*((number of vials dispensed – number of vials returned)/(expected number of vials to
be taken during study period)) (excluding visit 6 for completers, as the vials will be dispensed by the site)
2. Drug intake as recorded in the e-diary: percent of ‘yes’ responses. The denominator is the number of records for which the patient provided an answer (Yes or No) to drug intake questions (morning and evening) in the e-diary.
4.5.2. Extent of Exposure
Duration of exposure to study medication will be calculated as follows: (Stop date – start date) + 1. The mean duration of exposure in days will be summarized by treatment group. Total exposure (in mL) will be based on the number of vials dispensed against the number returned (number of vials* contents of each vial (in mL)). For in-clinic dosing, the RPL554 exposure will be calculated based on the nominal dose.
5. Efficacy Endpoints
5.1. Primary Efficacy Endpoint
Change from baseline FEV1 to peak FEV1 (over 3 hours) at Week 4 o Baseline is defined as the FEV1 pre-dose assessment (-15 minutes) collected at Visit 2 o Peak FEV1 at Week 4 is defined as the maximum post-dose value among the 30
minutes, 1, 2 and 3 hour assessments collected at Visit 6 (Week 4).
5.2. Secondary Efficacy Endpoints
Change from baseline FEV1 to morning trough FEV1 at Week 1, 2, 3 and 4 Change from baseline FEV1 to average FEV1 (over 12 hours) at Day 1 and at Week 4 Change from baseline FEV1 to average FEV1 (over 3 hours) at Day 1, Week 1, 2, 3, and
4 Change from baseline FEV1 to peak FEV1 (over 3 hours) at Day 1, Week 1, 2 and 3
For details on the derivation of the above FEV1endpoints refer to section 5.5.1
Change from baseline in EXACT-PRO E-RS score at Week 4 Change from baseline in EXACT-PRO Total score at Week 4 Change from baseline in EXACT-PRO E-RS Breathlessness score at Week 4 Change from baseline in EXACT-PRO E-RS Cough/Sputum score at Week 4 Change from baseline in EXACT-PRO E-RS Chest Symptoms score at Week 4

Statistical Analysis Plan
Verona Pharma
RPL554-CO-203
Document:U:\My documents\ad hoc\Mark\Final SAP\Verona RPL554-CO-203 SAP v1.0.docx Author: Eleonora Chiossi Version: 1.0 Page 16 of 37 Version Date: 6 March 2018
For details on the derivation of the above EXACT-PRO scores refer to section 5.5.2
Change from baseline in the SGRQ-C Total score at Week 4 Change from baseline in the SGRQ-C Symptoms score at Week 4 Change from baseline in the SGRQ-C Activity score at Week 4 Change from baseline in the SGRQ-C Impact score at Week 4
For details on the derivation of the above SGRQ-C scores refer to section 5.5.3
Change from baseline in MRC breathlessness scales at Week 4
For details on the MRC scale refer to section 5.5.4
Transition Dyspnea Index (TDI) at week 4 Patient Global Assessment of Change (PGAC) at Week 4 Change from baseline (average over the last 7 days of the run-in period) in average daily
use of rescue medication over the treatment period, and at Week 1, 2, 3 and 4. Average daily use of rescue medication is the average of the number of times the rescue medications is taken (multiplied by two as two puffs are taken at each administration) during the period of time.
5.3. Exploratory Efficacy Endpoints
Change from baseline in EXACT-PRO E-RS score at Week 1, 2 and 3 Change from baseline in EXACT-PRO Total score at Week 1, 2 and 3 Change from baseline in EXACT-PRO E-RS Breathlessness score at Week 1,2 and 3 Change from baseline in EXACT-PRO E-RS Cough/Sputum score at Week 1,2 and 3 Change from baseline in EXACT-PRO E-RS Chest Symptoms score at Week 1,2 and 3
For details on the derivation of the above EXACT-PRO scores refer to section 5.5.2 Change from baseline in the SGRQ-C Total score at Week 2 Change from baseline in the SGRQ-C Symptoms score at Week 2 Change from baseline in the SGRQ-C Activity score at Week 2 Change from baseline in the SGRQ-C Impact score at Week 2
For details on the derivation of the above SGRQ-C scores refer to section 5.5.3
Change from baseline in MRC breathlessness scales at Week 2
For details on the MRC scale refer to section 5.5.4 Transition Dyspnea Index at week 2 Patient Global Assessment of Change (PGAC) at Week 2 COPD exacerbation
o Patient with one adverse event with MedDRA Preferred Term=’COPD exacerbation’ and use of systemic steroids (ATC2=H02) from AE date of onset for at least three days
Change in peak FEV1 (over 12 hours) from Day 1 (single dose) to Week 4 (steady state)
5.4. Selected secondary endpoints
The following secondary endpoints are of particular clinical interest and will undergo further

Statistical Analysis Plan
Verona Pharma
RPL554-CO-203
Document:U:\My documents\ad hoc\Mark\Final SAP\Verona RPL554-CO-203 SAP v1.0.docx Author: Eleonora Chiossi Version: 1.0 Page 17 of 37 Version Date: 6 March 2018
sensitivity analyses like subgroup analyses. Change from baseline FEV1 to peak FEV1 (over 3 hours) at Week 4 Change from baseline FEV1 to morning trough FEV1 at Week 4 Change from baseline FEV1 to average FEV1 (over 12 hours) at Week 4
5.5. Efficacy Endpoints details
5.5.1. Pulmonary Function Tests
Baseline FEV1 is defined as the FEV1 pre-dose assessment (-15 minutes) collected at Visit 2. Peak FEV1 (over 3 (12) hours) is defined as the maximum post-dose value among the values collected up to 3 (12) hours. Morning trough FEV1 is defined as the last pre-dose value at the visit under analysis Average FEV1 (over 3 (12) hours) is defined as the Area under the curve AUC0-3 (AUC0-12) of the FEV1 values collected during the visit under analysis, divided by the length of the time (in hours) interval of interest. The AUC is calculated using the trapezoidal rule. Parameters will be calculated over 3 hours (at Day 1 and Week 1 to 4) and over 12 hours (Day 1 and Week 4). If patient miss hour 2 and 3 then the AUC 0-3 is set to missing. If patient miss hour 8 and 12 then AUC 0-12 is set to missing. Censoring of value after rescue medications: before derivation of endpoints, within each visit, the spirometry data collected after the use of rescue medications (either Albuterol / Salbutamol or Ipratropium as collected on the CRF) will be censored (i.e.: considered as missing)
5.5.2. Symptom Diary [EXACT-PRO]
Once patients provide answers to all 14 questions on the ePRO, the device produces a score for each of three subscales: breathlessness, cough/sputum and chest symptoms. In addition to the subscale scores, a total score (covering all 14 questions) and a score for the E-RS part (11 questions) together with the subscores will be obtained. The average over the week 1, 2, 3 and 4 will be used as timepoint values, while the one over the week just prior to randomization (visit 2) will be used as baseline. If less than 4 days are available, the average over that week is set to missing. Scoring will be performed as described in Appendix 2: EXACT-PRO and E-RS Scoring Instructions . Note that, as the data are collected with an e-diary, there is no possibility of having missing items in the questionnaire as the system does not allow the patient to skip items. Also note that the EXACT-PRO subscale scores are not endpoints of the study but will be summarized for eventual comparison with other published studies
5.5.3. St. George’s Respiratory Questionnaire – COPD specific (SGRQ-C)
Patients will be asked to complete the SGRQ-C while they are at the study site at Visits 2
Statistical Analysis Plan
Verona Pharma
RPL554-CO-203
Document:U:\My documents\ad hoc\Mark\Final SAP\Verona RPL554-CO-203 SAP v1.0.docx Author: Eleonora Chiossi Version: 1.0 Page 18 of 37 Version Date: 6 March 2018
(baseline), 4 and 6. This is a 14-question, multiple-choice questionnaire that has 2 parts. Part 1 (questions 1-7) produces the symptoms score, while part 2 (questions 8-14) produces the activity and impacts scores. A total score is also produced. Each possible answer to each of the 14 questions is assigned a weigh as in Appendix 3: SGRQ-C (Jones P. , 2012). The lowest possible weight is zero, the highest is 100. A single response is required to each item. With electronic collection, it is impossible that there could be multiple responses given to any one item. The SGRQ-C is scored in 2 steps: 1. Sum the weights for all items with a positive response
The symptoms component score is obtained by adding the weights for items 1 through 7. The activity component score is obtained by adding the weights for the positive responses to items Questions 9 and 12. The impacts component score is obtained by adding the weights of items 8, 10, 11, 13 and 14 in the following way: the weights for all positive responses to items in Questions 10, 11 and 13 are summed together with the response to the single item that should have been checked/ticked in Questions 8 and 14.
2. Calculate the score
The score for each component is calculated separately by dividing the summed weights by the maximum possible weight for that component and expressing the result as a percentage.
The total score is calculated similarly
The total score is calculated by summing the weights to all the positive responses in each component. Please note that by “positive items”, it is meant those that show the presence of symptoms, to some degree. For example, in question 1 (part 1), all answers (“most days”, “several days” and “with chest infections”) except “not at all” would be positive. Another way to identify a positive response from a negative one is that a positive response has a nonzero score, unlike a negative one. The same definition is true in part 2. With question 8 for example (“How would you describe your chest condition”?), the following responses are positive: “the most important problem I have”, “causes me a few problems”; an answer of “Causes no problem” would be deemed negative as it does not show any signs of symptoms. In question 14 (see Appendix 3: SGRQ-C), as another example, any answer except “It does not stop me doing anything I would like to do” would be considered positive. Note that, as the data are collected with an e-diary, there is no possibility of having missing items in the questionnaire as the system does not allow the patient to skip items.
Statistical Analysis Plan
Verona Pharma
RPL554-CO-203
Document:U:\My documents\ad hoc\Mark\Final SAP\Verona RPL554-CO-203 SAP v1.0.docx Author: Eleonora Chiossi Version: 1.0 Page 19 of 37 Version Date: 6 March 2018
5.5.4. Medical Research Council (MRC) Breathlessness Scale
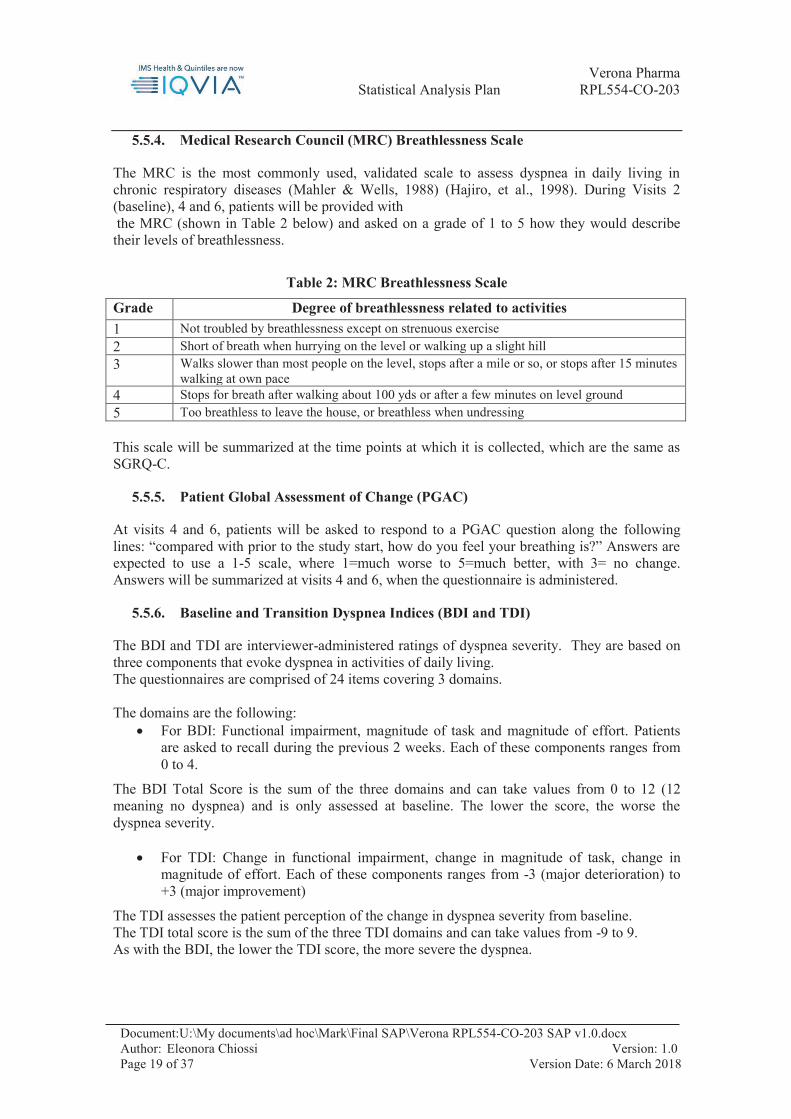
The MRC is the most commonly used, validated scale to assess dyspnea in daily living in chronic respiratory diseases (Mahler & Wells, 1988) (Hajiro, et al., 1998). During Visits 2 (baseline), 4 and 6, patients will be provided with the MRC (shown in Table 2 below) and asked on a grade of 1 to 5 how they would describe their levels of breathlessness.
Table 2: MRC Breathlessness Scale Grade Degree of breathlessness related to activities 1 Not troubled by breathlessness except on strenuous exercise 2 Short of breath when hurrying on the level or walking up a slight hill 3 Walks slower than most people on the level, stops after a mile or so, or stops after 15 minutes
walking at own pace 4 Stops for breath after walking about 100 yds or after a few minutes on level ground 5 Too breathless to leave the house, or breathless when undressing This scale will be summarized at the time points at which it is collected, which are the same as SGRQ-C.
5.5.5. Patient Global Assessment of Change (PGAC)
At visits 4 and 6, patients will be asked to respond to a PGAC question along the following lines: “compared with prior to the study start, how do you feel your breathing is?” Answers are expected to use a 1-5 scale, where 1=much worse to 5=much better, with 3= no change. Answers will be summarized at visits 4 and 6, when the questionnaire is administered.
5.5.6. Baseline and Transition Dyspnea Indices (BDI and TDI)
The BDI and TDI are interviewer-administered ratings of dyspnea severity. They are based on three components that evoke dyspnea in activities of daily living. The questionnaires are comprised of 24 items covering 3 domains. The domains are the following:
For BDI: Functional impairment, magnitude of task and magnitude of effort. Patients are asked to recall during the previous 2 weeks. Each of these components ranges from 0 to 4.
The BDI Total Score is the sum of the three domains and can take values from 0 to 12 (12 meaning no dyspnea) and is only assessed at baseline. The lower the score, the worse the dyspnea severity.
For TDI: Change in functional impairment, change in magnitude of task, change in magnitude of effort. Each of these components ranges from -3 (major deterioration) to +3 (major improvement)
The TDI assesses the patient perception of the change in dyspnea severity from baseline. The TDI total score is the sum of the three TDI domains and can take values from -9 to 9. As with the BDI, the lower the TDI score, the more severe the dyspnea.

Statistical Analysis Plan
Verona Pharma
RPL554-CO-203
Document:U:\My documents\ad hoc\Mark\Final SAP\Verona RPL554-CO-203 SAP v1.0.docx Author: Eleonora Chiossi Version: 1.0 Page 20 of 37 Version Date: 6 March 2018
5.6. Efficacy Endpoint Analysis
5.6.1. General consideration on the analysis of efficacy
All efficacy analyses will be performed on the Full Analysis Set. Patients will be analyzed according to the randomized treatment. All efficacy summaries will present the five treatment groups. All data summarized will also be listed.
5.6.2. Analysis of Primary Endpoint
The primary efficacy analysis parameter is change from baseline FEV1 to peak FEV1 at Week 4 of treatment. The primary analysis will be based on the full analysis set.
Summary statistics for FEV1 will be presented for baseline, week 4 and change from baseline by treatment group on patients with both assessments. The primary analysis will use a restricted maximum likelihood (REML)–based repeated-measures approach. The change from baseline FEV1 (at Day 1, Week 1, 2 3 and 4) will be the dependent variable. The analyses will include the fixed, categorical effects of treatment, visit, and treatment-by-visit interaction as well as the continuous, fixed covariates of baseline value. An unstructured (co)variance structure shared across treatment groups will be used to model the within-patient errors. If the model does not converge a compound symmetry (co)variance structure will be used. The Kenward-Roger approximation will be used to estimate denominator degrees of freedom and adjust standard errors. Analyses will be implemented with SAS PROC MIXED (see Appendix 4: SAS code for efficacy analysis). The primary comparison will be the contrast (difference in least squares mean [LSMEAN]) between treatments at Week 4.
5.6.2.1. Sensitivity analysis for the primary endpoint
To check the robustness of the results the following analysis will be performed: MMRM analysis excluding the patients with only one on treatment assessment of peak
FEV1 (over 3 hours) analysis of covariance (ANCOVA) will be used on data where missing data will be
imputed using last observation carried forward (LOCF) method.
5.6.3. Analyses of Secondary and exploratory Endpoints
The secondary and exploratory endpoints will be analyzed in the same way as the primary endpoint. In the analysis of TDI, BDI scores will be used as baseline in the model and the dependent endpoint will be the TDI score. As for PGAC the model will not include the baseline as the score reflect itself a change from baseline. The number of COPD exacerbations and use of rescue medications will be summarized by counts and percentages.
5.6.4. Multiple Comparison Adjustment for the Primary Efficacy Endpoint
The MMRM model above will test for the significance of treatment effect. Testing will continue
Statistical Analysis Plan
Verona Pharma
RPL554-CO-203
Document:U:\My documents\ad hoc\Mark\Final SAP\Verona RPL554-CO-203 SAP v1.0.docx Author: Eleonora Chiossi Version: 1.0 Page 21 of 37 Version Date: 6 March 2018
with each of the 4 doses of RPL554 against placebo, starting with the highest dose (6 mg). To this end, the fixed-sequence testing approach (Maurer et al., 1995; (Westfall & Krishen, 2001)) will be used. Let i = 0, 1, …, 4 represent increasing dose levels, 0 denoting placebo. Also, let μi, i = 0, 1, …, 4, denote the mean change from baseline in peak FEV1 after 4 weeks of treatment for placebo and each increasing active dose level, respectively. The primary null hypotheses are defined as: Hi: μj - μ0 = 0 and will be tested against the two-sided alternative Ki: μj - μ0 ≠ 0, j = 1, …, 4.
Finally, let p1, …, p4 denote the marginal p-values obtained from the statistical tests associated with H1, …, H4 (obtained from the MMRM model).
The fixed-sequence testing will begin with the null hypothesis corresponding to the highest dose versus placebo. If a statistically significant difference is found at the two-sided α level of 5%, the testing will proceed with the next highest dose, and so on. Otherwise, testing stops and the remaining null hypotheses are accepted without testing.
This testing strategy can be written as the following stepwise algorithm:
Step 1: If p4 ≤ α reject H4 and go to Step 2. Otherwise accept H1, …, H4 and stop. Step 2: If p3 ≤ α reject H3 and go to Step 3. Otherwise accept H1, …, H3 and stop. Step 3: If p2 ≤ α reject H2 and go to Step 4. Otherwise accept H1 and H2 and stop. Step 4: If p1 ≤ α reject H1. Otherwise accept H1.
The fixed-sequence procedure controls the family-wise error rate in the strong sense because, for each null hypothesis, the testing is conditional upon rejecting all hypotheses earlier in the sequence (Dmitrienko, et al., 2009).
5.6.5. Multiple Comparison Adjustment for the Secondary Efficacy Endpoints
As type I error is only controlled for the primary, secondary endpoints will be considered exploratory. Each secondary endpoint will be tested independently and nominally following a hierarchical testing of doses like the one used for the primary. Interpretation of the analyses of secondary endpoints in the CSR should ensure to consider the dose ranging nature of the study.
5.6.6. Examination of Subgroups
The following subgroups will be examined: 1. Current vs. ex-smokers 2. Chronic bronchitis vs. no chronic bronchitis at screening 3. Males vs. females. 4. Symptoms severity (MRC <2 vs. MRC ≥ 2) at randomization 5. Age: (≥ 65 vs < 65) 6. Inhaled corticosteroid use versus no use (use of medications during the last 7 days of run-in
phase). 7. By baseline FEV1 (> or <= 50% predicted)
Subgroup analyses will be performed for the primary and the selected secondary endpoints (see 5.4). The MMRM model will be run on each subgroup separately.
6. Safety Endpoints
Safety measures that will be collected and investigated include adverse events (AEs), clinical

Statistical Analysis Plan
Verona Pharma
RPL554-CO-203
Document:U:\My documents\ad hoc\Mark\Final SAP\Verona RPL554-CO-203 SAP v1.0.docx Author: Eleonora Chiossi Version: 1.0 Page 22 of 37 Version Date: 6 March 2018
laboratory tests, vital signs, physical examination and electrocardiograms assessments (ECGs, 12-Lead and using 24 hour Holter monitors). All safety analyses will be performed on the safety analysis set. Patients will be analyzed according to the treatment received. All safety summaries will present the five treatment groups.
6.1. Adverse Events
Treatment Emergent Adverse Events (TEAEs) are defined as all AEs which start after the first dose of study medication, or start prior to first dose of study medication and worsen, based on the investigator assessment of severity, on or after first dose of study medication. Adverse events with completely missing onset dates will also be considered as treatment emergent. If any AE records contain only partial dates, these will be handled by imputation, as described in Section 3.8.4.
Table summaries will be produced summarizing AEs in the following ways: TEAEs TEAEs classified by maximum severity TEAEs classified with relationship to study medication TEAEs leading to study discontinuation Serious TEAEs Serious TEAEs classified by maximum severity Serious TEAEs classified with relationship to study medication Serious TEAEs leading to study discontinuation TEAEs with outcome death
6.1.1. Analysis of Adverse Events
Adverse events will be coded using MedDRA version 20 (June 2017). All AE tables will be summarized by SOC and PT by treatment group, including the number of patients for each SOC and PT. Within each patient, multiple records of events mapping to a common MedDRA PT and SOC will be condensed into a single AE for incidence counts. Adverse Events will be reported by SOC and by PT in decreasing order of the highest active dose group of study medication (i.e 6.0 mg).
Listings of patients who discontinue the study for an AE, patients who experience an SAE and patients with AEs resulting in death will be presented.
6.2. Clinical Laboratory Evaluations
Change from baseline to Week 1 (Visit 3) in laboratory parameters Change from baseline to End of Study (Visit 6) in laboratory parameters
Laboratory parameters to be analyzed are:
o Hematology: hemoglobin, hematocrit, total white cell count, leukocyte differential count and platelet count
o Biochemistry: creatinine, total bilirubin, alkaline phosphatase, aspartate aminotransferase, alanine transaminase, gamma-glutamyl transferase, lactate dehydrogenase, creatine kinase, thyroid stimulating hormone, triiodothyronine and

Statistical Analysis Plan
Verona Pharma
RPL554-CO-203
Document:U:\My documents\ad hoc\Mark\Final SAP\Verona RPL554-CO-203 SAP v1.0.docx Author: Eleonora Chiossi Version: 1.0 Page 23 of 37 Version Date: 6 March 2018
thyroxine, glucose, potassium, sodium and calcium o Urinalysis: leukocytes, blood, ketones, bilirubin, urobilinogen, protein and glucose.
6.2.1. Analysis of Clinical Laboratory Evaluation
Descriptive statistics (number of observations, mean, standard deviation, minimum, median and maximum values) for collected values and change from baseline will be summarized for clinical laboratory tests (hematology, biochemistry and urinalysis) at applicable visits, by treatment groups. Selected laboratory test results will be classified by markedly abnormal criteria as normal or abnormal, according to Table 3 below. The number and percentage of patients with markedly abnormal laboratory results will be provided. No statistical testing will be performed on laboratory data.
Table 3: Markedly abnormal ranges for clinical laboratory parameters
Parameter Markedly Abnormally High Criteria Alanine Amino Transferase (ALT) >3 times Upper Limit of Normal
Range Alkaline Phosphatase >3 times Upper Limit of Normal
Range Aspartate Amino Transferase (AST)
>3 times Upper Limit of Normal Range
Creatinine 221 μmol/L Gamma Glutamyl Transferase (GGT)
>3 times Upper Limit of Normal Range
Total Bilirubin >3 times Upper Limit of Normal Range
In addition, abnormal values (relative to the normal range) for hematology and biochemistry will be presented by treatment, patient, visit, and parameter in data listings (including all values of a parameter if at least one value was abnormal per patient). These listings will include: treatment, subject identifier, the laboratory parameter, units, visit number and study day, parameter value, an indicator for values outside of the reference range (H or L), the reference range, and an indicator for clinically significant out-of-range values. All laboratory parameter results will be listed.
6.3. Electrocardiograms
Change from baseline (pre-dose at Visit 2) to 2-hours post-dose at Day 1, Week 1, Week 2, Week 3 and End of study in ECG parameters
Change from pre-dose to 2-hours post-dose at Week 1, Week 2, Week 3 and End of study in ECG parameters
Clinically significant ECG abnormality during treatment period ECG parameters to be analyzed are: QTcF Interval (msec), QRS Interval (msec), PR Interval (msec), RR (msec)and Heart rate (bpm).
6.3.1. Analysis of ECG Evaluations
A 12-lead ECG will be recorded at Baseline and Screening, visits 2, 3, 4, 5 and end of study (or
Statistical Analysis Plan
Verona Pharma
RPL554-CO-203
Document:U:\My documents\ad hoc\Mark\Final SAP\Verona RPL554-CO-203 SAP v1.0.docx Author: Eleonora Chiossi Version: 1.0 Page 24 of 37 Version Date: 6 March 2018
early termination). The overall ECG investigator interpretations will be summarized using a shift table comparing Baseline to time points. The ECG interpretations will be reported as “Normal”, “Abnormal NCS (Not Clinically Significant)”, or “Abnormal CS (Clinically Significant)”. The denominators for the percentages will be the numbers of patients with ECG data at both the baseline and at the time point in question in each treatment group. The quantitative parameters listed in 6.3 will be summarized and listed.
6.3.2. Holter Monitors
Change from screening to Week 4 in Holter parameters
The following parameter will be summarized: Atrial Fibrillation Time in %, Supraventricular, Supraventricular Couplets, Supraventricular Runs, Ventricular Single, Ventricular Couplets, Ventricular Runs, Number of RR > 2 seconds The number of patients with Supraventricular or Ventricular runs, and the total number of runs will be also summarized at Screening and Week 4, presenting also the number of patients who had no runs at screening but had run at Week 4. These parameters will also be listed together with the start and stop of Holter recording.
6.4. Vital Signs
Change from baseline (pre-dose at Visit 2) to each post-dose assessment at Day 1, Week 1, Week 2, Week 3 and Week 4 in vital signs parameters
Change from pre-dose to each post-dose assessment at Week 1, Week 2, Week 3 and Week 4 in vital signs parameters
Blood pressure (systolic and diastolic) and pulse rate will be measured at screening (visit 1) and pre-dose, 30 minutes and 1, 2, 4, 6, 8 and 12 hours post-dose at visits 2 and 6. Blood pressure and pulse rate will be measured at pre-dose and 30 minutes, 1, 2 and 3 hours after dosing at visits 3 to 5.
6.4.1. Analysis of Vital Signs
Vital signs to be analyzed and presented are body weight, sitting blood pressure (systolic and diastolic), sitting pulse rate, and BMI. Vital signs at all study visits and changes from baseline at post-baseline visits will be summarized by visit for each treatment group using descriptive statistics.
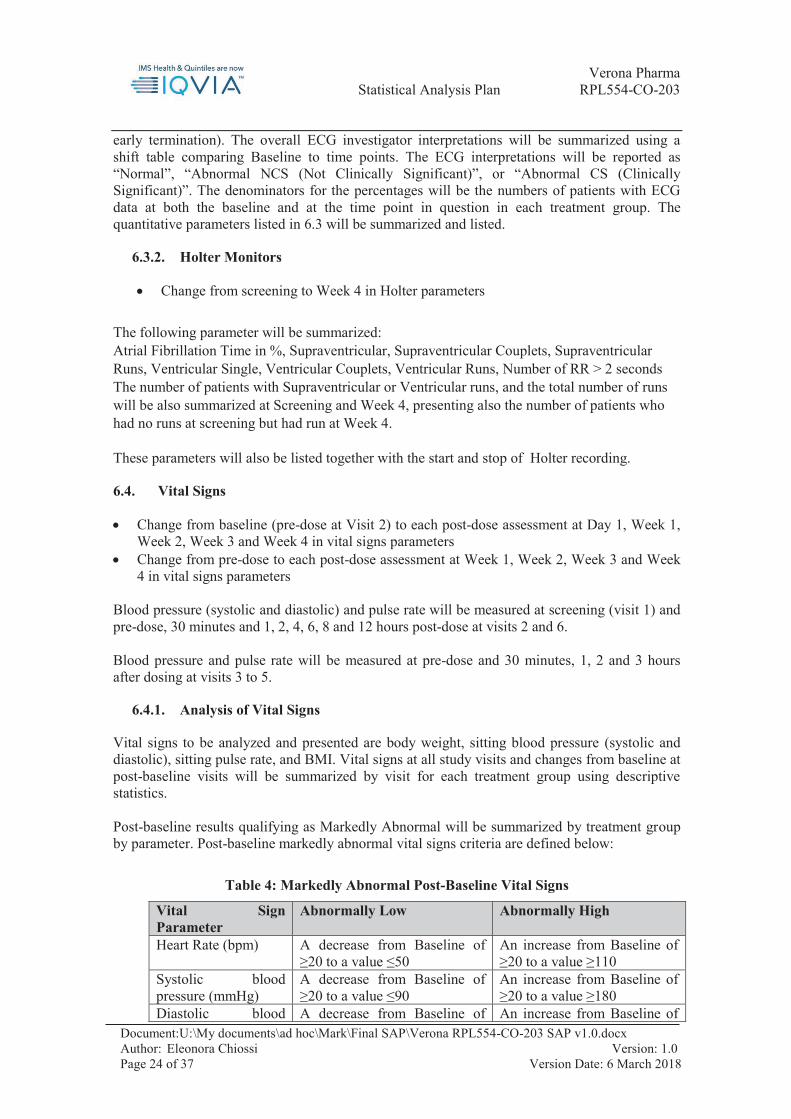
Post-baseline results qualifying as Markedly Abnormal will be summarized by treatment group by parameter. Post-baseline markedly abnormal vital signs criteria are defined below:
Table 4: Markedly Abnormal Post-Baseline Vital Signs
Vital Sign Parameter
Abnormally Low Abnormally High
Heart Rate (bpm) A decrease from Baseline of ≥20 to a value ≤50
An increase from Baseline of ≥20 to a value ≥110
Systolic blood pressure (mmHg)
A decrease from Baseline of ≥20 to a value ≤90
An increase from Baseline of ≥20 to a value ≥180
Diastolic blood A decrease from Baseline of An increase from Baseline of
Statistical Analysis Plan
Verona Pharma
RPL554-CO-203
Document:U:\My documents\ad hoc\Mark\Final SAP\Verona RPL554-CO-203 SAP v1.0.docx Author: Eleonora Chiossi Version: 1.0 Page 25 of 37 Version Date: 6 March 2018
pressure (mmHg) ≥20 to a value ≤50 ≥20 to a value ≥105 Body weight (kg) Loss of ≥ 5% Gain of ≥ 5%
Vital sign measurements will be presented by patient, visit and parameter in a data listing.
6.5. Physical Findings
The physical examination will be performed at screening and end of study (or early termination) and the results will only be listed.
6.6. Drug induced bronchospasm
Drug induced bronchospasm, defined as a decrease from pre-dose FEV1 value of > 20% within the first hour after dosing.
6.6.1. Analysis of drug induced bronchospasm
The number of patients with at least one event of drug induced bronchospasm will be summarized by counts and percentage, overall and displayed by spirometry assessment (Day 1 and Week 1 to 4). The total number of events will also be displayed.
7. Pharmacokinetic
Concentration of study medication at pre-dose assessment of Week 1 and Week 4 Correlation of pre-dose concentration with trough FEV1 at Week 1 and at Week 4
7.1. Analysis of pharmacokinetic
The concentration of study medication will be summarized at week 1 and 4. The correlation with the pre-dose FEV1 value will be presented in a graphical representation. Pearson’s correlation and its 95% CI will be presented as well.

Statistical Analysis Plan
Verona Pharma
RPL554-CO-203
Document:U:\My documents\ad hoc\Mark\Final SAP\Verona RPL554-CO-203 SAP v1.0.docx Author: Eleonora Chiossi Version: 1.0 Page 26 of 37 Version Date: 6 March 2018
8. REFERENCES
Decramer, M., Celli, B., Kesten, S., & al. (2009). Effect of tiotropium on outcomes in patients
with moderate chronic obstructive pulmonary disease (UPLIFT): a prespecified subgroup analysis of a randomised controlled trial. Lancet, 1171-1178.
Dmitrienko, A., Bretz, F., Westfall, P. H., Troendle, J., Wiens, B. L., Tamhane, A. C., & Hsu, J. C. (2009). Multiple testing methodology. Multiple Testing Problems in Pharmaceutical Statistics. Chapman and Hall/CRC Press, New York.
Evidera. (2014). Retrieved from http://www.ema.europa.eu/docs/en_GB/document_library/Other/2015/04/WC500185443.pdf
EXACT-PRO Initiative. (2014, October). EMA. Retrieved from http://www.ema.europa.eu/docs/en_GB/document_library/Other/2015/04/WC500185444.pdf
Hajiro, T., Nishimura, K., Tsukino, M., Ikeda, A., Koyama, H., & Uzumi, T. (1998). Comparison of discriminative properties among disease-specific questionnaires for measuring health-related quality of life in patients with COPD. American Journal of Respiratory and Critical Care Medicine, 785-790.
Jones, P. (2012, April). Retrieved from http://www.healthstatus.sgul.ac.uk/SGRQ_download/sgrq-c-manual-april-2012.pdf
Jones, P. W., Quirk, F. H., & Baveystock, C. M. (1991). The St George's Respiratory Questionnaire. Respiratory Medicine, 25-31.
Mahler, D. A., & Wells, C. K. (1988). Evaluation of clinical methods for rating dyspnea. Chest, 580-586.
Marcus, R., Peritz, E., & Gabriel, K. R. (1976). On Closed Testing Procedures With Special Reference to Ordered Analysis of Variance. Biometrika, 655-660.
Maurer, W., Hothorn, L. A., & Lehmacher, W. (1995). Multiple Comparisons in Drug Clinical Trials and Preclinical Assays: A-priori ordered Hypotheses. Testing Principles in Clinical and Preclinical Trials (J. Vollmar, editor) STuttgart, Gustav Fisher Verlag, 3-18.
Meguro, M., Barley, E. A., Spencer, S., & Jones, P. W. (2007). Development and Validation of an Improved, COPD-Specific Version of the St. George Respiratory Questionnaire. Chest, 456-463.
Miller, M. R., & al. (2005). Standardisation of spirometry. European Respiratory Journal, 153-161.
SAS Institute, Inc. (1999). SAS Procedures Guide, version 8. Cary, NC: SAS Institute. Siddiqui O, H. H. (2009). MMRM vs. LOCF: a comprehensive comparison based on simulation
study and 25 NDA datasets. Journal of biopharmaceutical statistics, 19(2):227-46. Tamhane, A. C., & Logan, B. R. (2002). Multiple Test Procedures for Identifying the Minimum
Effective and Maximum Safe Doses of a Drug. Journal of the American Statistical Association, 293-301.
Westfall, P. H., & Krishen, A. (2001). Optimally weighted, fixed sequence, and gatekeeping multiple testing procedures. Journal of Statistical Planning and Inference 99, 25-40.
WHO Collaborating Centre for International Drug Monitoring. (1993). WHO Drug Dictionary. Uppsala, Sweden (Box 26, S-751-03).
St
atis
tical
Ana
lysi
s Pla
n
V
eron
a Ph
arm
a R
PL55
4-C
O-2
03
Doc
umen
t:U:\M
y do
cum
ents
\ad
hoc\
Mar
k\Fi
nal S
AP\
Ver
ona
RPL
554-
CO
-203
SA
P v1
.0.d
ocx
Aut
hor:
Eleo
nora
Chi
ossi
V
ersi
on: 1
.0
Page
27
of 3
7
Ver
sion
Dat
e: 5
th M
arch
201
8
9.
App
endi
ces
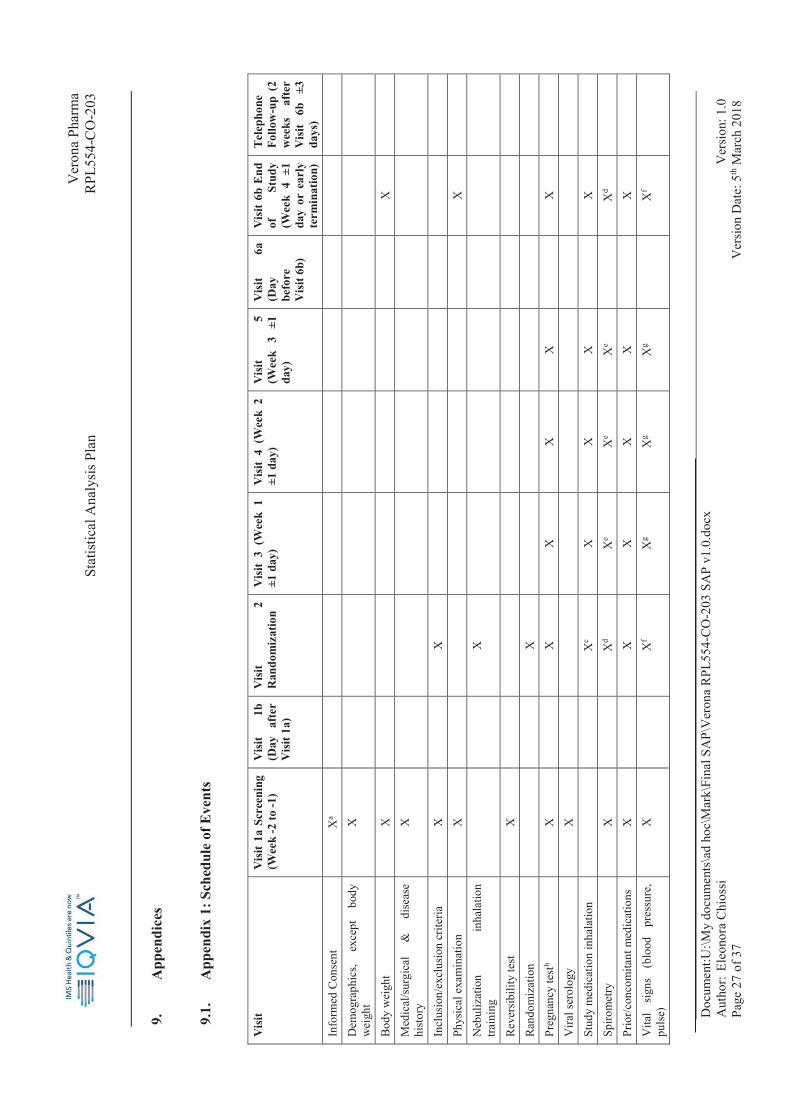
9.1.
A
ppen
dix
1: S
ched
ule
of E
vent
s
V
isit
Vis
it 1a
Scr
eeni
ng
(Wee
k -2
to -1
) V
isit
1b
(Day
af
ter
Vis
it 1a
)
Vis
it 2
Ran
dom
izat
ion
Vis
it 3
(Wee
k 1
±1
day
) V
isit
4 (W
eek
2 ±1
day
) V
isit
5 (W
eek
3 ±1
da
y)
Vis
it 6a
(D
ay
befo
re
Vis
it 6b
)
Vis
it 6b
End
of
St
udy
(Wee
k 4
±1
day
or e
arly
te
rmin
atio
n)
Tel
epho
ne
Follo
w-u
p (2
w
eeks
af
ter
Vis
it 6b
±3
da
ys)
Info
rmed
Con
sent
X
a
D
emog
raph
ics,
exce
pt
body
w
eigh
t X
Bod
y w
eigh
t X
X
Med
ical
/sur
gica
l &
di
seas
e hi
stor
y X
Incl
usio
n/ex
clus
ion
crite
ria
X
X
Ph
ysic
al e
xam
inat
ion
X
X
N
ebul
izat
ion
inha
latio
n tra
inin
g
X
Rev
ersi
bilit
y te
st
X
Ran
dom
izat
ion
X
Preg
nanc
y te
stb
X
X
X
X
X
X
V
iral s
erol
ogy
X
Stud
y m
edic
atio
n in
hala
tion
Xc
X
X
X
X
Spiro
met
ry
X
X
d X
e X
e X
e
Xd
Pr
ior/c
onco
mita
nt m
edic
atio
ns
X
X
X
X
X
X
V
ital
sign
s (b
lood
pr
essu
re,
puls
e)
X
X
f X
g X
g X
g
Xf

St
atis
tical
Ana
lysi
s Pla
n
V
eron
a Ph
arm
a R
PL55
4-C
O-2
03
Doc
umen
t:U:\M
y do
cum
ents
\ad
hoc\
Mar
k\Fi
nal S
AP\
Ver
ona
RPL
554-
CO
-203
SA
P v1
.0.d
ocx
Aut
hor:
Eleo
nora
Chi
ossi
V
ersi
on: 1
.0
Page
28
of 3
7
Ver
sion
Dat
e: 5
th M
arch
201
8
Vis
it V
isit
1a S
cree
ning
(W
eek
-2 to
-1)
Vis
it 1b
(D
ay
afte
r V
isit
1a)
Vis
it 2
Ran
dom
izat
ion
Vis
it 3
(Wee
k 1
±1
day
) V
isit
4 (W
eek
2 ±1
day
) V
isit
5 (W
eek
3 ±1
da
y)
Vis
it 6a
(D
ay
befo
re
Vis
it 6b
)
Vis
it 6b
End
of
St
udy
(Wee
k 4
±1
day
or e
arly
te
rmin
atio
n)
Tel
epho
ne
Follo
w-u
p (2
w
eeks
af
ter
Vis
it 6b
±3
da
ys)
ECG
(QTc
F an
d he
art r
ate)
X
Xh
Xh
Xh
Xh
X
h
Labo
rato
ry sa
fety
test
s X
X
X
Che
st X
-ray
X
A
dmin
iste
r SG
RQ
-C,B
DI/T
DI
and
MR
C b
reat
hles
snes
s sca
le
Xi
X
i
X
i
Adm
inis
ter
PGA
C
ques
tionn
aire
X
X
Dis
pens
e st
udy
med
icat
ion
and
nebu
lizer
X
X
X
X
Col
lect
stu
dy m
edic
atio
n an
d ne
buliz
er
X
X
X
X
Dis
pens
e co
mpr
esso
r
X
Col
lect
com
pres
sor
X
Dis
pens
e al
bute
rol/s
albu
tam
olj
X
Trou
gh P
K b
lood
sam
ple
X
X
Plac
e H
olte
r Mon
itor
X
X
Rem
ove
Hol
ter M
onito
rk
X
X
Dis
pens
e sy
mpt
om e
-dia
ry
X

St
atis
tical
Ana
lysi
s Pla
n
V
eron
a Ph
arm
a R
PL55
4-C
O-2
03
Doc
umen
t:U:\M
y do
cum
ents
\ad
hoc\
Mar
k\Fi
nal S
AP\
Ver
ona
RPL
554-
CO
-203
SA
P v1
.0.d
ocx
Aut
hor:
Eleo
nora
Chi
ossi
V
ersi
on: 1
.0
Page
29
of 3
7
Ver
sion
Dat
e: 5
th M
arch
201
8
Vis
it V
isit
1a S
cree
ning
(W
eek
-2 to
-1)
Vis
it 1b
(D
ay
afte
r V
isit
1a)
Vis
it 2
Ran
dom
izat
ion
Vis
it 3
(Wee
k 1
±1
day
) V
isit
4 (W
eek
2 ±1
day
) V
isit
5 (W
eek
3 ±1
da
y)
Vis
it 6a
(D
ay
befo
re
Vis
it 6b
)
Vis
it 6b
End
of
St
udy
(Wee
k 4
±1
day
or e
arly
te
rmin
atio
n)
Tel
epho
ne
Follo
w-u
p (2
w
eeks
af
ter
Vis
it 6b
±3
da
ys)
Rev
iew
sym
ptom
e-d
iary
X
X
X
X
X
Col
lect
sym
ptom
e-d
iary
X
Adv
erse
eve
nt q
uest
ioni
ng
X
X
X
X
X
X
X
Abb
revi
atio
ns: B
DI=
Bas
elin
e D
yspn
ea In
dex;
EC
G=e
lect
roca
rdio
gram
; IC
S=in
hale
d co
rtico
ster
oids
; MR
C=M
edic
al R
esea
rch
Cou
ncil;
QTc
F=Q
T in
terv
al c
orre
cted
usi
ng F
rider
icia
’s fo
rmul
a;
PGA
C=P
atie
nt G
loba
l Ass
essm
ent o
f Cha
nge;
PK
=pha
rmac
okin
etic
s; S
GR
Q-C
=St G
eorg
e’s R
espi
rato
ry Q
uest
ionn
aire
-CO
PD sp
ecifi
c; T
DI=
Tran
sitio
n D
yspn
ea In
dex
(a)
Info
rmed
Con
sent
may
be
obta
ined
prio
r to
scre
enin
g vi
sit
(b)
Seru
m p
regn
ancy
test
at V
isit
1; u
rine
preg
nanc
y te
st a
t Vis
its 2
-6
(c)
At V
isit
2, st
udy
med
icat
ion
is to
be
adm
inis
tere
d at
the
stud
y cl
inic
twic
e; fi
rst,
just
afte
r ran
dom
izat
ion
and
agai
n 12
hou
rs la
ter o
nce
all a
sses
smen
ts a
re c
ompl
ete
(d)
Spiro
met
ry a
t Vis
its 2
and
6 is
per
form
ed 1
5 m
inut
es p
re-d
ose,
follo
wed
by
30 m
inut
es a
nd 1
, 2, 3
, 4, 6
, 8 a
nd 1
2 ho
urs p
ost-d
ose
(e)
Spiro
met
ry a
t Vis
its 3
, 4, a
nd 5
are
per
form
ed 1
5 m
inut
es p
re-d
ose,
follo
wed
by
30 m
inut
es a
nd 1
, 2, a
nd 3
hou
rs p
ost-d
ose
(f)
Vita
l sig
ns a
t Vis
its 2
and
6 a
re m
easu
red
pre-
dose
and
30
min
utes
, 1, 2
, 4, 6
, 8, a
nd 1
2 ho
urs p
ost-d
ose
(g)
Vita
l sig
ns a
t Vis
its 3
, 4, a
nd 5
are
mea
sure
d pr
e-do
se a
nd 3
0 m
inut
es, 1
, 2 a
nd 3
hou
rs p
ost-d
ose
(h)
ECG
at V
isits
2 th
roug
h 6
is p
erfo
rmed
pre
-dos
e an
d 2
hour
s pos
t-dos
e (i)
B
DI a
dmin
iste
red
at V
isit
2, T
DI a
dmin
iste
red
at V
isits
4 a
nd 6
(j)
A
seco
nd c
anis
ter o
f alb
uter
ol/s
albu
tam
ol m
ay b
e di
spen
sed
durin
g th
e st
udy
if ne
cess
ary
(k)
Hol
ter i
s to
be re
mov
ed 2
4 ho
urs (
± 1
hour
) afte
r pla
cem
ent

Statistical Analysis Plan
Verona Pharma
RPL554-CO-203
Document:U:\My documents\ad hoc\Mark\Final SAP\Verona RPL554-CO-203 SAP v1.0.docx Author: Eleonora Chiossi Version: 1.0 Page 30 of 37 Version Date: 5th March 2018
9.2. Appendix 2: EXACT-PRO and E-RS Scoring Instructions
The following instructions are from the user manual for EXACT-PRO, version 7.0 (EXACT-PRO Initiative, 2014)
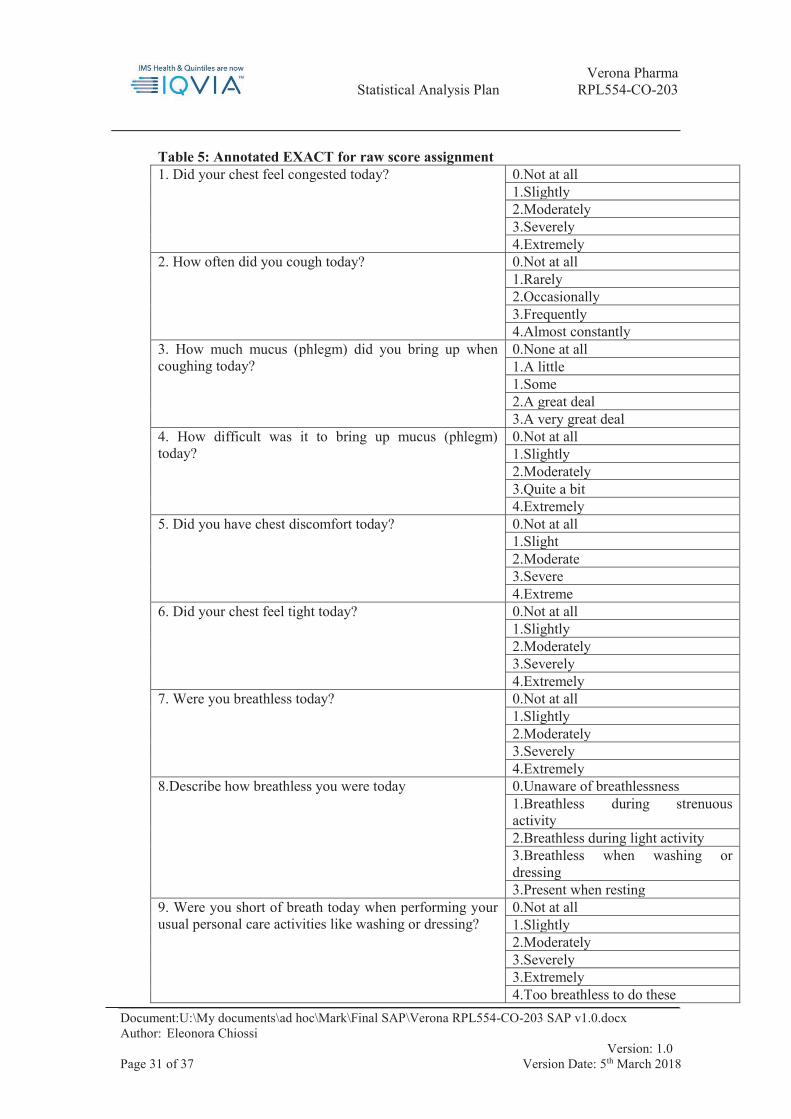
Raw scores are assigned to each item response option as shown in Table 7 below. Please note that items 3, 8, 9, 10, 11 and 14 have separate scoring instructions, namely with the same raw score being assigned to several answer options.
Sum the item-level raw scores of the 14 EXACT items to form the raw summed score For each raw summed score, look up the corresponding EXACT Total score from Table
6 below. Notes:
1. EXACT total scores range from 0 to 100 2. If the EXACT total score is 0, set to missing. 3. The Evaluating Respiratory Symptoms (E-RS) part of the EXACT tool consists
of the first 11 items, broken down as follows (Evidera, 2014): a. RS-Breathlessness: items 7, 8, 9, 10 and 11 (score range: 0-17); b. RS-Cough & Sputum: items 2, 3 and 4 (score range: 0-11); c. RS-Chest Symptoms: items 1, 5 and 6 (score range: 0-12).
Scoring the domains:
The following respiratory domains are included in the EXACT measure: Breathlessness, Cough/Sputum and Chest Symptoms. Items are assigned to specific domains as follows (please note that items 4, 12, 13 and 14 do not correspond to a domain and hence, are not used in domain-specific analyses):
Breathlessness: items 7, 8, 9, 10 and 11 Cough and Sputum: items 2 and 3 Chest Symptoms: items 1, 5 and 6
Score the domains as follows: For each day, sum the item-level raw scores of the items comprising the domain to form
the domain raw summed score. If no diary entry exists for a given day, leave the domain raw summed score missing.
For each domain raw summed score, look up the corresponding EXACT domain score from Table 7
If no diary entry exists for a given day, leave the EXACT domain score missing. If the daily EXACT domain score is 0, set it to missing.
Statistical Analysis Plan
Verona Pharma
RPL554-CO-203
Document:U:\My documents\ad hoc\Mark\Final SAP\Verona RPL554-CO-203 SAP v1.0.docx Author: Eleonora Chiossi Version: 1.0 Page 31 of 37 Version Date: 5th March 2018
Table 5: Annotated EXACT for raw score assignment 1. Did your chest feel congested today? 0.Not at all
1.Slightly 2.Moderately 3.Severely 4.Extremely
2. How often did you cough today? 0.Not at all 1.Rarely 2.Occasionally 3.Frequently 4.Almost constantly
3. How much mucus (phlegm) did you bring up when coughing today?
0.None at all 1.A little 1.Some 2.A great deal 3.A very great deal
4. How difficult was it to bring up mucus (phlegm) today?
0.Not at all 1.Slightly 2.Moderately 3.Quite a bit 4.Extremely
5. Did you have chest discomfort today? 0.Not at all 1.Slight 2.Moderate 3.Severe 4.Extreme
6. Did your chest feel tight today? 0.Not at all 1.Slightly 2.Moderately 3.Severely 4.Extremely
7. Were you breathless today? 0.Not at all 1.Slightly 2.Moderately 3.Severely 4.Extremely
8.Describe how breathless you were today 0.Unaware of breathlessness 1.Breathless during strenuous activity 2.Breathless during light activity 3.Breathless when washing or dressing 3.Present when resting
9. Were you short of breath today when performing your usual personal care activities like washing or dressing?
0.Not at all 1.Slightly 2.Moderately 3.Severely 3.Extremely 4.Too breathless to do these

Statistical Analysis Plan
Verona Pharma
RPL554-CO-203
Document:U:\My documents\ad hoc\Mark\Final SAP\Verona RPL554-CO-203 SAP v1.0.docx Author: Eleonora Chiossi Version: 1.0 Page 32 of 37 Version Date: 5th March 2018
10. Were you short of breath today when performing your usual indoor activities like cleaning or household work?
0.Not at all 1.Slightly 2.Moderately 3.Severely 3.Extremely 3.Too breathless to do these
11. Were you short of breath today when performing your usual activities outside the home such as yard work or errands?
0.Not at all 1.Slightly 2.Moderately 3.Severely 3.Extremely 3.Too breathless to do these
12. Were you tired or weak today? 0.Not at all 1.Slightly 2.Moderately 3.Severely 4.Extremely
13. Last night, was your sleep disturbed? 0.Not at all 1.Slightly 2.Moderately 3.Severely 4.Extremely
14. How scared or worried were you about your lung problems today?
0.Not at all 1.Slightly 2.Moderately 3.Severely 3.Extremely

Statistical Analysis Plan
Verona Pharma
RPL554-CO-203
Document:U:\My documents\ad hoc\Mark\Final SAP\Verona RPL554-CO-203 SAP v1.0.docx Author: Eleonora Chiossi Version: 1.0 Page 33 of 37 Version Date: 5th March 2018
Table 6: Raw Summed Score to Scale Conversion Table for EXACT Total Score
Raw Summed Score
EXACT Total Score
Raw Summed Score
EXACT Total Score
0 0 26 50 1 8 27 51 2 13 28 52 3 17 29 53 4 20 30 54 5 23 31 55 6 25 32 57 7 27 33 58 8 28 34 59 9 30 35 60 10 31 36 61 11 33 37 63 12 34 38 64 13 36 39 65 14 37 40 67 15 38 41 68 16 39 42 70 17 40 43 72 18 41 44 73 19 42 45 75 20 43 46 77 21 44 47 80 22 46 48 83 23 47 49 87 24 48 50 92 25 49 51 100
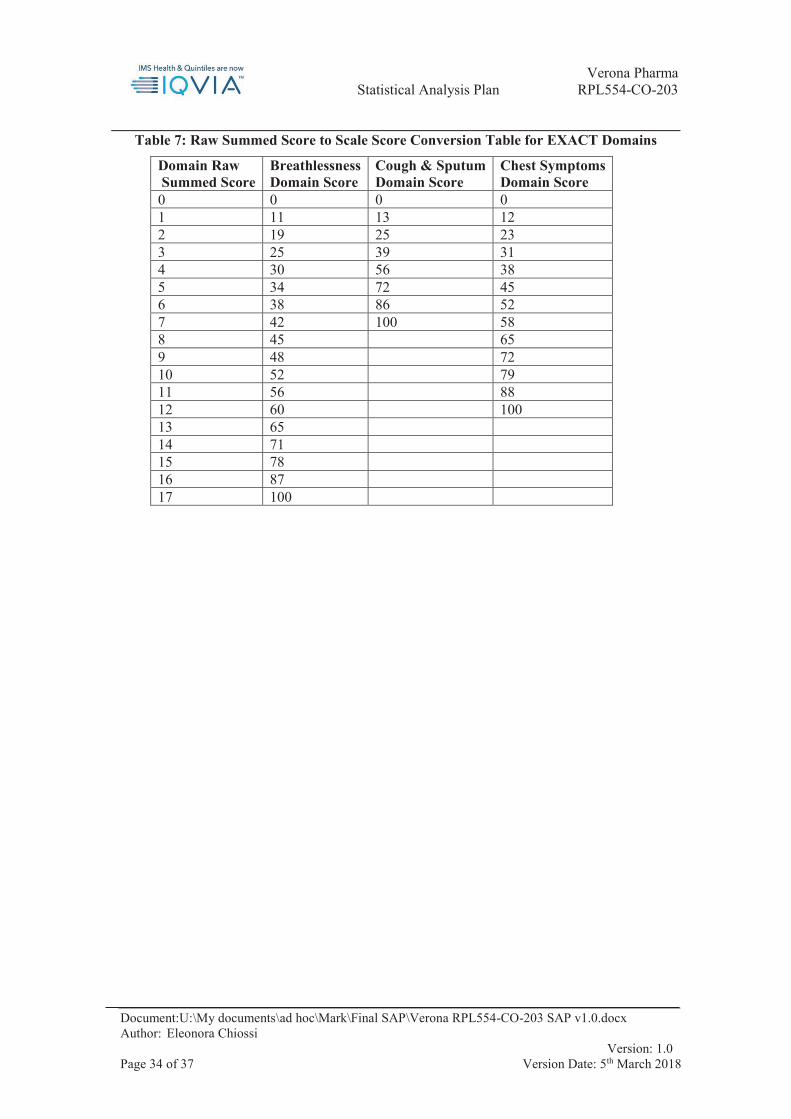
Statistical Analysis Plan
Verona Pharma
RPL554-CO-203
Document:U:\My documents\ad hoc\Mark\Final SAP\Verona RPL554-CO-203 SAP v1.0.docx Author: Eleonora Chiossi Version: 1.0 Page 34 of 37 Version Date: 5th March 2018
Table 7: Raw Summed Score to Scale Score Conversion Table for EXACT Domains
Domain Raw Summed Score
Breathlessness Domain Score
Cough & Sputum Domain Score
Chest Symptoms Domain Score
0 0 0 0 1 11 13 12 2 19 25 23 3 25 39 31 4 30 56 38 5 34 72 45 6 38 86 52 7 42 100 58 8 45 65 9 48 72 10 52 79 11 56 88 12 60 100 13 65 14 71 15 78 16 87 17 100

Statistical Analysis Plan
Verona Pharma
RPL554-CO-203
Document:U:\My documents\ad hoc\Mark\Final SAP\Verona RPL554-CO-203 SAP v1.0.docx Author: Eleonora Chiossi Version: 1.0 Page 35 of 37 Version Date: 5th March 2018
9.3. Appendix 3: SGRQ-C
Table 9: SGRQ-C Item weights Question Answers Weight Part 1 Question 1: I cough
Most days 80.6 Several days 46.3 With chest infections 28.1 Not at all 0.0
Question 2: I bring up phlegm (sputum) Most days 76.8 Several days 47.0 With chest infections 30.2 Not at all 0.0
Question 3: I have shortness of breath Most days 87.2 Several days 50.3 Not at all 0.0
Question 4: I have attacks of wheezing Most days 86.2 Several days 71.0 A few days 45.6 With chest infections 36.4 Not at all 0.0
Question 5: How many attacks of chest trouble have you had
3 or more 80.1 1 or 2 attacks 52.3 None 0.0
Question 6: How often do you have good days (with little chest trouble)
None 93.3 A few 76.6 Most are good 38.5 Every day 0.0
Question 7: If you have a wheeze, is it worse in the morning?
No 0.0 Yes 62.0
Part 2 Question 8: How would you describe your chest condition?
The most important problem I have 82.9 Causes me a few problems 34.6 Causes no problem 0.0
Question 9: Questions about what activities usually make you feel breathless
Getting washed or dressed 82.8 Walking around the home 80.2 Walking outside on the level 81.4 Walking up a flight of stairs 76.1 Walking up hills 75.1
Question 10: More questions about your cough and breathlessness
My cough hurts 81.1
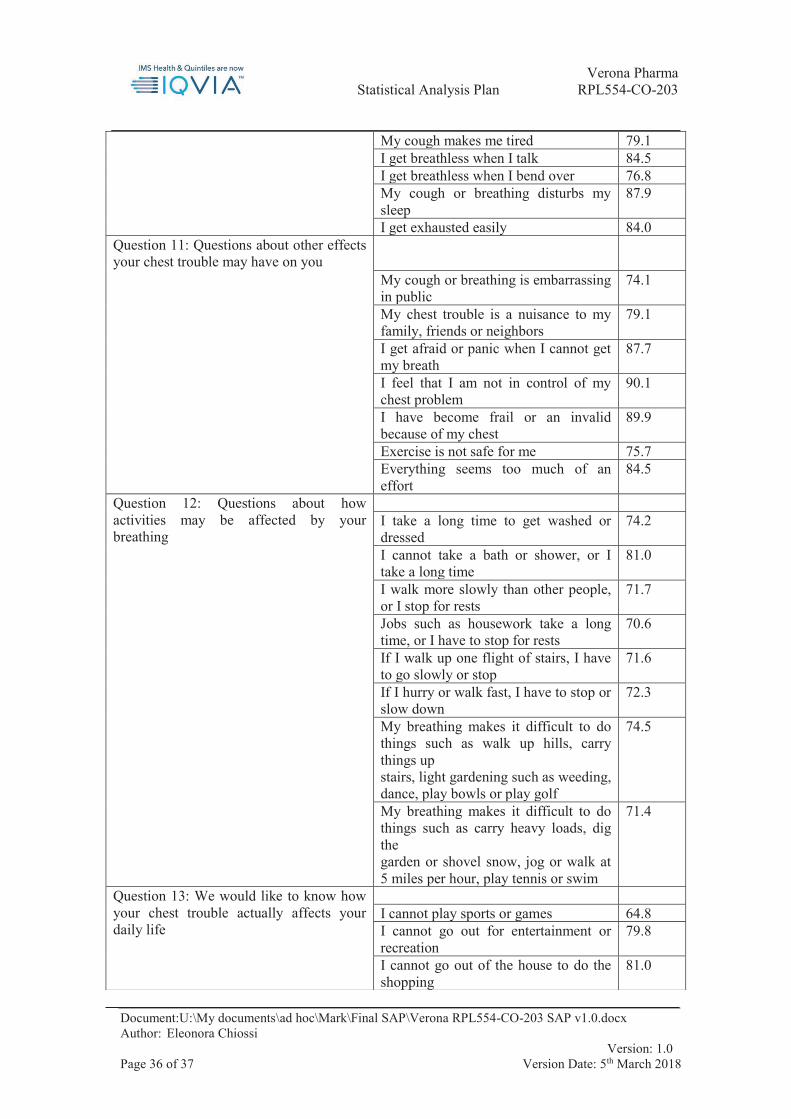
Statistical Analysis Plan
Verona Pharma
RPL554-CO-203
Document:U:\My documents\ad hoc\Mark\Final SAP\Verona RPL554-CO-203 SAP v1.0.docx Author: Eleonora Chiossi Version: 1.0 Page 36 of 37 Version Date: 5th March 2018
My cough makes me tired 79.1 I get breathless when I talk 84.5 I get breathless when I bend over 76.8 My cough or breathing disturbs my sleep
87.9
I get exhausted easily 84.0 Question 11: Questions about other effects your chest trouble may have on you
My cough or breathing is embarrassing in public
74.1
My chest trouble is a nuisance to my family, friends or neighbors
79.1
I get afraid or panic when I cannot get my breath
87.7
I feel that I am not in control of my chest problem
90.1
I have become frail or an invalid because of my chest
89.9
Exercise is not safe for me 75.7 Everything seems too much of an effort
84.5
Question 12: Questions about how activities may be affected by your breathing
I take a long time to get washed or dressed
74.2
I cannot take a bath or shower, or I take a long time
81.0
I walk more slowly than other people, or I stop for rests
71.7
Jobs such as housework take a long time, or I have to stop for rests
70.6
If I walk up one flight of stairs, I have to go slowly or stop
71.6
If I hurry or walk fast, I have to stop or slow down
72.3
My breathing makes it difficult to do things such as walk up hills, carry things up stairs, light gardening such as weeding, dance, play bowls or play golf
74.5
My breathing makes it difficult to do things such as carry heavy loads, dig the garden or shovel snow, jog or walk at 5 miles per hour, play tennis or swim
71.4
Question 13: We would like to know how your chest trouble actually affects your daily life
I cannot play sports or games 64.8 I cannot go out for entertainment or recreation
79.8
I cannot go out of the house to do the shopping
81.0

Statistical Analysis Plan
Verona Pharma
RPL554-CO-203
Document:U:\My documents\ad hoc\Mark\Final SAP\Verona RPL554-CO-203 SAP v1.0.docx Author: Eleonora Chiossi Version: 1.0 Page 37 of 37 Version Date: 5th March 2018
9.4. Appendix 4: SAS code for efficacy analysis
proc mixed data=efficacy; class subject trt country visit; model outcome= trt visit trt*visit b_fev /ddfm=kr; repeated visit/ sub=subject type=un; lsmeans trt*visit/ cl diff; run; where outcome is the change from baseline
I cannot do housework 79.1 I cannot move far from my bed or chair
94.0
Question 14: Tick the statement which you think best describes how your chest affects you
It does not stop me doing anything I would like to do
0.0
It stops me doing one or two things I would like to do
42.0
It stops me doing most of the things I would like to do
84.2
It stops me doing everything I would like to do
96.7