Embed Size (px)
Citation preview
U.S. Department of Education • Office of Educational Research and Improvement NCES 2000–102
NATIONAL CENTER FOR EDUCATION STATISTICSStatistical Analysis Report
A Report on Teachers’ Use of TechnologySeptember 2000
A Report on Teachers’ Use of TechnologySeptember 2000
Teachers’ Toolsfor the 21st CenturyTeachers’ Toolsfor the 21st Century
Becky SmerdonStephanie CronenLawrence LanahanJennifer AndersonNicholas IannottiJanuary AngelesAmerican Institutes for Research, in conjunctionwith the Education Statistics Services Institute
Bernie GreeneProject OfficerNational Center for Education Statistics
NATIONAL CENTER FOR EDUCATION STATISTICSStatistical Analysis Report
Teachers’ Tools for the 21st
Century:A Report on Teachers’ Use of Technology
U.S. Department of EducationOffice of Educational Research and Improvement NCES 2000-102
U.S. Department of EducationRichard W. RileySecretary
Office of Educational Research and ImprovementC. Kent McGuireAssistant Secretary
National Center for Education StatisticsGary W. PhillipsActing Commissioner
The National Center for Education Statistics (NCES) is the primary federal entity for collecting, analyzing, andreporting data related to education in the United States and other nations. It fulfills a congressional mandate tocollect, collate, analyze, and report full and complete statistics on the condition of education in the United States;conduct and publish reports and specialized analyses of the meaning and significance of such statistics; assist stateand local education agencies in improving their statistical systems; and review and report on education activitiesin foreign countries.
NCES activities are designed to address high priority education data needs; provide consistent, reliable, complete,and accurate indicators of education status and trends; and report timely, useful, and high quality data to the U.S.Department of Education, the Congress, the states, other education policymakers, practitioners, data users, andthe general public.
We strive to make our products available in a variety of formats and in language that is appropriate to a variety ofaudiences. You, as our customer, are the best judge of our success in communicating information effectively. Ifyou have any comments or suggestions about this or any other NCES product or report, we would like to hearfrom you. Please direct your comments to:
National Center for Education StatisticsOffice of Educational Research and ImprovementU.S. Department of Education1990 K Street, NWWashington, DC 20006-5574
September 2000
The NCES World Wide Web Home Page is http://nces.ed.gov.
Suggested Citation: U.S. Department of Education. National Center for Education Statistics. Teachers’ Tools for the21st Century: A Report on Teachers’ Use of Technology. NCES 2000–102 by Becky Smerdon, Stephanie Cronen,Lawrence Lanahan, Jennifer Anderson, Nicholas Iannotti, and January Angeles. Washingon, DC: 2000.
For ordering information on this report, write: Contact:U.S. Department of Education Bernie GreeneED Pubs (202) 502–7348P.O. Box 1398Jessup, MD 20794-1398
Or call toll free 1–877–4ED–Pubs.
Acknowledgments
This report involved a great deal of work on the part of many. The authors of this report are very gratefulto the people listed below, without whom this report could not have been completed.
At the Education Statistics Services Institute of the American Institutes for Research, Yann-Yann Shieh andMary Ann Wiehe wrote many of the computer programs that generated the estimates presented in thisreport and created the output from which the tables and figures were constructed. Melisa Doherty, RachelFirestone, Christina Kary, and Kate Lavanga assisted in development of the report. David Hurst, DouglasLevin, Vicki Lundmark, David Miller, and Mary McLaughlin reviewed various chapters of the report priorto submission to NCES. Supervised by Qiwu Liu, the ESSI Communications Design Team designed andimplemented the cover and page layout. The ESSI Communications Design Team designed and imple-mented the cover and page layout. Design Team members who contributed to this aspect of the report areMariel Escudero, Elina Hartwell, Qiwu Liu, and Jennifer Thompson.
Experts within and outside of NCES provided helpful suggestions at all stages of the report production.Serving as consultant to the authors, Edith McArthur reviewed the outline, provided suggestions, andreviewed earlier drafts of the report. At various stages of the report, a number of NCES staff members readand commented on the report, including Ellen Bradburn, Shelley Burns, Bernie Greene, Gerald Malitz,Marilyn McMillan, Larry Ogle, Valena Plisko, Carl Schmitt, and John Ralph. Outside NCES, DavidMalouf of the Office of Special Education Programs, Linda Roberts and Diane Reed of the Office ofEducational Technology, Jeff Rodamer of the Planning and Evaluation Services, and Mary Schifferli of theOffice for Civil Rights also reviewed the report.
Photo Credits
All of the photographs in the report are from Photodisc, Inc.
ExecutiveSummary
i
Background
As the availability of computers and the Internet in schools andclassrooms has grown (e.g., Williams, 2000), so has interest inthe extent to which these technologies are being used and for
what purposes. Using the Fast Response Survey System (FRSS), NCESadministered a short survey of public school teachers in 1999 that in-cluded items on teachers’ use of computers and the Internet. This re-port draws on that survey to describe teachers’ use of education tech-nology in their classrooms and schools, the availability of this technol-ogy in their classrooms and schools, their training and preparation fortheir use, and the barriers to technology use they encounter. Additionaldata sources (e.g., National Assessment of Educational Progress [NAEP],Current Population Survey [CPS]) are used throughout the report toprovide background information on these topics.
Key Findings
Technology and Instruction
Over the past ten years, NCES has administered surveys focusing pri-marily on technology (e.g., computers, connections to the Internet)infrastructure in schools and classrooms. The 1999 FRSS survey fo-cused on availability of technology and the way in which these tech-nologies are used. According to this survey:
• Approximately half of the public school teachers who had comput-ers or the Internet available in their schools used them for class-room instruction (table 2.3). Teachers assigned students to use thesetechnologies for word processing or creating spreadsheets most fre-quently (61 percent did this to some extent), followed by Internetresearch (51 percent), practicing drills (50 percent), and solvingproblems and analyzing data (50 percent—figure 2.6). Moreover,many teachers used computers or the Internet to conduct a numberof preparatory and administrative tasks (e.g., creating instructionalmaterials, gathering information for planning lessons) and com-municative (e.g., communication with colleagues) tasks.
ii
• Among those with technology available in their schools, teachers in low minority and lowpoverty schools were generally more likely than teachers in high minority and high povertyschools to use computers or the Internet for a wide range of activities, including gatheringinformation at school, creating instructional materials at school, communicating with col-leagues at school, and instructing students. For example, 57 percent of teachers in schoolswith less than 6 percent minority enrollments used computers or the Internet for Internetresearch compared with 41 percent of teachers in schools with 50 percent or more minorityenrollments (table 2.4).
• Among teachers with computers available at home, teachers with the fewest years of expe-rience were more likely than teachers with the most years of experience to use computers orthe Internet at home to gather information for planning lessons (76 percent comparedwith 63 percent) and creating instructional materials (91 percent compared with 82 per-cent—table 2.1). They were also generally more likely than more experienced teachers touse these technologies to access model lesson plans at school and at home.
Availability and Use of Technology
On a most basic level, teachers may be more likely to integrate computers and the Internet intoclassroom instruction if they have access to adequate equipment and connections. The 1999FRSS survey on teachers’ use of technology provides teachers’ perspectives on the availability ofcomputers and the Internet in their schools and classrooms and the general frequency withwhich these technologies are used. Results of this survey indicate that:
• Nearly all public school teachers (99 percent) reported having computers available some-where in their schools in 1999 (table A-3.9); 84 percent had computers available in theirclassrooms, and 95 percent had computers available elsewhere in the school (table 3.1).Teachers were generally more likely to use computers and the Internet when located intheir classrooms than elsewhere in the school (figure 4.3), while their students were morelikely to use computers and the Internet outside the classroom than inside (figure 4.8).Additionally, teachers and students with computers or Internet connections in their class-rooms used these technologies elsewhere in the school more often than teachers and studentswithout such tools in their classrooms (figures 4.5 & 4.10).
• Most public school teachers (84 percent) reported having at least one computer in theirclassrooms in 1999 (table 3.1). Thirty-six percent of teachers had one computer in theirclassrooms, 38 percent reported having two to five computers in their classrooms, and 10percent reported having more than five computers in their classrooms (table 3.2). Teachersand students with more computers or computers connected to the Internet in their class-rooms generally used these technologies more often than teachers with fewer computers orInternet connections.
• In 1999, computer and Internet availability was not equally distributed among schools.For example, teachers in schools with the lower minority enrollments (less than 6 percentor 6 to 20 percent) were more likely to have the Internet available in the classroom than

iii
teachers in schools with the highest minority enrollments (50 percent or more minorityenrollments—69 percent and 71 percent compared with 51 percent—table 3.3). More-over, teachers in schools with the lowest minority enrollments (less than 6 percent) weremore likely to report having two to five computers connected to the Internet than teachersin schools with the highest minority enrollments (19 percent compared with 9 percent—table 3.4).
• Eighty-two percent of public school teachers reported having a computer available at home,63 percent of public school teachers had the Internet available at home, and 27 percentreported that their school had a network that they could use to access the Internet fromhome (table 3.6).
Teacher Preparation and Training
Teachers’ preparation and training to use education technology is a key factor to consider whenexamining their use of computers and the Internet for instructional purposes. The 1999 FRSSsurvey indicates that:
• In 1999, approximately one-third of teachers reported feeling well prepared or very wellprepared to use computers and the Internet for classroom instruction (table A-5.5), withless experienced teachers indicating they felt better prepared to use technology than theirmore experienced colleagues (figure 5.1). For many instructional activities, teachers whoreported feeling better prepared to use technology were generally more likely to use it thanteachers who indicated that they felt unprepared (table 5.1).
• Teachers cited independent learning most frequently as preparing them for technology use(93 percent), followed by professional development activities (88 percent) and their col-leagues (87 percent—figure 5.2). Whereas half of all teachers reported that college andgraduate work prepared them to use technology, less experienced teachers were generallymuch more likely than their more experienced colleagues to indicate that this educationprepared them to use computers and the Internet (figures 5.2 and 5.3).
• Most teachers indicated that professional development activities on a number of topicswere available to them, including training on software applications, the use of the Internet,and the use of computers and basic computer training (ranging from 96 percent to 87percent—figure 5.4). Among teachers reporting these activities available, participation wasrelatively high (ranging from 83 to 75 percent—figure 5.6), with more experienced teach-ers generally more likely to participate than less experienced teachers (table 5.3). Teachersindicated that follow-up and advanced training and use of other advanced telecommunica-tions were available less frequently (67 percent and 54 percent, respectively), and approxi-mately half of the teachers reporting that these two activities were available to them partici-pated in them.
• Over a 3-year time period, most teachers (77 percent) participated in professional develop-ment activities in the use of computers or the Internet that lasted the equivalent of 4 days
iv
or less (i.e., 32 or fewer hours—figure 5.7). Teachers who spent more time in professionaldevelopment activities were generally more likely than teachers who spent less time in suchactivities to indicate they felt well prepared or very well prepared to use computers and theInternet for instruction (table 5.4).
Barriers to Teachers’ Use of Technology
Certain characteristics of classrooms and schools, such as equipment, time, technical assis-tance, and leadership, may act as either barriers to or facilitators of technology use. The 1999FRSS survey indicates that:
• In 1999, the barriers to the use of computers and the Internet for instruction most fre-quently reported by public school teachers were not enough computers (78 percent), lackof release time for teachers to learn how to use computers or the Internet (82 percent), andlack of time in schedule for students to use computers in class (80 percent—figure 6.1).Among the barriers most frequently reported by teachers to be “great” barriers to their useof computers or the Internet for instruction in 1999 were not enough computers (38 per-cent) and lack of release time for teachers to learn how to use computers or the Internet (37percent).
• Teachers’ perceptions of barriers to technology use varied by a number of teacher and schoolcharacteristics. For example, secondary teachers, teachers in large schools, and teachers incity schools were more likely than elementary teachers, teachers in small schools, and teachersin rural schools, respectively, to report that not enough computers was a great barrier (table6.1). Additionally, teachers in schools with more than 50 percent minority enrollmentswere more likely to cite outdated, incompatible, or unreliable computers as a great barrierthan teachers in schools with less than 6 percent minority enrollments (32 percent com-pared with 22 percent).
• Generally, teachers’ who perceived lacking computers and time for students to use comput-ers as great barriers were less likely than those who did not perceive these conditions asbarriers to assign students to use computers or the Internet for some instructional activities.For example, teachers who reported insufficient numbers of computers as a great barrierwere less likely than teachers reporting that this was not a barrier to assign students to usecomputers or the Internet to a “large extent” for practicing drills (9 percent compared with19 percent), word processing or creating spreadsheets (14 percent compared with 25 per-cent), and solving problems and analyzing data (6 percent compared with 13 percent—table 6.2).
Summary
The primary focus of this report is teachers’ use of computers or the Internet for instructionalpurposes. Findings presented in this report indicate that about half of the teachers with com-puters available in their schools used them for classroom instruction. Moreover, teachers’ use
v
of technology was related to their training and preparation and work environments. As de-scribed in detail in the report, teachers were more likely to use these technologies when thetechnologies were available to them, available in their classrooms as opposed to computer labs,and available in greater numbers. Moreover, teachers who reported feeling better preparedwere more likely to use these technologies than their less prepared colleagues. (Teachers whospent more time in professional development reported feeling better prepared than their col-leagues.) Finally, teachers who perceived that lacking computers and time for students to usecomputers as great barriers were less likely than their colleagues to assign students to use com-puters or the Internet for some instructional activities.

vii
Table of Contents
Section Page
Executive Summary ............................................................................................................. i
1 Introduction ........................................................................................................... 1
Technology and Instruction ................................................................................... 2
Teacher Training and Preparation .......................................................................... 3
Technology Use in Schools and Classrooms .......................................................... 4
Equipment .................................................................................................. 5
Time ............................................................................................................ 5
Technical Assistance ................................................................................... 6
Leadership ................................................................................................... 6
General Framework ................................................................................................ 6
Study Methodology ................................................................................................ 6
Organization of This Report .................................................................................. 7
2 Chapter Highlights ................................................................................................. 9
Technology and Instruction ................................................................................. 11
Technology Use in Schools and Classrooms: Findings from NAEP .................. 11
Computer Use for Reading and Writing Instruction .............................. 11
Technology Use in Schools and Classrooms: Findings from FRSS ................... 13
Preparatory and Administrative Tasks ...................................................... 13
Communication ....................................................................................... 18
Classroom Instruction .............................................................................. 22
3 Chapter Highlights ............................................................................................... 29
Availability of Technology for Instructional Purposes ......................................... 31
Availability of Computers and the Internet: 1990 to 1999 ............................... 31
Computer Availability: 1990 to 1999 ..................................................... 32
Internet Availability: 1994 to 1999 ........................................................ 32
Differences in the Growth of Availability ............................................................ 34
Availability of Computers at Home: 1994 to 1998 ............................................ 36
Teachers’ Computer Availability at Home ............................................... 36
viii
Students’ Computer Availability at Home ............................................... 38
Availability of Technology to Teachers and Students in 1999 ............................. 39
Computer Availability in the School ....................................................... 39
Internet Availability at School.................................................................. 41
E-mail Availability in School.................................................................... 45
Availablity at Home: Computers, Internet, and School Network ..................... 45
Teachers’ Computer, Internet, and School Network Availability
at Home .................................................................................................... 45
Students’ Computer Availability at Home ............................................... 47
Teachers’ Use of Technology and Computer Availability in their
Classrooms ............................................................................................................ 49
Preparatory Tasks and Computer Availability .......................................... 50
Classroom Instruction and Computer Availability .................................. 50
4 Chapter Highlights ............................................................................................... 53
Frequency of Technology Use .............................................................................. 55
Frequency of Technology Use in Schools and Classrooms: 1997 to 1998......... 55
Internet ..................................................................................................... 55
Current Frequency of Technology Use in Schools and Classrooms .................... 55
Frequency of Teachers’ Technology Use at School ................................... 56
Frequency of Students’ Technology Use at School .................................. 61
Current Frequency of Technology Use at Home ................................................. 67
Teacher Use of Computers and the Internet at Home ............................ 68
Frequency of Technology Use at Home and Technology Use for
Instruction ................................................................................................ 70
Student Access to Computers and the Internet at Home........................ 71
5 Chapter Highlights ............................................................................................... 73
Teacher Preparation and Training ........................................................................ 75
Teachers’ Feelings of Preparedness ....................................................................... 75
Preparedness and Teachers’ Use of Technology ........................................ 75
Teacher Preparation and Training ........................................................................ 76
Sources of Training ................................................................................... 77
ix
Professional Development ........................................................................ 79
Support and Guidance for Participation in Technology Training ........... 84
6 Chapter Highlights ............................................................................................... 89
Barriers to Teachers’ Use of Technology ............................................................... 91
Barriers to Technology Use ................................................................................... 93
Differences in Teachers’ Reports of Great Barriers .............................................. 93
Availability of and Access to Computers and the Internet ...................... 93
Lack of Time ............................................................................................. 95
Institutional and Technical Support for Using Technology ................................ 95
Barriers and Teachers’ Instructional Activities ..................................................... 97
7 Conclusions ........................................................................................................ 101
Teacher Use of Technology ................................................................................. 101
Teachers’ Training and Preparation .................................................................... 102
Teachers’ Work Environment ............................................................................. 102
Teacher and School Characteristics .................................................................... 103
Years of Teaching Experience.................................................................. 103
Minority Enrollment and Poverty Concentration ................................. 104
Instructional Level .................................................................................. 104
New Directions ................................................................................................... 105
New NCES Data Sources for Education Technology Issues ............................. 106
References ........................................................................................................... 107
List of Appendices
A: Standard Error Tables for Text Tables and Figures ............................................ A-1
B: Survey Methodology and Data Reliability ........................................................ B-1
C: Survey Questionnaire ........................................................................................ C-1
xi
List of Text Tables
Text Table Page
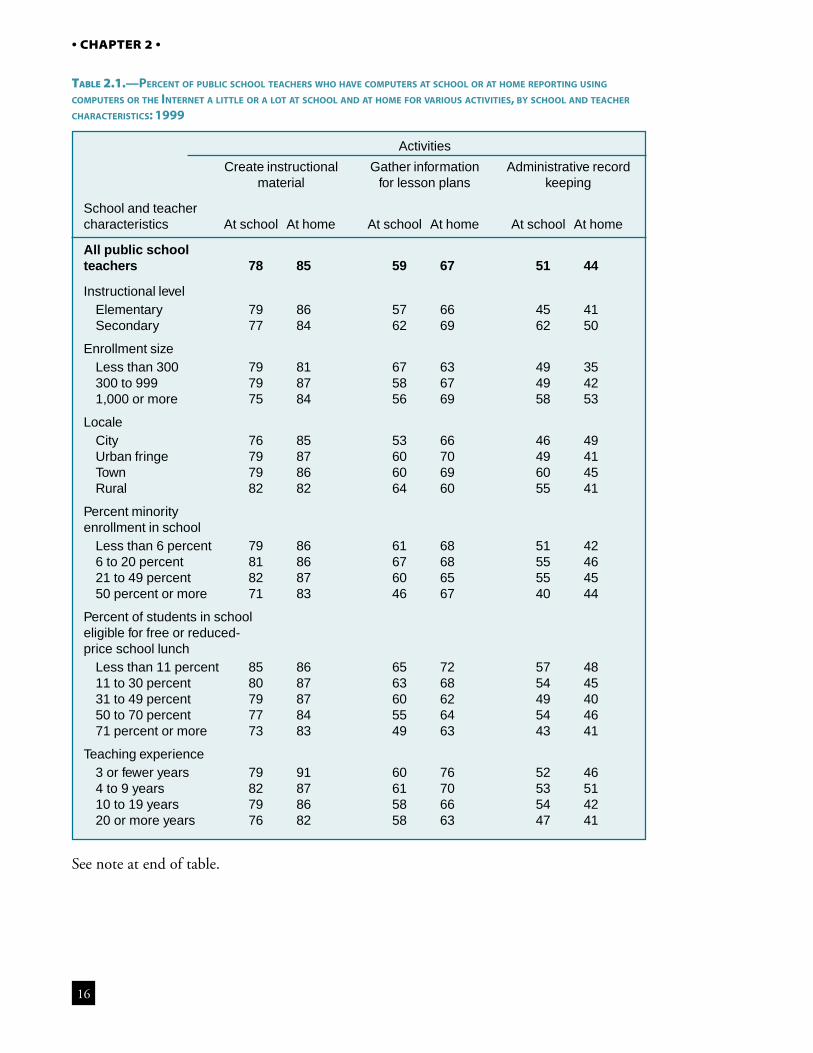
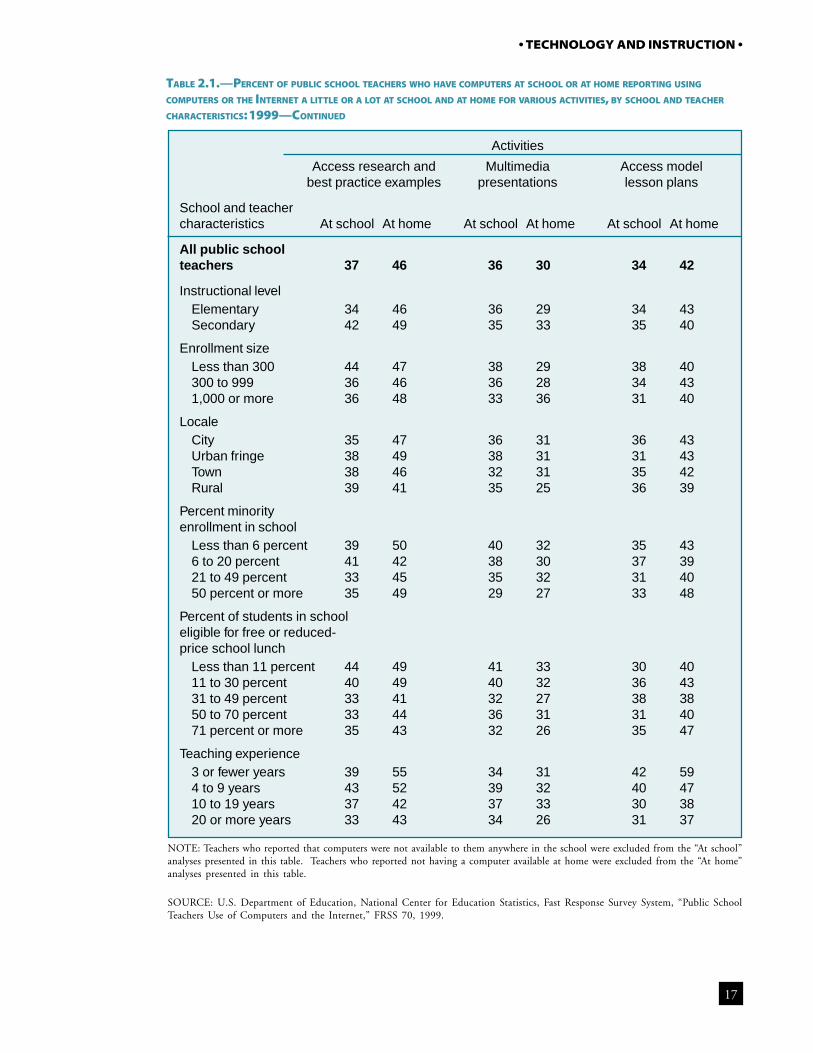
2.1 Percent of public school teachers who have computers at school or at homereporting using computers or the Internet a little or a lot at school and at homefor various activities, by school and teacher characteristics: 1999......................... 16
2.2 Percent of public school teachers who have computers at school or at homereporting using computers or the Internet a little or a lot at school and at home,for various activities, by school and teacher characteristics: 1999......................... 20
2.3 Percent of public school teachers who have computers at school reporting useof computers or the Internet for instruction during class time, by school andteacher characteristics: 1999 ................................................................................ 23
2.4 Percent of public school teachers who have computers at school assigningstudents to do various activities with computers or the Internet to any extent,by school and teacher characteristics: 1999 ......................................................... 26
3.1 Percent of public school teachers reporting computer availability in theclassroom and elsewhere in school, by school characteristics: 1999 ..................... 40
3.2 Percent of public school teachers reporting varying numbers of computersavailable in the classroom, by school characteristics: 1999 ................................... 42
3.3 Percent of public school teachers reporting Internet availability in the classroomand elsewhere in school, by school characteristics: 1999 ...................................... 44
3.4 Percent of public school teachers reporting varying numbers of computers inthe classroom with Internet connections, by school characteristics: 1999 ............ 46
3.5 Percent of public school teachers having e-mail available to them at school, byschool characteristics: 1999 ................................................................................. 47
3.6 Percent of public school teachers having computers and the Internet availableto them at home, and the percent of teachers having a school network that theycan access from home, by school characteristics: 1999 ........................................ 48
3.7 Percent of public school teachers reporting that more than 50 percent of theirstudents have computers at home, by school characteristics: 1999 ...................... 49
3.8 Percent of public school teachers by number of computers available inclassroom who report assignment of various activities to a small, moderate,or large extent, or not at all: 1999 ....................................................................... 52
xii
4.1 Percent of public school teachers reporting using e-mail at school to a largeextent when available, by school characteristics: 1999 ......................................... 62
4.2 Percent of public school teachers reporting student use of the Internet in theclassroom, computer labs, media centers, or libraries to any extent during classtime, by school characteristics: 1999 ................................................................... 68
5.1 Percent of public school teachers reporting using computers or the Internet forvarious activities at school to any extent, by extent to which they felt preparedto use computers and the Internet for instruction: 1999 ..................................... 77
5.2 Percent of public school teachers reporting assigning students various activitiesto any extent that use computers or the Internet, by extent to which they feltprepared to use computers and the Internet for instruction: 1999 ....................... 78
5.3 Percent of public school teachers reporting participation in available trainingprograms, by years of teaching experience: 1999 ................................................. 84
5.4 Percent of public school teachers reporting feeling prepared to various extentsto use computers and the Internet for instruction, by hours spent inprofessional development: 1999 .......................................................................... 85
6.1 Percent of public school teachers reporting various barriers as great barriers tothe use of computers and the Internet for instruction, by school characteristics:1999 ................................................................................................................... 94
6.2 Percent of public school teachers reporting using computers or the Internet forvarious activities at school to a large extent, by extent to which they perceivedvarious conditions to be barriers to computer and Internet use: 1999 ................. 99
xiii
List of Figures
Figure Page
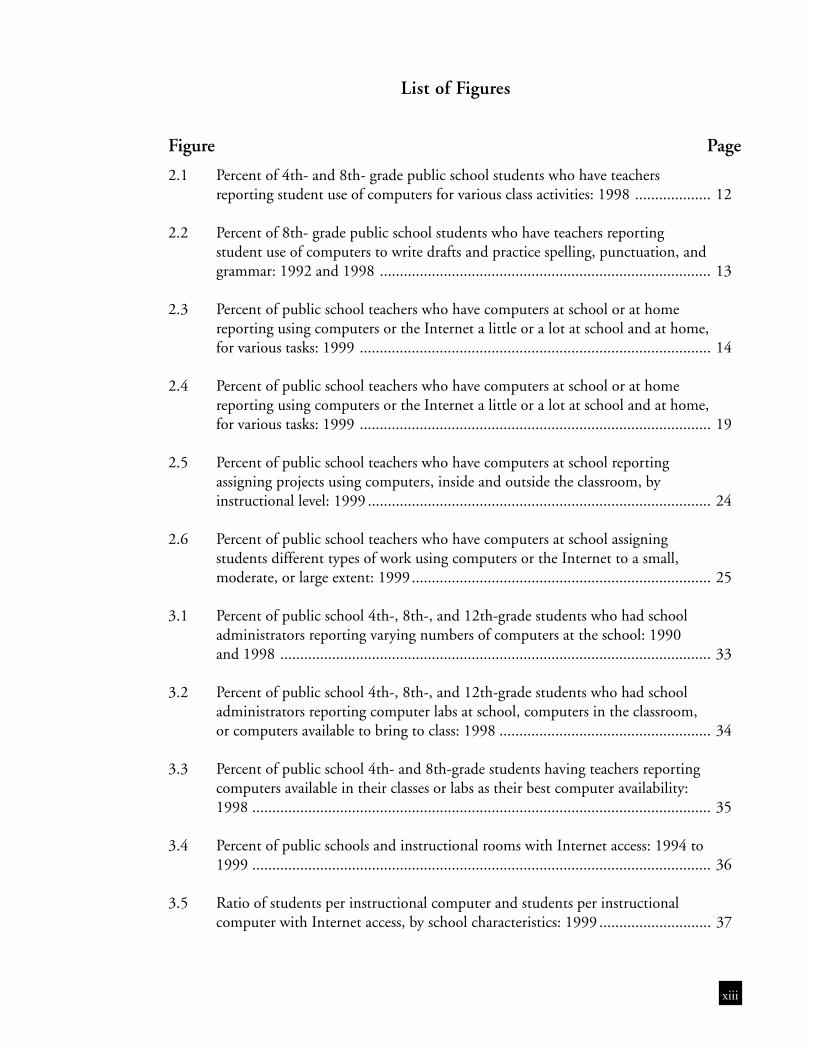
2.1 Percent of 4th- and 8th- grade public school students who have teachersreporting student use of computers for various class activities: 1998 ................... 12
2.2 Percent of 8th- grade public school students who have teachers reportingstudent use of computers to write drafts and practice spelling, punctuation, andgrammar: 1992 and 1998 ................................................................................... 13
2.3 Percent of public school teachers who have computers at school or at homereporting using computers or the Internet a little or a lot at school and at home,for various tasks: 1999 ........................................................................................ 14
2.4 Percent of public school teachers who have computers at school or at homereporting using computers or the Internet a little or a lot at school and at home,for various tasks: 1999 ........................................................................................ 19
2.5 Percent of public school teachers who have computers at school reportingassigning projects using computers, inside and outside the classroom, byinstructional level: 1999 ...................................................................................... 24
2.6 Percent of public school teachers who have computers at school assigningstudents different types of work using computers or the Internet to a small,moderate, or large extent: 1999........................................................................... 25
3.1 Percent of public school 4th-, 8th-, and 12th-grade students who had schooladministrators reporting varying numbers of computers at the school: 1990and 1998 ............................................................................................................ 33
3.2 Percent of public school 4th-, 8th-, and 12th-grade students who had schooladministrators reporting computer labs at school, computers in the classroom,or computers available to bring to class: 1998 ..................................................... 34
3.3 Percent of public school 4th- and 8th-grade students having teachers reportingcomputers available in their classes or labs as their best computer availability:1998 ................................................................................................................... 35
3.4 Percent of public schools and instructional rooms with Internet access: 1994 to1999 ................................................................................................................... 36
3.5 Ratio of students per instructional computer and students per instructionalcomputer with Internet access, by school characteristics: 1999 ............................ 37
xiv
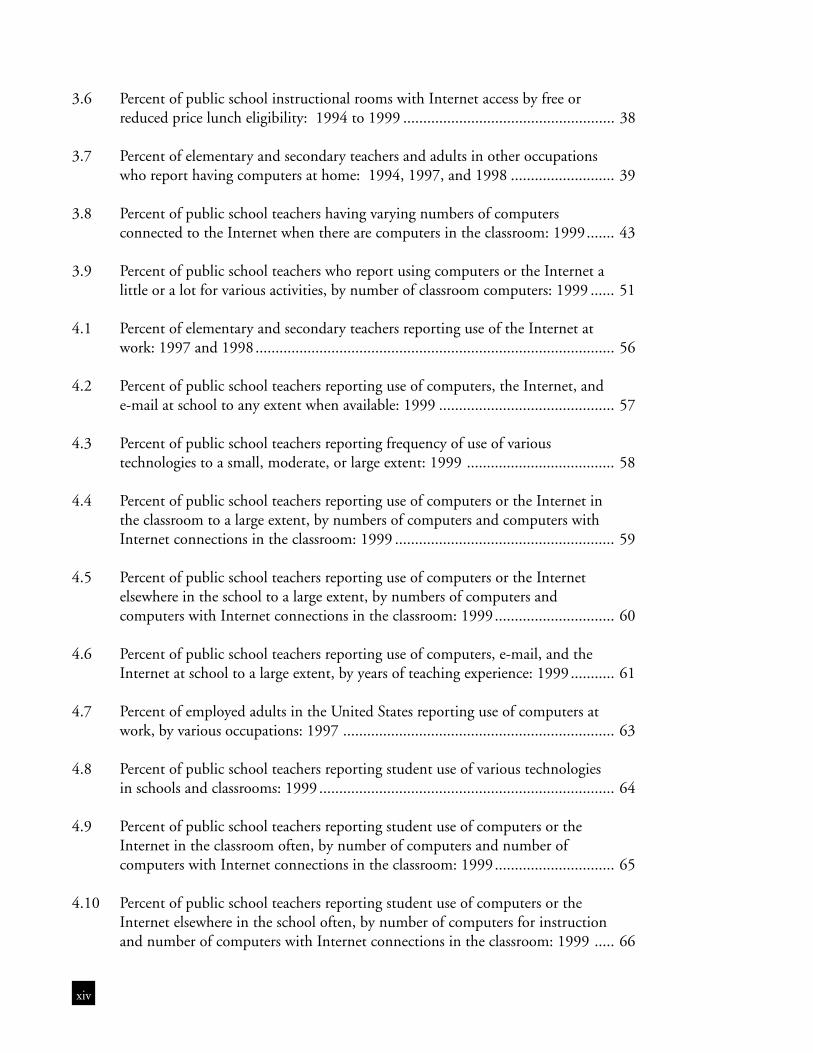
3.6 Percent of public school instructional rooms with Internet access by free orreduced price lunch eligibility: 1994 to 1999 ..................................................... 38
3.7 Percent of elementary and secondary teachers and adults in other occupationswho report having computers at home: 1994, 1997, and 1998 .......................... 39
3.8 Percent of public school teachers having varying numbers of computersconnected to the Internet when there are computers in the classroom: 1999....... 43
3.9 Percent of public school teachers who report using computers or the Internet alittle or a lot for various activities, by number of classroom computers: 1999 ...... 51
4.1 Percent of elementary and secondary teachers reporting use of the Internet atwork: 1997 and 1998.......................................................................................... 56
4.2 Percent of public school teachers reporting use of computers, the Internet, ande-mail at school to any extent when available: 1999 ............................................ 57
4.3 Percent of public school teachers reporting frequency of use of varioustechnologies to a small, moderate, or large extent: 1999 ..................................... 58
4.4 Percent of public school teachers reporting use of computers or the Internet inthe classroom to a large extent, by numbers of computers and computers withInternet connections in the classroom: 1999 ....................................................... 59
4.5 Percent of public school teachers reporting use of computers or the Internetelsewhere in the school to a large extent, by numbers of computers andcomputers with Internet connections in the classroom: 1999.............................. 60
4.6 Percent of public school teachers reporting use of computers, e-mail, and theInternet at school to a large extent, by years of teaching experience: 1999........... 61
4.7 Percent of employed adults in the United States reporting use of computers atwork, by various occupations: 1997 .................................................................... 63
4.8 Percent of public school teachers reporting student use of various technologiesin schools and classrooms: 1999 .......................................................................... 64
4.9 Percent of public school teachers reporting student use of computers or theInternet in the classroom often, by number of computers and number ofcomputers with Internet connections in the classroom: 1999.............................. 65
4.10 Percent of public school teachers reporting student use of computers or theInternet elsewhere in the school often, by number of computers for instructionand number of computers with Internet connections in the classroom: 1999 ..... 66

xv
4.11 Percent of public school teachers reporting student use of computers and theInternet at school to any extent, by instructional level: 1999 .............................. 67
4.12 Percent of employed U.S. elementary teachers, secondary teachers, and adultsin other occupations reporting use of computers and the Internet at home toany extent when computers are available in the household: 1997 and 1998 ........ 69
4.13 Percent of public school teachers reporting use of computers and the Internet athome to a large extent, by years of teaching experience: 1999 ............................. 70
4.14 Percent of public school teachers reporting technology use in school to a largeextent for instruction and student assignment, by their use of computers andthe Internet at home: 1999 ................................................................................. 71
4.15 Percent of public school 4th-, 8th-, and 12th-grade students reporting using acomputer at home at least once a week, once or twice a month, or never orhardly ever: 1992, 1994, and 1998 ..................................................................... 72
5.1 Percent of public school teachers reporting feeling not at all, somewhat, orwell/very well prepared to use computers and the Internet for classroominstruction, by years of teaching experience: 1999 .............................................. 76
5.2 Percent of public school teachers reporting feeling prepared to use computersand the Internet to a small, moderate, or large extent, by various sources oftraining: 1999 ..................................................................................................... 79
5.3 Percent of public school teachers reporting whether college/graduate workprepared them not at all or to any extent to use computers and the Internet,by years of teaching experience: 1999 ................................................................. 80
5.4 Percent of public school teachers reporting the availability of professionaldevelopment training activities for various uses and applications of technology:1999 ................................................................................................................... 81
5.5 Percent of public school teachers reporting the availability of training in the useof the Internet, by percent minority enrollment in school and percent ofstudents in school eligible for free or reduced-price school lunch: 1999 .............. 82
5.6 Percent of public school teachers reporting participating in various types oftraining, when available: 1999 ............................................................................ 83
5.7 Percent of public school teachers reporting number of hours spent inprofessional development activities in the use of computers or the Internetduring the last 3 years: 1999 ............................................................................... 85
xvi
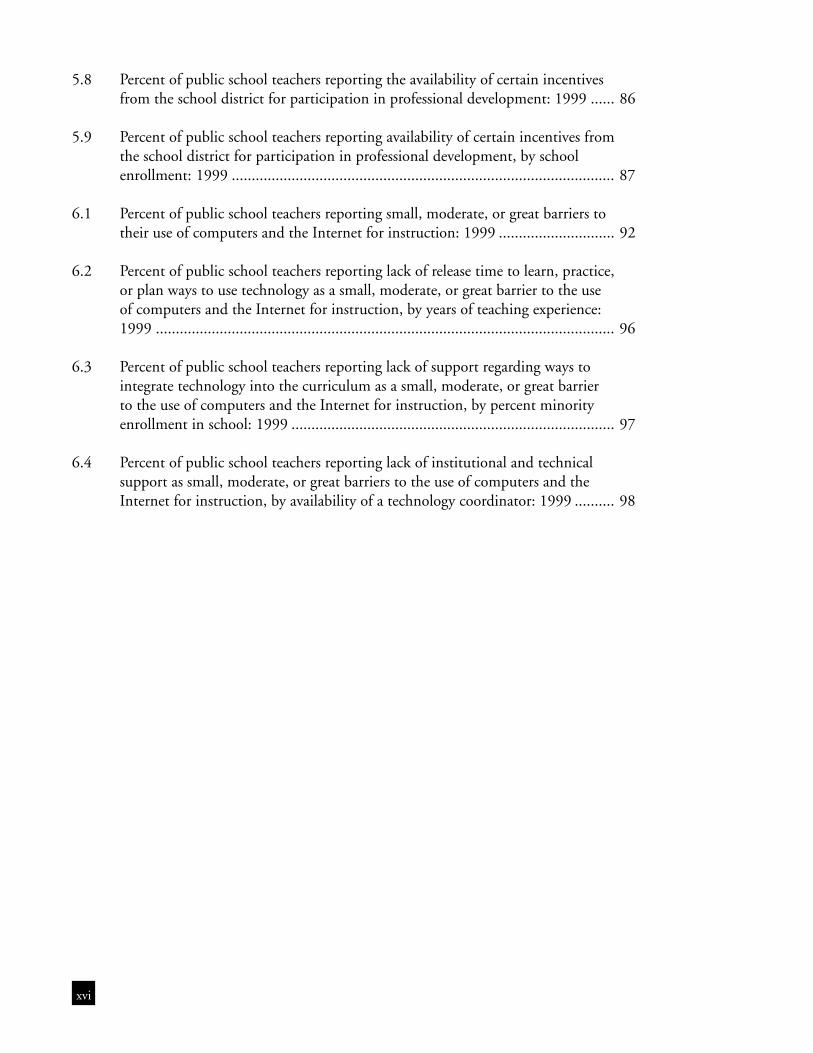
5.8 Percent of public school teachers reporting the availability of certain incentivesfrom the school district for participation in professional development: 1999 ...... 86
5.9 Percent of public school teachers reporting availability of certain incentives fromthe school district for participation in professional development, by schoolenrollment: 1999 ................................................................................................ 87
6.1 Percent of public school teachers reporting small, moderate, or great barriers totheir use of computers and the Internet for instruction: 1999 ............................. 92
6.2 Percent of public school teachers reporting lack of release time to learn, practice,or plan ways to use technology as a small, moderate, or great barrier to the useof computers and the Internet for instruction, by years of teaching experience:1999 ................................................................................................................... 96
6.3 Percent of public school teachers reporting lack of support regarding ways tointegrate technology into the curriculum as a small, moderate, or great barrierto the use of computers and the Internet for instruction, by percent minorityenrollment in school: 1999 ................................................................................. 97
6.4 Percent of public school teachers reporting lack of institutional and technicalsupport as small, moderate, or great barriers to the use of computers and theInternet for instruction, by availability of a technology coordinator: 1999 .......... 98
1C H A P T E R
1
Over the past two decades, modern technologies have trans-formed many aspects of American life, including how we com-municate, how we spend our free time, and especially how we
work. As American life and workplace demands have changed as a resultof this “technological revolution,” so have conceptions of the skills andknowledge children will need to become successful adults and the rel-evant educational experiences they should encounter while attendingschool. As a result, technology, specifically in the form of computers andthe Internet, has become a major focus of education policy and reform inrecent years. National, state, and local initiatives have provided schoolswith computer hardware and software, allowed schools and classroomsto connect to the Internet, and supported technology-focused profes-sional opportunities for teachers (Coley, 1997; U.S. Department of Edu-cation, 1996).
To date, most research on this topic has focused on the availability ofeducation technology (i.e., computer hardware, software, and equip-ment and Internet connections) in schools and classrooms. Over thepast decade, the National Center for Education Statistics (NCES) ofthe U.S. Department of Education has collected such data and shownthat availability has grown dramatically. For example, Internet access inpublic schools increased by 60 percentage points between 1994 and1999, from 3 percent in 1994 to 63 percent in 1999 (Williams, 2000).By 1999, 95 percent of public schools were connected to the Internet,with one instructional computer with an Internet connection for every 9students (Williams, 2000).
As the numbers of computers and access to the Internet in schools havegrown, so have the number of questions being asked about the extentto which these technologies are being used in schools and classroomsand for what purposes. Using the Fast Response Survey System (FRSS),NCES administered a short survey of public school teachers in 1999that included items on teachers’ use of computers and the Internet.This report draws on that survey, along with additional data sources (e.g.,
Introduction
2
• CHAPTER 1 •
National Assessment of Educational Progress [NAEP], Current Population Survey[CPS] )1, to describe teachers’ use of education technology in their classrooms and schools, theirtraining and preparation for that use, and the school and classroom contexts within which theydo or do not use these technologies. This report also includes an examination of the relationshipsbetween teachers’ use of technology and these contextual factors. As a preface to discussing theseempirical results, the introductory chapter highlights literature on technology and instruction.
Technology and Instruction
The U.S. Department of Education, in its Getting America’s students ready for the 21st Century:Meeting the technology literacy challenge, described computers as “the new basic” of Americaneducation, and the Internet as “the blackboard of the future” (U.S. Department of Education,1996, p. 3). Over the past 20 years, education technology has been a major focus of reform andpolicy at the federal level, as well as at state and local levels. Such initiatives have been guided bythe goals of increasing the availability of computers in classrooms and schools, assisting schoolswith Internet access, and providing resources and guidance for teacher training and the integra-tion of technology into the curriculum. The availability of computers and the Internet hasincreased significantly in the nation’s schools and classrooms (Williams, 2000). This increasehas been coupled with initiatives aimed toward understanding how best to use technology toimprove teaching and learning and training educators to use technology effectively.
Existing research on education technology includes a small number of national studies thatdescribe teachers’ use of technology, as well as their training to use these tools. Specifically, thisresearch suggests that most current and past uses of education technology have typically sup-ported traditional notions of teaching and learning. For example, in the early 1980s, studentsmost often used computers for drill and practice (Becker, 1983). Typically, drill-and-practicesoftware consists of sequences of worksheet-style questions that automatically adjust their dif-ficulty to match individual students’ responses. Also, in the early 1980s, teachers typically usedcomputers to teach students programming skills (Becker, 1983). They rarely used computersfor content-related instruction (Becker, 1985); students were more likely to learn about how touse computers at school than they were to use computers to learn about mathematics or socialstudies (Becker, 1983).
By the early 1990s, the practice of using computers for programming had declined consider-ably and an emphasis on using computers as a tool for learning content had emerged (Becker,1994; Sutton, 1991). However, the primary use of computers remained drill and practice inelementary schools in the early 1990s. In high schools, it was classes on computer education,and middle schools provided a combination of drill and practice and computer education(Becker, 1994). Finally, as the decade of the 1990s progressed, school computer use had shiftedto some degree to reflect a greater emphasis on problem solving and in-depth learning and lessemphasis on drill and practice and basic skills. Fulton (1997) found that 25 percent of the 1996
1 All data presented in this report are for public school students, with the exception of CPS data.
3
• INTRODUCTION •
high school graduates who participated in the Scholastic Assessment Test (SAT) program re-ported having used computers for solving math problems, processing data, or computer pro-gramming. Approximately 10 percent had used computers to solve problems in natural sci-ence. Using a nationally representative sample of teachers, the Teaching, Learning, and Com-puting Study found that CD-ROM reference and surfing the Internet were more likely to beassigned as classroom activities than games and traditional drill-and-practice applications (Becker,1999). However, many of these newer uses have been limited to a small proportion of teachersand students.
Teachers are in fact using computers or the Internet generally more frequently to complete anumber of instruction-related tasks than to augment instruction itself (Becker, 1999). For ex-ample, they may use these technologies to help prepare for classroom instruction (e.g., to accessresearch on best practices, download information to present in class) or to complete adminis-trative tasks (e.g., to record and calculate grades). The Teaching, Learning, and ComputingStudy also indicated that two-thirds of all teachers used the Internet in their effort to findinformation for use in their lessons, and about one-third reported doing so on at least a weeklybasis (Becker, 1999). In addition, teachers may also use technology to communicate with par-ents or students about students’ performance, assignments, or special events. They may also usetechnology to communicate with other members of their profession to share ideas or strategiesfor presenting content or helping students who are struggling with the content. Sixteen percentof teachers in the Teaching, Learning, and Computing Study communicated by e-mail withteachers from other schools as often as five times during the school year, and 18 percent ofteachers said they posted information on the Internet, including suggestions, opinions, or stu-dent work (Becker, 1999).
Teacher Training and Preparation
As the brief history of technology use for learning suggests, the way educators teach and stu-dents learn has not changed dramatically over the past two decades. The research on teacherchange and instructional reform in general indicates that such changes in teacher practice areoften slow, minimal, or even nonexistent (Ball, 1990; Cohen, 1990; Peterson, 1990). A num-ber of factors contribute to the success or failure of instructional reforms. One important factorthe literature has identified is that teachers do not always have opportunities to learn about andpractice instructional reforms. In the area of technology, teachers may have learned about howto use computers and adapt their teaching from a variety of sources—teacher preparation pro-grams (for prospective teachers), professional development activities (for practicing teachers),and informal learning opportunities such as assistance from classmates, colleagues, or students.
Professional development research suggests that teachers’ opportunities to learn about educa-tion technology during traditional professional development activities are often lacking. Oftendescribed as an important vehicle for school reform (Sprinthall, Reiman, & Theis-Sprinthall,
4
• CHAPTER 1 •
1996), professional development activities in general have been widely criticized for being rela-tively ineffective. Specifically, they have been described as short term, devoid of continuity due toinadequate follow-up and the lack of ongoing feedback from experts, isolated from the partici-pants’ classroom and school contexts, and characterized by too few opportunities to learn bydoing and reflecting with colleagues (Fullan with Stiegelbauer, 1991). In fact, while a majority ofteachers participate in such activities, a small percentage of teachers report feeling very well pre-pared to integrate technology into instruction (Lewis et al., 1999).
Teacher preparation programs have received similar criticisms. Traditional programs for prospec-tive teachers have been described as fragmented, superficial, and unconnected to real classroomexperiences (National Commission on Teaching and America’s Future [NCTAF], 1996). Withrespect to education technology, some observers have claimed that prospective teachers are notgetting the training they need to successfully integrate technology into classroom instruction(President’s Committee of Advisors on Science and Technology, 1997). For example, some re-searchers have reported that most students training to become teachers do not routinely usetechnology while in the field and do not work under supervising teachers who can advise themon using technology in the classroom (Moursund & Bielefeldt, 1999). Additionally, about halfof the technology training that prospective teachers get in the classroom is delivered as part ofother classes (i.e., methods and curriculum classes), and the other half is provided in the form ofstand-alone technology classes (Moursund & Bielefeldt, 1999). Furthermore, most teacher-prepa-ration programs provided by schools, colleges, and departments of education do not have writ-ten, funded, regularly updated technology plans (Moursund & Bielefeldt, 1999).
Informal learning opportunities, in addition to these formal learning opportunities, may alsoprovide teachers with assistance using technology. Peer collaboration, in particular, has beenheralded by many teachers, researchers, and policymakers as essential for teachers’ continuouslearning (Coley, 1997). Teachers may benefit when they learn about technology from oneanother and provide one another with motivation to continue working with this resource.Research supports this proposition; teachers who use computers benefit from interacting witha network of other teachers at their school who also use computers (Software and InformationIndustry Association [SIIA], 2000).
Technology Use in Schools and Classrooms
In recent years, policymakers have recognized that teachers and administrators need resourcesand organizational capacity to implement instructional reforms (CEO Forum on Educationand Technology, 2000; Coley, 1997; Means, 1995; SIIA, 2000; Trotter, 1999; U.S. Depart-ment of Education, 1996; U.S. Congress, Office of Technology Assessment, 1995a). For ex-ample, teachers’ ability and willingness to use computers and the Internet may depend, tosome extent, on the schools and classrooms in which they work. Specifically, certain character-istics of classrooms and schools, such as equipment, time, technical assistance, and leadership,may act as either barriers to or facilitators of technology use.
5
• INTRODUCTION •
Equipment
On a most basic level, teachers may be more likely to integrate computers and the Internet intoclassroom instruction if they have access to adequate equipment and connections. Researchindicates that the number of computers in America’s classrooms and schools has grown sub-stantially in recent years. In 1983, there was one computer for every 125 students (Glennan &Melmed, 1996). By 1998, there was one computer for every 6 students (Rowand, 1999). As thenumber of computers in schools has grown, so has the availability of the Internet in schoolsand classrooms. Between 1994 and 1998, Internet availability among public schools increasedfrom 35 to 95 percent (Williams, 2000). In 1997, 27 percent of instructional rooms had Internetconnections, whereas 63 percent were connected in 1999 (Williams, 2000). By 1999, there wasone instructional computer with an Internet connection for every 9 students (Williams, 2000).
However, availability is not the same as use. Computers may be available, but are they beingused? Research suggests that the answer is yes, to some degree. As availability has grown, so hasthe number of students and teachers using computers and the frequency with which they usethem (Levin et al., 1998). For example, the percent of eleventh-grade students who had neverused computers in school dropped substantially between 1984 and 1996 (from 55 to 16 per-cent) and the frequency with which students used computers increased between 1984 and1996 (Snyder and Wirt, 1998). By 1996, 72 percent of fourth-graders, 47 percent of eighth-graders, and 50 percent of eleventh-graders reported using a computer in school at least once aweek (Snyder and Wirt, 1998).
Although the presence of computers and the Internet has grown sharply in recent years, muchof the technology equipment currently in schools and classrooms is from an earlier generationof technology—computers with less processing power, less storage capability, and limited ca-pacity for being linked together electronically (Anderson & Ronnkvist, 1999). Using data from1998, Anderson and Ronnkvist (1999) have concluded that although computing capacity forinstruction has improved substantially over the past several years, there are a number of “majordeficiencies” (p. 16). For example, they found that most of the computers in schools do nothave the capability to run a large variety of multimedia software and are also limited in howthey can access graphical information on the Internet.
Time
The nation’s schools have been increasingly challenged by policy initiatives “to do better, and todo differently” (McLaughlin & Oberman, 1996, p. iv), pushing teachers to change the waythey teach. At the same time, teachers face many other challenges, including rapidly increasingtechnological changes and a greater diversity in the classroom. With regard to technology, thereis often little time in teachers’ schedules to become familiar with hardware and software or tolearn to integrate the new technology into their lesson plans (President’s Committee of Advi-sors on Science and Technology, 1997). Lack of time to become acquainted with technologyand learn to use it has been identified as the greatest obstacle to the effective use of educationtechnology (Becker, 1990b; President’s Committee of Advisors on Science and Technology, 1997).
6
• CHAPTER 1 •
Technical Assistance
Another important resource for the development of teacher expertise in the use of educationtechnology is technical assistance. A full-time computer coordinator, for example, may assistteachers with using computer software and hardware or adapting their teaching practice toinclude computer or Internet use. However, according to one study, less than 5 percent of allschools have such a staff member. Furthermore, where they are present, computer coordinatorstypically spend a significant amount of time teaching students, and much less time assistingteachers (Becker, 1998).
Leadership
Principal leadership has been described as one of the most important factors affecting theeffective use of technology in classrooms (Byrom, 1998). Principals who exhibit leadership areinstrumental in modeling the use of technology in classrooms. They understand how it cansupport best practices in instruction and assessment and provide teachers with guidance for itsuse. Principals may also participate actively in professional development activities related toeducation technology and provide teachers with opportunities to learn how to use these re-sources. In our nation’s schools, however, teachers often receive little administrative and peda-gogical guidance (President’s Committee of Advisors on Science and Technology, 1997). Forsome teachers, lack of principal leadership may prove to be a barrier to their effective use oftechnology.
General Framework
The previous discussion described three general topics of high importance in current studies ofeducation technology. First, the growing interest in how technology is being used in schoolsand classrooms and the limited research on this topic illustrate the importance of examiningwhether and how teachers use education technology. Second, because teachers may be morelikely to use education technology and to use it more effectively if they have opportunities tolearn about its use, it is valuable to understand how prepared teachers feel to use technologyand their learning experiences. Finally, it is important to understand the extent to which teach-ers’ school and classroom environments (e.g., the availability of and access to technology, sup-ports for and barriers to technology use) are related to their technology use. These generaltopics suggest that a useful model for studying education technology would begin with exam-ining whether and how teachers use it and then explore the teacher preparation and training,and the school and classroom contexts, that characterize where technology is used and where itis not used.
Study Methodology
Three sources of data are presented in this report—the Fast Response Survey System [FRSS],the Current Population Survey [CPS], and the National Assessment of Educational Progress
7
• INTRODUCTION •
(NAEP). These data sources share a number of differences that preclude comparisons amongthem. For example, the CPS findings that are presented include both public and private schoolteachers. The FRSS and NAEP findings presented in this report include only public schoolteachers. Additionally, for the NAEP, students were sampled and their teachers surveyed. Thus,unlike the FRSS teacher survey, the NAEP data are not nationally representative of teachers.
All comparative statements in this report have been tested for statistical significance using chi-square tests or t-tests adjusted for multiple comparisons using the Bonferroni adjustment andare significant at the 0.05 level. Appendix B provides a detailed discussion of the sample andsurvey methodology. The primary teacher characteristic used as an analysis variable in thisreport is total years of teaching experience (3 or fewer years, 4 to 9 years, 10 to 19 years, 20 ormore years). In addition to work experience, this variable may also, though not necessarily,represent for many teachers their age or cohort (e.g., teachers with fewer years of experiencemay be young and newly-trained). The school characteristics used as analysis variables in thisreport are school instructional level, school enrollment size, locale (city, urban fringe, town,rural), percent minority enrollment, and percent of students in school eligible for free or re-duced-price school lunch (which indicates the concentration of poverty in the school). Thesevariables are defined in appendix B.
It is important to note that many of the school characteristics used for independent analysesmay also be related to each other. For example, enrollment size and instructional level ofschools are related, with secondary schools typically being larger than elementary schools. Simi-larly, poverty concentration and minority enrollment are related, with schools with a highminority enrollment also more likely to have a high concentration of poverty. Other relation-ships between analysis variables may exist. Because of the relatively small sample size used inthe FRSS, it is difficult to separate the independent effects of these variables. Their existence,however, should be considered in the interpretation of the data presented in this report.
Organization of This Report
The remaining chapters of the report are organized around the following themes: (1) technol-ogy and instruction, (2) availability, (3) frequency of use, (4) teacher training and preparation,and (5) barriers to technology use. Each chapter presents results from the NCES Fast ResponseSurvey System 1999 teacher survey of education technology. In addition, findings from othersurveys will be referenced throughout this report to provide context for the FRSS data. Com-puter and Internet usage supplements to the CPS, a monthly survey of the U.S. populationconducted by the Census Bureau, will provide a backdrop for American students’ and teachers’computer and Internet usage. NCES’s NAEP will assist in providing a more detailed portrait ofimplementation of technology in U.S. schools. Conclusions are provided in the final chapter ofthe report. Technical information, including a detailed study methodology (appendix B) andtables of standard errors for all data presented in this report (appendix A), are included as techni-cal appendices to the report. The questionnaire is included in appendix C.
9
Chapter 2
Technology and Instruction
Highlights
• In 1999, among teachers with computer availability in their schools, many used computersor the Internet to conduct a number of preparatory and administrative tasks (e.g., creatinginstructional materials, gathering information for planning lessons) and communicative(e.g., communication with colleagues) tasks. However, teachers generally used these tech-nologies less frequently for such tasks as accessing research, best practices examples, andmodel lesson plans, as well as communicating with parents and students.
• Approximately half of public school teachers who had computers available in their schoolsused computers or the Internet for classroom instruction. Teachers assigned students to usethese technologies for word processing or creating spreadsheets most frequently, followedby Internet research, practicing drills, and solving problems and analyzing data.
• Elementary teachers were more likely than secondary teachers to use the computer or Internetto communicate with parents at home, use the computer or Internet for classroom instruc-tion, assign projects inside the classroom, or assign students to use computers to practicedrills or to solve problems and analyze data. On the other hand, secondary teachers weremore likely than elementary teachers to use computers or the Internet for administrativerecord keeping at home and school, as well as communicating with students at school,assigning projects outside of class, and assigning students to conduct research using theInternet.
• Teachers in low minority and low poverty schools were generally more likely than teachersin high minority and high poverty schools, respectively, to use computers or the Internetfor a wide range of activities, including gathering information at school, creating instruc-tional materials at school, communicating with colleagues at school, and instructing stu-dents.
• Teachers with the fewest years of experience were more likely than teachers with the mostyears of experience to use computers or the Internet to gather information for planninglessons and creating instructional materials at home. They were also generally more likelythan more experienced teachers to use these technologies to access research and best prac-tices examples at school and model lesson plans at school and at home.
2C H A P T E R
11
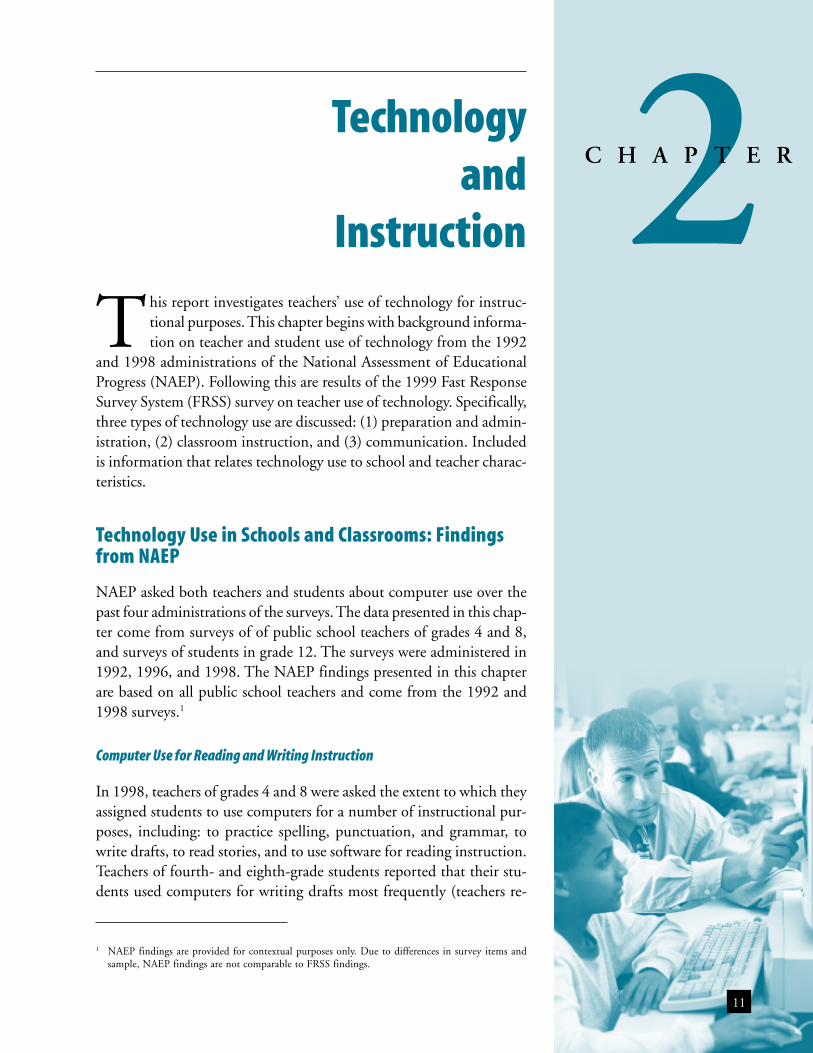
This report investigates teachers’ use of technology for instruc-tional purposes. This chapter begins with background informa-tion on teacher and student use of technology from the 1992
and 1998 administrations of the National Assessment of EducationalProgress (NAEP). Following this are results of the 1999 Fast ResponseSurvey System (FRSS) survey on teacher use of technology. Specifically,three types of technology use are discussed: (1) preparation and admin-istration, (2) classroom instruction, and (3) communication. Includedis information that relates technology use to school and teacher charac-teristics.
Technology Use in Schools and Classrooms: Findingsfrom NAEP
NAEP asked both teachers and students about computer use over thepast four administrations of the surveys. The data presented in this chap-ter come from surveys of of public school teachers of grades 4 and 8,and surveys of students in grade 12. The surveys were administered in1992, 1996, and 1998. The NAEP findings presented in this chapterare based on all public school teachers and come from the 1992 and1998 surveys.1
Computer Use for Reading and Writing Instruction
In 1998, teachers of grades 4 and 8 were asked the extent to which theyassigned students to use computers for a number of instructional pur-poses, including: to practice spelling, punctuation, and grammar, towrite drafts, to read stories, and to use software for reading instruction.Teachers of fourth- and eighth-grade students reported that their stu-dents used computers for writing drafts most frequently (teachers re-
Technologyand
Instruction
1 NAEP findings are provided for contextual purposes only. Due to differences in survey items andsample, NAEP findings are not comparable to FRSS findings.
12
• CHAPTER 2 •
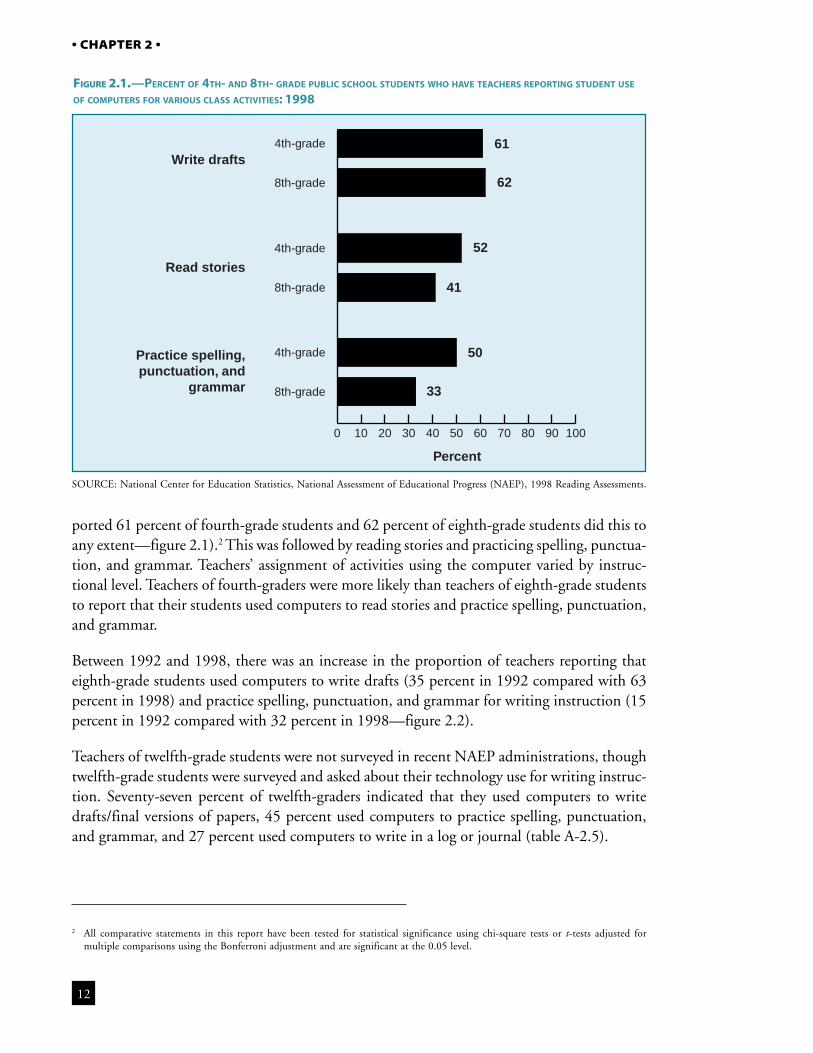
ported 61 percent of fourth-grade students and 62 percent of eighth-grade students did this toany extent—figure 2.1).2 This was followed by reading stories and practicing spelling, punctua-tion, and grammar. Teachers’ assignment of activities using the computer varied by instruc-tional level. Teachers of fourth-graders were more likely than teachers of eighth-grade studentsto report that their students used computers to read stories and practice spelling, punctuation,and grammar.
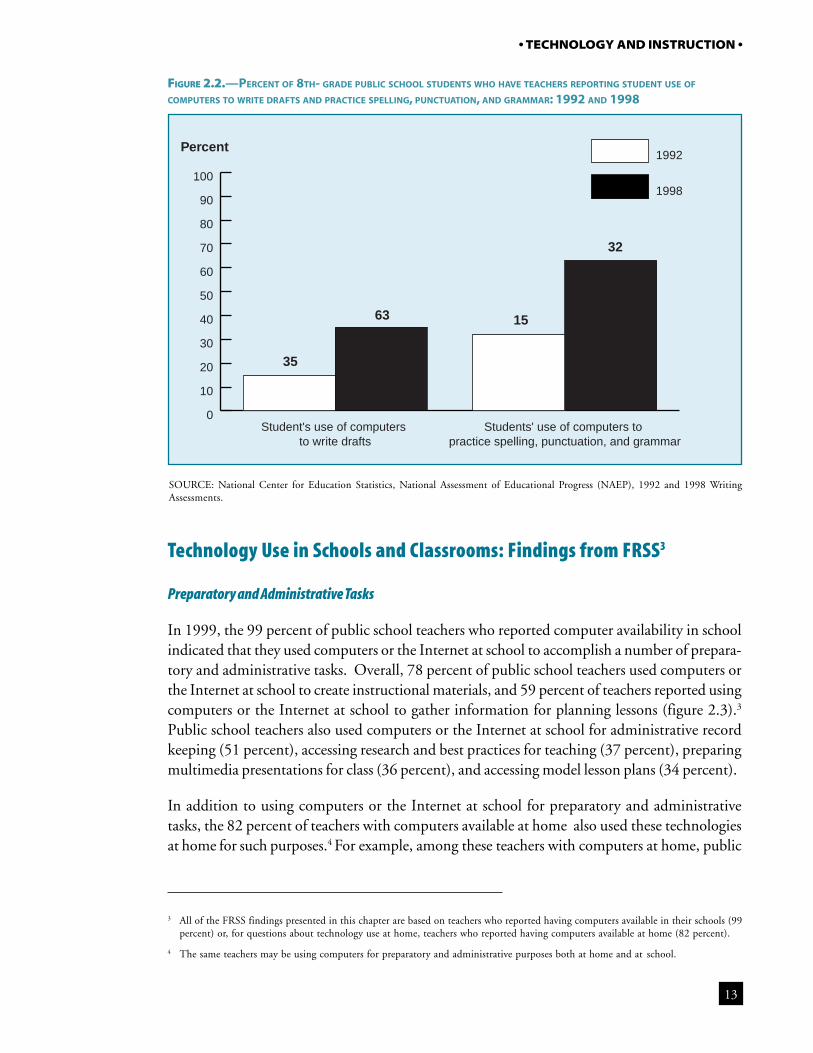
Between 1992 and 1998, there was an increase in the proportion of teachers reporting thateighth-grade students used computers to write drafts (35 percent in 1992 compared with 63percent in 1998) and practice spelling, punctuation, and grammar for writing instruction (15percent in 1992 compared with 32 percent in 1998—figure 2.2).
Teachers of twelfth-grade students were not surveyed in recent NAEP administrations, thoughtwelfth-grade students were surveyed and asked about their technology use for writing instruc-tion. Seventy-seven percent of twelfth-graders indicated that they used computers to writedrafts/final versions of papers, 45 percent used computers to practice spelling, punctuation,and grammar, and 27 percent used computers to write in a log or journal (table A-2.5).
FIGURE 2.1.—PERCENT OF 4TH- AND 8TH- GRADE PUBLIC SCHOOL STUDENTS WHO HAVE TEACHERS REPORTING STUDENT USE
OF COMPUTERS FOR VARIOUS CLASS ACTIVITIES: 1998
SOURCE: National Center for Education Statistics, National Assessment of Educational Progress (NAEP), 1998 Reading Assessments.
0 10 20 30 40 50 60 70 80 90 100
8th-grade
4th-grade
8th-grade
4th-grade
8th-grade
4th-grade
Percent
Write drafts
Read stories
Practice spelling,punctuation, and
grammar
61
62
52
41
50
33
2 All comparative statements in this report have been tested for statistical significance using chi-square tests or t-tests adjusted formultiple comparisons using the Bonferroni adjustment and are significant at the 0.05 level.
13
• TECHNOLOGY AND INSTRUCTION •
Technology Use in Schools and Classrooms: Findings from FRSS3
Preparatory and Administrative Tasks
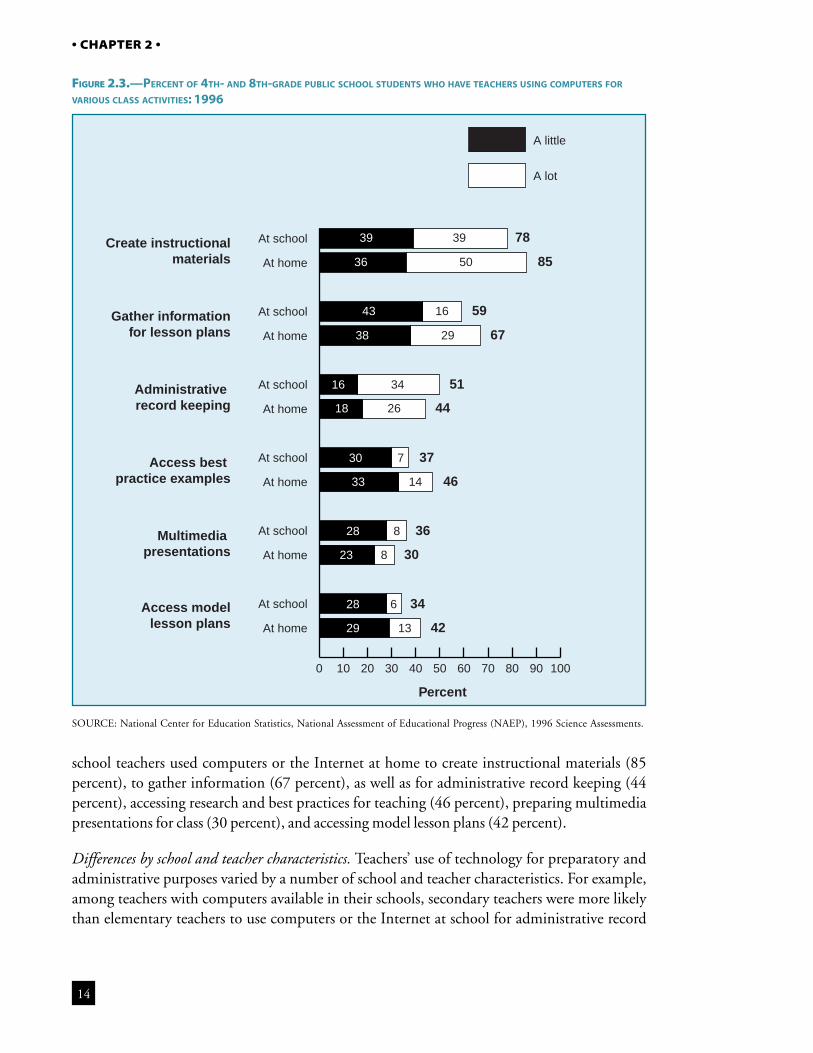
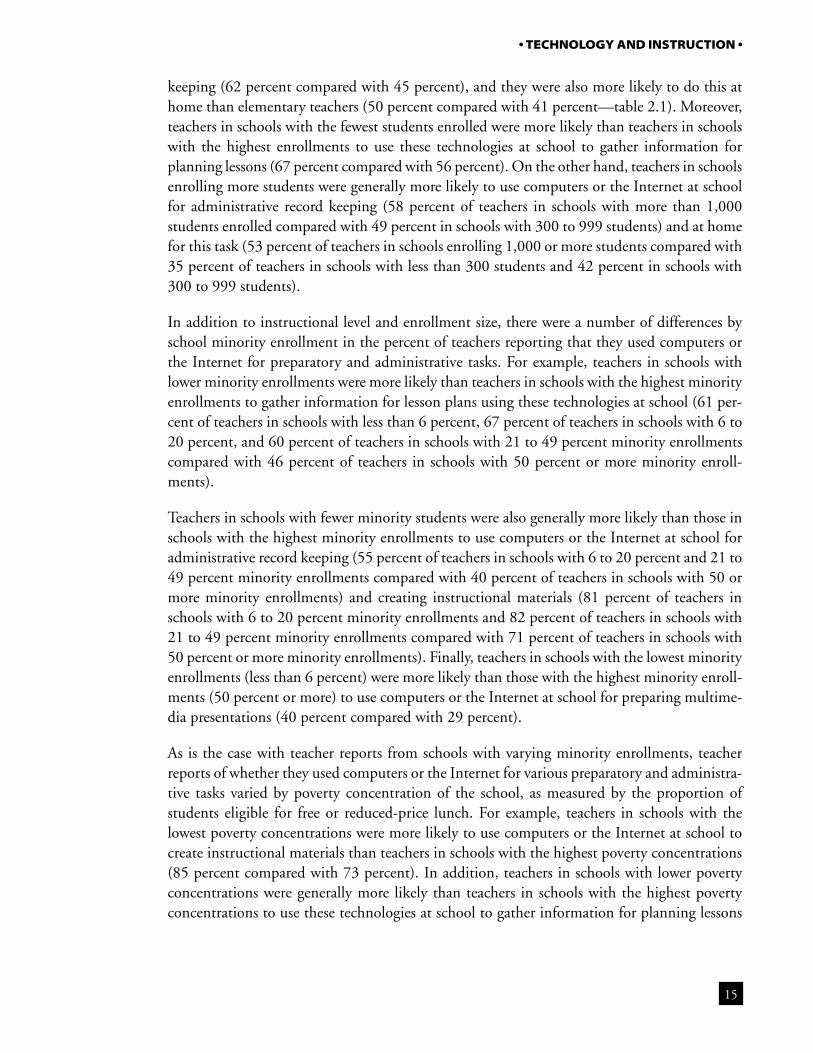
In 1999, the 99 percent of public school teachers who reported computer availability in schoolindicated that they used computers or the Internet at school to accomplish a number of prepara-tory and administrative tasks. Overall, 78 percent of public school teachers used computers orthe Internet at school to create instructional materials, and 59 percent of teachers reported usingcomputers or the Internet at school to gather information for planning lessons (figure 2.3).3
Public school teachers also used computers or the Internet at school for administrative recordkeeping (51 percent), accessing research and best practices for teaching (37 percent), preparingmultimedia presentations for class (36 percent), and accessing model lesson plans (34 percent).
In addition to using computers or the Internet at school for preparatory and administrativetasks, the 82 percent of teachers with computers available at home also used these technologiesat home for such purposes.4 For example, among these teachers with computers at home, public
FIGURE 2.2.—PERCENT OF 8TH- GRADE PUBLIC SCHOOL STUDENTS WHO HAVE TEACHERS REPORTING STUDENT USE OF
COMPUTERS TO WRITE DRAFTS AND PRACTICE SPELLING, PUNCTUATION, AND GRAMMAR: 1992 AND 1998
SOURCE: National Center for Education Statistics, National Assessment of Educational Progress (NAEP), 1992 and 1998 WritingAssessments.
3 All of the FRSS findings presented in this chapter are based on teachers who reported having computers available in their schools (99percent) or, for questions about technology use at home, teachers who reported having computers available at home (82 percent).
4 The same teachers may be using computers for preparatory and administrative purposes both at home and at school.
Percent
35
63 15
32
0
10
20
30
40
50
60
70
80
90
100
1992
1998
Students' use of computers to practice spelling, punctuation, and grammar
Student's use of computers to write drafts
14
• CHAPTER 2 •
school teachers used computers or the Internet at home to create instructional materials (85percent), to gather information (67 percent), as well as for administrative record keeping (44percent), accessing research and best practices for teaching (46 percent), preparing multimediapresentations for class (30 percent), and accessing model lesson plans (42 percent).
Differences by school and teacher characteristics. Teachers’ use of technology for preparatory andadministrative purposes varied by a number of school and teacher characteristics. For example,among teachers with computers available in their schools, secondary teachers were more likelythan elementary teachers to use computers or the Internet at school for administrative record
FIGURE 2.3.—PERCENT OF 4TH- AND 8TH-GRADE PUBLIC SCHOOL STUDENTS WHO HAVE TEACHERS USING COMPUTERS FOR
VARIOUS CLASS ACTIVITIES: 1996
SOURCE: National Center for Education Statistics, National Assessment of Educational Progress (NAEP), 1996 Science Assessments.
Percent
Create instructionalmaterials
Gather informationfor lesson plans
Administrative record keeping
Access best practice examples
Multimedia presentations
Access modellesson plans
0 10 20 30 40 50 60 70 80 90 100
A little
A lot
At home
At school
At home
At school
At home
At school
At home
At school
At home
At school
At home
At school 39 39 78
36 50 85
43 16 59
38 29 67
16 34 51
18 26 44
30 7 37
33 14 46
28 8 36
23 8 30
28 6 34
29 13 42
15
• TECHNOLOGY AND INSTRUCTION •
keeping (62 percent compared with 45 percent), and they were also more likely to do this athome than elementary teachers (50 percent compared with 41 percent—table 2.1). Moreover,teachers in schools with the fewest students enrolled were more likely than teachers in schoolswith the highest enrollments to use these technologies at school to gather information forplanning lessons (67 percent compared with 56 percent). On the other hand, teachers in schoolsenrolling more students were generally more likely to use computers or the Internet at schoolfor administrative record keeping (58 percent of teachers in schools with more than 1,000students enrolled compared with 49 percent in schools with 300 to 999 students) and at homefor this task (53 percent of teachers in schools enrolling 1,000 or more students compared with35 percent of teachers in schools with less than 300 students and 42 percent in schools with300 to 999 students).
In addition to instructional level and enrollment size, there were a number of differences byschool minority enrollment in the percent of teachers reporting that they used computers orthe Internet for preparatory and administrative tasks. For example, teachers in schools withlower minority enrollments were more likely than teachers in schools with the highest minorityenrollments to gather information for lesson plans using these technologies at school (61 per-cent of teachers in schools with less than 6 percent, 67 percent of teachers in schools with 6 to20 percent, and 60 percent of teachers in schools with 21 to 49 percent minority enrollmentscompared with 46 percent of teachers in schools with 50 percent or more minority enroll-ments).
Teachers in schools with fewer minority students were also generally more likely than those inschools with the highest minority enrollments to use computers or the Internet at school foradministrative record keeping (55 percent of teachers in schools with 6 to 20 percent and 21 to49 percent minority enrollments compared with 40 percent of teachers in schools with 50 ormore minority enrollments) and creating instructional materials (81 percent of teachers inschools with 6 to 20 percent minority enrollments and 82 percent of teachers in schools with21 to 49 percent minority enrollments compared with 71 percent of teachers in schools with50 percent or more minority enrollments). Finally, teachers in schools with the lowest minorityenrollments (less than 6 percent) were more likely than those with the highest minority enroll-ments (50 percent or more) to use computers or the Internet at school for preparing multime-dia presentations (40 percent compared with 29 percent).
As is the case with teacher reports from schools with varying minority enrollments, teacherreports of whether they used computers or the Internet for various preparatory and administra-tive tasks varied by poverty concentration of the school, as measured by the proportion ofstudents eligible for free or reduced-price lunch. For example, teachers in schools with thelowest poverty concentrations were more likely to use computers or the Internet at school tocreate instructional materials than teachers in schools with the highest poverty concentrations(85 percent compared with 73 percent). In addition, teachers in schools with lower povertyconcentrations were generally more likely than teachers in schools with the highest povertyconcentrations to use these technologies at school to gather information for planning lessons
16
• CHAPTER 2 •
TABLE 2.1.—PERCENT OF PUBLIC SCHOOL TEACHERS WHO HAVE COMPUTERS AT SCHOOL OR AT HOME REPORTING USING
COMPUTERS OR THE INTERNET A LITTLE OR A LOT AT SCHOOL AND AT HOME FOR VARIOUS ACTIVITIES, BY SCHOOL AND TEACHER
CHARACTERISTICS: 1999
See note at end of table.
Activities
Create instructional Gather information Administrative recordmaterial for lesson plans keeping
School and teachercharacteristics At school At home At school At home At school At home
All public schoolteachers 78 85 59 67 51 44
Instructional levelElementary 79 86 57 66 45 41Secondary 77 84 62 69 62 50
Enrollment sizeLess than 300 79 81 67 63 49 35300 to 999 79 87 58 67 49 421,000 or more 75 84 56 69 58 53
LocaleCity 76 85 53 66 46 49Urban fringe 79 87 60 70 49 41Town 79 86 60 69 60 45Rural 82 82 64 60 55 41
Percent minorityenrollment in school
Less than 6 percent 79 86 61 68 51 426 to 20 percent 81 86 67 68 55 4621 to 49 percent 82 87 60 65 55 4550 percent or more 71 83 46 67 40 44
Percent of students in schooleligible for free or reduced-price school lunch
Less than 11 percent 85 86 65 72 57 4811 to 30 percent 80 87 63 68 54 4531 to 49 percent 79 87 60 62 49 4050 to 70 percent 77 84 55 64 54 4671 percent or more 73 83 49 63 43 41
Teaching experience3 or fewer years 79 91 60 76 52 464 to 9 years 82 87 61 70 53 5110 to 19 years 79 86 58 66 54 4220 or more years 76 82 58 63 47 41
17
• TECHNOLOGY AND INSTRUCTION •
TABLE 2.1.—PERCENT OF PUBLIC SCHOOL TEACHERS WHO HAVE COMPUTERS AT SCHOOL OR AT HOME REPORTING USING
COMPUTERS OR THE INTERNET A LITTLE OR A LOT AT SCHOOL AND AT HOME FOR VARIOUS ACTIVITIES, BY SCHOOL AND TEACHER
CHARACTERISTICS: 1999—CONTINUED
NOTE: Teachers who reported that computers were not available to them anywhere in the school were excluded from the “At school”analyses presented in this table. Teachers who reported not having a computer available at home were excluded from the “At home”analyses presented in this table.
SOURCE: U.S. Department of Education, National Center for Education Statistics, Fast Response Survey System, “Public SchoolTeachers Use of Computers and the Internet,” FRSS 70, 1999.
Activities
Access research and Multimedia Access modelbest practice examples presentations lesson plans
School and teachercharacteristics At school At home At school At home At school At home
All public schoolteachers 37 46 36 30 34 42
Instructional levelElementary 34 46 36 29 34 43Secondary 42 49 35 33 35 40
Enrollment sizeLess than 300 44 47 38 29 38 40300 to 999 36 46 36 28 34 431,000 or more 36 48 33 36 31 40
LocaleCity 35 47 36 31 36 43Urban fringe 38 49 38 31 31 43Town 38 46 32 31 35 42Rural 39 41 35 25 36 39
Percent minorityenrollment in school
Less than 6 percent 39 50 40 32 35 436 to 20 percent 41 42 38 30 37 3921 to 49 percent 33 45 35 32 31 4050 percent or more 35 49 29 27 33 48
Percent of students in schooleligible for free or reduced-price school lunch
Less than 11 percent 44 49 41 33 30 4011 to 30 percent 40 49 40 32 36 4331 to 49 percent 33 41 32 27 38 3850 to 70 percent 33 44 36 31 31 4071 percent or more 35 43 32 26 35 47
Teaching experience3 or fewer years 39 55 34 31 42 594 to 9 years 43 52 39 32 40 4710 to 19 years 37 42 37 33 30 3820 or more years 33 43 34 26 31 37

18
• CHAPTER 2 •
(65 percent of teachers in schools with less than 11 percent and 63 percent of teachers in schoolswith 11 to 30 percent of students eligible for free or reduced-price school lunch compared with49 percent of teachers in schools with 71 percent or more students eligible for free or reduced-price school lunch).
Finally, teachers with varying years of teaching experience differed with respect to whether theyused computers or the Internet to conduct a number of preparatory and administrative tasks.For example, teachers with the fewest years of teaching experience were more likely than teach-ers with the most experience to use these technologies at home to gather information for plan-ning lessons (76 percent compared with 63 percent) and to create instructional materials (91percent compared with 82 percent). Teachers with 4 to 9 years of experience were more likelyto use computers or the Internet at school to access research and best practices examples thanthose with 20 or more years of experience (43 percent compared with 33 percent). Finally,teachers with less than 10 years of teaching experience were generally more likely to use thesetechnologies at school to access model lesson plans than those with 10 to 19 years of experience(42 percent of teachers with 3 or fewer years and 40 percent of teachers with 4 to 9 years ofteaching experience compared with 30 percent of teachers with 10 to 19 years of teachingexperience) and at home to conduct this task (59 percent of teachers with 3 or fewer years and47 percent of teachers with 4 to 9 years of experience compared with 37 percent of teacherswith 20 or more years of teaching experience).
Communication
The 1999 FRSS survey on public school teachers’ use of technology also asked teachers howoften they used computers or the Internet either at school or at home to communicate withcolleagues, parents, or students or to post homework or assignments. Public school teacherswith computers available in their schools used computers or the Internet to communicate withcolleagues most frequently (50 percent at school, 48 percent at home), compared to communi-cation with parents (25 percent at school, 19 percent at home), posting homework or assign-ments (17 percent at school, 13 percent at home), and communication with students (12percent at school and 14 percent at home—figure 2.4).
Differences by school and teacher characteristics. Teachers’ use of technology for communicativepurposes varied by a number of school and teacher characteristics. For example, elementaryteachers were more likely than secondary teachers to use computers or the Internet at home tocommunicate with parents (20 percent compared with 15 percent, respectively—table 2.2).On the other hand, secondary teachers were more likely than elementary teachers to use thesetechnologies at school to communicate with students (14 percent compared with 10 percent).Furthermore, teachers in schools with medium-sized enrollments were more likely than teach-ers in schools with small enrollments to report that they used computers or the Internet athome to communicate with colleagues (50 percent of teachers in schools with 300 to 999students compared with 38 percent of teachers in schools with less than 300 students). Teach-ers in schools with large enrollments were also more likely to use these technologies at school topost homework or assignments (23 percent in schools with 1,000 or more students compared
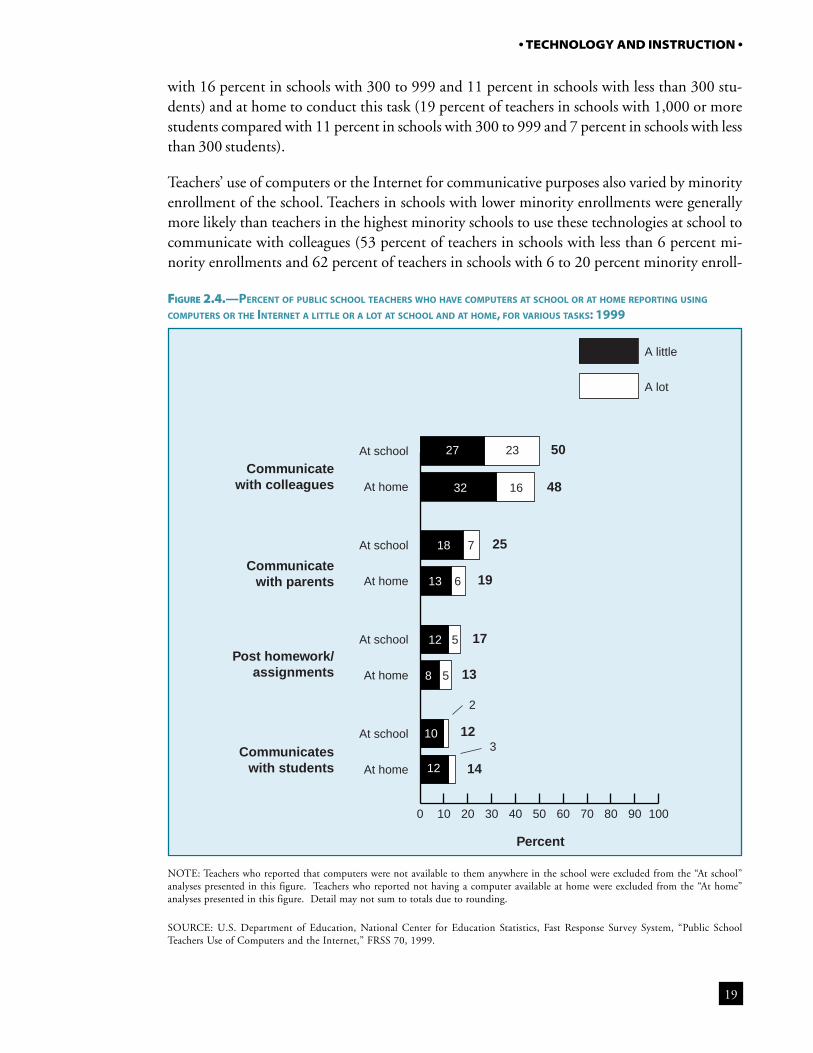
19
• TECHNOLOGY AND INSTRUCTION •
with 16 percent in schools with 300 to 999 and 11 percent in schools with less than 300 stu-dents) and at home to conduct this task (19 percent of teachers in schools with 1,000 or morestudents compared with 11 percent in schools with 300 to 999 and 7 percent in schools with lessthan 300 students).
Teachers’ use of computers or the Internet for communicative purposes also varied by minorityenrollment of the school. Teachers in schools with lower minority enrollments were generallymore likely than teachers in the highest minority schools to use these technologies at school tocommunicate with colleagues (53 percent of teachers in schools with less than 6 percent mi-nority enrollments and 62 percent of teachers in schools with 6 to 20 percent minority enroll-
FIGURE 2.4.—PERCENT OF PUBLIC SCHOOL TEACHERS WHO HAVE COMPUTERS AT SCHOOL OR AT HOME REPORTING USING
COMPUTERS OR THE INTERNET A LITTLE OR A LOT AT SCHOOL AND AT HOME, FOR VARIOUS TASKS: 1999
NOTE: Teachers who reported that computers were not available to them anywhere in the school were excluded from the “At school”analyses presented in this figure. Teachers who reported not having a computer available at home were excluded from the “At home”analyses presented in this figure. Detail may not sum to totals due to rounding.
SOURCE: U.S. Department of Education, National Center for Education Statistics, Fast Response Survey System, “Public SchoolTeachers Use of Computers and the Internet,” FRSS 70, 1999.
Percent
Communicatewith colleagues
Communicatewith parents
Post homework/assignments
Communicateswith students
50
48
25
19
17
13
12
14
0 10 20 30 40 50 60 70 80 90 100
A little
A lot
At home
At school
At home
At school
At home
At school
At home
At school 2327
1632
718
613
512
58
10
12
2
3
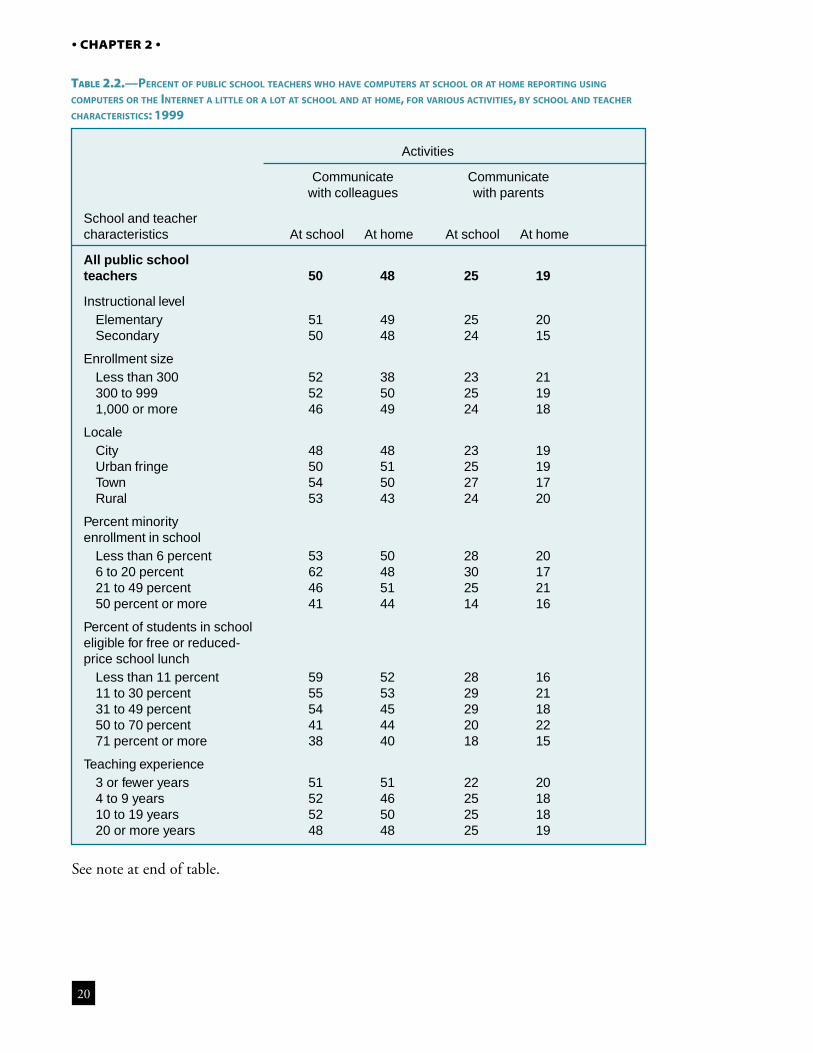
20
• CHAPTER 2 •
TABLE 2.2.—PERCENT OF PUBLIC SCHOOL TEACHERS WHO HAVE COMPUTERS AT SCHOOL OR AT HOME REPORTING USING
COMPUTERS OR THE INTERNET A LITTLE OR A LOT AT SCHOOL AND AT HOME, FOR VARIOUS ACTIVITIES, BY SCHOOL AND TEACHER
CHARACTERISTICS: 1999
See note at end of table.
Activities
Communicate Communicatewith colleagues with parents
School and teachercharacteristics At school At home At school At home
All public schoolteachers 50 48 25 19
Instructional levelElementary 51 49 25 20Secondary 50 48 24 15
Enrollment sizeLess than 300 52 38 23 21300 to 999 52 50 25 191,000 or more 46 49 24 18
LocaleCity 48 48 23 19Urban fringe 50 51 25 19Town 54 50 27 17Rural 53 43 24 20
Percent minorityenrollment in school
Less than 6 percent 53 50 28 206 to 20 percent 62 48 30 1721 to 49 percent 46 51 25 2150 percent or more 41 44 14 16
Percent of students in schooleligible for free or reduced-price school lunch
Less than 11 percent 59 52 28 1611 to 30 percent 55 53 29 2131 to 49 percent 54 45 29 1850 to 70 percent 41 44 20 2271 percent or more 38 40 18 15
Teaching experience3 or fewer years 51 51 22 204 to 9 years 52 46 25 1810 to 19 years 52 50 25 1820 or more years 48 48 25 19
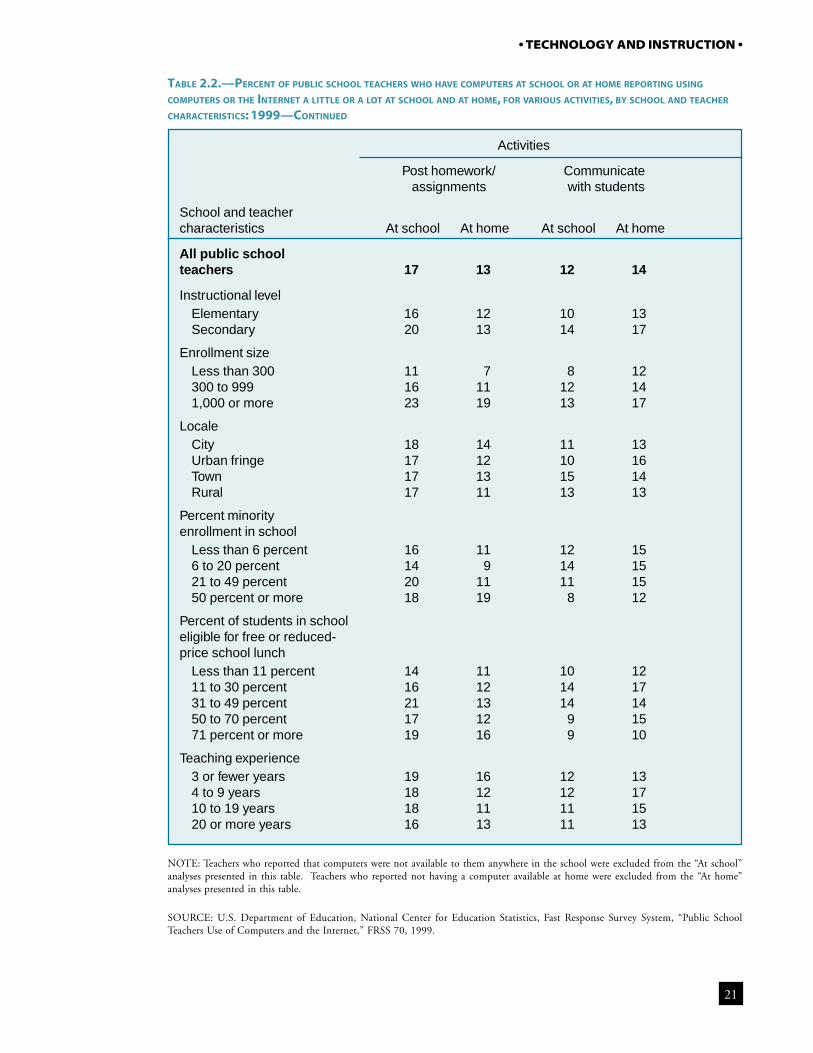
21
• TECHNOLOGY AND INSTRUCTION •
NOTE: Teachers who reported that computers were not available to them anywhere in the school were excluded from the “At school”analyses presented in this table. Teachers who reported not having a computer available at home were excluded from the “At home”analyses presented in this table.
SOURCE: U.S. Department of Education, National Center for Education Statistics, Fast Response Survey System, “Public SchoolTeachers Use of Computers and the Internet,” FRSS 70, 1999.
TABLE 2.2.—PERCENT OF PUBLIC SCHOOL TEACHERS WHO HAVE COMPUTERS AT SCHOOL OR AT HOME REPORTING USING
COMPUTERS OR THE INTERNET A LITTLE OR A LOT AT SCHOOL AND AT HOME, FOR VARIOUS ACTIVITIES, BY SCHOOL AND TEACHER
CHARACTERISTICS: 1999—CONTINUED
Activities
Post homework/ Communicateassignments with students
School and teachercharacteristics At school At home At school At home
All public schoolteachers 17 13 12 14
Instructional levelElementary 16 12 10 13Secondary 20 13 14 17
Enrollment sizeLess than 300 11 7 8 12300 to 999 16 11 12 141,000 or more 23 19 13 17
LocaleCity 18 14 11 13Urban fringe 17 12 10 16Town 17 13 15 14Rural 17 11 13 13
Percent minorityenrollment in school
Less than 6 percent 16 11 12 156 to 20 percent 14 9 14 1521 to 49 percent 20 11 11 1550 percent or more 18 19 8 12
Percent of students in schooleligible for free or reduced-price school lunch
Less than 11 percent 14 11 10 1211 to 30 percent 16 12 14 1731 to 49 percent 21 13 14 1450 to 70 percent 17 12 9 1571 percent or more 19 16 9 10
Teaching experience3 or fewer years 19 16 12 134 to 9 years 18 12 12 1710 to 19 years 18 11 11 1520 or more years 16 13 11 13

22
• CHAPTER 2 •
ments compared with 41 percent of teachers in schools with 50 percent or more minority enroll-ments). Similarly, teachers in schools with lower minority enrollments were also more likely touse computers or the Internet at school to communicate with parents than teachers in schoolswith the highest minority enrollments (25 percent to 30 percent of teachers in schools with lessthan 50 percent minority enrollments compared with 14 percent of teachers in schools with 50percent or more minority enrollments). On the other hand, teachers in schools with high minor-ity enrollments (50 percent or more) were more likely than teachers in schools with minorityenrollments of 6 to 20 percent to use these technologies at home to post homework or assign-ments (19 percent compared with 9 percent, respectively).
Like minority enrollment, poverty concentration of the school is related to teachers’ use of tech-nology for communicative purposes. For example, teachers in schools with lower poverty con-centrations were generally more likely than teachers in the highest poverty schools to use com-puters or the Internet to communicate with colleagues. Fifty-nine percent of teachers in schoolswith less than 11 percent, 55 percent of teacher in schools with 11 to 30 percent, and 54 percentof teachers in schools with 31 to 49 percent of students eligible for free or reduced-price schoollunch used these technologies at school for this purpose, compared with 38 percent of teachers inschools with 71 percent or more students eligible for free or reduced-price school lunch. Simi-larly, 53 percent of teachers in schools with poverty concentrations of 11 to 30 percent eligiblefor free or reduced-price school lunch used these technologies at home to communicate withcolleagues, compared with 40 percent of teachers in schools with 71 percent or more studentseligible for free or reduced-price school lunch.
Classroom Instruction
In addition to preparation for instruction, administrative tasks, and communication, teachersmay also use computers or the Internet for a number of instructional activities in their class-rooms. The 1999 FRSS survey on public school teachers’ use of technology asked teachers howoften they used computers or the Internet during class time and assigned students to use thesetechnologies for projects and various other activities, including: word processing/spreadsheets,Internet research, practice drills, solving problems/analyzing data, CD-ROM research, multi-media projects, graphical presentations, demonstration/simulation, and correspondence withexperts.
General classroom instructional use. Fifty-three percent of public school teachers indicated thatthey used computers or the Internet for instruction during class time (table 2.3). Elementaryteachers were more likely to do this than secondary teachers (56 percent compared with 44percent), and teachers in schools with smaller enrollments were more likely to do this thanteachers in schools with the largest enrollments (56 percent of teachers in schools enrolling lessthan 300 and 300 to 999 students compared with 40 percent of teachers in schools with 1,000or more students). Teachers in schools with lower minority enrollments were generally morelikely to use computers or the Internet for instruction during class time than teachers in schoolswith high minority enrollments (56 percent of teachers in schools with less than 6 percentminority enrollment compared with 45 percent of teachers in schools with 50 percent or more
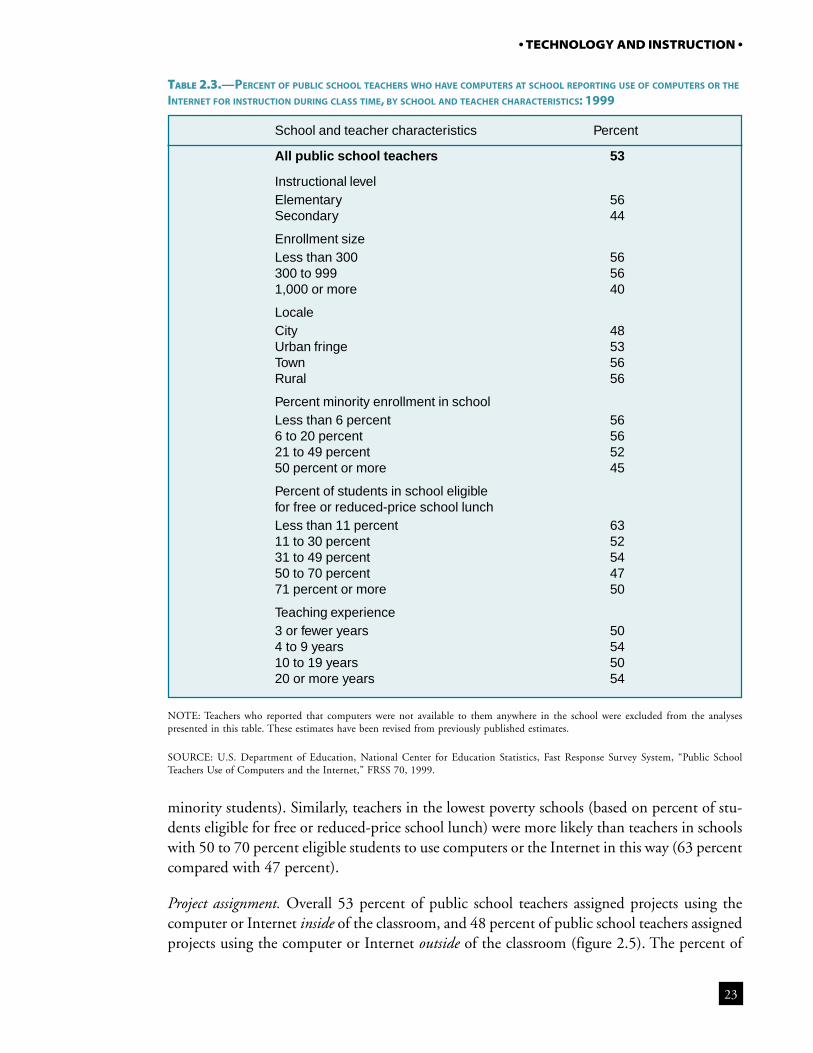
23
• TECHNOLOGY AND INSTRUCTION •
minority students). Similarly, teachers in the lowest poverty schools (based on percent of stu-dents eligible for free or reduced-price school lunch) were more likely than teachers in schoolswith 50 to 70 percent eligible students to use computers or the Internet in this way (63 percentcompared with 47 percent).
Project assignment. Overall 53 percent of public school teachers assigned projects using thecomputer or Internet inside of the classroom, and 48 percent of public school teachers assignedprojects using the computer or Internet outside of the classroom (figure 2.5). The percent of
TABLE 2.3.—PERCENT OF PUBLIC SCHOOL TEACHERS WHO HAVE COMPUTERS AT SCHOOL REPORTING USE OF COMPUTERS OR THE
INTERNET FOR INSTRUCTION DURING CLASS TIME, BY SCHOOL AND TEACHER CHARACTERISTICS: 1999
NOTE: Teachers who reported that computers were not available to them anywhere in the school were excluded from the analysespresented in this table. These estimates have been revised from previously published estimates.
SOURCE: U.S. Department of Education, National Center for Education Statistics, Fast Response Survey System, “Public SchoolTeachers Use of Computers and the Internet,” FRSS 70, 1999.
School and teacher characteristics Percent
All public school teachers 53
Instructional levelElementary 56Secondary 44
Enrollment sizeLess than 300 56300 to 999 561,000 or more 40
LocaleCity 48Urban fringe 53Town 56Rural 56
Percent minority enrollment in schoolLess than 6 percent 566 to 20 percent 5621 to 49 percent 5250 percent or more 45
Percent of students in school eligiblefor free or reduced-price school lunchLess than 11 percent 6311 to 30 percent 5231 to 49 percent 5450 to 70 percent 4771 percent or more 50
Teaching experience3 or fewer years 504 to 9 years 5410 to 19 years 5020 or more years 54
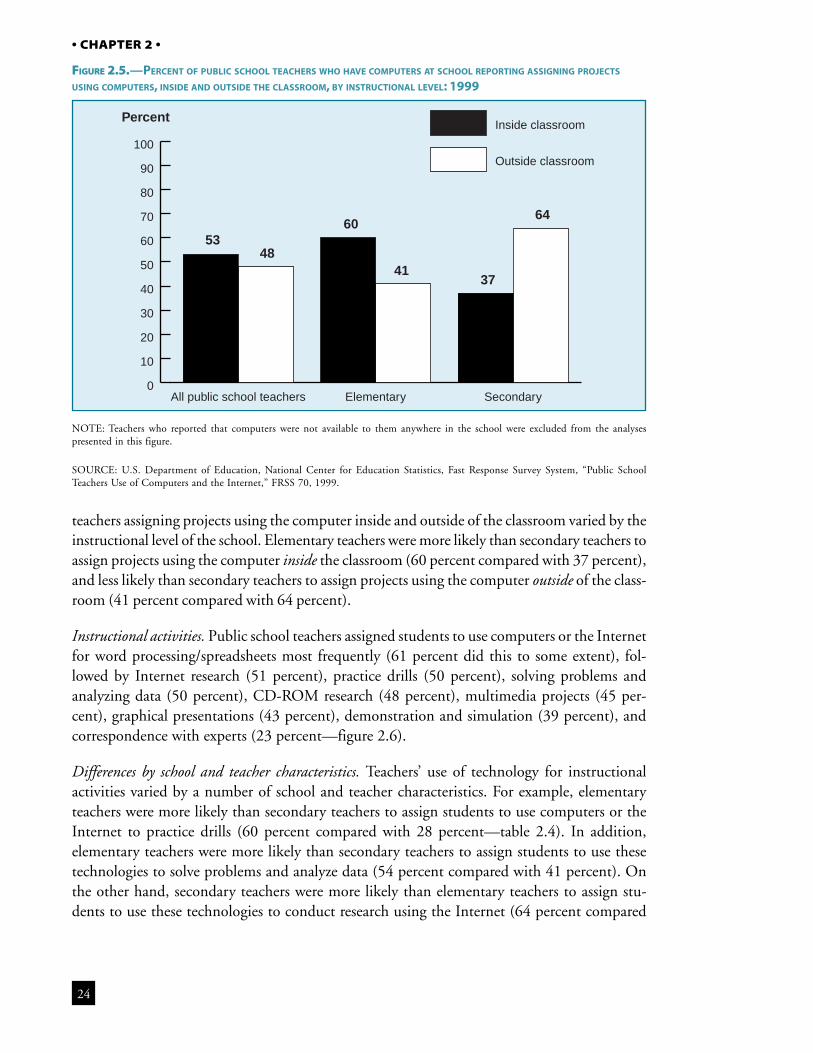
24
• CHAPTER 2 •
teachers assigning projects using the computer inside and outside of the classroom varied by theinstructional level of the school. Elementary teachers were more likely than secondary teachers toassign projects using the computer inside the classroom (60 percent compared with 37 percent),and less likely than secondary teachers to assign projects using the computer outside of the class-room (41 percent compared with 64 percent).
Instructional activities. Public school teachers assigned students to use computers or the Internetfor word processing/spreadsheets most frequently (61 percent did this to some extent), fol-lowed by Internet research (51 percent), practice drills (50 percent), solving problems andanalyzing data (50 percent), CD-ROM research (48 percent), multimedia projects (45 per-cent), graphical presentations (43 percent), demonstration and simulation (39 percent), andcorrespondence with experts (23 percent—figure 2.6).
Differences by school and teacher characteristics. Teachers’ use of technology for instructionalactivities varied by a number of school and teacher characteristics. For example, elementaryteachers were more likely than secondary teachers to assign students to use computers or theInternet to practice drills (60 percent compared with 28 percent—table 2.4). In addition,elementary teachers were more likely than secondary teachers to assign students to use thesetechnologies to solve problems and analyze data (54 percent compared with 41 percent). Onthe other hand, secondary teachers were more likely than elementary teachers to assign stu-dents to use these technologies to conduct research using the Internet (64 percent compared
FIGURE 2.5.—PERCENT OF PUBLIC SCHOOL TEACHERS WHO HAVE COMPUTERS AT SCHOOL REPORTING ASSIGNING PROJECTS
USING COMPUTERS, INSIDE AND OUTSIDE THE CLASSROOM, BY INSTRUCTIONAL LEVEL: 1999
NOTE: Teachers who reported that computers were not available to them anywhere in the school were excluded from the analysespresented in this figure.
SOURCE: U.S. Department of Education, National Center for Education Statistics, Fast Response Survey System, “Public SchoolTeachers Use of Computers and the Internet,” FRSS 70, 1999.
Percent
5348
60
4137
64
0
10
20
30
40
50
60
70
80
90
100
Inside classroom
Outside classroom
SecondaryElementaryAll public school teachers
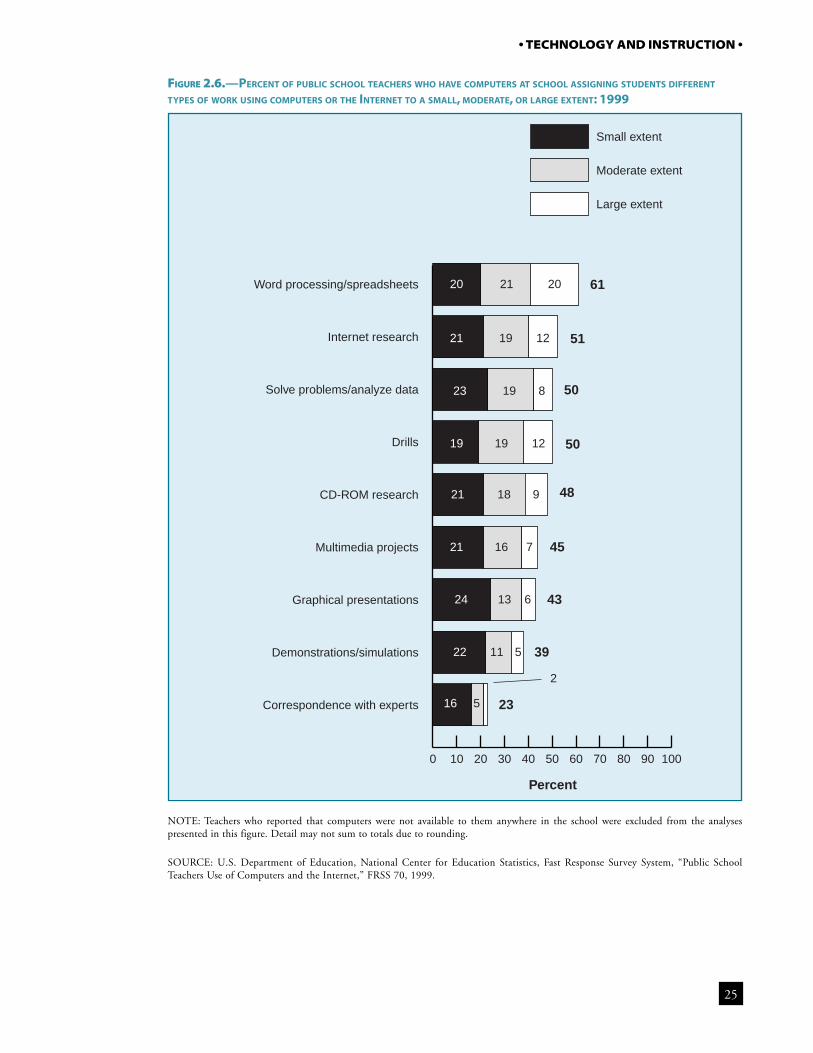
25
• TECHNOLOGY AND INSTRUCTION •
FIGURE 2.6.—PERCENT OF PUBLIC SCHOOL TEACHERS WHO HAVE COMPUTERS AT SCHOOL ASSIGNING STUDENTS DIFFERENT
TYPES OF WORK USING COMPUTERS OR THE INTERNET TO A SMALL, MODERATE, OR LARGE EXTENT: 1999
NOTE: Teachers who reported that computers were not available to them anywhere in the school were excluded from the analysespresented in this figure. Detail may not sum to totals due to rounding.
SOURCE: U.S. Department of Education, National Center for Education Statistics, Fast Response Survey System, “Public SchoolTeachers Use of Computers and the Internet,” FRSS 70, 1999.
Percent
61
51
50
50
48
45
43
39
23
0 10 20 30 40 50 60 70 80 90 100
Small extent
Moderate extent
Large extent
Correspondence with experts
Demonstrations/simulations
Graphical presentations
Multimedia projects
CD-ROM research
Drills
Solve problems/analyze data
Internet research
Word processing/spreadsheets 21
19
19
19
18
16
13
11
5
2
16
522
624
721
921
1219
823
1221
2020
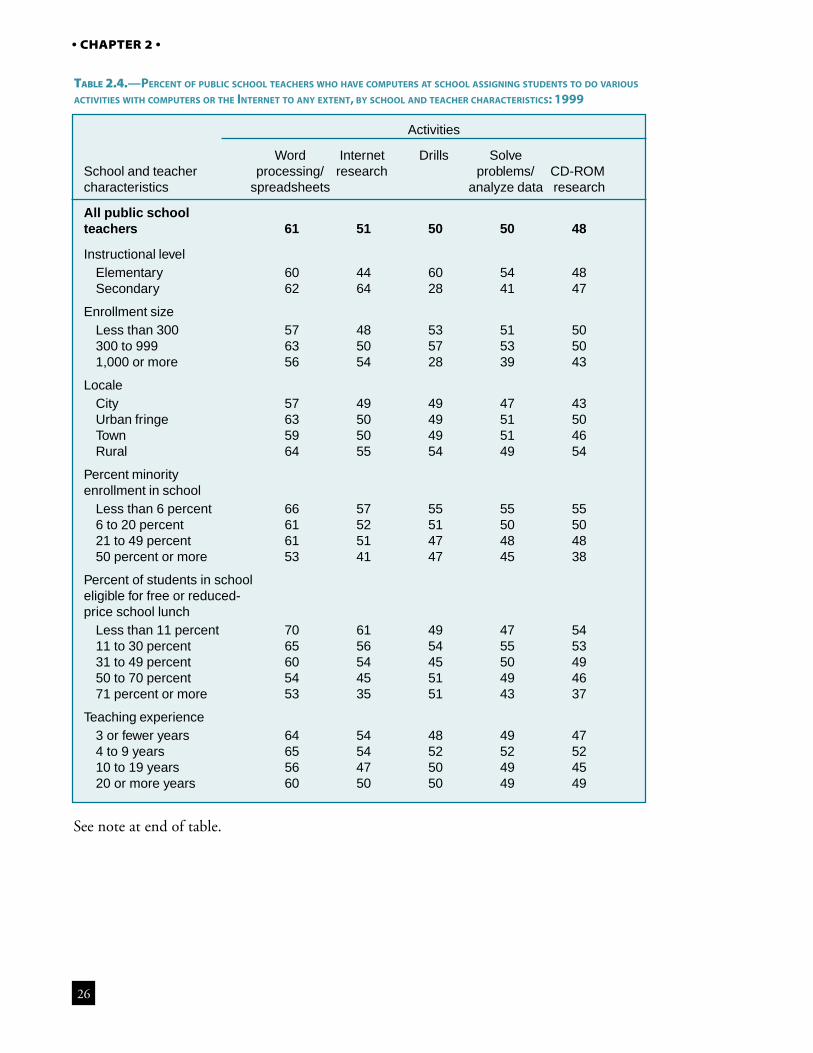
26
• CHAPTER 2 •
TABLE 2.4.—PERCENT OF PUBLIC SCHOOL TEACHERS WHO HAVE COMPUTERS AT SCHOOL ASSIGNING STUDENTS TO DO VARIOUS
ACTIVITIES WITH COMPUTERS OR THE INTERNET TO ANY EXTENT, BY SCHOOL AND TEACHER CHARACTERISTICS: 1999
See note at end of table.
Activities
Word Internet Drills SolveSchool and teacher processing/ research problems/ CD-ROMcharacteristics spreadsheets analyze data research
All public schoolteachers 61 51 50 50 48
Instructional levelElementary 60 44 60 54 48Secondary 62 64 28 41 47
Enrollment sizeLess than 300 57 48 53 51 50300 to 999 63 50 57 53 501,000 or more 56 54 28 39 43
LocaleCity 57 49 49 47 43Urban fringe 63 50 49 51 50Town 59 50 49 51 46Rural 64 55 54 49 54
Percent minorityenrollment in school
Less than 6 percent 66 57 55 55 556 to 20 percent 61 52 51 50 5021 to 49 percent 61 51 47 48 4850 percent or more 53 41 47 45 38
Percent of students in schooleligible for free or reduced-price school lunch
Less than 11 percent 70 61 49 47 5411 to 30 percent 65 56 54 55 5331 to 49 percent 60 54 45 50 4950 to 70 percent 54 45 51 49 4671 percent or more 53 35 51 43 37
Teaching experience3 or fewer years 64 54 48 49 474 to 9 years 65 54 52 52 5210 to 19 years 56 47 50 49 4520 or more years 60 50 50 49 49
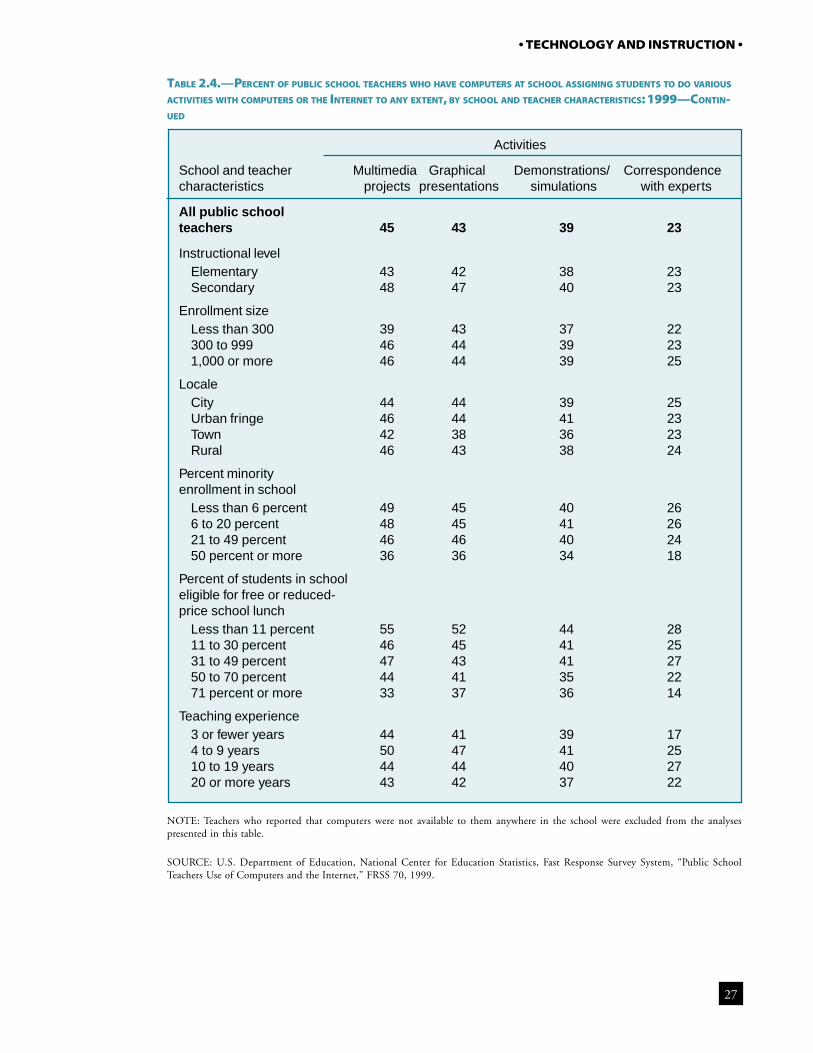
27
• TECHNOLOGY AND INSTRUCTION •
TABLE 2.4.—PERCENT OF PUBLIC SCHOOL TEACHERS WHO HAVE COMPUTERS AT SCHOOL ASSIGNING STUDENTS TO DO VARIOUS
ACTIVITIES WITH COMPUTERS OR THE INTERNET TO ANY EXTENT, BY SCHOOL AND TEACHER CHARACTERISTICS: 1999—CONTIN-UED
NOTE: Teachers who reported that computers were not available to them anywhere in the school were excluded from the analysespresented in this table.
SOURCE: U.S. Department of Education, National Center for Education Statistics, Fast Response Survey System, “Public SchoolTeachers Use of Computers and the Internet,” FRSS 70, 1999.
Activities
School and teacher Multimedia Graphical Demonstrations/ Correspondencecharacteristics projects presentations simulations with experts
All public schoolteachers 45 43 39 23
Instructional levelElementary 43 42 38 23Secondary 48 47 40 23
Enrollment sizeLess than 300 39 43 37 22300 to 999 46 44 39 231,000 or more 46 44 39 25
LocaleCity 44 44 39 25Urban fringe 46 44 41 23Town 42 38 36 23Rural 46 43 38 24
Percent minorityenrollment in school
Less than 6 percent 49 45 40 266 to 20 percent 48 45 41 2621 to 49 percent 46 46 40 2450 percent or more 36 36 34 18
Percent of students in schooleligible for free or reduced-price school lunch
Less than 11 percent 55 52 44 2811 to 30 percent 46 45 41 2531 to 49 percent 47 43 41 2750 to 70 percent 44 41 35 2271 percent or more 33 37 36 14
Teaching experience3 or fewer years 44 41 39 174 to 9 years 50 47 41 2510 to 19 years 44 44 40 2720 or more years 43 42 37 22
28
• CHAPTER 2 •
with 44 percent).
Teachers in schools with different enrollment sizes varied with respect to whether they assignedstudents to use computers or the Internet for various instructional activities. Teachers in schoolswith smaller enrollments were nearly twice as likely as teachers in schools with large enrollmentsto assign students to use these technologies to practice drills (53 percent of teachers in schoolswith less than 300 students and 57 percent with 300 to 999 students compared with 28 percentof teachers in schools with 1,000 or more students). Teachers in schools with smaller enrollmentswere also more likely than teachers in schools with the largest enrollments to assign students touse computers or the Internet to solve problems and analyze data (51 percent of teachers inschools with less than 300 students and 53 percent with 300 to 999 students compared with 39percent of teachers in schools with 1,000 or more students).
There were also differences in whether teachers assigned students to use technology for variousinstructional activities according to minority enrollment. For example, teachers in schools en-rolling the smallest proportion of minority students were more likely to assign students to usethese technologies for word processing and creating spreadsheets than teachers in the highestminority enrollment schools (66 percent in schools with less than 6 percent minority enroll-ments compared with 53 percent of teachers in schools with 50 percent or more minorityenrollments).
Teachers in lower minority enrollment schools were also generally more likely than teachers inthe highest minority enrollment schools to assign students to use these technologies for multi-media presentations (49 percent of teachers in schools with less than 6 percent minority enroll-ments and 48 percent in schools with 6 to 20 percent minority enrollments compared with 36percent of teachers in schools with 50 percent or more minority enrollments) and CD-ROMresearch (55 percent of teachers in schools with less than 6 percent minority enrollments and50 percent in schools with 6 to 20 percent minority enrollments compared with 38 percent ofteachers in schools with 50 percent or more minority enrollments). Finally, teachers in schoolswith smaller proportions of minority enrollments were more likely to use computers or theInternet for Internet research (57 percent of teachers in schools with less than 6 percent minor-ity enrollments and 52 percent in schools with 6 to 20 percent minority enrollments comparedwith 41 percent of teachers in schools with 50 percent or more minority enrollments).
Similar to the differences in minority enrollment, school poverty concentration is related to anumber of activities for which teachers assign students to use computers or the Internet. Teach-ers in schools with the lowest poverty concentrations were more likely than teachers in schoolswith the highest poverty concentrations to assign students to use these technologies for graphi-cal presentations, multimedia presentations, word processing and spreadsheets, research usingCD-ROM and the Internet, and corresponding with experts. For example, 52 percent of teachersin schools with less than 11 percent of students eligible for free or reduced-price school lunchassigned students to use these technologies for graphical presentations compared with 37 per-cent of teachers in schools with 71 percent or more students eligible for free or reduced-priceschool lunch.
29
Chapter 3
Availability of Technology For Instructional Purposes
Highlights
• The availability of educational technology increased substantially during the 1990s, par-ticularly at the school level. By 1999, most teachers reported having at least one computerin their classrooms, and over half of these teachers also had access to the Internet in theirclassrooms. Additionally, the majority of teachers also reported having these technologiesavailable at home.
• Despite the gains in computer and Internet availability at school and in classrooms, ap-proximately one-third of teachers reported that their classrooms had a single computer or asingle computer connected to the Internet available in 1999. In addition, the availability oftechnology was not equally distributed among schools with different characteristics. Forexample, teachers in schools with lower minority enrollments were generally more likelythan teachers in schools with the highest minority enrollments to report having the Internetavailable in the classroom. Additionally, teachers in schools with lower poverty concentra-tions (based on the percent of students eligible for free or reduced-lunch) were generallymore likely than teachers in schools with high minority concentrations to report having theInternet available in the classroom.
• In 1999, the availability of technology in the classroom was related to teachers’ use of thattechnology. For example, teachers who reported having more than five computers in theirclassrooms were more likely than teachers with fewer classroom computers to report usingcomputers a lot for various preparatory activities. Additionally, teachers who had morecomputers available in the classroom were generally more likely to report assigning stu-dents to use computers or the Internet to a large extent to conduct various tasks (e.g., solveproblems or analyze data).

3C H A P T E R
31
This chapter reviews data collected by several surveys on theavailability of education technology to teachers and their stu-dents. The chapter begins with background information on
computer availability from the National Assessment of EducationalProgress (NAEP) school surveys, as well as from the Fast Response Sur-vey System (FRSS) school survey, NAEP teacher survey, and the Cur-rent Population Survey (CPS) from 1994 to 1998. Data are also pro-vided from the 1994 to 1999 FRSS school surveys on the percent ofschools and instructional rooms with Internet connections. This back-ground information is followed by more recent, detailed findings onthe technology available to teachers and their students, taken from the1999 FRSS survey on teachers’ use of technology. Included are differ-ences in the availability of computers and Internet connections by char-acteristics of schools (e.g., instructional level, location of school, pov-erty concentration).
Availability of Computers and the Internet:1990 to 1999
Measures of computer availability come in a variety of forms, includingthe percent of students who have varying numbers of computers avail-able to them in their schools (NAEP), student-to-computer ratios inschools (FRSS), the percent of students who have computer labs andportable computers available to them (NAEP), the percent of studentswho have computers permanently available in the classroom (NAEP),and the percent of students for whom computers are best described asavailable in computer labs or available in the classroom (NAEP). Mea-sures of Internet availability in public schools are similar, but typicallyfocus on the percent of schools connected to the Internet rather thanon the percent of students with the Internet available to them. Thesemeasures include the percent of schools connected to the Internet
Availability ofTechnology for
InstructionalPurposes
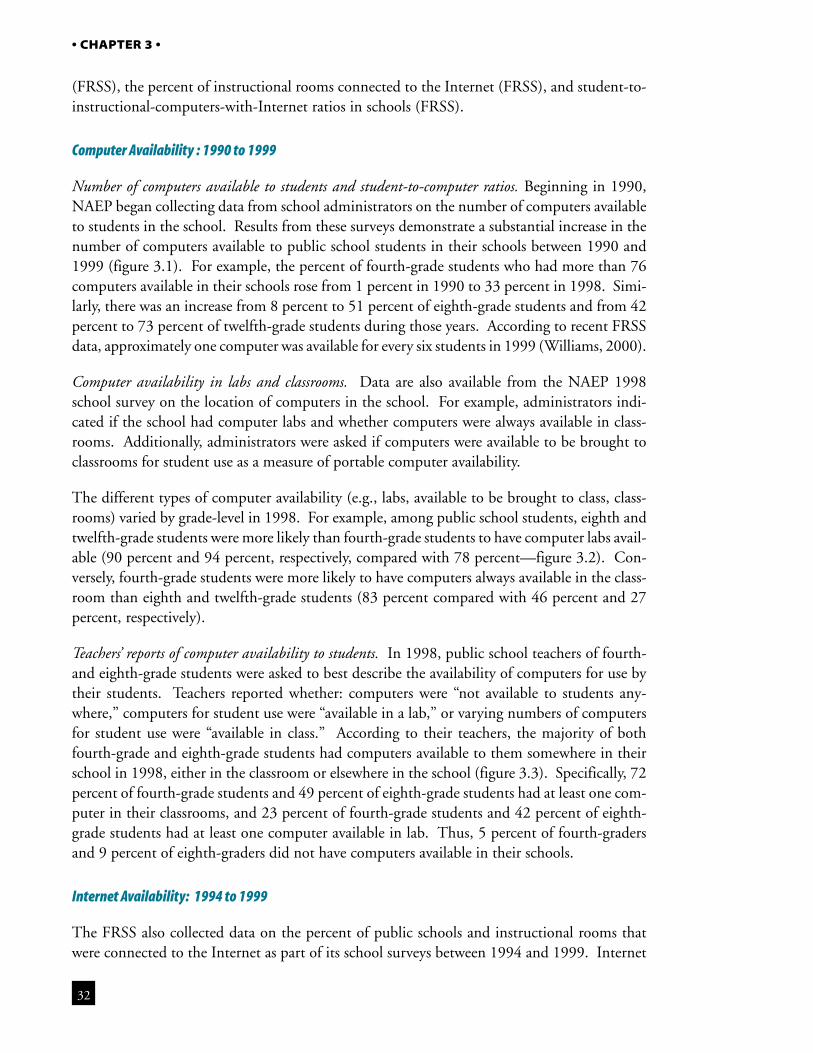
32
• CHAPTER 3 •
(FRSS), the percent of instructional rooms connected to the Internet (FRSS), and student-to-instructional-computers-with-Internet ratios in schools (FRSS).
Computer Availability : 1990 to 1999
Number of computers available to students and student-to-computer ratios. Beginning in 1990,NAEP began collecting data from school administrators on the number of computers availableto students in the school. Results from these surveys demonstrate a substantial increase in thenumber of computers available to public school students in their schools between 1990 and1999 (figure 3.1). For example, the percent of fourth-grade students who had more than 76computers available in their schools rose from 1 percent in 1990 to 33 percent in 1998. Simi-larly, there was an increase from 8 percent to 51 percent of eighth-grade students and from 42percent to 73 percent of twelfth-grade students during those years. According to recent FRSSdata, approximately one computer was available for every six students in 1999 (Williams, 2000).
Computer availability in labs and classrooms. Data are also available from the NAEP 1998school survey on the location of computers in the school. For example, administrators indi-cated if the school had computer labs and whether computers were always available in class-rooms. Additionally, administrators were asked if computers were available to be brought toclassrooms for student use as a measure of portable computer availability.
The different types of computer availability (e.g., labs, available to be brought to class, class-rooms) varied by grade-level in 1998. For example, among public school students, eighth andtwelfth-grade students were more likely than fourth-grade students to have computer labs avail-able (90 percent and 94 percent, respectively, compared with 78 percent—figure 3.2). Con-versely, fourth-grade students were more likely to have computers always available in the class-room than eighth and twelfth-grade students (83 percent compared with 46 percent and 27percent, respectively).
Teachers’ reports of computer availability to students. In 1998, public school teachers of fourth-and eighth-grade students were asked to best describe the availability of computers for use bytheir students. Teachers reported whether: computers were “not available to students any-where,” computers for student use were “available in a lab,” or varying numbers of computersfor student use were “available in class.” According to their teachers, the majority of bothfourth-grade and eighth-grade students had computers available to them somewhere in theirschool in 1998, either in the classroom or elsewhere in the school (figure 3.3). Specifically, 72percent of fourth-grade students and 49 percent of eighth-grade students had at least one com-puter in their classrooms, and 23 percent of fourth-grade students and 42 percent of eighth-grade students had at least one computer available in lab. Thus, 5 percent of fourth-gradersand 9 percent of eighth-graders did not have computers available in their schools.
Internet Availability: 1994 to 1999
The FRSS also collected data on the percent of public schools and instructional rooms thatwere connected to the Internet as part of its school surveys between 1994 and 1999. Internet
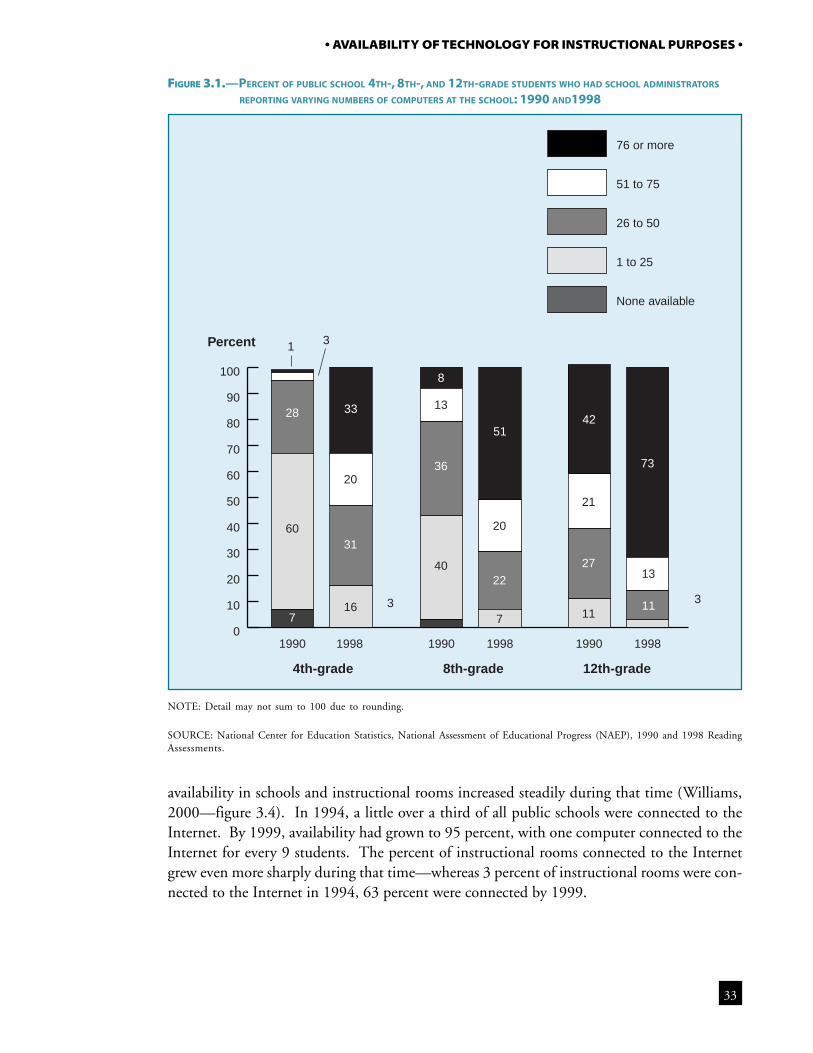
33
• AVAILABILITY OF TECHNOLOGY FOR INSTRUCTIONAL PURPOSES •
availability in schools and instructional rooms increased steadily during that time (Williams,2000—figure 3.4). In 1994, a little over a third of all public schools were connected to theInternet. By 1999, availability had grown to 95 percent, with one computer connected to theInternet for every 9 students. The percent of instructional rooms connected to the Internetgrew even more sharply during that time—whereas 3 percent of instructional rooms were con-nected to the Internet in 1994, 63 percent were connected by 1999.
FIGURE 3.1.—PERCENT OF PUBLIC SCHOOL 4TH-, 8TH-, AND 12TH-GRADE STUDENTS WHO HAD SCHOOL ADMINISTRATORS
REPORTING VARYING NUMBERS OF COMPUTERS AT THE SCHOOL: 1990 AND1998
NOTE: Detail may not sum to 100 due to rounding.
SOURCE: National Center for Education Statistics, National Assessment of Educational Progress (NAEP), 1990 and 1998 ReadingAssessments.
Percent
4th-grade 8th-grade 12th-grade
1
0
10
20
30
40
50
60
70
80
90
100
76 or more
51 to 75
26 to 50
1 to 25
None available
199819901998199019981990
3
28 33
8
5142
73
60
20
13
40
20
21
13
1111
2722
73 3
36
31
167
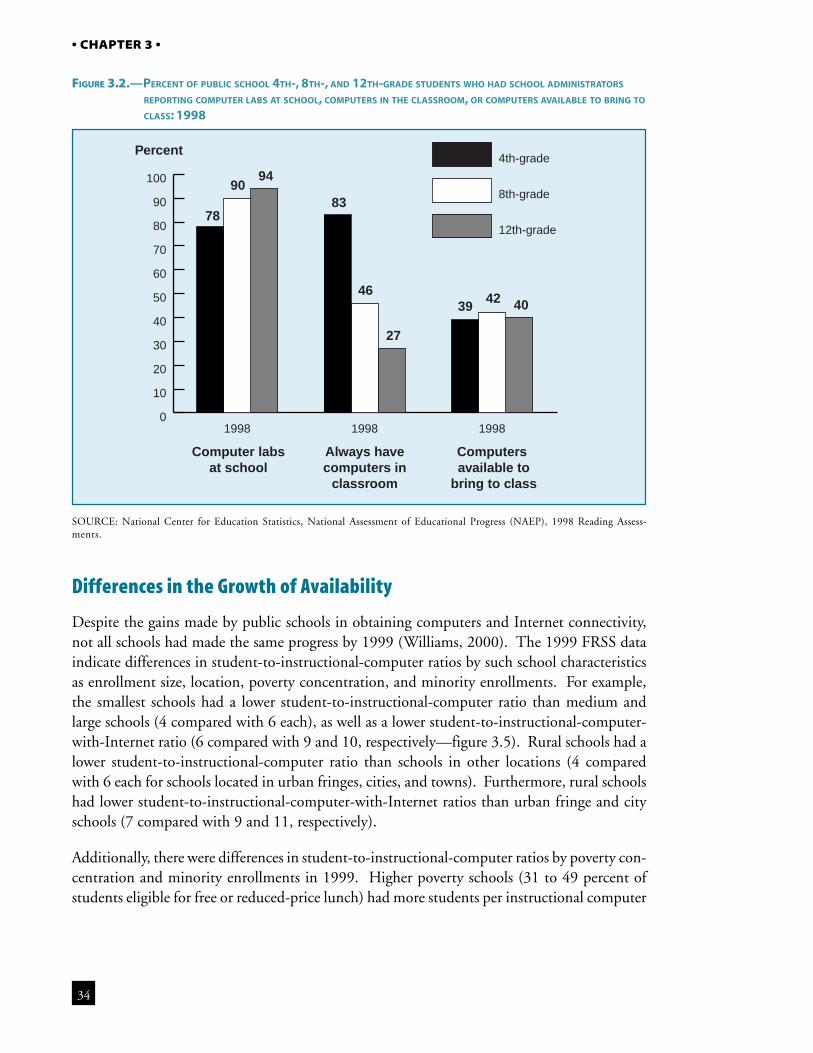
34
• CHAPTER 3 •
Percent
Computer labsat school
Always havecomputers in
classroom
Computers available to
bring to class
78
9094
83
46
27
3942 40
0
10
20
30
40
50
60
70
80
90
100
4th-grade
8th-grade
12th-grade
199819981998
Differences in the Growth of Availability
Despite the gains made by public schools in obtaining computers and Internet connectivity,not all schools had made the same progress by 1999 (Williams, 2000). The 1999 FRSS dataindicate differences in student-to-instructional-computer ratios by such school characteristicsas enrollment size, location, poverty concentration, and minority enrollments. For example,the smallest schools had a lower student-to-instructional-computer ratio than medium andlarge schools (4 compared with 6 each), as well as a lower student-to-instructional-computer-with-Internet ratio (6 compared with 9 and 10, respectively—figure 3.5). Rural schools had alower student-to-instructional-computer ratio than schools in other locations (4 comparedwith 6 each for schools located in urban fringes, cities, and towns). Furthermore, rural schoolshad lower student-to-instructional-computer-with-Internet ratios than urban fringe and cityschools (7 compared with 9 and 11, respectively).
Additionally, there were differences in student-to-instructional-computer ratios by poverty con-centration and minority enrollments in 1999. Higher poverty schools (31 to 49 percent ofstudents eligible for free or reduced-price lunch) had more students per instructional computer
FIGURE 3.2.—PERCENT OF PUBLIC SCHOOL 4TH-, 8TH-, AND 12TH-GRADE STUDENTS WHO HAD SCHOOL ADMINISTRATORS
REPORTING COMPUTER LABS AT SCHOOL, COMPUTERS IN THE CLASSROOM, OR COMPUTERS AVAILABLE TO BRING TO
CLASS: 1998
SOURCE: National Center for Education Statistics, National Assessment of Educational Progress (NAEP), 1998 Reading Assess-ments.
35
• AVAILABILITY OF TECHNOLOGY FOR INSTRUCTIONAL PURPOSES •
FIGURE 3.3.—PERCENT OF PUBLIC SCHOOL 4TH- AND 8TH-GRADE STUDENTS HAVING TEACHERS REPORTING COMPUTERS
AVAILABLE IN THEIR CLASSES OR LABS AS THEIR BEST COMPUTER AVAILABILITY: 1998
SOURCE: National Center for Education Statistics, National Assessment of Educational Progress (NAEP), 1998 Reading Assess-ments.
Percent
72
49
23
42
0
10
20
30
40
50
60
70
80
90
1004th-grade
8th-grade
Available in labAvailable in class
than lower poverty schools (11 to 30 percent and less than 11 percent of students eligible forfree or reduced-price lunch—6 compared with 5 each). Similarly, schools with the highestminority enrollments had a higher student-to-instructional-computer ratio than schools withlower minority enrollments (6 to 20 percent or less than 6 percent minority enrollments—6compared with 5 each).
Differences by poverty concentration and minority enrollments were also present in student-to-instructional-computer-with-Internet ratios. Schools with more than 70 percent of stu-dents eligible for free or reduced-price lunch had more students per instructional computerwith Internet than schools with lower poverty concentrations (31 to 49 percent, 11 to 30percent, and less than 11 percent—16 compared with 9, 8, and 7, respectively). Similarly,schools with the highest minority enrollments had a higher student-to-instructional-computer-with-Internet ratio than schools with lower minority enrollments (21 to 49 percent, 6 to 20percent, and less than 6 percent—13 compared with 9, 8, and 7, respectively).
The highest poverty schools were also less likely to report having instructional rooms con-nected to the Internet than several other groups in 1997 and 1998 (Rowand, 1999; Williams,2000—figure 3.6). Between 1998 and 1999, all schools except those with the highest povertyconcentrations reported an increase in the percentage of instructional rooms connected to theInternet. In 1999, 39 percent of instructional rooms at schools with more than 70 percent ofstudents eligible for free or reduced-price lunch were connected to the Internet, comparedwith 62 to 74 percent of schools with lower concentrations of poverty.
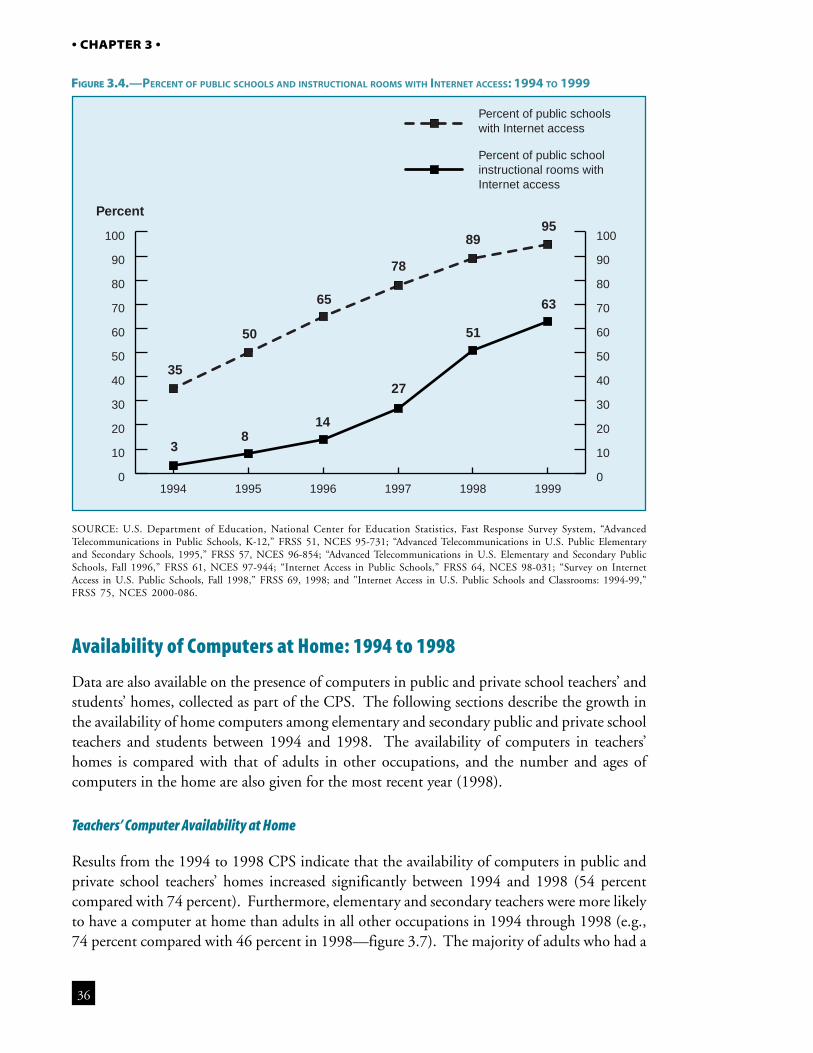
36
• CHAPTER 3 •
Availability of Computers at Home: 1994 to 1998
Data are also available on the presence of computers in public and private school teachers’ andstudents’ homes, collected as part of the CPS. The following sections describe the growth inthe availability of home computers among elementary and secondary public and private schoolteachers and students between 1994 and 1998. The availability of computers in teachers’homes is compared with that of adults in other occupations, and the number and ages ofcomputers in the home are also given for the most recent year (1998).
Teachers’ Computer Availability at Home
Results from the 1994 to 1998 CPS indicate that the availability of computers in public andprivate school teachers’ homes increased significantly between 1994 and 1998 (54 percentcompared with 74 percent). Furthermore, elementary and secondary teachers were more likelyto have a computer at home than adults in all other occupations in 1994 through 1998 (e.g.,74 percent compared with 46 percent in 1998—figure 3.7). The majority of adults who had a
FIGURE 3.4.—PERCENT OF PUBLIC SCHOOLS AND INSTRUCTIONAL ROOMS WITH INTERNET ACCESS: 1994 TO 1999
Percent
35
50
65
78
8995
63
51
27
148
3
0
10
20
30
40
50
60
70
80
90
100
0
10
20
30
40
50
60
70
80
90
100
Percent of public schools with Internet access
Percent of public school instructional rooms with Internet access
199919981997199619951994
SOURCE: U.S. Department of Education, National Center for Education Statistics, Fast Response Survey System, “AdvancedTelecommunications in Public Schools, K-12,” FRSS 51, NCES 95-731; “Advanced Telecommunications in U.S. Public Elementaryand Secondary Schools, 1995,” FRSS 57, NCES 96-854; “Advanced Telecommunications in U.S. Elementary and Secondary PublicSchools, Fall 1996,” FRSS 61, NCES 97-944; “Internet Access in Public Schools,” FRSS 64, NCES 98-031; “Survey on InternetAccess in U.S. Public Schools, Fall 1998,” FRSS 69, 1998; and "Internet Access in U.S. Public Schools and Classrooms: 1994-99,"FRSS 75, NCES 2000-086.
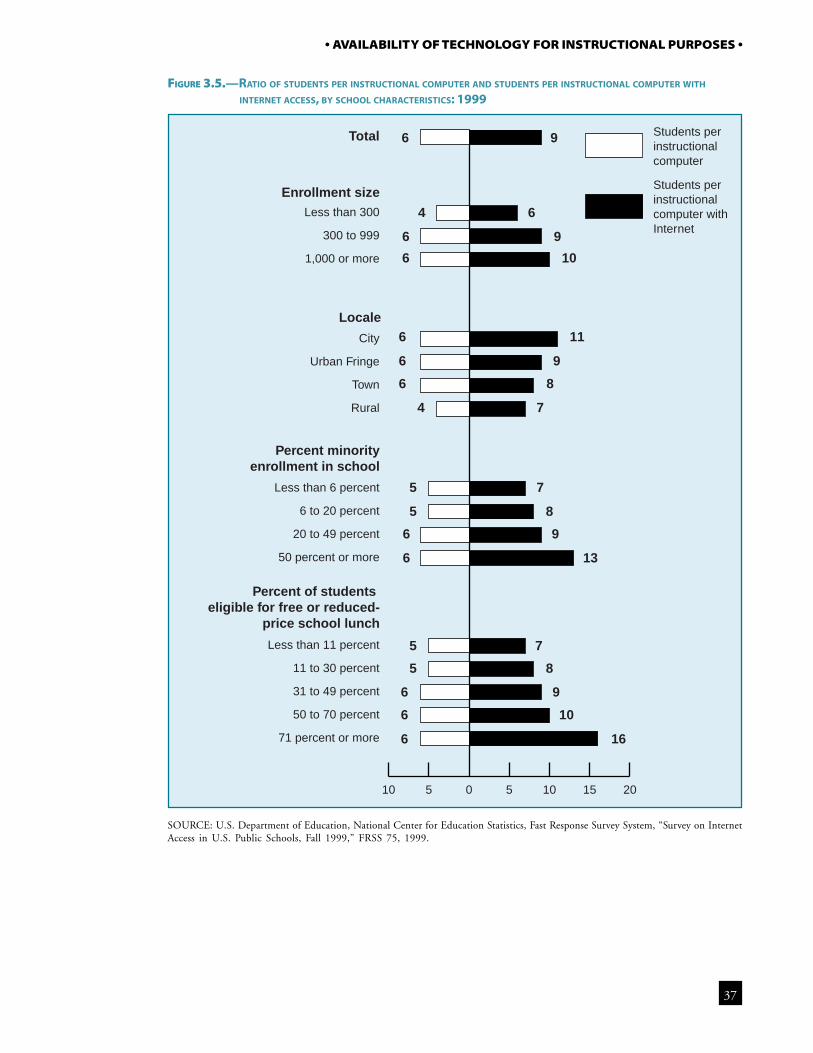
37
• AVAILABILITY OF TECHNOLOGY FOR INSTRUCTIONAL PURPOSES •
FIGURE 3.5.—RATIO OF STUDENTS PER INSTRUCTIONAL COMPUTER AND STUDENTS PER INSTRUCTIONAL COMPUTER WITH
INTERNET ACCESS, BY SCHOOL CHARACTERISTICS: 1999
Enrollment size
Locale
Percent minorityenrollment in school
Percent of students eligible for free or reduced-
price school lunch
6
4
6
6
6
6
6
4
5
5
6
6
5
5
6
6
6 16
10
9
8
7
13
9
8
7
7
8
9
11
10
9
6
9
10 5 0 5 10 15 20
71 percent or more
50 to 70 percent
31 to 49 percent
11 to 30 percent
Less than 11 percent
50 percent or more
20 to 49 percent
6 to 20 percent
Less than 6 percent
Rural
Town
Urban Fringe
City
1,000 or more
300 to 999
Less than 300
Total Students per instructional computer
Students per instructional computer with Internet
SOURCE: U.S. Department of Education, National Center for Education Statistics, Fast Response Survey System, “Survey on InternetAccess in U.S. Public Schools, Fall 1999,” FRSS 75, 1999.
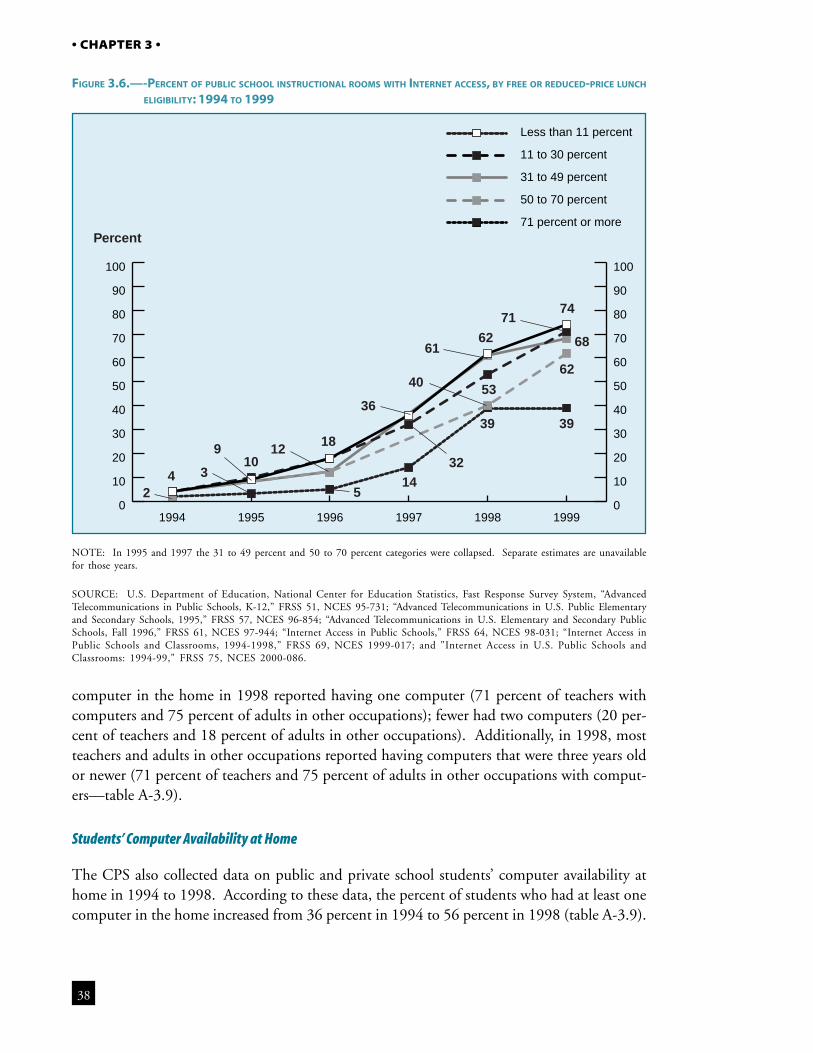
38
• CHAPTER 3 •
computer in the home in 1998 reported having one computer (71 percent of teachers withcomputers and 75 percent of adults in other occupations); fewer had two computers (20 per-cent of teachers and 18 percent of adults in other occupations). Additionally, in 1998, mostteachers and adults in other occupations reported having computers that were three years oldor newer (71 percent of teachers and 75 percent of adults in other occupations with comput-ers—table A-3.9).
Students’ Computer Availability at Home
The CPS also collected data on public and private school students’ computer availability athome in 1994 to 1998. According to these data, the percent of students who had at least onecomputer in the home increased from 36 percent in 1994 to 56 percent in 1998 (table A-3.9).
FIGURE 3.6.—-PERCENT OF PUBLIC SCHOOL INSTRUCTIONAL ROOMS WITH INTERNET ACCESS, BY FREE OR REDUCED-PRICE LUNCH
ELIGIBILITY: 1994 TO 1999
NOTE: In 1995 and 1997 the 31 to 49 percent and 50 to 70 percent categories were collapsed. Separate estimates are unavailablefor those years.
SOURCE: U.S. Department of Education, National Center for Education Statistics, Fast Response Survey System, “AdvancedTelecommunications in Public Schools, K-12,” FRSS 51, NCES 95-731; “Advanced Telecommunications in U.S. Public Elementaryand Secondary Schools, 1995,” FRSS 57, NCES 96-854; “Advanced Telecommunications in U.S. Elementary and Secondary PublicSchools, Fall 1996,” FRSS 61, NCES 97-944; “Internet Access in Public Schools,” FRSS 64, NCES 98-031; “Internet Access inPublic Schools and Classrooms, 1994-1998,” FRSS 69, NCES 1999-017; and "Internet Access in U.S. Public Schools andClassrooms: 1994-99," FRSS 75, NCES 2000-086.
0
10
20
30
40
50
60
70
80
90
100
0
10
20
30
40
50
60
70
80
90
100
Less than 11 percent
11 to 30 percent
31 to 49 percent
50 to 70 percent
71 percent or more
199919981997199619951994
42
310
9
514
39 39
12 18
62
5340
36
32
61 68
62
7174
Percent
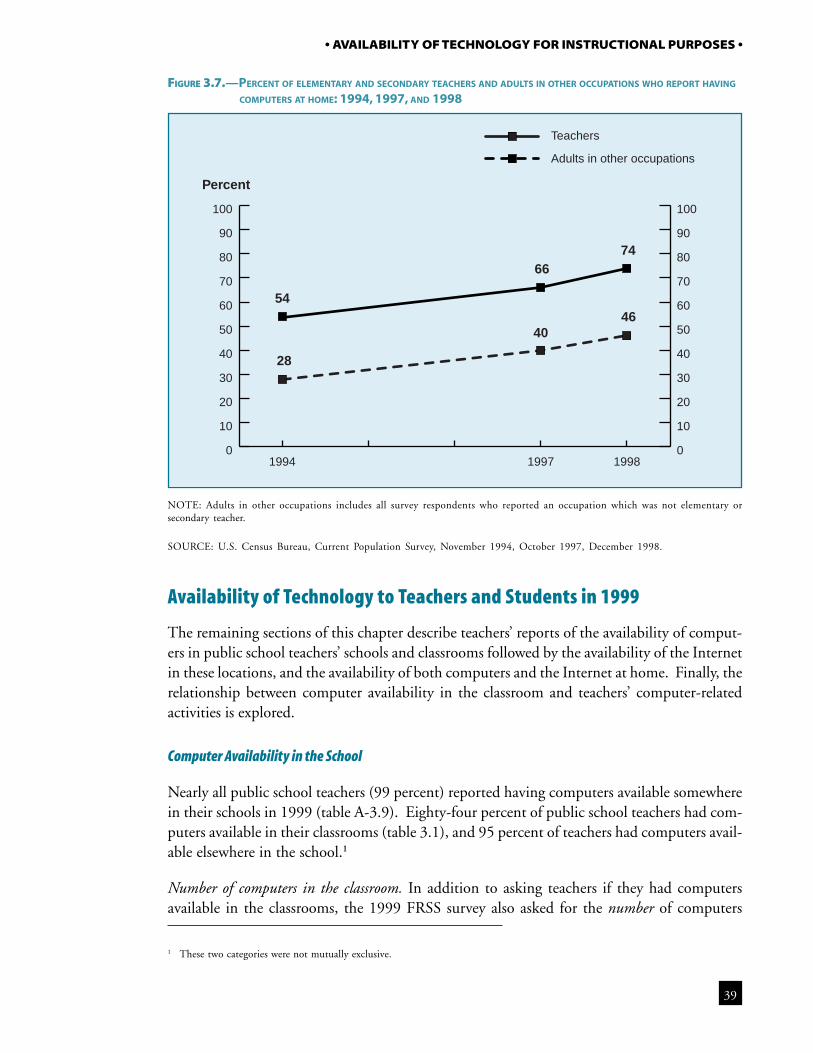
39
• AVAILABILITY OF TECHNOLOGY FOR INSTRUCTIONAL PURPOSES •
FIGURE 3.7.—PERCENT OF ELEMENTARY AND SECONDARY TEACHERS AND ADULTS IN OTHER OCCUPATIONS WHO REPORT HAVING
COMPUTERS AT HOME: 1994, 1997, AND 1998
NOTE: Adults in other occupations includes all survey respondents who reported an occupation which was not elementary orsecondary teacher.
SOURCE: U.S. Census Bureau, Current Population Survey, November 1994, October 1997, December 1998.
Availability of Technology to Teachers and Students in 1999
The remaining sections of this chapter describe teachers’ reports of the availability of comput-ers in public school teachers’ schools and classrooms followed by the availability of the Internetin these locations, and the availability of both computers and the Internet at home. Finally, therelationship between computer availability in the classroom and teachers’ computer-relatedactivities is explored.
Computer Availability in the School
Nearly all public school teachers (99 percent) reported having computers available somewherein their schools in 1999 (table A-3.9). Eighty-four percent of public school teachers had com-puters available in their classrooms (table 3.1), and 95 percent of teachers had computers avail-able elsewhere in the school.1
Number of computers in the classroom. In addition to asking teachers if they had computersavailable in the classrooms, the 1999 FRSS survey also asked for the number of computers
Percent
54
6674
4640
28
0
10
20
30
40
50
60
70
80
90
100
0
10
20
30
40
50
60
70
80
90
100
Teachers
Adults in other occupations
199819971994
1 These two categories were not mutually exclusive.
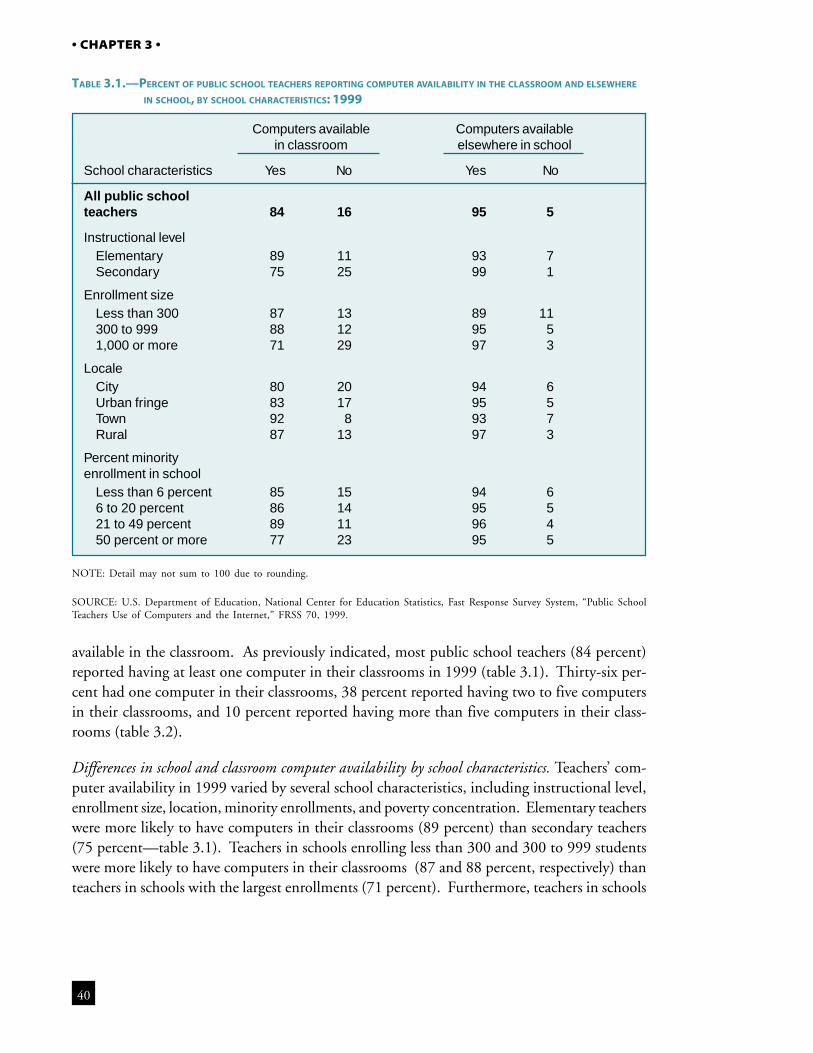
40
• CHAPTER 3 •
TABLE 3.1.—PERCENT OF PUBLIC SCHOOL TEACHERS REPORTING COMPUTER AVAILABILITY IN THE CLASSROOM AND ELSEWHERE
IN SCHOOL, BY SCHOOL CHARACTERISTICS: 1999
NOTE: Detail may not sum to 100 due to rounding.
SOURCE: U.S. Department of Education, National Center for Education Statistics, Fast Response Survey System, “Public SchoolTeachers Use of Computers and the Internet,” FRSS 70, 1999.
available in the classroom. As previously indicated, most public school teachers (84 percent)reported having at least one computer in their classrooms in 1999 (table 3.1). Thirty-six per-cent had one computer in their classrooms, 38 percent reported having two to five computersin their classrooms, and 10 percent reported having more than five computers in their class-rooms (table 3.2).
Differences in school and classroom computer availability by school characteristics. Teachers’ com-puter availability in 1999 varied by several school characteristics, including instructional level,enrollment size, location, minority enrollments, and poverty concentration. Elementary teacherswere more likely to have computers in their classrooms (89 percent) than secondary teachers(75 percent—table 3.1). Teachers in schools enrolling less than 300 and 300 to 999 studentswere more likely to have computers in their classrooms (87 and 88 percent, respectively) thanteachers in schools with the largest enrollments (71 percent). Furthermore, teachers in schools
Computers available Computers availablein classroom elsewhere in school
School characteristics Yes No Yes No
All public schoolteachers 84 16 95 5
Instructional levelElementary 89 11 93 7Secondary 75 25 99 1
Enrollment sizeLess than 300 87 13 89 11300 to 999 88 12 95 51,000 or more 71 29 97 3
LocaleCity 80 20 94 6Urban fringe 83 17 95 5Town 92 8 93 7Rural 87 13 97 3
Percent minorityenrollment in school
Less than 6 percent 85 15 94 66 to 20 percent 86 14 95 521 to 49 percent 89 11 96 450 percent or more 77 23 95 5
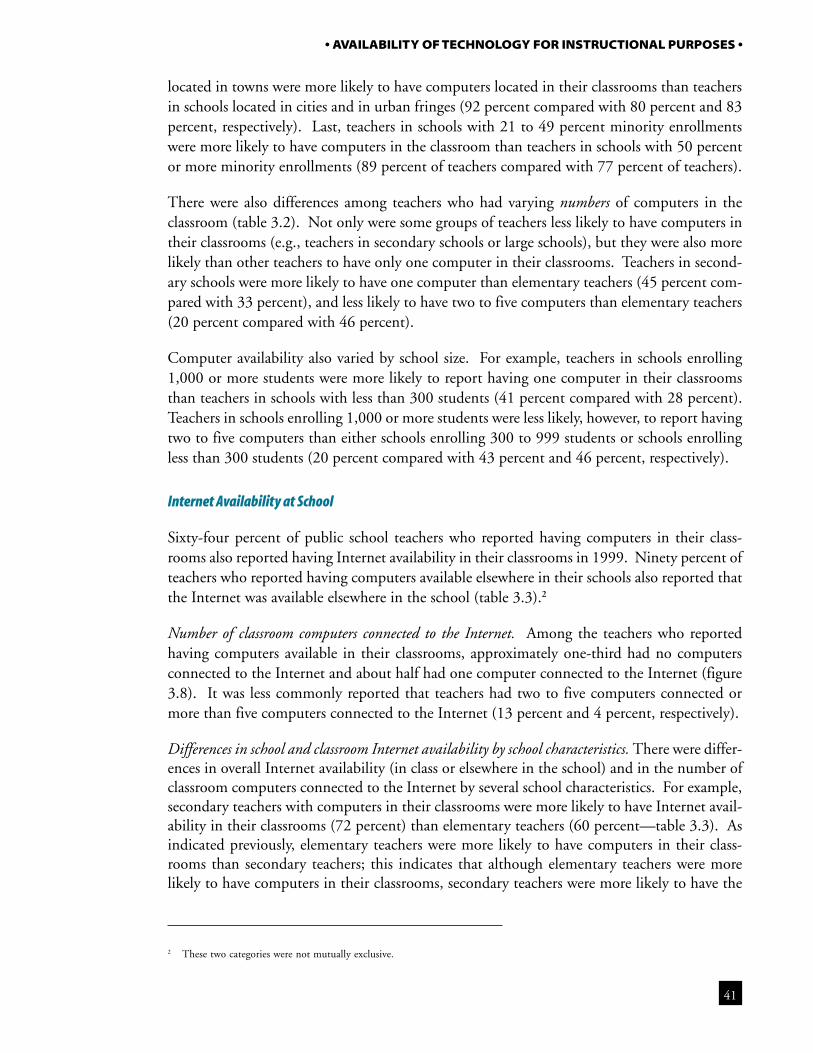
41
• AVAILABILITY OF TECHNOLOGY FOR INSTRUCTIONAL PURPOSES •
located in towns were more likely to have computers located in their classrooms than teachersin schools located in cities and in urban fringes (92 percent compared with 80 percent and 83percent, respectively). Last, teachers in schools with 21 to 49 percent minority enrollmentswere more likely to have computers in the classroom than teachers in schools with 50 percentor more minority enrollments (89 percent of teachers compared with 77 percent of teachers).
There were also differences among teachers who had varying numbers of computers in theclassroom (table 3.2). Not only were some groups of teachers less likely to have computers intheir classrooms (e.g., teachers in secondary schools or large schools), but they were also morelikely than other teachers to have only one computer in their classrooms. Teachers in second-ary schools were more likely to have one computer than elementary teachers (45 percent com-pared with 33 percent), and less likely to have two to five computers than elementary teachers(20 percent compared with 46 percent).
Computer availability also varied by school size. For example, teachers in schools enrolling1,000 or more students were more likely to report having one computer in their classroomsthan teachers in schools with less than 300 students (41 percent compared with 28 percent).Teachers in schools enrolling 1,000 or more students were less likely, however, to report havingtwo to five computers than either schools enrolling 300 to 999 students or schools enrollingless than 300 students (20 percent compared with 43 percent and 46 percent, respectively).
Internet Availability at School
Sixty-four percent of public school teachers who reported having computers in their class-rooms also reported having Internet availability in their classrooms in 1999. Ninety percent ofteachers who reported having computers available elsewhere in their schools also reported thatthe Internet was available elsewhere in the school (table 3.3).2
Number of classroom computers connected to the Internet. Among the teachers who reportedhaving computers available in their classrooms, approximately one-third had no computersconnected to the Internet and about half had one computer connected to the Internet (figure3.8). It was less commonly reported that teachers had two to five computers connected ormore than five computers connected to the Internet (13 percent and 4 percent, respectively).
Differences in school and classroom Internet availability by school characteristics. There were differ-ences in overall Internet availability (in class or elsewhere in the school) and in the number ofclassroom computers connected to the Internet by several school characteristics. For example,secondary teachers with computers in their classrooms were more likely to have Internet avail-ability in their classrooms (72 percent) than elementary teachers (60 percent—table 3.3). Asindicated previously, elementary teachers were more likely to have computers in their class-rooms than secondary teachers; this indicates that although elementary teachers were morelikely to have computers in their classrooms, secondary teachers were more likely to have the
2 These two categories were not mutually exclusive.
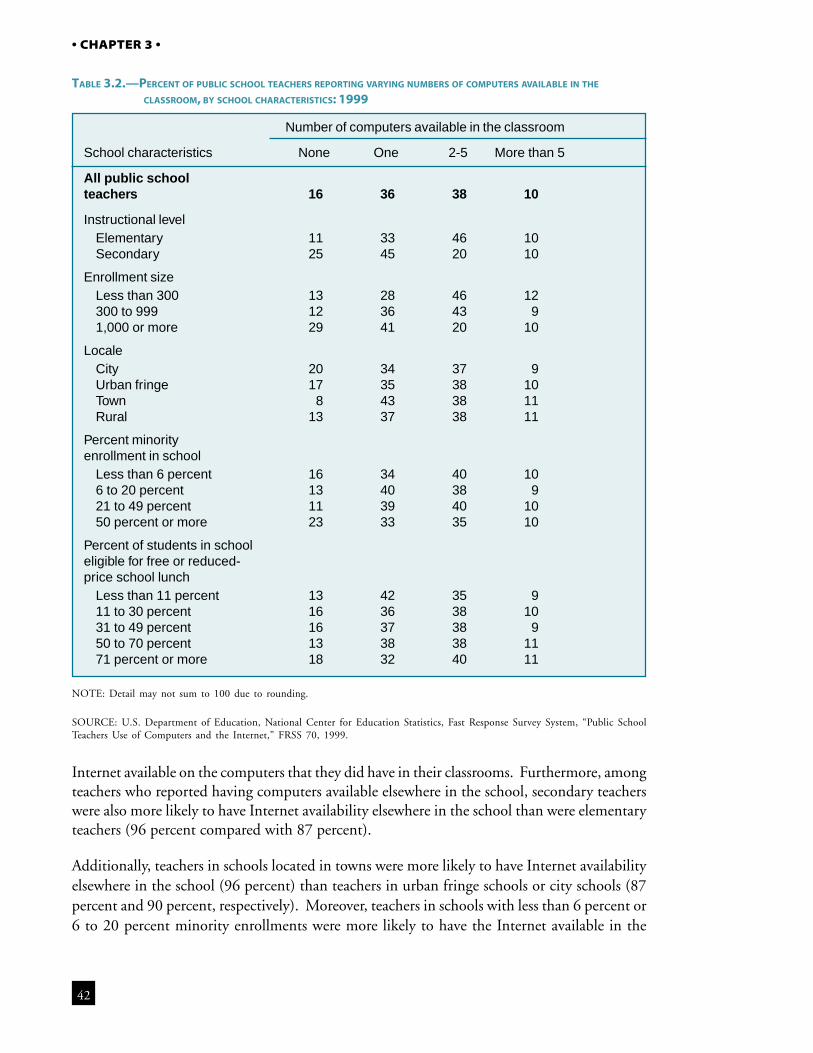
42
• CHAPTER 3 •
TABLE 3.2.—PERCENT OF PUBLIC SCHOOL TEACHERS REPORTING VARYING NUMBERS OF COMPUTERS AVAILABLE IN THE
CLASSROOM, BY SCHOOL CHARACTERISTICS: 1999
NOTE: Detail may not sum to 100 due to rounding.
SOURCE: U.S. Department of Education, National Center for Education Statistics, Fast Response Survey System, “Public SchoolTeachers Use of Computers and the Internet,” FRSS 70, 1999.
Internet available on the computers that they did have in their classrooms. Furthermore, amongteachers who reported having computers available elsewhere in the school, secondary teacherswere also more likely to have Internet availability elsewhere in the school than were elementaryteachers (96 percent compared with 87 percent).
Additionally, teachers in schools located in towns were more likely to have Internet availabilityelsewhere in the school (96 percent) than teachers in urban fringe schools or city schools (87percent and 90 percent, respectively). Moreover, teachers in schools with less than 6 percent or6 to 20 percent minority enrollments were more likely to have the Internet available in the
Number of computers available in the classroom
School characteristics None One 2-5 More than 5
All public schoolteachers 16 36 38 10
Instructional levelElementary 11 33 46 10Secondary 25 45 20 10
Enrollment sizeLess than 300 13 28 46 12300 to 999 12 36 43 91,000 or more 29 41 20 10
LocaleCity 20 34 37 9Urban fringe 17 35 38 10Town 8 43 38 11Rural 13 37 38 11
Percent minorityenrollment in school
Less than 6 percent 16 34 40 106 to 20 percent 13 40 38 921 to 49 percent 11 39 40 1050 percent or more 23 33 35 10
Percent of students in schooleligible for free or reduced-price school lunch
Less than 11 percent 13 42 35 911 to 30 percent 16 36 38 1031 to 49 percent 16 37 38 950 to 70 percent 13 38 38 1171 percent or more 18 32 40 11
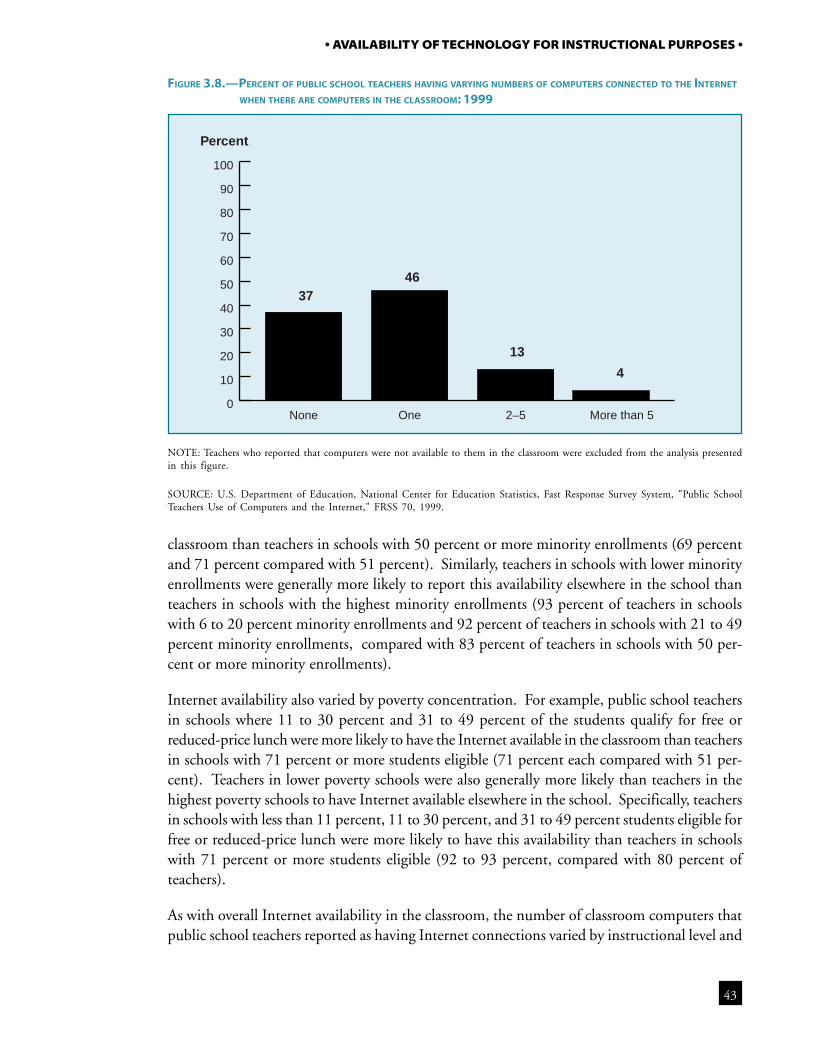
43
• AVAILABILITY OF TECHNOLOGY FOR INSTRUCTIONAL PURPOSES •
classroom than teachers in schools with 50 percent or more minority enrollments (69 percentand 71 percent compared with 51 percent). Similarly, teachers in schools with lower minorityenrollments were generally more likely to report this availability elsewhere in the school thanteachers in schools with the highest minority enrollments (93 percent of teachers in schoolswith 6 to 20 percent minority enrollments and 92 percent of teachers in schools with 21 to 49percent minority enrollments, compared with 83 percent of teachers in schools with 50 per-cent or more minority enrollments).
Internet availability also varied by poverty concentration. For example, public school teachersin schools where 11 to 30 percent and 31 to 49 percent of the students qualify for free orreduced-price lunch were more likely to have the Internet available in the classroom than teachersin schools with 71 percent or more students eligible (71 percent each compared with 51 per-cent). Teachers in lower poverty schools were also generally more likely than teachers in thehighest poverty schools to have Internet available elsewhere in the school. Specifically, teachersin schools with less than 11 percent, 11 to 30 percent, and 31 to 49 percent students eligible forfree or reduced-price lunch were more likely to have this availability than teachers in schoolswith 71 percent or more students eligible (92 to 93 percent, compared with 80 percent ofteachers).
As with overall Internet availability in the classroom, the number of classroom computers thatpublic school teachers reported as having Internet connections varied by instructional level and
Percent
3746
13
4
0
10
20
30
40
50
60
70
80
90
100
More than 52–5OneNone
NOTE: Teachers who reported that computers were not available to them in the classroom were excluded from the analysis presentedin this figure.
SOURCE: U.S. Department of Education, National Center for Education Statistics, Fast Response Survey System, "Public SchoolTeachers Use of Computers and the Internet," FRSS 70, 1999.
FIGURE 3.8.—PERCENT OF PUBLIC SCHOOL TEACHERS HAVING VARYING NUMBERS OF COMPUTERS CONNECTED TO THE INTERNET
WHEN THERE ARE COMPUTERS IN THE CLASSROOM: 1999
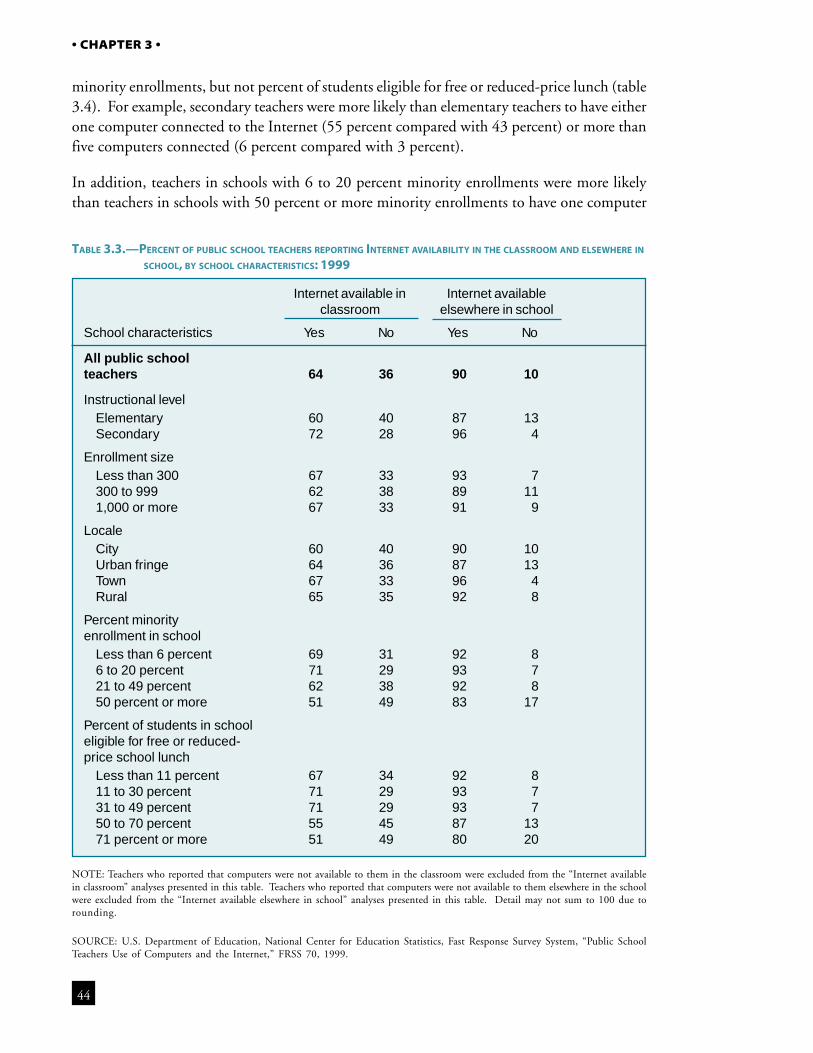
44
• CHAPTER 3 •
minority enrollments, but not percent of students eligible for free or reduced-price lunch (table3.4). For example, secondary teachers were more likely than elementary teachers to have eitherone computer connected to the Internet (55 percent compared with 43 percent) or more thanfive computers connected (6 percent compared with 3 percent).
In addition, teachers in schools with 6 to 20 percent minority enrollments were more likelythan teachers in schools with 50 percent or more minority enrollments to have one computer
TABLE 3.3.—PERCENT OF PUBLIC SCHOOL TEACHERS REPORTING INTERNET AVAILABILITY IN THE CLASSROOM AND ELSEWHERE INSCHOOL, BY SCHOOL CHARACTERISTICS: 1999
NOTE: Teachers who reported that computers were not available to them in the classroom were excluded from the “Internet availablein classroom” analyses presented in this table. Teachers who reported that computers were not available to them elsewhere in the schoolwere excluded from the “Internet available elsewhere in school” analyses presented in this table. Detail may not sum to 100 due torounding.
SOURCE: U.S. Department of Education, National Center for Education Statistics, Fast Response Survey System, “Public SchoolTeachers Use of Computers and the Internet,” FRSS 70, 1999.
Internet available in Internet availableclassroom elsewhere in school
School characteristics Yes No Yes No
All public schoolteachers 64 36 90 10
Instructional levelElementary 60 40 87 13Secondary 72 28 96 4
Enrollment sizeLess than 300 67 33 93 7300 to 999 62 38 89 111,000 or more 67 33 91 9
LocaleCity 60 40 90 10Urban fringe 64 36 87 13Town 67 33 96 4Rural 65 35 92 8
Percent minorityenrollment in school
Less than 6 percent 69 31 92 86 to 20 percent 71 29 93 721 to 49 percent 62 38 92 850 percent or more 51 49 83 17
Percent of students in schooleligible for free or reduced-price school lunch
Less than 11 percent 67 34 92 811 to 30 percent 71 29 93 731 to 49 percent 71 29 93 750 to 70 percent 55 45 87 1371 percent or more 51 49 80 20
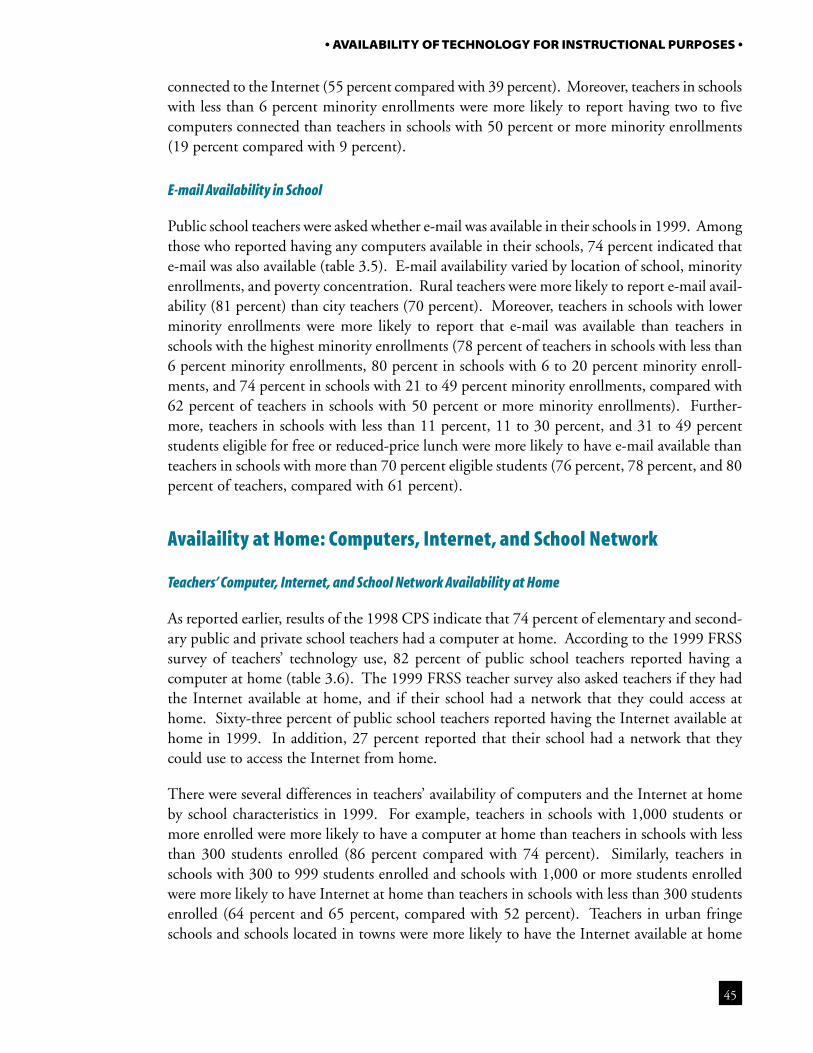
45
• AVAILABILITY OF TECHNOLOGY FOR INSTRUCTIONAL PURPOSES •
connected to the Internet (55 percent compared with 39 percent). Moreover, teachers in schoolswith less than 6 percent minority enrollments were more likely to report having two to fivecomputers connected than teachers in schools with 50 percent or more minority enrollments(19 percent compared with 9 percent).
E-mail Availability in School
Public school teachers were asked whether e-mail was available in their schools in 1999. Amongthose who reported having any computers available in their schools, 74 percent indicated thate-mail was also available (table 3.5). E-mail availability varied by location of school, minorityenrollments, and poverty concentration. Rural teachers were more likely to report e-mail avail-ability (81 percent) than city teachers (70 percent). Moreover, teachers in schools with lowerminority enrollments were more likely to report that e-mail was available than teachers inschools with the highest minority enrollments (78 percent of teachers in schools with less than6 percent minority enrollments, 80 percent in schools with 6 to 20 percent minority enroll-ments, and 74 percent in schools with 21 to 49 percent minority enrollments, compared with62 percent of teachers in schools with 50 percent or more minority enrollments). Further-more, teachers in schools with less than 11 percent, 11 to 30 percent, and 31 to 49 percentstudents eligible for free or reduced-price lunch were more likely to have e-mail available thanteachers in schools with more than 70 percent eligible students (76 percent, 78 percent, and 80percent of teachers, compared with 61 percent).
Availaility at Home: Computers, Internet, and School Network
Teachers’ Computer, Internet, and School Network Availability at Home
As reported earlier, results of the 1998 CPS indicate that 74 percent of elementary and second-ary public and private school teachers had a computer at home. According to the 1999 FRSSsurvey of teachers’ technology use, 82 percent of public school teachers reported having acomputer at home (table 3.6). The 1999 FRSS teacher survey also asked teachers if they hadthe Internet available at home, and if their school had a network that they could access athome. Sixty-three percent of public school teachers reported having the Internet available athome in 1999. In addition, 27 percent reported that their school had a network that theycould use to access the Internet from home.
There were several differences in teachers’ availability of computers and the Internet at homeby school characteristics in 1999. For example, teachers in schools with 1,000 students ormore enrolled were more likely to have a computer at home than teachers in schools with lessthan 300 students enrolled (86 percent compared with 74 percent). Similarly, teachers inschools with 300 to 999 students enrolled and schools with 1,000 or more students enrolledwere more likely to have Internet at home than teachers in schools with less than 300 studentsenrolled (64 percent and 65 percent, compared with 52 percent). Teachers in urban fringeschools and schools located in towns were more likely to have the Internet available at home
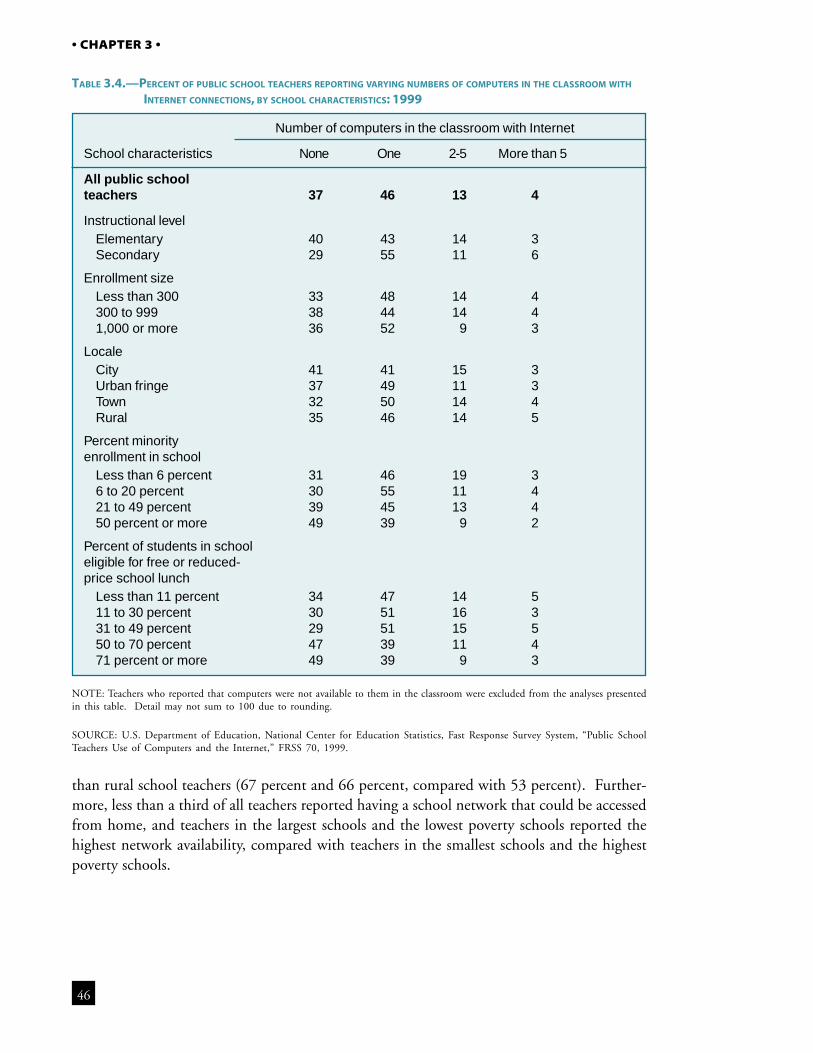
46
• CHAPTER 3 •
than rural school teachers (67 percent and 66 percent, compared with 53 percent). Further-more, less than a third of all teachers reported having a school network that could be accessedfrom home, and teachers in the largest schools and the lowest poverty schools reported thehighest network availability, compared with teachers in the smallest schools and the highestpoverty schools.
NOTE: Teachers who reported that computers were not available to them in the classroom were excluded from the analyses presentedin this table. Detail may not sum to 100 due to rounding.
SOURCE: U.S. Department of Education, National Center for Education Statistics, Fast Response Survey System, “Public SchoolTeachers Use of Computers and the Internet,” FRSS 70, 1999.
TABLE 3.4.—PERCENT OF PUBLIC SCHOOL TEACHERS REPORTING VARYING NUMBERS OF COMPUTERS IN THE CLASSROOM WITH
INTERNET CONNECTIONS, BY SCHOOL CHARACTERISTICS: 1999
Number of computers in the classroom with Internet
School characteristics None One 2-5 More than 5
All public schoolteachers 37 46 13 4
Instructional levelElementary 40 43 14 3Secondary 29 55 11 6
Enrollment sizeLess than 300 33 48 14 4300 to 999 38 44 14 41,000 or more 36 52 9 3
LocaleCity 41 41 15 3Urban fringe 37 49 11 3Town 32 50 14 4Rural 35 46 14 5
Percent minorityenrollment in school
Less than 6 percent 31 46 19 36 to 20 percent 30 55 11 421 to 49 percent 39 45 13 450 percent or more 49 39 9 2
Percent of students in schooleligible for free or reduced-price school lunch
Less than 11 percent 34 47 14 511 to 30 percent 30 51 16 331 to 49 percent 29 51 15 550 to 70 percent 47 39 11 471 percent or more 49 39 9 3
47
• AVAILABILITY OF TECHNOLOGY FOR INSTRUCTIONAL PURPOSES •
TABLE 3.5.—PERCENT OF PUBLIC SCHOOL TEACHERS HAVING E-MAIL AVAILABLE TO THEM AT SCHOOL,BY SCHOOL CHARACTERISTICS: 1999
NOTE: Teachers who reported that computers were not available to them anywhere in the school were excluded from the analysespresented in this table. Detail may not sum to 100 due to rounding.
SOURCE: U.S. Department of Education, National Center for Education Statistics, Fast Response Survey System, “Public SchoolTeachers Use of Computers and the Internet,” FRSS 70, 1999.
Students’ Computer Availability at Home
Because 48 percent of the teachers surveyed in 1999 reported assigning projects using thecomputer outside of class, it is useful to know if students had the resources to complete theseassignments at home. This section uses data from the 1999 FRSS teacher survey3 to describethe availability of computers in students’ homes during that year. Results of this survey indi-cate that 36 percent of the teachers reported that more than half of their students had comput-ers at home (table 3.7). This means that 64 percent of teachers did not believe that the majorityof their students had a computer available at home. The percent of teachers who reported thatmore than half of their students had computers at home varied by several school characteristics.For example, teachers in urban fringe schools were more likely to report that the majority of
3 The FRSS data reported in this section are teachers’ estimates of students’ home computer availability, and therefore may not accu-rately reflect whether students had computers at home. Data from the 1998 CPS on the percent of students who reported having acomputer at home were presented earlier in the chapter.
E-mail available at school
School characteristics Yes No
All public schoolteachers 74 26
LocaleCity 70 30Urban fringe 71 29Town 79 21Rural 81 19
Percent minorityenrollment in schoolLess than 6 percent 78 226 to 20 percent 80 2021 to 49 percent 74 2650 percent or more 62 38
Percent of students in schooleligible for free or reduced-price school lunchLess than 11 percent 76 2411 to 30 percent 78 2231 to 49 percent 80 2050 to 70 percent 69 3171 percent or more 61 39
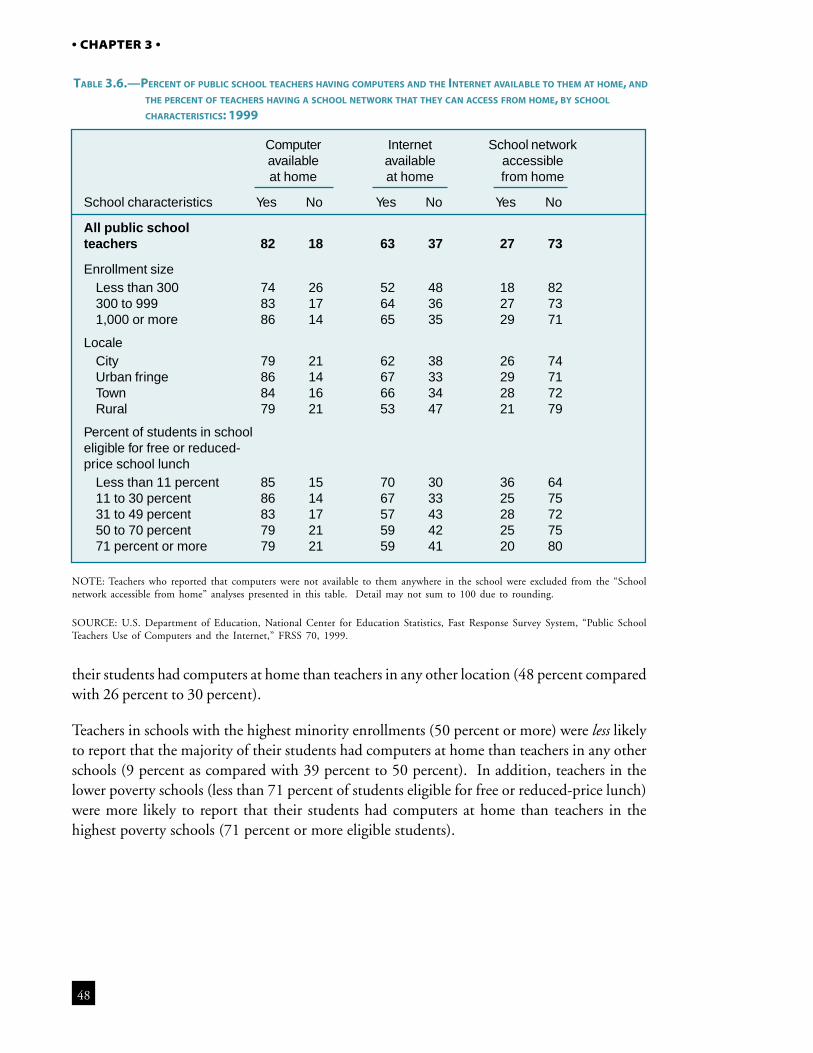
48
• CHAPTER 3 •
their students had computers at home than teachers in any other location (48 percent comparedwith 26 percent to 30 percent).
Teachers in schools with the highest minority enrollments (50 percent or more) were less likelyto report that the majority of their students had computers at home than teachers in any otherschools (9 percent as compared with 39 percent to 50 percent). In addition, teachers in thelower poverty schools (less than 71 percent of students eligible for free or reduced-price lunch)were more likely to report that their students had computers at home than teachers in thehighest poverty schools (71 percent or more eligible students).
TABLE 3.6.—PERCENT OF PUBLIC SCHOOL TEACHERS HAVING COMPUTERS AND THE INTERNET AVAILABLE TO THEM AT HOME, AND
THE PERCENT OF TEACHERS HAVING A SCHOOL NETWORK THAT THEY CAN ACCESS FROM HOME, BY SCHOOL
CHARACTERISTICS: 1999
NOTE: Teachers who reported that computers were not available to them anywhere in the school were excluded from the “Schoolnetwork accessible from home” analyses presented in this table. Detail may not sum to 100 due to rounding.
SOURCE: U.S. Department of Education, National Center for Education Statistics, Fast Response Survey System, “Public SchoolTeachers Use of Computers and the Internet,” FRSS 70, 1999.
Computer Internet School networkavailable available accessibleat home at home from home
School characteristics Yes No Yes No Yes No
All public schoolteachers 82 18 63 37 27 73
Enrollment sizeLess than 300 74 26 52 48 18 82300 to 999 83 17 64 36 27 731,000 or more 86 14 65 35 29 71
LocaleCity 79 21 62 38 26 74Urban fringe 86 14 67 33 29 71Town 84 16 66 34 28 72Rural 79 21 53 47 21 79
Percent of students in schooleligible for free or reduced-price school lunch
Less than 11 percent 85 15 70 30 36 6411 to 30 percent 86 14 67 33 25 7531 to 49 percent 83 17 57 43 28 7250 to 70 percent 79 21 59 42 25 7571 percent or more 79 21 59 41 20 80
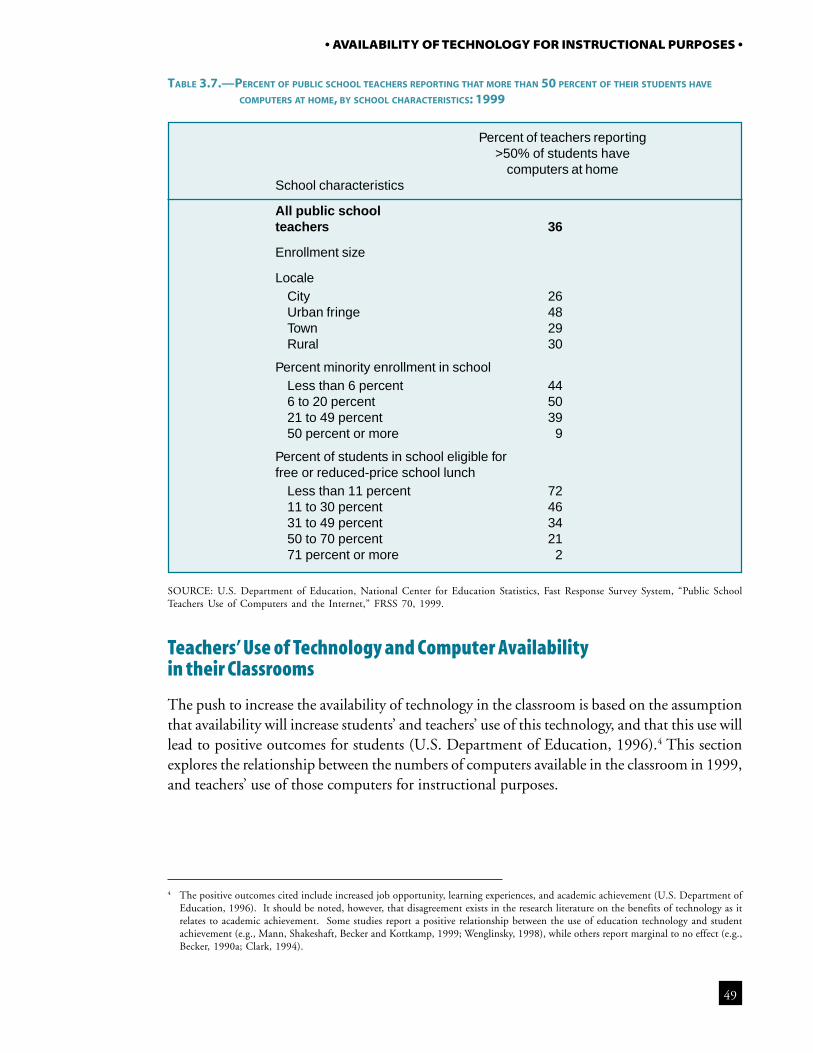
49
• AVAILABILITY OF TECHNOLOGY FOR INSTRUCTIONAL PURPOSES •
4 The positive outcomes cited include increased job opportunity, learning experiences, and academic achievement (U.S. Department ofEducation, 1996). It should be noted, however, that disagreement exists in the research literature on the benefits of technology as itrelates to academic achievement. Some studies report a positive relationship between the use of education technology and studentachievement (e.g., Mann, Shakeshaft, Becker and Kottkamp, 1999; Wenglinsky, 1998), while others report marginal to no effect (e.g.,Becker, 1990a; Clark, 1994).
TABLE 3.7.—PERCENT OF PUBLIC SCHOOL TEACHERS REPORTING THAT MORE THAN 50 PERCENT OF THEIR STUDENTS HAVE
COMPUTERS AT HOME, BY SCHOOL CHARACTERISTICS: 1999
SOURCE: U.S. Department of Education, National Center for Education Statistics, Fast Response Survey System, “Public SchoolTeachers Use of Computers and the Internet,” FRSS 70, 1999.
Percent of teachers reporting>50% of students have
computers at homeSchool characteristics
All public schoolteachers 36
Enrollment size
LocaleCity 26Urban fringe 48Town 29Rural 30
Percent minority enrollment in schoolLess than 6 percent 446 to 20 percent 5021 to 49 percent 3950 percent or more 9
Percent of students in school eligible forfree or reduced-price school lunch
Less than 11 percent 7211 to 30 percent 4631 to 49 percent 3450 to 70 percent 2171 percent or more 2
Teachers’ Use of Technology and Computer Availabilityin their Classrooms
The push to increase the availability of technology in the classroom is based on the assumptionthat availability will increase students’ and teachers’ use of this technology, and that this use willlead to positive outcomes for students (U.S. Department of Education, 1996).4 This sectionexplores the relationship between the numbers of computers available in the classroom in 1999,and teachers’ use of those computers for instructional purposes.
50
• CHAPTER 3 •
Preparatory Tasks and Computer Availability
Among teachers who reported having computers located in their classrooms, those who hadmore than 5 classroom computers were more likely than those with fewer classroom computersto report doing various preparatory activities “a lot” (figure 3.9). For example, 28 percent ofteachers with more than five computers reporting using computers or the Internet a lot togather information for lesson plans, compared with 17 percent of teachers with two to fivecomputers and 13 percent of teachers with one computer. A similar relationship was found forusing computers or the Internet a lot to prepare multimedia presentations.
Classroom Instruction and Computer Availability
Teachers’ reports of assigning students to use computers or the Internet for various instruc-tional purposes differed by the number of computers in their classrooms. For example, 59percent of teachers with one computer in the classroom reported not assigning students to usecomputers or the Internet to solve problems or analyze data, compared with 40 percent ofteachers with two to five computers and 23 percent of teachers with more than five computers(table 3.8). Conversely, teachers with more than five computers in their classrooms were mostlikely to report assigning problem solving or data analysis computer work to a “large extent,”followed by teachers with two to five computers and teachers with one computer (21 percentcompared with 9 percent and 5 percent, respectively). Similar relationships were found forword processing and practicing drills.
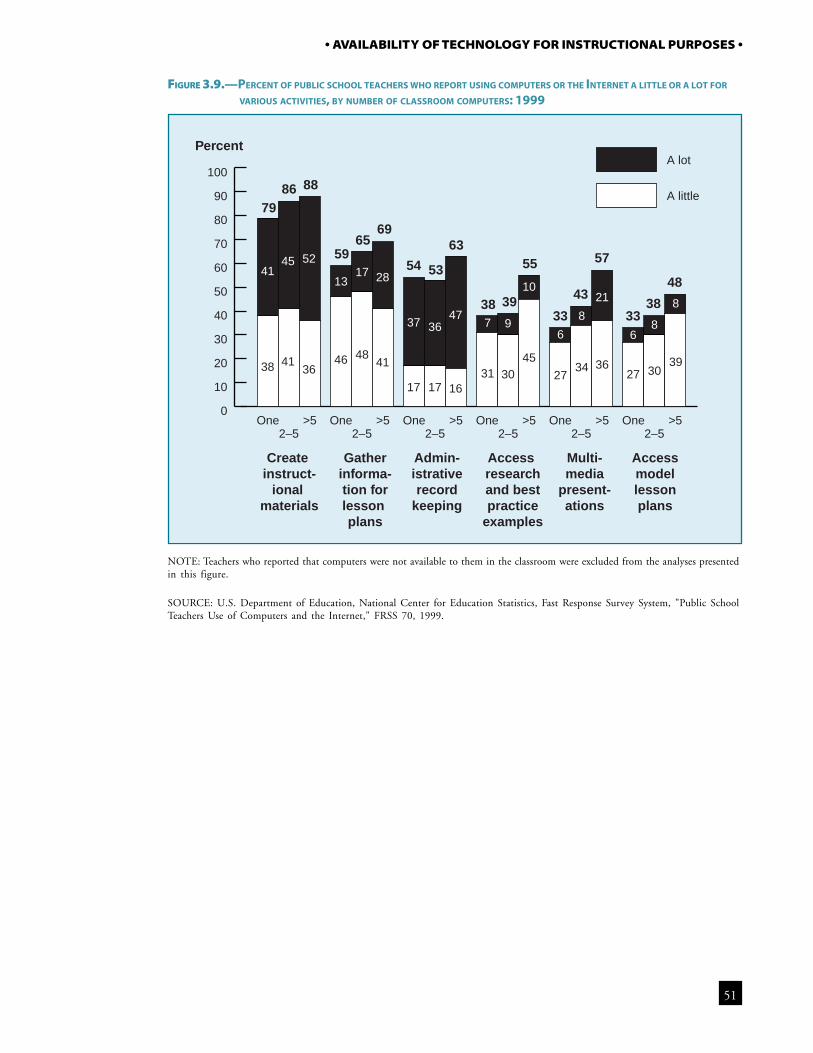
51
• AVAILABILITY OF TECHNOLOGY FOR INSTRUCTIONAL PURPOSES •
FIGURE 3.9.—PERCENT OF PUBLIC SCHOOL TEACHERS WHO REPORT USING COMPUTERS OR THE INTERNET A LITTLE OR A LOT FOR
VARIOUS ACTIVITIES, BY NUMBER OF CLASSROOM COMPUTERS: 1999
NOTE: Teachers who reported that computers were not available to them in the classroom were excluded from the analyses presentedin this figure.
SOURCE: U.S. Department of Education, National Center for Education Statistics, Fast Response Survey System, "Public SchoolTeachers Use of Computers and the Internet," FRSS 70, 1999.
Percent
Create instruct-
ional materials
Gatherinforma-tion forlesson plans
Admin-istrativerecord
keeping
Access researchand bestpractice
examples
Multi-media
present-ations
Accessmodellessonplans
7986 88
5965
69
54 53
63
38 39
55
33
43
57
3338
48
0
10
20
30
40
50
60
70
80
90
100A lot
A little
>52–5
One>52–5
One>52–5
One>52–5
One>52–5
One>52–5
One
38
41
41
45
36
52
46
13
48
17
41
28
17
37
17
36
16
47
31
7
30
9
45
10
27
6
34
8
36
21
27
6
30
8
39
8
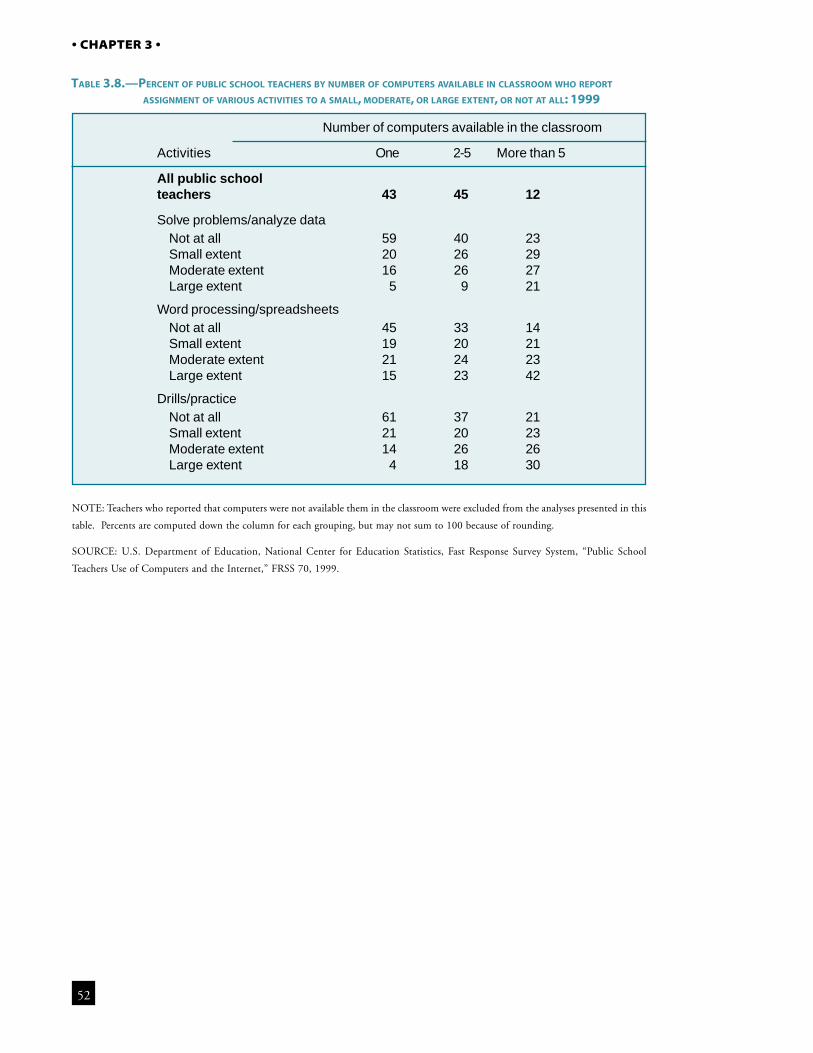
52
• CHAPTER 3 •
TABLE 3.8.—PERCENT OF PUBLIC SCHOOL TEACHERS BY NUMBER OF COMPUTERS AVAILABLE IN CLASSROOM WHO REPORT
ASSIGNMENT OF VARIOUS ACTIVITIES TO A SMALL, MODERATE, OR LARGE EXTENT, OR NOT AT ALL: 1999
NOTE: Teachers who reported that computers were not available them in the classroom were excluded from the analyses presented in this
table. Percents are computed down the column for each grouping, but may not sum to 100 because of rounding.
SOURCE: U.S. Department of Education, National Center for Education Statistics, Fast Response Survey System, “Public School
Teachers Use of Computers and the Internet,” FRSS 70, 1999.
Number of computers available in the classroom
Activities One 2-5 More than 5
All public schoolteachers 43 45 12
Solve problems/analyze dataNot at all 59 40 23Small extent 20 26 29Moderate extent 16 26 27Large extent 5 9 21
Word processing/spreadsheetsNot at all 45 33 14Small extent 19 20 21Moderate extent 21 24 23Large extent 15 23 42
Drills/practiceNot at all 61 37 21Small extent 21 20 23Moderate extent 14 26 26Large extent 4 18 30
53
Chapter 4
Frequency of Technology Use
Highlights
• In 1999, nearly all teachers used the computers and the Internet when available in theirschools, and most reported that their students used computers and the Internet in theschool as well. Teachers were generally more likely to use computers and the Internet whenlocated in their classrooms than elsewhere in the school, while their students were morelikely to use computers and the Internet outside the classroom than inside.
• Elementary teachers were more likely to report that their students used computers at school,and secondary teachers were more likely to report that their students used the Internet atschool.
• Teachers with more computers or more computers connected to the Internet in their class-rooms generally used these technologies more often than teachers with fewer computers orInternet connections (as did their students). Additionally, teachers with computer or Internetconnections in their classrooms used these technologies elsewhere in the school more oftenthan teachers without such equipment in their classrooms (as did their students).
• Teachers in schools with lower minority enrollments were generally more likely to reportusing e-mail than teachers in schools with the highest minority enrollments, and teachersin schools with lower minority enrollments and lower poverty concentrations were gener-ally more likely than teachers in schools with the highest minority enrollments and thehighest poverty concentrations to report that their students used the Internet.
• Teachers with fewer years of teaching experience were generally more likely than teacherswith more experience to report using computers, the Internet, and e-mail at school to alarge extent.
• In 1999, nearly all teachers with computers or the Internet available at home used thesetechnologies. Teachers with fewer years of teaching experience generally used these tech-nologies at home more frequently than their most experienced colleagues. Teachers whoused computers for instruction and who assigned projects that required their students touse a computer were more likely than teachers who did not use these technologies for suchpurposes to use computers and the Internet at home to a large extent.
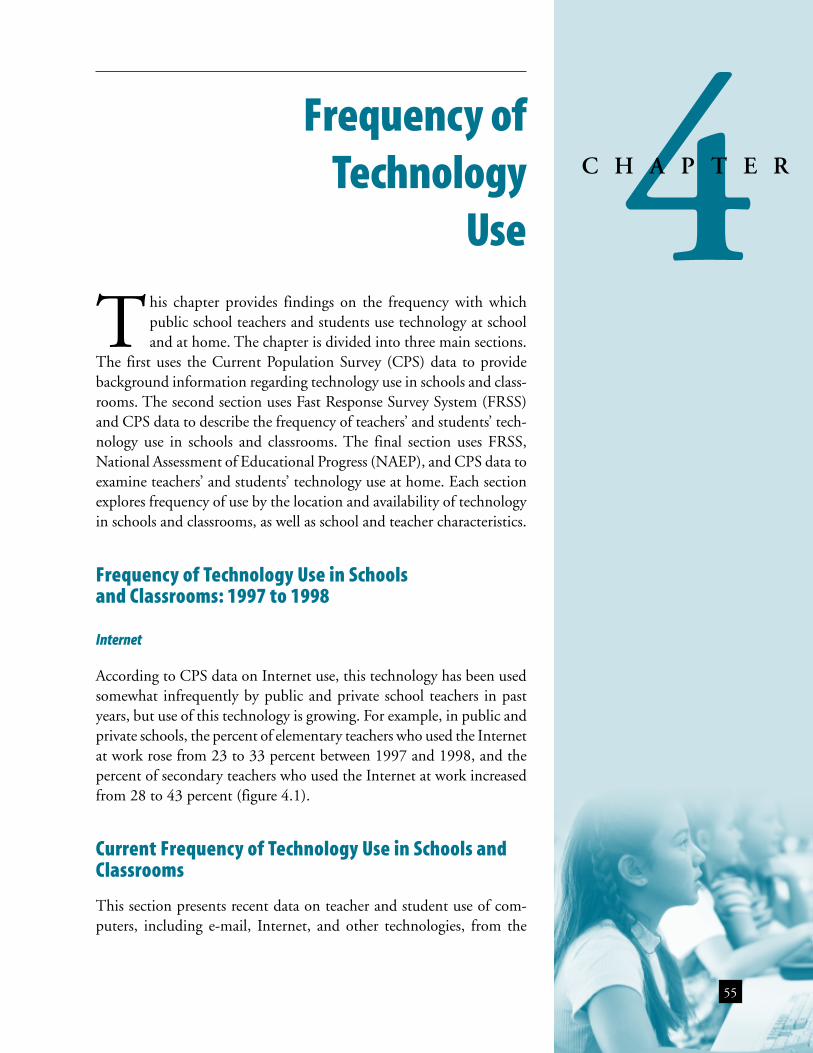
4C H A P T E R
55
Frequency of Technology
Use
This chapter provides findings on the frequency with whichpublic school teachers and students use technology at schooland at home. The chapter is divided into three main sections.
The first uses the Current Population Survey (CPS) data to providebackground information regarding technology use in schools and class-rooms. The second section uses Fast Response Survey System (FRSS)and CPS data to describe the frequency of teachers’ and students’ tech-nology use in schools and classrooms. The final section uses FRSS,National Assessment of Educational Progress (NAEP), and CPS data toexamine teachers’ and students’ technology use at home. Each sectionexplores frequency of use by the location and availability of technologyin schools and classrooms, as well as school and teacher characteristics.
Frequency of Technology Use in Schoolsand Classrooms: 1997 to 1998
Internet
According to CPS data on Internet use, this technology has been usedsomewhat infrequently by public and private school teachers in pastyears, but use of this technology is growing. For example, in public andprivate schools, the percent of elementary teachers who used the Internetat work rose from 23 to 33 percent between 1997 and 1998, and thepercent of secondary teachers who used the Internet at work increasedfrom 28 to 43 percent (figure 4.1).
Current Frequency of Technology Use in Schools andClassrooms
This section presents recent data on teacher and student use of com-puters, including e-mail, Internet, and other technologies, from the
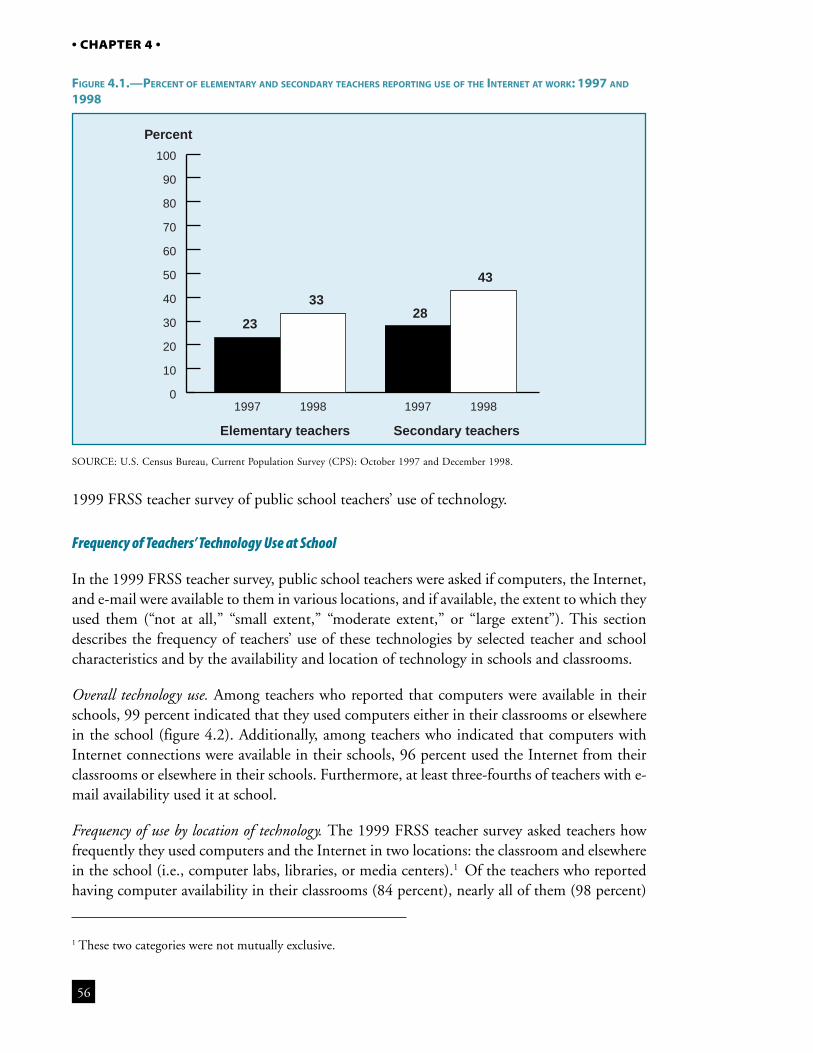
56
• CHAPTER 4 •
1 These two categories were not mutually exclusive.
Percent
Elementary teachers Secondary teachers
23
3328
43
0
10
20
30
40
50
60
70
80
90
100
1998199719981997
FIGURE 4.1.—PERCENT OF ELEMENTARY AND SECONDARY TEACHERS REPORTING USE OF THE INTERNET AT WORK: 1997 AND
1998
SOURCE: U.S. Census Bureau, Current Population Survey (CPS): October 1997 and December 1998.
1999 FRSS teacher survey of public school teachers’ use of technology.
Frequency of Teachers’ Technology Use at School
In the 1999 FRSS teacher survey, public school teachers were asked if computers, the Internet,and e-mail were available to them in various locations, and if available, the extent to which theyused them (“not at all,” “small extent,” “moderate extent,” or “large extent”). This sectiondescribes the frequency of teachers’ use of these technologies by selected teacher and schoolcharacteristics and by the availability and location of technology in schools and classrooms.
Overall technology use. Among teachers who reported that computers were available in theirschools, 99 percent indicated that they used computers either in their classrooms or elsewherein the school (figure 4.2). Additionally, among teachers who indicated that computers withInternet connections were available in their schools, 96 percent used the Internet from theirclassrooms or elsewhere in their schools. Furthermore, at least three-fourths of teachers with e-mail availability used it at school.
Frequency of use by location of technology. The 1999 FRSS teacher survey asked teachers howfrequently they used computers and the Internet in two locations: the classroom and elsewherein the school (i.e., computer labs, libraries, or media centers).1 Of the teachers who reportedhaving computer availability in their classrooms (84 percent), nearly all of them (98 percent)
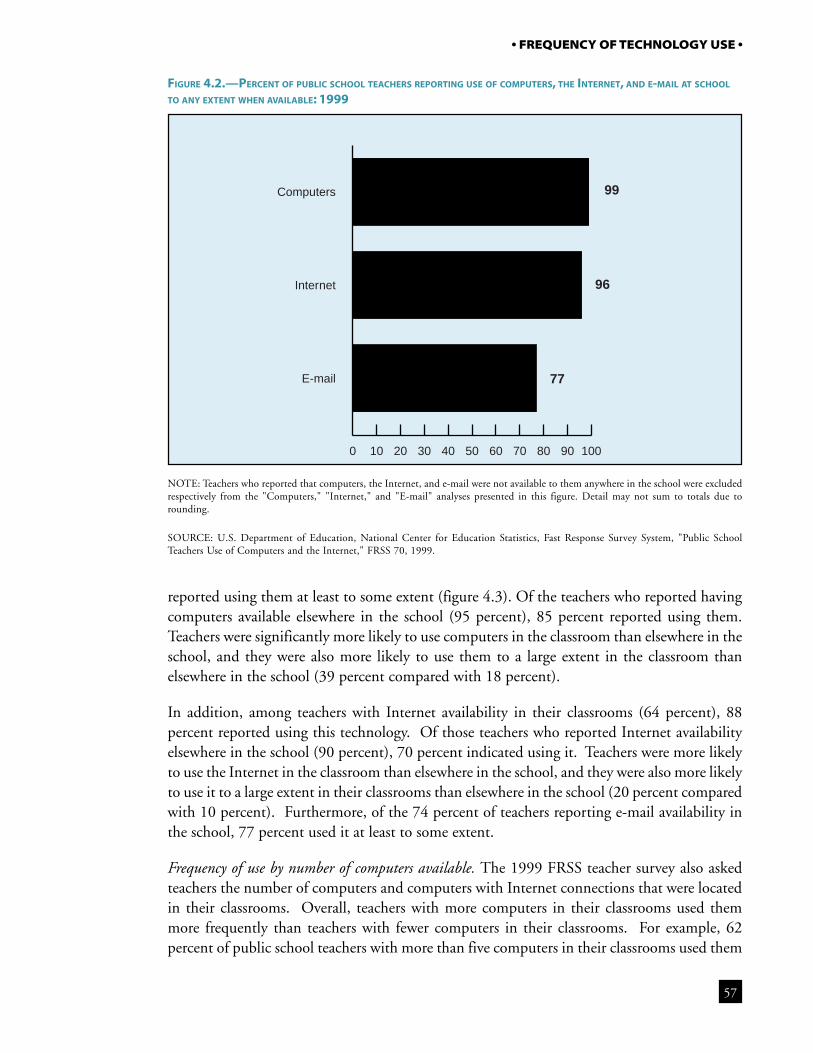
57
• FREQUENCY OF TECHNOLOGY USE •
NOTE: Teachers who reported that computers, the Internet, and e-mail were not available to them anywhere in the school were excludedrespectively from the "Computers," "Internet," and "E-mail" analyses presented in this figure. Detail may not sum to totals due torounding.
SOURCE: U.S. Department of Education, National Center for Education Statistics, Fast Response Survey System, "Public SchoolTeachers Use of Computers and the Internet," FRSS 70, 1999.
FIGURE 4.2.—PERCENT OF PUBLIC SCHOOL TEACHERS REPORTING USE OF COMPUTERS, THE INTERNET, AND E-MAIL AT SCHOOL
TO ANY EXTENT WHEN AVAILABLE: 1999
99
96
77
0 10 20 30 40 50 60 70 80 90 100
Internet
Computers
reported using them at least to some extent (figure 4.3). Of the teachers who reported havingcomputers available elsewhere in the school (95 percent), 85 percent reported using them.Teachers were significantly more likely to use computers in the classroom than elsewhere in theschool, and they were also more likely to use them to a large extent in the classroom thanelsewhere in the school (39 percent compared with 18 percent).
In addition, among teachers with Internet availability in their classrooms (64 percent), 88percent reported using this technology. Of those teachers who reported Internet availabilityelsewhere in the school (90 percent), 70 percent indicated using it. Teachers were more likelyto use the Internet in the classroom than elsewhere in the school, and they were also more likelyto use it to a large extent in their classrooms than elsewhere in the school (20 percent comparedwith 10 percent). Furthermore, of the 74 percent of teachers reporting e-mail availability inthe school, 77 percent used it at least to some extent.
Frequency of use by number of computers available. The 1999 FRSS teacher survey also askedteachers the number of computers and computers with Internet connections that were locatedin their classrooms. Overall, teachers with more computers in their classrooms used themmore frequently than teachers with fewer computers in their classrooms. For example, 62percent of public school teachers with more than five computers in their classrooms used them
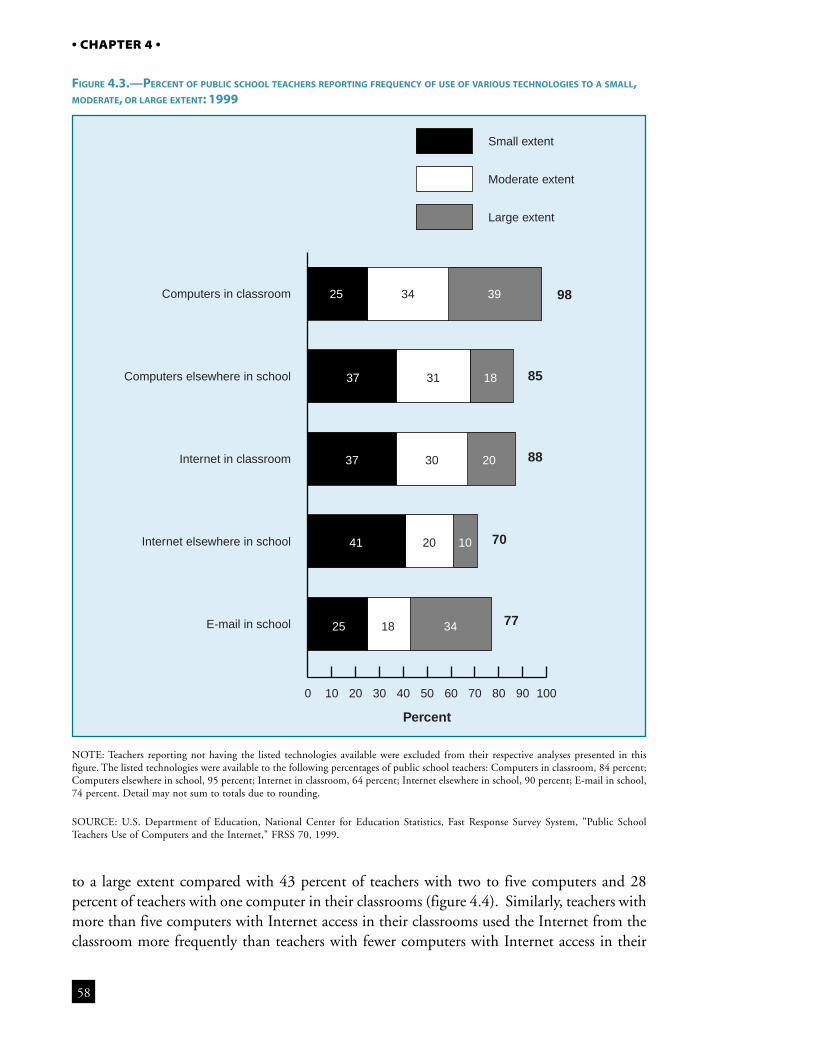
58
• CHAPTER 4 •
Percent
98
85
88
70
77
0 10 20 30 40 50 60 70 80 90 100
Small extent
Moderate extent
Large extent
E-mail in school
Internet elsewhere in school
Internet in classroom
Computers elsewhere in school
Computers in classroom 25 34
31
30
20
1825 34
41 10
37 20
37 18
39
to a large extent compared with 43 percent of teachers with two to five computers and 28percent of teachers with one computer in their classrooms (figure 4.4). Similarly, teachers withmore than five computers with Internet access in their classrooms used the Internet from theclassroom more frequently than teachers with fewer computers with Internet access in their
NOTE: Teachers reporting not having the listed technologies available were excluded from their respective analyses presented in thisfigure. The listed technologies were available to the following percentages of public school teachers: Computers in classroom, 84 percent;Computers elsewhere in school, 95 percent; Internet in classroom, 64 percent; Internet elsewhere in school, 90 percent; E-mail in school,74 percent. Detail may not sum to totals due to rounding.
SOURCE: U.S. Department of Education, National Center for Education Statistics, Fast Response Survey System, "Public SchoolTeachers Use of Computers and the Internet," FRSS 70, 1999.
FIGURE 4.3.—PERCENT OF PUBLIC SCHOOL TEACHERS REPORTING FREQUENCY OF USE OF VARIOUS TECHNOLOGIES TO A SMALL,MODERATE, OR LARGE EXTENT: 1999
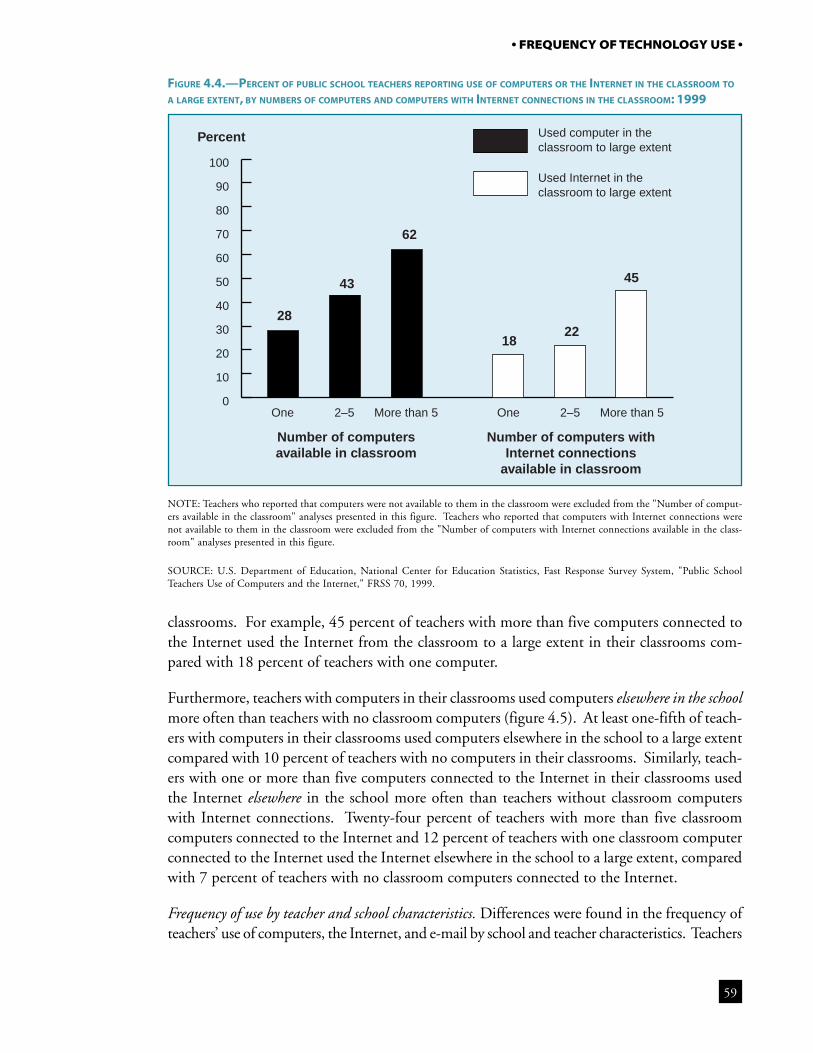
59
• FREQUENCY OF TECHNOLOGY USE •
classrooms. For example, 45 percent of teachers with more than five computers connected tothe Internet used the Internet from the classroom to a large extent in their classrooms com-pared with 18 percent of teachers with one computer.
Furthermore, teachers with computers in their classrooms used computers elsewhere in the schoolmore often than teachers with no classroom computers (figure 4.5). At least one-fifth of teach-ers with computers in their classrooms used computers elsewhere in the school to a large extentcompared with 10 percent of teachers with no computers in their classrooms. Similarly, teach-ers with one or more than five computers connected to the Internet in their classrooms usedthe Internet elsewhere in the school more often than teachers without classroom computerswith Internet connections. Twenty-four percent of teachers with more than five classroomcomputers connected to the Internet and 12 percent of teachers with one classroom computerconnected to the Internet used the Internet elsewhere in the school to a large extent, comparedwith 7 percent of teachers with no classroom computers connected to the Internet.
Frequency of use by teacher and school characteristics. Differences were found in the frequency ofteachers’ use of computers, the Internet, and e-mail by school and teacher characteristics. Teachers
FIGURE 4.4.—PERCENT OF PUBLIC SCHOOL TEACHERS REPORTING USE OF COMPUTERS OR THE INTERNET IN THE CLASSROOM TO
A LARGE EXTENT, BY NUMBERS OF COMPUTERS AND COMPUTERS WITH INTERNET CONNECTIONS IN THE CLASSROOM: 1999
NOTE: Teachers who reported that computers were not available to them in the classroom were excluded from the "Number of comput-ers available in the classroom" analyses presented in this figure. Teachers who reported that computers with Internet connections werenot available to them in the classroom were excluded from the "Number of computers with Internet connections available in the class-room" analyses presented in this figure.
SOURCE: U.S. Department of Education, National Center for Education Statistics, Fast Response Survey System, "Public SchoolTeachers Use of Computers and the Internet," FRSS 70, 1999.
Percent
Number of computersavailable in classroom
Number of computers withInternet connections
available in classroom
28
43
62
1822
45
0
10
20
30
40
50
60
70
80
90
100
Used computer in the classroom to large extent
Used Internet in the classroom to large extent
More than 52–5OneMore than 52–5One
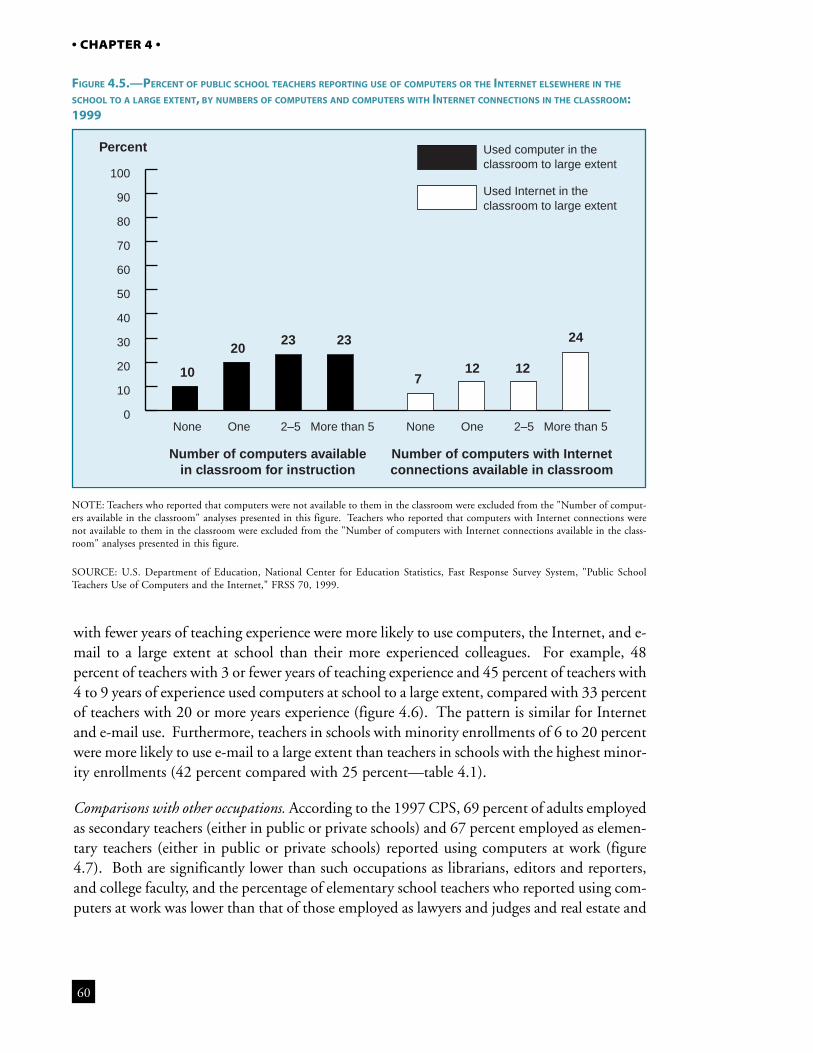
60
• CHAPTER 4 •
with fewer years of teaching experience were more likely to use computers, the Internet, and e-mail to a large extent at school than their more experienced colleagues. For example, 48percent of teachers with 3 or fewer years of teaching experience and 45 percent of teachers with4 to 9 years of experience used computers at school to a large extent, compared with 33 percentof teachers with 20 or more years experience (figure 4.6). The pattern is similar for Internetand e-mail use. Furthermore, teachers in schools with minority enrollments of 6 to 20 percentwere more likely to use e-mail to a large extent than teachers in schools with the highest minor-ity enrollments (42 percent compared with 25 percent—table 4.1).
Comparisons with other occupations. According to the 1997 CPS, 69 percent of adults employedas secondary teachers (either in public or private schools) and 67 percent employed as elemen-tary teachers (either in public or private schools) reported using computers at work (figure4.7). Both are significantly lower than such occupations as librarians, editors and reporters,and college faculty, and the percentage of elementary school teachers who reported using com-puters at work was lower than that of those employed as lawyers and judges and real estate and
FIGURE 4.5.—PERCENT OF PUBLIC SCHOOL TEACHERS REPORTING USE OF COMPUTERS OR THE INTERNET ELSEWHERE IN THE
SCHOOL TO A LARGE EXTENT, BY NUMBERS OF COMPUTERS AND COMPUTERS WITH INTERNET CONNECTIONS IN THE CLASSROOM:1999
NOTE: Teachers who reported that computers were not available to them in the classroom were excluded from the "Number of comput-ers available in the classroom" analyses presented in this figure. Teachers who reported that computers with Internet connections werenot available to them in the classroom were excluded from the "Number of computers with Internet connections available in the class-room" analyses presented in this figure.
SOURCE: U.S. Department of Education, National Center for Education Statistics, Fast Response Survey System, "Public SchoolTeachers Use of Computers and the Internet," FRSS 70, 1999.
Percent
Number of computers availablein classroom for instruction
Number of computers with Internetconnections available in classroom
10
2023 23
712 12
24
0
10
20
30
40
50
60
70
80
90
100
Used computer in the classroom to large extent
Used Internet in the classroom to large extent
More than 52–5OneNoneMore than 52–5OneNone
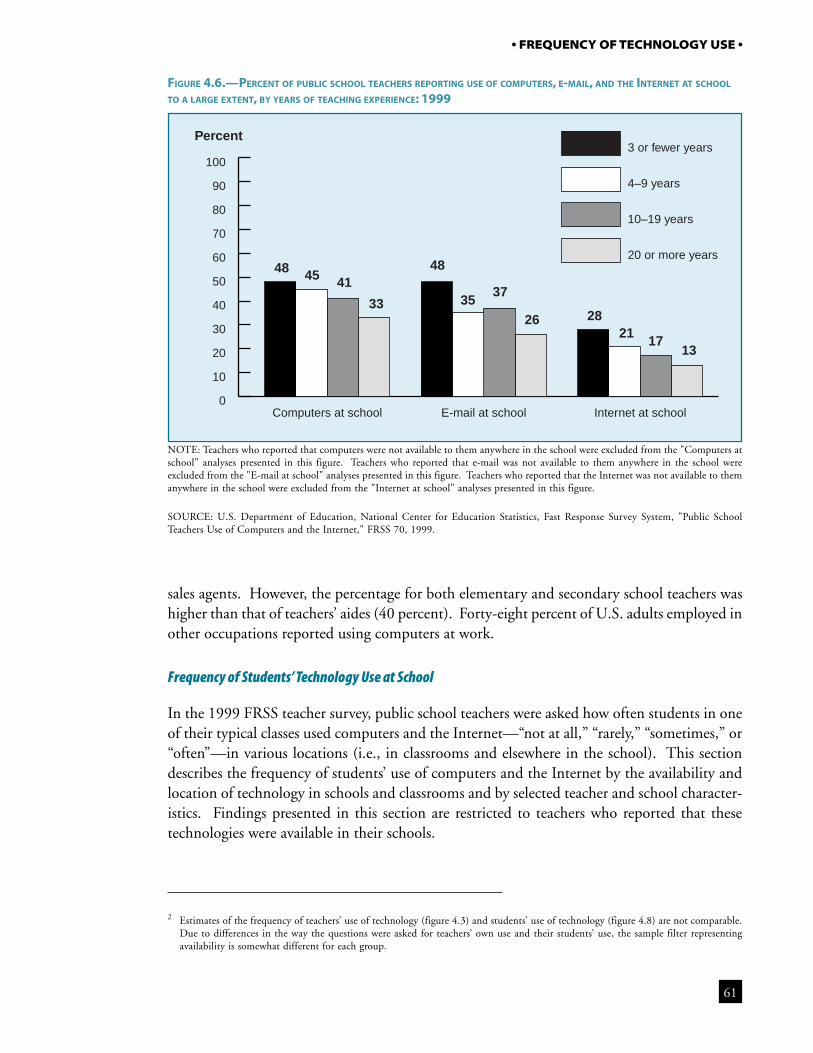
61
• FREQUENCY OF TECHNOLOGY USE •
FIGURE 4.6.—PERCENT OF PUBLIC SCHOOL TEACHERS REPORTING USE OF COMPUTERS, E-MAIL, AND THE INTERNET AT SCHOOL
TO A LARGE EXTENT, BY YEARS OF TEACHING EXPERIENCE: 1999
NOTE: Teachers who reported that computers were not available to them anywhere in the school were excluded from the "Computers atschool" analyses presented in this figure. Teachers who reported that e-mail was not available to them anywhere in the school wereexcluded from the "E-mail at school" analyses presented in this figure. Teachers who reported that the Internet was not available to themanywhere in the school were excluded from the "Internet at school" analyses presented in this figure.
SOURCE: U.S. Department of Education, National Center for Education Statistics, Fast Response Survey System, "Public SchoolTeachers Use of Computers and the Internet," FRSS 70, 1999.
Percent
48 45 41
33
48
3537
26 2821
1713
0
10
20
30
40
50
60
70
80
90
1003 or fewer years
4–9 years
10–19 years
20 or more years
Internet at schoolE-mail at schoolComputers at school
sales agents. However, the percentage for both elementary and secondary school teachers washigher than that of teachers’ aides (40 percent). Forty-eight percent of U.S. adults employed inother occupations reported using computers at work.
Frequency of Students’ Technology Use at School
In the 1999 FRSS teacher survey, public school teachers were asked how often students in oneof their typical classes used computers and the Internet—“not at all,” “rarely,” “sometimes,” or“often”—in various locations (i.e., in classrooms and elsewhere in the school). This sectiondescribes the frequency of students’ use of computers and the Internet by the availability andlocation of technology in schools and classrooms and by selected teacher and school character-istics. Findings presented in this section are restricted to teachers who reported that thesetechnologies were available in their schools.
2 Estimates of the frequency of teachers’ use of technology (figure 4.3) and students’ use of technology (figure 4.8) are not comparable.Due to differences in the way the questions were asked for teachers’ own use and their students’ use, the sample filter representingavailability is somewhat different for each group.
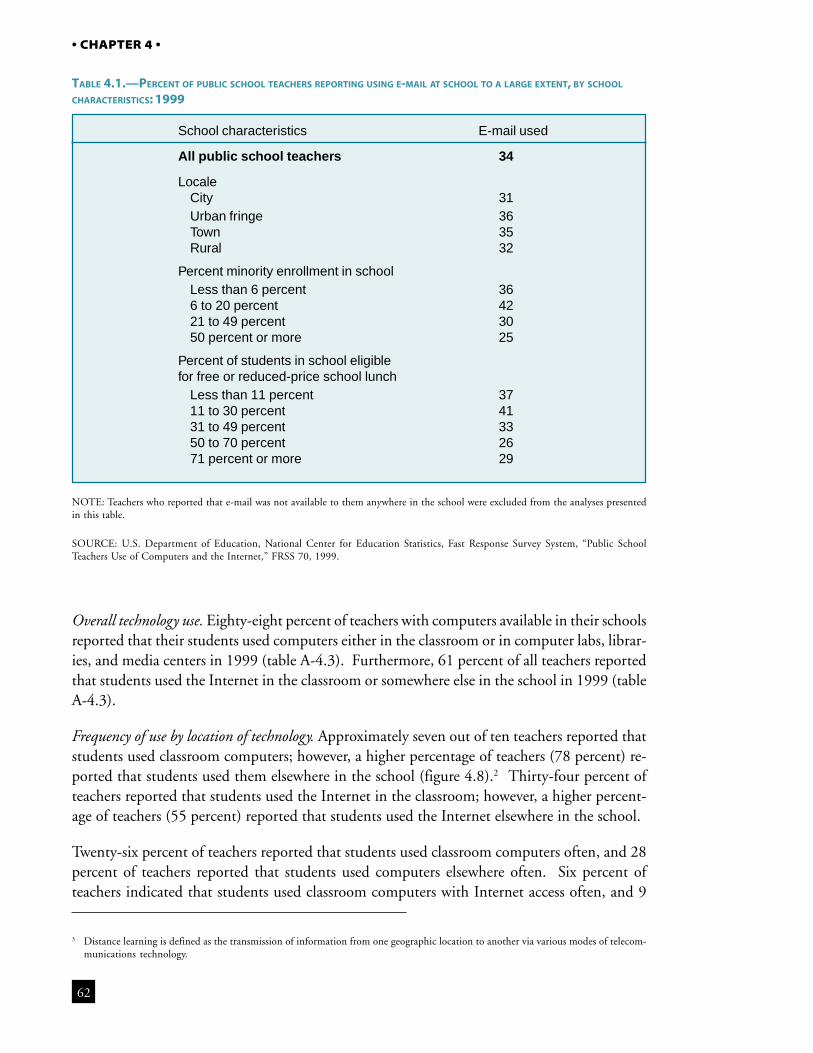
62
• CHAPTER 4 •
3 Distance learning is defined as the transmission of information from one geographic location to another via various modes of telecom-munications technology.
TABLE 4.1.—PERCENT OF PUBLIC SCHOOL TEACHERS REPORTING USING E-MAIL AT SCHOOL TO A LARGE EXTENT, BY SCHOOL
CHARACTERISTICS: 1999
NOTE: Teachers who reported that e-mail was not available to them anywhere in the school were excluded from the analyses presentedin this table.
SOURCE: U.S. Department of Education, National Center for Education Statistics, Fast Response Survey System, “Public SchoolTeachers Use of Computers and the Internet,” FRSS 70, 1999.
Overall technology use. Eighty-eight percent of teachers with computers available in their schoolsreported that their students used computers either in the classroom or in computer labs, librar-ies, and media centers in 1999 (table A-4.3). Furthermore, 61 percent of all teachers reportedthat students used the Internet in the classroom or somewhere else in the school in 1999 (tableA-4.3).
Frequency of use by location of technology. Approximately seven out of ten teachers reported thatstudents used classroom computers; however, a higher percentage of teachers (78 percent) re-ported that students used them elsewhere in the school (figure 4.8).2 Thirty-four percent ofteachers reported that students used the Internet in the classroom; however, a higher percent-age of teachers (55 percent) reported that students used the Internet elsewhere in the school.
Twenty-six percent of teachers reported that students used classroom computers often, and 28percent of teachers reported that students used computers elsewhere often. Six percent ofteachers indicated that students used classroom computers with Internet access often, and 9
School characteristics E-mail used
All public school teachers 34
LocaleCity 31Urban fringe 36Town 35Rural 32
Percent minority enrollment in schoolLess than 6 percent 366 to 20 percent 4221 to 49 percent 3050 percent or more 25
Percent of students in school eligiblefor free or reduced-price school lunch
Less than 11 percent 3711 to 30 percent 4131 to 49 percent 3350 to 70 percent 2671 percent or more 29
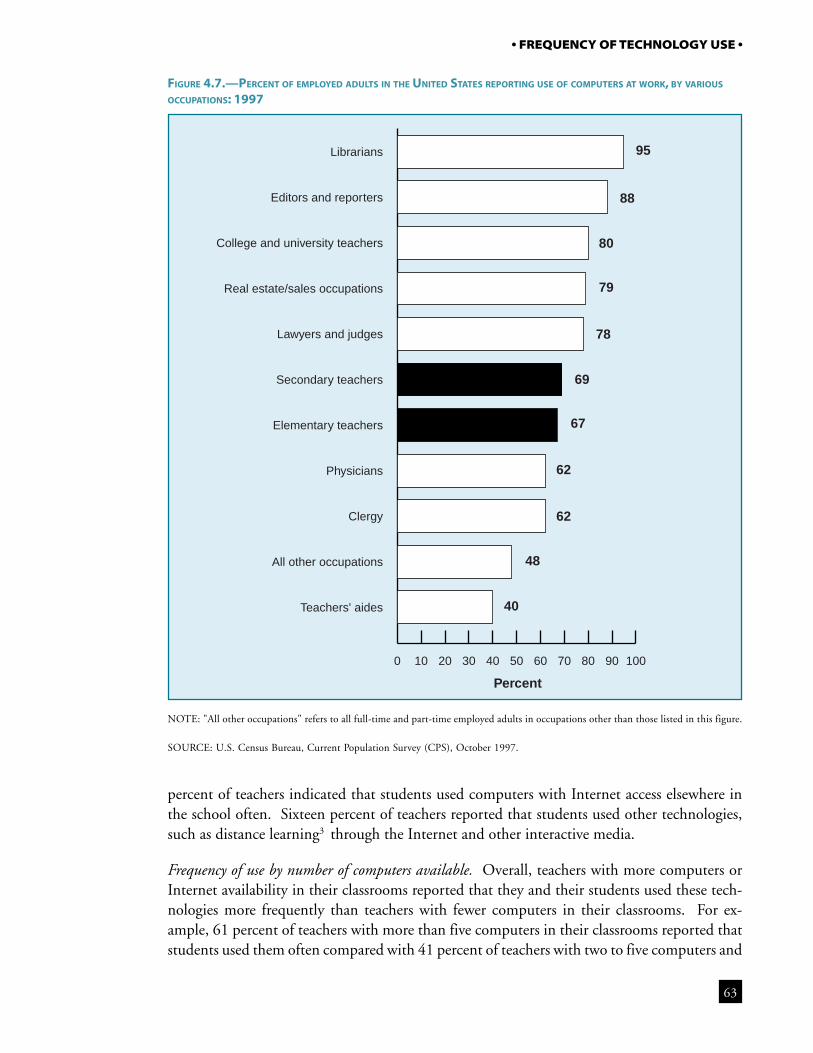
63
• FREQUENCY OF TECHNOLOGY USE •
NOTE: "All other occupations" refers to all full-time and part-time employed adults in occupations other than those listed in this figure.
SOURCE: U.S. Census Bureau, Current Population Survey (CPS), October 1997.
FIGURE 4.7.—PERCENT OF EMPLOYED ADULTS IN THE UNITED STATES REPORTING USE OF COMPUTERS AT WORK, BY VARIOUS
OCCUPATIONS: 1997
Percent
95
88
80
79
78
69
67
62
62
48
40
0 10 20 30 40 50 60 70 80 90 100
Teachers' aides
All other occupations
Clergy
Physicians
Elementary teachers
Secondary teachers
Lawyers and judges
Real estate/sales occupations
College and university teachers
Editors and reporters
Librarians
percent of teachers indicated that students used computers with Internet access elsewhere inthe school often. Sixteen percent of teachers reported that students used other technologies,such as distance learning3 through the Internet and other interactive media.
Frequency of use by number of computers available. Overall, teachers with more computers orInternet availability in their classrooms reported that they and their students used these tech-nologies more frequently than teachers with fewer computers in their classrooms. For ex-ample, 61 percent of teachers with more than five computers in their classrooms reported thatstudents used them often compared with 41 percent of teachers with two to five computers and
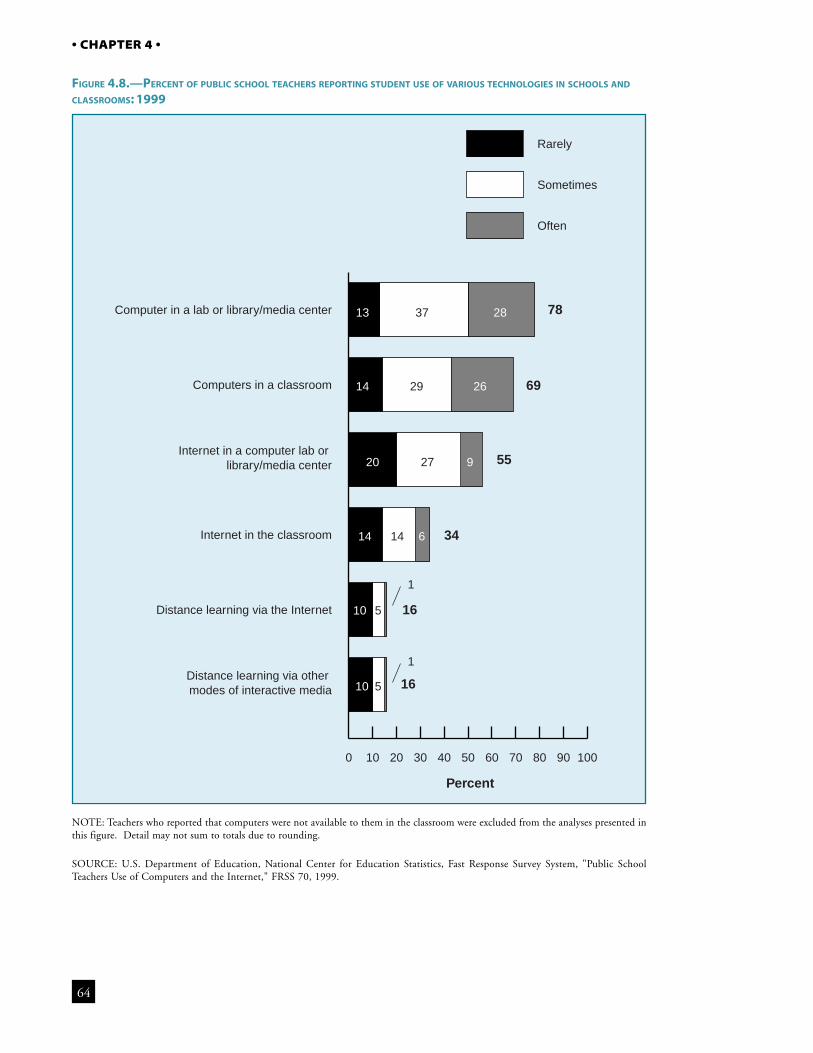
64
• CHAPTER 4 •
NOTE: Teachers who reported that computers were not available to them in the classroom were excluded from the analyses presented inthis figure. Detail may not sum to totals due to rounding.
SOURCE: U.S. Department of Education, National Center for Education Statistics, Fast Response Survey System, "Public SchoolTeachers Use of Computers and the Internet," FRSS 70, 1999.
FIGURE 4.8.—PERCENT OF PUBLIC SCHOOL TEACHERS REPORTING STUDENT USE OF VARIOUS TECHNOLOGIES IN SCHOOLS AND
CLASSROOMS: 1999
Percent
78
69
55
34
16
16
0 10 20 30 40 50 60 70 80 90 100
Rarely
Sometimes
Often
Distance learning via other modes of interactive media
Distance learning via the Internet
Internet in the classroom
Internet in a computer lab or library/media center
Computers in a classroom
Computer in a lab or library/media center 13
14 2629
27
14
10 5
510
1
14 6
20 9
2837
1
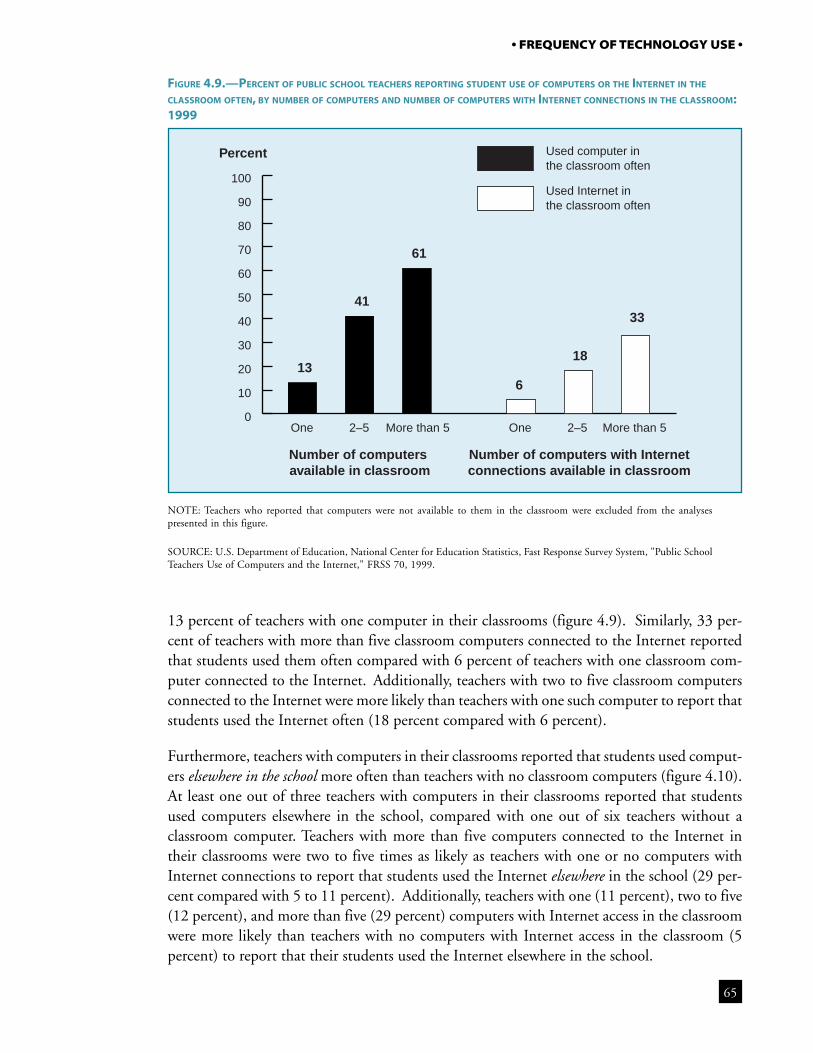
65
• FREQUENCY OF TECHNOLOGY USE •
FIGURE 4.9.—PERCENT OF PUBLIC SCHOOL TEACHERS REPORTING STUDENT USE OF COMPUTERS OR THE INTERNET IN THE
CLASSROOM OFTEN, BY NUMBER OF COMPUTERS AND NUMBER OF COMPUTERS WITH INTERNET CONNECTIONS IN THE CLASSROOM:1999
NOTE: Teachers who reported that computers were not available to them in the classroom were excluded from the analysespresented in this figure.
SOURCE: U.S. Department of Education, National Center for Education Statistics, Fast Response Survey System, "Public SchoolTeachers Use of Computers and the Internet," FRSS 70, 1999.
Percent
Number of computers available in classroom
Number of computers with Internetconnections available in classroom
13
41
61
6
18
33
0
10
20
30
40
50
60
70
80
90
100
Used computer in the classroom often
Used Internet in the classroom often
More than 52–5OneMore than 52–5One
13 percent of teachers with one computer in their classrooms (figure 4.9). Similarly, 33 per-cent of teachers with more than five classroom computers connected to the Internet reportedthat students used them often compared with 6 percent of teachers with one classroom com-puter connected to the Internet. Additionally, teachers with two to five classroom computersconnected to the Internet were more likely than teachers with one such computer to report thatstudents used the Internet often (18 percent compared with 6 percent).
Furthermore, teachers with computers in their classrooms reported that students used comput-ers elsewhere in the school more often than teachers with no classroom computers (figure 4.10).At least one out of three teachers with computers in their classrooms reported that studentsused computers elsewhere in the school, compared with one out of six teachers without aclassroom computer. Teachers with more than five computers connected to the Internet intheir classrooms were two to five times as likely as teachers with one or no computers withInternet connections to report that students used the Internet elsewhere in the school (29 per-cent compared with 5 to 11 percent). Additionally, teachers with one (11 percent), two to five(12 percent), and more than five (29 percent) computers with Internet access in the classroomwere more likely than teachers with no computers with Internet access in the classroom (5percent) to report that their students used the Internet elsewhere in the school.
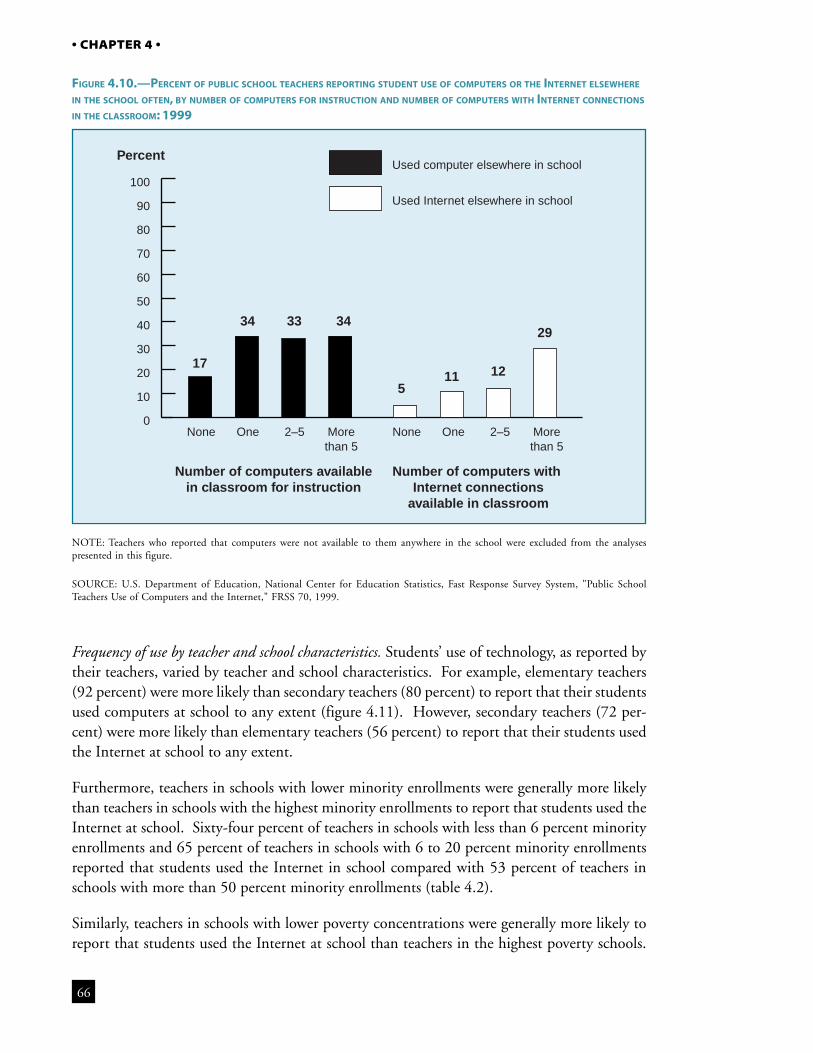
66
• CHAPTER 4 •
FIGURE 4.10.—PERCENT OF PUBLIC SCHOOL TEACHERS REPORTING STUDENT USE OF COMPUTERS OR THE INTERNET ELSEWHERE
IN THE SCHOOL OFTEN, BY NUMBER OF COMPUTERS FOR INSTRUCTION AND NUMBER OF COMPUTERS WITH INTERNET CONNECTIONS
IN THE CLASSROOM: 1999
Percent
Number of computers availablein classroom for instruction
Number of computers with Internet connections
available in classroom
17
34 33 34
511 12
29
0
10
20
30
40
50
60
70
80
90
100
Used computer elsewhere in school
Used Internet elsewhere in school
Morethan 5
2–5OneNoneMorethan 5
2–5OneNone
NOTE: Teachers who reported that computers were not available to them anywhere in the school were excluded from the analysespresented in this figure.
SOURCE: U.S. Department of Education, National Center for Education Statistics, Fast Response Survey System, "Public SchoolTeachers Use of Computers and the Internet," FRSS 70, 1999.
Frequency of use by teacher and school characteristics. Students’ use of technology, as reported bytheir teachers, varied by teacher and school characteristics. For example, elementary teachers(92 percent) were more likely than secondary teachers (80 percent) to report that their studentsused computers at school to any extent (figure 4.11). However, secondary teachers (72 per-cent) were more likely than elementary teachers (56 percent) to report that their students usedthe Internet at school to any extent.
Furthermore, teachers in schools with lower minority enrollments were generally more likelythan teachers in schools with the highest minority enrollments to report that students used theInternet at school. Sixty-four percent of teachers in schools with less than 6 percent minorityenrollments and 65 percent of teachers in schools with 6 to 20 percent minority enrollmentsreported that students used the Internet in school compared with 53 percent of teachers inschools with more than 50 percent minority enrollments (table 4.2).
Similarly, teachers in schools with lower poverty concentrations were generally more likely toreport that students used the Internet at school than teachers in the highest poverty schools.
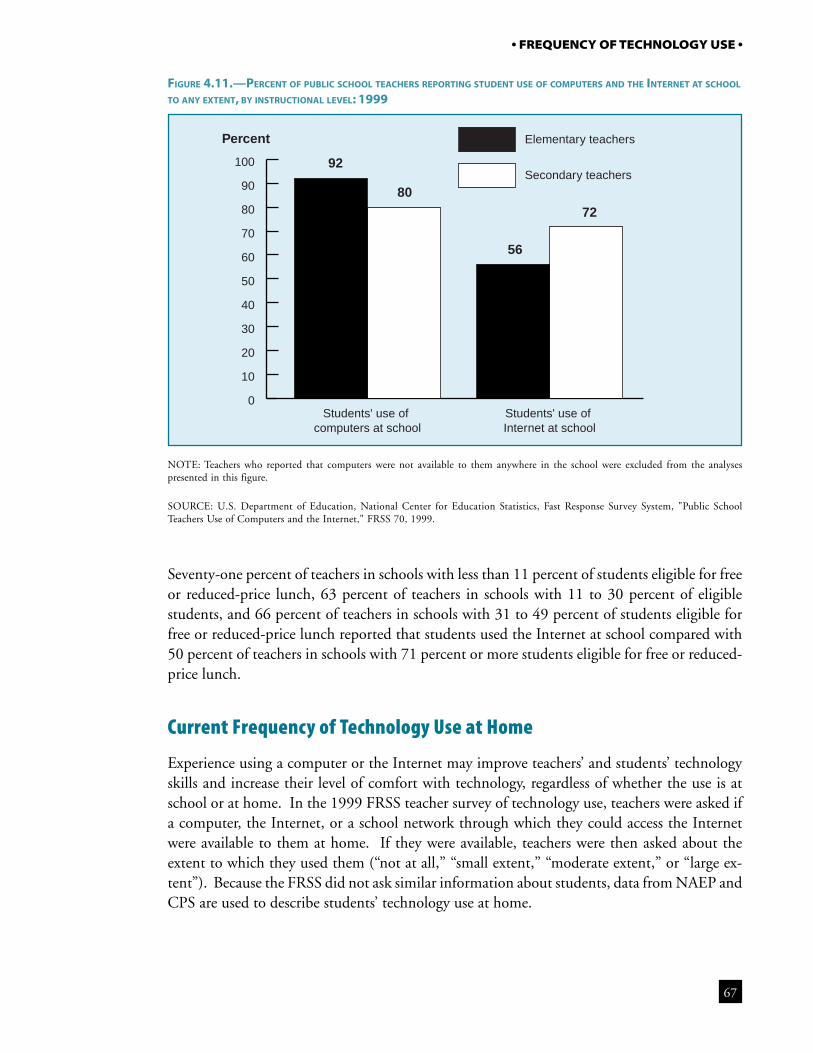
67
• FREQUENCY OF TECHNOLOGY USE •
FIGURE 4.11.—PERCENT OF PUBLIC SCHOOL TEACHERS REPORTING STUDENT USE OF COMPUTERS AND THE INTERNET AT SCHOOL
TO ANY EXTENT, BY INSTRUCTIONAL LEVEL: 1999
NOTE: Teachers who reported that computers were not available to them anywhere in the school were excluded from the analysespresented in this figure.
SOURCE: U.S. Department of Education, National Center for Education Statistics, Fast Response Survey System, "Public SchoolTeachers Use of Computers and the Internet," FRSS 70, 1999.
Percent
92
80
56
72
0
10
20
30
40
50
60
70
80
90
100
Elementary teachers
Secondary teachers
Students' use of Internet at school
Students' use of computers at school
Seventy-one percent of teachers in schools with less than 11 percent of students eligible for freeor reduced-price lunch, 63 percent of teachers in schools with 11 to 30 percent of eligiblestudents, and 66 percent of teachers in schools with 31 to 49 percent of students eligible forfree or reduced-price lunch reported that students used the Internet at school compared with50 percent of teachers in schools with 71 percent or more students eligible for free or reduced-price lunch.
Current Frequency of Technology Use at Home
Experience using a computer or the Internet may improve teachers’ and students’ technologyskills and increase their level of comfort with technology, regardless of whether the use is atschool or at home. In the 1999 FRSS teacher survey of technology use, teachers were asked ifa computer, the Internet, or a school network through which they could access the Internetwere available to them at home. If they were available, teachers were then asked about theextent to which they used them (“not at all,” “small extent,” “moderate extent,” or “large ex-tent”). Because the FRSS did not ask similar information about students, data from NAEP andCPS are used to describe students’ technology use at home.
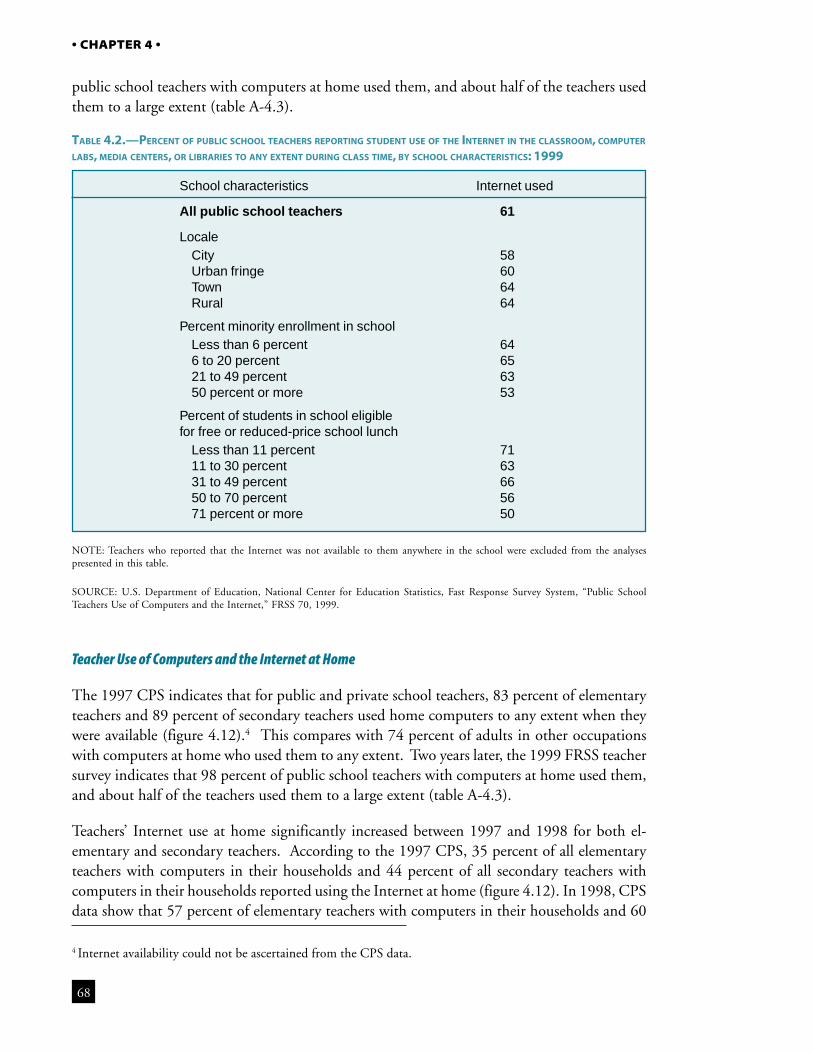
68
• CHAPTER 4 •
public school teachers with computers at home used them, and about half of the teachers usedthem to a large extent (table A-4.3).
4 Internet availability could not be ascertained from the CPS data.
TABLE 4.2.—PERCENT OF PUBLIC SCHOOL TEACHERS REPORTING STUDENT USE OF THE INTERNET IN THE CLASSROOM, COMPUTER
LABS, MEDIA CENTERS, OR LIBRARIES TO ANY EXTENT DURING CLASS TIME, BY SCHOOL CHARACTERISTICS: 1999
NOTE: Teachers who reported that the Internet was not available to them anywhere in the school were excluded from the analysespresented in this table.
SOURCE: U.S. Department of Education, National Center for Education Statistics, Fast Response Survey System, “Public SchoolTeachers Use of Computers and the Internet,” FRSS 70, 1999.
Teacher Use of Computers and the Internet at Home
The 1997 CPS indicates that for public and private school teachers, 83 percent of elementaryteachers and 89 percent of secondary teachers used home computers to any extent when theywere available (figure 4.12).4 This compares with 74 percent of adults in other occupationswith computers at home who used them to any extent. Two years later, the 1999 FRSS teachersurvey indicates that 98 percent of public school teachers with computers at home used them,and about half of the teachers used them to a large extent (table A-4.3).
Teachers’ Internet use at home significantly increased between 1997 and 1998 for both el-ementary and secondary teachers. According to the 1997 CPS, 35 percent of all elementaryteachers with computers in their households and 44 percent of all secondary teachers withcomputers in their households reported using the Internet at home (figure 4.12). In 1998, CPSdata show that 57 percent of elementary teachers with computers in their households and 60
School characteristics Internet used
All public school teachers 61
LocaleCity 58Urban fringe 60Town 64Rural 64
Percent minority enrollment in schoolLess than 6 percent 646 to 20 percent 6521 to 49 percent 6350 percent or more 53
Percent of students in school eligiblefor free or reduced-price school lunch
Less than 11 percent 7111 to 30 percent 6331 to 49 percent 6650 to 70 percent 5671 percent or more 50
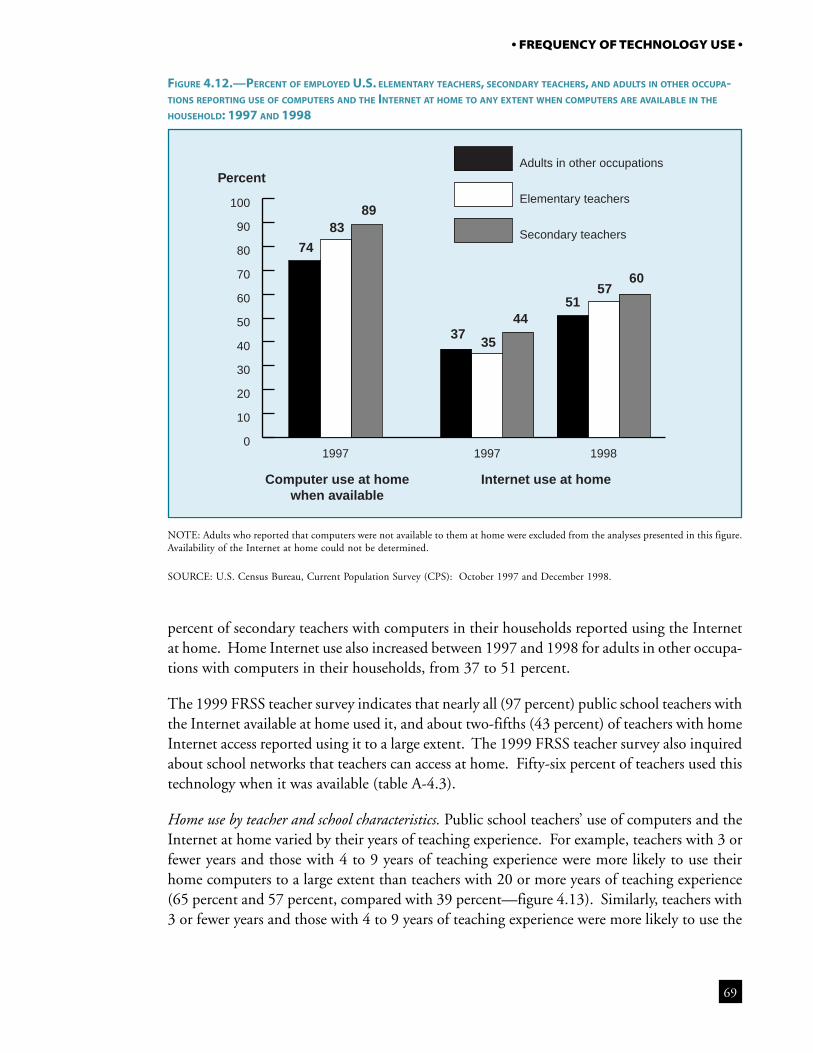
69
• FREQUENCY OF TECHNOLOGY USE •
FIGURE 4.12.—PERCENT OF EMPLOYED U.S. ELEMENTARY TEACHERS, SECONDARY TEACHERS, AND ADULTS IN OTHER OCCUPA-TIONS REPORTING USE OF COMPUTERS AND THE INTERNET AT HOME TO ANY EXTENT WHEN COMPUTERS ARE AVAILABLE IN THE
HOUSEHOLD: 1997 AND 1998
NOTE: Adults who reported that computers were not available to them at home were excluded from the analyses presented in this figure.Availability of the Internet at home could not be determined.
SOURCE: U.S. Census Bureau, Current Population Survey (CPS): October 1997 and December 1998.
Percent
Computer use at homewhen available
Internet use at home
74
8389
3735
4451
5760
0
10
20
30
40
50
60
70
80
90
100
Adults in other occupations
Elementary teachers
Secondary teachers
199819971997
percent of secondary teachers with computers in their households reported using the Internetat home. Home Internet use also increased between 1997 and 1998 for adults in other occupa-tions with computers in their households, from 37 to 51 percent.
The 1999 FRSS teacher survey indicates that nearly all (97 percent) public school teachers withthe Internet available at home used it, and about two-fifths (43 percent) of teachers with homeInternet access reported using it to a large extent. The 1999 FRSS teacher survey also inquiredabout school networks that teachers can access at home. Fifty-six percent of teachers used thistechnology when it was available (table A-4.3).
Home use by teacher and school characteristics. Public school teachers’ use of computers and theInternet at home varied by their years of teaching experience. For example, teachers with 3 orfewer years and those with 4 to 9 years of teaching experience were more likely to use theirhome computers to a large extent than teachers with 20 or more years of teaching experience(65 percent and 57 percent, compared with 39 percent—figure 4.13). Similarly, teachers with3 or fewer years and those with 4 to 9 years of teaching experience were more likely to use the
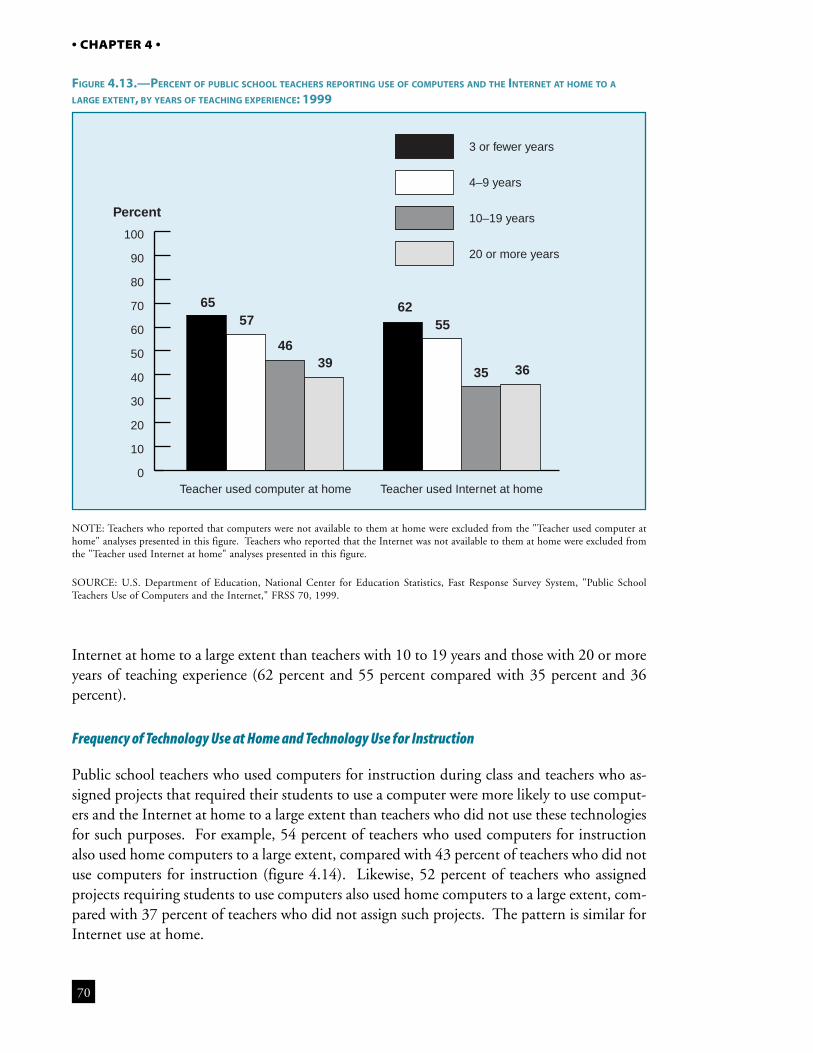
70
• CHAPTER 4 •
FIGURE 4.13.—PERCENT OF PUBLIC SCHOOL TEACHERS REPORTING USE OF COMPUTERS AND THE INTERNET AT HOME TO ALARGE EXTENT, BY YEARS OF TEACHING EXPERIENCE: 1999
NOTE: Teachers who reported that computers were not available to them at home were excluded from the "Teacher used computer athome" analyses presented in this figure. Teachers who reported that the Internet was not available to them at home were excluded fromthe "Teacher used Internet at home" analyses presented in this figure.
SOURCE: U.S. Department of Education, National Center for Education Statistics, Fast Response Survey System, "Public SchoolTeachers Use of Computers and the Internet," FRSS 70, 1999.
Percent
6557
4639
6255
35 36
0
10
20
30
40
50
60
70
80
90
100
3 or fewer years
4–9 years
10–19 years
20 or more years
Teacher used Internet at homeTeacher used computer at home
Internet at home to a large extent than teachers with 10 to 19 years and those with 20 or moreyears of teaching experience (62 percent and 55 percent compared with 35 percent and 36percent).
Frequency of Technology Use at Home and Technology Use for Instruction
Public school teachers who used computers for instruction during class and teachers who as-signed projects that required their students to use a computer were more likely to use comput-ers and the Internet at home to a large extent than teachers who did not use these technologiesfor such purposes. For example, 54 percent of teachers who used computers for instructionalso used home computers to a large extent, compared with 43 percent of teachers who did notuse computers for instruction (figure 4.14). Likewise, 52 percent of teachers who assignedprojects requiring students to use computers also used home computers to a large extent, com-pared with 37 percent of teachers who did not assign such projects. The pattern is similar forInternet use at home.
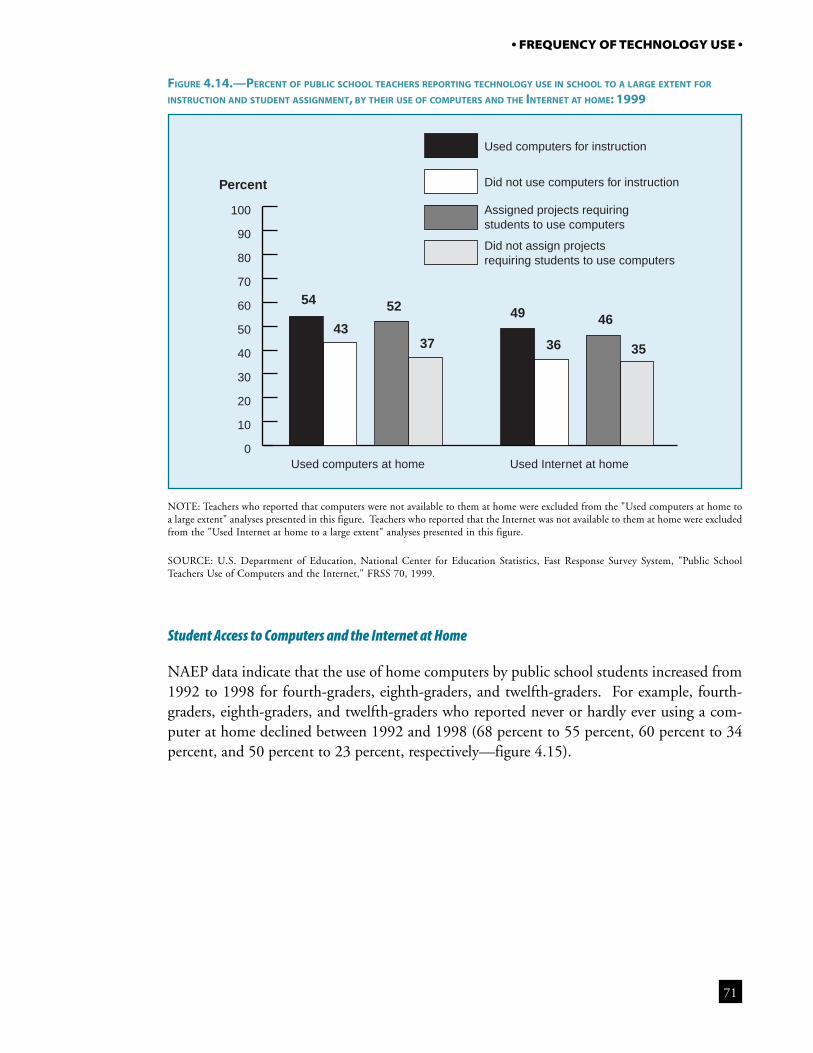
71
• FREQUENCY OF TECHNOLOGY USE •
FIGURE 4.14.—PERCENT OF PUBLIC SCHOOL TEACHERS REPORTING TECHNOLOGY USE IN SCHOOL TO A LARGE EXTENT FOR
INSTRUCTION AND STUDENT ASSIGNMENT, BY THEIR USE OF COMPUTERS AND THE INTERNET AT HOME: 1999
NOTE: Teachers who reported that computers were not available to them at home were excluded from the "Used computers at home toa large extent" analyses presented in this figure. Teachers who reported that the Internet was not available to them at home were excludedfrom the "Used Internet at home to a large extent" analyses presented in this figure.
SOURCE: U.S. Department of Education, National Center for Education Statistics, Fast Response Survey System, "Public SchoolTeachers Use of Computers and the Internet," FRSS 70, 1999.
Percent
54
43
52
37
49
36
46
35
0
10
20
30
40
50
60
70
80
90
100
Used computers for instruction
Did not use computers for instruction
Assigned projects requiring students to use computers
Did not assign projects requiring students to use computers
Used Internet at homeUsed computers at home
Student Access to Computers and the Internet at Home
NAEP data indicate that the use of home computers by public school students increased from1992 to 1998 for fourth-graders, eighth-graders, and twelfth-graders. For example, fourth-graders, eighth-graders, and twelfth-graders who reported never or hardly ever using a com-puter at home declined between 1992 and 1998 (68 percent to 55 percent, 60 percent to 34percent, and 50 percent to 23 percent, respectively—figure 4.15).
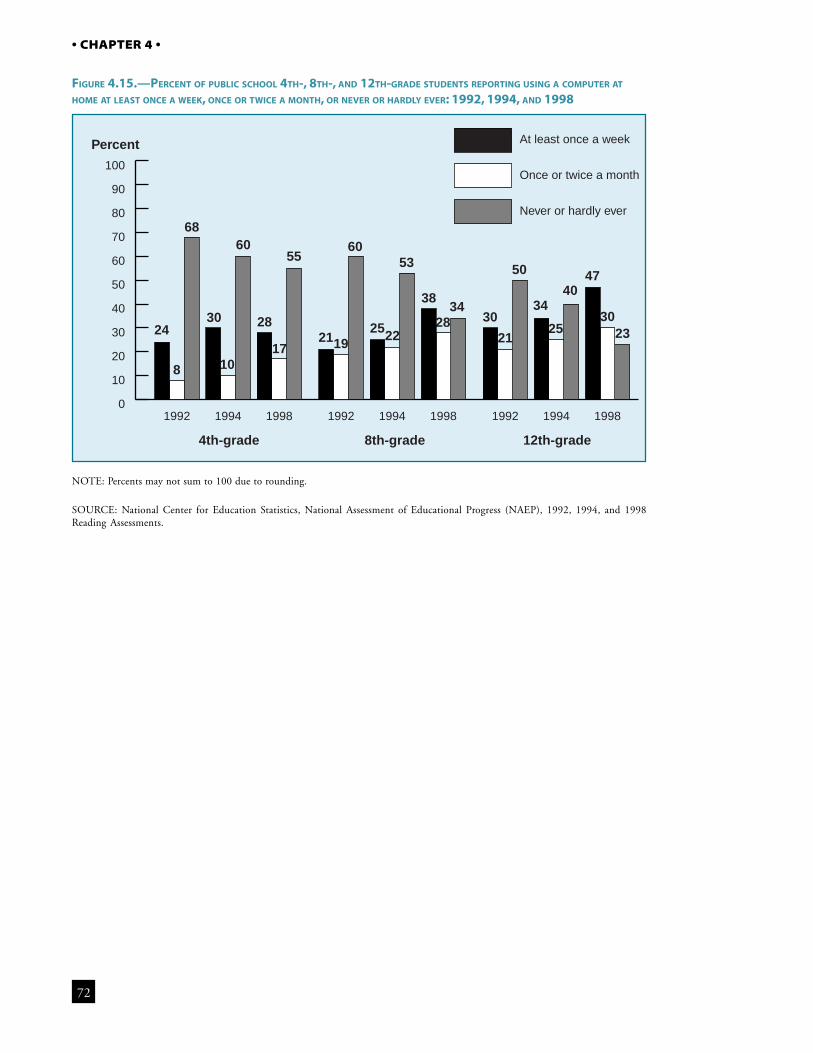
72
• CHAPTER 4 •
FIGURE 4.15.—PERCENT OF PUBLIC SCHOOL 4TH-, 8TH-, AND 12TH-GRADE STUDENTS REPORTING USING A COMPUTER AT
HOME AT LEAST ONCE A WEEK, ONCE OR TWICE A MONTH, OR NEVER OR HARDLY EVER: 1992, 1994, AND 1998
NOTE: Percents may not sum to 100 due to rounding.
SOURCE: National Center for Education Statistics, National Assessment of Educational Progress (NAEP), 1992, 1994, and 1998Reading Assessments.
Percent
4th-grade 8th-grade 12th-grade
24
8
68
30
10
60
28
17
55
2119
60
2522
53
38
2834
30
21
50
34
25
4047
3023
0
10
20
30
40
50
60
70
80
90
100
At least once a week
Once or twice a month
Never or hardly ever
199819941992199819941992199819941992

73
Chapter 5
Teacher Preparation and Training
Highlights
• In 1999, one-third of teachers reported feeling very well or well prepared to use computersand the Internet for instruction, with less experienced teachers indicating they felt moreprepared to use technology than their more experienced colleagues. For many instruc-tional activities, teachers who reported feeling well prepared or very well prepared to usetechnology were more likely to use it or assign students to use it than teachers who reportedfeeling unprepared.
• Teachers cited independent learning most frequently as preparing them for technology use,followed by professional development activities and their colleagues. Whereas half of allteachers reported that college and graduate work prepared them to use technology, lessexperienced teachers were generally much more likely than their more experienced col-leagues to indicate that this education prepared them to use computers and the Internet.
• Most teachers indicated that professional development activities on a number of topicswere available to them, including training on software applications, the use of the Internet,and the use of computers and basic computer training. Participation was relatively high inthese three activities (ranging from 75 to 83 percent), with more experienced teachers oftenmore likely to participate than less experienced teachers. Teachers indicated that follow-upand advanced training were available less frequently, and approximately half of the teachersreporting that each of these two activities were available to them participated in them.
• Over a 3-year time period, most teachers participated in professional development activi-ties that lasted the equivalent of 4 days or less (i.e., 32 or fewer hours). Teachers whoreported spending more time in professional development activities (9 hours or more) weregenerally more likely than teachers who spent less time in such activities (fewer than 9hours) to report feeling well or very well prepared to use computers and the Internet forinstruction.
5C H A P T E R
75
The 1999 Fast Response Survey System (FRSS) teacher surveyof technology use asked public school teachers a number ofquestions regarding their preparation and training on the fol-
lowing topics: their feelings of preparedness, the extent to which vari-ous training sources contributed to their understanding of technology(e.g., colleagues, independent learning), their participation in a num-ber of different types of professional development activities and thelength of their participation, and the supports they received for partici-pating in training activities.
Teachers’ Feelings of Preparedness
In 1999, 10 percent of teachers reported feeling “very well prepared,”and 23 percent reported feeling “well prepared” to use computers andthe Internet for classroom instruction. At least half of teachers reportedfeeling “somewhat prepared” to use these technologies for instruction(53 percent), and 13 percent reported feeling “not at all prepared” touse these technologies for instruction (table A-5.5).
Teachers’ feelings of preparation varied by their years of teaching expe-rience. For example, teachers with 3 or fewer years of teaching experi-ence were generally more likely to report that they felt well prepared orvery well prepared, compared with teachers with more years of teachingexperience (45 percent compared with 31 percent of teachers with 10to 19 years and 27 percent of teachers with 20 or more years of teachingexperience—figure 5.1).
Preparedness and Teachers’ Use of Technology
For many instructional activities, teachers who reported feeling betterprepared to use technology were more likely to use it than teachers whoindicated that they felt unprepared. Specifically, teachers who reportedfeeling well prepared or very well prepared were more likely than teach-ers who reported feeling unprepared to create instructional materials
TeacherPreparation
and Training
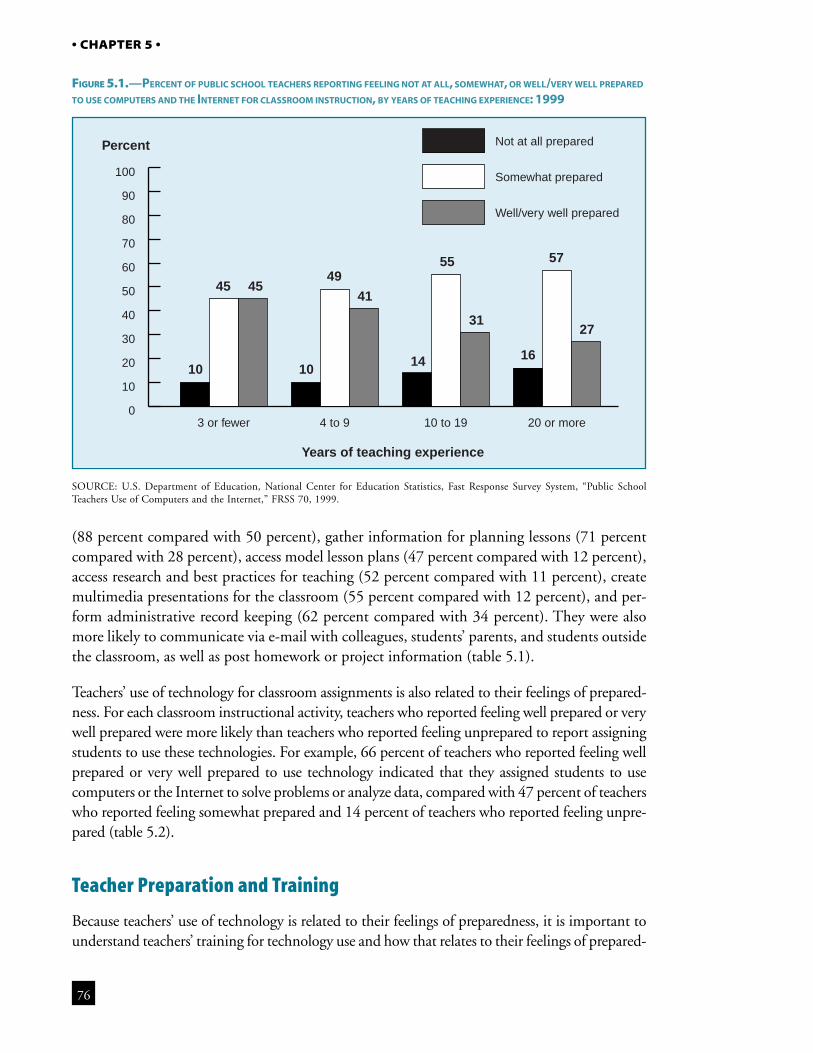
76
• CHAPTER 5 •
FIGURE 5.1.—PERCENT OF PUBLIC SCHOOL TEACHERS REPORTING FEELING NOT AT ALL, SOMEWHAT, OR WELL/VERY WELL PREPARED
TO USE COMPUTERS AND THE INTERNET FOR CLASSROOM INSTRUCTION, BY YEARS OF TEACHING EXPERIENCE: 1999
SOURCE: U.S. Department of Education, National Center for Education Statistics, Fast Response Survey System, “Public SchoolTeachers Use of Computers and the Internet,” FRSS 70, 1999.
(88 percent compared with 50 percent), gather information for planning lessons (71 percentcompared with 28 percent), access model lesson plans (47 percent compared with 12 percent),access research and best practices for teaching (52 percent compared with 11 percent), createmultimedia presentations for the classroom (55 percent compared with 12 percent), and per-form administrative record keeping (62 percent compared with 34 percent). They were alsomore likely to communicate via e-mail with colleagues, students’ parents, and students outsidethe classroom, as well as post homework or project information (table 5.1).
Teachers’ use of technology for classroom assignments is also related to their feelings of prepared-ness. For each classroom instructional activity, teachers who reported feeling well prepared or verywell prepared were more likely than teachers who reported feeling unprepared to report assigningstudents to use these technologies. For example, 66 percent of teachers who reported feeling wellprepared or very well prepared to use technology indicated that they assigned students to usecomputers or the Internet to solve problems or analyze data, compared with 47 percent of teacherswho reported feeling somewhat prepared and 14 percent of teachers who reported feeling unpre-pared (table 5.2).
Teacher Preparation and Training
Because teachers’ use of technology is related to their feelings of preparedness, it is important tounderstand teachers’ training for technology use and how that relates to their feelings of prepared-
Percent
Years of teaching experience
10
45 45
10
49
41
14
55
31
16
57
27
0
10
20
30
40
50
60
70
80
90
100
Not at all prepared
Somewhat prepared
Well/very well prepared
20 or more10 to 194 to 93 or fewer
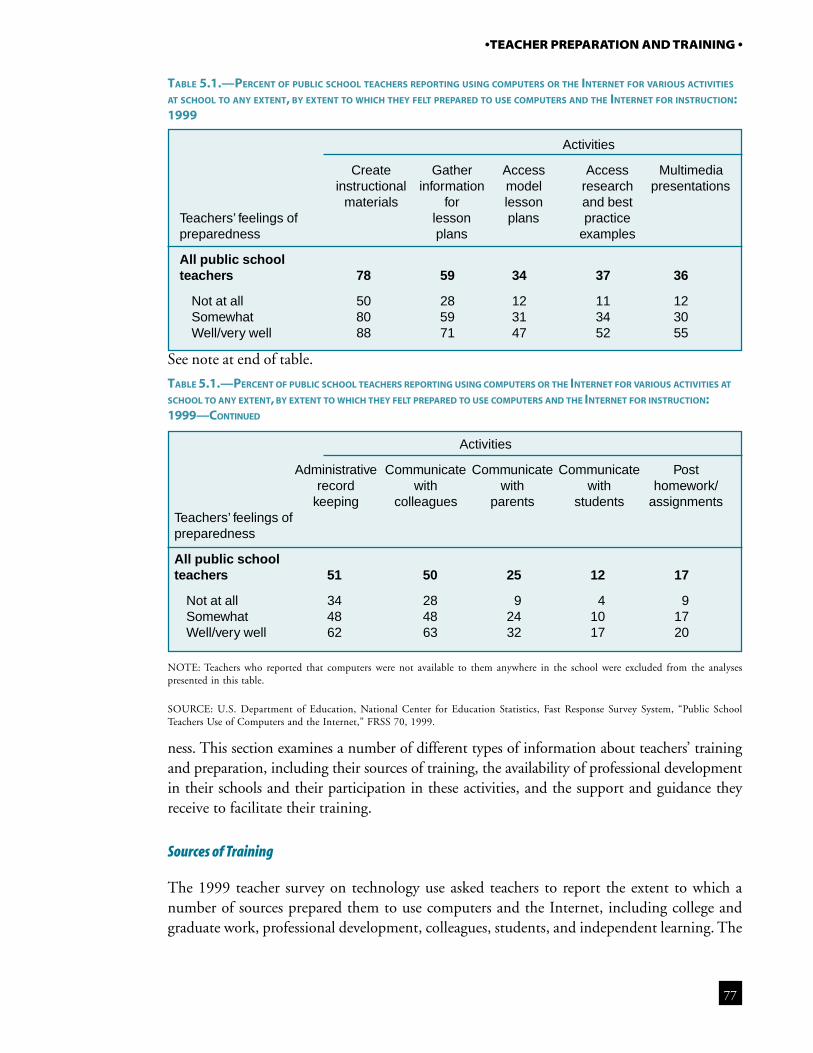
77
•TEACHER PREPARATION AND TRAINING •
ness. This section examines a number of different types of information about teachers’ trainingand preparation, including their sources of training, the availability of professional developmentin their schools and their participation in these activities, and the support and guidance theyreceive to facilitate their training.
Sources of Training
The 1999 teacher survey on technology use asked teachers to report the extent to which anumber of sources prepared them to use computers and the Internet, including college andgraduate work, professional development, colleagues, students, and independent learning. The
TABLE 5.1.—PERCENT OF PUBLIC SCHOOL TEACHERS REPORTING USING COMPUTERS OR THE INTERNET FOR VARIOUS ACTIVITIES
AT SCHOOL TO ANY EXTENT, BY EXTENT TO WHICH THEY FELT PREPARED TO USE COMPUTERS AND THE INTERNET FOR INSTRUCTION:1999
TABLE 5.1.—PERCENT OF PUBLIC SCHOOL TEACHERS REPORTING USING COMPUTERS OR THE INTERNET FOR VARIOUS ACTIVITIES AT
SCHOOL TO ANY EXTENT, BY EXTENT TO WHICH THEY FELT PREPARED TO USE COMPUTERS AND THE INTERNET FOR INSTRUCTION:1999—CONTINUED
NOTE: Teachers who reported that computers were not available to them anywhere in the school were excluded from the analysespresented in this table.
SOURCE: U.S. Department of Education, National Center for Education Statistics, Fast Response Survey System, “Public SchoolTeachers Use of Computers and the Internet,” FRSS 70, 1999.
Activities
Create Gather Access Access Multimediainstructional information model research presentations
materials for lesson and bestTeachers’ feelings of lesson plans practicepreparedness plans examples
All public schoolteachers 78 59 34 37 36
Not at all 50 28 12 11 12Somewhat 80 59 31 34 30Well/very well 88 71 47 52 55
Activities
Administrative Communicate Communicate Communicate Postrecord with with with homework/
keeping colleagues parents students assignmentsTeachers’ feelings ofpreparedness
All public schoolteachers 51 50 25 12 17
Not at all 34 28 9 4 9Somewhat 48 48 24 10 17Well/very well 62 63 32 17 20
See note at end of table.
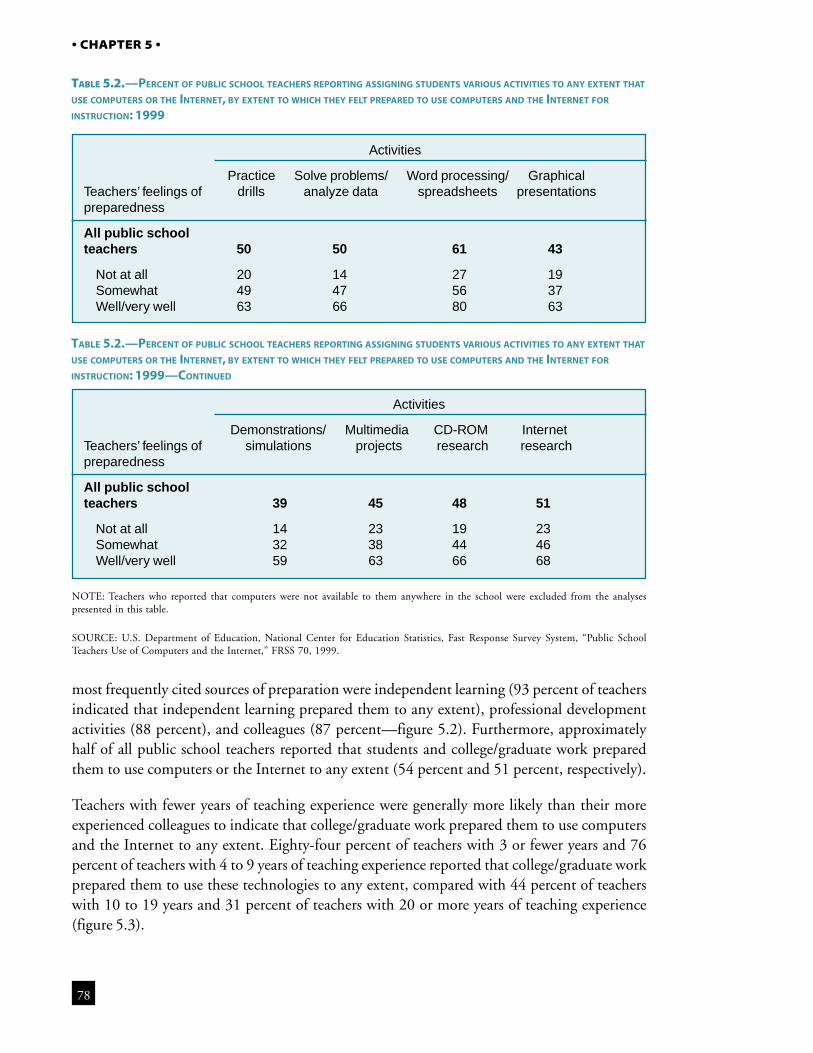
78
• CHAPTER 5 •
most frequently cited sources of preparation were independent learning (93 percent of teachersindicated that independent learning prepared them to any extent), professional developmentactivities (88 percent), and colleagues (87 percent—figure 5.2). Furthermore, approximatelyhalf of all public school teachers reported that students and college/graduate work preparedthem to use computers or the Internet to any extent (54 percent and 51 percent, respectively).
Teachers with fewer years of teaching experience were generally more likely than their moreexperienced colleagues to indicate that college/graduate work prepared them to use computersand the Internet to any extent. Eighty-four percent of teachers with 3 or fewer years and 76percent of teachers with 4 to 9 years of teaching experience reported that college/graduate workprepared them to use these technologies to any extent, compared with 44 percent of teacherswith 10 to 19 years and 31 percent of teachers with 20 or more years of teaching experience(figure 5.3).
TABLE 5.2.—PERCENT OF PUBLIC SCHOOL TEACHERS REPORTING ASSIGNING STUDENTS VARIOUS ACTIVITIES TO ANY EXTENT THAT
USE COMPUTERS OR THE INTERNET, BY EXTENT TO WHICH THEY FELT PREPARED TO USE COMPUTERS AND THE INTERNET FOR
INSTRUCTION: 1999
NOTE: Teachers who reported that computers were not available to them anywhere in the school were excluded from the analysespresented in this table.
SOURCE: U.S. Department of Education, National Center for Education Statistics, Fast Response Survey System, “Public SchoolTeachers Use of Computers and the Internet,” FRSS 70, 1999.
TABLE 5.2.—PERCENT OF PUBLIC SCHOOL TEACHERS REPORTING ASSIGNING STUDENTS VARIOUS ACTIVITIES TO ANY EXTENT THAT
USE COMPUTERS OR THE INTERNET, BY EXTENT TO WHICH THEY FELT PREPARED TO USE COMPUTERS AND THE INTERNET FOR
INSTRUCTION: 1999—CONTINUED
Activities
Practice Solve problems/ Word processing/ GraphicalTeachers’ feelings of drills analyze data spreadsheets presentationspreparedness
All public schoolteachers 50 50 61 43
Not at all 20 14 27 19Somewhat 49 47 56 37Well/very well 63 66 80 63
Activities
Demonstrations/ Multimedia CD-ROM InternetTeachers’ feelings of simulations projects research researchpreparedness
All public schoolteachers 39 45 48 51
Not at all 14 23 19 23Somewhat 32 38 44 46Well/very well 59 63 66 68
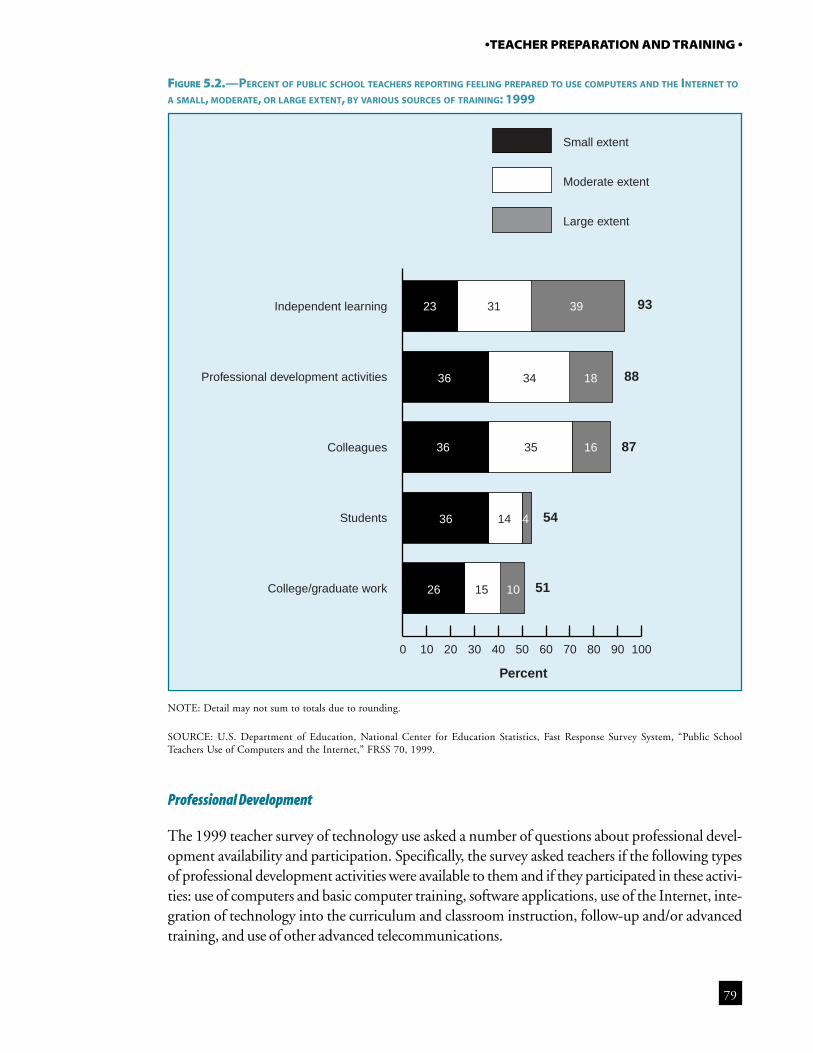
79
•TEACHER PREPARATION AND TRAINING •
Percent
93
88
87
54
51
0 10 20 30 40 50 60 70 80 90 100
Small extent
Moderate extent
Large extent
College/graduate work
Students
Colleagues
Professional development activities
Independent learning 23
36
36
36
26 15 10
14 4
35 16
34 18
31 39
Professional Development
The 1999 teacher survey of technology use asked a number of questions about professional devel-opment availability and participation. Specifically, the survey asked teachers if the following typesof professional development activities were available to them and if they participated in these activi-ties: use of computers and basic computer training, software applications, use of the Internet, inte-gration of technology into the curriculum and classroom instruction, follow-up and/or advancedtraining, and use of other advanced telecommunications.
FIGURE 5.2.—PERCENT OF PUBLIC SCHOOL TEACHERS REPORTING FEELING PREPARED TO USE COMPUTERS AND THE INTERNET TO
A SMALL, MODERATE, OR LARGE EXTENT, BY VARIOUS SOURCES OF TRAINING: 1999
NOTE: Detail may not sum to totals due to rounding.
SOURCE: U.S. Department of Education, National Center for Education Statistics, Fast Response Survey System, “Public SchoolTeachers Use of Computers and the Internet,” FRSS 70, 1999.
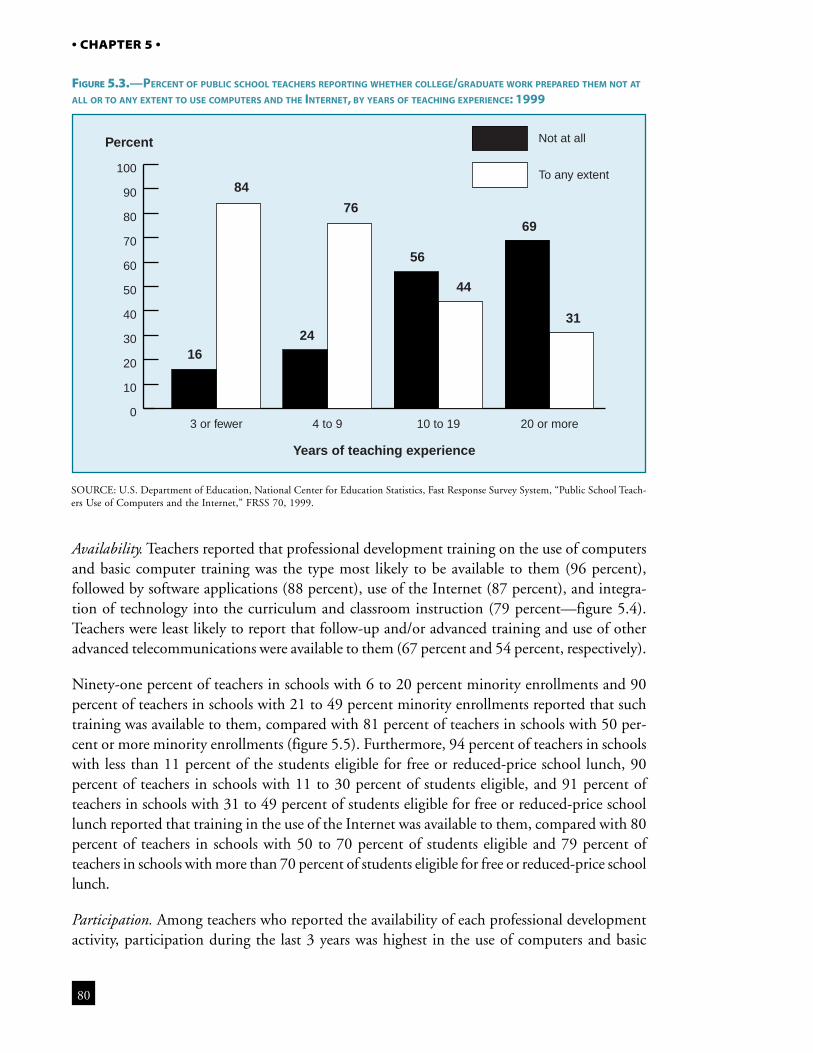
80
• CHAPTER 5 •
Availability. Teachers reported that professional development training on the use of computersand basic computer training was the type most likely to be available to them (96 percent),followed by software applications (88 percent), use of the Internet (87 percent), and integra-tion of technology into the curriculum and classroom instruction (79 percent—figure 5.4).Teachers were least likely to report that follow-up and/or advanced training and use of otheradvanced telecommunications were available to them (67 percent and 54 percent, respectively).
Ninety-one percent of teachers in schools with 6 to 20 percent minority enrollments and 90percent of teachers in schools with 21 to 49 percent minority enrollments reported that suchtraining was available to them, compared with 81 percent of teachers in schools with 50 per-cent or more minority enrollments (figure 5.5). Furthermore, 94 percent of teachers in schoolswith less than 11 percent of the students eligible for free or reduced-price school lunch, 90percent of teachers in schools with 11 to 30 percent of students eligible, and 91 percent ofteachers in schools with 31 to 49 percent of students eligible for free or reduced-price schoollunch reported that training in the use of the Internet was available to them, compared with 80percent of teachers in schools with 50 to 70 percent of students eligible and 79 percent ofteachers in schools with more than 70 percent of students eligible for free or reduced-price schoollunch.
Participation. Among teachers who reported the availability of each professional developmentactivity, participation during the last 3 years was highest in the use of computers and basic
FIGURE 5.3.—PERCENT OF PUBLIC SCHOOL TEACHERS REPORTING WHETHER COLLEGE/GRADUATE WORK PREPARED THEM NOT AT
ALL OR TO ANY EXTENT TO USE COMPUTERS AND THE INTERNET, BY YEARS OF TEACHING EXPERIENCE: 1999
SOURCE: U.S. Department of Education, National Center for Education Statistics, Fast Response Survey System, “Public School Teach-ers Use of Computers and the Internet,” FRSS 70, 1999.
Percent
Years of teaching experience
16
84
24
76
56
44
69
31
0
10
20
30
40
50
60
70
80
90
100
Not at all
To any extent
20 or more10 to 194 to 93 or fewer
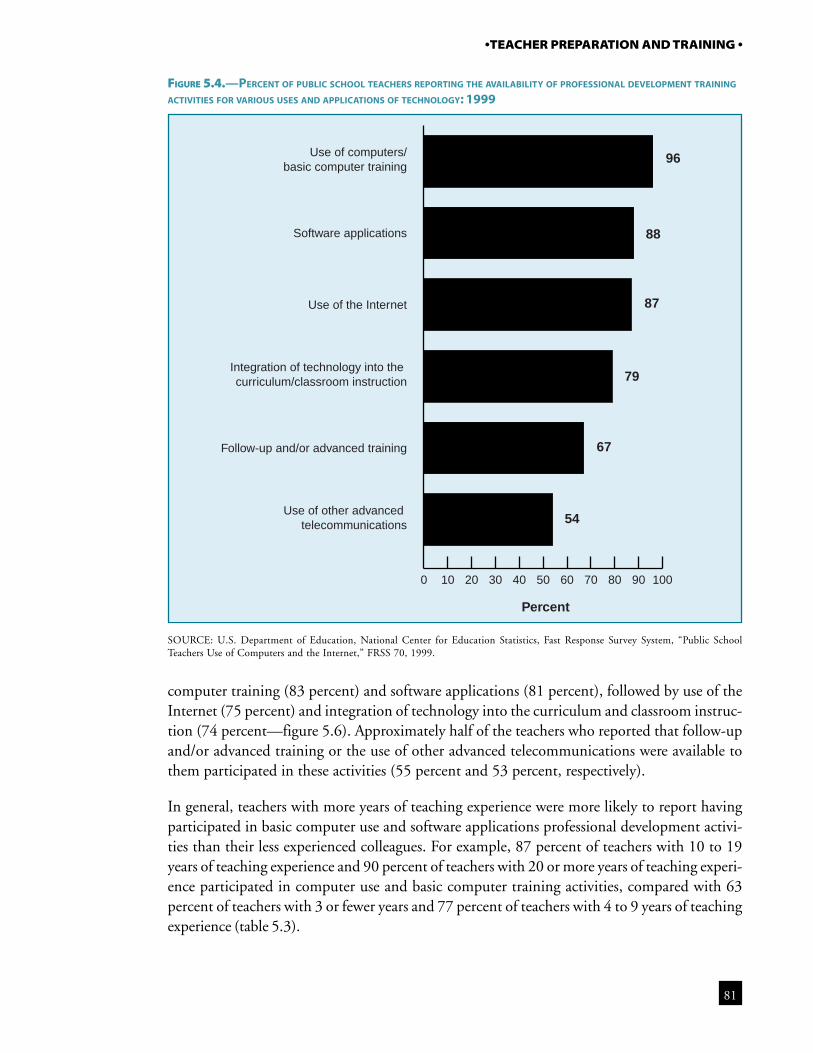
81
•TEACHER PREPARATION AND TRAINING •
computer training (83 percent) and software applications (81 percent), followed by use of theInternet (75 percent) and integration of technology into the curriculum and classroom instruc-tion (74 percent—figure 5.6). Approximately half of the teachers who reported that follow-upand/or advanced training or the use of other advanced telecommunications were available tothem participated in these activities (55 percent and 53 percent, respectively).
In general, teachers with more years of teaching experience were more likely to report havingparticipated in basic computer use and software applications professional development activi-ties than their less experienced colleagues. For example, 87 percent of teachers with 10 to 19years of teaching experience and 90 percent of teachers with 20 or more years of teaching experi-ence participated in computer use and basic computer training activities, compared with 63percent of teachers with 3 or fewer years and 77 percent of teachers with 4 to 9 years of teachingexperience (table 5.3).
FIGURE 5.4.—PERCENT OF PUBLIC SCHOOL TEACHERS REPORTING THE AVAILABILITY OF PROFESSIONAL DEVELOPMENT TRAINING
ACTIVITIES FOR VARIOUS USES AND APPLICATIONS OF TECHNOLOGY: 1999
SOURCE: U.S. Department of Education, National Center for Education Statistics, Fast Response Survey System, “Public SchoolTeachers Use of Computers and the Internet,” FRSS 70, 1999.
Percent
96
88
87
79
67
54
0 10 20 30 40 50 60 70 80 90 100
Use of other advanced telecommunications
Follow-up and/or advanced training
Integration of technology into the curriculum/classroom instruction
Use of the Internet
Software applications
Use of computers/basic computer training
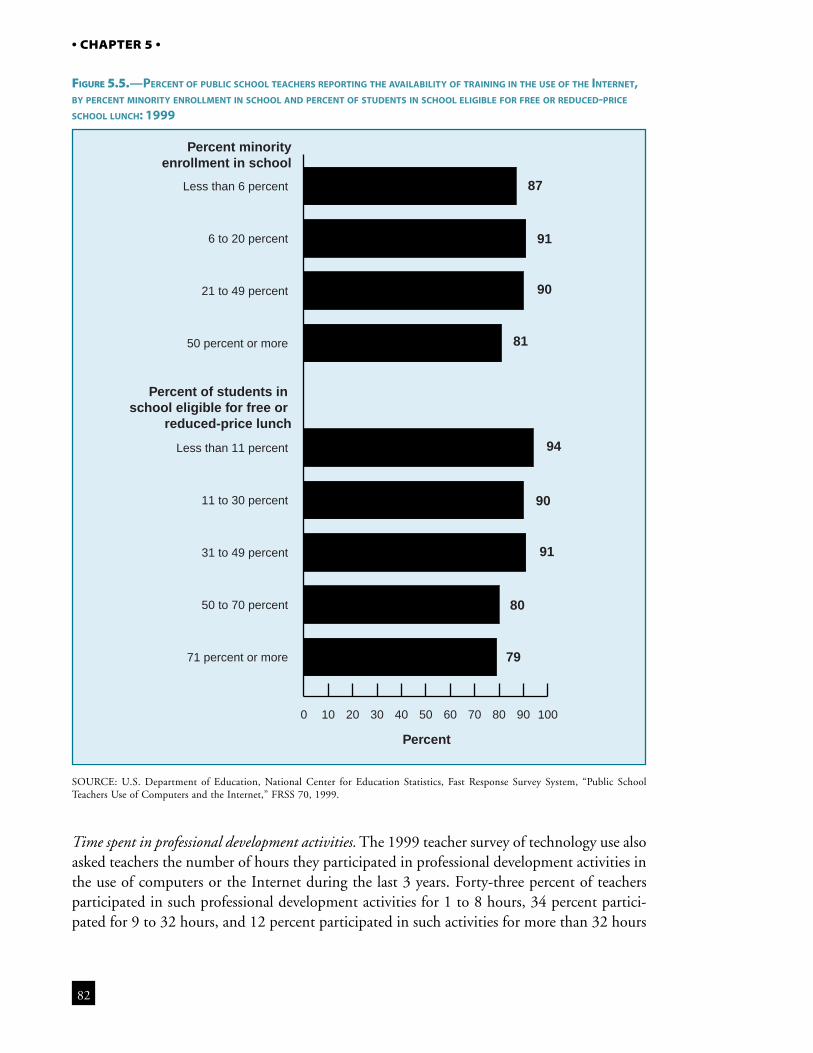
82
• CHAPTER 5 •
Percent
Percent minorityenrollment in school
Percent of students in school eligible for free or
reduced-price lunch
87
91
90
81
94
90
91
80
79
0 10 20 30 40 50 60 70 80 90 100
71 percent or more
50 to 70 percent
31 to 49 percent
11 to 30 percent
Less than 11 percent
50 percent or more
21 to 49 percent
6 to 20 percent
Less than 6 percent
Time spent in professional development activities. The 1999 teacher survey of technology use alsoasked teachers the number of hours they participated in professional development activities inthe use of computers or the Internet during the last 3 years. Forty-three percent of teachersparticipated in such professional development activities for 1 to 8 hours, 34 percent partici-pated for 9 to 32 hours, and 12 percent participated in such activities for more than 32 hours
FIGURE 5.5.—PERCENT OF PUBLIC SCHOOL TEACHERS REPORTING THE AVAILABILITY OF TRAINING IN THE USE OF THE INTERNET,BY PERCENT MINORITY ENROLLMENT IN SCHOOL AND PERCENT OF STUDENTS IN SCHOOL ELIGIBLE FOR FREE OR REDUCED-PRICE
SCHOOL LUNCH: 1999
SOURCE: U.S. Department of Education, National Center for Education Statistics, Fast Response Survey System, “Public SchoolTeachers Use of Computers and the Internet,” FRSS 70, 1999.
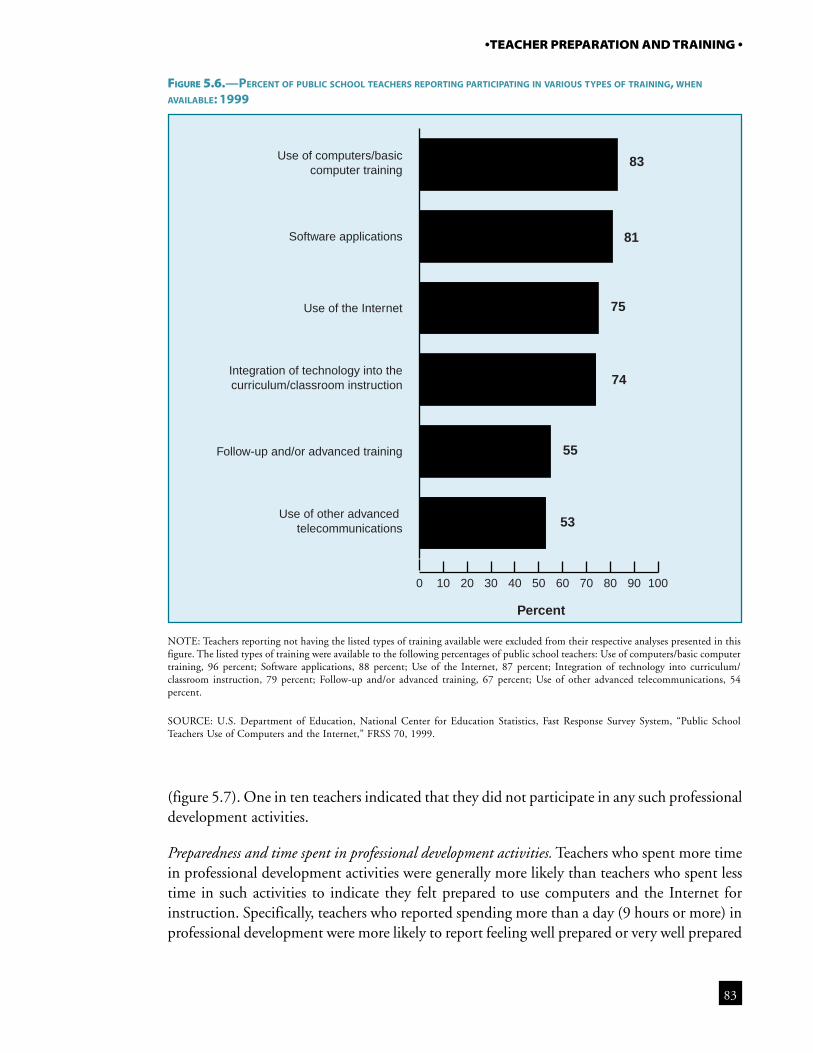
83
•TEACHER PREPARATION AND TRAINING •
(figure 5.7). One in ten teachers indicated that they did not participate in any such professionaldevelopment activities.
Preparedness and time spent in professional development activities. Teachers who spent more timein professional development activities were generally more likely than teachers who spent lesstime in such activities to indicate they felt prepared to use computers and the Internet forinstruction. Specifically, teachers who reported spending more than a day (9 hours or more) inprofessional development were more likely to report feeling well prepared or very well prepared
FIGURE 5.6.—PERCENT OF PUBLIC SCHOOL TEACHERS REPORTING PARTICIPATING IN VARIOUS TYPES OF TRAINING, WHEN
AVAILABLE: 1999
NOTE: Teachers reporting not having the listed types of training available were excluded from their respective analyses presented in thisfigure. The listed types of training were available to the following percentages of public school teachers: Use of computers/basic computertraining, 96 percent; Software applications, 88 percent; Use of the Internet, 87 percent; Integration of technology into curriculum/classroom instruction, 79 percent; Follow-up and/or advanced training, 67 percent; Use of other advanced telecommunications, 54percent.
SOURCE: U.S. Department of Education, National Center for Education Statistics, Fast Response Survey System, “Public SchoolTeachers Use of Computers and the Internet,” FRSS 70, 1999.
Percent
83
81
75
74
55
53
0 10 20 30 40 50 60 70 80 90 100
Use of other advanced telecommunications
Follow-up and/or advanced training
Integration of technology into thecurriculum/classroom instruction
Use of the Internet
Software applications
Use of computers/basiccomputer training
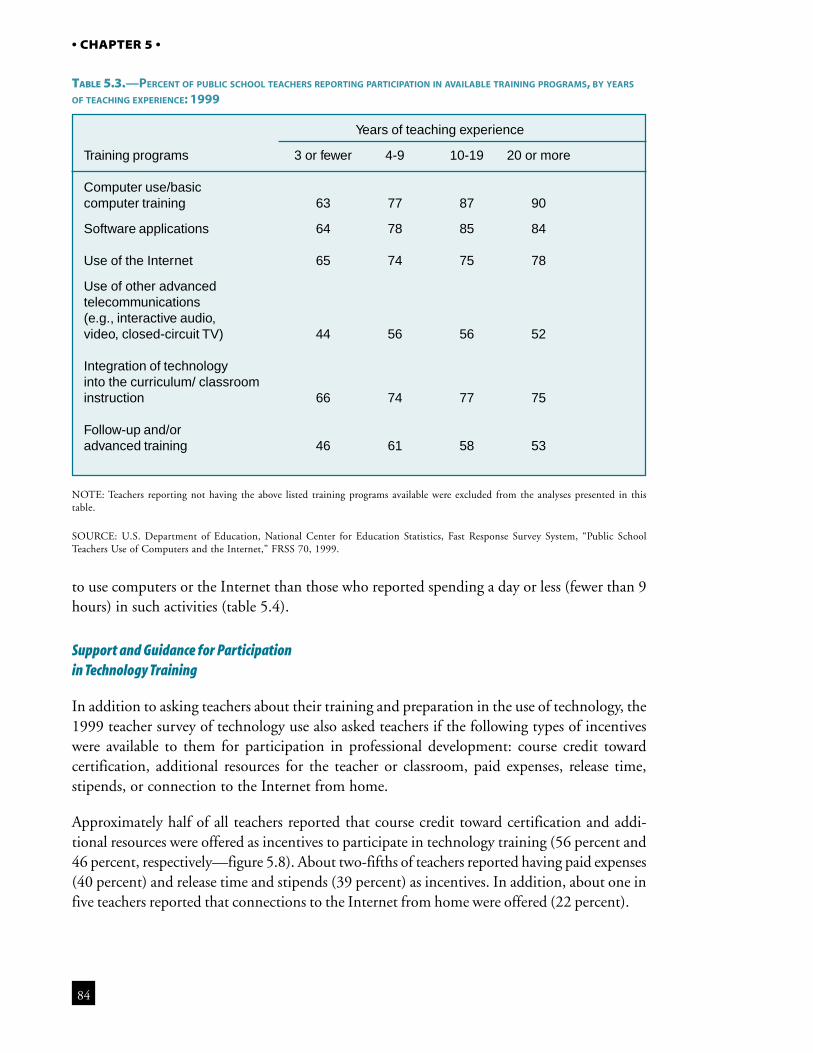
84
• CHAPTER 5 •
NOTE: Teachers reporting not having the above listed training programs available were excluded from the analyses presented in thistable.
SOURCE: U.S. Department of Education, National Center for Education Statistics, Fast Response Survey System, “Public SchoolTeachers Use of Computers and the Internet,” FRSS 70, 1999.
to use computers or the Internet than those who reported spending a day or less (fewer than 9hours) in such activities (table 5.4).
Support and Guidance for Participationin Technology Training
In addition to asking teachers about their training and preparation in the use of technology, the1999 teacher survey of technology use also asked teachers if the following types of incentiveswere available to them for participation in professional development: course credit towardcertification, additional resources for the teacher or classroom, paid expenses, release time,stipends, or connection to the Internet from home.
Approximately half of all teachers reported that course credit toward certification and addi-tional resources were offered as incentives to participate in technology training (56 percent and46 percent, respectively—figure 5.8). About two-fifths of teachers reported having paid expenses(40 percent) and release time and stipends (39 percent) as incentives. In addition, about one infive teachers reported that connections to the Internet from home were offered (22 percent).
TABLE 5.3.—PERCENT OF PUBLIC SCHOOL TEACHERS REPORTING PARTICIPATION IN AVAILABLE TRAINING PROGRAMS, BY YEARS
OF TEACHING EXPERIENCE: 1999
Years of teaching experience
Training programs 3 or fewer 4-9 10-19 20 or more
Computer use/basiccomputer training 63 77 87 90
Software applications 64 78 85 84
Use of the Internet 65 74 75 78
Use of other advancedtelecommunications(e.g., interactive audio,video, closed-circuit TV) 44 56 56 52
Integration of technologyinto the curriculum/ classroominstruction 66 74 77 75
Follow-up and/oradvanced training 46 61 58 53
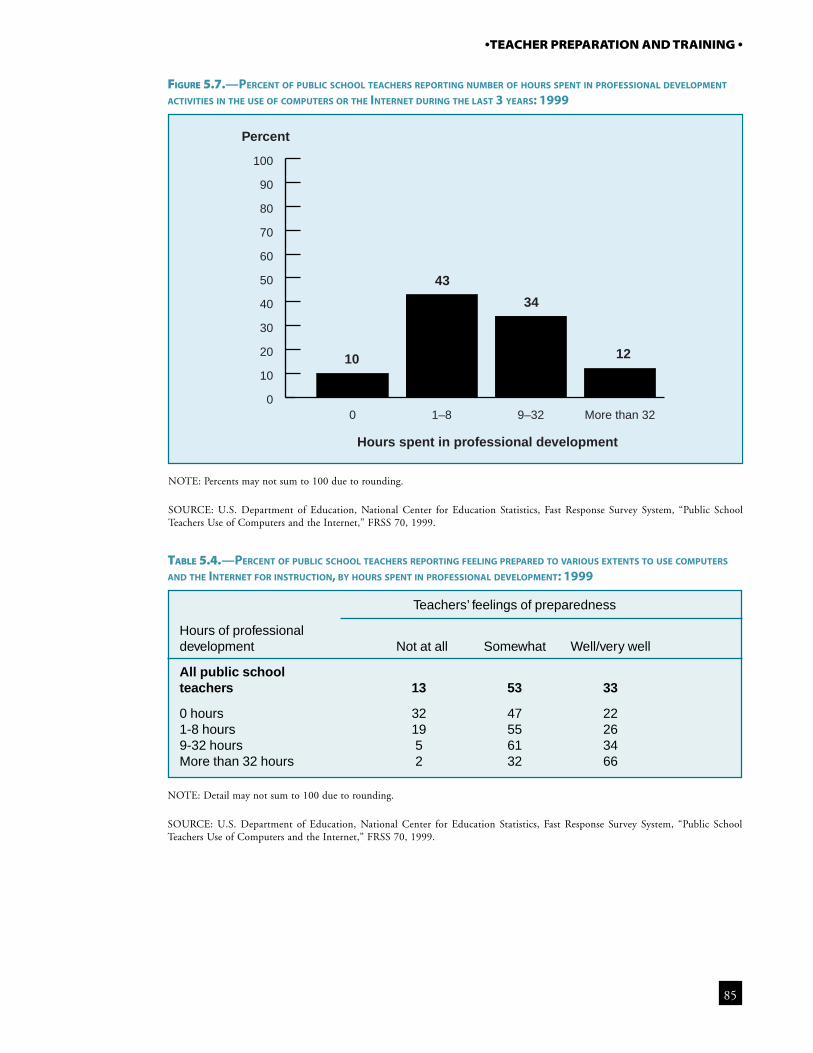
85
•TEACHER PREPARATION AND TRAINING •
Percent
Hours spent in professional development
10
43
34
12
0
10
20
30
40
50
60
70
80
90
100
More than 329–321–80
FIGURE 5.7.—PERCENT OF PUBLIC SCHOOL TEACHERS REPORTING NUMBER OF HOURS SPENT IN PROFESSIONAL DEVELOPMENT
ACTIVITIES IN THE USE OF COMPUTERS OR THE INTERNET DURING THE LAST 3 YEARS: 1999
NOTE: Percents may not sum to 100 due to rounding.
SOURCE: U.S. Department of Education, National Center for Education Statistics, Fast Response Survey System, “Public SchoolTeachers Use of Computers and the Internet,” FRSS 70, 1999.
TABLE 5.4.—PERCENT OF PUBLIC SCHOOL TEACHERS REPORTING FEELING PREPARED TO VARIOUS EXTENTS TO USE COMPUTERS
AND THE INTERNET FOR INSTRUCTION, BY HOURS SPENT IN PROFESSIONAL DEVELOPMENT: 1999
NOTE: Detail may not sum to 100 due to rounding.
SOURCE: U.S. Department of Education, National Center for Education Statistics, Fast Response Survey System, “Public SchoolTeachers Use of Computers and the Internet,” FRSS 70, 1999.
Teachers’ feelings of preparedness
Hours of professionaldevelopment Not at all Somewhat Well/very well
All public schoolteachers 13 53 33
0 hours 32 47 221-8 hours 19 55 269-32 hours 5 61 34More than 32 hours 2 32 66
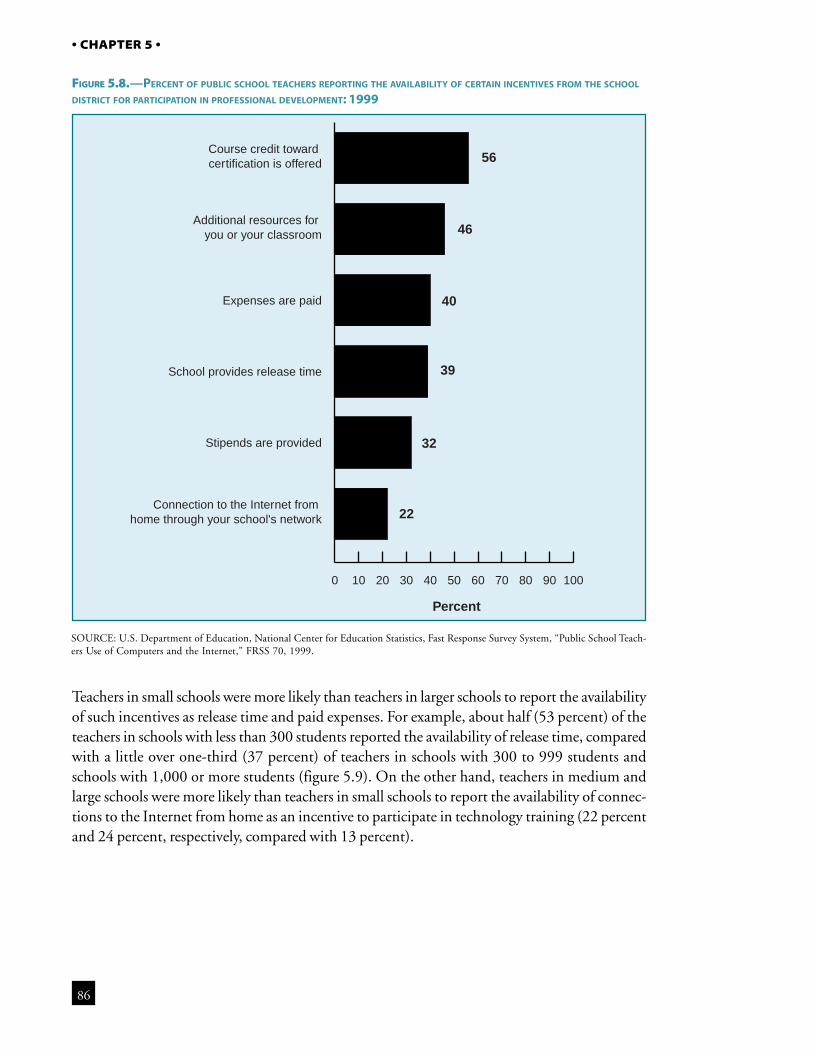
86
• CHAPTER 5 •
FIGURE 5.8.—PERCENT OF PUBLIC SCHOOL TEACHERS REPORTING THE AVAILABILITY OF CERTAIN INCENTIVES FROM THE SCHOOL
DISTRICT FOR PARTICIPATION IN PROFESSIONAL DEVELOPMENT: 1999
SOURCE: U.S. Department of Education, National Center for Education Statistics, Fast Response Survey System, “Public School Teach-ers Use of Computers and the Internet,” FRSS 70, 1999.
Teachers in small schools were more likely than teachers in larger schools to report the availabilityof such incentives as release time and paid expenses. For example, about half (53 percent) of theteachers in schools with less than 300 students reported the availability of release time, comparedwith a little over one-third (37 percent) of teachers in schools with 300 to 999 students andschools with 1,000 or more students (figure 5.9). On the other hand, teachers in medium andlarge schools were more likely than teachers in small schools to report the availability of connec-tions to the Internet from home as an incentive to participate in technology training (22 percentand 24 percent, respectively, compared with 13 percent).
Percent
56
46
40
39
32
22
0 10 20 30 40 50 60 70 80 90 100
Connection to the Internet from home through your school's network
Stipends are provided
School provides release time
Expenses are paid
Additional resources for you or your classroom
Course credit toward certification is offered
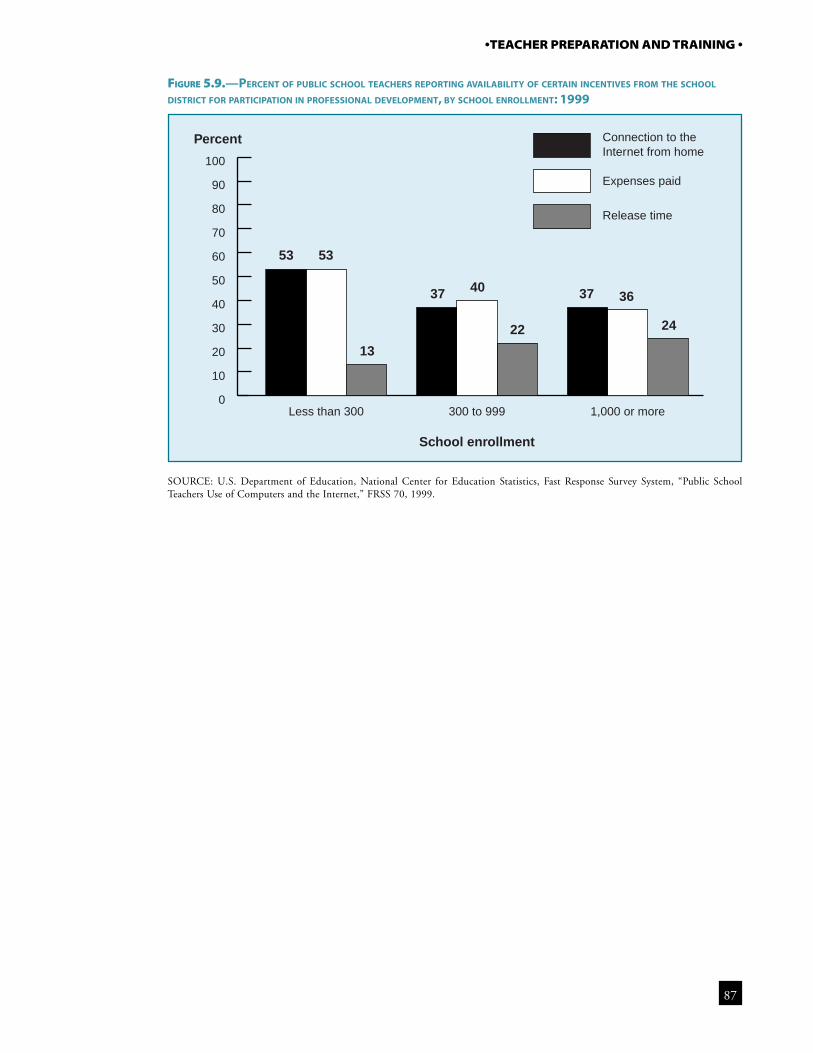
87
•TEACHER PREPARATION AND TRAINING •
FIGURE 5.9.—PERCENT OF PUBLIC SCHOOL TEACHERS REPORTING AVAILABILITY OF CERTAIN INCENTIVES FROM THE SCHOOL
DISTRICT FOR PARTICIPATION IN PROFESSIONAL DEVELOPMENT, BY SCHOOL ENROLLMENT: 1999
SOURCE: U.S. Department of Education, National Center for Education Statistics, Fast Response Survey System, “Public SchoolTeachers Use of Computers and the Internet,” FRSS 70, 1999.
Percent
School enrollment
53 53
13
37 40
22
37 36
24
0
10
20
30
40
50
60
70
80
90
100
Connection to the Internet from home
Expenses paid
Release time
1,000 or more300 to 999Less than 300
89
Chapter 6
Barriers to Teachers’ Use of Technology
Highlights
• In 1999, the barriers to the use of computer and the Internet for instruction most frequentlyreported by public school teachers were not enough computers, lack of release time for teach-ers to learn how to use computers or the Internet, and lack of time in schedule for students touse computers in class. Among the barriers most frequently reported by teachers to be “great”barriers to their use of computers or the Internet for instruction were not enough computersand lack of release time for teachers to learn how to use computers or the Internet.
• Teachers’ perceptions of barriers to technology use varied by a number of teacher and schoolcharacteristics. For example, secondary teachers, teachers in large schools, and teachers incity schools were more likely than elementary teachers, teachers in small schools, and teachersin rural schools, respectively, to report that not enough computers was a great barrier. Ad-ditionally, elementary teachers were more likely to report the lack of time in the schedulefor students to use computers in class as a great barrier than secondary teachers. Further-more, teachers with more years of experience were generally more likely than less experi-enced teachers to cite the lack of release time to learn, practice, or plan ways to use comput-ers or the Internet as a great barrier.
• Generally, teachers who perceived lacking computers and time for students to use computersas great barriers were less likely than those who did not perceive these conditions as barriers toassign students to use computers or the Internet for some instructional activities.
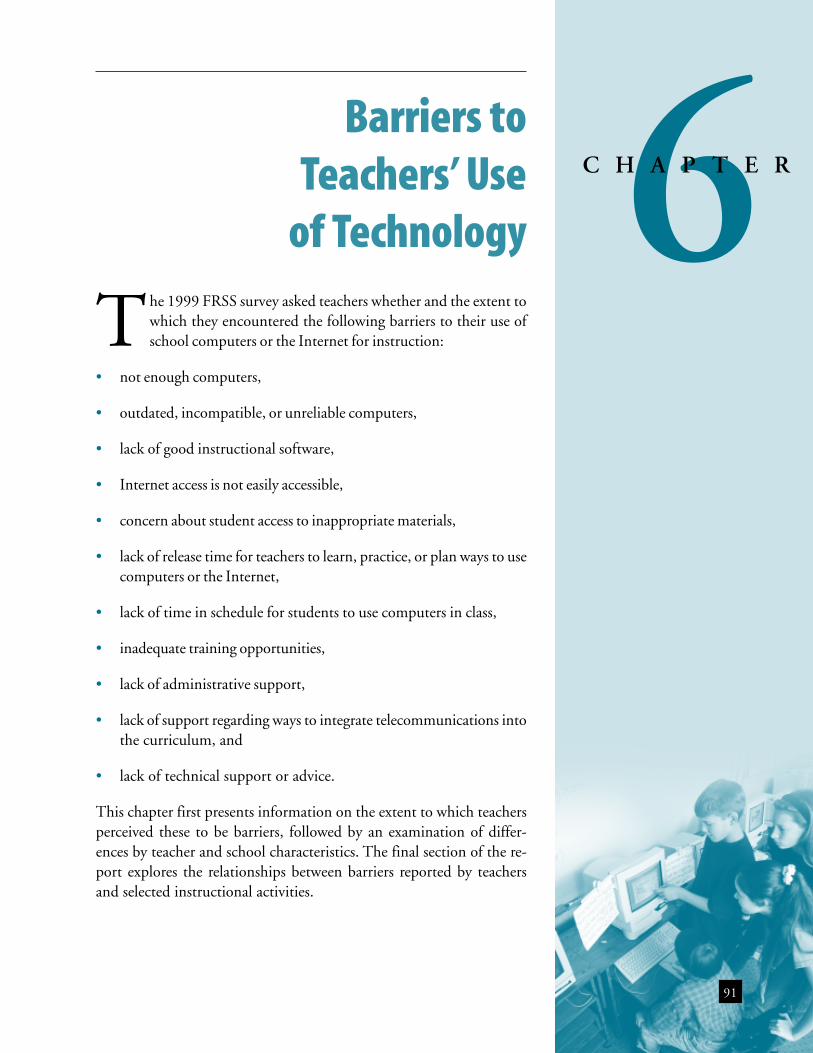
6C H A P T E R
91
Barriers toTeachers’ Use
of Technology
The 1999 FRSS survey asked teachers whether and the extent towhich they encountered the following barriers to their use ofschool computers or the Internet for instruction:
• not enough computers,
• outdated, incompatible, or unreliable computers,
• lack of good instructional software,
• Internet access is not easily accessible,
• concern about student access to inappropriate materials,
• lack of release time for teachers to learn, practice, or plan ways to usecomputers or the Internet,
• lack of time in schedule for students to use computers in class,
• inadequate training opportunities,
• lack of administrative support,
• lack of support regarding ways to integrate telecommunications intothe curriculum, and
• lack of technical support or advice.
This chapter first presents information on the extent to which teachersperceived these to be barriers, followed by an examination of differ-ences by teacher and school characteristics. The final section of the re-port explores the relationships between barriers reported by teachersand selected instructional activities.
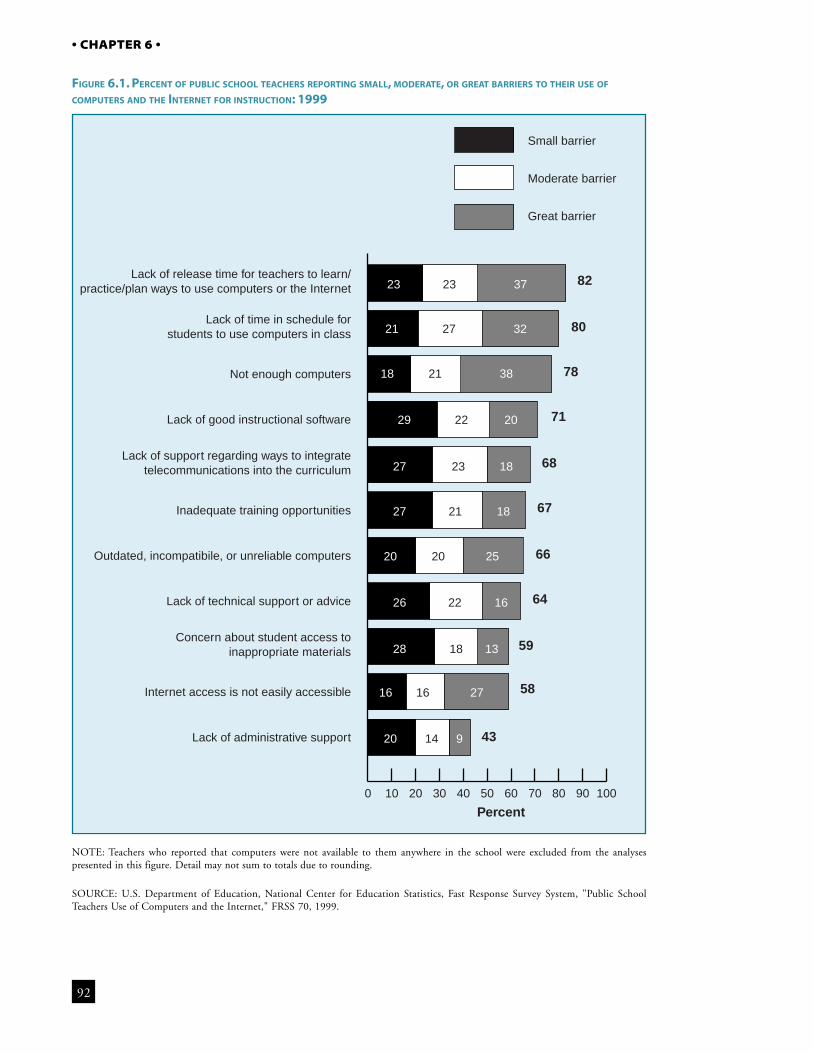
92
• CHAPTER 6 •
FIGURE 6.1. PERCENT OF PUBLIC SCHOOL TEACHERS REPORTING SMALL, MODERATE, OR GREAT BARRIERS TO THEIR USE OF
COMPUTERS AND THE INTERNET FOR INSTRUCTION: 1999
NOTE: Teachers who reported that computers were not available to them anywhere in the school were excluded from the analysespresented in this figure. Detail may not sum to totals due to rounding.
SOURCE: U.S. Department of Education, National Center for Education Statistics, Fast Response Survey System, "Public SchoolTeachers Use of Computers and the Internet," FRSS 70, 1999.
Percent
82
80
78
71
68
67
66
64
59
58
43
0 10 20 30 40 50 60 70 80 90 100
Small barrier
Moderate barrier
Great barrier
Lack of administrative support
Internet access is not easily accessible
Concern about student access toinappropriate materials
Lack of technical support or advice
Outdated, incompatibile, or unreliable computers
Inadequate training opportunities
Lack of support regarding ways to integratetelecommunications into the curriculum
Lack of good instructional software
Not enough computers
Lack of time in schedule forstudents to use computers in class
Lack of release time for teachers to learn/practice/plan ways to use computers or the Internet 23
21
18
29
27
27
20
26
28
16
20 14 9
16 27
18 13
22 16
20 25
21 18
23 18
22 20
21 38
27 32
23 37
93
• BARRIERS TO TEACHERS’ USE OF TECHNOLOGY •
Barriers to Technology Use
In 1999, the barriers to the use of computer and the Internet for instruction most frequentlyreported by public school teachers were insufficient numbers of computers, lack of release timefor teachers to learn how to use computers or the Internet, and lack of time in schedule forstudents to use computers in class (78 percent, 82 percent, and 80 percent of teachers, respec-tively—figure 6.1). In addition, 71 percent reported the lack of good instructional software,and 58 percent of teachers reported difficult Internet access as barriers. Furthermore, approxi-mately two-thirds of all teachers reported the lack of adequate equipment, training opportuni-ties, technical support or advice, and support regarding ways to integrate telecommunicationsinto the curriculum as barriers (66 percent, 67 percent, 64 percent, and 68 percent, respec-tively). Fifty-nine percent also reported that a concern about student access to inappropriatematerials was a barrier. Lack of administrative support was least likely to be reported as a barrier(43 percent). Among the barriers most frequently reported by teachers to be “great” barriers totheir use of computers or the Internet for instruction in 1999 were not enough computers, lackof release time for teachers to learn how to use computers or the Internet, and lack of time instudents’ schedule to use technology (38 percent, 37 percent, and 32 percent, respectively).
Differences in Teachers’ Reports of Great Barriers
Availability of and Access to Computers and the Internet
In order for teachers to integrate technology into their instruction, technology must be avail-able and accessible to them. This section examines barriers to teachers’ use of technology thatinvolve availability of and access to computers and the Internet. More specifically, it looks atdifferences in teachers’ reports of the lack of computers, lack of adequate computers, and diffi-culty accessing the Internet (38 percent, 25 percent, and 27 percent of teachers, respectively,reported these to be great barriers to their use of technology for instruction).
Teachers’ reports that not having enough computers was a great barrier varied by instructionallevel, school size, and school location (table 6.1). Secondary teachers were more likely thanelementary teachers to indicate that not having enough computers was a great barrier (43percent compared with 36 percent). In addition, teachers in schools with 300 or more studentswere more likely than teachers in schools with fewer than 300 students to report that nothaving enough computers was a great barrier (38 percent and 46 percent, compared with 25percent). Moreover, teachers in city schools were more likely than those in rural schools toreport that not enough computers was a great barrier (43 percent compared with 31 percent).
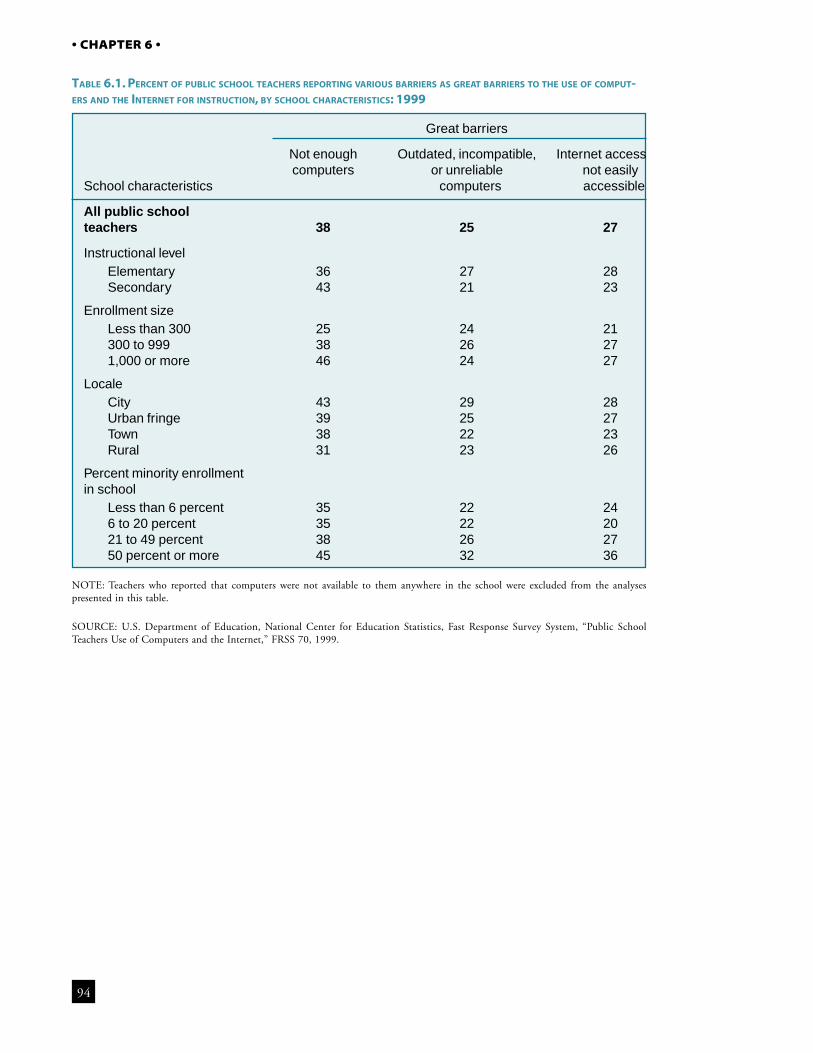
94
• CHAPTER 6 •
TABLE 6.1. PERCENT OF PUBLIC SCHOOL TEACHERS REPORTING VARIOUS BARRIERS AS GREAT BARRIERS TO THE USE OF COMPUT-ERS AND THE INTERNET FOR INSTRUCTION, BY SCHOOL CHARACTERISTICS: 1999
NOTE: Teachers who reported that computers were not available to them anywhere in the school were excluded from the analysespresented in this table.
SOURCE: U.S. Department of Education, National Center for Education Statistics, Fast Response Survey System, “Public SchoolTeachers Use of Computers and the Internet,” FRSS 70, 1999.
Great barriers
Not enough Outdated, incompatible, Internet accesscomputers or unreliable not easily
School characteristics computers accessible
All public schoolteachers 38 25 27
Instructional levelElementary 36 27 28Secondary 43 21 23
Enrollment sizeLess than 300 25 24 21300 to 999 38 26 271,000 or more 46 24 27
LocaleCity 43 29 28Urban fringe 39 25 27Town 38 22 23Rural 31 23 26
Percent minority enrollmentin school
Less than 6 percent 35 22 246 to 20 percent 35 22 2021 to 49 percent 38 26 2750 percent or more 45 32 36
95
• BARRIERS TO TEACHERS’ USE OF TECHNOLOGY •
There were also differences in teachers’ reports of outdated, incompatible, or unreliable com-puters being a barrier. For example, elementary teachers were more likely to report that this wasa great barrier than secondary teachers (27 percent compared with 21 percent). Additionally,teachers in schools with more than 50 percent minority enrollments were more likely to citeoutdated, incompatible, or unreliable computers as a great barrier than teachers in schools withless than 6 percent minority enrollments (32 percent compared with 22 percent).
Similar differences were found for not having easy Internet access as a barrier. Elementaryteachers cited this barrier more frequently than secondary teachers (28 percent compared with23 percent). Additionally, teachers in schools with more than 50 percent minority enrollmentswere more likely to report not having easy Internet access as a great barrier than teachers inschools with less than 6 percent minority enrollments and 6 to 20 percent minority enroll-ments (36 percent compared with 24 percent and 20 percent, respectively).
Lack of Time
Among the greatest barriers to the use of technology in instruction reported was lack of time.The section examines two types of time limitations. The first is the lack of release time forteachers to learn, practice, or plan ways to use computers or the Internet for instruction. Thesecond is the lack of time in the schedule for students to use computers and the Internet inclass.
Although teachers’ reports of lack of training opportunities did not differ significantly by teacheror school characteristics (table A-6.3), release time did (figure 6.2). Specifically, teachers withmore years of teaching experience (10 to 19 years and 20 or more years of experience) weremore likely than teachers with the least experience (3 or fewer years) to report that a lack ofrelease time was a great barrier (41 percent and 39 percent, compared with 25 percent). Addi-tionally, elementary teachers were more likely than secondary teachers to report a lack of timein the schedule for students to use computers and the Internet in class as a great barrier (34percent compared with 28 percent—table A-6.3).
Institutional and Technical Support for Using Technology
This section examines teachers’ perceptions of the lack of administrative and technical support,as well as lack of support regarding ways to integrate computers and the Internet into thecurriculum as barriers to their use of computers and the Internet for instruction.
The lack of administrative support as a great barrier varied by years of teaching experience.Specifically, teachers with 10 to 19 years of experience cited this as a great barrier more fre-quently than teachers with 20 or more years of experience (13 percent compared with 7 per-cent—table A-6.3). There were also differences in teachers’ reports of the lack of support re-garding ways to integrate telecommunications into the curriculum as a great barrier by minor-ity enrollments. That is, 24 percent of teachers in schools with 50 percent or more minority
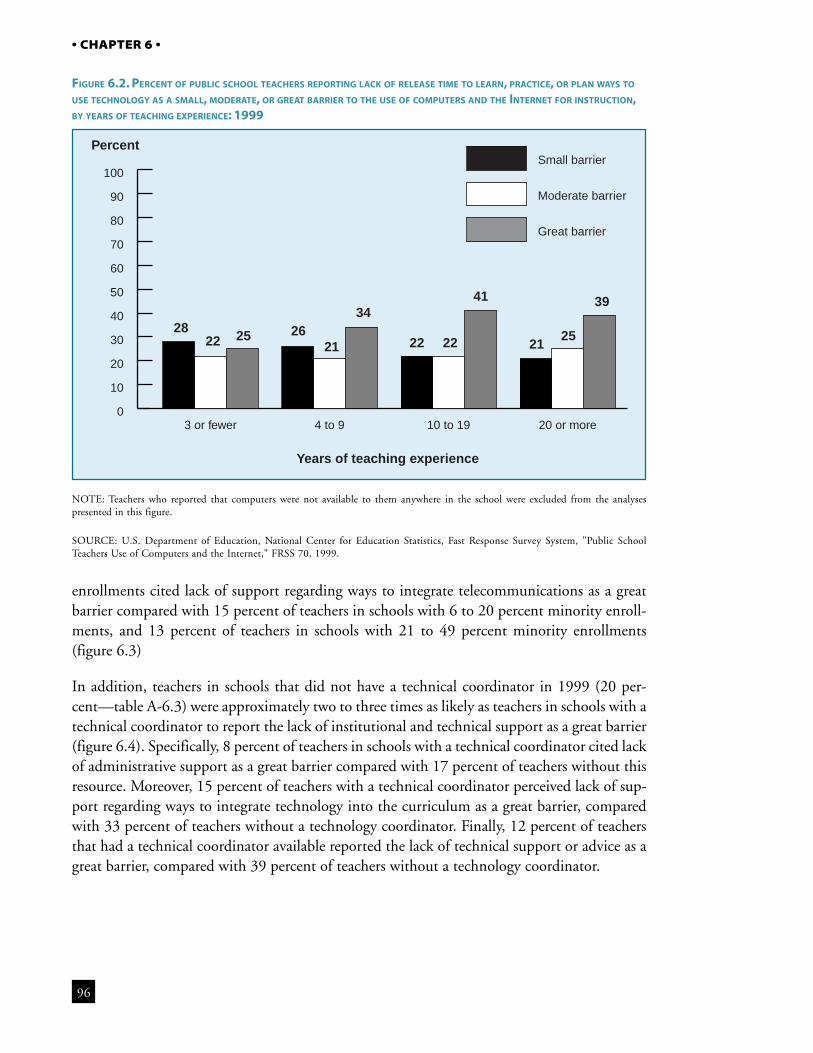
96
• CHAPTER 6 •
enrollments cited lack of support regarding ways to integrate telecommunications as a greatbarrier compared with 15 percent of teachers in schools with 6 to 20 percent minority enroll-ments, and 13 percent of teachers in schools with 21 to 49 percent minority enrollments(figure 6.3)
In addition, teachers in schools that did not have a technical coordinator in 1999 (20 per-cent—table A-6.3) were approximately two to three times as likely as teachers in schools with atechnical coordinator to report the lack of institutional and technical support as a great barrier(figure 6.4). Specifically, 8 percent of teachers in schools with a technical coordinator cited lackof administrative support as a great barrier compared with 17 percent of teachers without thisresource. Moreover, 15 percent of teachers with a technical coordinator perceived lack of sup-port regarding ways to integrate technology into the curriculum as a great barrier, comparedwith 33 percent of teachers without a technology coordinator. Finally, 12 percent of teachersthat had a technical coordinator available reported the lack of technical support or advice as agreat barrier, compared with 39 percent of teachers without a technology coordinator.
FIGURE 6.2. PERCENT OF PUBLIC SCHOOL TEACHERS REPORTING LACK OF RELEASE TIME TO LEARN, PRACTICE, OR PLAN WAYS TO
USE TECHNOLOGY AS A SMALL, MODERATE, OR GREAT BARRIER TO THE USE OF COMPUTERS AND THE INTERNET FOR INSTRUCTION,BY YEARS OF TEACHING EXPERIENCE: 1999
NOTE: Teachers who reported that computers were not available to them anywhere in the school were excluded from the analysespresented in this figure.
SOURCE: U.S. Department of Education, National Center for Education Statistics, Fast Response Survey System, "Public SchoolTeachers Use of Computers and the Internet," FRSS 70, 1999.
Percent
Years of teaching experience
2822 25 26
21
34
22 22
41
2125
39
0
10
20
30
40
50
60
70
80
90
100Small barrier
Moderate barrier
Great barrier
20 or more10 to 194 to 93 or fewer
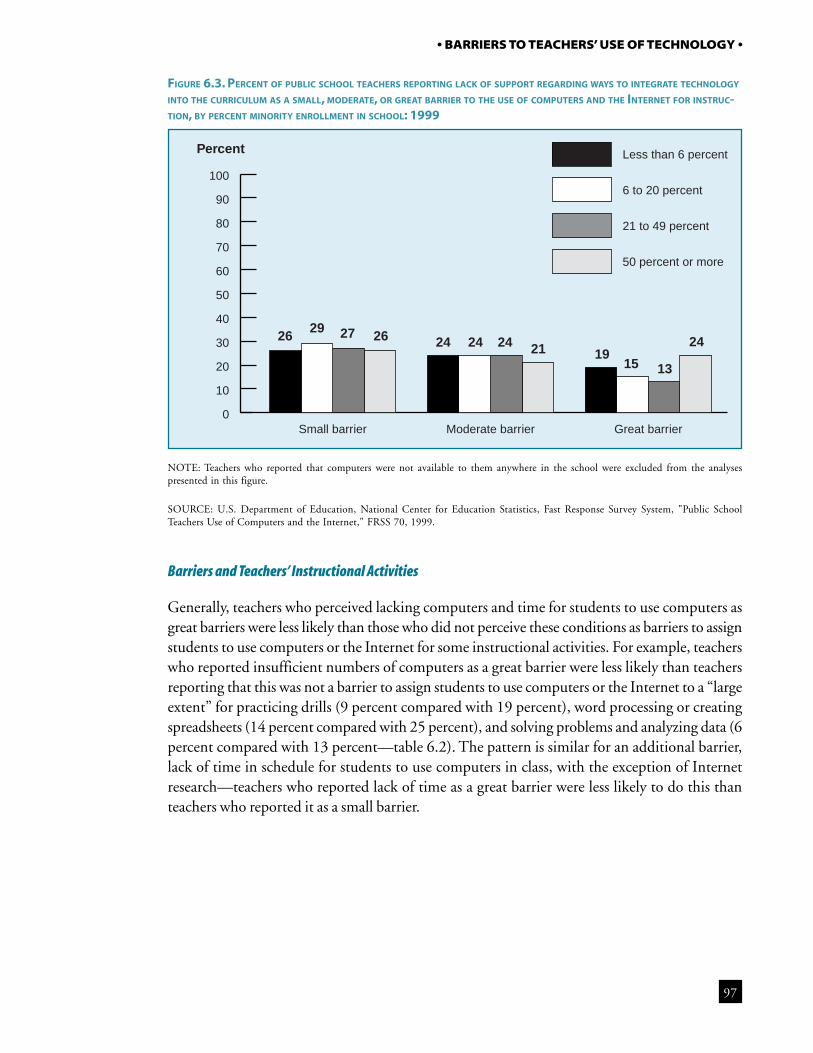
97
• BARRIERS TO TEACHERS’ USE OF TECHNOLOGY •
FIGURE 6.3. PERCENT OF PUBLIC SCHOOL TEACHERS REPORTING LACK OF SUPPORT REGARDING WAYS TO INTEGRATE TECHNOLOGY
INTO THE CURRICULUM AS A SMALL, MODERATE, OR GREAT BARRIER TO THE USE OF COMPUTERS AND THE INTERNET FOR INSTRUC-TION, BY PERCENT MINORITY ENROLLMENT IN SCHOOL: 1999
NOTE: Teachers who reported that computers were not available to them anywhere in the school were excluded from the analysespresented in this figure.
SOURCE: U.S. Department of Education, National Center for Education Statistics, Fast Response Survey System, "Public SchoolTeachers Use of Computers and the Internet," FRSS 70, 1999.
Percent
2629 27 26 24 24 24 21 19
15 13
24
0
10
20
30
40
50
60
70
80
90
100
Less than 6 percent
6 to 20 percent
21 to 49 percent
50 percent or more
Great barrierModerate barrierSmall barrier
Barriers and Teachers’ Instructional Activities
Generally, teachers who perceived lacking computers and time for students to use computers asgreat barriers were less likely than those who did not perceive these conditions as barriers to assignstudents to use computers or the Internet for some instructional activities. For example, teacherswho reported insufficient numbers of computers as a great barrier were less likely than teachersreporting that this was not a barrier to assign students to use computers or the Internet to a “largeextent” for practicing drills (9 percent compared with 19 percent), word processing or creatingspreadsheets (14 percent compared with 25 percent), and solving problems and analyzing data (6percent compared with 13 percent—table 6.2). The pattern is similar for an additional barrier,lack of time in schedule for students to use computers in class, with the exception of Internetresearch—teachers who reported lack of time as a great barrier were less likely to do this thanteachers who reported it as a small barrier.
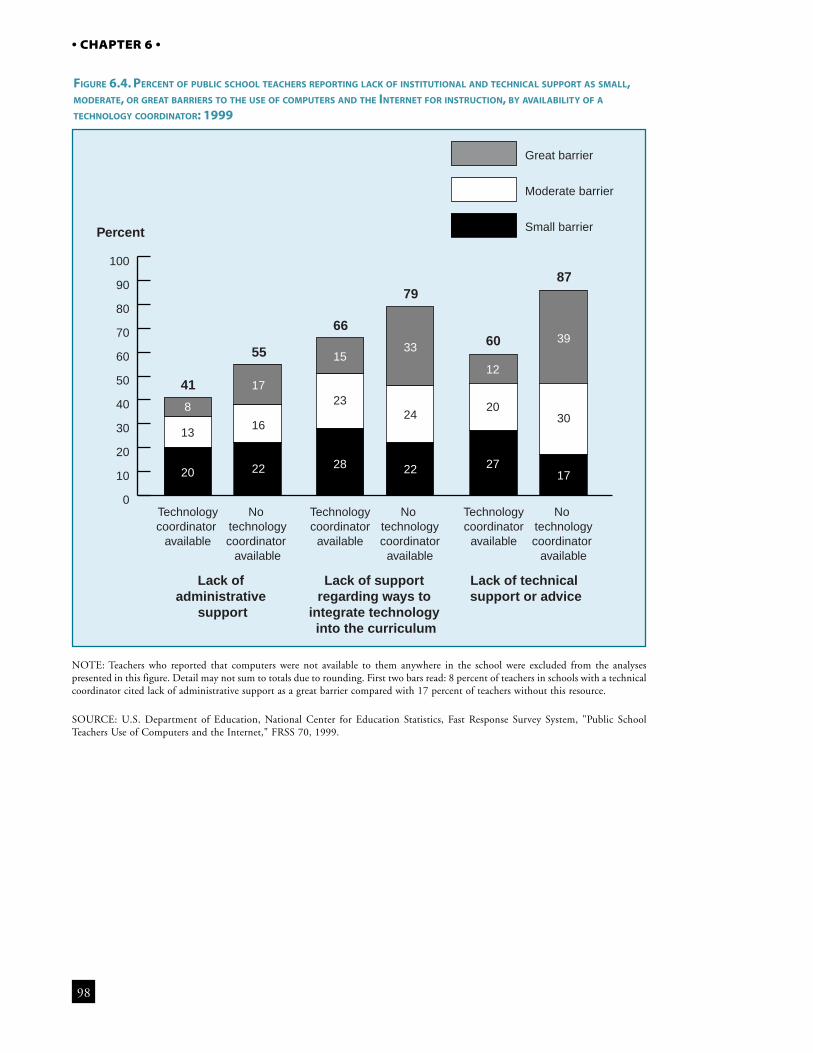
98
• CHAPTER 6 •
0
10
20
30
40
50
60
70
80
90
100
Great barrier
Moderate barrier
Small barrier
No technologycoordinator
available
Technologycoordinator
available
No technologycoordinator
available
Technologycoordinator
available
No technologycoordinator
available
Technologycoordinator
available
Percent
Lack of administrative
support
Lack of support regarding ways to
integrate technology into the curriculum
Lack of technical support or advice
41
55
66
79
60
87
8
17
1533
12
39
30
17
20
27
24
22
23
28
16
22
13
20
FIGURE 6.4. PERCENT OF PUBLIC SCHOOL TEACHERS REPORTING LACK OF INSTITUTIONAL AND TECHNICAL SUPPORT AS SMALL,MODERATE, OR GREAT BARRIERS TO THE USE OF COMPUTERS AND THE INTERNET FOR INSTRUCTION, BY AVAILABILITY OF ATECHNOLOGY COORDINATOR: 1999
NOTE: Teachers who reported that computers were not available to them anywhere in the school were excluded from the analysespresented in this figure. Detail may not sum to totals due to rounding. First two bars read: 8 percent of teachers in schools with a technicalcoordinator cited lack of administrative support as a great barrier compared with 17 percent of teachers without this resource.
SOURCE: U.S. Department of Education, National Center for Education Statistics, Fast Response Survey System, "Public SchoolTeachers Use of Computers and the Internet," FRSS 70, 1999.
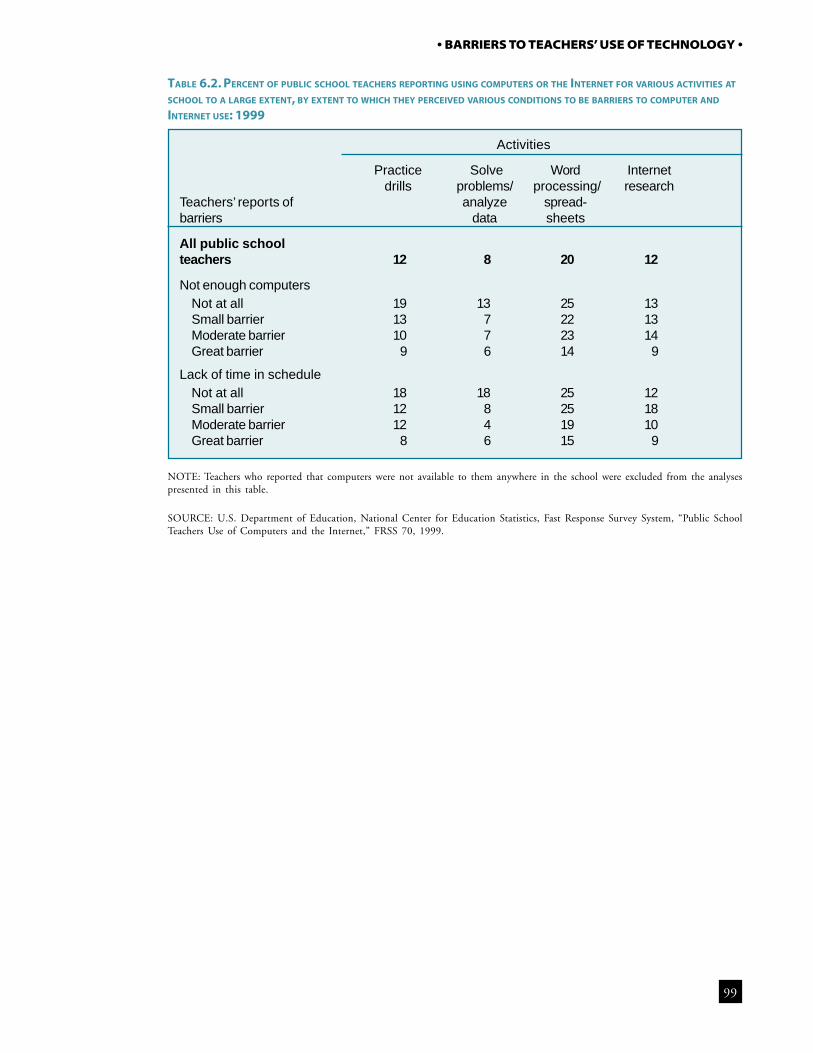
99
• BARRIERS TO TEACHERS’ USE OF TECHNOLOGY •
TABLE 6.2. PERCENT OF PUBLIC SCHOOL TEACHERS REPORTING USING COMPUTERS OR THE INTERNET FOR VARIOUS ACTIVITIES AT
SCHOOL TO A LARGE EXTENT, BY EXTENT TO WHICH THEY PERCEIVED VARIOUS CONDITIONS TO BE BARRIERS TO COMPUTER AND
INTERNET USE: 1999
NOTE: Teachers who reported that computers were not available to them anywhere in the school were excluded from the analysespresented in this table.
SOURCE: U.S. Department of Education, National Center for Education Statistics, Fast Response Survey System, “Public SchoolTeachers Use of Computers and the Internet,” FRSS 70, 1999.
Activities
Practice Solve Word Internetdrills problems/ processing/ research
Teachers’ reports of analyze spread-barriers data sheets
All public schoolteachers 12 8 20 12
Not enough computersNot at all 19 13 25 13Small barrier 13 7 22 13Moderate barrier 10 7 23 14Great barrier 9 6 14 9
Lack of time in scheduleNot at all 18 18 25 12Small barrier 12 8 25 18Moderate barrier 12 4 19 10Great barrier 8 6 15 9
7C H A P T E R
101
ConclusionsTeacher Use of Technology
The research literature on education technology has typically fo-cused on the availability of technology in the nation’s publicschools and classrooms and reported that the availability has
grown substantially. However, there is much less research on whether,how frequently, and in what manner these technologies are being used.The research that does exist suggests that as availability has grown, so hasthe number of students and teachers using computers and the frequencywith which they use them (Levin et al., 1998). According to the litera-ture, however, the advent of computers and the Internet has not dramati-cally changed how teachers teach and how students learn. Computershave typically been used for traditional methods of teaching (e.g., drilland practice and computer education—Becker, 1983; Becker, 1984); al-though the more recent data suggest that some teachers are using tech-nology in more innovative ways (e.g., solve problems, conduct research—Becker, 1999; Fulton, 1997).
The most recent data on teachers’ technology use, provided by the 1999FRSS teacher survey, indicate that approximately half of all public schoolteachers used computers or the Internet for classroom instruction in 1999.And teachers’ use of technology can be characterized as reflecting a mix-ture of traditional and innovative teaching methods. For example, teach-ers using computers for instruction assigned students to use computersor the Internet for practicing drills and word processing or creating spread-sheets frequently in 1999. However, they also frequently assigned stu-dents to use computers and the Internet for research and solving prob-lems and analyzing data.
In addition to classroom instruction, the 1999 survey indicates that teachersalso used computers to prepare for instruction and to communicate withothers. Specifically, many teachers used computers or the Internet to con-duct a number of preparatory and administrative tasks (e.g., creating in-structional materials, gathering information for planning lessons) andcommunicative (e.g., communication with colleagues) tasks. However,
102
• CHAPTER 7 •
teachers used these technologies less frequently for such tasks as accessing research, best practicesexamples, and model lesson plans, as well as communicating with parents and students.
Teachers’ use of computers or the Internet for instructional purposes was related to their trainingand preparation and work environments. As described in more detailed below, teachers weremore likely to use these technologies when the technologies were available to them, available intheir classrooms as opposed to computer labs, and available in greater numbers. Moreover,teachers who reported feeling better prepared were more likely to use these technologies thantheir less prepared colleagues. (Teachers who spent more time in professional development re-ported feeling better prepared than their colleagues.) Finally, teachers who perceived lackingcomputers and time for students to use computers as great barriers were less likely than theircolleagues to assign students to use computers or the Internet for some instructional activities.
Teachers’ Training and Preparation
Research on teacher training and preparation for technology use often focuses on professionaldevelopment opportunities or pre-service training. Generally, traditional professional develop-ment activities have been criticized for lacking continuity and follow-up (Fullan with Stiegelbauer,1991), and pre-service training has been criticized as being fragmented and unconnected toreal classroom experiences (NCTAF, 1996). Despite these criticisms, 88 percent of teachersindicated that professional development activities prepared them to some extent to use tech-nology, and 84 percent of teachers with 3 or fewer years of teaching experience indicated thatcollege/graduate work prepared them to some extent to use technology. However, a relativelysmall proportion of teachers indicated that these sources prepared them to a “large extent.”
Results presented in this report also indicate that professional development and teachers’ feel-ings of preparation are related. Specifically, teachers who spent more time in professional devel-opment activities on technology use indicated that they felt better prepared to use technologyfor classroom instruction than those who spent less time in these activities. Furthermore, teacherswho reported that they felt better prepared to use technology were more likely to use it thanteachers who reported feeling less prepared. However, these findings are descriptive and notcausal in nature. For example, results presented in this paragraph may suggest that if teachersspend more time in professional development activities, their feeling of preparedness will in-crease. On the other hand, these findings may also suggest that teachers who feel more pre-pared to use technology tend to seek out more opportunities to learn about this topic.
Teachers’ Work Environment
As described in the introductory chapter, teachers’ ability and willingness to use computers andthe Internet may depend, to some extent, on the schools and classrooms in which they work.On the most basic level, for example, teachers may be more likely to integrate computers andthe Internet into classroom instruction if they have access to adequate equipment and connec-tions and if they have time to learn about these technologies and use them in their classrooms.
103
• CONCLUSIONS •
With respect to the availability of and access to technology, the findings presented in this reportindicate that both have grown dramatically over the past decade. A majority of classrooms have atleast one computer, many of these computers have Internet connections, and a large number ofteachers and students have these technologies available at home as well. In addition, nearly allteachers with such technology available to them used the computers and the Internet connectionsin their schools, and most reported that their students used computers and the Internet in theschool as well.
Despite high levels of availability and use, however, many teachers reported facing a number ofbarriers to the use of technology in their schools. The barriers to the use of computer and theInternet for instruction most frequently reported by public school teachers were insufficientnumbers of computers, lack of release time for teachers to learn how to use computers or theInternet, and lack of time in schedule for students to use computers in class. In fact, while it istrue that most schools now have computers and the Internet available somewhere in theirschools, this availability is still somewhat limited in the classroom; among teachers who re-ported having any computers in their classrooms, it was most common to have one computer.With one classroom computer, teachers may have the technology they need to prepare forlessons and use computers for demonstrative purposes during classroom instruction; however,it may be difficult to have students use computers under these conditions. Indeed, teacherswho did not use computers or the Internet were more likely to report insufficient numbers ofcomputers and lack of time as great barriers than teachers who used these technologies. Addi-tionally, teachers with more computers in their classrooms generally used technology for in-structional purposes more frequently. These findings are descriptive and not causal. For ex-ample, teachers may be more inclined to use computers once they are placed in their class-rooms. On the other hand, teachers who are more inclined to use computers may actively seekto acquire them for their classrooms.
Teacher and School Characteristics
Years of Teaching Experience
As discussed in the introductory chapter of this report, there are a number of factors thatcontribute to the success or failure of instructional reforms, including the use of technology forclassroom instruction. One important factor is that teachers do not always have opportunitiesto learn about and practice instructional reforms. One way prospective teachers learn how touse computers is through their teacher preparation programs. And although some observershave argued that prospective teachers are not getting the training they need to successfullyintegrate technology into classroom instruction (President’s Committee of Advisors on Scienceand Technology, 1997), recent graduates of teacher preparation programs are more likely tohave received some instruction in technology use than teachers who graduated one or twodecades ago. In fact, teachers with fewer years of teaching experience were more likely thantheir more experienced colleagues to indicate that college/graduate work prepared them to usecomputers and the Internet. Indeed, less experienced teachers used technology (e.g., e-mail, the
104
• CHAPTER 7 •
Internet, computers) more frequently than their more experienced colleagues for a variety ofpurposes (e.g., to gather information for planning lessons, create instructional materials, accessresearch, best practices examples, model lesson plans).
On the other hand, practicing teachers often learn from professional development activities, andmay be more likely to learn about technology from such activities. As findings presented in thisreport indicate, more experienced teachers were more likely than their less experienced colleaguesto take advantage of the professional development activities on technology use that were availableto them. Despite their higher participation in professional development, however, more experi-enced teachers were less likely than less experienced teachers to indicate that they felt “well pre-pared” or “very well prepared” to use technology for classroom instruction.
Minority Enrollment and Poverty Concentration
Among teachers with technology available in their schools, teachers in low minority schools(less than 6 percent) and lower poverty schools (less than 11 percent) were generally more likelythan teachers in higher minority schools (50 percent or more minority enrollments) and higherpoverty schools (50 to 70 percent or 71 percent or more students eligible for free or reduced-price lunch) to use computers or the Internet at school for a wide range of activities, includingcreating instructional materials, communicating with colleagues, and instructing students. Fea-tures of these schools may provide a context for understanding these findings. For example,teachers in high minority schools were less likely than those in some lower minority schools tohave computers (77 percent of teachers in schools with minority enrollments of 50 percent ormore compared with 89 percent of teachers in schools with minority enrollments of 21 to 49percent) or the Internet (69 percent of teachers in schools with minority enrollments of lessthan 6 percent and 71 percent of teachers in schools with minority enrollments of 6 to 20percent compared with 51 percent of teachers in schools with minority enrollments of 50percent or more) in their classrooms.
Furthermore, teachers in high minority schools were generally more likely than teachers in lowminority schools to cite a number of barriers to technology use, including outdated, incompat-ible, or unreliable computers, easy Internet access, and the lack of support regarding ways tointegrate telecommunications. In addition, teachers in high poverty schools generally had fewercomputers with Internet connections available in their classrooms or elsewhere in the schoolthan teachers in lower poverty schools. Moreover, teachers in high poverty and high minorityschools generally were less likely to report that training in Internet use was available to them.
Instructional Level
There were a number of differences between elementary and secondary teachers in their use oftechnology. For example, elementary teachers were more likely than secondary teachers to usetechnology for classroom instruction and to communicate with parents. In addition, elemen-tary teachers were more likely than secondary teachers to assign students to use computers or theInternet to practice drills and to solve problems and analyze data. On the other hand, secondary
105
• CONCLUSIONS •
teachers were more likely than elementary teachers to use computers or the Internet for adminis-trative record keeping, to communicate with students, and to assign students to use these tech-nologies to conduct Internet research. Furthermore, elementary teachers were more likely thansecondary teachers to assign projects using the computer inside the classroom, whereas, secondaryteachers were more likely than elementary teachers to assign projects using the computer outsideof the classroom. Elementary teachers were also more likely than secondary teachers to reportthat their students used computers at school; however, secondary teachers were more likely thanelementary teachers to report that their students used the Internet at school.
Features of elementary and secondary teachers’ schools may provide a context for these differ-ences. For example, secondary teachers may have reported that their students used computersinside the classroom less often than elementary teachers because secondary teachers were lesslikely to have computers in their classrooms and had fewer classroom computers than elemen-tary teachers. In fact, secondary teachers were more likely than elementary teachers to indicatethat insufficient numbers of computers was a great barrier to use of computers or the Internetfor instruction. On the other hand, secondary teachers may have reported that their studentsused the Internet more often than elementary teachers because secondary teachers were morelikely than elementary teachers to have the Internet available on the computers that they didhave in their classrooms, and they were also more likely to have Internet availability elsewherein the school. In fact, elementary teachers cited not having easy Internet access as a barrier morefrequently than secondary teachers.
New Directions
Although the findings presented in this report provide important information about a topic—teachers’ use of advanced education technology—that has not been well documented previ-ously, they do not address many emerging policy issues, including the following policy ques-tions:
• How does the use of computers, the Internet and other applications by teachers and studentsaffect student performance, knowledge, and skills?
• What is the impact of computer and Internet use on the way teachers teach and studentslearn, and what is the impact, more broadly, on educational reform?
• How does the investment in technology compare with other educational innovations, suchas smaller classes or individualized instruction, in terms of costs and benefits?
In addition to the questions listed above, fruitful topics for future research include thefollowing:
• updated information on the types of technologies that are available in schools (e.g., quality/speed, types of Internet connections, software applications);
106
• CHAPTER 7 •
• organizational changes to schools that will enable the increased use of technology (e.g., ad-ministrative efficiency, home-school connections, collegial communication) or thesustainability of technology implementation and use;
• fiscal expenditures on educational technology at the school, district, state, and especiallynational levels;
• professional development and technical support strategies for enhancing teachers’ effectiveuse of technology;
• in-depth understanding of the duration and types of technology uses for teaching andlearning both inside and outside of the school (e.g., subject specific uses);
• the effects of different types of technology applications on particular types of students (e.g.,limited English proficient, special education, gifted and talented).
New NCES Data Sources for Education Technology Issues
Throughout 1999 and 2000, a number of NCES surveys were collecting a wide range of infor-mation on the use of education technology. These data may fill in some of the gaps in theeducational technology literature and may provide more detail on topics addressed in the 1999FRSS teacher survey. For example, the 2000 FRSS school technology survey will provide themost recent data on the availability of computers and the Internet in public schools. Further-more, the 1999-2000 Schools and Staffing Survey (SASS), an extensive survey with a largesample of public, private, Bureau of Indian Affairs, and charter schools and detailed informa-tion on teachers’ characteristics and practices, includes a number of questions about technol-ogy. For example, SASS collected data in areas such as expenditures on computer hardware, thetypes of technology available in media centers, and school staffing for both technical supportand the integration of technology into the classroom for teaching and learning in 1999-2000.
The 2001 National Assessment of Educational Progress (NAEP) will be collecting detailed datain a number of new areas: the age and quality of school computers, schools’ participation incommunity programs and grant programs such as the E-rate, details of schools’ technologyplans, and student perceptions of their own technology skills. NAEP 2001 items also coversubject-specific student uses of technology, student attitudes about technology, and teacherratings of availability of technology, quality of technical support, and usefulness of computersin the classroom.
Finally, the Early Childhood Longitudinal Study (ECLS) collected data on technology at thekindergarten level. ECLS 1998-99 items inquired about the number of computers in schools,the perceived adequacy and physical condition of computer labs, the presence of technology inclassrooms, and kindergarten students’ use of technology. The ECLS will collect longitudinaldata on student achievement and teacher practices, which may be used to link these measuresto various items related to technology.
107
References
American Council on Education. (1995). Computers, technology, and people with disabilities.Washington, DC: American Council on Education.
Anderson, R.E., and Ronnkvist, A. (1999). The presence of computers in American schools. Irvine,CA: Center for Research on Information Technology and Organizations, University ofCalifornia, Irvine.
Allen, N., Kline, D., and Zelenal, C. (1997). The NAEP 1994 technical report (NCES 97-897).U.S. Department of Education. Washington, DC: National Center for Education Sta-tistics.
Ballator, Nada. (1997). The NAEP guide: A description of the content and methods of the 1994and 1996 Assessments (NCES 97-586). U.S. Department of Education. Washington,DC: National Center for Education Statistics.
Ball, D. L. (1990). “Reflections and deflections of policy: The case of Carol Turner.” Educa-tional Evaluation and Policy Analysis, 12(3), 263-275.
Bare, J., and Meek, A. (1998). Internet access in public schools (NCES 98-031). U.S. Depart-ment of Education. Washington, DC: National Center for Education Statistics.
Becker, H. J. (1983). “School uses of microcomputers: Report #1 from a national survey.”Journal of Computers in Mathematics and Science Teaching, 3(2), 29-33.
Becker, H. J. (1985). How schools use microcomputers: Summary of the first national survey. Bal-timore, MD: Center for Social Organization of Schools, Johns Hopkins University.
Becker, H. J. (1986). Instructional uses of school computers. Reports from the 1985 National Sur-vey. Issue No. 3. Baltimore, MD: Johns Hopkins University, Center for Social Organiza-tion of Schools.
Becker, H. J. (1990a). Effects of computer use on mathematics achievement. Findings from anationwide field experiment in grades five to eight. Classes: Rationale, study design, andaggregate effect sizes (Report No. 51). Baltimore, MD: Center for Research on Elemen-tary and Middle Schools.
Becker, H. J. (1990b). When powerful tools meet conventional beliefs and institutional constraints:National survey findings on computer use by American teachers. (Report No. 49). Balti-more, MD: Center for Research on Elementary and Middle Schools.
Becker, H. J. (1991). “When powerful tools meet conventional beliefs and institutional con-straints.” The Computing Teacher, 18(8), 6-9.
108
Becker, H. J. (1994). Analysis and trends of school use of new information technologies. Irvine, CA:University of California, Irvine. Department of Education.
Becker, H. J. (1998). “Running to catch a moving train: Schools and informationtechnologies.”Theory Into Practice, 37(1), 20-30.
Becker, H. J. (1999). Internet use by teachers: Conditions of professional use and teacher-directedstudent use. Irvine, CA: Center for Research on Information Technology and Organiza-tions, University of California, Irvine, and the University of Minnesota.
Becker, H. J., Ravitz, J. L., and Wong, Y. (1999). Teacher and teacher-directed student use ofcomputers and software. Irvine, CA: Center for Research on Information Technologyand Organizations, University of California, Irvine, and the University of Minnesota.
Byrom, E. (1998). Factors influencing the effective use of technology for teaching and learning:Lessons learned from the SEIRTEC intensive site schools. Greensboro, NC: SERVE, Inc.
Calderone, J., Horkay, N. and King, L.M. (1997). The NAEP guide: A description of the contentand methods of the 1997 and 1998 Assessments (NCES 97-990). U.S. Department ofEducation. Washington, DC: National Center for Education Statistics.
Carpenter, J. (1996). E.D.TAB: Advanced telecommunications in U.S. public elementary andsecondary schools, 1995 (NCES 96-854). U.S. Department of Education. Washington,DC: National Center for Education Statistics.
CEO Forum on Education and Technology. (2000). The power of learning: Integrating digitalcontent. Washington, DC: Author.
Clark, R. E. (1994). “Media will never influence learning.” Educational Technology Researchand Development, 42(2), 21-29.
Cohen, D. K. (1990). “A revolution in one classroom: The case of Mrs. Oublier.” EducationalEvaluation and Policy Analysis, 12(3), 327-345.
Coley, R., Cradler, J., and Engel, P. K. (1997). Computers and classrooms: The status of technologyin U.S. schools. Policy information report. Princeton, NJ: Educational Testing Service.
Dunn, O. J. (1961). “Multiple Comparisons Among Means.” Journal of the American StatisticalAssociation, 56: 52–64.
Fullan, M. with Steigelbauer, S. (1991). The new meaning of educational change. New York:Teachers College Press.
Fulton, K. (1997). Learning in a digital age: Insights into the issues: The skills students need fortechnological fluency. Santa Monica, CA: Milken Exchange on Educational Technology.
109
Glennan, T. K. and Melmed, A. (1996). Fostering the use of educational technology: Elements of anational strategy. Santa Monica, CA: RAND.
Gorman, Steve. (1994). The 1992 NAEP Technical Report for the National Assessment (NCES94-490). U.S. Department of Education. Washington, DC: National Center for Edu-cation Statistics.
Heaviside, S., Farris, E., and Malitz, G. (1995). E.D.TAB: Advanced telecommunications in U.S.public schools, K-12 (NCES 95-731). U.S. Department of Education. Washington, DC:National Center for Education Statistics.
Heaviside, S., Farris, E., and Riggins, T. (1997). Statistics in brief: Advanced telecommunicationsin U.S. public elementary and secondary schools, Fall 1996 (NCES 97-944). U.S. De-partment of Education. Washington, DC: National Center for Education Statistics.
Kozma, R. B. and Croninger, R. G. (1992). Technology and the fate of at-risk students. Educa-tion and Urban Society, 24(4), 440-453.
Levin, D., Stephens, M., Kirshstein, R., and Birman, B. (1998). Toward assessing the effectivenessof using technology in K-12 education. U.S. Department of Education. Washington,DC: Office of Educational Research and Improvement.
Lewis, L., Parsad, B., Carey, N., Bartfai, N., Farris, E., and Smerdon, B. (1999). Teacher quality:A report on the preparation and qualifications of public school teachers (NCES 1999-080).U.S. Department of Education. Washington, DC: National Center for Education Sta-tistics.
Mann, D., Shakeshaft, C., Becker, J., and Kottkamp, R. (1999). West Virginia story: Achieve-ment gains from a statewide comprehensive instructional technology program. Santa Monica,CA: Milken Exchange on Education Technology.
McLaughlin, M. W. and Oberman, I. (Eds.). (1996). Teacher learning: New policies and prac-tices. New York: Teachers College Press.
Means, B. and Olson, K. (1995). Technology’s role in education reform: Findings from a nationalstudy of innovating schools (Contract No. RR 9117010). U.S. Department of Educa-tion. Washington, DC: Office of Educational Research and Improvement.
Moursund, D. and Bielefeldt, T. (1999). Will new teachers be prepared to teach in a digital age? Anational survey on information technology in teacher education. Santa Monica, CA: MilkenExchange on Education Technology and the International Society for Technology inEducation.
National Commission on Teaching and America’s Future. (1996). What matters most: Teachingfor America’s future. New York: Author.
110
Peterson, P. L. (1990). “Doing more in the same amount of time: Cathy Swift.” EducationalEvaluation and Policy Analysis, 12(3), 277-296.
Phillips, G., and Johnson, E. (1991). NAEP: Technical Summary Report (NCES 91-1051). U.S.Department of Education. Washington, DC: National Center for Education Statistics.
Piele, P. K. (1990). “The politics of technology utilization,” in D. E. Mitchell and M. E. Goertz(Eds.), Education politics for the new century: The twentieth anniversary yearbook of thePolitics of Education Association (pp. 93-106). New York: The Falmer Press.
President’s Committee of Advisors on Science and Technology. (1997). Report to the Presidenton the use of technology to strengthen K-12 education in the United States. Washington,DC: Author.
Rowand, C. (1999). Internet access in public schools: 1994-1998 (NCES 99-017). U.S. Depart-ment of Education. Washington, DC: National Center for Education Statistics.
Snyder, T., and Wirt, J. (1998). The Condition of Education 1998 (NCES 98-013). U.S. De-partment of Education. Washington, DC: National Center for Education Statistics.
Software and Information Industry Association. (2000). 2000 report on the effectiveness of tech-nology in schools: Executive summary. Washington, DC: Author.
Sprinthall, N. A., Reiman, A. J., and Theis-Sprinthall, L. (1996). “Teacher professional devel-opment,” in J. P. Sikula, T. J. Buttery, and E. Guyton (Eds.), Handbook of research onteacher education (pp. 666-703). New York: Simon & Schuster Macmillan.
Sutton, R. E. (1991). “Equity and computers in the schools: A decade of research.” Review ofEducational Research, 61(4), 475-503.
Trotter, A. (1999). “Preparing teachers for the digital age.” Education Week, 19, 37-43.
U.S. Congress, Office of Technology Assessment. (1995). Teachers and technology: Making theconnection (OTA-EHR-616). Washington, DC: U.S. Government Printing Office.
U.S. Department of Education, National Center for Education Statistics, A Note from the ChiefStatistician, No. 2, 1993.
U.S. Department of Education, Office of Educational Research and Improvement. (1993).Using technology to support education reform (Contract No. RR91172010). B. Means, J.Blando, K. Olson, T. Middleton, C.C. Morocco, A.R. Remz, and J. Zorfass. Washing-ton, DC.
U.S. Department of Education. (1996). Getting America’s students ready for the 21st Century:Meeting the technology literacy challenge. A report to the Nation on technology and educa-tion. Washington, DC: Author.
111
U.S. Department of Education. (2000). Educational technology programs at the U.S. Depart-ment of Education. Washington DC: Author.
Williams, C. (2000). Internet access in public schools: 1994-1999 (NCES 2000-086). U.S.Department of Education. Washington, DC: National Center for Education Statistics.
Wenglinsky, H. (1998). Does it compute? The relationship between educational technology andstudent achievement in mathematics (Policy Information Report). Princeton: Educational
����������
������� ��������������������������������������
����� �� �����
������ ����� ������ ��� ���� ������ �� �������
����� ����
������ ����� ����� �� �� � �� � �� ������ ������ � ��� �� ��� ��� ������ �� �� ������ �� �� ��� � ������ ���� ������ �� �� �� �� � � � ����� �� � ��� �� ������ � �� ��� ��� ������� �������� ���� ������ � � ��� � ������� �������� � �����������������������������������������������������������������������
������ ����� ����� �� �� � �� � �� ������ ������ � ��� �� ��� ��� ������ �� �� ������ �� �� ��� � ������ ���� ������ �� �� �� �� � � � ����� �� � ��� �� ������ � �� ��� � ��� ������� �������� ���� ������ � � ��� � ������� �������� � ����������������������������������������������������������������������!
����!� ����� ����� �� �� � �� � �� ������ ������ � ��� �� ��� ��� ������ �� �� ������ � ������ �� �� ������ �� �� �� �� � � ������������ ���� ����� ��� � �� ������ � � ��� � ������� ��������� �����������������������������������������������������������������������������������������������������������������������������������������"
����#� ����� ����� �� �� � �� � �� ������ ������ � ��� �� ��� ��� ������ �� �� ������ ������� ��� �� �� � ������� �������� � ���������� �� �� �� �� � � �� �� $� �� �� ������ � � ��� �������� �������� � ��������������������������������������������������������������������������������������������������������������%
����" ����� ����� ��� �� ����� � � ��� ��� �� ���� � ���� � ������ � �� &'�� � � (�)* � �� � #� � %� � + ��������������������������������������������+
��!��� ����� ����� �� �� � �� � �� ������ ������ � ��� �� � ������������ � ������������ � �� ��������� � �� �� � � ������� �������� ������� �������� � ���������������������������������������������������������������������������������������������������
��!��� ����� ����� �� �� � �� � �� ������ ������ � ��� �� � ������������ ��� �� �� ������ �� �������� � �� ���������� �� ������������� �������� � ����������������������������������������������������������������������������������������������������������������
��!�!� ����� ����� �� �� � �� � �� ������ ������ � ��� �� � �������� � � ������������ � �� ��������� � �� �� � � ������� �������� ������� �������� � ��������������������������������������������������������������������������������������������������!
��!�#� ����� ����� �� �� � �� � �� ������ ������ � ��� �� � ������������ ��� �� �� ������ �� � �� ��������� ���� �� � ��� ������ �� ������ ������� �������� � ��������������������������������������������������������������������#
��!�"� ����� ����� �� �� � �� � �� ������ ������ � ��� �� ����� ������������� �� �� � �� ������� �� ������ ������� �������� � �������������������������������������������"
��!�%� ����� ����� �� �� � �� � �� ������ ������ � ��� �� ����������� �� � �� �� � � �������� �� �� � �� ��� � � �� � �� � �� � ��� �� ����� � ������ ����, ���� �� � �� ��� ������ ��� � �� ������ ������� �������� � ����������������������������������������������������������������������%
��!�-� ����� ����� �� �� � �� � �� ������ ������ � ��� �� � ������ ������� ��� ". � �� � �� �� �� ��� �� ��� ������ �� �� ��� � �������� ������� �������� � ��������������������������������������������������������������������������������������������������-
��!�+� ����� ����� �� �� � �� � �� ������ ������ � ��� �� �� ��� ��� ������ �� �������� � ��������� ��� � ���� ������ � �� ��������������� � �� � ������ �� ��� � �� ���� $� �� �� �� �� ���� � ���������������������������������+
��!� ����� ����� ��� �� ����� � � ��� ��� �� ���� � ���� � ������ � !� &'�� � / (�)* � .� � #� � +/ 0*� � #� � -�� +������������������������������������������������������������������������������������������������������������������������������������������
��#��� ����� ����� �� �� � �� � �� ������ ������ � ��� �� � ���������� ����� �� ������ �� � ���� $� � �� �������� � �� ������������� �������� � ���������������������������������������������������������������������������������������������������������������!
��#��� ����� ����� �� �� � �� � �� ������ ������ � ��� �� � ��������� � �� �� �� �� � � �� �� $� � � �� ���������� ������ ������ � �� � � ��� �� ������� � ���� ����� ��� � �� ������������� �������� � ���������������������������������������������������������������������������������������������������������������#
��#�! ����� ����� ��� �� ����� � � ��� ��� �� ���� � ���� � ������ � #� &'�� � / (�)* � �� � #� � %� � � +/ 0*� � -� � + ����������������������������������������������������������������������������������������������������������������������������������"
��"��� ����� ����� �� �� � �� � �� ������ ������ � ��� �� � ���������� ������ �� �� �� �� � � ��� ������� �������� � �� ������ ���� $� �� �� $� � �� ����� �� � � �� �� ��� �� �� ������ ��� �� �� � � ��� ���������� � �������������������������������������������������������������������������������!.
��"��� ����� ����� �� �� � �� � �� ������ ������ � ��� �� � ������������� ��� �� ������� �������� � �� �� $� � ���� �� ������ ���� �� �� � �� �� $� � �� ����� �� � � �� �� ��� �� �� ������ �� � �� �� � � ��� ���������� � �����������������������������������������������������������!�
��"�!� ����� ����� �� �� � �� � �� ������ ������ � ��� �� � ������������������ � �������� ������ ��������� �� � ��� �� � ����� $� �� � � � ��������������������������������������������������������������������������������������������������������������������!�
��"�#� ����� ����� �� �� � �� � �� ������ ������ � ��� �� � ������� ��� �� ��� �� ������� $� �� �� �� ������ �� � �� �� � ���� ���������� �� ����� �� � � ���� ������ � ���� �� � �����������������������������!!
��"�" ����� ����� ��� �� ����� � � ��� ��� �� ���� � ���� � �0���� � "� &'�� � ����������������������������������������������������������������������������������������������������������!#
��%��� ����� ����� �� �� � �� � �� ������ ������ � ��� �� � ������������� ����� �� �� �� �� ����� �� �� �� �� �� ������ �� � �� �� � � ��� ���������� �� ������ ������� �������� � ������������������������������������������������!-
��%��� ����� ����� �� �� � �� � �� ������ ������ � ��� �� � ���������� ������ �� �� �� �� � � ��� ������� �������� � �� ������ �� ����� $� �� �� $� � �� ����� �� � � �� �� ������� ��������� � ����� �� �� ������ � � �� � � �� � � ����������������������������������������������������������!+
��%�! ����� ����� ��� �� ����� � � ��� ��� �� ���� � ���� � ������ � %� &'�� � �����������������������������������������������������������������������������������������������������������!
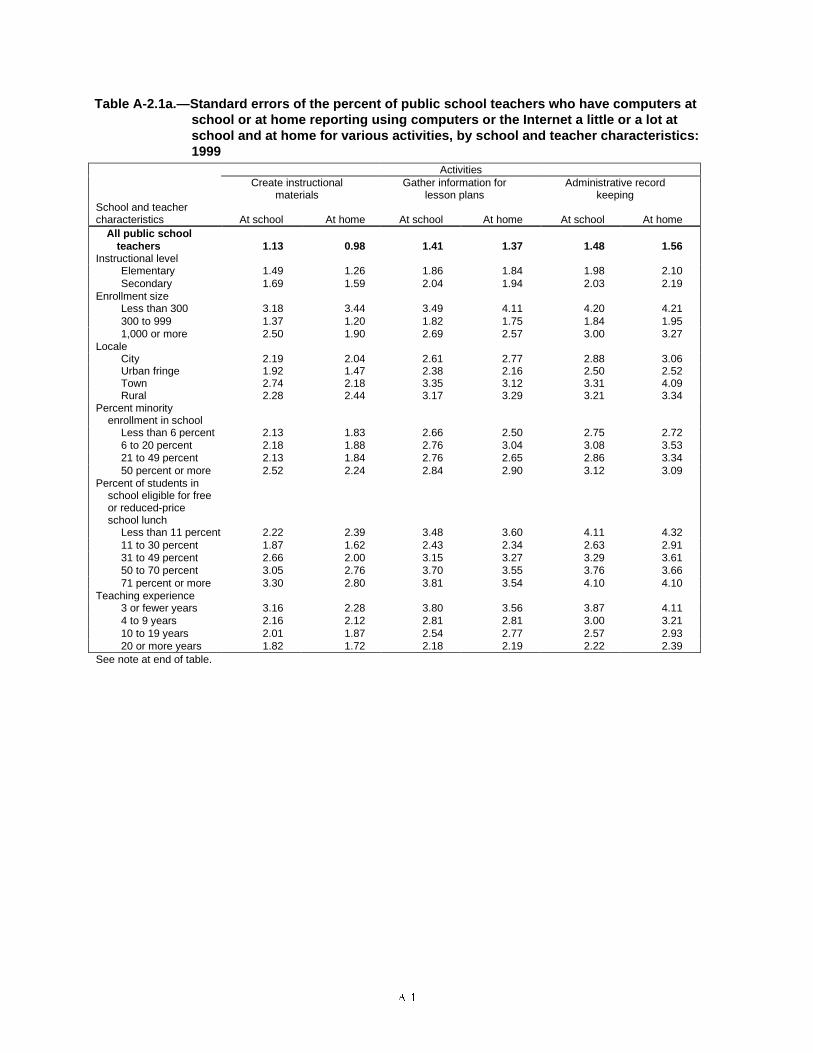
���
Table A-2.1a.—Standard errors of the percent of public school teachers who have computers atschool or at home reporting using computers or the Internet a little or a lot atschool and at home for various activities, by school and teacher characteristics:1999
ActivitiesCreate instructional
materialsGather information for
lesson plansAdministrative record
keepingSchool and teachercharacteristics At school At home At school At home At school At home
All public schoolteachers 1.13 0.98 1.41 1.37 1.48 1.56
Instructional levelElementary 1.49 1.26 1.86 1.84 1.98 2.10Secondary 1.69 1.59 2.04 1.94 2.03 2.19
Enrollment sizeLess than 300 3.18 3.44 3.49 4.11 4.20 4.21300 to 999 1.37 1.20 1.82 1.75 1.84 1.951,000 or more 2.50 1.90 2.69 2.57 3.00 3.27
LocaleCity 2.19 2.04 2.61 2.77 2.88 3.06Urban fringe 1.92 1.47 2.38 2.16 2.50 2.52Town 2.74 2.18 3.35 3.12 3.31 4.09Rural 2.28 2.44 3.17 3.29 3.21 3.34
Percent minorityenrollment in school
Less than 6 percent 2.13 1.83 2.66 2.50 2.75 2.726 to 20 percent 2.18 1.88 2.76 3.04 3.08 3.5321 to 49 percent 2.13 1.84 2.76 2.65 2.86 3.3450 percent or more 2.52 2.24 2.84 2.90 3.12 3.09
Percent of students inschool eligible for freeor reduced-priceschool lunch
Less than 11 percent 2.22 2.39 3.48 3.60 4.11 4.3211 to 30 percent 1.87 1.62 2.43 2.34 2.63 2.9131 to 49 percent 2.66 2.00 3.15 3.27 3.29 3.6150 to 70 percent 3.05 2.76 3.70 3.55 3.76 3.6671 percent or more 3.30 2.80 3.81 3.54 4.10 4.10
Teaching experience3 or fewer years 3.16 2.28 3.80 3.56 3.87 4.114 to 9 years 2.16 2.12 2.81 2.81 3.00 3.2110 to 19 years 2.01 1.87 2.54 2.77 2.57 2.9320 or more years 1.82 1.72 2.18 2.19 2.22 2.39
See note at end of table.
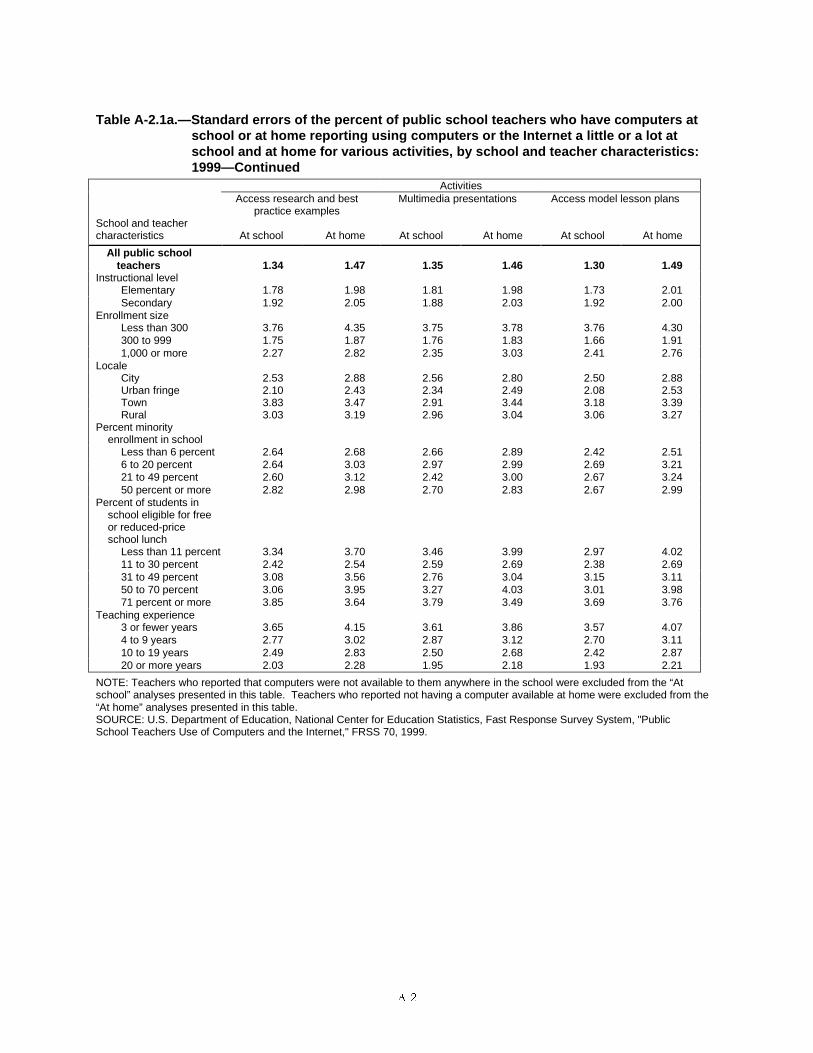
���
Table A-2.1a.—Standard errors of the percent of public school teachers who have computers atschool or at home reporting using computers or the Internet a little or a lot atschool and at home for various activities, by school and teacher characteristics:1999—Continued
ActivitiesAccess research and best
practice examplesMultimedia presentations Access model lesson plans
School and teachercharacteristics At school At home At school At home At school At home
All public schoolteachers 1.34 1.47 1.35 1.46 1.30 1.49
Instructional levelElementary 1.78 1.98 1.81 1.98 1.73 2.01Secondary 1.92 2.05 1.88 2.03 1.92 2.00
Enrollment sizeLess than 300 3.76 4.35 3.75 3.78 3.76 4.30300 to 999 1.75 1.87 1.76 1.83 1.66 1.911,000 or more 2.27 2.82 2.35 3.03 2.41 2.76
LocaleCity 2.53 2.88 2.56 2.80 2.50 2.88Urban fringe 2.10 2.43 2.34 2.49 2.08 2.53Town 3.83 3.47 2.91 3.44 3.18 3.39Rural 3.03 3.19 2.96 3.04 3.06 3.27
Percent minorityenrollment in school
Less than 6 percent 2.64 2.68 2.66 2.89 2.42 2.516 to 20 percent 2.64 3.03 2.97 2.99 2.69 3.2121 to 49 percent 2.60 3.12 2.42 3.00 2.67 3.2450 percent or more 2.82 2.98 2.70 2.83 2.67 2.99
Percent of students inschool eligible for freeor reduced-priceschool lunch
Less than 11 percent 3.34 3.70 3.46 3.99 2.97 4.0211 to 30 percent 2.42 2.54 2.59 2.69 2.38 2.6931 to 49 percent 3.08 3.56 2.76 3.04 3.15 3.1150 to 70 percent 3.06 3.95 3.27 4.03 3.01 3.9871 percent or more 3.85 3.64 3.79 3.49 3.69 3.76
Teaching experience3 or fewer years 3.65 4.15 3.61 3.86 3.57 4.074 to 9 years 2.77 3.02 2.87 3.12 2.70 3.1110 to 19 years 2.49 2.83 2.50 2.68 2.42 2.8720 or more years 2.03 2.28 1.95 2.18 1.93 2.21
NOTE: Teachers who reported that computers were not available to them anywhere in the school were excluded from the “Atschool” analyses presented in this table. Teachers who reported not having a computer available at home were excluded from the“At home” analyses presented in this table.SOURCE: U.S. Department of Education, National Center for Education Statistics, Fast Response Survey System, "PublicSchool Teachers Use of Computers and the Internet," FRSS 70, 1999.
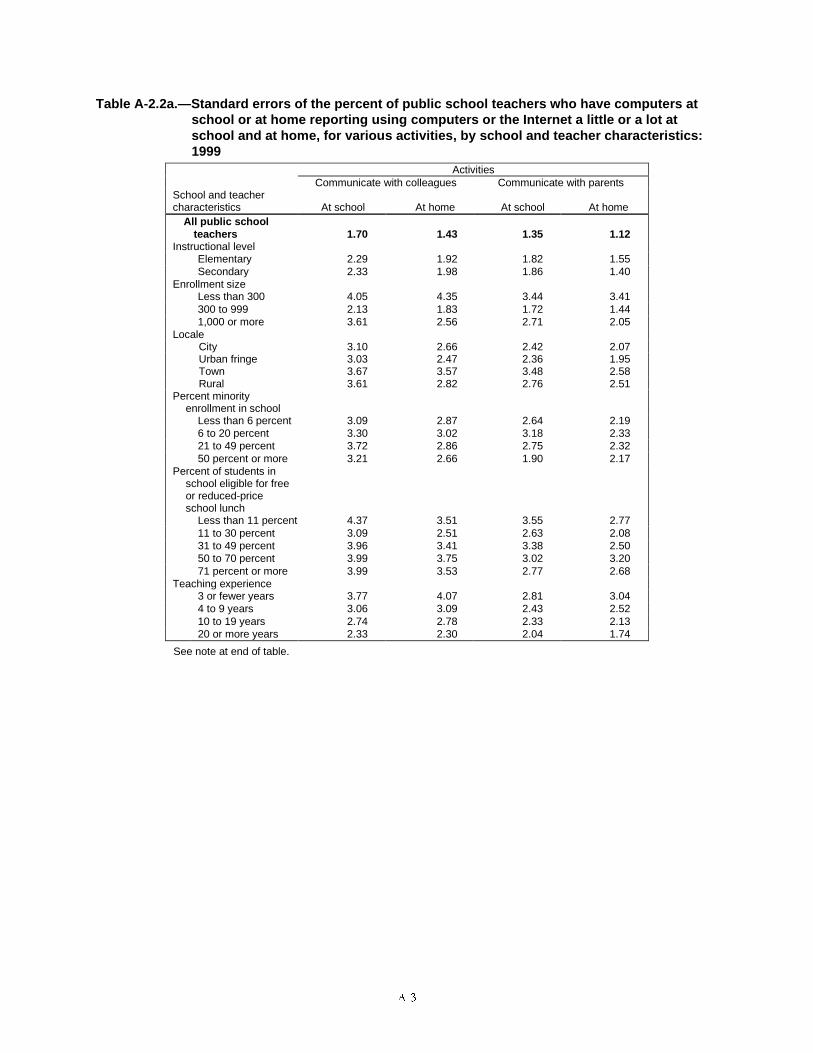
���
Table A-2.2a.—Standard errors of the percent of public school teachers who have computers atschool or at home reporting using computers or the Internet a little or a lot atschool and at home, for various activities, by school and teacher characteristics:1999
ActivitiesCommunicate with colleagues Communicate with parents
School and teachercharacteristics At school At home At school At home
All public schoolteachers 1.70 1.43 1.35 1.12
Instructional levelElementary 2.29 1.92 1.82 1.55Secondary 2.33 1.98 1.86 1.40
Enrollment sizeLess than 300 4.05 4.35 3.44 3.41300 to 999 2.13 1.83 1.72 1.441,000 or more 3.61 2.56 2.71 2.05
LocaleCity 3.10 2.66 2.42 2.07Urban fringe 3.03 2.47 2.36 1.95Town 3.67 3.57 3.48 2.58Rural 3.61 2.82 2.76 2.51
Percent minorityenrollment in school
Less than 6 percent 3.09 2.87 2.64 2.196 to 20 percent 3.30 3.02 3.18 2.3321 to 49 percent 3.72 2.86 2.75 2.3250 percent or more 3.21 2.66 1.90 2.17
Percent of students inschool eligible for freeor reduced-priceschool lunch
Less than 11 percent 4.37 3.51 3.55 2.7711 to 30 percent 3.09 2.51 2.63 2.0831 to 49 percent 3.96 3.41 3.38 2.5050 to 70 percent 3.99 3.75 3.02 3.2071 percent or more 3.99 3.53 2.77 2.68
Teaching experience3 or fewer years 3.77 4.07 2.81 3.044 to 9 years 3.06 3.09 2.43 2.5210 to 19 years 2.74 2.78 2.33 2.1320 or more years 2.33 2.30 2.04 1.74
See note at end of table.

���
Table A-2.2a.—Standard errors of the percent of public school teachers who have computers atschool or at home reporting using computers or the Internet a little or a lot atschool and at home, for various activities, by school and teacher characteristics:1999—Continued
ActivitiesPost homework/ assignments Communicate with students
School and teachercharacteristics At school At home At school At home
All public schoolteachers 0.99 0.99 0.84 1.00
Instructional levelElementary 1.29 1.32 1.06 1.30Secondary 1.58 1.42 1.43 1.61
Enrollment sizeLess than 300 2.26 2.16 1.92 2.69300 to 999 1.26 1.21 1.09 1.251,000 or more 2.02 2.16 1.65 2.11
LocaleCity 1.97 2.03 1.59 1.78Urban fringe 1.54 1.56 1.37 1.79Town 2.73 2.78 2.19 2.24Rural 2.21 2.02 1.89 2.19
Percent minorityenrollment in school
Less than 6 percent 1.97 1.83 1.68 1.816 to 20 percent 1.92 1.69 1.95 2.2921 to 49 percent 2.01 1.93 1.72 2.0650 percent or more 2.08 2.44 1.38 1.87
Percent of students inschool eligible for freeor reduced-priceschool lunch
Less than 11 percent 2.26 2.15 1.99 2.2611 to 30 percent 1.61 1.68 1.75 1.9931 to 49 percent 2.50 2.27 2.10 2.3250 to 70 percent 2.52 2.72 1.78 2.4571 percent or more 2.95 3.27 1.88 2.27
Teaching experience3 or fewer years 2.76 2.93 2.22 2.644 to 9 years 2.11 2.12 1.82 2.3410 to 19 years 2.06 1.72 1.57 1.8820 or more years 1.52 1.53 1.29 1.46
NOTE: Teachers who reported that computers were not available to them anywhere in the school were excluded from the “Atschool” analyses presented in this table. Teachers who reported not having a computer available at home were excluded from the“At home” analyses presented in this table.SOURCE: U.S. Department of Education, National Center for Education Statistics, Fast Response Survey System, "Public SchoolTeachers Use of Computers and the Internet," FRSS 70, 1999.
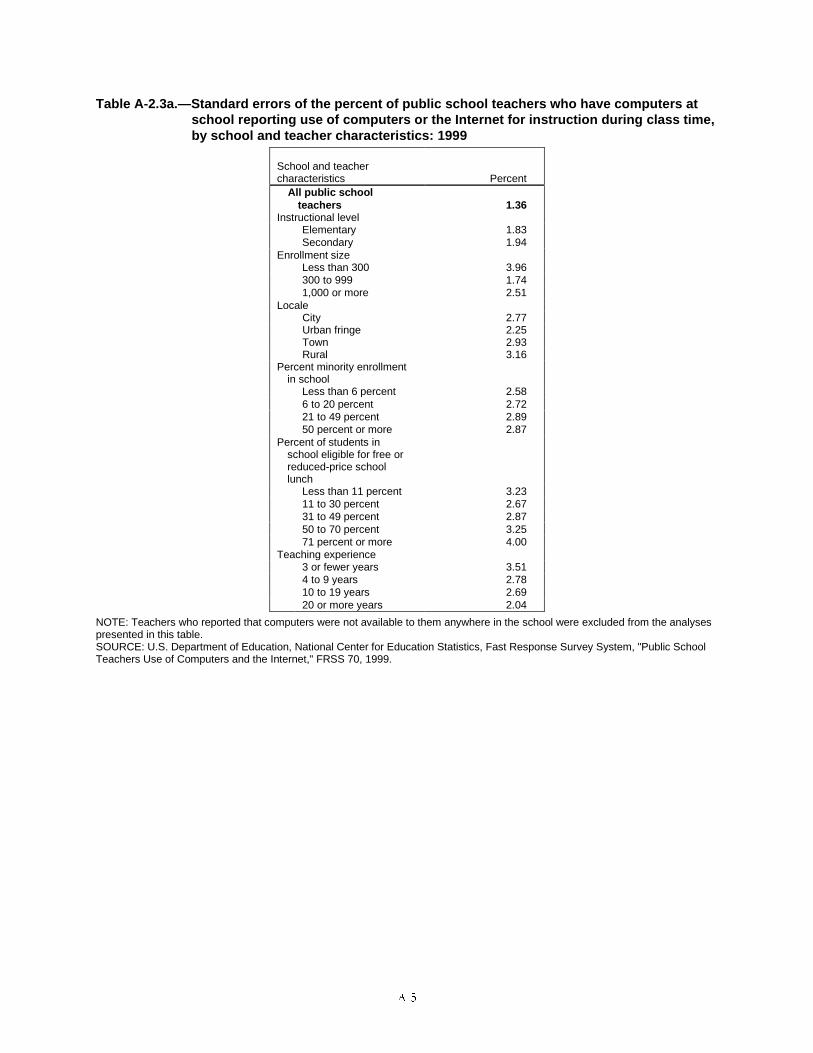
���
Table A-2.3a.—Standard errors of the percent of public school teachers who have computers atschool reporting use of computers or the Internet for instruction during class time,by school and teacher characteristics: 1999
School and teachercharacteristics Percent
All public schoolteachers 1.36
Instructional levelElementary 1.83Secondary 1.94
Enrollment sizeLess than 300 3.96300 to 999 1.741,000 or more 2.51
LocaleCity 2.77Urban fringe 2.25Town 2.93Rural 3.16
Percent minority enrollmentin school
Less than 6 percent 2.586 to 20 percent 2.7221 to 49 percent 2.8950 percent or more 2.87
Percent of students inschool eligible for free orreduced-price schoollunch
Less than 11 percent 3.2311 to 30 percent 2.6731 to 49 percent 2.8750 to 70 percent 3.2571 percent or more 4.00
Teaching experience3 or fewer years 3.514 to 9 years 2.7810 to 19 years 2.6920 or more years 2.04
NOTE: Teachers who reported that computers were not available to them anywhere in the school were excluded from the analysespresented in this table.SOURCE: U.S. Department of Education, National Center for Education Statistics, Fast Response Survey System, "Public SchoolTeachers Use of Computers and the Internet," FRSS 70, 1999.
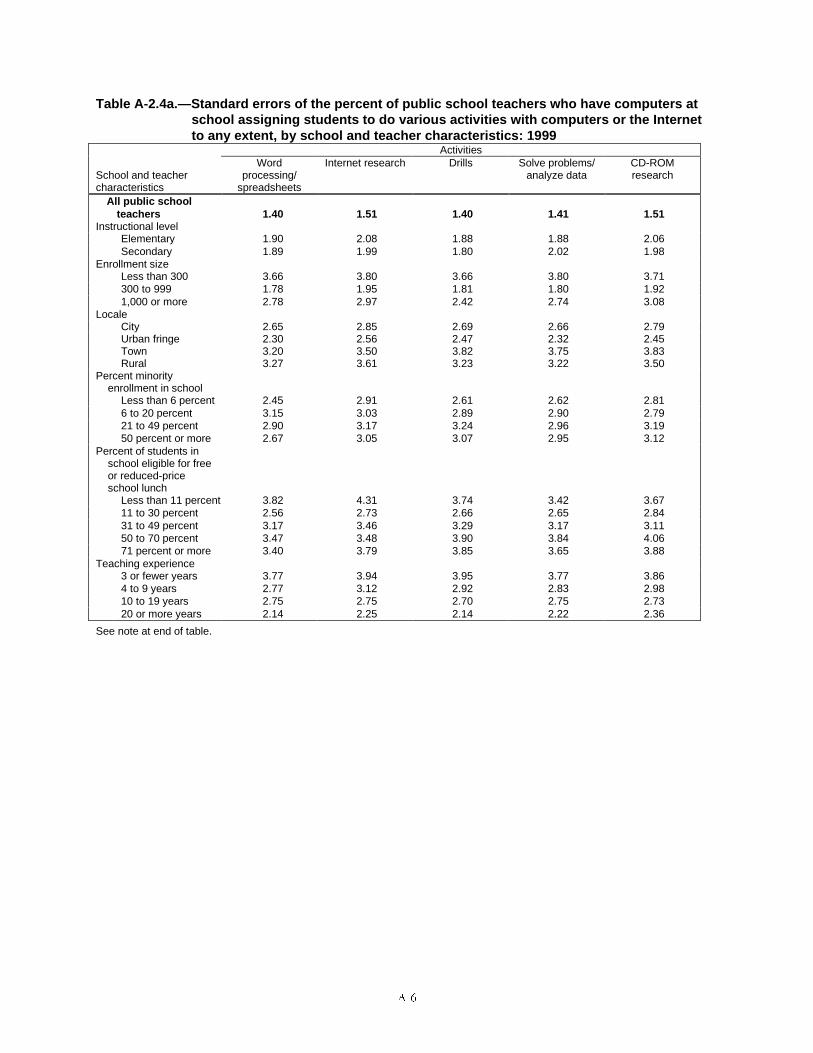
���
Table A-2.4a.—Standard errors of the percent of public school teachers who have computers atschool assigning students to do various activities with computers or the Internetto any extent, by school and teacher characteristics: 1999
Activities
School and teachercharacteristics
Wordprocessing/
spreadsheets
Internet research Drills Solve problems/analyze data
CD-ROMresearch
All public schoolteachers 1.40 1.51 1.40 1.41 1.51
Instructional levelElementary 1.90 2.08 1.88 1.88 2.06Secondary 1.89 1.99 1.80 2.02 1.98
Enrollment sizeLess than 300 3.66 3.80 3.66 3.80 3.71300 to 999 1.78 1.95 1.81 1.80 1.921,000 or more 2.78 2.97 2.42 2.74 3.08
LocaleCity 2.65 2.85 2.69 2.66 2.79Urban fringe 2.30 2.56 2.47 2.32 2.45Town 3.20 3.50 3.82 3.75 3.83Rural 3.27 3.61 3.23 3.22 3.50
Percent minorityenrollment in school
Less than 6 percent 2.45 2.91 2.61 2.62 2.816 to 20 percent 3.15 3.03 2.89 2.90 2.7921 to 49 percent 2.90 3.17 3.24 2.96 3.1950 percent or more 2.67 3.05 3.07 2.95 3.12
Percent of students inschool eligible for freeor reduced-priceschool lunch
Less than 11 percent 3.82 4.31 3.74 3.42 3.6711 to 30 percent 2.56 2.73 2.66 2.65 2.8431 to 49 percent 3.17 3.46 3.29 3.17 3.1150 to 70 percent 3.47 3.48 3.90 3.84 4.0671 percent or more 3.40 3.79 3.85 3.65 3.88
Teaching experience3 or fewer years 3.77 3.94 3.95 3.77 3.864 to 9 years 2.77 3.12 2.92 2.83 2.9810 to 19 years 2.75 2.75 2.70 2.75 2.7320 or more years 2.14 2.25 2.14 2.22 2.36
See note at end of table.
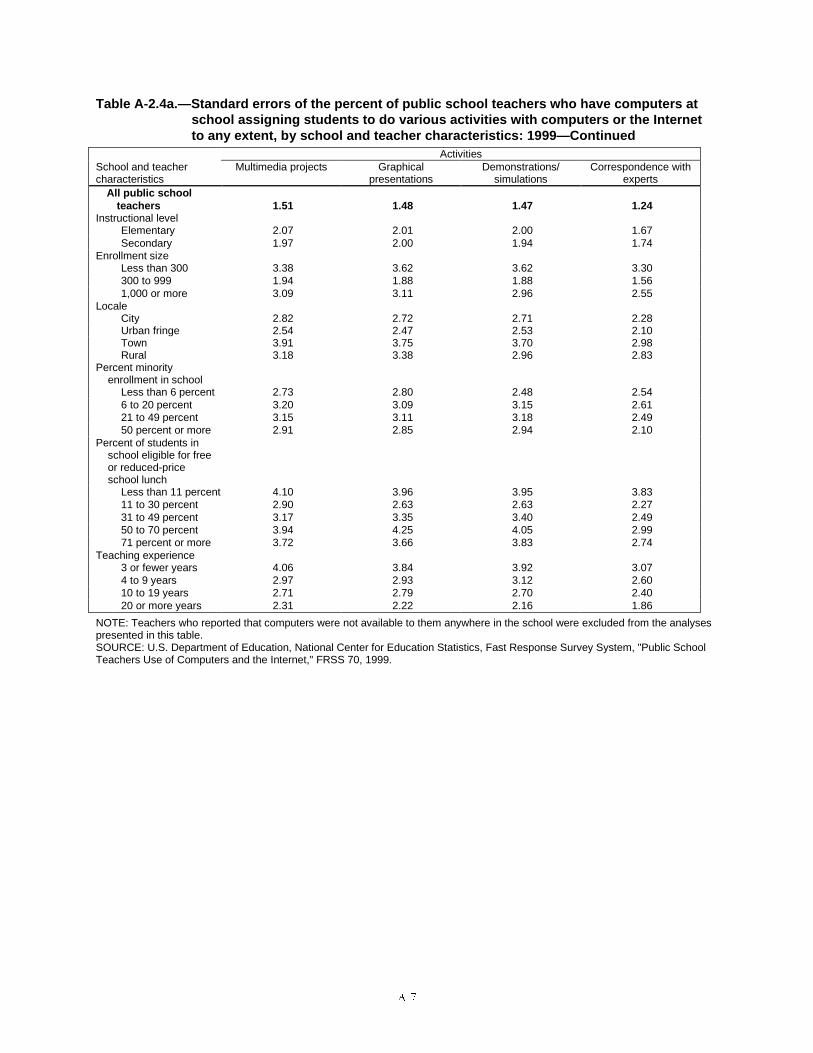
��
Table A-2.4a.—Standard errors of the percent of public school teachers who have computers atschool assigning students to do various activities with computers or the Internetto any extent, by school and teacher characteristics: 1999—Continued
ActivitiesSchool and teachercharacteristics
Multimedia projects Graphicalpresentations
Demonstrations/simulations
Correspondence withexperts
All public schoolteachers 1.51 1.48 1.47 1.24
Instructional levelElementary 2.07 2.01 2.00 1.67Secondary 1.97 2.00 1.94 1.74
Enrollment sizeLess than 300 3.38 3.62 3.62 3.30300 to 999 1.94 1.88 1.88 1.561,000 or more 3.09 3.11 2.96 2.55
LocaleCity 2.82 2.72 2.71 2.28Urban fringe 2.54 2.47 2.53 2.10Town 3.91 3.75 3.70 2.98Rural 3.18 3.38 2.96 2.83
Percent minorityenrollment in school
Less than 6 percent 2.73 2.80 2.48 2.546 to 20 percent 3.20 3.09 3.15 2.6121 to 49 percent 3.15 3.11 3.18 2.4950 percent or more 2.91 2.85 2.94 2.10
Percent of students inschool eligible for freeor reduced-priceschool lunch
Less than 11 percent 4.10 3.96 3.95 3.8311 to 30 percent 2.90 2.63 2.63 2.2731 to 49 percent 3.17 3.35 3.40 2.4950 to 70 percent 3.94 4.25 4.05 2.9971 percent or more 3.72 3.66 3.83 2.74
Teaching experience3 or fewer years 4.06 3.84 3.92 3.074 to 9 years 2.97 2.93 3.12 2.6010 to 19 years 2.71 2.79 2.70 2.4020 or more years 2.31 2.22 2.16 1.86
NOTE: Teachers who reported that computers were not available to them anywhere in the school were excluded from the analysespresented in this table.SOURCE: U.S. Department of Education, National Center for Education Statistics, Fast Response Survey System, "Public SchoolTeachers Use of Computers and the Internet," FRSS 70, 1999.

��
Table A-2.5.—Standard errors for the figures and for data not shown in tables in chapter 2: FRSS1999 and NAEP 1992, 1994, 1996, 1998
Item EstimateStandard
error
Figure 2.1: Percent of 4th- and 8th- grade public school students who have teachersreporting student use of computers for various class activities: 1998
Write drafts: 4th-grade 61 2.65Write drafts: 8th-grade 62 2.74Read stories: 4th-grade 52 2.10Read stories: 8th-grade 41 2.47Practice spelling, punctuation, and grammar: 4th-grade 50 2.11Practice spelling, punctuation, and grammar: 8th-grade 33 2.36
Figure 2.2: Percent of 8th- grade public school students who have teachers reportingstudent use of computers to write drafts and practice spelling, punctuation, andgrammar: 1992 and 1998
Write drafts: 1992 35 3.13Write drafts: 1998 63 2.32Practice spelling, punctuation, and grammar: 1992 15 1.99Practice spelling, punctuation, and grammar: 1998 32 1.86
Figure 2.3: Percent of public school teachers who have computers at school or athome reporting using computers or the Internet a little or a lot at school and at home,for various tasks: 1999
Create instructional materials: at school: a little 39 1.28Create instructional materials: at school: a lot 39 1.35Create instructional materials: at school: to any extent 78 1.13Create instructional materials: at home: a little 36 1.37Create instructional materials: at home: a lot 50 1.42Create instructional materials: at home: to any extent 85 0.98Gather information for lesson plans: at school: a little 43 1.35Gather information for lesson plans: at school: a lot 16 0.93Gather information for lesson plans: at school: to any extent 59 1.41Gather information for lesson plans: at home: a little 38 1.38Gather information for lesson plans: at home: a lot 29 1.29Gather information for lesson plans: at home: to any extent 67 1.37Administrative record keeping: at school: a little 16 0.99Administrative record keeping: at school: a lot 34 1.39Administrative record keeping: at school: to any extent 51 1.48Administrative record keeping: at home: a little 18 1.11Administrative record keeping: at home: a lot 26 1.32Administrative record keeping: at home: to any extent 44 1.56Access best practice examples: at school: a little 30 1.24Access best practice examples: at school: a lot 7 0.66Access best practice examples: at school: to any extent 37 1.34Access best practice examples: at home: a little 33 1.36Access best practice examples: at home: a lot 14 0.97Access best practice examples: at home: to any extent 46 1.47Multimedia presentations: at school: a little 28 1.18Multimedia presentations: at school: a lot 8 0.75Multimedia presentations: at school: to any extent 36 1.35Multimedia presentations: at home: a little 23 1.36Multimedia presentations: at home: a lot 8 0.76Multimedia presentations: at home: to any extent 30 1.46Access model lesson plans: at school: a little 28 1.23Access model lesson plans: at school: a lot 6 0.62Access model lesson plans: at school: to any extent 34 1.30Access model lesson plans: at home: a little 29 1.35Access model lesson plans: at home: a lot 13 1.03Access model lesson plans: at home: to any extent 42 1.49
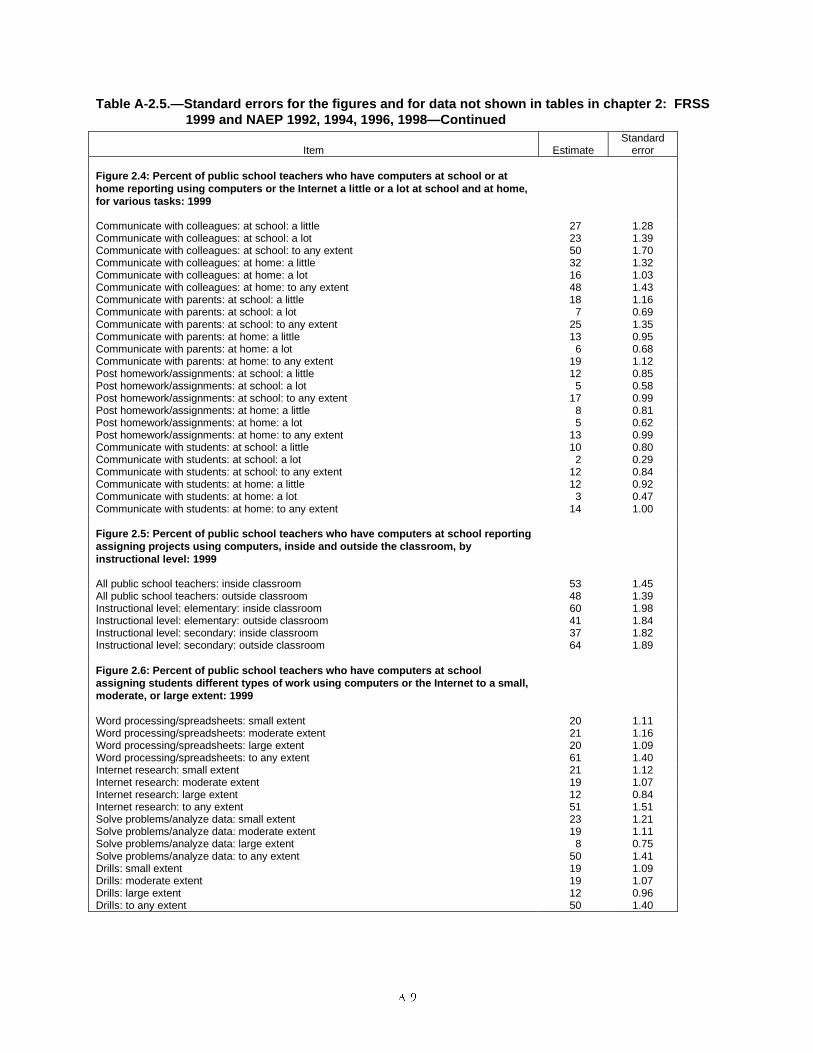
���
Table A-2.5.—Standard errors for the figures and for data not shown in tables in chapter 2: FRSS1999 and NAEP 1992, 1994, 1996, 1998—Continued
Item EstimateStandard
error
Figure 2.4: Percent of public school teachers who have computers at school or athome reporting using computers or the Internet a little or a lot at school and at home,for various tasks: 1999
Communicate with colleagues: at school: a little 27 1.28Communicate with colleagues: at school: a lot 23 1.39Communicate with colleagues: at school: to any extent 50 1.70Communicate with colleagues: at home: a little 32 1.32Communicate with colleagues: at home: a lot 16 1.03Communicate with colleagues: at home: to any extent 48 1.43Communicate with parents: at school: a little 18 1.16Communicate with parents: at school: a lot 7 0.69Communicate with parents: at school: to any extent 25 1.35Communicate with parents: at home: a little 13 0.95Communicate with parents: at home: a lot 6 0.68Communicate with parents: at home: to any extent 19 1.12Post homework/assignments: at school: a little 12 0.85Post homework/assignments: at school: a lot 5 0.58Post homework/assignments: at school: to any extent 17 0.99Post homework/assignments: at home: a little 8 0.81Post homework/assignments: at home: a lot 5 0.62Post homework/assignments: at home: to any extent 13 0.99Communicate with students: at school: a little 10 0.80Communicate with students: at school: a lot 2 0.29Communicate with students: at school: to any extent 12 0.84Communicate with students: at home: a little 12 0.92Communicate with students: at home: a lot 3 0.47Communicate with students: at home: to any extent 14 1.00
Figure 2.5: Percent of public school teachers who have computers at school reportingassigning projects using computers, inside and outside the classroom, byinstructional level: 1999
All public school teachers: inside classroom 53 1.45All public school teachers: outside classroom 48 1.39Instructional level: elementary: inside classroom 60 1.98Instructional level: elementary: outside classroom 41 1.84Instructional level: secondary: inside classroom 37 1.82Instructional level: secondary: outside classroom 64 1.89
Figure 2.6: Percent of public school teachers who have computers at schoolassigning students different types of work using computers or the Internet to a small,moderate, or large extent: 1999
Word processing/spreadsheets: small extent 20 1.11Word processing/spreadsheets: moderate extent 21 1.16Word processing/spreadsheets: large extent 20 1.09Word processing/spreadsheets: to any extent 61 1.40Internet research: small extent 21 1.12Internet research: moderate extent 19 1.07Internet research: large extent 12 0.84Internet research: to any extent 51 1.51Solve problems/analyze data: small extent 23 1.21Solve problems/analyze data: moderate extent 19 1.11Solve problems/analyze data: large extent 8 0.75Solve problems/analyze data: to any extent 50 1.41Drills: small extent 19 1.09Drills: moderate extent 19 1.07Drills: large extent 12 0.96Drills: to any extent 50 1.40
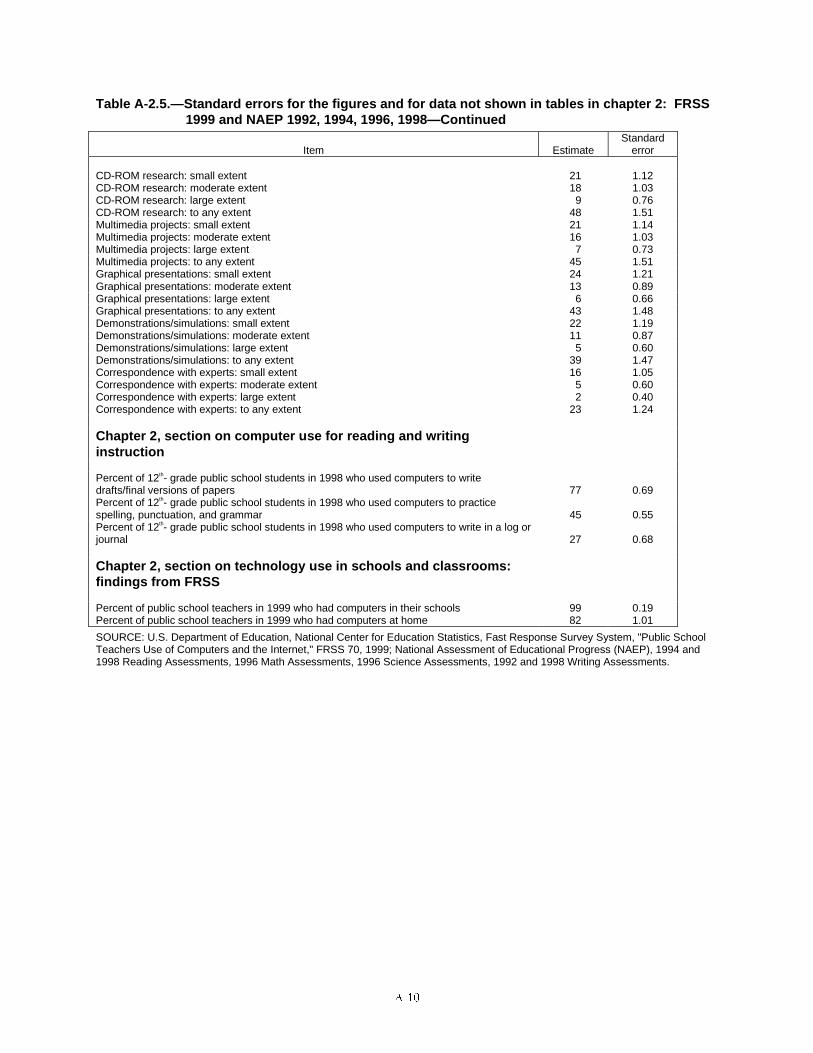
����
Table A-2.5.—Standard errors for the figures and for data not shown in tables in chapter 2: FRSS1999 and NAEP 1992, 1994, 1996, 1998—Continued
Item EstimateStandard
error
CD-ROM research: small extent 21 1.12CD-ROM research: moderate extent 18 1.03CD-ROM research: large extent 9 0.76CD-ROM research: to any extent 48 1.51Multimedia projects: small extent 21 1.14Multimedia projects: moderate extent 16 1.03Multimedia projects: large extent 7 0.73Multimedia projects: to any extent 45 1.51Graphical presentations: small extent 24 1.21Graphical presentations: moderate extent 13 0.89Graphical presentations: large extent 6 0.66Graphical presentations: to any extent 43 1.48Demonstrations/simulations: small extent 22 1.19Demonstrations/simulations: moderate extent 11 0.87Demonstrations/simulations: large extent 5 0.60Demonstrations/simulations: to any extent 39 1.47Correspondence with experts: small extent 16 1.05Correspondence with experts: moderate extent 5 0.60Correspondence with experts: large extent 2 0.40Correspondence with experts: to any extent 23 1.24
Chapter 2, section on computer use for reading and writinginstruction
Percent of 12th- grade public school students in 1998 who used computers to writedrafts/final versions of papers 77 0.69Percent of 12th- grade public school students in 1998 who used computers to practicespelling, punctuation, and grammar 45 0.55Percent of 12th- grade public school students in 1998 who used computers to write in a log orjournal 27 0.68
Chapter 2, section on technology use in schools and classrooms:findings from FRSS
Percent of public school teachers in 1999 who had computers in their schools 99 0.19Percent of public school teachers in 1999 who had computers at home 82 1.01
SOURCE: U.S. Department of Education, National Center for Education Statistics, Fast Response Survey System, "Public SchoolTeachers Use of Computers and the Internet," FRSS 70, 1999; National Assessment of Educational Progress (NAEP), 1994 and1998 Reading Assessments, 1996 Math Assessments, 1996 Science Assessments, 1992 and 1998 Writing Assessments.
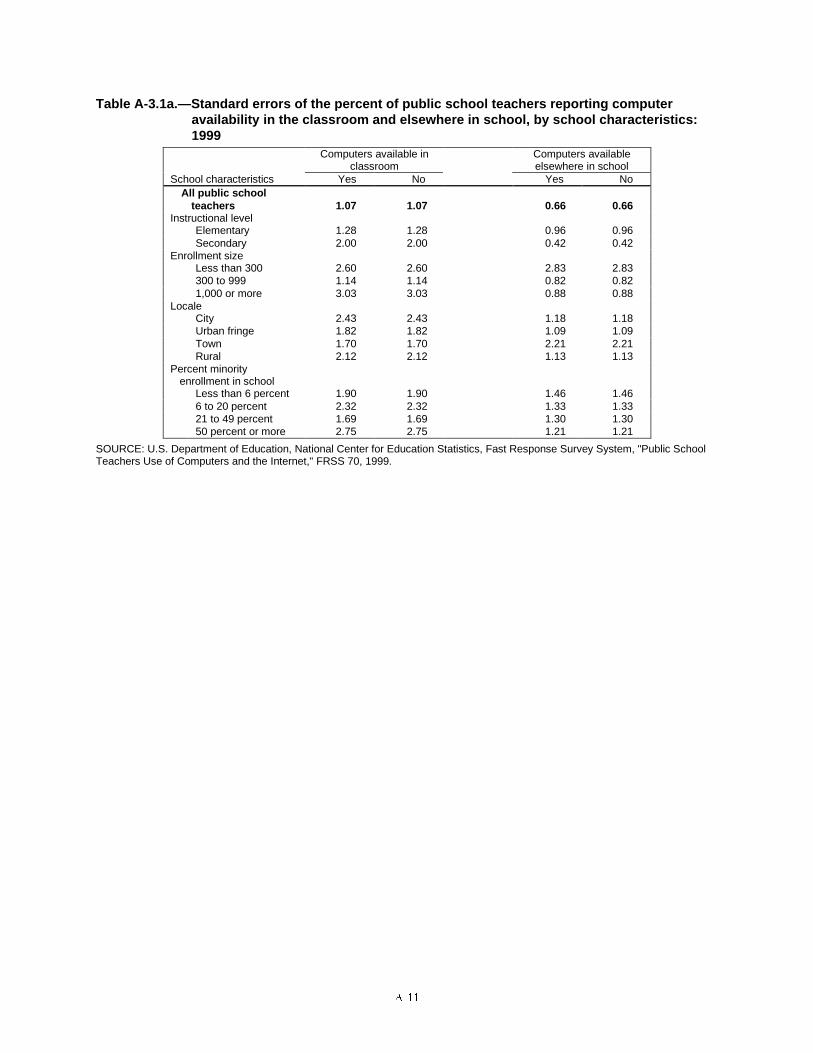
����
Table A-3.1a.—Standard errors of the percent of public school teachers reporting computeravailability in the classroom and elsewhere in school, by school characteristics:1999
Computers available inclassroom
Computers availableelsewhere in school
School characteristics Yes No Yes NoAll public school
teachers 1.07 1.07 0.66 0.66Instructional level
Elementary 1.28 1.28 0.96 0.96Secondary 2.00 2.00 0.42 0.42
Enrollment sizeLess than 300 2.60 2.60 2.83 2.83300 to 999 1.14 1.14 0.82 0.821,000 or more 3.03 3.03 0.88 0.88
LocaleCity 2.43 2.43 1.18 1.18Urban fringe 1.82 1.82 1.09 1.09Town 1.70 1.70 2.21 2.21Rural 2.12 2.12 1.13 1.13
Percent minorityenrollment in school
Less than 6 percent 1.90 1.90 1.46 1.466 to 20 percent 2.32 2.32 1.33 1.3321 to 49 percent 1.69 1.69 1.30 1.3050 percent or more 2.75 2.75 1.21 1.21
SOURCE: U.S. Department of Education, National Center for Education Statistics, Fast Response Survey System, "Public SchoolTeachers Use of Computers and the Internet," FRSS 70, 1999.
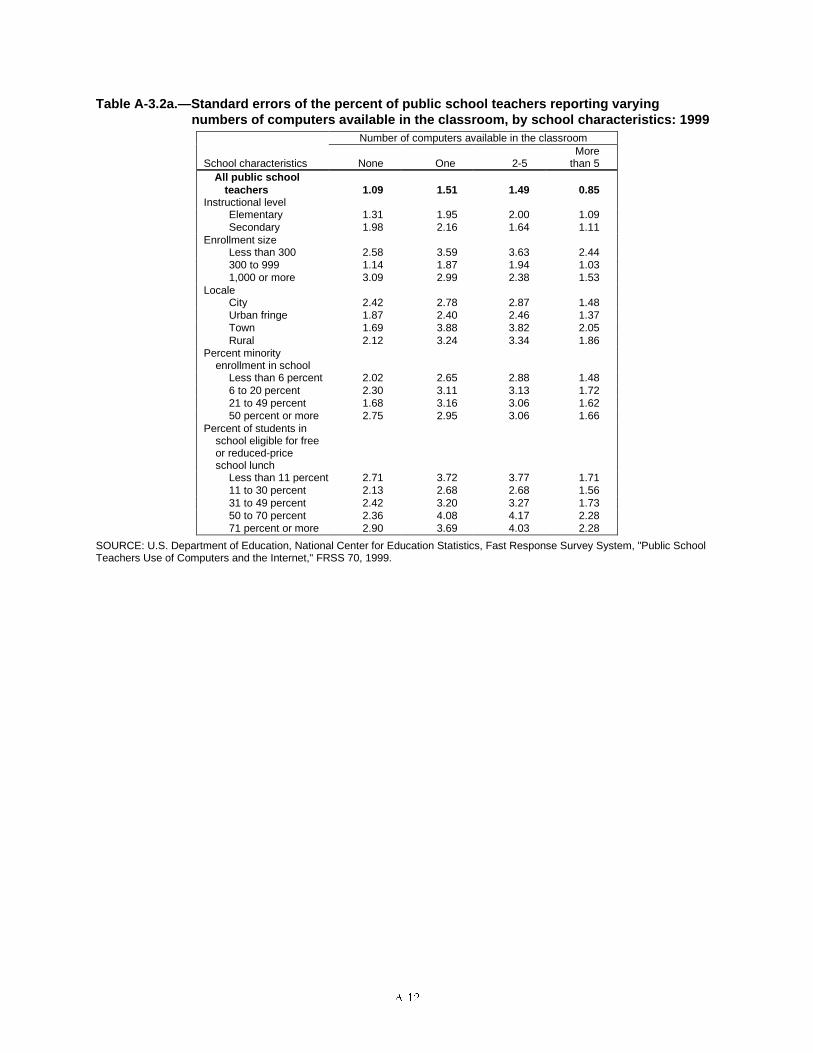
����
Table A-3.2a.—Standard errors of the percent of public school teachers reporting varyingnumbers of computers available in the classroom, by school characteristics: 1999
Number of computers available in the classroom
School characteristics None One 2-5More
than 5All public school
teachers 1.09 1.51 1.49 0.85Instructional level
Elementary 1.31 1.95 2.00 1.09Secondary 1.98 2.16 1.64 1.11
Enrollment sizeLess than 300 2.58 3.59 3.63 2.44300 to 999 1.14 1.87 1.94 1.031,000 or more 3.09 2.99 2.38 1.53
LocaleCity 2.42 2.78 2.87 1.48Urban fringe 1.87 2.40 2.46 1.37Town 1.69 3.88 3.82 2.05Rural 2.12 3.24 3.34 1.86
Percent minorityenrollment in school
Less than 6 percent 2.02 2.65 2.88 1.486 to 20 percent 2.30 3.11 3.13 1.7221 to 49 percent 1.68 3.16 3.06 1.6250 percent or more 2.75 2.95 3.06 1.66
Percent of students inschool eligible for freeor reduced-priceschool lunch
Less than 11 percent 2.71 3.72 3.77 1.7111 to 30 percent 2.13 2.68 2.68 1.5631 to 49 percent 2.42 3.20 3.27 1.7350 to 70 percent 2.36 4.08 4.17 2.2871 percent or more 2.90 3.69 4.03 2.28
SOURCE: U.S. Department of Education, National Center for Education Statistics, Fast Response Survey System, "Public SchoolTeachers Use of Computers and the Internet," FRSS 70, 1999.
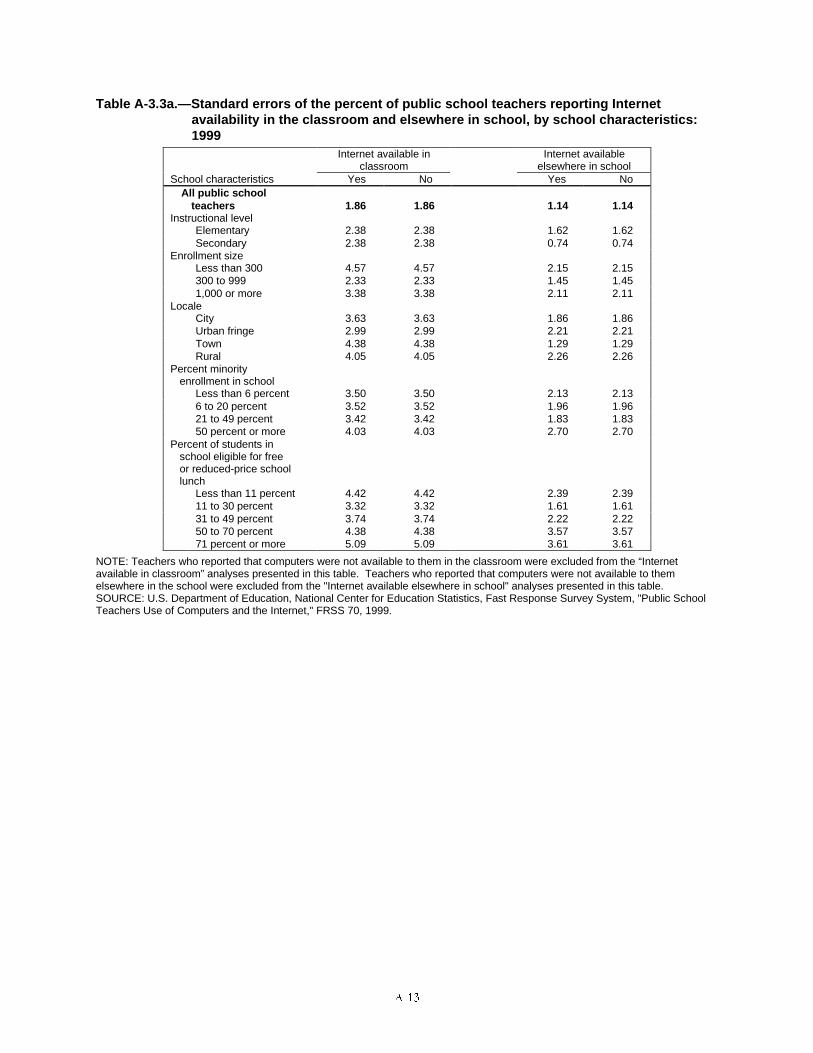
����
Table A-3.3a.—Standard errors of the percent of public school teachers reporting Internetavailability in the classroom and elsewhere in school, by school characteristics:1999
Internet available inclassroom
Internet availableelsewhere in school
School characteristics Yes No Yes NoAll public school
teachers 1.86 1.86 1.14 1.14Instructional level
Elementary 2.38 2.38 1.62 1.62Secondary 2.38 2.38 0.74 0.74
Enrollment sizeLess than 300 4.57 4.57 2.15 2.15300 to 999 2.33 2.33 1.45 1.451,000 or more 3.38 3.38 2.11 2.11
LocaleCity 3.63 3.63 1.86 1.86Urban fringe 2.99 2.99 2.21 2.21Town 4.38 4.38 1.29 1.29Rural 4.05 4.05 2.26 2.26
Percent minorityenrollment in school
Less than 6 percent 3.50 3.50 2.13 2.136 to 20 percent 3.52 3.52 1.96 1.9621 to 49 percent 3.42 3.42 1.83 1.8350 percent or more 4.03 4.03 2.70 2.70
Percent of students inschool eligible for freeor reduced-price schoollunch
Less than 11 percent 4.42 4.42 2.39 2.3911 to 30 percent 3.32 3.32 1.61 1.6131 to 49 percent 3.74 3.74 2.22 2.2250 to 70 percent 4.38 4.38 3.57 3.5771 percent or more 5.09 5.09 3.61 3.61
NOTE: Teachers who reported that computers were not available to them in the classroom were excluded from the “Internetavailable in classroom” analyses presented in this table. Teachers who reported that computers were not available to themelsewhere in the school were excluded from the "Internet available elsewhere in school" analyses presented in this table.SOURCE: U.S. Department of Education, National Center for Education Statistics, Fast Response Survey System, "Public SchoolTeachers Use of Computers and the Internet," FRSS 70, 1999.
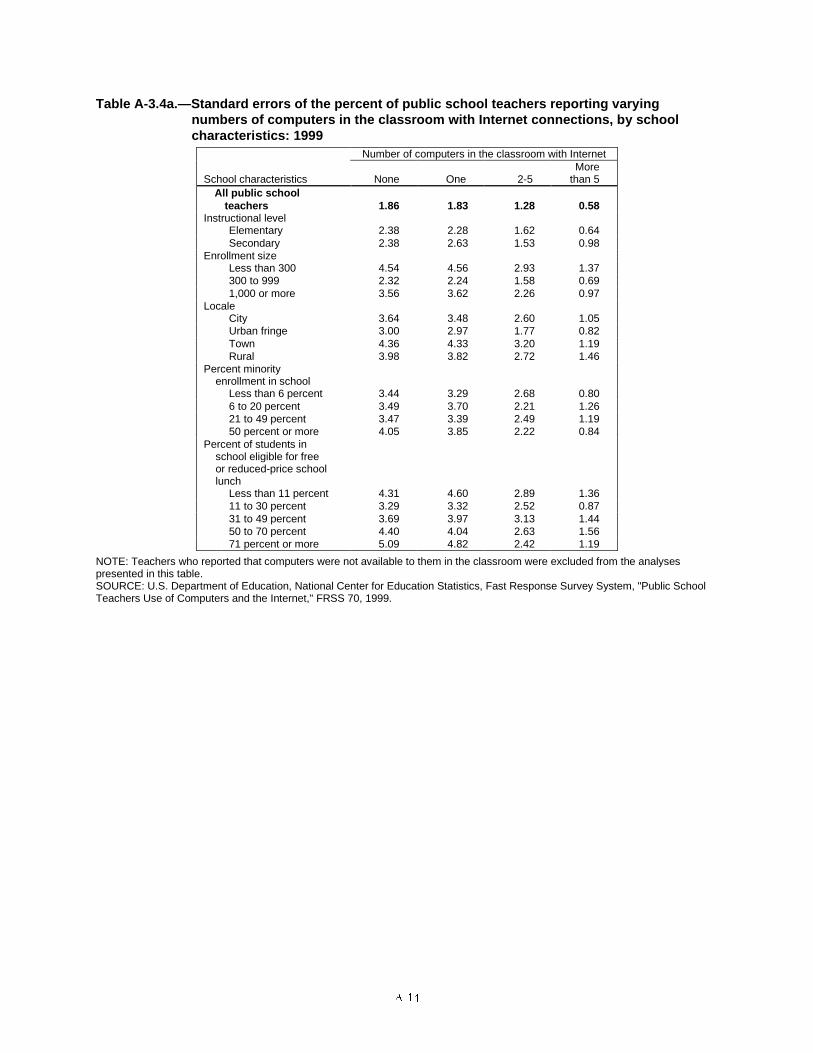
����
Table A-3.4a.—Standard errors of the percent of public school teachers reporting varyingnumbers of computers in the classroom with Internet connections, by schoolcharacteristics: 1999
Number of computers in the classroom with Internet
School characteristics None One 2-5More
than 5All public school
teachers 1.86 1.83 1.28 0.58Instructional level
Elementary 2.38 2.28 1.62 0.64Secondary 2.38 2.63 1.53 0.98
Enrollment sizeLess than 300 4.54 4.56 2.93 1.37300 to 999 2.32 2.24 1.58 0.691,000 or more 3.56 3.62 2.26 0.97
LocaleCity 3.64 3.48 2.60 1.05Urban fringe 3.00 2.97 1.77 0.82Town 4.36 4.33 3.20 1.19Rural 3.98 3.82 2.72 1.46
Percent minorityenrollment in school
Less than 6 percent 3.44 3.29 2.68 0.806 to 20 percent 3.49 3.70 2.21 1.2621 to 49 percent 3.47 3.39 2.49 1.1950 percent or more 4.05 3.85 2.22 0.84
Percent of students inschool eligible for freeor reduced-price schoollunch
Less than 11 percent 4.31 4.60 2.89 1.3611 to 30 percent 3.29 3.32 2.52 0.8731 to 49 percent 3.69 3.97 3.13 1.4450 to 70 percent 4.40 4.04 2.63 1.5671 percent or more 5.09 4.82 2.42 1.19
NOTE: Teachers who reported that computers were not available to them in the classroom were excluded from the analysespresented in this table.SOURCE: U.S. Department of Education, National Center for Education Statistics, Fast Response Survey System, "Public SchoolTeachers Use of Computers and the Internet," FRSS 70, 1999.
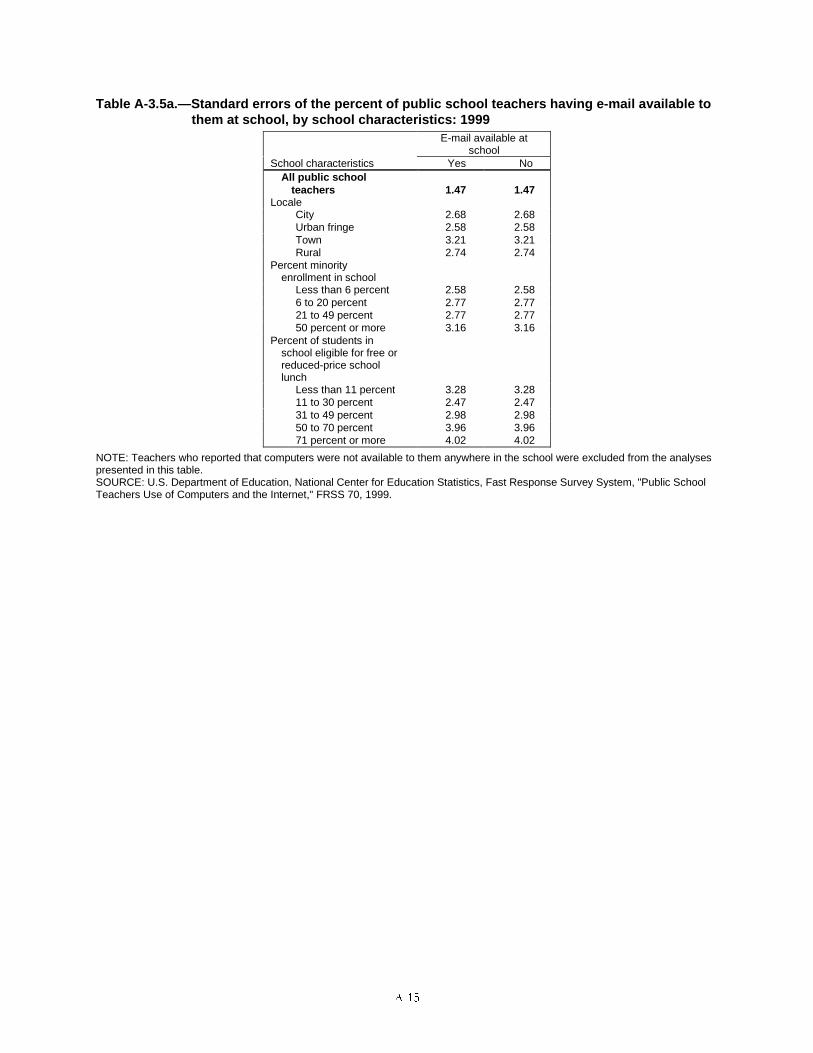
����
Table A-3.5a.—Standard errors of the percent of public school teachers having e-mail available tothem at school, by school characteristics: 1999
E-mail available atschool
School characteristics Yes NoAll public school
teachers 1.47 1.47Locale
City 2.68 2.68Urban fringe 2.58 2.58Town 3.21 3.21Rural 2.74 2.74
Percent minorityenrollment in school
Less than 6 percent 2.58 2.586 to 20 percent 2.77 2.7721 to 49 percent 2.77 2.7750 percent or more 3.16 3.16
Percent of students inschool eligible for free orreduced-price schoollunch
Less than 11 percent 3.28 3.2811 to 30 percent 2.47 2.4731 to 49 percent 2.98 2.9850 to 70 percent 3.96 3.9671 percent or more 4.02 4.02
NOTE: Teachers who reported that computers were not available to them anywhere in the school were excluded from the analysespresented in this table.SOURCE: U.S. Department of Education, National Center for Education Statistics, Fast Response Survey System, "Public SchoolTeachers Use of Computers and the Internet," FRSS 70, 1999.
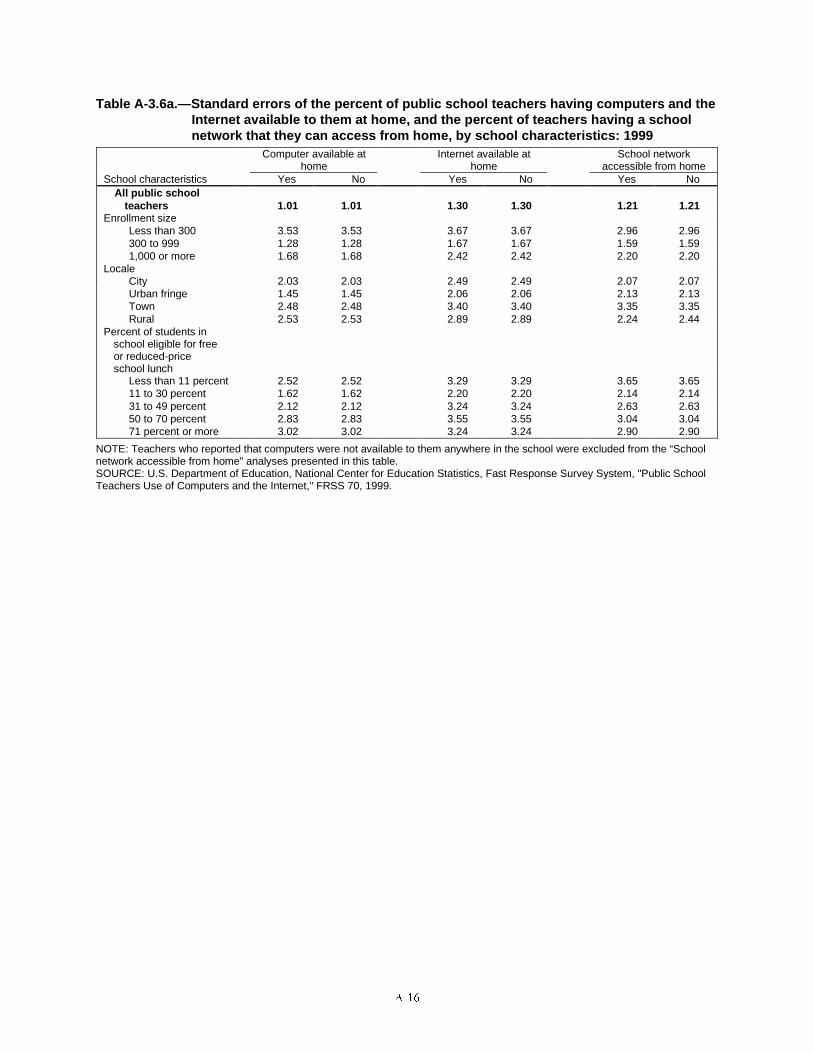
����
Table A-3.6a.—Standard errors of the percent of public school teachers having computers and theInternet available to them at home, and the percent of teachers having a schoolnetwork that they can access from home, by school characteristics: 1999
Computer available athome
Internet available athome
School networkaccessible from home
School characteristics Yes No Yes No Yes NoAll public school
teachers 1.01 1.01 1.30 1.30 1.21 1.21Enrollment size
Less than 300 3.53 3.53 3.67 3.67 2.96 2.96300 to 999 1.28 1.28 1.67 1.67 1.59 1.591,000 or more 1.68 1.68 2.42 2.42 2.20 2.20
LocaleCity 2.03 2.03 2.49 2.49 2.07 2.07Urban fringe 1.45 1.45 2.06 2.06 2.13 2.13Town 2.48 2.48 3.40 3.40 3.35 3.35Rural 2.53 2.53 2.89 2.89 2.24 2.44
Percent of students inschool eligible for freeor reduced-priceschool lunch
Less than 11 percent 2.52 2.52 3.29 3.29 3.65 3.6511 to 30 percent 1.62 1.62 2.20 2.20 2.14 2.1431 to 49 percent 2.12 2.12 3.24 3.24 2.63 2.6350 to 70 percent 2.83 2.83 3.55 3.55 3.04 3.0471 percent or more 3.02 3.02 3.24 3.24 2.90 2.90
NOTE: Teachers who reported that computers were not available to them anywhere in the school were excluded from the “Schoolnetwork accessible from home” analyses presented in this table.SOURCE: U.S. Department of Education, National Center for Education Statistics, Fast Response Survey System, "Public SchoolTeachers Use of Computers and the Internet," FRSS 70, 1999.
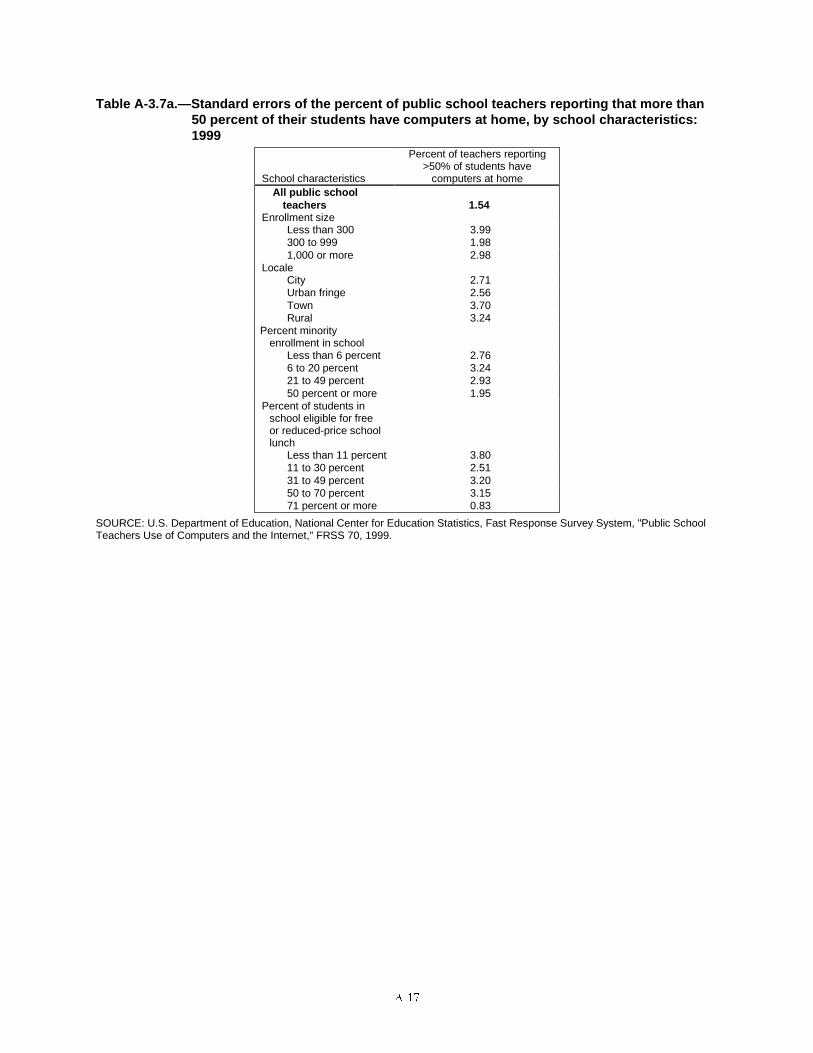
���
Table A-3.7a.—Standard errors of the percent of public school teachers reporting that more than50 percent of their students have computers at home, by school characteristics:1999
School characteristics
Percent of teachers reporting>50% of students have
computers at homeAll public school
teachers 1.54Enrollment size
Less than 300 3.99300 to 999 1.981,000 or more 2.98
LocaleCity 2.71Urban fringe 2.56Town 3.70Rural 3.24
Percent minorityenrollment in school
Less than 6 percent 2.766 to 20 percent 3.2421 to 49 percent 2.9350 percent or more 1.95
Percent of students inschool eligible for freeor reduced-price schoollunch
Less than 11 percent 3.8011 to 30 percent 2.5131 to 49 percent 3.2050 to 70 percent 3.1571 percent or more 0.83
SOURCE: U.S. Department of Education, National Center for Education Statistics, Fast Response Survey System, "Public SchoolTeachers Use of Computers and the Internet," FRSS 70, 1999.
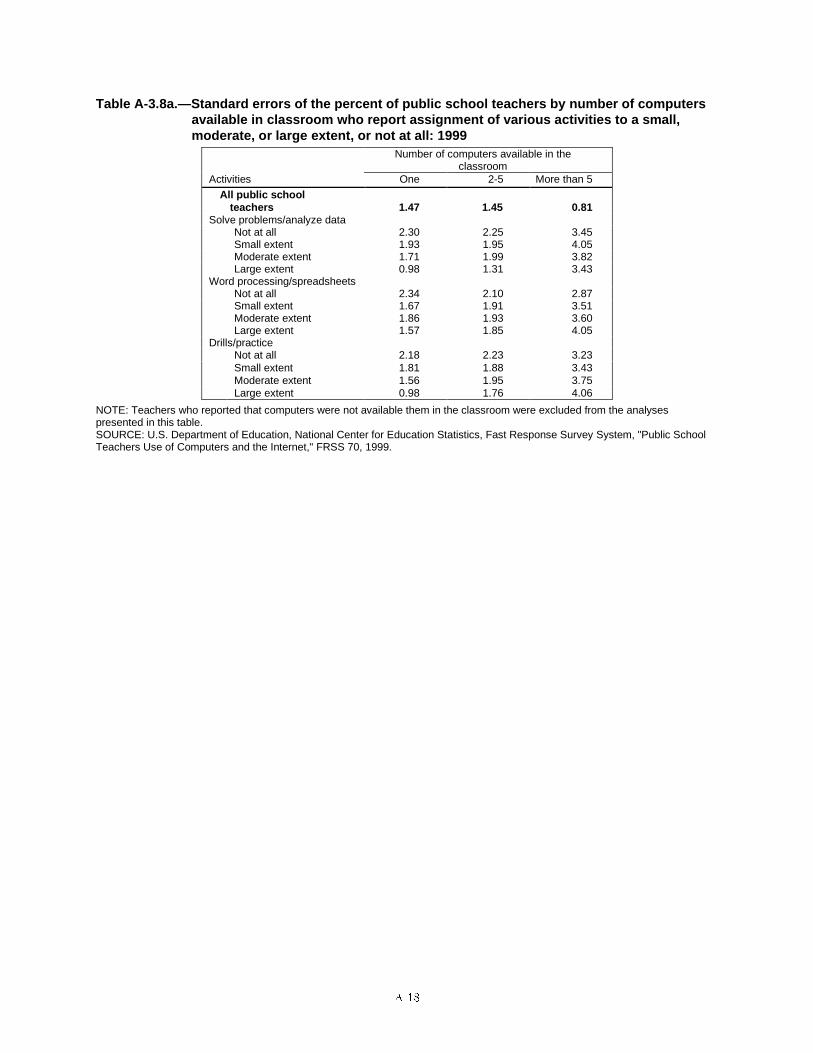
���
Table A-3.8a.—Standard errors of the percent of public school teachers by number of computersavailable in classroom who report assignment of various activities to a small,moderate, or large extent, or not at all: 1999
Number of computers available in theclassroom
Activities One 2-5 More than 5
All public schoolteachers 1.47 1.45 0.81
Solve problems/analyze dataNot at all 2.30 2.25 3.45Small extent 1.93 1.95 4.05Moderate extent 1.71 1.99 3.82Large extent 0.98 1.31 3.43
Word processing/spreadsheetsNot at all 2.34 2.10 2.87Small extent 1.67 1.91 3.51Moderate extent 1.86 1.93 3.60Large extent 1.57 1.85 4.05
Drills/practiceNot at all 2.18 2.23 3.23Small extent 1.81 1.88 3.43Moderate extent 1.56 1.95 3.75Large extent 0.98 1.76 4.06
NOTE: Teachers who reported that computers were not available them in the classroom were excluded from the analysespresented in this table.SOURCE: U.S. Department of Education, National Center for Education Statistics, Fast Response Survey System, "Public SchoolTeachers Use of Computers and the Internet," FRSS 70, 1999.
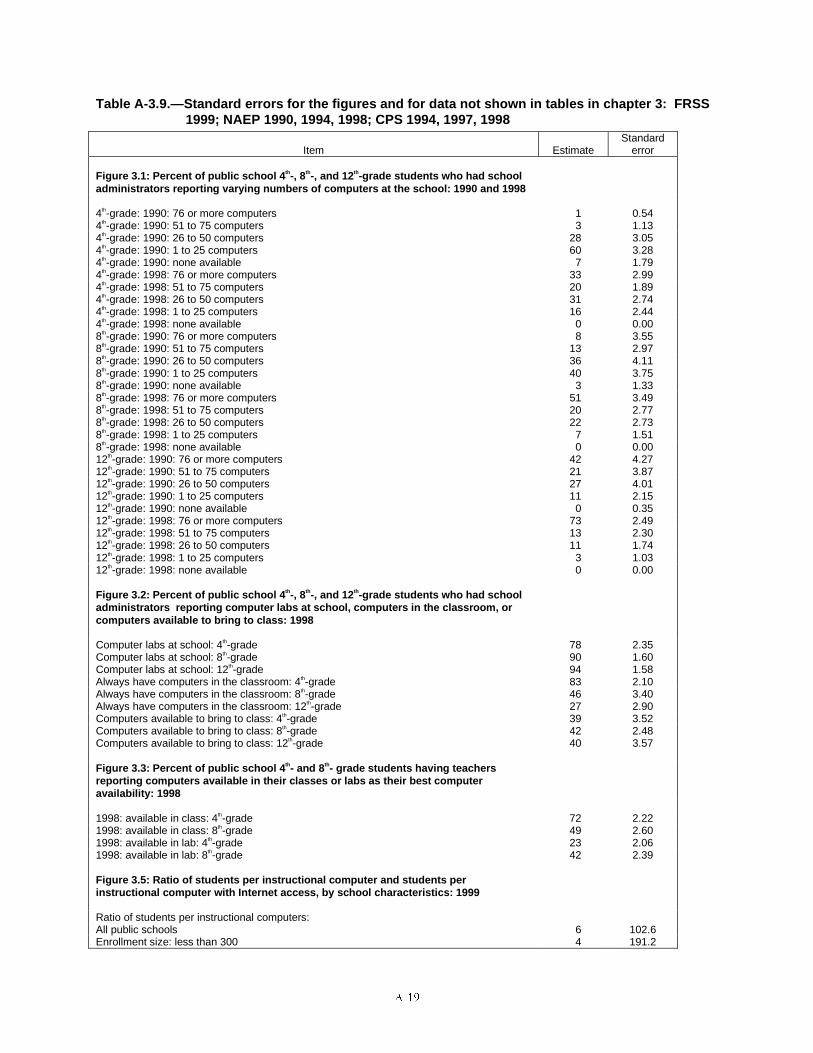
����
Table A-3.9.—Standard errors for the figures and for data not shown in tables in chapter 3: FRSS1999; NAEP 1990, 1994, 1998; CPS 1994, 1997, 1998
Item EstimateStandard
error
Figure 3.1: Percent of public school 4th-, 8th-, and 12th-grade students who had schooladministrators reporting varying numbers of computers at the school: 1990 and 1998
4th-grade: 1990: 76 or more computers 1 0.544th-grade: 1990: 51 to 75 computers 3 1.134th-grade: 1990: 26 to 50 computers 28 3.054th-grade: 1990: 1 to 25 computers 60 3.284th-grade: 1990: none available 7 1.794th-grade: 1998: 76 or more computers 33 2.994th-grade: 1998: 51 to 75 computers 20 1.894th-grade: 1998: 26 to 50 computers 31 2.744th-grade: 1998: 1 to 25 computers 16 2.444th-grade: 1998: none available 0 0.008th-grade: 1990: 76 or more computers 8 3.558th-grade: 1990: 51 to 75 computers 13 2.978th-grade: 1990: 26 to 50 computers 36 4.118th-grade: 1990: 1 to 25 computers 40 3.758th-grade: 1990: none available 3 1.338th-grade: 1998: 76 or more computers 51 3.498th-grade: 1998: 51 to 75 computers 20 2.778th-grade: 1998: 26 to 50 computers 22 2.738th-grade: 1998: 1 to 25 computers 7 1.518th-grade: 1998: none available 0 0.0012th-grade: 1990: 76 or more computers 42 4.2712th-grade: 1990: 51 to 75 computers 21 3.8712th-grade: 1990: 26 to 50 computers 27 4.0112th-grade: 1990: 1 to 25 computers 11 2.1512th-grade: 1990: none available 0 0.3512th-grade: 1998: 76 or more computers 73 2.4912th-grade: 1998: 51 to 75 computers 13 2.3012th-grade: 1998: 26 to 50 computers 11 1.7412th-grade: 1998: 1 to 25 computers 3 1.0312th-grade: 1998: none available 0 0.00
Figure 3.2: Percent of public school 4th-, 8th-, and 12th-grade students who had schooladministrators reporting computer labs at school, computers in the classroom, orcomputers available to bring to class: 1998
Computer labs at school: 4th-grade 78 2.35Computer labs at school: 8th-grade 90 1.60Computer labs at school: 12th-grade 94 1.58Always have computers in the classroom: 4th-grade 83 2.10Always have computers in the classroom: 8th-grade 46 3.40Always have computers in the classroom: 12th-grade 27 2.90Computers available to bring to class: 4th-grade 39 3.52Computers available to bring to class: 8th-grade 42 2.48Computers available to bring to class: 12th-grade 40 3.57
Figure 3.3: Percent of public school 4th- and 8th- grade students having teachersreporting computers available in their classes or labs as their best computeravailability: 1998
1998: available in class: 4th-grade 72 2.221998: available in class: 8th-grade 49 2.601998: available in lab: 4th-grade 23 2.061998: available in lab: 8th-grade 42 2.39
Figure 3.5: Ratio of students per instructional computer and students perinstructional computer with Internet access, by school characteristics: 1999
Ratio of students per instructional computers:All public schools 6 102.6Enrollment size: less than 300 4 191.2
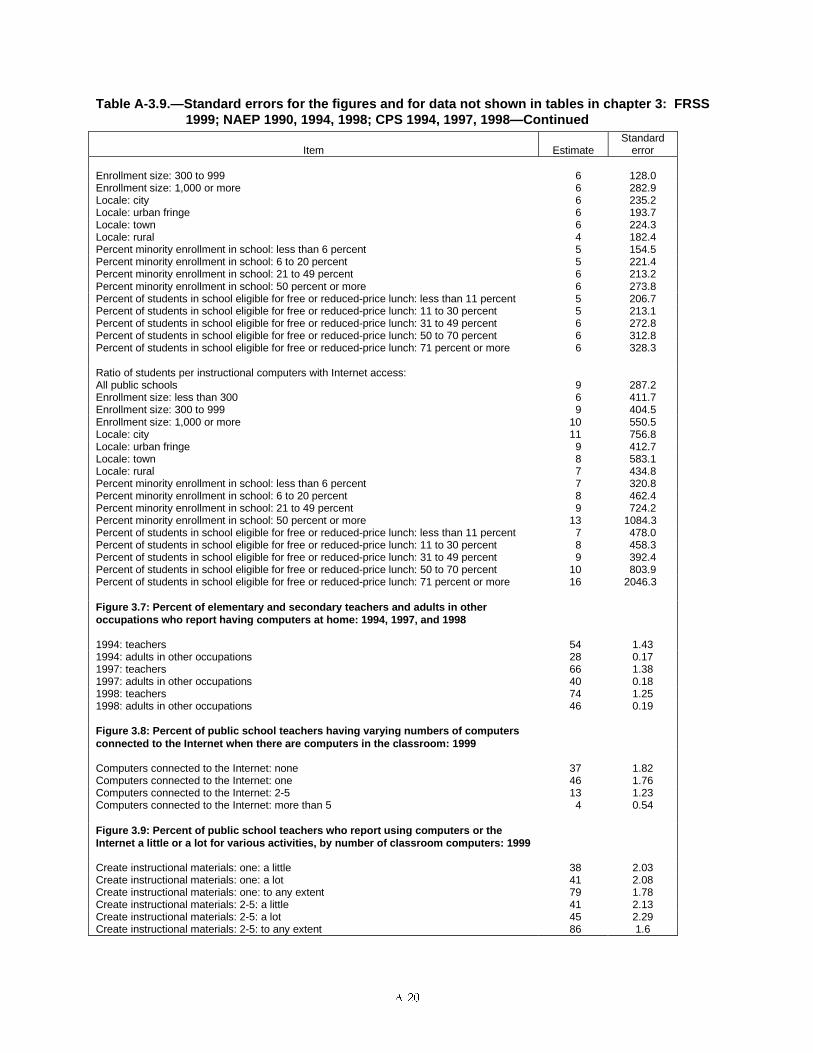
����
Table A-3.9.—Standard errors for the figures and for data not shown in tables in chapter 3: FRSS1999; NAEP 1990, 1994, 1998; CPS 1994, 1997, 1998—Continued
Item EstimateStandard
error
Enrollment size: 300 to 999 6 128.0Enrollment size: 1,000 or more 6 282.9Locale: city 6 235.2Locale: urban fringe 6 193.7Locale: town 6 224.3Locale: rural 4 182.4Percent minority enrollment in school: less than 6 percent 5 154.5Percent minority enrollment in school: 6 to 20 percent 5 221.4Percent minority enrollment in school: 21 to 49 percent 6 213.2Percent minority enrollment in school: 50 percent or more 6 273.8Percent of students in school eligible for free or reduced-price lunch: less than 11 percent 5 206.7Percent of students in school eligible for free or reduced-price lunch: 11 to 30 percent 5 213.1Percent of students in school eligible for free or reduced-price lunch: 31 to 49 percent 6 272.8Percent of students in school eligible for free or reduced-price lunch: 50 to 70 percent 6 312.8Percent of students in school eligible for free or reduced-price lunch: 71 percent or more 6 328.3
Ratio of students per instructional computers with Internet access:All public schools 9 287.2Enrollment size: less than 300 6 411.7Enrollment size: 300 to 999 9 404.5Enrollment size: 1,000 or more 10 550.5Locale: city 11 756.8Locale: urban fringe 9 412.7Locale: town 8 583.1Locale: rural 7 434.8Percent minority enrollment in school: less than 6 percent 7 320.8Percent minority enrollment in school: 6 to 20 percent 8 462.4Percent minority enrollment in school: 21 to 49 percent 9 724.2Percent minority enrollment in school: 50 percent or more 13 1084.3Percent of students in school eligible for free or reduced-price lunch: less than 11 percent 7 478.0Percent of students in school eligible for free or reduced-price lunch: 11 to 30 percent 8 458.3Percent of students in school eligible for free or reduced-price lunch: 31 to 49 percent 9 392.4Percent of students in school eligible for free or reduced-price lunch: 50 to 70 percent 10 803.9Percent of students in school eligible for free or reduced-price lunch: 71 percent or more 16 2046.3
Figure 3.7: Percent of elementary and secondary teachers and adults in otheroccupations who report having computers at home: 1994, 1997, and 1998
1994: teachers 54 1.431994: adults in other occupations 28 0.171997: teachers 66 1.381997: adults in other occupations 40 0.181998: teachers 74 1.251998: adults in other occupations 46 0.19
Figure 3.8: Percent of public school teachers having varying numbers of computersconnected to the Internet when there are computers in the classroom: 1999
Computers connected to the Internet: none 37 1.82Computers connected to the Internet: one 46 1.76Computers connected to the Internet: 2-5 13 1.23Computers connected to the Internet: more than 5 4 0.54
Figure 3.9: Percent of public school teachers who report using computers or theInternet a little or a lot for various activities, by number of classroom computers: 1999
Create instructional materials: one: a little 38 2.03Create instructional materials: one: a lot 41 2.08Create instructional materials: one: to any extent 79 1.78Create instructional materials: 2-5: a little 41 2.13Create instructional materials: 2-5: a lot 45 2.29Create instructional materials: 2-5: to any extent 86 1.6
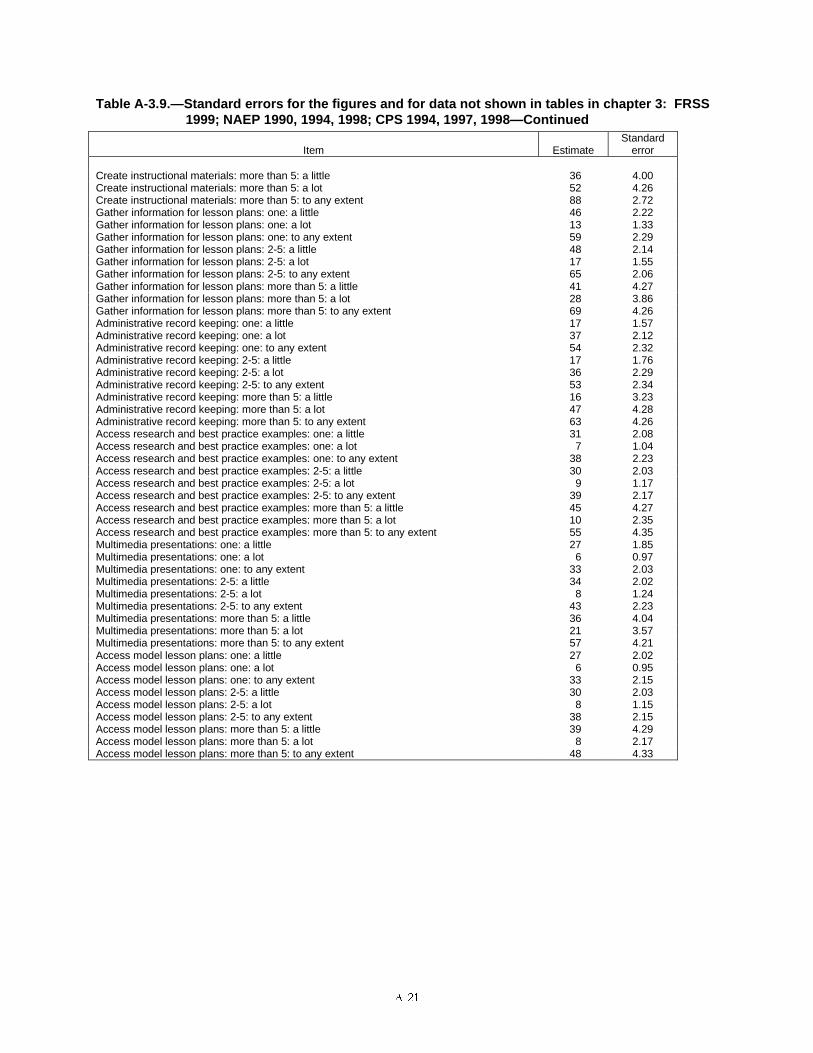
����
Table A-3.9.—Standard errors for the figures and for data not shown in tables in chapter 3: FRSS1999; NAEP 1990, 1994, 1998; CPS 1994, 1997, 1998—Continued
Item EstimateStandard
error
Create instructional materials: more than 5: a little 36 4.00Create instructional materials: more than 5: a lot 52 4.26Create instructional materials: more than 5: to any extent 88 2.72Gather information for lesson plans: one: a little 46 2.22Gather information for lesson plans: one: a lot 13 1.33Gather information for lesson plans: one: to any extent 59 2.29Gather information for lesson plans: 2-5: a little 48 2.14Gather information for lesson plans: 2-5: a lot 17 1.55Gather information for lesson plans: 2-5: to any extent 65 2.06Gather information for lesson plans: more than 5: a little 41 4.27Gather information for lesson plans: more than 5: a lot 28 3.86Gather information for lesson plans: more than 5: to any extent 69 4.26Administrative record keeping: one: a little 17 1.57Administrative record keeping: one: a lot 37 2.12Administrative record keeping: one: to any extent 54 2.32Administrative record keeping: 2-5: a little 17 1.76Administrative record keeping: 2-5: a lot 36 2.29Administrative record keeping: 2-5: to any extent 53 2.34Administrative record keeping: more than 5: a little 16 3.23Administrative record keeping: more than 5: a lot 47 4.28Administrative record keeping: more than 5: to any extent 63 4.26Access research and best practice examples: one: a little 31 2.08Access research and best practice examples: one: a lot 7 1.04Access research and best practice examples: one: to any extent 38 2.23Access research and best practice examples: 2-5: a little 30 2.03Access research and best practice examples: 2-5: a lot 9 1.17Access research and best practice examples: 2-5: to any extent 39 2.17Access research and best practice examples: more than 5: a little 45 4.27Access research and best practice examples: more than 5: a lot 10 2.35Access research and best practice examples: more than 5: to any extent 55 4.35Multimedia presentations: one: a little 27 1.85Multimedia presentations: one: a lot 6 0.97Multimedia presentations: one: to any extent 33 2.03Multimedia presentations: 2-5: a little 34 2.02Multimedia presentations: 2-5: a lot 8 1.24Multimedia presentations: 2-5: to any extent 43 2.23Multimedia presentations: more than 5: a little 36 4.04Multimedia presentations: more than 5: a lot 21 3.57Multimedia presentations: more than 5: to any extent 57 4.21Access model lesson plans: one: a little 27 2.02Access model lesson plans: one: a lot 6 0.95Access model lesson plans: one: to any extent 33 2.15Access model lesson plans: 2-5: a little 30 2.03Access model lesson plans: 2-5: a lot 8 1.15Access model lesson plans: 2-5: to any extent 38 2.15Access model lesson plans: more than 5: a little 39 4.29Access model lesson plans: more than 5: a lot 8 2.17Access model lesson plans: more than 5: to any extent 48 4.33
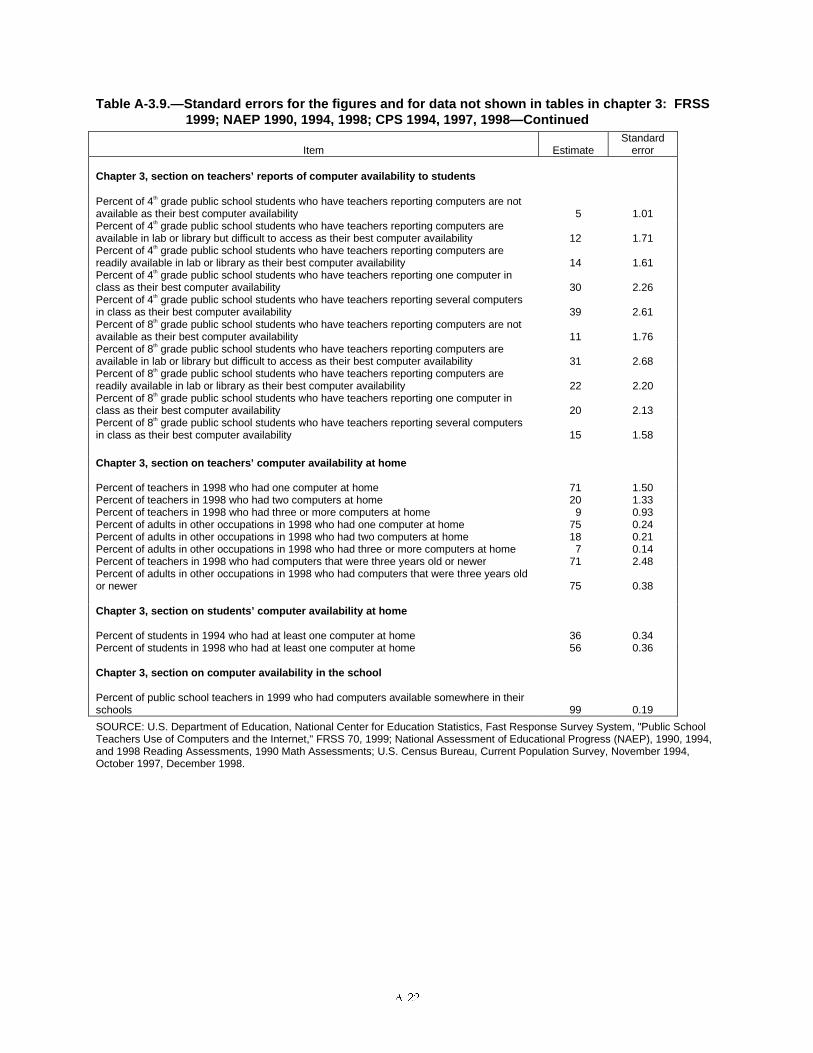
����
Table A-3.9.—Standard errors for the figures and for data not shown in tables in chapter 3: FRSS1999; NAEP 1990, 1994, 1998; CPS 1994, 1997, 1998—Continued
Item EstimateStandard
error
Chapter 3, section on teachers’ reports of computer availability to students
Percent of 4th grade public school students who have teachers reporting computers are notavailable as their best computer availability 5 1.01Percent of 4th grade public school students who have teachers reporting computers areavailable in lab or library but difficult to access as their best computer availability 12 1.71Percent of 4th grade public school students who have teachers reporting computers arereadily available in lab or library as their best computer availability 14 1.61Percent of 4th grade public school students who have teachers reporting one computer inclass as their best computer availability 30 2.26Percent of 4th grade public school students who have teachers reporting several computersin class as their best computer availability 39 2.61Percent of 8th grade public school students who have teachers reporting computers are notavailable as their best computer availability 11 1.76Percent of 8th grade public school students who have teachers reporting computers areavailable in lab or library but difficult to access as their best computer availability 31 2.68Percent of 8th grade public school students who have teachers reporting computers arereadily available in lab or library as their best computer availability 22 2.20Percent of 8th grade public school students who have teachers reporting one computer inclass as their best computer availability 20 2.13Percent of 8th grade public school students who have teachers reporting several computersin class as their best computer availability 15 1.58
Chapter 3, section on teachers’ computer availability at home
Percent of teachers in 1998 who had one computer at home 71 1.50Percent of teachers in 1998 who had two computers at home 20 1.33Percent of teachers in 1998 who had three or more computers at home 9 0.93Percent of adults in other occupations in 1998 who had one computer at home 75 0.24Percent of adults in other occupations in 1998 who had two computers at home 18 0.21Percent of adults in other occupations in 1998 who had three or more computers at home 7 0.14Percent of teachers in 1998 who had computers that were three years old or newer 71 2.48Percent of adults in other occupations in 1998 who had computers that were three years oldor newer 75 0.38
Chapter 3, section on students’ computer availability at home
Percent of students in 1994 who had at least one computer at home 36 0.34Percent of students in 1998 who had at least one computer at home 56 0.36
Chapter 3, section on computer availability in the school
Percent of public school teachers in 1999 who had computers available somewhere in theirschools 99 0.19
SOURCE: U.S. Department of Education, National Center for Education Statistics, Fast Response Survey System, "Public SchoolTeachers Use of Computers and the Internet," FRSS 70, 1999; National Assessment of Educational Progress (NAEP), 1990, 1994,and 1998 Reading Assessments, 1990 Math Assessments; U.S. Census Bureau, Current Population Survey, November 1994,October 1997, December 1998.
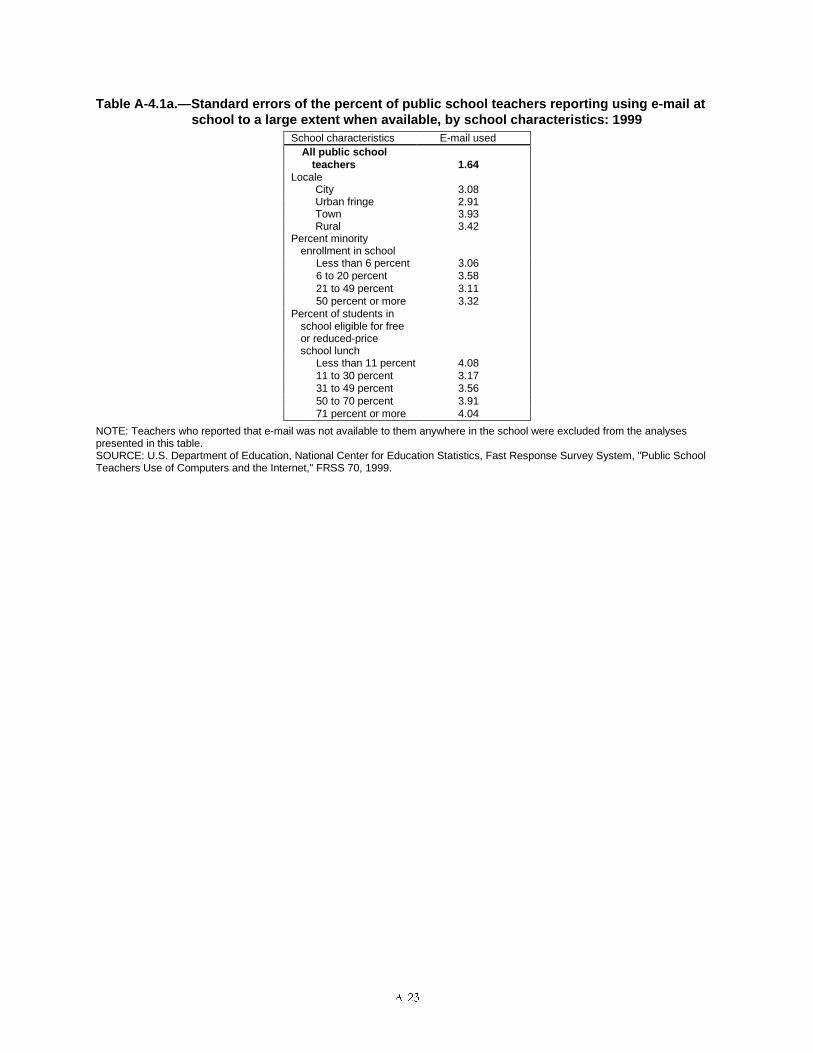
����
Table A-4.1a.—Standard errors of the percent of public school teachers reporting using e-mail atschool to a large extent when available, by school characteristics: 1999
School characteristics E-mail usedAll public school
teachers 1.64Locale
City 3.08Urban fringe 2.91Town 3.93Rural 3.42
Percent minorityenrollment in school
Less than 6 percent 3.066 to 20 percent 3.5821 to 49 percent 3.1150 percent or more 3.32
Percent of students inschool eligible for freeor reduced-priceschool lunch
Less than 11 percent 4.0811 to 30 percent 3.1731 to 49 percent 3.5650 to 70 percent 3.9171 percent or more 4.04
NOTE: Teachers who reported that e-mail was not available to them anywhere in the school were excluded from the analysespresented in this table.SOURCE: U.S. Department of Education, National Center for Education Statistics, Fast Response Survey System, "Public SchoolTeachers Use of Computers and the Internet," FRSS 70, 1999.
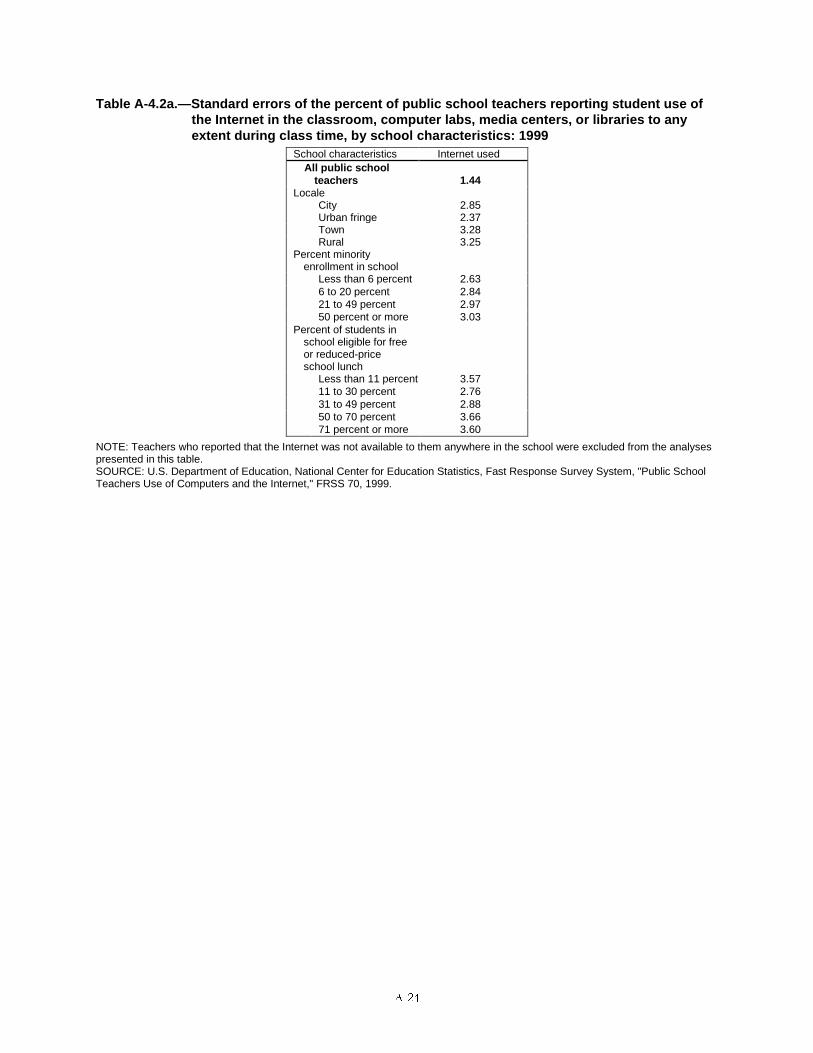
����
Table A-4.2a.—Standard errors of the percent of public school teachers reporting student use ofthe Internet in the classroom, computer labs, media centers, or libraries to anyextent during class time, by school characteristics: 1999
School characteristics Internet usedAll public school
teachers 1.44Locale
City 2.85Urban fringe 2.37Town 3.28Rural 3.25
Percent minorityenrollment in school
Less than 6 percent 2.636 to 20 percent 2.8421 to 49 percent 2.9750 percent or more 3.03
Percent of students inschool eligible for freeor reduced-priceschool lunch
Less than 11 percent 3.5711 to 30 percent 2.7631 to 49 percent 2.8850 to 70 percent 3.6671 percent or more 3.60
NOTE: Teachers who reported that the Internet was not available to them anywhere in the school were excluded from the analysespresented in this table.SOURCE: U.S. Department of Education, National Center for Education Statistics, Fast Response Survey System, "Public SchoolTeachers Use of Computers and the Internet," FRSS 70, 1999.
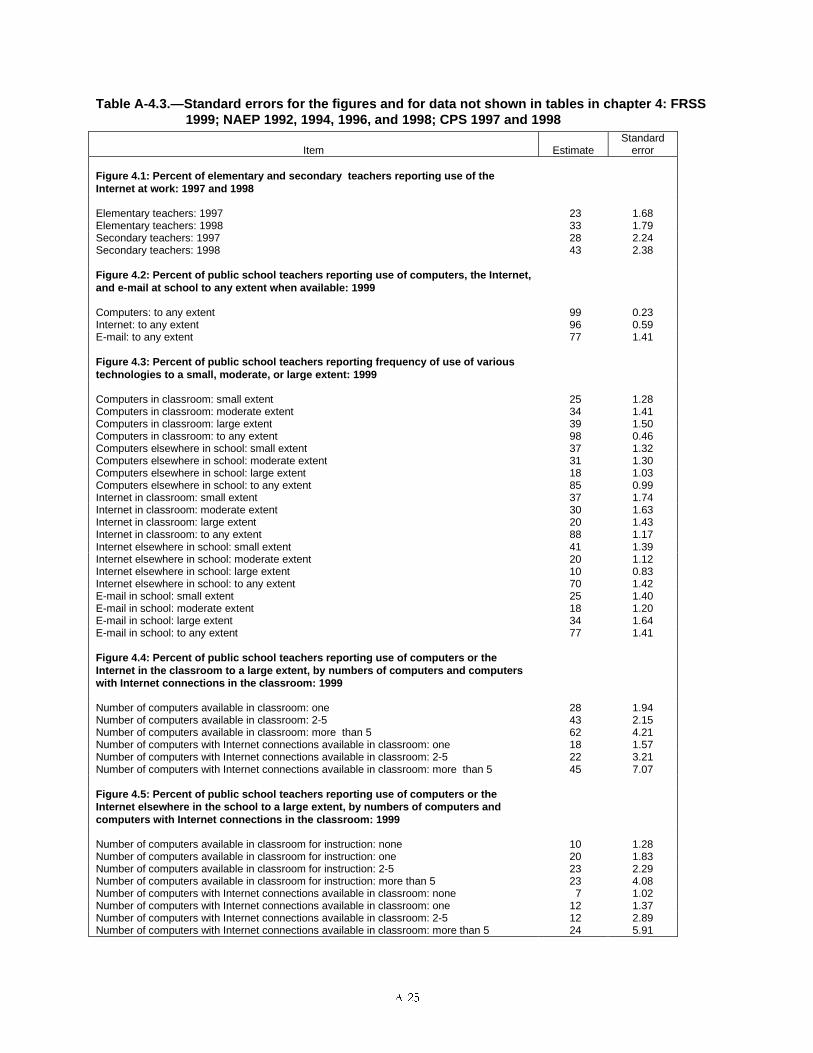
����
Table A-4.3.—Standard errors for the figures and for data not shown in tables in chapter 4: FRSS1999; NAEP 1992, 1994, 1996, and 1998; CPS 1997 and 1998
Item EstimateStandard
error
Figure 4.1: Percent of elementary and secondary teachers reporting use of theInternet at work: 1997 and 1998
Elementary teachers: 1997 23 1.68Elementary teachers: 1998 33 1.79Secondary teachers: 1997 28 2.24Secondary teachers: 1998 43 2.38
Figure 4.2: Percent of public school teachers reporting use of computers, the Internet,and e-mail at school to any extent when available: 1999
Computers: to any extent 99 0.23Internet: to any extent 96 0.59E-mail: to any extent 77 1.41
Figure 4.3: Percent of public school teachers reporting frequency of use of varioustechnologies to a small, moderate, or large extent: 1999
Computers in classroom: small extent 25 1.28Computers in classroom: moderate extent 34 1.41Computers in classroom: large extent 39 1.50Computers in classroom: to any extent 98 0.46Computers elsewhere in school: small extent 37 1.32Computers elsewhere in school: moderate extent 31 1.30Computers elsewhere in school: large extent 18 1.03Computers elsewhere in school: to any extent 85 0.99Internet in classroom: small extent 37 1.74Internet in classroom: moderate extent 30 1.63Internet in classroom: large extent 20 1.43Internet in classroom: to any extent 88 1.17Internet elsewhere in school: small extent 41 1.39Internet elsewhere in school: moderate extent 20 1.12Internet elsewhere in school: large extent 10 0.83Internet elsewhere in school: to any extent 70 1.42E-mail in school: small extent 25 1.40E-mail in school: moderate extent 18 1.20E-mail in school: large extent 34 1.64E-mail in school: to any extent 77 1.41
Figure 4.4: Percent of public school teachers reporting use of computers or theInternet in the classroom to a large extent, by numbers of computers and computerswith Internet connections in the classroom: 1999
Number of computers available in classroom: one 28 1.94Number of computers available in classroom: 2-5 43 2.15Number of computers available in classroom: more than 5 62 4.21Number of computers with Internet connections available in classroom: one 18 1.57Number of computers with Internet connections available in classroom: 2-5 22 3.21Number of computers with Internet connections available in classroom: more than 5 45 7.07
Figure 4.5: Percent of public school teachers reporting use of computers or theInternet elsewhere in the school to a large extent, by numbers of computers andcomputers with Internet connections in the classroom: 1999
Number of computers available in classroom for instruction: none 10 1.28Number of computers available in classroom for instruction: one 20 1.83Number of computers available in classroom for instruction: 2-5 23 2.29Number of computers available in classroom for instruction: more than 5 23 4.08Number of computers with Internet connections available in classroom: none 7 1.02Number of computers with Internet connections available in classroom: one 12 1.37Number of computers with Internet connections available in classroom: 2-5 12 2.89Number of computers with Internet connections available in classroom: more than 5 24 5.91
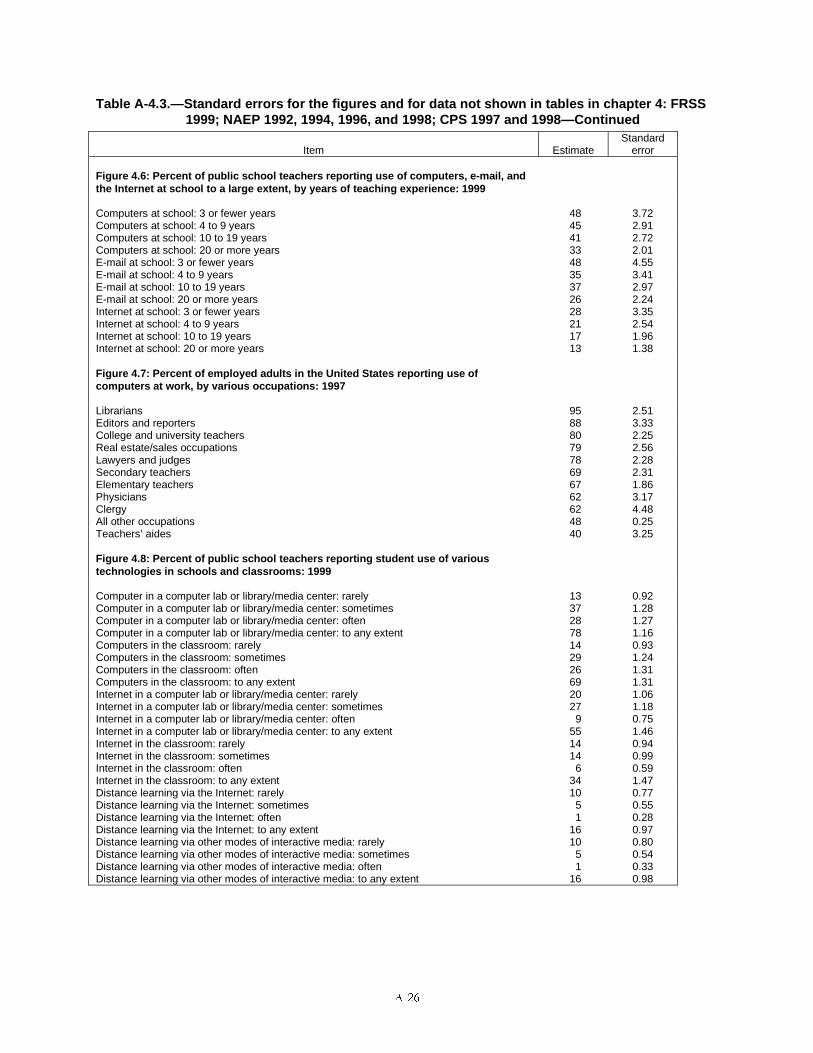
����
Table A-4.3.—Standard errors for the figures and for data not shown in tables in chapter 4: FRSS1999; NAEP 1992, 1994, 1996, and 1998; CPS 1997 and 1998—Continued
Item EstimateStandard
error
Figure 4.6: Percent of public school teachers reporting use of computers, e-mail, andthe Internet at school to a large extent, by years of teaching experience: 1999
Computers at school: 3 or fewer years 48 3.72Computers at school: 4 to 9 years 45 2.91Computers at school: 10 to 19 years 41 2.72Computers at school: 20 or more years 33 2.01E-mail at school: 3 or fewer years 48 4.55E-mail at school: 4 to 9 years 35 3.41E-mail at school: 10 to 19 years 37 2.97E-mail at school: 20 or more years 26 2.24Internet at school: 3 or fewer years 28 3.35Internet at school: 4 to 9 years 21 2.54Internet at school: 10 to 19 years 17 1.96Internet at school: 20 or more years 13 1.38
Figure 4.7: Percent of employed adults in the United States reporting use ofcomputers at work, by various occupations: 1997
Librarians 95 2.51Editors and reporters 88 3.33College and university teachers 80 2.25Real estate/sales occupations 79 2.56Lawyers and judges 78 2.28Secondary teachers 69 2.31Elementary teachers 67 1.86Physicians 62 3.17Clergy 62 4.48All other occupations 48 0.25Teachers’ aides 40 3.25
Figure 4.8: Percent of public school teachers reporting student use of varioustechnologies in schools and classrooms: 1999
Computer in a computer lab or library/media center: rarely 13 0.92Computer in a computer lab or library/media center: sometimes 37 1.28Computer in a computer lab or library/media center: often 28 1.27Computer in a computer lab or library/media center: to any extent 78 1.16Computers in the classroom: rarely 14 0.93Computers in the classroom: sometimes 29 1.24Computers in the classroom: often 26 1.31Computers in the classroom: to any extent 69 1.31Internet in a computer lab or library/media center: rarely 20 1.06Internet in a computer lab or library/media center: sometimes 27 1.18Internet in a computer lab or library/media center: often 9 0.75Internet in a computer lab or library/media center: to any extent 55 1.46Internet in the classroom: rarely 14 0.94Internet in the classroom: sometimes 14 0.99Internet in the classroom: often 6 0.59Internet in the classroom: to any extent 34 1.47Distance learning via the Internet: rarely 10 0.77Distance learning via the Internet: sometimes 5 0.55Distance learning via the Internet: often 1 0.28Distance learning via the Internet: to any extent 16 0.97Distance learning via other modes of interactive media: rarely 10 0.80Distance learning via other modes of interactive media: sometimes 5 0.54Distance learning via other modes of interactive media: often 1 0.33Distance learning via other modes of interactive media: to any extent 16 0.98
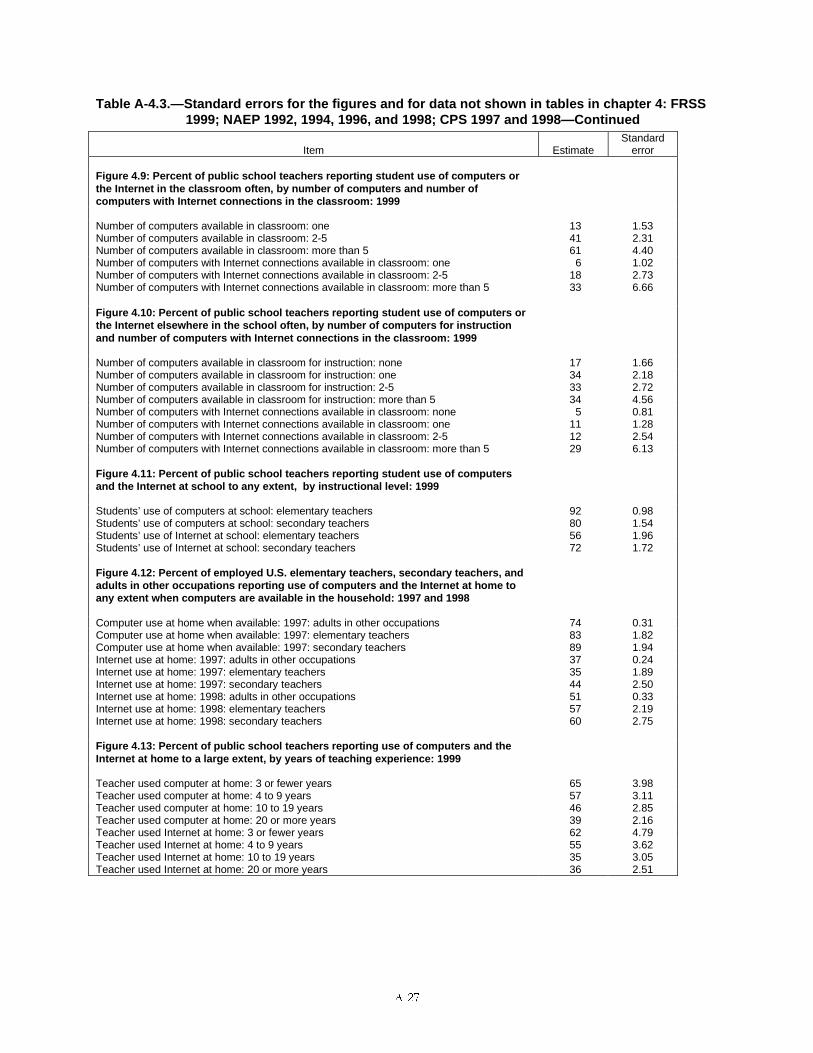
���
Table A-4.3.—Standard errors for the figures and for data not shown in tables in chapter 4: FRSS1999; NAEP 1992, 1994, 1996, and 1998; CPS 1997 and 1998—Continued
Item EstimateStandard
error
Figure 4.9: Percent of public school teachers reporting student use of computers orthe Internet in the classroom often, by number of computers and number ofcomputers with Internet connections in the classroom: 1999
Number of computers available in classroom: one 13 1.53Number of computers available in classroom: 2-5 41 2.31Number of computers available in classroom: more than 5 61 4.40Number of computers with Internet connections available in classroom: one 6 1.02Number of computers with Internet connections available in classroom: 2-5 18 2.73Number of computers with Internet connections available in classroom: more than 5 33 6.66
Figure 4.10: Percent of public school teachers reporting student use of computers orthe Internet elsewhere in the school often, by number of computers for instructionand number of computers with Internet connections in the classroom: 1999
Number of computers available in classroom for instruction: none 17 1.66Number of computers available in classroom for instruction: one 34 2.18Number of computers available in classroom for instruction: 2-5 33 2.72Number of computers available in classroom for instruction: more than 5 34 4.56Number of computers with Internet connections available in classroom: none 5 0.81Number of computers with Internet connections available in classroom: one 11 1.28Number of computers with Internet connections available in classroom: 2-5 12 2.54Number of computers with Internet connections available in classroom: more than 5 29 6.13
Figure 4.11: Percent of public school teachers reporting student use of computersand the Internet at school to any extent, by instructional level: 1999
Students’ use of computers at school: elementary teachers 92 0.98Students’ use of computers at school: secondary teachers 80 1.54Students’ use of Internet at school: elementary teachers 56 1.96Students’ use of Internet at school: secondary teachers 72 1.72
Figure 4.12: Percent of employed U.S. elementary teachers, secondary teachers, andadults in other occupations reporting use of computers and the Internet at home toany extent when computers are available in the household: 1997 and 1998
Computer use at home when available: 1997: adults in other occupations 74 0.31Computer use at home when available: 1997: elementary teachers 83 1.82Computer use at home when available: 1997: secondary teachers 89 1.94Internet use at home: 1997: adults in other occupations 37 0.24Internet use at home: 1997: elementary teachers 35 1.89Internet use at home: 1997: secondary teachers 44 2.50Internet use at home: 1998: adults in other occupations 51 0.33Internet use at home: 1998: elementary teachers 57 2.19Internet use at home: 1998: secondary teachers 60 2.75
Figure 4.13: Percent of public school teachers reporting use of computers and theInternet at home to a large extent, by years of teaching experience: 1999
Teacher used computer at home: 3 or fewer years 65 3.98Teacher used computer at home: 4 to 9 years 57 3.11Teacher used computer at home: 10 to 19 years 46 2.85Teacher used computer at home: 20 or more years 39 2.16Teacher used Internet at home: 3 or fewer years 62 4.79Teacher used Internet at home: 4 to 9 years 55 3.62Teacher used Internet at home: 10 to 19 years 35 3.05Teacher used Internet at home: 20 or more years 36 2.51
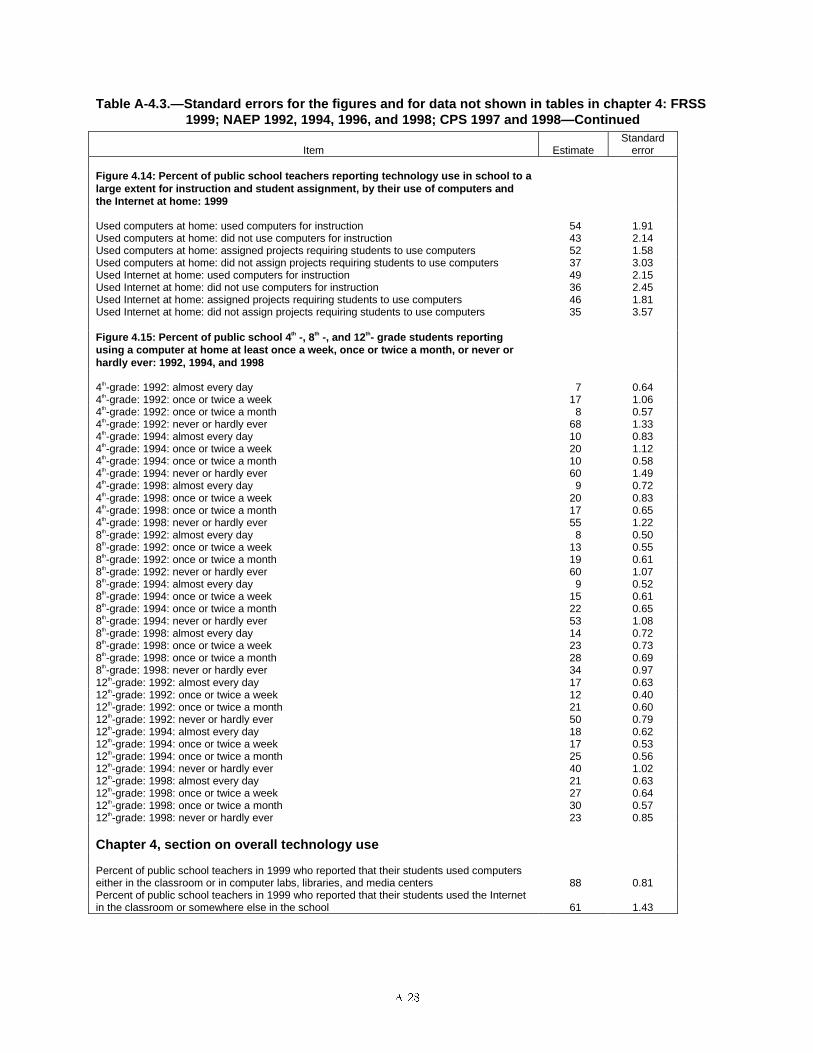
���
Table A-4.3.—Standard errors for the figures and for data not shown in tables in chapter 4: FRSS1999; NAEP 1992, 1994, 1996, and 1998; CPS 1997 and 1998—Continued
Item EstimateStandard
error
Figure 4.14: Percent of public school teachers reporting technology use in school to alarge extent for instruction and student assignment, by their use of computers andthe Internet at home: 1999
Used computers at home: used computers for instruction 54 1.91Used computers at home: did not use computers for instruction 43 2.14Used computers at home: assigned projects requiring students to use computers 52 1.58Used computers at home: did not assign projects requiring students to use computers 37 3.03Used Internet at home: used computers for instruction 49 2.15Used Internet at home: did not use computers for instruction 36 2.45Used Internet at home: assigned projects requiring students to use computers 46 1.81Used Internet at home: did not assign projects requiring students to use computers 35 3.57
Figure 4.15: Percent of public school 4th -, 8th -, and 12th- grade students reportingusing a computer at home at least once a week, once or twice a month, or never orhardly ever: 1992, 1994, and 1998
4th-grade: 1992: almost every day 7 0.644th-grade: 1992: once or twice a week 17 1.064th-grade: 1992: once or twice a month 8 0.574th-grade: 1992: never or hardly ever 68 1.334th-grade: 1994: almost every day 10 0.834th-grade: 1994: once or twice a week 20 1.124th-grade: 1994: once or twice a month 10 0.584th-grade: 1994: never or hardly ever 60 1.494th-grade: 1998: almost every day 9 0.724th-grade: 1998: once or twice a week 20 0.834th-grade: 1998: once or twice a month 17 0.654th-grade: 1998: never or hardly ever 55 1.228th-grade: 1992: almost every day 8 0.508th-grade: 1992: once or twice a week 13 0.558th-grade: 1992: once or twice a month 19 0.618th-grade: 1992: never or hardly ever 60 1.078th-grade: 1994: almost every day 9 0.528th-grade: 1994: once or twice a week 15 0.618th-grade: 1994: once or twice a month 22 0.658th-grade: 1994: never or hardly ever 53 1.088th-grade: 1998: almost every day 14 0.728th-grade: 1998: once or twice a week 23 0.738th-grade: 1998: once or twice a month 28 0.698th-grade: 1998: never or hardly ever 34 0.9712th-grade: 1992: almost every day 17 0.6312th-grade: 1992: once or twice a week 12 0.4012th-grade: 1992: once or twice a month 21 0.6012th-grade: 1992: never or hardly ever 50 0.7912th-grade: 1994: almost every day 18 0.6212th-grade: 1994: once or twice a week 17 0.5312th-grade: 1994: once or twice a month 25 0.5612th-grade: 1994: never or hardly ever 40 1.0212th-grade: 1998: almost every day 21 0.6312th-grade: 1998: once or twice a week 27 0.6412th-grade: 1998: once or twice a month 30 0.5712th-grade: 1998: never or hardly ever 23 0.85
Chapter 4, section on overall technology use
Percent of public school teachers in 1999 who reported that their students used computerseither in the classroom or in computer labs, libraries, and media centers 88 0.81Percent of public school teachers in 1999 who reported that their students used the Internetin the classroom or somewhere else in the school 61 1.43
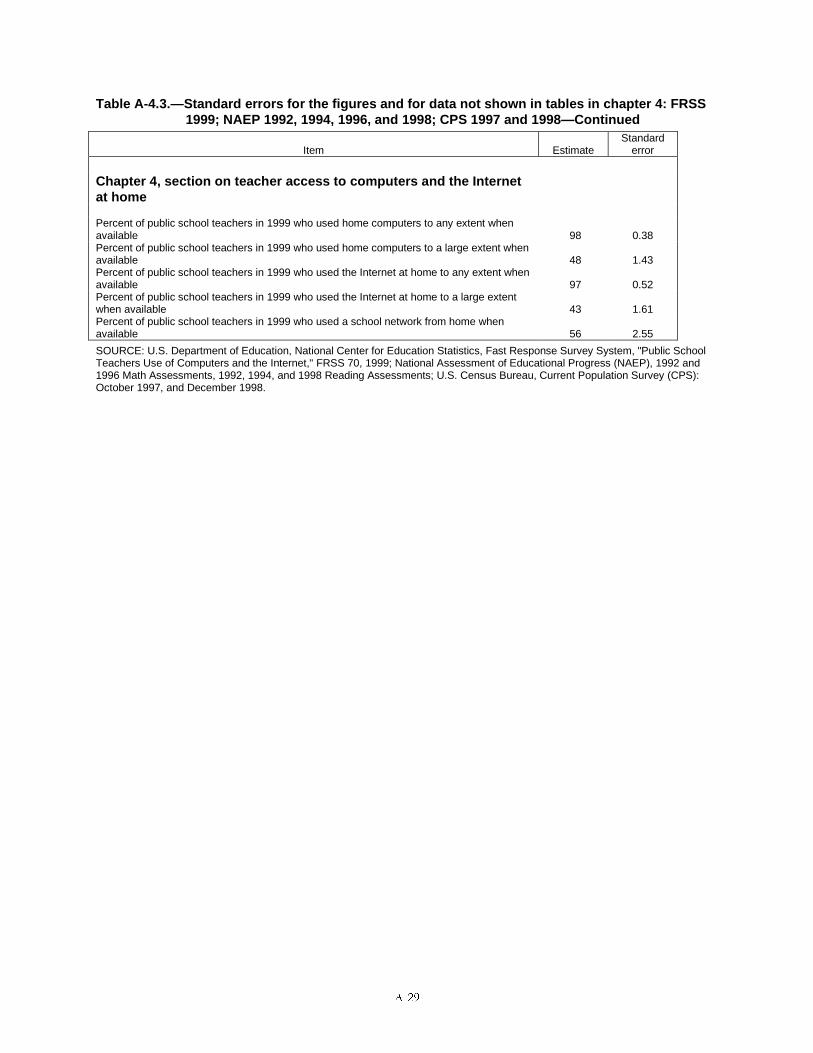
����
Table A-4.3.—Standard errors for the figures and for data not shown in tables in chapter 4: FRSS1999; NAEP 1992, 1994, 1996, and 1998; CPS 1997 and 1998—Continued
Item EstimateStandard
error
Chapter 4, section on teacher access to computers and the Internetat home
Percent of public school teachers in 1999 who used home computers to any extent whenavailable 98 0.38Percent of public school teachers in 1999 who used home computers to a large extent whenavailable 48 1.43Percent of public school teachers in 1999 who used the Internet at home to any extent whenavailable 97 0.52Percent of public school teachers in 1999 who used the Internet at home to a large extentwhen available 43 1.61Percent of public school teachers in 1999 who used a school network from home whenavailable 56 2.55
SOURCE: U.S. Department of Education, National Center for Education Statistics, Fast Response Survey System, "Public SchoolTeachers Use of Computers and the Internet," FRSS 70, 1999; National Assessment of Educational Progress (NAEP), 1992 and1996 Math Assessments, 1992, 1994, and 1998 Reading Assessments; U.S. Census Bureau, Current Population Survey (CPS):October 1997, and December 1998.
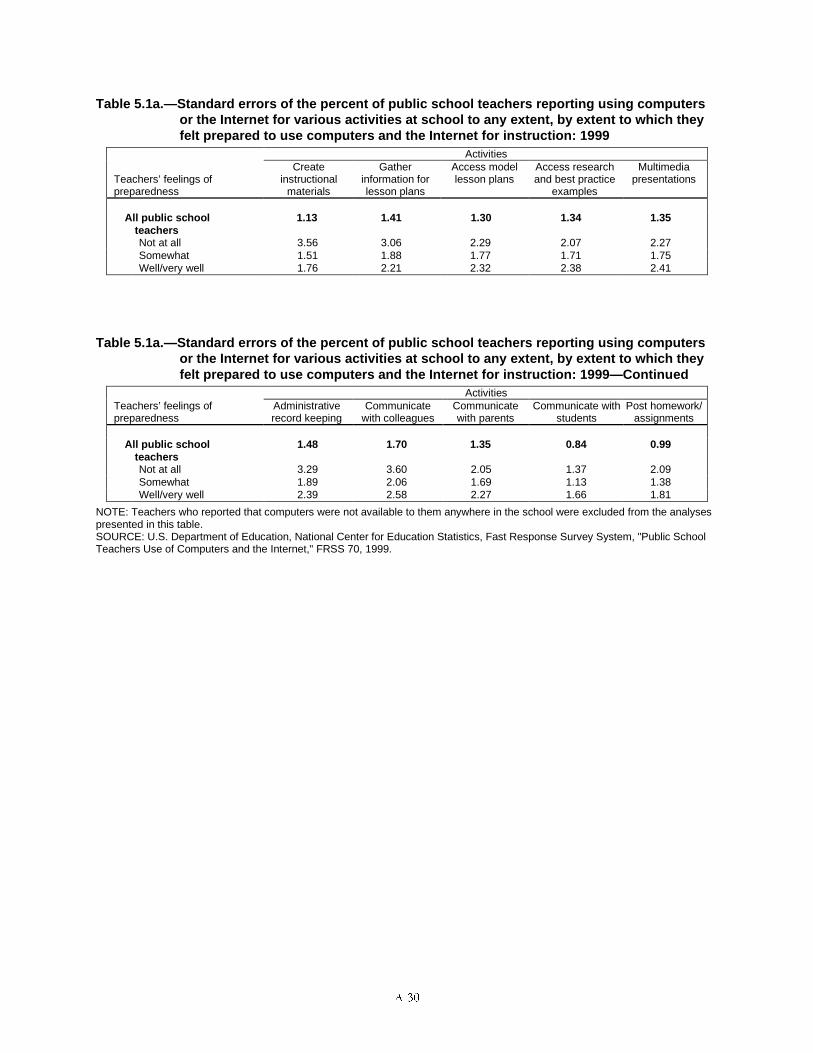
����
Table 5.1a.—Standard errors of the percent of public school teachers reporting using computersor the Internet for various activities at school to any extent, by extent to which theyfelt prepared to use computers and the Internet for instruction: 1999
Activities
Teachers’ feelings ofpreparedness
Createinstructional
materials
Gatherinformation forlesson plans
Access modellesson plans
Access researchand best practice
examples
Multimediapresentations
All public schoolteachers
1.13 1.41 1.30 1.34 1.35
Not at all 3.56 3.06 2.29 2.07 2.27Somewhat 1.51 1.88 1.77 1.71 1.75Well/very well 1.76 2.21 2.32 2.38 2.41
Table 5.1a.—Standard errors of the percent of public school teachers reporting using computersor the Internet for various activities at school to any extent, by extent to which theyfelt prepared to use computers and the Internet for instruction: 1999—Continued
ActivitiesTeachers’ feelings ofpreparedness
Administrativerecord keeping
Communicatewith colleagues
Communicatewith parents
Communicate withstudents
Post homework/assignments
All public schoolteachers
1.48 1.70 1.35 0.84 0.99
Not at all 3.29 3.60 2.05 1.37 2.09Somewhat 1.89 2.06 1.69 1.13 1.38Well/very well 2.39 2.58 2.27 1.66 1.81
NOTE: Teachers who reported that computers were not available to them anywhere in the school were excluded from the analysespresented in this table.SOURCE: U.S. Department of Education, National Center for Education Statistics, Fast Response Survey System, "Public SchoolTeachers Use of Computers and the Internet," FRSS 70, 1999.
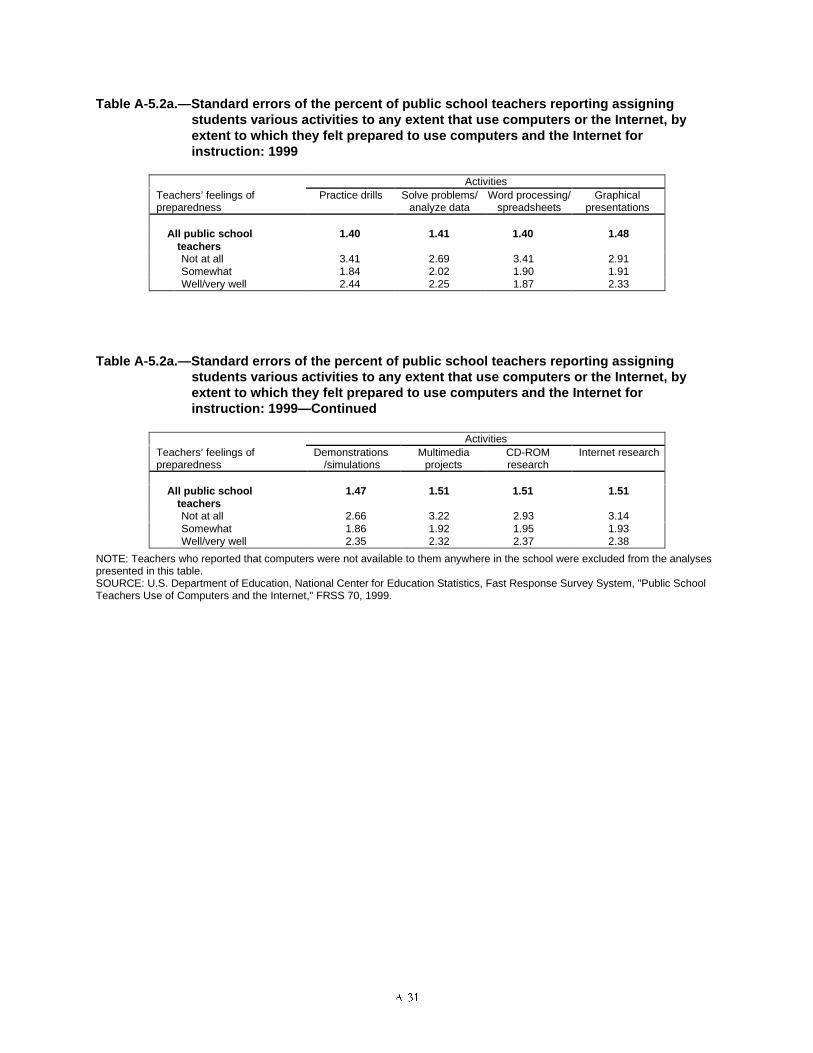
����
Table A-5.2a.—Standard errors of the percent of public school teachers reporting assigningstudents various activities to any extent that use computers or the Internet, byextent to which they felt prepared to use computers and the Internet forinstruction: 1999
ActivitiesTeachers’ feelings ofpreparedness
Practice drills Solve problems/analyze data
Word processing/spreadsheets
Graphicalpresentations
All public schoolteachers
1.40 1.41 1.40 1.48
Not at all 3.41 2.69 3.41 2.91Somewhat 1.84 2.02 1.90 1.91Well/very well 2.44 2.25 1.87 2.33
Table A-5.2a.—Standard errors of the percent of public school teachers reporting assigningstudents various activities to any extent that use computers or the Internet, byextent to which they felt prepared to use computers and the Internet forinstruction: 1999—Continued
ActivitiesTeachers’ feelings ofpreparedness
Demonstrations/simulations
Multimediaprojects
CD-ROMresearch
Internet research
All public schoolteachers
1.47 1.51 1.51 1.51
Not at all 2.66 3.22 2.93 3.14Somewhat 1.86 1.92 1.95 1.93Well/very well 2.35 2.32 2.37 2.38
NOTE: Teachers who reported that computers were not available to them anywhere in the school were excluded from the analysespresented in this table.SOURCE: U.S. Department of Education, National Center for Education Statistics, Fast Response Survey System, "Public SchoolTeachers Use of Computers and the Internet," FRSS 70, 1999.
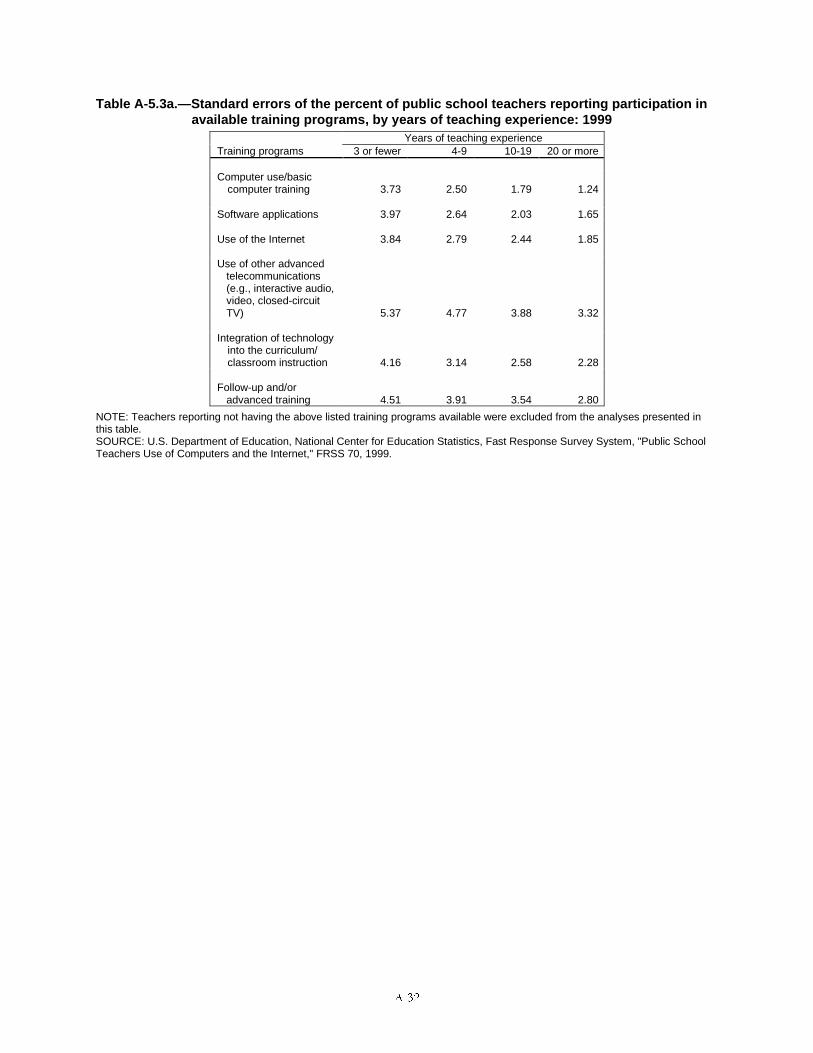
����
Table A-5.3a.—Standard errors of the percent of public school teachers reporting participation inavailable training programs, by years of teaching experience: 1999
Years of teaching experienceTraining programs 3 or fewer 4-9 10-19 20 or more
Computer use/basiccomputer training 3.73 2.50 1.79 1.24
Software applications 3.97 2.64 2.03 1.65
Use of the Internet 3.84 2.79 2.44 1.85
Use of other advancedtelecommunications(e.g., interactive audio,video, closed-circuitTV) 5.37 4.77 3.88 3.32
Integration of technologyinto the curriculum/classroom instruction 4.16 3.14 2.58 2.28
Follow-up and/oradvanced training 4.51 3.91 3.54 2.80
NOTE: Teachers reporting not having the above listed training programs available were excluded from the analyses presented inthis table.SOURCE: U.S. Department of Education, National Center for Education Statistics, Fast Response Survey System, "Public SchoolTeachers Use of Computers and the Internet," FRSS 70, 1999.
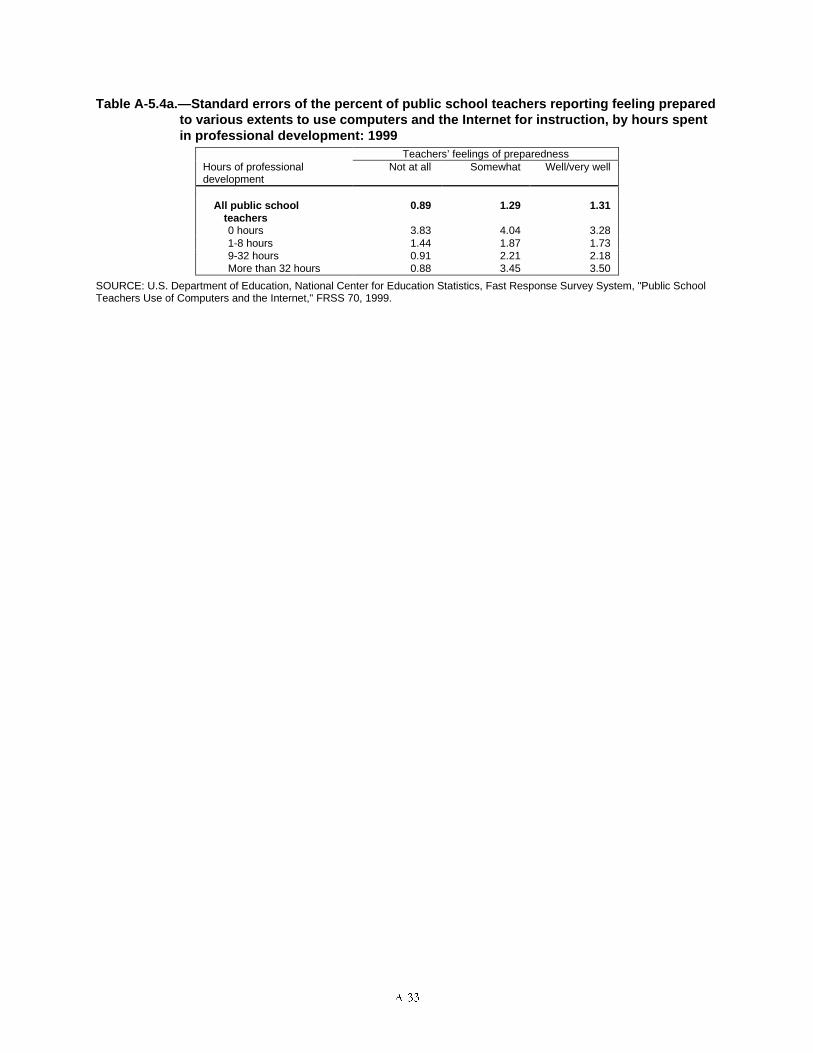
����
Table A-5.4a.—Standard errors of the percent of public school teachers reporting feeling preparedto various extents to use computers and the Internet for instruction, by hours spentin professional development: 1999
Teachers’ feelings of preparednessHours of professionaldevelopment
Not at all Somewhat Well/very well
All public schoolteachers
0.89 1.29 1.31
0 hours 3.83 4.04 3.281-8 hours 1.44 1.87 1.739-32 hours 0.91 2.21 2.18More than 32 hours 0.88 3.45 3.50
SOURCE: U.S. Department of Education, National Center for Education Statistics, Fast Response Survey System, "Public SchoolTeachers Use of Computers and the Internet," FRSS 70, 1999.
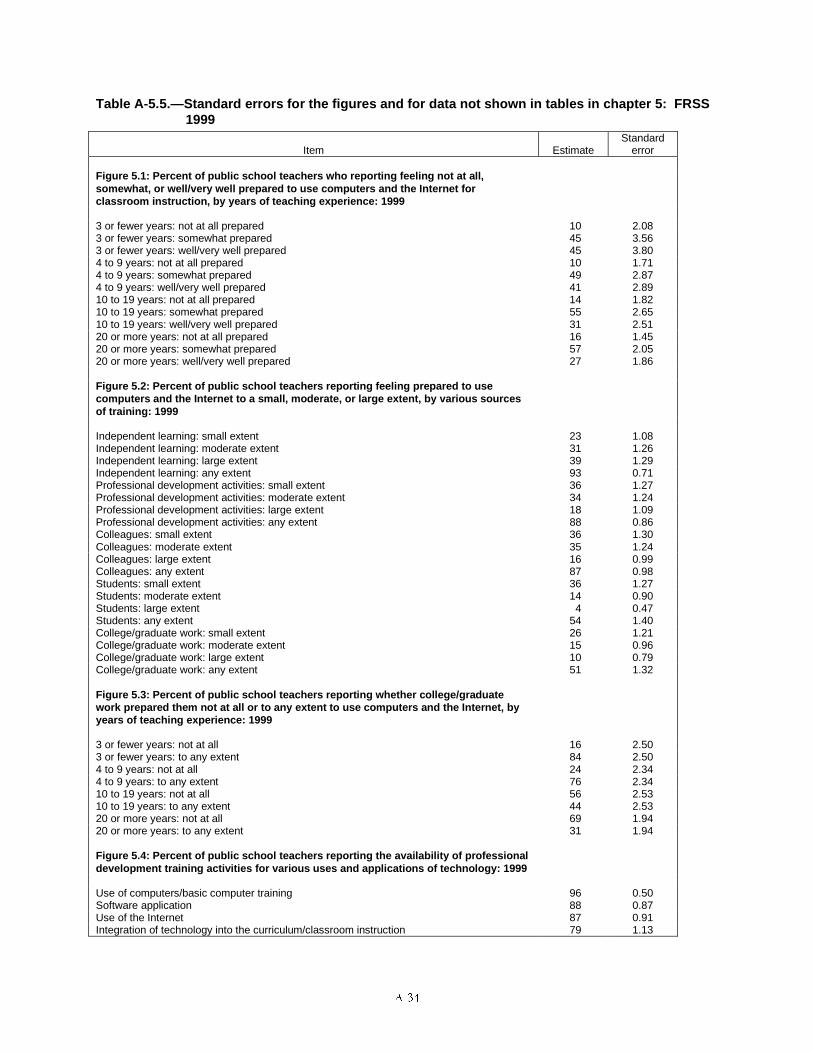
����
Table A-5.5.—Standard errors for the figures and for data not shown in tables in chapter 5: FRSS1999
Item EstimateStandard
error
Figure 5.1: Percent of public school teachers who reporting feeling not at all,somewhat, or well/very well prepared to use computers and the Internet forclassroom instruction, by years of teaching experience: 1999
3 or fewer years: not at all prepared 10 2.083 or fewer years: somewhat prepared 45 3.563 or fewer years: well/very well prepared 45 3.804 to 9 years: not at all prepared 10 1.714 to 9 years: somewhat prepared 49 2.874 to 9 years: well/very well prepared 41 2.8910 to 19 years: not at all prepared 14 1.8210 to 19 years: somewhat prepared 55 2.6510 to 19 years: well/very well prepared 31 2.5120 or more years: not at all prepared 16 1.4520 or more years: somewhat prepared 57 2.0520 or more years: well/very well prepared 27 1.86
Figure 5.2: Percent of public school teachers reporting feeling prepared to usecomputers and the Internet to a small, moderate, or large extent, by various sourcesof training: 1999
Independent learning: small extent 23 1.08Independent learning: moderate extent 31 1.26Independent learning: large extent 39 1.29Independent learning: any extent 93 0.71Professional development activities: small extent 36 1.27Professional development activities: moderate extent 34 1.24Professional development activities: large extent 18 1.09Professional development activities: any extent 88 0.86Colleagues: small extent 36 1.30Colleagues: moderate extent 35 1.24Colleagues: large extent 16 0.99Colleagues: any extent 87 0.98Students: small extent 36 1.27Students: moderate extent 14 0.90Students: large extent 4 0.47Students: any extent 54 1.40College/graduate work: small extent 26 1.21College/graduate work: moderate extent 15 0.96College/graduate work: large extent 10 0.79College/graduate work: any extent 51 1.32
Figure 5.3: Percent of public school teachers reporting whether college/graduatework prepared them not at all or to any extent to use computers and the Internet, byyears of teaching experience: 1999
3 or fewer years: not at all 16 2.503 or fewer years: to any extent 84 2.504 to 9 years: not at all 24 2.344 to 9 years: to any extent 76 2.3410 to 19 years: not at all 56 2.5310 to 19 years: to any extent 44 2.5320 or more years: not at all 69 1.9420 or more years: to any extent 31 1.94
Figure 5.4: Percent of public school teachers reporting the availability of professionaldevelopment training activities for various uses and applications of technology: 1999
Use of computers/basic computer training 96 0.50Software application 88 0.87Use of the Internet 87 0.91Integration of technology into the curriculum/classroom instruction 79 1.13
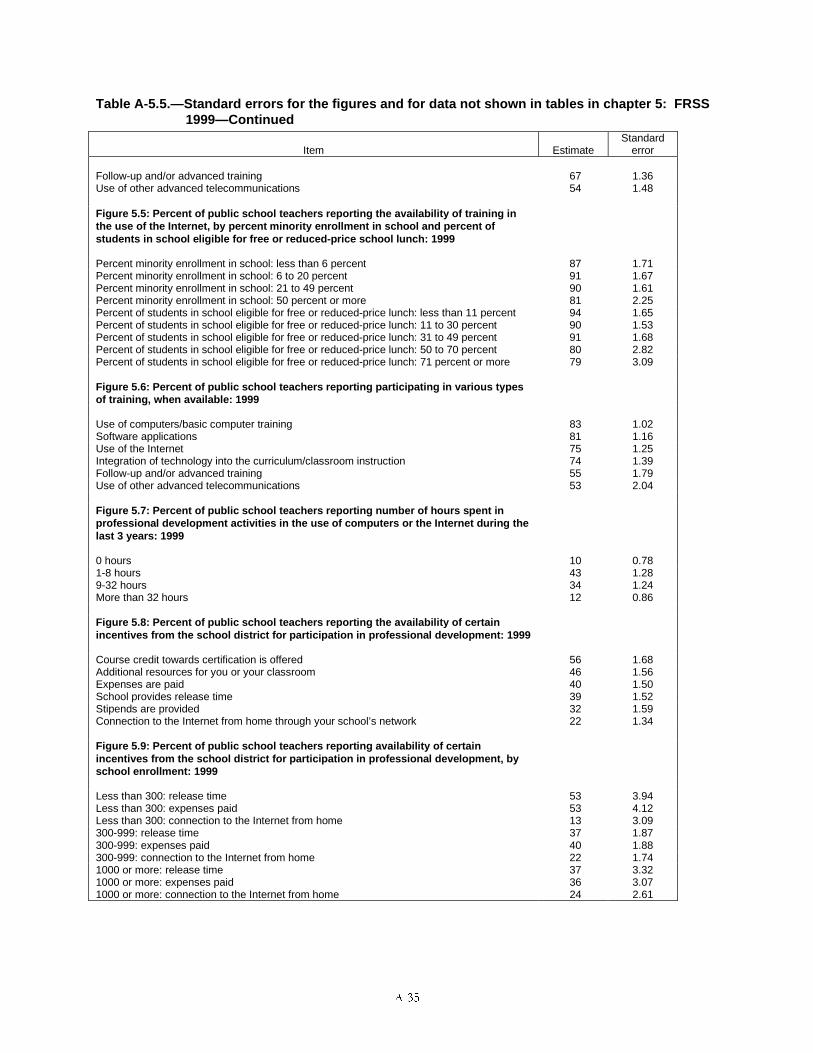
����
Table A-5.5.—Standard errors for the figures and for data not shown in tables in chapter 5: FRSS1999—Continued
Item EstimateStandard
error
Follow-up and/or advanced training 67 1.36Use of other advanced telecommunications 54 1.48
Figure 5.5: Percent of public school teachers reporting the availability of training inthe use of the Internet, by percent minority enrollment in school and percent ofstudents in school eligible for free or reduced-price school lunch: 1999
Percent minority enrollment in school: less than 6 percent 87 1.71Percent minority enrollment in school: 6 to 20 percent 91 1.67Percent minority enrollment in school: 21 to 49 percent 90 1.61Percent minority enrollment in school: 50 percent or more 81 2.25Percent of students in school eligible for free or reduced-price lunch: less than 11 percent 94 1.65Percent of students in school eligible for free or reduced-price lunch: 11 to 30 percent 90 1.53Percent of students in school eligible for free or reduced-price lunch: 31 to 49 percent 91 1.68Percent of students in school eligible for free or reduced-price lunch: 50 to 70 percent 80 2.82Percent of students in school eligible for free or reduced-price lunch: 71 percent or more 79 3.09
Figure 5.6: Percent of public school teachers reporting participating in various typesof training, when available: 1999
Use of computers/basic computer training 83 1.02Software applications 81 1.16Use of the Internet 75 1.25Integration of technology into the curriculum/classroom instruction 74 1.39Follow-up and/or advanced training 55 1.79Use of other advanced telecommunications 53 2.04
Figure 5.7: Percent of public school teachers reporting number of hours spent inprofessional development activities in the use of computers or the Internet during thelast 3 years: 1999
0 hours 10 0.781-8 hours 43 1.289-32 hours 34 1.24More than 32 hours 12 0.86
Figure 5.8: Percent of public school teachers reporting the availability of certainincentives from the school district for participation in professional development: 1999
Course credit towards certification is offered 56 1.68Additional resources for you or your classroom 46 1.56Expenses are paid 40 1.50School provides release time 39 1.52Stipends are provided 32 1.59Connection to the Internet from home through your school’s network 22 1.34
Figure 5.9: Percent of public school teachers reporting availability of certainincentives from the school district for participation in professional development, byschool enrollment: 1999
Less than 300: release time 53 3.94Less than 300: expenses paid 53 4.12Less than 300: connection to the Internet from home 13 3.09300-999: release time 37 1.87300-999: expenses paid 40 1.88300-999: connection to the Internet from home 22 1.741000 or more: release time 37 3.321000 or more: expenses paid 36 3.071000 or more: connection to the Internet from home 24 2.61
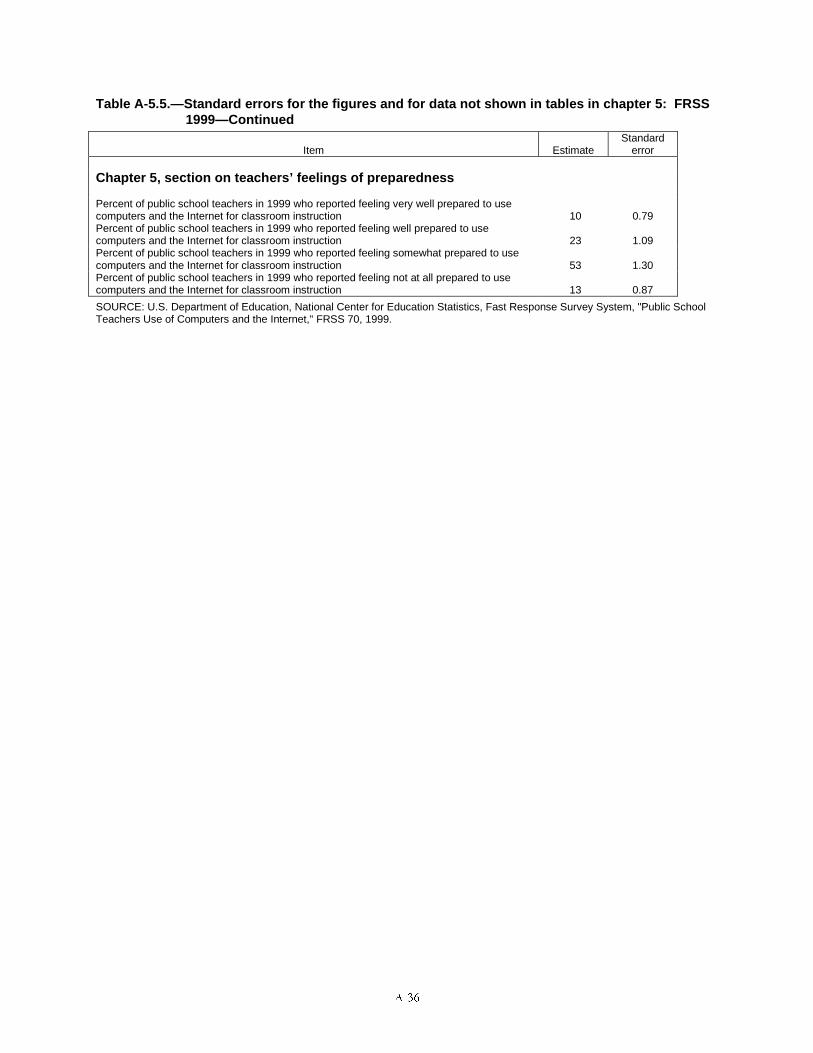
����
Table A-5.5.—Standard errors for the figures and for data not shown in tables in chapter 5: FRSS1999—Continued
Item EstimateStandard
error
Chapter 5, section on teachers’ feelings of preparedness
Percent of public school teachers in 1999 who reported feeling very well prepared to usecomputers and the Internet for classroom instruction 10 0.79Percent of public school teachers in 1999 who reported feeling well prepared to usecomputers and the Internet for classroom instruction 23 1.09Percent of public school teachers in 1999 who reported feeling somewhat prepared to usecomputers and the Internet for classroom instruction 53 1.30Percent of public school teachers in 1999 who reported feeling not at all prepared to usecomputers and the Internet for classroom instruction 13 0.87
SOURCE: U.S. Department of Education, National Center for Education Statistics, Fast Response Survey System, "Public SchoolTeachers Use of Computers and the Internet," FRSS 70, 1999.
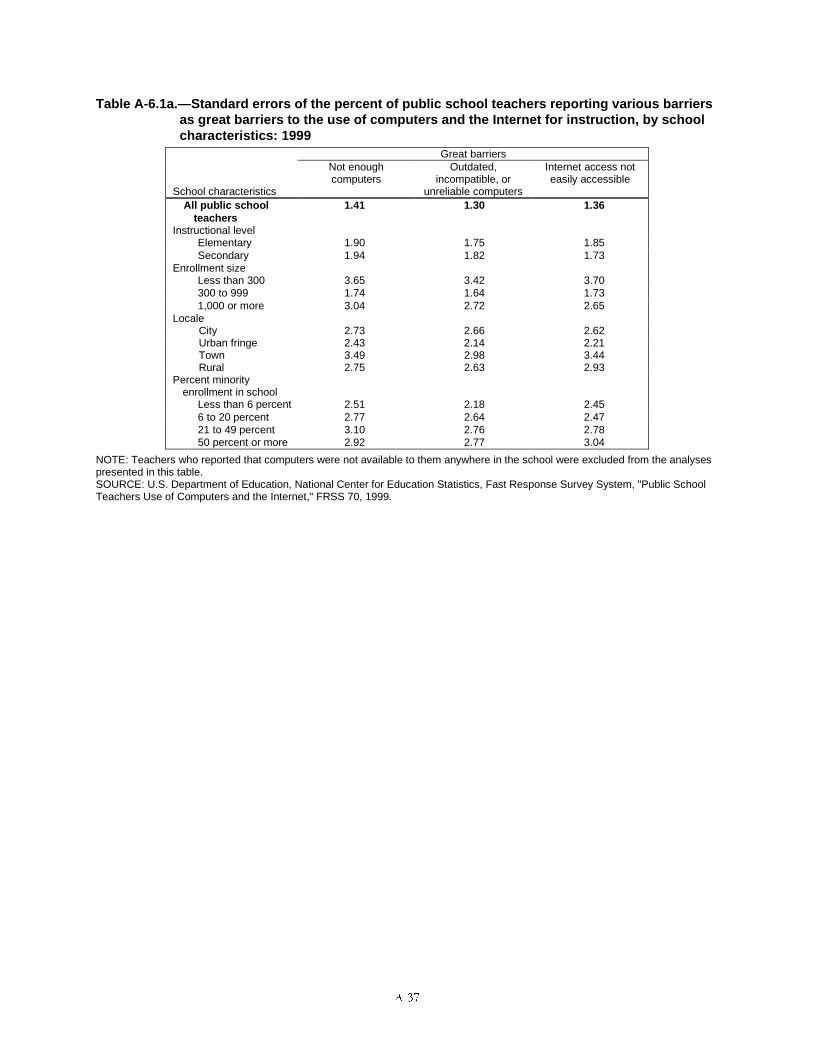
���
Table A-6.1a.—Standard errors of the percent of public school teachers reporting various barriersas great barriers to the use of computers and the Internet for instruction, by schoolcharacteristics: 1999
Great barriers
School characteristics
Not enoughcomputers
Outdated,incompatible, or
unreliable computers
Internet access noteasily accessible
All public schoolteachers
1.41 1.30 1.36
Instructional levelElementary 1.90 1.75 1.85Secondary 1.94 1.82 1.73
Enrollment sizeLess than 300 3.65 3.42 3.70300 to 999 1.74 1.64 1.731,000 or more 3.04 2.72 2.65
LocaleCity 2.73 2.66 2.62Urban fringe 2.43 2.14 2.21Town 3.49 2.98 3.44Rural 2.75 2.63 2.93
Percent minorityenrollment in school
Less than 6 percent 2.51 2.18 2.456 to 20 percent 2.77 2.64 2.4721 to 49 percent 3.10 2.76 2.7850 percent or more 2.92 2.77 3.04
NOTE: Teachers who reported that computers were not available to them anywhere in the school were excluded from the analysespresented in this table.SOURCE: U.S. Department of Education, National Center for Education Statistics, Fast Response Survey System, "Public SchoolTeachers Use of Computers and the Internet," FRSS 70, 1999.
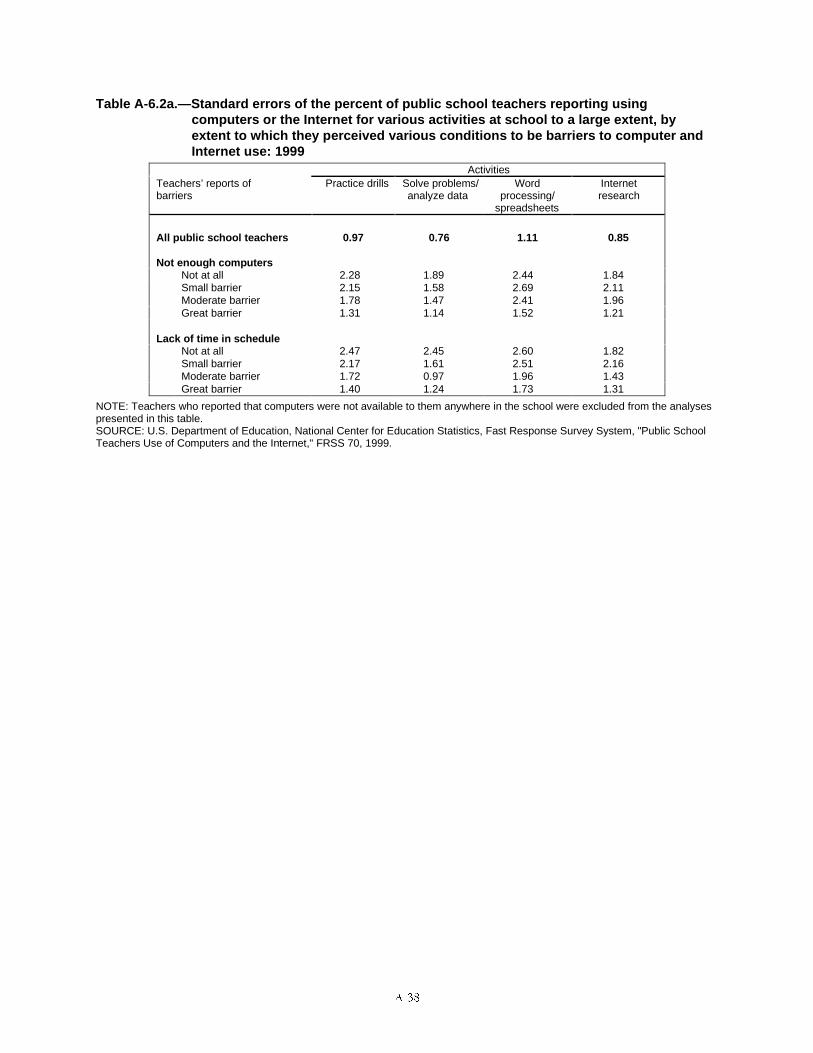
���
Table A-6.2a.—Standard errors of the percent of public school teachers reporting usingcomputers or the Internet for various activities at school to a large extent, byextent to which they perceived various conditions to be barriers to computer andInternet use: 1999
ActivitiesTeachers’ reports ofbarriers
Practice drills Solve problems/analyze data
Wordprocessing/
spreadsheets
Internetresearch
All public school teachers 0.97 0.76 1.11 0.85
Not enough computersNot at all 2.28 1.89 2.44 1.84Small barrier 2.15 1.58 2.69 2.11Moderate barrier 1.78 1.47 2.41 1.96Great barrier 1.31 1.14 1.52 1.21
Lack of time in scheduleNot at all 2.47 2.45 2.60 1.82Small barrier 2.17 1.61 2.51 2.16Moderate barrier 1.72 0.97 1.96 1.43Great barrier 1.40 1.24 1.73 1.31
NOTE: Teachers who reported that computers were not available to them anywhere in the school were excluded from the analysespresented in this table.SOURCE: U.S. Department of Education, National Center for Education Statistics, Fast Response Survey System, "Public SchoolTeachers Use of Computers and the Internet," FRSS 70, 1999.
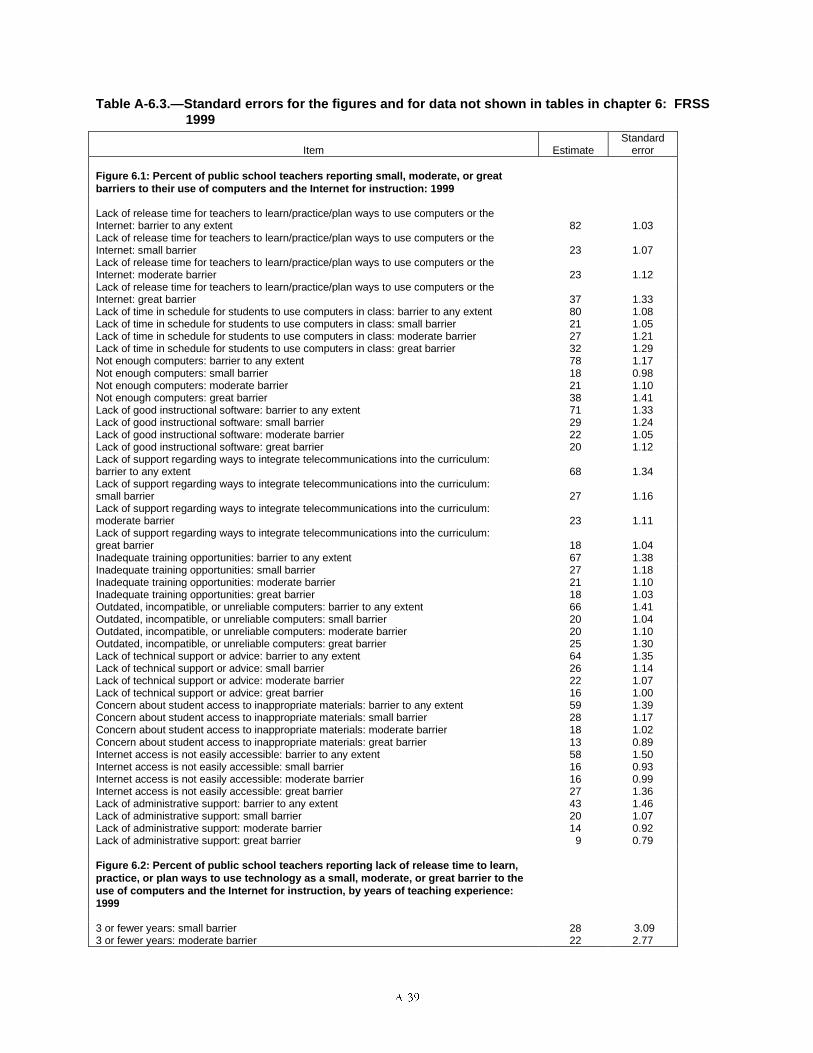
����
Table A-6.3.—Standard errors for the figures and for data not shown in tables in chapter 6: FRSS1999
Item EstimateStandard
error
Figure 6.1: Percent of public school teachers reporting small, moderate, or greatbarriers to their use of computers and the Internet for instruction: 1999
Lack of release time for teachers to learn/practice/plan ways to use computers or theInternet: barrier to any extent 82 1.03Lack of release time for teachers to learn/practice/plan ways to use computers or theInternet: small barrier 23 1.07Lack of release time for teachers to learn/practice/plan ways to use computers or theInternet: moderate barrier 23 1.12Lack of release time for teachers to learn/practice/plan ways to use computers or theInternet: great barrier 37 1.33Lack of time in schedule for students to use computers in class: barrier to any extent 80 1.08Lack of time in schedule for students to use computers in class: small barrier 21 1.05Lack of time in schedule for students to use computers in class: moderate barrier 27 1.21Lack of time in schedule for students to use computers in class: great barrier 32 1.29Not enough computers: barrier to any extent 78 1.17Not enough computers: small barrier 18 0.98Not enough computers: moderate barrier 21 1.10Not enough computers: great barrier 38 1.41Lack of good instructional software: barrier to any extent 71 1.33Lack of good instructional software: small barrier 29 1.24Lack of good instructional software: moderate barrier 22 1.05Lack of good instructional software: great barrier 20 1.12Lack of support regarding ways to integrate telecommunications into the curriculum:barrier to any extent 68 1.34Lack of support regarding ways to integrate telecommunications into the curriculum:small barrier 27 1.16Lack of support regarding ways to integrate telecommunications into the curriculum:moderate barrier 23 1.11Lack of support regarding ways to integrate telecommunications into the curriculum:great barrier 18 1.04Inadequate training opportunities: barrier to any extent 67 1.38Inadequate training opportunities: small barrier 27 1.18Inadequate training opportunities: moderate barrier 21 1.10Inadequate training opportunities: great barrier 18 1.03Outdated, incompatible, or unreliable computers: barrier to any extent 66 1.41Outdated, incompatible, or unreliable computers: small barrier 20 1.04Outdated, incompatible, or unreliable computers: moderate barrier 20 1.10Outdated, incompatible, or unreliable computers: great barrier 25 1.30Lack of technical support or advice: barrier to any extent 64 1.35Lack of technical support or advice: small barrier 26 1.14Lack of technical support or advice: moderate barrier 22 1.07Lack of technical support or advice: great barrier 16 1.00Concern about student access to inappropriate materials: barrier to any extent 59 1.39Concern about student access to inappropriate materials: small barrier 28 1.17Concern about student access to inappropriate materials: moderate barrier 18 1.02Concern about student access to inappropriate materials: great barrier 13 0.89Internet access is not easily accessible: barrier to any extent 58 1.50Internet access is not easily accessible: small barrier 16 0.93Internet access is not easily accessible: moderate barrier 16 0.99Internet access is not easily accessible: great barrier 27 1.36Lack of administrative support: barrier to any extent 43 1.46Lack of administrative support: small barrier 20 1.07Lack of administrative support: moderate barrier 14 0.92Lack of administrative support: great barrier 9 0.79
Figure 6.2: Percent of public school teachers reporting lack of release time to learn,practice, or plan ways to use technology as a small, moderate, or great barrier to theuse of computers and the Internet for instruction, by years of teaching experience:1999
3 or fewer years: small barrier 28 3.093 or fewer years: moderate barrier 22 2.77
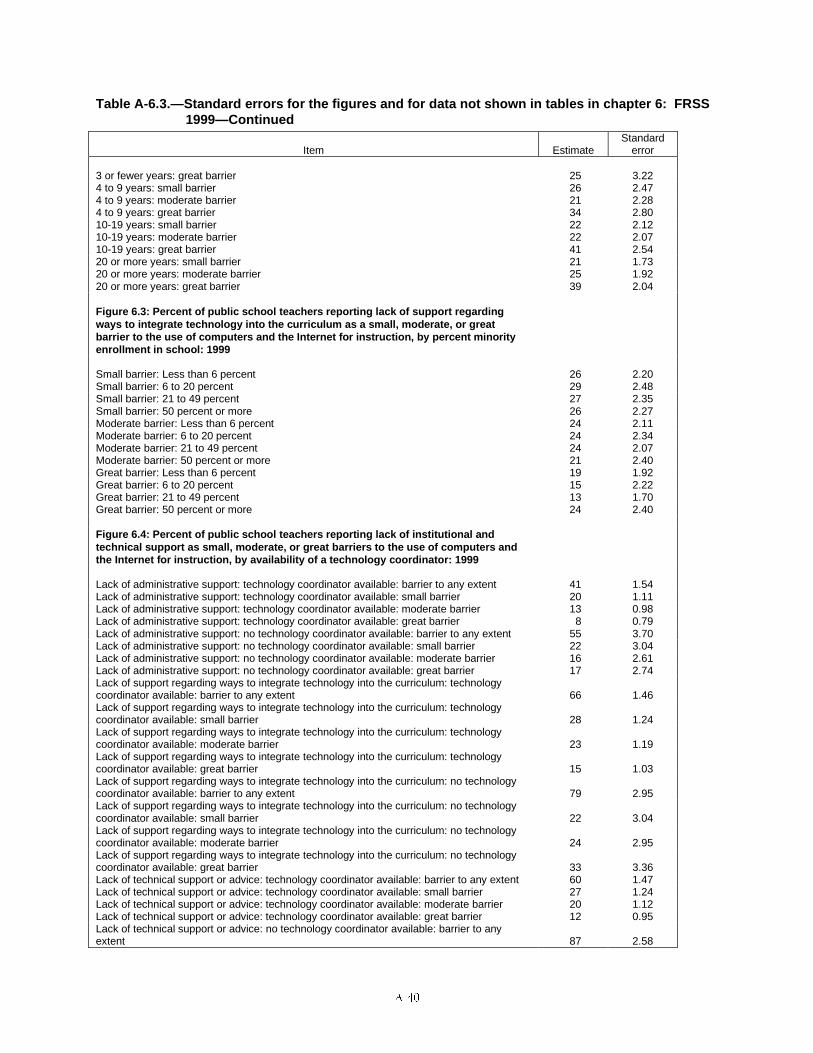
����
Table A-6.3.—Standard errors for the figures and for data not shown in tables in chapter 6: FRSS1999—Continued
Item EstimateStandard
error
3 or fewer years: great barrier 25 3.224 to 9 years: small barrier 26 2.474 to 9 years: moderate barrier 21 2.284 to 9 years: great barrier 34 2.8010-19 years: small barrier 22 2.1210-19 years: moderate barrier 22 2.0710-19 years: great barrier 41 2.5420 or more years: small barrier 21 1.7320 or more years: moderate barrier 25 1.9220 or more years: great barrier 39 2.04
Figure 6.3: Percent of public school teachers reporting lack of support regardingways to integrate technology into the curriculum as a small, moderate, or greatbarrier to the use of computers and the Internet for instruction, by percent minorityenrollment in school: 1999
Small barrier: Less than 6 percent 26 2.20Small barrier: 6 to 20 percent 29 2.48Small barrier: 21 to 49 percent 27 2.35Small barrier: 50 percent or more 26 2.27Moderate barrier: Less than 6 percent 24 2.11Moderate barrier: 6 to 20 percent 24 2.34Moderate barrier: 21 to 49 percent 24 2.07Moderate barrier: 50 percent or more 21 2.40Great barrier: Less than 6 percent 19 1.92Great barrier: 6 to 20 percent 15 2.22Great barrier: 21 to 49 percent 13 1.70Great barrier: 50 percent or more 24 2.40
Figure 6.4: Percent of public school teachers reporting lack of institutional andtechnical support as small, moderate, or great barriers to the use of computers andthe Internet for instruction, by availability of a technology coordinator: 1999
Lack of administrative support: technology coordinator available: barrier to any extent 41 1.54Lack of administrative support: technology coordinator available: small barrier 20 1.11Lack of administrative support: technology coordinator available: moderate barrier 13 0.98Lack of administrative support: technology coordinator available: great barrier 8 0.79Lack of administrative support: no technology coordinator available: barrier to any extent 55 3.70Lack of administrative support: no technology coordinator available: small barrier 22 3.04Lack of administrative support: no technology coordinator available: moderate barrier 16 2.61Lack of administrative support: no technology coordinator available: great barrier 17 2.74Lack of support regarding ways to integrate technology into the curriculum: technologycoordinator available: barrier to any extent 66 1.46Lack of support regarding ways to integrate technology into the curriculum: technologycoordinator available: small barrier 28 1.24Lack of support regarding ways to integrate technology into the curriculum: technologycoordinator available: moderate barrier 23 1.19Lack of support regarding ways to integrate technology into the curriculum: technologycoordinator available: great barrier 15 1.03Lack of support regarding ways to integrate technology into the curriculum: no technologycoordinator available: barrier to any extent 79 2.95Lack of support regarding ways to integrate technology into the curriculum: no technologycoordinator available: small barrier 22 3.04Lack of support regarding ways to integrate technology into the curriculum: no technologycoordinator available: moderate barrier 24 2.95Lack of support regarding ways to integrate technology into the curriculum: no technologycoordinator available: great barrier 33 3.36Lack of technical support or advice: technology coordinator available: barrier to any extent 60 1.47Lack of technical support or advice: technology coordinator available: small barrier 27 1.24Lack of technical support or advice: technology coordinator available: moderate barrier 20 1.12Lack of technical support or advice: technology coordinator available: great barrier 12 0.95Lack of technical support or advice: no technology coordinator available: barrier to anyextent 87 2.58
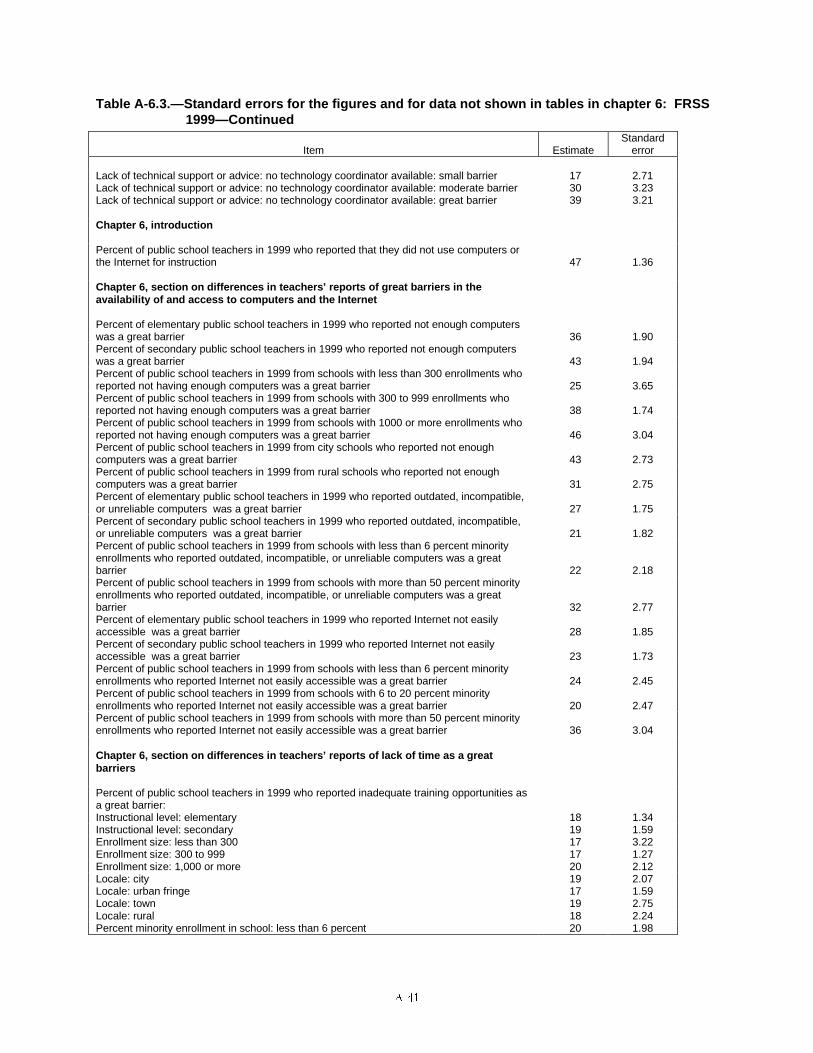
����
Table A-6.3.—Standard errors for the figures and for data not shown in tables in chapter 6: FRSS1999—Continued
Item EstimateStandard
error
Lack of technical support or advice: no technology coordinator available: small barrier 17 2.71Lack of technical support or advice: no technology coordinator available: moderate barrier 30 3.23Lack of technical support or advice: no technology coordinator available: great barrier 39 3.21
Chapter 6, introduction
Percent of public school teachers in 1999 who reported that they did not use computers orthe Internet for instruction 47 1.36
Chapter 6, section on differences in teachers’ reports of great barriers in theavailability of and access to computers and the Internet
Percent of elementary public school teachers in 1999 who reported not enough computerswas a great barrier 36 1.90Percent of secondary public school teachers in 1999 who reported not enough computerswas a great barrier 43 1.94Percent of public school teachers in 1999 from schools with less than 300 enrollments whoreported not having enough computers was a great barrier 25 3.65Percent of public school teachers in 1999 from schools with 300 to 999 enrollments whoreported not having enough computers was a great barrier 38 1.74Percent of public school teachers in 1999 from schools with 1000 or more enrollments whoreported not having enough computers was a great barrier 46 3.04Percent of public school teachers in 1999 from city schools who reported not enoughcomputers was a great barrier 43 2.73Percent of public school teachers in 1999 from rural schools who reported not enoughcomputers was a great barrier 31 2.75Percent of elementary public school teachers in 1999 who reported outdated, incompatible,or unreliable computers was a great barrier 27 1.75Percent of secondary public school teachers in 1999 who reported outdated, incompatible,or unreliable computers was a great barrier 21 1.82Percent of public school teachers in 1999 from schools with less than 6 percent minorityenrollments who reported outdated, incompatible, or unreliable computers was a greatbarrier 22 2.18Percent of public school teachers in 1999 from schools with more than 50 percent minorityenrollments who reported outdated, incompatible, or unreliable computers was a greatbarrier 32 2.77Percent of elementary public school teachers in 1999 who reported Internet not easilyaccessible was a great barrier 28 1.85Percent of secondary public school teachers in 1999 who reported Internet not easilyaccessible was a great barrier 23 1.73Percent of public school teachers in 1999 from schools with less than 6 percent minorityenrollments who reported Internet not easily accessible was a great barrier 24 2.45Percent of public school teachers in 1999 from schools with 6 to 20 percent minorityenrollments who reported Internet not easily accessible was a great barrier 20 2.47Percent of public school teachers in 1999 from schools with more than 50 percent minorityenrollments who reported Internet not easily accessible was a great barrier 36 3.04
Chapter 6, section on differences in teachers’ reports of lack of time as a greatbarriers
Percent of public school teachers in 1999 who reported inadequate training opportunities asa great barrier:Instructional level: elementary 18 1.34Instructional level: secondary 19 1.59Enrollment size: less than 300 17 3.22Enrollment size: 300 to 999 17 1.27Enrollment size: 1,000 or more 20 2.12Locale: city 19 2.07Locale: urban fringe 17 1.59Locale: town 19 2.75Locale: rural 18 2.24Percent minority enrollment in school: less than 6 percent 20 1.98
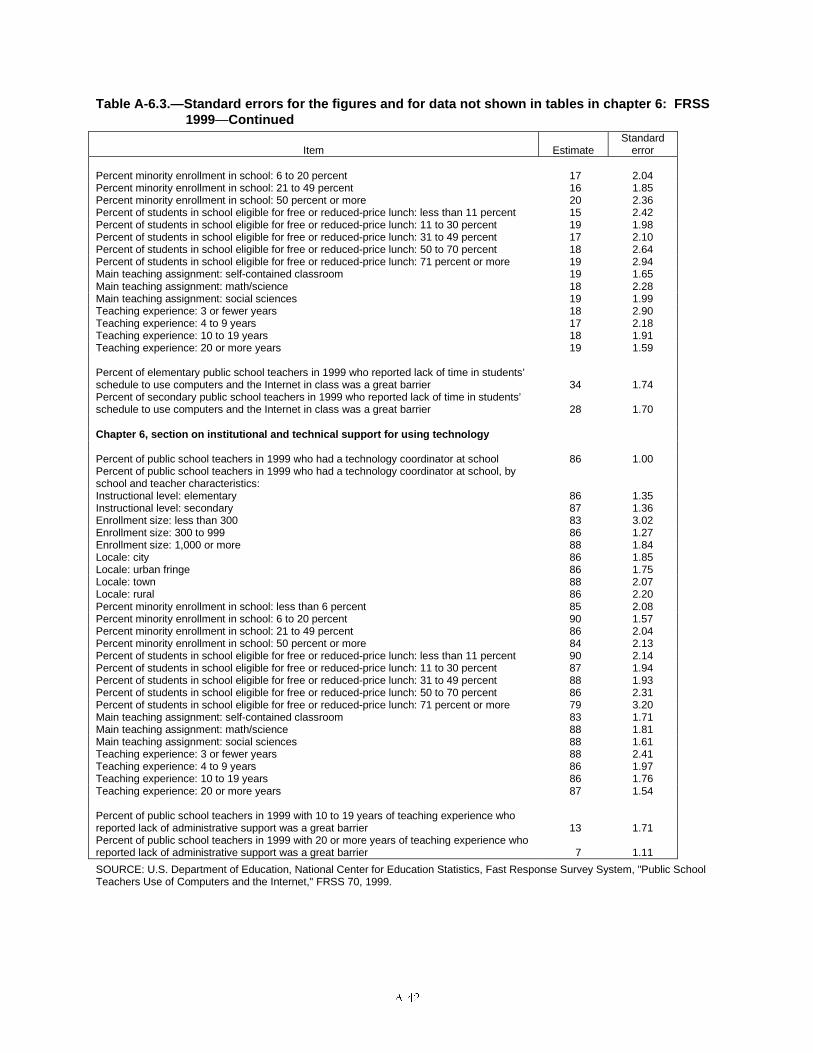
����
Table A-6.3.—Standard errors for the figures and for data not shown in tables in chapter 6: FRSS1999—Continued
Item EstimateStandard
error
Percent minority enrollment in school: 6 to 20 percent 17 2.04Percent minority enrollment in school: 21 to 49 percent 16 1.85Percent minority enrollment in school: 50 percent or more 20 2.36Percent of students in school eligible for free or reduced-price lunch: less than 11 percent 15 2.42Percent of students in school eligible for free or reduced-price lunch: 11 to 30 percent 19 1.98Percent of students in school eligible for free or reduced-price lunch: 31 to 49 percent 17 2.10Percent of students in school eligible for free or reduced-price lunch: 50 to 70 percent 18 2.64Percent of students in school eligible for free or reduced-price lunch: 71 percent or more 19 2.94Main teaching assignment: self-contained classroom 19 1.65Main teaching assignment: math/science 18 2.28Main teaching assignment: social sciences 19 1.99Teaching experience: 3 or fewer years 18 2.90Teaching experience: 4 to 9 years 17 2.18Teaching experience: 10 to 19 years 18 1.91Teaching experience: 20 or more years 19 1.59
Percent of elementary public school teachers in 1999 who reported lack of time in students’schedule to use computers and the Internet in class was a great barrier 34 1.74Percent of secondary public school teachers in 1999 who reported lack of time in students’schedule to use computers and the Internet in class was a great barrier 28 1.70
Chapter 6, section on institutional and technical support for using technology
Percent of public school teachers in 1999 who had a technology coordinator at school 86 1.00Percent of public school teachers in 1999 who had a technology coordinator at school, byschool and teacher characteristics:Instructional level: elementary 86 1.35Instructional level: secondary 87 1.36Enrollment size: less than 300 83 3.02Enrollment size: 300 to 999 86 1.27Enrollment size: 1,000 or more 88 1.84Locale: city 86 1.85Locale: urban fringe 86 1.75Locale: town 88 2.07Locale: rural 86 2.20Percent minority enrollment in school: less than 6 percent 85 2.08Percent minority enrollment in school: 6 to 20 percent 90 1.57Percent minority enrollment in school: 21 to 49 percent 86 2.04Percent minority enrollment in school: 50 percent or more 84 2.13Percent of students in school eligible for free or reduced-price lunch: less than 11 percent 90 2.14Percent of students in school eligible for free or reduced-price lunch: 11 to 30 percent 87 1.94Percent of students in school eligible for free or reduced-price lunch: 31 to 49 percent 88 1.93Percent of students in school eligible for free or reduced-price lunch: 50 to 70 percent 86 2.31Percent of students in school eligible for free or reduced-price lunch: 71 percent or more 79 3.20Main teaching assignment: self-contained classroom 83 1.71Main teaching assignment: math/science 88 1.81Main teaching assignment: social sciences 88 1.61Teaching experience: 3 or fewer years 88 2.41Teaching experience: 4 to 9 years 86 1.97Teaching experience: 10 to 19 years 86 1.76Teaching experience: 20 or more years 87 1.54
Percent of public school teachers in 1999 with 10 to 19 years of teaching experience whoreported lack of administrative support was a great barrier 13 1.71Percent of public school teachers in 1999 with 20 or more years of teaching experience whoreported lack of administrative support was a great barrier 7 1.11
SOURCE: U.S. Department of Education, National Center for Education Statistics, Fast Response Survey System, "Public SchoolTeachers Use of Computers and the Internet," FRSS 70, 1999.
B–1
���������
�� �����������������������������������
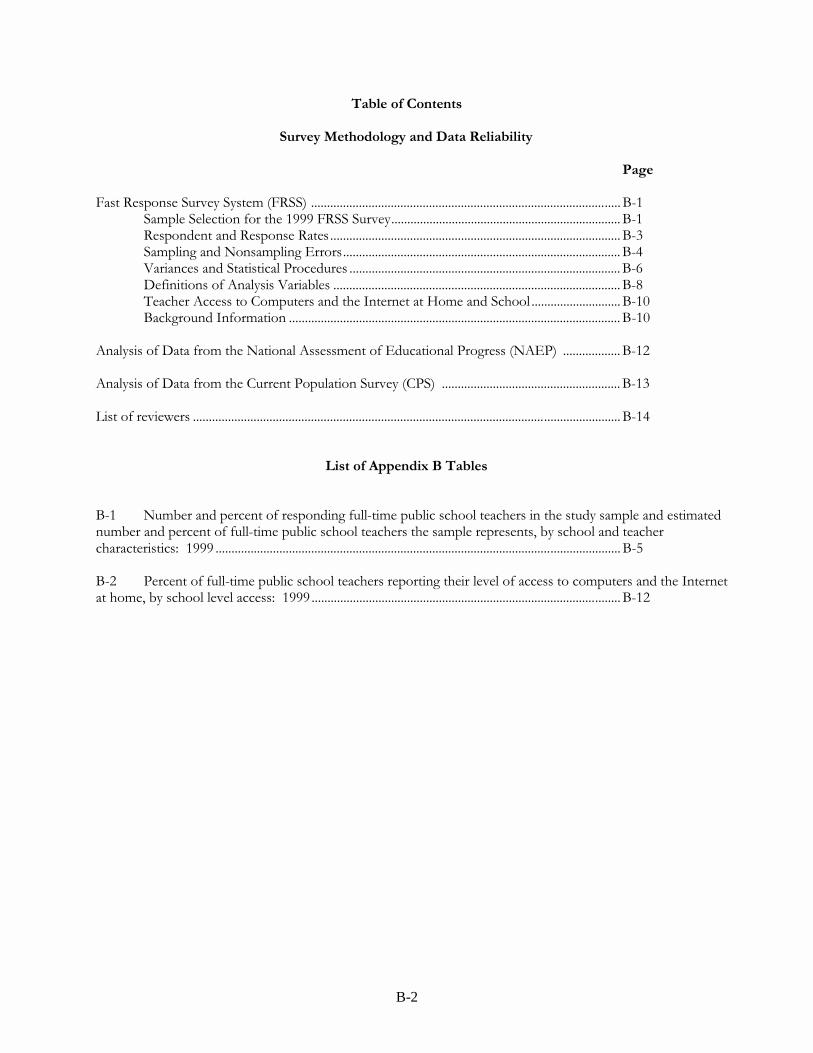
B-2
�����������������
�� �����������������������������������
����
�������������� ������������������������������������������������������������������������������������������������������������������� ������������������� ����������������� ��������������������������������������������������������������������������� ��������������������������������������������������������������������������������������������������������������������� �������������� ��������! ���������������������������������������������������������������������������������������� ��"#� ���������������������$ ���� �� ������������������������������������������������������������������������������������� ��%&����������'�������#� ��(��� ������������������������������������������������������������������������������������������ ��)*����� �'��������+����� ���������,�� ������-���������� ���������������������������� ���.���/� ���,� ���� �������������������������������������������������������������������������������������������������������� ���.
'���������&����� ������ ������'�����������!���������$ � ����� '!$�� ������������������ ���0
'���������&����� ������+� ���$��������� �����+$��� �������������������������������������������������������� ����
1������ ����2� � �������������������������������������������������������������������������������������������������������������������������������������� ���"
������������������������
��� ��(� ������ ������ �������������������(��������������� �����������������������������������(� ������ ������������������(��������������� ������������� �� �����3�(���������������� ��� ���� ������4������ ������������������������������������������������������������������������������������������������������������������������������� ��5
��0 $� ������������������(��������������� �� �� �������� ������������������������ ���������,�� ��������3�(�������������������4������������������������������������������������������������������������������������������������������� ���0
B-3
&����� ������ �� ��2� ��� �2�� ��� ����� �����������6$�(���������*����� ��7�����+����� �
�������,�� ��6��� ���3����������� ���������������������� ������������������������ ������+���
� �!������������������� +!���������������������� �������������� �� ��2� ����/��� ������ �����
'�����������!���������$ � ����� '!$��������� ����3�+� ���$��������� ������+$��3��������
������� ������������ ���������,�� �������(������������*������2����������2�������� �(����������
�� ������������������ ���� ���������������������������� ������������������ �������������� �� ��
The Fast Response Survey System (FRSS)*����������������� �����������������3����������� �������� ������+��� �� �!������
������������ +!��3�2�������(�����������85������������� �� ��������/�������������������������������� �
�������� ��������9���/������2����������� ������(� �����*��������2��������������������������
�������&��� �������!��������������3����� �3�������������/� ��2����� ������������(�
���������9���/����� ����� �������� +!���� �������&��������������� ����������� ������ �� �� ���������
������������������3�� �2���� �������� �������������� � ������ ������������
,���������������������������������� �������������6$�(���������*����� ��7�����+����� �
�������,�� ��6��� ���3������ �� ��� �2���������(���������� �������������(��������������������
������(�������(������������� �����:��/3����);�+� ���� 3����%;�-���������������3����53����8�����������
����������������� ���� ��3����2������� ������ ����������������������������� ��(����� �����
���������� ���3�� ������ �(������������������� �� ���
Sample Selection for the 1999 FRSS Survey
*����������� ������������ �����$�(���������*����� �<�7�����+����� ���������,�� ��
����������03.������������������� ���� ����� ���(����������� �3�������3���������������������5.�������
�������&��� ������+���(����*��� ����������������������� �3�������������3...���(����������2����� ��
���������� ���������5��%� +!��+���+ ����&�����++&��$�(���������7��� ���������*����������
� ������� ������� ���������5��%�++&�������������8)3%�8� ����� ���(��������������������������
�����3��������������3����� �����=��� ������3��������������� �� ���3��� �����&��� ������
B-4
&�����������3�������2������������ �����2� ������ ������ ��� ����3������������������������
��������������2� ���>�������� ������� ������*���� �����������")38�"� ����� �������� �������3
�"3..�� ����� �������������3�����53�).� ����� �����=��(�����������!������ ��������2� ��������
���������2���������2����� ������������� ��9������� ���������������������� ������������� ��9������� ���
)������� ��������2� ������������������2�������2����� ��������� ����� ��9������� ����8�����
��������� ������������� ��9������� �����0��+�(����������2� ���������������������2����� ��������
���� ��9������� �������������������� ����� ���� ����� ��9������� ������������ ����������
��(����������2� ����(�������������� ��� ����������:������������2� ����������������� ����
������� �� ���������� �=��(������ ������������������ �� ��������
*�����(������������������ ����2����� ��������(����� ��������������������� ����
����� �=��(���������������?�������������..3��..������3�����3...� �� ����@���������� ��� �
�� ���3�������2� ������� ����(������������������� �������3�� (��� ���3��23� � ���3���� ������ ���3
����� ������������������������������(���� �� ��� � �������� ����������������� �������������
����������� �����������'�����������3...�������2����������������� ������� ����� ����2����� (�(�������
� � ����������?�3�2�� ����������� ������?��2��������9�� �� ��������������������(� �������������
�9����������*!�������� ��������������*�����������������5..�������� �����������5..
����� �=��(�����������!�����������������2�����/���������������������� ������(��������� �3�� �
2������������� ���������� ����2���� ��� ����*��������� ���������� ����2������������� �� ����� �����
���������������� ��2����������������� ��������� �����0��A��������� ��2����� ��� �����������2��
(���������������=!�����������������������3����������������3��������������������2� ���>�������
*�� ��� ������������ ������3�������2� ����/�������� ��2��������������������������� ������������3�������
��� �������������2����������������� �4���� ������3����� ��3������(�������������� �;������� �<������;
������������ �;�� ������������������2��������;�/��� �� ��� �� ������������ �;� ���������
�����2��2������������ �������� ������3���( � ���3���� ��� ���3� ������������ �>�3�������2� ����� �����
��� ������������������������ ��2����� ��� �������������������2���(���������������=!����������
������������3����������������3� �����������������
B-5
@�������������������3������� ��������� �����2� ������������������������������(����� �����
�� ������� ���� �����3�2��������� ���������������� �������2������� ���� �������*��� ��������������
��03.��������� ����������3.�%�������� �����������3..������� �=��(��������������� ��
Respondent and Response Rates
'������ ������� ������������ �� ��� �������������������� ��2�������������� �������������
���������������A��(� ����)��*�������� ��� ���������������3� �9������������ ������<����� �����
������������� �3������/�������� ���������� ��� ����������������� ���������������������������������� ��
*����������2���2������������ �� ���(� ����)��� ����:� ��������2����� ��������2�������
������������������ �9������ ������� ��������A�������3...�������������������3�8�2� ��������(������
����������������� ��������� ����>�������3�� �������������������(����������*����� �������2� ��� �����
(���.�������3� ������ ���������������(���������
B������� ���2� ����������������� ����:� ���������*����������2���2������������ �
'� ����� ����C��������2���������� ��2�������� ������������������9������� ���������� �����
���2���2��������������C���(����������� ���� ��������������������� �2� �������3�������(���
�������������(� �������*����� ��2� �������� ����� ����� ��������(������������ �������������������
�� ��������������9������� ���2����(�������������������(���0�2��/���B������� ��3�����2�����
������2���������� �����������������/������� ��� ����� ��� ��������3�2� �� ���������� �������
(������2������� ������������������������&������������2��������������A��(� �������A������03.��
������ ������������ �����������3��80�2� ��������(������������������������ ���3���������(�����������
2� ���� ����� ���������������� �������� ���*�������������������3)"8������(��������� ���������������
+��������9������� ���2� �� ��������� ���3%8"������� �3� ������ ���������������(��������� ���*��
�� ���� ������ ����2���)���� ���������� ����� �����������������������������(������� ����� �����������
9������� ����@������������� ������ ����� ������ ��.��� ������������ ����� ����������
� �������������� �� ���������������� ������2������23����������� ������ ������2����
�����������

B-6
Sampling and Nonsampling Errors
*��� �������2� ��2����������� ����������������������������(���������*���2�������2� �
������������D����� ������� ��(���� (�(�������������������������� ������ �������*����������������
�� ��� ������������(����������������������������3����9�����3�� ����(D���������������� ��(������
*����� ��������������� ��������(D��������������� ����������� ����(���������(�� ����
� ������ ���� ������ �3�� ���� �� ���3����� �����������������������*������ �
������������(�������������� ��������� ������������������� (����������� �� ������ ������;
�� ����������3�����3����������� �;������ ����� ��������������� ������ ������������ ����2����������;
�� ���������� ��� �����@�������� �������������� �����(����������� �������� �����2�����������
�������������� ��(�������������������3���������� ��� ���������������� ����3�� ������ ����
�� ����3��������� �9�� ����������>�� �����(��������������� ���������������������� ���� ��� �����
������>�� ���������������(�������
*������?��������������� ���������� �3�����9������� ��2���� ��������2���� �������
��/�������2����������������� �����&� ��������������������� ������������� ����� �����3������ ��2��
�����������/�� ��������������� � ��������9�����������������������(�������������*��
9������� �������� ������2� ���>��������� ����2���(������ ������+��� �� �!��������������������
����A��������������� ��� �3�7����&��� �������!��������:����������������������������9������� �
�������2� ����������������/����������� ����� ���������������3����������2�����������
���������������2� �� ���������(�����������&����2� ��/�����2�����..��� ������ ��������
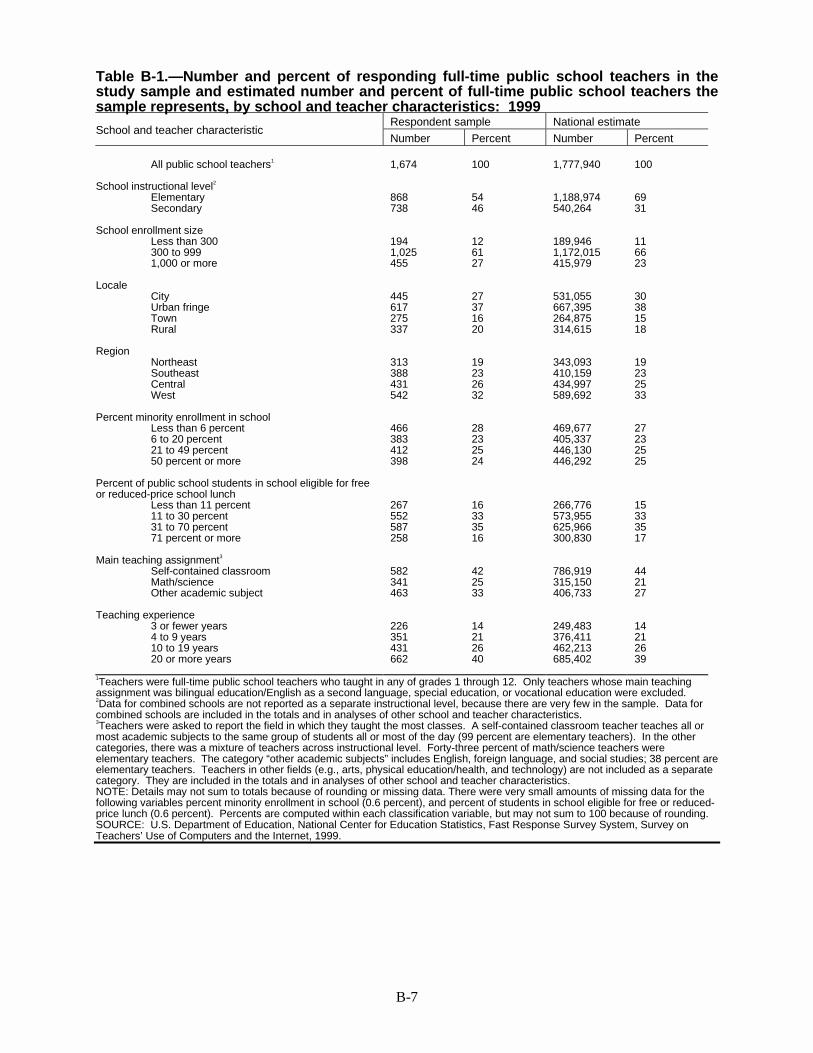
B-7
Table B-1.—Number and percent of responding full-time public school teachers in thestudy sample and estimated number and percent of full-time public school teachers thesample represents, by school and teacher characteristics: 1999
Respondent sample National estimateSchool and teacher characteristic
Number Percent Number Percent
All public school teachers1 1,674 100 1,777,940 100
School instructional level2
Elementary 868 54 1,188,974 69Secondary 738 46 540,264 31
School enrollment sizeLess than 300 194 12 189,946 11300 to 999 1,025 61 1,172,015 661,000 or more 455 27 415,979 23
LocaleCity 445 27 531,055 30Urban fringe 617 37 667,395 38Town 275 16 264,875 15Rural 337 20 314,615 18
RegionNortheast 313 19 343,093 19Southeast 388 23 410,159 23Central 431 26 434,997 25West 542 32 589,692 33
Percent minority enrollment in schoolLess than 6 percent 466 28 469,677 276 to 20 percent 383 23 405,337 2321 to 49 percent 412 25 446,130 2550 percent or more 398 24 446,292 25
Percent of public school students in school eligible for freeor reduced-price school lunch
Less than 11 percent 267 16 266,776 1511 to 30 percent 552 33 573,955 3331 to 70 percent 587 35 625,966 3571 percent or more 258 16 300,830 17
Main teaching assignment3
Self-contained classroom 582 42 786,919 44Math/science 341 25 315,150 21Other academic subject 463 33 406,733 27
Teaching experience3 or fewer years 226 14 249,483 144 to 9 years 351 21 376,411 2110 to 19 years 431 26 462,213 2620 or more years 662 40 685,402 39
1Teachers were full-time public school teachers who taught in any of grades 1 through 12. Only teachers whose main teachingassignment was bilingual education/English as a second language, special education, or vocational education were excluded.2Data for combined schools are not reported as a separate instructional level, because there are very few in the sample. Data forcombined schools are included in the totals and in analyses of other school and teacher characteristics.3Teachers were asked to report the field in which they taught the most classes. A self-contained classroom teacher teaches all ormost academic subjects to the same group of students all or most of the day (99 percent are elementary teachers). In the othercategories, there was a mixture of teachers across instructional level. Forty-three percent of math/science teachers wereelementary teachers. The category “other academic subjects” includes English, foreign language, and social studies; 38 percent areelementary teachers. Teachers in other fields (e.g., arts, physical education/health, and technology) are not included as a separatecategory. They are included in the totals and in analyses of other school and teacher characteristics.NOTE: Details may not sum to totals because of rounding or missing data. There were very small amounts of missing data for thefollowing variables percent minority enrollment in school (0.6 percent), and percent of students in school eligible for free or reduced-price lunch (0.6 percent). Percents are computed within each classification variable, but may not sum to 100 because of rounding.SOURCE: U.S. Department of Education, National Center for Education Statistics, Fast Response Survey System, Survey onTeachers’ Use of Computers and the Internet, 1999.
��)
Variances and Statistical Procedures
*�������� ��� ����������� ���������� ��(���������������������������������,����������
������ ��(�������������������������������2����(��(������� ����������(�������������������
�����������?�������� ��� ��� ����������������� ��������� �������>�������� ������ ������
��������,����������(�����������2� ���� ��������� ������� �������3���� ����������%������ �
� ��(��2������%������ ��� ���(������� ������ �����������2���������������� ����������
�� ����� �(�����������������(����5��� �������������������*����������5��� �����������
��� ����
� ��>�����3����������������� ��������������� ��2��������� ��2����� ��� ��������
������ ���������,�� ���� ������ ����� �����������������.��� ���3�����������������
����� ��� ����.����� �����*����5��� ��������������� ����� ����������������>������ ��E�.��
�.������������%�F���E�.�G��.������������%�F3� �� ��)�0������)��� �����*�(����������� ��� ���
�������(���������� �������� �� ��� ��� ��������'�����>�'�
&����� �������������������������� ����2� ������?�������������3��������� �� � ��
2��������2����� ���������������������� �� ����������������������� � ������������ ��� �
� ������������������*���� � �������������2� ��2�������������������� ���9���
� (�(�������������������������D����� ��������������� �����3� ���������������������������
(��� D������������7��������������������� ���������� ����(��������������� ����*��
����� ��� ��� ����������������2� ������������ ������� ���� ���������*��� ��� ���
��� >��������*����������������������/����������������� ��(�������� ����������������������
(���������������� ���� ������ ����� ��������������*��� ���������� �������������(������
��������������������������������������
+��� ��������������(��������(��2������������������������������ �� �������(��
�������� ����������������������������� ���������������� ������ ���� �� ���������������������(�
�>����������������������� �������*������������������� ����2� ��(����������������H���
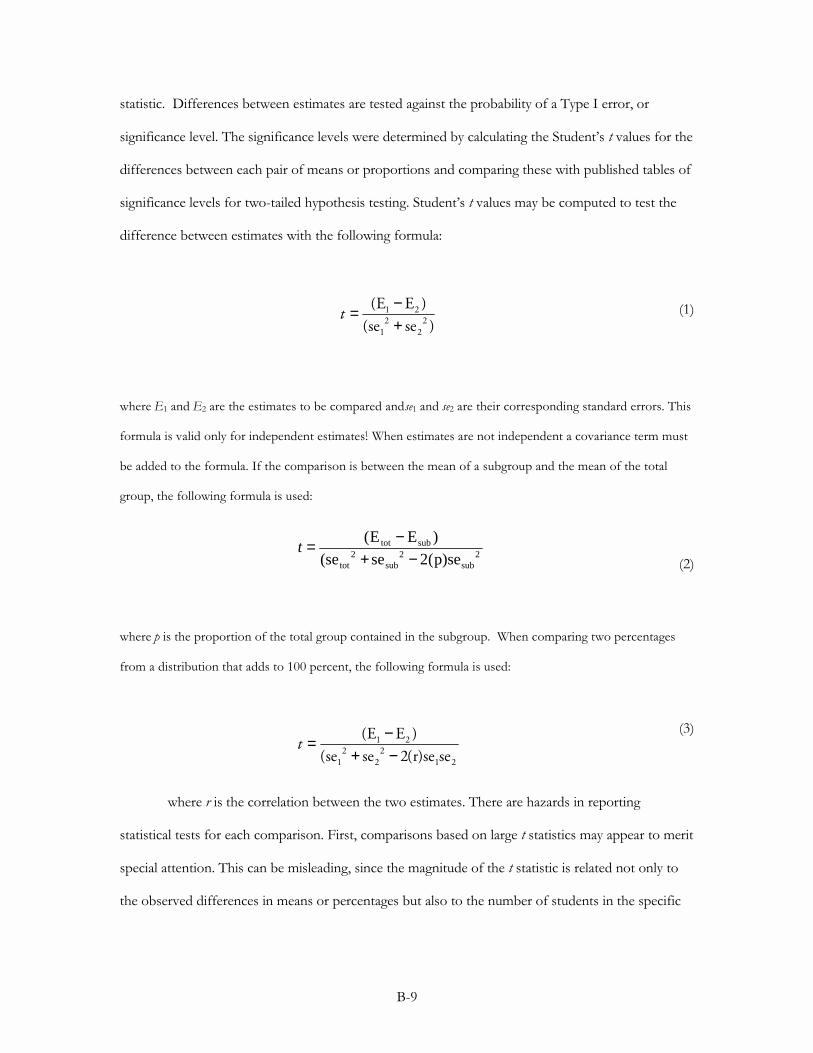
���
������������&���� �����(��2�������������� ��������������������� (�(����������*����,�� 3�
������������������*���������������������2� ������ �����(�����������������������<������������ ����
����� �����(��2����������� �������� �� � ����������� ���������2������(���������(�����
������������������� ��2��������������������������������<���������������(��������������������
����� ����(��2�������������2�����������2���� ����4
���
2�� ���������0�� ������������������(������ ���������������0�� ������ �� ������������ ��� ���*���
� ������������������ ����������������������@�������������� ������������������ ������� ������
(��������������� ������,���������� ������(��2�����������������(� ������������������������
� ��3��������2���� ������������4
�0�
2�� ������������ � ��������������� ������������������(� �����@������� ����2��� �������
� �������� �(�����������������..��� ���3��������2���� ������������4
���
2�� ������������ ������(��2��������2������������*�� ��� ����?� ����� �� ���
������������������� ���������� ������ ��3����� ����(�������� ������������������������� ����� ��
����������������*�������(�����������3���������������������������������������� �������������
����(�� ��������� ������������ ��� ��������(���������������(� �������������������������
t = −+
( )
( )
E E
se se1 2
1 22 2
t = −+ −
( )
( (
E E
se se r)se se1 2
1 2 1 22 2 2
t = −+ −( )
( (
E E
se se p)setot sub
tot sub sub2 2 22
���.
����� ���������� ����� ����-���3�������������� �������� ����� ������� �����(� ��
��������2����� ��������� ���������������
'��������?� ���� �� ����������������������� ���������� ������ ��2�����/��
������������� ������������� ������������������� ��(����� ��>�����3�2�����/��
��� ������� ������ �������� ��� �����=������� ���3������ (�(����������*����,�� �� ������
���� ������/�������� �������� �� ���������� (�(������� ������������� ����@���� �����
������� ����(��2���� ������ ���������� ���� ������� �I��������J�� ���������� ������������
����������3��������������������� ����������� ������������������������� �����������
���� ������/�������� ��+��� ����2� �������������� �� �����2����K��.5=��� ��
�� ������ ���� 2�������� ��3�2�� ����������� ���2���������������2���������������*���
��� ������(�������������������������� ���2����������K��.5���������� ������� ����2����
���������������(������� ���3����������������������� ������������� ����2�����������K��.5�0
*�� �� �3������ ���������� ������� ����(������������������� ���3���� ����D�����
������������������2��������� ���������������� ����� �������������� �� �3������� � �����
Definitions of Analysis Variables
���������������������� �� �������2� ���������������� ���������� �� �������������
+���+ ����&�����++&��
� !��"�������������L�2����� ������������� ��9������� ����������������
� ������������� ��9������� ����)�
� �������������L�2����� ��������� ����� ��9������� ����8�����������
� ����8� ������ �
������������"������#� �*������(� ������������ ���������������(������+��
+ ����&�����++&��
��7����&��� �������!������3� ������+��� �� �!�����������������3��������� ������������������������� ��03������
0�*�������� ��������K�.5=��� ���������� ������� ���� �������������� ��� �������������������������������������� ���������
�������K�.5��� ���(������2������������������� �9�� �������� ��������K�.5=��� ����� ������ ����������?�������� ������� ����3����
A�����C���&�3�I:��������+��� ����'���:���3J���������������� ������������������������������5%����%��4�50M%"�
����
� 1���������..��������
� �..��������������
� �3...� �� ���������
������ �'���������������+���+ ����&�����++&��
� ����L��� ������������:�� ������������������' ����:�'��
� $�����������L��������2�������:�'�������� �������3�(������ ��� �������
��� ��������
� ��%�L����������2�������:�'3�(���2��������������� ���� ����� ��9���
��035..��������������� (��(������7������ ����������+�����
� �����L��������2�����������������������035..�������������� � ���(�����
7������ ����������+�����
��������"��������������"����������������� �*����� ��������������� ���������������
2���� ���� ���������3�(��������������������5��%�++&�����3�����������������������������2��4
'�� ����,���� �'���/�� �����3�'���� �$�������,����� 3�(���/3� �-���������&���������
�� ��(���2� ���������� �.�"��� ���������������� ���*���( ��/������������ ���������2� ��(����
����� ����������������9�� ������� ������2���������� ���������
� 1��������%��� ���
� %���0.��� ���
� 0����5.��� ���
� : ������5.��� ���
��������������������������������������������������������������&����������� � *����2��
(�������� ��������������� ������������� ������������� �������������������;�������2��
�������� ������������������3����2���(������� ������++&�����3��������(����&������������ ��(��
2� ���������� �.�0��� ���������������� ���*����������� ���������������� ����������
���� ��������� ����������������*���( ��/������������ ���������2� ��(����������( ��/�
������ ���������������,�� ���'��������7����$�(������������ ����
� 1������������� ���
���0
� ������.��� ���
� �����"���� ���
� 5.���8.��� ���
� 8���� ���� �� �
������������������� �*������� �������������>�� ����3�(������ ���������9�����
�"�������� ����9������� ��
� �� ���2� ���� �
� "�������� �
� �.��������� �
� 0.� �� ����� �
,�������� �������������������������������������� ���� ���� ������������� ���������
����������������(�� ����������������� ��� ��>�����3�� ��������?�������� ���������������������� �
������3�2��������� ������������������(������ �� ������������ ��������������� ��3���� ������� ���
����� ����� ������� �� ������3�2����������2������������� ����� ����������� ����/������������
��������� ��������� ����A��� � �����������(��2������������� ��(���������>������������������
�������������������������?�������������������3����������������������� ��������������������������������
�� ��(�����*��� ��>������3��2��� 3�������(������� ������������ � ������������������ �������������
�� ��
Teacher Access to Computers and the Internet at Home and School
*�������� �� �������������(������� �� ��������� ����� �������������(��������������� ����1���������
�� ������������������ �� �� ���������������������������������������� �� �����,�� �������� ��������
�����������(�����0����: ����������������������� �� �� ����������������������(����������� �������
,�� ���������������������
Background Information
*����� ����2����� � ������� ��� ����2����@�����3������������������������ ���
���������������@�����<��$ D����&� ��� �2���!��?�(������ ��3���������� ����:���� �2��
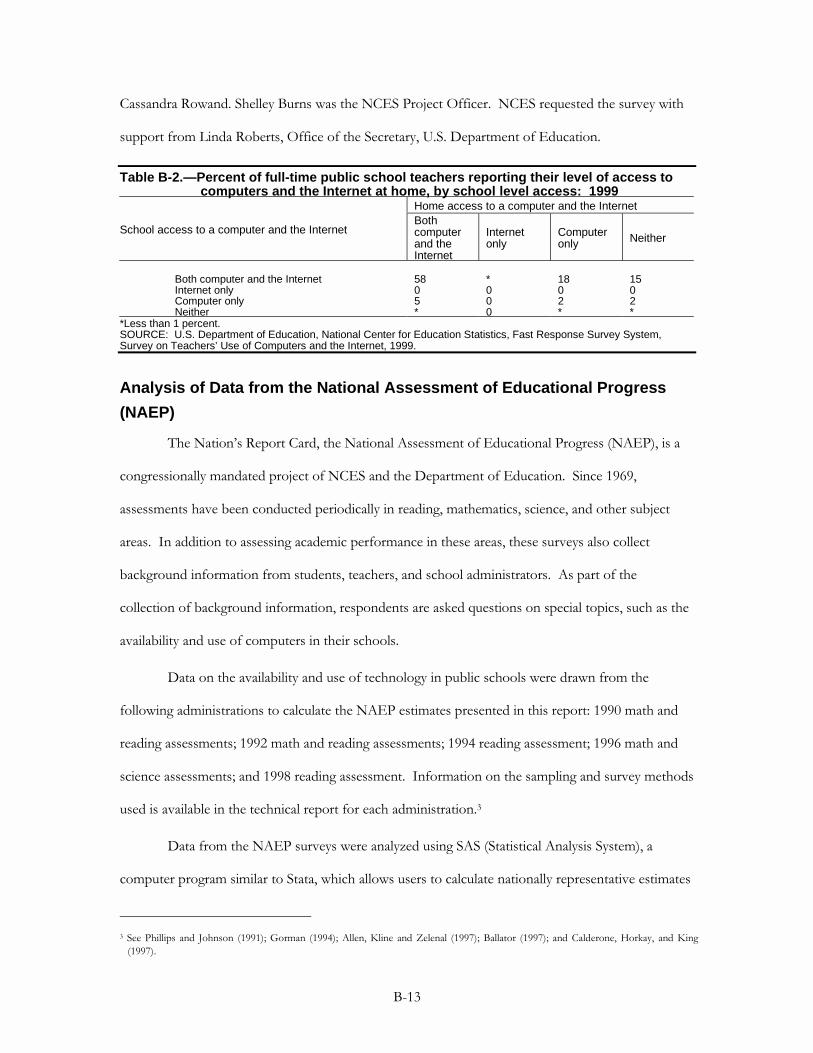
����
+����� ���2�������������� ��2������� +!��$ D����A����� ��� +!�� �9������������� ����2���
���� ��� ��1�����(� ��3�A��������������� ��� �3�7����&��� �������!�������
Table B-2.—Percent of full-time public school teachers reporting their level of access tocomputers and the Internet at home, by school level access: 1999
Home access to a computer and the Internet
School access to a computer and the InternetBothcomputerand theInternet
Internetonly
Computeronly Neither
Both computer and the Internet 58 * 18 15Internet only 0 0 0 0Computer only 5 0 2 2Neither * 0 * *
*Less than 1 percent.SOURCE: U.S. Department of Education, National Center for Education Statistics, Fast Response Survey System,Survey on Teachers’ Use of Computers and the Internet, 1999.
Analysis of Data from the National Assessment of Educational Progress
(NAEP)
*��� ���<����� ��+� �3����� ������'�����������!���������$ � ����� '!$�3�����
�� ������������������ D������ +!���������&��� �������!����������������%�3
����������������(������������� ����������� �����3������������3�������3������� ���(D���
� ������,������������������������������ � �������������� ���3��������� ���������������
(��/� ����� ������ ���������3������� �3���������������� �� ����'���� �������
����������(��/� ����� ����3� ��������� ����/���9���������������������3������������
������(��������������������� �������� �������
&���������������(���������������������������(����������2� ��� �2�� �����
���2���������� ��������������������� '!$������������ �������������� �� �4����.��������
����������������;����0��������� ����������������;����"� ���������������;����%��������
�����������������;�������)� ������������������,� ����������������������� ����������
��������������(������������������ �� ��� ������������� �����
&����� ������ '!$��� �����2� ������?���������'���������������'��������������3��
������ �� � ��������� ��������3�2��������2����� ���������������������� �� �������������������
�� ����$�������� ��� C��� ������;�N ��� ����"�;�'���3�O���� ���P������ ����8�;������� � ����8�;� ���+���� �3�- /��3� ���O��
����8��
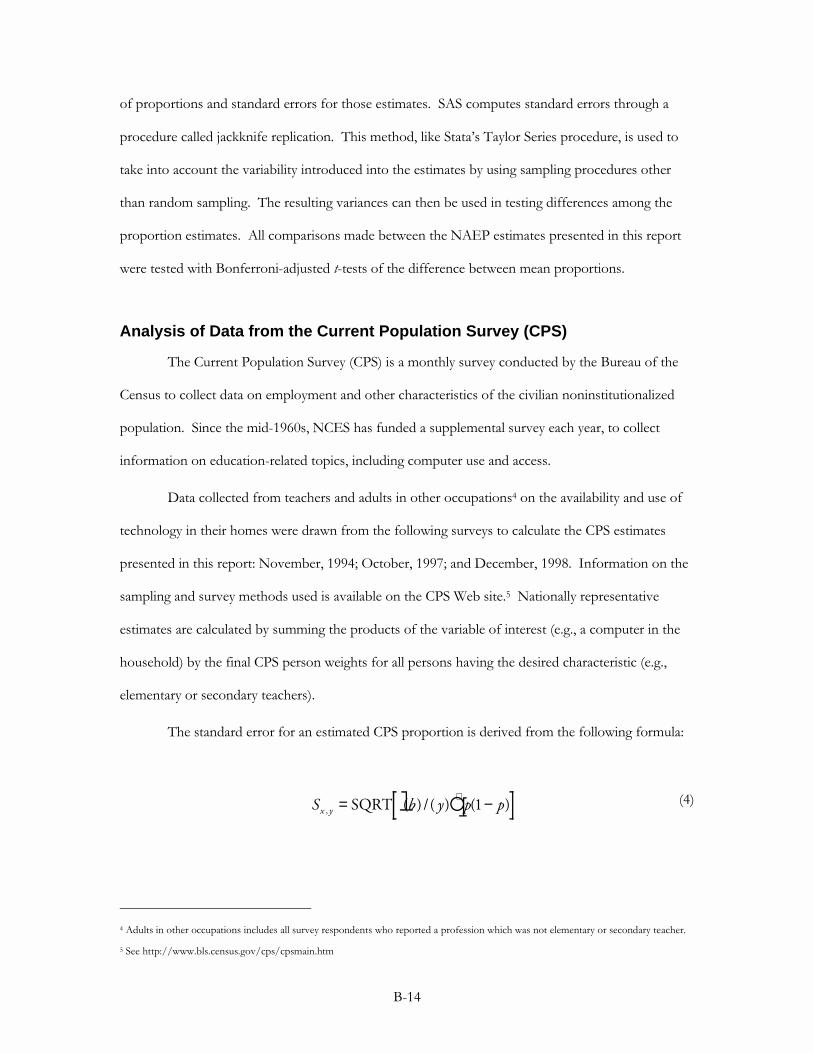
���"
��� � ������������ ��� ��� �������������������'��������������� ��� ���� �����
� ���� ���������D��//���� �����������*���������3���/�������<��*��� ��� ����� ���� �3����������
��/����������������� ��(�������� �����������������������(���������������� ���� ������
���� ��������������*��� ���������� �������������(��������������������� ������������
� � ���������������'������� ���������(��2������� '!$������������ �������������� �� �
2� ���������2������� ����D������������������������� ����(��2�������� � ����
Analysis of Data from the Current Population Survey (CPS)
*���+� ���$��������� �����+$���������������� ������������(�������� ���������
+����������������������������������� ���� ���� ��������������������������������?��
�������������������������%.�3� +!���������������������������� ������������ 3���������
�� �������������� ������������3��������������� ���������������
&�������������� �������� ����������������� ���������"������������(��������������
�������������� ������2� ��� �2�� ���������2����� ���������������������+$�����������
� �������������� �� �4� ���(� 3����";�A��(� 3����8;����&����(� 3����)���,� ���������
������������� �������������������������(��������+$��@�(������5�� �������� �� ���������
����������� �������������(�������������� �������������� ��(�������� ���������3��������� ������
���������(�����������+$���� ��2�������� ������� ����������������� ������ ���� �����������3
������� �� ������ �������� ���
*�������� ��� �� �������������+$��� � �������� ������ ���������2���� ����4
�"�
"�'����������� ������������������������ ���� ��������2�� �� ������� ������2�����2������������ �� ������ �������� �
5���������4==222�(�����������=���=����������
S b y p px y, ( )/( ) ( )= −∗SQRTl q 1
���5
2�� ����������� ����� ����� �����(������+������� �������� �����������+$��@�(�����;�������������������
��(� ����� ���������(���;������������������������ � ���
!���������������+$��� � ����� ������������� �� ��2� ������������������������
����� ��� ��2� �������������(������������ �������������(�����'������ ���������(��2��
+$������������2� ���������2������� ����D������������������������� ����(��2������
� � ����
*���� �� ��2��� ����2���(���������2�������������4
Outside NCES
� &�����:����3�A����������������!�������$ � ���3�7����&��� ������
!������
� &��������3�A��������!���������*������3�7����&��� �������!������
� 1�����(� ��3�A��������!���������*������3�7����&��� ������
!������
� C��������� 3�$��������!���������� �����3�7����&��� �������!������
� :� ��������� ��3�A������� �+�����������3�7����&��� �������!������
Inside NCES
� !����� ��(� 3�!� ���+������3�,�� �����3����+ ����������������
&�����
� ���������� �3�!� ���+������3�,�� �����3����+ ����������������
&�����
� �� ���N ���3�!� ���+������3�,�� �����3����+ ����������������
&�����
� !�����:�' ��� 3�!� ���+������3�,�� �����3����+ ����������������
&�����
� :� ����:�:����3�+����������������
� 1� ��A���3�'���������&�����
���%
� #�����$���/3�'��������+������� 3�!� ���+������3�,�� �����3���
+ �����������������&�����
� C�������3�!� ���+������3�,�� �����3����+ �����������������&�����
� +� ���������3�!������ �=����� �����1�( � ������������&�����
� �� ���� ������(��������������������� �����������������3��������������
�� �3�!� ���+������3�,�� �����3����+ �����������������&�����3� ������+��� ��
!�����������������3�A��������!�������������� ������,�� �����3�7����&��� ������
!������3����.�O��� ���3� @3�@������3�&+�0...%�5%5.3�������4��������Q�� �R�����3
���������0.0��5.0�8�")��� �� ���� ������(��������� �����*����� �<�7�����+����� �
�������,�� ��3�������!�����:�' ��� 3�!� ���+������3�,�� �����3����+ ����������������
&�����3� ������+��� �� �!�����������������3�A��������!�������������� �����
,�� �����3�7����&��� �������!������3����.�O��� ���3� @3�@������3�&+�0...%�5%5.3���
����4�!����Q:�' ��� R�����3����������0.0��5.0�8����
���������
�� ����������������
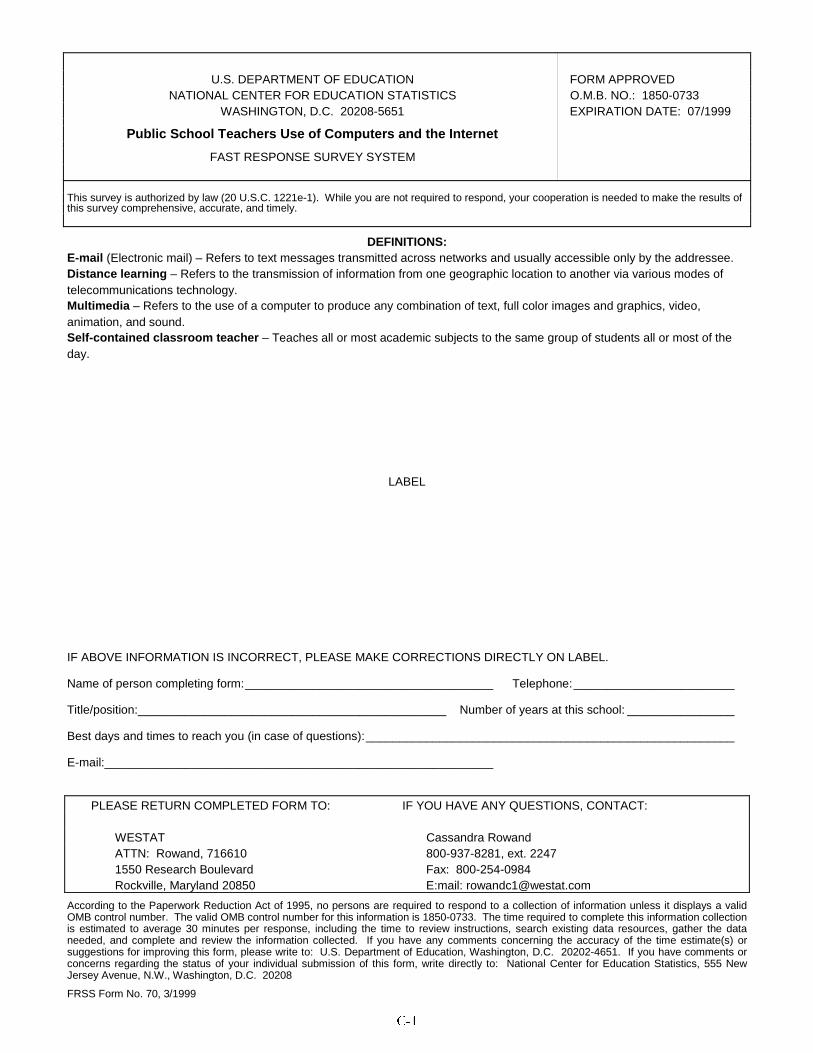
���
U.S. DEPARTMENT OF EDUCATION FORM APPROVEDNATIONAL CENTER FOR EDUCATION STATISTICS O.M.B. NO.: 1850-0733
WASHINGTON, D.C. 20208-5651 EXPIRATION DATE: 07/1999
Public School Teachers Use of Computers and the Internet
FAST RESPONSE SURVEY SYSTEM
This survey is authorized by law (20 U.S.C. 1221e-1). While you are not required to respond, your cooperation is needed to make the results ofthis survey comprehensive, accurate, and timely.
DEFINITIONS:E-mail (Electronic mail) – Refers to text messages transmitted across networks and usually accessible only by the addressee.Distance learning – Refers to the transmission of information from one geographic location to another via various modes oftelecommunications technology.Multimedia – Refers to the use of a computer to produce any combination of text, full color images and graphics, video,animation, and sound.Self-contained classroom teacher – Teaches all or most academic subjects to the same group of students all or most of theday.
LABEL
IF ABOVE INFORMATION IS INCORRECT, PLEASE MAKE CORRECTIONS DIRECTLY ON LABEL.
Name of person completing form:_____________________________________ Telephone:________________________
Title/position:______________________________________________ Number of years at this school: ________________
Best days and times to reach you (in case of questions):_______________________________________________________
E-mail:__________________________________________________________
PLEASE RETURN COMPLETED FORM TO: IF YOU HAVE ANY QUESTIONS, CONTACT:
WESTAT Cassandra RowandATTN: Rowand, 716610 800-937-8281, ext. 22471550 Research Boulevard Fax: 800-254-0984Rockville, Maryland 20850 E:mail: [email protected]
According to the Paperwork Reduction Act of 1995, no persons are required to respond to a collection of information unless it displays a validOMB control number. The valid OMB control number for this information is 1850-0733. The time required to complete this information collectionis estimated to average 30 minutes per response, including the time to review instructions, search existing data resources, gather the dataneeded, and complete and review the information collected. If you have any comments concerning the accuracy of the time estimate(s) orsuggestions for improving this form, please write to: U.S. Department of Education, Washington, D.C. 20202-4651. If you have comments orconcerns regarding the status of your individual submission of this form, write directly to: National Center for Education Statistics, 555 NewJersey Avenue, N.W., Washington, D.C. 20208
FRSS Form No. 70, 3/1999
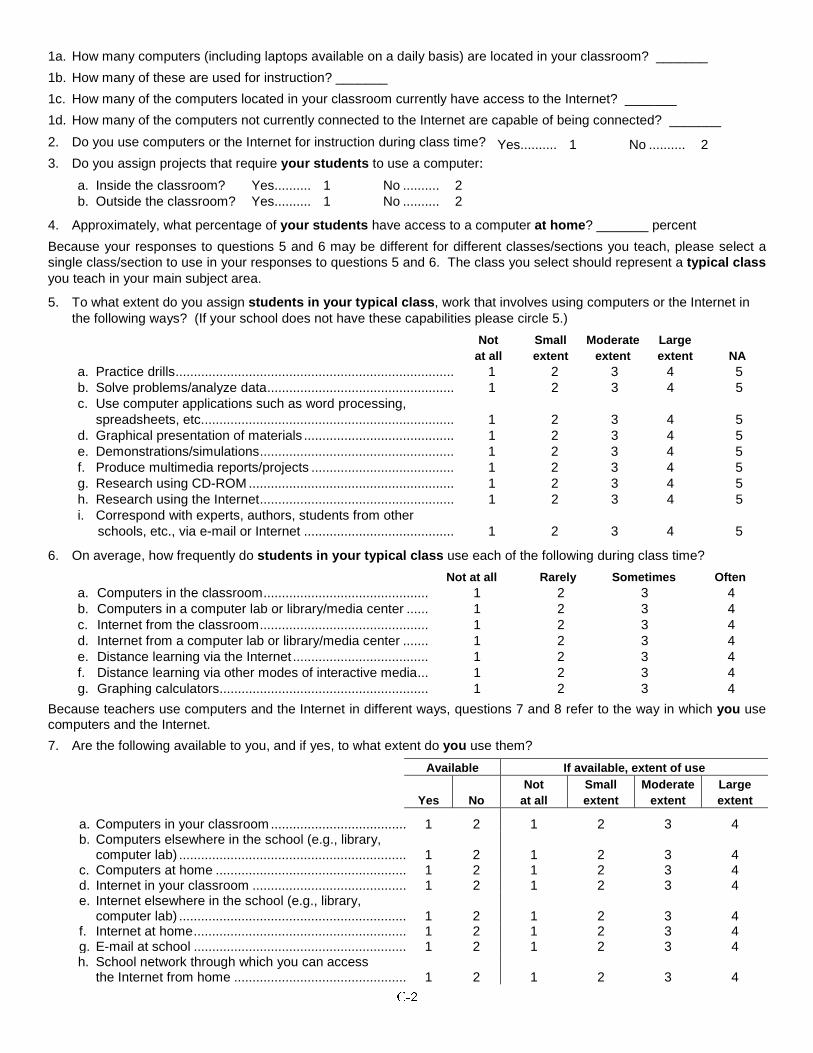
���
1a. How many computers (including laptops available on a daily basis) are located in your classroom? _______
1b. How many of these are used for instruction? _______
1c. How many of the computers located in your classroom currently have access to the Internet? _______
1d. How many of the computers not currently connected to the Internet are capable of being connected? _______
2. Do you use computers or the Internet for instruction during class time?
3. Do you assign projects that require your students to use a computer:
a. Inside the classroom? Yes.......... 1 No .......... 2b. Outside the classroom? Yes.......... 1 No .......... 2
4. Approximately, what percentage of your students have access to a computer at home? _______ percent
Because your responses to questions 5 and 6 may be different for different classes/sections you teach, please select asingle class/section to use in your responses to questions 5 and 6. The class you select should represent a typical classyou teach in your main subject area.
5. To what extent do you assign students in your typical class, work that involves using computers or the Internet inthe following ways? (If your school does not have these capabilities please circle 5.)
Notat all
Smallextent
Moderateextent
Largeextent NA
a. Practice drills............................................................................ 1 2 3 4 5b. Solve problems/analyze data................................................... 1 2 3 4 5c. Use computer applications such as word processing,
spreadsheets, etc..................................................................... 1 2 3 4 5d. Graphical presentation of materials ......................................... 1 2 3 4 5e. Demonstrations/simulations..................................................... 1 2 3 4 5f. Produce multimedia reports/projects ....................................... 1 2 3 4 5g. Research using CD-ROM ........................................................ 1 2 3 4 5h. Research using the Internet..................................................... 1 2 3 4 5i. Correspond with experts, authors, students from other
schools, etc., via e-mail or Internet ......................................... 1 2 3 4 5
6. On average, how frequently do students in your typical class use each of the following during class time?
Not at all Rarely Sometimes Oftena. Computers in the classroom............................................. 1 2 3 4b. Computers in a computer lab or library/media center ...... 1 2 3 4c. Internet from the classroom.............................................. 1 2 3 4d. Internet from a computer lab or library/media center ....... 1 2 3 4e. Distance learning via the Internet ..................................... 1 2 3 4f. Distance learning via other modes of interactive media... 1 2 3 4g. Graphing calculators......................................................... 1 2 3 4
Because teachers use computers and the Internet in different ways, questions 7 and 8 refer to the way in which you usecomputers and the Internet.
7. Are the following available to you, and if yes, to what extent do you use them?
Available If available, extent of use
Yes NoNot
at allSmallextent
Moderateextent
Largeextent
a. Computers in your classroom ..................................... 1 2 1 2 3 4b. Computers elsewhere in the school (e.g., library,
computer lab) .............................................................. 1 2 1 2 3 4c. Computers at home .................................................... 1 2 1 2 3 4d. Internet in your classroom .......................................... 1 2 1 2 3 4e. Internet elsewhere in the school (e.g., library,
computer lab) .............................................................. 1 2 1 2 3 4f. Internet at home.......................................................... 1 2 1 2 3 4g. E-mail at school .......................................................... 1 2 1 2 3 4h. School network through which you can access
the Internet from home ............................................... 1 2 1 2 3 4
Yes.......... 1 No .......... 2
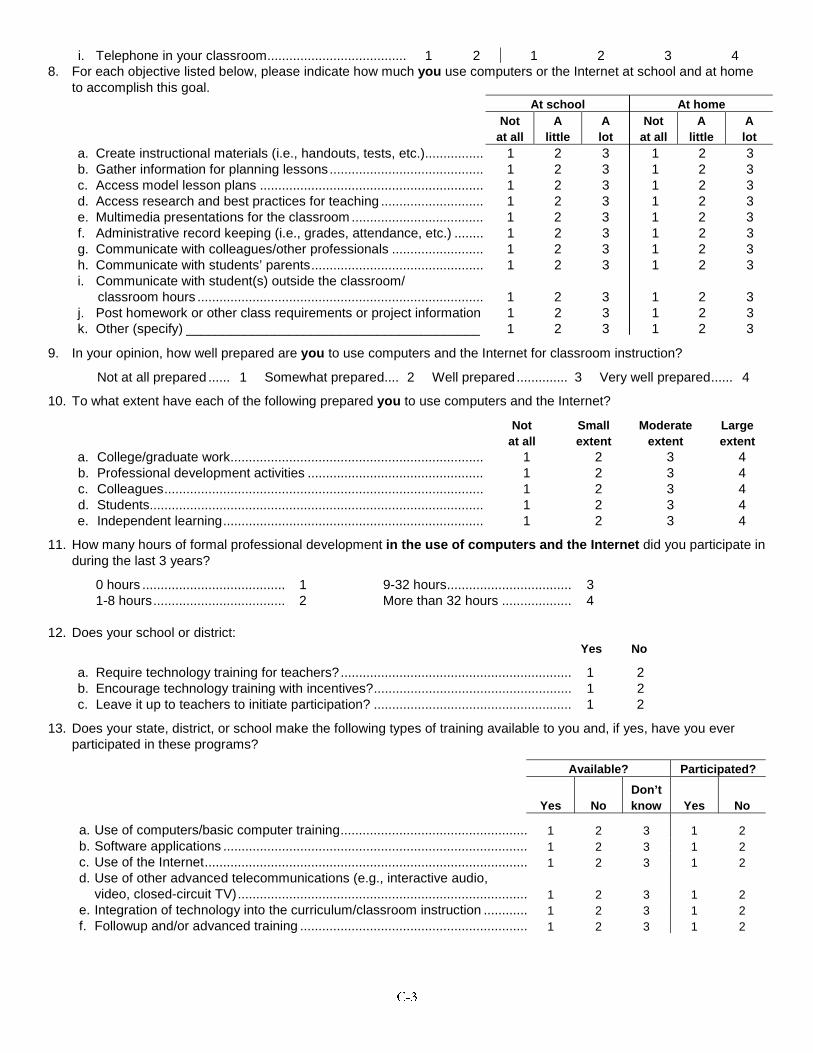
���
i. Telephone in your classroom...................................... 1 2 1 2 3 48. For each objective listed below, please indicate how much you use computers or the Internet at school and at home
to accomplish this goal.At school At home
Notat all
Alittle
Alot
Notat all
Alittle
Alot
a. Create instructional materials (i.e., handouts, tests, etc.)................ 1 2 3 1 2 3b. Gather information for planning lessons.......................................... 1 2 3 1 2 3c. Access model lesson plans ............................................................. 1 2 3 1 2 3d. Access research and best practices for teaching ............................ 1 2 3 1 2 3e. Multimedia presentations for the classroom .................................... 1 2 3 1 2 3f. Administrative record keeping (i.e., grades, attendance, etc.) ........ 1 2 3 1 2 3g. Communicate with colleagues/other professionals ......................... 1 2 3 1 2 3h. Communicate with students’ parents............................................... 1 2 3 1 2 3i. Communicate with student(s) outside the classroom/
classroom hours .............................................................................. 1 2 3 1 2 3j. Post homework or other class requirements or project information 1 2 3 1 2 3k. Other (specify) ________________________________________ 1 2 3 1 2 3
9. In your opinion, how well prepared are you to use computers and the Internet for classroom instruction?
Not at all prepared ...... 1 Somewhat prepared.... 2 Well prepared.............. 3 Very well prepared...... 4
10. To what extent have each of the following prepared you to use computers and the Internet?
Notat all
Smallextent
Moderateextent
Largeextent
a. College/graduate work..................................................................... 1 2 3 4b. Professional development activities ................................................ 1 2 3 4c. Colleagues....................................................................................... 1 2 3 4d. Students........................................................................................... 1 2 3 4e. Independent learning....................................................................... 1 2 3 4
11. How many hours of formal professional development in the use of computers and the Internet did you participate induring the last 3 years?
0 hours ....................................... 1 9-32 hours.................................. 31-8 hours.................................... 2 More than 32 hours ................... 4
12. Does your school or district:Yes No
a. Require technology training for teachers?............................................................... 1 2b. Encourage technology training with incentives?...................................................... 1 2c. Leave it up to teachers to initiate participation? ...................................................... 1 2
13. Does your state, district, or school make the following types of training available to you and, if yes, have you everparticipated in these programs?
Available? Participated?
Yes NoDon’tknow Yes No
a. Use of computers/basic computer training................................................... 1 2 3 1 2b. Software applications ................................................................................... 1 2 3 1 2c. Use of the Internet........................................................................................ 1 2 3 1 2d. Use of other advanced telecommunications (e.g., interactive audio,
video, closed-circuit TV)............................................................................... 1 2 3 1 2e. Integration of technology into the curriculum/classroom instruction ............ 1 2 3 1 2f. Followup and/or advanced training .............................................................. 1 2 3 1 2
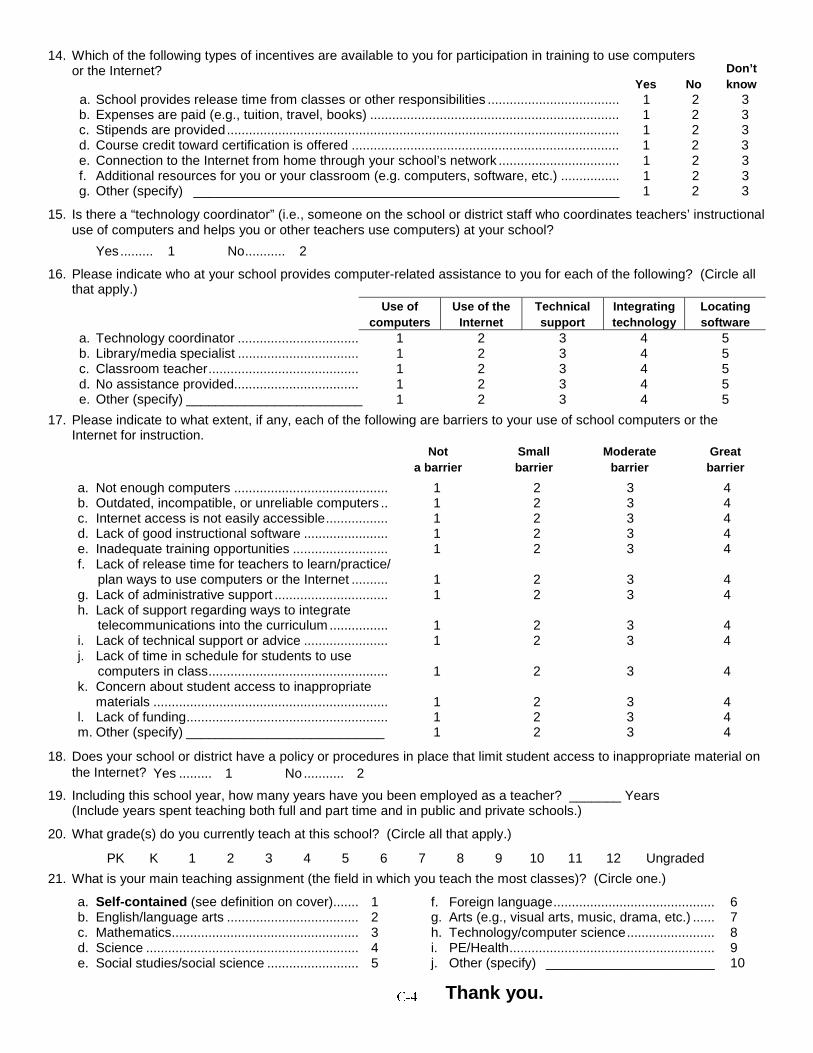
���
14. Which of the following types of incentives are available to you for participation in training to use computersor the Internet?
a. School provides release time from classes or other responsibilities .................................... 1 2 3b. Expenses are paid (e.g., tuition, travel, books) .................................................................... 1 2 3c. Stipends are provided........................................................................................................... 1 2 3d. Course credit toward certification is offered ......................................................................... 1 2 3e. Connection to the Internet from home through your school’s network ................................. 1 2 3f. Additional resources for you or your classroom (e.g. computers, software, etc.) ................ 1 2 3g. Other (specify) __________________________________________________________ 1 2 3
15. Is there a “technology coordinator” (i.e., someone on the school or district staff who coordinates teachers’ instructionaluse of computers and helps you or other teachers use computers) at your school?
Yes......... 1 No........... 2
16. Please indicate who at your school provides computer-related assistance to you for each of the following? (Circle allthat apply.)
Use ofcomputers
Use of theInternet
Technicalsupport
Integratingtechnology
Locatingsoftware
a. Technology coordinator ................................. 1 2 3 4 5b. Library/media specialist ................................. 1 2 3 4 5c. Classroom teacher......................................... 1 2 3 4 5d. No assistance provided.................................. 1 2 3 4 5e. Other (specify) ________________________ 1 2 3 4 5
17. Please indicate to what extent, if any, each of the following are barriers to your use of school computers or theInternet for instruction.
Nota barrier
Smallbarrier
Moderatebarrier
Greatbarrier
a. Not enough computers .......................................... 1 2 3 4b. Outdated, incompatible, or unreliable computers .. 1 2 3 4c. Internet access is not easily accessible................. 1 2 3 4d. Lack of good instructional software ....................... 1 2 3 4e. Inadequate training opportunities .......................... 1 2 3 4f. Lack of release time for teachers to learn/practice/
plan ways to use computers or the Internet .......... 1 2 3 4g. Lack of administrative support ............................... 1 2 3 4h. Lack of support regarding ways to integrate
telecommunications into the curriculum ................ 1 2 3 4i. Lack of technical support or advice ....................... 1 2 3 4j. Lack of time in schedule for students to use
computers in class................................................. 1 2 3 4k. Concern about student access to inappropriate
materials ................................................................ 1 2 3 4l. Lack of funding....................................................... 1 2 3 4m. Other (specify) ___________________________ 1 2 3 4
18. Does your school or district have a policy or procedures in place that limit student access to inappropriate material onthe Internet?
19. Including this school year, how many years have you been employed as a teacher? _______ Years(Include years spent teaching both full and part time and in public and private schools.)
20. What grade(s) do you currently teach at this school? (Circle all that apply.)
PK K 1 2 3 4 5 6 7 8 9 10 11 12 Ungraded
21. What is your main teaching assignment (the field in which you teach the most classes)? (Circle one.)
a. Self-contained (see definition on cover)....... 1b. English/language arts .................................... 2c. Mathematics................................................... 3d. Science .......................................................... 4e. Social studies/social science ......................... 5
f. Foreign language............................................ 6g. Arts (e.g., visual arts, music, drama, etc.) ...... 7h. Technology/computer science........................ 8i. PE/Health........................................................ 9j. Other (specify) _______________________ 10
Yes ......... 1 No ........... 2
Yes NoDon’tknow
Thank you.