Embed Size (px)
Citation preview

Andreas Brandt | Statistical approaches for comparability assessment: A regulatory statistician’s views and reflections| CMC Strategy Forum Europe 2017 | Page 1
Statistical approaches for comparability assessmentA regulatory statistician’s views and reflections
Andreas Brandt

Andreas Brandt | Statistical approaches for comparability assessment: A regulatory statistician’s views and reflections| CMC Strategy Forum Europe 2017 | Page 2
The views expressed in this presentation are the presenter‘s personal views and not necessarily the views of BfArM or EMA
Disclaimer

Andreas Brandt | Statistical approaches for comparability assessment: A regulatory statistician’s views and reflections| CMC Strategy Forum Europe 2017 | Page 3
• Currently applied statistical methods• Considerations on role of quality experts and statisticians • EMA ‘Reflection paper on statistical methodology for the comparative
assessment of quality attributes in drug development’• Summary
Overview

Andreas Brandt | Statistical approaches for comparability assessment: A regulatory statistician’s views and reflections| CMC Strategy Forum Europe 2017 | Page 4
• Started to be involved in similarity assessment for analytical biosimilarityless than 1 year ago
• Lesson learned: quality data are different• Involved in several procedures – not in two of them the same statistical
methods for similarity assessment was used
Personal experiences
Andreas Brandt | Statistical approaches for comparability assessment: A regulatory statistician’s views and reflections| CMC Strategy Forum Europe 2017 | Page 5
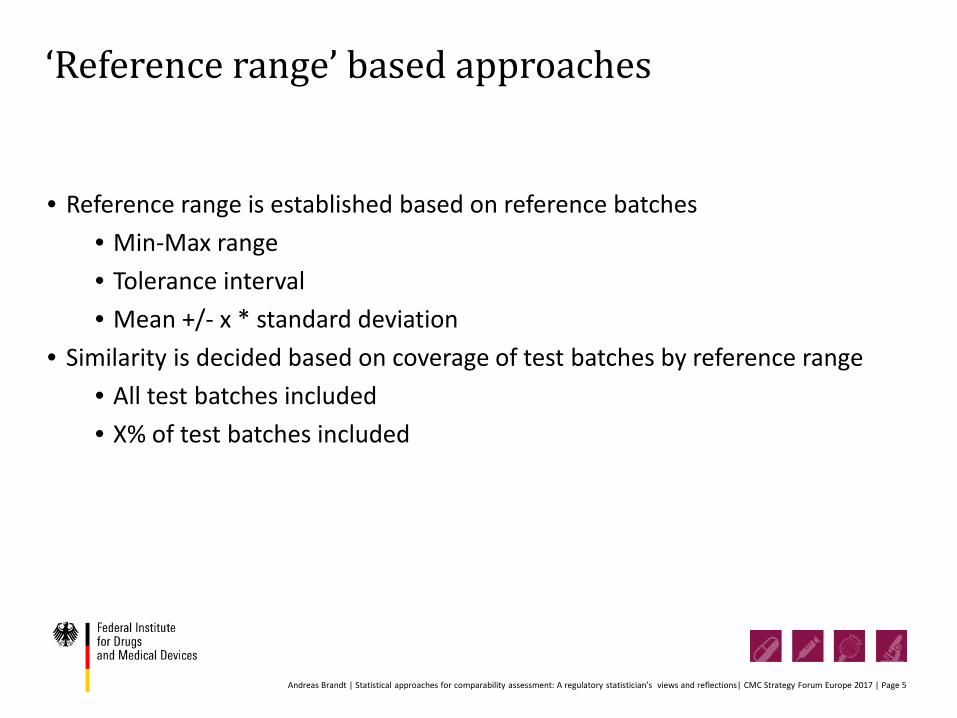
• Reference range is established based on reference batches• Min-Max range• Tolerance interval• Mean +/- x * standard deviation
• Similarity is decided based on coverage of test batches by reference range• All test batches included• X% of test batches included
‘Reference range’ based approaches

Andreas Brandt | Statistical approaches for comparability assessment: A regulatory statistician’s views and reflections| CMC Strategy Forum Europe 2017 | Page 6
90%-95%tolerance interval
Min-max
Mean +/- 2* SD
-3 -2 -1 0 1 2 3
Example referencetest

Andreas Brandt | Statistical approaches for comparability assessment: A regulatory statistician’s views and reflections| CMC Strategy Forum Europe 2017 | Page 7
• Choose parameter(s) that describe(s) the distribution of QA of interest• Similarity decision is based on similarity (‘equivalence’) of parameters for
test and reference distribution• Similar parameters similar distributions• Can be decided based on a statistical test (“equivalence test”)• Recommended using the mean by FDA for QAs in “Tier 1”
‘Equivalence-testing’ based approaches

Andreas Brandt | Statistical approaches for comparability assessment: A regulatory statistician’s views and reflections| CMC Strategy Forum Europe 2017 | Page 8
Example: Normal distribution
-3 -2 -1 0 1 2 3
SD
mean

Andreas Brandt | Statistical approaches for comparability assessment: A regulatory statistician’s views and reflections| CMC Strategy Forum Europe 2017 | Page 9
Example: Normal distribution
-3 -2 -1 0 1 2 3
referencetest

Andreas Brandt | Statistical approaches for comparability assessment: A regulatory statistician’s views and reflections| CMC Strategy Forum Europe 2017 | Page 10
• There are no ‘right’ or ‘wrong’ statistical methods• Statistical methods itself do not define what is ‘similarity’• Statistical methods are tools for decision-making on ‘true similarity’
What is the ‘correct’ statistical approach?

Andreas Brandt | Statistical approaches for comparability assessment: A regulatory statistician’s views and reflections| CMC Strategy Forum Europe 2017 | Page 11
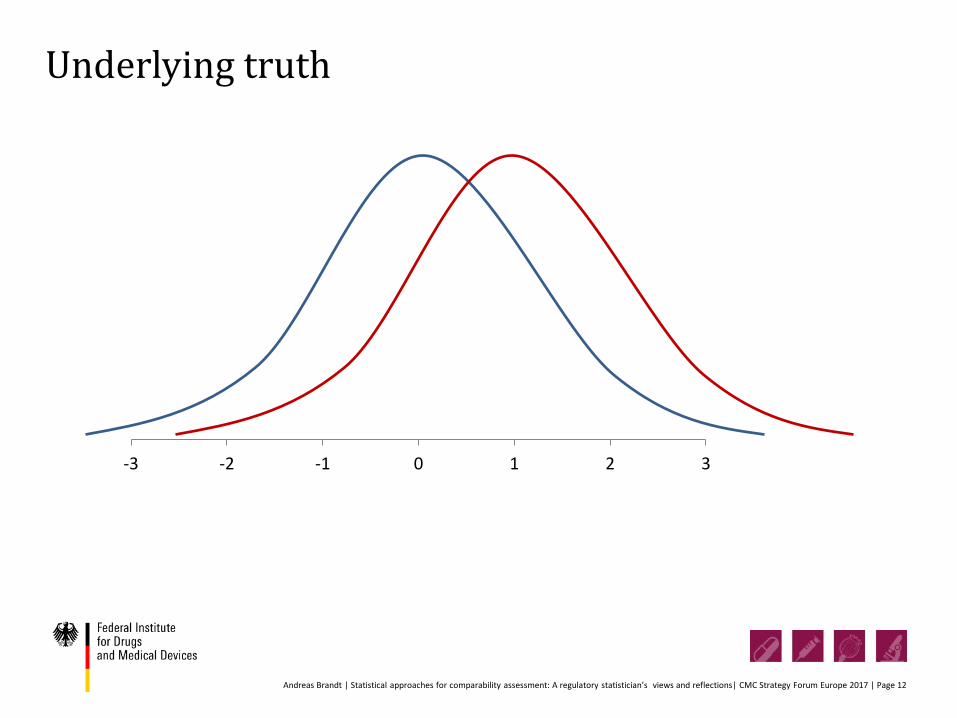
• If the ‘underlying truth’ was known (i.e. infinitely many representative batches could be sampled): when can test and reference be considered as similar?
• Is high overlap of ‘true’ test distribution with specification limits of reference sufficient?
• Is it required that distributions of QAs are similar?• Question needs to be answered (primarily) by quality experts, not
statisticians
Key question: What is ‘true similarity’?
Andreas Brandt | Statistical approaches for comparability assessment: A regulatory statistician’s views and reflections| CMC Strategy Forum Europe 2017 | Page 12
-3 -2 -1 0 1 2 3
Underlying truth

Andreas Brandt | Statistical approaches for comparability assessment: A regulatory statistician’s views and reflections| CMC Strategy Forum Europe 2017 | Page 13
-3 -1 1 3
Similar?
-3 -1 1 3
-3 -1 1 3

Andreas Brandt | Statistical approaches for comparability assessment: A regulatory statistician’s views and reflections| CMC Strategy Forum Europe 2017 | Page 14
-3 -2 -1 0 1 2 3
Underlying truth vs. sampled data
Andreas Brandt | Statistical approaches for comparability assessment: A regulatory statistician’s views and reflections| CMC Strategy Forum Europe 2017 | Page 15
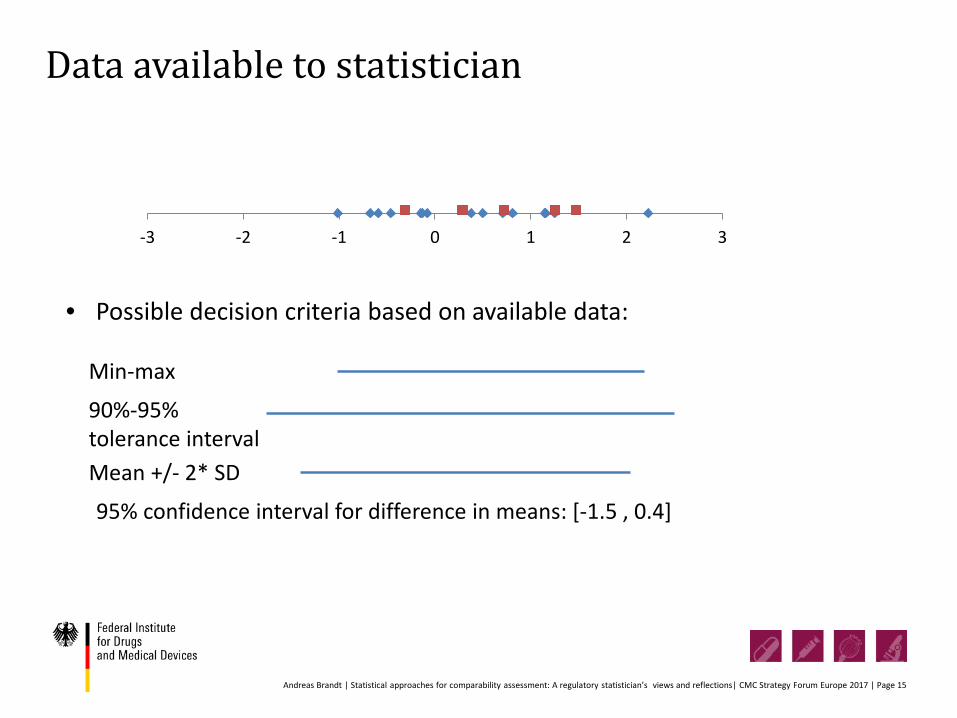
90%-95%tolerance interval
Min-max
Mean +/- 2* SD
-3 -2 -1 0 1 2 3
95% confidence interval for difference in means: [-1.5 , 0.4]
• Possible decision criteria based on available data:
Data available to statistician

Andreas Brandt | Statistical approaches for comparability assessment: A regulatory statistician’s views and reflections| CMC Strategy Forum Europe 2017 | Page 16
• ‘Underlying truth’ is unknown• Statistician’s task: find fair criteria to decide whether ‘true similarity’ is
fulfilled based on limited number of samples• Properties of statistical methods (roughly speaking)
• ‘Type 1 error’: Probability to declare products to be similar that are not• ‘Power’: Probability to declare products to be similar that are similar
• Properties of statistical methods should be known
What is the statistician’s task?
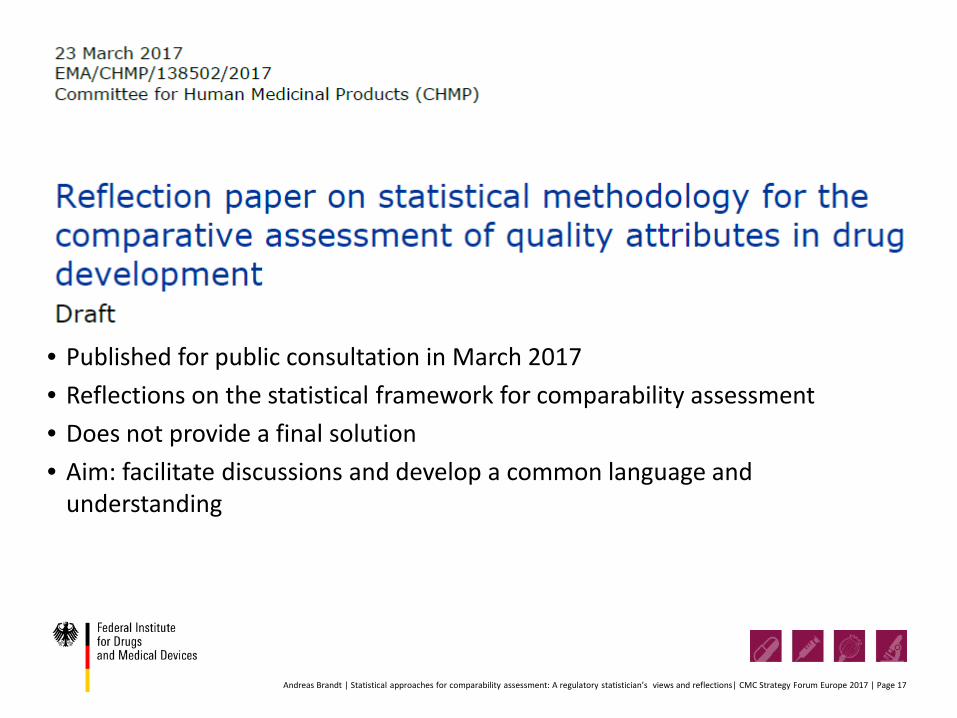
Andreas Brandt | Statistical approaches for comparability assessment: A regulatory statistician’s views and reflections| CMC Strategy Forum Europe 2017 | Page 17
• Published for public consultation in March 2017• Reflections on the statistical framework for comparability assessment• Does not provide a final solution • Aim: facilitate discussions and develop a common language and
understanding

Andreas Brandt | Statistical approaches for comparability assessment: A regulatory statistician’s views and reflections| CMC Strategy Forum Europe 2017 | Page 18
• What is the ‘unit of observation’?• Batch, tablet, vial?
• Dependencies between observations need to be taken into account• Knowledge of sources of variability required for standardization
• Between-batch variability: e.g. batch age• Within-batch variability• Within-sample variability: e.g. storage conditions
Understand the data

Andreas Brandt | Statistical approaches for comparability assessment: A regulatory statistician’s views and reflections| CMC Strategy Forum Europe 2017 | Page 19
Within-batch and between-batch variability
• Blue curves: infinitely many samples drawn from the single batches – within batch variability does not represent true variability
• Red curve: single samples drawn from infinitely many batches

Andreas Brandt | Statistical approaches for comparability assessment: A regulatory statistician’s views and reflections| CMC Strategy Forum Europe 2017 | Page 20
Source of variability
• Consistent production process? Influence of batch age on QA?
‘young’ batches ‘old’ batches

Andreas Brandt | Statistical approaches for comparability assessment: A regulatory statistician’s views and reflections| CMC Strategy Forum Europe 2017 | Page 21
Similar?
‘young’ batches
referencetest
‘old’ batches

Andreas Brandt | Statistical approaches for comparability assessment: A regulatory statistician’s views and reflections| CMC Strategy Forum Europe 2017 | Page 22
• Are the batches used for comparability exercise representative?• Ideally: Random sampling from all/a large number of batches
• Random sampling often not possible• ‘Consistency’ assumption required• Knowledge on sources of variability needed
Understand data generating process: sampling

Andreas Brandt | Statistical approaches for comparability assessment: A regulatory statistician’s views and reflections| CMC Strategy Forum Europe 2017 | Page 23
• Descriptive statistics: only statements about sampled data (e.g. min-max range)• Inferential statistics: making conclusions on ‘underlying truth’ based on sampled
data• Assumptions for inferential analysis
• Consistency: consistent production process, or sources of variability known• Representative sampling• Often: Distribution assumption (e.g. normal distribution)
• Inferential statistical concepts• Equivalence testing• Tolerance intervals• Assumption that sample mean +/- 2* sample SD covers ~ 95% of reference
distribution
Assumptions for inferential analysis

Andreas Brandt | Statistical approaches for comparability assessment: A regulatory statistician’s views and reflections| CMC Strategy Forum Europe 2017 | Page 24
• Statistical properties (type 1 error, power) poorly understood• Probability for conclusion of similarity increases with uncertainty
• Probability that reference range covers test batches is larger for few test batches
• Reference ranges defined based on statistical intervals to quantify uncertainty of location are wider when uncertainty is large
Limitations of reference range based approaches

Andreas Brandt | Statistical approaches for comparability assessment: A regulatory statistician’s views and reflections| CMC Strategy Forum Europe 2017 | Page 25
90%-95%tolerance intervalusing all reference data
-3 -2 -1 0 1 2 3
90%-95%tolerance intervalusing 2/3 of reference data
Example: Tolerance interval

Andreas Brandt | Statistical approaches for comparability assessment: A regulatory statistician’s views and reflections| CMC Strategy Forum Europe 2017 | Page 26
• Framework for appropriate inferential equivalence testing described in reflection paper
• Choose characteristic(s) to be compared (e.g. mean)• Find metric to describe distance of characteristics (e.g. difference in
means)• Define equivalence limits based on maximal acceptable difference
• Justification of equivalence limits required• Knowledge about the association between quality characteristics and
clinical outcome needed• Some arbitrariness acceptable?
• Well-understood approach from statistical side – but practical?
Equivalence testing

Andreas Brandt | Statistical approaches for comparability assessment: A regulatory statistician’s views and reflections| CMC Strategy Forum Europe 2017 | Page 27
• Several statistical approaches are used for similarity assessment• Key questions to be addressed
• For quality experts: What is ‘true similarity’?• For statisticians: How can fair decisions on ‘true similarity’ be made
based on limited data? • Reflection paper on statistical methodology for similarity assessment
• Understand raw data and data generating process• Understand the assumptions• Be aware of limitations
Summary

Andreas Brandt | Statistical approaches for comparability assessment: A regulatory statistician’s views and reflections| CMC Strategy Forum Europe 2017 | Page 28
… the curtain closed and all the issues open

Andreas Brandt | Statistical approaches for comparability assessment: A regulatory statistician’s views and reflections| CMC Strategy Forum Europe 2017 | Page 29
EMA Biostatistics Working PartyThomas Lang (Vice-Chair)Norbert BendaDavid BrownChristian GartnerRobert James HemmingsArmin KochAnja Schiel (Chair) Steven TeerenstraFerran TorresJörg ZinserlingCecilia Hedlund+ Observers
AcknowledgementsBfArMAnn-Kristin LeuchsAstrid SchäferBrigitte BrakeUte FischerKatrin BussCornelia LipperheideBirgit Schmauser

Andreas Brandt | Statistical approaches for comparability assessment: A regulatory statistician’s views and reflections| CMC Strategy Forum Europe 2017 | Page 30
ContactFederal Institute for Drugs and Medical DevicesDivision Research, Unit Biostatistics and Special Pharmacokinetics Kurt-Georg-Kiesinger-Allee 3D-53175 Bonn
Contact personDr. Andreas [email protected]. +49 (0)228 99 307-3797
Thank you very much for your attention!