Embed Size (px)
Citation preview

Statistical approaches for
understanding the aetiology
of psoriatic arthritis:
genetics, environment and
comorbidities
A thesis submitted to The University of Manchester for the degree of
Doctor of Philosophy
in the Faculty of Biology, Medicine and Health
2018
Eftychia Bellou
School of Biological Sciences
Division of Musculoskeletal and Dermatological Sciences

2

3
Table of Contents
List of Tables..................................................................................................................................................... 7
List of Figures ................................................................................................................................................. 10
Abbreviations.................................................................................................................................................. 12
Abstract ........................................................................................................................................................... 15
Declaration...................................................................................................................................................... 17
Copyright Statement .................................................................................................................................... 18
Publications Arising During this PhD ........................................................................................................ 19
About the Author.......................................................................................................................................... 21
Dedication ....................................................................................................................................................... 22
Acknowledgements ....................................................................................................................................... 22
Introduction .................................................................................................................................................... 24
1.1 Common complex diseases ...................................................................................................... 24
1.2 Epidemiology in complex diseases .......................................................................................... 25
1.2.1 Risk factors .......................................................................................................................... 25
1.2.2 Study designs ....................................................................................................................... 26
1.2.3 Causation versus association .......................................................................................... 29
1.2.4 Bias ........................................................................................................................................ 29
1.2.5 Basic epidemiological concepts ....................................................................................... 31
1.2.6 Observational epidemiology: Investigating environmental/lifestyle factors in
complex diseases ................................................................................................................................. 36
1.2.7 Genetic epidemiology: Investigating the genetic basis of complex diseases ........ 38
1.3 Investigating risk factors for PSO and PsA ............................................................................ 44
1.3.1 Epidemiology of PSO and PsA ........................................................................................ 45
1.3.2 Clinical manifestations of the diseases .......................................................................... 46
1.3.3 Immunopathogenesis of PSO and PsA .......................................................................... 58
1.3.4 Comorbid diseases ............................................................................................................ 60
1.3.5 Environmental risk factors for PsA ................................................................................ 73

4
1.3.6 Genetic risk factors for PSO and PsA .......................................................................... 81
1.4 Overall aims and objectives ...................................................................................................... 95
1.5 Outline of thesis .......................................................................................................................... 95
Environmental risk factors .......................................................................................................................... 97
2.1 Introduction ................................................................................................................................. 97
2.1.1 UK Biobank ......................................................................................................................... 98
2.2 Aims and objectives .................................................................................................................. 101
2.2.1 Aims and objectives of first study ................................................................................ 101
2.2.2 Aim and objectives of second study ............................................................................ 101
2.3 Contribution of the candidate ............................................................................................... 102
2.4 Methods ...................................................................................................................................... 103
2.4.1 Identifying lifestyle factors and comorbidities associated with PSO without
arthritis and PsA compared to the general population ............................................................ 103
2.4.2 Comorbidities in rheumatic diseases and their effect on physical activity ........ 114
2.5 Results ......................................................................................................................................... 119
2.5.1 Identifying lifestyle factors and comorbidities associated with PSO without
arthritis and PsA compared to the general population in the UK Biobank ........................ 119
2.5.2 Comorbidities in rheumatic diseases and their effect on physical activity ........ 130
2.6 Discussion ................................................................................................................................... 139
2.6.1 Review of objectives ....................................................................................................... 140
2.6.2 Study design ...................................................................................................................... 148
2.6.3 Conclusion ........................................................................................................................ 149
Genetics of PsA ........................................................................................................................................... 151
3.1 Introduction ............................................................................................................................... 151
3.2 Aims and Objectives ................................................................................................................ 153
3.3 Contribution of the candidate ............................................................................................... 153
3.4 Methods ...................................................................................................................................... 154
3.4.1 GWAS summary statistics datasets............................................................................. 154
3.4.2 Pre-processing .................................................................................................................. 155

5
3.4.3 Statistical analysis ............................................................................................................. 157
3.5 Results .......................................................................................................................................... 163
3.5.1 Genetic overlap between the diseases ....................................................................... 163
3.5.2 cFDR analysis .................................................................................................................... 164
3.5.3 MTAG ................................................................................................................................. 169
3.5.4 Sub-based analysis (ASSET) ........................................................................................... 174
3.6 Discussion ................................................................................................................................... 180
Mendelian Randomization.......................................................................................................................... 187
4.1 Introduction ................................................................................................................................ 187
4.1.1 General Overview of MR ............................................................................................... 188
4.2 Aims and objectives .................................................................................................................. 197
4.2.1 Aim ...................................................................................................................................... 197
4.2.2 Objectives .......................................................................................................................... 197
4.3 Contribution of the candidate ............................................................................................... 197
4.4 Methods ....................................................................................................................................... 198
4.4.1 Data sources and choice of IVs .................................................................................... 198
4.4.2 Statistical analysis ............................................................................................................. 200
4.5 Results .......................................................................................................................................... 201
4.5.1 Effect of BMI upon PsA and vice versa ....................................................................... 201
4.5.2 Effect of smoking initiation upon PsA and vice versa .............................................. 208
4.5.3 Effect of alcohol frequency consumption upon PsA and vice versa ..................... 209
4.6 Discussion ................................................................................................................................... 210
4.6.1 Strengths and weaknesses of the study ...................................................................... 211
4.6.2 Future work ...................................................................................................................... 212
4.6.3 Conclusion ......................................................................................................................... 213
Discussion of thesis ..................................................................................................................................... 215
5.1 Conclusion .................................................................................................................................. 218
References ..................................................................................................................................................... 219
Appendix........................................................................................................................................................ 249

6
Word count: 63,466

7
List of Tables
Table 1 | Advantages and disadvantages of the main observational study designs ............... 28
Table 2 | Types of variables used in epidemiology .............................................................................. 31
Table 3 | Types of studies in genetic epidemiology and their use ................................................. 38
Table 4 | Characteristics of the screening tools at their development phase ............................ 53
Table 5 | Comparison of psoriatic arthritis screening tools by different studies .................... 57
Table 6 | Cardiovascular events in psoriasis and psoriatic arthritis ............................................. 62
Table 7 | Hypertension in psoriasis and psoriatic arthritis .............................................................. 64
Table 8 | Obesity in psoriasis and psoriatic arthritis ........................................................................... 66
Table 9 | Liver disease in psoriasis and PsA ............................................................................................ 68
Table 10 | Chronic obstructive pulmonary disease in psoriasis patients ................................... 69
Table 11 | Psychological disorders in patients with psoriasis and psoriatic arthritis .......... 71
Table 12 | Other environmental factors associated with psoriasis and psoriatic arthritis . 77
Table 13 | Twin studies conducted to establish the genetic basis of psoriasis......................... 82
Table 14 | Epidemiological studies estimating familial aggregation in psoriatic arthritis .. 82
Table 15 | Non-MHC PSO susceptibility loci identified by association studies in the
European population (Adapted by (Ray-Jones, Eyre et al. 2016)) ................................................ 85
Table 16 | Non-MHC PSO susceptibility loci identified by association studies in the Chinese
population (Adapted by (Ray-Jones, Eyre et al. 2016)) ...................................................................... 89
Table 17 | Data collection of lifestyle factors by the UK Biobank and their categorisation for
the current study ..............................................................................................................................................105
Table 18 | Methods for controlling confounding effects in statistical modelling ..................108
Table 19 | Morbidities with their codes included in the current study and categorisation
used ........................................................................................................................................................................111
Table 20 | Baseline characteristics of the study populations .........................................................120
Table 21 | Adjusted analysis for identifying the exposures that were associated with
disease status .....................................................................................................................................................122
Table 22 | Association between lifestyle/environmental factors and disease status (final,
multivariable analysis)...................................................................................................................................124
Table 23 | Univariate regression analysis investigating the association of prevalent
comorbidities with disease status .............................................................................................................127
Table 24 | Multivariable regression analysis investigating the association of prevalent
comorbidities with disease status .............................................................................................................128
8
Table 25 | Baseline characteristics of the cohorts .............................................................................. 131
Table 26 | Prevalence of comorbidities in participants with a rheumatic disease ............... 134
Table 27 | Prevalence of comorbidities in participants with a rheumatic disease (self-
reported rheumatic disease and use of a DMARD) ............................................................................ 135
Table 28 | Association between comorbidities and physical activity in participants with a
rheumatic disease ............................................................................................................................................ 138
Table 29 | Shared pathways among immune-mediated diseases (Adapted from (Sun and
Zhang 2014)) ...................................................................................................................................................... 152
Table 30 | Sample sizes of the GWAS summary statistics datasets of the five
musculoskeletal diseases .............................................................................................................................. 154
Table 31 | Loci associated with PsA after applying cFDR analysis using as conditional
phenotypes RA, AS and JIA ........................................................................................................................... 168
Table 32 | Power gain when using MTAG approach .......................................................................... 170
Table 33 | MTAG results for PsA (presented for original PsA p-value≤0.05).......................... 172
Table 34 | MTAG results for PsA (original PsA p-value>0.05)....................................................... 173
Table 35 | Loci associated with AS, JIA, PsA, RA and SLE after applying the ASSET subset-
based approach ................................................................................................................................................. 175
Table 36 | Assumptions regarding pleiotropy of the Mendelian Randomization methods
.................................................................................................................................................................................. 195
Table 37 | Methods used to address MR limitations.......................................................................... 196
Table 38 | Characteristics of the GIANT consortium and the UK Biobank ............................... 199
Table 39 | Number of genetic instruments used for the MR analysis for each exposure-
outcome ................................................................................................................................................................ 202
Table 40 | Results of Mendelian randomization with BMI as exposure and PsA as the
outcome ................................................................................................................................................................ 203
Table 41 | Results of Mendelian randomization with smoking initiation from the UK
Biobank as the exposure and PsA as the outcome ............................................................................ 208
Table 42 | Results of Mendelian randomization with alcohol intake frequency from the UK
Biobank as the exposure and PsA as the outcome ............................................................................. 209
Appendix Table 1 | The sequence of the assessment visit (table taken from
http://www.ukbiobank.ac.uk/)...................................................................................................249
Appendix Table 2 | Genetic correlations between PsA, JIA and RA and SLE using LD
Hub……………………………………………………………………………………………………………….253
Appendix Table 3 | Loci associated with JIA after applying cFDR analysis using as
conditional phenotypes AS, PsA, RA and SLE…………………………………………………...257

9
Appendix Table 4 | Loci associated with SLE after applying cFDR analysis using as a
conditional phenotype RA and JIA…………………………………………………………………..264
Appendix Table 5 | Loci associated with RA after applying cFDR analysis using as a
conditional phenotype SLE, JIA and PsA………………………………………………………….271
Appendix Table 6 | MTAG results for JIA (results presented for original JIA p-
value<0.05)……………………………………………………………………………………………………275
Appendix Table 7 | MTAG results for JIA (original JIA p-value>0.05)……………….277
Appendix Table 8 | MTAG results for SLE………………………………………………………..281
Appendix Table 9 | MTAG results for RA…………………………………………………………286
Appendix Table 10 | MTAG results for AS……………………………………………………….289

10
List of Figures
Figure 1 | Liability-threshold model presented as a normal (Gaussian) distribution. .......... 25
Figure 2 | Example of confounding bias. ................................................................................................... 30
Figure 3 | Skin manifestations of psoriasis .............................................................................................. 47
Figure 4 | Nail changes in patients with psoriasis ................................................................................ 48
Figure 5 | Manifestations of psoriatic arthritis ...................................................................................... 49
Figure 6 | Joint with the enthesis and synovial lining being points of inflammation in
psoriatic arthritis. Adapted from Wikipedia (https://en.wikipedia.org) ................................... 60
Figure 7 | Locations of the 22 assessment centres in the UK ........................................................... 99
Figure 8 | Association of lifestyle factors with disease status (adjusted model) adjusting for
age, sex and ethnicity ...................................................................................................................................... 123
Figure 9 | Association of lifestyle factors with disease status (multivariable model)
adjusting for age, sex and ethnicity; ......................................................................................................... 125
Figure 10 | Association of prevalent comorbidities with disease status (multivariable
model) adjusting for age, sex, ethnicity, smoking and alcohol consumption, BMI and
Townsend deprivation index; ..................................................................................................................... 129
Figure 11 | Number of participants included in the study .............................................................. 130
Figure 12 | Prevalence and incidence rates of comorbidities ........................................................ 136
Figure 13 | Association between presence/absence of rheumatic disease, (co)morbidity
and physical activity ........................................................................................................................................ 138
Figure 14 | Genetic correlation for each pair of the five musculoskeletal disorders. .......... 163
Figure 15 | Dendrogram clustering the diseases on correlation “distances”. ......................... 164
Figure 16 | Q-Q plots for PsA conditional on RA (top), AS (left) and JIA (right). ................... 166
Figure 17 | cFDR results for PsA conditioned on RA (top), AS (bottom left) and JIA (bottom
right). ..................................................................................................................................................................... 167
Figure 18 | Manhattan plot of association results for PsA. ............................................................. 171
Figure 19 | Novel loci identified by ASSET subset-based analysis by frequency of disease
clusters. ................................................................................................................................................................ 179
Figure 20 | All loci identified by ASSET subset-based approach by frequency of disease
clusters. ................................................................................................................................................................ 179
Figure 21 | Scatterplot for comparison of methods of BMI (GIANT) upon PsA. .................... 204
Figure 22 | Scatterplot for comparison of methods of BMI (UK Biobank) upon PsA. .......... 205
11
Figure 23 | Funnel plot displaying the causal effect estimate of each IV against its precision
for MR analysis of BMI (GIANT) on PsA. .................................................................................................206
Figure 24 | Funnel plot displaying the causal effect estimate of each IV against its precision
for MR analysis of BMI (UK Biobank) on PsA. ......................................................................................207
Appendix Figure 1 | Short version of the International Physical Activity Questionnaire
(IPAQ)……………………………………………………………………………………..250
Appendix Figure 2 | Scoring protocol for International Physical Activity Questionnaire
(IPAQ) ....................................................................................................................................................................252
Appendix Figure 3| Q-Q plots for JIA conditional on AS (top left), PsA (top right), RA
(bottom left) and SLE (bottom right). ......................................................................................................254
Appendix Figure 4 | cFDR results for JIA conditioned on AS (top left), PsA (top right), RA
(bottom left). ......................................................................................................................................................256
Appendix Figure 5 | Q-Q plots for SLE conditional on RA (left) and JIA (right). ...................262
Appendix Figure 6 | cFDR results for SLE conditioned on RA (left) and JIA (right). ............263
Appendix Figure 7 | Q-Q plots for RA conditional on SLE (top), PsA (bottom left) and JIA
(bottom right). ...................................................................................................................................................269
Appendix Figure 8 | cFDR results for RA conditioned on SLE (top), PsA (bottom left) and
JIA (bottom right). ............................................................................................................................................270
Appendix Figure 9 | Manhattan plot of association results for JIA. .............................................279
Appendix Figure 10 | Manhattan plot of association results for SLE. .........................................283
Appendix Figure 11 | Manhattan plot of association results for RA. ..........................................285
Appendix Figure 12 | Manhattan plot of association results for AS. ...........................................288
Appendix Figure 13 | Forest plot of BMI (GIANT) on PsA using Wald ratio for each IVW.
..................................................................................................................................................................................290
Appendix Figure 14| Leave-one-out-plot for BMI (GIANT) on PsA. ............................................291
Appendix Figure 15 | Forest plot of BMI (UK Biobank) on PsA using Wald ratio for each
IVW. ........................................................................................................................................................................292
Appendix Figure 16 | Leave-one-out-plot for BMI (UK Biobank) on PsA. ................................293

12
Abbreviations
1KG 1000 Genome
2SLS Two-Stage Least Squares
AS Ankylosing Spondylitis
BIA Bioelectrical Impedance Analysis
BMI Body Mass Index
BSA Body Surface Area
CASPAR ClASsification of Psoriatic ARthritis
ccFDR conjunctional conditional False Discovery Rate
CD Crohn’s Disease
CD4 Cluster of Differentiation 4
cFDR conditional False Discover Rate
CHD Coronary Heart Disease
CHIAG Community Health Index Advisory Group
CI Confidence Interval
COPD Chronic Obstructive Pulmonary Disease
CPMA Cross-phenotype meta-analysis
CRP C-Reactive Protein
CVD Cardiovascular Disease
DC Dendritic Cell
DIP Distal Interphalangeal Joint
DM Diabetes Mellitus
DMARD Disease-modifying Anti-Rheumatic Drug
DNA Deoxyribonucleic acid
EARP Early ARthritis for Psoriatic Patients
ERAP1 Encoding Endoplasmic Reticulum Aminopeptidase 1
FDR False Discovery Rate
gcp genetic causality proportion
GIANT Genetic Investigation of ANthropometric Traits
GP General Practitioner
GPP Generalised Palmoplantar Pustulosis
GWAS Genome-Wide Association Study

13
HCV Hepatitis C Virus
HIV Human Immunodeficiency Virus
HLA Human Leukocyte Antigen
HPA Hypothalamic-Pituitary-Adrenal
HR Hazard Ratio
IBD Inflammatory Bowel Disease
IFN Interferon
IgA Immunoglobulin A
IgG Immunoglobulin G
IL Interleukin
IL-23R Interleukin 23 receptor
IPAQ International Physical Activity Questionnaire
IQR Interquartile Range
IV Instrumental Variable
JIA Juvenile Idiopathic Arthritis
KP Koebner Phenomenon
LCE Late Cornified Envelope
LCV Latent Causal Variable
LD Linkage Disequilibrium
MBE Mode-Based Estimate
MDD Major Depressive Disorder
MHC Major Histocompatibility Complex
MI Myocardial Infraction
mPAQ modified Psoriasis and Arthritis Questionnaire
MR Mendelian Randomization
MREC Multi-centre Research Ethics Committee
MRI Magnetic Resonance Imaging
MS Multiple Sclerosis
MTAG Multi-Trait Analysis of GWAS
NAFLD Non-Alcoholic Fatty Liver Disease
NASH Non-Alcoholic SteatoHepatitis
NHS Nurses’ Health Study
NIGB National Information Governance Board
NSAID NonSteroidal Anti-Inflammatory Drug
OR Odds Ratio
PAQ Psoriasis and Arthritis Questionnaire

14
PASE Psoriatic Arthritis Screening and Evaluation
PASI Psoriasis Area and Severity Index
PASQ Psoriasis and Arthritis Screening Questionnaire
PBC Primary Biliary Cholangitis
pDC plasmacytoid Dendritic Cell
PEST Psoriasis Epidemiology Screening Tool
PsA Psoriatic Arthritis
PSO Psoriasis
Q-Q Quantile-Quantile
RA Rheumatoid Arthritis
RANK Receptor Activator of Nuclear factor Kappa-B
RANKL RANK ligand
RR Relative Risk
SBM Subset-based Method
SD Standard Deviation
SF-36 36-item Short Form
SLE Systemic Lupus Erythematosus
SMR Standardised Morbidity Ratio
SNP Single Nucleotide Polymorphism
SPR Standardised Prevalence Rate
ST Systemic Therapy
T1D Type 1 Diabetes
T2D Type 2 Diabetes
TAG Tobacco, Alcohol and Genetics consortium
Tc1 T cytotoxic 1
Th1 T helper 1
THIN The Health Improvement Network
TIA Transient Ischaemic Attack
TNF Tumour Necrosis Factor
ToPAS Toronto Psoriatic Arthritis Screen
UC Ulcerative Colitis
UK United Kingdom
USA United States of America
WHO World Health Organisation
WTCCC Wellcome Trust Case Control Consortium
ZEMPA Zero Modal Pleiotropy Assumption

15
Abstract
Background: Psoriatic arthritis (PsA) is a seronegative inflammatory arthritis affecting
patients with psoriasis. Early identification of PsA could result in less joint damage and
better outcomes and highlight potential clinical targets. Several studies have tried to
elucidate the aetiology of PsA by investigating its genetic basis using genome-wide
association studies, the contribution of environmental and lifestyle factors to its
development and the prevalence of comorbidities in patients with psoriasis and/or PsA.
However, the small sample sizes used in these studies along with the unclear
phenotypic characterisation have led to the identification of only a handful PsA-specific
risk factors.
Aims: The broad aim of this study was to improve the understanding of the
pathogenesis of PsA by investigating the genetic and the environmental contribution,
along with the prevalence of multi-morbidity that has an impact on clinical outcomes.
Firstly, the study aimed to explore the association and causality of environmental
factors with PsA and the prevalence of comorbidities using the wealth of data UK
Biobank offers. Secondly, the study aimed to identify novel genetic variants
underpinning PsA using state-of-the-art techniques that leverage power from genetic
studies performed in other correlated musculoskeletal diseases.
Methods: The association of PsA with known environmental factors and
comorbidities was investigated using logistic regression in the UK Biobank. To further
define the genetic variants underpinning PsA, GWAS data from other musculoskeletal
diseases were tested for correlation with PsA using LD score regression and cross-
trait analysis was subsequently performed. Conditional False Discovery Rate analysis
and two alternative meta-analysis methods (Multi-Trait analysis of GWAS and subset-
based analysis) were used because of their ability to exploit the pleiotropy among
correlated traits and increase the power of polymorphism detection. Finally, the causal
role of the statistically significant environmental factors was then determined using
Mendelian Randomisation.

16
Results: Body mass index was confirmed to play a causal role in the development of
PsA in patients with psoriasis. In addition, using LD score regression rheumatoid
arthritis, systemic lupus erythematosus, ankylosing spondylitis and juvenile idiopathic
arthritis were found to be genetically correlated with PsA. Twenty one novel SNPs
were found by all three methods to be associated with PsA, the majority of which are
mapped to genes that have not previously been associated with PsA.
Summary: This work has carried forward the research of detecting PsA risk factors.
It includes the first cross-trait study investigating PsA along with other musculoskeletal
diseases, the first study to explore UK Biobank data for associations of the disease
with lifestyle risk factors and known comorbidities and finally the first study to assess
the causal role of obesity, smoking status and alcohol frequency consumption in the
onset of PsA. All this evidence can be taken forward for further functional and clinical
applications.

17
Declaration
I declare that no portion of the work referred to in the thesis has been submitted in
support of an application for another degree or qualification of this or any other
university or other institute of learning.

18
Copyright Statement
I. The author of this thesis (including any appendices and/or schedules to this
thesis) owns certain copyright or related rights in it (the “Copyright”) and she
has given The University of Manchester certain rights to use such Copyright,
including for administrative purposes.
II. Copies of this thesis, either in full or in extracts and whether in hard or
electronic copy, may be made only in accordance with the Copyright, Designs
and Patents Act 1988 (as amended) and regulations issued under it or, where
appropriate, in accordance with licensing agreements which the University has
from time to time. This page must form part of any such copies made.
III. The ownership of certain Copyright, patents, designs, trademarks and other
intellectual property (the “Intellectual Property”) and any reproductions of
copyright works in the thesis, for example graphs and tables (“Reproductions”),
which may be described in this thesis, may not be owned by the author and
may be owned by third parties. Such Intellectual Property and Reproductions
cannot and must not be made available for use without the prior written
permission of the owner(s) of the relevant Intellectual Property and/or
Reproductions.
Further information on the conditions under which disclosure, publication and
commercialisation of this thesis, the Copyright and any Intellectual Property and/or
Reproductions described in it may take place is available in the University IP Policy (see
http://documents.manchester.ac.uk/DocuInfo.aspx?DocID=24420), in any relevant
Thesis restriction declarations deposited in the University Library, The University
Library’s regulations (see http://www.library.manchester.ac.uk/about/regulations/) and
in The University’s policy on Presentation of Theses.

19
Publications Arising During this PhD
Manuscripts
Bowes J., Ashcroft J., Dand N., Jalali-Najafabadi F., Bellou E., Ho P., Marzo-Ortega H.,
Helliwell P.S., Feletar M., Ryan A.W., Kane D.J., Korendowych E., Simpson M.A.,
Packham J., McManus R., Brown M.A., Smith C.H., Barker J.N., McHugh N., FitzGerald
O., Warren R.B., Barton A. Cross-phenotype association mapping of the MHC
identifies genetic variants that differentiate psoriatic arthritis from psoriasis. Ann Rheum
Dis. 2017; 76(10):1774-1779
Cook M.*, Bellou E.*, Bowes J., Sergeant J.C., O’Neill T.W., Barton A., Verstappen
S.M.M. Impact of (co-)morbidities on physical activity in people with and without
inflammatory rheumatic diseases: results from the UK Biobank. Rheumatology
(Accepted/In press) *equal contribution
Conference Abstracts
The American College of Rheumatology (San Francisco, November 2015)
Bellou E., Cook M., Bowes J., Sergeant J.C., Barton A., O’Neill T.W., Verstappen
S.M.M. Prevalence of chronic comorbidities in patients with rheumatoid arthritis,
psoriatic arthritis, ankylosing spondylitis and systemic lupus erythematosus: an analysis
of UK Biobank Data (oral).
Cook M.J., Bellou E., Sergeant J.C., Bowes J., Barton A., O’Neill T.W., Verstappen
S.M.M. The impact of cardiovascular and lung disorder morbidities on physical activities
in people with inflammatory arthritis compared to the general population in the UK
(poster).
British Society of Investigative Dermatology (Dundee, April 2016)
Bellou E., Bowes J., Verstappen S.M.M, Cook M., Sergeant J.C., Barton A., Warren R.B.
A study from the UK Biobank of lifestyle habits and cardiovascular disease in psoriasis,
psoriatic arthritis and controls (poster).

20
British Society of Rheumatology (Glasgow, April 2016)
Bellou E., Verstappen S.M.M., Cook M., Sergeant J.C., Warren R.B., Barton A., Bowes J.
Increased rates of hypertension in patients with psoriatic arthritis compared to
psoriasis alone: results from the UK Biobank (oral).
Cook M.J., Bellou E., Sergeant J.C., Bowes J., Barton A., O’Neill T.W., Verstappen
S.M.M. Higher prevalence of chronic cardiovascular and pulmonary morbidities in
people with inflammatory arthritis is associated with a lower level of physical activity:
results from the UK Biobank (poster).
The American College of Rheumatology (Washington D.C.- November
2016)
Bellou E., Verstappen S.M.M., Cook M., Sergeant J.C., Warren R.B., Barton A., Bowes J.
Increased rates of hypertension in patients with psoriatic arthritis compared to
psoriasis alone: results from the UK Biobank (poster)

21
About the Author
My background is in computer science, having completed a 5-year MEng in Computer
and Communications Engineering at the University of Thessaly, Greece. During the
final year of my MEng I became fascinated with bioinformatics and decided to pursue a
MSc in this field. I graduated from the University of Newcastle in 2014 with an MSc in
Bioinformatics with distinction. For my master’s year project, I embarked upon a
project on the investigation of fatigue in patient with primary Sjogren’s syndrome using
Machine Learning. During this time I developed a passion for research and I became
increasingly interested in epidemiology and decided to pursue a PhD at the Arthritis
Research UK Centre for Genetics and Genomics in Manchester.
During my PhD, I enjoyed developing my existing programming skills and learning
statistical techniques for analysing large datasets. In particular I was keen on using both
novel and “traditional” methods in (genetic) epidemiology to further our understanding
in the aetiology of autoimmune diseases such as psoriasis and psoriatic arthritis. In
addition, I have enjoyed presenting my research at international and national
conferences including ACR and BSR.
Currently, I am a Research Associate in Bioinformatics at the Division of Psychological
Medicine and Clinical Neurosciences at Cardiff University working on the development
and implementation of polygenic risk algorithms for stratifying individuals for future
cognitive decline due to Alzheimer’s disease.

22
Dedication
This thesis is dedicated to my parents, Sofia Georgoudi and Evangelos Bellos and to the
loving memory of my grandparents, Dimitra and Georgios Georgoudis.
Acknowledgements
First of all, I want to express my gratitude to my supervisor, Dr. John Bowes, for introducing
me to field of genetic epidemiology, for his guidance and his endless support throughout the
PhD. He has helped me to develop invaluable skills for my future career and for that, I am
extremely grateful. I would also like to thank Professor Anne Barton and Professor Richard
Warren for always being there to offer a new insight and ideas and for providing constructive
feedback.
During my PhD, I was incredibly fortunate to collaborate with brilliant researchers within the
ARUK Centre for Epidemiology. Many thanks to Dr. Suzanne Verstappen, Dr. Jamie Sergeant
and Michael Cook for their generous help and guidance with various analyses. I would also
wish to thank Professor Goran Nenadic for his advice during the implementation of the
“misspelling” algorithm and James Liley for help with the cFDR method. Finally, I am grateful to
everyone within the Arthritis Research UK Centre for Genetics and Genomics who have
provided training whenever needed.
I could not have survived this PhD without the support of my close friends and family. Endless
thanks to my friends for life and fellow students in 2.706 for the great moments we have
shared, the morning hashtag deep conversations, the unstoppable laughter and the vast amount
of cookies during stressful periods. Special thanks to my friends outside of the University for
putting up with me during our endless phone calls and the great memories we have created
travelling. Alex, Dimitra, Jo, Marina, Mpou and Xara thanks for always being there. Last but not
least, I wish to thank my parents for being supportive of my decisions, and believing in me.
Finally, I wish to thank the Psoriasis Association for funding this PhD and Sofoklis Achillopoulos
Foundation for their support during my studies.

23

24
Chapter1
Introduction
Common complex diseases 1.1
Modern genetics has had a major impact on medicine by defining diseases that are
caused by alterations in one gene and are called “Mendelian” or “monogenic” diseases.
They run in families; the majority are rare and their transmission pattern can be
dominant or recessive, autosomal or sex-linked.
In contrast, common complex diseases do not follow the standard Mendelian patterns
of inheritance but are caused by the interplay of genetic, environmental and lifestyle
factors. Such conditions include Alzheimer’s and Parkinson’s disease, various types of
cancer, mental health disorders and autoimmune diseases.
The complex diseases present a polygenic inheritance in which many gene loci have a
small effect (Mitchell 2012). The liability-threshold model consists of two assumptions:
i) all members of a population have a normally distributed genetic liability for a
particular trait and ii) according to the threshold value; all individuals whose value on
the liability continuum exceeds this threshold are affected by the trait (Figure 1). An
individual’s liability is the sum of his or her genetic and lifestyle risk factors, with each
additional risk factor moving the individual closer to the threshold (Haegert 2004).

25
Figure 1 | Liability-threshold model presented as a normal (Gaussian) distribution. The arrows present the potential range of liabilities.
This model highlights the importance of studying the contribution from all risk factors
to fully understand susceptibility to disease.
Epidemiology in complex diseases 1.2
Epidemiology is concerned with the distribution and the determinants of health-related
states or events in specific populations. It is one of the core disciplines used to
investigate the associations between environmental and genetic factors and health
outcomes. More specifically epidemiology focuses on i) the definition of the disease ii)
the aetiology of the disease iii) the prevalence and incidence of the disease in a specific
population iv) the identification of risk factors and v) the control and prevention of the
disease.
Risk factors 1.2.1
Risk factors are aspects of lifestyle, environmental exposure, biological characteristics
and/or genetic predisposition that are associated with the frequency of occurrence of a
health-related condition such as tobacco and alcohol consumption, high blood pressure
and body mass index (BMI) (Fletcher and Fletcher 2005). There are various types of
risk factors including
Inherited (predisposition) such as carriage of certain HLA alleles that
increases the risk of autoimmune diseases.
Environmental determinants that lie outside the individual’s immediate
control such as air pollutants, infectious agents and water pollution. There

26
are others that are part of the social environment; for example, loss of a
relative or unemployment.
Determinants associated with the individual’s lifestyle and behaviour
including tobacco and alcohol consumption.
The exposure to a risk factor can occur either at a single point in time, as when an
individual is traumatised during a car accident, or over a period of time (e.g. asbestos
exposure) with the risk of the disease associated with the exposure time. Recognising
risk factors can be challenging because the associations between exposure and disease
are not obvious due to:
the long latency between exposure to a risk factor and the onset of the disease
the frequency of exposure to a risk factor
the low incidence of the disease or the small risk that the exposure can confer
which may necessitate large number of cases to observe a relationship between
the exposure and the disease outcome
various determinants may be related and their combination might be associated
with the onset of the disease (Fletcher and Fletcher 2005).
Study designs 1.2.2
Optimal study design is essential in order to investigate the nature of the relationship
between a risk factor and a health outcome and it depends on the study population,
the outcome of interest and the aim of the study. There are two basic approaches to
measure this relationship; the experimental and the observational approach. The
effects of most risk factors can be studied with observational studies in which the
researcher gathers data by simply observing and without interfering in the process.
Cohort studies 1.2.2.1
In a cohort design, a closed group of subjects is classified based on their exposure to a
factor of interest and then it is observed over a meaningful period of time to note the
incidence of any new cases of a trait (Song and Chung 2010). This design helps in
establishing a timeline of events occurring as well as in evaluating many outcomes. The
cohort studies can be either prospective or retrospective. In a prospective study
design, the subjects are followed over time into the future, whereas in retrospective

27
study the data from the subjects were recorded at some point in the past and their
current status with respect to the outcome of interest is determined.
Population-based cohort studies 1.2.2.1.1
Population-based studies are a type of a cohort design; however, the cohort is not a
fixed group of subjects but an entire target population. This type of study tries to
reflect the variety of demographic, epidemiological and clinical characteristics of a well-
defined population with the results being generalised to the whole population (Ethgen
and Standaert 2012). This type can include a range of other study designs such as case-
control and cross-sectional studies.
Case-control studies 1.2.2.2
Case-control studies are a type of retrospective design, where two groups are
compared based on past exposure to putative risk factors; the case group containing
subjects with the outcome of interest and the control group including subjects without
the outcome. The difference between this and the cohort study is in the selection of
the subjects; in a cohort study the subjects are free of the outcome of interest and
then are monitored over a sensible period of time, whereas in the case-control
approach, the subjects are selected based on whether the outcome is present or not
(Lewallen and Courtright 1998).
Nested case-control studies 1.2.2.3
Nested case-control studies are a variant of the conventional case-control and cohort
study and can also be described as a case-control study within a cohort study. With
this approach, a defined cohort is created, followed and cases are identified either as
they occur (prospective approach) or after occurring (retrospective approach). Then
for each case, a number of controls are selected among those who have not developed
the outcome (Ernster 1994).
Cross-sectional studies 1.2.2.4
In the cross-sectional study, the selection of subjects is made from an existing defined
population and at a specific point in time information is simultaneously obtained for all
the subjects on both the exposure(s) and outcome(s) of interest (Song and Chung
2010).

28
The main advantages and disadvantages of the three approached are described in Table
1.
Table 1 | Advantages and disadvantages of the main observational study designs
Study design Advantages Disadvantages
Cohort study 1. Assures that exposure
occurred before the
outcome of interest
1. Not applicable to rare
diseases as a large cohort
will be needed
2. Large cohorts are
expensive and time
consuming to be formed
3. Follow-up issues
4. Susceptible to selection
bias
Case-control study 1. Suitable for rare diseases
2. Suitable for studying
diseases with long
induction period
3. Smaller number of subjects
needed so they are
inexpensive to carry out
1. More interpretation
difficulties compared to
the cohort approach
2. Controls and cases
should be selected from
the same population
3. Unsure whether
exposure(s) preceded
the studied outcome(s)
Cross-sectional study 1. Estimation of prevalence of
conditions
2. Investigation of the
distribution and the
determinants of
behavioural risk factors
3. Easy and quick to
implement
1. Unsure whether
exposure(s) preceded
the studied outcome(s)
2. Susceptible to selection
bias and misclassification
issues

29
Causation versus association 1.2.3
One of the main goals of epidemiology is to assert the existence of a causal
relationship between a risk factor and a health outcome. Understanding the difference
between association and causation is the key to accurate interpretation of
epidemiological findings. For that reason, Hill proposed nine criteria that must be taken
into account in assessing whether causation exists (Fedak, Bernal et al. 2015). These
are:
strength of the association
consistency of the association (which is the repeated observation of the
association in different settings)
specificity (meaning a specific disease results from a given exposure and not
from other exposures under a given association)
temporality (which means that the exposure must be observed before the
effect)
biological gradient (meaning the existence of a linear relationship between the
two variables)
biological plausibility
coherence among studies about the nature of the association
experimental evidence when possible, and
analogy (similar factors have been taken into account).
Bias 1.2.4
Epidemiological studies can be subject to a number of biases at any research stage that
can lead to an inaccurate result. The term bias refers to the systematic deviation of the
estimated statistic of the association between an exposure and a disease from the true
value. Most biases occur during the design of the study, the data collection and during
the estimation of an effect influenced by many determinants (Delgado-Rodriguez and
Llorca 2004). Biases can fall into the following broad categories:
Selection bias is the type of error introduced when the study population
is not representative of the target population. It occurs when the
compared groups of patients are dissimilar in determinants of the health
outcome, such as age and sex, compared to the target population.

30
Measurement bias is the result of systematic erroneous measurements
because of imprecise tools, faulty measurement procedure or human
error.
Information bias describes the recording of either a risk factor or the
outcome being studied in a different way leading to misclassification. For
example, if the interviewer knows the status of the subjects before the
interview, he/she may examine the exposures in a different way if the
subjects are cases.
Confounding bias occurs when a risk factor, which is associated with
the under-study exposure, is also associated with the outcome of
interest without being an intermediate step of the causal pathway. For
example, in a study of whether alcohol consumption causes mouth
cancer, smoking can be a confounder if it is a well-known risk factor for
mouth cancer and if it is associated with alcohol consumption without
being a result of alcohol consumption (Figure 2). This type of bias can be
dealt with during the analysis of the data if the confounding variables
have been recorded; otherwise this leads to spurious associations
between the investigated risk factor and the outcome of interest.
Figure 2 | Example of confounding bias. Another exposure exists (smoking) in the study population besides the one being studied (alcohol consumption) and is associated both with disease (mouth cancer) and the exposure being studied. If the confounder (smoking), which is a determinant of or a risk factor for the disease, is unequally distributed between the exposure subgroups (alcohol drinkers are more likely to smoke), it can lead to confounding.

31
Basic epidemiological concepts 1.2.5
Before describing the methods for measuring effects per each design study, it is useful
to list a number of fundamental epidemiological terms used in the current thesis for
better comprehension of the methods used and the reasons they were chosen.
Types of variables 1.2.5.1
The following table (Table 2) summarises the types of variables that can be
encountered in an epidemiological study.
Table 2 | Types of variables used in epidemiology
Type Scale Definition
Categorical or Qualitative Nominal The values are categories
without ranking
Ordinal The values can be ranked
Continuous or Quantitative Interval Values are measured in equally
spaced unites with no zero point
Ratio Values can have a zero point
Distribution and measures 1.2.5.2
Frequency distributions have two main properties; central location (where the
distribution peaks) and spread (the distribution out of a central value).
Regarding central location, the most common measures are the mean and the median
and they can summarise the entire distribution. The selection of the measure to be
used depends on the shape of the distribution. The mean is equal to the sum of all the
values in the dataset divided by the number of values in the same dataset. It is used to
summarise continuous variables that follow a normal distribution and is affected by the
presence of extreme values. On the contrary, median is the middle score for a set of
data that has been arranged in order of magnitude. It is used for reporting continuous
variables that have a skewed or asymmetrical distribution and it is a robust measure, as
it is not affected by extreme value observations.
Regarding the spread, the measures that are most frequently reported are the
interquartile range (IQR) and the standard deviation (SD). The SD is used in
conjunction with the mean and it shows how widely or tightly the observations are
distributed from the centre. The IQR is jointly used with the median and it conveys the

32
portion of the distribution from the 25th percentile to the 75th percentile (Dicker
2006).
Measures of frequency 1.2.5.3
Frequency measures compare parts of the same distribution or a part to the entire
distribution. The most common measures are ratio, proportion and rate (Dicker
2006).
𝑅𝑎𝑡𝑖𝑜 =𝑁𝑢𝑚𝑏𝑒𝑟 𝑜𝑓 𝑒𝑣𝑒𝑛𝑡𝑠, 𝑝𝑒𝑟𝑠𝑜𝑛𝑠 𝑖𝑛 𝑜𝑛𝑒 𝑔𝑟𝑜𝑢𝑝
𝑁𝑢𝑚𝑏𝑒𝑟 𝑜𝑓 𝑒𝑣𝑒𝑛𝑡𝑠, 𝑝𝑒𝑟𝑠𝑜𝑛𝑠 𝑖𝑛 𝑎𝑛𝑜𝑡ℎ𝑒𝑟 𝑔𝑟𝑜𝑢𝑝
In ratio, the two compared groups should not be related. It is mainly used to estimate
the occurrence of an event (as described later).
The proportion is suitable when the intended use is the comparison of a part to the
whole.
𝑃𝑟𝑜𝑝𝑜𝑟𝑡𝑖𝑜𝑛 =𝑁𝑢𝑚𝑏𝑒𝑟 𝑜𝑓 𝑒𝑣𝑒𝑛𝑡𝑠, 𝑝𝑒𝑟𝑠𝑜𝑛𝑠 𝑤𝑖𝑡ℎ 𝑎 𝑠𝑝𝑒𝑐𝑖𝑓𝑖𝑐 𝑡𝑟𝑎𝑖𝑡 𝑜𝑟 𝑒𝑥𝑝𝑜𝑠𝑢𝑟𝑒
𝑇𝑜𝑡𝑎𝑙 𝑛𝑢𝑚𝑏𝑒𝑟 𝑜𝑓 𝑒𝑣𝑒𝑛𝑡𝑠 𝑜𝑟 𝑝𝑒𝑟𝑠𝑜𝑛𝑠 𝑥 100
In proportion, the numerator should always be a subset of the denominator. It is
mainly used as a descriptive measure and it is expressed as a percentage.
Finally, the rate measures the frequency of event (the risk of an event occurring) in a
specific population during a particular period of time and it is useful when the
frequency of an event needs to be compared in different times or different groups of
subjects from different sized populations.
Measures of morbidity occurrence 1.2.5.4
Measuring the occurrence of morbidity depends on the period during which the
population was at risk. There are two main measures; prevalence and incidence (dos
Santos Silva 1999).

33
(Point) Prevalence measures how many cases there are in a population at a specific
point in time.
𝑃𝑟𝑒𝑣𝑎𝑙𝑒𝑛𝑐𝑒 =𝑁𝑢𝑚𝑏𝑒𝑟 𝑜𝑓 𝑐𝑎𝑠𝑒𝑠 𝑖𝑛 𝑎 𝑑𝑒𝑓𝑖𝑛𝑒𝑑 𝑝𝑜𝑝𝑢𝑙𝑎𝑡𝑖𝑜𝑛 𝑎𝑡 𝑎 𝑝𝑎𝑟𝑡𝑖𝑐𝑢𝑙𝑎𝑟 𝑝𝑜𝑖𝑛𝑡 𝑖𝑛 𝑡𝑖𝑚𝑒
𝑁𝑢𝑚𝑏𝑒𝑟 𝑜𝑓 𝑝𝑒𝑜𝑝𝑙𝑒 𝑖𝑛 𝑡ℎ𝑒 𝑑𝑒𝑓𝑖𝑛𝑒𝑑 𝑝𝑜𝑝𝑢𝑙𝑎𝑡𝑖𝑜𝑛 𝑎𝑡 𝑡ℎ𝑒 𝑠𝑎𝑚𝑒 𝑝𝑜𝑖𝑛𝑡 𝑖𝑛 𝑡𝑖𝑚𝑒
Prevalence can also be presented as a percentage (multiplying the ratio with 100) or as
the number of cases per 100,000 of the population.
The incidence measures the occurrence of new cases in a population over a particular
period of time. The two most frequent types of incidence used are the incidence risk
and the incidence rate.
𝐼𝑛𝑐𝑖𝑑𝑒𝑛𝑐𝑒 𝑟𝑖𝑠𝑘 =𝑁𝑢𝑚𝑏𝑒𝑟 𝑜𝑓 𝑛𝑒𝑤 𝑐𝑎𝑠𝑒𝑠 𝑜𝑓 𝑚𝑜𝑟𝑏𝑖𝑑𝑖𝑡𝑦 𝑖𝑛 𝑎 𝑑𝑒𝑓𝑖𝑛𝑒𝑑 𝑝𝑜𝑝𝑢𝑙𝑎𝑡𝑖𝑜𝑛 𝑎𝑡 𝑎 𝑠𝑝𝑒𝑐𝑖𝑓𝑖𝑐 𝑝𝑒𝑟𝑖𝑜𝑑
𝑁𝑢𝑚𝑏𝑒𝑟 𝑜𝑓 𝑚𝑜𝑟𝑏𝑖𝑑𝑖𝑡𝑦 𝑓𝑟𝑒𝑒 𝑠𝑢𝑏𝑗𝑒𝑐𝑡𝑠 𝑖𝑛 𝑡ℎ𝑒 𝑠𝑎𝑚𝑒 𝑝𝑜𝑝𝑢𝑙𝑎𝑡𝑖𝑜𝑛 𝑎𝑡 𝑡ℎ𝑒 𝑠𝑡𝑎𝑟𝑡 𝑜𝑓 𝑡ℎ𝑎𝑡 𝑝𝑒𝑟𝑖𝑜𝑑
𝐼𝑛𝑐𝑖𝑑𝑒𝑛𝑐𝑒 𝑟𝑎𝑡𝑒 =𝑁𝑢𝑚𝑏𝑒𝑟 𝑜𝑓 𝑛𝑒𝑤 𝑐𝑎𝑠𝑒𝑠 𝑜𝑓 𝑚𝑜𝑟𝑏𝑖𝑑𝑖𝑡𝑦 𝑖𝑛 𝑎 𝑑𝑒𝑓𝑖𝑛𝑒𝑑 𝑝𝑜𝑝𝑢𝑙𝑎𝑡𝑖𝑜𝑛 𝑎𝑡 𝑎 𝑠𝑝𝑒𝑐𝑖𝑓𝑖𝑐 𝑝𝑒𝑟𝑖𝑜𝑑
𝑇𝑖𝑚𝑒 𝑒𝑎𝑐ℎ 𝑠𝑢𝑏𝑗𝑒𝑐𝑡 𝑤𝑎𝑠 𝑓𝑜𝑙𝑙𝑜𝑤𝑒𝑑 𝑢𝑝, 𝑡𝑜𝑡𝑎𝑙𝑒𝑑 𝑓𝑜𝑟 𝑎𝑙𝑙 𝑠𝑢𝑏𝑗𝑒𝑐𝑡𝑠
The difference between the two types of incidence is time relevant. The estimation of
risk needs a population that would be entirely followed-up for a specific period,
whereas in the case of incidence rate the population can be dynamic, meaning that not
all individuals have been followed up for the same amount of time.
Measures of exposure effect 1.2.5.5
The main purpose of epidemiology is to quantify the association between the exposure
and the outcome of interest among two groups. The main measures are:
𝑅𝑖𝑠𝑘 𝑟𝑎𝑡𝑖𝑜 =𝑅𝑖𝑠𝑘 𝑜𝑓 𝑜𝑢𝑡𝑐𝑜𝑚𝑒 𝑖𝑛 𝑡ℎ𝑒 𝑒𝑥𝑝𝑜𝑠𝑒𝑑 𝑔𝑟𝑜𝑢𝑝
𝑅𝑖𝑠𝑘 𝑜𝑓 𝑜𝑢𝑡𝑐𝑜𝑚𝑒 𝑖𝑛 𝑡ℎ𝑒 𝑢𝑛𝑒𝑥𝑝𝑜𝑠𝑒𝑑 𝑔𝑟𝑜𝑢𝑝
𝑅𝑎𝑡𝑒 𝑟𝑎𝑡𝑖𝑜 =𝐼𝑛𝑐𝑖𝑑𝑒𝑛𝑐𝑒 𝑟𝑎𝑡𝑒 𝑖𝑛 𝑡ℎ𝑒 𝑒𝑥𝑝𝑜𝑠𝑒𝑑 𝑔𝑟𝑜𝑢𝑝
𝐼𝑛𝑐𝑖𝑑𝑒𝑛𝑐𝑒 𝑟𝑎𝑡𝑒 𝑖𝑛 𝑡ℎ𝑒 𝑢𝑛𝑒𝑥𝑝𝑜𝑠𝑒𝑑 𝑔𝑟𝑜𝑢𝑝
𝑂𝑑𝑑𝑠 𝑟𝑎𝑡𝑖𝑜 (𝑂𝑅) =𝑂𝑑𝑑𝑠 𝑜𝑓 𝑜𝑢𝑡𝑐𝑜𝑚𝑒 𝑖𝑛 𝑡ℎ𝑒 𝑒𝑥𝑝𝑜𝑠𝑒𝑑 𝑔𝑟𝑜𝑢𝑝
𝑂𝑑𝑑𝑠 𝑜𝑓 𝑜𝑢𝑡𝑐𝑜𝑚𝑒 𝑖𝑛 𝑡ℎ𝑒 𝑢𝑚𝑒𝑥𝑝𝑜𝑠𝑒𝑑 𝑔𝑟𝑜𝑝𝑢𝑝
The first two ratios are also referred as “relative risk (RR)”. A value of 1.0 indicates
that both the exposed and the unexposed group have identical incidence; thus, there is

34
no association between the exposure and the outcome of interest. A value greater
than one indicates that the exposed group has an increased risk of developing the
outcome of interest compared to the unexposed group (positive association); a value
less than one indicates that the exposed group has a decreased risk of developing the
outcome compared to the unexposed group (negative association) (Dicker 2006).
Regression analysis models 1.2.5.5.1
The most common method to estimate the OR and the RR is regression analysis. This
technique is used for prediction and investigation of the relationship between a
dependent variable and an independent or predictor variable(s). It indicates significant
associations and the strength of the effect the independent variables have on the
dependent one. Moreover, it is used to control for any potential confounders. There
are various types of regression analysis that can be used depending on the number of
independent variables, the type of the dependent variable and the shape of the
regression line. In general, regression analysis can be either simple or
multiple/multivariable depending on the number of independent variables and
univariate or multivariate depending on the number of dependent variables included in
the model. Then, depending on the type of the dependent variable (continuous,
categorical, counts of an event or patient’s hazard rate), either linear/non-linear or
logistic or Poisson or Cox proportional hazards regression is used, respectively.
In regression, the dependent variable is modelled as a function of the independent
variables, fixed coefficients1 and an error term2. The most basic regression model is
the univariate simple linear regression method described by the equation
𝑦𝑖 = 𝛽0 + 𝛽1𝑥𝑖 + 𝜀
where 𝑦𝑖 denotes the predicted response for subject 𝑖, 𝑥𝑖 denotes the
predictor value for subject 𝑖, 𝛽0 is the intercept, 𝛽1 is the slope (the average
increase of the outcome per unit increase of the predictor) and ε is the error
term.
1 Also called parameters and they present the mean increase in the dependent variable per increase in the
independent variable 2 The error is a random variable which presents the unexplained variation in the dependent variable.

35
When there are more than one independent/predictor variables, the model is called
univariate multiple/multivariable linear regression
𝑦𝑖 = 𝛽0 + 𝛽1𝑥𝑖 + ⋯ + 𝛽𝑁𝑥𝑖 + 𝜀
where N is the number of independent variables in the model.
In the case where there is more than one measured responses the regression model is
called multivariate (simple/multiple) regression and the multiple type has the form
𝑦𝑖1 + ⋯ + 𝑦𝑖𝐾 = 𝛽0𝑘 + 𝛽1𝑥𝑖 + ⋯ + 𝛽𝑁𝑥𝑖 + 𝜀
where 𝐾 is the number of dependent variables/responses for subject 𝑖.
It should be noted that the terms multiple/multivariable and multivariate are often used
interchangeably in the literature, although they are two different types of analysis
models (Hidalgo and Goodman 2013).
In the case where the dependent variable is categorical (as described in 1.2.5.1), then
binary logistic regression is used, which estimates the probability that a trait is present
given the values of the dependent/predictor variables; 𝜋 = 𝑃𝑟(𝑌 = 1|𝑋 = 𝑥) in the
case of a single predictor. Thus,
𝜋𝑖 = 𝑃𝑟(𝑌𝑖 = 1|𝑋𝑖 = 𝑥𝑖)
or,
log(𝜋𝑖) = log (𝜋𝑖
1 − 𝜋𝑖) = 𝛽0 + 𝛽1𝑥𝑖
where 𝑌𝑖 = 1 if the trait is present in the subject 𝑖, 𝑌𝑖 = 0 is absent in the
subject 𝑖, 𝑋 is the independent variables, 𝑥 the observed value for the
independent variable, 𝑖 is the 𝑖-th subject.
When the subject’s hazard rate (or the possibility of the event occurring in a subject
yet to develop the event) is needed, the Cox regression is used (Klein, Rizzo et al.
2001). The hazard rate for a subject 𝑖 can be presented as
ℎ𝑖(𝑡) = ℎ0(𝑡)𝑒𝑥𝑝{𝛽𝑍𝑖}

36
where ℎ0(𝑡) is the baseline hazard rate, 𝑍𝑖 is the 𝑖-th subject’s covariate and 𝛽
is the risk or the regression coefficient.
Significance and confidence intervals 1.2.5.6
The significance level denoted as alpha or α is the probability of rejecting the null
hypothesis when it is true. Usually the significance level of 0.05 (Fisher 1925) is used
which corresponds to a chance of error of 1 in 20.
The p-value is used in epidemiological studies to determine whether the null
hypothesis should be accepted or rejected and it assists in the recognition of
statistically important findings (du Prel, Hommel et al. 2009). The smaller the p-value
(compared to a predefined threshold alpha), the stronger the evidence that the
observed association or difference did not occur by chance. If the p-value is less than a
set alpha level (usually 0.05), then the finding of the statistical hypothesis test is
designated as “statistically significant”.
The confidence interval (CI) indicates the range in which the true value lies with a
predefined degree of probability (the 95% CI is usually used). The size of the range
depends on the sample size and the standard deviation of the groups being compared.
Compared to the p-value, the CI provides information about the direction and the
strength of the effect. When the CI does not include the value of zero effect, the
finding can be assumed to be “statistically significant”.
Observational epidemiology: Investigating environmental/lifestyle 1.2.6
factors in complex diseases
Statistical analysis 1.2.6.1
Summarising data 1.2.6.1.1
For summarising data, the measures of central location and spread are used depending
on the type of the variable as described in section 1.2.5.2. At this point, various
statistical tests can be applied depending on the intended use. For example, the chi-
squared (𝜒2) test can be applied in categorical variables from the same population to
investigate whether any difference in frequencies between a set of results is due to
chance. The general formula is:

37
χ2 = ∑(𝑂𝑖 − 𝐸𝑖)2
𝐸𝑖
where O is the observed value and E the expected value.
When the compared variables are continuous, either the T-test or Mann-Whitney U-
test can be used depending on whether the variables are normally-distributed or not,
respectively. Both tests allow the comparison of the means of the two groups to
investigate whether there is a statistically significant difference between them.
Longitudinal cohort studies 1.2.6.1.2
In cohort studies the incidence rate and risk can be estimated as described in section
1.2.5.4 and the risk ratio (or RR) as presented in 1.2.5.5. Another method that can be
applied is the standardised ratio to compare either the incidence (standardised
incidence ratio) or the morbidity (standardised morbidity ratio) in the cohort
compared to the general population (dos Santos Silva 1999). The number of new cases
that would be expected in the cohort, if the incidence or the morbidity was the same
in the general population, is estimated. Standardisation is one of the most common
approaches used to adjust for the effect of age and/or sex and it can be either direct or
indirect. In summary, the direct method requires that stratum-specific rates are
available for all the populations studied. The indirect approach requires only the total
number of cases that occurred in each population.
Regarding regression modelling, two techniques are mostly used in cohort studies;
Cox regression and Poisson regression. In Cox regression analysis, the target
parameter is the time until the occurrence of the outcome of interest. Cox regression
uses a proportional hazard model to calculate the hazard ratio (HR). Poisson
regression is used when the target parameter is the number of observations of a rare
event; for example, the number of ovarian cancer cases within a certain period of time.
Case-control studies 1.2.6.1.3
The measure of association between the exposure and the outcome of interest used in
case-control studies is the OR. The best statistical method to estimate the OR for the
binary variable (outcome yes or no) is the logistic regression analysis.
38
Cross-sectional studies 1.2.6.1.4
In cross-sectional studies the prevalence is estimated as a measure of frequency and
the prevalence OR is a measure of association (or effect). The prevalence OR
compares the odds of the prevalence of the outcome in the exposed group with the
odds of the prevalence of the outcome in the unexposed group.
Genetic epidemiology: Investigating the genetic basis of complex 1.2.7
diseases
Genetic epidemiology focuses on the role of genes and their interplay with
environmental factors in the development of a disease in families and in populations
(Kaprio 2000). The flow of research in genetic epidemiology is summarised in Table 3
and described in more detail in the following sections.
Table 3 | Types of studies in genetic epidemiology and their use
Aim Analytical study designs
Familial clustering Familial aggregation study
Genetic or environmental basis Twin studies
Mode of inheritance Segregation analysis
Disease susceptibility loci Linkage analysis
Disease susceptibility variants Association study
Disease susceptibility variants Candidate-gene association study
Refining disease true causality Fine-mapping study
Familial aggregation studies 1.2.7.1
The initial step in determining the potential genetic basis of a trait is to investigate
whether the trait appears in families more often than expected (familial clustering)
without any specific model in mind (Matthews, Finkelstein et al. 2008). The analysis for
dichotomous traits, such as psoriatic arthritis (PsA), is based on familial sampling in
which affected subjects and healthy controls are identified and the disease status of
their relatives is assessed. By calculating the prevalence of a trait in relatives (e.g.
siblings) of cases over the general population, the potential increased risk of having the
trait when having relatives with the same trait is determined. Thus, a genetic

39
component of the trait can be established. The measure used is termed relative
recurrence risk
𝜆𝑅 =λ
𝐾
where 𝑅 is the type of relatives (siblings, first degree relatives), 𝐾 is the prevalence of
the trait in the population and λ is the probability a subject has the disease given that a
relative has also the disease. Higher values of the recurrence risk suggest that a greater
proportion of the risk clusters in families compared to the general population.
Logistic regression analysis can be used to assess the familial aggregation, adjusting for
potential confounders such as environmental risk factors for each relative.
Twin studies 1.2.7.2
Aggregation studies are not sufficient to demonstrate genetic basis for a trait as
aggregation can be the result of other factors including environmental determinants.
Hence, the next step is the estimation of heritability (ℎ2) via twin studies (Sahu and
Prasuna 2016). Heritability is the proportion of variation that is due to genetic
differences.
In twin studies the monozygotic (identical) twins, sharing the same genes, are
compared to dizygotic (fraternal) twins, which share 50% genes but have common
environmental exposures. The measure used in this design is the concordance rate
which is defined as the probability that a pair of subjects will both have a certain trait;
given that one of them has the trait. The concordance rate is calculated as follows:
𝐶𝑜𝑛𝑐𝑜𝑟𝑑𝑎𝑛𝑐𝑒 𝑟𝑎𝑡𝑒 =𝐵𝑜𝑡ℎ 𝑡𝑤𝑖𝑛𝑠 𝑎𝑟𝑒 𝑎𝑓𝑓𝑒𝑐𝑡𝑒𝑑
𝑂𝑛𝑒 𝑎𝑓𝑓𝑒𝑐𝑡𝑒𝑑 + 𝑏𝑜𝑡ℎ 𝑎𝑓𝑓𝑒𝑐𝑡𝑒𝑑 𝑥 100
If the disease is genetic, the concordance rate will be higher for identical twins
compared to fraternal ones.
Linkage studies 1.2.7.3
Genetic linkage analysis is used to detect loci in the genome that contain disease
predisposing genes. There are two methods used for such analysis: parametric and
non-parametric linkage analysis. Parametric analysis is also called model-based as it
firstly requires the construction of the model for explaining the disease inheritance in a

40
family with both diseased and non-diseased individuals and then the estimation of the
recombination rate for a given pedigree. Non-parametric analysis does not require the
knowledge of the inheritance mode; the latter is the reason why it is preferred in
multifactorial diseases in which the inheritance pattern is not clear. The idea behind
this method is that diseased siblings will share susceptibility alleles and markers (Risch
1990).
Genetic association studies 1.2.7.4
The most efficient method to identify susceptibility loci for diseases, in which common
variants are causal, is the genome-wide association study (GWAS) which analyses
DNA sequence variations such as single nucleotide polymorphisms (SNPs) across the
human genome in order to identify genetic risk factors for diseases that are common
in the population. The conduct of GWAS is feasible because of several factors. Firstly,
the International HapMap Project (International HapMap 2003) identified the
commonly occurring SNPs for testing in genetic studies. A variety of sequencing
methods were used and SNPs were discovered in the European population, the
Yoruba population of Africa descent, Han Chinese and Japanese from Tokyo. GWAS
were also made possible by the advance in genotyping technology as chip-based
microarrays for assaying one million or more SNPs were developed. Finally, the
development of statistical methods to assist in the data mining and analyse the genetic
data and the international collaborations that formed to explore the genetic basis of
common diseases by combing well-phenotypes cohorts, contributed to the wide
expansion of GWAS. Usually, hundreds of thousands of markers are used to achieve
genome-wide coverage. However, the large number of statistical tests conducted in
GWAS requires a genome-wide threshold of significance, protecting against false-
positive results that will occur when multiple tests are performed at the level of 0.05.
The first threshold of 5x10⁻⁸ was proposed in 1996 (Risch and Merikangas 1996) and is
widely used3 (Hoggart, Clark et al. 2008).
3 A GWAS involves approximately 1 million independent tests, thus the significance threshold that is
widely used has been Bonferroni corrected for the multiple tests (𝑃 = 0.05 106 = 5𝑥10−8⁄ ).

41
GWAS have successfully identified numerous associations for complex diseases,
exploiting the linkage disequilibrium (LD)4 between nearby genetic variants. However,
the majority of these strongly associated SNPs are most likely to be in LD with the
causal variant, rather than playing a biological role themselves. In order to identify truly
causal variants, fine-mapping of the associated locus is required, where all variants in
the region are densely genotyped. This is carried out in large independent studies,
usually large international consortia that design custom genotyping arrays. These arrays
containing approximately 200,000 variants provide dense genotyping of previously
discovered GWAS regions for fine-mapping (Spain and Barrett 2015). For instance, the
Immunochip is an Illumina Infinium custom array containing 196,524 polymorphisms
designed to replicate and fine-map established GWAS significant associations with
autoimmune diseases. As the initiative of the Wellcome Trust Case-Control
Consortium (WTCCC), Immunochip was designed to incorporate loci from 12
inflammatory disorders including rheumatoid arthritis (RA), psoriasis (PSO), Crohn’s
disease (CD), ulcerative colitis (UC), ankylosing spondylitis (AS), systemic lupus
erythematosus (SLE), type 1 diabetes (T1D), thyroid disease, celiac disease, multiple
sclerosis (MS), primary biliary cirrhosis (PBC) and immunoglobulin A (IgA) deficiency
(Cortes and Brown 2011). The Immunochip array allows dense genotyping across 186
regions of the genome with evidence for association with autoimmune diseases.
Use of summary statistics and pleiotropy methods 1.2.7.5
GWAS have been successful in identifying genetic variants that are associated with
susceptibility for complex traits and highlight candidate underlying biological
mechanisms. However, these variants explain only a proportion of the trait’s
heritability, as there are many variants that have a low penetrance that GWAS cannot
statistically associate with a trait (Maher 2008). These studies have produced extensive
genetic variation databases whose analysis could shed more light into the genetics of
complex diseases, but the individual-level genotype and phenotype data are often
inaccessible due to confidentially concerns. For that reason, GWAS summary statistics
data from large consortia can be used as they are publicly available and advantageous in
computational cost. They usually contain per allele SNP effect sizes along with their
4 The term is used to describe the non-random association of alleles at two or more loci and it can be
produced by natural selection, mutation, random drift and gene flow.

42
standard errors which can be used to compute z-score (which is the effect size divided
by the standard error).
A variety of methods have been developed for the analyses of GWAS summary
statistics including methods focusing on single-variant association analysis (meta-
analysis, conditional association), fine-mapping causal SNPs, polygenic risk scores
construction for disease prediction, joint analysis of multiple traits and causal inference.
In the current thesis, I will concentrate on meta-analysis, cross-trait analysis methods
and causal inference via Mendelian randomization.
Cross-trait analyses 1.2.7.5.1
Most complex diseases, such as autoimmune disorders, have a shared genetic aetiology
which can be due to pleiotropy; that is when shared genetic variants with non-zero
effects influence multiple traits. Methods have been developed that exploit pleiotropic
effects in order to identify novel genetic associations and investigate the underlying
biological pathways (Andreassen, Thompson et al. 2013; Liley and Wallace 2015;
Pickrell, Berisa et al. 2016).
Pickrell et al. using a Bayesian approach on summary statistics data from 42 traits, of
unknown in-between relation, performed a scan for SNPs that influence pairs of traits
at each locus in the genome, including a correction for overlapping subjects in the
model (Pickrell, Berisa et al. 2016). Another method, exploiting pleiotropic effects
among diseases known or suspected to be related, can leverage the increased power
from combining GWAS and detect novel common variants that could not be identified
in the original GWAS analysis because of stringent significance threshold. The Bayesian
conditional False Discovery Rate (cFDR) constitutes an upper bound on the expected
false discovery rate (FDR) across a set of SNPs whose p-values for two diseases are
both less than two disease-specific thresholds. This model-free statistical analysis is
based on the notion that if two diseases share common genetic risk factors, a degree
of association of a locus with one disease may increase the likelihood of detecting an
association with the other (Andreassen, Thompson et al. 2013). This method also been
extended to include studies with overlapping control subjects, strengthening the
power of the technique (Liley and Wallace 2015).

43
An alternative approach assessing the overlap between two complex diseases is to
estimate the genetic correlation between effect sizes across the two traits (Bulik-
Sullivan, Finucane et al. 2015; Palla and Dudbridge 2015). Palla et al. developed a fast
method based on polygenic risk scores for estimating the proportion of variants
affecting each trait and the genetic correlation between a pair of related traits, using
only summary statistics. However, this method requires independent datasets and the
use of uncorrelated markers so “LD pruning” (selecting SNPs with limited pairwise
correlation) is essential (Palla and Dudbridge 2015). Another recent study developed a
method that uses cross-trait LD score regression, which uses LD to estimate the
variance among traits. This method is robust to overlapping samples and adjusts for
population stratification in its calculation (Bulik-Sullivan, Finucane et al. 2015).
Meta-analysis 1.2.7.5.2
Meta-analysis is a statistical method that jointly integrates the results of multiple
GWAS of a single trait to boost power for identifying SNP associations with small
effects (Evangelou and Ioannidis 2013). The advantage in performing meta-analysis is
the use of aggregated data as it is wholly available and does not require any additional
cost. A meta-analysis is usually performed using fixed-effect (effects sizes are constant
across studies) approaches, where any differences between effect sizes are due to
sampling error. However, when the observed differences are also due to variation in
the true, causal effects (which is called heterogeneity), a random-effect meta-analysis
model should be used (Kelley and Kelley 2012). Although random-effects models
reflect the heterogeneous nature of the complex diseases, they tend to be less
powerful than fixed-effects models (Evangelou and Ioannidis 2013).
The use of single-trait analyses cannot exploit information provided by correlated
traits, thus methods have been developed which jointly analyse GWAS results from
several related diseases (Cotsapas, Voight et al. 2011; Bhattacharjee, Rajaraman et al.
2012). These approaches boost the statistical power to detect genetic associations for
each disease and investigate the underlying biological pathways.
Cross-phenotype meta-analysis (CPMA) is a statistical approach that assesses whether
a SNP has multiple phenotypic associations across different diseases that may be
genetically similar, such as autoimmunity (Cotsapas, Voight et al. 2011; Turley, Walters
et al. 2018). CPMA is agnostic to the direction of the effect and it examines the

44
deviation in the distribution of association p-values, thus it can detect variants that are
associated to at least a subset of, and not necessarily all, diseases. A major disadvantage
of this method is that it cannot be applied to studies that share the same control
samples.
On the contrary, both multi-trait analysis of GWAS (MTAG) by Turley et al. and the
subset-based method (SBM) by Bhattacharjee et al. are robust to sharing the same
controls, which is essential when summary statistics data come from large consortia.
MTAG is a generalised inverse-variance-weighted meta-analysis method that is based
on the key assumption that all markers share the same variance-covariance matrix of
effects sizes across diseases; even then MTAG has proven to be a consistent estimator
(Turley, Walters et al. 2018). Its main advantage is that it can be specifically useful for a
disease of interest that is underpowered but shows strong genetic correlation with
other diseases. However, the application of MTAG to a large number of low-powered
studies or to GWASs with a substantial difference in power could cause large inflations
to the FDR. Regarding the subset-based method, it is a generalisation of the basic
fixed-effects meta-analysis that allows some subset of the studies to have no effect or
the effect of susceptibility loci to manifest in different directions for different traits.
More specifically, this method explores all possible subsets for non-null associations to
identify the strongest one and then evaluates the significance of the association while
accounting for multiple testing (Bhattacharjee, Rajaraman et al. 2012).
Investigating risk factors for PSO and PsA 1.3
PSO is a chronic, immune-mediated disorder with variable manifestations, severity and
course. It mainly affects the skin and is associated with both a physical and a
psychological burden, comparable to other major chronic disorders (Rapp, Feldman et
al. 1999). Up to 30% of patients can develop chronic inflammatory arthritis, called PsA
(Gladman, Antoni et al. 2005). Certain clinical features such as negative testing for
rheumatoid factor differentiate PsA from RA, which classes PsA as a seronegative
spondyloarthropathy (Moll and Wright 1973). Both PSO and PsA present a large
degree of clinical overlap, as patients with PsA usually present with skin manifestations
as well. They are both complex diseases, like the majority of immune related disorders,
45
whose onset and progression is influenced by the individual’s genetic predisposition
and various environmental and lifestyle factors.
Epidemiology of PSO and PsA 1.3.1
Prevalence and incidence of PSO 1.3.1.1
PSO affects approximately 0.91 (United States) (Robinson, Hackett et al. 2006) to 8.5%
(Norway) (Bo, Thoresen et al. 2008) of the population worldwide. The occurrence
varies according to age and geographic location with countries further away from
equator having higher prevalence rates. In the United Kingdom (UK) it is estimated to
occur in 2-3% of the general population (Parisi, Symmons et al. 2013). Moreover, a
recent study showed that latitude may significantly influence PSO, with 6.5 new PSO
cases per 100,000 person-years for every degree increase in latitude in the UK
(Springate, Parisi et al. 2017). The incidence of PSO in adults varied from 78.9 per
100,000 person-years in the United States (USA) to 230 per 100,000 person-years in
Italy (Parisi, Symmons et al. 2013).
PSO equally affects women and men and it can develop at any stage; however two
peaks of incidence have been reported at the ages of 16 or 22 and 60 or 57 (Henseler
and Christophers 1985), describing a bimodal distribution. This dichotomises the
disease into Type 1 (early-onset PSO before 40 years of age) and Type 2 (late-onset
PSO after the age of 40).
PSO in childhood is less prevalent compared to adulthood, ranging from 0% in Taiwan
to 2.1% in Italy; whereas, the incidence rate reported in the USA was 40.8 per 100,000
person-years (Parisi, Symmons et al. 2013).
Prevalence and incidence of PsA 1.3.1.2
The prevalence of PsA is difficult to estimate as until recently there was a lack of
widely accepted classification criteria. Nevertheless, prevalence estimates in the USA
range from 0.06 to 0.25% and from 0.05% to 0.21% in Europe (Ogdie and Weiss 2015).
The incidence of PsA in the general population ranges from 0.1 to 23.1 per 100,000
person-years according to a systematic review (Alamanos, Voulgari et al. 2008).
Despite the low prevalence in the general population, PsA is the most frequent
comorbidity in patients with PSO, with prevalence ranging from 6% to 41% depending

46
again on the definition of the disease and the methodology used per study (Ogdie and
Weiss 2015). In a population-based study, the cumulative incidence of PsA over time in
patients with PSO was assessed and 1.7%, 3.1% and 5.1% had developed PsA at 5,10
and 20 years, respectively, after being diagnosed with PSO (Wilson, Icen et al. 2009).
In a prospective study of 313 psoriatic patients, an annual incidence of 1.87% was
reported (Eder, Chandran et al. 2011).
Clinical manifestations of the diseases 1.3.2
PSO is a diverse disease that can manifest as various phenotypes as seen in Figure 3.
PSO vulgaris is the most common type accounting for 90% of all cases and is
characterised by round to oval, raised plaques covered with silvery white scales to
well-defined, erythematous areas at the knees, elbows, scalp and lower back. Guttate
PSO manifests as smaller, less scaly patches, has an onset in childhood or young
adulthood (age<30 years old) and is typically triggered by streptococcal infection.
Inverse PSO presents at the folds of the body as erythematous, not scaly plaques,
whereas the erythrodermic PSO is a relatively rare and rather severe type that
appears as a widespread erythema covering 90% of the patient’s body and can be life-
threatening (Greb, Goldminz et al. 2016). Until recently, pustular PSO (including
generalised pustular PSO (GPP) and palmoplantar pustulosis), was referred to as a type
of PSO; however, evidence suggests that it is likely to be a distinct entity. Genetic
studies of GPP have found an association of small number of cases with mutations in
CARD14 and AP1S3 (Navarini, Burden et al. 2017). In addition, GPP has been observed
in patients without a history of PSO and it has been reported that interleukin-36RN
(IL36RN) mutations are more prevalent in patients with GPP alone compared to those
with PSO as well (Sugiura, Takemoto et al. 2013).

47
Figure 3 | Skin manifestations of psoriasis a) psoriasis vulgaris b) guttate psoriasis c) inverse psoriasis and d) erythrodermic psoriasis. Picture e) shows pustular psoriasis, previously reported to be a PSO phenotype. Picture adapted from (Greb, Goldminz et al. 2016) – used with permission.
Furthermore, a common feature of PSO is the involvement of the nail which presents a
lifetime incidence of 80-90% in patients with PSO (Reich 2009) and PsA (Tan, Chong et
al. 2012). The nail changes include the involvement of the nail matrix which causes nail
pitting and nail dystrophy, and the nail bed involvement that leads to subungual
hyperkeratosis and onycholysis that appear as yellow, keratinous material under the
nail plate (Sobolewski, Walecka et al. 2017) (Figure 4).

48
Figure 4 | Nail changes in patients with psoriasis These include discoloration and dystrophy.
The nail matrix is anatomically connected to the enthesis of the distal interphalangeal
predominant (DIP) joint extensor, with the latter being the most often affected in PsA
and thus, potentially explaining the higher prevalence of nail changes in those patients
(Tan, Chong et al. 2012).
The age of onset of PsA is usually between 30-55 years and both sexes are equally
affected. Despite the fact that most patients (~70%) with PsA suffer from PSO at the
time of diagnosis, in 30% of cases PsA precedes PSO or a simultaneous development is
observed (Gottlieb, Korman et al. 2008). PsA is an inflammatory disease causing pain
and joint damage, leading to disability. The clinical manifestations of the disease can be
diverse in severity and involvement; patients may develop axial and peripheral joint
inflammation, nail dystrophies as those seen in PSO, enthesitis or dactylitis (Figure 5).
Patients with PsA are at high risk of developing spondylitis (40%); therefore, the
disorder is classified with the spondyloarthropathies. However, the difference between
PsA and the latter can be detected at the development of peripheral arthritis and the
asymmetrical joint involvement (Gladman, Antoni et al. 2005).

49
Figure 5 | Manifestations of psoriatic arthritis a) nail changes b) swollen joint (left knee) c) swollen Achilles tendon (enthesitis) d) swollen/sausage digit (dactylitis). [Picture reprinted from http://www.aad.org]
Classification and diagnostic criteria for PsA 1.3.2.1
The discrimination between disorders with similar manifestations poses a great
challenge for specialists. Thus, the development of criteria for use in clinical care and
research is an important aspect in rheumatology. Although classification and diagnostic
criteria can be very similar, especially in well-defined diseases such as gout, in reality
disease features are usually different among patients. Thus, classification criteria do not
perform 100% accurately leading to misclassification, so they cannot be used for
diagnosis. The primary aim of classification criteria is to create a well-defined cohort
capturing the majority of patients with the key features of the disease for research
purposes, whereas the diagnostic criteria aim to effectively identify as many subjects
with the disease as possible by incorporating the various features of the disease
(Aggarwal, Ringold et al. 2015).
In 1973, Moll and Wright proposed a set of classification criteria for PsA that had been
widely used for some time which are (Moll and Wright 1973):

50
An inflammatory arthritis (peripheral arthritis and/or sacroilitis or spondylitis)
The presence of PSO
Blood test negative for rheumatoid factor, which is an autoantibody against the
fragment crystallisable region of immunoglobulin G (IgG) and is detected in
patients with autoimmune diseases including RA (Song and Kang 2010).
Using these criteria, PsA was classified into five major subtypes based on the clinical
features of the disease: polyarthritis, asymmetrical oligoarthritis, DIP joint, spondylitis
and arthritis mutilans. However, due to the overlap observed among the groups the
Classification of Psoriatic Arthritis (CASPAR) group suggested new classification
criteria, which have since been routinely used by most researchers (Taylor, Gladman
et al. 2006). According to CASPAR, inflammation of either joints, spine or entheses is
needed along with a score of three or more in the following:
Current PSO (score 2), personal or family history of PSO (score 1 each)
Psoriatic nail dystrophy, including onycholysis, pitting and hyperkeratosis (score
1)
Negative rheumatoid factor presence test (score 1)
Current dactylitis or personal history of dactylitis (score 1)
Radiographic evidence of juxta-articular new bone formation (score 1).
The above classification criteria are used in research but not for diagnostic purposes.
Instead, screening questionnaires have been developed to assist dermatologists in
identifying individuals with possible PsA in routine clinical care settings. PsA is
estimated to be undiagnosed in approximately 10.1-15.5% of patients with PSO
because of a lack of awareness among patients and dermatologists about the
relationship between skin and joint symptoms and the lack of a commonly accepted
and validated diagnostic/screening tool. Screening tools currently used include i) the
PSO and Arthritis Questionnaire (PAQ) (Peloso, Behl et al. 1997) and the modified
PAQ (mPAQ) (Alenius, Stenberg et al. 2002) ii) the Psoriatic Arthritis Screening and
Evaluation (PASE) questionnaire (Husni, Meyer et al. 2007) iii) the Toronto Psoriatic
Arthritis Screen (ToPAS) questionnaire (Gladman, Schentag et al. 2009) and ToPAS2
iv) the PSO Epidemiology Screening Tool (PEST) (Ibrahim, Buch et al. 2009) v) the PSO
and Arthritis Screening Questionnaire (PASQ) (Khraishi, Landells et al. 2010) and vi)

51
the Early Arthritis for Psoriatic Patients (EARP) (Tinazzi, Adami et al. 2012). The
characteristics of the screening tools can be reviewed in Table 4.
A number of studies have compared the performance of these screening instruments
in different settings and populations (Coates, Aslam et al. 2013; Haroon, Kirby et al.
2013; Walsh, Callis Duffin et al. 2013; Mease, Gladman et al. 2014; Karreman, Weel et
al. 2016; Mishra, Kancharla et al. 2017) (Table 5). While the screening tools performed
well in the training datasets, they demonstrated low sensitivity and specificity in
validation datasets. For example, Haroon et al. compared the performance of PASE,
PEST and ToPAS and found that they performed poorly in identifying patients with
non-polyarticular manifestations of PsA, resulting in low sensitivities (Haroon, Kirby et
al. 2013). In a different study, the low specificity of the same tools reflects the fact that
they identify many cases with other musculoskeletal diseases. However, that study
recruited patients from PSO clinics rather than general dermatology clinics; thus, many
patients would already have been diagnosed with PsA and excluded from the study.
This may have resulted in a reduction of the specificity (Coates, Aslam et al. 2013).
Finally, lower specificities compared to the original validation of the same tools were
presented by Walsh et al. The lower specificities were probably caused by the high
prevalence of musculoskeletal diseases in the study population which have similar
manifestations as those caused by PsA. In addition, it was noted that the diversity in
PsA’s phenotypes may have resulted in lower sensitivities as patients who did not fulfil
the CASPAR criteria were included. Finally, it was shown that these tools did not
adequately differentiate PsA from osteoarthritis or fibromyalgia (Walsh, Callis Duffin et
al. 2013). On the contrary, Mease et al. comparing the performance of PASQ, PEST
and ToPAS showed that these tools can effectively identify patients with arthritis that
could benefit from a rheumatological evaluation (Mease, Gladman et al. 2014).
Interpreting the findings from the different studies is problematic because of the
existence of substantial differences in patient characteristics such as age, PSO severity,
presence and duration of PsA, treatments received and study setting (different
recruitment sites) and methods used. In general, the screening tools appeared unable
to differentiate between PsA and other musculoskeletal disorders. In addition,
differences in the wording of the questions between the tools could contribute to
their performance. For example, PASE asks about painful joints, PEST about swollen

52
joints and ToPAS asks about red and swollen joints. Furthermore, in the case of
patients not having any musculoskeletal symptoms, their score would be negative for
PsA. However, they could help patients realise the connection between skin and joint
involvement and make them more “open” in revealing to their physicians any signs or
symptoms they had (such as back pain that is usually believed to be part of the
everyday life).
A high proportion of patients with PSO also have undiagnosed PsA and raising
awareness of the association between PSO and arthritis could raise awareness about
that issue. These tools demonstrate good sensitivity and specificity in the development
stages, but fail to perform to the same high standards in validation attempts. It is clear
that the presence of clinical symptoms will be important classifiers for the identification
of PSO patients at the very early stages of developing PsA, but are not sufficient alone
to provide accurate prediction.

53
Table 4 | Characteristics of the screening tools at their development phase
Characteristics PAQ (pilot) mPAQ by Alenius PASE ToPAS PEST PASQ EARP
ToPAS 2 ePASQ
Setting Community and
hospital based
register
Combined
dermatology-
rheumatology
clinic
PsA clinic, PSO
clinic, general
dermatology
clinic, general
rheumatology
clinic (without
PsA patients) and
family medicine
clinic
Community
sample (two
general
practitioners
(GPs)) and
hospital
rheumatology
clinic
Dermatology
and
rheumatology
clinic
Dermatology-
rheumatology
combined clinic
Community-
based
Based on De novo
dermatological
input
PAQ De novo
dermatological
and
rheumatological
input using the
Delphi method
Dermatology,
rheumatology
and methodology
input
mPAQ PAQ typical
symptoms and
signs in PsA
patients
ToPAS PASQ
Date 1997 2002 2007 2009
2009 2010 2012
2011
PAQ: Psoriasis and Arthritis Questionnaire; mPAQ: modified PAQ; PASE: Psoriatic Arthritis Screening and Evaluation; ToPAS: Toronto Psoriatic Arthritis Screen;
PEST: Psoriasis Epidemiology Screening Tool; PASQ: Psoriasis and Arthritis Screening Questionnaire; EARP: Early Arthritis for Psoriatic patients; PsA: Psoriatic Arthritis;
GP: General Practitioner; PSO: Psoriasis

54
Table 4 | Characteristics of the screening tools at their development phase
Characteristics PAQ (pilot) mPAQ by Alenius PASE ToPAS PEST PASQ EARP
ToPAS 2 ePASQ
Initial patients
administrated
108 PSO
patients
202 psoriatic
patients not
knowing whether
they had arthritis
69 PSO patients
naïve to systemic
therapy
134 (PsA clinic),
123 (PSO clinic),
118
(dermatology),
135
(rheumatology),
178 (family
medicine)
93 with unknown
PsA (GP) and 21
diagnosed with
PsA
(rheumatology
clinic)
group A: 87 with
either PSO or PsA,
group B: 42 with
early PsA
228 PSO patients
with unknown
PsA naïve to
systemic therapy
with a disease-
modifying anti-
rheumatic drug
(DMARD)
131 (with PsA),
336 (with PSO
only), 89 (healthy
controls)
54 with suspected
early PsA (with or
without known
PSO)
Cut-off score 7 4 47 8 3 9 (group A)
7 (group B)
3
7 (8) 7
PAQ: Psoriasis and Arthritis Questionnaire; mPAQ: modified PAQ; PASE: Psoriatic Arthritis Screening and Evaluation; ToPAS: Toronto Psoriatic Arthritis Screen;
PEST: Psoriasis Epidemiology Screening Tool; PASQ: Psoriasis and Arthritis Screening Questionnaire; EARP: Early Arthritis for Psoriatic patients;
GP: General Practitioner; PsA: Psoriatic Arthritis; PSO: Psoriasis

55
Table 4 | Characteristics of the screening tools at their development phase
Characteristics PAQ (pilot) mPAQ by Alenius PASE ToPAS PEST PASQ EARP
ToPAS 2 ePASQ
Sensitivity (%) 85 60 82 89 (PSO and PsA), 92
(Dermatology and PsA),
93 (Rheumatology and
PsA), 90 (Family
medicine and PsA)
92 86 (group A)
93 (group B)
85
92 (87) (PsA vs rest), 92
(87) (PsA vs PSO), 92
(87) (PsA vs healthy)
98
Specificity (%) 88 62 73 86 (PSO and PsA), 95
(Dermatology and PsA),
86 (Rheumatology and
PsA), 100 (Family
medicine and PsA)
78 89 (group A)
75 (group B)
92
77 (83) (PsA vs rest), 74
(80) (PsA vs PSO), 90
(92) (PsA vs healthy)
75
PAQ: Psoriasis and Arthritis Questionnaire; mPAQ: modified PAQ; PASE: Psoriatic Arthritis Screening and Evaluation; ToPAS: Toronto Psoriatic Arthritis Screen;
PEST: Psoriasis Epidemiology Screening Tool; PASQ: Psoriasis and Arthritis Screening Questionnaire; EARP: Early Arthritis for Psoriatic patients;
PsA: Psoriatic Arthritis; PSO: Psoriasis

56
Table 4 | Characteristics of the screening tools at their development phase
Characteristics PAQ
(pilot)
mPAQ by Alenius PASE ToPAS PEST PASQ EARP
ToPAS 2 ePASQ
Axial
involvement
Yes Yes Yes (being developed) Both Yes Yes Both Yes Yes
Skin/nail
involvement
Yes Yes No Both Yes Yes Both Yes No
Unique features 7-item symptom
subscale and 8-item
function subscale, PsA
and osteoarthritis
symptom distinction,
tracks patients’
response to
treatment, refers only
to current status
pictures of skin/nail
involvement, PsA
can be screened in
any population, use
of direct questions
manikin for areas
of tenderness
manikin for joint
involvement
Addition of pictures
of dactylitis and
arthritic joints,
rephrasing
questions about
axial disease
Physician’s
involvement was
not needed as it is
electronic and
self-scoring
PAQ: Psoriasis and Arthritis Questionnaire; mPAQ: modified PAQ; PASE: Psoriatic Arthritis Screening and Evaluation; ToPAS: Toronto Psoriatic Arthritis Screen;
PEST: Psoriasis Epidemiology Screening Tool; PASQ: Psoriasis and Arthritis Screening Questionnaire; EARP: Early Arthritis for Psoriatic patients;
PsA: Psoriatic Arthritis

57
Table 5 | Comparison of psoriatic arthritis screening tools by different studies
Studies PASE47 PASE44 PEST ToPAS ToPAS 2 EARP PASQ
Sensitivity Specificity Sensitivity Specificity Sensitivity Specificity Sensitivity Specificity Sensitivity Specificity Sensitivity Specificity Sensitivity Specificity
(Haroon, Kirby
et al. 2013)
0.24
0.62*
0.94 0.28
0.86*
0.98 0.41
0.83*
0.90
(Coates, Aslam
et al. 2013)
0.75 0.39 - - 0.77 0.37 0.77 0.30 - - - - - -
(Walsh, Callis
Duffin et al.
2013)
0.68 0.50 0.78 0.40 0.85 0.45 0.75 0.72 - - - - - -
(Mease,
Gladman et al.
2014)
- - - - 0.84 0.75 0.77 0.72 - - - - 0.67 0.64
(Mishra,
Kancharla et
al. 2017)
0.76 0.95 0.80 0.95 0.53 0.95 - - 0.44 0.97 0.91 0.88 - -
(Karreman,
Weel et al.
2016)
0.59 0.66 0.66 0.57 0.68 0.71 - - - - 0.87 0.34 - -
* group 2 (= confirmed psoriatic arthritis)
PASE: Psoriatic Arthritis Screening and Evaluation; PEST: Psoriasis Epidemiology Screening Tool; ToPAS: Toronto Psoriatic Arthritis Screen;
EARP: Early Arthritis for Psoriatic patients; PASQ: Psoriasis and Arthritis Screening Questionnaire

58
Immunopathogenesis of PSO and PsA 1.3.3
The pathogenesis of PSO is the result of the interplay between skin cells and the innate
and adaptive immune systems. PSO was considered to be a disease characterised by
the hyper-proliferation of keratinocytes that manifested in the characteristic scaling
plaques, until the crucial role of T-cells was demonstrated (Gottlieb, Gilleaudeau et al.
1995). Initially, the concept of an immune-mediated pathogenesis was supported by the
presence of T-cells in the psoriatic plaques, including T helper 1 (Th1; CD4+) and T
cytotoxic (Tc1; CD8+) subsets (Krueger 2002) however, the pathogenic paradigm has
been shifted and now a key role of the IL-23/IL-17 axis has been recognised (Martin,
Towne et al. 2013).
The pathogenesis of PSO can be divided into two stages; initiation and maintenance.
The activation of the dermal dendritic cells (DCs) by a trigger, often environmental
such as infection or trauma, causes the production of cytokines IL-12 and IL-23 which
in turn induce the differentiation of T cells into effector cells such as Th1 or Tc1 and
Th17 or Tc17, respectively. The effector cells (Th and Tc) recirculate and travel into
the skin tissue in response to the signals from key chemokines and cytokines
(Nograles, Davidovici et al. 2010). There they produce IL-17 and IL-22 which lead to
further keratinocyte activation and proliferation, creating the skin lesions and
maintaining the disease. Recently distinct Th cells were found in the psoriatic lesions,
known as Th22 which can only produce IL-22. Th22 cells reside in normal skin and are
enriched in the lesions where they produce IL-22 without the ability to produce IL-17
and interferon γ (IFN-γ) (Duhen, Geiger et al. 2009; Fujita 2013). DCs also produce
tumor necrosis factor alpha (TNFα) and IL-23. TNFα amplifies inflammation by
regulating the antigen-presenting cells and by activating IL-23 production in DCs,
whereas IL-23 is responsible for the expansion of Th17 cells that produce IL-17
(Lowes, Kikuchi et al. 2008). Finally, the secretion of chemokines, cytokines and
antimicrobial peptides from the keratinocytes contributes to the feedback loop that
exists between the immune system and the epidermal cells in PSO by attracting further
immune cells (Lowes, Kikuchi et al. 2008). Bergboer et al. suggested an alternative
model for the pathogenesis of PSO based on genetic evidence implicating that skin
barrier function alterations contribute to the PSO along with the innate and adaptive
immune system (Bergboer, Zeeuwen et al. 2012).

59
The pathogenesis of PsA is not clearly understood due to the complexity of the
disease. Inflammation can appear within the entheses, the synovium and the spine,
affecting both soft tissue and bone with a range of immune cells playing a role in the
onset and progression of the disease. When the immune system is triggered, two main
events for PsA to develop occur; the T cells and B cells infiltrate into the enthesis and
the synovium of the joint, and the entheseal and synovial tissues respond to the
infiltration with the presence of CD8+ T-cell clones implicating the adaptive immune
system and the infiltration of CD4+ T-cells in the synovial fluid and the epidermis of
the skin. Results from experiments using mouse and human tissues showed that IL-23
induced Th17 cytokines (IL-17 and IL-22) can contribute to all four pathological
features in PsA: development of psoriatic plaque, pannus formation in the joint, joint
erosion, and new bone formation (Raychaudhuri, Saxena et al. 2015).
Analysis from synovial fluid has shown elevated levels of pro-inflammatory cytokines
including IL-1, IL-2, IL-6, IL-8, TNFα and INF-γ. Moreover, within the synovium
angiogenesis has been observed due to functional changes in the infiltrating immune
cells. In the joint, osteoclastogenesis and bone resorption is induced by the infiltration
of T-cells. In addition, inflammatory changes have been seen extending from the
enthesis in the adjacent tissues and synovium. The enthesis is the insertion of ligament,
tendon or joint capsule to bone (Figure 6) including the underlying bone at attachment
sites and enthesitis is a focal insertional inflammation (Benjamin and McGonagle 2001).
Based on imaging results, McGonagle et al. suggested that PsA is primarily an enthesis-
centred disease with enthesitis appearing at sites of high mechanical stress and
compression forces with synovitis arising later (McGonagle 2005).

60
Figure 6 | Joint with the enthesis and synovial lining being points of inflammation in psoriatic arthritis. Adapted from Wikipedia (https://en.wikipedia.org)
Comorbid diseases 1.3.4
PSO is not just “skin deep” but is linked to many comorbidities (Ni and Chiu 2014).
The “PSO march” or “inflammatory march” model has been used to describe the
systemic expansion of the cutaneous inflammation across a variety of organs (Furue
and Kadono 2017). According to this hypothesis, PSO produces a variety of pro-
inflammatory cytokines and chemokines not only in the lesions but also in circulation,
which can trigger chronic inflammatory responses in other tissues and induce low-
grade systemic inflammation. In a review, Krueger and Brunner described the role of
the IL-23/Th17 axis, that plays an important role in the immunopathogenesis of PSO as
described in 1.3.3, and specifically IL-17 in the genesis of many morbidities associated
with PSO (Krueger and Brunner 2017). According to them, IL-17 acts synergistically
with TNFα and interferons to alter the response of various cell types that contribute
to the onset of comorbidities. Thus, they propose that chronic inflammation induces
insulin resistance and metabolic abnormalities (Gottlieb, Dann et al. 2008), endothelial
dysfunction and cardiovascular disorders (CVDs) (Hu and Lan 2017). In addition,
psychological (Ferreira, Abreu et al. 2016) and gastrointestinal disorders (Pietrzak,
Pietrzak et al. 2017) along with liver disease (Prussick and Miele 2017) lead patients
with PSO to a more diminished health related quality of life (de Korte, Sprangers et al.
2004). The abovementioned comorbidities also co-occur in patients with PsA (Kotsis,
Voulgari et al. 2012; Zhu, Li et al. 2012; Dreiher, Freud et al. 2013). It has been

61
suggested that the coexistence of cutaneous disease with joint involvement may cause
an overwhelming inflammatory status that could provoke these comorbidities (Ogdie,
Schwartzman et al. 2015). Although it is still unclear if PSO and PsA are a consequence
of these morbidities or predisposing factors, evidence shows that their co-appearance
is based on shared biological pathways.
Cardiovascular disease 1.3.4.1
The presence of both PSO and PsA has been linked to an increased prevalence of
cardiovascular diseases (Table 6).

62
Table 6 | Cardiovascular events in psoriasis and psoriatic arthritis
Outcome Study type Patients (n) HR/RR/OR/SPR (95% CI) Confounders controlled
MI cohort study
(Mehta, Yu et al. 2011)
severe PSO: 3,603
controls: 14,330
HR 1.53 (1.26-1.85) Age, gender, hypertension, diabetes and
hyperlipidaemia
MI meta-analysis
(Armstrong, Harskamp et
al. 2013)
mild PSO: 201,239 RR 1.29 (1.02-1.63)
Primary adjustment accounting for
comorbidities
Stroke RR 1.12 (1.08-1.16)
MI severe PSO: 17,415
RR 1.70 (1.32-2.18)
Stroke RR 1.56 (1.32-1.84)
MI meta-analysis
(Samarasekera, Neilson
et al. 2013)
mild PSO HR or IRR 1.34 (1.07-1.68)
Primary adjustments
Stroke HR or IRR 1.15 (0.98,1.35)
MI severe PSO
HR or IRR 3.04 (0.65-14.35)
Stroke HR or IRR 1.59 (1.34-1.89)
MI cross-sectional
(Lai and Yew 2016)
PSO: 520
controls: 19,065
OR 2.23 (1.27-3.95) Smoking, alcohol consumption, metabolic
syndrome and hyperuricemia CHD OR 1.90 (1.18-3.05)
Stroke OR 1.01 (0.48-2.16)
MI meta-analysis
(Raaby, Ahlehoff et al.
2017)
mild PSO HR 1.20 (1.06-1.35)
Primary adjustments Stroke HR 1.10 (1.00-1.19)
MI severe PSO
HR 1.70 (1.18-2.43)
Stroke HR 1.38 (1.20-1.60)
HR: Hazard Ratio; RR: Risk Ratio; OR: Odds Ratio; SPR: Standardised Prevalence Rate; CI: Confidence Interval; MI: Myocardial Infraction; PSO: Psoriasis;
IRR: Incidence Risk Ratio; CHD: Coronary/Ischaemic Heart Disease

63
Table 6 | Cardiovascular events in psoriasis and psoriatic arthritis
Outcome Study type Patients (n) HR/RR/OR/SPR (95% CI) Confounders controlled
MI
population-based cohort
(Ogdie, Yu et al. 2015)
PsA: 8,706
No DMARD: HR 1.36 (1.04-1.77)
Age, sex, hypertension,
diabetes, hyperlipidaemia,
smoking and start year in the
cohort
DMARD: HR 1.36 (1.01-1.84)
Stroke No DMARD: HR 1.33 (1.03-1.71)
DMARD: HR 1.13 (0.83-1.55)
MI
PSO: 138,424
No DMARD: HR 1.08 (0.98-1.18)
DMARD: HR 1.26 (0.92-1.72)
Stroke No DMARD: HR 1.08 (0.99-1.17)
DMARD: HR 1.45 (1.10-1.92)
Ref Healthy controls: 81,573 ref
Any MI population-based cohort
(Egeberg, Thyssen et al. 2017)
mild cutaneous PSO: 46,085 HR 1.01 (0.94-1.08) Age, sex, socioeconomic status,
smoking, alcohol abuse,
previous cardiovascular
diseases, diabetes,
hypertension, statin use and
health care consumption
severe cutaneous PSO: 7,369 HR 1.19 (1.03-1.39)
PsA: 8,149 HR 1.22 (1.05-1.43)
general population = 4,300,085 Ref
MI meta-analysis
(Polachek, Touma et al. 2017)
PsA: 32,973
Controls
OR 1.68 (1.31-2.15) Primary adjustment
Heart Failure OR 1.32 (1.11-1.57)
Cerebrovascular events OR 1.22 (1.05-1.41)
HR: Hazard Ratio; RR: Risk Ratio; OR: Odds Ratio; SPR: Standardised Prevalence Rate; CI: Confidence Interval; MI: Myocardial Infraction; PsA: Psoriatic Arthritis;
DMARD: Disease-Modifying Anti-Rheumatic Drug; PSO: Psoriasis; Ref: reference group

64
Hypertension 1.3.4.2
Hypertension is one of the conditions, along with obesity, insulin resistance and
hypercholesterolemia that is part of the metabolic syndrome and it is a traditional risk
factor for CVDs and diabetes. Increased prevalence and incidence of hypertension has
been reported in both PSO and PsA (Table 7). Interestingly, a study among 611
patients with PsA and 449 with PSO without arthritis showed that hypertension was
significantly more prevalent in PsA (adjusted OR 2.17; 95% CI: 1.22-3.83) (Husted,
Thavaneswaran et al. 2011).
Table 7 | Hypertension in psoriasis and psoriatic arthritis
Study type Patients (n) HR/RR/OR (95% CI) Confounders controlled
meta-analysis
(Armstrong,
Harskamp et al.
2013)
mild PSO: 127,706 OR 1.03 (1.01-1.06)
Age, sex, person-years and
diabetes, lipids, smoking
and BMI
controls: 465,252 ref
severe PSO: 3,854 OR 1.00 (0.87-1.14)
controls: 14,065 ref
Prospective
(Qureshi, Choi et
al. 2009)
females with PSO: 386 RR 1.17 (1.06-1.30) Age, BMI, smoking, alcohol
intake and physical activity controls: 15,338 ref
case-control
(Cohen, Weitzman
et al. 2010)
PSO: 12,502 OR 1.37 (1.29-1.46) Age, sex, smoking, obesity,
diabetes, use of NSAIDs and
Cox-2 inhibitors
controls: 24,285 ref
cross-sectional
(Neimann, Shin et
al. 2006)
PSO OR 1.58 (1.42-1.76)
mild PSO OR 1.30 (1.15-1.47)
severe PSO OR 1.49 (1.20-1.86)
PsA OR 2.07 (1.41-3.04)
controls ref
cohort study
(Jafri, Bartels et al.
2017)
PsA: 9,741 HR 1.31 (1.23-1.39) Age, sex, other
cardiovascular risk factors,
heart disease, health care
utilization
controls: 307,278 ref
HR: Hazard Ratio; RR: Risk Ratio; OR: Odds Ratio; CI: Confidence Interval; PSO: psoriasis;
ref: reference group; BMI: Body Mass Index; NSAID: non-steroid anti-inflammatory drugs;
PsA: Psoriatic Arthritis

65
Diabetes mellitus 1.3.4.3
Type 2 diabetes mellitus (DM) is a metabolic disorder leading to increased insulin
resistance and hyperglycaemia and is one of the main contributors to the increased
cardiovascular morbidity and mortality (Armstrong, Harskamp et al. 2013)
In a case-control study in 1,835 PSO patients (mild cases=1,661 and severe cases=129)
from the Middle East, the prevalence of DM in mild PSO, severe PSO and controls was
37.4%, 41% and 16%, respectively (p-value=0.00001) (Al-Mutairi, Al-Farag et al. 2010).
In a population-based cohort study among 108,132 patients with PSO and 430,716
controls, the hazard ratio for incident DM was 1.14 (95% CI:1.10-1.18) in the PSO
cohort adjusted for BMI, hypertension, hyperlipidaemia, age and sex (Azfar, Seminara
et al. 2012).
The high prevalence of DM in patients with PsA was found in the majority of studies
(Han, Robinson et al. 2006; Tam, Tomlinson et al. 2008; Solomon, Love et al. 2010;
Eder, Chandran et al. 2017), but not in all (Khraishi, MacDonald et al. 2011).
Obesity 1.3.4.4
Obesity is thought to be a chronic inflammatory condition (Monteiro and Azevedo
2010). For that reason, obesity could trigger PSO and/or PsA or it could be the
consequence of the latent diseases, arising from metabolic disorders and low quality of
life (eating habits, physical inactivity). High BMI has been found to be prevalent in both
PSO and PsA compared to the general population and the risk of developing either
disease is elevated in obese individuals (Table 8). In addition, individuals with PsA have
higher BMI (OR 1.60 (95% CI: 1.09-2.39)) compared with those with PSO after
controlling for potential confounders (Bhole, Choi et al. 2012).
The majority of the studies evaluating either the metabolic risk or adiposity in patients
with PSO have used BMI as a simple marker of obesity. However, BMI cannot provide
information about the distribution of body fat such as the proportion of visceral
adiposity in the abdominal area, which has been more closely associated to
cardiovascular risk than the total fat mass (Despres 2012). Measurement of visceral
adiposity is more challenging compared to BMI as it requires imaging techniques,
however the use of anthropometric instruments such as the waist circumference has
been suggested as it could be used in a clinical setting.

66
Table 8 | Obesity in psoriasis and psoriatic arthritis
Study type Patients (n) HR/RR/OR (95% CI) Confounders
controlled
meta-analysis
(Armstrong,
Harskamp et al.
2012)
PSO: 201,831 OR 1.66 (1.46-1.89) primary adjustment
controls ref
cross-sectional
(Bhole, Choi et al.
2012)
PSO: 644 OR 1.84 (1.50-2.26)
Age and sex PsA: 448 OR 2.71 (2.31-3.18)
controls: 115,787 ref
population-based
(Snekvik, Smith et
al. 2017)
BMI (18.5-24.9): 13,904 ref Age, sex, education
and smoking BMI (25.0-29.9): 15,010 PSO RR: 1.45 (1.15-1.84)
BMI (≥30): 4,820 PSO RR: 1.87 (1.38-2.52)
cohort
(Love, Zhu et al.
2012)
PSO with BMI <25:
26,263
ref
Age, sex, smoking
status, alcohol intake
and history of trauma
PSO with BMI 25-29.9:
27,147
PsA RR: 1.09 (0.93-1.28)
PSO with BMI 30-34.9:
14,088
PsA RR: 1.22 (1.02-1.47)
PSO with BMI ≥35.0:
7.897
PsA RR: 1.48 (1.20-1.81)
HR: Hazard Ratio; RR: Risk Ratio; OR: Odds Ratio; CI: Confidence Interval; PSO: psoriasis;
ref: reference group; BMI: Body Mass Index; PsA: Psoriatic Arthritis
However, waist circumference is highly correlated with BMI at population level and the
latter cannot distinguish visceral from subcutaneous adiposity (Despres 2012). For that
reason, other techniques have been suggested like the use of whole-body bioelectrical
impedance analysis (BIA) with conflicting results about their advantages over the
routinely used measurements (Elia 2013).
Hypercholesterolemia 1.3.4.5
Hypercholesterolemia or increased cholesterol is defined as excessively high plasma
cholesterol levels and it is one of the main risk factors for CVDs.
Several studies have reported the increased prevalence of hypercholesterolemia
among patients with PSO or PsA compared to the general population (Wu, Mills et al.
2008; Warnecke, Manousaridis et al. 2011). Moreover, using the Nurses’ Health Study

67
II which is a cohort of US women, Wu et al. showed that hypercholesterolemia was
associated with an increased risk of incident PSO (HR 1.25; 95% CI: 1.04-1.50) and PsA
(HR 1.58; 95% CI: 1.13-2.23) and more specifically patients having
hypercholesterolemia for seven years or more were at higher risk of developing PSO
and PsA (Wu, Li et al. 2014).
Liver disorders 1.3.4.6
In recent years, studies have tried to elucidate the association of liver disease with
PSO and PsA (Table 9). As described in the previous section, the metabolic syndrome
is prevalent in patients with PSO and it is also a known contributor to the
development of non-alcoholic fatty liver disease (NAFLD); a precursor of fibrosis and
cirrhosis (Paschos and Paletas 2009).
Some medications used to treat arthritis such as methotrexate and leflunomide are
known to increase the risk of cirrhosis (Tilling, Townsend et al. 2006; Curtis,
Beukelman et al. 2010). The combination of existing NAFLD with alcohol consumption
and/or cumulative methotrexate dose can lead to cirrhosis (Bath, Brar et al. 2014) in
patients with PSO and PsA; however it is not clear in what degree methotrexate
induces hepatotoxicity in the absence of the other risk factors.
Respiratory disorders 1.3.4.7
Chronic obstructive pulmonary disease (COPD) which encompasses emphysema and
chronic obstructive bronchitis is a tobacco-related disease (Tuder and Petrache 2012)
that affects 10%-12% of the population (Adeloye, Chua et al. 2015). There have been a
few studies assessing the prevalence of COPD in patients with PSO compared with
healthy controls; however, there is no study comparing prevalence among patients
with PsA and controls or patients with PSO without arthritis (Table 10).

68
Table 9 | Liver disease in psoriasis and PsA
Outcome Study type Patients (n) HR/OR (95% CI) Confounders controlled
NAFLD
cross-sectional
(van der Voort,
Koehler et al. 2014)
PSO: 118 OR 1.7 (1.1-2.6) Age, gender, alcohol consumption, smoking, presence of
metabolic syndrome and alanine aminotransferase controls: 2,174 ref
Advanced
liver fibrosis
cross-sectional
(van der Voort,
Koehler et al. 2016)
PSO: 74 OR 2.57 (1.00-6.63)
Demographics, lifestyle variables and laboratory findings controls: 1,461 ref
NAFLD
meta-analysis
(Candia, Ruiz et al.
2015)
PSO: 581 vs.
controls: 2,764
OR 2.07 (1.62-2.64)
(good quality
papers)
Primary adjustments PsA: 117 vs.
PSO without PSA: 388
OR 2.25 (1.37-3.71)
mild PSO: 9,134 vs.
moderate to severe PSO: 42,795
OR 2.07 (1.59-2.71)
Liver Disease
(NAFLD,
cirrhosis)
population-based
(Ogdie, Grewal et al.
2017)
PSA (no ST): 5,786 HR 1.38 (1.02-1.86)
Age at start date, sex, smoking status, alcohol intake, BMI
category, use of oral corticosteroids and NSAIDs in
baseline
PSA (ST): 6,522 HR 1.67 (1.29-2.15)
PSO (no ST): 186,006 HR 1.37 (1.29-1.45)
PSO (ST): 11,124 HR 1.97 (1.63-2.38)
controls: 1,279,754 ref
HR: Hazard Ratio; OR: Odds Ratio; CI: Confidence Interval; NAFLD: Non-Alcoholic Fatty Liver Disease; PSO: Psoriasis; ref: reference group;
BMI: Body Mass Index; PsA: Psoriatic Arthritis; ST: systemic therapy; NSAID: Non-Steroid Anti-Inflammatory Drug

69
Table 10 | Chronic obstructive pulmonary disease in psoriasis patients
Study type Patients (n) HR/OR (95% CI) Confounders
controlled
case-control
(Dreiher, Weitzman et
al. 2008)
PSO: 12,502 OR 1.27 (1.13-1.42) Age, sex,
socioeconomic status,
smoking and obesity controls: 24,287 ref
case-control
(Al-Mutairi, Al-Farag et
al. 2010)
mild-moderate PSO:
1,661
OR 1.35 (0.98-1.85)
Age, gender severe PSO: 129 OR 1.78 (0.88-3.65)
controls: 1,835 ref
population-based
(Chiang and Lin 2012)
PSO: 2,096 HR 2.35 (1.42-3.89) Sociodemographics
and comorbidities controls: 8.384 ref
meta-analysis
(Li, Kong et al. 2015)
PSO: 42,150 OR 1.90 (1.36-2.65)
Primary adjustment
controls: 163,174 ref
mild-moderate PSO:
3,241
OR 1.66 (1.00-2.76)
controls: 10,177 ref
severe PSO: 620 OR 2.20 (1.29-3.75)
controls: 10,177 ref
HR: Hazard Ratio; OR: Odds Ratio; CI: Confidence Interval; PSO: psoriasis; ref: reference group;
Gastrointestinal disorders 1.3.4.8
PSO often co-exists with disorders affecting the gastroenterological tract. The
association of inflammatory bowel disease (IBD), an umbrella term that includes UC
and CD, has been investigated by epidemiological studies, although more clear insights
into their pathological overlap has been gained via genetic studies (Skroza, Proietti et
al. 2013).
In a case-control study of 12,502 PSO patients and 24,287 age- and sex- matched
controls, UC and CD were found to be significantly more prevalent in patients with
PSO compared with the controls (OR 1.64; 95% CI: 1.15-2.33 and OR 2.49; 95% CI:
1.71-3.62, respectively) after adjusting for TNFα therapy (Cohen, Dreiher et al. 2009).
In a population-based study involving 8,072 IBD cases and a matched control cohort,
an increased prevalence of PSO was found in both UC and CD cases (Bernstein,
Wajda et al. 2005). In a study of 174,476 women from the Nurses’ Health Study (NHS)

70
and NHS2, the PSO group had an elevated risk of developing CD (pooled analysis RR
3.86; 95% CI: 2.23-6.67) but not UC (RR 1.17; 95% CI: 0.41-3.36). Also, there was a
pronounced risk of CD in patients with PsA (RR 6.54; 95% CI: 2.07-20.65) (Li, Han et
al. 2013).
Psychological disorders 1.3.4.9
PSO and PsA can have profound physical, emotional and social effects and negative
impacts on many aspects of quality of life (Weiss, Kimball et al. 2002). Patients suffer
from high levels of anxiety and stress as the visible skin lesions can cause
embarrassment (Tejada Cdos, Mendoza-Sassi et al. 2011). A study showed that 83% of
patients with moderate and severe PSO felt that they ‘often’ or ‘always’ had to hide
their skin lesions and avoid social activities such as swimming (Weiss, Kimball et al.
2002). About 10% of patients with PSO have suicidal feelings (Gupta and Gupta 1998).
The majority of studies that have evaluated the prevalence or the incidence of
psychological disorders in patients with PSO compared to the healthy controls (Table
11). However there has been a study comparing patients with PsA to PSO without
arthritis in terms of depression and anxiety prevalence, in which the prevalence of
anxiety and depression was significantly higher in patients with PsA (36.6% and 22.2%,
respectively) compared to those with PSO only (24.4% and 9.6%, p-value < 0.05)
(McDonough, Ayearst et al. 2014).

71
Table 11 | Psychological disorders in patients with psoriasis and psoriatic arthritis
Outcome Study type Patients (n) HR/RR/OR (95% CI) Confounders controlled
Depression population-based cohort
(Kurd, Troxel et al. 2010)
mild PSO: 146,042 vs. controls: 746,930 HR 1.38 (1.35-1.40)
Age and sex severe PSO: 3,956 vs. controls: 20,020 HR 1.72 (1.57-1.88)
Anxiety mild PSO: 146,042 vs. controls: 746,930 HR 1.31 (1.29-1.34)
severe PSO: 3,956 vs. controls: 20,020 HR 1.29 (1.15-1.43)
Clinical
Depression
meta-analysis of 5 studies
(Dowlatshahi, Wakkee et al.
2014)
PSO OR 1.57 (1.40-1.76)
Primary adjustment controls ref
Depression cross-sectional
(Dalgard, Gieler et al. 2015)
PSO: 626 vs. controls: 1,359 OR 3.02 (1.86-4.90) Age, gender, socio-economics status, stress and
comorbidity Anxiety PSO: 626 vs. controls: 1,359 OR 2.91 (2.01-4.21)
Depression cross-sectional
(McDonough, Ayearst et al. 2014) PsA: 306 vs. PSO: 135
36.6% vs. 24.4% No adjustment to the prevalence estimation
Anxiety 22.2% vs. 9.6%
Depression prospective cohort
(Dommasch, Li et al. 2015)
PSO without PsA: 126 RR 1.25 (1.05-1.49) Age, smoking, alcohol intake, BMI, cancer,
angina, diabetes, snoring, hypertension, high
cholesterol, menopausal status, hormone use,
RA, sleeping duration, stroke
PSA: 30 RR 1.52 (1.06-2.19)
controls: 5,144 ref
PsA population-based
(Lewinson, Vallerand et al. 2017)
PSO with depression: 5,216 HR 1.37 (1.05-1.80) Age, sex, BMI, smoking, alcohol use, Charlson
comorbidity index, Townsend deprivation
index, PSO severity
PSO with no depression: 68,231 ref
HR: Hazard Ratio; OR: Odds Ratio; CI: Confidence Interval; PSO: psoriasis; ref: reference group; BMI: Body Mass Index; PsA: Psoriatic Arthritis; RA: Rheumatoid
Arthritis
72
Fatigue and chronic pain 1.3.4.10
Although fatigue and chronic pain cannot be classified as comorbidities, they are the
most important reported outcome among many patients with arthritis (Hewlett,
Cockshott et al. 2005; Gudu, Etcheto et al. 2016). However, only a few studies have
explored their association with PSO and PsA.
Pain and fatigue, which is defined as “an overwhelming sense of tiredness, lack of
energy, and a feeling of exhaustion” (Mills and Young 2008), are highly subjective and
due to their complex nature they are difficult to assess objectively. Both can be
influenced by the underlying disease, genetic predisposition, lifestyle and psychological
factors (Husted, Tom et al. 2009).
In a study assessing the prevalence of symptoms such as itch, pain and fatigue in
patients with dermatological conditions in general practice, 51.8% of patients with PSO
experience fatigue with 27.7% experiencing it relatively severely; whereas pain was
reported by 25% of the patients, with severe pain being less frequent, affecting
approximately 13.5% (Verhoeven, Kraaimaat et al. 2007). In PsA, the prevalence of
moderate fatigue is approximately 50%, with almost 30% of patients reporting severe
fatigue (Husted, Tom et al. 2009). In a recent study, fatigue was assessed using three
different instruments in 84 PSO patients and 84 age- and sex-matched controls (Skoie,
Dalen et al. 2017). Concomitant depression and bodily pain were also measured. On
all three instruments, patients with PSO scored higher in terms of fatigue compared to
controls. Fatigue severity was not associated with disease activity and inflammatory
variables. In addition, fatigue was associated with depression and pain; a finding in
concordance with a study by Evers et al. in which higher levels of fatigue were found to
be related with psychological distress (Evers, Lu et al. 2005). In a study by Rosen et al.,
patients with PSO without arthritis were less fatigued (3.4 vs 4.3, p-value=0.0007) and
experienced less pain compared with patients with PsA (Rosen, Mussani et al. 2012). In
a prospective study comparing patients with PSO and PsA, patients with PsA had
higher levels of fatigue compared to the PSO patients receiving phototherapy or
systemic treatment (p-value<0.009) (Tobin, Sadlier et al. 2017). Moreover, fatigue was
higher in female compared to male patients (4.2 vs 2.8, p-value<0.001). Finally, fatigue
was associated with depression (correlation r=0.3, p-value<0.001).

73
Limitations of current research 1.3.4.11
One of the limitations of the undertaken studies lies in the use of patients with severe
PSO recruited from hospital settings which may bias the estimates of comorbidities.
Thus, research should focus on patients from primary care settings who have also been
assessed for the co-existence of arthritis. The latter could help researchers better
evaluate the additional burden of the inflammatory joint disorder in certain
comorbidities.
Better understanding of the relationship between PSO, PSA and comorbidities could
help the separation of cause from effect and highlight targets for clinical intervention.
Environmental risk factors for PsA 1.3.5
PSO and PsA are multifactorial diseases in which the interplay between hereditary
factors, lifestyle and environmental influences is thought to be of major importance. It
is suggested that PSO patients with genetic susceptibility to arthritis develop PsA
following an environmental trigger.
A small number of studies have been conducted investigating the association between
environmental and lifestyle factors and the onset of PsA in patients with PSO. The first
took place in Rochester, Minnesota and studied 60 PsA and 120 PSO patients and
showed that corticosteroid use was associated with higher risk of PsA (OR 4.33, 95%
CI 1:34 to 14:02), while pregnancy had a protective role against PsA (OR 0.19, 95% CI
0.04-0.95). No association was found with ethnicity, trauma/infection, severity of PSO
and the type of therapy used to treat PSO (Thumboo, Uramoto et al. 2002). The
second was performed in the UK among 98 PsA and 163 PSO patients using a self-
completed questionnaire. It was found that immunization, especially for rubella;
infection by the human immunodeficiency virus (HIV); conjunctivitis and oral ulceration
and physical/psychological trauma were more common in the years preceding disease
onset in patients with PsA compared to PSO (Pattison, Harrison et al. 2008).
However, it should be noted that both studies were retrospective case-control, thus
subject to recall bias. In the second above-mentioned study they tried to minimize the
recall errors by recruiting patients with recent onset of PsA (up to five years).
Moreover, both studies had limited statistical power because of their small sample

74
sizes. The potential risk factors, identified in epidemiological studies, are discussed in
the following sections along with more recent evidence about their association with
the onset of PSO and/or PsA.
Physical trauma and the “deep Koebner phenomenon” 1.3.5.1
There have been a few cases series and a handful of retrospective studies implicating
physical trauma or injury as a trigger of PsA among patients with PSO. However, it is
unclear whether trauma is an actual trigger or a coincidental event.
The role of trauma in the onset of PSO is not a new concept and dates back to the
19th century when Heinrich Koebner reported the formation of PSO-like lesions in
unaffected skin of patients with PSO after cutaneous trauma. The Koebner
phenomenon (KP) appears in other skin conditions but it has been studied more
widely in PSO. Approximately 25% of patients with PSO will exhibit the Koebner
response after various injuries such as burns, surgical incisions and tattooing (Boyd and
Neldner 1990). According to Boyd and Neldner, the KP can develop in any anatomic
site and usually during the winter. The period from the actual trauma to the lesion
appearance is between 10 and 20 days but it can be as long as two years depending on
the patient’s skin sensitivity (Boyd and Neldner 1990).
Proposed mechanisms 1.3.5.1.1
The pathogenic mechanism in PSO underlying the Koebner response is not well
understood. It is assumed that an inflammatory response leads to the production of
various cytokines, stress proteins and adhesion molecules (Sagi and Trau 2011).
Several mechanisms have been proposed by which KP could affect deeper tissues like
the enthesis and cause arthritis. McGonagle et al. introduced the synovio-entheseal
complex theory in which mechanical stress in the entheses is hypothesised to lead to
enthesitis and in turn enthesitis could be the initiator of the innate immune activation.
Via the innate immune system an inflammatory reaction could be induced in the
juxtaposed synovium causing synovitis (McGonagle, Lories et al. 2007). Imaging studies
have supported this theory, as they have reported a higher prevalence of entheseal and
bone abnormalities in PSO patients without arthritis (McGonagle, Ash et al. 2011).
An alternative theory is that local trauma could result in the release of neuropeptides
like substance P whose expression levels have been reported to be increased in

75
psoriatic lesions and in the synovium. Substance P is thought to induce prolonged
inflammation by triggering the proliferation of synoviocytes (Hsieh, Kadavath et al.
2014).
Epidemiological evidence 1.3.5.1.2
There have been some case reports followed by two case series supporting the
hypothesis of KP initiating PsA among patients with PSO. In 1992, Scarpa et al.
reviewed the medical records of 138 patients with PsA and 138 patients with RA, used
as controls, for any acute event other than PSO that occurred less than ten days prior
the onset of PsA. Three patients developed arthritis followed articular trauma and in
only one case did arthritis occur at the same site affected by the local trauma (Scarpa,
Del Puente et al. 1992). Punzi et al. reported a higher prevalence of trauma that
occurred less than three months prior to the onset of arthritis in patients with PsA
(8%) compared to patients with RA (1.7%) or AS (0.7%). Higher levels of IL-6 were
also observed in patients with PsA (p-value<0.0005) (Punzi, Pianon et al. 1998). These
cases series can only suggest a possible association between a risk factor and the onset
of PsA, as they cannot infer causality and are prone to selection bias.
Three case-control studies (Thumboo, Uramoto et al. 2002; Pattison, Harrison et al.
2008; Eder, Law et al. 2011) tried to assess the relationship between trauma and PsA
with conflicting results, probably due to different definitions of trauma, the different
diagnostic criteria used for PsA (only Eder et al. used CASPAR) and the different time
frames preceding the trigger of disease. As previously mentioned (section1.3.5),
Thumboo et al. found no significant association between trauma and PsA (OR 1.58;
95% CI: 0.73-3.41) compared to controls, whereas Pattison et al. and Eder et al.
reported significant associations (trauma leading to medical care OR 2.53; 95% CI: 1.1-
6.0 and injuries OR 2.1; 95% CI: 1.11-4.01, respectively). Finally, data from the Health
Improvement Network (THIN) showed that patients with PSO exposed to trauma had
an increased risk of developing PsA compared to controls (adjusted HR 1.32; 95% CI:
1.13-1.54) with only bone and joint trauma being associated with PsA occurrence (HR
1.46; 95% CI: 1.04-2.04 and HR 1.50; 95% CI: 1.19-1.90, respectively) (Thorarensen, Lu
et al. 2017).
76
Stress 1.3.5.2
Stress has been defined along three categories: a) stressful events such as moving
house, financial problems and unemployment b) psychological difficulties and c) lack of
social support (Gupta, Gupta et al. 1989). Regardless of how stress is defined, it has
been associated with a higher severity of PSO and it has been suggested that PsA
occurs more frequently in patients with more severe PSO. A study showed that
patients with PsA reported more frequently that they had changed house (which is
exposure to psychological trauma) compared to PSO patients (30.3% vs. 18.1%) with
OR 2.29 (95% CI: 1.21-4.4) (Pattison, Harrison et al. 2008). However, as this demands
physical activity too, the true association could be with physical trauma. In addition, in
a study of 2,000 psoriatic patients, a significant increase in PSO exacerbations was
noted during stressful periods (Farber and Nall 1993).
It is believed that one of the most important cells in the pathogenesis of PSO is the T
cell (Kryczek, Bruce et al. 2008). Psychological stressors, which have been reported to
increase the level of T-cells (Buske-Kirschbaum, Kern et al. 2007), cause skin flares in
88% of PSO patients and may be associated with the onset of the disease in 40% of
cases (Al'Abadie, Kent et al. 1994; Griffiths and Richards 2001). As the psychological
disorders among patients with skin disease show a prevalence of 30% (Shenefelt 2011),
more studies should be conducted to determine the role of stress in both diseases and
whether stress is a causal factor or a consequence of PSO.
Infections, Vaccinations, Medication, Diet and Hormonal changes 1.3.5.3
Various studies have reported associations of various factors with the triggering or
induction of PSO and/or PsA, detailed in Table 12. More longitudinal studies are
needed to verify the role of these environmental factors in the pathogenesis of both
diseases.

77
Table 12 | Other environmental factors associated with psoriasis and psoriatic arthritis
Environmental factor Study Findings
Infections
Mouth ulceration PsA: 98 vs. PSO-only: 163
(Pattison, Harrison et al. 2008)
PsA vs. PSO: OR 4.20
(95% CI: 1.96-9.00)
HCV
Prospective study; PSO: 118
(Chouela, Abeldano et al. 1996)
anti-HCV prevalence;
PSO vs. controls: 7.6% vs 1.2%, respectively
PsA: 50, PSO: 50 vs. controls: 76
(Taglione, Vatteroni et al. 1999)
anti-HCV prevalence;
PsA vs. controls: 12% vs 5.2%, p<0.05
PSO vs. controls: 10% vs 5.2%, p>0.05
PSO: 12,502 vs. controls: 24,287
(Cohen, Weitzman et al. 2010)
Hepatitis C prevalence;
PSO vs. controls: 1.03% vs. 0.56%, p<0.001
OR 1.86 (95% CI 1.46-2.38)
HIV
PSO with HIV: 50
(Obuch, Maurer et al. 1992)
In HIV-positive patients 2.5% developed
PSO, comparable to that of the controls
PSO with HIV: 56
(Kassi, Mienwoley et al. 2013)
28.8% prevalence of severe PSO in HIV
Black African patients.
HIV patients: 52 and 1,100
respectively
(Buskila, Gladman et al. 1990;
Solinger and Hess 1993)
5.7% and 0.4% PsA prevalence in HIV
patients vs 0.25% in general USA
population
Medication
Lithium review
(Jafferany 2008)
Cause of flares in PSO patients and trigger to
patients without familial history of PSO
NSAIDs
prospective cohort study; 95,540
women (NHS II)
(Wu, Han et al. 2015)
Regular vs. non-regular users:
PSO HR 1.12 (95% CI 0.94-1.33)
PsA HR 1.35 (95% CI 0.98-1.88)
Aspirin
prospective cohort study; 95,540
women (NHS II)
(Wu, Han et al. 2015)
Regular vs. non-regular users:
PSO HR 0.97 (95% CI 0.79-1.20)
PsA HR 0.94 (95% CI 0.64-1.39)
Paracetamol
prospective cohort study; 95,540
women (NHS II)
(Wu, Han et al. 2015)
Regular vs. non-regular users:
PSO HR 1.17 (95% CI 0.97-1.39)
PsA HR 1.78 (95% CI 1.28-3.96)
Systemic steroids
non-systematic literature
research
(Mrowietz and Domm 2013)
Not recommended for PSO due to
deterioration of disease after withdrawal
from the drug
Antimalarial drugs review
(Basavaraj, Ashok et al. 2010)
Reported to trigger or induce PSO in
susceptible patients
PsA: Psoriatic Arthritis; PSO: Psoriasis; HCV: Hepatitis C Virus; HIV: Human Immunodeficiency virus; OR:
Odds Ratio; HR: Hazard Ratio; vs.: versus; CI: Confidence Interval; NHS: Nurses’ Health Study

78
Table 12 | Other environmental factors associated with psoriasis and psoriatic arthritis
Environmental factor Study Findings
Vaccinations
Rubella PsA: 98 vs. PSO-only: 163
(Pattison, Harrison et al. 2008)
PsA vs PSO: OR 12.4 (95% CI 1.20-
122.14)
Tetanus PSA vs PSO: OR 1.91 (95% CI 1.0-3.7)
Diet
α-carotene
PSO: 156 vs. controls: 6,104
(Johnson, Ma et al. 2014)
PSO vs. controls: OR 1.02
(95% CI 1.01-1.04)
vitamin A intake PSO vs. controls: OR 1.01
(95% CI 1.00-1.02), p=0.03
lower sugar consumption PSO vs. controls: OR 0.998
(95% CI 0.996-1.00), p=0.04
Variety of food PSO: 1,206 vs. population control
data from NHANES 2009-2010:
5,103
(Afifi, Danesh et al. 2017)
PSO vs. controls: less sugar, dairy,
whole grain fiber and calcium and
the consumption of fruits, vegetables
and legumes significantly increased.
53.8% of PSO patients reported skin
improvement after reducing alcohol,
53.4% after reducing gluten, 44.6%
after increasing omega-3 intake and
41% after adding vitamin D
Hormonal changes
Estrogen oral contraception Cohort study; 17,032 women
(Vessey, Painter et al. 2000)
Users vs non-users:
RR 1.07 (95% CI 1.0-2.9) for hospital
referral due to PSO
Pregnancy Pregnant women with PSO: 47 vs.
menstruating women with PSO:
27
(Murase, Chan et al. 2005)
55% PSO patients reported
improvement vs. 23% who reported
worsening. Postpartum, 65%
reported worsening of PSO. 84%
decrease of the lesions in women
with body surface involvement of
PSO>10%
PsA: 60 vs. PSO: 120
(Thumboo, Uramoto et al. 2002)
Decreased risk of developing PSA
with OR 0.16 (95% CI 0.02-0.99)
PSO: Psoriasis; vs.: versus; PSA: Psoriatic Arthritis; RR: Relative Risk; CI: Confidence Interval; OR: Odds Ratio;
NHANES: National Health And Nutrition Examination Survey

79
Obesity 1.3.5.4
As described in section 1.3.4.4 obesity can be classified as a comorbid condition in
PSO and PsA; however, three studies have supported the association of increased BMI
with the onset of PsA among patients with PSO (Soltani-Arabshahi, Wong et al. 2010;
Li, Han et al. 2012; Love, Zhu et al. 2012). Interestingly, Love et al. and Li et al.
reported a dose-effect of BMI on the development of PsA. Although these studies
reinforce the hypothesis that obesity is linked with the onset of PsA, it should be
mentioned that in the study by Love et al. the diagnosis of PsA was made by a primary
care physician and it was not validated by a rheumatologist; therefore bias because of
disease misclassification could be present (Canete and Mease 2012).
Smoking and alcohol consumption 1.3.5.5
Smoking and alcohol consumption are two of the lifestyle factors that have been
reported to be associated with an increased risk of PSO. A systematic literature
review was conducted by Brenaut et al. to assess whether alcohol consumption is
prevalent in PSO patients and whether it is a trigger factor of the disease (Brenaut,
Horreau et al. 2013). Out of the 23 studies investigating the association of PSO and
prevalent alcohol consumption, 18 concluded that the latter is significantly higher in
PSO compared to the general population, whereas five reported that this was not the
case. The fact that alcohol is a risk factor for PSO development was supported by four
studies. However, only one had a prospective design (Qureshi, Dominguez et al. 2010)
in which the RR of PSO was 1.72 (95% CI: 1.15-2.57) for a consumption of 2.3 drinks
per week or more, compared with women who did not drink alcohol. In a later study
the same group examined whether alcohol intake was also a risk factor for the onset
of PsA (Wu, Cho et al. 2015). An excessive alcohol consumption of 30 grams per day
was associated with an increased risk of PsA in women (HR 4.45; 95% CI: 2.07-9.59). A
possible mechanism underlying the interaction between alcohol and PSO could be the
up-regulation of pro-inflammatory cytokines (Ockenfels, Keim-Maas et al. 1996) or the
increase of lymphocyte proliferation (Schopf, Ockenfels et al. 1996) by ethanol.
The role of smoking in the disease risk is unclear. It has been suggested that smoking
can activate the nicotinic cholinergic receptors in keratinocytes which in turn enhance
cell differentiation (Grando, Horton et al. 1996). In addition, smoking is linked to
oxidative stress (Morrow, Frei et al. 1995) that may induce chronic inflammation and

80
activate signalling pathways implicated in PSO (Sopori 2002). In a meta-analysis of
studies assessing the prevalence of smoking among patients with PSO, the pooled OR
was 1.78 (95% CI: 1.53-2.06). Moreover, current smokers were at higher risk of
developing PSO (pooled adjusted OR 1.94; 95% CI: 1.64-2.28) compared to non-
smokers. In a recent nationwide study from Korea, the adjusted incidence ratio of
developing PSO among current smokers was 1.14 (95% CI: 1.13-1.15) and among
former smokers was 1.11 (95% CI: 1.10-1.12) compared to non-smokers, with the risk
of developing PSO being higher in smokers having more than two packs per day (Lee,
Han et al. 2017).
The relationship between smoking and PsA has been examined by researchers with
conflicting results. Eder et al. found an inverse association between smoking and PsA
(Eder, Law et al. 2011) which held only among patients negative for HLA-Cw6 (Eder,
Shanmugarajah et al. 2012). Li et al. reported that the RR of PsA was 3.13 (95% CI:
2.08-4.71) among current smokers and 1.54 (95% CI: 1.06-2.24) for former smokers
compared with non-smokers. This relationship was dose-dependent when assessing
the risk for PsA in the entire population (Li, Han et al. 2012). The protective effect of
smoking in the development of PsA among patients with PSO reported by Eder et al.
could be the result of a type of selection bias called index event bias. Nguyen et al.
tried to explain this “paradoxical” phenomenon using the THIN database (Nguyen,
Zhang et al. 2018). According to this study, smoking was associated with an increased
risk of PsA (HR 1.27; 95% CI: 1.19-1.36) in the general population but with a
decreased risk among patients with PSO (HR 0.91; 95% CI: 0.84-0.99). Performing
mediation analysis, they showed the effect of smoking on the risk of PsA was mediated
through its effect on PSO. In correspondence, Lee and Song commented that the study
by Nguyen et al. failed to adjust for factors such as physical activity, drugs, diet and
others, suggesting a possible confounding effect of additional unmeasured variables
(Lee and Song 2017). Nonetheless, “paradoxical” findings should always be interpreted
with caution because of bias and unidentified confounding. Therefore, further research
is needed to clarify the effect of smoking on the onset of PsA among patients with
PSO.
Lastly, two clinical factors have been suggested to be associated with the development
of PsA; PSO severity (Wilson, Icen et al. 2009; Soltani-Arabshahi, Wong et al. 2010;

81
Tey, Ee et al. 2010) and nail involvement (Wilson, Icen et al. 2009; Soltani-Arabshahi,
Wong et al. 2010). Further prospective cohort studies are required to confirm the
associations with the above-mentioned environmental and lifestyle factors and explore
differences between PSO and PsA. The identification of risk factors could help identify
those patients with PSO that are likely to develop PsA and it could allow clinicians to
intervene early or even prevent the development of the disease.
Genetic risk factors for PSO and PsA 1.3.6
The genetic basis of PSO and PsA is not fully understood. However, with the advent of
GWAS many SNPs have been found to be associated with both conditions. Discovery
of disease associated SNPs and genes can lead to two clinical benefits:
Improved prediction of disease risk
Improved treatment by identifying novel therapeutic targets and inform
repurposing of existing drugs
Although both PSO and PsA pathogenesis remains unclear, it is certain that genetic
predisposition plays a crucial role in the individual’s susceptibility and disease
expression. Evidence for this genetic predisposition has been ascertained through the
analysis of heritability in twin and genealogical studies.
Twin studies 1.3.6.1
In the case of PSO, as depicted in Table 13, in all conducted studies the concordance in
identical twins is much higher supporting a genetic component to disease. Moreover,
the majority of these studies have estimated the heritability (the proportion of trait
variance as a result of genetic variance) and found that it ranges between 68 and 90%.
As far as PsA is concerned, its genetics have not been thoroughly investigated. The
only twin study that has been conducted in Denmark among 36 twins did not have the
statistical power to detect genetic effectors on PsA, although confirmed the
importance of genes in PSO (Pedersen, Svendsen et al. 2008).

82
Table 13 | Twin studies conducted to establish the genetic basis of psoriasis
Country Cohort Concordance of
monozygotic
twins %
Concordance
of dizygotic
twins %
Heritability %
US (Farber, Nall et al. 1974) 61 73 20 -
Denmark (Brandrup, Hauge
et al. 1978)
36 64 14 90
Australia (Duffy, Spelman et
al. 1993)
77 35 12 80
Norway (Grjibovski, Olsen et
al. 2007)
273 22 6 66
Denmark (Lonnberg, Skov et
al. 2013)
804 20 9 68
Familial aggregation studies 1.3.6.2
Familial aggregation studies in PSO showed that the recurrence ratio in first degree
relatives is 7.6 (in one study) and the λs has been estimated between 4 and 12 (Myers,
Kay et al. 2005; Rahman and Elder 2005; Chandran, Schentag et al. 2009). A number of
epidemiological studies have estimated familial aggregation in PsA, as seen in Table 14,
consistently reporting that its genetic burden is higher compared to PSO. Particularly
in the Icelandic study the risk ratio of first degree relatives to fourth-degree relatives
was 39, 12, 3.6 and 2.3 respectively (Karason, Love et al. 2009).
Table 14 | Epidemiological studies estimating familial aggregation in psoriatic arthritis
Country λ1 Prevalence in
FDRs, %
λs Prevalence in
siblings, %
UK (Moll and Wright 1973) 55 5.5 - -
UK (Myers, Kay et al. 2005) - - 47 14.3
Canada (Chandran, Schentag et al. 2009) 30.4 7.6 30.8 7.7
Iceland (Karason, Love et al. 2009) 39 - -
λ1: recurrence risk ratio in first degree relatives; FDRs: First Degree Relatives;
λs: recurrence risk ration in siblings

83
Association studies 1.3.6.3
PSO 1.3.6.3.1
In 2007, the first PSO GWAS was undertaken by Cargill et al. and consisted of 467
cases and 500 controls and 25,215 SNPs (Cargill, Schrodi et al. 2007). In the following
years, another four GWAS were carried out (Nair, Duffin et al. 2009; Ellinghaus,
Ellinghaus et al. 2010; Genetic Analysis of Psoriasis, the Wellcome Trust Case Control
et al. 2010), one exome-wide association study (Dand, Mucha et al. 2017), two meta-
analyses including only GWAS datasets (Stuart, Nair et al. 2010; Ellinghaus, Ellinghaus
et al. 2012) and three meta-analysis including both GWAS and Immunochip datasets
(Tsoi, Spain et al. 2012; Tsoi, Spain et al. 2015; Tsoi, Stuart et al. 2017), identifying 63
susceptibility loci in total in the European population (Table 15). In the Han Chinese
population (Table 16) GWAS have indicated some novel associations along with shared
loci with the European findings. The candidate genes identified so far are involved in
four broad biological pathways: NF-κB signaling, skin barrier function, antigen
presentation and IL-23/Th17 signaling.
The most significant association reported in different populations is with the SNPs
located at the MHC class I region, which harbors the HLA genes with the HLA-C gene
being involved in the presentation of antigens to T lymphocytes, a function that is
important for the immune system. The strongest correlated SNP tags the HLA-Cw6
allele, whose contribution to the aetiology of PSO has been the aim of various studies.
It has been suggested that HLA-Cw6 may present a melanocytic autoantigen,
ADAMTS-like protein 5M to CD8+ T cells (Arakawa, Siewert et al. 2015). Moreover,
HLA-Cw6 has shown to have a high binding affinity for LL-37, which has been
described as a T-cell autoantigen in PSO (Mabuchi and Hirayama 2016). Finally,
encoding endoplasmic reticulum aminopeptidase 1 (ERAP1) in 5q15 takes part in
antigen presentation by shedding of pro-inflammatory cytokine receptors (Haroon and
Inman 2010) and its existing interaction with HLA-C could regulate PSO susceptibility
(Genetic Analysis of Psoriasis, the Wellcome Trust Case Control et al. 2010).
The skin barrier function also plays a role in PSO pathogenesis, as supported by several
GWAS findings. A deletion in late cornified envelope (LCE) at genes LCE3B and LCE3C,
and LCE3A have been significantly associated with the disease (de Cid, Riveira-Munoz et
al. 2009). The LCE genes play a crucial role in epidermal terminal differentiation as they
84
encode the stratum corneum proteins of the cornified envelope (Mischke, Korge et al.
1996).
Finally, IL23 signaling that regulates Th17 is a key pathway to the immunopathogenesis
of PSO. Polymorphisms within IL12B, IL23A (Nair, Duffin et al. 2009) and IL23R (Cargill,
Schrodi et al. 2007) have been identified in both European and Asian populations and
along with TRAF3IP2 (encodes an adaptor molecule driving NF-κB signal transduction
downstream of IL-17) (Ellinghaus, Ellinghaus et al. 2010) and NFKBIZ (a target of IL-17
signaling in keratinocytes) (Tsoi, Spain et al. 2015) confirm the involvement of T-cell
signaling in PSO susceptibility.

85
Table 15 | Non-MHC PSO susceptibility loci identified by association studies in the European population (Adapted by (Ray-Jones, Eyre et al. 2016))
Locus Notable gene(s) Index SNPⱡ Index SNP annotation P-value Risk
allele
OR Sample size
cases/controls
1p36.23 SLC45A1, TNFRSF9 rs11121129 Intergenic 1.7 x 10⁻⁸ A 1.131 10,588/22,806
1p36 IL-28RA rs7552167 4.2kb 5' of IL-28RA 8.5 x 10⁻¹² G 1.211 10,588/22,806
1p36.11 RUNX3 rs7536201 1.5kb 5' of RUNX3 2.3 x 10⁻¹² C 1.131 10,588/22,806
1p31.3 IL-23R rs9988642 441bp 3' of IL-23R 1.1 x 10⁻²⁶ T 1.521 10,588/22,806
1p31.1 FUBP1 rs34517439 Intronic: DNAJB4 4.43 × 10⁻⁹ A 1.182 Up to 11,988/275,334
1q21.3 LCE3B, LCE3D rs6677595 3.6kb 3' of LCE3B 2.1 x 10⁻³³ T 1.261 10,588/22,806
1q24.3 FASLG rs12118303 Intergenic 3.02 × 10⁻¹⁰ C 1.122 Up to 11,988/275,334
1q31.1 LRRC7 rs10789285 Intergenic 1.43 x 10⁻⁸ G 1.123 15,295/27,578
1q31.3 DENND1B rs2477077 Intronic: DENND1B 3.05 x 10⁻⁸ (meta) T NR4 1,962/8,923
1q32.1 IKBKE rs41298997 Intronic: IKBKE 2.37 × 10⁻⁸ T 1.132 Up to 11,988/275,334
2p16.1 FLJ16341, REL rs62149416 Intronic: FLJ16341 1.8 x 10⁻¹⁷ T 1.171 10,588/22,806
2p15 B3GNT2 rs10865331 Intergenic 4.7 x 10⁻¹⁰ A 1.121 10,588/22,806
2q24.2 KCNH7, IFIH1 rs17716942 Intronic: KCNH7 3.3 x 10⁻¹⁸ T 1.271 10,588/22,806
3p24.3 PLCL2 rs4685408 Intronic: PLCL2 8.58 x 10⁻⁹ G 1.123 15,295/27,578
3q11.2 TP63 rs28512356 400bp 3' of TP63 4.31 x 10⁻⁸ C 1.175 3,496/5,186
3q12.3 NFKBIZ rs7637230 Intronic: RP11-221J22.1 2.07 x 10⁻⁹ A 1.143 15,295/27,578
ⱡ The most recently reported GWAS index SNP in each locus at genome wide significance (p-value ≤ 5 x 10⁻⁸), excluding any secondary signals in the locus
1 (Tsoi, Spain et al. 2012); 2 (Tsoi, Stuart et al. 2017); 3 (Tsoi, Spain et al. 2015); 4 (Bowes, Budu-Aggrey et al. 2015); 5 (Yin, Low et al. 2015)

86
Table 15 | Non-MHC PSO susceptibility loci identified by association studies in the European population (Adapted by (Ray-Jones, Eyre et al. 2016))
Locus Notable gene(s) Index SNPⱡ Index SNP annotation P-value Risk
allele
OR Sample size
cases/controls
5p13.1 PTGER4, CARD6 rs114934997 Intergenic 1.27 x 10⁻⁸ C 1.173 15,295/27,578
5q15 ERAP1, LNPEP rs27432 Intronic: ERAP1 1.9 x 10⁻²⁰ A 1.201 10,588/22,806
5q31 IL13, IL4 rs1295685 3'-UTR: IL13 3.4 x 10⁻¹⁰ G 1.181 10,588/22,806
5q33.1 TNIP1 rs2233278 5'-UTR: TNIP1 2.2 x 10-42 C 1.591 10,588/ 22,806
5q33.3 IL12B rs12188300 Intergenic 3.2 x 10-53 T 1.581 10,588/22,806
6p25.3 EXOC2, IRF4 rs9504361 Intronic: EXOC2 2.1 x 10⁻¹¹ A 1.121 10,588/22,806
6p22.3 CDKAL1 rs4712528 Intronic: CDKAL1 8.4 x 10⁻¹¹ C 1.166 9,293/13,670
6q21 TRAF3IP2 rs33980500 Missense: TRAF3IP2 4,2 x 10-45 T 1.521 10,588/22,806
6q23.3 TNFAIP3 rs582757 Intronic: TNFAIP3 2.2 x 10⁻²⁵ C 1.231 10,588/22,806
6q25.3 TAGAP rs2451258 Intergenic 3.4 x 10⁻⁸ C 1.121 10,588/22,806
7p14.1 ELMO1 rs2700987 Intronic: ELMO1 4.3 x 10⁻⁹ A 1.111 10,588/22,806
9p21.1 DDX58 rs11795343 Intronic: DDX58 8.4 x 10⁻¹¹ T 1.111 10,588/22,806
9q31.2 KLF4 rs10979182 Intergenic 2.3 x 10⁻⁸ A 1.121 10,588/22,806
9q32 TNFSF15 rs6478108 Intronic: TNFSF15 1.50 x 10⁻⁸ C 1.107 11,861/28,610
10q21.2 ZNF365 rs2944542 Intronic: ZNF365 1.76 × 10⁻⁸ G 1.082 Up to 11,988/275,334
10q22.2 CAMK2G, FUT11 rs2675662 Intronic: CAMK2G 7.35 x 10⁻⁹ A 1.123 15,295/27,578
10q22.3 ZMIZ1 rs1250544 Intronic: ZMIZ1 3.53 x 10⁻⁸ G 1.168 8,644/15,055
ⱡ The most recently reported GWAS index SNP in each locus at genome wide significance (p-value ≤ 5 x 10⁻⁸), excluding any secondary signals in the locus
1 (Tsoi, Spain et al. 2012); 2 (Tsoi, Stuart et al. 2017); 3 (Tsoi, Spain et al. 2015); 4 (Bowes, Budu-Aggrey et al. 2015); 5 (Yin, Low et al. 2015); 6 (Stuart, Nair et al. 2015);
7 (Dand, Mucha et al. 2017); 8 (Ellinghaus, Ellinghaus et al. 2012)

87
Table 15 | Non-MHC PSO susceptibility loci identified by association studies in the European population (Adapted by (Ray-Jones, Eyre et al. 2016))
Locus Notable gene(s) Index SNPⱡ Index SNP annotation P-value Risk
allele
OR Sample size
cases/controls
10q23.31 PTEN, KLLN, SNORD74 rs76959677 Intergenic 2.75 × 10⁻⁸ G 1.282 Up to 11,988/ 275,334
10q24.31 CHUK rs61871342 Intronic: BLOC1S2 1.56 × 10⁻⁹ G 1.102 Up to 11,988/ 275,334
11q13 RPS6KA4, PRDX5 rs694739 256bp 5' of AP003774.1 3.71 x 10⁻⁹ A 1.128 8,644/ 15,055
11q13.1 CFL1, FIBP, FOSL1 rs118086960 Intronic: CFL1 6.89 × 10⁻⁹ T 1.122 Up to 11,988/ 275,334
11q22.3 ZC3H12C rs4561177 1.7kb 5' of ZC3H12C 7.7 x 10⁻¹³ A 1.141 10,588/ 22,806
11q24.3 ETS1 rs3802826 Intronic: ETS1 9.5 x 10⁻¹⁰ A 1.121 10,588/ 22,806
12p13.2 KLRK1, KLRC4 rs11053802 Intronic: KLRC1 4.17 × 10⁻⁹ T 1.112 Up to 11,988/ 275,334
12q13.3 IL-23A, STAT2 rs2066819 Intronic: STAT2 5.4 x 10⁻¹⁷ C 1.391 10,588/ 22,806
12q24.12 BRAP, MAPKAPK5 rs11065979 Intergenic 1.67 × 10⁻⁸ T 1.082 Up to 11,988/ 275,334
12q24.31 IL31 rs11059675 Intronic: LRRC43 1.50 × 10⁻⁸ A 1.102 Up to 11,988/ 275,334
13q14.11 COG6 rs34394770 Intronic: COG6 2.65 x 10⁻⁸ T 1.165 3,496/5,186
13q14.11 LOC144817 rs9533962 within LOC144817 1.93 x 10⁻⁸ C 1.145 3,496/5,186
13q32.3 UBAC2, RN7SKP9 rs9513593 Intronic: UBAC2 3.60 × 10⁻⁸ G 1.122 Up to 11,988/ 275,334
14q13.2 NFKBIA rs8016947 Intronic: RP11-56B11.3 2.5 x 10⁻¹⁷ G 1.162 10,588/ 22,806
14q32.2 RP11-61O1.1 rs142903734 Intronic: RP11-61O1.1 7.15 × 10⁻⁹ AAG 1.122 Up to 11,988/ 275,334
15q13.3 KLF13 rs28624578 Intronic: KLF13 9.22 × 10⁻¹⁰ T 1.182 Up to 11,988/ 275,334
ⱡ The most recently reported GWAS index SNP in each locus at genome wide significance (p-value ≤ 5 x 10⁻⁸), excluding any secondary signals in the locus
1 (Tsoi, Spain et al. 2012); 2 (Tsoi, Stuart et al. 2017); 3 (Tsoi, Spain et al. 2015); 4 (Bowes, Budu-Aggrey et al. 2015); 5 (Yin, Low et al. 2015); 6 (Stuart, Nair et al. 2015);
8 (Ellinghaus, Ellinghaus et al. 2012)

88
Table 15 | Non-MHC PSO susceptibility loci identified by association studies in the European population (Adapted by (Ray-Jones, Eyre et al. 2016))
Locus Notable gene(s) Index SNPⱡ Index SNP annotation P-value Risk
allele
OR Sample size
cases/controls
16p13.13 PRM3, SOCS1 rs367569 1.6kb 3' of PRM3 4.9 x 10⁻⁸ C 1.131 10,588/ 22,806
16p11.2 FBXL19, PRSS53 rs12445568 Intronic: STX1B 1.2 x 10⁻¹⁶ C 1.161 10,588/ 22,806
17q11.2 NOS2 rs28998802 Intronic: NOS2 3.3 x 10⁻¹⁶ A 1.221 10,588/ 22,806
17q21.2 PTRF, STAT3, STAT5A/B rs963986 Intronic: PTRF 5.3 x 10⁻⁹ C 1.151 10,588/ 22,806
17q25.1 TRIM47, TRIM65 rs55823223 Intronic: TRIM65 1.06 × 10⁻⁸ A 1.152 Up to 11,988/ 275,334
17q25.3 CARD14 rs11652075 Missense: CARD14 3.4 x 10⁻⁸ C 1.111 10,588/ 22,806
18p11.21 PTPN2 rs559406 Intronic: PTPN2 1.19 × 10⁻¹⁰ G 1.102 Up to 11,988/ 275,334
18q21.2 POL1, STARD6, MBD2 rs545979 Intronic: POL1 3.5 x 10⁻¹⁰ T 1.121 10,588/ 22,806
19p13.2 TYK2 rs34536443 Missense: TYK2 9.1 x 10⁻³¹ G 1.881 10,588/ 22,806
19p13.2 ILF3, CARM1 rs892085 Intronic: QTRT1 3 x 10-17 A 1.171 10,588/ 22,806
19q13.33 FUT2 rs492602 Synonymous: FUT2 6.57 × 10⁻¹³ G 1.112 Up to 11,988/ 275,334
20q13.13 RNF114 rs1056198 Intronic: RNF114 1.5 x 10⁻¹⁴ C 1.161 10,588/ 22,806
21q22 RUNX1 rs8128234 Intronic: RUNX1 3.74 x 10⁻⁸ T 1.175 3,496/ 5,186
22q11.21 UBE2L3, YDJC rs4821124 1kb 3' of UBE2L3 3.8 x 10⁻⁸ C 1.131 10,588/ 22,806
ⱡ The most recently reported GWAS index SNP in each locus at genome wide significance (p-value ≤ 5 x 10⁻⁸), excluding any secondary signals in the locus
1 (Tsoi, Spain et al. 2012); 2 (Tsoi, Stuart et al. 2017); 3 (Tsoi, Spain et al. 2015); 4 (Bowes, Budu-Aggrey et al. 2015); 5 (Yin, Low et al. 2015); 6 (Stuart, Nair et al. 2015);
8 (Ellinghaus, Ellinghaus et al. 2012)

89
Table 16 | Non-MHC PSO susceptibility loci identified by association studies in the Chinese population (Adapted by (Ray-Jones, Eyre et al. 2016))
Locus Notable gene(s) Index SNPⱡ Index SNP annotation P-value Risk
allele
OR Sample size
cases/controls
1p36.3 MTHFR rs2274976 Missense: MTHFR 2.33 x 10⁻¹⁰ G 1.211 11,245/11,177
1p36 IL-28RA rs4649203 5.5kb 5' of IL-28RA 9.74 x 10⁻¹¹ A 1.192 8,339/12,725
1p36.11 ZNF683 rs10794532 Missense: ZNF683 4.18 x 10⁻⁸ A 1.111 11,245/11,177
1p31.3 IL-23R chr1: 67,421,184
(build hg18)
Nonsynonymous: IL-23R 1.94 x 10⁻¹¹ G 1.283 10,727/10,582
1p31.3 C1orf141 rs72933970 Missense: C1orf141 1.23 x 10⁻⁸ G 1.161 11,245/11,177
1q21.3 LCE3B, LCE3D rs10888501 175bp 3' of LCE3E 6.48 x 10⁻¹³ A 1.141 11,245/11,177
1q22 AIM2 rs2276405 Stop-gained: AIM2 3.22 x 10⁻⁹ G 1.171 11,245/11,177
2q12.1 IL1RL1 rs1420101 Intronic: IL1RL1 1.71 x 10⁻¹⁰ G 1.121 11,245/11,177
2q24.2 KCNH7, IFIH1 rs13431841 Intronic: IFIH1 2.96 x 10⁻⁹ G 1.174 15,207/17,103
3q13 CASR rs1042636 Missense: CASR 1.88 x 10⁻¹⁰ A 1.091 11,245/11,177
3q26.2-q27 GPR160 rs6444895 Intronic: GPR160 1.44 x 10⁻¹² G 1.111 11,245/11,177
4q24 NFKB1 rs1020760 Intronic: NFKB1 2.19 x 10⁻⁸ G 1.124 15,207/17,103
5q14 ZFYVE16 rs249038 Missense: ZFYVE16 2.14 x 10⁻⁸ G 1.161 11,245/11,177
5q15 ERAP1, LNPEP rs27043 Intronic: ERAP1 6.50 x 10⁻¹² G 1.134 15,207/17,103
ⱡ The most recently reported GWAS index SNP in each locus at genome wide significance (p-value ≤ 5 x 10⁻⁸), excluding any secondary signals in the locus
1 (Zuo, Sun et al. 2015); 2 (Cheng, Li et al. 2014); 3 (Tang, Jin et al. 2014); 4 (Sheng, Jin et al. 2014)
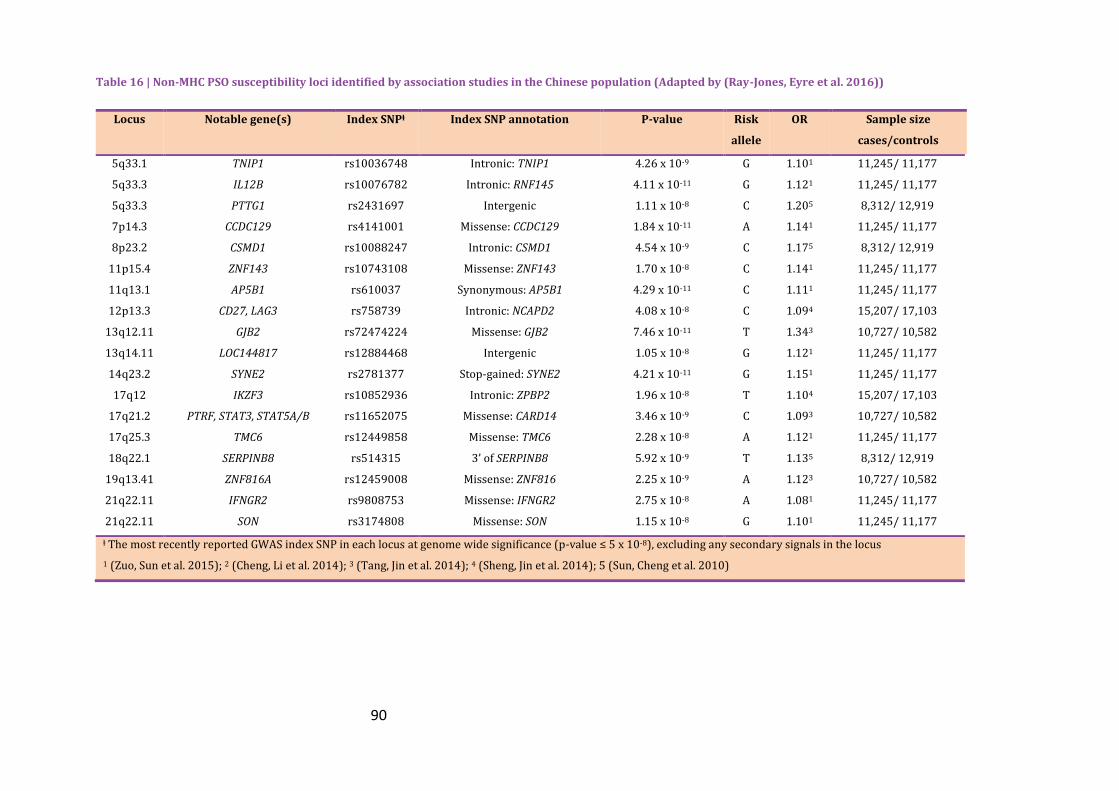
90
Table 16 | Non-MHC PSO susceptibility loci identified by association studies in the Chinese population (Adapted by (Ray-Jones, Eyre et al. 2016))
Locus Notable gene(s) Index SNPⱡ Index SNP annotation P-value Risk
allele
OR Sample size
cases/controls
5q33.1 TNIP1 rs10036748 Intronic: TNIP1 4.26 x 10⁻⁹ G 1.101 11,245/ 11,177
5q33.3 IL12B rs10076782 Intronic: RNF145 4.11 x 10⁻¹¹ G 1.121 11,245/ 11,177
5q33.3 PTTG1 rs2431697 Intergenic 1.11 x 10⁻⁸ C 1.205 8,312/ 12,919
7p14.3 CCDC129 rs4141001 Missense: CCDC129 1.84 x 10⁻¹¹ A 1.141 11,245/ 11,177
8p23.2 CSMD1 rs10088247 Intronic: CSMD1 4.54 x 10⁻⁹ C 1.175 8,312/ 12,919
11p15.4 ZNF143 rs10743108 Missense: ZNF143 1.70 x 10⁻⁸ C 1.141 11,245/ 11,177
11q13.1 AP5B1 rs610037 Synonymous: AP5B1 4.29 x 10⁻¹¹ C 1.111 11,245/ 11,177
12p13.3 CD27, LAG3 rs758739 Intronic: NCAPD2 4.08 x 10⁻⁸ C 1.094 15,207/ 17,103
13q12.11 GJB2 rs72474224 Missense: GJB2 7.46 x 10⁻¹¹ T 1.343 10,727/ 10,582
13q14.11 LOC144817 rs12884468 Intergenic 1.05 x 10⁻⁸ G 1.121 11,245/ 11,177
14q23.2 SYNE2 rs2781377 Stop-gained: SYNE2 4.21 x 10⁻¹¹ G 1.151 11,245/ 11,177
17q12 IKZF3 rs10852936 Intronic: ZPBP2 1.96 x 10⁻⁸ T 1.104 15,207/ 17,103
17q21.2 PTRF, STAT3, STAT5A/B rs11652075 Missense: CARD14 3.46 x 10⁻⁹ C 1.093 10,727/ 10,582
17q25.3 TMC6 rs12449858 Missense: TMC6 2.28 x 10⁻⁸ A 1.121 11,245/ 11,177
18q22.1 SERPINB8 rs514315 3’ of SERPINB8 5.92 x 10⁻⁹ T 1.135 8,312/ 12,919
19q13.41 ZNF816A rs12459008 Missense: ZNF816 2.25 x 10⁻⁹ A 1.123 10,727/ 10,582
21q22.11 IFNGR2 rs9808753 Missense: IFNGR2 2.75 x 10⁻⁸ A 1.081 11,245/ 11,177
21q22.11 SON rs3174808 Missense: SON 1.15 x 10⁻⁸ G 1.101 11,245/ 11,177
ⱡ The most recently reported GWAS index SNP in each locus at genome wide significance (p-value ≤ 5 x 10⁻⁸), excluding any secondary signals in the locus
1 (Zuo, Sun et al. 2015); 2 (Cheng, Li et al. 2014); 3 (Tang, Jin et al. 2014); 4 (Sheng, Jin et al. 2014); 5 (Sun, Cheng et al. 2010)

91
PsA 1.3.6.3.2
HLA-Cw6 has also been found to be associated with PsA (Lopez-Larrea, Torre Alonso
et al. 1990; Chandran, Bull et al. 2013) with Eder et al. showing that the frequency of
this allele to be lower in patients with PsA compared with patients with PSO-only;
although both cohorts harboured a higher frequency of the allele compared with the
controls (Eder, Chandran et al. 2012). Ho et al. also reported that HLA-Cw6 allele was
strongly associated with both PsA, only in patients with type 1 PSO, and PSO (Ho,
Barton et al. 2008). A recent study tried to assess the “paradoxical” finding of HLA-Cw6
being protective of PsA among PSO patients comparing 2808 patients with PSO
without arthritis, 1945 PsA cases and 8920 controls and by controlling for the age of
onset of PSO, found no significant association of PsA to the allele; instead PsA was
significantly associated with amino acid 97 of HLA-B (Bowes, Ashcroft et al. 2017).
Aside from HLA-Cw6, studies have provided evidence of other HLA associations. The
frequency of HLA-B*38, B*08 and B*39 has been found significantly elevated in PsA
compared to PSO alone (Eder, Chandran et al. 2012; Winchester, Minevich et al.
2012). In addition, data from large scale fine-mapping study consisting of GWAS and
Immunochip datasets reported other HLA-C alleles along with HLA-A and HLA-B
alleles (Okada, Han et al. 2014). The HLA genes play a significant role in antigen
presentation and T-cell signalling and alteration of the signalling pathways can lead to
inappropriate targeting and destruction of cells; thus contributing to the pathogenesis
of PsA (O'Rielly and Rahman 2014).
In PsA, a small number of GWAS have been published, most of which included patients
with PSO as well. Liu et al. performed a GWAS with 223 PSO cases (91 had PsA) and
519 controls for the “discovery” phase and then the results were replicated in a UK
cohort of 576 PsA cases (Liu, Helms et al. 2008). They showed that MHC is a major
factor in PsA susceptibility and they confirmed the associations with IL23 and IL12B.
Finally a novel region on chromosome 4q27 for PsA was revealed which harbors genes
for IL2 and IL21 cytokines. It should be noted that the findings of this study did not
reach the genome-wide significance threshold (<5x10⁻⁸) probably because of its small
sample size. Nair et al. found by genotyping SNPs that were strongly correlated with
PsA in a PSO cohort, three genes to be significantly associated with PsA susceptibility
(HLA-C, IL12B, TNIP1). Moreover, an association was detected with TNFAIP3, IL13,
92
IL23A, TSC1 and SMARCA4 but did not reach genome-wide significance (Nair, Duffin et
al. 2009). The association of TNIP1 was confirmed by Bowes et al. in 1057 PsA patients.
They also showed convincing evidence of association with IL23A and nominal evidence
with TNFAIP3 and TSC1 (Bowes, Orozco et al. 2011). These findings show the
involvement of NF-κB and IL-23 signaling in the pathogenesis of PsA which are key
effectors of the adaptive and innate immunse responses. Furthermore, the association
of IL13 with PsA was confirmed in a study including 1,057 PsA patients and 778 type 1
PSO cases (Bowes, Eyre et al. 2011). IL23 encondes an imunoregulatory cytokine that
inhibits inflammation by down-regulating macrophage activity.
The study published by Huffmeier et al., was the first GWAS solely focused on PsA and
involved 609 PsA cases and 990 healthy controls. Not only did it confirm the
association with HLA-C and IL12B, but it detected and replicated the associations with
three polymorphisms at the TRAF3IP2 locus. TRAF3IP2 gene is involved in the
regulation of the adaptive immune system (Huffmeier, Uebe et al. 2010). It codes for
Act1 which is the connection between adaptive immune responses mediated by IL-17
and NF-κB innate pathway, controlling the transcription of a range of pro-inflammatory
cytokines (Hoffmann and Baltimore 2006). Another study after performing stratified
analysis in the dataset to include only PsA cases (1922 PsA patients compared to 8037
controls) confirmed the association of TRAF3IP2 with PsA, suggesting a shared
susceptibility with PSO (Ellinghaus, Ellinghaus et al. 2010).
In 2012, Ellinghaus et al. carried a genome-wide meta-analysis using PsA data (535
cases) from their previous study, Nair et al. and from an independent Canadian study.
A significant association was found between PsA and variants at the REL gene which is
stronger than the association found with PSO (Ellinghaus, Stuart et al. 2012).
In 2013, further analysis was conducted on 17 SNPs that were not significantly
associated with PsA in the study by Huffmeier et al., including independent cohorts of
1398 PsA cases and 6389 controls (Apel, Uebe et al. 2013). The only variant that
reached genome-wide significance, when combining the original GWAS dataset with
the replication study, was rs4649038 in the RUNX3 region. RUNX3 encodes a
transcription factor that promotes the differentiation of T-cells to CD8+ T cells which
predominate in the synovial fluid of PsA patients (Costello, Bresnihan et al. 1999).

93
In 2015, a meta-analysis of 3061 PsA cases that included PSO cases as well reported
three novel association signals at the IFNLR1 gene, the IFIH1 and the NFKBIA gene locus
(Stuart, Nair et al. 2015). Regarding the IFH1 gene, a recent study (Budu-Aggrey,
Bowes et al. 2017) using the exome chip discovered a rare coding allele that is
protective for PsA and it is independent from the variant reported by Stuart et al.
Finally, Bowes et al. using the Immunochip genotyping array and by including 1962 cases
and 8923 controls reported a novel association at chromosome 5q31 and seven loci
which have confirmed association with PSO too. These are IL23R, TNIP1, IL12B, HLA-B
and HLA-C, TRAF3IP2, STAT2 and IL23A and TYK2 and shed more light to the
importance of pathways involved in susceptibility to PsA (Bowes, Budu-Aggrey et al.
2015).
The common risk loci that have been identified for both PSO and PsA emphasize the
genetic overlap between the two diseases, as well as the shared underlying pathways
involved in their pathogenesis illustrating that the PSO experienced by patients with
PsA is genetically similar to cutaneous-only PSO.
PsA-specific risk loci 1.3.6.3.3
Although both diseases share a large genetic overlap, the fact that PsA has a higher
genetic burden as discussed in 1.3.6.2 suggests the existence of PsA-specific risk loci.
Among the HLA alleles, HLA-B27 has been reported to be a genetic marker for PsA
(Eder, Chandran et al. 2012), a finding that was reported in previous studies
(Gladman, Anhorn et al. 1986). In addition HLA-B*08 and HLA-B*38 have been
suggested to be PsA-specific and HLA-B*39 a potential risk allele for axial PsA (Eder,
Chandran et al. 2012). In another study three independent effects were identified in
HLA-C*0602, HLA-B and HLA-A*0201 (Bowes, Budu-Aggrey et al. 2015). However, a
more recent study revealed that the age of onset of PSO confounds the HLA
associations when comparing PsA with PSO patients. After controlling for age, the
HLA-C*0602 was no longer significantly associated with PsA; instead, the amino acid at
position 97 of HLA-B was associated with PsA (Bowes, Ashcroft et al. 2017).
Moreover the Glu at HLA-B position 45 confers risk of PsA and the fact that HLA-B27,
HLA-B38 and HLA-B39 carry Glu at position 45 indicates the more significant
association of these alleles with PsA (Okada, Han et al. 2014). However, in the MHC

94
region it is difficult to detect specific risk loci for these two correlated phenotypes
because of its extensive LD.
Outside of the MHC region, a number of loci have been stated to have larger effects in
PsA, such as variants in TRAF3IP2, REL and FBXL19 (Ellinghaus, Ellinghaus et al. 2010;
Huffmeier, Uebe et al. 2010; Nair, x..c. et al. 2013). In addition a number of studies
have suggested the IL13 gene as a potential marker of PsA (Duffin, Freeny et al. 2009;
Bowes, Orozco et al. 2011; Eder, Chandran et al. 2011). However, PSO studies have
reported an association with the same genetic variant too (Genetic Analysis of
Psoriasis, the Wellcome Trust Case Control et al. 2010; Tsoi, Spain et al. 2012). An
Immunochip study, reported a novel PsA-specific association at chromosome 5q31
which is independent of the IL13 PSO-associated SNP and the functional annotation
identified SLC22A5 as the candidate gene (Bowes, Budu-Aggrey et al. 2015). The same
study revealed a distinct PsA-associated variant at locus IL23R (rs12044149). The same
SNP was replicated at a different population confirming its independence of the PSO-
associated variant (rs9988642) (Budu-Aggrey, Bowes et al. 2016). Finally, the
rs2476601 variant at PTPN22 has been reported for the first time to be PsA-specific
(Bowes, Loehr et al. 2015).

95
Overall aims and objectives 1.4
This project aims to improve understanding of the aetiology of PsA by using a wide
range of statistical methods to identify environmental, lifestyle and genetic PsA specific
risk factors. In addition, assessing which comorbidities are prevalent in both PSO and
PsA and in other musculoskeletal diseases can shed some light on the shared biological
mechanisms underlying these disorders. These aims will be achieved by applying a
number of established methods along with some novel pleiotropic techniques to data
collected as part of the UK Biobank, in-house PsA genetic data and GWAS summary
statistics data from other musculoskeletal disorders such as RA, SLE, AS and juvenile
idiopathic arthritis (JIA).
In order to achieve this, known environmental risk factors and prevalent comorbidities
will be identified in both PSO and PsA compared to the healthy population using the
UK Biobank. In parallel, the association of prevalent comorbidities in PSO, PsA and
other musculoskeletal diseases will be assessed. Then, using genome-wide summary
statistics of other musculoskeletal diseases and statistical methods that exploit the
pleiotropy among traits potential disease risk loci will be investigated. Finally, bi-
directional Mendelian Randomization (MR) analysis will be performed between PsA and
the significant risk factors found to identify any possible causative relationship and its
direction of effect.
Outline of thesis 1.5
The rest of the thesis is presented in four chapters; the second chapter presenting two
different studies with the first being focused on the environmental factors that are
associated with both PSO and PsA and the prevalent comorbidities found in these
diseases, and the second study on investigating the prevalent comorbidities in
additional musculoskeletal diseases and their effect on physical activity. The third
chapter presents the application of statistical methods that exploit the phenomenon of
pleiotropy applied to PsA, RA, SLE, AS and JIA. The forth chapter investigates the
causal role of environmental factors identified in chapter 2 on PsA onset and vice
versa, using MR, and the final discussion chapter brings together all three results
chapters; environmental, genetic, causality via MR, to discuss insights into the
pathogenesis of PsA.

96

97
Chapter2
Environmental risk factors
2
Introduction 2.1
The onset of PsA and PSO is influenced by the individual‘s genetic predisposition and
the influence of environmental and lifestyle factors (Chandran 2010). A number of
environmental exposures have been identified as potential risk factors (Ogdie and
Gelfand 2015) for PsA in patients with PSO and include smoking and alcohol
consumption, BMI and trauma (both physical and psychological).
Previous studies suggest that various comorbidities including CVDs (Gelfand, Neimann
et al. 2006; Husted, Thavaneswaran et al. 2011), metabolic abnormalities (Haroon,
Gallagher et al. 2014) and depression (McDonough, Ayearst et al. 2014) are more
prevalent in PSO and PsA leading to a diminished health-related quality of life (de
Korte, Sprangers et al. 2004). In addition, patients with arthritis often find chronic pain
and fatigue more debilitating than comorbidities affecting their everyday life (Rosen,
Mussani et al. 2012). This is not unique to PSO and PsA; patients with all types of
inflammatory arthritis such as RA, AS and SLE, also experience similar comorbidities
and more pain and fatigue. However, there is a lack of studies comparing the
prevalence and incidence of comorbidities across these rheumatic diseases. In addition,
there is some evidence that patients are less physically active compared to the general
population but it is unclear how that relates to comorbidities (cause or effect) and the
contribution of comorbidities to physical inactivity has not been investigated in detail.

98
UK Biobank 2.1.1
Overview and aim 2.1.1.1
The UK Biobank is a large-scale national health resource established by the Wellcome
Trust medical charity, Medical Research Council, Department of Health, Scottish
Government and the Northwest Regional Development Agency. It is hosted by the
University of Manchester and it is also funded by the Welsh Assembly Government,
British Heart Foundation and Diabetes UK. Its main goal is to collect population level
data to facilitate epidemiological studies to assess the causes of a wide range of medical
conditions including cancer, PSO, diabetes, CVDs and dementia. It is also a valuable
resource to investigate susceptibility factors for particular diseases because it has
included thousands of participants who have completed detailed health, activity,
medical, medication and demographic questionnaires and have provided biological
samples; it is therefore possible to identify individuals with specific diseases, thus
providing enough statistical power to address questions about the risk factors and the
morbidities that co-exist with each disease.
Ethical Approval 2.1.1.2
The UK Biobank has been approved by the North West Multi-centre Research Ethics
committee (MREC) in the UK, by the National Information Governance Board for
Health and Social Care (NIGB) and by the Community Health Index Advisory Group
(CHIAG) in Scotland. Moreover, all participants provided written informed consent.
Access to UK Biobank data was provided to the Centre for Musculoskeletal Research
following submission of a study proposal.
Study design and patient recruitment 2.1.1.3
The UK Biobank is a prospective study of British participants with good representation
across the UK, aged 37-73 that were voluntarily recruited from 2006-2010.
Participants were identified from their National Health System records and an
invitation was sent to them. After confirmation of attendance, a pre-visit questionnaire
was mailed to the volunteers to record information that could be easily forgotten such
as medication, family medical history and surgeries. Twenty two assessment centres
(Figure 7) were used, which were located within ten miles from areas with sufficient
population in the preferred age range. Each centre recruited volunteers for a six
month to one year period before relocating to another area.

99
Figure 7 | Locations of the 22 assessment centres in the UK 1.Edinburgh, 2.Glasgow, 3.Newcastle-upon-Tyne, 4.Middlesborough, 5.Leeds, 6.Bury, 7.Manchester, 8.Altrincham, 9.Liverpool, 10.Sheffield, 11.Nottingham, 12.Stoke-on-Trent, 13.Birmingham, 14.Oxford, 15.Bristol, 16.Reading, 17.London, 18.Hounslow, 19.Croydon, 20.Cardiff, 21.Swansea, 22.Wrexham
Data collection 2.1.1.4
Baseline data 2.1.1.4.1
Lifestyle, environmental information and medical history were collected through a
computer-based, self-completed questionnaire and follow-up interview conducted by a
research nurse. In addition, physical measurements and biological samples were
collected at the first assessment visit (Appendix Table 1).

100
The baseline questionnaire was designed based on:
known and potential environmental risk exposures for disorders that are
prevalent in the adult population
current knowledge about risk factor-disease relationships
the importance of each disease
the reliability of the questionnaire measures
a prevalence of exposures of at least 15%.
The baseline questions can be categorised into:
sociodemographics
lifestyle exposures including dietary habits, smoking and alcohol consumption
and physical activity
psychological and cognitive state
family history and early childhood exposures
medical history and general health.
The questions were identified by previous questionnaires used in studies and were
reviewed by experts.

101
Aims and objectives 2.2
The work described in this chapter is comprised of two independent studies using UK
Biobank data.
Aims and objectives of first study 2.2.1
Aim 2.2.1.1
The aim of the first study was twofold:
1. To investigate the association of known environmental factors with the
prevalence of PsA and PSO
2. To identify the association of prevalent comorbidities with disease status.
Objectives 2.2.1.2
Create three distinct study cohorts; the PsA cohort, the PSO without arthritis
cohort and the controls using the UK Biobank participants
Perform regression analysis to identify the environmental factors that are
associated with the disease status compared to controls
Perform regression analysis to identify the prevalent comorbidities in both PsA
and PSO without arthritis and compare rates between groups.
Aim and objectives of second study 2.2.2
Aim 2.2.2.1
The second study aimed:
1. To identify any associations between known prevalent comorbidities and
rheumatic diseases, including RA, PsA, AS and SLE
2. To evaluate the contribution of these comorbidities to the physical activity
levels of patients with a rheumatic disease.
Objectives 2.2.2.2
Create the study cohorts; the RA, the PsA, the AS, the SLE and the controls
using the UK Biobank participants
Create an algorithm that would identify and correct misspelling medication
reported by participants during the interview and recorded as free text

102
Determine the prevalence and the incidence rates of comorbidities in these
types of inflammatory arthritis compared to people without a rheumatic
disease
Perform a sensitivity analysis comparing the prevalence of comorbidities in
participants with each self-reported rheumatic disease and taking DMARDs to
those without a rheumatic disease
Create a modified functional comorbidity index based on the physical function
domain of the 36-item Short Form Health Survey (SF-36).
Determine whether the prevalent comorbidities are associated with physical
activity among patients with a rheumatic disease using the above mentioned
index.
Contribution of the candidate 2.3
The candidate (EB) was not involved in the acquisition of data for the UK Biobank.
However, for the first study the data preparation, the planning, statistical analysis and
interpretation of the results were performed by EB.
For the second study, the estimation of the prevalence and creation of the misspelling
algorithm were performed by the candidate (EB). Additional analysis was performed by
Michael Cook, a research assistant at the Arthritis Research UK Centre for
Epidemiology.

103
Methods 2.4
Identifying lifestyle factors and comorbidities associated with PSO 2.4.1
without arthritis and PsA compared to the general population
Defining the study design 2.4.1.1
For the purpose of the current study, a cross-sectional study design was used (see
1.2.2.4 and Table 1).
Defining the study population 2.4.1.2
Participants were included in the analysis if they self-reported a diagnosis of PsA or
PSO when answering the touch-screen question “Has a doctor ever told you that you
have any other serious medical conditions or disabilities” or during the follow-up interview
with the research nurse.
For the purpose of this study three cohorts were created:
The PsA cohort which included the participants having been diagnosed with
PsA
The PSO only group was defined as participants with PSO who had not
reported any type of arthritis including PsA, AS, RA, SLE and non-specified
arthritis.
The control population was all remaining participants not belonging to the
previous two groups.
Comparisons were performed between these three cohorts in order to assess
whether an association emerged because of the presence of PSO in the PsA cohort or
was specific to PsA.
Identifying lifestyle factors associated with the disease status 2.4.1.3
Environmental risk factors that may potentially trigger disease onset in a susceptible
individual were defined a priori, following a comprehensive review of the literature
(section 1.3.5). The variables selected included the Townsend deprivation index, BMI,
current smoking status, alcohol frequency consumption and fractures or muscle

104
trauma. Information about these lifestyle habits were collected at the baseline
assessment visit during the completion of the computer-based, self-reported
questionnaire.
The postcode of residence was used to estimate the Townsend index, a measure of
area-based deprivation. This index incorporates the following variables; unemployment,
non-car and/or non-home ownership and household overcrowding. Positive value of
the index indicates areas with high deprivation, where zero indicates an area with
mean values. The ethnic background variable is categorised into White, Asian, Black,
Chinese, other and mixed by the UK Biobank. Due to insufficient number of
participants in some categories, all groups except white were clustered together. The
self-reported smoking status was classified as never, previous and current and the
frequency of alcohol intake as never, special occasions only, one to three times a
month, once or twice a week, three or four times a week and daily or almost daily.
For this study, alcohol consumption status was categorised as daily (daily or almost
daily intake), frequent (alcohol intake at least once per week) and low-frequency
(never, special occasions only, one to three times a month), based on the frequency of
alcohol intake. In addition, weight and height were measured and BMI was derived.
Finally, physical activity was measured based on the International Physical Activity
Questionnaire (IPAQ) (Appendix Figure 1). By using the participants’ responses about
the number of days per week and the duration per day that were spent in physical
engagement and processing them according to IPAQ guidelines (Appendix Figure 2),
three categories were created: “low intensity”, “medium intensity” and “high intensity”
physical activity. Table 17 provides further details.

105
Table 17 | Data collection of lifestyle factors by the UK Biobank and their categorisation for the current study
Data-Field Question asked by the UK Biobank Possible answers provided by the UK Biobank Categorisation for current study
Townsend deprivation
index (189)
Townsend deprivation index was
estimated before assessment visit and is
based on postcode of residence.
N/A Used as a continuous variable
Ethnic background
(21000)
“What is your ethnic group?” White
Mixed
Asian or Asian British
Black or Black British
Chinese
Other ethnic group
White background
Other ethnic background
Smoking status
(20116)
“Do you smoke tobacco now and in the
past how often have you smoked tobacco?”
Never
Previous
Current
As categorised by the UK Biobank
Alcohol intake
frequency (1558)
“About how often do you drink alcohol?” Daily or almost daily Daily drinker
Three or four times a week
Once or twice a week Frequent drinker
Once to three times a month
Special occasions only
Never
Low frequency drinker
BMI (21001) BMI was estimated from height and weight
manual measurements during assessment
visit
N/A Used as a continuous variable
N/A: Not Applicable; BMI: Body Mass Index
The number in () is number of the Data-Field used in the UK Biobank data.

106
Table 17 | Data collection of lifestyle factors by the UK Biobank and their categorisation for the current study
Data-Field Question asked by the UK Biobank Possible answers provided by the UK Biobank Categorisation for current study
Fractured/broken
bones in the last 5
years (2463) or
muscle injuries
“Have you ever fractured/broken any
bones in last 5 years?”
Data on muscle injuries were reported
during the interview
Yes
No
Do not know
Prefer not to answer
As categorised by the UK Biobank (Do not know and
prefer not to answer were excluded from the analysis)
Physical activity
(864)
(874)
(884)
(894)
(904)
(914)
“In a typical week, how many days did you
walk for at least 10 minutes at time?”
“How many minutes did you usually spend
walking on a typical day?”
“In a typical week, on how many days did
you do 10 minutes or more of moderate
physical activities like carrying light loads,
cycling at normal pace?”
“How many minutes did you usually spend
doing moderate activities on a typical
day?”
“In an typical week, how many days did
you do 10 or more minutes of vigorous
activity”
“How many minutes did you usually spend
doing vigorous activities on a typical day?”
N/A
N/A
N/A
N/A
N/A
N/A
Using IPAQ guidelines, three categories of physical
activity were used: “low intensity”, “medium intensity”
and “high intensity”
N/A: Not Applicable; IPAQ: International Physical Activity Questionnaire.
The number in () is number of the Data-Field used in the UK Biobank data.

107
Identification of confounders 2.4.1.3.1
The aim of epidemiological studies is to estimate the associations between diseases of
interest and risk factors. This is done by comparing the effect that the risk factor has
on the diseased group versus the healthy cohort. However, there may be other factors
that are related to the exposure and also affect the development of a disease leading
to a distortion in the estimated measurement of the association between exposure and
disease. These factors are called confounding variables and it is essential to account for
them.
There is not a standard, agreed method for determining which variables can act as
confounders. Some investigators decide this by inspecting the data and checking
whether there is a clinically meaningful association between the variable (potential
confounder) and the risk factor and between the variable and the outcome of interest.
Others estimate the difference between the crude (estimation of the association
before adjusting for a confounder) and the adjusted results and the presence of
variation of more than 10% indicates a confounding “phenomenon” (Skelly, Dettori et
al. 2012). Adjusting a statistical model for confounders can be achieved either through
the study design stage or during the statistical analysis. The methods used per stage are
described in Table 18.
In summary, adjusting during the design stage happens before the data gathering and in
registry-based observational studies like the UK Biobank it could be difficult or
insufficient to control for confounding only during the design of the study. In
epidemiological studies, usually many confounders need to be accounted for which
cannot be done with restriction as it could result in very small cohorts; furthermore, it
may not be possible to find control subjects that could be used to match with cases for
the comparisons. It should be noted that controlling during design and through analysis
can be used in the same design, for example case-control matching and multivariable
analysis.
For the current study, the confounder controlling took place at the analysis level using
the multivariable analysis method, described below. Age, sex and ethnic background
were included as confounding variables as is routine for epidemiological studies.

108
Table 18 | Methods for controlling confounding effects in statistical modelling
Stage of the study Method Description Advantages & Disadvantages
Design Restriction Participation in the study of individuals who are similar
according to a confounder
- Difficult to generalise to the rest of the population
Randomization Randomly allocating individuals to exposure categories + Similarly distributed known and unknown confounders for each cohort
being compared
- Use in clinical trials
Matching Selection of controls according to the distribution of
confounders among the cases
- Use in case-control studies
Analysis Stratification Evaluation of association between exposure and disease
within confounder’s different strata where the
confounder does not vary
+ Good for small number of strata and with one or two confounders to control
- Strata with more subjects provide more precise estimation of the
association compared to those with fewer (use of Mantel-Haenszel weighting
method)
Standardisation As different populations of interest may be significantly
different with respect to age and gender, this method
compares age and/or gender specific rates
+ Comprehensive comparison with the increased strata of specific rates
- Used to control for age and gender
- Choice between direct or indirect
- Used for mortality and morbidity rates
- Difficult to use when doing large number of comparisons
Multivariate analysis Evaluation of association between exposure(s) and
disease and controlling for many confounders
+ Good for more than two confounders and for confounders with many
grouping levels to simultaneously handle
- Multicollinearity, linearity, normality must be taken into account
Propensity Score Measurement of probability of an exposure based on
the subject’s observed baseline characteristics
+ Creation of a single score based on all confounders
+ Robust when the outcome is rare
- Exposure must be categorical variable
- Information loss when balancing the comparison groups
109
Statistical analysis 2.4.1.3.2
All data analysis was performed using R statistical analysis software (R Development
Core Team 2008).
2.4.1.3.2.1 Descriptive analysis
All continuous variables were initially analysed using histograms (see Supplementary
data) to assess whether they followed a normal distribution. The non-normal
distributed variables were presented as medians with IQR. The significance between
group differences was examined using the Mann-Whitney U-test for non-normally
distributed variables and the chi-squared test for categorical variables. A two-tailed p-
value<0.05 was considered statistically significant.
2.4.1.3.2.2 Missing data
In observational studies like the UK Biobank it is common to encounter missing data.
Within the dataset however, missing data were minimal. For all the
environmental/lifestyle exposures, <1% was missing (participants who responded “I do
not know” or “Prefer not to answer”); thus by excluding these subjects and performing a
complete-case analysis would not result in a significant loss of statistical power or bias
the results.
2.4.1.3.2.3 Association of lifestyle factors with the prevalence of PSO and PsA
Analysis was performed in two stages. During the initial, “screening stage” logistic
regression analysis was used to create statistical models per environmental factor using
disease status as an outcome and adjusting for age, sex and ethnic background,
referred to as the adjusted model. During this stage, the significant factors that were
associated with disease status were identified by pairwise comparison of all three
cohorts. For the second and final stage of the analysis, three multivariable models were
built with the same outcome variable and the same confounders as in the previous
stage; however, those factors that were found to be statistically significant in that stage
were also included in the model, referred to as the multivariable model.

110
Investigating the association of prevalent comorbidities with disease 2.4.1.4
status
The choice of co-existing morbidities to be investigated was made a priori, after an
extensive literature review as presented in section 1.3.4. During the computer-based
questionnaire, participants were asked if they had ever been diagnosed by a physician
for specific disorders including CVDs, diabetes and pulmonary diseases. The stated
diseases were verified during the following interview.
The CVDs that were analysed in the current study were i) heart attack or myocardial
infarction (MI) ii) angina iii) stroke or transient ischaemic attack (TIA) iv) hypertension
and v) high cholesterol. The last two morbidities do not belong to the CVD category;
rather, they are traditional risk factors for developing CVD. For this analysis, they
were included in the CVDs. The definition of depression was complicated in the UK
Biobank due to the number and content of the questions included in the questionnaire.
For the current study, cases were diagnosed by a specialist or a general practitioner
(GP) either for depression, nerves, tension or anxiety. More specifically, the
participants where characterised as depressed if i) they self-reported ever feeling
depressed or down or uninterested for things they once used to enjoy for at least a
week and ii) the duration of this feeling lasting for at least two weeks and iii) this
episode occurred more than once and iv) they had seen a GP or a psychiatrist for
nerves, anxiety, tension or depression. In case of chronic pain, participants had to have
experienced persistent pain for more than three months in any of the sites listed, such
as headache, back pain, knee pain and pain all over the body to be categorised as
suffering from chronic pain. Finally, participants who reported feeling tired or lacking
energy in the last two weeks at least several days per week were classed as fatigued.
More details about the comorbidities included per disease category and the clustering
used for this study can be found in Table 19. Comorbidities with a frequency of more
than 1% were reported.
Selection of exposure/independent variables 2.4.1.4.1
For assessing the prevalence of co-existing morbidities in PsA and PSO without
arthritis compared to the control group and to each other, disease status (PsA, PSO
without arthritis or healthy controls) was used as the independent variable.

111
Table 19 | Morbidities with their codes included in the current study and categorisation used
Morbidity UK Biobank Codes Categorisation for current
study
Heart attack 6150 heart attack ¥
1075 heart attack/myocardial infraction
Angina 6150 angina ¥
1074 angina
Stroke 6150 stroke ¥
1081 stroke
1082 transient ischaemic attack (TIA)
1083 subdural haemorrhage/haematoma
1086 subarachnoid haemorrhage
1425 cerebral aneurysm
1583 ischaemic stroke
Hypertension 6150 high blood pressure ¥
1065 hypertension
1072 essential hypertension
High cholesterol 1473 high cholesterol
Pulmonary disease 6152 blood clot in the lung,
emphysema/chronic bronchitis,
asthma¥
1093 pulmonary embolism
1111 asthma
1112 chronic obstructive airways disease/copd
1113 emphysema/chronic bronchitis
1114 bronchiectasis 1123 sleep apnoea
1412 bronchitis
1472 emphysema
Diabetes 2443 diabetes ¥
1220 diabetes
1222 type 1 diabetes
1223 type 2 diabetes
1521 diabetes insipidus
Liver disease 1136 liver/biliary/pancreas problem
1155 hepatitis
1156 infective/viral hepatitis
1157 non-infective hepatitis
1158 liver failure/cirrhosis
1506 primary biliary cirrhosis
1578 hepatitis a
1579 hepatitis b
1580 hepatitis c
1581 hepatitis d
1582 hepatitis e
1604 alcoholic liver disease/alcoholic cirrhosis
Fatigue in last 2 weeks 2080 “Over the past two weeks, how often
have you felt tired or had little energy?”
Categorised as fatigued if
participants reported feeling
tired:
several days OR
more than half the
days OR
nearly every day
Gastrointestinal disease 1154 irritable bowel syndrome
1462 Crohn’s disease
1463 ulcerative colitis
¥ computed-based question

112
Table 19 | Morbidities with their codes included in the current study and categorisation
used
Morbidity UK Biobank Codes Categorisation for current
study
Depression 4598 “Ever depressed/down for at least a
whole week?”
4609 “How many weeks was the longest period
when you were feeling
depressed/down?” 4620 “How many periods have you had when
you were feeling depressed/down for
at least a whole week?”
4631 “Have you ever had a time when you
were uninterested in things or unable to
enjoy the things you used to for at least
a whole week?”
5375 “How many weeks was the longest
period when you were uninterested in
things or unable to enjoy the things you
used to?”
5386 “How many periods have you had when
you were uninterested in things or
unable to enjoy the things you used to
for at least a whole week?”
2090 “Have you ever seen a general
practitioner for nerves, anxiety, tension
or depression?”
2100 “Have you ever seen a psychiatrist for
nerves, anxiety, tension or depression?”
Categorised as depressed if
participants:
ever depressed/down for at least a week
AND
at least two weeks
duration AND
at least one episode
AND
ever seen a GP OR a psychiatrist for nerves,
anxiety, tension or
depression
OR
ever uninterested for
things once used to
enjoy AND
at least two weeks duration AND
at least one episode
AND
ever seen a general
practitioner OR a
psychiatrist for nerves,
anxiety, tension or
depression
Chronic pain (more
than three months)
6159 “In the last month have you experienced
any of the following that interfered
with your usual activities?”
Headache, Facial pain, Neck/shoulder
pain, back pain, stomach/abdominal
pain, hip pain, knee pain, pain all over
the body, none of the above
Categorised as having chronic
pain if:
experienced pain in the
last month in any of the
of the sites listed AND
pain persisted more
than three months
3799 “Have you had headaches for more than
three months?”
4067 “Have you had facial pains for more than
three months?”
3404 “Have you had neck/shoulder pain for
more than three months?”
3571 “Have you had back pains for more than
three months?”
3741 “Have you had stomach/abdominal pains
for more than three months?”
3414 “Have you had hip pains for more than
three months?”
3773 “Have you had knee pains for more than
three months?”
2956 “Have you had pains all over your body
for more than three months?”

113
Identification of confounders 2.4.1.4.2
As described in section 2.4.1.3.1, adjustment for confounders was performed during
the statistical multivariable analysis. Potential confounders were selected based on
existing knowledge of clinically meaningful associations between comorbidity outcome
and confounder; for example smoking is known to associate with CVDs and is a
potential confounder. The confounders that were included were age, sex, ethnic
background, Townsend deprivation index, current smoking status, alcohol frequency
consumption and BMI. Furthermore, as duration of existing inflammation in the body
could be a potential confounder it was used to verify the significant associations found
during the analysis. It was estimated using information provided by the participants
about their current age and year of diagnosis with either PSO or PsA.
Statistical analysis 2.4.1.4.3
2.4.1.4.3.1 Descriptive analysis
All comorbidities were classified as categorical variables with factors where 1 indicates
the presence of the comorbidity and 0 the absence. The association of the comorbidity
and outcome was tested using the chi-squared test. A two-tailed p-value<0.05 was
considered statistically significant.
2.4.1.4.3.2 Missing data
A complete-case analysis was performed by excluding participants who had replied “I
don’t know” or “Prefer not to answer” to the relevant questions.
2.4.1.4.3.3 Association of prevalent comorbidities with disease status
To investigate the association between prevalent comorbidities and disease status,
both disease cohorts were compared with the controls and to each other using; firstly,
a univariate logistic regression for assessing the crude ratio, and secondly a
multivariable logistic regression analysis, adjusting for possible confounders including
age, gender, ethnicity, Townsend deprivation index, BMI, current smoking status and
alcohol consumption status.

114
Comorbidities in rheumatic diseases and their effect on physical 2.4.2
activity
Defining the study design 2.4.2.1
The design of this study is a population-based cohort study, in which a case-control
analysis was also performed when the incident cases of comorbidity that developed
after the diagnosis of arthritis were identified.
Defining the study population 2.4.2.2
From the self-reported data during the interview 2.4.2.2.1
Participants who self-reported as having RA, AS, PsA or SLE during their interview
were clustered into the four respective disease cohorts. Participants who reported not
having any medical condition, who reported having non-specified arthritis and those
who reported having more than one form of arthritis were excluded from the study.
For sensitivity analysis purposes, participants were also identified as having one type of
rheumatic disease from their reports during the interview with the research nurse and
whether they were using synthetic or biologic DMARDs. Medications were recorded
during the interview by selecting from a pre-specified list. When a drug was not
included in the list, it was recorded in free-text format. This method led to the
insertion of text varying from one word to many, including drugs with misspelled
names.
The coding of medication is an on-going process by UK Biobank and during the
implementation of the current study the coding of the DMARDs had not been
completed (December 2016). For that reason, an algorithm was developed to
recognise drug names from free text data, either correctly or falsely spelled. The
process included various stages:
Identification of current medications prescribed to patients with rheumatic
diseases from the British National Formulary (musculoskeletal chapter)
Creation of a “dictionary” that included both generic and brand drug names by
downloading an xml version of the majority of the drugs from Drugbank
(www.drugbank.ca)

115
Use of the spellchecking library PyEnchant for Python (www.python.org) to
create a text mining algorithm to correct misspelled medication names.
Briefly, PyEnchant tokenises the free-text sentences to single words and then cross-
references each word to the provided dictionary. If a word is not included in the
dictionary of drugs, the algorithm returns a number of suggestions for the misspelled
word based on the Levenshtein distance between the two words (Haldar and
Mukhopadhyay 2011). The latter is used as a measurement of similarity between two
words, in which distance is the number of deletions, insertions and substitutions
needed to transform a word to another. For example the words “ward” and “world”
have a distance of 2 as it needs a substitute (a to o) and an insertion (the letter l) to
get the second word from the first. If the distance between two words is larger than a
specified threshold, meaning the words are too different, the algorithm does not
provide any suggestions.
Comparison of the prevalence and incidence of comorbidities in 2.4.2.3
rheumatic diseases
Comorbidities investigated 2.4.2.3.1
The comorbidities that were investigated were decided a priori and they were those
that are considered to be more likely to co-exist with rheumatic diseases based on
previous reports (Burner and Rosenthal 2009; Edwards, Cahalan et al. 2011;
Nurmohamed, Heslinga et al. 2015; Doyle and Dellaripa 2017). These were:
Myocardial disorders such as angina and heart attack
Vascular diseases including stroke and hypertension
Pulmonary disease which includes COPD or emphysema or bronchitis
Diabetes
Depression
Identification of incident cases of comorbidity 2.4.2.3.2
In order to identify the incident cases of comorbidities whose onset was after the
diagnosis of arthritis, the age or year of diagnosis was used and the years between
diagnosis of arthritis and comorbidities was estimated.

116
Statistical analysis 2.4.2.3.3
All statistical analyses were performed in R 3.3.2 and Stata V.13.1.
2.4.2.3.3.1 Descriptive analysis
The non-normal distributed continuous variables were presented as medians with IQR
and number of participants (%) for categorical variables. The significance of group
differences with the control group was tested using the Mann-Whitney U-test for the
non-normally distributed variables and the chi-squared (χ2) test for the categorical
variables. A two-tailed p-value<0.05 was considered statistically significant.
2.4.2.3.3.2 Prevalence of comorbidities
For estimating the sex-adjusted and 5-year age band- prevalence and morbidity ratios
(SMRs), indirect standardisation was used. Indirect standardisation is usually used to
estimate the expected mortality rate for the index population, given age specific
mortality rates from a reference population.
The standardised mortality ratio is expressed in ratio and integer (ratio*100) formats
along with a confidence interval. So,
Standardised mortality ratio= 𝑛𝑢𝑚𝑏𝑒𝑟 𝑜𝑓 𝑜𝑏𝑠𝑒𝑟𝑣𝑒𝑑 𝑑𝑒𝑎𝑡ℎ𝑠
𝑛𝑢𝑚𝑏𝑒𝑟 𝑜𝑓 𝑒𝑥𝑝𝑒𝑐𝑡𝑒𝑑 𝑑𝑒𝑎𝑡ℎ𝑠∗ 100 and
Number of expected deaths = ∑ 𝑛𝑖𝑅𝑖𝑘𝑖=1 where
𝑛𝑖 is the person-time for the 𝑖𝑡ℎ study group stratum and 𝑅𝑖 is the reference
population rate for the 𝑖𝑡ℎ stratum.
In the current study, indirect standardisation takes the age- and sex- specific rates from
the standard or reference population and applies them to the corresponding numbers
of people in the age groups in the population of interest. Summing these gives the
total number of events expected in the special population if the age- and sex-specific
rates were the same as in the standard population. Here the standard or reference
population was the control group.
A sensitivity analysis was performed by restricting the inclusion of participants to those
who were classified in one of the rheumatic diseases cohorts and also reported taking
synthetic or biologic DMARD. Prevalence estimates based on less than 10 cases were
not included.

117
2.4.2.3.3.3 Risk of incident comorbidities occurring after arthritis diagnosis
Participants with arthritis were matched to four control participants by age and sex in
order to estimate the risk of incident comorbidities developing after the diagnosis of
arthritis. Then, Cox regression analysis was used for determining the hazard ratio of
developing comorbidities compared to controls. The time of diagnosis of a rheumatic
disease was used as an index date in all cohorts, including the matched controls. The
proportional hazards assumption was assessed using the Schoenfeld Residuals Test.
The latter is used to detect any violation of the Cox model’s assumption in which the
effect of a change in a covariate on the hazard rate of an event occurrence is stable
over time. Incidence estimates based on less than 10 cases were not reported.
Association of prevalent comorbidities and physical activity in 2.4.2.4
rheumatic diseases
Physical activity 2.4.2.4.1
Section 2.4.1.3 and Table 17 describe the categorisation used in the current study.
Creation of a modified functional comorbidity index 2.4.2.4.2
As physical activity is one of the measures of success of a medical intervention (along
with health status and quality of life), adjustment for comorbid conditions is essential in
epidemiological studies. For that reason, a self-administered comorbidity index with
physical activity as the outcome, called SF-36 was developed (Groll, To et al. 2005).
For the current study, a modified version of the SF-36 was used. The index was
created by summing comorbidities including asthma, angina, heart failure, heart attack,
osteoporosis, COPD, neurological disease, stroke, peripheral vascular disease, diabetes
(both types), upper gastrointestinal disease, depression, anxiety, visual and hearing
impairment and degenerative disc disease that correlate with SF-36’s physical function
subscale.
Statistical analysis 2.4.2.4.3
Multinomial logistic regression was used to estimate the association between
comorbidities and physical activity level, controlling for age, sex, BMI, smoking and
alcohol consumption. First, the association between physical activity and comorbidity,
where the modified functional comorbidity index was larger than 0, was investigated in

118
participants with a rheumatic disease compared to those without. Four groups were
studied:
Participants with one of the rheumatic diseases and without any comorbid
disease
Participants with a rheumatic disease and a comorbidity
Participants without rheumatic disease but with a comorbidity
Participants without a rheumatic disease and without a comorbidity (referent
group)
Secondly, the relationship between physical activity and individual comorbidities in the
diseased cohorts was assessed. Finally, the association between physical activity and
the functional comorbidity index in people with one of the four rheumatic diseases was
estimated. The categories of the index were 0, 1-2, 3-4 and ≥5 where higher values
indicate higher comorbidity burden. The proportion of participants with and without
one of the investigated rheumatic diseases who carried out the World Health
Organisation (WHO) recommended amount of physical activity was compared using a
chi-square test.

119
Results 2.5
Identifying lifestyle factors and comorbidities associated with PSO 2.5.1
without arthritis and PsA compared to the general population in the
UK Biobank
Of the 502,643 individuals that participated in UK Biobank, 939 (0.2%) of them self-
reported having been diagnosed by a physician with PsA and 4,991 (1.0%) with PSO
without any type of inflammatory arthritis. Their demographic and clinical
characteristics are shown in .
Table 20.
The median age of the three cohorts was similar; however the prevalence of PSO
without arthritis in the male population was significantly higher compared to the
controls (53.5% vs. 45.5%, respectively, p<0.01). Moreover, the proportion of
participants with white ethnic background was significantly higher for both PsA and
PSO without arthritis (97% and 96.5%, respectively, vs. 94%, p<0.01) and the median
BMI for both disease groups was higher (28.0 and 27.5, respectively) compared to
participants without PSO and/or PsA (26.3). Those who reported PsA were more
likely to be previous smokers (38.1%) but less likely to consume alcohol (frequent
drinker 46.5%, daily drinker 16.3%), whilst those in the PSO-only group were more
likely to be smokers (previous smoker 41.1%, current smoker 16.3%) and daily
drinkers (22.3%) compared to the controls (previous smoker 34.4%, current smoker
10.5%, frequent drinker 48.5%, daily drinker 20.2%). Finally, participants who reported
either PsA or PSO without arthritis were less likely to engage in moderate (41.3% and
42.8%, respectively) or high (20.4% and 23.9%, respectively) intensity physical activity
compared to those without either condition (moderate 43%, high intensity 25.5%).
The most prevalent comorbid conditions in both PsA and PSO without arthritis groups
were chronic pain (67% and 45.4%, respectively) and fatigue (64.6% and 54.1%,
respectively) (.
Table 20). The proportion of patients that reported at least one CVD was 41.2% and
32.7%, respectively, with 2.9% and 3.0% of them having self-reported heart attack, 4.8%

120
and 4.2% angina, 1.7% and 1.9% stroke and 38.8% of those with PsA had hypertension,
whereas 29.7% from the PSO-only group were hypertensive. In addition, the
prevalence of high cholesterol, pulmonary disease, diabetes, chronic depression, liver
disease and gastrointestinal disease in PsA was 13.1%, 13.6%, 6.8%, 6.5%, 2.0% and
15.9%, respectively. In the PSO-only cohort the prevalence of the aforementioned
comorbidities were 13.7%, 14.5%, 6.9%, 7.2%, 1.2% and 17.4%, respectively.
Identifying lifestyle factors associated with the disease status 2.5.1.1
As an initial “screening test”, adjusted analysis using logistic regression was performed
to determine the environmental and lifestyle exposures that are significantly associated
with the prevalence of the two conditions (Table 21, Figure 8). When PsA was
compared to the PSO-only cohort, BMI (OR per unit increase 1.03, 95% CI 1.01-1.04),
smoking status (previous smoker: OR 0.78, 95% CI 0.67-0.91 and current smoker: OR
0.53, 95% CI 0.42-0.67) and alcohol intake frequency (frequent drinker: OR 0.80, 95%
CI 0.68-0.94 and daily drinker: OR 0.61, 95% CI 0.49-0.75) were found to be
statistically significant determinants.
The significant factors found in the adjusted analysis step were included in the final
multivariable logistic regressions. The analysis of lifestyle factors between PsA and the
PSO-only cohort found BMI to be associated with increased odds of PsA (OR per unit
increase 1.02, 95% CI 1.01-1.04), while alcohol consumption frequency was associated
with decreased odds of PsA (frequent drinker: OR 0.82, 95% CI 0.70-0.96 and daily
drinker: 0.67, 95% CI 0.54-0.83) as was smoking status (previous smoker: OR 0.80,
95% CI 0.68-0.93 and current smoker: OR 0.54, 95% CI 0.42-0.68) (Table 22 and
Figure 9).
In comparison with the control population, the following variables were independently
associated with PsA: BMI (OR per unit increase 1.05, 95% CI 1.04-1.06), previous
smokers compared to non-smokers (OR 1.17, 95% CI 1.01-1.35), frequent and daily
drinkers (OR 0.78, 95% CI 0.67-0.90 and OR 0.65, 95% CI 0.53-0.80, respectively)
compared to low-frequency drinkers. In addition the exposures that remained
significantly associated with the prevalence of PSO were: Townsend deprivation index
(OR per unit increase 1.01, 95% CI 1.01-1.02), BMI (OR per unit increase 1.03, 95% CI
1.02-1.03) and previous and current smokers (OR 1.46, 95% CI 1.37-1.55 and OR 1.89,
95% CI 1.74-2.06) compared to non-smokers (Table 22 and Figure 9).

121
Table 20 | Baseline characteristics of the study populations
Characteristics PsA (N=939)
PSO without arthritis (N=4,991)
Controls (N=496,536)
Age Median (IQR) 57 (11) 58 (13) 58 (13) Gender Male N (%) 453 (48.2) 2,670 (53.5)* 225,977 (45.5) Ethnic background Missing data N (%) 4 (0.4) 25 (0.5) 2,748 (0.6) White N (%) 911 (97.0)* 4,817 (96.5)* 466,929 (94.0) BMI Missing data N (%) 5 (0.5) 17 (0.38) 3,077 (0.62) Median (IQR) 28 (6.5)* 27.5 (6)* 26.3 (5.8) Townsend deprivation index, Missing data N (%) 3 (0.32) 1 (0.02) 623 (0.13) Median (IQR) -2.1 (4.5) -1.9 (4.5)* -2.1 (4.2) Smoking status Missing data N (%) 5 (0.45) 21 (0.4) 2,925 (0.6) Never 478 (50.9) 2,103 (42.1) 270,957 (54.6) Previous 358 (38.1)* 2,053 (41.1)* 170,600 (34.4) Current 98 (10.4) 814 (16.3)* 52,054 (10.5) Frequency of alcohol intake Missing data N (%) 2 (0.2) 13 (0.3) 1,488 (0.3) Low frequency 347 (37.0) 1,484 (29.7) 152,648 (30.7) Frequent 437 (46.5)* 2,381 (47.7) 241,899 (48.7) Daily 153 (16.3)* 1,113 (22.3)* 100,501 (20.2) Fractures or muscle trauma Missing data N (%) 3 (0.3) 23 (0.5) 3,778 (0.8) Yes 89 (9.5) 493 (9.9) 46,867 (9.4) Intensity of physical activity (IPAQ) Missing data N (%) 89 (9.5) 441 (8.8) 50,048 (10.1) Low 270 (28.6) 1,222 (24.5) 106,314 (21.4) Moderate 388 (41.3)* 2,137 (42.8)* 213,691 (43.0) High 192 (20.4)* 1,191 (23.9)* 126,483 (25.5) Fatigue in last 2 weeks Missing data N (%) 30 (3.2) 173 (3.5) 17,050 (3.4) Yes 607 (64.6)* 2,699 (54.1)* 255,856 (51.5) Chronic pain (more than 3 months) Missing data N (%) 97 (10.3) 860 (17.2) 85,790 (17.3) Yes 629 (67.0)* 2,266 (45.4)* 215,705 (43.4) Heart attack Yes N (%) 27 (2.9) 149 (3.0)* 11,587 (2.3) Angina Yes N (%) 45 (4.8)* 209 (4.2)* 16,226 (3.3) Stroke Yes N (%) 16 (1.7) 94 (1.9) 9,156 (1.8) Hypertension Yes N (%) 364 (38.8)* 1,484 (29.7)* 136,319 (27.5) High cholesterol Yes N (%) 123 (13.1) 685 (13.7)* 60,801 (12.2) Pulmonary disease Yes N (%) 128 (13.6) 725 (14.5) 71,349 (14.3) Diabetes Missing data N (%) 3 (0.3) 19 (0.4) 2,467 (0.5) Yes N (%) 64 (6.8)* 345 (6.9)* 26,275 (5.3) Chronic depression Missing data N (%) 769 (81.9) 3,931 (78.8) 380,061 (76.5) Yes N (%) 61 (6.5)* 361 (7.2)* 32,204 (6.5) Liver disease Yes N (%) 19 (2.0)* 58 (1.2)* 3,782 (0.8) Gastrointestinal disease Yes N (%) 150 (16.0) 892 (17.9)* 74,206 (14.9)
PsA: Psoriatic Arthritis; IQR: Interquartile Range; BMI: Body Mass Index; * statistically significant (p<0.05) with controls as a referent group
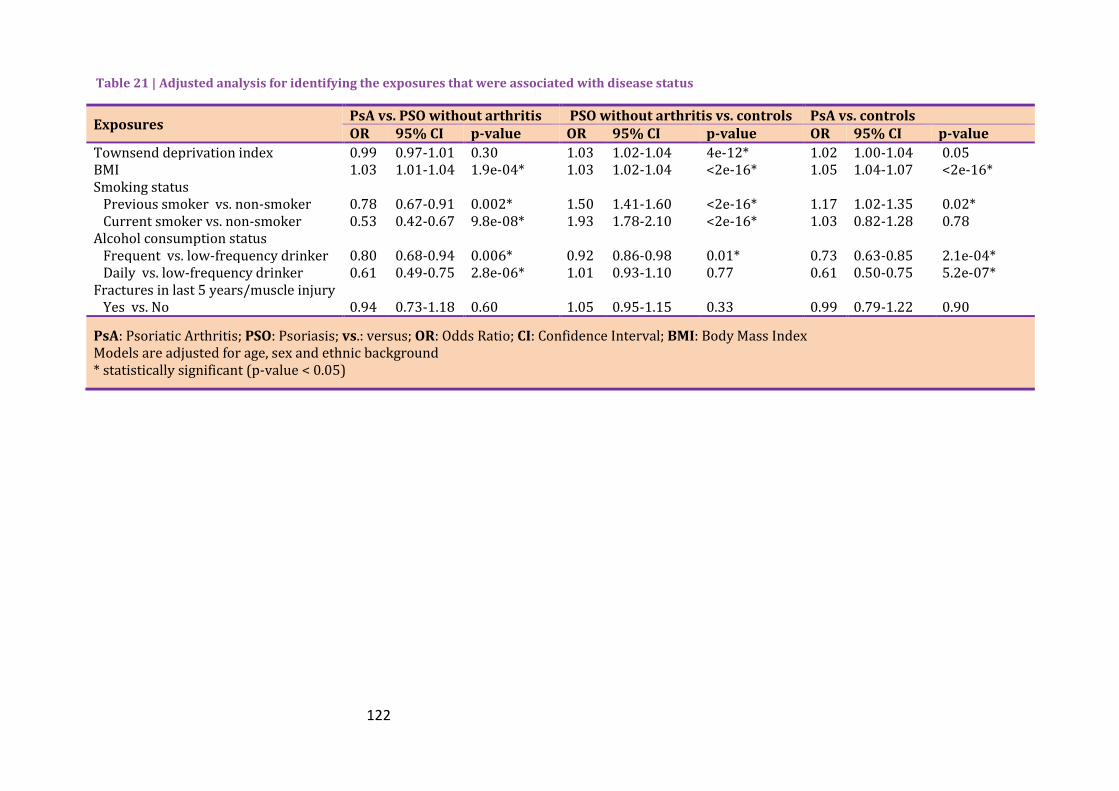
122
Table 21 | Adjusted analysis for identifying the exposures that were associated with disease status
Exposures PsA vs. PSO without arthritis PSO without arthritis vs. controls PsA vs. controls OR 95% CI p-value OR 95% CI p-value OR 95% CI p-value
Townsend deprivation index 0.99 0.97-1.01 0.30 1.03 1.02-1.04 4e-12* 1.02 1.00-1.04 0.05 BMI 1.03 1.01-1.04 1.9e-04* 1.03 1.02-1.04 <2e-16* 1.05 1.04-1.07 <2e-16* Smoking status Previous smoker vs. non-smoker 0.78 0.67-0.91 0.002* 1.50 1.41-1.60 <2e-16* 1.17 1.02-1.35 0.02* Current smoker vs. non-smoker 0.53 0.42-0.67 9.8e-08* 1.93 1.78-2.10 <2e-16* 1.03 0.82-1.28 0.78 Alcohol consumption status Frequent vs. low-frequency drinker 0.80 0.68-0.94 0.006* 0.92 0.86-0.98 0.01* 0.73 0.63-0.85 2.1e-04* Daily vs. low-frequency drinker 0.61 0.49-0.75 2.8e-06* 1.01 0.93-1.10 0.77 0.61 0.50-0.75 5.2e-07* Fractures in last 5 years/muscle injury Yes vs. No 0.94 0.73-1.18 0.60 1.05 0.95-1.15 0.33 0.99 0.79-1.22 0.90
PsA: Psoriatic Arthritis; PSO: Psoriasis; vs.: versus; OR: Odds Ratio; CI: Confidence Interval; BMI: Body Mass Index Models are adjusted for age, sex and ethnic background * statistically significant (p-value < 0.05)

123
Figure 8 | Association of lifestyle factors with disease status (adjusted model) adjusting for age, sex and ethnicity a. Results from logistic regression. Disease status is the dependent variable. The referent group is comprised of participants without psoriatic arthritis (PsA) and psoriasis b. Results from logistic regression. The referent group is the participants with psoriasis without arthritis

124
Table 22 | Association between lifestyle/environmental factors and disease status (final, multivariable analysis)
Exposures PsA vs. PSO without arthritis PSO without arthritis vs. controls PsA vs. controls OR 95% CI p-value OR 95% CI p-value OR 95% CI p-value
Townsend deprivation index 1.01 1.00-1.02 0.002* BMI 1.02 1.01-1.04 0.002* 1.03 1.02-1.03 <2e-16* 1.05 1.04-1.06 6.3e-16* Smoking status Previous smoker vs. non-smoker 0.80 0.68-0.93 0.004* 1.46 1.37-1.55 <2e-16* 1.17 1.01-1.35 0.03* Current smoker vs. non-smoker 0.54 0.42-0.68 2.3e-07* 1.89 1.74-2.05 <2e-16* 1.04 0.83-1.29 0.75 Alcohol consumption status Frequent vs. Low-frequency drinker 0.82 0.70-0.96 0.01* 0.96 0.90-1.03 0.22 0.78 0.67-0.90 7.9e-04* Daily vs. Low-frequency drinker 0.67 0.54-0.83 2.5e-04* 1.01 0.93-1.10 0.76 0.65 0.53-0.80 3.1e-05*
PsA: Psoriatic Arthritis; vs.: versus; PSO: Psoriasis; OR: Odds Ratio; CI: Confidence Interval; BMI: Body Mass Index Multivariable model including significant factors from the adjusted analysis and adjusted for age, gender and ethnic background * statistically significant (p-value < 0.05)

125
Figure 9 | Association of lifestyle factors with disease status (multivariable model) adjusting for age, sex and ethnicity; a. Results from logistic regression. Disease status is the dependent variable. The referent group is comprised of participants without psoriatic arthritis (PsA) and psoriasis b. Results from logistic regression. The referent group is the participants with psoriasis without arthritis

126
Investigating the association of prevalent comorbidities with disease 2.5.1.2
status
For assessing the crude ratios of prevalent comorbidities in both diseases compared to
controls and to each other, univariate logistic regression analysis was used (Table 23).
In the univariate analysis the prevalence of fatigue, chronic pain, hypertension and liver
disease were significantly elevated in PsA compared to the PSO without arthritis
cohort, with the ORs ranging from 1.50 to 2.43. Compared to the controls, the PSO-
only cohort was associated with the prevalence of the majority of morbidities that
were investigated with the exception of stroke and pulmonary disease. Comparing PsA
with controls, fatigue, chronic pain, hypertension, angina and liver disease were more
likely to be reported by participants with PsA.
During the multivariable analysis in which BMI, smoking status, frequency of alcohol
consumption and Townsend deprivation index were controlled, participants with PsA
were more likely to report fatigue (OR 1.55, 95% CI 1.33-1.81), chronic pain (OR 2.39,
95% CI 2.02-2.85), at least one CVD (OR 2.39, 95% CI 2.02-2.85), hypertension (OR
1.57, 95% CI 1.34-1.84) and liver disease (OR 1.84, 95% CI 1.06-3.09) compared to
participants with PSO (Table 24 and Figure 10). PSO-only patients were more likely to
report diabetes, chronic depression and gastrointestinal disease compared to controls;
whilst these differences were not statistically different in PsA compared with controls,
no detectable differences between PSO and PsA were observed suggesting that
reduced power may explain the lack of association with PsA versus controls. The
results remain significant after including duration of inflammation.
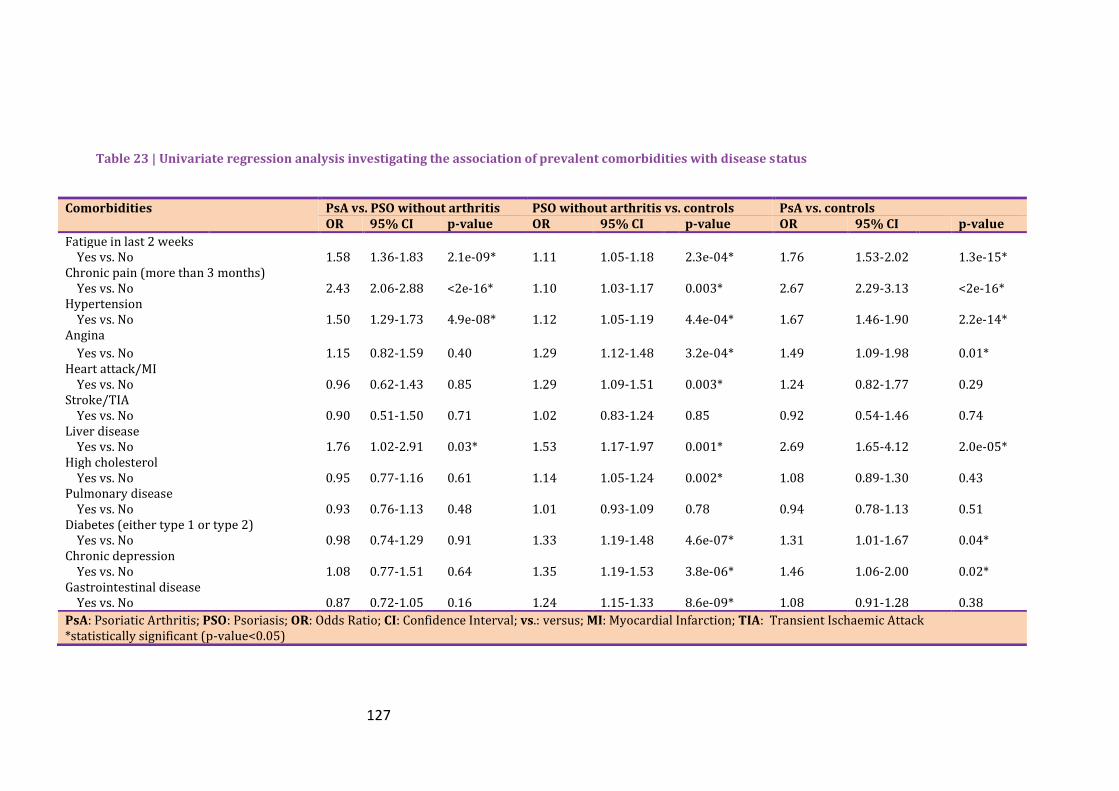
127
Table 23 | Univariate regression analysis investigating the association of prevalent comorbidities with disease status
Comorbidities PsA vs. PSO without arthritis PSO without arthritis vs. controls PsA vs. controls OR 95% CI p-value OR 95% CI p-value OR 95% CI p-value
Fatigue in last 2 weeks Yes vs. No 1.58 1.36-1.83 2.1e-09* 1.11 1.05-1.18 2.3e-04* 1.76 1.53-2.02 1.3e-15* Chronic pain (more than 3 months) Yes vs. No 2.43 2.06-2.88 <2e-16* 1.10 1.03-1.17 0.003* 2.67 2.29-3.13 <2e-16* Hypertension Yes vs. No 1.50 1.29-1.73 4.9e-08* 1.12 1.05-1.19 4.4e-04* 1.67 1.46-1.90 2.2e-14* Angina
Yes vs. No 1.15 0.82-1.59 0.40 1.29 1.12-1.48 3.2e-04* 1.49 1.09-1.98 0.01* Heart attack/MI Yes vs. No 0.96 0.62-1.43 0.85 1.29 1.09-1.51 0.003* 1.24 0.82-1.77 0.29 Stroke/TIA Yes vs. No 0.90 0.51-1.50 0.71 1.02 0.83-1.24 0.85 0.92 0.54-1.46 0.74 Liver disease Yes vs. No 1.76 1.02-2.91 0.03* 1.53 1.17-1.97 0.001* 2.69 1.65-4.12 2.0e-05* High cholesterol Yes vs. No 0.95 0.77-1.16 0.61 1.14 1.05-1.24 0.002* 1.08 0.89-1.30 0.43 Pulmonary disease Yes vs. No 0.93 0.76-1.13 0.48 1.01 0.93-1.09 0.78 0.94 0.78-1.13 0.51 Diabetes (either type 1 or type 2) Yes vs. No 0.98 0.74-1.29 0.91 1.33 1.19-1.48 4.6e-07* 1.31 1.01-1.67 0.04* Chronic depression Yes vs. No 1.08 0.77-1.51 0.64 1.35 1.19-1.53 3.8e-06* 1.46 1.06-2.00 0.02* Gastrointestinal disease Yes vs. No 0.87 0.72-1.05 0.16 1.24 1.15-1.33 8.6e-09* 1.08 0.91-1.28 0.38
PsA: Psoriatic Arthritis; PSO: Psoriasis; OR: Odds Ratio; CI: Confidence Interval; vs.: versus; MI: Myocardial Infarction; TIA: Transient Ischaemic Attack *statistically significant (p-value<0.05)

128
Table 24 | Multivariable regression analysis investigating the association of prevalent comorbidities with disease status
Comorbidities PsA vs. PSO without arthritis PSO without arthritis vs. controls PsA vs. controls OR 95% CI p-value OR 95% CI p-value OR 95% CI p-value
Fatigue in last 2 weeks Yes vs. No 1.55 1.33-1.81 2.7e-08* 1.08 1.01-1.14 0.02 1.66 1.44-1.92 3.3e-12* Chronic pain (more than 3 months) Yes vs. No 2.39 2.02-2.85 <2e-16* 1.03 0.96-1.10 0.39 2.48 2.12-2.91 <2e-16* Hypertension Yes vs. No 1.57 1.34-1.84 2.5e-08* 1.01 0.95-1.08 0.70 1.57 1.36-1.80 7e-10* Angina
Yes vs. No 1.28 0.90-1.80 0.16 1.11 0.96-1.28 0.16 1.43 1.04-1.93 0.02* Heart attack/MI Yes vs. No 1.15 0.73-1.73 0.53 1.06 0.89-1.24 0.53 1.22 0.81-1.77 0.31 Stroke/TIA Yes vs. No 0.95 0.53-1.58 0.84 0.90 0.73-1.11 0.34 0.90 0.53-1.43 0.69 Liver disease Yes vs. No 1.84 1.06-3.09 0.02* 1.40 1.06-1.81 0.01 2.64 1.62-4.05 3e-05* High cholesterol Yes vs. No 0.99 0.79-1.23 0.94 1.03 0.95-1.12 0.45 1.04 0.85-1.26 0.69 Pulmonary disease Yes vs. No 0.92 0.75-1.13 0.45 0.96 0.89-1.04 0.36 0.89 0.74-1.07 0.23 Diabetes (either type 1 or type 2) Yes vs. No 0.93 0.68-1.24 0.62 1.17 1.04-1.31 0.009* 1.11 0.84-1.45 0.43 Chronic depression Yes vs. No 1.11 0.77-1.58 0.58 1.31 1.15-1.50 5.3e-05* 1.39 1.00-1.92 0.05 Gastrointestinal disease Yes vs. No 0.87 0.71-1.06 0.18 1.15 1.07-1.25 1.8e-04* 1.03 0.86-1.23 0.76
PsA: Psoriatic Arthritis; PSO: Psoriasis; OR: Odds Ratio; CI: Confidence Interval; vs.: versus; MI: Myocardial Infarction; TIA: Transient Ischaemic Attack Multivariable adjusted model included age, gender, ethnic background, Townsend deprivation index, Body mass index, smoking status, alcohol frequency consumption *statistically significant (p-value<0.05)

129
Figure 10 | Association of prevalent comorbidities with disease status (multivariable model) adjusting for age, sex, ethnicity, smoking and alcohol consumption, BMI and Townsend deprivation index; a. Results from logistic regression. Comorbidities is the dependent variable. The referent group is comprised of participants without psoriatic arthritis (PsA) and psoriasis b. Results from logistic regression. The referent group is the participants with psoriasis without arthritis.

130
Comorbidities in rheumatic diseases and their effect on physical 2.5.2
activity
Of the 502,643 individuals recruited by the UK Biobank 488,991 were eligible to be
included in the study (Figure 11). Of the latter, 5,315 (1.1%) had self-reported RA, 865
(0.2%) had PsA, 1,255 (0.3%) had reported being diagnosed with AS and 559 (0.1%)
had SLE. The rest of UK Biobank’s population (98.4%) formed the controls cohort.
Figure 11 | Number of participants included in the study
The median age of the participants that reported having one of the rheumatic diseases
was 61.0 for those having RA, 57.0 for PsA, 59.0 for AS, 56.0 for SLE and these were
significantly different to the controls’ median age of 58 years. The proportion of
participants using DMARDs varied between the different types of inflammatory
arthritis, ranging from 48.4% in RA to 7.7% in AS. 0.4% of the controls cohort also
reported taking DMARDs and 1.1% taking corticosteroids.

131
Table 25 | Baseline characteristics of the cohorts
RA (N=5,315)
PsA (N=865)
AS (N=1,254)
SLE (N=559)
Controls (N=480,998)
Age Median (IQR) 61.0 (55.0-65.0)* 57.0 (51.0-62.0)* 59.0 (52.0-63.0)* 56.0 (49.0-62.0)* 58.0 (50.0-63.0) Age at onset of rheumatic disease Median (IQR) 48.3 (37.9-56.0) 44.7 (35.0-52.2) 36.1 (25.5-46.9) 42.0 (23.8-51.3) - Gender Female N (%) 3,713 (69.9)* 445 (51.4) 459 (36.6)* 499 (89.3)* 259,915 (54.0) BMI Median (IQR) 27.4 (24.4-31.0)* 28.0 (25.1-31.6)* 26.9 (24.4-30.0) 26.2 (23.5-30.2) 26.7 (24.1-20.8) Smoking status Current 659 (12.5)* 88 (10.2) 179 (14.3)* 69 (12.4) 50,083 (10.5) Past 2,137 (40.5)* 325 (37.8) 512 (41.0)* 194 (34.8) 165,240 (34.5) Never 2,479 (47.0)* 447 (52.0) 557 (44.7)* 294 (52.8) 263,115 (55.0) Alcohol Daily or almost daily 766 (14.4)* 139 (16.1)* 296 (23.6)* 82 (14.7)* 98,407 (20.5) Three or four times a week 889 (16.8)* 197 (22.8)* 265 (21.2)* 75 (13.4)* 111,691 (23.3) Once or twice a week 1,308 (24.7)* 213 (24.7)* 311 (24.8)* 114 (20.4)* 124,130 (25.9) One to three times a month 661 (12.5)* 99 (11.5)* 123 (9.8)* 84 (15.1)* 53,330 (11.1) Special occasions only 881 (16.6)* 122 (14.1)* 153 (12.2)* 111 (19.7)* 54,443 (11.4) Never 800 (15.1)* 93 (10.8)* 105 (8.4)* 93 (16.7)* 37,722 (7.9) Medication Using synthetic DMARD 2,574 (48.4)* 418 (48.3)* 97 (7.7)* 226 (40.4)* 2,050 (0.4) Using biologic DMARD 327 (6.2)* 53 (6.1)* 40 (3.2)* 0 (0.0) 66 (0.01) Using corticosteroids 522 (9.8)* 44 (5.1)* 48 (3.8)* 114 (20.4)* 5,064 (1.1)
IQR: Interquartile Range; BMI: Body Mass Index; IPAQ: International Physical Activity Questionnaire; DMARD: Disease-Modifying Anti-Rheumatic Drug *Statistically significantly difference from the controls group (P<0.05), using Mann-Whitney U-test for continuous variables and chi-square test for categorical variable

132
Table 25 | Baseline characteristics of the cohorts
RA (N=5,315)
PsA (N=865)
AS (N=1,254)
SLE (N=559)
Controls (N=480,998)
Physical activity (IPAQ group) Low 1,010 (23.0)* 164 (22.0)* 239 (21.4)* 87 (18.6)* 67,394 (15.4) Moderate 1,811 (41.2)* 320 (43.0)* 447 (40.1)* 208 (44.5)* 182,781 (42.2) High 1,575 (35.8)* 261 (35.0)* 429 (38.5)* 172 (36.8)* 183,505 (42.3) Functional comorbidity index 0 1,962 (37.0)* 372 (43.1)* 537 (42.9)* 215 (38.5)* 235,831 (49.1) 1-2 2,688 (50.7)* 410 (47.5)* 593 (47.3)* 269 (48.1)* 217,179 (45.2) 3-4 575 (10.8)* 76 (8.8)* 99 (7.9)* 68 (12.2)* 24,786 (5.2) ≥5 80 (1.5)* 6 (0.7)* 24 (1.9)* 7 (1.3)* 2,292 (0.5)
IQR: Interquartile Range; BMI: Body Mass Index; IPAQ: International Physical Activity Questionnaire; DMARD: Disease-Modifying Anti-Rheumatic Drug *Statistically significantly difference from the controls group (P<0.05), using Mann-Whitney U-test for continuous variables and chi-square test for categorical variables
133
Comparison of the prevalence and incidence of comorbidities in 2.5.2.1
rheumatic diseases
Prevalence of morbid conditions 2.5.2.1.1
The prevalence rate ratio of each comorbidity was found to be increased in the
majority of rheumatic diseases (Table 26 and Figure 12a). In RA and SLE almost all
studied comorbidities were increased compared to the controls and in the case of SLE,
the increase was considerable. More specifically, angina (SMR: 3.1, 95% CI 2.2-4.2),
heart attack (SMR: 3.3, 95% CI 2.1-4.9) and stroke (SMR: 4.9, 95% CI 3.6-6.6) were
more prevalent in SLE compared to controls. The following comorbidities were
prevalent in all four disease cohorts: compared to controls: angina (RA: SMR 1.9, 95%
CI 1.7-2.1, PsA: SMR 1.5, 95 CI% 1.1-2.0, AS: SMR 1.4, 95% CI 1.1-1.7 and SLE: SMR
3.1, 95% CI 2.2-4.2), hypertension (RA: SMR 1.2, 95% CI 1.2-1.3, PsA: SMR 1.4, 95% CI
1.3-1.6, AS: SMR 1.2, 95% CI 1.1-1.3 and SLE: SMR 1.4, 95% CI 1.3-1.6) and depression
(RA: SMR 1.2, 95% CI 1.1-1.3, PsA: SMR 1.3, 95% CI 1.0-1.7, AS: SMR 1.5, 95% CI 1.2-
1.8 and SLE: SMR 1.4, 95% CI 1.0-1.8). Only participants with RA had an increased
prevalence of diabetes compared to the controls (SMR: 1.5, 95% CI 1.4-1.6).
The sensitivity analysis including only participants who self-reported a rheumatic
disease and who were also taking synthetic and/or biologic DMARD compared to the
controls showed similar results (Table 27).
Incidence of morbid conditions 2.5.2.1.2
Cox regression analysis of incident cases of comorbidities occurring after the diagnosis
of a rheumatic disease revealed similar significant results as the SMR method.
Participants with RA were at increased risk of developing all of the comorbidities
considered compared to controls over the same period of time (Figure 12b).
Participants with PsA had a statistically significant increased risk of developing
hypertension only (HR 1.5, 95% CI 1.3-1.8) compared to controls. Participants with AS
were at increased risk of having a stroke (HR 1.6, 95% CI 1.1-2.5), developing
pulmonary disease (HR 2.0, 95% CI 1.3-3.1) and depression (HR 1.5, 95% CI 1.1-2.0).
The risk of developing myocardial, vascular and pulmonary comorbidities was
increased in participants with SLE, with particularly increased risk of incident angina
and stroke.

134
Table 26 | Prevalence of comorbidities in participants with a rheumatic disease
RA PsA AS SLE
n (%) SMR¥ n (%) SMR¥ n (%) SMR¥ n (%) SMR¥
Angina 350 (0.06) 1.9 (1.7-2.1)* 42 (0.05) 1.5 (1.1-2.0)* 71 (0.05) 1.4 (1.1-1.7)* 41 (0.06) 3.1 (2.2-4.2)* Heart attack/MI 224 (0.04) 1.9 (1.6-2.1)* 26 (0.03) 1.3 (0.8-1.9) 53 (0.04) 1.3 (1.0-1.7)* 23 (0.04) 3.3 (2.1-4.9)* Stroke/Ischaemic stroke 180 (0.03) 1.6 (1.4-1.9)* 16 (0.02) 1.0 (0.6-1.6) 40 (0.03) 1.5 (1.0-2.0)* 45 (0.07) 4.9 (3.6-6.6)*
Hypertension 2043 (36.5) 1.2 (1.2-1.3)* 345 (38.7) 1.4 (1.3-1.6)* 462 (34.8)
1.2 (1.1-1.3)* 218 (39.2) 1.4 (1.3-1.6)*
Pulmonary disease 284 (5.1) 2.1 (1.9-2.4)* 25 (2.8) 1.3 (0.8-1.9) 63 (4.8) 2.0 (1.6-2.6)* 30 (4.7) 2.4 (1.6-3.4)*
Diabetes 443 (7.9) 1·5 (1.4-1.6)* 57 (6.4) 1.2 (0.9-1.6) 84 (6.3) 1.0 (0.8-1.3) 36 (5.6) 1.4 (1.0-2.0) Depression
367 (6.5) 1.2 (1.1-1.3)* 62 (7.0) 1.3 (1.0-1.7)* 94 (7.1) 1.5 (1.2-1.8)* 56 (8.7) 1.4 (1.0-1.8)*
SMR: Standardised Morbidity Ratio; MI: Myocardial Infarction; COPD: Chronic Obstructive Pulmonary Disease Pulmonary disease includes COPD, emphysema and bronchitis ¥Age- and sex-standardised morbidity ratio. The reference population comprised participants without any of the four rheumatic diseases being studied *p<0.05

135
Table 27 | Prevalence of comorbidities in participants with a rheumatic disease (self-reported rheumatic disease and use of a DMARD)
RA PsA AS SLE
n (%) SMR¥ n (%) SMR¥ n (%) SMR¥ n (%) SMR¥
Angina 134 (0.05) 1.5 (1.3-1.8)* 21 (0.04) 1.6 (1.0-2.4) 8 (0.07) 1.9 (0.8-3.8) 5.5 (1.3-4.0)* Heart attack/MI 103 (0.04) 1.8 (1.5-2.2)* 12 (0.02) 1.2 (0.6-2.1) -+ -+ 2.0 (0.7-4.4) Stroke / Ischaemic stroke 73 (0.03) 1.4 (1.1-1.8)* -+ -+ -+ -+ 17 (0.06) 4.4 (2.6-7.1)* Hypertension 967 (0.4) 1.2 (1.2-1.3)* 176 (0.4) 1·5 (1.3-1.7)* 60 (0.5) 1·8 (1.4-2.3)* 93 (0.3) 1.4 (1.2-1.8)*
Pulmonary disease 133 (0.05) 2.1 (1.7-2.4)* -+ -+ -+ -+ 16 (0.06) 2.9 (1.7-4.8)*
Diabetes 188 (0.07) 1.3 (1.2-1.5)* 27 (0.06) 1.2 (0.8-1.7) 13 (0.1) 1.9 (1.0-3.2)* 14 (0.05) 1.3 (0.7-2.1) Depression
145 (0.05) 1.0 (0.8-1.1) 37 (0.08) 1.6 (1.1-2.2)* 15 (0.1) 2.5 (1.4-4.2)* 25 (0.09) 1.4 (0.9-2.0)
SMR: Standardised Morbidity Ratio; MI: Myocardial Infarction; COPD: Chronic Obstructive Pulmonary Disease Pulmonary disease includes COPD, emphysema and bronchitis ¥ Age- and sex-standardised morbidity ratio. The reference population comprised participants without any of the four rheumatic/musculoskeletal diseases being studied. + Results are not presented where the number of cases is <10 * p<0.05

136
Figure 12 | Prevalence and incidence rates of comorbidities a. Indirect age- and sex- standardised morbidity ratios for the four rheumatic diseases. The referent group includes participants with none of the rheumatic diseases being analysed b. Hazard ratios from a Cox proportional hazard model. Each participant with a rheumatic disease was age- and sex- matched with four participants from the controls group.

137
Association of prevalent comorbidities and physical activity 2.5.2.2
A significantly lower proportion of people with one of the four diseases reported
performing a high level of physical activity, compared to the control population (Table
25). The proportion of participants meeting the WHO recommended amount of
physical activity was 64% for people with rheumatic diseases and 74% for people
without a rheumatic disease (p<0.001, chi-square test). The presence of (co)morbidity
was associated with reduced odds of reporting a moderate or high level of physical
activity in participants with a rheumatic disease and in controls, with low physical
activity as the referent group (Figure 13). Participants with a rheumatic disease and no
comorbidity were less likely to report a high (OR 0.61, 95% CI 0.55-0.69) or moderate
(OR 0.72, 95% CI 0.64-0.80) level of physical activity than participants with no
rheumatic disease and a morbidity (high: OR 0.80, 95% CI 0.79-0.82, moderate: OR
0.87, 95% CI 0.85-0.89), with the referent group comprising participants with no
rheumatic disease and no morbidity (Figure 13).
In people with one of the four rheumatic diseases, most of the comorbidities
considered were individually associated with physical activity level (Table 28). In
particular, cardiovascular comorbidities and depression were associated with reduced
odds of reporting a moderate or high level of physical activity. There was evidence of
a dose-response relationship between increasing level of comorbid burden, measured
using a modified functional comorbidity index, and reduced odds of reporting a
moderate or high level of physical activity (Table 28).

138
Figure 13 | Association between presence/absence of rheumatic disease, (co)morbidity and physical activity Results from the multinomial logistic regression. Physical activity group (referent=low) is the dependent variable. Study group: no rheumatic disease and no morbidity, no rheumatic disease and morbidity, rheumatic disease and no comorbidity, and rheumatic disease and comorbidity is the independent variable. Adjusted for age, sex, smoking, alcohol consumption and BMI.
Table 28 | Association between comorbidities and physical activity in participants with a rheumatic disease
Physical activity level
Moderate High
RRR (95% CI)a
Angina 0.60 (0.46-0.78)* 0.54 (0.4-0.71)*
MI / heart attack 0.68 (0.50-0.92)* 0.54 (0.39-0.75)*
Stroke / Ischaemic stroke 0.55 (0.39-0.78)* 0.65 (0.46-0.92)*
Hypertension 0.75 (0.66-0.86)* 0.71 (0.62-0.82)*
Pulmonary disease 0.86 (0.64-1.16) 0.72 (0.53-0.99)*
Depression 0.67 (0.52-0.85)* 0.77 (0.60-0.98)*
Functional comorbidity index
0 referent referent
1-2 0.72 (0.63-0.83)* 0.68 (0.59-0.78)*
3-4 0.48 (0.38-0.60)* 0.48 (0.38-0.60)*
≥5 0.32 (0.20-0.54)* 0.22 (0.13-0.40)*
RRR: Relative Risk Ratio; CI: Confidence Interval; MI: myocardial infarction; COPD: Chronic Obstructive Pulmonary Disease a Relative risk ratio from a multinomial logistic model with physical activity level as the dependent group. Low physical activity was the referent group. Adjusted for age and sex. *p<0.05

139
Discussion 2.6
As the field of biobanking has been evolving over the past number of decades,
population-based repositories have been created worldwide for collecting, storing and
analysing phenotypic and genetic information on large samples of their source
population (De Souza and Greenspan 2013). Such large prospective studies, like the
UK Biobank, that collect an extensive range of data (including pre-occurrent exposures
that could affect the onset of a disease and pre-existing or subsequent comorbidities
that could burden quality of life) are needed to shed light on the causes of the diseases
such as PSO and rheumatic diseases and the greater functional impairment that
patients with comorbidities experience.
A major advantage of the UK Biobank is that the participants recruited were
registered with a GP in the National Health Service. As the latter keeps detailed
medical records, linkage with each participant’s UK Biobank profile allow the cross-
validation of the self-reported information provided during the assessment visit as well
as the participant’s follow-up health outcomes. This extensive phenotypic, genetic and
clinical data along with the large sample size enables the in depth investigation of
exposures and outcomes of diseases in order to improve the prevention, diagnosis and
treatment of diseases (Allen 2013; Sudlow, Gallacher et al. 2015).
However, UK Biobank is not representative of the general population as a result of the
“volunteer” effect or bias in which the participants who volunteer to take part in
studies tend to be women, with higher socioeconomic status, married and healthier
(Galea and Tracy 2007). This was exemplified by the findings of Fry et al. where
women, older aged individuals and those living in less socioeconomically deprived areas
were more likely to participate in UK Biobank. Moreover, UK Biobank participants
were less likely to be daily drinkers, obese and smokers and less likely to report health
outcomes, having lower all-cause mortality rates compared to the general population
of the same age group (Fry, Littlejohns et al. 2017). This fact makes UK Biobank
unsuitable for estimating generalizable prevalence and incidence rates. However,
because of its large sizes with different levels of exposures it can provide reliable
associations between the latter and health outcomes with non-representativeness not
being a caveat (Collins 2012; Ebrahim and Davey Smith 2013; Richiardi, Pizzi et al.
2013). For example, whilst the number of participants with higher BMI is lower

140
compared to the general population, there are enough obese participants to estimate
the association of high BMI with various diseases.
Finally, the data collected in UK Biobank is self-reported and were gathered via the
touchscreen questionnaire and the face-to-face interview with a nurse. The use of self-
report data is faster and cheaper than their extraction from the medical records, but
they might not accurately capture the exposures and phenotypes they represent and
there is a chance of bias and misclassification incidents (Fadnes, Taube et al. 2008).
However, research has shown that patients can accurately report medical conditions
(Barber, Muller et al. 2010), with the accuracy varying depending on the condition
(Okura, Urban et al. 2004) and the age and gender of the interviewees (Pakhomov,
Jacobsen et al. 2008). Previous validation of self-reported PsA cases from the THIN
database showed limited misclassification (Ogdie, Langan et al. 2013). Still there is a
possibility of undiagnosed cases of PsA among participants with PSO; however the
frequency cannot be estimated in a population-based cohort. This misclassification will
underestimate the observed differences (bias to the null); thus, if differences are seen,
they are more likely to be real.
As UK Biobank is a large longitudinal cohort established to investigate susceptibility to
a variety of diseases, the primary objective was to exploit this rich resource of data
and provide a baseline, mainly descriptive analysis of the characteristics of participants
that reported PsA or PSO. More specifically, the aim was to identify associations of
lifestyle determinants with PsA and to investigate the prevalence of comorbidities in
participants with PSO, PsA and other inflammatory rheumatic diseases. The
relationship between comorbidities and physical (in)activity was also investigated.
Review of objectives 2.6.1
First study 2.6.1.1
First aim 2.6.1.1.1
There is an increased interest in identifying environmental and lifestyle risk factors for
the onset of PsA among patients with PSO as they could assist in understanding the
causal pathways of PsA and in potentially preventing the development of the disease.
The identification of these factors is challenging in PsA due to i) the small sample sizes
studied, which leads to insufficient power to detect significant associations ii) the

141
undiagnosed cases of PsA which are wrongly categorised as PSO without arthritis iii)
the lack of universal consensus in the diagnostic criteria used iv) the misdiagnosis of
osteoarthritis with PsA in early stages as they can both start in the entheses
(McGonagle, Hermann et al. 2015) v) the uncertainty of the PsA onset as patients delay
seeking medical advice vi) the difference in study designs, with the majority being case-
control studies which are prone to selection and recall bias (Kopec and Esdaile 1990).
A number of studies (Thumboo, Uramoto et al. 2002; Pattison, Harrison et al. 2008;
Soltani-Arabshahi, Wong et al. 2010; Tey, Ee et al. 2010; Eder, Law et al. 2011; Li, Han
et al. 2012; Li, Han et al. 2012; Love, Zhu et al. 2012; Eder, Haddad et al. 2015; Wu,
Cho et al. 2015) have investigated the environmental and lifestyle risk factors that are
associated with the development of PsA; however for the abovementioned reasons the
findings are often conflicting.
In the current study, participants with PsA had a higher BMI compared with both the
PSO without arthritis cohort and the controls. As the study design is cross-sectional, it
is impossible to infer causality between elevated BMI and the development of PsA, or if
the increased BMI is a consequence of reduced physical activity among patients with
arthritis. BMI has been reported to be associated with a higher risk of PSO in a
prospective study in women (Kumar, Han et al. 2013) and it is the only risk factor
whose association with the onset of PsA has been replicated across three studies
(Soltani-Arabshahi, Wong et al. 2010; Li, Han et al. 2012; Love, Zhu et al. 2012). Li et
al. and Love et al. using prospective cohort studies reported a dose-response relation
between increasing BMI and increasing risk of incident PsA after adjusting for potential
confounders. Finally, Soltani-Arabshahi et al. reported that BMI at age 18 was predictive
of PsA (OR 1.06, p-value<0.01) while current BMI was not significantly associated with
the risk of PsA. That study suffered from a few limitations including the definition of
PsA cases, which was based on self-reported data and the accuracy of BMI at age 18
could be affected by recall bias. One possible explanation could be the chronic
inflammation that is common in both obese and PsA patients. More specifically, obesity
has been found to be related to an overproduction of inflammatory cytokines which
are in turn associated with adiposity (Hamminga, van der Lely et al. 2006). However,
adjusting for duration of disease (and thus inflammatory burden) in the current UK
Biobank study did not materially alter the findings.

142
Regarding alcohol consumption, findings are mixed due to differences in alcohol intake
assessments and time of recording. The current study suggested an inverse association
between PsA and alcohol consumption compared to both the PSO without arthritis
group and controls after adjusting for potential confounders. The association of
frequency of alcohol consumption with the PSO without arthritis did not reach
significance. An inverse association between alcohol consumption and the prevalence
of PsA (OR 0.34, 95% CI 0.23-0.62) has been reported elsewhere (Huidekoper, van
der Woude et al. 2013). The inverse association could be explained by a potential
change in drinking behaviour after the diagnosis of PsA (Wang, Kay et al. 2009) as
advised by the physician due to the use of certain disease modifying anti-rheumatic
drugs that could lead to abnormal liver function (Curtis, Beukelman et al. 2010). In two
case-control studies, Tey et al. and Eder et al. found no association with PsA, whereas
Wu et al. in their prospective study reported that excessive alcohol intake in women
may be associated with increased risk of developing PsA (fully adjusted HR: 4.45, 95%
CI 2.07-9.59) compared to non-drinkers among all participants (Wu, Cho et al. 2015).
This association did not reach the significance threshold among participants with
confirmed PSO. However, excessive drinkers had an increased risk of developing PsA
compared to moderate drinkers (fully adjusted HR: 2.79, 95% CI 1.24-6.26) among
participants with PSO. In a previous prospective study the same authors suggested an
association between excessive alcohol intake and the risk of incident PSO (fully-
adjusted HR: 2.53, 95% CI 1.45-4.40) in women (Qureshi, Dominguez et al. 2010).
The role of smoking in the onset of PsA is unclear. It has been suggested that acute
cigarette smoking activates neutrophils and macrophages and it is associated with
oxidative stress that could stimulate inflammation (van der Vaart, Postma et al. 2004).
In a large cohort of women, current and past smokers were at increased risk of
developing PSO compared to non-smokers (current smokers: RR 1.78, 95% CI 1.46-
2.16, past smokers: RR 1.37, 95% CI 1.17-1.59). The risk increased with the duration,
intensity and pack-years of smoking (Setty, Curhan et al. 2007). Conversely, a
suppressive effect of smoking on several inflammatory cytokines has been suggested
probably due to the presence of anti-inflammatory carbon monoxide and nicotine
(Chapman, Otterbein et al. 2001; Bencherif, Lippiello et al. 2011). Regarding PsA, the
studies that have been conducted have reported conflicting results. Eder et. al (2011)
found an inverse association between smoking and PsA. In a later study, using a larger

143
sample size and stratifying by the HLA-C*06, this inverse association was present only
among patients who were HLA-C*06 negative (Eder, Shanmugarajah et al. 2012). By
contrast, Li et al. reported an elevated risk of PsA in both current (RR 3.13, 95% CI
2.08-4.71) and past smokers (RR 1.54, 95% CI 1.06-2.24) among all the participants,
with an increase in risk of PsA as the duration of smoking (pack-years) increased.
Among participants with PSO, there was an association between current smokers that
smoke more than 15 cigarettes per day (RR 1.93, OR 95% CI 1.09-3.40) and smoking
duration of more than 25 years (RR 1.90, 90% CI 1.09-3.33) with an increased risk of
developing PsA. In the current study, the findings were in line with Eder et al. (2011);
smoking is a risk factor when compared to control populations but protective for PsA
when compared to PSO. However, this finding is probably a paradox as the observed
protective effect of smoking on the development of PsA within patients with PSO has
been shown to be almost completely mediated by smoking’s direct effect on PSO
(Nguyen, Zhang et al. 2015). This spurious association is due to index event bias
(collider stratification bias) caused by conditioning on an outcome, in this case
restricting the analysis to participants with PSO (inclusive of PsA), and inducing
dependence between risk factors (Nguyen, Zhang et al. 2018).
Socioeconomic status was assessed with the use of Townsend deprivation index which
is a measure of deprivation based on unemployment, non-car and non-home
ownership and household overcrowding. A negative value represents a high
socioeconomic status. Evidence is limited about the association of socioeconomic
status and its association with PSO and PsA. Eder et. al (2015) reported that
participants with university or college education were at lower risk of developing PsA
compared to participants with incomplete high school education (RR 0.20, 95% CI
0.06-0.62). As they stated the lower level of education is a marker of lower
socioeconomic status, which is linked with lifestyle habits that may increase the risk of
PsA. The current study including another measure of socioeconomic status found that
people with lower socioeconomic status (higher Townsend deprivation index) have
higher odds of reporting PSO without arthritis compared to the controls; supporting
Eder et. al finding. Clearly, this association will require further and more
comprehensive assessment in future studies.

144
Finally, fractures and muscle injuries were not associated with any disease status in the
adjusted analysis. A few studies have addressed this potential risk factor of PsA. An
association between trauma that leads to medical consultation (Pattison, Harrison et
al. 2008), heavy weight lifting (Eder, Law et al. 2011) and PSO onset due to Koebner
phenomenon (Soltani-Arabshahi, Wong et al. 2010) and PsA has been suggested
previously.
In summary, this study verified the association of increased BMI with PsA compared to
PSO-only cohort and clarified the smoking paradox that has previously been reported
as a limitation of cross-sectional studies.
Second aim 2.6.1.1.2
The majority of patients with PSO with or without PsA have at least one comorbid
condition which may interfere in treatment selection. Thus, it is essential these
comorbidities are recognised and addressed to fulfil the second aim of the study; the
prevalence of self-reported comorbid conditions in both diseases compared to the
general population was assessed. Hypertension was found to be more prevalent in PsA
compared to the PSO-only cohort and the controls, which is similar to the estimated
prevalence reported previously (Husted, Thavaneswaran et al. 2011). This association
could be a result of the interaction between systemic inflammation which is increased
in arthritis because of joint involvement, traditional risk factors which are prevalent in
arthritis and medication effects like corticosteroids (Nurmohamed, Heslinga et al.
2015). No information was available about the severity of the diseases in the current
study; however, Husted et. al reported a significant association (OR 2.17, 95% CI 1.22-
3.83) even after controlling for disease severity and medication history.
There are limited studies investigating the prevalence of liver disease, specifically non-
alcoholic fatty liver, in both PSO and PsA (Gisondi, Targher et al. 2009; Lindsay, Fraser
et al. 2009; Miele, Vallone et al. 2009). Moreover, some medication used in the
treatment of PSO and PSA such as methotrexate and leflunomide have been associated
with abnormalities in liver function tests (Tilling, Townsend et al. 2006; Curtis,
Beukelman et al. 2010). In this study, a higher prevalence of liver disease in PsA
compared to PSO without arthritis and to controls was found, although the number of
cases in both cohorts was too small to make firm conclusions. Husted et. al reported

145
similar findings with patients with PsA being more likely to report liver disease
compared to PSO without arthritis group (OR 7.74, 95% CI 1.35-44.29).
Finally, the prevalence of fatigue and chronic pain was examined, as patients think these
symptoms play a leading role in reducing their quality of everyday life compared to
other comorbidities. The results have shown significant associations between these
symptoms and PsA compared to the PSO and control cohorts. In a study investigating
the quality of life in both diseases, patients with PsA had reduced quality of life
compared to PSO (Rosen, Mussani et al. 2012). Patients with PsA were significantly
more fatigued (measured by the Fatigue Severity Scale) than patients with PSO (4.3 vs
3.4, p-value=0.0007) and experienced more body pain as measured by the SF-36 (61.8
vs. 78.9, p-value<0.0001), where lower scores indicate worse outcome. Both fatigue
and bodily pain were correlated with the number of actively inflamed joints.
Notably, the prevalence of the aforementioned comorbidities with PSO compared to
the controls did not reach significance supporting the hypothesis that their higher
prevalence in PsA could be the result of the increased systemic inflammation
Regarding the PSO cohort, the prevalence of diabetes (both types one and two) was
higher compared to the controls. Various cross-sectional studies have also reported a
significant association (Neimann, Shin et al. 2006; Brauchli, Jick et al. 2008; Qureshi,
Choi et al. 2009). Furthermore, a study reported a significant correlation between
insulin secretion, serum resistin levels (which is increased in insulin resistance) and the
Psoriasis Area and Severity Index (PASI), an assessment of PSO severity (Boehncke,
Thaci et al. 2007).
PSO can have profound emotional and social effects and negative impact on many
aspects of quality of life (Weiss, Kimball et al. 2002). Patients suffer from high levels of
anxiety and stress as the visible skin lesions can cause embarrassment (Tejada Cdos,
Mendoza-Sassi et al. 2011). An increased prevalence of chronic depression was
reported among patients with PSO without arthritis in the current study; a finding that
supports the outcome of a population-based cohort study (Kurd, Troxel et al. 2010),
in which the adjusted relative risk of depression (RR 1.39, 95% CI 1.37-1.41), anxiety
(RR 1.31, 95% CI 1.29-1.34) and suicidality (RR 1.44, 95% CI 1.32-1.57) was higher in
the PSO group compared to the general population.

146
Finally, a significant association was shown with the prevalence of gastrointestinal
disease including IBD, UC and CD. A study conducted on 12,502 patents with PSO
and 24,287 controls, showed that the prevalence of UC and CD was significantly
higher in the PSO group (OR 1.64, 95% CI 1.15-2.33 and OR 2.49, 95% CI 1.71-3.62,
respectively). The associations remained statistically significant even after excluding
patients treated with anti-TNFα drugs (Cohen, Dreiher et al. 2009). It is known that
PSO and inflammatory bowel disease are strongly genetically linked (Skroza, Proietti et
al. 2013).
In conclusion, the current study demonstrated higher prevalence of fatigue, chronic
pain and hypertension in participants with PsA compared to both PSO and the
controls, indicating that the additional inflammatory burden could lead to a higher
prevalence of comorbidities.
Second study 2.6.1.2
Rheumatic diseases, including RA, PsA, AS and SLE are associated with an increased
risk of comorbid conditions compared to the general population (Ursum, Korevaar et
al. 2013; Ursum, Nielen et al. 2013). Using UK Biobank, an increased prevalence and
incidence of chronic myocardial, vascular and pulmonary comorbidities and depression
in people with a range of chronic rheumatic diseases compared to those without these
conditions was found. The results are similar to previous cross-sectional studies
showing an increased prevalence of chronic comorbidities in people with rheumatic
diseases. Data from the Netherlands Information Network of General Practice showed
an increased prevalence of COPD (40% increase), cardiovascular disease (40%
increase) and depression (20% increase) at the time of diagnosis of rheumatic diseases
compared to age- and sex-matched controls (Ursum, Korevaar et al. 2013). Similar
results have been found in people with AS (Kang, Chen et al. 2010), PsA (Khraishi,
MacDonald et al. 2011), and RA (Symmons and Gabriel 2011).
Two previous meta-analyses showed that patients with RA have almost a twofold risk
of developing COPD (Ungprasert, Srivali et al. 2016) and a 70% increased risk of
having a myocardial infarction compared to controls (Avina-Zubieta, Thomas et al.
2012). Data from the Dutch Primary Care Database has also showed that patients with
rheumatic diseases have a 40% increased risk of developing depression compared to
controls without arthritis (Ursum, Nielen et al. 2013). Moreover, a cross-sectional

147
analysis of medical service and prescription drug claims database from the US, found a
30% increased prevalence of hypertension in people with either RA, PsA, or AS,
compared to controls without any of these conditions (Han, Robinson et al. 2006),
which is in line with the current study.
Physical activity has many benefits for patients with inflammatory rheumatic diseases,
including reducing disease activity and pain, increasing functional capacity, and
improving psychological health (Tierney, Fraser et al. 2012), as well as potentially
reducing the incidence of some comorbidities including cardiovascular disease,
diabetes, and osteoporosis (Warburton, Nicol et al. 2006). This study’s results are
consistent with other studies showing that people with rheumatic diseases are less
physically active compared to the general population (Henchoz, Bastardot et al. 2012),
and that a significant proportion do not carry out the recommended level of physical
activity (Manning, Hurley et al. 2012). Two previous studies did not see an association
between comorbidity and physical activity in people with a rheumatic disease (Greene,
Haldeman et al. 2006). This discordance may be explained by difference in the study
population: subjects included in the previous two studies also had other forms of
rheumatic diseases, including osteoarthritis and gout.
The current study compares the prevalence and incidence of common comorbidities
across a range of rheumatic diseases using a single, large, national cohort from the UK
using a consistent study design. The age- and sex-standardised prevalence rate ratios of
each of the comorbidities considered was increased in at least one rheumatic disease
compared to people without these conditions. Particularly high standardised
prevalence rate ratios for angina, stroke and myocardial infarction were seen in
participants with SLE. Compared to participants with no morbidity, participants with a
rheumatic disease and no comorbidity were less likely to have a moderate or high level
of physical activity. In addition, compared to participants with a rheumatic disease and
no comorbidity, those with a rheumatic disease and comorbidity were less likely to
have a moderate or high level of physical activity.

148
Study design 2.6.2
Strengths 2.6.2.1
The obvious strength of these two studies is that the prevalent chronic rheumatic
diseases were studied in a single large national cohort, with detailed demographic and
lifestyle data, as well as details about chronic diseases and medication collected in a
consistent way.
Regarding the first study, another strength is the use of a “healthy” cohort in the
analysis which can help clarify whether an observed association is a result of the
cutaneous part of the disease or the joint involvement. The majority of the studies
compare PsA with PSO as a referent group, often without assessing the latter for
arthritis. However, the coexisting skin and join involvement may cause an
overwhelming inflammatory status and alter the risk of comorbidity or the lifestyle
factor effect.
Limitations 2.6.2.2
Despite the obvious strengths of using a large population cohort, there some
limitations related mostly to the design of the UK Biobank. Due to the self-reported
nature of the data, there is a possibility of misclassification. However, the prevalence of
the rheumatic diseases used in the two studies matches closely with previously
published estimates (Gabriel and Michaud 2009). There has been limited validation of
self-reported medical conditions in UK Biobank to date; however one study has
suggested that the prevalence of overall pain and musculoskeletal-specific pain in UK
Biobank closely match estimates from large population studies with much higher
participation rates (Macfarlane, Beasley et al. 2015). In addition, some participants that
have been included in the study reported being diagnosed with an inflammatory
arthritis before the age of 18; these participants may have been developed juvenile
arthritis that has persisted in adulthood. Data on disease activity and severity was not
available. However, Husted et al. reported similar prevalence with the findings of the
first study after controlling for disease severity. At the same time, of the six studies
that have looked at the association of disease activity with physical activity, only one
found a modest association (Larkin and Kennedy 2014). Finally, because data on
physical activity and environmental factors were collected at a single point in time, it
was not possible to determine any temporal relationships. Another limitation of the

149
cross-sectional study design that has been used is that is prone to bias such the index
event bias that caused the spurious association between smoking and PsA.
Conclusion 2.6.3
Patients with inflammatory and rheumatic diseases have an increase of chronic
comorbidities compared to the general population that contribute to the further
reduced quality of life reported by the patients. Early detection and optimal
management of comorbid conditions in patients with a rheumatic disease may help to
reduce the impact of the increased comorbid burden seen in these patients. Patients
with a rheumatic disease should be encouraged to meet physical activity guidelines
where possible, which may help to reduce the risk of incident cardiovascular disease.
Longitudinal studies are needed to investigate the association of environmental factors
with the development of complex diseases.

150

151
Chapter 3 Genetics of PsA
3
Introduction 3.1
A key challenge in the discovery of genetic risk loci for PsA is reaching sufficient
sample sizes to adequately power the analysis to detect modest effect sizes. A number
of methods have now emerged that exploit pleiotropy between correlated traits to
improve statistical power. In the current chapter, I explore the use of these statistical
methods for estimating genetic correlation between PsA and related musculoskeletal
diseases, including RA, SLE, AS and JIA, and for the discovery of novel PsA associated
loci. These diseases are thought to be immune-mediated and are characterized by joint
inflammation and with multiple genetic variants contributing to their susceptibility,
many of which have been found to be common or “pleiotropic” among them as seen in
Table 29 (Cotsapas, Voight et al. 2011; Parkes, Cortes et al. 2013; Solovieff, Cotsapas
et al. 2013). This genetic overlap can encompass:
a common locus for which the same SNP confers increased risk for more than
one diseases
a common locus for which the same haplotype confers increased risk for one
disease but is protective for another, or
a common locus for which different haplotypes are implicated.
In contrast to pleiotropy which focuses on particular regions, genetic correlation
estimates the genome-wide correlation of all SNPs for two traits. Genetic correlation
can only exist if the directions of effects are consistently aligned between the traits
(Bulik-Sullivan, Finucane et al. 2015).

152
Table 29 | Shared pathways among immune-mediated diseases (Adapted from (Sun and Zhang 2014))
Region Reported gene(s) Biological annotations Associated diseases
1q23 FCGR2A Antigen processing and presentation AS, RA, SLE
1p13 PTPN22 T-cell receptor signaling pathway PsA, RA, SLE, JIA
1p31 IL23R IL-23/Th17 axis PSO, PsA, AS, JIA
1p36 RUNX3 CD8+ T lymphocyte differentiation PsA, AS
2q24.2 IFH1 Interferon signaling pathway PsA, PSO, SLE
2q32 STAT4 IL-23/Th17 axis RA, SLE, JIA, PSO
2p16. REL Rel/NF-κB family PsA, PSO, RA
5q33 IL12B Th1 cell differentiation PsA, PSO, AS
5q33 TNIP1 NF-κB pathway PSA, PSO, SLE
5q31.1 IL13 Th2 cell differentiation PsA, PSO
5q15 ERAP1, ERAP2 MHC class I processing AS, PSO, JIA
6q21 PRDM1 Type III interferon responses
regulation
RA, SLE
6q23 TNFAIP3 NF-κB pathway PsA, PSO, RA, SLE
6q25 TAGAP Signal transduction PSO, RA
10p15 IL2RA IL-2R signaling pathway JIA, RA
11q24.3 ETS1 Regulation of Th17 and B cells SLE, RA
16q24 IRF8 IRF family RA, SLE
16p13.13 SOCS1 IL-7RA/IL-7 pathway SLE, RA
16p11 IL27 IL-23/Th17 axis AS, SLE
18p11 PTPN2 JAK/STAT pathway regulation PSO, JIA
19p13 TYK2 IL-23/Th17 signaling RA, PsA, PSO, JIA, AS
22q11 UBE2L3 Ubiquitylation SLE, RA, AS, PSO, JIA
22q11 YDJC Ubiquitylation PSO, RA, SLE, JIA
22q13 IL2RB IL-2R signaling pathway JIA, RA
PsA: psoriatic arthritis; PSO: Psoriasis; AS: ankylosing spondylitis; SLE: systemic lupus
erythematosus; RA: rheumatoid arthritis; JIA: juvenile idiopathic arthritis; IL: Interleukin;
Th: T helper; MHC: Major Histocompatibility Complex;
All methods used to exploit the pleiotropy between diseases require only GWAS
summary statistics data and account for the use of common controls.

153
Aims and Objectives 3.2
The aim of this chapter is to identify novel PsA associated variants by leveraging power
from other musculoskeletal traits and, by extension, the common underlying pathways
among the musculoskeletal diseases. While the primary motivation is the discovery of
novel PsA association the methods employed will identify correlations between the
other four traits used in the analysis and these will also be described in the Appendix.
The objectives of this chapter are:
Harmonize the associations of the GWAS summary data to the same effect
allele using as a reference the 1000 Genomes Project
Explore the genetic correlation among the studied musculoskeletal diseases
Identify novel associations using cFDR analysis to the genetically correlated
diseases identified by the previous objective
Combine the datasets in a meta-analysis exploring two different methods
Contribution of the candidate 3.3
The candidate (EB) performed the data preparation, the planning, the statistical analysis
and the interpretation of the results.

154
Methods 3.4
GWAS summary statistics datasets 3.4.1
The summary statistics data were obtained from five studies on musculoskeletal
diseases. Both RA (Okada, Wu et al. 2014)
(http://plaza.umin.ac.jp/~yokada/datasource/software.htm) and SLE (Bentham, Morris et
al. 2015) (www.immunobase.org) datasets were publicly available, whereas the AS data
(Australo-Anglo-American Spondyloarthritis, Reveille et al. 2010) were provided upon
request. The PsA and JIA summary datasets are based on GWAS from the Arthritis
Research UK Centre for Genetics and Genomics (personal communication Dr. Anne
Hinks and Dr. John Bowes). Inclusion and exclusion criteria for RA, SLE and AS are
described in the original study publications. The sample numbers of the GWAS
summary datasets for the five diseases can be found in Table 30. The control groups
were partially overlapping as they were obtained from common data sources (e.g.
WTCCC2).
Table 30 | Sample sizes of the GWAS summary statistics datasets of the five musculoskeletal diseases
Disease dataset Number of Cases Number of Controls
RA 14,361 43,923
SLE 4,036 6,959
AS 2,951 6,658
PsA 2,443 5,129
JIA 1,472 5,181
RA: Rheumatoid Arthritis; SLE: Systematic Lupus Erythematosus; AS: Ankylosing
Spondylitis; PsA: Psoriatic Arthritis; JIA: Juvenile Idiopathic Arthritis
In addition, the 1000 Genomes phase 3 alleles frequencies dataset
(ALL.wgs.phase3_shapeit2_mvncall_integrated_v5b.20130502.sites.vcf.gz) was
downloaded from the International Genome Sample Resource
(ftp://ftp.1000genomes.ebi.ac.uk/vol1/ftp/phase3). This dataset contains the allele
frequencies for every SNP per population.

155
Pre-processing 3.4.2
Datasets 3.4.2.1
Due to inconsistencies in the format of publicly available GWAS summary association
statistics data, conversion into the same format is necessary to prevent any pitfalls in
the post-GWAS analyses. Initially, it is essential to bring all genetic analyses to the
same reference build. For that reason, genome positions in NCBI build 36 (UCSC hg
18) from the AS summary data were transferred to NCBI build 37 (UCSC hg19) using
the online tool Batch Coordinate Conversion (liftOver) from UCSC Genome Browser
(https://genome.ucsc.edu/cgi-bin/hgLiftOver). In addition, it is essential that the
summary statistics contain the following columns as they are needed by the post-
GWAS analysis methods used in the current chapter; SNP: the rs identification of
SNPs, CHR: chromosome number, BP: base pair positions, A1: effect allele, A2: other
allele, Z: z-score with respect to the allele A1, BETA: beta coefficient with respect to
allele A1, SE: standard error and N: sample size. Only the SLE data contained an OR
column, instead of BETA, along with its 95% CI. Thus, the BETA and SE were
computed using the formulas:
beta = log 𝑂𝑅 (1)
𝑠𝑒 = 𝐶𝐼𝑙𝑜𝑔𝑂𝑅𝐿
−𝑏𝑒𝑡𝑎
−1.96 (2)
where 𝐶𝐼𝑙𝑜𝑔𝑂𝑅𝐿 is the lower confidence bound (the upper bound can also be used but
instead of -1.96, 1.96 should be used). Moreover, none of the datasets included the z-
score so it was estimated with the following formula:
𝑧 − 𝑠𝑐𝑜𝑟𝑒 = 𝑏𝑒𝑡𝑎
𝑠𝑒 (3)
It should be noted that the AS dataset did not include any allele columns, thus the
alleles were imputed from the reference panel during the harmonization of the alleles
described in the next session. Finally, quality control was performed on the SNPs:
The MHC region, which exhibits both strong LD and strong association
with musculoskeletal diseases, was excluded from every summary statistics
dataset.
All non-biallelic SNPs were removed

156
All SNPs without rs ID or with duplicated rs ID were removed
All SNPs on chromosome X, Y and mitochondrial SNPs were removed.
Regarding the 1000 Genomes (1KG) dataset, variants that are neither SNPs nor bi-
allelic nor autosomal were removed and only the allele frequencies of the European
population (EUR_AF) were kept in the dataset. Then three additional columns named
as minor_allele and major_allele and euro_allele_frequency were created according to
the following pseudo-code so as EUR_AF to refer to minor_allele column (initially it is
referred to ALT column):
IF EUR_AF IS LESS THAN OR EQUAL TO 0.5 THEN:
minor_allele IS EQUAL TO ALT;
major_allele IS EQUAL TO REF;
euro_allele_frequency IS EQUAL TO EUR_AF;
ELSE:
minor_allele IS EQUAL TO REF;
major_allele IS EQUAL TO ALT;
euro_allele_frequency IS EQUAL TO 1-EUR_AF;
Harmonisation of datasets 3.4.2.2
The summary statistic data from different studies often suffer from allele coding
discordance and thus, aligning the alleles of each SNP from all the datasets against
those of a reference panel is essential. The process requires the reversal of signs of the
betas and Z-scores if the alleles of a SNP in the summary stats are the reverse of the
alleles of the reference panel. Thus, each study dataset was merged to the updated
version of 1KG dataset that was created as described in the previous section. If the
minor_allele from 1KG was different from the study’s A1 allele then the signs of betas
and Z-scores were flipped.

157
Statistical analysis 3.4.3
Estimation of genome-wide genetic correlation 3.4.3.1
Elucidating the complex relationships and underlying pathways among diseases is a
primary aim of epidemiology. Genetic variations can assist in shedding some light in
cause and effect, as they are more robust to confounding and reverse causality. This
can be achieved by looking for correlations in effect sizes from summary data of
GWAS analyses among complex diseases.
In the current study all five musculoskeletal conditions present a polygenic architecture
(in which inheritance is affected by thousands of SNPs with small effects), thus the
pairwise genetic correlation between them was estimated using the cross-trait LD
Score regression (Bulik-Sullivan, Finucane et al. 2015). This method is used to test for
genetic overlap among traits and diseases using GWAS summary statistics and is not
affected by sample overlap. The key assumption behind this approach is that the
variants that have high LD scores - a measure of the extent a variant is in LD with its
neighbour variants - are more likely to tag causal SNPs and have a higher χ2 statistic on
average compared to those with low LD scores. LD Score regression can also be used
to control for population stratification and estimate the genetic heritability as it
exploits the expected relationships between true association signals and local LD
around them.
In the current study, pre-computed LD Scores were downloaded for HapMap3 SNPs
from the LDScore website https://data.broadinstitute.org/alkesgroup/LDSCORE/ (File
eur_w_ld_chr.tar.bz2). Moreover, as imputation quality is correlated with LD Score
and low imputation quality (INFO) yields lower test statistics, it is suggested that SNPs
with INFO<0.9 should be removed from the analysis. Due to the lack of the INFO
column in the datasets that were used, the filtering was performed using HapMap3
SNPs, as recommended from (Bulik-Sullivan, Finucane et al. 2015). The file containing
the HapMap3 SNPs was downloaded from the above-mentioned website (File
w_hm3.snplist.bz2).
Correlation is scaled between -1 and +1 depending on whether it is a positive or a
negative correlation.

158
In order to verify the findings from the analyses, LD Hub was used
(http://ldsc.broadinstitute.org/ldhub/) to technically validate a subset of the findings; this
is a web interface that contains summary-level GWAS data for 173 traits including RA
and SLE and automates the LD score regression analysis and was applied to the PsA
and JIA data (Zheng, Erzurumluoglu et al. 2017). Full analysis on LD Hub was not
possible due to the limited public availability of some of the datasets.
cFDR analysis 3.4.3.2
In GWAS the parallel testing of millions of potential markers with a comparatively low
number of samples, requires the use of a stringent significance threshold in order to
limit Type 1 errors (false positives). As a result, the identification of variants with small
effect sizes requires large sample sizes which in turn are costly and time-consuming.
The leverage of power from genetically related diseases can improve detection of
associated variants without requiring larger data samples. The Bayesian cFDR analysis
establishes an upper bound on the FDR across a set of variants whose p-values are
both less than two disease-specific thresholds (Andreassen, Djurovic et al. 2013; Liley
and Wallace 2015).
Genomic control 3.4.3.2.1
No additional genomic control was performed due to the fact that all the studies had
already been corrected for genomic inflation, as can be seen in the original publications
(Australo-Anglo-American Spondyloarthritis, Reveille et al. 2010; Okada, Wu et al.
2014; Bentham, Morris et al. 2015).
Pleiotropic enrichment estimation 3.4.3.2.2
A Quantile-Quantile (Q-Q) plot is a graph indicating the observed distribution of a
random variable against the expected distribution. In GWAS, Q-Q plots are often used
to present the observed association across SNPs with the expected distribution of
association test statistics under the null hypothesis. A true association is observed
when there is a deviation from the identity line. Thus, to assess pleiotropic enrichment
of association, Q-Q plots conditioned on “pleiotropic” effects with varying strengths of
association in the conditional trait were used based on Andreassen et al. (Andreassen,
Djurovic et al. 2013). The conditional Q-Q graphs were plotted for quantiles of
nominal −𝑙𝑜𝑔10(𝑃) values for association of the subset of SNPs below each
significance threshold in the conditional disorder. The nominal P-values −𝑙𝑜𝑔10(𝑃)

159
were plotted on the y-axis and the empirical quantiles −𝑙𝑜𝑔10(𝑞) were plotted on the
x-axis. Any leftward shift from the identity line as the principal phenotype is
successively conditioned on more stringent significance criteria indicates a pleiotropic
enrichment. Greater spacing between the curves implies a stronger trend of
enrichment shared between the two traits (Andreassen, Djurovic et al. 2013).
Q-Q plots were constructed for each pair of diseases that were significantly correlated
as shown by the LD Score regression analysis, using each trait both as principal and as
conditional.
Estimation of the cFDR 3.4.3.2.3
The enrichment seen in the Q-Q plots can be interpreted in terms of FDR. FDR is the
rate that features called significant are truly null and is given by the formula
𝐹𝐷𝑅 = 𝐸 [𝑁𝑢𝑚𝑏𝑒𝑟 𝑜𝑓 𝑓𝑎𝑙𝑠𝑒 𝑝𝑟𝑒𝑑𝑖𝑐𝑡𝑖𝑜𝑛𝑠
𝑁𝑢𝑚𝑏𝑒𝑟 𝑜𝑓 𝑡𝑜𝑡𝑎𝑙 𝑝𝑟𝑒𝑑𝑖𝑐𝑡𝑖𝑜𝑛𝑠]
For example an FDR of 5% means that among 100 features called significant, five are
truly null.
FDR can also be defined as
𝐹𝐷𝑅 ≈ 𝑝
𝑞
which is the equivalent to the nominal p-value divided by the empirical quantile as
described in the previous section. Using the −𝑙𝑜𝑔10 conversion
−𝑙𝑜𝑔10(𝐹𝐷𝑅(𝑝)) ≈ 𝑙𝑜𝑔10(𝑞) − 𝑙𝑜𝑔10(𝑝)
a value is obtained that corresponds to the horizontal shift of the curves in the Q-Q
plots, with a larger shift corresponding to a smaller FDR.
Finally, conditional FDR is the posterior probability that a given variant is null for the
first phenotype given that the p-values for both are as small or smaller as the observed
p-values (Andreassen, Djurovic et al. 2013).
In the current study, the extended cFDR method by Liley et al. was used as it allows
the use of shared controls between the studies (Liley and Wallace 2015). This

160
improves the accuracy of the effect size estimates as no splitting of the control cohort
among studies is required. The cFDR was calculated for each SNP where the
significantly correlated pairs of musculoskeletal diseases served either as the principal
phenotype or as the conditional one. To assess whether the cFDR method leads to the
enrichment of a specific locus, a less conservative significance cut-off was used; the
method chooses the cFDR a SNP would have if it had a principal p-value of 5e-08 and a
conditional p-value of 1. The value of the cut-off is a bound on the FDR for the GWAS
analysis (that is, rejecting the null whenever p-value<5e-08).
Conjunctional cFDR (ccFDR) 3.4.3.2.4
To identify the pleiotropic loci, that is the SNPs that were associated with both
diseases - a conjunction cFDR was used (Andreassen, Thompson et al. 2015). The
ccFDR was estimated as the maximum cFDR of the two traits
𝑚𝑎𝑥{𝑐𝐹𝐷𝑅𝑡𝑟𝑎𝑖𝑡1 | 𝑡𝑟𝑎𝑖𝑡2, 𝑐𝐹𝐷𝑅𝑡𝑟𝑎𝑖𝑡2 | 𝑡𝑟𝑎𝑖𝑡1}
Again, the most significant SNP in each LD block was reported based on the minimum
ccFDR.
MTAG analysis 3.4.3.3
Another method to identify novel variants used in the current study is MTAG, a joint
analysis of GWAS summary statistics from different traits robust to sample overlap.
MTAG can be applied to a cluster of traits with known or suspected genetic
correlation, such as autoimmune disease with resulting gains in statistical power.
Therefore the effect estimates for each trait can be improved with the incorporation
of information contained in the GWAS estimates for the other related traits (Turley,
Walters et al. 2018).
MTAG is a generalised version of the inverse-variance-weighted meta-analysis that
produces trait-specific association statistics. It uses bivariate LD score regression to
account for the overlapping samples and is based on the key assumption that all SNPs
have the same effect sizes across traits. As shown by Turley et al., even when some
SNPs are not associated with some traits (a violation of the key assumption), MTAG is
still a consistent estimator (Turley, Walters et al. 2018).

161
MTAG was applied to the intersection of SNPs from the summary statistics of all five
musculoskeletal diseases to exploit the expected gains in power. This method requires
filtering of effect allele frequency (EAF) to exclude rare variants. As the EAFs were not
available in the summary statistics datasets, the 1KG allele frequencies (updated
variable euro_allele_frequency) were used.
Manhattan plots, using R package “qqman”, were created to illustrate the localisation
of the genetic markers associated with the traits, plotting all SNPs within an LD block
in relation to their chromosomal location.
Subset-based analysis (ASSET) 3.4.3.4
An alternative meta-analysis method used to conduct association analysis is based on
subsets (ASSET) methodology. This method’s main advantage is that it can account for
subset-specific and bidirectional effects of individual SNPs; thus, it gains a substantial
power compared to the basic meta-analysis method of fixed-effects (Bhattacharjee,
Rajaraman et al. 2012).
The subset-based meta-analysis (SBM) is a generalised fixed-effects meta-analysis model
which investigates all possible subsets of traits for the presence of true associations by
incorporating a multiple-testing adjustment procedure. The method that has been
implemented in the R package “ASSET” performs both one-sided and two-sided
analysis. The one-sided method identifies the traits that have associations in the same
direction, whereas the two-sided method applies one-sided subset search separately
for positively and negatively associated traits for a given SNP and then combines the
signals from the two directions in to a single combined χ2 statistic. Both methods
account for correlation among the studied traits due to shared subjects.
For the application of the methods, the use of case-control overlap matrices N11, N10
and N00 are required which specify the number of cases, controls and the cases that
served as controls among studies.
In the current study the following matrices were used:

162
N11
RA SLE AS PsA JIA
RA 14,361 0 0 0 0
SLE 0 4,036 0 0 0
AS 0 0 2,951 0 0
PsA 0 0 0 2,443 0
JIA 0 0 0 0 1,472
The table denotes the number of cases that are shared between the disease studies. The
diagonal contains the number of cases in each disease study. The zeros indicate the absence of
overlap among the studies.
N00
RA SLE AS PsA JIA
RA 43,923 231 5,847 5,129 5,181
SLE 231 6,959 231 231 231
AS 5,847 231 6,658 3,000 3,000
PsA 5,129 231 3,000 5,129 5,129
JIA 5,181 231 3,000 5,129 5,181
The table denotes the number of controls that are shared between the disease studies (non-
diagonal elements of the table). The diagonal contains the number of controls in each disease
study.
N10
controls
cases RA SLE AS PsA JIA
RA 0 0 0 0 0
SLE 0 0 0 0 0
AS 0 0 0 0 0
PsA 0 0 0 0 0
JIA 0 0 0 0 0
The table denotes the number of cases in a disease study that were used as controls in
another disease study. By definition, the diagonal is zero since cases cannot serve as controls
and vice versa in the same study.

163
Results 3.5
Genetic overlap between the diseases 3.5.1
The genome-wide correlation for each pair of musculoskeletal disorders was assessed
using the LD Score regression (Figure 14, Figure 15). The pairs which significantly
overlap were RA-SLE (rg=0.49, p-value=1.93e-14), RA-PsA (rg=0.30, p-value=0.002),
RA-JIA (rg=0.49, p-value=4.3e-05), SLE-JIA (rg=0.60, p-value=2.00e-04) and PsA-JIA
(rg=0.67, p-value=5.3e-06). Also, AS presented a negative weak association with both
PsA (rg=-0.14, p-value=0.005) and JIA (rg=-0.12, p-value=0.045). This weak association
between PsA and AS could be due to the absence of axial sub-phenotype in the PsA
cohort. The findings were verified for both PsA and JIA by using LD hub (Appendix
Table 2).
Figure 14 | Genetic correlation for each pair of the five musculoskeletal disorders. The pairs RA-SLE, RA-PsA, RA-JIA, SLE-JIA, AS-PsA, AS-JIA and PsA-JIA presented a statistically significant correlation. Red colour indicates negative correlation, blue indicates positive correlation and white indicates no correlation. P-values are also presented.

164
Figure 15 | Dendrogram clustering the diseases on correlation “distances”. The dissimilarity measure 1-abs(correlation) was used to discriminate all correlated pairs and is presented as the clustering height (y-axis). PsA and JIA are clustered together, then RA and SLE create their own cluster. AS is in its own branch.
cFDR analysis 3.5.2
The pleiotropy-informed cFDR analysis was applied to the pairs of diseases that
presented a significant genetic correlation during the LD score regression analysis
including RA-SLE, RA-PsA, RA-JIA, SLE-JIA, PsA-JIA, PsA-AS and AS-JIA. Initially, each
Q-Q plot-based enrichment analysis was performed for each pair and then all SNPs
identified were reported. Finally, pleiotropic SNPs affecting both diseases in a pair
were also identified. In the main body of the thesis only the cFDR analysis using PsA as
the principal disease is described. The analysis for the rest of the pairs of diseases is
analytically described in the Appendix.

165
cFDR analysis using PsA as the principal disease 3.5.2.1
Enrichment plots 3.5.2.1.1
Q-Q plots of nominal p-values from GWAS summary statistic data can be used to
visualise the enrichment of the observed statistical association relative to that
expected under the null hypothesis. Figure 16 depicts the conditional Q-Q plots for
PsA given nominal p-values of association with RA (PsA|RA), AS (PsA|AS) and JIA
(PsA|JIA). It shows enrichment across different significance values for the three
conditional diseases. The successive leftward shifts for decreasing nominal p-values of
each of the RA, AS and JIA indicate that the proportion of non-null effects in PsA
varies considerably across the distinct levels of association with either RA, AS or JIA.
The slopes of the Q-Q plots of PsA associations increased as the plotted SNP sets
become more strongly associated with each of the conditional diseases providing
evidence of pleiotropy.

166
Figure 16 | Q-Q plots for PsA conditional on RA (top), AS (left) and JIA (right). Y axes show log10(P’) for each principal disease and X axes show the log quantile of p-values in sets of SNPs. The degree of leftward shift of a black point from the diagonal is proportional to the unconditional FDR of that p-value for the principal phenotype, and the degree of leftward shift of a coloured point is proportional to the conditional FDR of the p-value for the principal phenotype and the p-cutoff corresponding to the colour for the conditional phenotype. Each colour corresponds to the Q-Q plot for 𝒑𝑷𝒔𝑨 amongst a subset of SNPs with 𝒑𝑹𝑨𝒐𝒓 𝒑𝑨𝑺𝒐𝒓 𝒑𝑱𝑰𝑨less than the indicated cutoff.
A leftward shift with decreasing 𝒑𝑹𝑨𝒐𝒓 𝒑𝑨𝑺𝒐𝒓 𝒑𝑱𝑰𝑨cut-off indicates that SNPs which are associated
with the conditional phenotype (RA, AS or JIA) are more likely to be associated with the principal phenotype (PsA), presumably due to pleiotropic effects on phenotypes.

167
PsA loci identified with cFDR 3.5.2.1.2
As shown in Figure 17, conditioning PsA on RA led to the identification of 61
significant SNPs (orange colour, top plot left of the vertical line), while 37 (orange
colour, bottom left) and 30 (orange colour, bottom right) were identified when
conditioned on AS and JIA, respectively. The identified SNPs map to eight independent
loci and the list of index SNPs for each region can be seen in Table 31. All novel
associations identified in this analysis for PsA have been previously reported to be
associated with PSO or PsA, either directly or indirectly as a proxy SNP being in LD
with the SNP associated with the disease.
Figure 17 | cFDR results for PsA conditioned on RA (top), AS (bottom left) and JIA (bottom right). The black vertical line signifies the GWAS significance threshold 5e-08. The red dots signify the genome-wide significant SNPs for the principal disease (here, PsA), whereas the orange dots (on the left side of the vertical line) signify the SNPs identified as significant for PsA after conditioning on the conditional disease (RA, AS or JIA). Black dots show a random sample of the observed p-value pairs. Note that the leftward shift of colours corresponding to an increased p-value threshold for association with PsA for SNPs with low p-values for the conditional diseases.

168
Table 31 | Loci associated with PsA after applying cFDR analysis using as conditional phenotypes RA, AS and JIA
Chr Position rsid effect
allele
other
allele
MAF conditional
phenotype
principal
p-value
conditional
p-value
cFDRprinc.|cond. Gene Consequence Associated Trait
1 114377568 rs2476601 A G 0.09
RA
2.66e-04 1.56e-144 4.63e-04 PTPN22 missense variant RA,T1D,CD
p: JIA, g: PsA
2 163110536 rs2111485 A G 0.40 5.47e-08 2.57e-02 2.50e-04 IFIN1 intergenic variant IBD, vitiligo
p:T1D,IgA,PSO
mixed
6 138199417 rs610604 G T 0.34 2.51e-07 6.59e-06 3.56e-05 TNFAIP3 intron variant PSO
19 10469975 rs12720356 C A 0.09 9.42e-08 8.80e-07 1.18e-05 TYK2 missense variant PSO, IBD, CD
1 25294345 rs7536848 A C 0.46 AS
3.15e-07 8.23e-09 1.47e-05 RUNX3 upstream gene variant p: PSO, AS
2 62559205 rs6759003 T C 0.38 5.17E-07 1.52e-21 1.80e-05 p: PSO, AS, CD
1 25293941 rs4648890 G A 0.46
JIA
3.15e-07 6.61e-05 1.42e-04 RUNX3 upstream gene variant p: PSO, Celiac
disease, AS
16 11354091 rs413024 G A 0.32 2.24e-06 1.88e-05 6.00e-04 SOCS1 upstream gene variant PBC, p: PSO
Chr: Chromosome; MAF; Minor Allele Frequency; cFDR: conditional False Discovery Rate; princ.: principal; cond.: conditional; RA: Rheumatoid Arthritis; T1D: Type 1 Diabetes;
CD: Crohn’s Disease; p: proxy SNP to the reported SNP associated with ; JIA: Juvenile Idiopathic Arthritis; IBD: Inflammatory Bowel Disease; PSO: Psoriasis; AS: Ankylosing Spondylitis;
g: gene associated with; PBC: Primary Biliary Cirrhosis/Cholangitis; mixed: mixed population (Europeans and Asians)
PsA|RA cut-off = 6.13e-04; PSA|AS cut-off: 4.54e-04; PSA|JIA cut-off: 6.23e-04
The Associated Traits for the reported SNP have been detected using PhenoScanner with parameters; catalogue: GWAS, p-value cut-off: 5e-08, proxies: Yes; r-squared: 0

169
Pleiotropic loci identified with conjunctional cFDR (ccFDR) 3.5.2.2
To identify pleiotropic variants among each genetic correlated pair, a conjunctional
FDR analysis was performed. The pair PsA and JIA shares a pleiotropic SNP, rs413024
(SOCS1), in chromosome 16 with ccFDR<2.40e-03. Moreover, a pleiotropic SNP was
detected, rs16903065 (RP11-89M16.1), associated with both JIA and RA with
ccFDR<1.29e-03. For both variants the direction of the effect (z-scores) was the same
for both diseases per pair.
MTAG 3.5.3
MTAG was applied to summary statistics from the five single-trait analyses described
above.
Table 32 presents the gain in average power for each trait using MTAG. The resulting
GWAS-equivalent sizes were 11686 for PsA, 22311 for JIA, 67303 for RA, 13200 for
SLE and 9883 for AS, yielding gains equivalent to increasing the original samples by
54%, 235%, 16%, 20% and 3%, respectively. The use of MTAG resulted in an impressive
gain in power for JIA, whereas the power increase for detecting novel loci for AS was
minimal and reflects the lack of genetic correlation with the other traits.
Manhattan plots were used to represent the p-values of disease variants (in both
original GWAS and MTAG analysis) on a genomic scale. The p-values are represented
in genomic order by chromosome and position on the chromosome (x-axis). The y-
axis represents the −𝑙𝑜𝑔10of the P value (equivalent to the number of zeros after the
decimal point plus one).
In this chapter, only the MTAG results for PsA are presented and the findings for the
remaining musculoskeletal diseases are presented in the Appendix.

170
Table 32 | Power gain when using MTAG approach
Trait Sample size SNPs used GWAS equivalent (max.) sample size
PsA 7,572
2,167,678
11,686 JIA 6,653 22,311 SLE 10,995 13,200 RA 58,284 67,303 AS 9,609 9,883 SNP: Single Nucleotide Polymorphism; GWAS: Genome-Wide Association Studies; max.: maximum; PsA: Psoriatic Arthritis; JIA: Juvenile Idiopathic Arthritis; SLE: Systemic Lupus Erythematosus;
RA: Rheumatoid Arthritis; AS: Ankylosing spondylitis
PsA loci identified with MTAG 3.5.3.1
The significant associations to SNPs with at least a marginal association in the original
PsA summary statistics (p-value = 0.05) for PsA are presented in Table 33 with bright
purple colour and Table 34 presents the SNPs with original p-value>0.05, whereas the
Manhattan plot (Figure 18) presents the PsA-associated variants before and after
applying MTAG.
Sixteen loci passed the significance threshold of 5e-08 of which 11 were novel for
PSO/PsA. Two of the novel SNPs (rs2135755 and rs12990970) were intergenic
variants being associated with celiac disease and RA, and were found to be protective
of PsA (OR 0.91 with p=7e-12 and OR 0.92 with p=2.01e-09, respectively).
Furthermore, four new signals were found to contribute to the susceptibility of PsA
including AC006460.2 (rs744600, OR 1.08, p = 1.18e-08), RP4-590F24.1 (rs12563513,
OR 1.16, p = 2.63e-10), ITPR3 (rs2296330, OR 1.09, p = 4.61e-08) and PTPN2
(rs2542151, OR 1.12, p = 6.16e-09). The remaining five associations were found to be
protective of PsA; IL12RB2 (rs6693065, OR 0.92, p = 4.61e-08), ANKRD55 (rs6859219,
OR 0.91, p = 9.48e-09), IRF5 (rs3807306, OR 0.90, p = 6.99e-15), RP11-279F6.3
(rs12899564, OR 0.85, p = 6.10e-10) and ICAM3 (rs2278442, OR 0.90, p = 1.40e-13).
Finally, the strongest evidence of association was with the PTPN22 locus (rs6679677,
OR 1.45, p = 2.11e-57) which has been previously been reported to be associated with
PsA. In addition, STAT4 (rs11889341, OR 1.16, p = 2.17e-20), SOCS1 (rs243325, OR
0.92, p = 5.91 e-09), IFIH1 (rs2111485, OR 0.92, p = 9.96e-10) and YDJC (rs11089637,
OR 1.14, p = 6.93e-13) have been previously associated with PSO and/or PsA.
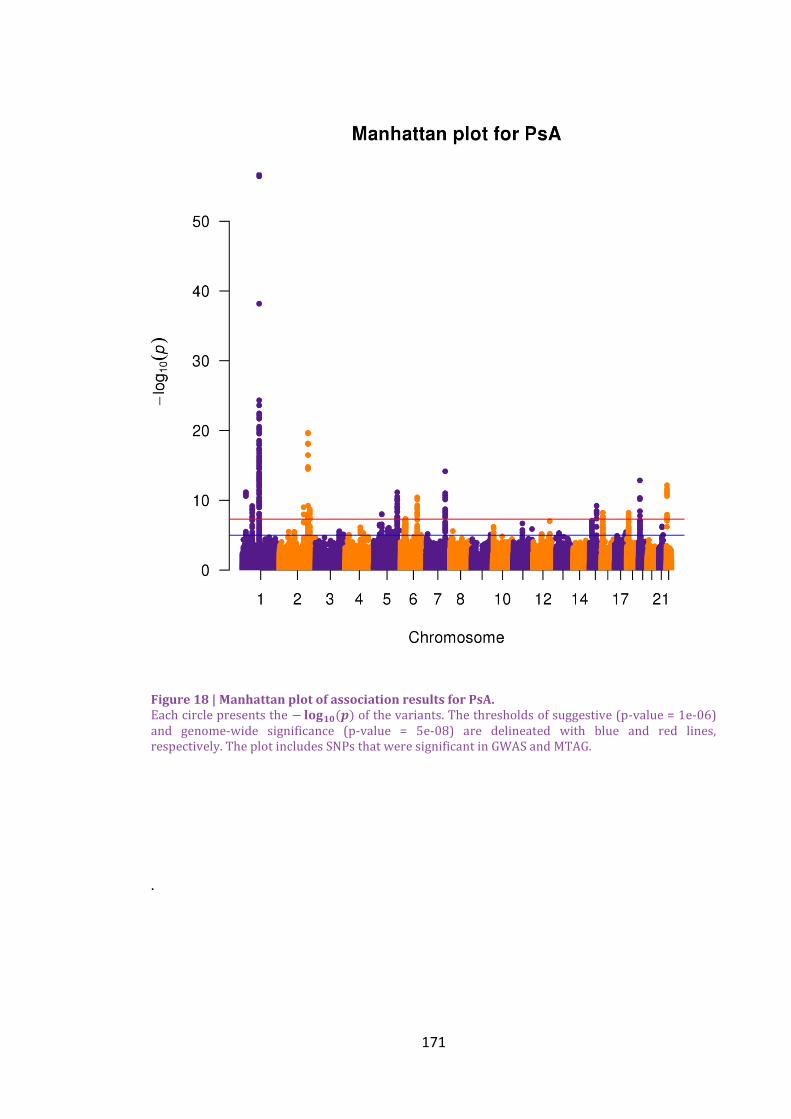
171
Figure 18 | Manhattan plot of association results for PsA. Each circle presents the − 𝐥𝐨𝐠𝟏𝟎(𝒑) of the variants. The thresholds of suggestive (p-value = 1e-06) and genome-wide significance (p-value = 5e-08) are delineated with blue and red lines, respectively. The plot includes SNPs that were significant in GWAS and MTAG.
.

172
Table 33 | MTAG results for PsA (presented for original PsA p-value≤0.05)
C
hr
Position rsid effect
allele
other
allele
MAF PsA
p-value
MTAG
p-value
MTAG
OR
MTAG
95% CI
Gene Consequence Associated Trait
1 25302495 rs2135755 G A 0.46 2.30e-07 7.00e-12 0.91 0.89-0.94 intergenic variant p: Celiac, IgAD
1 114303808 rs6679677 A C 0.09 3.11e-04 2.11e-57 1.45 1.38-1.51 PTPN22 upstream gene variant CD, RA, T1D, JIA, p:PSA
1 67800018 rs6693065 G A 0.24 8.84e-04 4.61e-08 0.92 0.89-0.95 IL12RB2 intron variant
2 191943742 rs11889341 T C 0.23 7.63e-03 2.17e-20 1.16 1.12-1.19 STAT4 intron variant RA, g: PSO
p: SLE, MS, PsA
2 204700689 rs12990970 T C 0.45 3.52e-02 2.01e-09 0.92 0.90-0.95 intergenic variant RA
2 163110536 rs2111485 A G 0.40 5.47e-08 9.96e-10 0.92 0.90-0.94 IFIH1 intergenic variant IBD, p:PSO,T1D, IgAD
2 191564757 rs744600 G T 0.39 1.63e-02 1.18e-08 1.08 1.05-1.11 AC006460.2 intron & non coding
transcript variant
Height
5 55438580 rs6859219 A C 0.22 5.68e-02 9.48e-09 0.91 0.88-0.94 ANKRD55 intron variant RA, p: JIA, CD
7 128580680 rs3807306 G T 0.49 1.94e-03 6.99e-15 0.90 0.88-0.93 IRF5 intron variant RA, PBC, MI
15 69985284 rs12899564 G C 0.07 1.10e-03 6.10e-10 0.85 0.81-0.90 RP11-
279F6.3
intron & non coding
transcript variant
RA
16 11354497 rs243325 C T 0.34 7.00e-06 5.91e-09 0.92 0.90-0.95 SOCS1 upstream gene variant CD, PBC, p:PSO
19 10444826 rs2278442 G A 0.34 1.64e-06 1.40e-13 0.90 0.88-0.93 ICAM3 intron variant RA
22 21979096 rs11089637 C T 0.17 7.56e-05 6.93e-13 1.14 1.10-1.18 YDJC downstream gene variant RA,HDL,IBD, p: PSO
Chr: Chromosome; MAF; Minor Allele Frequency; MTAG: Multi-Trait Analysis of GWAS; OR: Odds Ratio; CI: Confidence Interval; IgAD: Immunoglobulin A Deficiency;
p: proxy SNP; CD: Crohn’s Disease; RA: Rheumatoid Arthritis; T1D: Type 1 Diabetes; JIA: Juvenile Idiopathic Arthritis; IBD: Inflammatory Bowel Disease; PSO: Psoriasis;
PBC: Primary Biliary Cirrhosis/Cholangitis; MS: Multiple Sclerosis
The Associated Traits have been detected using PhenoScanner (version 1.1) with parameters catalogue: GWAS, p-value cut-off: 5e-08, proxies: Yes; r-squared: 0.8
The novel loci are presented with bright purple.

173
Table 34 | MTAG results for PsA (original PsA p-value>0.05)
Chr Position rsid effect
allele
other
allele
MAF PsA
p-value
MTAG
p-value
MTAG
OR
MTAG
95% CI
Gene Consequence Associated Trait
1 114547798 rs12563513 A G 0.09 6.66e-01 2.63e-10 1.16 1.11-1.21 RP4-
590F24.1
upstream gene variant RA
6 33650621 rs2296330 A G 0.24 6.89e-01 4.61e-08 1.09 1.06-1.12 ITPR3 intron variant RA, Height
18 12779947 rs2542151 G T 0.14 1.10e-01 6.16e-09 1.12 1.08-1.16 PTPN2 upstream gene variant CD,IBD,RA,T1D,IgAD,
p: JIA
Chr: Chromosome; MAF; Minor Allele Frequency; MTAG: Multi-Trait Analysis of GWAS; OR: Odds Ratio; CI: Confidence Interval; RA: Rheumatoid Arthritis; CD: Crohn’s Disease;
IBD: Inflammatory Bowel Disease; T1D: Type 1 Diabetes; IgAD: Immunoglobulin A Deficiency; p: proxy SNP;; JIA: Juvenile Idiopathic Arthritis;
The Associated Traits have been detected using PhenoScanner (version 1.1) with parameters catalogue: GWAS, p-value cut-off: 5e-08, proxies: Yes; r-squared: 0.8

174
Sub-based analysis (ASSET) 3.5.4
The SBM method has the ability to detect susceptibility loci, and the clusters of traits
that have a shared genetic architecture were used to investigate any novel SNPs
contributing to the susceptibility of PsA. Table 35 shows the loci per disease identified
by the method and the subset of traits for each association signal with the same
direction. Three independent SNPs remained for PsA and AS, 16 for JIA, 6 for RA and
29 for SLE. The three association genes for PsA were IFIH1 (rs1990760, OR 0.85, psubset
= 5.6e-10), ICAM3 (rs2278442, OR 0.90, psubset = 5.3e-15) and CCDC116 (rs5754467,
OR 1.26, psubset = 3.1e-18). The latter SNP has been found to be associated with SLE
and CD and the gene with PSO. In addition, a rare allele in IFIH1 (rs35667974) has
been previously reported to be protective of PsA (Budu-Aggrey, Bowes et al. 2017);
however, it is independent from the SNP found in the current analysis. Both SBM and
MTAG identified rs2278442 (ICAM3) and IFH1 (rs2111485 and rs1990760 are in LD) to
be associated with PsA. The largest number of identified associations by MTAG could
be due to its approach to use estimates of heritability based on genome-wide set of
SNPs making MTAG more powerful when the diseases under study share strong
genetic correlation.
Figure 19 and Figure 20 depict the frequency of the appearance of disease clusters for
only the novel loci and the total identified association SNPs, respectively. The most
frequent subset of diseases sharing novel loci was the RA-SLE (n=12), followed by the
JIA-RA-SLE (n=6). For rs2278442 (ICAM3), PsA, JIA, RA and SLE had the same
association signal direction (Figure 19). In addition, SBM identified a significant
association between rs16903065 and both JIA and RA. This SNP was also identified by
ccFDR to be pleiotropic for JIA and RA (section 3.5.2.2).
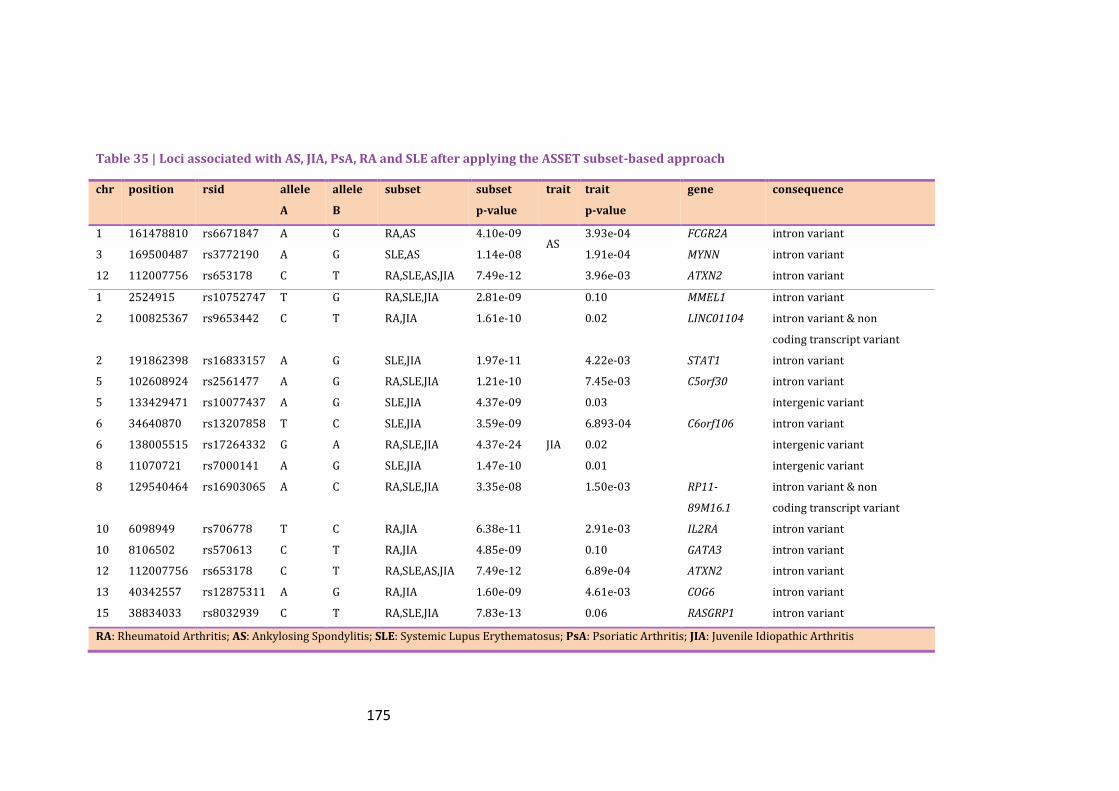
175
Table 35 | Loci associated with AS, JIA, PsA, RA and SLE after applying the ASSET subset-based approach
chr position rsid allele
A
allele
B
subset subset
p-value
trait trait
p-value
gene consequence
1 161478810 rs6671847 A G RA,AS 4.10e-09 AS
3.93e-04 FCGR2A intron variant
3 169500487 rs3772190 A G SLE,AS 1.14e-08 1.91e-04 MYNN intron variant
12 112007756 rs653178 C T RA,SLE,AS,JIA 7.49e-12 3.96e-03 ATXN2 intron variant
1 2524915 rs10752747 T G RA,SLE,JIA 2.81e-09
JIA
0.10 MMEL1 intron variant
2 100825367 rs9653442 C T RA,JIA 1.61e-10 0.02 LINC01104 intron variant & non
coding transcript variant
2 191862398 rs16833157 A G SLE,JIA 1.97e-11 4.22e-03 STAT1 intron variant
5 102608924 rs2561477 A G RA,SLE,JIA 1.21e-10 7.45e-03 C5orf30 intron variant
5 133429471 rs10077437 A G SLE,JIA 4.37e-09 0.03 intergenic variant
6 34640870 rs13207858 T C SLE,JIA 3.59e-09 6.893-04 C6orf106 intron variant
6 138005515 rs17264332 G A RA,SLE,JIA 4.37e-24 0.02 intergenic variant
8 11070721 rs7000141 A G SLE,JIA 1.47e-10 0.01 intergenic variant
8 129540464 rs16903065 A C RA,SLE,JIA 3.35e-08 1.50e-03 RP11-
89M16.1
intron variant & non
coding transcript variant
10 6098949 rs706778 T C RA,JIA 6.38e-11 2.91e-03 IL2RA intron variant
10 8106502 rs570613 C T RA,JIA 4.85e-09 0.10 GATA3 intron variant
12 112007756 rs653178 C T RA,SLE,AS,JIA 7.49e-12 6.89e-04 ATXN2 intron variant
13 40342557 rs12875311 A G RA,JIA 1.60e-09 4.61e-03 COG6 intron variant
15 38834033 rs8032939 C T RA,SLE,JIA 7.83e-13 0.06 RASGRP1 intron variant
RA: Rheumatoid Arthritis; AS: Ankylosing Spondylitis; SLE: Systemic Lupus Erythematosus; PsA: Psoriatic Arthritis; JIA: Juvenile Idiopathic Arthritis
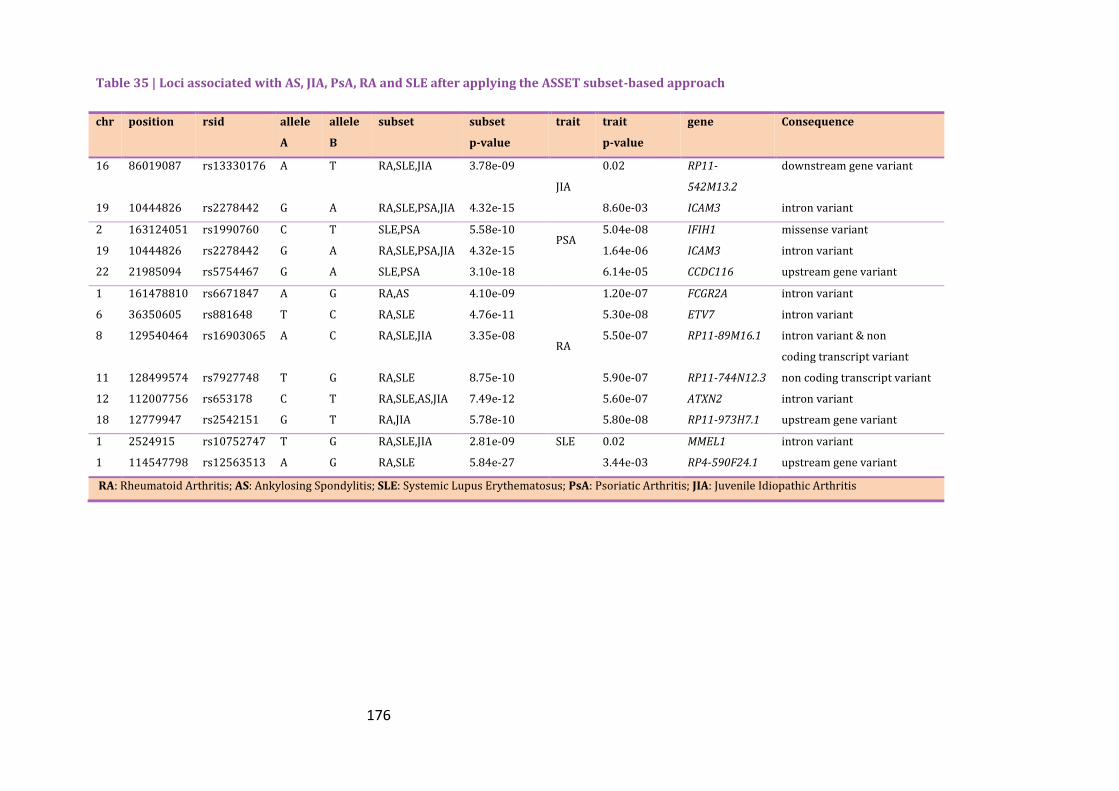
176
Table 35 | Loci associated with AS, JIA, PsA, RA and SLE after applying the ASSET subset-based approach
chr position rsid allele
A
allele
B
subset subset
p-value
trait trait
p-value
gene Consequence
16 86019087 rs13330176 A T RA,SLE,JIA 3.78e-09
JIA
0.02 RP11-
542M13.2
downstream gene variant
19 10444826 rs2278442 G A RA,SLE,PSA,JIA 4.32e-15 8.60e-03 ICAM3 intron variant
2 163124051 rs1990760 C T SLE,PSA 5.58e-10 PSA
5.04e-08 IFIH1 missense variant
19 10444826 rs2278442 G A RA,SLE,PSA,JIA 4.32e-15 1.64e-06 ICAM3 intron variant
22 21985094 rs5754467 G A SLE,PSA 3.10e-18 6.14e-05 CCDC116 upstream gene variant
1 161478810 rs6671847 A G RA,AS 4.10e-09
RA
1.20e-07 FCGR2A intron variant
6 36350605 rs881648 T C RA,SLE 4.76e-11 5.30e-08 ETV7 intron variant
8 129540464 rs16903065 A C RA,SLE,JIA 3.35e-08 5.50e-07 RP11-89M16.1 intron variant & non
coding transcript variant
11 128499574 rs7927748 T G RA,SLE 8.75e-10 5.90e-07 RP11-744N12.3 non coding transcript variant
12 112007756 rs653178 C T RA,SLE,AS,JIA 7.49e-12 5.60e-07 ATXN2 intron variant
18 12779947 rs2542151 G T RA,JIA 5.78e-10 5.80e-08 RP11-973H7.1 upstream gene variant
1 2524915 rs10752747 T G RA,SLE,JIA 2.81e-09 SLE
0.02 MMEL1 intron variant
1 114547798 rs12563513 A G RA,SLE 5.84e-27 3.44e-03 RP4-590F24.1 upstream gene variant
RA: Rheumatoid Arthritis; AS: Ankylosing Spondylitis; SLE: Systemic Lupus Erythematosus; PsA: Psoriatic Arthritis; JIA: Juvenile Idiopathic Arthritis

177
Table 35 | Loci associated with AS, JIA, PsA, RA and SLE after applying the ASSET subset-based approach
chr position rsid allele A allele B subset subset p-value trait trait p-value gene Consequence
2 65635688 rs2661798 T A RA,SLE 1.33e-12
SLE
8.67e-06 SPRED2 intron variant
2 135046984 rs4954125 T G SLE 1.14e-10 8.80e-08 MGAT5 intron variant
2 163124051 rs1990760 C T SLE,PSA 5.58e-10 2.48e-06 IFIH1 missense variant
2 204610396 rs1980422 C T RA,SLE 9.79e-11 0.01 intergenic variant
2 204738919 rs3087243 A G RA,SLE 2.00e-19 8.97e-03 CTLA4 downstream gene
variant
3 169500487 rs3772190 A G SLE,AS 1.14e-08 1.67e-05 MYNN intron variant
4 6607460 rs7672421 T C SLE 3.25e-09 8.12e-05 MAN2B2 intron variant
4 56971271 rs10030686 A G SLE 1.24e-08 5.49e-04 intergenic variant
4 181310395 rs4293824 T G SLE 1.12e-09 5.77e-04 intergenic variant
5 102608924 rs2561477 A G RA,SLE,JIA 1.21e-10 7.15e-03 C5orf30 intron variant
6 34640870 rs13207858 T C SLE,JIA 3.59e-09 1.12e-07 C6orf106 intron variant
6 36350605 rs881648 T C RA,SLE 4.76e-11 3.54e-06 ETV7 intron variant
6 138005515 rs17264332 G A RA,SLE,JIA 4.37e-24 1.17e-05 intergenic variant
6 159514778 rs654690 T C RA,SLE 8.29e-11 0.02 intergenic variant
6 167540842 rs1571878 C T RA,SLE 1.13e-14 0.02 CCR6 intron variant
8 11070721 rs7000141 A G SLE,JIA 1.47e-10 6.50e-08 intergenic variant
RA: Rheumatoid Arthritis; AS: Ankylosing Spondylitis; SLE: Systemic Lupus Erythematosus; PsA: Psoriatic Arthritis; JIA: Juvenile Idiopathic Arthritis

178
Table 35 | Loci associated with AS, JIA, PsA, RA and SLE after applying the ASSET subset-based approach
chr position rsid allele
A
allele
B
subset subset
p-value
trait trait
p-value
gene Consequence
8 129540464 rs16903065 A C RA,SLE,JIA 3.35e-08
SLE
0.002301 RP11-89M16.1 intron variant & non coding transcript
variant
10 8480044 rs10905371 G A SLE 4.24e-10 2.06e-07 RP11-543F8.2 intron variant & non coding transcript
variant
10 63800004 rs12764378 A G RA,SLE 3.48e-14 0.005879 ARID5B intron variant
11 118741842 rs4938573 C T RA,SLE 1.44e-15 4.27e-04 intergenic variant
11 128499574 rs7927748 T G RA,SLE 8.75e-10 1.39e-06 RP11-744N12.3 non coding transcript
variant
12 112007756 rs653178 C T RA,SLE,AS,JIA 7.49e-12 1.2eE-07 ATXN2 intron variant
15 38834033 rs8032939 C T RA,SLE,JIA 7.83e-13 0.001027 RASGRP1 intron variant
16 86019087 rs13330176 A T RA,SLE,JIA 3.78e-09 0.007345 RP11-542M13.2 downstream gene
variant
17 38066267 rs1008723 G T RA,SLE 2.61e-11 8.29E-07 GSDMB intron variant
19 10444826 rs2278442 G A RA,SLE,PSA,JIA 4.32e-15 6.52E-08 ICAM3 intron variant
22 39740078 rs137687 A G RA,SLE 6.08e-12 0.004826 intergenic variant
RA: Rheumatoid Arthritis; AS: Ankylosing Spondylitis; SLE: Systemic Lupus Erythematosus; PsA: Psoriatic Arthritis; JIA: Juvenile Idiopathic Arthritis
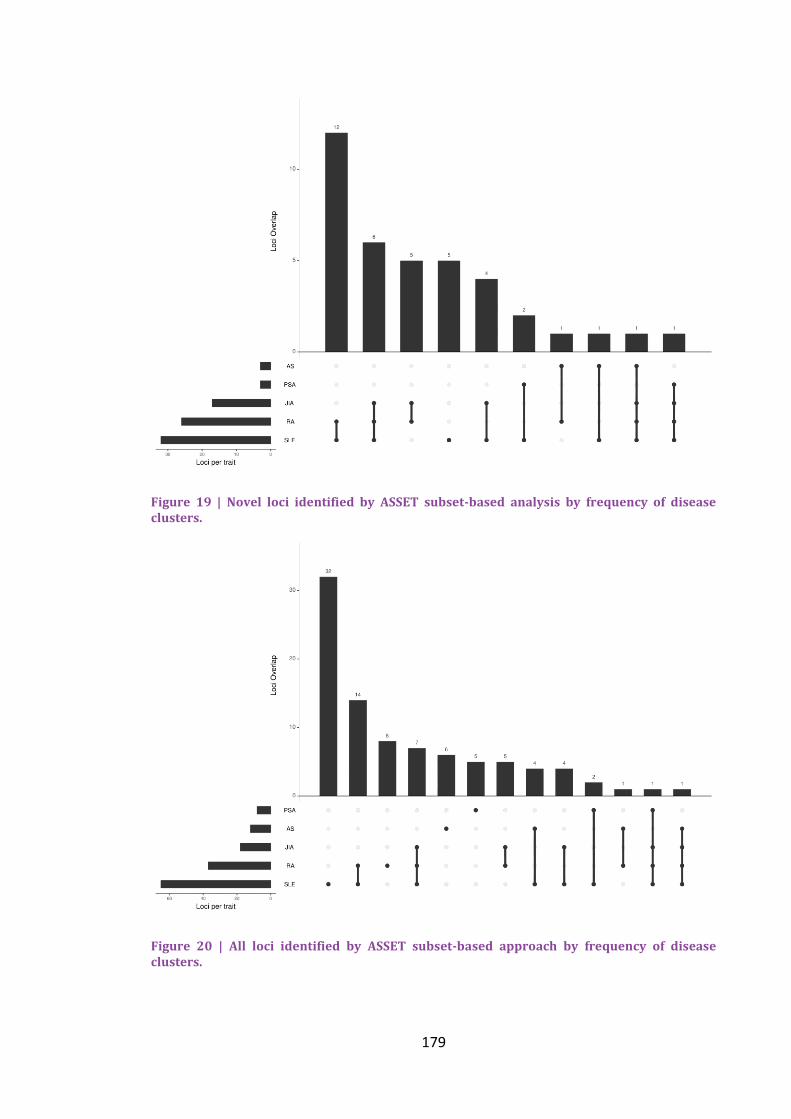
179
Figure 19 | Novel loci identified by ASSET subset-based analysis by frequency of disease clusters.
Figure 20 | All loci identified by ASSET subset-based approach by frequency of disease clusters.

180
Discussion 3.6
The aim of this study was to identify novel PsA-specific loci using a new category of
statistical methods that exploit the pleiotropy among musculoskeletal diseases. They
only require GWAS summary statistic data and can account for any potential overlap
between samples thereby maximising the statistical power of the analysis. Therefore,
these methods helped identifying novel loci associated not only with PsA but the other
musculoskeletal diseases including RA, SLE, AS and JIA. In addition, they provided
further information about the common biological mechanisms underlying these
diseases assisting with the identification of common and/or discrete therapeutic
targets. In this section, discussion is limited to the loci identified to be associated with
PsA as this disease was the basis of my PhD.
A Bayesian approach called cFDR was the first method applied to the pairs of
musculoskeletal diseases that showed a statistically significant genetic overlap by LD
score regression to identify potential novel loci. Thus, RA, JIA and AS were used as
conditional phenotypes for boosting the statistical power to search for loci
contributing to PsA susceptibility. Eight new SNPs were identified mapping to genes
already known to be related with either PsA or PSO such as PTPN22, IFIN1, TNFAIP3,
TYK2, RUNX3 and SOCS1, but would not have been identified in this data alone. In
addition, a pleiotropic SNP (rs413024) in SOCS1 was shared among PsA and JIA. SOCS1
is a cytokine signalling inhibitor gene that regulates the IFN signal transduction. A
previous study reported changes in SOCS1 levels in systemic JIA monocytes providing
evidence of inhibition of IFN signalling in these cells (Macaubas, Wong et al. 2016).
The application of a meta-analysis method called MTAG led to 16 identified SNPs
resulting in 54% power increase in SNP detection, with 11 of them being novel. Among
this newly associated loci was ITPR3 (rs2296330) which has been shown to participate
in induction of apoptosis in T cells and other types of cells (Blackshaw, Sawa et al.
2000) and in susceptibility to autoimmune diseases such as SLE (Oishi, Iida et al. 2008)
and T1D (Roach, Deutsch et al. 2006). Moreover, PTPN2 (rs2542151) was found to be
associated with an increased risk of developing PsA. There is evidence that rs2542151
is associated with a higher risk of developing joint erosions in patients with RA
(Ciccacci, Conigliaro et al. 2016) and increases the risk of developing CD and UC
(Glas, Wagner et al. 2012). In JIA, rs2542151 is involved in the epistasis (gene-gene

181
interaction) amongst PTPN2 and vitamin D genes contributing to risk of JIA (Ellis,
Scurrah et al. 2015).
By contrast, IL12RB2 (rs6693065) was found to be protective for PsA which is of
interest as IL12RB2 is involved in IL12 signalling, is upregulated by gamma interferon in
Th1 cells and plays a role in Th1 differentiation (Chang, Shevach et al. 1999). In
addition, in animal models the lack of Il12rb2 signalling contributes to the
predisposition to autoimmunity (Airoldi, Di Carlo et al. 2005). Another SNP protective
of PsA was rs6859219 in ANKRD55, a gene of unknown function. The same locus has
been previously reported to be protective for RA as well (Stahl, Raychaudhuri et al.
2010). Another study tried to shed some light on this gene and its role in MS and
other immune-mediated disease susceptibility. They reported a correlation of
rs6859219 with expression of ANKRD55 in CD4+ cells and higher expression of the
gene in the risk allele carriers indicating the gene’s role in the pro-inflammatory state
(Lopez de Lapuente, Feliu et al. 2016; Lopez de Lapuente, Feliu et al. 2016). IRF5 has
been associated with the pathogenesis of SLE and RA and its function includes the
induction of type 1 interferons and pro-inflammatory cytokines (Stahl, Raychaudhuri et
al. 2010; Cham, Ko et al. 2012). In addition, IRF5 is involved in the generation of
effective Th1 and Th17 T cell responses (Krausgruber, Blazek et al. 2011). The
protective role of IRF5 for PsA in this study needs further investigation. Finally, the
protein encoded by ICAM3 is over-expressed in all leucocytes and plays an important
role in the initiation of the immune-response. There has been evidence of the presence
of ICAM3-positive naïve T cells in the synovium of RA patients, leading to the
hypothesis that it contributes to the onset of RA (van Lent, Figdor et al. 2003). The
rs2278442 in ICAM3 was also identified using SBM to be protective of PsA with SLE,
RA and JIA having the same direction of association. SBM also identified two additional
SNPs to be associated with PsA; rs1990760 (IFH1) and rs5754467 (CCDC116).
Thus, 21 novel SNPs were identified for PsA/PSO, which would not have been
detected without the use of leveraging power from other traits. It should be noted the
impressive power increase in identifying novel loci in JIA by MTAG method which led
to 42 SNPs including IL12B2 and ICAM3 variants (Appendix).
This study exploits the phenomenon of pleiotropy which has been widely researched
in genetic epidemiology due to the public availability of summary statistic data from

182
consortia investigating common diseases. Solovieff et al. described the existence of
three categories of pleiotropy; a) biological pleiotropy, where causal variants for
different traits tag the same gene b) mediated pleiotropy where a variant affects a trait
and this trait in turn affects another trait c) spurious pleiotropy, whereby causal
variants for two traits fall into different loci but are in LD with a SNP associated with
both traits (Solovieff, Cotsapas et al. 2013). An evaluation of the NIHR catalogue
indicated that two or more traits were genetically overlapped in 4.6% of the variants, a
number that probably has increased through the years. The genetic overlap among
immune-mediated diseases, a broader category including musculoskeletal diseases, was
indicated by observational studies which reported the co-occurrence of these diseases
in the same individual or among family members. Later, it was confirmed by the
conduct of cross-phenotype studies utilising one of the methods described in the
current chapter or other relevant methods. For example, Cotsapas et al. assessed the
existence of a common genetic basis among celiac disease, CD, MS, PSO, RA, SLE and
T1D using a cross-phenotype meta-analysis (CPMA) method that examines whether a
variant is associated with two or more diseases. They found that 44% of the examined
variants were associated to multiple diseases (Cotsapas, Voight et al. 2011).
Furthermore, Ellinghaus et al. conducted a cross-trait meta-analysis study using the
SBM described in this chapter, to investigate the common pathogenesis among AS, CD,
PSO, PSC and UC. They were able to identify 244 multi-disease signals and 27 novel
susceptibility loci (Ellinghaus, Jostins et al. 2016).
The current cross-trait study used four methods that leverage the power of GWAS
and the phenomenon of pleiotropy to identify novel PsA loci and to construct
biological hypotheses about the underlying mechanisms of pathogenesis. All four
methods require only the use of GWAS summary statistics and can adjust for sample
overlap. The, first method was a univariate, genome-wide method called LD Score
regression that performs genetic correlation analysis. An online database and tool has
also been created, the LD Hub, which is used to accumulate the summary statistics
data from various GWAS and to systematically perform the correlation analysis across
the traits. The authors suggest that the use of data from targeted genotyping arrays
such as Immunochip does affect the performance. The data analysed in the current
study contained a small number of Immunochip samples but this should not distort the
findings. In addition, it is suggested that the LD score regression should be applied only

183
in datasets with over 5000 samples to avoid noisy results. Finally, the most essential
consideration when interpreting the genetic correlation among traits is that the genetic
correlation is not the same as pleiotropy. For example, zero correlation does not
mean that the two traits do not share any risk loci as there could be lack of
directionality to the genetic relationship. Recently, a new method for the identification
of regions that contribute to the genetic correlation of two traits has been proposed
named ρ-HESS (Shi, Mancuso et al. 2017). This method hypothesizes that at a region-
level two traits may present significant genetic covariance even if the genome-wide
genetic correlation is not significant. This method could be used to verify the LD score
regression findings in this study, investigate whether the pairs that did not present a
genome-wide correlation present any local correlation and find the specific regions
with strong correlation that could serve as putative causal models between the
diseases.
Exploiting any pleiotropic effects among the genetically correlated diseases can
improve the statistical power to detect risk associated loci. This is the basis of the
three methods used in the current study which also account for the existence of
overlapping samples among the datasets. The Bayesian cFDR analysis detects variants
associated with the principal trait given the p-values of association with both the
principal and the conditional traits are less than a specified threshold. In addition, the
detection of SNPs is not weakened when there is no extensive pleiotropy among the
two traits. MTAG and SBM are extensions of the classical meta-analysis in which effect
sizes or p-values are combined across numerous studies of the same trait, with effect
sizes assumed to be either consistent (fixed effects meta-analysis) or varied (random
effects meta-analysis). SBM evaluates all possible subsets of traits in order to identify
the one with the maximum z-statistic at a SNP. The method improves the
interpretation of the findings by presenting the cluster of traits that show the same
effect direction. Another advantage is its flexibility to use restricted subset of SNPs for
search, based on previous knowledge of potential grouping of traits. Its major caveat is
the loss of power compared to the standard meta-analysis method when a large
proportion of the studies contain association signals with the same effect direction.
This loss increases with the number of studies involved in the analysis and the multiple
testing penalty. Authors recommend the use of both standard and subset-based meta-
analysis to account for loss of power. On the other hand, the MTAG method can

184
incorporate the effect estimates from all the traits included in the analysis and present
adjusted estimates per trait. The use of MTAG is more fruitful when the traits involved
present a high genetic correlation. Caution should be taken when applying the method
in underpowered GWAS as the FDR can become substantial. FDR calculation should
be performed, a process that is not included in the existing pipeline provided by the
authors. It should be noted that the current study lacks these FDR estimations, a step
that could be addressed in future work. Finally, an extensive description of the
methods used currently to detect pleiotropy can be found in the review by Hackinger
and Zeggini (Hackinger and Zeggini 2017).
The current chapter presents an exploration of statistical methods that can be used to
identify genetic variants that increase the risk of PsA and shows many merits. The
strength of the study lies in the use of publicly available summary data, most of which
has been used in other studies; thus confirming their quality. It is the first time this
cluster of musculoskeletal diseases has been systematically analysed to exploit the
power of pleiotropic effects and identify association signals for each disease and to
assess their common genetic basis.
Limitations should also be considered and include the fact that the summary statistics
for PsA were from GWAS comparing patients with PsA to healthy controls. Due to
the fact that these patients also have PSO, it was not possible to determine whether
the PsA associations observed in the novel loci were because of PsA or because of the
presence of PSO. Another limitation was the absence of the alleles in the AS GWAS
summary data, leading to the use of the alleles from 1000G for each SNP. In addition,
the absence of strand information from most of the studies made it difficult to verify
findings for markers with complementary alleles. However, this issue was addressed
performing harmonization of the datasets with the 1000G. Moreover, the MHC region
that has shown evidence of pleiotropic effects was excluded from the analysis because
of the extensive LD present in the region. Thus, only the shared genetic basis and the
existence of novel susceptibility loci outside this region were assessed. In addition, this
study is oriented on SNPs but gene-based pleiotropy is also of interest (Wagner and
Zhang 2011).
The current study indicated numerous SNPs associated with PsA and the other
musculoskeletal diseases. The results need to be replicated in well-powered,

185
independent studies to verify their validity as credible associations. GWAS results
require further extensive interrogation for meaningful conclusions. Usually, the next
step is to perform dense genotyping to investigate the association of all variants in LD
with the lead variant in order to gain some insight into the SNPs’ causality. Functional
experiments should be conducted to directly assess the mechanism by which the
putative lead SNP affects gene expression.

186

187
Chapter 4 Mendelian Randomization
4
Introduction 4.1
The aim of epidemiology is to determine the causes of a disease, with many studies
trying to identify the environmental and lifestyle determinants that could modify the
risk of a disease. However, observational studies, as described in section 1.2.2, suffer
from confounding bias and reverse causation5. Thus, causal inference cannot be
proposed from the association between an exposure and a disease, unless all the
potential confounders of the association have been recognized, correctly measured
and adjusted for. To overcome these limitations, genetic epidemiology can provide
those non-confounding surrogates for exposures needed which can be analysed by
Mendelian Randomization (Smith and Ebrahim 2004).
Genetic variants that explain variation in the exposure and are not associated with the
outcome (except through the exposure) can be used as proxies to estimate a causal
effect, as they can be thought of as biological exposures being present from
conception. This is the basic premise of MR in which such genetic variants are termed
instrumental variables (IVs) (Greenland 2000). The MR can be thought as a randomized
clinical trial, in which individuals have been randomly assigned to receive a different
level of exposure, depending on whether they carry an allele associated with the
exposure or not.
5 Reverse causation refers to the situation when the outcome or disease precedes and causes the
exposure instead of the other way around.

188
General Overview of MR 4.1.1
Instrumental Variables 4.1.1.1
Initially, MR was performed using a small number of genetic variants which explained a
small proportion of the exposure’s variation limiting the power to investigate the
causal role of the exposure on the outcome (Smith and Ebrahim 2004). The
proliferation of GWAS led to the use of a large number of genetic variants which
meant increasing power for inferring causality when the variants explained a larger
proportion of the exposure’s variance. In addition, the availability of summary
association statistics by large consortia allows the interrogation of many causal
hypotheses without the administrative burden needed for the individual-level data
analyses (Burgess, Butterworth et al. 2013).
Three assumptions must be satisfied for a genetic variant to be a valid IV (Greenland
2000):
The genetic variant is associated with the exposure
The genetic variant is not associated with any of the confounders of the
exposure-outcome relationship
The genetic variant is only associated with the outcome through the exposure
These assumptions suggest that there is only one causal pathway from the genetic
variant to the outcome and that is via the exposure. The first assumption can be easily
been tested; however, the other two assumptions are unlikely to hold especially when
using summary data. The use of many instruments increases the risk of including at
least one invalid IV which could bias the result.
More specifically,
Assumption 1: Typically, SNPs that have been found to be significantly associated (p-
value<5e-08) with the exposure in GWAS and subsequently have been replicated in
independent studies are used as IVs. However, the inclusion of SNPs that have not
reached the significance level may improve the prediction power as they could be
variants with small effect sizes that could not reach significance due to lack of power.
When the IVs are “weak”, which means they explain little variation of the exposure
under analysis, they can lead to inflated type 1 error rates and can bias the causal

189
estimates (Burgess, Thompson et al. 2011). At this point the use of all variants
combined into an allelic score as an IV could be efficient by increasing power and
avoiding weak instrument bias (Burgess and Thompson 2013).
Assumption 2: Although it is impossible to prove the validity of this assumption in a MR
analysis, it might be possible to check whether the IVs are associated with known
confounders of the exposure-outcome relationship.
Assumption 3: This is known as the exclusion restriction criterion and it refers to the
non-existence of horizontal pleiotropy for the IV to be valid. Horizontal pleiotropy
occurs when a variant affects multiple outcomes though separate pathways. Although
directly testing this assumption is impossible, methods have been developed and
described later that provide accurate estimations even when the assumption is
violated.
Design strategies for Mendelian Randomization 4.1.1.2
Single-sample/One sample MR 4.1.1.2.1
This design is the basic implementation of MR in which the SNPs, exposure and
outcome are from individuals in the same sample. In this design, the causal effect is
estimated by using 2-stage least-squares (2SLS) regression. In the first stage of the 2SLS
method, the exposure is regressed on the IVs. In the second stage, the outcome under
study is regressed over the predicted values of the exposure (estimated in the first
stage) using the either linear or logistic regression based on the nature of the
outcome. Then, the β coefficient or the log 𝑂𝑅 can be interpreted as the change in the
outcome per unit increase in the exposure due to IVs (Haycock, Burgess et al. 2016).
Two-sample MR 4.1.1.2.2
The two-sample MR is an extension of the 2SLS allowing for greater statistical power
due to the ability to use larger sample sizes. In this setting, variants-exposure and
variants-outcome associations should be estimated in different, non-overlapping
samples. Due to the latter, the two-sample approach has gained popularity as GWAS
summary statistics data from large consortia is publicly available. The advantages of
two-sample approach compared with the single-sample approach are i) no requirement
to measure exposure and outcome in the same sample as it could be difficult and
expensive and ii) the weak instrument bias is toward the null whereas in one-sample

190
approach, it is toward the confounded observational association (Burgess, Scott et al.
2015).
Bidirectional MR 4.1.1.2.3
In this design, IVs for both the exposure and the outcome are used to assess whether
the exposure causes the outcome and vice versa. More specifically, if exposure causes
the outcome, then the instrument Zexposure will be associated with both the exposure
and the outcome. However, the instrument Zoutcome will be associated to the outcome
and not to the exposure. The main assumption of this method is that the causal
association occurs in one direction, without having the ability to address any
complexities in the biological systems such as the effect of feedback loops among
exposure and outcome (Davey Smith and Hemani 2014).
Two-step MR 4.1.1.2.4
This method is used to assess whether there is mediation in the causal pathway; that
is, whether an intermediary trait is a mediator between exposure and outcome. In the
first step, variants for the exposure are used to assess the causal role of the exposure
at the intermediate factor. In the second step, IVs for the intermediate factor are used
to assess its causal effect on the outcome. Association in both steps implies the
existence of mediation between the exposure and the outcome by the intermediary
factor (Haycock, Burgess et al. 2016).
Multivariable MR 4.1.1.2.5
In some situations, the lack of variants that are solely associated with the exposure of
interest leads to the use of pleiotropic variants. Although, horizontal pleiotropy leads
to the violation of the third assumption, the development of multivariable MR
overcomes this issue by using IVs associated with multiple exposures to jointly assess
the independent causal role of each exposure on the outcome (Burgess, Dudbridge et
al. 2015; Burgess and Thompson 2015).
Multifactorial MR 4.1.1.2.6
Risk factors usually cluster together to contribute to the increasing burden of a
disease. For example, increased BMI combined with heavy alcohol consumption
significantly increases the risk of liver disease (Hart, Morrison et al. 2010). However, it
is difficult to estimate the effect of confounded exposures without the risk of

191
confounding bias. For that reason, factorial MR can be used to identify the combined,
unconfounded causal effects of the co-occurrence of two or more exposures for an
outcome (Zheng, Baird et al. 2017).
Pitfalls in MR studies 4.1.1.3
Even if the assumptions hold, there are still limitations in MR studies (Zheng, Baird et
al. 2017):
Weak instrument bias: As described previously the estimates of the IVs can be
biased when many of the genetic variants are only modestly associated with the
exposure. Practically, this means that a “strong” IV can explain the difference in
exposure and any difference in the outcome will be due to the difference in
exposure. By contrast, a “weak” IV can explain little variation in the exposure
and the difference in the outcome could be due to chance difference in
confounders. The ‘rule of thumb’ to avoid bias is that the F-statistic6 should be
at least 10, which means that the bias of the IV estimator is 10% the bias of the
observational estimator (Burgess, Thompson et al. 2011). In a one-sample
setting, the causal estimates can be biased towards the observational estimate
whereas in a two-sample setting the bias is towards the null. There are a few
ways to minimize this type of bias including a) increase the F-statistic by
increasing the sample size with the use of large GWAS (summary statistics)
datasets and b) adjustment for measured confounders that are not on the
causal pathway between exposure and outcome which will lead to increased
precision. Although it is better to address any type of bias prior to data
collection in order to ensure large F-statistics, it is possible to conduct
sensitivity analyses to assess any effects on causal estimates (Burgess,
Thompson et al. 2011).
Lack of genetic variants for exposure: Finding genetic variants is not always feasible
even with the proliferation of GWAS. A suggestion would be the use of
polygenic risk scores; however their use could introduce horizontal pleiotropy.
6 The F-statistic indicates the strength of an IV and its formula is (
𝑛−𝑘−1
𝑘) (
𝑅2
1−𝑅2) where 𝑛 is the sample
size, 𝑘 the number of IVs and 𝑅2 the proportion of variance in the phenotype explained by the variants.

192
Population stratification: This phenomenon can induce spurious associations due
to ancestry difference between in study subjects. For that reason, MR should
always be conducted using genetic associations from homogenous populations
or from GWAS that have adjusted for population structure.
Low power: Genetic variants usually explain only a small proportion of the total
variance of the exposure which results in the lack of statistical power to detect
a causal effect. The use of larger sample sizes from GWAS consortia could lead
to the increase of power and to more precise estimation of causal effects.
Horizontal pleiotropy: In the case of horizontal pleiotropy, the IV is associated
with the outcome via a pathway that does not pass through the study exposure
(Davey Smith and Hemani 2014). Erroneous causal estimates can be limited by
choosing IVs that act directly on the trait. However when less well-
characterized IVs are used, there are methods used to detect the effect of
pleiotropy in the causal inference and methods for effect estimation that are
robust to pleiotropy by relaxing the assumptions (Davey Smith and Hemani
2014) and will be mentioned later in the chapter. In the context of MR, there is
also vertical pleiotropy in which the IVs are associated with other risk factors
downstream of the exposure of interest. However, this type of pleiotropy does
not invalidate the assumptions of MR.
Trait heterogeneity: SNPs can be associated with multiple aspects of a single trait,
for example rs1051730 is associated with the number of cigarettes smoked per
day. However, the smoking behavior is different among smokers including
number and depth of smoke inhalations per cigarette and years of smoking. The
latter does not invalidate rs1051730 as an IV, but it makes it difficult to
estimate the precise magnitude of the causal effect (Haycock, Burgess et al.
2016).
LD: When a variant is in LD with the IV, confounding bias can be introduced to
the analysis as there will be a pathway from the IV to the outcome other than
the one including the exposure of interest. One solution is the use of the SNP
with the smallest p-value as IV and the removal of the other SNPs that are in
LD with the IV.

193
Winner’s curse7: In the single-sample MR setting, the use of the same sample for
GWAS discovery and MR study leads to upward bias in the estimation of the
SNP-exposure association. A possible sensitivity analysis test would be the use
of unweighted allelic score of several variants as IV. In the case of two-sample
MR, where the GWAS and MR analysis are independent, the winner’s curse will
bias the MR estimates towards the null.
Collider bias: As mentioned in the previous chapter, conditioning on a variable
that is independently affected by both exposure and outcome may cause
selection bias. Collider bias usually occurs in MR studies where the IVs are
chosen from a GWAS which conditions one phenotype on another, for
example waist circumference on CVD adjusted for BMI.
Binary outcomes: when the genetic associations with the outcome are estimated
in a case-control study, then the causal effect estimates may be imprecise (Dai
and Zhang 2015). If exposure is obtained after disease diagnosis, then the
genetic associations could be biased by reverse causation. Moreover, there is
the phenomenon of “noncollapsibilty” of ORs, which means that ORs can
predict the population-averaged causal effect but not the impact on specific
subgroups (Harbord, Didelez et al. 2013). The above considerations affect the
ability of MR to precisely estimate the magnitude of the causal effect.
Methods dealing with the pitfalls of MR 4.1.1.4
Inverse variance weighted (IVW) 4.1.1.4.1
The IVW is the traditional method used for the estimation of the causal effect of the
exposure on the outcome under study, when all IVs are valid. The estimate is
equivalent to the slope of a linear regression of the variant-outcome association
estimates on the variant-exposure association estimates with the intercept term
constrained to zero (Burgess, Butterworth et al. 2013).
7 A phenomenon first described in the auction theory, where the winner is likely to overpay for the item
is bidding for. In GWAS, it is the systematic overestimation of effects due to chance noise.

194
MR-Egger 4.1.1.4.2
In contrast to IVW, this method can provide a true estimate of the causal effect even if
all SNP-outcome associations are affected by horizontal pleiotropy. It is an alternative
method based on a technique for identifying publication bias in meta-analysis studies
proposed by Bowden et al. and performs a weighted regression of the gene-outcome
coefficients on the gene-exposure coefficients with the weights being the inverse
variances of the gene-outcome associations. Basically, MR-Egger substitutes the third
assumption with a more loose assumption; the InSIDE (Instrument Strength
Independent of Direct Effect) assumption according to which the distributions of the
genetic associations with the exposure and the SNP-outcome associations are
independent. The intercept is an estimate of the pleiotropic effect across all IVs and if
it differs from zero potential pleiotropy, could bias the estimate (Bowden, Davey Smith
et al. 2015). MR-Egger can only detect “directional” pleiotropy (having a non-zero
value) and not “balanced” pleiotropy where all SNPs present pleiotropy but it is
canceled out. Finally, the slope of the regression (beta coefficient) indicates the causal
effect between exposure and outcome adjusted for pleiotropy (Bowden, Del Greco et
al. 2016).
Weighted median 4.1.1.4.3
Although the IVW is an efficient method when all IVs are valid, it will give biased
estimates even if only one IV is invalid. This means that IVW has a 0% breakdown.
However, there is an estimator with 50% breakdown; the median estimator which
gives consistent estimates when up to half the IVs are not valid. When the precision of
the estimates varies, weighted median can be used where the probability of the
estimate of each IV is proportional to the inverse of its variance, so more precise
estimates receive more weight. The weights used are the inverse of the variance of the
ratio estimates (Bowden, Davey Smith et al. 2016).
Mode-based estimate 4.1.1.4.4
Another method that has been proposed to offer robustness to horizontal pleiotropy
is the Mode-based Estimator (MBE). It uses a “relaxed” assumption called Zero Modal
Pleiotropy Assumption (ZEMPA) in which the causal effect is precise if the most
common pleiotropy value across the IVs is zero. The weighted MBE is more precise

195
compared with simple MBE, but more susceptible to bias due to violations of the
InSIDE assumption (Hartwig, Davey Smith et al. 2017).
The essential assumptions regarding pleiotropy that need to be valid in order to obtain
accurate estimates by MR methods can be seen in Table 36. In addition to the
aforementioned methods used to estimate the causal effect of an exposure on the
outcome of interest even with the presence of pleiotropic genetic polymorphisms,
there are more methods that can be used to deal with the limitations of MR and can
be seen in the Table 37.
Table 36 | Assumptions regarding pleiotropy of the Mendelian Randomization methods
Method Assumptions regarding pleiotropy
IVW No pleiotropic effects and InSIDE holds
MR-Egger regression Consistent even if all IVs are invalid and InSIDE holds
Simple median Consistent if less than 50% of IVs are invalid
Weighted median Consistent if less than 50% of the weight is contributed by invalid IVs
Simple MBE Consistent if the most common horizontal pleiotropy value is zero
Weighted MBE Consistent if the largest weights among the k subsets are contributed by
invalid instruments
IVW: Inverse-Variance Weighting; InSIDE: Instrument Strength Independent of Direct Effect;
IV: Instrument Variable; MBE: Mode-Based Estimator
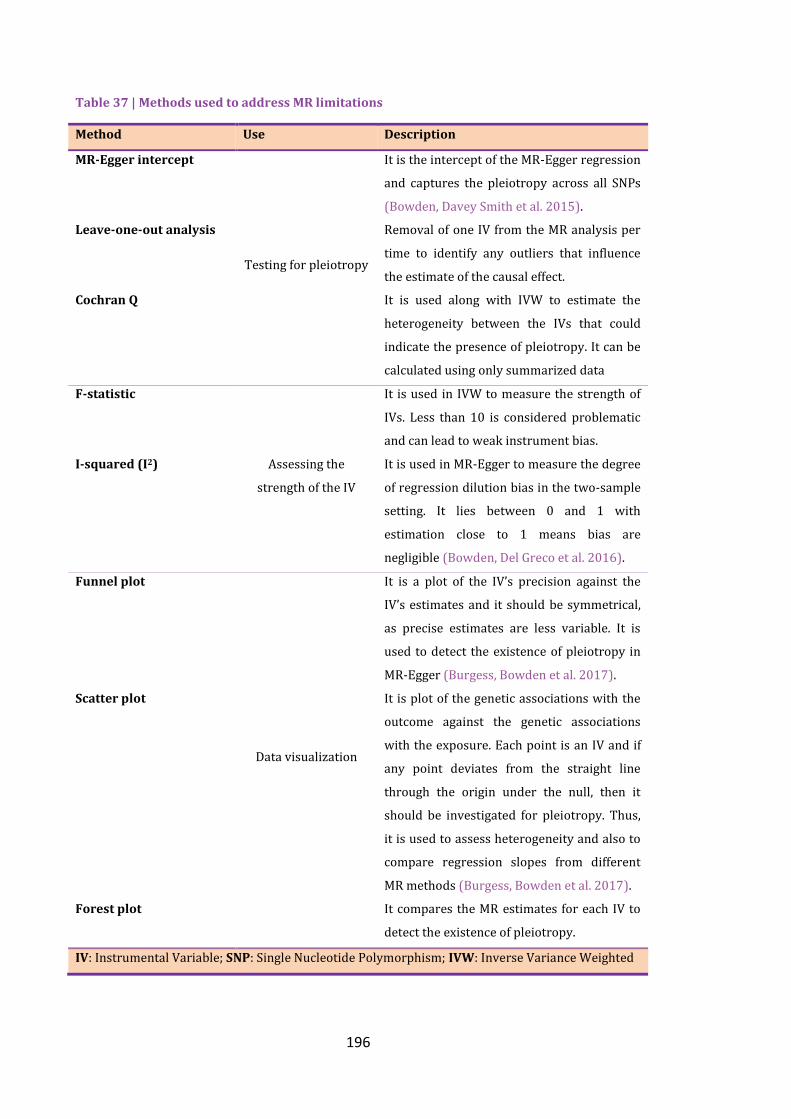
196
Table 37 | Methods used to address MR limitations
Method Use Description
MR-Egger intercept
Testing for pleiotropy
It is the intercept of the MR-Egger regression
and captures the pleiotropy across all SNPs
(Bowden, Davey Smith et al. 2015).
Leave-one-out analysis Removal of one IV from the MR analysis per
time to identify any outliers that influence
the estimate of the causal effect.
Cochran Q It is used along with IVW to estimate the
heterogeneity between the IVs that could
indicate the presence of pleiotropy. It can be
calculated using only summarized data
F-statistic
Assessing the
strength of the IV
It is used in IVW to measure the strength of
IVs. Less than 10 is considered problematic
and can lead to weak instrument bias.
I-squared (I2) It is used in MR-Egger to measure the degree
of regression dilution bias in the two-sample
setting. It lies between 0 and 1 with
estimation close to 1 means bias are
negligible (Bowden, Del Greco et al. 2016).
Funnel plot
Data visualization
It is a plot of the IV’s precision against the
IV’s estimates and it should be symmetrical,
as precise estimates are less variable. It is
used to detect the existence of pleiotropy in
MR-Egger (Burgess, Bowden et al. 2017).
Scatter plot It is plot of the genetic associations with the
outcome against the genetic associations
with the exposure. Each point is an IV and if
any point deviates from the straight line
through the origin under the null, then it
should be investigated for pleiotropy. Thus,
it is used to assess heterogeneity and also to
compare regression slopes from different
MR methods (Burgess, Bowden et al. 2017).
Forest plot It compares the MR estimates for each IV to
detect the existence of pleiotropy.
IV: Instrumental Variable; SNP: Single Nucleotide Polymorphism; IVW: Inverse Variance Weighted
197
Aims and objectives 4.2
Aim 4.2.1
The aim of this chapter is to assess the causal role of the BMI, smoking status and
alcohol consumption, which were found to be associated with PsA in chapter two, in
the development of PsA and vice versa using bidirectional, two-sample Mendelian
randomization.
Objectives 4.2.2
Find the IVs for each exposure from publicly available GWAS summary
statistics data
Perform bidirectional, two-sample MR between each exposure and PsA
Perform relevant sensitivity analyses to ensure the accuracy of the outcome.
Contribution of the candidate 4.3
The data acquisition and preparation, the planning, statistical analysis and interpretation
of the results were performed by the candidate (EB).
198
Methods 4.4
Two-sample, bidirectional MR was used to assess the potential causal role of BMI,
smoking status and alcohol consumption identified in chapter 2 on PsA. In addition, a
range of sensitivity analysis methods were applied to identify any pleiotropy that could
bias the results. In the analysis, the main outcome variable was either diagnosed PsA or
one of the lifestyle factors under study.
Data sources and choice of IVs 4.4.1
For the application of MR, the use of SNPs that have been found to be significantly
associated with the traits in large consortia is recommended to avoid weak instrument
bias and to have the necessary power to address the causal role of exposures. Thus,
IVs for the lifestyle factors were identified from publicly-available summary GWASs
data which included both sexes and were restricted to European populations to avoid
any population stratification bias. The IVs for the PsA were taken from our in-house
GWAS study described in the previous chapter. For each trait, all IVs achieved the
genome-wide significance (p-value<5e-08).
Defining IVs for BMI 4.4.1.1
The IVs for BMI were identified using results from the Genetic Investigation of
ANthropometric Traits (GIANT) consortium (Table 38), a large collaborative GWAS
on human body size and shape (Locke, Kahali et al. 2015). Using GWAS data on
339,224 individuals, GIANT identified 97 genetic markers independently associated
with BMI. In the GIANT study population, these 97 SNPs explained 2.7% of in-study
variance in BMI. In the GIANT population, the effect estimate was expressed in SD of
BMI, where 1 SD change in BMI equaled 4.65kg/m2. To generate the corresponding
SNP-outcome (here, PsA) association, the beta estimates and standard errors were
taken from our in-house PsA cohort.
Defining IVs for alcohol frequency and smoking status 4.4.1.2
GWAS summary data were available from the Tobacco, Alcohol and Genetic (TAG)
consortium (Tobacco and Genetics 2010) for smoking initiation assessed as a binary
ever/never variable ascertained in 74,053 individuals; however for alcohol consumption
no GWAS associations were publicly available.

199
Defining IVs for PsA 4.4.1.3
For PsA, a genetic instrument was constructed using the PsA-associated SNPs and
their effect sizes as estimated in our in-house PsA cohort. To generate the
corresponding SNP-outcome (here BMI, alcohol frequency and smoking initiation)
association, the effect estimates and the standard errors were taken from GIANT
consortium, TAG and the UK Biobank.
Validation of findings using the UK Biobank 4.4.1.4
For validity reasons, the causal relationships between PsA and the lifestyle factors were
assessed using summary statistics from the UK Biobank (Table 38). The summary
statistics data were released by the Neale Lab who performed a univariate analysis on
approximately 337,000 participants (http://www.nealelab.is/blog/2017/7/19/rapid-gwas-
of-thousands-of-phenotypes-for-337000-samples-in-the-uk-biobank). The data used for
BMI, alcohol intake frequency and smoking initiation (ever smoker) correspond to the
UK Biobank field ID 21001, 1558 and 20160, respectively. According to the UK
Biobank classification, an individual is classified as ever smoker if they are currently
smoking tobacco either most days or occasionally, or they used to smoke.
Table 38 | Characteristics of the GIANT consortium and the UK Biobank
Cohort Design Aim Participants Summary statistics used
GIANT Consortium
of different
groups,
countries
and studies
Identify genetic loci
that are associated
with the human
body size and shape
More than half
a million of
European and
non-European
descent.
Taken from a meta-analysis of 125
studies (Locke, Kahali et al. 2015)
including 339,224 individuals
UK
Biobank
Prospective
study
Facilitate
epidemiological
studies to assess
the causes of a
range of conditions
and their
susceptibility
factors
Half a million
of British
participants
registered
with the
National
Health System
Taken from Neale’s Lab
(http://www.nealelab.is/blog/2017/7/19
/rapid-gwas-of-thousands-of-
phenotypes-for-337000-samples-in-
the-uk-biobank) after a basic
association test was performed on
approximately 337,000 individuals
GIANT: Genetic Investigation of Anthropometric Traits consortium

200
Statistical analysis 4.4.2
Bidirectional, two-sample MR was used to evaluate the causal role of lifestyle factors
on PsA and vice versa. Analyses and data visualization were performed using the R
package “TwoSampleMR” (Hemani, Zheng et al. 2016).
Initially, the number of significant SNPs from each summary dataset was clumped using
the function “clump_data” to ensure that the IVs for the exposure are independent.
During clumping the provided SNPs are extracted from 1000G data, the LD is
calculated among them and amongst those SNPs (in a clumping distance of 10,000kb)
with 𝑟2>0.01 only the SNP with the lowest p-value are kept. Then, it is essential to
harmonise the SNP-exposure and SNP-outcome association effects in order to
correspond to the same allele. This was achieved with the “harmonise_data” function.
All associations were combined using the IVW method. This method is suitable even
for exposures with less than ten IVs due to its increased power even when the number
of the associated SNPs is limited. This approach produces a causal estimate of the
association between exposure-outcome, which is equal to the coefficient from a
weighted regression of the SNP-outcome on the SNP-exposure association estimates,
where the weights are the inverse of the precision of the SNP-outcome coefficients
and the intercept is constrained to zero.
The degree of weak instrument bias for the IVW can be quantified with the F-statistic.
Given that the chosen IVs are statistically significant SNPs, the F-statistic will
necessarily be high.
Sensitivity analysis 4.4.2.1
MR-Egger regression, weighted median analysis and weighted MBE were used to assess
the robustness of the findings to potential horizontal pleiotropy. All three methods
provide consistent results, even if there is a violation of the third assumption. In
addition, the intercept of MR-Egger regression provides the degree of pleiotropy
present in the data based on the degree it departs from zero. Therefore, the intercept
should be zero in the absence of pleiotropy. For the validity of the results, the absence
of overlap between the IVs associated with the pair of traits investigated each time is
essential. For example, it is possible that an instrument for PsA includes SNPs that are
directly associated with BMI if there is a causal effect of BMI on PsA. Therefore, any
201
identical or strongly correlated SNPs among the pair of traits under study were
removed and the analyses were repeated.
In addition, Cochran’s Q test for heterogeneity was used to assess any inconsistencies
in the effect estimates across the IVs (IVs presenting unexpectedly large or small
effects on the outcome, given the magnitude of their effect on the exposure) which
would indicate potential pleiotropy.
Finally, four types of plots were used to visually assess the presence of pleiotropy.
Scatterplots provide the causal effect estimates for each IV by plotting SNP-outcome
associations against SNP-exposure associations. In funnel plots, larger spread suggests
higher heterogeneity and asymmetry indicates horizontal pleiotropy. Finally, with the
leave-one-out analysis and plot, any associations that are being disproportionately
influenced by a single variant can be assessed.
Results 4.5
The number of instruments used in each MR analysis can be seen in Table 39. In the
case of smoking, no significant SNP was found at the published GWAS from TAG;
however the analysis was performed using the UK Biobank data. Moreover, no publicly
available GWAS was found for alcohol intake frequency, thus the analysis was limited
in the UK Biobank data.
Effect of BMI upon PsA and vice versa 4.5.1
MR analysis performed with published GWAS data and UK Biobank gave evidence of
higher BMI increases the risk of PsA. Using the available 65/69 SNPs associated with
BMI from GIANT study in the in-house PsA GWAS summary results, there was a 0.65
(95% CI 0.25, 1.05) log increase in PsA per SD (4.5kg/m2) increase in BMI (p-
value=0.001) or 92% (𝑒0.65 = 1.92) increase in the odds of developing PsA (Table 40).
The causal effect of BMI on PsA was confirmed using the UK Biobank GWAS summary
results where a 0.53 (95% CI 0.27, 079) log increase in PsA was reported per SD
increase in BMI (p-value=5.76e-05).
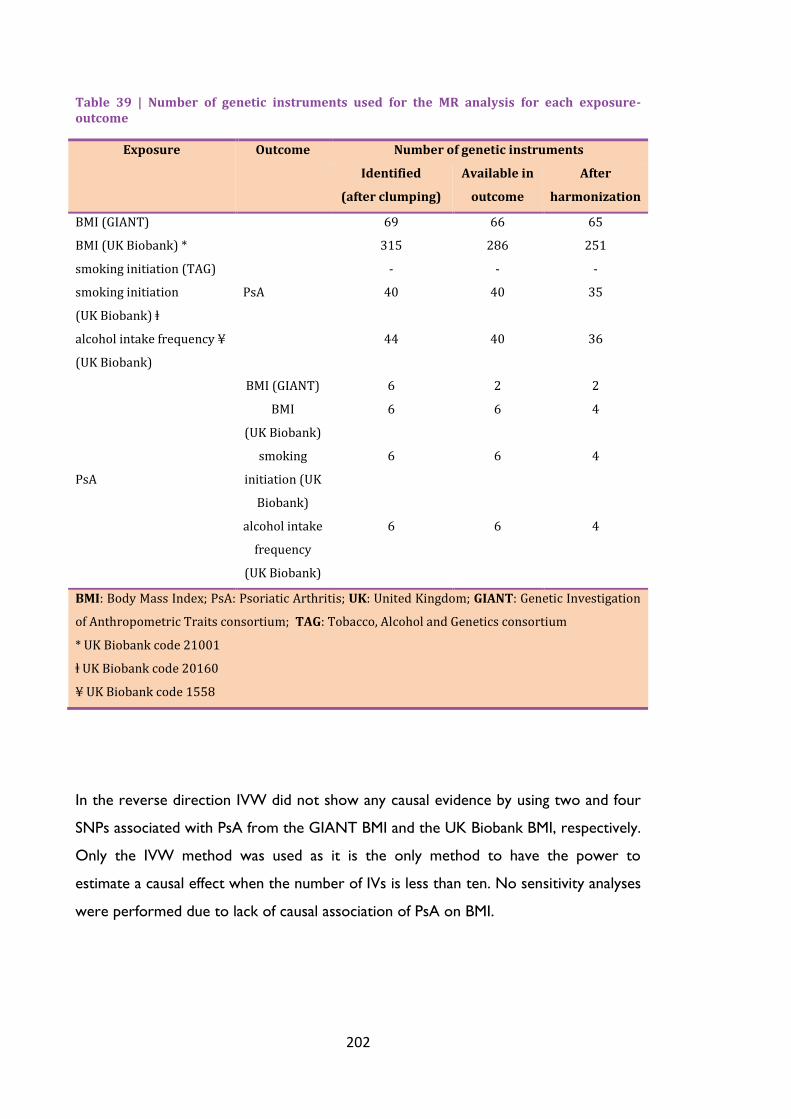
202
Table 39 | Number of genetic instruments used for the MR analysis for each exposure-outcome
Exposure Outcome Number of genetic instruments
Identified
(after clumping)
Available in
outcome
After
harmonization
BMI (GIANT)
PsA
69 66 65
BMI (UK Biobank) * 315 286 251
smoking initiation (TAG) - - -
smoking initiation
(UK Biobank) ⱡ
40 40 35
alcohol intake frequency ¥
(UK Biobank)
44 40 36
PsA
BMI (GIANT) 6 2 2
BMI
(UK Biobank)
6 6 4
smoking
initiation (UK
Biobank)
6 6 4
alcohol intake
frequency
(UK Biobank)
6 6 4
BMI: Body Mass Index; PsA: Psoriatic Arthritis; UK: United Kingdom; GIANT: Genetic Investigation
of Anthropometric Traits consortium; TAG: Tobacco, Alcohol and Genetics consortium
* UK Biobank code 21001
ⱡ UK Biobank code 20160
¥ UK Biobank code 1558
In the reverse direction IVW did not show any causal evidence by using two and four
SNPs associated with PsA from the GIANT BMI and the UK Biobank BMI, respectively.
Only the IVW method was used as it is the only method to have the power to
estimate a causal effect when the number of IVs is less than ten. No sensitivity analyses
were performed due to lack of causal association of PsA on BMI.

203
Table 40 | Results of Mendelian randomization with BMI as exposure and PsA as the outcome
Exposure Dataset Method Estimate ¥ 95% CI p-value
BMI
GIANT
IVW 0.65 0.25, 1.05 0.001
MR-Egger 1.03 -0.17, 2.23 0.09
Weighted median 0.57 0.01, 1.13 0.04
Weighted MBE 1.36 0.36, 2.36 0.008
UK Biobank
IVW 0.53 0.27, 0.79 5.76e-05
MR-Egger 0.53 -0.21, 1.27 0.15
Weighted median 0.48 0.01, 0.96 0.04
Weighted MBE 0.39 -0.33, 1.11 0.29
IVW: Inverse Variance Weighted; CI: Confidence Interval; MBE: Mode-Based Estimator;
GIANT: Genetic Investigation of Anthropometric Traits consortium;
¥ log increase in PsA per SD (4.5 kg./m2) increase in BMI
Sensitivity analysis 4.5.1.1
Assessing the instrumental variable assumptions 4.5.1.1.1
For assessing heterogeneity, scatter plots are used for a visual inspection along with
the Cochran Q test. Q test relies on the assumption that all valid IVs identify the same
causal parameter; otherwise the heterogeneity test might over-reject the null. Figure
21 and Figure 22 depict evidence of heterogeneity with some outliers with Q statistic
being 74.96 (64 degrees of freedom, p-value=0.16) for IVs taken from GIANT
consortium and 281.7 (250 degrees of freedom, p-value=0.08) for IVs taken from the
UK Biobank; although the results were not significant.

204
Figure 21 | Scatterplot for comparison of methods of BMI (GIANT) upon PsA. It presents the genetic associations with PsA against the genetic associations with BMI (lines represent 95% confidence intervals). The slope of each line represents the causal association and each method has a different line. IVW, MR-Egger, weighted median and weighted MBE estimates are indicated by the light blue, blue, light green and green lines respectively. There is evidence of heterogeneity with a few outliers.

205
Figure 22 | Scatterplot for comparison of methods of BMI (UK Biobank) upon PsA. It presents the genetic associations with PsA against the genetic associations with BMI (lines represent 95% confidence intervals). The slope of each line represents the causal association and each method has a different line. IVW, MR-Egger, weighted median and weighted MBE estimates are indicated by the light blue, blue, light green and green lines respectively. There is evidence of heterogeneity with a few outliers.
For assessing directional pleiotropy, funnel plots of the IVs precisions against the IVs
estimates are used with any asymmetry being evidence of horizontal pleiotropy;
pleiotropic effects do not average to zero and causal estimates from weaker variants
tend to be skewed in one direction. There is no sign of departure from asymmetry for
BMI taken from the GIANT consortium (Figure 23) and the UK Biobank (Figure 24),
respectively. In addition, the intercept of MR-Egger regression indicates the average
pleiotropic effect; if it differs from zero, then there is evidence of pleiotropy. Here
GIANT intercept= -0.01 with p-value=0.50 and UK Biobank intercept=-9.4e-05 with p-
value=0.99, suggesting there was no strong directional horizontal pleiotropy under the
InSIDE assumption.

206
Figure 23 | Funnel plot displaying the causal effect estimate of each IV against its precision for MR analysis of BMI (GIANT) on PsA. Asymmetry is indicative of horizontal pleiotropy, meaning that the pleiotropic effects of genetic variants are not balanced about the null. Here the plot is symmetrical.

207
Figure 24 | Funnel plot displaying the causal effect estimate of each IV against its precision for MR analysis of BMI (UK Biobank) on PsA. Asymmetry is indicative of horizontal pleiotropy, meaning that the pleiotropic effects of genetic variants are not balanced about the null. Here the plot is symmetrical.
Using robust methods 4.5.1.1.2
The MR-Egger regression, weighted median and MBE are used as alternative methods
to assess the causal effect as they use weaker assumptions than the standard IVW. In
summary, MR-Egger regression can provide a consistent effect even when all IVs
exhibit some pleiotropy, the weighted median is consistent under the assumption that
the valid IVs represent over 50% of the weight in the analysis and the weighted-mode
is consistent if the most common pleiotropy value is zero.
In the case of BMI from GIANT consortium, the alternative methods suggest an effect
on the same direction as the IVW with results being significant for all of them (MR-
Egger has a p-value=0.09). This indicates that the IVs might all be valid and the
conclusion that the increase of BMI causes an increase in PsA is reliable. When

208
assessing the results of UK Biobank BMI upon PsA, all methods indicate a positive
causal effect with the result being statistically significant only with the weighted-median
method.
Effect of smoking initiation upon PsA and vice versa 4.5.2
Using 35 SNPs significantly associated with the ever smoker status in PsA, there is a
0.36 (-2.5, 1.78) log decrease of PsA for ever smokers compared to those who have
never smoked, but the result was not statistically significant. In contrast, the rest of the
methods suggest a positive effect of ever smoking on PsA (Table 41). Estimating the
Cochran Q, there is no statistically significant evidence of heterogeneity (Q=60, 34
degrees of freedom, p-value=0.08); however the MR-Egger regression was consistent
with the null (intercept=-0.06 with 95% CI -0.14, 0.02 and p-value=0.11). Performing
leave-one-out analysis to assess whether there were any outlier SNPs affecting the
result showed that when SNP rs9468350 (gene ZSCAN31) was removed from the IVs,
there was a positive effect of smoking initiation on PsA using the IVW method as well
(estimate= 0.02, 95% CI -1.98, 2.02). This SNP has been found to be associated with
other diseases such as RA and schizophrenia, suggesting possible pleiotropy biasing the
causal effect.
In the reverse direction, using only four SNPs as IVs method IVW indicated no
significant causal role of PsA on smoking initiation (estimate=0.02 (95% CI -0.04, 0.08),
p-value=0.23).
Table 41 | Results of Mendelian randomization with smoking initiation from the UK Biobank as the exposure and PsA as the outcome
Exposure Dataset Method Estimate ¥ 95% CI p-value
smoking
initiation
(ever
smoker)
UK Biobank
IVW -0.36 -2.5, 1.78 0.74
MR-Egger 7.42 -2.34, 17.18 0.14
Weighted median 0.31 -2.19, 2.81 0.80
Weighted MBE 0.52 -3.24, 4.28 0.78
IVW: Inverse Variance Weighted; CI: Confidence Interval; MBE: Mode-Based Estimator;
MR: Mendelian Randomization
¥ log increase in PsA for ever smokers

209
Effect of alcohol frequency consumption upon PsA and vice versa 4.5.3
Using 36 SNPs significantly associated with alcohol intake frequency in UK Biobank
that were present in the PsA summary data, there was no causal role observed as seen
in Table 42. There was no evidence of pleiotropy (MR-Egger intercept=0.02, 95% CI 0,
0.04 and p-value=0.10) or heterogeneity (Q=41, p-value=0.22).
In addition, no causal effect was observed of PsA on alcohol frequency intake using
IVW method (estimate=0.01 (95% CI -0.03, 0.05), p-value=0.53).
Table 42 | Results of Mendelian randomization with alcohol intake frequency from the UK Biobank as the exposure and PsA as the outcome
Exposure Dataset Method Estimate 95% CI p-value
alcohol
intake
frequency UK Biobank
IVW 0.18 -0.31, 0.65 0.45
MR-Egger -0.53 -1.49, 0.43 0.28
Weighted median 0.02 -0.66, 0.66 0.99
Weighted MBE -0.27 -1.09, 0.55 0.52
IVW: Inverse Variance Weighted; CI: Confidence Interval; MBE: Mode-Based Estimator;
MR: Mendelian Randomization

210
Discussion 4.6
In this chapter, the association between BMI, smoking initiation and alcohol intake
frequency and PsA was evaluated by MR using summary-level data. BMI, with IVs taken
from the GIANT consortium, presented a consistent causal effect in terms of direction
estimated using the MR methods, although statistical evidence was weak when using
the MR-Egger regression method. Using BMI data from the UK Biobank found the
equivalent causal effect; however the result was only significant in two of the MR
methods. There was no evidence of horizontal pleiotropy as assessed by MR-Egger and
funnel plots; however, there was some evidence of heterogeneity. Heterogeneity,
where some IVs present disproportionately large or small causal effect estimates,
might be a sign of pleiotropy. In the reverse direction, the results were not significant
suggesting that the observed association is explained by the causal role of BMI on PSO
and/or PsA. There was no evidence of bidirectional causal role among smoking
initiation and PsA or of alcohol intake frequency and PsA.
These findings suggest that the commonly positive association between BMI and both
PSO and PsA reported in observational studies (as described in 1.3.5.4) may
correspond to a causal risk-increasing effect. Obesity is thought to be a chronic
inflammatory condition (Monteiro and Azevedo 2010). Macrophages in adipose tissue
induce the secretion of inflammatory mediators, establishing the inflammatory state.
The adipose tissue secretes adipocytokines including TNFα, IL-6 and leptin which
contribute to an ongoing inflammatory status and probably to the pathogenesis of PSO
and PsA (Hamminga, van der Lely et al. 2006). Leptin plays a key role in the irregular
deposit of fat and development of insulin resistance (Gisondi, Tessari et al. 2007). For
that reason, obesity could trigger PSO and/or PsA or it could be the consequence of
the latent diseases, arising from metabolic disorders and low quality of life (eating
habits, physical inactivity) (Carrascosa, Rocamora et al. 2014). Nonetheless, further
studies are needed to understand the role of inflammation and other biological
pathways shared by obesity and PsA.
MR analysis has emerged as a powerful tool to examine causal inference between
exposures and disease outcomes. MR has a number of advantages that has helped it
gain popularity among epidemiologists. The key feature is the avoidance of confounding
and selection bias, as there is a random allocation of genetic markers of interest. In

211
addition, reverse causation, which is one of the limitations of observational studies, is
avoided as genetic variants are allocated at conception which precedes disease onset.
Finally MR is a cost effective, especially compared with RCTs or prospective cohort
studies, and ethically approved.
However, MR has limitations that should be considered. With the use of summary-
level data from large consortia, the probability of using invalid IVs due to pleiotropy
increases. Pleiotropy can distort MR analyses; for that reason various methods are
being developed to negate pleiotropy including MR-Egger regression. In addition, LD
between the IVs can induce pleiotropy or confounding; however sometimes this is
advantageous as it allows an unmeasured variant to be estimated through a proxy
variant. Perhaps the most important consideration is the statistical power to infer
causality; usually genetic variants have a small effect on the exposure and this could be
tiny if the IV is weak. This means that large sample sizes are required; for example
SNP-exposure associations investigated by consortia to adequately test causal
hypotheses. In general, the difficulty in assessing the MR’s second and third
assumptions could lead to some uncertainty in inferring causality among exposure and
outcome especially when it comes to the precision of the effect estimate.
Nevertheless, MR is an important tool which, coupled with GWAS genetic variants,
has contributed important insights in the potential causality of factors associated with
CVD and mental disorders and can also be used to inform drug development by
pharmacologically modulating the causal risk factors.
Strengths and weaknesses of the study 4.6.1
Several assumptions are required for MR to provide consistent estimates of the
causality of a putative risk factor on a disease outcome. In the current analysis, BMI-
associated variants from a GWAS consortium (GIANT) and a population-based study
(UK Biobank) were used to exploit their large sample sizes to test the causal
hypothesis. The use of only independent, statistically significant SNPs helps to limit the
weak instrument bias and any confounding induced by the LD. In the GIANT study
population, the identified associations explained 2.7% of the BMI variance In addition,
the analysis was restricted to participants of European origin to minimise the risk of
bias due to population stratification. Finally, the use of two-sample design allowed the
212
application of methods that apply different assumptions regarding pleiotropy, thus
relaxing the initial assumptions for valid causal inference.
Conversely, the current analysis suffers from some limitations. First, the PsA cohort
consists of patients who also have PSO; thus, it is not feasible to assess whether the
BMI infers causality for PSO or PsA. In that case, two-step MR analysis can be used to
test for causal mediation in the pathway between BMI and PsA. Also, the use of non-
MHC SNPs as IVs for PsA that explain a small variance of the outcome’s variance could
lead to limited statistical power to assess the causal role of PsA on BMI. Further
similar analyses need to be conducted using the largest GWAS in both PSO and PsA to
test this reverse causation. In addition, the causal role of smoking initiation and alcohol
consumption frequency on PsA could only be investigated using UK Biobank data due
to the lack of publicly available GWAS summary data for alcohol consumption and the
lack of significant variants for smoking initiation in TAG study. A possible solution to
this could be the construction and application of polygenic risk scores for each factor
using variants that do not reach significance; however, their use increases the risk of
pleiotropy. Thus, publicly available summary-data are needed for both exposures from
large studies.
Future work 4.6.2
One of the challenges in MR is the possibility of pleiotropic effects of the IVs which can
induce a genetic correlation among traits because of shared aetiology. A new approach
has been suggested using the latent variable modelling that can identify full or partial
causation among genetically correlated, polygenic traits (O'Connor and Price 2018).
The latent causal variable (LCV) model introduces a latent variable that has a causal
effect on both traits and the genetic correlation between the traits is mediated by this
latent variable. It is used to account for potential pleiotropy; it distinguishes between
genetic correlation and genetic causation and quantifies the magnitude of causality
using the genetic causality proportion (gcp). Authors showed that LCV can avoid
confounding when there is a difference in power or polygenicity between two traits,
unlike bidirectional MR. They also confirmed that MR produces false positives in the
presence of genetic correlation. Thus, LCV should be used in the future to confirm the
causal role of BMI on PsA found in the current study.

213
Conclusion 4.6.3
A higher prevalence of obesity in patients with PSO with or without arthritis
compared to the general population has been reported in various observational
studies. Increased OR of BMI was also reported in chapter two, where I investigated
the association of environmental factors with both PSO without arthritis and PsA using
data from the UK Biobank. However, due to the limitations of observational studies,
alternative low-cost methods have been developed that can effectively and quickly
assess the causal role of lifestyle choices on the onset of disease. One promising
method which is now widely-used is the Mendelian Randomization. In this study
bidirectional MR was applied and identified a possible causal role of BMI on PsA/PSO
that could help preventing disease by targeting adiposity levels along with the use of
immune-oriented medication. This is the first study, to my knowledge, that has utilised
MR to investigate the causal role of obesity on PSO and/or PsA.

214
215
Chapter 5 Discussion of thesis
5
During the last decade, GWAS have been applied to hundreds of complex disorders
yielding thousands of genetic markers and increasing our knowledge of disease
aetiology and underlying biological pathways. In PSO more than 80 risk loci have been
discovered, whereas in PsA only a handful of PsA-specific variants (i.e. associated with
PsA but not with PSO) have been identified due to the smaller samples sizes in PsA
research and its complicated clinical overlap with PSO and other inflammatory
arthritides. In parallel, the research focused on environmental and lifestyle risk factors
that affect the disease’s onset has been mainly conducted in cross-sectional studies not
allowing the investigation of the causal role of those factors on PsA. It is apparent that
only the combination of environmental and genetic risk factors and other -omics data
will provide the full picture of disease heritability and pathogenesis which would help
the effective recognition of PSO patients at risk of developing PsA and the
advancement of therapies.
The application of GWAS in complex traits has proved that many genetic loci
contribute to the genetic variation; thus, the proportion of variance explained by each
SNP is small and larger cohort sizes are needed to detect additional markers. This
realization led the research community to establish large consortia and biobanks in an
effort to detect a proportion of the “missing heritability” of complex traits.
Simultaneously, advances in biostatistics have enabled researchers to explore various
ways of using the results of GWAS for further investigating the genetic architecture of
traits. Therefore, to address the challenges that PsA research faces, a novel cross-
phenotype study was conducted using state-of-the-art statistical methods applied to

216
GWAS data that exploit the phenomenon of pleiotropy. To date, the identification of
PsA genetic risk factors has been performed using traditional GWAS. As multiple lines
of evidence suggest the existence of extensive pleiotropy for complex traits, especially
in autoimmune diseases, may influence predisposition to many of them. The latter has
been the central idea in the development of a specific group of techniques which use
the observed pleiotropy to leverage more power to detect novel associations without
increasing sample sizes. In chapter three, I presented three methods of this category
which led to the detection of 21 novel loci in PsA as well as novel loci in PsA-
correlated diseases including RA, SLE, AS and JIA. Independent replication studies are
needed to establish their association with the disease susceptibility and subsequent
functional studies to confirm their role in causation.
Cross-phenotype GWAS can be challenging compared to the meta-analysis of a single
trait. First, a specific locus can affect only a subset of the analyzed traits and in some
cases this locus might be protective for one disease and increase the risk of another.
Second, it is important to distinguish between truly heterogeneous effects and
statistical noise in cases where the studies are of different power and design. Finally,
the existence of overlapping subjects leads to the inflation of false positive associations.
MTAG and ASSET used in the current thesis are two meta-analysis methods used in a
cross-phenotype context which were developed to address these challenges, with
some unresolved issues still remaining. A recent study compared a number of meta-
analysis methods for cross-phenotype GWAS studies including ASSET (Zhu, Anttila et
al. 2018). The fixed-effect methods like the ASSET outperformed other methods in the
presence of diverse heterogeneity. More specifically, ASSET which exhaustively
explores all subsets of disease combinations for the presence of association performs
best when the number of traits with non-null effects is small. It also presents the best
sensitivity in the presence of directionally opposite effects and the best specificity
under most settings. Finally, it can adequately adjust for known sample overlap. A
crucial improvement will be the adjustment for unknown sample overlap like MTAG
which addresses this by using the LD score regression analysis (Zhu, Anttila et al.
2018). Although MTAG was not included in the comparison, it is known that this
method does not take into account any subset specific effect and performs well when
all variants share the same genetic correlation across all traits. However, the latter
assumption usually is not held in a cross-phenotype design.

217
In the pathogenesis of complex diseases, lifestyle choices and environmental factors
play a key role in the development of the disease. The establishment of biobanks and
repositories help researchers to elucidate these risk factors for diseases. The UK
Biobank is part of this effort and is a rich resource of data including genetic, lifestyle,
biomarkers and imaging. In this thesis, I investigated the association of known lifestyle
factors using data from 500,000 participants. The study showed the role of obesity in
both PSO and PsA compared to the general population and its increased prevalence in
patients with PsA compared to PSO which is in line with previous literature. The
involvement of both alcohol frequency consumption and smoking has been unclear. In
this study, smoking and alcohol frequency intake was found to be less prevalent in PsA
compared to PSO, where collider bias probably influenced the association with
smoking. The use of cross-sectional data allows only the estimation of the prevalence
rates of those factors; therefore MR was applied to GWAS summary data to elucidate
their causality on PsA. Only BMI was found to play a causal role in the development of
PsA, a finding that could help clinicians motivate patients with PSO to change their
nutritional habits or adopt healthy eating to decrease the odds of developing PsA.
The key question is “How can these factors, both genetic and lifestyle, be useful in clinical
practice for each patient?”. Personalised medicine is not a new concept. For years
clinicians have tried to tailor health care to an individual’s needs, however the
identification of individuals at risk of developing a disease or more likely to respond to
certain treatments has not yet been sufficiently predictive to be clinically useful in many
cases. To address these challenges, researchers use the vast amount of genome-wide
data that is available to create genomic risk prediction models. The approach is
straightforward; each individual’s DNA is genotyped using one of the various
genotyping arrays and after passing quality control tests and performing imputation, an
algorithm calculates a risk score utilising the weights of a list of genetic markers. As
genomic risk models only show the heritable component of risk, integrating
environmental factors, biomarkers and electronic health records could increase the
predictive ability of these models. It should be noted that the role of predictive
models is not to substitute clinical judgement but to provide insights to the
progression of a disease and stratify individuals to those at risk of developing a disease.
In the case of PSO patients, predictive risk modelling can stratify patients into
appropriate treatment plans and help implement accurate screening techniques. The

218
transition from PSO to the development of PsA is known; psoriatic individuals with
genetic risk factors for PsA will be exposed to relevant environmental and lifestyle risk
factors and some of them will eventually develop PsA. The prevention of PsA would
involve interventions to halt the onset of PsA in the phase of exposure to
environmental determinants while pre-existing systemic autoimmunity underlies, for
example a healthy diet and frequent exercise campaign could be implemented for first-
degree relatives of patients with PsA. It is obvious that relevant interventions could
take place in the case of the development of PSO by preventing any PSO-related
systemic autoimmunity. However, targeted prevention could be challenging regarding
the “screening” for potential cases in the general population. PsA present us with a
unique opportunity for preventative intervention as patients with PSO represent a high
risk group where prevalence of PsA is approximately 30%. This is not the case for
PSO and other diseases where the general population is the potential pool of subjects
which could lead to increased risk of false positives and false negatives. Furthermore,
predictive modelling is not without its challenges when it comes to efficient
manipulation, storage and protection of the exponentially increasing data and the
knowledge gaps on “mining” useful information from large datasets. In addition, the
lack of standards for bioinformatics processing, storage and assistance with clinical-
decision making means the incorporation of genomic data into clinical practice remains
challenging. Despite these concerns, genomic data will play an essential role in
personalised medicine and will further help patient-oriented care.
Conclusion 5.1
In conclusion, this thesis has carried forward the research in detecting PsA risk factors.
The thesis includes the first cross-phenotype study of PsA along with other four
musculoskeletal diseases, the first study of environmental factors and comorbidities in
PsA using the UK Biobank and the first MR analysis performed in a PsA cohort to
detect potential causality among environmental factors and the disease. While this data
do not provide the opportunity for immediate clinical application, it can be the basis
for further studies.

219
References
Adeloye, D., S. Chua, et al. (2015). "Global and regional estimates of COPD prevalence: Systematic review and meta-analysis." J Glob Health 5(2): 020415.
Afifi, L., M. J. Danesh, et al. (2017). "Dietary Behaviors in Psoriasis: Patient-Reported
Outcomes from a U.S. National Survey." Dermatol Ther (Heidelb) 7(2): 227-
242.
Aggarwal, R., S. Ringold, et al. (2015). "Distinctions between diagnostic and
classification criteria?" Arthritis Care Res (Hoboken) 67(7): 891-897.
Airoldi, I., E. Di Carlo, et al. (2005). "Lack of Il12rb2 signaling predisposes to
spontaneous autoimmunity and malignancy." Blood 106(12): 3846-3853.
Al'Abadie, M. S., G. G. Kent, et al. (1994). "The relationship between stress and the
onset and exacerbation of psoriasis and other skin conditions." Br J Dermatol
130(2): 199-203.
Al-Mutairi, N., S. Al-Farag, et al. (2010). "Comorbidities associated with psoriasis: an
experience from the Middle East." J Dermatol 37(2): 146-155.
Alamanos, Y., P. V. Voulgari, et al. (2008). "Incidence and prevalence of psoriatic
arthritis: a systematic review." J Rheumatol 35(7): 1354-1358.
Alenius, G. M., B. Stenberg, et al. (2002). "Inflammatory joint manifestations are
prevalent in psoriasis: prevalence study of joint and axial involvement in
psoriatic patients, and evaluation of a psoriatic and arthritic questionnaire." J
Rheumatol 29(12): 2577-2582.
Allen, N. (2013). "UK Biobank: current status and what it means for epidemiology."
Health Policy and Technology 1(3): 123-126.
Andreassen, O. A., S. Djurovic, et al. (2013). "Improved detection of common variants
associated with schizophrenia by leveraging pleiotropy with cardiovascular-
disease risk factors." Am J Hum Genet 92(2): 197-209.
Andreassen, O. A., W. K. Thompson, et al. (2013). "Improved detection of common
variants associated with schizophrenia and bipolar disorder using pleiotropy-
informed conditional false discovery rate." PLoS Genet 9(4): e1003455.

220
Andreassen, O. A., W. K. Thompson, et al. (2015). "Correction: Improved Detection
of Common Variants Associated with Schizophrenia and Bipolar Disorder
Using Pleiotropy-Informed Conditional False Discovery Rate." PLoS Genet
11(11): e1005544.
Apel, M., S. Uebe, et al. (2013). "Variants in RUNX3 contribute to susceptibility to
psoriatic arthritis, exhibiting further common ground with ankylosing
spondylitis." Arthritis Rheum 65(5): 1224-1231.
Arakawa, A., K. Siewert, et al. (2015). "Melanocyte antigen triggers autoimmunity in
human psoriasis." J Exp Med 212(13): 2203-2212.
Armstrong, A. W., C. T. Harskamp, et al. (2012). "The association between psoriasis
and obesity: a systematic review and meta-analysis of observational studies."
Nutr Diabetes 2: e54.
Armstrong, A. W., C. T. Harskamp, et al. (2013). "The association between psoriasis
and hypertension: a systematic review and meta-analysis of observational
studies." J Hypertens 31(3): 433-443.
Armstrong, A. W., C. T. Harskamp, et al. (2013). "Psoriasis and the risk of diabetes mellitus: a systematic review and meta-analysis." JAMA Dermatol 149(1): 84-91.
Armstrong, E. J., C. T. Harskamp, et al. (2013). "Psoriasis and major adverse
cardiovascular events: a systematic review and meta-analysis of observational
studies." J Am Heart Assoc 2(2): e000062.
Australo-Anglo-American Spondyloarthritis, C., J. D. Reveille, et al. (2010). "Genome-
wide association study of ankylosing spondylitis identifies non-MHC
susceptibility loci." Nat Genet 42(2): 123-127.
Avina-Zubieta, J. A., J. Thomas, et al. (2012). "Risk of incident cardiovascular events in
patients with rheumatoid arthritis: a meta-analysis of observational studies."
Ann Rheum Dis 71(9): 1524-1529.
Azfar, R. S., N. M. Seminara, et al. (2012). "Increased risk of diabetes mellitus and
likelihood of receiving diabetes mellitus treatment in patients with psoriasis."
Arch Dermatol 148(9): 995-1000.
Barber, J., S. Muller, et al. (2010). "Measuring morbidity: self-report or health care
records?" Fam Pract 27(1): 25-30.
Basavaraj, K. H., N. M. Ashok, et al. (2010). "The role of drugs in the induction and/or
exacerbation of psoriasis." Int J Dermatol 49(12): 1351-1361.

221
Bath, R. K., N. K. Brar, et al. (2014). "A review of methotrexate-associated
hepatotoxicity." J Dig Dis 15(10): 517-524.
Baum, P. R., R. B. Gayle, 3rd, et al. (1994). "Molecular characterization of murine and
human OX40/OX40 ligand systems: identification of a human OX40 ligand as
the HTLV-1-regulated protein gp34." EMBO J 13(17): 3992-4001.
Bencherif, M., P. M. Lippiello, et al. (2011). "Alpha7 nicotinic receptors as novel
therapeutic targets for inflammation-based diseases." Cell Mol Life Sci 68(6):
931-949.
Benjamin, M. and D. McGonagle (2001). "The anatomical basis for disease localisation
in seronegative spondyloarthropathy at entheses and related sites." J Anat
199(Pt 5): 503-526.
Bentham, J., D. L. Morris, et al. (2015). "Genetic association analyses implicate aberrant
regulation of innate and adaptive immunity genes in the pathogenesis of
systemic lupus erythematosus." Nat Genet 47(12): 1457-1464.
Bergboer, J. G. M., P. Zeeuwen, et al. (2012). "Genetics of psoriasis: evidence for
epistatic interaction between skin barrier abnormalities and immune deviation." J Invest Dermatol 132(10): 2320-2331.
Bernstein, C. N., A. Wajda, et al. (2005). "The clustering of other chronic inflammatory
diseases in inflammatory bowel disease: a population-based study."
Gastroenterology 129(3): 827-836.
Bhattacharjee, S., P. Rajaraman, et al. (2012). "A subset-based approach improves
power and interpretation for the combined analysis of genetic association
studies of heterogeneous traits." Am J Hum Genet 90(5): 821-835.
Bhole, V. M., H. K. Choi, et al. (2012). "Differences in body mass index among
individuals with PsA, psoriasis, RA and the general population." Rheumatology
(Oxford) 51(3): 552-556.
Blackshaw, S., A. Sawa, et al. (2000). "Type 3 inositol 1,4,5-trisphosphate receptor
modulates cell death." FASEB J 14(10): 1375-1379.
Bo, K., M. Thoresen, et al. (2008). "Smokers report more psoriasis, but not atopic
dermatitis or hand eczema: results from a Norwegian population survey among
adults." Dermatology 216(1): 40-45.
Boehncke, S., D. Thaci, et al. (2007). "Psoriasis patients show signs of insulin
resistance." Br J Dermatol 157(6): 1249-1251.

222
Bowden, J., G. Davey Smith, et al. (2015). "Mendelian randomization with invalid
instruments: effect estimation and bias detection through Egger regression." Int
J Epidemiol 44(2): 512-525.
Bowden, J., G. Davey Smith, et al. (2016). "Consistent Estimation in Mendelian
Randomization with Some Invalid Instruments Using a Weighted Median
Estimator." Genet Epidemiol 40(4): 304-314.
Bowden, J., M. F. Del Greco, et al. (2016). "Assessing the suitability of summary data
for two-sample Mendelian randomization analyses using MR-Egger regression:
the role of the I2 statistic." Int J Epidemiol 45(6): 1961-1974.
Bowes, J., J. Ashcroft, et al. (2017). "Cross-phenotype association mapping of the MHC
identifies genetic variants that differentiate psoriatic arthritis from psoriasis."
Ann Rheum Dis 76(10): 1774-1779.
Bowes, J., A. Budu-Aggrey, et al. (2015). "Dense genotyping of immune-related
susceptibility loci reveals new insights into the genetics of psoriatic arthritis."
Nat Commun 6: 6046.
Bowes, J., S. Eyre, et al. (2011). "Evidence to support IL-13 as a risk locus for psoriatic arthritis but not psoriasis vulgaris." Ann Rheum Dis 70(6): 1016-1019.
Bowes, J., S. Loehr, et al. (2015). "PTPN22 is associated with susceptibility to psoriatic
arthritis but not psoriasis: evidence for a further PsA-specific risk locus." Ann
Rheum Dis 74(10): 1882-1885.
Bowes, J., G. Orozco, et al. (2011). "Confirmation of TNIP1 and IL23A as susceptibility
loci for psoriatic arthritis." Ann Rheum Dis 70(9): 1641-1644.
Boyd, A. S. and K. H. Neldner (1990). "The isomorphic response of Koebner." Int J
Dermatol 29(6): 401-410.
Brandrup, F., M. Hauge, et al. (1978). "Psoriasis in an unselected series of twins." Arch
Dermatol 114(6): 874-878.
Brauchli, Y. B., S. S. Jick, et al. (2008). "Psoriasis and the risk of incident diabetes
mellitus: a population-based study." Br J Dermatol 159(6): 1331-1337.
Brenaut, E., C. Horreau, et al. (2013). "Alcohol consumption and psoriasis: a systematic
literature review." J Eur Acad Dermatol Venereol 27 Suppl 3: 30-35.
Budu-Aggrey, A., J. Bowes, et al. (2016). "Replication of a distinct psoriatic arthritis risk
variant at the IL23R locus." Ann Rheum Dis 75(7): 1417-1418.
223
Budu-Aggrey, A., J. Bowes, et al. (2017). "A rare coding allele in IFIH1 is protective for
psoriatic arthritis." Ann Rheum Dis 76(7): 1321-1324.
Bulik-Sullivan, B., H. K. Finucane, et al. (2015). "An atlas of genetic correlations across
human diseases and traits." Nat Genet 47(11): 1236-1241.
Burgess, S., J. Bowden, et al. (2017). "Sensitivity Analyses for Robust Causal Inference
from Mendelian Randomization Analyses with Multiple Genetic Variants."
Epidemiology 28(1): 30-42.
Burgess, S., A. Butterworth, et al. (2013). "Mendelian randomization analysis with
multiple genetic variants using summarized data." Genet Epidemiol 37(7): 658-
665.
Burgess, S., F. Dudbridge, et al. (2015). "Re: "Multivariable Mendelian randomization:
the use of pleiotropic genetic variants to estimate causal effects"." Am J
Epidemiol 181(4): 290-291.
Burgess, S., R. A. Scott, et al. (2015). "Using published data in Mendelian randomization:
a blueprint for efficient identification of causal risk factors." Eur J Epidemiol
30(7): 543-552.
Burgess, S. and S. G. Thompson (2013). "Use of allele scores as instrumental variables
for Mendelian randomization." Int J Epidemiol 42(4): 1134-1144.
Burgess, S. and S. G. Thompson (2015). "Multivariable Mendelian randomization: the
use of pleiotropic genetic variants to estimate causal effects." Am J Epidemiol
181(4): 251-260.
Burgess, S., S. G. Thompson, et al. (2011). "Avoiding bias from weak instruments in
Mendelian randomization studies." Int J Epidemiol 40(3): 755-764.
Burner, T. W. and A. K. Rosenthal (2009). "Diabetes and rheumatic diseases." Curr
Opin Rheumatol 21(1): 50-54.
Buske-Kirschbaum, A., S. Kern, et al. (2007). "Altered distribution of leukocyte subsets
and cytokine production in response to acute psychosocial stress in patients
with psoriasis vulgaris." Brain Behav Immun 21(1): 92-99.
Buskila, D., D. D. Gladman, et al. (1990). "Rheumatologic manifestations of infection
with the human immunodeficiency virus (HIV)." Clin Exp Rheumatol 8(6): 567-
573.
Candia, R., A. Ruiz, et al. (2015). "Risk of non-alcoholic fatty liver disease in patients
with psoriasis: a systematic review and meta-analysis." J Eur Acad Dermatol
Venereol 29(4): 656-662.

224
Canete, J. D. and P. Mease (2012). "The link between obesity and psoriatic arthritis."
Ann Rheum Dis 71(8): 1265-1266.
Cargill, M., S. J. Schrodi, et al. (2007). "A large-scale genetic association study confirms
IL12B and leads to the identification of IL23R as psoriasis-risk genes." Am J
Hum Genet 80(2): 273-290.
Carrascosa, J. M., V. Rocamora, et al. (2014). "Obesity and psoriasis: inflammatory
nature of obesity, relationship between psoriasis and obesity, and therapeutic
implications." Actas Dermosifiliogr 105(1): 31-44.
Cham, C. M., K. Ko, et al. (2012). "Interferon regulatory factor 5 in the pathogenesis of
systemic lupus erythematosus." Clin Dev Immunol 2012: 780436.
Chandran, V. (2010). "Genetics of psoriasis and psoriatic arthritis." Indian J Dermatol
55(2): 151-156.
Chandran, V., S. B. Bull, et al. (2013). "Human leukocyte antigen alleles and
susceptibility to psoriatic arthritis." Hum Immunol 74(10): 1333-1338.
Chandran, V., C. T. Schentag, et al. (2009). "Familial aggregation of psoriatic arthritis."
Ann Rheum Dis 68(5): 664-667.
Chang, J. T., E. M. Shevach, et al. (1999). "Regulation of interleukin (IL)-12 receptor
beta2 subunit expression by endogenous IL-12: a critical step in the
differentiation of pathogenic autoreactive T cells." J Exp Med 189(6): 969-978.
Chapman, J. T., L. E. Otterbein, et al. (2001). "Carbon monoxide attenuates
aeroallergen-induced inflammation in mice." Am J Physiol Lung Cell Mol Physiol
281(1): L209-216.
Cheng, H., Y. Li, et al. (2014). "Identification of a missense variant in LNPEP that
confers psoriasis risk." J Invest Dermatol 134(2): 359-365.
Chiang, Y. Y. and H. W. Lin (2012). "Association between psoriasis and chronic
obstructive pulmonary disease: a population-based study in Taiwan." J Eur Acad
Dermatol Venereol 26(1): 59-65.
Chouela, E., A. Abeldano, et al. (1996). "Hepatitis C virus antibody (anti-HCV):
prevalence in psoriasis." Int J Dermatol 35(11): 797-799.
Ciccacci, C., P. Conigliaro, et al. (2016). "Polymorphisms in STAT-4, IL-10, PSORS1C1,
PTPN2 and MIR146A genes are associated differently with prognostic factors in
Italian patients affected by rheumatoid arthritis." Clin Exp Immunol 186(2):
157-163.

225
Coates, L. C., T. Aslam, et al. (2013). "Comparison of three screening tools to detect
psoriatic arthritis in patients with psoriasis (CONTEST study)." Br J Dermatol
168(4): 802-807.
Cohen, A. D., J. Dreiher, et al. (2009). "Psoriasis associated with ulcerative colitis and
Crohn's disease." J Eur Acad Dermatol Venereol 23(5): 561-565.
Cohen, A. D., D. Weitzman, et al. (2010). "Psoriasis associated with hepatitis C but not
with hepatitis B." Dermatology 220(3): 218-222.
Cohen, A. D., D. Weitzman, et al. (2010). "Psoriasis and hypertension: a case-control
study." Acta Derm Venereol 90(1): 23-26.
Collins, R. (2012). "What makes UK Biobank special?" Lancet 379(9822): 1173-1174.
Cortes, A. and M. A. Brown (2011). "Promise and pitfalls of the Immunochip." Arthritis
Res Ther 13(1): 101.
Costello, P., B. Bresnihan, et al. (1999). "Predominance of CD8+ T lymphocytes in
psoriatic arthritis." J Rheumatol 26(5): 1117-1124.
Cotsapas, C., B. F. Voight, et al. (2011). "Pervasive sharing of genetic effects in
autoimmune disease." PLoS Genet 7(8): e1002254.
Curtis, J. R., T. Beukelman, et al. (2010). "Elevated liver enzyme tests among patients
with rheumatoid arthritis or psoriatic arthritis treated with methotrexate
and/or leflunomide." Ann Rheum Dis 69(1): 43-47.
Dai, J. Y. and X. C. Zhang (2015). "Mendelian randomization studies for a continuous
exposure under case-control sampling." Am J Epidemiol 181(6): 440-449.
Dalgard, F. J., U. Gieler, et al. (2015). "The psychological burden of skin diseases: a
cross-sectional multicenter study among dermatological out-patients in 13
European countries." J Invest Dermatol 135(4): 984-991.
Dand, N., S. Mucha, et al. (2017). "Exome-wide association study reveals novel
psoriasis susceptibility locus at TNFSF15 and rare protective alleles in genes
contributing to type I IFN signalling." Hum Mol Genet 26(21): 4301-4313.
Davey Smith, G. and G. Hemani (2014). "Mendelian randomization: genetic anchors for
causal inference in epidemiological studies." Hum Mol Genet 23(R1): R89-98.
de Cid, R., E. Riveira-Munoz, et al. (2009). "Deletion of the late cornified envelope
LCE3B and LCE3C genes as a susceptibility factor for psoriasis." Nat Genet
41(2): 211-215.

226
de Korte, J., M. A. Sprangers, et al. (2004). "Quality of life in patients with psoriasis: a
systematic literature review." J Investig Dermatol Symp Proc 9(2): 140-147.
De Souza, Y. G. and J. S. Greenspan (2013). "Biobanking past, present and future:
responsibilities and benefits." AIDS 27(3): 303-312.
Delgado-Rodriguez, M. and J. Llorca (2004). "Bias." J Epidemiol Community Health
58(8): 635-641.
Despres, J. P. (2012). "Body fat distribution and risk of cardiovascular disease: an
update." Circulation 126(10): 1301-1313.
Dicker, R. C. (2006). Principles of Epidemiology in Public Health Practice: An
Introduction to Applied Epidemiology and Biostatistics, Centre for Disease
Control and Prevention (CDC).
Dommasch, E. D., T. Li, et al. (2015). "Risk of depression in women with psoriasis: a
cohort study." Br J Dermatol 173(4): 975-980.
dos Santos Silva, I. (1999). Cancer Epidemiology: Principles and Methods. France,
International Agency for Research and Cancer.
Dowlatshahi, E. A., M. Wakkee, et al. (2014). "The prevalence and odds of depressive symptoms and clinical depression in psoriasis patients: a systematic review and
meta-analysis." J Invest Dermatol 134(6): 1542-1551.
Doyle, T. J. and P. F. Dellaripa (2017). "Lung Manifestations in the Rheumatic Diseases."
Chest 152(6): 1283-1295.
Dreiher, J., T. Freud, et al. (2013). "Psoriatic arthritis and diabetes: a population-based
cross-sectional study." Dermatol Res Pract 2013: 580404.
Dreiher, J., D. Weitzman, et al. (2008). "Psoriasis and chronic obstructive pulmonary
disease: a case-control study." Br J Dermatol 159(4): 956-960.
du Prel, J. B., G. Hommel, et al. (2009). "Confidence interval or p-value?: part 4 of a
series on evaluation of scientific publications." Dtsch Arztebl Int 106(19): 335-
339.
Duffin, K. C., I. C. Freeny, et al. (2009). "Association between IL13 polymorphisms and
psoriatic arthritis is modified by smoking." J Invest Dermatol 129(12): 2777-
2783.
Duffy, D. L., L. S. Spelman, et al. (1993). "Psoriasis in Australian twins." J Am Acad
Dermatol 29(3): 428-434.

227
Duhen, T., R. Geiger, et al. (2009). "Production of interleukin 22 but not interleukin 17
by a subset of human skin-homing memory T cells." Nat Immunol 10(8): 857-
863.
Ebrahim, S. and G. Davey Smith (2013). "Commentary: Should we always deliberately
be non-representative?" Int J Epidemiol 42(4): 1022-1026.
Eder, L., V. Chandran, et al. (2017). "The Risk of Developing Diabetes Mellitus in
Patients with Psoriatic Arthritis: A Cohort Study." J Rheumatol 44(3): 286-291.
Eder, L., V. Chandran, et al. (2012). "Human leucocyte antigen risk alleles for psoriatic
arthritis among patients with psoriasis." Ann Rheum Dis 71(1): 50-55.
Eder, L., V. Chandran, et al. (2011). "IL13 gene polymorphism is a marker for psoriatic
arthritis among psoriasis patients." Ann Rheum Dis 70(9): 1594-1598.
Eder, L., V. Chandran, et al. (2011). "Incidence of arthritis in a prospective cohort of
psoriasis patients." Arthritis Care Res (Hoboken) 63(4): 619-622.
Eder, L., A. Haddad, et al. (2015). "The incidence and risk factors for psoriatic arthritis
in patients with psoriasis - a prospective cohort study." Arthritis Rheumatol.
Eder, L., T. Law, et al. (2011). "Association between environmental factors and onset of psoriatic arthritis in patients with psoriasis." Arthritis Care Res (Hoboken)
63(8): 1091-1097.
Eder, L., S. Shanmugarajah, et al. (2012). "The association between smoking and the
development of psoriatic arthritis among psoriasis patients." Ann Rheum Dis
71(2): 219-224.
Edwards, R. R., C. Cahalan, et al. (2011). "Pain, catastrophizing, and depression in the
rheumatic diseases." Nat Rev Rheumatol 7(4): 216-224.
Egeberg, A., J. P. Thyssen, et al. (2017). "Risk of Myocardial Infarction in Patients with
Psoriasis and Psoriatic Arthritis: A Nationwide Cohort Study." Acta Derm
Venereol 97(7): 819-824.
Elia, M. (2013). "Body composition by whole-body bioelectrical impedance and
prediction of clinically relevant outcomes: overvalued or underused?" Eur J Clin
Nutr 67 Suppl 1: S60-70.
Ellinghaus, D., E. Ellinghaus, et al. (2012). "Combined analysis of genome-wide
association studies for Crohn disease and psoriasis identifies seven shared
susceptibility loci." Am J Hum Genet 90(4): 636-647.

228
Ellinghaus, D., L. Jostins, et al. (2016). "Analysis of five chronic inflammatory diseases
identifies 27 new associations and highlights disease-specific patterns at shared
loci." Nat Genet 48(5): 510-518.
Ellinghaus, E., D. Ellinghaus, et al. (2010). "Genome-wide association study identifies a
psoriasis susceptibility locus at TRAF3IP2." Nat Genet 42(11): 991-995.
Ellinghaus, E., P. E. Stuart, et al. (2012). "Genome-wide meta-analysis of psoriatic
arthritis identifies susceptibility locus at REL." J Invest Dermatol 132(4): 1133-
1140.
Ellis, J. A., K. J. Scurrah, et al. (2015). "Epistasis amongst PTPN2 and genes of the
vitamin D pathway contributes to risk of juvenile idiopathic arthritis." J Steroid
Biochem Mol Biol 145: 113-120.
Ernster, V. L. (1994). "Nested case-control studies." Prev Med 23(5): 587-590.
Ethgen, O. and B. Standaert (2012). "Population- versus cohort-based modelling
approaches." Pharmacoeconomics 30(3): 171-181.
Evangelou, E. and J. P. Ioannidis (2013). "Meta-analysis methods for genome-wide
association studies and beyond." Nat Rev Genet 14(6): 379-389.
Evers, A. W., Y. Lu, et al. (2005). "Common burden of chronic skin diseases?
Contributors to psychological distress in adults with psoriasis and atopic
dermatitis." Br J Dermatol 152(6): 1275-1281.
Fadnes, L. T., A. Taube, et al. (2008). "How to identify information bias due to self-
reporting in epidemiological research." The Internet Journal of Epidemiology
7(2).
Farber, E. M. and L. Nall (1993). "Psoriasis: a stress-related disease." Cutis 51(5): 322-
326.
Farber, E. M., M. L. Nall, et al. (1974). "Natural history of psoriasis in 61 twin pairs."
Arch Dermatol 109(2): 207-211.
Fedak, K. M., A. Bernal, et al. (2015). "Applying the Bradford Hill criteria in the 21st
century: how data integration has changed causal inference in molecular
epidemiology." Emerg Themes Epidemiol 12: 14.
Ferreira, B. I., J. L. Abreu, et al. (2016). "Psoriasis and Associated Psychiatric Disorders:
A Systematic Review on Etiopathogenesis and Clinical Correlation." J Clin
Aesthet Dermatol 9(6): 36-43.

229
Fisher, R. A. (1925). Statistical methods for research workers. Edinburgh: Oliver and
Boyd.
Fletcher, R. H. and S. W. Fletcher (2005). Clinical epidemiology : the essentials.
Philadelphia, Lippincott Williams & Wilkins.
Fry, A., T. J. Littlejohns, et al. (2017). "Comparison of Sociodemographic and Health-
Related Characteristics of UK Biobank Participants with the General
Population." Am J Epidemiol.
Fujita, H. (2013). "The role of IL-22 and Th22 cells in human skin diseases." J Dermatol
Sci 72(1): 3-8.
Furue, M. and T. Kadono (2017). ""Inflammatory skin march" in atopic dermatitis and
psoriasis." Inflamm Res 66(10): 833-842.
Gabriel, S. E. and K. Michaud (2009). "Epidemiological studies in incidence, prevalence,
mortality, and comorbidity of the rheumatic diseases." Arthritis Res Ther 11(3):
229.
Galea, S. and M. Tracy (2007). "Participation rates in epidemiologic studies." Ann
Epidemiol 17(9): 643-653.
Gelfand, J. M., A. L. Neimann, et al. (2006). "Risk of myocardial infarction in patients
with psoriasis." JAMA 296(14): 1735-1741.
Genetic Analysis of Psoriasis, C., C. the Wellcome Trust Case Control, et al. (2010).
"A genome-wide association study identifies new psoriasis susceptibility loci and
an interaction between HLA-C and ERAP1." Nat Genet 42(11): 985-990.
Gisondi, P., G. Targher, et al. (2009). "Non-alcoholic fatty liver disease in patients with
chronic plaque psoriasis." J Hepatol 51(4): 758-764.
Gisondi, P., G. Tessari, et al. (2007). "Prevalence of metabolic syndrome in patients
with psoriasis: a hospital-based case-control study." Br J Dermatol 157(1): 68-
73.
Gladman, D. D., K. A. Anhorn, et al. (1986). "HLA antigens in psoriatic arthritis." J
Rheumatol 13(3): 586-592.
Gladman, D. D., C. Antoni, et al. (2005). "Psoriatic arthritis: epidemiology, clinical
features, course, and outcome." Ann Rheum Dis 64 Suppl 2: ii14-17.
Gladman, D. D., C. T. Schentag, et al. (2009). "Development and initial validation of a
screening questionnaire for psoriatic arthritis: the Toronto Psoriatic Arthritis
Screen (ToPAS)." Ann Rheum Dis 68(4): 497-501.

230
Glas, J., J. Wagner, et al. (2012). "PTPN2 gene variants are associated with
susceptibility to both Crohn's disease and ulcerative colitis supporting a
common genetic disease background." PLoS One 7(3): e33682.
Gottlieb, A., N. J. Korman, et al. (2008). "Guidelines of care for the management of
psoriasis and psoriatic arthritis: Section 2. Psoriatic arthritis: overview and
guidelines of care for treatment with an emphasis on the biologics." J Am Acad
Dermatol 58(5): 851-864.
Gottlieb, A. B., F. Dann, et al. (2008). "Psoriasis and the metabolic syndrome." J Drugs
Dermatol 7(6): 563-572.
Gottlieb, S. L., P. Gilleaudeau, et al. (1995). "Response of psoriasis to a lymphocyte-
selective toxin (DAB389IL-2) suggests a primary immune, but not keratinocyte,
pathogenic basis." Nat Med 1(5): 442-447.
Grando, S. A., R. M. Horton, et al. (1996). "Activation of keratinocyte nicotinic
cholinergic receptors stimulates calcium influx and enhances cell
differentiation." J Invest Dermatol 107(3): 412-418.
Greb, J. E., A. M. Goldminz, et al. (2016). "Psoriasis." Nat Rev Dis Primers 2: 16082.
Greene, B. L., G. F. Haldeman, et al. (2006). "Factors affecting physical activity behavior
in urban adults with arthritis who are predominantly African-American and
female." Phys Ther 86(4): 510-519.
Greenland, S. (2000). "An introduction to instrumental variables for epidemiologists."
Int J Epidemiol 29(4): 722-729.
Griffiths, C. E. and H. L. Richards (2001). "Psychological influences in psoriasis." Clin
Exp Dermatol 26(4): 338-342.
Grjibovski, A. M., A. O. Olsen, et al. (2007). "Psoriasis in Norwegian twins:
contribution of genetic and environmental effects." J Eur Acad Dermatol
Venereol 21(10): 1337-1343.
Groll, D. L., T. To, et al. (2005). "The development of a comorbidity index with
physical function as the outcome." J Clin Epidemiol 58(6): 595-602.
Gudu, T., A. Etcheto, et al. (2016). "Fatigue in psoriatic arthritis - a cross-sectional
study of 246 patients from 13 countries." Joint Bone Spine 83(4): 439-443.
Gupta, M. A. and A. K. Gupta (1998). "Depression and suicidal ideation in dermatology
patients with acne, alopecia areata, atopic dermatitis and psoriasis." Br J
Dermatol 139(5): 846-850.

231
Gupta, M. A., A. K. Gupta, et al. (1989). "A psychocutaneous profile of psoriasis
patients who are stress reactors. A study of 127 patients." Gen Hosp Psychiatry
11(3): 166-173.
Hackinger, S. and E. Zeggini (2017). "Statistical methods to detect pleiotropy in human
complex traits." Open Biol 7(11).
Haegert, D. G. (2004). "Analysis of the threshold liability model provides new
understanding of causation in autoimmune diseases." Med Hypotheses 63(2):
257-261.
Haldar, R. and D. Mukhopadhyay (2011). "Levenshtein distance technique in dictionary
lookup methods: An improved approach." Web intelligence & distributed
computing research lab.
Hamminga, E. A., A. J. van der Lely, et al. (2006). "Chronic inflammation in psoriasis
and obesity: implications for therapy." Med Hypotheses 67(4): 768-773.
Han, C., D. W. Robinson, Jr., et al. (2006). "Cardiovascular disease and risk factors in
patients with rheumatoid arthritis, psoriatic arthritis, and ankylosing
spondylitis." J Rheumatol 33(11): 2167-2172.
Harbord, R. M., V. Didelez, et al. (2013). "Severity of bias of a simple estimator of the
causal odds ratio in Mendelian randomization studies." Stat Med 32(7): 1246-
1258.
Haroon, M., P. Gallagher, et al. (2014). "High prevalence of metabolic syndrome and of
insulin resistance in psoriatic arthritis is associated with the severity of
underlying disease." J Rheumatol 41(7): 1357-1365.
Haroon, M., B. Kirby, et al. (2013). "High prevalence of psoriatic arthritis in patients
with severe psoriasis with suboptimal performance of screening
questionnaires." Ann Rheum Dis 72(5): 736-740.
Haroon, N. and R. D. Inman (2010). "Endoplasmic reticulum aminopeptidases: Biology
and pathogenic potential." Nat Rev Rheumatol 6(8): 461-467.
Hart, C. L., D. S. Morrison, et al. (2010). "Effect of body mass index and alcohol
consumption on liver disease: analysis of data from two prospective cohort
studies." BMJ 340: c1240.
Hartwig, F. P., G. Davey Smith, et al. (2017). "Robust inference in summary data
Mendelian randomization via the zero modal pleiotropy assumption." Int J
Epidemiol 46(6): 1985-1998.

232
Haycock, P. C., S. Burgess, et al. (2016). "Best (but oft-forgotten) practices: the design,
analysis, and interpretation of Mendelian randomization studies." Am J Clin
Nutr 103(4): 965-978.
Hemani, G., J. Zheng, et al. (2016). "MR-Base: a platform for systematic causal
inference across the phenome using billions of genetic associations. ." bioRxiv.
Henchoz, Y., F. Bastardot, et al. (2012). "Physical activity and energy expenditure in
rheumatoid arthritis patients and matched controls." Rheumatology (Oxford)
51(8): 1500-1507.
Henseler, T. and E. Christophers (1985). "Psoriasis of early and late onset:
characterization of two types of psoriasis vulgaris." J Am Acad Dermatol 13(3):
450-456.
Hewlett, S., Z. Cockshott, et al. (2005). "Patients' perceptions of fatigue in rheumatoid
arthritis: overwhelming, uncontrollable, ignored." Arthritis Rheum 53(5): 697-
702.
Hidalgo, B. and M. Goodman (2013). "Multivariate or multivariable regression?" Am J
Public Health 103(1): 39-40.
Ho, P. Y., A. Barton, et al. (2008). "Investigating the role of the HLA-Cw*06 and HLA-
DRB1 genes in susceptibility to psoriatic arthritis: comparison with psoriasis
and undifferentiated inflammatory arthritis." Ann Rheum Dis 67(5): 677-682.
Hoffmann, A. and D. Baltimore (2006). "Circuitry of nuclear factor kappaB signaling."
Immunol Rev 210: 171-186.
Hoggart, C. J., T. G. Clark, et al. (2008). "Genome-wide significance for dense SNP and
resequencing data." Genet Epidemiol 32(2): 179-185.
Hsieh, J., S. Kadavath, et al. (2014). "Can traumatic injury trigger psoriatic arthritis? A
review of the literature." Clin Rheumatol 33(5): 601-608.
Hu, S. C. and C. E. Lan (2017). "Psoriasis and Cardiovascular Comorbidities: Focusing
on Severe Vascular Events, Cardiovascular Risk Factors and Implications for
Treatment." Int J Mol Sci 18(10).
Huffmeier, U., S. Uebe, et al. (2010). "Common variants at TRAF3IP2 are associated
with susceptibility to psoriatic arthritis and psoriasis." Nat Genet 42(11): 996-
999.
Huidekoper, A. L., D. van der Woude, et al. (2013). "Patients with early arthritis
consume less alcohol than controls, regardless of the type of arthritis."
Rheumatology (Oxford) 52(9): 1701-1707.

233
Husni, M. E., K. H. Meyer, et al. (2007). "The PASE questionnaire: pilot-testing a
psoriatic arthritis screening and evaluation tool." J Am Acad Dermatol 57(4):
581-587.
Husted, J. A., A. Thavaneswaran, et al. (2011). "Cardiovascular and other comorbidities
in patients with psoriatic arthritis: a comparison with patients with psoriasis."
Arthritis Care Res (Hoboken) 63(12): 1729-1735.
Husted, J. A., B. D. Tom, et al. (2009). "Occurrence and correlates of fatigue in
psoriatic arthritis." Ann Rheum Dis 68(10): 1553-1558.
Ibrahim, G. H., M. H. Buch, et al. (2009). "Evaluation of an existing screening tool for
psoriatic arthritis in people with psoriasis and the development of a new
instrument: the Psoriasis Epidemiology Screening Tool (PEST) questionnaire."
Clin Exp Rheumatol 27(3): 469-474.
International HapMap, C. (2003). "The International HapMap Project." Nature
426(6968): 789-796.
Jafferany, M. (2008). "Lithium and psoriasis: what primary care and family physicians
should know." Prim Care Companion J Clin Psychiatry 10(6): 435-439.
Jafri, K., C. M. Bartels, et al. (2017). "Incidence and Management of Cardiovascular Risk
Factors in Psoriatic Arthritis and Rheumatoid Arthritis: A Population-Based
Study." Arthritis Care Res (Hoboken) 69(1): 51-57.
Johnson, J. A., C. Ma, et al. (2014). "Diet and nutrition in psoriasis: analysis of the
National Health and Nutrition Examination Survey (NHANES) in the United
States." J Eur Acad Dermatol Venereol 28(3): 327-332.
Kang, J. H., Y. H. Chen, et al. (2010). "Comorbidity profiles among patients with
ankylosing spondylitis: a nationwide population-based study." Ann Rheum Dis
69(6): 1165-1168.
Kaprio, J. (2000). "Science, medicine, and the future. Genetic epidemiology." BMJ
320(7244): 1257-1259.
Karason, A., T. J. Love, et al. (2009). "A strong heritability of psoriatic arthritis over
four generations--the Reykjavik Psoriatic Arthritis Study." Rheumatology
(Oxford) 48(11): 1424-1428.
Karreman, M. C., A. E. Weel, et al. (2016). "Performance of screening tools for
psoriatic arthritis: a cross-sectional study in primary care." Rheumatology
(Oxford).

234
Kassi, K., O. A. Mienwoley, et al. (2013). "Severe skin forms of psoriasis in black
africans: epidemiological, clinical, and histological aspects related to 56 cases."
Autoimmune Dis 2013: 561032.
Kelley, G. A. and K. S. Kelley (2012). "Statistical models for meta-analysis: A brief
tutorial." World J Methodol 2(4): 27-32.
Khraishi, M., I. Landells, et al. (2010). "The self-administered Psoriasis and Arthritis
Screening Questionnaire (PASQ): A sensitive and specific tool for the diagnosis
of early and established psoriatic arthritis." Psoriasis Forum 16(2): 9-16.
Khraishi, M., D. MacDonald, et al. (2011). "Prevalence of patient-reported
comorbidities in early and established psoriatic arthritis cohorts." Clin
Rheumatol 30(7): 877-885.
Klein, J. P., J. D. Rizzo, et al. (2001). "Statistical methods for the analysis and
presentation of the results of bone marrow transplants. Part 2: Regression
modeling." Bone Marrow Transplant 28(11): 1001-1011.
Kopec, J. A. and J. M. Esdaile (1990). "Bias in case-control studies. A review." J
Epidemiol Community Health 44(3): 179-186.
Kotsis, K., P. V. Voulgari, et al. (2012). "Anxiety and depressive symptoms and illness
perceptions in psoriatic arthritis and associations with physical health-related
quality of life." Arthritis Care Res (Hoboken) 64(10): 1593-1601.
Krausgruber, T., K. Blazek, et al. (2011). "IRF5 promotes inflammatory macrophage
polarization and TH1-TH17 responses." Nat Immunol 12(3): 231-238.
Krueger, J. G. (2002). "The immunologic basis for the treatment of psoriasis with new
biologic agents." J Am Acad Dermatol 46(1): 1-23; quiz 23-26.
Krueger, J. G. and P. M. Brunner (2017). "Interleukin-17 alters the biology of many cell
types involved in the genesis of psoriasis, systemic inflammation and associated
comorbidities." Exp Dermatol.
Kryczek, I., A. T. Bruce, et al. (2008). "Induction of IL-17+ T cell trafficking and
development by IFN-gamma: mechanism and pathological relevance in
psoriasis." J Immunol 181(7): 4733-4741.
Kumar, S., J. Han, et al. (2013). "Obesity, waist circumference, weight change and the
risk of psoriasis in US women." J Eur Acad Dermatol Venereol 27(10): 1293-
1298.

235
Kurd, S. K., A. B. Troxel, et al. (2010). "The risk of depression, anxiety, and suicidality
in patients with psoriasis: a population-based cohort study." Arch Dermatol
146(8): 891-895.
Lai, Y. C. and Y. W. Yew (2016). "Psoriasis as an Independent Risk Factor for
Cardiovascular Disease: An Epidemiologic Analysis Using a National Database."
J Cutan Med Surg 20(4): 327-333.
Larkin, L. and N. Kennedy (2014). "Correlates of physical activity in adults with
rheumatoid arthritis: a systematic review." J Phys Act Health 11(6): 1248-1261.
Lee, E. J., K. D. Han, et al. (2017). "Smoking and risk of psoriasis: A nationwide cohort
study." J Am Acad Dermatol 77(3): 573-575.
Lee, Y. H. and G. G. Song (2017). "Smoking paradox in the development of psoriatic
arthritis among patients with psoriasis." Ann Rheum Dis.
Lewallen, S. and P. Courtright (1998). "Epidemiology in practice: case-control studies."
Community Eye Health 11(28): 57-58.
Lewinson, R. T., I. A. Vallerand, et al. (2017). "Depression Is Associated with an
Increased Risk of Psoriatic Arthritis among Patients with Psoriasis: A
Population-Based Study." J Invest Dermatol 137(4): 828-835.
Li, W., J. Han, et al. (2012). "Obesity and risk of incident psoriatic arthritis in US
women." Ann Rheum Dis 71(8): 1267-1272.
Li, W., J. Han, et al. (2012). "Smoking and risk of incident psoriatic arthritis in US
women." Ann Rheum Dis 71(6): 804-808.
Li, W. Q., J. L. Han, et al. (2013). "Psoriasis, psoriatic arthritis and increased risk of
incident Crohn's disease in US women." Ann Rheum Dis 72(7): 1200-1205.
Li, X., L. Kong, et al. (2015). "Association between Psoriasis and Chronic Obstructive
Pulmonary Disease: A Systematic Review and Meta-analysis." PLoS One 10(12):
e0145221.
Liley, J. and C. Wallace (2015). "A pleiotropy-informed Bayesian false discovery rate
adapted to a shared control design finds new disease associations from GWAS
summary statistics." PLoS Genet 11(2): e1004926.
Lindsay, K., A. D. Fraser, et al. (2009). "Liver fibrosis in patients with psoriasis and
psoriatic arthritis on long-term, high cumulative dose methotrexate therapy."
Rheumatology (Oxford) 48(5): 569-572.
236
Liu, Y., C. Helms, et al. (2008). "A genome-wide association study of psoriasis and
psoriatic arthritis identifies new disease loci." PLoS Genet 4(3): e1000041.
Locke, A. E., B. Kahali, et al. (2015). "Genetic studies of body mass index yield new
insights for obesity biology." Nature 518(7538): 197-206.
Lonnberg, A. S., L. Skov, et al. (2013). "Heritability of psoriasis in a large twin sample."
Br J Dermatol 169(2): 412-416.
Lopez-Larrea, C., J. C. Torre Alonso, et al. (1990). "HLA antigens in psoriatic arthritis
subtypes of a Spanish population." Ann Rheum Dis 49(5): 318-319.
Lopez de Lapuente, A., A. Feliu, et al. (2016). "Correction: Novel Insights into the
Multiple Sclerosis Risk Gene ANKRD55." J Immunol 197(10): 4177.
Lopez de Lapuente, A., A. Feliu, et al. (2016). "Novel Insights into the Multiple Sclerosis
Risk Gene ANKRD55." J Immunol 196(11): 4553-4565.
Love, T. J., Y. Zhu, et al. (2012). "Obesity and the risk of psoriatic arthritis: a
population-based study." Ann Rheum Dis 71(8): 1273-1277.
Lowes, M. A., T. Kikuchi, et al. (2008). "Psoriasis vulgaris lesions contain discrete
populations of Th1 and Th17 T cells." J Invest Dermatol 128(5): 1207-1211.
Mabuchi, T. and N. Hirayama (2016). "Binding Affinity and Interaction of LL-37 with
HLA-C*06:02 in Psoriasis." J Invest Dermatol 136(9): 1901-1903.
Macaubas, C., E. Wong, et al. (2016). "Altered signaling in systemic juvenile idiopathic
arthritis monocytes." Clin Immunol 163: 66-74.
Macfarlane, G. J., M. Beasley, et al. (2015). "Can large surveys conducted on highly
selected populations provide valid information on the epidemiology of common
health conditions? An analysis of UK Biobank data on musculoskeletal pain." Br
J Pain 9(4): 203-212.
Maher, B. (2008). "Personal genomes: The case of the missing heritability." Nature
456(7218): 18-21.
Manning, V. L., M. V. Hurley, et al. (2012). "Are patients meeting the updated physical
activity guidelines? Physical activity participation, recommendation, and
preferences among inner-city adults with rheumatic diseases." J Clin Rheumatol
18(8): 399-404.
Martin, D. A., J. E. Towne, et al. (2013). "The emerging role of IL-17 in the
pathogenesis of psoriasis: preclinical and clinical findings." J Invest Dermatol
133(1): 17-26.

237
Matthews, A. G., D. M. Finkelstein, et al. (2008). "Analysis of familial aggregation
studies with complex ascertainment schemes." Stat Med 27(24): 5076-5092.
McDonough, E., R. Ayearst, et al. (2014). "Depression and anxiety in psoriatic disease:
prevalence and associated factors." J Rheumatol 41(5): 887-896.
McGonagle, D. (2005). "Imaging the joint and enthesis: insights into pathogenesis of
psoriatic arthritis." Ann Rheum Dis 64 Suppl 2: ii58-60.
McGonagle, D., Z. Ash, et al. (2011). "The early phase of psoriatic arthritis." Ann
Rheum Dis 70 Suppl 1: i71-76.
McGonagle, D., K. G. Hermann, et al. (2015). "Differentiation between osteoarthritis
and psoriatic arthritis: implications for pathogenesis and treatment in the
biologic therapy era." Rheumatology (Oxford) 54(1): 29-38.
McGonagle, D., R. J. Lories, et al. (2007). "The concept of a "synovio-entheseal
complex" and its implications for understanding joint inflammation and damage
in psoriatic arthritis and beyond." Arthritis Rheum 56(8): 2482-2491.
Mease, P. J., D. D. Gladman, et al. (2014). "Comparative performance of psoriatic
arthritis screening tools in patients with psoriasis in European/North American
dermatology clinics." J Am Acad Dermatol 71(4): 649-655.
Mehta, N. N., Y. Yu, et al. (2011). "Attributable risk estimate of severe psoriasis on
major cardiovascular events." Am J Med 124(8): 775 e771-776.
Miele, L., S. Vallone, et al. (2009). "Prevalence, characteristics and severity of non-
alcoholic fatty liver disease in patients with chronic plaque psoriasis." J Hepatol
51(4): 778-786.
Mills, R. J. and C. A. Young (2008). "A medical definition of fatigue in multiple
sclerosis." QJM 101(1): 49-60.
Mischke, D., B. P. Korge, et al. (1996). "Genes encoding structural proteins of
epidermal cornification and S100 calcium-binding proteins form a gene complex
("epidermal differentiation complex") on human chromosome 1q21." J Invest
Dermatol 106(5): 989-992.
Mishra, S., H. Kancharla, et al. (2017). "Comparison of four validated psoriatic arthritis
screening tools in diagnosing psoriatic arthritis in patients with psoriasis
(COMPAQ Study)." Br J Dermatol 176(3): 765-770.
Mitchell, K. J. (2012). "What is complex about complex disorders?" Genome Biol
13(1): 237.

238
Moll, J. M. and V. Wright (1973). "Familial occurrence of psoriatic arthritis." Ann
Rheum Dis 32(3): 181-201.
Moll, J. M. and V. Wright (1973). "Psoriatic arthritis." Semin Arthritis Rheum 3(1): 55-
78.
Monteiro, R. and I. Azevedo (2010). "Chronic inflammation in obesity and the
metabolic syndrome." Mediators Inflamm 2010.
Morrow, J. D., B. Frei, et al. (1995). "Increase in circulating products of lipid
peroxidation (F2-isoprostanes) in smokers. Smoking as a cause of oxidative
damage." N Engl J Med 332(18): 1198-1203.
Mrowietz, U. and S. Domm (2013). "Systemic steroids in the treatment of psoriasis:
what is fact, what is fiction?" J Eur Acad Dermatol Venereol 27(8): 1022-1025.
Murase, J. E., K. K. Chan, et al. (2005). "Hormonal effect on psoriasis in pregnancy and
post partum." Arch Dermatol 141(5): 601-606.
Myers, A., L. J. Kay, et al. (2005). "Recurrence risk for psoriasis and psoriatic arthritis
within sibships." Rheumatology (Oxford) 44(6): 773-776.
Nair, R. P., K. C. Duffin, et al. (2009). "Genome-wide scan reveals association of psoriasis with IL-23 and NF-kappaB pathways." Nat Genet 41(2): 199-204.
Nair, R. P., x..c., et al. (2013). "Meta-analysis of psoriasis and psoriatic arthritis
identifies three new susceptibility loci." J. Invest. Dermatol. 133(S136).
Navarini, A. A., A. D. Burden, et al. (2017). "European consensus statement on
phenotypes of pustular psoriasis." J Eur Acad Dermatol Venereol 31(11): 1792-
1799.
Neimann, A. L., D. B. Shin, et al. (2006). "Prevalence of cardiovascular risk factors in
patients with psoriasis." J Am Acad Dermatol 55(5): 829-835.
Nguyen, U. D. T., Y. Zhang, et al. (2018). "Smoking paradox in the development of
psoriatic arthritis among patients with psoriasis: a population-based study." Ann
Rheum Dis 77(1): 119-123.
Nguyen, U. S. D. T., Y. Zhang, et al. (2015). "The Smoking Paradox in the Development
of Psoriatic Arthritis Among Psoriasis Patients [abstract]." Arthritis Rheumatol
67(suppl 10).
Ni, C. and M. W. Chiu (2014). "Psoriasis and comorbidities: links and risks." Clin
Cosmet Investig Dermatol 7: 119-132.

239
Nograles, K. E., B. Davidovici, et al. (2010). "New insights in the immunologic basis of
psoriasis." Semin Cutan Med Surg 29(1): 3-9.
Nurmohamed, M. T., M. Heslinga, et al. (2015). "Cardiovascular comorbidity in
rheumatic diseases." Nat Rev Rheumatol 11(12): 693-704.
O'Connor, L. J. and A. L. Price (2018). "Distinguishing genetic correlation from
causation across 52 diseases and complex traits." BioRxiv.
O'Rielly, D. D. and P. Rahman (2014). "Genetics of psoriatic arthritis." Best Pract Res
Clin Rheumatol 28(5): 673-685.
Obuch, M. L., T. A. Maurer, et al. (1992). "Psoriasis and human immunodeficiency virus
infection." J Am Acad Dermatol 27(5 Pt 1): 667-673.
Ockenfels, H. M., C. Keim-Maas, et al. (1996). "Ethanol enhances the IFN-gamma, TGF-
alpha and IL-6 secretion in psoriatic co-cultures." Br J Dermatol 135(5): 746-
751.
Ogdie, A. and J. M. Gelfand (2015). "Clinical Risk Factors for the Development of
Psoriatic Arthritis Among Patients with Psoriasis: A Review of Available
Evidence." Curr Rheumatol Rep 17(10): 64.
Ogdie, A., S. K. Grewal, et al. (2017). "Risk of incident liver disease in patients with
psoriasis, psoriatic arthritis, and rheumatoid arthritis: a population-based
study." J Invest Dermatol.
Ogdie, A., S. Langan, et al. (2013). "Prevalence and treatment patterns of psoriatic
arthritis in the UK." Rheumatology (Oxford) 52(3): 568-575.
Ogdie, A., S. Schwartzman, et al. (2015). "Recognizing and managing comorbidities in
psoriatic arthritis." Curr Opin Rheumatol 27(2): 118-126.
Ogdie, A. and P. Weiss (2015). "The Epidemiology of Psoriatic Arthritis." Rheum Dis
Clin North Am 41(4): 545-568.
Ogdie, A., Y. Yu, et al. (2015). "Risk of major cardiovascular events in patients with
psoriatic arthritis, psoriasis and rheumatoid arthritis: a population-based cohort
study." Ann Rheum Dis 74(2): 326-332.
Oishi, T., A. Iida, et al. (2008). "A functional SNP in the NKX2.5-binding site of ITPR3
promoter is associated with susceptibility to systemic lupus erythematosus in
Japanese population." J Hum Genet 53(2): 151-162.

240
Okada, Y., B. Han, et al. (2014). "Fine mapping major histocompatibility complex
associations in psoriasis and its clinical subtypes." Am J Hum Genet 95(2): 162-
172.
Okada, Y., D. Wu, et al. (2014). "Genetics of rheumatoid arthritis contributes to
biology and drug discovery." Nature 506(7488): 376-381.
Okura, Y., L. H. Urban, et al. (2004). "Agreement between self-report questionnaires
and medical record data was substantial for diabetes, hypertension, myocardial
infarction and stroke but not for heart failure." J Clin Epidemiol 57(10): 1096-
1103.
Pakhomov, S. V., S. J. Jacobsen, et al. (2008). "Agreement between patient-reported
symptoms and their documentation in the medical record." Am J Manag Care
14(8): 530-539.
Palla, L. and F. Dudbridge (2015). "A Fast Method that Uses Polygenic Scores to
Estimate the Variance Explained by Genome-wide Marker Panels and the
Proportion of Variants Affecting a Trait." Am J Hum Genet 97(2): 250-259.
Parisi, R., D. P. Symmons, et al. (2013). "Global epidemiology of psoriasis: a systematic review of incidence and prevalence." J Invest Dermatol 133(2): 377-385.
Parkes, M., A. Cortes, et al. (2013). "Genetic insights into common pathways and
complex relationships among immune-mediated diseases." Nat Rev Genet
14(9): 661-673.
Paschos, P. and K. Paletas (2009). "Non alcoholic fatty liver disease and metabolic
syndrome." Hippokratia 13(1): 9-19.
Pattison, E., B. J. Harrison, et al. (2008). "Environmental risk factors for the
development of psoriatic arthritis: results from a case-control study." Ann
Rheum Dis 67(5): 672-676.
Pedersen, O. B., A. J. Svendsen, et al. (2008). "On the heritability of psoriatic arthritis.
Disease concordance among monozygotic and dizygotic twins." Ann Rheum Dis
67(10): 1417-1421.
Peloso, P., M. Behl, et al. (1997). "The psoriasis and arthritis questionnaire (PAQ) in
detection of arthritis among patients with psoriasis [abstract]." Arthritis Rheum
40(Suppl:S64).
Pickrell, J. K., T. Berisa, et al. (2016). "Detection and interpretation of shared genetic
influences on 42 human traits." Nat Genet 48(7): 709-717.
241
Pietrzak, D., A. Pietrzak, et al. (2017). "Digestive system in psoriasis: an update." Arch
Dermatol Res 309(9): 679-693.
Polachek, A., Z. Touma, et al. (2017). "Risk of Cardiovascular Morbidity in Patients
With Psoriatic Arthritis: A Meta-Analysis of Observational Studies." Arthritis
Care Res (Hoboken) 69(1): 67-74.
Prussick, R. B. and L. Miele (2017). "Nonalcoholic fatty liver disease in patients with
psoriasis: A consequence of systemic inflammatory burden?" Br J Dermatol.
Punzi, L., M. Pianon, et al. (1998). "Clinical, laboratory and immunogenetic aspects of
post-traumatic psoriatic arthritis: a study of 25 patients." Clin Exp Rheumatol
16(3): 277-281.
Qureshi, A. A., H. K. Choi, et al. (2009). "Psoriasis and the risk of diabetes and
hypertension: a prospective study of US female nurses." Arch Dermatol 145(4):
379-382.
Qureshi, A. A., P. L. Dominguez, et al. (2010). "Alcohol intake and risk of incident
psoriasis in US women: a prospective study." Arch Dermatol 146(12): 1364-
1369.
R Development Core Team (2008). "R: A language and environment for statistical
computing."
Raaby, L., O. Ahlehoff, et al. (2017). "Psoriasis and cardiovascular events: updating the
evidence." Arch Dermatol Res 309(3): 225-228.
Rahman, P. and J. T. Elder (2005). "Genetic epidemiology of psoriasis and psoriatic
arthritis." Ann Rheum Dis 64 Suppl 2: ii37-39; discussion ii40-31.
Rapp, S. R., S. R. Feldman, et al. (1999). "Psoriasis causes as much disability as other
major medical diseases." J Am Acad Dermatol 41(3 Pt 1): 401-407.
Ray-Jones, H., S. Eyre, et al. (2016). "One SNP at a Time: Moving beyond GWAS in
Psoriasis." J Invest Dermatol.
Raychaudhuri, S. K., A. Saxena, et al. (2015). "Role of IL-17 in the pathogenesis of
psoriatic arthritis and axial spondyloarthritis." Clin Rheumatol 34(6): 1019-
1023.
Reich, K. (2009). "Approach to managing patients with nail psoriasis." J Eur Acad
Dermatol Venereol 23 Suppl 1: 15-21.
Richiardi, L., C. Pizzi, et al. (2013). "Commentary: Representativeness is usually not
necessary and often should be avoided." Int J Epidemiol 42(4): 1018-1022.

242
Risch, N. (1990). "Linkage strategies for genetically complex traits. III. The effect of
marker polymorphism on analysis of affected relative pairs." Am J Hum Genet
46(2): 242-253.
Risch, N. and K. Merikangas (1996). "The future of genetic studies of complex human
diseases." Science 273(5281): 1516-1517.
Roach, J. C., K. Deutsch, et al. (2006). "Genetic mapping at 3-kilobase resolution
reveals inositol 1,4,5-triphosphate receptor 3 as a risk factor for type 1
diabetes in Sweden." Am J Hum Genet 79(4): 614-627.
Robinson, D., Jr., M. Hackett, et al. (2006). "Co-occurrence and comorbidities in
patients with immune-mediated inflammatory disorders: an exploration using
US healthcare claims data, 2001-2002." Curr Med Res Opin 22(5): 989-1000.
Rosen, C. F., F. Mussani, et al. (2012). "Patients with psoriatic arthritis have worse
quality of life than those with psoriasis alone." Rheumatology (Oxford) 51(3):
571-576.
Sagi, L. and H. Trau (2011). "The Koebner phenomenon." Clin Dermatol 29(2): 231-
236.
Sahu, M. and J. G. Prasuna (2016). "Twin Studies: A Unique Epidemiological Tool."
Indian J Community Med 41(3): 177-182.
Samarasekera, E. J., J. M. Neilson, et al. (2013). "Incidence of cardiovascular disease in
individuals with psoriasis: a systematic review and meta-analysis." J Invest
Dermatol 133(10): 2340-2346.
Scarpa, R., A. Del Puente, et al. (1992). "Interplay between environmental factors,
articular involvement, and HLA-B27 in patients with psoriatic arthritis." Ann
Rheum Dis 51(1): 78-79.
Schopf, R. E., H. M. Ockenfels, et al. (1996). "Ethanol enhances the mitogen-driven
lymphocyte proliferation in patients with psoriasis." Acta Derm Venereol 76(4):
260-263.
Setty, A. R., G. Curhan, et al. (2007). "Smoking and the risk of psoriasis in women:
Nurses' Health Study II." Am J Med 120(11): 953-959.
Shenefelt, P. D. (2011). "Psychodermatological disorders: recognition and treatment."
Int J Dermatol 50(11): 1309-1322.
Sheng, Y., X. Jin, et al. (2014). "Sequencing-based approach identified three new
susceptibility loci for psoriasis." Nat Commun 5: 4331.

243
Shi, H., N. Mancuso, et al. (2017). "Local Genetic Correlation Gives Insights into the
Shared Genetic Architecture of Complex Traits." Am J Hum Genet 101(5):
737-751.
Skelly, A. C., J. R. Dettori, et al. (2012). "Assessing bias: the importance of considering
confounding." Evid Based Spine Care J 3(1): 9-12.
Skoie, I. M., I. Dalen, et al. (2017). "Fatigue in psoriasis: a controlled study." Br J
Dermatol 177(2): 505-512.
Skroza, N., I. Proietti, et al. (2013). "Correlations between psoriasis and inflammatory
bowel diseases." Biomed Res Int 2013: 983902.
Smith, G. D. and S. Ebrahim (2004). "Mendelian randomization: prospects, potentials,
and limitations." Int J Epidemiol 33(1): 30-42.
Snekvik, I., C. H. Smith, et al. (2017). "Obesity, Waist Circumference, Weight Change,
and Risk of Incident Psoriasis: Prospective Data from the HUNT Study." J Invest
Dermatol 137(12): 2484-2490.
Sobolewski, P., I. Walecka, et al. (2017). "Nail involvement in psoriatic arthritis."
Reumatologia 55(3): 131-135.
Solinger, A. M. and E. V. Hess (1993). "Rheumatic diseases and AIDS--is the association
real?" J Rheumatol 20(4): 678-683.
Solomon, D. H., T. J. Love, et al. (2010). "Risk of diabetes among patients with
rheumatoid arthritis, psoriatic arthritis and psoriasis." Ann Rheum Dis 69(12):
2114-2117.
Solovieff, N., C. Cotsapas, et al. (2013). "Pleiotropy in complex traits: challenges and
strategies." Nat Rev Genet 14(7): 483-495.
Soltani-Arabshahi, R., B. Wong, et al. (2010). "Obesity in early adulthood as a risk
factor for psoriatic arthritis." Arch Dermatol 146(7): 721-726.
Song, J. W. and K. C. Chung (2010). "Observational studies: cohort and case-control
studies." Plast Reconstr Surg 126(6): 2234-2242.
Song, Y. W. and E. H. Kang (2010). "Autoantibodies in rheumatoid arthritis:
rheumatoid factors and anticitrullinated protein antibodies." QJM 103(3): 139-
146.
Sopori, M. (2002). "Effects of cigarette smoke on the immune system." Nat Rev
Immunol 2(5): 372-377.

244
Spain, S. L. and J. C. Barrett (2015). "Strategies for fine-mapping complex traits." Hum
Mol Genet 24(R1): R111-119.
Springate, D. A., R. Parisi, et al. (2017). "Incidence, prevalence and mortality of patients
with psoriasis: a U.K. population-based cohort study." Br J Dermatol 176(3):
650-658.
Stahl, E. A., S. Raychaudhuri, et al. (2010). "Genome-wide association study meta-
analysis identifies seven new rheumatoid arthritis risk loci." Nat Genet 42(6):
508-514.
Stuart, P. E., R. P. Nair, et al. (2010). "Genome-wide association analysis identifies three
psoriasis susceptibility loci." Nat Genet 42(11): 1000-1004.
Stuart, P. E., R. P. Nair, et al. (2015). "Genome-wide Association Analysis of Psoriatic
Arthritis and Cutaneous Psoriasis Reveals Differences in Their Genetic
Architecture." Am J Hum Genet 97(6): 816-836.
Sudlow, C., J. Gallacher, et al. (2015). "UK biobank: an open access resource for
identifying the causes of a wide range of complex diseases of middle and old
age." PLoS Med 12(3): e1001779.
Sugiura, K., A. Takemoto, et al. (2013). "The majority of generalized pustular psoriasis
without psoriasis vulgaris is caused by deficiency of interleukin-36 receptor
antagonist." J Invest Dermatol 133(11): 2514-2521.
Sun, L. and X. Zhang (2014). "The immunological and genetic aspects in psoriasis."
Applied Informatics 1(3).
Sun, L. D., H. Cheng, et al. (2010). "Association analyses identify six new psoriasis
susceptibility loci in the Chinese population." Nat Genet 42(11): 1005-1009.
Symmons, D. P. and S. E. Gabriel (2011). "Epidemiology of CVD in rheumatic disease,
with a focus on RA and SLE." Nat Rev Rheumatol 7(7): 399-408.
Taglione, E., M. L. Vatteroni, et al. (1999). "Hepatitis C virus infection: prevalence in
psoriasis and psoriatic arthritis." J Rheumatol 26(2): 370-372.
Tam, L. S., B. Tomlinson, et al. (2008). "Cardiovascular risk profile of patients with
psoriatic arthritis compared to controls--the role of inflammation."
Rheumatology (Oxford) 47(5): 718-723.
Tan, E. S., W. S. Chong, et al. (2012). "Nail psoriasis: a review." Am J Clin Dermatol
13(6): 375-388.

245
Tang, H., X. Jin, et al. (2014). "A large-scale screen for coding variants predisposing to
psoriasis." Nat Genet 46(1): 45-50.
Taylor, W., D. Gladman, et al. (2006). "Classification criteria for psoriatic arthritis:
development of new criteria from a large international study." Arthritis Rheum
54(8): 2665-2673.
Tejada Cdos, S., R. A. Mendoza-Sassi, et al. (2011). "Impact on the quality of life of
dermatological patients in southern Brazil." An Bras Dermatol 86(6): 1113-
1121.
Tey, H. L., H. L. Ee, et al. (2010). "Risk factors associated with having psoriatic arthritis
in patients with cutaneous psoriasis." J Dermatol 37(5): 426-430.
Thompson, S. D., M. C. Marion, et al. (2012). "Genome-wide association analysis of
juvenile idiopathic arthritis identifies a new susceptibility locus at chromosomal
region 3q13." Arthritis Rheum 64(8): 2781-2791.
Thorarensen, S. M., N. Lu, et al. (2017). "Physical trauma recorded in primary care is
associated with the onset of psoriatic arthritis among patients with psoriasis."
Ann Rheum Dis 76(3): 521-525.
Thumboo, J., K. Uramoto, et al. (2002). "Risk factors for the development of psoriatic
arthritis: a population based nested case control study." J Rheumatol 29(4):
757-762.
Tierney, M., A. Fraser, et al. (2012). "Physical activity in rheumatoid arthritis: a
systematic review." J Phys Act Health 9(7): 1036-1048.
Tilling, L., S. Townsend, et al. (2006). "Methotrexate and hepatic toxicity in rheumatoid
arthritis and psoriatic arthritis." Clin Drug Investig 26(2): 55-62.
Tinazzi, I., S. Adami, et al. (2012). "The early psoriatic arthritis screening questionnaire:
a simple and fast method for the identification of arthritis in patients with
psoriasis." Rheumatology (Oxford) 51(11): 2058-2063.
Tiosano, S., A. Farhi, et al. (2017). "Schizophrenia among patients with systemic lupus
erythematosus: population-based cross-sectional study." Epidemiol Psychiatr Sci
26(4): 424-429.
Tobacco and C. Genetics (2010). "Genome-wide meta-analyses identify multiple loci
associated with smoking behavior." Nat Genet 42(5): 441-447.
Tobin, A. M., M. Sadlier, et al. (2017). "Fatigue as a symptom in psoriasis and psoriatic
arthritis: an observational study." Br J Dermatol 176(3): 827-828.

246
Tsoi, L. C., S. L. Spain, et al. (2015). "Enhanced meta-analysis and replication studies
identify five new psoriasis susceptibility loci." Nat Commun 6: 7001.
Tsoi, L. C., S. L. Spain, et al. (2012). "Identification of 15 new psoriasis susceptibility loci
highlights the role of innate immunity." Nat Genet 44(12): 1341-1348.
Tsoi, L. C., P. E. Stuart, et al. (2017). "Large scale meta-analysis characterizes genetic
architecture for common psoriasis associated variants." Nat Commun 8: 15382.
Tuder, R. M. and I. Petrache (2012). "Pathogenesis of chronic obstructive pulmonary
disease." J Clin Invest 122(8): 2749-2755.
Turley, P., R. K. Walters, et al. (2018). "Multi-trait analysis of genome-wide association
summary statistics using MTAG." Nat Genet 50(2): 229-237.
Turley, P., R. K. Walters, et al. (2018). "Multi-trait analysis of genome-wide association
summary statistics using MTAG." Nat Genet.
Ungprasert, P., N. Srivali, et al. (2016). "Risk of incident chronic obstructive pulmonary
disease in patients with rheumatoid arthritis: A systematic review and meta-
analysis." Joint Bone Spine 83(3): 290-294.
Ursum, J., J. C. Korevaar, et al. (2013). "Prevalence of chronic diseases at the onset of inflammatory arthritis: a population-based study." Fam Pract 30(6): 615-620.
Ursum, J., M. M. Nielen, et al. (2013). "Increased risk for chronic comorbid disorders in
patients with inflammatory arthritis: a population based study." BMC Fam Pract
14: 199.
van der Vaart, H., D. S. Postma, et al. (2004). "Acute effects of cigarette smoke on
inflammation and oxidative stress: a review." Thorax 59(8): 713-721.
van der Voort, E. A., E. M. Koehler, et al. (2014). "Psoriasis is independently associated
with nonalcoholic fatty liver disease in patients 55 years old or older: Results
from a population-based study." J Am Acad Dermatol 70(3): 517-524.
van der Voort, E. A., E. M. Koehler, et al. (2016). "Increased Prevalence of Advanced
Liver Fibrosis in Patients with Psoriasis: A Cross-sectional Analysis from the
Rotterdam Study." Acta Derm Venereol 96(2): 213-217.
van Lent, P. L., C. G. Figdor, et al. (2003). "Expression of the dendritic cell-associated
C-type lectin DC-SIGN by inflammatory matrix metalloproteinase-producing
macrophages in rheumatoid arthritis synovium and interaction with intercellular
adhesion molecule 3-positive T cells." Arthritis Rheum 48(2): 360-369.

247
Verhoeven, E. W., F. W. Kraaimaat, et al. (2007). "Prevalence of physical symptoms of
itch, pain and fatigue in patients with skin diseases in general practice." Br J
Dermatol 156(6): 1346-1349.
Vessey, M. P., R. Painter, et al. (2000). "Skin disorders in relation to oral contraception
and other factors, including age, social class, smoking and body mass index.
Findings in a large cohort study." Br J Dermatol 143(4): 815-820.
Wagner, G. P. and J. Zhang (2011). "The pleiotropic structure of the genotype-
phenotype map: the evolvability of complex organisms." Nat Rev Genet 12(3):
204-213.
Walsh, J. A., K. Callis Duffin, et al. (2013). "Limitations in screening instruments for
psoriatic arthritis: a comparison of instruments in patients with psoriasis." J
Rheumatol 40(3): 287-293.
Wang, J., A. B. Kay, et al. (2009). "Alcohol consumption is not protective for systemic
lupus erythematosus." Ann Rheum Dis 68(3): 345-348.
Warburton, D. E., C. W. Nicol, et al. (2006). "Health benefits of physical activity: the
evidence." CMAJ 174(6): 801-809.
Warnecke, C., I. Manousaridis, et al. (2011). "Cardiovascular and metabolic risk profile
in German patients with moderate and severe psoriasis: a case control study."
Eur J Dermatol 21(5): 761-770.
Weiss, S. C., A. B. Kimball, et al. (2002). "Quantifying the harmful effect of psoriasis on
health-related quality of life." J Am Acad Dermatol 47(4): 512-518.
Wilson, F. C., M. Icen, et al. (2009). "Incidence and clinical predictors of psoriatic
arthritis in patients with psoriasis: a population-based study." Arthritis Rheum
61(2): 233-239.
Winchester, R., G. Minevich, et al. (2012). "HLA associations reveal genetic
heterogeneity in psoriatic arthritis and in the psoriasis phenotype." Arthritis
Rheum 64(4): 1134-1144.
Wu, S., E. Cho, et al. (2015). "Alcohol intake and risk of incident psoriatic arthritis in
women." J Rheumatol 42(5): 835-840.
Wu, S., J. Han, et al. (2015). "Use of aspirin, non-steroidal anti-inflammatory drugs, and
acetaminophen (paracetamol), and risk of psoriasis and psoriatic arthritis: a
cohort study." Acta Derm Venereol 95(2): 217-223.
Wu, S., W. Q. Li, et al. (2014). "Hypercholesterolemia and risk of incident psoriasis
and psoriatic arthritis in US women." Arthritis Rheumatol 66(2): 304-310.
248
Wu, Y., D. Mills, et al. (2008). "Psoriasis: cardiovascular risk factors and other disease
comorbidities." J Drugs Dermatol 7(4): 373-377.
Yin, X., H. Q. Low, et al. (2015). "Genome-wide meta-analysis identifies multiple novel
associations and ethnic heterogeneity of psoriasis susceptibility." Nat Commun
6: 6916.
Zheng, J., D. Baird, et al. (2017). "Recent Developments in Mendelian Randomization
Studies." Curr Epidemiol Rep 4(4): 330-345.
Zheng, J., A. M. Erzurumluoglu, et al. (2017). "LD Hub: a centralized database and web
interface to perform LD score regression that maximizes the potential of
summary level GWAS data for SNP heritability and genetic correlation
analysis." Bioinformatics 33(2): 272-279.
Zhu, T. Y., E. K. Li, et al. (2012). "Cardiovascular risk in patients with psoriatic
arthritis." Int J Rheumatol 2012: 714321.
Zhu, Z., V. Anttila, et al. (2018). "Statistical power and utility of meta-analysis methods
for cross-phenotype genome-wide association studies." PLoS One 13(3):
e0193256.
Zuo, X., L. Sun, et al. (2015). "Whole-exome SNP array identifies 15 new susceptibility
loci for psoriasis." Nat Commun 6: 6793.

249
Appendix
Appendix Table 1 describes the process followed during the assessment visit at a UK
Biobank centre.
Appendix Table 1 | The sequence of the assessment visit (table taken from http://www.ukbiobank.ac.uk/).
Visit station Assessments undertaken
Reception 1. Registration
2. A USB key was provided to each participant
Touch screen questionnaire 1. Consent
2. Questionnaire
3. Hearing Test
4. Cognitive function tests
Interview and blood pressure 1. Interview with a research nurse
2. Blood pressure measurement
3. Measurement of arterial stiffness
Eye measurements 1. Visual acuity
2. Auto-refraction
3. Intraocular pressure
4. Retinal image
Physical measurements 1. Height (standing and sitting)
2. Hip and waist measurement
3. Weight and body composition measurement
4. Hand-grip strength
5. Ultrasound bone densitometry
6. Lung function test (spirometry)
Physical fitness/cardio test 1. Cycling
Sample collection 1. Blood sample
2. Urine sample
3. Saliva sample
4. Consent and result summary printed
Web-based diet questions 1. Dietary questionnaire

250
Appendix Figure 1 and Appendix Figure 2 depict the IPAQ questionnaire along with
the scoring protocol used in the current thesis
(https://sites.google.com/site/theipaq/questionnaire_links).
Appendix Figure 1 | Short version of the International Physical Activity Questionnaire (IPAQ)

251
Appendix Figure 1 | Short version of the International Physical Activity Questionnaire (IPAQ)

252
Appendix Figure 2 | Scoring protocol for International Physical Activity Questionnaire (IPAQ)

253
Appendix Table 2 presents the genetic correlations for PsA and JIA with RA and SLE
using LD Hub (http://ldsc.broadinstitute.org/ldhub/) as a technical validation of a subset
of results presented in the main body of the thesis. The results are identical confirming
the successful harmonization of the datasets and application of the LD score
regression.
Appendix Table 2 | Genetic correlations between PsA, JIA and RA and SLE using LD Hub
Trait Trait genetic correlation (rg) p-value
PsA RA 0.30 0.002
SLE 0.14 0.25
JIA RA 0.49 8.22e-05
SLE 0.59 0.0002

254
cFDR analysis using JIA as the principal disease
Enrichment plots
In Appendix Figure 3 strong enrichment of JIA-associated SNPs was observed with the
proportion of true effects in JIA varying considerably depending on different levels of
association for RA and SLE (bottom plots) and there appears to be a greater amount
of separation between the different curves. The two top plots present a less robust
enrichment pattern for JIA conditioned on AS and PsA.
Appendix Figure 3| Q-Q plots for JIA conditional on AS (top left), PsA (top right), RA (bottom left) and SLE (bottom right). Y axes show log10(P’) for each principal disease and X axes show the log quantile of p-values in sets of SNPs. The degree of leftward shift of a black point from the diagonal is proportional to the unconditional FDR of that p-value for the principal phenotype, and the degree of leftward shift of a coloured point is proportional to the conditional FDR of the p-value for the principal phenotype and the p-cutoff corresponding to the colour for the conditional phenotype. Each colour corresponds to the Q-Q plot for 𝒑𝑱𝑰𝑨 amongst a subset of SNPs with 𝒑𝑨𝑺𝒐𝒓 𝒑𝑷𝒔𝑨𝒐𝒓 𝒑𝑹𝑨 𝒐𝒓 𝒑𝑺𝑳𝑬 less than the
indicated cutoff. A leftward shift with decreasing cut-off indicates that SNPs which are associated with the conditional phenotype (AS, PsA, RA or SLE) are more likely to be associated with the principal phenotype (JIA), presumably due to pleiotropic effects on phenotypes

255
JIA loci identified with cFDR
The greater enrichment seen when conditioning on RA and SLE is depicted in
Appendix Figure 4 (bottom plots), with the increased amount of newly identified
significant loci for JIA. More specifically, 1083 significant SNPs were identified with a
significance threshold of cFDR<1.43e-02 and 348 with a significance threshold of
cFDR<0.014 using cFDR analysis for JIA conditioned of RA and SLE, respectively.
Moreover, 83 significant SNPs (cFDR<2.24e-02) and 161 significant SNPs
(cFDR<1.45e-02) were identified when JIA was conditioned on AS and PsA,
respectively. The final list of independent loci can be seen in Appendix Table 3.
Associations with known genes were identified (for example STAT4, RUNX3,
ANKRD55, SH2B3, TYK2); however, the identified SNPs could be different to those
reported in previous studies as this method works as a SNP prioritization tool,
recognising additional variants. Among the novel identified SNPs 16 were found in
intergenic regions with some of them being associated with the susceptibility of
immune-mediated diseases such as RA, celiac disease and MS. Some of the notable
novel SNPs are rs692211 (ZKSCAN3), rs78264909 (ZSCAN12) and rs13215804
(ZSCAN23) which have been found to be associated with both RA and schizophrenia.
In addition, rs413024 (SOCS1) a susceptibility variant for primary biliary cirrhosis and
PSO was associated with JIA when leveraging power from the PsA cohort. SOCS1 is a
cytokine signalling inhibitor gene that regulates the IFN signal transduction. A previous
study reported changes in SOCS1 levels in systemic JIA monocytes which provides
evidence of inhibition of IFN signalling in these cells (Macaubas, Wong et al. 2016). An
association was found with rs2661798 (SPRED2), a gene associated with RA, SLE and
IBD susceptibility. There is evidence of association at 2p for JIA but has not been
replicated in other studies (Thompson, Marion et al. 2012).

256
Appendix Figure 4 | cFDR results for JIA conditioned on AS (top left), PsA (top right), RA (bottom left). The black vertical line signifies the GWAS significance threshold 5e-08. The red dots signify the genome-wide significant SNPs for the principal disease (herein, JIA), whereas the orange dots (on the left side of the vertical line) signify the SNPs identified as significant for JIA after conditioning on the conditional disease (AS, PSA, RA and SLE). Black dots show a random sample of the observed p-value pairs. Note that the leftward shift of colours corresponding to an increased p-value threshold for association with JIA for SNPs with low p-values for the conditional diseases.

257
Appendix Table 3 | Loci associated with JIA after applying cFDR analysis using as conditional phenotypes AS, PsA, RA and SLE
Chr Position rsid effect
allele
other
allele
MAF conditional
phenotype
principal
p-value
conditiona
l p-value
cFDRprinc.|cond Gene Consequence Associated
Trait
1 25293356 rs4265380 C T 0.46
AS
1.51e-05 8.23e-09 6.19e-04 RUNX3 upstream gene variant p: PSO,AS, JIA
2 191973034 rs10174238 G A 0.24 5.56e-08 0.28 8.75e-03 STAT4 intron variant RA, JIA, p: SLE
3 119017382 rs7640033 T A 0.17 1.86e-05 4.28e-03 1.70e-02 ARHGAP31 intron variant g: celiac disease
5 40385790 rs12523160 T A 0.35 1.08e-04 4.53e-04 1.58e-02 intergenic variant CD, IBD
6 28325308 rs6922111 T C 0.20 2.12e-03 1.93e-30 2.34e-03 ZKSCAN3 intron variant SCZ, p: RA
8 106471210 rs4734866 C A 0.37 1.91e-04 1.87e-04 1.69e-02 ZFPM2 intron variant g:platelet count
9 117629689 rs7048073 A G 0.28 2.47e-06 9.68e-03 1.93e-02 intergenic variant
1 25291010 rs6672420 A T 0.50
PsA
2.02e-05 6.75e-07 1.99e-03 RUNX3 missense variant p: PSO,AS, JIA
2 191966452 rs7568275 G C 0.23 8.35e-08 7.75e-03 7.45e-03 STAT4 intron variant RA, p: SLE,JIA
3 21477153 rs73045433 A G 0.02 3.92e-05 2.70e-04 1.39e-02 ZNF385D intron variant g: gut
microbiome
6 28368106 rs78264909 C T 0.09 9.07e-05 1.09e-05 7.09e-03 ZSCAN12 upstream gene variant RA. g: SCZ
6 162124704 rs73597197 C T 0.02 2.14e-05 4.79e-04 1.40e-02 PARK2 intron variant g: BMI
11 74273590 rs75409031 A C 0.01 2.58e-05 4.20e-04 1.42e-02 POLD3 intron variant g: cancer
16 11354091 rs413024 G A 0.32 1.88e-05 2.24e-06 2.40e-03 SOCS1 upstream gene variant PBC, p: PSO
22 21999292 rs5749600 G A 0.25 1.58e-04 1.82e-05 1.24e-02 SDF2L1 downstream gene variant g: CD,IBD,UC
Chr: Chromosome; MAF: Minor Allele Frequency; cFDR: conditional False Discovery Rate; princ.: principal; cond.: conditional; p: proxy SNP to reported SNP associated with;
PSO: Psoriasis; AS: Ankylosing Spondylitis; IgAD: immunoglobulin A Deficiency; RA: Rheumatoid Arthritis; JIA: Juvenile Idiopathic Arthritis; SLE: Systemic Lupus Erythematosus;
g: gene associated with; CD: Crohn’s Disease; IBD: Inflammatory Bowel Disease; SCZ: Schizophrenia; PBC: Primary Biliary Cirrhosis/Cholangitis
JIA|AS cut-off = 2.24e-02; JIA|PsA cut-off = 1.45e-02; JIA|RA cut-off = 1.43e-02; JIA|SLE cut-off = 0.014
The Associated Traits have been detected using PhenoScanner (version 1.1) with parameters catalogue: GWAS, p-value cut-off: 5e-08, proxies: Yes; r-squared: 0.8
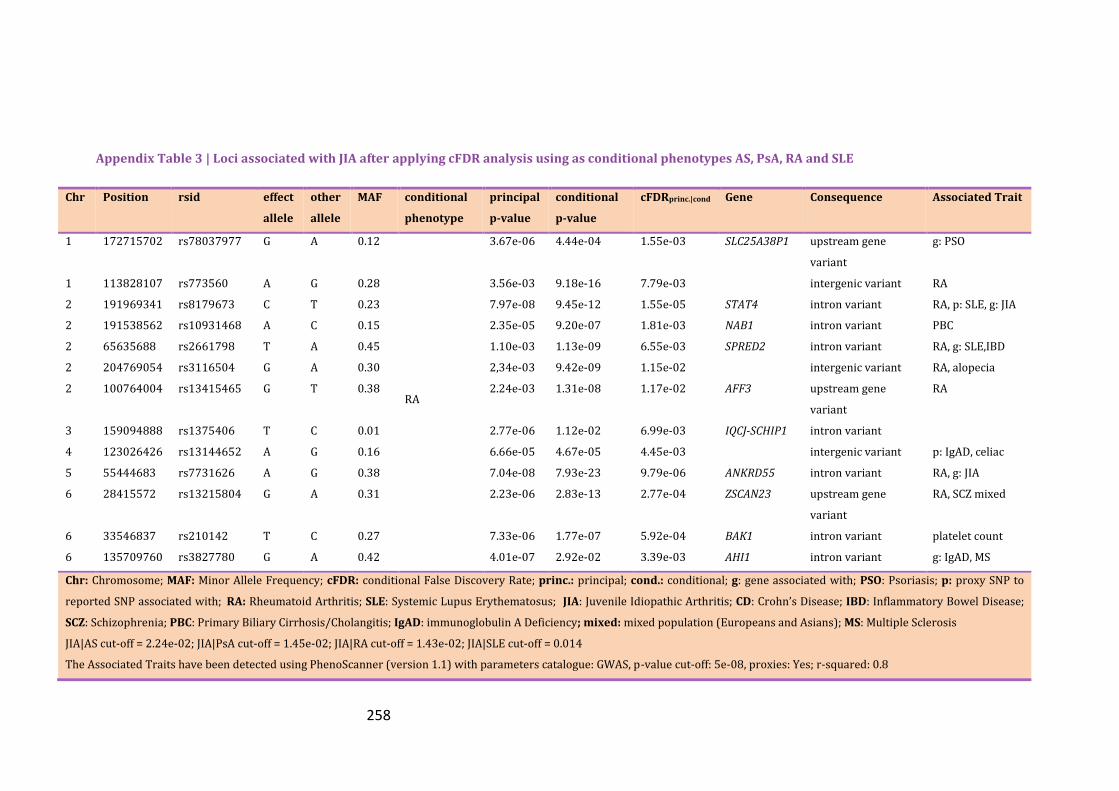
258
Appendix Table 3 | Loci associated with JIA after applying cFDR analysis using as conditional phenotypes AS, PsA, RA and SLE
Chr Position rsid effect
allele
other
allele
MAF conditional
phenotype
principal
p-value
conditional
p-value
cFDRprinc.|cond Gene Consequence Associated Trait
1 172715702 rs78037977 G A 0.12
RA
3.67e-06 4.44e-04 1.55e-03 SLC25A38P1 upstream gene
variant
g: PSO
1 113828107 rs773560 A G 0.28 3.56e-03 9.18e-16 7.79e-03 intergenic variant RA
2 191969341 rs8179673 C T 0.23 7.97e-08 9.45e-12 1.55e-05 STAT4 intron variant RA, p: SLE, g: JIA
2 191538562 rs10931468 A C 0.15 2.35e-05 9.20e-07 1.81e-03 NAB1 intron variant PBC
2 65635688 rs2661798 T A 0.45 1.10e-03 1.13e-09 6.55e-03 SPRED2 intron variant RA, g: SLE,IBD
2 204769054 rs3116504 G A 0.30 2,34e-03 9.42e-09 1.15e-02 intergenic variant RA, alopecia
2 100764004 rs13415465 G T 0.38 2.24e-03 1.31e-08 1.17e-02 AFF3 upstream gene
variant
RA
3 159094888 rs1375406 T C 0.01 2.77e-06 1.12e-02 6.99e-03 IQCJ-SCHIP1 intron variant
4 123026426 rs13144652 A G 0.16 6.66e-05 4.67e-05 4.45e-03 intergenic variant p: IgAD, celiac
5 55444683 rs7731626 A G 0.38 7.04e-08 7.93e-23 9.79e-06 ANKRD55 intron variant RA, g: JIA
6 28415572 rs13215804 G A 0.31 2.23e-06 2.83e-13 2.77e-04 ZSCAN23 upstream gene
variant
RA, SCZ mixed
6 33546837 rs210142 T C 0.27 7.33e-06 1.77e-07 5.92e-04 BAK1 intron variant platelet count
6 135709760 rs3827780 G A 0.42 4.01e-07 2.92e-02 3.39e-03 AHI1 intron variant g: IgAD, MS
Chr: Chromosome; MAF: Minor Allele Frequency; cFDR: conditional False Discovery Rate; princ.: principal; cond.: conditional; g: gene associated with; PSO: Psoriasis; p: proxy SNP to
reported SNP associated with; RA: Rheumatoid Arthritis; SLE: Systemic Lupus Erythematosus; JIA: Juvenile Idiopathic Arthritis; CD: Crohn’s Disease; IBD: Inflammatory Bowel Disease;
SCZ: Schizophrenia; PBC: Primary Biliary Cirrhosis/Cholangitis; IgAD: immunoglobulin A Deficiency; mixed: mixed population (Europeans and Asians); MS: Multiple Sclerosis
JIA|AS cut-off = 2.24e-02; JIA|PsA cut-off = 1.45e-02; JIA|RA cut-off = 1.43e-02; JIA|SLE cut-off = 0.014
The Associated Traits have been detected using PhenoScanner (version 1.1) with parameters catalogue: GWAS, p-value cut-off: 5e-08, proxies: Yes; r-squared: 0.8

259
Appendix Table 3 | Loci associated with JIA after applying cFDR analysis using as conditional phenotypes AS, PsA, RA and SLE
Chr Position rsid effect
allele
other
allele
MA
F
conditional
phenotype
principal
p-value
conditional
p-value
cFDRprinc.|cond Gene Consequence Associated Trait
6 433061 rs1567901 A C 0.46
RA
3.60e-04 5.96e-06 5.89e-03 intergenic variant RA mixed
6 33689534 rs2967 A G 0.26 3.26e-03 1.15e-15 7.27e-03 IP6K3 3 prime UTR variant RA, g: BMI,CD
6 27546448 rs116724532 G A 0.02 1.31e-04 5.26e-04 1.05e-02 intergenic variant
7 128576086 rs3757387 C T 0.45 6.21e-04 2.01e-11 2.92e-03 IRF5 upstream gene
variant
RA, PBC
p: SLE, UC, MS
8 129540464 rs16903065 A C 0.10 1.50e-03 5.51e-07 1.29e-02 RP11-89M16.1 intron & non-coding
transcript variant
p: ovarian cancer
9 117353464 rs10124511 G A 0.31 3.70e-07 0.19 1.36e-02 ATP6V1G1 intron variant
10 6178614 rs1983890 T C 0.40 1.45e-04 1.72e-06 3.96e-03 intergenic variant
10 6100725 rs3134883 A G 0.29 9.94e-04 3.47e-09 6.77e-03 IL2RA intron variant RA, p: JIA
11 134180440 rs113825217 A G 0.03 3.29e-07 4.72e-02 4.11e-03 GLB1L3 intron variant g: BMI traits
12 111865049 rs7310615 C G 0.47 4.42e-04 3.69e-07 5.36e-03 SH2B3 intron variant CAD, MI, g: JIA
12 113030227 rs233724 A G 0.49 1.58e-05 3.15e-03 8.59e-03 RPH3A intron variant g: platelet count
13 40300328 rs9603603 G T 0.36 8.25e-04 3.40e-10 4.61e-03 COG6 intron variant RA, p: PSO, JIA
13 43009008 rs1924415 C G 0.22 2.39e-04 8.55e-06 5.66e-03 intergenic variant
Chr: Chromosome; MAF: Minor Allele Frequency; cFDR: conditional False Discovery Rate; princ.: principal; cond.: conditional; RA: Rheumatoid Arthritis; g: gene associated with;
BMI: Body Mass Index; CD: Crohn’s Disease; PBC: Primary Biliary Cirrhosis/Cholangitis; p: proxy SNP to reported SNP associated with; SLE: Systemic Lupus Erythematosus;
UC: Ulcerative Colitis; MS: Multiple Sclerosis; CAD: Coronary Artery Disease; MI: Myocardial Infarction; JIA: Juvenile Idiopathic Arthritis; PSO: Psoriasis
JIA|AS cut-off = 2.24e-02; JIA|PsA cut-off = 1.45e-02; JIA|RA cut-off = 1.43e-02; JIA|SLE cut-off = 0.014
The Associated Traits have been detected using PhenoScanner (version 1.1) with parameters catalogue: GWAS, p-value cut-off: 5e-08, proxies: Yes; r-squared: 0.8

260
Appendix Table 3 | Loci associated with JIA after applying cFDR analysis using as conditional phenotypes AS, PsA, RA and SLE
Chr Position rsid effect
allele
other
allele
MAF conditional
phenotype
principal
p-value
conditional
p-value
cFDRprinc.|cond Gene Consequence Associated
Trait
14 74297983 rs8006139 G A 0.46
RA
5.48E-05 1.23e-03 1.08e-02 RP5-1021I20.2 upstream gene
variant
15 38915313 rs56279249 C G 0.17 1.14e-03 1.48e-08 8.20e-03 intergenic variant RA
19 10463118 rs34536443 C G 0.03 2.79e-04 4.56e-16 1.36e-03 TYK2 missense variant RA, JIA, PSO
22 37558356 rs2051582 A G 0.21 1.02e-04 2.96e-05 5.02e-03 RP1-151B14.6
1 172715702 rs78037977 G A 0.12
SLE
3.67e-06 1.81e-03 2.01e-03 SLC25A38P1 upstream gene
variant
1 25297184 rs11249215 G A 0.48 3.87e-06 3.31e-02 1.26e-02 RP11-84D1.2 non coding
transcript variant
AS, p: PSO,
IgAD, celiac
disease
2 191960109 rs113429865 T A 0.24 1.44e-07 1.03e-64 2.20e-07 STAT4 intron variant g: JIA
2 214085179 rs2371887 G A 0.44 8.05e-07 4.48e-05 3.65e-04 intergenic variant
2 191486081 rs72917118 T C 0.16 2.79e-06 6.57e-06 5.35e-04 intergenic variant
5 55444683 rs7731626 A G 0.38 7.04e-08 1.84e-04 1.77e-04 ANKRD55 intron variant RA, g: JIA
5 62250627 rs139135162 T C 0.01 1.33e-06 7.78e-02 1.38e-02 intergenic variant
Chr: Chromosome; MAF: Minor Allele Frequency; cFDR: conditional False Discovery Rate; princ.: principal; cond.: conditional; RA: Rheumatoid Arthritis; g: gene associated with;
p: proxy SNP to reported SNP associated with; JIA: Juvenile Idiopathic Arthritis; PSO: Psoriasis;
JIA|AS cut-off = 2.24e-02; JIA|PsA cut-off = 1.45e-02; JIA|RA cut-off = 1.43e-02; JIA|SLE cut-off = 0.014
The Associated Traits have been detected using PhenoScanner (version 1.1) with parameters catalogue: GWAS, p-value cut-off: 5e-08, proxies: Yes; r-squared: 0.8

261
Appendix Table 3 | Loci associated with JIA after applying cFDR analysis using as conditional phenotypes AS, PsA, RA and SLE
Chr Position rsid effect
allele
other
allele
MAF conditional
phenotype
principal
p-value
conditional
p-value
cFDRprinc.|cond Gene Consequence Associated
Trait
6 28411244 rs13190937 A G 0.31
SLE
2.08e-06 2.30E-09 2.76e-04 ZSCAN23 5 prime UTR variant RA, SCZ
6 135841056 rs9647635 C A 0.36 3.15e-07 1.39e-03 6.63e-04 LINC00271 intron & non coding
transcript variant
p: MS, g: SLE
6 33479774 rs6907702 T C 0.12 9.58e-06 5.58e-93 7.54e-03 intergenic variant
6 33627077 rs2296342 G A 0.37 4.88e-06 1.53e-02 8.41e-03 ITPR3 intron variant g: CD
6 76528438 rs13194998 T C 0.05 2.24e-06 4.33e-02 1.11e-02 MYO6 intron variant g: high BP
7 128570026 rs12706860 G C 0.34 2.37e-05 2.26e-18 1.03e-03 intergenic variant SLE
10 6094697 rs61839660 T C 0.07 3.67e-06 3.23e-03 2.45e-03 IL2RA intron variant T1D, p: JIA,
g: CD, JIA
11 134180440 rs113825217 A G 0.03 3.29e-07 3.56e-02 6.49e-03 GLB1L3 intron variant g: BMI traits
12 112553032 rs10850001 A T 0.45 2.39e-04 1.35e-06 1.11e-02 intergenic variant p: CAD, MI
16 58415897 rs9926887 C T 0.29 3.63e-06 2.39e-02 9.50e-03 RNU6-269P upstream gene variant
19 10463118 rs34536443 C G 0.03 2.79e-04 2.03e-11 1.07e-02 TYK2 missense variant RA, JIA, PSO
21 36665202 rs9305565 G A 0.28 1.26e-05 7.37e-04 5.01e-03 RUNX1 intron variant p: JIA
22 21999292 rs5749600 G A 0.25 1.58e-04 1.07e-06 7.56e-03 SDF2L1 downstream gene
variant
g: CD, IBD
Chr: Chromosome; MAF: Minor Allele Frequency; cFDR: conditional False Discovery Rate; princ.: principal; cond.: conditional; RA: Rheumatoid Arthritis; g: gene associated with;
p: proxy SNP to reported SNP associated with; JIA: Juvenile Idiopathic Arthritis; PSO: Psoriasis;
JIA|AS cut-off = 2.24e-02; JIA|PsA cut-off = 1.45e-02; JIA|RA cut-off = 1.43e-02; JIA|SLE cut-off = 0.014
The Associated Traits have been detected using PhenoScanner (version 1.1) with parameters catalogue: GWAS, p-value cut-off: 5e-08, proxies: Yes; r-squared: 0.8

262
cFDR analysis using SLE as the principal disease
Enrichment plots
The Q-Q plots in Appendix Figure 5 show a robust enrichment pattern for SLE
conditioned on RA and JIA with curves distinctively separated; thus providing evidence
of pleiotropy.
Appendix Figure 5 | Q-Q plots for SLE conditional on RA (left) and JIA (right). Y axes show log10(P’) for each principal disease and X axes show the log quantile of p-values in sets of SNPs. The degree of leftward shift of a black point from the diagonal is proportional to the unconditional FDR of that p-value for the principal phenotype, and the degree of leftward shift of a coloured point is proportional to the conditional FDR of the p-value for the principal phenotype and the p-cutoff corresponding to the colour for the conditional phenotype. Each colour corresponds to the Q-Q plot for 𝒑𝑺𝑳𝑬 amongst a subset of SNPs with 𝒑𝑹𝑨 𝒐𝒓 𝒑𝑱𝑰𝑨 less than the indicated cutoff. A
leftward shift with decreasing cut-off indicates that SNPs which are associated with the conditional phenotype (RA or JIA) are more likely to be associated with the principal phenotype (JIA), presumably due to pleiotropic effects on phenotypes.
SLE loci identified with cFDR
The enrichment observed in Appendix Figure 5 led to the identification of additional
SNPs, presented with orange colour in Appendix Figure 6, significantly associated with
SLE after leveraging power from RA and JIA GWAS. 849 SNPs were identified when
RA was used as the conditional trait with significant threshold cFDR<1.25e-04 and 315
when JIA was the conditional trait with cFDR<1.19e-04.

263
Appendix Figure 6 | cFDR results for SLE conditioned on RA (left) and JIA (right). The black vertical line signifies the GWAS significance threshold 5e-08. The red dots signify the genome-wide significant SNPs for the principal disease (herein, SLE), whereas the orange dots (on the left side of the vertical line) signify the SNPs identified as significant for SLE after conditioning on the conditional disease (RA and JIA). Black dots show a random sample of the observed p-value pairs. Note that the leftward shift of colours corresponding to an increased p-value threshold for association with SLE for SNPs with low p-values for the conditional diseases.
Thirty novel loci were identified being associated with SLE with six of them being in
intergenic regions as seen in Appendix Table 4. Among the novel loci, three
(rs4954125, rs1444766 and rs183779130) mapped in genes associated with
schizophrenia and two (rs7844895 and rs453301) have been reported to be associated
with neuroticism. Observational studies have shown increased prevalence between
schizophrenia and SLE (Tiosano, Farhi et al. 2017). Moreover, two of the newly
identified SNPs (rs6659932 and rs7764323) have been reported in previous GWAS to
be associated with IBD, PBC and RA, respectively. The rest of the novel SNPs are in
LD with SNPs which have been reported to contribute to the susceptibility of various
autoimmune diseases and monocyte count levels.
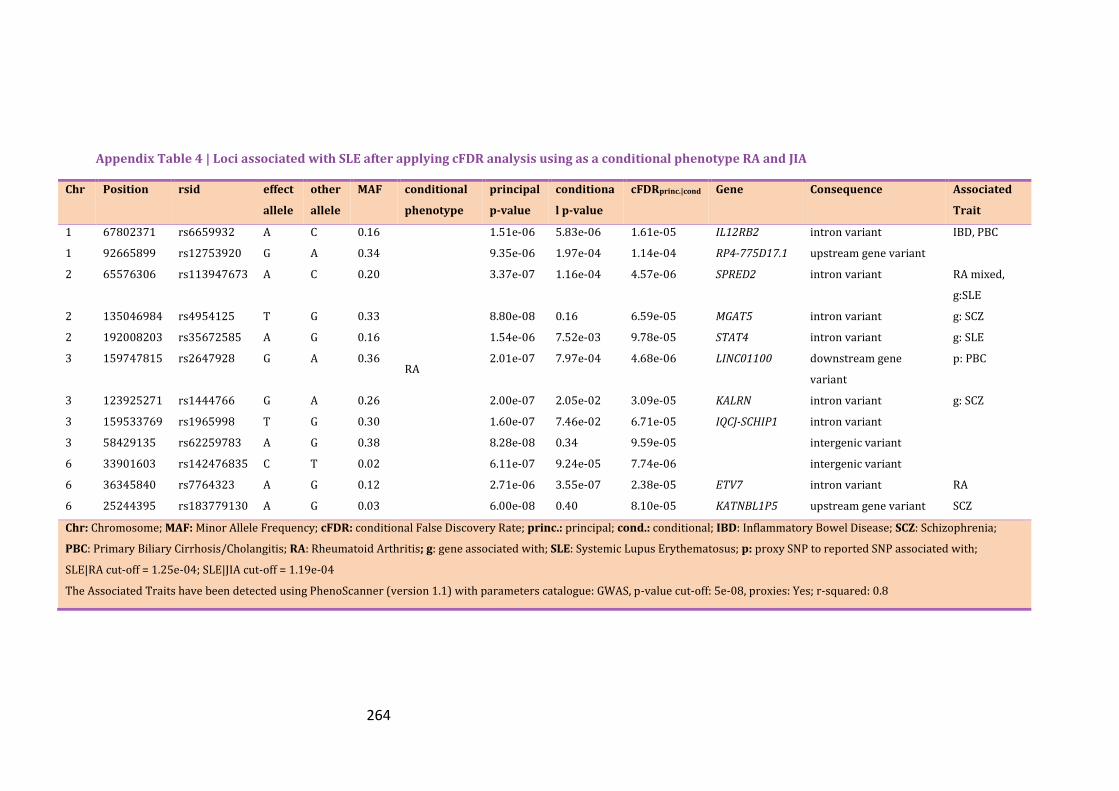
264
Appendix Table 4 | Loci associated with SLE after applying cFDR analysis using as a conditional phenotype RA and JIA
Chr Position rsid effect
allele
other
allele
MAF conditional
phenotype
principal
p-value
conditiona
l p-value
cFDRprinc.|cond Gene Consequence Associated
Trait
1 67802371 rs6659932 A C 0.16
RA
1.51e-06 5.83e-06 1.61e-05 IL12RB2 intron variant IBD, PBC
1 92665899 rs12753920 G A 0.34 9.35e-06 1.97e-04 1.14e-04 RP4-775D17.1 upstream gene variant
2 65576306 rs113947673 A C 0.20 3.37e-07 1.16e-04 4.57e-06 SPRED2 intron variant RA mixed,
g:SLE
2 135046984 rs4954125 T G 0.33 8.80e-08 0.16 6.59e-05 MGAT5 intron variant g: SCZ
2 192008203 rs35672585 A G 0.16 1.54e-06 7.52e-03 9.78e-05 STAT4 intron variant g: SLE
3 159747815 rs2647928 G A 0.36 2.01e-07 7.97e-04 4.68e-06 LINC01100 downstream gene
variant
p: PBC
3 123925271 rs1444766 G A 0.26 2.00e-07 2.05e-02 3.09e-05 KALRN intron variant g: SCZ
3 159533769 rs1965998 T G 0.30 1.60e-07 7.46e-02 6.71e-05 IQCJ-SCHIP1 intron variant
3 58429135 rs62259783 A G 0.38 8.28e-08 0.34 9.59e-05 intergenic variant
6 33901603 rs142476835 C T 0.02 6.11e-07 9.24e-05 7.74e-06 intergenic variant
6 36345840 rs7764323 A G 0.12 2.71e-06 3.55e-07 2.38e-05 ETV7 intron variant RA
6 25244395 rs183779130 A G 0.03 6.00e-08 0.40 8.10e-05 KATNBL1P5 upstream gene variant SCZ
Chr: Chromosome; MAF: Minor Allele Frequency; cFDR: conditional False Discovery Rate; princ.: principal; cond.: conditional; IBD: Inflammatory Bowel Disease; SCZ: Schizophrenia;
PBC: Primary Biliary Cirrhosis/Cholangitis; RA: Rheumatoid Arthritis; g: gene associated with; SLE: Systemic Lupus Erythematosus; p: proxy SNP to reported SNP associated with;
SLE|RA cut-off = 1.25e-04; SLE|JIA cut-off = 1.19e-04
The Associated Traits have been detected using PhenoScanner (version 1.1) with parameters catalogue: GWAS, p-value cut-off: 5e-08, proxies: Yes; r-squared: 0.8

265
Appendix Table 4 | Loci associated with SLE after applying cFDR analysis using as a conditional phenotype RA and JIA
Chr Position rsid effect
allele
other
allele
MAF conditional
phenotype
principal
p-value
conditional
p-value
cFDRprinc.|cond Gene Consequence Associated
Trait
6 33819571 rs72896160 T C 0.10
RA
6.53e-06 2.89e-04 8.89e-05 intergenic variant
6 137900027 rs79689527 A G 0.02 1.42e-05 2.39e-06 1.12e-04 intergenic variant
7 128782112 rs74549660 G A 0.03 9.46e-08 2.23e-03 3.49e-06 TSPAN33 upstream gene variant g: UC
7 73605165 rs150727739 T C 0.01 1.07e-06 4.15e-05 1.14e-05 EIF4H intron variant
7 73811948 rs12537907 G T 0.01 1.21e-06 2.07e-04 1.82e-05 CLIP2 intron variant
7 73866009 rs2097926 T A 0.01 1.45e-06 2.02e-04 2.12e-05 GTF2IRD1 upstream gene variant g: SLE
7 73434106 rs115021831 A G 0.01 2.90e-06 3.39e-05 2.79e-05 intergenic variant
7 42121585 rs866417 T C 0.50 5.75e-08 0.14 4.01e-05 GLI3 intron variant
7 74096144 rs192479202 A G 0.01 5.73e-06 5.58e-05 5.62e-05 GTF2I intron variant g: SLE
8 10955225 rs7844895 G C 0.49 2.84e-07 0.06 9.34e-05 XKR6 intron variant Neurotism
8 11448328 rs1478891 C G 0.34 5.72e-07 0.03 1.10e-04 intergenic variant Neurotism
10 8472876 rs10905367 C G 0.38 1.18e-07 0.11 6.66e-05 RP11-
543F8.2
intron & non coding
transcript variant
g: monocyte
count
11 128499000 rs7941765 C T 0.50 1.14e-06 6.21e-07 1.05e-05 RP11-
744N12.3
downstream gene variant RA mixed
Chr: Chromosome; MAF: Minor Allele Frequency; cFDR: conditional False Discovery Rate; princ.: principal; cond.: conditional; g: gene associated with; UC: Ulcerative Colitis;
SLE: Systemic Lupus Erythematosus; RA: Rheumatoid Arthritis; mixed: mixed population (Europeans and Asians included)
SLE|RA cut-off = 1.25e-04; SLE|JIA cut-off = 1.19e-04
The Associated Traits have been detected using PhenoScanner (version 1.1) with parameters catalogue: GWAS, p-value cut-off: 5e-08, proxies: Yes; r-squared: 0.8

266
Appendix Table 4 | Loci associated with SLE after applying cFDR analysis using as a conditional phenotype RA and JIA
Chr Position rsid effect
allele
other
allele
MAF conditional
phenotype
principal
p-value
conditional
p-value
cFDRprinc.|cond Gene Consequence Associated
Trait
11 128324869 rs12575600 G C 0.10
RA
3.55e-06 1.43e-04 4.32e-05 ETS1 downstream gene
variant
RA (mixed),
p: SLE(Asian)
16 86021505 rs35703946 A G 0.14 5.53e-08 0.03 1.06e-05 RP11-
542M13.2
downstream gene
variant
g: monocyte
count
16 58329828 rs10852562 T C 0.22 1.99e-07 0.09 9.42e-05 PRSS54 upstream gene variant
17 38068043 rs869402 C T 0.48 5.29e-07 8.20e-07 5.11e-06 GSDMB intron variant RA (mixed),
PBC, g: SLE
17 7234112 rs3809822 G C 0.21 1.29e-07 0.005 7.87e-06 NEURL4 upstream gene variant g: monocytes
1 159171603 rs3845622 A C 0.12
JIA
1.12e-07 0.07 8.81e-05 CADM3 3 prime UTR variant g: BD
2 135072001 rs7575908 G A 0.33 1.31e-07 0.05 8.78e-05 MGAT5 intron variant g: SCZ
3 159747815 rs2647928 G A 0.36 2.01e-07 0.002 2.07e-05 LINC01100 downstream gene
variant
p: PBC
3 159533769 rs1965998 T G 0.30 1.60e-07 0.03 7.72e-05 IQCJ-SCHIP1 intron variant
8 9030387 rs453301 G T 0.47 1.16e-07 0.09 1.01e-04 RP11-10A14.4 downstream gene
variant
Neurotism
Chr: Chromosome; MAF: Minor Allele Frequency; cFDR: conditional False Discovery Rate; princ.: principal; cond.: conditional; RA: Rheumatoid Arthritis; SCZ: Schizophrenia;
SLE: Systemic Lupus Erythematosus; mixed: mixed population (Europeans and Asians included); g: gene associated with; PBC: Primary Biliary Cirrhosis/Cholangitis; BD: Bipolar Disease;
SLE|RA cut-off = 1.25e-04; SLE|JIA cut-off = 1.19e-04
The Associated Traits have been detected using PhenoScanner (version 1.1) with parameters catalogue: GWAS, p-value cut-off: 5e-08, proxies: Yes; r-squared: 0.8
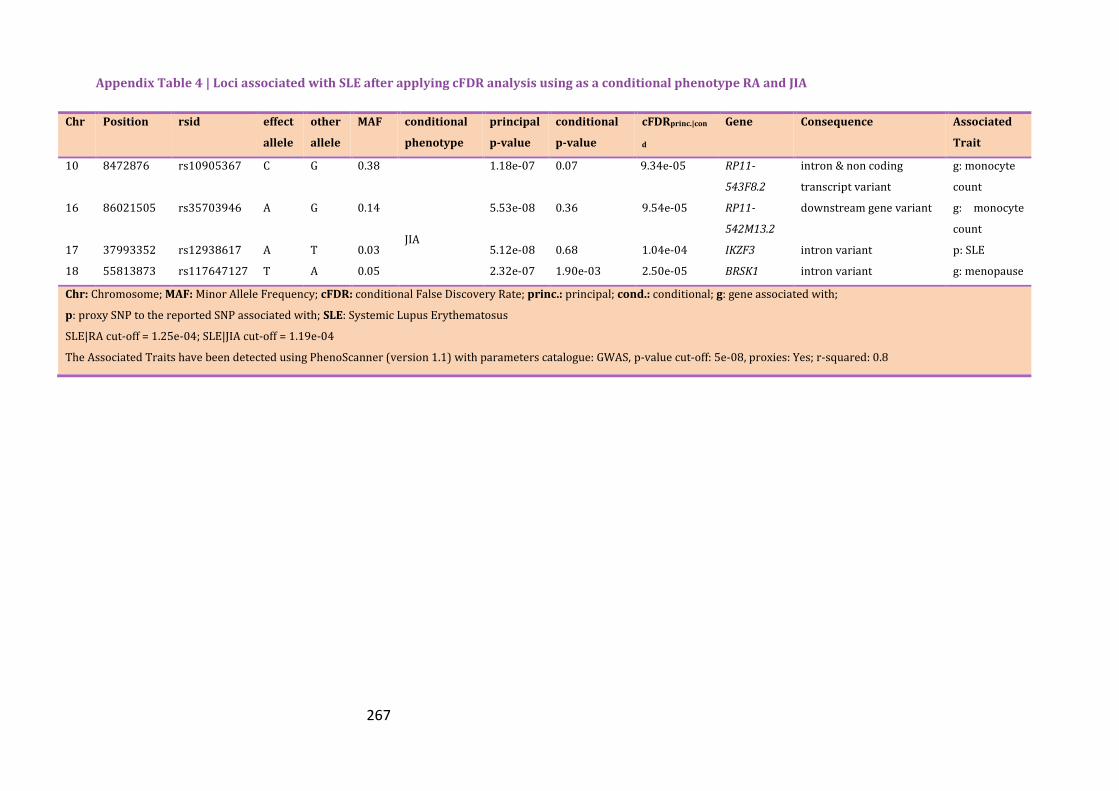
267
Appendix Table 4 | Loci associated with SLE after applying cFDR analysis using as a conditional phenotype RA and JIA
Chr Position rsid effect
allele
other
allele
MAF conditional
phenotype
principal
p-value
conditional
p-value
cFDRprinc.|con
d
Gene Consequence Associated
Trait
10 8472876 rs10905367 C G 0.38 1.18e-07 0.07 9.34e-05 RP11-
543F8.2
intron & non coding
transcript variant
g: monocyte
count
16 86021505 rs35703946 A G 0.14
JIA
5.53e-08 0.36 9.54e-05 RP11-
542M13.2
downstream gene variant g: monocyte
count
17 37993352 rs12938617 A T 0.03 5.12e-08 0.68 1.04e-04 IKZF3 intron variant p: SLE
18 55813873 rs117647127 T A 0.05 2.32e-07 1.90e-03 2.50e-05 BRSK1 intron variant g: menopause
Chr: Chromosome; MAF: Minor Allele Frequency; cFDR: conditional False Discovery Rate; princ.: principal; cond.: conditional; g: gene associated with;
p: proxy SNP to the reported SNP associated with; SLE: Systemic Lupus Erythematosus
SLE|RA cut-off = 1.25e-04; SLE|JIA cut-off = 1.19e-04
The Associated Traits have been detected using PhenoScanner (version 1.1) with parameters catalogue: GWAS, p-value cut-off: 5e-08, proxies: Yes; r-squared: 0.8

268
cFDR analysis using RA as the principal disease
Enrichment plots
Appendix Figure 7 presents the Q-Q enrichment analysis for the principal disease RA
conditioned on SLE (top), PsA (right) and JIA (left). The less robust enrichment pattern
was in the pair RA-PsA with the slope of Q-Q plots slightly increased when SNPs of
increasingly strong association with PsA were plotted. The other two plots present
evidence of pleiotropy, especially in the first four significance levels.
RA loci identified with cFDR
Appendix Figure 8 presents the newly identified SNPs associated with RA upon
conditioning with the correlated traits including SLE, PsA and JIA. 1,023 SNPs were
associated with RA (cFDR<1.25e-04) conditioning on SLE and 247 when leveraging
power from the PsA summary data with significance threshold cFDR<2.15e-05. Finally
607 were identified with cFDR<1.22e-04 when JIA was used as the conditional trait.
The association of RA with most of the loci identified in previous studies was
replicated; however 16 novel loci were identified, of which eight were intergenic and
the rest have been reported in other autoimmune diseases as shown by PhenoScanner.
For example, rs6679356 (IL12RB2) found here is in LD with variant associated with
IBD and MS. IL12RB2 gene is the receptor for IL-12 and promotes the proliferation of
T-cells. It encodes IL-12Rβ2 whose lack of signalling promotes autoimmunity in animal
models (Airoldi, Di Carlo et al. 2005). No previous association of rs1234313 that maps
gene TNFSF4 with RA predisposition has been reported previously. TNFSF4 encodes a
cytokine that is expressed on CD40-stimulated B-cells and antigen-presenting cells and
has been associated with SLE and MS (Baum, Gayle et al. 1994). An interesting finding
is the association with SNP rs4958880 in TNIP1 region whose variants are associated
with PSO, PSA, SLE and myasthenia gravis and inhibits NF-κB transcriptional activity.
Novel loci were also found in genes CCRI (rs3176953) and ZFP36L1 (rs10443). These
genes are associated with the susceptibility to a number of autoimmune diseases
including IBD, CD, UC and IBD. The list of novel associations for RA can be found in
Appendix Table 5.

269
Appendix Figure 7 | Q-Q plots for RA conditional on SLE (top), PsA (bottom left) and JIA (bottom right). Y axes show log10(P’) for each principal disease and X axes show the log quantile of p-values in sets of SNPs. The degree of leftward shift of a black point from the diagonal is proportional to the unconditional FDR of that p-value for the principal phenotype, and the degree of leftward shift of a coloured point is proportional to the conditional FDR of the p-value for the principal phenotype and the p-cutoff corresponding to the colour for the conditional phenotype. Each colour corresponds to the Q-Q plot for 𝒑𝑹𝑨 amongst a subset of SNPs with 𝒑𝑺𝑳𝑬 𝒐𝒓 𝒑𝑷𝒔𝑨𝒐𝒓 𝒑𝑱𝑰𝑨 less than the indicated
cutoff. A leftward shift with decreasing cut-off indicates that SNPs which are associated with the conditional phenotype (SLE, PSA, JIA) are more likely to be associated with the principal phenotype (RA), presumably due to pleiotropic effects on phenotypes.

270
Appendix Figure 8 | cFDR results for RA conditioned on SLE (top), PsA (bottom left) and JIA (bottom right). The black vertical line signifies the GWAS significance threshold 5e-08. The red dots signify the genome-wide significant SNPs for the principal disease (herein, RA), whereas the orange dots (on the left side of the vertical line) signify the SNPs identified as significant for RA after conditioning on the conditional disease (SLE, PSA, JIA). Black dots show a random sample of the observed p-value pairs. Note that the leftward shift of colours corresponding to an increased p-value threshold for association with RA for SNPs with low p-values for the conditional disease.

271
Appendix Table 5 | Loci associated with RA after applying cFDR analysis using as a conditional phenotype SLE, JIA and PsA
Chr Position rsid effect
allele
other
allele
MAF conditional
phenotype
principal
p-value
conditional
p-value
cFDRprinc.|cond Gene Consequence Associated
Trait
1 161478859 rs4657041 T C 0.49
SLE
9.84e-08 7.64e-11 1.32e-06 FCGR2A intron variant IBD, UC, g: RA
1 67820194 rs6679356 C T 0.172 4.51e-06 1.12e-05 4.60e-05 IL12RB2 intron variant p: IBD, PBC
1 173166247 rs1234313 A G 0.31 9.34e-06 1.03e-06 6.97e-05 TNFSF4 intron variant g: SLE,CD,MS
2 191516020 rs6733720 G C 0.20 4.32e-07 3.12e-08 3.52e-06 NAB1 intron variant g: PBC
2 202154397 rs6715284 G C 0.10 2.93e-07 2.95e-02 7.00e-05 ALS2CR12 intron variant RA (mixed)
3 58318477 rs185407974 A G 0.05 5.68e-08 1.45e-04 1.81e-06 PXK upstream gene variant p: RA
5 150438477 rs4958880 A C 0.19 8.15e-07 3.76e-15 5.60e-06 TNIP1 intron variant g: PsA,PSO
5 133423616 rs244687 A G 0.16 6.35e-06 1.31e-08 3.86e-05 intergenic variant
6 27616489 rs4711160 C T 0.14 1.24e-07 9.32e-06 2.08e-06 RP1-15D7.1 downstream gene
variant
6 426268 rs6930468 A G 0.35 1.61e-07 0.12 9.83e-05 intergenic variant RA (mixed)
8 11351912 rs922483 T C 0.28 1.76e-07 7.23e-15 1.45e-06 BLK 5 prime UTR variant RA (mixed)
8 129540464 rs16903065 A C 0.10 5.51e-07 2.30e-03 3.84e-05 RP11-
89M16.1
intron & non coding
transcript variant
p: ovarian
cancer
10 63910344 rs148672683 C T 0.01 5.98e-08 2.73e-04 2.32e-06 intergenic variant
12 111833788 rs10774624 G A 0.47 2.36e-07 1.49e-07 2.30e-06 RP3-
473L9.4
intron & non coding
transcript variant
RA (mixed),
p: T1D
Chr: Chromosome; MAF: Minor Allele Frequency; cFDR: conditional False Discovery Rate; princ.: principal; cond.: conditional; g: gene associated with;
p: proxy SNP to the reported SNP associated with; SLE: Systemic Lupus Erythematosus
RA|SLE cut-off = 1.25e-04; RA|JIA cut-off = 1.22e-04; RA|PsA cut-off = 2.15e-05
The Associated Traits have been detected using PhenoScanner (version 1.1) with parameters catalogue: GWAS, p-value cut-off: 5e-08, proxies: Yes; r-squared: 0.8

272
Appendix Table 5 | Loci associated with RA after applying cFDR analysis using as a conditional phenotype SLE, JIA and PsA
Chr Position rsid effect
allele
other
allele
MAF conditional
phenotype
principal
p-value
conditional
p-value
cFDRprinc.|cond Gene Consequence Associated
Trait
12 56384804 rs705699 A G 0.39
SLE
9.84e-08 4.86e-02 3.61e-05 RAB5B intron variant RA (mixed)
14 68760141 rs1950897 C T 0.35 2.51e-07 9.05e-03 3.14e-05 RAD51B intron variant RA
16 86009760 rs12232384 A C 0.22 5.85e-07 2.73e-02 1.23e-04 intergenic variant RA (mixed),
MS
22 21979096 rs11089637 C T 0.17 5.55e-07 2.73e-12 5.19e-06 YDJC downstream gene
variant
CD, IBD,
RA(mixed)
1 114588810 rs139977996 C T 0.01
PsA
1.59e-07 3.12e-02 1.07e-04 intergenic variant
10 6177894 rs71479758 G A 0.25 1.58e-07 2.25e-02 9.07e-05 intergenic variant
12 56384804 rs705699 A G 0.39 9.84e-08 5.92e-02 9.24e-05 RAB5B intron variant RA (mixed)
22 21979096 rs11089637 C T 0.17 5.55e-07 7.56e-05 2.06e-05 YDJC downstream gene
variant
CD, IBD, RA
(mixed)
1 114588810 rs139977996 C T 0.01
JIA
1.59e-07 1.76e-02 3.08e-05 intergenic variant
3 58318477 rs185407974 A G 0.05 5.68e-08 8.55e-02 3.03e-05 PXK upstream gene variant p: RA
3 46243718 rs3176953 A T 0.14 4.69e-07 8.68e-03 5.70e-05 CCR1 3 prime UTR variant g: UC, IBD
6 33820658 rs78861422 T C 0.03 5.92e-08 0.25 6.34e-05 intergenic variant
6 27714052 rs142306808 G C 0.04 4.53e-07 0.01 7.23e-05 intergenic variant
6 426268 rs6930468 A G 0.35 1.61e-07 8.88e-02 8.10e-05 intergenic variant RA
Chr: Chromosome; MAF: Minor Allele Frequency; cFDR: conditional False Discovery Rate; princ.: principal; cond.: conditional; g: gene associated with;
p: proxy SNP to the reported SNP associated with; SLE: Systemic Lupus Erythematosus
RA|SLE cut-off = 1.25e-04; RA|JIA cut-off = 1.22e-04; RA|PsA cut-off = 2.15e-05
The Associated Traits have been detected using PhenoScanner (version 1.1) with parameters catalogue: GWAS, p-value cut-off: 5e-08, proxies: 1000G; r-squared: 0.8

273
Appendix Table 5 | Loci associated with RA after applying cFDR analysis using as a conditional phenotype SLE, JIA and PsA
Chr Position rsid effect
allele
other
allele
MAF conditional
phenotype
principal
p-value
conditional
p-value
cFDRprinc.|cond Gene Consequence Associated
Trait
8 11341880 rs2736337 C T 0.24
JIA
1.60e-07 0.02 3.11e-05 intergenic variant RA, p: SLE
8 129540464 rs16903065 A C 0.10 5.51e-07 0.002 3.16e-05 RP11-
89M16.1
intron & non coding
transcript variant
p: RA, CD
10 6178941 rs11598494 C T 0.37 1.16e-06 3.89e-04 3.21e-05 intergenic variant
10 9049253 rs12413578 T C 0.11 3.27e-07 0.01 5.37e-05 intergenic variant RA (mixed)
12 111833788 rs10774624 G A 0.47 2.36e-07 6.80e-04 9.31e-06 RP3-
473L9.4
intron & non coding
transcript variant
RA (mixed),
p: RA
12 58108052 rs1633360 C T 0.40 9.11e-08 0.11 5.34e-05 OS9 intron variant RA
14 69260290 rs10443 T C 0.25 6.97e-07 0.009 8.42els-05 ZFP36L1 upstream gene variant g: T1D,MS,CD
Chr: Chromosome; MAF: Minor Allele Frequency; cFDR: conditional False Discovery Rate; princ.: principal; cond.: conditional; g: gene associated with;
p: proxy SNP to the reported SNP associated with; SLE: Systemic Lupus Erythematosus
RA|SLE cut-off = 1.25e-04; RA|JIA cut-off = 1.22e-04; RA|PsA cut-off = 2.15e-05
The Associated Traits have been detected using PhenoScanner (version 1.1) with parameters catalogue: GWAS, p-value cut-off: 5e-08, proxies: 1000G; r-squared: 0.8

274
JIA loci identified with MTAG
The noteworthy power gain noticed in JIA can be seen in the number of novel
associations detected by MTAG (Appendix Table 6 and Appendix Table 7). Thirty nine
signal peaks were identified including 14 intergenic SNPs and 15 provided evidence of
contribution to the predisposition of JIA including; RP4-590F24.1 (rs12563513, OR
1.16, p = 3.26e-18), AFF3 (rs12712065, OR 1.06, p = 1.51e-08), AC006460.2 (rs744600,
OR 1.08, p = 1.07e-16), C6orf106 (rs13207858, OR 1.12, p = 41.53e-08), AHI1
(rs2614266, OR 1.05, p = 3.64e-08), ITPR3 (rs749338, OR 1.07, p = 4.79e-13), TNOP3
(rs17338998, OR 1.21, p = 1.85e-32), BLK (rs4840568, OR 1.09, p = 9.55e-15) and
RASGRP1 (rs8043085, OR 1.08, p = 1.74e-11); the remainder are listed in Appendix
Table 7. The remaining 9 associations were found to be protective of JIA; IL12RB2
(rs6693065, OR 0.94, p = 6.28e-09), LINC01100 (rs485499, OR 0.94, p = 6.69e-10),
C5orf30 (rs411648, OR 0.94, p = 1.74e-10), RP11-89M16.1 (rs16903081, OR 0.92, p =
1.45e-08), ICAM3 (rs2278442, OR 0.92, p = 2.69e-16), RP11-279F6.3 (rs12899564, OR
0.88, p = 1.17e-12) and the remaining three SNPs protective of JIA can be found in
Appendix Table 7.
Finally, six gene associations were replicated in this study including ANKRD55, STAT4,
IL2RA, SH2B3, RUNX1 and COG6 (Appendix Table 6). In addition, a novel independent
loci was found for ANKRD55 to be protective for JIA as well (rs13186299, OR 0.90, p
= 2.81e-13). The Manhattan plot depicted in Appendix Figure 9 presents the SNPs for
JIA GWAS and MTAG analyses in genomic scale.

275
Appendix Table 6 | MTAG results for JIA (results presented for original JIA p-value<0.05)
Chr Position rsid effect
allele
other
allele
MAF JIA
p-value
MTAG
p-value
MTAG
OR
MTAG
95% CI
Gene Consequence Associated Trait
1 25304552 rs10794667 C T 0.46 9.00e-06 1.76e-08 0.95 0.93-0.97 intergenic variant
1 114547798 rs12563513 A G 0.09 2.19e-02 3.26e-18 1.16 1.12-1.19 RP4-590F24.1 upstream gene variant RA
1 67800018 rs6693065 G A 0.24 2.40e-02 6.28e-09 0.94 0.92-0.96 IL12RB2 intron variant
2 100761105 rs12712065 C G 0.49 1.81e-02 1.51e-08 1.06 1.04-1.08 AFF3 upstream gene variant RA
2 191564757 rs744600 G T 0.39 9.13e-03 1.07e-16 1.08 1.06-1.11 AC006460.2 intron & non coding
transcript variant
Height
2 191970120 rs7582694 C G 0.23 7.36e-08 1.05e-53 1.19 1.16-1.22 STAT4 intron variant JIA, RA, p: SLE
3 159745863 rs485499 C T 0.35 2.27e-03 6.69e-10 0.94 0.92-0.96 LINC01100 downstream gene variant PBC
4 123402195 rs6534349 G A 0.09 2.32e-03 7.19e-09 1.10 1.07-1.14 intergenic variant
5 55438851 rs10065637 T C 0.22 2.89e-05 4.72e-15 0.91 0.89-0.93 ANKRD55 intron variant JIA, CD, RA
5 55455645 rs13186299 C G 0.14 2.05e-03 2.81e-13 0.90 0.88-0.93 ANKRD55 intron variant RA
5 133425735 rs17167255 A G 0.07 2.63e-02 2.24e-09 1.12 1.08-1.16 intergenic variant
5 102602902 rs411648 T A 0.30 7.19e-03 1.74e-10 0.94 0.92-0.95 C5orf30 intron variant RA, g: PBC
6 34640870 rs13207858 T C 0.06 6.89e-04 1.53e-08 1.12 1.08-1.17 C6orf106 intron variant g: CAD, high BP
6 137973068 rs2327832 G A 0.17 2.29e-02 1.89e-15 1.11 1.08-1.14 intergenic variant UC, RA, IgAD
Chr: Chromosome; MAF; Minor Allele Frequency; MTAG: Multi-Trait Analysis of GWAS; OR: Odds Ratio; CI: Confidence Interval; RA: Rheumatoid Arthritis;
IBD: Inflammatory Bowel Disease; PBC: Primary Biliary Cirrhosis/Cholangitis; p: proxy SNP to the reported SNP associated with; SLE: Systemic Lupus Erythematosus;
IgAD: Immunoglobulin A Deficiency; JIA: Juvenile Idiopathic Arthritis; CD: Crohn’s Disease; CAD: Coronary Artery Disease; BP: Blood Pressure; UC: Ulcerative Colitis
The Associated Traits have been detected using PhenoScanner (version 1.1) with parameters catalogue: GWAS, p-value cut-off: 5e-08, proxies: Yes; r-squared: 0.8
Novel loci are presented in bright purple

276
Appendix Table 6 | MTAG results for JIA (results presented for original JIA p-value<0.05)
Chr Position rsid effect
allele
other
allele
MAF JIA
p-value
MTAG
p-value
MTAG
OR
MTAG
95% CI
Gene Consequence Associated Trait
6 135716532 rs2614266 A T 0.42 4.61e-07 3.64e-08 1.05 1.03-1.08 AHI1 intron variant g: IgAD, MS
6 33653448 rs749338 T C 0.46 3.42e-02 4.79e-13 1.07 1.05-1.09 ITPR3 synonymous variant RA, Height
7 128618559 rs17338998 T C 0.10 4.04e-03 1.85e-32 1.21 1.17-1.25 TNPO3 intron variant RA, p: SLE,MS
8 129548309 rs16903081 C T 0.10 2.12e-03 1.45e-08 0.92 0.89-0.94 RP11-
89M16.1
intron & non coding
transcript variant
8 11351019 rs4840568 A G 0.27 2.97e-02 9.55e-15 1.09 1.06-1.11 BLK upstream gene variant RA, p:SLE, g:
Neurotism, Sjogren’s
10 6100725 rs3134883 A G 0.29 9.94e-04 5.03e-08 1.06 1.04-1.08 IL2RA intron variant T1D, p: JIA
12 111884608 rs3184504 T C 0.46 5.81e-04 1.61e-13 1.07 1.05-1.09 SH2B3 missense variant JIA, MI, T1D
13 40300328 rs9603603 G T 0.36 8.25e-04 3.96e-08 0.95 0.93-0.97 COG6 intron variant RA, p: JIA,PSO
15 69985284 rs12899564 G C 0.07 4.82e-02 1.17e-12 0.88 0.84-0.91 RP11-279F6.3 intron & non coding
transcript variant
RA, Height
15 38828140 rs8043085 T G 0.22 3.01e-02 1.74e-11 1.08 1.06-1.11 RASGRP1 intron variant RA
19 10444826 rs2278442 G A 0.34 8.59e-03 2.69e-16 0.92 0.90-0.94 ICAM3 intron variant RA, g: IBD, UC
21 36715761 rs9979383 C T 0.36 1.03e-02 3.87e-08 0.95 0.93-0.97 RUNX1 intron variant JIA, RA
Chr: Chromosome; MAF; Minor Allele Frequency; MTAG: Multi-Trait Analysis of GWAS; OR: Odds Ratio; CI: Confidence Interval; RA: Rheumatoid Arthritis;
IBD: Inflammatory Bowel Disease; PBC: Primary Biliary Cirrhosis/Cholangitis; p: proxy SNP to the reported SNP associated with; SLE: Systemic Lupus Erythematosus;
IgAD: Immunoglobulin A Deficiency; JIA: Juvenile Idiopathic Arthritis; MI: Myocardial Infraction; PSO: Psoriasis; CD: Crohn’s Disease; BP: Blood Pressure; UC: Ulcerative Colitis
The Associated Traits have been detected using PhenoScanner (version 1.1) with parameters catalogue: GWAS, p-value cut-off: 5e-08, proxies: Yes; r-squared: 0.8
Novel loci are presented in bright purple

277
Appendix Table 7 | MTAG results for JIA (original JIA p-value>0.05)
Chr Position rsid effect
allele
other
allele
MAF JIA
p-value
MTAG
p-value
MTAG
OR
MTAG
95% CI
Gene Consequence Associated Trait
1 173353881 rs1557121 T C 0.24 6.46e-02 8.80e-15 0.92 0.90-0.94 intergenic variant RA
1 173191475 rs2205960 T G 0.23 3.02e-01 2.43e-09 1.07 1.05-1.09 intergenic variant SLE (Asian), IgAD
2 113829869 rs13019891 T G 0.45 4.16e-01 1.76e-11 0.94 0.92-0.96 IL1F10 upstream gene variant
2 163110536 rs2111485 A G 0.40 1.63e-01 8.22e-09 0.95 0.93-0.96 intergenic variant IBD, p: PSO,T1D
2 233288667 rs2573219 C A 0.09 9.34e-01 7.13e-14 1.14 1.10-1.17 AC068134.5 upstream gene variant
3 12481375 rs4498025 T C 0.24 1.44e-02 2.06e-06 1.05 1.03-1.08 intergenic variant
3 129084581 rs9852014 G A 0.07 9.12e-02 5.33e-11 1.13 1.09-1.17 intergenic variant
4 102714254 rs4518254 G T 0.44 5.66e-02 1.43e-14 0.93 0.91-0.95 BANK1 intron variant
5 150438988 rs1422673 T C 0.19 8.09e-01 2.15e-12 1.09 1.06-1.11 TNIP1 intron variant Myasthenia Gravis
5 159879978 rs2431697 C T 0.43 1.94e-01 8.64e-09 0.95 0.93-0.96 intergenic variant PSO, SLE
6 26309908 rs10484439 A G 0.07 7.88e-01 3.70e-10 1.12 1.08-1.17 intergenic variant SCZ
6 26582035 rs13198716 T C 0.07 8.70e-01 1.37e-12 1.15 1.10-1.19 intergenic variant SCZ
6 27868792 rs13199649 T C 0.07 4.64e-01 2.06e-13 1.14 1.10-1.19 RNU7-26P upstream gene variant SCZ
6 25983010 rs13212534 A G 0.06 4.39e-01 1.61e-09 1.12 1.08-1.17 TRIM38 intron variant SCZ
Chr: Chromosome; MAF; Minor Allele Frequency; MTAG: Multi-Trait Analysis of GWAS; OR: Odds Ratio; CI: Confidence Interval; RA: Rheumatoid Arthritis;
SLE: Systemic Lupus Erythematosus; IgAD: Immunoglobulin A Deficiency; PBC: Primary Biliary Cirrhosis/Cholangitis; IBD: Inflammatory Bowel Disease;
p: proxy SNP to the reported SNP associated with; PSO: Psoriasis; T1D: Type 1 Diabetes; SCZ: Schizophrenia
The Associated Traits have been detected using PhenoScanner (version 1.1) with parameters catalogue: GWAS, p-value cut-off: 5e-08, proxies: Yes; r-squared: 0.8
Novel loci are presented in bright purple

278
Appendix Table 7 | MTAG results for JIA (original JIA p-value>0.05)
Chr Position rsid effect
allele
other
allele
MAF JIA
p-value
MTAG
p-value
MTAG
OR
MTAG
95% CI
Gene Consequence Associated Trait
6 167540842 rs1571878 C T 0.42 3.51e-01 2.05e-08 1.06 1.04-1.08 CCR6 intron variant RA
6 33557225 rs430655 A G 0.36 6.19e-01 2.15e-10 0.94 0.92-0.96 GGNBP1 downstream gene
variant
RA
6 138230389 rs7749323 A G 0.02 1.11e-01 1.05e-17 1.34 1.25-1.43 intergenic variant RA, SLE
22 21979096 rs11089637 C T 0.17 7.36e-02 4.44e-19 1.12 1.09-1.15 YDJC downstream gene
variant
RA, IBD
22 39740078 rs137687 A G 0.44 7.89e-01 1.48e-08 0.95 0.93-0.96 intergenic variant RA
Chr: Chromosome; MAF; Minor Allele Frequency; MTAG: Multi-Trait Analysis of GWAS; OR: Odds Ratio; CI: Confidence Interval; RA: Rheumatoid Arthritis;
SLE: Systemic Lupus Erythematosus; IBD: Inflammatory Bowel Disease;
The Associated Traits have been detected using PhenoScanner (version 1.1) with parameters catalogue: GWAS, p-value cut-off: 5e-08, proxies: Yes; r-squared: 0.8
Novel loci are presented in bright purple

279
Appendix Figure 9 | Manhattan plot of association results for JIA. Each circle presents the − 𝐥𝐨𝐠𝟏𝟎(𝒑) of the variants. The thresholds of suggestive (p-value = 1e-06) and genome-wide significance (p-value = 5e-08) are delineated with blue and red lines, respectively. The plot includes SNPs that were significant in both GWAS and MTAG.

280
SLE loci identified with MTAG
Appendix Table 8 and Appendix Figure 10 present the 26 regions with genome-wide
significant association for SLE. Two of these were previously known (ARID5B and
ATXN2/SH2B3) and the other 24 were newly established at genome-wide significance.
Thirteen of the novel associations were found to contribute to disease susceptibility;
RP4-590F24.1 (rs10494164, OR 1.17, p = 2.53e-11), AC012370.3 (rs1866050, OR 1.09,
p = 3.84e-08), KALRN (rs1444766, OR 1.09, p = 9.43e-09), C6orf106 (rs13207858, OR
1.19, p = 7.78e-10), CLIP2 (rs12537907, OR 1.41, p = 2.07e-08), XKR6 (rs2001433, OR
1.07, p = 1.60e-08), RP11-744N12.3 (rs7945677, OR 1.07, p = 1.62e-08), RASGRP1
(rs8043085, OR 1.09, p = 1.50e-08), PRSS54 (rs11644244, OR 1.10, p = 2.34e-09),
NEURL4 (rs8081264, OR 1.10, p = 8.69e-10), intergenic rs2327832 (OR 1.16, p =
1.52e-16), intergenic rs13274269 (OR 1.08, p = 2.48e-08) and rs9308364 (OR 1.08, p
= 2.34e-09).
The remaining 11 novel gene associations were found to be protective for SLE
including CTLA4 (rs3087243, OR 0.92, p = 3.12e-09) MGAT (rs4954125, OR 0.91, p =
2.89e-11), LINC01100 (rs564976, OR 0.92, p = 4.64e-09), ITPR3 (rs4259245, OR 0.91,
p = 4.72e-12), ETV7 (rs881648, OR 0.89, p = 4.26e-10), RP11-543F8.2 (rs10905371,
OR 0.91, p = 2.66e-11), GSDMB (rs7224129, OR 0.93, p = 8.08e-09), CACNA1I
(rs12170452, OR 0.92, p = 4.86e-10), intergenic variant rs7000141 (OR 0.91, p =
2.86e-11), intergenic rs10152590 (OR 0.87, p = 2.08e-08) and rs137687 (OR 0.92, p =
3.31e-10).

281
Appendix Table 8 | MTAG results for SLE
Chr Position rsid effect
allele
other
allele
MAF SLE
p-value
MTAG
p-value
MTAG
OR
MTAG
95% CI
Gene Consequence Associated Trait
1 114546528 rs10494164 G A 0.09 2.67e-03 2.53e-11 1.17 1.12-1.22 RP4-590F24.1 upstream gene variant RA
2 65677729 rs1866050 G A 0.24 5.38e-06 3.84e-08 1.09 1.06-1.12 AC012370.3 non coding transcript
variant
2 204738919 rs3087243 A G 0.47 8.97e-03 3.12e-09 0.92 0.90-0.95 CTLA4 downstream gene variant RA, T1D,IgAD
2 135046984 rs4954125 T G 0.33 8.80e-08 2.89e-11 0.91 0.89-0.94 MGAT5 intron variant g: SCZ
3 123925271 rs1444766 G A 0.26 2.00e-07 9.43e-09 1.09 1.06-1.12 KALRN intron variant g: SCZ
3 159729059 rs564976 A G 0.35 9.49e-07 4.64e-09 0.92 0.90-0.95 LINC01100 upstream gene variant p: PBC
6 34640870 rs13207858 T C 0.06 1.12e-07 7.78e-10 1.19 1.13-1.26 C6orf106 intron variant g: BMI, CAD, high
BP
6 137973068 rs2327832 G A 0.17 3.40e-06 1.52e-16 1.16 1.12-1.20 intergenic variant RA, UC, IgAD
6 33624221 rs4259245 G A 0.39 2.46e-06 4.72e-12 0.91 0.89-0.93 ITPR3 intron variant RA, g: CD, asthma
6 36350605 rs881648 T C 0.14 3.54e-06 4.26e-10 0.89 0.86-0.92 ETV7 intron variant RA
7 73811948 rs12537907 G T 0.01 1.21e-06 2.07e-08 1.41 1.25-1.59 CLIP2 intron variant
8 11449325 rs13274269 T G 0.34 7.28e-07 2.48e-08 1.08 1.05-1.11 intergenic variant Neurotism
8 10903475 rs2001433 T A 0.49 3.60e-07 1.60e-08 1.07 1.05-1.11 XKR6 intron variant Neurotism
8 11070721 rs7000141 A G 0.33 6.50e-08 1.86e-11 0.91 0.88-0.94 intergenic variant
Chr: Chromosome; MAF; Minor Allele Frequency; MTAG: Multi-Trait Analysis of GWAS; OR: Odds Ratio; CI: Confidence Interval; RA: Rheumatoid Arthritis;
IBD: Inflammatory Bowel Disease; PBC: Primary Biliary Cirrhosis/Cholangitis; p: proxy SNP to the reported SNP associated with; SLE: Systemic Lupus Erythematosus;
IgAD: Immunoglobulin A Deficiency; JIA: Juvenile Idiopathic Arthritis; MI: Myocardial Infraction; PSO: Psoriasis; CD: Crohn’s Disease; BP: Blood Pressure; UC: Ulcerative Colitis
The Associated Traits have been detected using PhenoScanner (version 1.1) with parameters catalogue: GWAS, p-value cut-off: 5e-08, proxies: Yes; r-squared: 0.8
Novel loci are presented with bright purple

282
Appendix Table 8 | MTAG results for SLE
Chr Position rsid effect
allele
other
allele
MAF SLE
p-value
MTAG
p-value
MTAG
OR
MTAG
95% CI
Gene Consequence Associated Trait
10 8480044 rs10905371 G A 0.32 2.06e-07 2.66e-11 0.91 0.88-0.94 RP11-543F8.2 intron & non coding
transcript variant
g: monocyte count
10 63813744 rs16916931 T A 0.37 1.21e-07 3.90e-12 1.10 1.07-1.13 ARID5B intron variant p: RA, p: SLE
11 128499905 rs7945677 C T 0.50 1.34e-06 1.62e-08 1.07 1.05-1.11 RP11-744N12.3 intron & non coding
transcript variant
RA (mixed)
12 112007756 rs653178 C T 0.47 1.20e-07 1.31e-11 1.09 1.07-1.12 ATXN2/SH2B3 intron variant CAD,MI, p:SLE,JIA
15 70048116 rs10152590 T A 0.07 1.86e-03 2.08e-08 0.87 0.83-0.91 intergenic variant RA, Height
15 38828140 rs8043085 T G 0.22 1.02e-03 1.50e-08 1.09 1.06-1.13 RASGRP1 intron variant RA, g:T2D,CD
16 58322851 rs11644244 G A 0.20 3.10e-06 2.56e-08 1.10 1.06-1.13 PRSS54 intron variant
16 86003446 rs9308364 C T 0.49 3.41e-07 2.34e-09 1.08 1.05-1.11 intergenic variant
17 38075426 rs7224129 A G 0.48 1.95e-06 8.08e-09 0.93 0.90-0.95 GSDMB upstream gene variant UC, RA(mixed)
17 7235316 rs8081264 C G 0.21 1.66e-07 8.69e-10 1.10 1.07-1.14 NEURL4 upstream gene variant g: monocyte % of
white cells
22 40019773 rs12170452 A G 0.42 4.00e-04 4.86e-10 0.92 0.90-0.94 CACNA1I intron variant p: SCZ
22 39740078 rs137687 A G 0.44 4.83e-03 3.31e-10 0.92 0.90-0.94 intergenic variant RA
Chr: Chromosome; MAF; Minor Allele Frequency; MTAG: Multi-Trait Analysis of GWAS; OR: Odds Ratio; CI: Confidence Interval; &: and; g: gene associated with;
p: proxy SNP to the reported SNP associated with; RA: Rheumatoid Arthritis; SLE: Systemic Lupus Erythematosus; mixed: mixed populations (Europeans and Asians);
CAD: Cardiac Artery Disease; MI: Myocardial Infraction; JIA: Juvenile Idiopathic Arthritis; T2D: Type 2 Diabetes; CD; Crohn’s Disease; UC: Ulcerative Colitis; SCZ: Schizophrenia
The Associated Traits have been detected using PhenoScanner (version 1.1) with parameters catalogue: GWAS, p-value cut-off: 5e-08, proxies: Yes; r-squared: 0.8
Novel loci are presented with bright purple

283
Appendix Figure 10 | Manhattan plot of association results for SLE. Each circle presents the − 𝐥𝐨𝐠𝟏𝟎(𝒑) of the variants. The thresholds of suggestive (p-value = 1e-06) and genome-wide significance (p-value = 5e-08) are delineated with blue and red lines, respectively. The plot includes SNPs that were significant in both GWAS and MTAG.

284
RA loci identified with MTAG
Appendix Table 9 and Appendix Figure 11 present the 18 regions with genome-wide
significant association for RA. Seven of these were previously reported mainly in mixed
population cohort (ALS2CR12, ETV7, BLK, SH2B3, RAD51B, RP11-973H7.1, and YDJC)
and the other 11 were newly established at genome-wide significance. Seven of the
novel associations were found to contribute to disease susceptibility; MANEAL
(rs2306627, OR 1.04, p = 9.73e-10), IL12RB2 (rs6679356, OR 1.04, p = 1.94e-08),
KIAA1109 (rs7677168, OR 1.06, p = 1.95e-08), TNIP1 (rs4958880, OR 1.05, p = 7.78e-
10), intergenic variant rs244689 (OR 1.04, p = 6.65e-09), intergenic rs12215241 (OR
1.04, p = 3.36e-08) and rs802791 (OR 1.03, p = 1.12e-08).
The remaining four novel gene associations were found to be protective for RA
including TNFS4 (rs1234313, OR 0.97, p = 3.40e-09), BANK1 (rs4572884, OR 0.97, p =
3.64e-09), RP11-89M16.1 (rs16903065, OR 0.95, p = 1.48e-09) and UBASH3A
(rs9980184, OR 0.94, p = 2.09e-14). The latter is independent to the locus that has
previously been reported to be associated with RA.

285
Appendix Figure 11 | Manhattan plot of association results for RA. Each circle presents the − 𝐥𝐨𝐠𝟏𝟎(𝒑) of the variants. The thresholds of suggestive (p-value = 1e-06) and genome-wide significance (p-value = 5e-08) are delineated with blue and red lines, respectively. The plot includes SNPs that were significant in both GWAS and MTAG.

286
Appendix Table 9 | MTAG results for RA
Chr Position rsid effect
allele
other
allele
MAF RA
p-value
MTAG
p-value
MTG
OR
MTAG
95% CI
Gene Consequence Associated Trait
1 173166247 rs1234313 A G 0.31 9.34e-06 3.40e-09 0.97 0.96-0.98 TNFSF4 intron variant g: SLE, CD, MS
1 38260503 rs2306627 T C 0.28 5.98e-08 9.73e-10 1.04 1.02-1.05 MANEAL intron variant
1 67820194 rs6679356 C T 0.17 4.51e-06 1.94e-08 1.04 1.03-1.05 IL12RB2 intron variant
2 202171573 rs13408294 G C 0.10 4.36e-07 1.17e-08 1.05 1.03-1.07 ALS2CR12 intron variant p: RA
4 102783351 rs4572884 T C 0.38 2.55e-04 3.64e-09 0.97 0.96-0.98 BANK1 intron variant g: SLE,CD,SCZ
4 123134158 rs7677168 A G 0.08 4.63e-06 1.95e-08 1.06 1.04-1.08 KIAA1109 intron variant g: IBD, T1D, UC
5 133422816 rs244689 A G 0.16 5.99e-06 6.65e-09 1.04 1.03-1.06 intergenic variant
5 150438477 rs4958880 A C 0.19 8.15e-07 1.97e-13 1.05 1.04-1.06 TNIP1 intron variant PSO,PSA
6 27023081 rs12215241 A G 0.20 3.61e-04 3.36e-08 1.04 1.02-1.05 intergenic variant SCZ, p: T1D
6 106569270 rs802791 T C 0.31 3.78e-05 1.12e-08 1.03 1.02-1.05 intergenic variant IgAD, p: SLE
6 36350605 rs881648 T C 0.14 5.28e-08 5.56e-11 0.95 0.94-0.97 ETV7 intron variant p: RA
8 129540464 rs16903065 A C 0.10 5.51e-07 1.48e-09 0.95 0.93-0.97 RP11-
89M16.1
intron & non coding
transcript variant
p: ovarian cancer
8 11351019 rs4840568 A G 0.27 8.89e-07 3.18e-14 1.05 1.03-1.06 BLK upstream gene variant RA (mixed), p:SLE
12 111884608 rs3184504 T C 0.46 3.02e-07 5.25e-12 1.04 1.03-1.05 SH2B3 missense variant JIA,T1D, p:RA(mixed)
Chr: Chromosome; MAF; Minor Allele Frequency; MTAG: Multi-Trait Analysis of GWAS; OR: Odds Ratio; CI: Confidence Interval; &: and; g: gene associated with;
SLE: Systemic Lupus Erythematosus; CD; Crohn’s Disease; MS: Multiple Sclerosis; p: proxy SNP to the reported SNP associated with; IBD: Inflammatory Bowel Disease;
PBC: Primary Biliary Cirrhosis/Cholangitis; RA: Rheumatoid Arthritis; SCZ: Schizophrenia; T1D: Type 1 Diabetes; UC: Ulcerative Colitis; PSO: Psoriasis; PsA: Psoriatic Arthritis;
IgAD: Immunoglobulin A Deficiency; mixed: mixed populations (Europeans and Asians); JIA: Juvenile Idiopathic Arthritis
The Associated Traits have been detected using PhenoScanner (version 1.1) with parameters catalogue: GWAS, p-value cut-off: 5e-08, proxies: Yes; r-squared: 0.8
Novel loci are presented with bright purple

287
Appendix Table 9 | MTAG results for RA
Chr Position rsid effect
allele
other
allele
MAF RA
p-value
MTAG
p-value
MTG
OR
MTAG
95% CI
Gene Consequence Associated Trait
14 68747868 rs7148416 T A 0.34 5.31e-07 2.37e-09 0.97 0.96-0.98 RAD51B intron variant RA (mixed), height
18 12779947 rs2542151 G T 0.14 5.83e-08 4.57e-10 1.05 1.03-1.06 RP11-
973H7.1
upstream gene variant RA (mixed), T1D,IBD
21 43843391 rs9980184 A G 0.06 2.83e-07 2.15e-08 0.94 0.92-0.96 UBASH3A intron variant g: RA,T1D, PBC
22 21979096 rs11089637 C T 0.17 5.55e-07 2.09e-14 1.06 1.04-1.07 YDJC downstream gene
variant
RA, CD
Chr: Chromosome; MAF; Minor Allele Frequency; MTAG: Multi-Trait Analysis of GWAS; OR: Odds Ratio; CI: Confidence Interval; &: and; g: gene associated with;
p: proxy SNP to the reported SNP associated with; RA: Rheumatoid Arthritis; SLE: Systemic Lupus Erythematosus; mixed: mixed populations (Europeans and Asians);
CAD: Cardiac Artery Disease; MI: Myocardial Infraction; JIA: Juvenile Idiopathic Arthritis; T2D: Type 2 Diabetes; CD; Crohn’s Disease; UC: Ulcerative Colitis; SCZ: Schizophrenia
The Associated Traits have been detected using PhenoScanner (version 1.1) with parameters catalogue: GWAS, p-value cut-off: 5e-08, proxies: Yes; r-squared: 0.8
Novel associations are presented with bright purple

288
AS loci identified with MTAG
The power gain to detect additional genome-wide significant loci in AS was only 3%
using MTAG which is obvious from Appendix Table 10. Only one novel locus was
identified; TDRD10 (rs4845639, OR 0.92, p = 2.15e-08) which was found to be
protective for AS
The Manhattan plot depicted the association results for both AS GWAS and MTAG
analysis can been in Appendix Figure 12.
Appendix Figure 12 | Manhattan plot of association results for AS. Each circle presents the − 𝐥𝐨𝐠𝟏𝟎(𝒑) of the variants. The thresholds of suggestive (p-value = 1e-06) and genome-wide significance (p-value = 5e-08) are delineated with blue and red lines, respectively. The plot includes SNPs that were significant in both GWAS and MTAG.

289
Appendix Table 10 | MTAG results for AS
Chr Position rsid effect
allele
other
allele
MAF AS
p-value
MTAG
p-value
MTG
OR
MTAG
95% CI
Gene Consequence Associated Trait
1 154490352 rs4845639 C T 0.41 1.25e-07 2.15e-08 0.92 0.90-0.95 TDRD10 intron variant p: IL 6 levels
Chr: Chromosome; MAF; Minor Allele Frequency; MTAG: Multi-Trait Analysis of GWAS; OR: Odds Ratio; CI: Confidence Interval; p: proxy SNP to the reported SNP associated with;
IL: Interleukin
The Associated Traits have been detected using PhenoScanner (version 1.1) with parameters catalogue: GWAS, p-value cut-off: 5e-08, proxies: Yes; r-squared: 0.8
Novel association is presented with bright purple

290
Appendix Figure 13, Appendix Figure 14, Appendix Figure 15 and Appendix Figure 16
are forest and leave-one-out plots produced when assessing the causal role of BMI on
PsA using both GIANT and UK Biobank datasets for BMI. The plots are used in
Mendelian Randomization to visually check the validity of the instrumental variables,
the existence of any outliers and the presence of pleiotropy.
Appendix Figure 13 | Forest plot of BMI (GIANT) on PsA using Wald ratio for each IVW. The MR estimate using all SNP using IVW is shown with red.

291
Appendix Figure 14| Leave-one-out-plot for BMI (GIANT) on PsA. Each black point represents the MR analysis using IVW excluding the particular SNP. The overall effect using all SNPs is shown with red.

292
Appendix Figure 15 | Forest plot of BMI (UK Biobank) on PsA using Wald ratio for each IVW. The MR estimate using all SNP using IVW is shown with red.

293
Appendix Figure 16 | Leave-one-out-plot for BMI (UK Biobank) on PsA. Each black point represents the MR analysis using IVW excluding the particular SNP. The overall effect using all SNPs is shown with red.