Embed Size (px)
Citation preview

REPUBLIC OF LIBERIALIBERIA INSTITUTE
OF STATISTICS &
GEO-INFORMATION SERVICES
STATISTICALBULLETINSTATISTICALBULLETIN
VOL. 3 NO. 01
MONROVIA, LIBERIA, DECEMBER 2011

STATISTICAL
BULLETIN
REPUBLIC OF LIBERIALIBERIA INSTITUTE
OF STATISTICS &
GEO-INFORMATION SERVICES
VOLUME THREE
NO. 01
MONROVIA, LIBERIA, DECEMBER 2011.
Statistical Bulletin, Monrovia, Liberia. December 2011 1
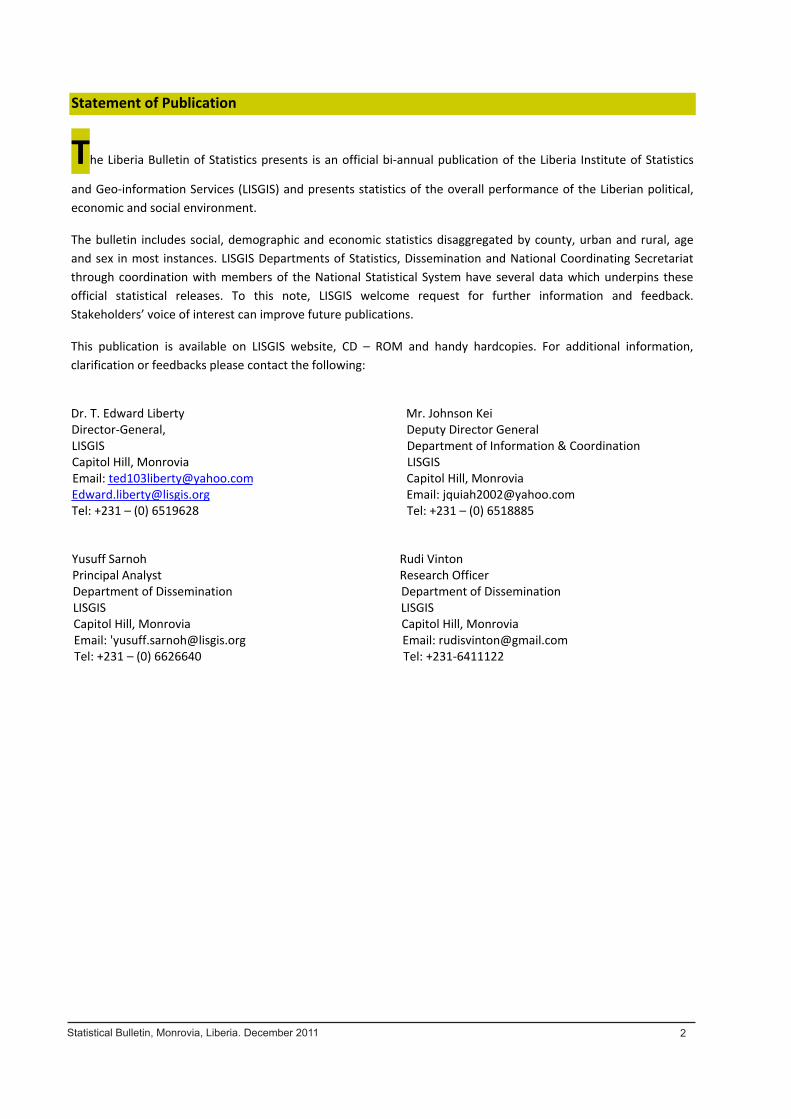
Statement of Publication
The Liberia Bulletin of Statistics presents is an official bi annual publication of the Liberia Institute of Statistics
and Geo information Services (LISGIS) and presents statistics of the overall performance of the Liberian political,economic and social environment.
The bulletin includes social, demographic and economic statistics disaggregated by county, urban and rural, ageand sex in most instances. LISGIS Departments of Statistics, Dissemination and National Coordinating Secretariatthrough coordination with members of the National Statistical System have several data which underpins theseofficial statistical releases. To this note, LISGIS welcome request for further information and feedback.Stakeholders’ voice of interest can improve future publications.
This publication is available on LISGIS website, CD – ROM and handy hardcopies. For additional information,clarification or feedbacks please contact the following:
Dr. T. Edward Liberty Mr. Johnson KeiDirector General, Deputy Director GeneralLISGIS Department of Information & CoordinationCapitol Hill, Monrovia LISGISEmail: [email protected] Capitol Hill, [email protected] Email: [email protected]: +231 – (0) 6519628 Tel: +231 – (0) 6518885
Yusuff Sarnoh Rudi VintonPrincipal Analyst Research OfficerDepartment of Dissemination Department of DisseminationLISGIS LISGISCapitol Hill, Monrovia Capitol Hill, MonroviaEmail: '[email protected] Email: [email protected]: +231 – (0) 6626640 Tel: +231 6411122
Statistical Bulletin, Monrovia, Liberia. December 2011 2
Acknowledgement
The 2011 Liberia Bulletin of Statistics was prepared under the overall umbrella of the 18 members Ministries and
Agencies of the National Statistical System (NSS) coordinated by LISGIS through it secretariat for coordinating TheNational Strategy for the Development of Statistics. LISGIS Department of Dissemination through its PrincipalAnalyst Yusuff Sarnoh and Research Officer Rudi Vinton and UNDP technical representation through ResearchAssociate Wellington Jah and MDGs and Development Information Specialist Abdulai Jalloh coordinated thetechnical compilation of the Liberia Bulletin of Statistics – 2011.
It was prepared under the overall guidance of Dr. T. Edward Liberty, Director General, LISGIS, Mr. Francis Wreh,Deputy Director of Statistics and Mr. Johnson Q. Kei, Deputy Director, Department of Dissemination. The jointNSDS working team validated the data.
We acknowledge the overall materials and logistical support provided by UNDP through it Strategy and Policy Unit.We also recognized the contribution of the African Development Bank through it technical arm Avo Njosa for theadvisory role to this publication.
The NSDS joint working team comprised key staff from various units of statistics across the following line ministriesand agencies:
Ministry of Public Works, Ministry of Finance, Central Bank of Liberia, Ministry of Planning and Economic Affairs,Ministry of Commerce and Industries, Ministry of Education, Ministry of Internal Affairs, Ministry of Labour,Ministry of Transport, Ministry of Health and Social Welfare, Ministry of Agriculture, Bureau of Immigration andNaturalization, Ministry of Gender, Liberia Water and Sewer Corporation, Liberian Refugee Repatriation andResettlement Commission, the University of Liberia and Civil Service Agency.
Statistical Bulletin, Monrovia, Liberia. December 2011 3
Table of Content
Foreword ………………………………………………………………………………………………………Acknowledgement ………………………………………………………………………………………..Abbreviations and Acronyms ……………………………………………………………………….Introduction ………………………………………………………………………………………………….General Notes ………………………………………………………………………………………………1.0: Social Demographic Indicators1.1: Population, Surface Area and Density (1984 and 2008)1.2: Population Distribution by County and District
1.2.1: Age group distribution of the population by county and sex, Liberia 20081.3: Labour Force
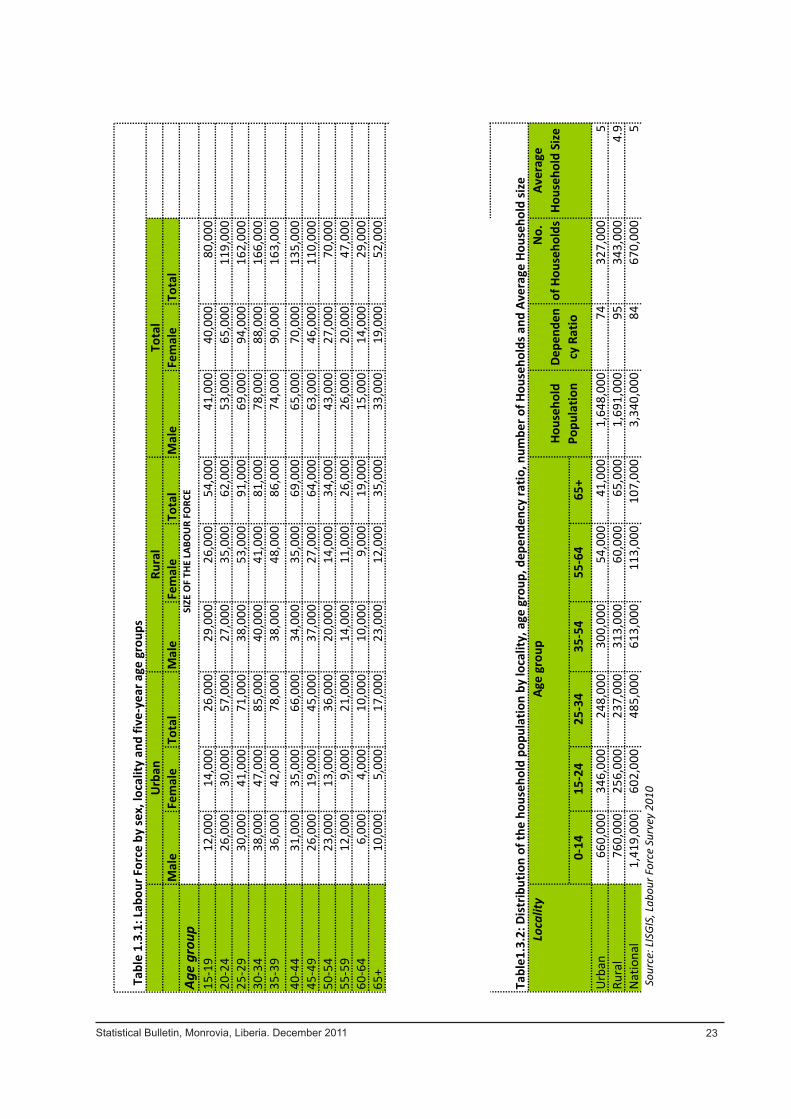
1.3.1: Labour Force by sex, locality and five year age groups1.3.2: Distribution of the household population by locality, age group, dependency ratio, number ofHouseholds and Average Household size1.3.3: Status in employment (persons aged 15 and over)1.3.4: Labour market indicators: various ratios1.3.5: Employed males aged 15 and above by sex, county and main occupation1.3.6: Employed females aged 15 and above by sex, county and main occupation1.3.7: Employed persons aged 15 and over by sex, county and main occupation both sexes
1.4: Gender Dimension of Population1.4.1: Distribution of household headship by gender, urban rural residence and county1.4.2: Distribution of household headship by gender and house ownership1.4.3: Essential assets deficiency by gender and county1.4.4: Distribution of female and male headed households by household size and place of residence1.4.5: Type of dwelling by gender of household head and county
1.5: Education Statistics1.5.1: Gross enrollment in primary school by county, level, sex and proprietor, 2007/20081.5.2: Gross enrollment in primary school by county, level, sex and proprietor, 2008/20091.5.3: Gross enrollment in junior high school by county, level, sex and proprietor, 2007/20081.5.4: Gross enrollment in junior high school by county, level, sex and proprietor, 2008/20091.5.5: Gross enrollment in senior high school by county, level, sex and proprietor, 2007/20081.5.6: Gross enrollment in senior high school by county, level, sex and proprietor, 2008/2009 1.5.7: Estimates of Primary School Level Net and Gross Enrollment Rates by County and Sex, 2007/20081.5.8: Estimates of junior school level net and gross enrollment rates by county and sex, 2007/20081.5.9: Estimates of senior school level net and gross enrollment rates by county and sex, 2007/20081.5.10: Estimates of primary school level net and gross enrollment rates by county and sex, 2008/20091.5.11: Estimates of junior school level net and gross enrollment rates by county and sex, 2008/20091.5.12: Estimates of senior school level net and gross enrollment rates by county and sex, 2008/20091.5.13: Estimates of primary level net and gross intake rates by county and sex, 2008/20091.5.14: Estimates of junior high level net and gross intake rates by county and sex, 2008/20091.5.15: Estimates of senior high level net and gross intake rates by county and sex, 2008/20091.5.16: Estimates of primary level net and gross completion rates by county and sex, 2008/20091.5.17: Estimates of junior high level net and gross completion rates by county and sex, 2008/2009
Statistical Bulletin, Monrovia, Liberia. December 2011 4
1.5.18: Estimates of senior high level net and gross completion by county and sex, 2008/20091.5.19: Distribution of pupil to teacher ratio (PTR) by county and level, 2007 20091.5.20: Enrolment of institutions granting baccalaureate degree by sex, age and classes
1.6: Health statistics1.6.1: Total health facility status by county, 2006 and 20111.6.2: Total health facility status by county, 2006 and 20111.6.3: Health facility by county and type, 2006 and 20101.6.4: Population health worker ratio (per 1,000) by county and by cadre, 20091.6.5: In patient admissions by county, 20101.6:7: Gender breakdown by cadre, 20091.6.6: Selected under –five diseases by county, 2010
2.0 Economic statistics2.1: Liberia sectoral origin of GDP at current prices2.2: Liberia sectoral origin of G.D.P at Constant Price
2.2.1: World outlook/project (GDP % change)2.3.1: Export by HS Code eight digit, product description and FOB value, 20102.3.2: Export by HS Code two digit, all product, FOB Value, 20092.3.3: Export by reference month, 2009 20102.3.4: Export by HS Code, all countries of destination, FOB Value, 20102.3.5: Re export by reference month and value, 20102.3.6: Export by HS Code, all countries of destination, FOB value, 20092.3.7: Export by HS Code two digit, all product, FOB value, 20092.3.8: FOB value of export by countries, 20082.4.1: Import by reference month, 2009 – 20102.4.2: Import by HS Code, all countries of origin, CIF value, 20102.4.3: Import by HS Code, all countries of origin, CIF value, 20092.4.3: Import by HS Code, all countries of origin, CIF value, 20082.4.5: Commodity composition of imports
2.5: External Trade2.6: Harmonized consumer price index (HCPI) by major group2.7: Key Agricultural Production of Liberia3.1: Money Supply & Broad Money
3.2.1: Liberia banking system monetary survey3.2.2: Liberia accounts of the Central Bank3.2.3: Liberia accounts of deposit money banks
3.3: Year on year rate of exchange3.4: Interest Rate of Liberia, 2002 20103.5: External and domestic debt3.6: Year on year rate of inflation, 2002 20114.0: Millennium Development Goals5.0: Transportation and other indicators of Liberia5.1: Number of monthly licenses issued, 20095.2: Number of vehicle registration5.3: Production and consumption performance indicator5.4.: The number of structures affected by fire, their occupants, casualty, injury and estimated losses by month,2007, 2008 and 2010
Statistical Bulletin, Monrovia, Liberia. December 2011 5
5.4.1: Number of fire according to dollar loss, by type of property, 20085.4.2: Fire outbreaks according to category by month, 2007 2008
5.5: Public safety accidents and crimes5.6: Communications number of postal mails5.7: GSM mobile operators and subscribers, 2007 20105.7.1: Mobile Phone Usage in Liberia, 2010
Statistical Bulletin, Monrovia, Liberia. December 2011 6
Foreword
Timely and reliable statistics are considered essential for evidence based policy or decision making and for
better support to policy implementation, monitoring progress and evaluation of outcomes and impacts ofdevelopment initiatives such as the Poverty Reduction Strategies (PRSs), County Development Agenda (CDA) andthe Millennium Development Goals (MDGs). These initiatives have accordingly resulted in an unprecedentedincrease in demand for statistics as policy makers and other stakeholders seek information to improve on nationaland international developments. Critical to achieve development results is the ability to measure and closelymonitor progress. This is in line with the commitment made by developing countries, including Liberia as will beseen in the coming years, when the country will fully be involved in managing for results.
Lack of data availability continues to be one of the major challenges to successful implementation of developmentprograms as monitoring becomes skewed while results had been in most instances far from actuality. It is expectedthat this second publication will respond to data needs of stakeholders and other international initiatives aimed atpromoting economic and socio development to which Liberia has committed herself. Measurement makesmanagement easier.
The joint collection and sharing of information among actors in Liberia National Statistical System to ensure thispublication is produced signals the level of progress made in coordinating statistics in Liberia as outlined in theNational Strategy for Development of Statistics (NSDS). The improvement is expected to lead to better monitoringof development results over the coming years as Liberia drives to middle income status.
The first post conflict issue was to set the pace. The level of improvement and coordination within the NSS explainsthe collaboration in producing a National Dissemination Policy upon which this issue and all other future issues willbe principled. We are confident that this year bulletin of statistics and it related databases, from which it isgenerated, will become key repositories for providing development information across Liberia. It is thereforeincumbent upon all data users and providers to act in accordance with the National Data Dissemination Policy toensure Liberia fill data gaps to enhance it positioning nationally and worldwide.
Dr. T. Edward LibertyDirector General,Liberia Institute of Statistics & Geo Information ServicesCapitol HillMonrovia, Liberia
Statistical Bulletin, Monrovia, Liberia. December 2011 7
Teaching Staff at specific levelTeachers are defined as persons whose professional activity involves the transmitting of knowledge, attitudes andskills that stipulated in formal curriculum programme to students enrolled in a formal educational institution atspecific level (primary, secondary or tertiary).
Student enrolment at specific levelFirst level student enrolment is the number of pupils enrolled at the primary level of education, considering boys,girls and by county regardless of age. Second level student Enrolment is the total number of students enrolled atthe secondary level of education, considering boys, girls and by county regardless of age.
Pupil Teacher ratioPupil teacher ratio is the average number of pupils (students) per teacher at a specific level of education in a givenschool year.
II. ECONOMIC STATISTICS
This section provides information on national accounts. National accounts data provide essential information on theeconomic performance of in terms of growth and structure of output, investments and savings. National accounts dataare still being published by the World Bank and IMF and by the Central Bank in some instances using the 1993 System ofNational Account (SNA).
Gross Domestic Product (GDP)GDP measures the total final output of goods and services produced by a national economy within a year, excludingprovisions for depreciation. When all the components of GDP are valued at current prices in the market at the time anddoes not takes inflation into account, they are referred to as nominal gross domestic product or GDP at Current prices.The production of goods and services separate from any changes that may occur in the economy during year is GDP atconstant prices or Real GDP
GDP by kind of economic activity (by sector)GDP by sector gives value added by the broad categories of the ISIC classification. Value added is evaluated at basicprices or factor cost or at producer prices depending on the current practice in the country. Data is provided at currentprices and in terms of growth rates over the previous year based on data at constant prices.
Expenditure on GDPGeneral Government final consumption General Government final consumption expenditure comprises all currentexpenditure for purchases of goods and services by all levels of government, as well as capital expenditure on nationaldefense and security.
Private final consumptionHousehold final consumption expenditure represents the final consumption of households and non profit institutions. Itincludes imputed rent for owner occupied dwellings but excludes purchases of dwellings and it also includes anystatistical discrepancy. Gross capital formation consists of gross domestic fixed capital formation plus net changes in thelevel of inventories.Exports and imports of goods and servicesRefer to the value of goods and non factor services provided to or from the rest of the world. They do not includereceipts and payments for factor services such as investment income, interest and labor income. The data are generallyestimated on the basis of foreign trade statistics and are not directly comparable with those from the balance ofpayments.
Harmonized Index of Consumer
General Note
The statistics presented in this publication are as far as possible in accordance with International
recommendations and definitions. In any instances where there is deviation from standards, footnotes areindicated and further explanations are provided.
I. SOCIAL AND DEMOGRAPHIC INDICATORS
Data presented in this section, are derived mainly from the following publications: Liberia National Population andHousing Census (NPHC) 1984 and 2008. Liberia 2010 Labor Force survey1 and the 2010 Liberia school censusreport. Data presented generally relate to the public (official) and private (independent) as well as community andMissions schools (Church own Borden schools). The levels of schooling are categorized into Primary, Junior Highand Secondary schools in most cases. The indicated years refer to the beginning of school year. In most instancesthe statistics are disaggregated by county, major districts, sex and age distribution.
Population by age groupsIn most instances three age groups are used in order to highlight the proportion of active population vis à vis thedependant population. Population aged 15 64 is the number of people who could potentially be economicallyactive, excluding children. This publication group ages by 5 years to strike the effect of age differences by sex andcounty.
Economically active populationThe economically active population comprises all employed and unemployed persons (including those seeking jobsfor the first time). It covers employers, persons working on their own account, salaried employees, wage earners,unpaid family workers, members of producers’ co operatives and members of the armed forces.
Life expectancy, Crude birth and death ratesLife expectancy at birth is the average number of years a newborn infant would live if prevailing patterns ofmortality of the total population at the time of his/her birth were to stay the same throughout his/her life. Crudebirth and death rates represent the number of live births and the number of deaths respectively per 1000 people.Death is the permanent disappearance of all evidence of life at any time after live birth has taken place (postnatalcessation of vital functions without capability of resuscitation). This definition excludes fetal deaths.
Net reproduction rateThe net reproduction rate is the average number of daughters that would be born to a woman if she passedthrough her lifetime conforming to the age specific fertility and mortality rates of a given year. This rate is similarto the gross reproduction rate but takes into account that some women will die before completing theirchildbearing years.
Total fertility rateThe total fertility rate is the average number of children that would be born per woman if she experiences nomortality and were subject to a given set of age specific fertility throughout her lifetime.
1The 2010 Labour Force Survey report is available and use in major publication and pending official launch after the 2011 Presidential election.
The importance to this launch center around the unveiling circumstances and importance of this publication since the establishment of Liberiaas a country.
Statistical Bulletin, Monrovia, Liberia. December 2011 8
Teaching Staff at specific levelTeachers are defined as persons whose professional activity involves the transmitting of knowledge, attitudes andskills that stipulated in formal curriculum programme to students enrolled in a formal educational institution atspecific level (primary, secondary or tertiary).
Student enrolment at specific levelFirst level student enrolment is the number of pupils enrolled at the primary level of education, considering boys,girls and by county regardless of age. Second level student Enrolment is the total number of students enrolled atthe secondary level of education, considering boys, girls and by county regardless of age.
Pupil Teacher ratioPupil teacher ratio is the average number of pupils (students) per teacher at a specific level of education in a givenschool year.
II. ECONOMIC STATISTICS
This section provides information on national accounts. National accounts data provide essential information on theeconomic performance of in terms of growth and structure of output, investments and savings. National accounts dataare still being published by the World Bank and IMF and by the Central Bank in some instances using the 1993 System ofNational Account (SNA).
Gross Domestic Product (GDP)GDP measures the total final output of goods and services produced by a national economy within a year, excludingprovisions for depreciation. When all the components of GDP are valued at current prices in the market at the time anddoes not takes inflation into account, they are referred to as nominal gross domestic product or GDP at Current prices.The production of goods and services separate from any changes that may occur in the economy during year is GDP atconstant prices or Real GDP
GDP by kind of economic activity (by sector)GDP by sector gives value added by the broad categories of the ISIC classification. Value added is evaluated at basicprices or factor cost or at producer prices depending on the current practice in the country. Data is provided at currentprices and in terms of growth rates over the previous year based on data at constant prices.
Expenditure on GDPGeneral Government final consumption General Government final consumption expenditure comprises all currentexpenditure for purchases of goods and services by all levels of government, as well as capital expenditure on nationaldefense and security.
Private final consumptionHousehold final consumption expenditure represents the final consumption of households and non profit institutions. Itincludes imputed rent for owner occupied dwellings but excludes purchases of dwellings and it also includes anystatistical discrepancy. Gross capital formation consists of gross domestic fixed capital formation plus net changes in thelevel of inventories.Exports and imports of goods and servicesRefer to the value of goods and non factor services provided to or from the rest of the world. They do not includereceipts and payments for factor services such as investment income, interest and labor income. The data are generallyestimated on the basis of foreign trade statistics and are not directly comparable with those from the balance ofpayments.
Harmonized Index of Consumer
Statistical Bulletin, Monrovia, Liberia. December 2011 9
A list of the final costs paid by consumers for items in a basket of common goods. The Harmonized Index ofConsumer Prices (HICP) is produced to help measure inflation and to guide government in the formulationmonetary policy. The index tracks the prices of goods such as food and non alcoholic beverages, alcoholicbeverages, tobacco & narcotics, clothing & footwear, housing, water, electricity, gas, other fuel etc taken fromMonrovia prices.
Key Agricultural productionThe agricultural production is based mainly on information from the online database of the Central Bank of Liberia(CBL) and on listings (commodity basis) prepared by the Ministry of Agriculture. The five major crops produced bythe country are obtained by calculating the average yearly production of each crop produced by metric tons.
External TradeInternational trade is the exchange of goods and services between countries. This type of trade gives rise to a world economy, in which prices, or supply and demand, affect and are affected by global events.
III. FINANCIAL AND MONETARY STATISTICS
Data in this section are mainly gathered from the Central Bank of Liberia, Ministry of Finance and the IMF.
Money supplyComprise transferable deposits and currency outside deposit of banks.
Net foreign assetsNet foreign assets equal the sum of foreign assets, less the sum of foreign liabilities of monetary authorities and depositmoney banks.
Exchange ratesExchange rates are expressed in national currency unit (Liberian Dollars) per US dollar unit and are reported as end ofperiod and period averages of market exchange rates and official rates. The market rate is defined as the ratedetermined largely by market forces; and the official rate is determined by the authorities.
InflationMeasured the annual percent changes in Consumer price index. Consumer price index (CPI) shows the cost of acquisitionof a basket of goods and services purchased by the average consumer. Weights for the computation of the indexnumbers are obtained from household budget surveys. CPI data are provided by the national statistical systems, mainlyby the national bureau of statistics or Central banks.
External DebtExternal Debt (total outstanding debt) is the amount, at any given time, of disbursed and outstanding contractualliabilities of residents of a country to non residents to repay principal, with or without interest, or to pay interest with orwithout principal. It is the sum of public and publicly guaranteed short and long term debt, private non guaranteed shortand long term debt and the use of IMF credit.
Domestic creditDomestic credit includes all domestic assets of the banking system. It is the sum of claims on the centralgovernment (net), on official entities and the private sector. Credit to the private sector is shown separately but asa subset of domestic credit.
IV. Millennium Development Goals:In September 2000, leaders from 189 nations agreed on a vision for the future: a world with less poverty, hungerand disease, greater survival prospects for mothers and their infants, better educated children, equal opportunitiesfor women, and a healthier environment; a world in which developed and developing countries worked inpartnership for the betterment of all.
This vision took the shape of eight Millennium Development Goals, which provide a framework for developmentplanning for countries around the world, and time bound targets by which progress can be measured.
The eight MDGs range from halving extreme poverty to halting the spread of HIV/AIDS and providing universalprimary education, all by the target date of 2015. The individual goals are as follows:
o Eradicate extreme poverty and hungero Achieve universal primary educationo Promote gender equality and empower womeno Reduce child mortalityo Improve maternal healtho Combat HIV/AIDS, malaria and other diseaseso Ensure environmental sustainabilityo Develop a global partnership for development.
Liberia MDGs indicators were gathered from LISGIS through various government agencies responsible for ensuringthe goals are achieved.
A list of the final costs paid by consumers for items in a basket of common goods. The Harmonized Index ofConsumer Prices (HICP) is produced to help measure inflation and to guide government in the formulationmonetary policy. The index tracks the prices of goods such as food and non alcoholic beverages, alcoholicbeverages, tobacco & narcotics, clothing & footwear, housing, water, electricity, gas, other fuel etc taken fromMonrovia prices.
Key Agricultural productionThe agricultural production is based mainly on information from the online database of the Central Bank of Liberia(CBL) and on listings (commodity basis) prepared by the Ministry of Agriculture. The five major crops produced bythe country are obtained by calculating the average yearly production of each crop produced by metric tons.
External TradeInternational trade is the exchange of goods and services between countries. This type of trade gives rise to a world economy, in which prices, or supply and demand, affect and are affected by global events.
III. FINANCIAL AND MONETARY STATISTICS
Data in this section are mainly gathered from the Central Bank of Liberia, Ministry of Finance and the IMF.
Money supplyComprise transferable deposits and currency outside deposit of banks.
Net foreign assetsNet foreign assets equal the sum of foreign assets, less the sum of foreign liabilities of monetary authorities and depositmoney banks.
Exchange ratesExchange rates are expressed in national currency unit (Liberian Dollars) per US dollar unit and are reported as end ofperiod and period averages of market exchange rates and official rates. The market rate is defined as the ratedetermined largely by market forces; and the official rate is determined by the authorities.
InflationMeasured the annual percent changes in Consumer price index. Consumer price index (CPI) shows the cost of acquisitionof a basket of goods and services purchased by the average consumer. Weights for the computation of the indexnumbers are obtained from household budget surveys. CPI data are provided by the national statistical systems, mainlyby the national bureau of statistics or Central banks.
External DebtExternal Debt (total outstanding debt) is the amount, at any given time, of disbursed and outstanding contractualliabilities of residents of a country to non residents to repay principal, with or without interest, or to pay interest with orwithout principal. It is the sum of public and publicly guaranteed short and long term debt, private non guaranteed shortand long term debt and the use of IMF credit.
Domestic creditDomestic credit includes all domestic assets of the banking system. It is the sum of claims on the centralgovernment (net), on official entities and the private sector. Credit to the private sector is shown separately but asa subset of domestic credit.
Statistical Bulletin, Monrovia, Liberia. December 2011 10
IV. Millennium Development Goals:In September 2000, leaders from 189 nations agreed on a vision for the future: a world with less poverty, hungerand disease, greater survival prospects for mothers and their infants, better educated children, equal opportunitiesfor women, and a healthier environment; a world in which developed and developing countries worked inpartnership for the betterment of all.
This vision took the shape of eight Millennium Development Goals, which provide a framework for developmentplanning for countries around the world, and time bound targets by which progress can be measured.
The eight MDGs range from halving extreme poverty to halting the spread of HIV/AIDS and providing universalprimary education, all by the target date of 2015. The individual goals are as follows:
o Eradicate extreme poverty and hungero Achieve universal primary educationo Promote gender equality and empower womeno Reduce child mortalityo Improve maternal healtho Combat HIV/AIDS, malaria and other diseaseso Ensure environmental sustainabilityo Develop a global partnership for development.
Liberia MDGs indicators were gathered from LISGIS through various government agencies responsible for ensuringthe goals are achieved.
Statistical Bulletin, Monrovia, Liberia. December 2011 11
Introduction
The 2011 Liberia Bulletin of Statistics which is the second edition published since Liberia post crises is a result of
joint efforts by various line ministries and agencies, including our international partners who were instrumental inproviding socioeconomic data on various sectors of the country. The Liberia Bulletin of Statistics is meant toprovide key national data that could be used by policy makers, researchers, etc., and to heighten data providers,producers and users about the essentially of statistic to development in Liberia.
Previously, data limitations were immense while ministries and agencies of government in Liberia providedindividual disharmonized data thus lacking credibility for policy making. The current collaboration of the NSDSsector institutions has greatly improved the collection, validation and publishing of national data.
The data in this issue of the Liberia Bulletin of Statistics are arranged mostly for the year 2005 to 2011. Howeversome data are available for periods before the years stipulated. The bulletin is published in one volume consistingof general notes and summary tables.
The summary tables are presented in sections and comprise demographic data such as population size, labor,gender dimension, education and health; economic data including external trade; monetary statistics and inflation;Millennium Development Goals; and finally other data such as transportation, water production andconsumption, fire disaster, accident, crime and communications.
Statistical Bulletin, Monrovia, Liberia. December 2011 12
Area1984* 2008 Percent 1984* Percent 2008 Square Mile 1984* 2008
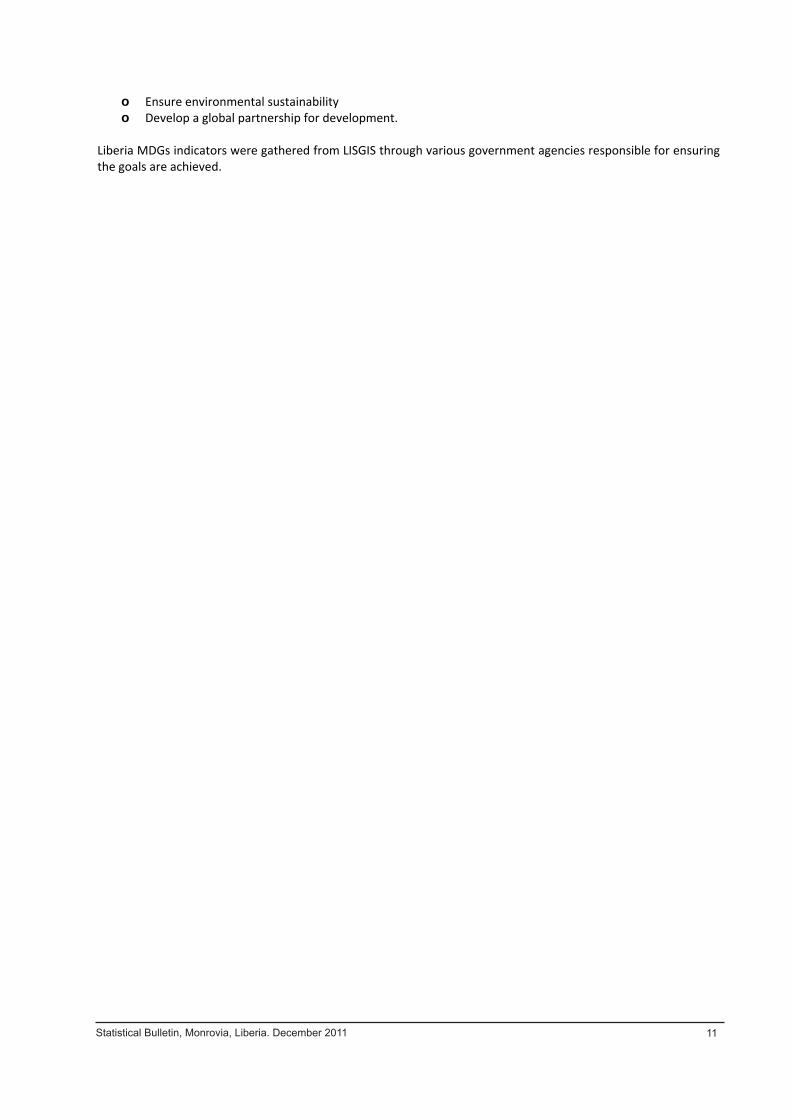
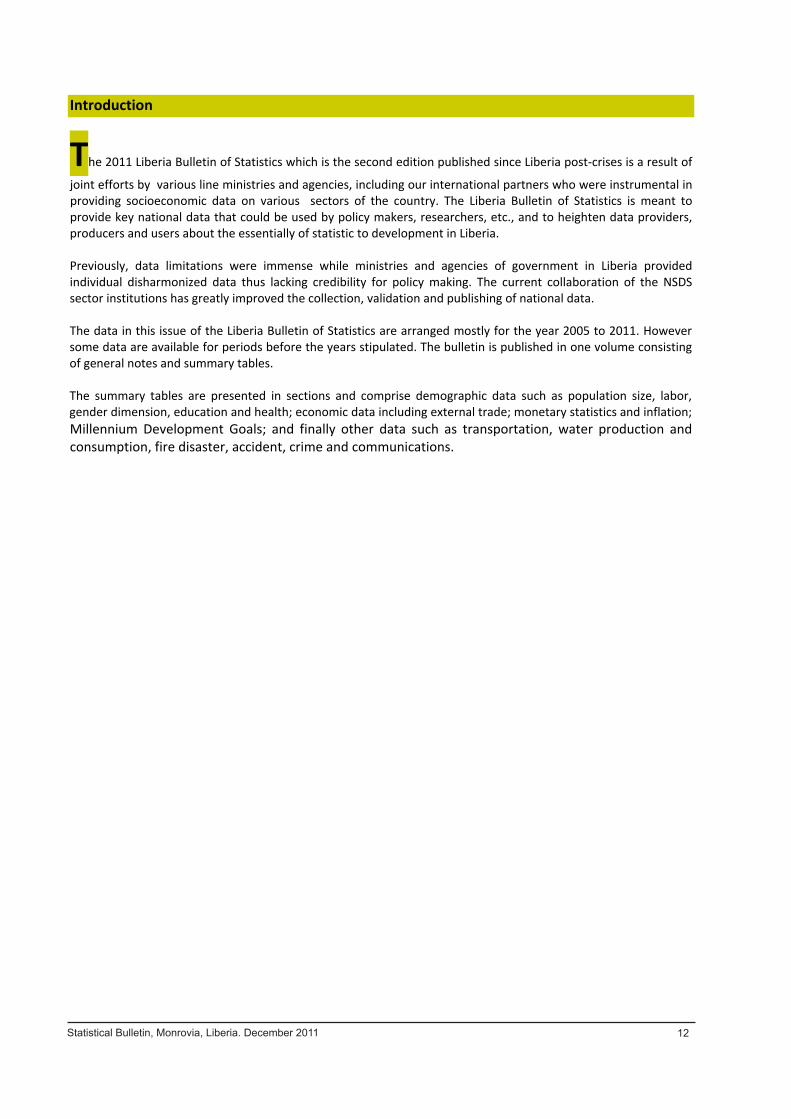
Bomi 66,420 84,119 3.2 2.4 746 89 113Bong 255,813 333,481 12.2 9.6 3,380 76 99Gbarpolu 48,399 83,388 2.3 2.4 3,843 13 22Grand Bassa 159,648 221,693 7.6 6.4 3,017 53 73Grand Cape Mount 79,322 127,076 3.8 3.7 1,846 43 69Grand Gedeh 63,028 125,258 3.0 3.6 4,191 15 30Grand Kru 62,791 57,913 3.0 1.7 1,504 42 39Lofa 199,242 276,863 9.5 8.0 3,854 52 72Margibi 151,792 209,923 7.2 6.0 1,039 146 202Maryland 69,267 135,938 3.3 3.9 887 78 153Montserrado 491,078 1,118,241 23.4 32.2 726 676 1,540Nimba 313,050 462,026 14.9 13.3 4,460 70 104Rivercess 37,849 71,509 1.8 2.1 2,183 17 33River Gee 39,782 66,789 1.9 1.9 1,974 20 34Sinoe 64,147 102,391 3.1 2.9 3,770 17 27NATIONAL TOTAL 2,101,628 3,476,608 100.0 100.0 37,420 56 93Source: LISGIS, 2008 National Population and Housing Census
Grand Cape Mount
1.0: Social Demographic Indicators
Table 1.1: Population, Surface Area and Density (1984 and 2008)Density
CountyPopulation
Page 1 Statistical Bulletin 2011
Area1984* 2008 Percent 1984* Percent 2008 Square Mile 1984* 2008
Bomi 66,420 84,119 3.2 2.4 746 89 113Bong 255,813 333,481 12.2 9.6 3,380 76 99Gbarpolu 48,399 83,388 2.3 2.4 3,843 13 22Grand Bassa 159,648 221,693 7.6 6.4 3,017 53 73Grand Cape Mount 79,322 127,076 3.8 3.7 1,846 43 69Grand Gedeh 63,028 125,258 3.0 3.6 4,191 15 30Grand Kru 62,791 57,913 3.0 1.7 1,504 42 39Lofa 199,242 276,863 9.5 8.0 3,854 52 72Margibi 151,792 209,923 7.2 6.0 1,039 146 202Maryland 69,267 135,938 3.3 3.9 887 78 153Montserrado 491,078 1,118,241 23.4 32.2 726 676 1,540Nimba 313,050 462,026 14.9 13.3 4,460 70 104Rivercess 37,849 71,509 1.8 2.1 2,183 17 33River Gee 39,782 66,789 1.9 1.9 1,974 20 34Sinoe 64,147 102,391 3.1 2.9 3,770 17 27NATIONAL TOTAL 2,101,628 3,476,608 100.0 100.0 37,420 56 93Source: LISGIS, 2008 National Population and Housing Census
Grand Cape Mount
0
200,000
400,000
600,000
800,000
1,000,000
1,200,000
Popu
latio
ns
Counties
Fig. 1 Population Growth by County1984 and 2008
1984*
2008
Page 1 Statistical Bulletin 2011
Statistical Bulletin, Monrovia, Liberia. December 2011 13
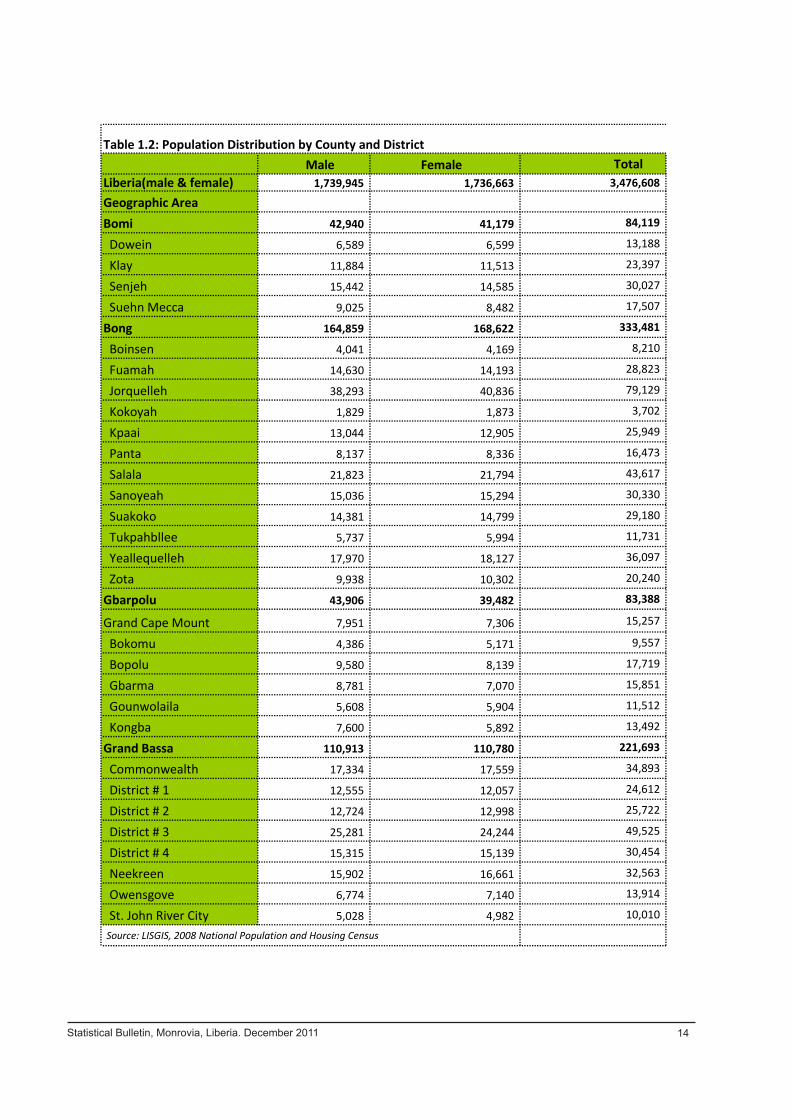
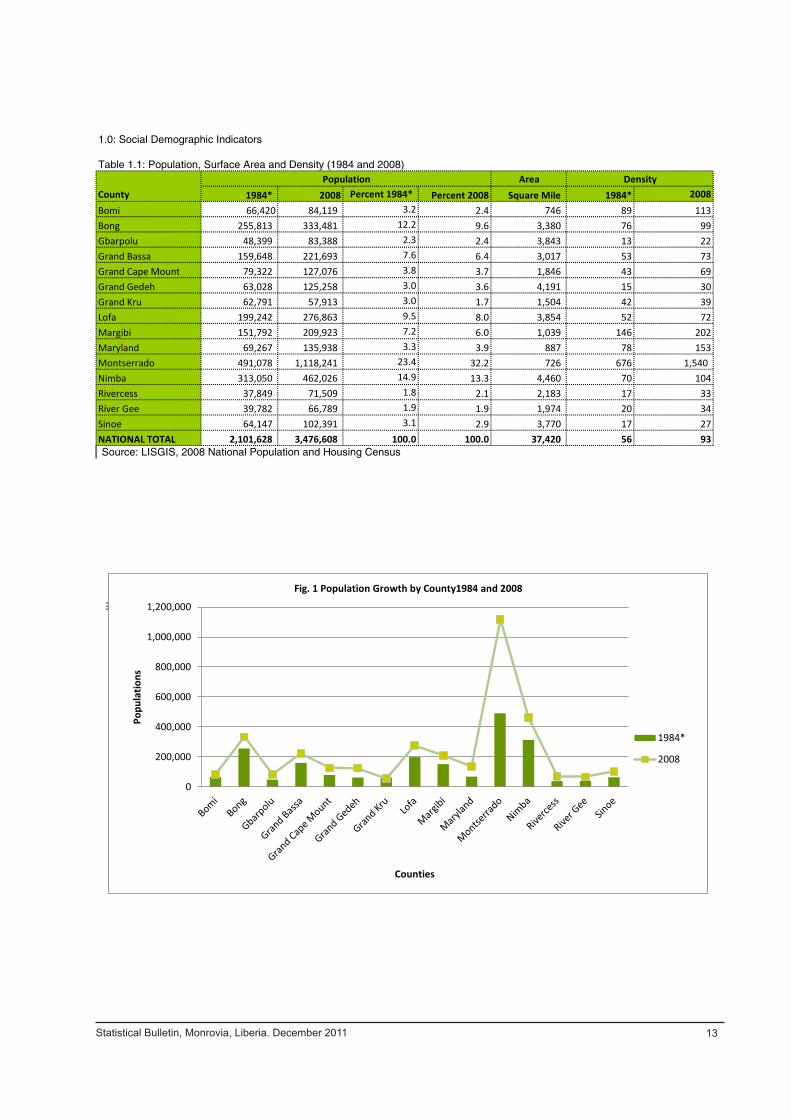
Male Female TotalLiberia(male & female) 1,739,945 1,736,663 3,476,608
Geographic AreaBomi 42,940 41,179 84,119
Dowein 6,589 6,599 13,188
Klay 11,884 11,513 23,397
Senjeh 15,442 14,585 30,027
Suehn Mecca 9,025 8,482 17,507
Bong 164,859 168,622 333,481
Boinsen 4,041 4,169 8,210
Fuamah 14,630 14,193 28,823
Jorquelleh 38,293 40,836 79,129
Kokoyah 1,829 1,873 3,702
Kpaai 13,044 12,905 25,949
Panta 8,137 8,336 16,473
Salala 21,823 21,794 43,617
Sanoyeah 15,036 15,294 30,330
Suakoko 14,381 14,799 29,180
Tukpahbllee 5,737 5,994 11,731
Yeallequelleh 17,970 18,127 36,097
Zota 9,938 10,302 20,240
Gbarpolu 43,906 39,482 83,388
Grand Cape Mount 7,951 7,306 15,257
Bokomu 4,386 5,171 9,557
Bopolu 9,580 8,139 17,719
Gbarma 8,781 7,070 15,851
Gounwolaila 5,608 5,904 11,512
Kongba 7,600 5,892 13,492
Grand Bassa 110,913 110,780 221,693
Commonwealth 17,334 17,559 34,893
District # 1 12,555 12,057 24,612
District # 2 12,724 12,998 25,722
District # 3 25,281 24,244 49,525
District # 4 15,315 15,139 30,454
Neekreen 15,902 16,661 32,563
Owensgove 6,774 7,140 13,914
St. John River City 5,028 4,982 10,010
Source: LISGIS, 2008 National Population and Housing Census
Table 1.2: Population Distribution by County and District
Page 2 Statistical Bulletin 2011
Statistical Bulletin, Monrovia, Liberia. December 2011 14
Male Female Total
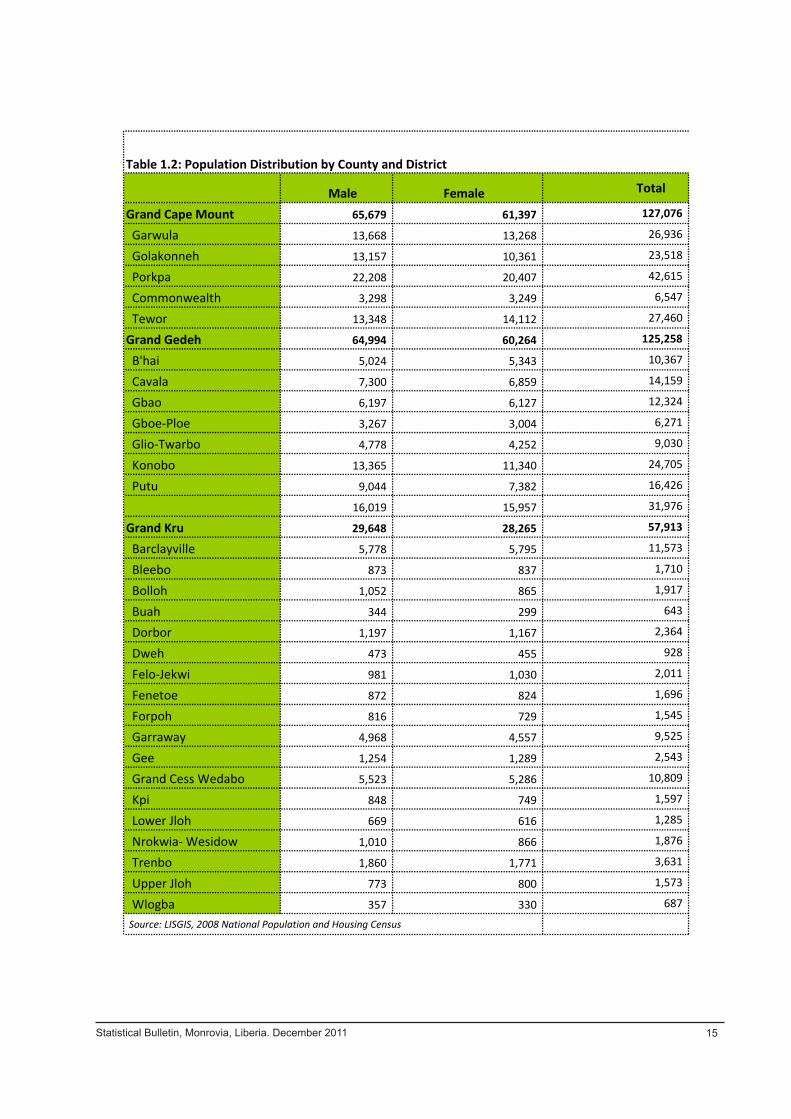
Grand Cape Mount 65,679 61,397 127,076
Garwula 13,668 13,268 26,936
Golakonneh 13,157 10,361 23,518
Porkpa 22,208 20,407 42,615
Commonwealth 3,298 3,249 6,547
Tewor 13,348 14,112 27,460
Grand Gedeh 64,994 60,264 125,258
B'hai 5,024 5,343 10,367
Cavala 7,300 6,859 14,159
Gbao 6,197 6,127 12,324
Gboe-Ploe 3,267 3,004 6,271
Glio-Twarbo 4,778 4,252 9,030
Konobo 13,365 11,340 24,705
Putu 9,044 7,382 16,426
16,019 15,957 31,976
Grand Kru 29,648 28,265 57,913
Barclayville 5,778 5,795 11,573
Bleebo 873 837 1,710
Bolloh 1,052 865 1,917
Buah 344 299 643
Dorbor 1,197 1,167 2,364
Dweh 473 455 928
Felo-Jekwi 981 1,030 2,011
Fenetoe 872 824 1,696
Forpoh 816 729 1,545
Garraway 4,968 4,557 9,525
Gee 1,254 1,289 2,543
Grand Cess Wedabo 5,523 5,286 10,809
Kpi 848 749 1,597
Lower Jloh 669 616 1,285
Nrokwia- Wesidow 1,010 866 1,876
Trenbo 1,860 1,771 3,631
Upper Jloh 773 800 1,573
Wlogba 357 330 687
Source: LISGIS, 2008 National Population and Housing Census
Table 1.2: Population Distribution by County and District
Page 3 Statistical Bulletin 2011
Statistical Bulletin, Monrovia, Liberia. December 2011 15

Geographical Area Male Female TotalLofa 133,611 143,252 276,863
Foya 36,152 37,160 73,312
Kolahun 28,586 31,971 60,557
Quardu Bondi 8,824 9,961 18,785
Salayea 11,399 12,179 23,578
Vahun 8,621 8,516 17,137
Voinjama 20,623 22,167 42,790
Zorzor 19,406 21,298 40,704
Margibi 105,840 104,083 209,923
Firestone 31,228 30,760 61,988
Gibi 7,359 6,891 14,250
Kakata 44,667 44,037 88,704
Mambah Kaba 22,586 22,395 44,981
Maryland 70,855 65,083 135,938
Gwelekpoken 5,370 4,690 10,060
Harper 19,591 18,433 38,024
Karluway #1 4,501 3,993 8,494
Karluway #2 9,429 7,730 17,159
Nyorken 5,319 4,738 10,057
Pleebo/Sodoken 21,884 21,339 43,223
Whojah 4,761 4,160 8,921
Montserrado 549,733 568,508 1,118,241
Careysburg 15,048 14,664 29,712
Commonwealth 5,752 6,124 11,876
Greater Monrovia 476,473 494,351 970,824
St. Paul River 34,981 36,850 71,831
Todee 17,479 16,519 33,998
Nimba 230,113 231,913 462,026
Boe & Quilla 9,163 9,099 18,262
Buu-Yao 20,028 19,979 40,007
Doe 18,122 17,796 35,918
Garr Bain 29,813 31,412 61,225
Gbehlay- Geh 15,859 16,317 32,176
Gbi & Doru 4,152 3,979 8,131
Gbor 5,339 5,536 10,875
Source: LISGIS, 2008 National Population and Housing Census
Table 1.2: Population Distribution by County and District
Page 4 Statistical Bulletin 2011
Statistical Bulletin, Monrovia, Liberia. December 2011 16
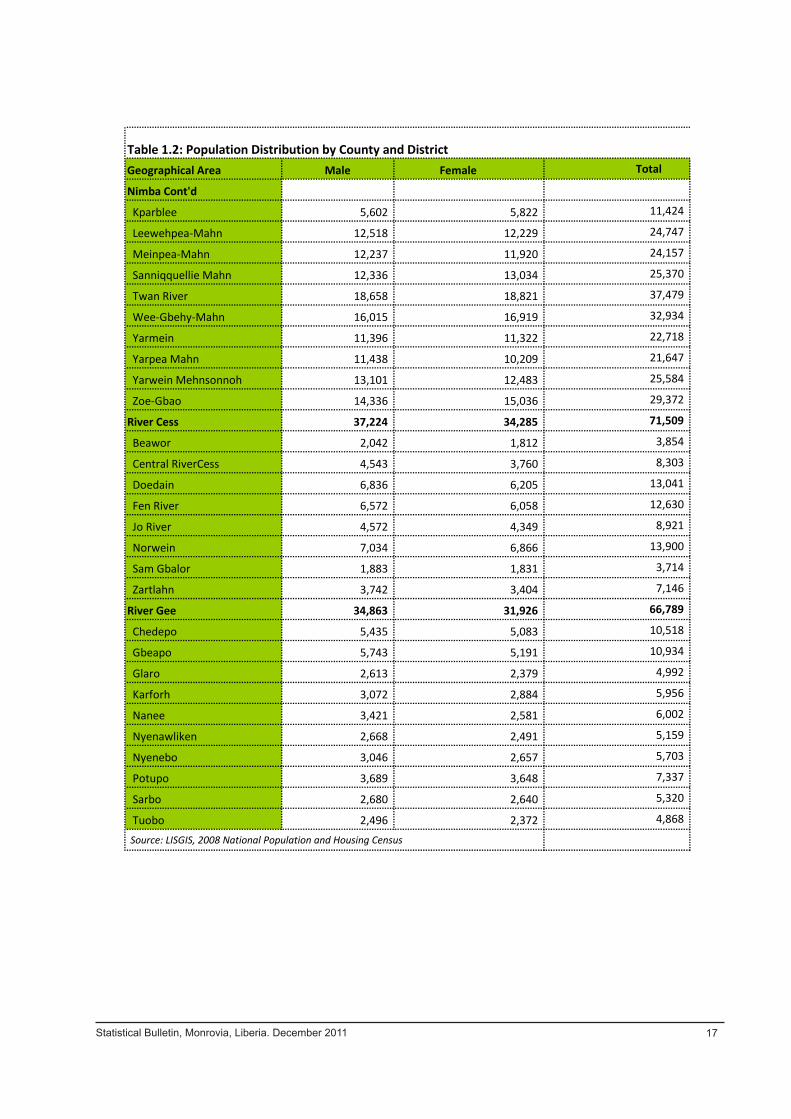
Geographical Area Male Female Total
Nimba Cont'd
Kparblee 5,602 5,822 11,424
Leewehpea-Mahn 12,518 12,229 24,747
Meinpea-Mahn 12,237 11,920 24,157
Sanniqquellie Mahn 12,336 13,034 25,370
Twan River 18,658 18,821 37,479
Wee-Gbehy-Mahn 16,015 16,919 32,934
Yarmein 11,396 11,322 22,718
Yarpea Mahn 11,438 10,209 21,647
Yarwein Mehnsonnoh 13,101 12,483 25,584
Zoe-Gbao 14,336 15,036 29,372
River Cess 37,224 34,285 71,509
Beawor 2,042 1,812 3,854
Central RiverCess 4,543 3,760 8,303
Doedain 6,836 6,205 13,041
Fen River 6,572 6,058 12,630
Jo River 4,572 4,349 8,921
Norwein 7,034 6,866 13,900
Sam Gbalor 1,883 1,831 3,714
Zartlahn 3,742 3,404 7,146
River Gee 34,863 31,926 66,789
Chedepo 5,435 5,083 10,518
Gbeapo 5,743 5,191 10,934
Glaro 2,613 2,379 4,992
Karforh 3,072 2,884 5,956
Nanee 3,421 2,581 6,002
Nyenawliken 2,668 2,491 5,159
Nyenebo 3,046 2,657 5,703
Potupo 3,689 3,648 7,337
Sarbo 2,680 2,640 5,320
Tuobo 2,496 2,372 4,868
Source: LISGIS, 2008 National Population and Housing Census
Table 1.2: Population Distribution by County and District
Page 5 Statistical Bulletin 2011
Statistical Bulletin, Monrovia, Liberia. December 2011 17
Geographical Area Male Female Total
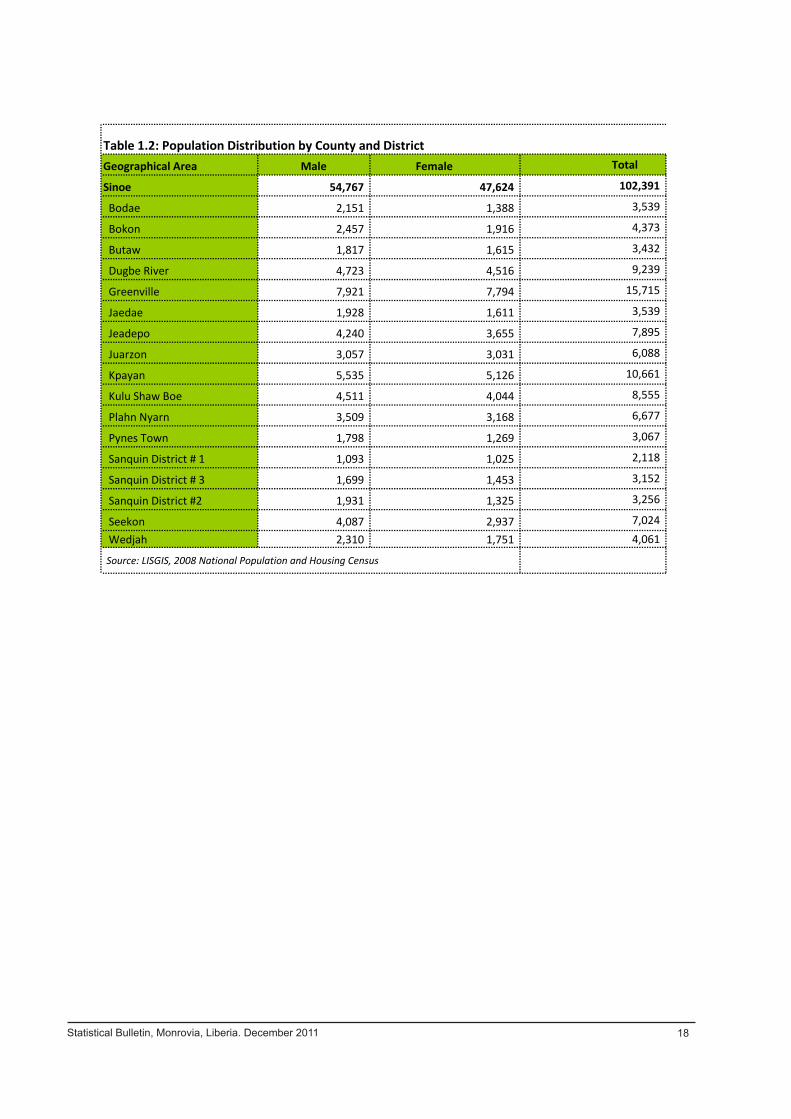
Sinoe 54,767 47,624 102,391
Bodae 2,151 1,388 3,539
Bokon 2,457 1,916 4,373
Butaw 1,817 1,615 3,432
Dugbe River 4,723 4,516 9,239
Greenville 7,921 7,794 15,715
Jaedae 1,928 1,611 3,539
Jeadepo 4,240 3,655 7,895
Juarzon 3,057 3,031 6,088
Kpayan 5,535 5,126 10,661
Kulu Shaw Boe 4,511 4,044 8,555
Plahn Nyarn 3,509 3,168 6,677
Pynes Town 1,798 1,269 3,067
Sanquin District # 1 1,093 1,025 2,118
Sanquin District # 3 1,699 1,453 3,152
Sanquin District #2 1,931 1,325 3,256
Seekon 4,087 2,937 7,024 Wedjah 2,310 1,751 4,061
Source: LISGIS, 2008 National Population and Housing Census
Table 1.2: Population Distribution by County and District
Page 6 Statistical Bulletin 2011
Statistical Bulletin, Monrovia, Liberia. December 2011 18

Male Female Total Male Female TotalLiberia 00-04 270,564 263,911 534,475 45-49 63,827 54,980 118,807 05-09 251,411 250,520 501,931 50-54 44,870 38,070 82,940 10-14 214,859 206,807 421,666 55-59 30,975 25,485 56,460 15-19 189,407 186,288 375,695 60-64 25,473 27,357 52,830 20-24 161,951 180,979 342,930 65-69 19,250 20,557 39,807 25-29 141,006 150,852 291,858 70-74 12,343 13,403 25,746 30-34 107,326 112,306 219,632 75-79 11,580 11,333 22,913 35-39 99,136 104,400 203,536 80-84 81,670 74,067 155,737 40-44 5,408 6,599 12,007 85 + 8,889 8,749 17,638
Total 1,739,945 1,736,663 3,476,608 Bomi County 00-04 7,759 7,490 15,249 45-49 1,610 1,395 3,005 05-09 6,605 6,324 12,929 50-54 1,158 1,004 2,162 10-14 4,769 4,048 8,817 55-59 872 665 1,537 15-19 3,575 3,474 7,049 60-64 814 889 1,703 20-24 3,275 4,156 7,431 65-69 627 645 1,272 25-29 3,460 3,421 6,881 70-74 389 421 810 30-34 2,561 2,444 5,005 75-79 419 325 744 35-39 2,536 2,416 4,952 80-84 157 161 318
Grand Cape Mount 2,058 1,677 3,735 85 + 296 224 520 Total 42,940 41,179 84,119 Bong County 00-04 30,787 29,648 60,435 45-49 6,424 5,929 12,353 05-09 25,617 24,083 49,700 50-54 4,158 4,114 8,272 10-14 18,714 15,827 34,541 55-59 3,112 3,038 6,150 15-19 14,529 14,899 29,428 60-64 2,717 3,157 5,874 20-24 12,583 16,773 29,356 65-69 2,470 2,683 5,153 25-29 12,185 14,503 26,688 70-74 1,446 1,528 2,974 30-34 9,337 11,152 20,489 75-79 1,572 1,455 3,027 35-39 9,553 10,612 20,165 80-84 631 659 1,290 40-44 85 + 1,203 1,098 2,301
Total 84,753 93,730 178,483 Gbarpolu County 00-04 6,269 5,908 12,177 45-49 1,776 1,319 3,095 05-09 6,301 6,191 12,492 50-54 1,114 775 1,889 10-14 5,422 5,025 10,447 55-59 860 660 1,520 15-19 4,882 4,371 9,253 60-64 717 663 1,380 20-24 3,790 3,811 7,601 65-69 617 574 1,191 25-29 3,761 3,198 6,959 70-74 322 206 528 30-34 2,757 2,314 5,071 75-79 309 224 533 35-39 2,598 2,427 5,025 80-84 111 89 200 40-44 2,133 1,596 3,729 85 + 167 131 298
Total 43,906 39,482 83,388 Source: LISGIS, 2008 National Population and Housing Census
Table 1.2.1: Population by Age Group Distribution, County and Sex, 2008
Age/Single YearAge in Years
Page 7 Statistical Bulletin 2011Statistical Bulletin, Monrovia, Liberia. December 2011 19

Table 1.2.2: Single Age Distribution of the Population by County and Sex, Liberia 2008
Male Female Total Male Female TotalGrand Bassa County 00-04 20,093 19,549 39,642 45-49 4,747 4,025 8,772 05-09 16,604 15,634 32,238 50-54 3,317 2,741 6,058 10-14 11,990 10,439 22,429 55-59 2,431 2,146 4,577
8,856 9,277 18,133 60-64 2,209 2,215 4,424 20-24 8,194 10,622 18,816 65-69 1,671 1,723 3,394 25-29 8,267 9,450 17,717 70-74 1,030 1,015 2,045 30-34 6,544 7,166 13,710 75-79 1,017 825 1,842 35-39 6,920 7,631 14,551 80-84 412 468 880 40-44 5,874 5,216 11,090 85 + 737 638 1,375 Total 110,913 110,780 221,693 Grand Cape Mount County 00-04 10,814 10,615 21,429 45-49 2,274 1,867 4,141 05-09 10,166 9,369 19,535 50-54 1,545 1,248 2,793 10-14 7,625 6,345 13,970 55-59 1,089 836 1,925 15-19 7,058 6,586 13,644 60-64 1,081 982 2,063 20-24 5,473 6,132 11,605 65-69 847 715 1,562 25-29 5,460 5,556 11,016 70-74 526 419 945 30-34 4,037 3,667 7,704 75-79 564 416 980 35-39 3,793 3,683 7,476 80-84 227 244 471 40-44 2,786 2,450 5,236 85 + 314 267 581
Total 65,679 61,397 127,076 Grand Gedeh County 00-04 7,766 7,398 15,164 45-49 2,060 2,129 4,189 05-09 8,156 7,768 15,924 50-54 1,479 1,443 2,922 10-14 8,607 7,439 16,046 55-59 1,005 895 1,900 15-19 9,324 7,839 17,163 60-64 992 1,022 2,014 20-24 7,819 7,119 14,938 65-69 603 665 1,268 25-29 5,686 5,339 11,025 70-74 459 457 916 30-34 4,179 3,777 7,956 75-79 388 406 794 35-39 3,317 3,463 6,780 80-84 174 247 421 40-44 2,686 2,561 5,247 85 + 294 297 591
Total 64,994 60,264 125,258 Grand Kru County 00-04 4,959 4,571 9,530 45-49 877 1,013 1,890 05-09 4,814 4,514 9,328 50-54 689 765 1,454 10-14 4,073 3,266 7,339 55-59 559 503 1,062 15-19 3,433 2,838 6,271 60-64 477 586 1,063 20-24 2,622 2,736 5,358 65-69 289 345 634 25-29 2,058 2,202 4,260 70-74 208 203 411 30-34 1,652 1,755 3,407 75-79 190 167 357 35-39 1,415 1,467 2,882 80-84 79 91 170 40-44 1,194 1,183 2,377 85 + 60 60 120
Total 29,648 28,265 57,913 Source: LISGIS, 2008 National Population and Housing Census
Age/Single YearAge in Years
Page 8 Statistical Bulletin 2011Statistical Bulletin, Monrovia, Liberia. December 2011 20

Table 1.2.3: Single Age Distribution of the Population by County and Sex, Liberia 2008
Male Female Total Male Female TotalLofa County 00-04 22,304 22,756 45,060 45-49 4,371 4,485 8,856 05-09 21,979 21,411 43,390 50-54 2,780 3,332 6,112 10-14 16,392 14,872 31,264 55-59 1,930 1,966 3,896 15-19 15,178 14,766 29,944 60-64 1,758 2,828 4,586 20-24 10,570 12,808 23,378 65-69 1,553 2,127 3,680 25-29 10,187 12,871 23,058 70-74 1,132 1,855 2,987 30-34 7,562 9,074 16,636 75-79 1,266 1,429 2,695 35-39 7,182 8,441 15,623 80-84 809 1,080 1,889 40-44 5,273 5,796 11,069 85 + 1,385 1,355 2,740
Total 133,611 143,252 276,863 Margibi County 00-04 16,797 16,276 33,073 45-49 4,577 3,247 7,824 05-09 15,182 15,565 30,747 50-54 3,105 2,057 5,162 10-14 12,840 12,950 25,790 55-59 2,074 1,447 3,521 15-19 10,261 10,417 20,678 60-64 1,712 1,381 3,093 20-24 9,432 11,028 20,460 65-69 1,206 1,127 2,333 25-29 8,475 8,694 17,169 70-74 708 651 1,359 30-34 6,316 6,628 12,944 75-79 651 655 1,306 35-39 6,301 6,578 12,879 80-84 312 334 646 40-44 85 + 546 542 1,088
Total 105,840 104,083 209,923 Maryland County 00-04 9,939 9,463 19,402 45-49 2,185 1,855 4,040 05-09 11,039 10,391 21,430 50-54 1,629 1,294 2,923 10-14 10,793 9,452 20,245 55-59 1,216 960 2,176 15-19 9,694 8,184 17,878 60-64 1,014 1,030 2,044 20-24 7,173 6,472 13,645 65-69 618 558 1,176 25-29 4,889 4,771 9,660 70-74 461 413 874 30-34 3,658 3,720 7,378 75-79 329 232 561 35-39 3,232 3,454 6,686 80-84 161 155 316 40-44 2,695 2,562 5,257 85 + 130 117 247
Total 70,855 65,083 135,938 Montserrado County 00-04 73,324 72,950 146,274 45-49 20,649 16,439 37,088 05-09 69,286 77,223 146,509 50-54 15,086 11,017 26,103 10-14 66,783 77,566 144,349 55-59 9,742 6,895 16,637 15-19 63,364 69,255 132,619 60-64 6,844 6,866 13,710 20-24 60,860 65,924 126,784 65-69 4,647 4,997 9,644 25-29 51,807 53,585 105,392 70-74 2,927 3,303 6,230 30-34 38,389 39,233 77,622 75-79 2,028 2,495 4,523 35-39 33,830 34,071 67,901 80-84 907 1,336 2,243 40-44 28,096 23,651 51,747 85 + 1,164 1,702 2,866
Total 549,733 568,508 1,118,241 Source: LISGIS, 2008 National Population and Housing Census
Age/Single YearAge in Years
Page 9 Statistical Bulletin 2011Statistical Bulletin, Monrovia, Liberia. December 2011 21
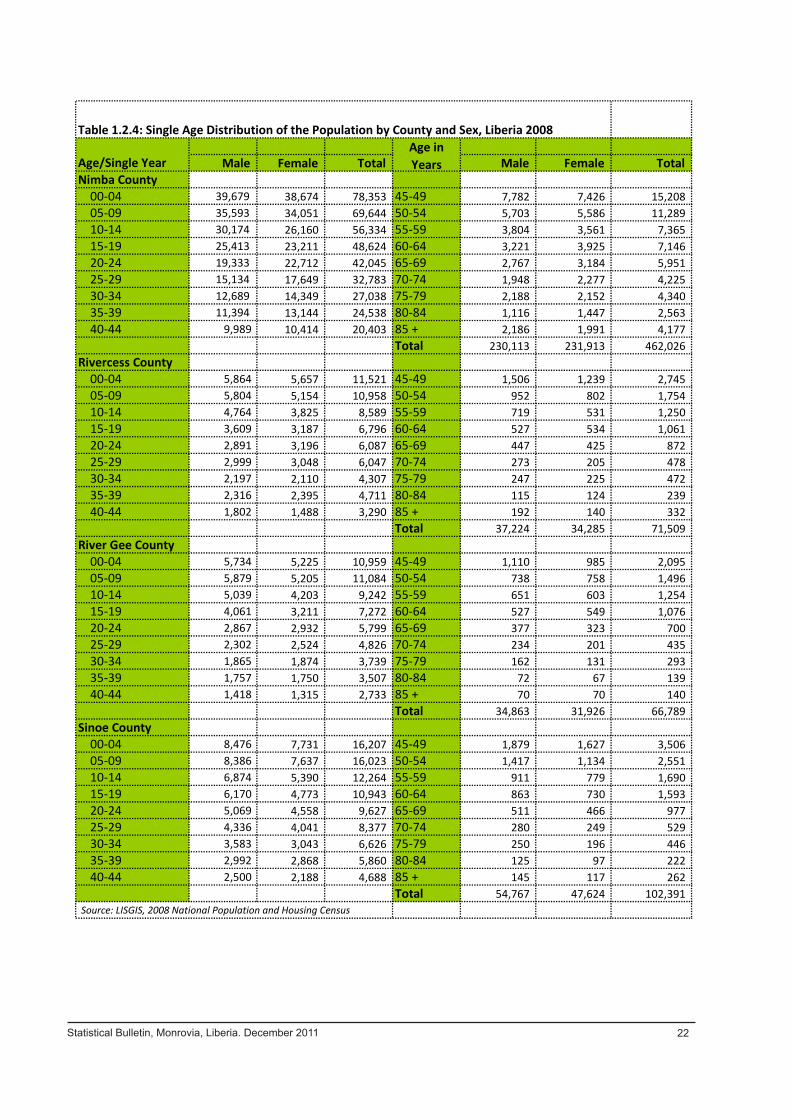
Table 1.2.4: Single Age Distribution of the Population by County and Sex, Liberia 2008
Male Female Total Male Female TotalNimba County 00-04 39,679 38,674 78,353 45-49 7,782 7,426 15,208 05-09 35,593 34,051 69,644 50-54 5,703 5,586 11,289 10-14 30,174 26,160 56,334 55-59 3,804 3,561 7,365 15-19 25,413 23,211 48,624 60-64 3,221 3,925 7,146 20-24 19,333 22,712 42,045 65-69 2,767 3,184 5,951 25-29 15,134 17,649 32,783 70-74 1,948 2,277 4,225 30-34 12,689 14,349 27,038 75-79 2,188 2,152 4,340 35-39 11,394 13,144 24,538 80-84 1,116 1,447 2,563 40-44 9,989 10,414 20,403 85 + 2,186 1,991 4,177
Total 230,113 231,913 462,026 Rivercess County 00-04 5,864 5,657 11,521 45-49 1,506 1,239 2,745 05-09 5,804 5,154 10,958 50-54 952 802 1,754 10-14 4,764 3,825 8,589 55-59 719 531 1,250 15-19 3,609 3,187 6,796 60-64 527 534 1,061 20-24 2,891 3,196 6,087 65-69 447 425 872 25-29 2,999 3,048 6,047 70-74 273 205 478 30-34 2,197 2,110 4,307 75-79 247 225 472 35-39 2,316 2,395 4,711 80-84 115 124 239 40-44 1,802 1,488 3,290 85 + 192 140 332
Total 37,224 34,285 71,509 River Gee County 00-04 5,734 5,225 10,959 45-49 1,110 985 2,095 05-09 5,879 5,205 11,084 50-54 738 758 1,496 10-14 5,039 4,203 9,242 55-59 651 603 1,254 15-19 4,061 3,211 7,272 60-64 527 549 1,076 20-24 2,867 2,932 5,799 65-69 377 323 700 25-29 2,302 2,524 4,826 70-74 234 201 435 30-34 1,865 1,874 3,739 75-79 162 131 293 35-39 1,757 1,750 3,507 80-84 72 67 139 40-44 1,418 1,315 2,733 85 + 70 70 140
Total 34,863 31,926 66,789 Sinoe County 00-04 8,476 7,731 16,207 45-49 1,879 1,627 3,506 05-09 8,386 7,637 16,023 50-54 1,417 1,134 2,551 10-14 6,874 5,390 12,264 55-59 911 779 1,690 15-19 6,170 4,773 10,943 60-64 863 730 1,593 20-24 5,069 4,558 9,627 65-69 511 466 977 25-29 4,336 4,041 8,377 70-74 280 249 529 30-34 3,583 3,043 6,626 75-79 250 196 446 35-39 2,992 2,868 5,860 80-84 125 97 222 40-44 2,500 2,188 4,688 85 + 145 117 262
Total 54,767 47,624 102,391 Source: LISGIS, 2008 National Population and Housing Census
Age/Single YearAge in Years
Page 10 Statistical Bulletin 2011Statistical Bulletin, Monrovia, Liberia. December 2011 22
Mal
e Fe
mal
e To
tal
Mal
e Fe
mal
e To
tal
Mal
e Fe
mal
e To
tal
Age
grou
p12
,000
14,000
26,000
29,000
26,000
54,000
41,000
40,000
80,000
20-24
26,000
30,000
57,000
27,000
35,000
62,000
53,000
65,000
119,00
025
-29
30,000
41,000
71,000
38,000
53,000
91,000
69,000
94,000
162,00
030
-34
38,000
47,000
85,000
40,000
41,000
81,000
78,000
88,000
166,00
035
-39
36,000
42,000
78,000
38,000
48,000
86,000
74,000
90,000
163,00
040
-44
31,000
35,000
66,000
34,000
35,000
69,000
65,000
70,000
135,00
045
-49
26,000
19,000
45,000
37,000
27,000
64,000
63,000
46,000
110,00
050
-54
23,000
13,000
36,000
20,000
14,000
34,000
43,000
27,000
70,000
55-59
12,000
9,00
021
,000
14,000
11,000
26,000
26,000
20,000
47,000
60-64
6,00
04,00
010
,000
10,000
9,00
019
,000
15,000
14,000
29,000
65+
10,000
5,00
017
,000
23,000
12,000
35,000
33,000
19,000
52,000
Tabl
e1.3
.2: D
istr
ibut
ion
of th
e ho
useh
old
popu
latio
n by
loca
lity,
age
gro
up, d
epen
denc
y ra
tio, n
umbe
r of H
ouse
hold
s and
Ave
rage
Hou
seho
ld si
ze
Tabl
e 1.
3.1:
Lab
our F
orce
by
sex,
loca
lity
and
five-
year
age
gro
ups
SIZE
OF
THE
LABO
UR
FORC
E
Urb
anRu
ral
Tota
l
Pag
e 11
Sta
tistic
al B
ulle
tin 2
011
Tabl
e1.3
.2: D
istr
ibut
ion
of th
e ho
useh
old
popu
latio
n by
loca
lity,
age
gro
up, d
epen
denc
y ra
tio, n
umbe
r of H
ouse
hold
s and
Ave
rage
Hou
seho
ld si
ze
65+
Urban
660,00
034
6,00
024
8,00
030
0,00
054
,000
41,000
1,64
8,00
074
327,00
05
Rural
760,00
025
6,00
023
7,00
031
3,00
060
,000
65,000
1,69
1,00
095
343,00
04.9
National
1,41
9,00
060
2,00
048
5,00
061
3,00
011
3,00
010
7,00
03,34
0,00
084
670,00
05
Sour
ce: L
ISGI
S, La
bour
For
ce S
urve
y 20
10
Aver
age
Hous
ehol
d Si
ze
Ho
useh
old
Popu
latio
n
Depe
nden
cy R
atio
N
o.
of H
ouse
hold
s
L
ocal
ity A
ge g
roup
Pag
e 11
Sta
tistic
al B
ulle
tin 2
011
Statistical Bulletin, Monrovia, Liberia. December 2011 23

Age
grou
pU
rban
Rur
al
26,0
0054
,000
20-2
457
,000
62,0
0025
-29
71,0
0091
,000
30-3
485
,000
81,0
0035
-39
78,0
0086
,000
40-4
466
,000
69,0
0045
-49
45,0
0064
,000
50-5
436
,000
34,0
0055
-59
21,0
0026
,000
60-6
410
,000
19,0
0065
+17
,000
35,0
00
0
10,0
00
20,0
00
30,0
00
40,0
00
50,0
00
60,0
00
70,0
00
80,0
00
90,0
00
100,
000
20
-24
25-2
9 30
-34
35-3
9 40
-44
45-4
9 50
-54
55-5
9 60
-64
65+
Rural/Urban labor force
Age
Dist
ribut
ion
Fig.
2 L
abou
r For
ce b
y Lo
catio
n &
Age
Gro
up
Urb
an
Rura
l
Pag
e 12
Sta
tistic
al B
ulle
tin 2
011
Statistical Bulletin, Monrovia, Liberia. December 2011 24

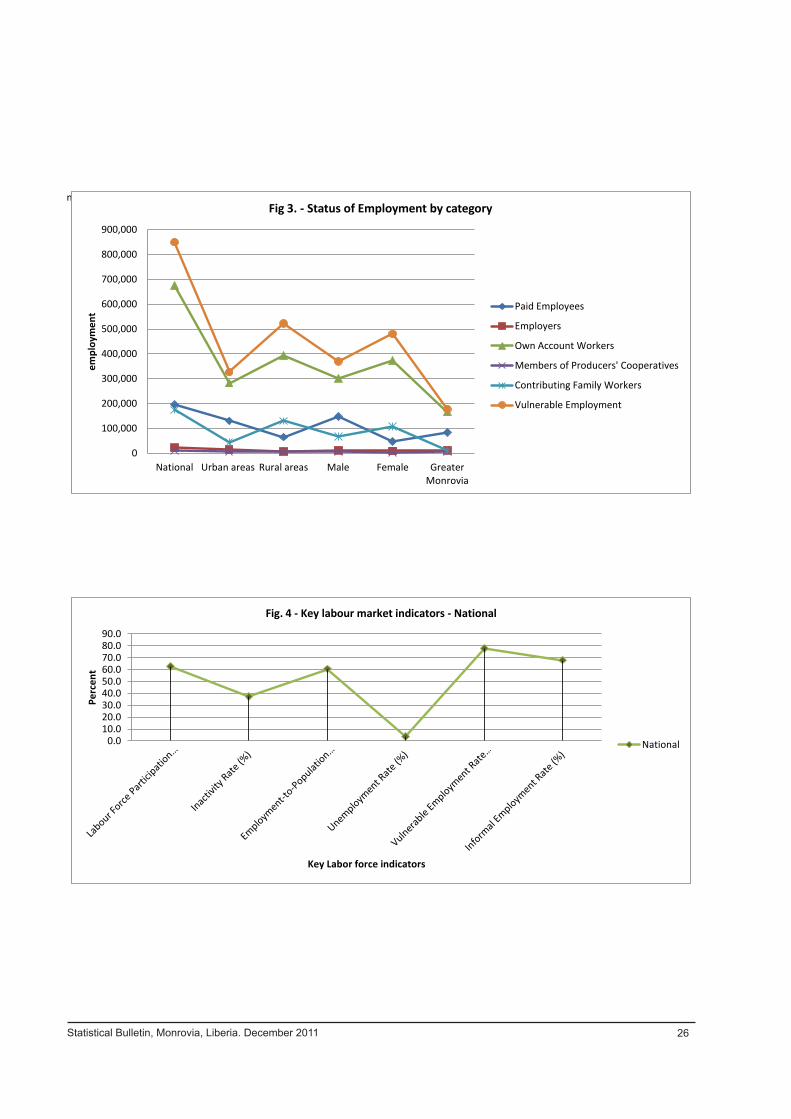
Nat
iona
l19
5,00
022
,000
675,
000
11,0
0017
4,00
085
0,00
0U
rban
are
as
130,
000
15,0
0028
2,00
06,
000
44,0
0032
7,00
0Ru
ral a
reas
65,0
007,
000
393,
000
5,00
013
0,00
052
3,00
0M
ale
148,
000
12,0
0030
2,00
07,
000
68,0
0037
0,00
0Fe
mal
e47
,000
9,00
037
3,00
04,
000
107,
000
480,
000
Grea
ter M
onro
via
84,0
0012
,000
166,
000
5,00
012
,000
178,
000
Sour
ce: L
iber
ia In
stitu
te o
f Sta
tistic
s & G
eo-In
form
atio
n Se
rvic
es, L
abou
r For
ce S
urve
y, 2
010
Labo
ur F
orce
Pa
rtic
ipat
ion
Rate
(%
)In
activ
ity
Rate
(%)
Empl
oym
ent-
to-P
opul
atio
n Ra
tio (%
)U
nem
ploy
men
t Ra
te (%
)
Vuln
erab
le
Empl
oym
ent
Rate
(%)
Info
rmal
Em
ploy
men
t Rat
e (%
)N
atio
nal
62.8
37.2
60.5
3.7
77.9
68.0
Urb
an a
reas
54.9
45.1
52.0
5.5
67.5
59.3
Rura
l are
as71
.228
.869
.62.
386
.175
.0M
ale
66.1
33.9
63.8
3.4
68.3
61.3
Fem
ale
59.9
40.1
57.5
4.1
87.3
74.7
Grea
ter M
onro
via
52.8
47.2
49.3
6.5
63.2
56.6
Sour
ce: L
iber
ia In
stitu
te o
f Sta
tistic
s & G
eo-In
form
atio
n Se
rvic
es, L
abou
r For
ce S
urve
y, 2
010
Tabl
e 1.
3.4:
Lab
our m
arke
t ind
icat
ors:
var
ious
ratio
s
Tabl
e 1.
3.3:
Sta
tus i
n em
ploy
men
t (pe
rson
s age
d 15
and
ove
r)Co
ntrib
utin
g Fa
mily
Wor
kers
Vuln
erab
le
Empl
oym
ent
Paid
Em
ploy
ees
Empl
oyer
sO
wn
Acco
unt W
orke
rs
Prod
ucer
s' Co
oper
ativ
es
Pag
e 13
Sta
tistic
al B
ulle
tin 2
011
Statistical Bulletin, Monrovia, Liberia. December 2011 25
Grand Cape Mount
0
100,000
200,000
300,000
400,000
500,000
600,000
700,000
800,000
900,000
National Urban areas Rural areas Male Female Greater Monrovia
empl
oym
ent
Fig 3. - Status of Employment by category
Paid Employees
Employers
Own Account Workers
Members of Producers' Cooperatives
Contributing Family Workers
Vulnerable Employment
Page 14 Statistical Bulletin 2011
Grand Cape Mount
0.0 10.0 20.0 30.0 40.0 50.0 60.0 70.0 80.0 90.0
Perc
ent
Key Labor force indicators
Fig. 4 - Key labour market indicators - National
National
Page 14 Statistical Bulletin 2011
Statistical Bulletin, Monrovia, Liberia. December 2011 26

Occupation
Bomi
Bong
Grand Bassa
Grand Cape Mount
Grand Gedeh
Grand Kru
Lofa
Margibi
Maryland
Montserrado
Nimba
Rivercess
Sinoe
River Gee
Gbarpolu
Total
ISO
-08
Man
ager
s
1,0
00
1,0
00
*
1
,000
*
*
*
*
*
5,0
00
*
*
*
*
*
11,0
00
Pro
fess
iona
ls
1,0
00
4,0
00
1
,000
1,0
00
1,0
00
1
,000
2
,000
4,
000
2
,000
2
1,00
0
3
,000
1,0
00
1
,000
1
,000
1
,000
43
,000
T
echn
icia
ns
*
2,0
00
1
,000
1,0
00
*
*
*
*
*
8
,000
1
,000
*
*
*
*
14
,000
C
leric
al su
ppor
t *
*
*
*
*
*
*
*
3,0
00
1,0
00
*
*
*
5,0
00
Ser
vice
& sa
les
1
,000
6
,000
5,0
00
1
,000
2
,000
1,0
00
4,0
00
4,00
0
1,0
00
50,
000
8,0
00
*
1
,000
1
,000
1
,000
86
,000
S
kille
d ag
ricul
ture
8,0
00
3
7,00
0 1
9,00
0 1
2,00
0
7
,000
5,0
00
2
6,00
0
16,
000
7
,000
1
2,00
0
36,
000
9
,000
3,0
00
7,0
00
1
0,00
0
216
,000
C
raft&
rela
ted
*
5,0
00
2
,000
1,0
00
1,0
00
*
2,0
00
2,00
0
1,0
00
30,
000
2,0
00
*
*
*
*
48,0
00
Mac
hine
ope
rato
rs
1
,000
1
,000
1,0
00
1
,000
1
,000
*
*
1,
000
*
15,
000
1,0
00
*
*
*
1,0
00
22,0
00
Ele
men
tary
occ
up
4
,000
8
,000
5,0
00
7
,000
3
,000
3,0
00
8,0
00
9,00
0
1,0
00
18,
000
1
0,00
0
3,0
00
1
,000
1
,000
3
,000
83
,000
T
otal
1
5,00
0
65
,000
3
5,00
0 2
5,00
0
15
,000
1
0,00
0
43,
000
3
7,00
0 1
3,00
0
16
4,00
0
60,
000
13,
000
7
,000
10
,000
16,
000
5
28,0
00
Man
ager
s
4
1
1
4
1
3
1
1
4
3
1
1
7
2
0
2
Pro
fess
iona
ls
4
7
3
4
8
7
5
10
14
1
3
5
5
1
3
9
5
8
Tec
hnic
ians
1
3
2
4
2
1
1
1
2
5
1
0
2
2
3
3
Cle
rical
supp
ort
0
1
0
0
0
1
1
1
-
2
1
0
2
-
0
1
S
ervi
ce&
sale
s
5
1
0
14
5
13
6
9
10
10
31
13
2
13
5
5
16
Ski
lleda
gric
ultu
re
5
2
5
8
56
4
8
4
6
52
59
44
57
8
60
7
0
46
69
64
41
Cra
ft&re
late
d
3
8
6
6
7
1
5
6
5
19
3
1
3
2
2
9
Mac
hine
ope
rato
rs
6
2
3
3
6
1
1
2
2
9
1
1
3
0
4
4
E
lem
enta
ry o
ccup
26
13
1
5
27
18
2
8
1
9
25
7
1
1
1
6
20
1
2
1
1
1
6
1
6
Gra
nd C
ape
Mou
nt
100
100
1
00
100
100
1
00
1
00
10
0
1
00
100
100
1
00
100
10
0
100
100
Tabl
e 1.
3.5:
Em
ploy
ed M
ales
Age
d 15
and
Abo
ve b
y Se
x, C
ount
y an
d M
ain
Occ
upat
ion
Sour
ce: L
ISGI
S - L
iber
ia La
bour
For
ce S
urve
y 20
10
Per
cent
ages
Pag
e 15
Sta
tistic
al B
ulle
tin 2
011
Statistical Bulletin, Monrovia, Liberia. December 2011 27
Occ
upat
ion
Bom
i B
ong
Gra
nd
Bass
a
Gra
nd
Cape
M
ount
G
rand
Ge
deh
Gra
nd
Kru
Lof
a M
argi
bi
M
aryl
an d
M
onts
erra do
N
imba
Ri
verc
es s
Sino
e R
iver
Gee
Gb
arpo
lu
Tota
l IS
O-0
8 M
anag
ers
*
1,0
00
*
*
-
*
*
-
*
1
,000
- *
*
*
-
3
,000
P
rofe
ssio
nals
*
2,0
00
1
,000
1,0
00
*
*
2,0
00
1,00
0
1,0
00
13,
000
2,0
00
*
*
*
*
26,0
00
Tec
hnic
ians
*
1
,000
- *
*
*
1
,000
*
*
3,0
00
*
-
*
*
*
5,0
00
Cle
rical
supp
ort
-
*
*
*
*
*
*
*
1
,000
-
- -
1,0
00
Ser
vice
&sa
les
3
,000
14,
000
12,
000
7
,000
4
,000
1,0
00
8,0
00
9,00
0
3,0
00
91,
000
1
1,00
0
1,0
00
1
,000
1
,000
2
,000
167,
000
Ski
lleda
gric
ultu
re
5
,000
41,
000
12,
000
12,
000
4,0
00
6
,000
36,
000
8,00
0
6,0
00
9
,000
33,
000
9
,000
3,0
00
7,0
00
8,0
00
20
1,00
0 C
raft&
rela
ted
*
3,0
00
1
,000
1,0
00
1,0
00
*
2,0
00
2,00
0 *
7,0
00
2,0
00
*
*
*
*
18,0
00
Mac
hine
oper
ator
s *
1
,000
*
*
*
- *
-
2,0
00
1,0
00
-
*
*
4,0
00
Ele
men
tary
occu
p.
4
,000
13,
000
5
,000
5,0
00
2,0
00
3
,000
11,
000
8,00
0
1,0
00
36,
000
1
6,00
0
3,0
00
1
,000
1
,000
2
,000
110,
000
Tot
al
12,
000
74,0
00
30,
000
28,
000
11,0
00
11,
000
5
9,00
0
29,
000
11,
000
162,
000
6
6,00
0 1
3,00
0
5,0
00
10,0
00
1
3,00
0
536
,000
Man
ager
s
0
1
0
1
-
0
0
-
2
1
-
0
4
0
-
1
Pro
fess
iona
ls
4
3
2
4
1
3
3
3
10
8
4
3
9
3
2
5
T
echn
icia
ns
0
1
-
1
2
1
1
1
1
2
1
-
1
1
1
1
C
leric
alsu
ppor
t
-
-
1
1
0
0
0
0
0
1
-
-
-
-
-
0
S
ervi
ce&
sale
s
24
19
3
9
26
33
1
0
1
3
32
24
5
6
1
7
6
2
2
6
14
31
Ski
lleda
gric
ultu
re
3
9
5
5
39
4
5
3
8
55
61
29
54
6
51
7
0
53
74
64
38
Cra
ft&re
late
d
3
3
3
3
6
1
3
6
2
4
3
1
2
1
1
3
Mac
hine
ope
rato
rs
1
1
1
1
0
-
-
1
-
1
1
-
-
0
1
1
E
lem
enta
ry o
ccup
29
17
1
5
20
19
2
9
1
9
28
8
2
2
2
5
21
1
0
1
4
1
7
2
1 T
otal
1
00
1
00
100
1
00
100
100
100
1
00
100
1
00
1
00
100
1
00
1
00
1
00
100
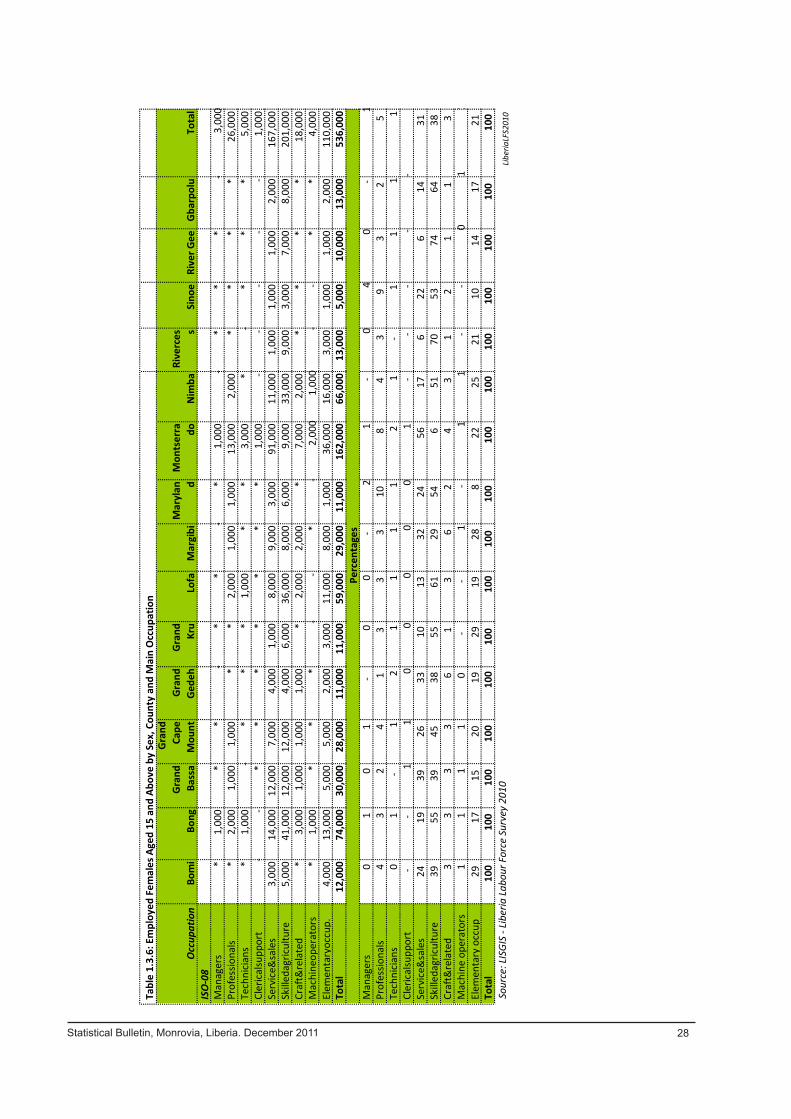
Sour
ce: L
ISGI
S - L
iber
ia La
bour
For
ce S
urve
y 20
10
Tab
le 1
.3.6
: Em
ploy
ed F
emal
es A
ged
15 a
nd A
bove
by
Sex,
Cou
nty
and
Mai
n O
ccup
atio
n
Per
cent
ages
Libe
riaLF
S201
0
Pag
e 16
Sta
tistic
al B
ulle
tin 2
011
Statistical Bulletin, Monrovia, Liberia. December 2011 28

Tabl
e 1.
3.7:
Em
ploy
ed p
erso
ns a
ged
15 a
nd o
ver b
y se
x, co
unty
and
mai
n oc
cupa
tion-
Bot
h Se
xes
Occ
upat
ion
Bom
i B
ong
Gra
nd
Bass
a
Gra
nd
Cape
M
ount
G
rand
Ge
deh
Gra
nd
Kru
Lof
a M
argi
bi
M
aryl
an d
M
onts
erra do
N
imba
Ri
verc
es s
Sino
e R
iver
Gee
Gb
arpo
lu
Tota
l IS
O-0
8 M
anag
ers
1
,000
1
,000
*
1,0
00
* *
*
*
1,0
00
6,
000
*
*
1
,000
*
*
14
,000
P
rofe
ssio
nals
1
,000
7
,000
2,0
00
2
,000
1
,000
1,0
00
4,0
00
5,00
0
3,0
00
34,
000
*
1
,000
1,0
00
1,0
00
1,0
00
69,0
00
*
2,0
00
1
,000
1,0
00
* *
1
,000
1,
000
*
11,
000
1,0
00
*
*
*
1,0
00
20,0
00
Cle
rical
supp
ort
*
*
*
*
*
*
1,0
00
*
*
4
,000
1
,000
*
*
- *
7
,000
0
Serv
ice&
sale
s
4,0
00
2
0,00
0 1
7,00
0
8,0
00
6,0
00
2
,000
12,
000
1
3,00
0
4,0
00
1
41,0
00
1
9,00
0
1,0
00
2
,000
1
,000
3
,000
252
,000
S
kille
dagr
icul
ture
1
3,00
0
79
,000
3
1,00
0 2
5,00
0
11
,000
11,0
00
6
1,00
0
24,
000
13,
000
22,
000
6
9,00
0 1
8,00
0
6,0
00
14,0
00
18,0
00
41
7,00
0 C
raft&
rela
ted
1
,000
8
,000
3,0
00
2
,000
2
,000
*
4
,000
4,
000
1
,000
3
7,00
0
3
,000
*
*
*
1
,000
66
,000
M
achi
ne
ope
rato
rs
1
,000
1
,000
1,0
00
1
,000
1
,000
*
*
1,
000
*
16,
000
1,0
00
*
*
*
1,0
00
27,0
00
Ele
men
tary
o
ccup
.
8,0
00
2
1,00
0 1
0,00
0 1
2,00
0
5
,000
6,0
00
1
9,00
0
17,
000
2
,000
5
4,00
0
26,
000
5
,000
1,0
00
2,0
00
5,0
00
1
93,0
00
Tot
al
28,
000
13
9,00
0 6
5,00
0 5
3,00
0
26
,000
21,0
00
102
,000
66,0
00
24,
000
326,
000
12
6,00
0 2
6,00
0
12,0
00
20,0
00
29,0
00
1
,063
,000
Man
ager
s
2
1
1
3
0
2
0
1
3
2
0
0
6
1
0
1
Pro
fess
iona
ls
4
5
3
4
5
5
4
7
1
2
10
4
4
11
6
4
7
T
echn
icia
ns
1
2
1
2
2
1
1
1
2
3
1
0
2
1
2
2
C
leric
alsu
ppor
t
0
0
0
0
0
1
1
1
0
1
0
0
1
-
0
1
S
ervi
ce&
sale
s
14
15
2
6
16
22
8
11
20
1
6
43
15
4
17
6
9
24
Ski
lleda
gric
ultu
re
4
6
5
6
48
4
6
4
3
54
60
37
5
5
7
55
7
0
49
72
64
39
Cra
ft&re
late
d
3
5
4
4
7
1
4
6
4
12
3
1
2
1
2
6
Mac
hine
o
pera
tors
4
1
2
2
4
0
0
2
1
5
1
1
2
0
3
3
Ele
men
tary
occ
up
2
7
1
5
15
2
3
1
8
28
19
26
7
17
21
2
1
11
12
16
18
Tot
al
100
100
1
00
100
10
0
1
00
1
00
10
0
1
00
100
100
1
00
100
10
0
100
1
00
Sour
ce: L
ISGI
S - L
iber
ia La
bour
For
ce S
urve
y
Per
cent
ages
Pag
e 17
Sta
tistic
al B
ulle
tin 2
011
Statistical Bulletin, Monrovia, Liberia. December 2011 29
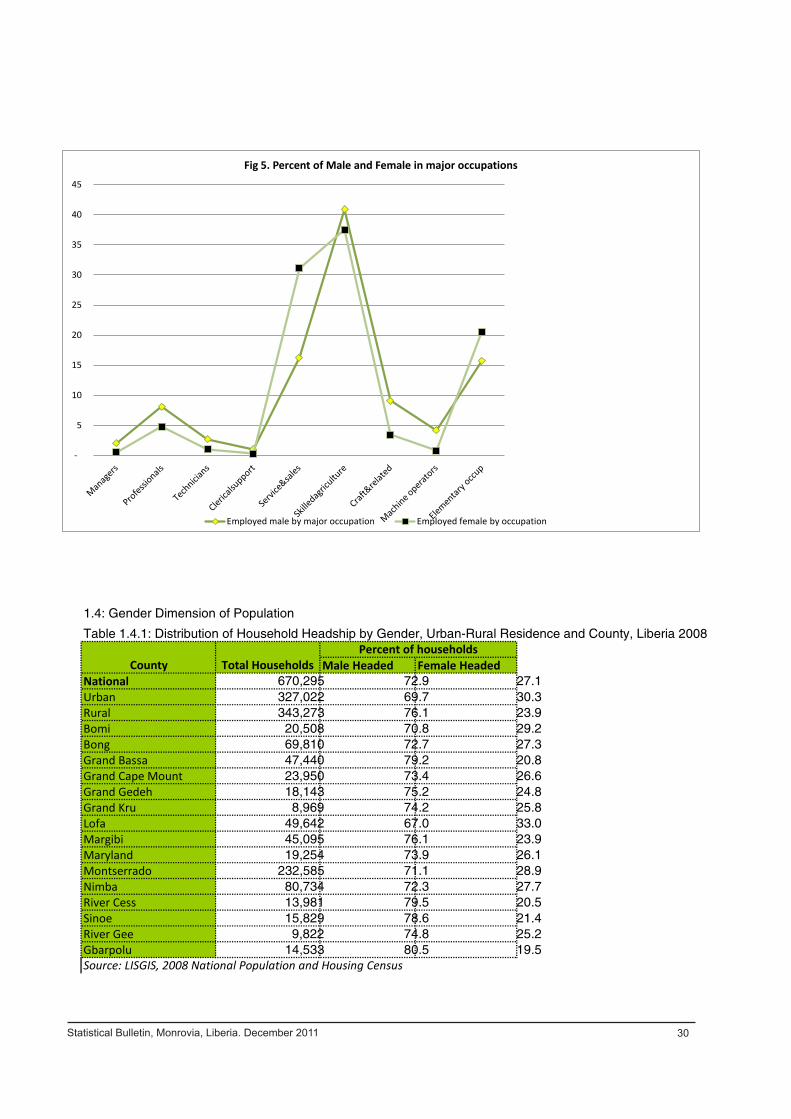
Table 1.4.1: Distribution of Household Headship by Gender, Urban-Rural Residence and County, Liberia 2008
Male Headed Female HeadedNational 670,295 72.9 27.1 Urban 327,022 69.7 30.3 Rural 343,273 76.1 23.9 Bomi 20,508 70.8 29.2 Bong 69,810 72.7 27.3 Grand Bassa 47,440 79.2 20.8 Grand Cape Mount 23,950 73.4 26.6 Grand Gedeh 18,143 75.2 24.8 Grand Kru 8,969 74.2 25.8 Lofa 49,642 67.0 33.0 Margibi 45,095 76.1 23.9 Maryland 19,254 73.9 26.1 Montserrado 232,585 71.1 28.9 Nimba 80,734 72.3 27.7 River Cess 13,981 79.5 20.5 Sinoe 15,829 78.6 21.4 River Gee 9,822 74.8 25.2 Gbarpolu 14,533 80.5 19.5
Grand Cape Mount
Table 1.4.2: Distribution of Household Headship by Gender and House Ownership, Liberia 2008
1.4: Gender Dimension of Population
County Total HouseholdsPercent of households
Source: LISGIS, 2008 National Population and Housing Census
Page19 Statistical bulletin 2011
% of employ% of employed female
-
5
10
15
20
25
30
35
40
45
Fig 5. Percent of Male and Female in major occupations
Employed male by major occupation Employed female by occupation
Page 18 Statistical Bulletin 2011
Statistical Bulletin, Monrovia, Liberia. December 2011 30
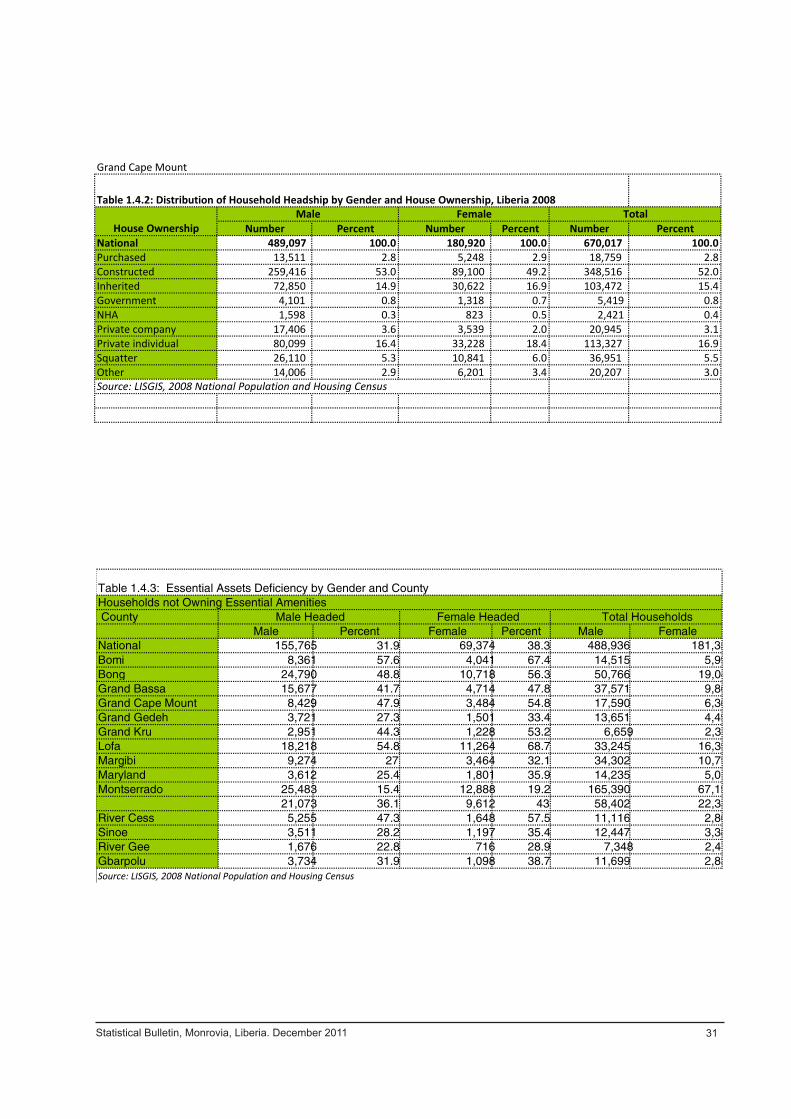
Table 1.4.1: Distribution of Household Headship by Gender, Urban-Rural Residence and County, Liberia 2008
Grand Cape Mount
Table 1.4.2: Distribution of Household Headship by Gender and House Ownership, Liberia 2008
Number Percent Number Percent Number PercentNational 489,097 100.0 180,920 100.0 670,017 100.0Purchased 13,511 2.8 5,248 2.9 18,759 2.8Constructed 259,416 53.0 89,100 49.2 348,516 52.0Inherited 72,850 14.9 30,622 16.9 103,472 15.4Government 4,101 0.8 1,318 0.7 5,419 0.8NHA 1,598 0.3 823 0.5 2,421 0.4Private company 17,406 3.6 3,539 2.0 20,945 3.1Private individual 80,099 16.4 33,228 18.4 113,327 16.9Squatter 26,110 5.3 10,841 6.0 36,951 5.5Other 14,006 2.9 6,201 3.4 20,207 3.0
House OwnershipMale Female
Source: LISGIS, 2008 National Population and Housing Census
Total
Page19 Statistical bulletin 2011
Statistical Bulletin, Monrovia, Liberia. December 2011 31
CountyMale Percent Female Percent Male Female
National 155,765 31.9 69,374 38.3 488,936 181,359 Bomi 8,361 57.6 4,041 67.4 14,515 5,993 Bong 24,790 48.8 10,718 56.3 50,766 19,044 Grand Bassa 15,677 41.7 4,714 47.8 37,571 9,869 Grand Cape Mount 8,429 47.9 3,484 54.8 17,590 6,360 Grand Gedeh 3,721 27.3 1,501 33.4 13,651 4,492 Grand Kru 2,951 44.3 1,228 53.2 6,659 2,310 Lofa 18,218 54.8 11,264 68.7 33,245 16,397 Margibi 9,274 27 3,464 32.1 34,302 10,793 Maryland 3,612 25.4 1,801 35.9 14,235 5,019 Montserrado 25,483 15.4 12,888 19.2 165,390 67,195
21,073 36.1 9,612 43 58,402 22,332 River Cess 5,255 47.3 1,648 57.5 11,116 2,865 Sinoe 3,511 28.2 1,197 35.4 12,447 3,382 River Gee 1,676 22.8 716 28.9 7,348 2,474 Gbarpolu 3,734 31.9 1,098 38.7 11,699 2,834
Table 1.4.3: Essential Assets Deficiency by Gender and CountyHouseholds not Owning Essential Amenities
Source: LISGIS, 2008 National Population and Housing Census
Male Headed Female Headed Total Households
Page20 Statistical bulletin 2011
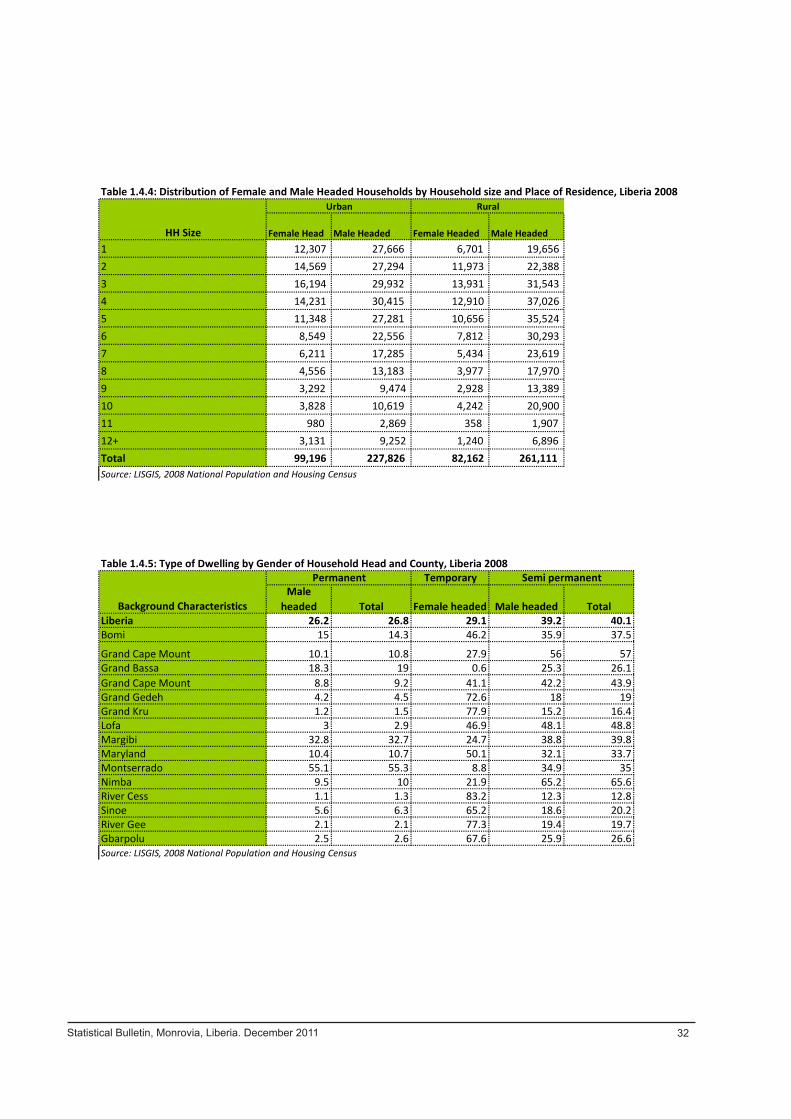
Statistical Bulletin, Monrovia, Liberia. December 2011 32
Female Head Male Headed Female Headed Male Headed1 12,307 27,666 6,701 19,656 2 14,569 27,294 11,973 22,388 3 16,194 29,932 13,931 31,543 4 14,231 30,415 12,910 37,026 5 11,348 27,281 10,656 35,524 6 8,549 22,556 7,812 30,293 7 6,211 17,285 5,434 23,619 8 4,556 13,183 3,977 17,970 9 3,292 9,474 2,928 13,389 10 3,828 10,619 4,242 20,900 11 980 2,869 358 1,907 12+ 3,131 9,252 1,240 6,896 Total 99,196 227,826 82,162 261,111 Source: LISGIS, 2008 National Population and Housing Census
Source: LISGIS, 2008 National Population and Housing Census
Table 1.4.4: Distribution of Female and Male Headed Households by Household size and Place of Residence, Liberia 2008
HH Size
Urban Rural
Page21 Statistical Bulletin 2011
Source: LISGIS, 2008 National Population and Housing Census
Male headed Total Female headed Male headed Total
Liberia 26.2 26.8 29.1 39.2 40.1Bomi 15 14.3 46.2 35.9 37.5
Grand Cape Mount 10.1 10.8 27.9 56 57Grand Bassa 18.3 19 0.6 25.3 26.1Grand Cape Mount 8.8 9.2 41.1 42.2 43.9Grand Gedeh 4.2 4.5 72.6 18 19Grand Kru 1.2 1.5 77.9 15.2 16.4Lofa 3 2.9 46.9 48.1 48.8Margibi 32.8 32.7 24.7 38.8 39.8Maryland 10.4 10.7 50.1 32.1 33.7Montserrado 55.1 55.3 8.8 34.9 35Nimba 9.5 10 21.9 65.2 65.6River Cess 1.1 1.3 83.2 12.3 12.8Sinoe 5.6 6.3 65.2 18.6 20.2River Gee 2.1 2.1 77.3 19.4 19.7Gbarpolu 2.5 2.6 67.6 25.9 26.6Source: LISGIS, 2008 National Population and Housing Census
Table 1.4.5: Type of Dwelling by Gender of Household Head and County, Liberia 2008
Background Characteristics
Semi permanentPermanent Temporary
Page21 Statistical Bulletin 2011
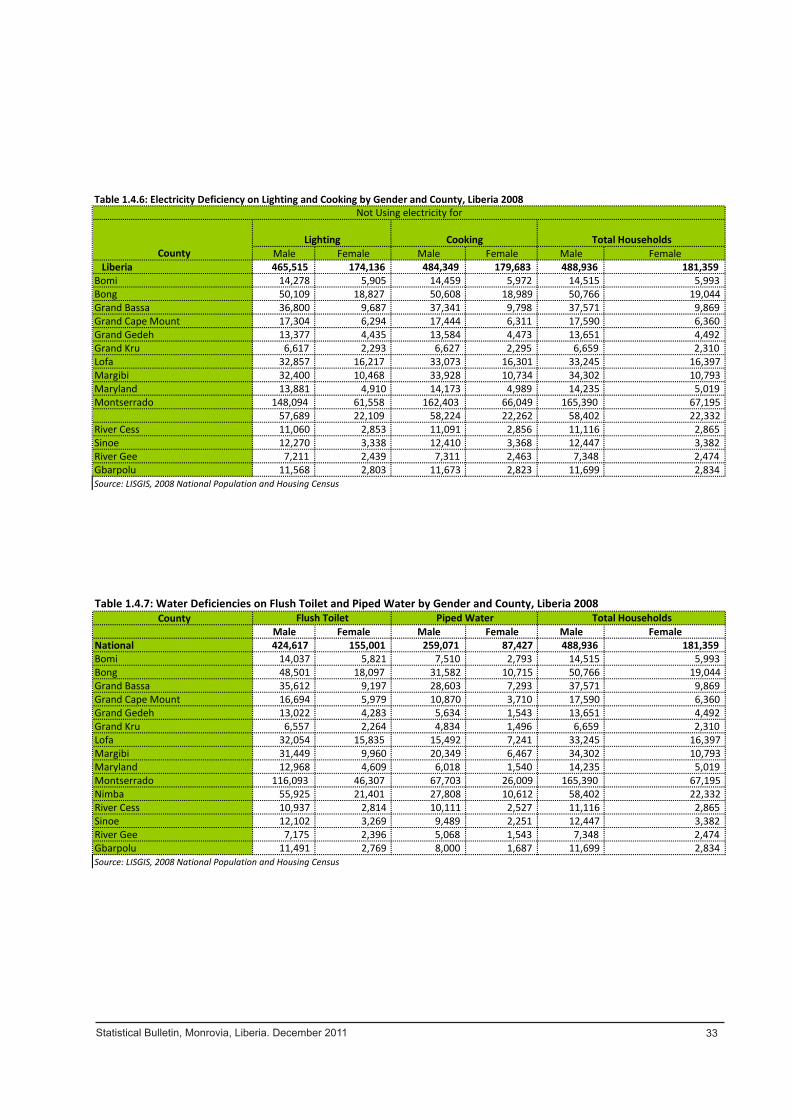
Statistical Bulletin, Monrovia, Liberia. December 2011 33
Table 1.4.6: Electricity Deficiency on Lighting and Cooking by Gender and County, Liberia 2008
Male Female Male Female Male Female Liberia 465,515 174,136 484,349 179,683 488,936 181,359 Bomi 14,278 5,905 14,459 5,972 14,515 5,993 Bong 50,109 18,827 50,608 18,989 50,766 19,044 Grand Bassa 36,800 9,687 37,341 9,798 37,571 9,869 Grand Cape Mount 17,304 6,294 17,444 6,311 17,590 6,360 Grand Gedeh 13,377 4,435 13,584 4,473 13,651 4,492 Grand Kru 6,617 2,293 6,627 2,295 6,659 2,310 Lofa 32,857 16,217 33,073 16,301 33,245 16,397 Margibi 32,400 10,468 33,928 10,734 34,302 10,793 Maryland 13,881 4,910 14,173 4,989 14,235 5,019 Montserrado 148,094 61,558 162,403 66,049 165,390 67,195
57,689 22,109 58,224 22,262 58,402 22,332 River Cess 11,060 2,853 11,091 2,856 11,116 2,865 Sinoe 12,270 3,338 12,410 3,368 12,447 3,382 River Gee 7,211 2,439 7,311 2,463 7,348 2,474 Gbarpolu 11,568 2,803 11,673 2,823 11,699 2,834 Source: LISGIS, 2008 National Population and Housing Census
County
Not Using electricity for
CookingLighting Total Households
Page22 Statistical Bulletin 2011
Table 1.4.7: Water Deficiencies on Flush Toilet and Piped Water by Gender and County, Liberia 2008 County
Male Female Male Female Male FemaleNational 424,617 155,001 259,071 87,427 488,936 181,359 Bomi 14,037 5,821 7,510 2,793 14,515 5,993 Bong 48,501 18,097 31,582 10,715 50,766 19,044 Grand Bassa 35,612 9,197 28,603 7,293 37,571 9,869 Grand Cape Mount 16,694 5,979 10,870 3,710 17,590 6,360 Grand Gedeh 13,022 4,283 5,634 1,543 13,651 4,492 Grand Kru 6,557 2,264 4,834 1,496 6,659 2,310 Lofa 32,054 15,835 15,492 7,241 33,245 16,397 Margibi 31,449 9,960 20,349 6,467 34,302 10,793 Maryland 12,968 4,609 6,018 1,540 14,235 5,019 Montserrado 116,093 46,307 67,703 26,009 165,390 67,195 Nimba 55,925 21,401 27,808 10,612 58,402 22,332 River Cess 10,937 2,814 10,111 2,527 11,116 2,865 Sinoe 12,102 3,269 9,489 2,251 12,447 3,382 River Gee 7,175 2,396 5,068 1,543 7,348 2,474 Gbarpolu 11,491 2,769 8,000 1,687 11,699 2,834
Total HouseholdsFlush Toilet Piped Water
Source: LISGIS, 2008 National Population and Housing Census
Page23 Statistical Bulletin 2011
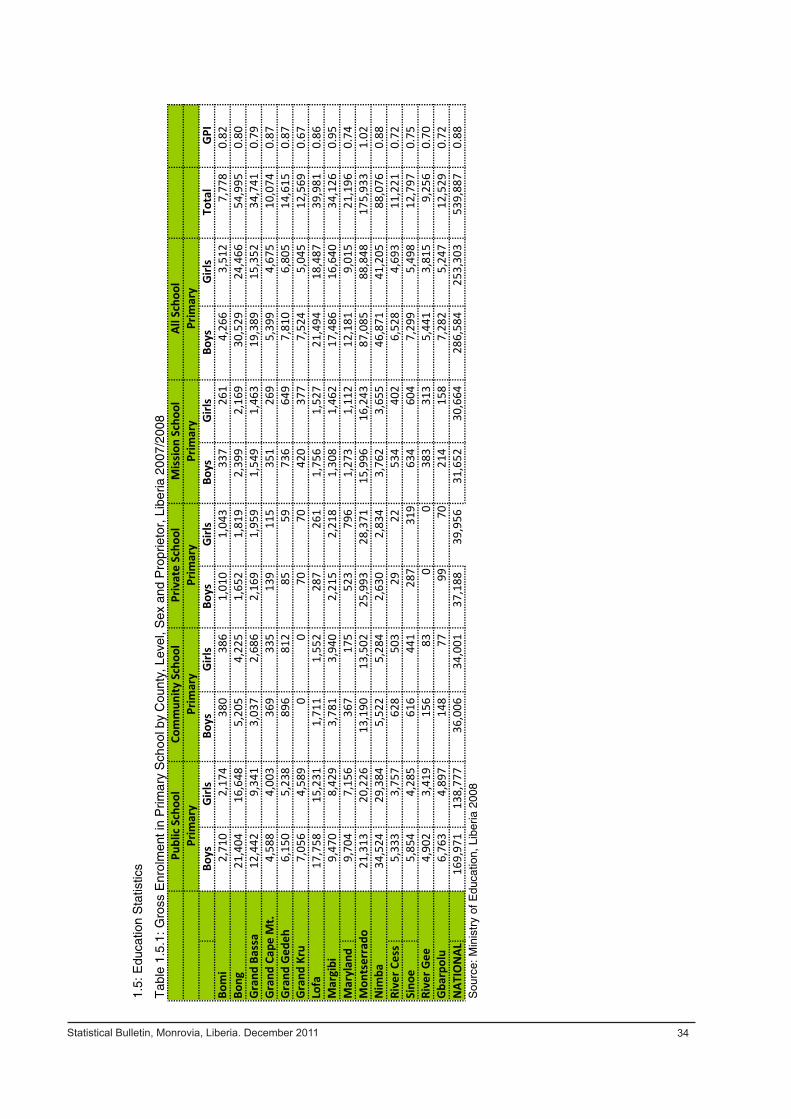
Statistical Bulletin, Monrovia, Liberia. December 2011 34
Boys
Girls
Boys
Girls
Boys
Girls
Boys
Girls
Boys
Girls
Tota
lGP
I2,
710
2,17
438
0
386
1,01
0
1,04
3
337
261
4,26
63,
512
7,77
80.
8221
,404
16,6
485,
205
4,22
5
1,65
2
1,81
9
2,39
9
2,16
9
30,5
2924
,466
54,9
950.
80Gr
and
Bass
a12
,442
9,34
13,
037
2,68
6
2,16
9
1,95
9
1,54
9
1,46
3
19,3
8915
,352
34,7
410.
79Gr
and
Cape
Mt.
4,58
84,
003
369
33
5
13
9
11
5
35
1
26
9
5,
399
4,67
510
,074
0.87
Gran
d Ge
deh
6,15
05,
238
896
81
2
85
59
73
6
64
9
7,
810
6,80
514
,615
0.87
7,05
64,
589
00
70
70
420
377
7,52
45,
045
12,5
690.
6717
,758
15,2
311,
711
1,55
2
287
261
1,75
6
1,52
7
21,4
9418
,487
39,9
810.
869,
470
8,42
93,
781
3,94
0
2,21
5
2,21
8
1,30
8
1,46
2
17,4
8616
,640
34,1
260.
95M
aryl
and
9,70
47,
156
367
17
5
52
3
79
6
1,
273
1,
112
12
,181
9,01
521
,196
0.74
Mon
tser
rado
21,3
1320
,226
13,1
90
13,5
02
25
,993
28,3
71
15
,996
16,2
43
87
,085
88,8
4817
5,93
31.
0234
,524
29,3
845,
522
5,28
4
2,63
0
2,83
4
3,76
2
3,65
5
46,8
7141
,205
88,0
760.
88Ri
ver C
ess
5,33
33,
757
628
50
3
29
22
53
4
40
2
6,
528
4,69
311
,221
0.72
Sino
e5,
854
4,28
561
6
441
287
319
634
604
7,29
95,
498
12,7
970.
754,
902
3,41
915
6
83
00
383
313
5,44
13,
815
9,25
60.
706,
763
4,89
714
8
77
9970
214
158
7,28
25,
247
12,5
290.
72N
ATIO
NAL
169,
971
138,
777
36,0
06
34,0
01
37
,188
39,9
56
31
,652
30,6
64
28
6,58
425
3,30
353
9,88
70.
88S
ourc
e: M
inis
try
of E
duca
tion,
Lib
eria
200
8
Gran
d Ca
pe M
ount
Rive
r Gee
Gbar
polu
1.5:
Edu
catio
n S
tatis
tics
Tab
le 1
.5.1
: Gro
ss E
nrol
men
t in
Prim
ary
Sch
ool b
y C
ount
y, L
evel
, Sex
and
Pro
prie
tor,
Lib
eria
200
7/20
08
Prim
ary
Prim
ary
Nim
ba
Mar
gibi
Lofa
Bom
i
All S
choo
lPu
blic
Sch
ool
Com
mun
ity S
choo
lPr
ivat
e Sc
hool
Bong
Gran
d Kr
u
Mis
sion
Sch
ool
Prim
ary
Prim
ary
Prim
ary P
age2
4S
tatis
tical
Bul
letin
201
1

Tab
le 1
.5.2
: Gro
ss E
nrol
men
t in
Prim
ary
Sch
ool b
y C
ount
y, L
evel
, Sex
and
Pro
prie
tor,
Lib
eria
200
8/20
09
Boys
Girls
Boys
Girls
Boys
Girls
Boys
Girls
Boys
Girls
Tota
lGP
I3,
378
2,
874
46
7
381
898
790
496
479
5,23
9
4,
524
9,76
3
0.
9324
,216
18,6
56
4,99
0
4,
041
1,
352
1,
362
2,
647
2,
415
33
,205
26,4
74
59,6
79
0.88
Gran
d Ba
ssa
10,2
66
6,
848
2,
608
2,20
7
1,78
9
1,34
7
2,35
4
2,02
6
17,0
17
12
,428
29
,445
0.
79Gr
and
Cape
Mt.
5,89
1
4,47
6
538
39
5
18
4
15
4
34
0
31
5
6,
953
5,34
0
12
,293
0.
86Gr
and
Gede
h7,
817
5,
998
68
2
633
319
292
650
565
9,46
8
7,
488
16,9
56
0.86
8,63
4
5,78
9
-
-
23
21
664
566
9,32
1
6,
376
15,6
97
0.76
21,3
87
17
,423
2,
185
1,73
2
7
10
2,
416
2,
121
25
,995
21,2
86
47,2
81
0.86
8,63
1
7,75
8
4,28
0
4,
300
4,
053
4,
069
1,
293
1,
279
18
,257
17,4
06
35,6
63
0.93
Mar
ylan
d 8,
469
6,
620
59
6
411
1,36
9
1,01
8
1,79
3
1,80
2
12,2
27
9,
851
22,0
78
0.88
Mon
tser
rado
26,7
67
23
,931
9,
843
10,1
35
47
,544
49,9
44
20
,417
20,0
64
10
4,57
1
104,
074
208,
645
0.
8838
,101
31,5
75
5,14
3
4,
368
2,
891
2,
783
5,
403
4,
968
51
,538
43,6
94
95,2
32
0.92
Rive
r Ces
s5,
618
3,
943
52
5
322
-
-
499
400
6,64
2
4,
665
11,3
07
0.83
Sino
e7,
187
5,
254
62
7
628
342
258
760
674
8,91
6
6,
814
15,7
30
0.88
5,69
3
4,23
3
393
30
1
31
19
26
5
21
5
6,
382
4,76
8
11
,150
0.
867,
726
5,
710
12
1
74
52
32
370
232
8,26
9
6,
048
14,3
17
0.75
NAT
ION
AL18
9,78
1
15
1,08
8
32
,998
29
,928
60,8
54
62
,099
40,3
67
38
,121
324,
000
28
1,23
6
60
5,23
6
0.88
Sou
rce:
Min
istr
y of
Edu
catio
n, L
iber
ia 2
010
Bong
Gran
d Kr
uLo
fa
Prim
ary
Prim
ary
Coun
tyBo
mi
Prim
ary
Mis
sion
Sch
ool
All S
choo
lPr
imar
yPr
imar
yPu
blic
Sch
ool
Priv
ate
Scho
olCo
mm
unity
Sch
ool
Mar
gibi
Nim
ba
Rive
r Gee
Gbar
polu
Pag
e25
Sta
tistic
al B
ulle
tin 2
011
Statistical Bulletin, Monrovia, Liberia. December 2011 35
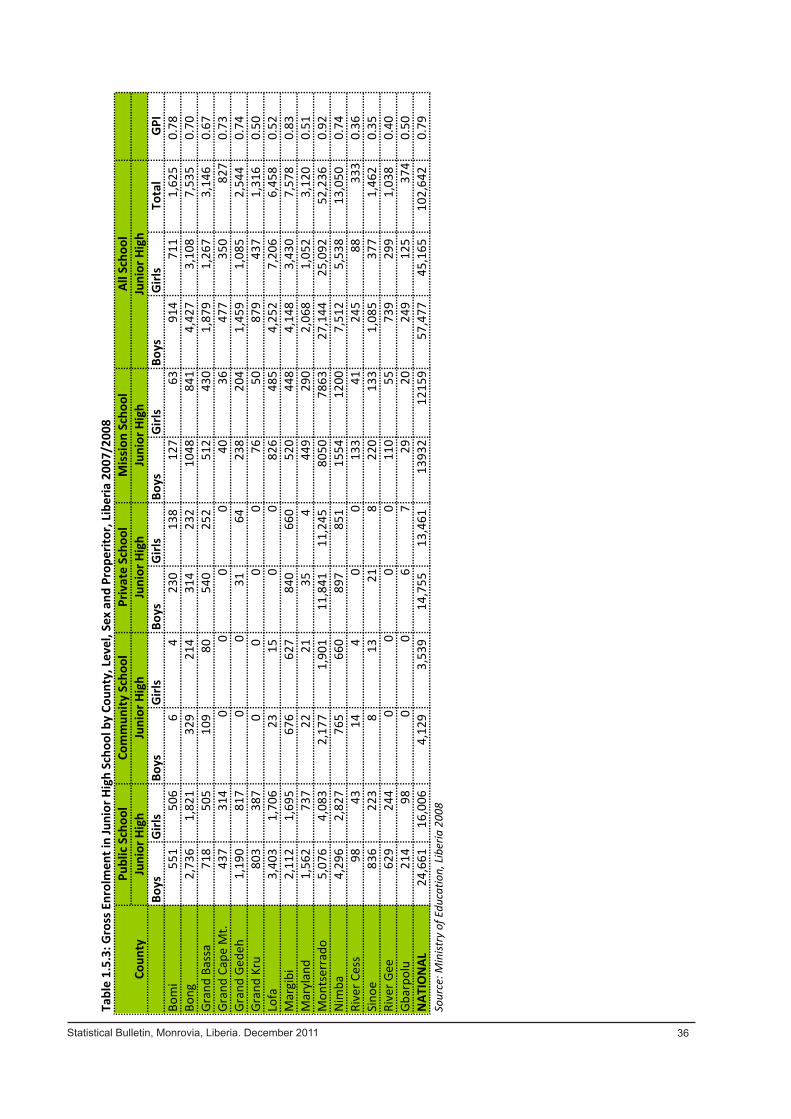
Boys
Girls
Boys
Girls
Boys
Girls
Boys
Girls
Boys
Girls
Tota
lGP
IBo
mi
551
506
6
4
230
138
127
6391
471
11,
625
0.78
Bong
2,73
61,
821
329
21
4
314
232
1048
841
4,42
73,
108
7,53
5
0.
70Gr
and
Bass
a71
850
510
9
80
54
0
25
2
51
243
01,
879
1,26
73,
146
0.67
Gran
d Ca
pe M
t.43
731
40
00
040
3647
735
082
70.
73Gr
and
Gede
h1,
190
817
00
31
64
238
204
1,45
91,
085
2,54
4
0.
74Gr
and
Kru
803
387
00
00
7650
879
437
1,31
60.
50Lo
fa3,
403
1,70
623
15
0
082
648
54,
252
7,20
66,
458
0.52
Mar
gibi
2,11
21,
695
676
62
7
840
660
520
448
4,14
83,
430
7,57
8
0.
83M
aryl
and
1,56
273
722
21
35
4
44
929
02,
068
1,05
23,
120
0.51
Mon
tser
rado
5,07
64,
083
2,17
7
1,
901
11,8
41
11
,245
8050
7863
27,1
4425
,092
52,2
36
0.92
Nim
ba4,
296
2,82
776
5
660
89
7
85
1
15
5412
007,
512
5,53
813
,050
0.
74Ri
ver C
ess
9843
14
4
0
013
341
245
8833
30.
36Si
noe
836
223
8
13
21
822
013
31,
085
377
1,46
2
0.
35Ri
ver G
ee62
924
40
00
011
055
739
299
1,03
8
0.
40Gb
arpo
lu21
498
00
67
2920
249
125
374
0.50
NAT
ION
AL24
,661
16,0
064,
129
3,53
9
14
,755
13,4
61
13
932
1215
957
,477
45,1
6510
2,64
20.
79So
urce
: Min
istry
of E
duca
tion,
Libe
ria 2
008
Juni
or H
igh
Tabl
e 1.
5.3:
Gro
ss E
nrol
men
t in
Juni
or H
igh
Scho
ol b
y Co
unty
, Lev
el, S
ex a
nd P
rope
ritor
, Lib
eria
200
7/20
08M
issi
on S
choo
lCo
unty
Publ
ic S
choo
lCo
mm
unity
Sch
ool
Priv
ate
Scho
olJu
nior
Hig
hAl
l Sch
ool
Juni
or H
igh
Juni
or H
igh
Juni
or H
igh P
age2
6S
tatis
tical
Bul
letin
Statistical Bulletin, Monrovia, Liberia. December 2011 36

Coun
tyBo
ysGi
rlsBo
ysGi
rlsBo
ysGi
rlsBo
ysGi
rlsBo
ysGi
rlsTo
tal
GPI
Bom
i70
151
852
20
27
6
23
6
16
3
96
1,
192
870
2,06
20.
88Bo
ng3,
144
1,79
337
5
235
11
6
80
1,
088
87
8
4,
723
2,98
67,
709
0.74
Gran
d Ba
ssa
688
378
144
13
9
340
161
771
542
1,94
31,
220
3,16
30.
72Gr
and
Cape
Mt.
649
376
00
00
7657
725
433
1,15
80.
70Gr
and
Gede
h1,
329
859
00
29
936
3
22
0
1,
721
1,08
82,
809
0.74
Gran
d Kr
u91
440
30
00
012
094
1,03
449
71,
531
0.61
Lofa
3,44
91,
526
216
91
00
1066
612
4,73
12,
229
6,96
00.
52M
argi
bi1,
758
960
480
49
0
910
671
621
610
3,76
92,
731
6,50
00.
72M
aryl
and
1,62
497
256
38
27
0
13
5
63
649
7
2,
586
1,64
24,
228
0.72
Mon
tser
rado
7,68
15,
794
1,94
9
1,
787
13,1
85
12
,940
10,2
74
9,
809
33
,089
30,3
3063
,419
0.78
Nim
ba4,
762
3,11
656
3
461
1,
129
94
8
1,
911
1,
407
8,
365
5,93
214
,297
0.82
Rive
r Ces
s16
561
7
5
00
145
7431
714
045
70.
55Si
noe
674
254
28
26
50
1921
714
1
96
944
01,
409
0.60
Rive
r Gee
699
262
00
4
10
6328
76
630
01,
066
0.47
Gbar
polu
458
209
11
9
00
4111
510
229
739
0.50
NAT
ION
AL28
,695
17,4
813,
881
3,30
1
16
,309
15,2
09
17
,555
15,0
76
66,4
4051
,067
117,
507
0.79
Tabl
e 1.
5.4:
Gro
ss E
nrol
men
t in
Juni
or H
igh
Scho
ol b
y Co
unty
, Lev
el, S
ex a
nd P
ropr
ieto
r, Li
beria
200
8/20
09
Juni
or H
igh
Com
mun
ity S
choo
lGr
and
Cape
Mou
ntM
issi
on S
choo
lAl
l Sch
ool
Juni
or H
igh
Juni
or H
igh
Juni
or H
igh
Priv
ate
Scho
olJu
nior
Hig
hPu
blic
Sch
ool
Sour
ce: M
inist
ry o
f Edu
catio
n, Li
beria
201
0
Pag
e27
Sta
tistic
al B
ulle
tin
Statistical Bulletin, Monrovia, Liberia. December 2011 37

Boys
Girls
Boys
Girls
Boys
Girls
Boys
Girls
Boys
Girls
Tota
lGP
IBo
mi
242
246
00
33
21
104
4437
931
169
00.
82Bo
ng1,
058
437
57
9
11
6
80
86
5
57
42,
096
1,10
03,
196
0.52
Gran
d Ba
ssa
235
179
00
297
122
379
258
911
559
1,47
00.
61Gr
and
Cape
Mt.
8418
00
00
145
9823
121
0.23
Gran
d Ge
deh
596
155
00
29
22
94
6671
924
396
20.
34Gr
and
Kru
125
180
00
00
012
518
143
0.14
1,23
435
821
13
0
036
013
51,
615
506
2,12
10.
31M
argi
bi1,
356
705
175
15
5
430
316
326
326
2,28
71,
502
3,78
90.
66M
aryl
and
1,09
536
30
00
018
0
19
51,
275
558
1,83
30.
44M
onts
erra
do3,
129
1,64
377
7
648
7,
704
6,
309
7,
843
69
6419
,453
15,5
6435
,017
0.80
Nim
ba1,
572
810
339
27
8
582
520
854
542
3,34
72,
150
5,49
70.
64Ri
ver C
ess
315
00
00
65
3710
470.
27Si
noe
169
500
00
012
3
33
292
8337
50.
28Ri
ver G
ee16
628
00
00
29
1119
539
234
0.20
Gbar
polu
7728
00
00
00
7728
105
0.36
NAT
ION
AL11
,169
5,04
31,
369
1,10
3
9,
191
7,
390
11
,177
9,15
8
32,9
0622
,694
55,6
000.
69
Tabl
e 1.
5.5:
Gro
ss E
nrol
men
t in
Seni
or H
igh
Scho
ol b
y Co
unty
, Lev
el, S
ex a
nd P
ropr
ieto
r, Li
beria
200
7/20
08
Seni
or H
igh
Seni
or H
igh
All S
choo
l
Sour
ce: M
inist
ry o
f Edu
catio
n, Li
beria
200
8
Seni
or H
igh
Mis
sion
Sch
ool
Priv
ate
Scho
olPu
blic
Sch
ool
Com
mun
ity S
choo
lSe
nior
Hig
hCo
unty
Seni
or H
igh
Pag
e28
Sta
tistic
al B
ulle
tin
Statistical Bulletin, Monrovia, Liberia. December 2011 38
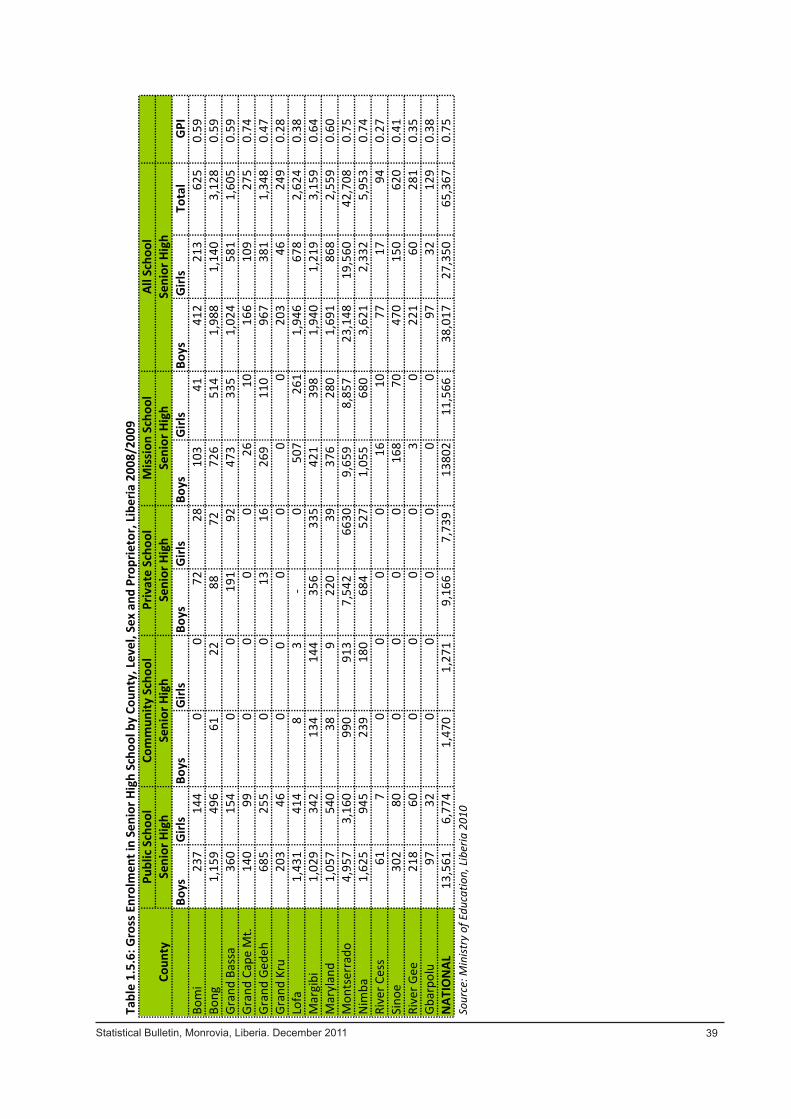
Boys
Girls
Boys
Girls
Boys
Girls
Boys
Girls
Boys
Girls
Tota
lGP
IBo
mi
237
144
00
7228
103
41
412
213
625
0.59
Bong
1,15
949
661
22
88
72
72
6
51
4
1,
988
1,14
03,
128
0.59
Gran
d Ba
ssa
360
154
00
191
9247
3
33
5
1,
024
581
1,60
50.
59Gr
and
Cape
Mt.
140
990
00
026
1016
610
927
50.
74Gr
and
Gede
h68
525
50
013
1626
9
11
0
96
738
11,
348
0.47
Gran
d Kr
u20
346
00
00
00
203
4624
90.
28Lo
fa1,
431
414
8
3-
050
726
11,
946
678
2,62
40.
38M
argi
bi1,
029
342
134
14
4
356
335
421
398
1,94
01,
219
3,15
90.
64M
aryl
and
1,05
754
038
9
220
3937
6
28
0
1,
691
868
2,55
90.
60M
onts
erra
do4,
957
3,16
099
0
913
7,
542
66
309,
659
8,
857
23
,148
19,5
6042
,708
0.75
Nim
ba1,
625
945
239
18
0
684
527
1,05
5
680
3,62
12,
332
5,95
30.
74Ri
ver C
ess
617
00
00
1610
7717
940.
27Si
noe
302
800
00
016
870
470
150
620
0.41
Rive
r Gee
218
600
00
03
022
160
281
0.35
Gbar
polu
9732
00
00
00
9732
129
0.38
NAT
ION
AL13
,561
6,77
41,
470
1,27
1
9,
166
7,
739
13
802
11,5
66
38,0
1727
,350
65,3
670.
75So
urce
: Min
istry
of E
duca
tion,
Libe
ria 2
010
Coun
tyPu
blic
Sch
ool
Com
mun
ity S
choo
lSe
nior
Hig
hSe
nior
Hig
h
Tabl
e 1.
5.6:
Gro
ss E
nrol
men
t in
Seni
or H
igh
Scho
ol b
y Co
unty
, Lev
el, S
ex a
nd P
ropr
ieto
r, Li
beria
200
8/20
09Al
l Sch
ool
Seni
or H
igh
Seni
or H
igh
Seni
or H
igh
Priv
ate
Scho
olM
issi
on S
choo
l
Pag
e29
Sta
tistic
al B
ulle
tin
Statistical Bulletin, Monrovia, Liberia. December 2011 39

County GER Boys GER Girls GER BothNER Boys 6-11 NER Girls 6-11NER Both 6-11
Bomi 59% 51% 55% 19% 17% 18%Bong 1% 85% 97% 37% 30% 33%Grand Bassa 100% 79% 89% 32% 28% 30%Grand Cape Mt. 46% 44% 45% 21% 19% 20%Grand Gedeh 69% 65% 67% 19% 18% 19%Grand Kru 148% 105% 127% 42% 30% 36%Lofa 95% 77% 86% 46% 40% 43%Margibi 101% 97% 99% 38% 36% 37%Maryland 99% 80% 90% 24% 17% 21%Montserrado 86% 92% 89% 38% 42% 40%Nimba 116% 102% 109% 33% 30% 31%River Cess 111% 85% 98% 22% 17% 19%Sinoe 77% 64% 70% 19% 17% 18%River Gee 89% 69% 79% 26% 22% 24%Gbapolu 94% 77% 86% 32% 30% 31%National 93% 85% 89% 34% 32% 33%Source: Ministry of Education, Liberia 2008
County GER Boys GER Girls GER Both NER Both12-14
Source: Ministry of Education, Liberia 2008
Table 1.5.7: Estimates of Primary School Level Net and Gross Enrollment Rates by County and Sex, Liberia 2007/2008
Page30 Statiscal Bullltin 2011
County GER Boys GER Girls GER Both NER Both 6-11
Source: Ministry of Education, Liberia 2008
County GER Boys GER Girls GER BothNER Boys 12-14 NER Girls 12-14NER Both12-14
Bomi 30% 24% 27% 2% 2% 2%
Grand Cape Mount 37% 26% 31% 2% 1% 1%Grand Bassa 23% 15% 19% 2% 2% 2%Grand Cape Mt. 10% 8% 9% 1% 1% 1%Grand Gedeh 31% 24% 28% 1% 1% 1%Grand Kru 41% 22% 32% 1% 1% 1%Lofa 45% 22% 33% 2% 1% 2%Margibi 57% 47% 52% 8% 7% 8%Maryland 40% 22% 31% 2% 1% 2%Montserrado 63% 62% 63% 11% 11% 11%Nimba 44% 32% 38% 2% 2% 2%River Cess 10% 4% 7% 0% 0% 0%Sinoe 27% 10% 19% 1% 1% 1%River Gee 29% 13% 21% 1% 0% 1%Gbapolu 8% 4% 6% 1% 1% 1%National 45% 36% 40% 5% 5% 5%Source: Ministry of Education, Liberia 2008
Table 1.5.8: Estimates of Junior School Level Net and Gross Enrollment Rates by County and Sex, Liberia 2007/2008
Page30 Statiscal Bullltin 2011
Statistical Bulletin, Monrovia, Liberia. December 2011 40

County GER Boys GER Girls GER BothNER Boys 12-14 NER Girls 12-14NER Both12-14
Bomi 14% 12% 13% 1% 0% 1%Bong 20% 10% 15% 3% 2% 3%Grand Bassa 12% 8% 10% 2% 1% 1%Grand Cape Mt. 2% 1% 1% 0% 0% 0%Grand Gedeh 17% 6% 12% 0% 0% 0%Grand Kru 6% 1% 4% 0% 0% 0%Lofa 19% 6% 12% 3% 1% 2%Margibi 35% 23% 29% 6% 6% 6%Maryland 27% 13% 20% 6% 3% 4%Montserrado 50% 43% 47% 14% 13% 13%Nimba 22% 14% 18% 2% 1% 1%River Cess 2% 0% 1% 0% 0% 0%Sinoe 8% 3% 5% 0% 0% 0%River Gee 8% 2% 5% 0% 0% 0%
3% 1% 2% 0% 0% 0%National 28% 30% 24% 6% 5% 6%Source: Ministry of Education, Liberia 2008
County GER Boys GER Girls GER Both NER Both 6-11
Source: Ministry of Education, Liberia 2010
Table 1.5.9: Estimates of Senior School Level Net and Gross Enrolment Rates by County and Sex, Liberia 2007/2008
Table 1.5.10: Estimates of Primary School Level Net and Gross Enrolment Rates by County and Sex, Liberia 2008/2009
Page31 Statiscal Bullltin 2011
County GER Boys GER Girls GER Both NER Both12-14
Source: Ministry of Education, Liberia 2008
County GER Boys GER Girls GER BothNER Boys 6-11 NER Girls 6-11NER Both 6-11
Bomi 72% 67% 70% 25% 24% 25%Bong 119% 104% 112% 38% 35% 37%Grand Bassa 93% 74% 84% 30% 25% 28% Cape Mount 62% 53% 58% 31% 26% 29%Grand Gedeh 95% 81% 88% 30% 26% 28%Grand Kru 167% 127% 148% 62% 48% 55%Lofa 105% 91% 98% 48% 43% 46%Margibi 105% 97% 101% 43% 40% 42%Maryland 91% 80% 86% 38% 33% 36%Montserrado 128% 112% 119% 60% 53% 57%Nimba 127% 117% 122% 40% 39% 40%River Cess 98% 81% 90% 22% 18% 20%Sinoe 92% 81% 87% 28% 25% 27%River Gee 93% 80% 87% 22% 21% 22%Gbapolu 111% 83% 97% 56% 43% 50%National 112% 99% 106% 44% 40% 42%Source: Ministry of Education, Liberia 2010
Table 1.5.10: Estimates of Primary School Level Net and Gross Enrolment Rates by County and Sex, Liberia 2008/2009
Page31 Statiscal Bullltin 2011
Statistical Bulletin, Monrovia, Liberia. December 2011 41
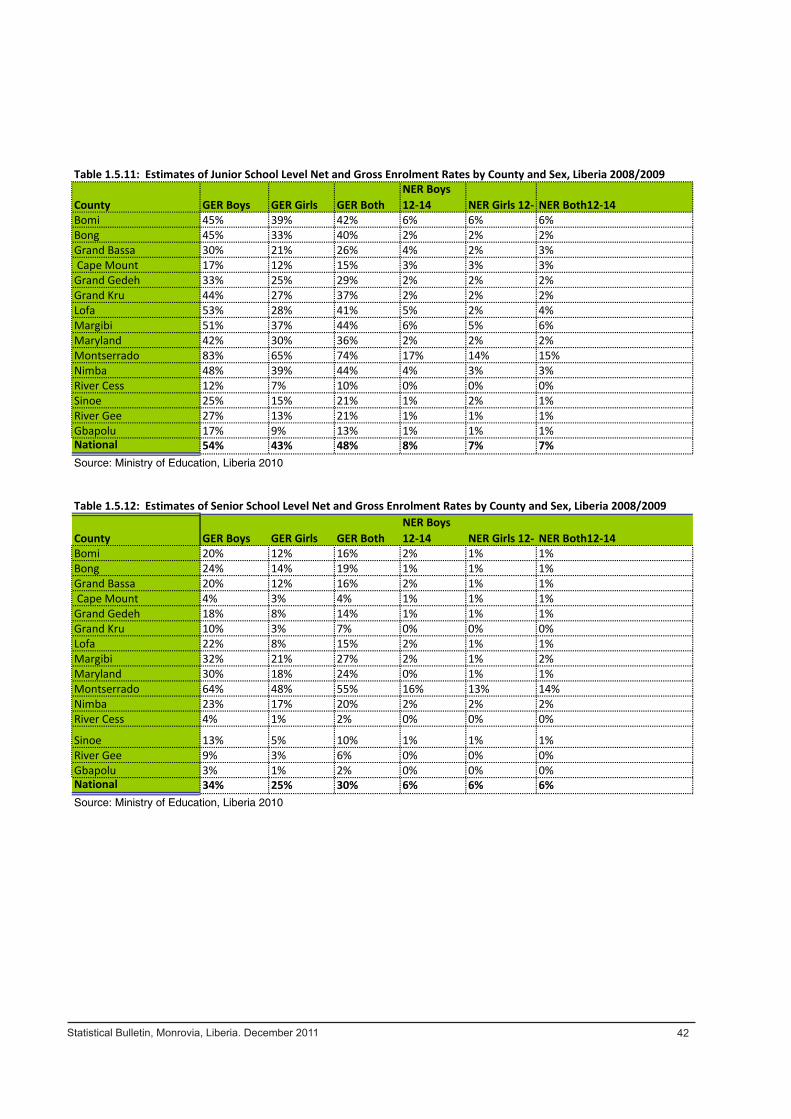
Statistical Bulletin, Monrovia, Liberia. December 2011 42
County GER Boys GER Girls GER BothNER Boys 12-14 NER Girls 12-14NER Both12-14
Bomi 45% 39% 42% 6% 6% 6%Bong 45% 33% 40% 2% 2% 2%Grand Bassa 30% 21% 26% 4% 2% 3% Cape Mount 17% 12% 15% 3% 3% 3%Grand Gedeh 33% 25% 29% 2% 2% 2%Grand Kru 44% 27% 37% 2% 2% 2%Lofa 53% 28% 41% 5% 2% 4%Margibi 51% 37% 44% 6% 5% 6%Maryland 42% 30% 36% 2% 2% 2%Montserrado 83% 65% 74% 17% 14% 15%Nimba 48% 39% 44% 4% 3% 3%River Cess 12% 7% 10% 0% 0% 0%Sinoe 25% 15% 21% 1% 2% 1%River Gee 27% 13% 21% 1% 1% 1%Gbapolu 17% 9% 13% 1% 1% 1%National 54% 43% 48% 8% 7% 7%Source: Ministry of Education, Liberia 2010
County GER Boys GER Girls GER BothNER Boys 12-14 NER Girls 12-14NER Both12-14
Bomi 20% 12% 16% 2% 1% 1%Bong 24% 14% 19% 1% 1% 1%Grand Bassa 20% 12% 16% 2% 1% 1% Cape Mount 4% 3% 4% 1% 1% 1%Grand Gedeh 18% 8% 14% 1% 1% 1%Grand Kru 10% 3% 7% 0% 0% 0%Lofa 22% 8% 15% 2% 1% 1%Margibi 32% 21% 27% 2% 1% 2%Maryland 30% 18% 24% 0% 1% 1%Montserrado 64% 48% 55% 16% 13% 14%Nimba 23% 17% 20% 2% 2% 2%River Cess 4% 1% 2% 0% 0% 0%
Sinoe 13% 5% 10% 1% 1% 1%River Gee 9% 3% 6% 0% 0% 0%Gbapolu 3% 1% 2% 0% 0% 0%National 34% 25% 30% 6% 6% 6%Source: Ministry of Education, Liberia 2010
Table 1.5.12: Estimates of Senior School Level Net and Gross Enrolment Rates by County and Sex, Liberia 2008/2009
Table 1.5.11: Estimates of Junior School Level Net and Gross Enrolment Rates by County and Sex, Liberia 2008/2009
Page32 Statiscal Bullltin 2011

Statistical Bulletin, Monrovia, Liberia. December 2011 43
County GIR Male GIR Female GIR All NIR Male NIR Female NIR AllBomi 97% 85% 91% 1.8% 2.0% 1.9%Bong 165% 141% 154% 6.2% 6.4% 6.3%Grand Bassa 138% 110% 124% 5.1% 4.2% 4.6%Grand Cape Mount 90% 73% 82% 6.7% 6.1% 6.4%Grand Gedeh 127% 103% 115% 6.6% 5.0% 5.8%Grand Kru 222% 180% 202% 9.4% 5.5% 7.6%Lofa 131% 120% 125% 7.5% 7.3% 7.4%Margibi 149% 139% 144% 8.2% 8.6% 8.4%Maryland 137% 117% 127% 7.5% 4.2% 5.9%Montserrado 174% 153% 163% 14.3% 13.1% 13.7%Nimba 178% 166% 172% 12.4% 12.0% 12.2%River Cess 152% 116% 135% 1.6% 1.4% 1.5%Sinoe 132% 116% 125% 5.5% 5.1% 5.3%River Gee 124% 115% 120% 1.6% 1.6% 1.6%Gbarpolu 200% 153% 177% 9.1% 7.4% 8.3%NATIONAL 155% 136% 46% 9.3% 8.6% 8.9%Source: Ministry of Education, Liberia 2010
County GIR Male GIR Female GIR All NIR Male NIR Female NIR AllBomi 45% 40% 43% 1.6% 1.3% 1.5%Bong 46% 38% 43% 0.3% 0.2% 0.2%
Grand Cape Mount 27% 21% 24% 0.2% 0.8% 0.5%Grand Cape Mount 20% 14% 17% 0.9% 1.1% 1.0%Grand Gedeh 33% 28% 31% 0.3% 0.6% 0.4%Grand Kru 47% 35% 42% 0.3% 0.3% 0.3%Lofa 51% 28% 40% 1.6% 0.6% 1.1%Margibi 44% 35% 39% 1.6% 1.4% 1.5%Maryland 39% 31% 35% 0.9% 0.5% 0.7%Montserrado 83% 65% 73% 6.0% 4.7% 5.3%Nimba 51% 42% 47% 1.9% 1.2% 1.6%River Cess 14% 9% 12% 0.0% 0.0% 0.0%Sinoe 25% 16% 21% 0.5% 0.6% 0.5%River Gee 30% 15% 24% 0.2% 0.1% 0.2%Gbarpolu 19% 12% 16% 0.4% 0.3% 0.3%NATIONAL 53% 43% 48% 2.5% 2.2% 2.4%Source: Ministry of Education, Liberia 2010
Table 1.5.13: Estimates of Primary Level Net and Gross Intake Rates by County and Sex, Liberia 2008/2009
Table 1.5.14: Estimates of Junior High Level Net and Gross Intake Rates by County and Sex, Liberia 2008/2009
Page33 Statistical Bulletin 2011
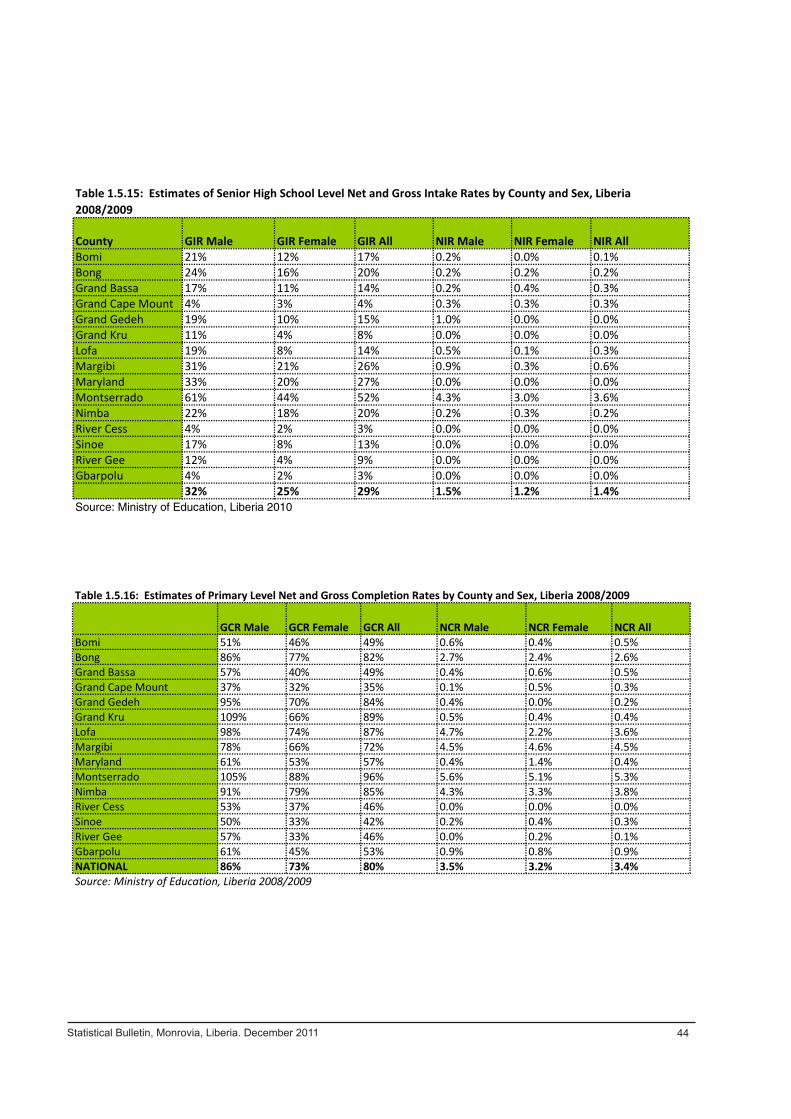
Statistical Bulletin, Monrovia, Liberia. December 2011 44
GCR Male GCR Female GCR All NCR Male NCR Female NCR AllBomi 51% 46% 49% 0.6% 0.4% 0.5%Bong 86% 77% 82% 2.7% 2.4% 2.6%Grand Bassa 57% 40% 49% 0.4% 0.6% 0.5%Grand Cape Mount 37% 32% 35% 0.1% 0.5% 0.3%Grand Gedeh 95% 70% 84% 0.4% 0.0% 0.2%Grand Kru 109% 66% 89% 0.5% 0.4% 0.4%Lofa 98% 74% 87% 4.7% 2.2% 3.6%Margibi 78% 66% 72% 4.5% 4.6% 4.5%Maryland 61% 53% 57% 0.4% 1.4% 0.4%Montserrado 105% 88% 96% 5.6% 5.1% 5.3%Nimba 91% 79% 85% 4.3% 3.3% 3.8%River Cess 53% 37% 46% 0.0% 0.0% 0.0%Sinoe 50% 33% 42% 0.2% 0.4% 0.3%River Gee 57% 33% 46% 0.0% 0.2% 0.1%Gbarpolu 61% 45% 53% 0.9% 0.8% 0.9%NATIONAL 86% 73% 80% 3.5% 3.2% 3.4%Source: Ministry of Education, Liberia 2008/2009
County GCR Male GCR Female GCR All NCR Male NCR Female NCR All
Grand Cape Mount 38% 25% 32% 0.5% 0.2% 0.3%
Table 1.5.16: Estimates of Primary Level Net and Gross Completion Rates by County and Sex, Liberia 2008/2009
Table 1.5.17: Estimates of Junior High Level Net and Gross Completion Rates by County and Sex, Liberia 2008/2009
Page34 Statistical Bulletin 2011
County GIR Male GIR Female GIR All NIR Male NIR Female NIR AllBomi 21% 12% 17% 0.2% 0.0% 0.1%Bong 24% 16% 20% 0.2% 0.2% 0.2%Grand Bassa 17% 11% 14% 0.2% 0.4% 0.3%Grand Cape Mount 4% 3% 4% 0.3% 0.3% 0.3%Grand Gedeh 19% 10% 15% 1.0% 0.0% 0.0%Grand Kru 11% 4% 8% 0.0% 0.0% 0.0%Lofa 19% 8% 14% 0.5% 0.1% 0.3%Margibi 31% 21% 26% 0.9% 0.3% 0.6%Maryland 33% 20% 27% 0.0% 0.0% 0.0%Montserrado 61% 44% 52% 4.3% 3.0% 3.6%Nimba 22% 18% 20% 0.2% 0.3% 0.2%River Cess 4% 2% 3% 0.0% 0.0% 0.0%Sinoe 17% 8% 13% 0.0% 0.0% 0.0%River Gee 12% 4% 9% 0.0% 0.0% 0.0%Gbarpolu 4% 2% 3% 0.0% 0.0% 0.0%
32% 25% 29% 1.5% 1.2% 1.4%Source: Ministry of Education, Liberia 2010
Table 1.5.15: Estimates of Senior High School Level Net and Gross Intake Rates by County and Sex, Liberia 2008/2009
Page34 Statistical Bulletin 2011

Statistical Bulletin, Monrovia, Liberia. December 2011 45
GCR Male GCR Female GCR All NCR Male NCR Female NCR All
County GCR Male GCR Female GCR All NCR Male NCR Female NCR AllBomi 33% 29% 31% 0.0% 0.0% 0.0%
Grand Cape Mount 38% 25% 32% 0.5% 0.2% 0.3%Grand Bassa 23% 17% 20% 0.4% 0.3% 0.4%Grand Cape Mount 11% 8% 10% 1.2% 1.2% 1.2%Grand Gedeh 23% 13% 18% 0.0% 0.1% 0.0%Grand Kru 29% 12% 22% 0.0% 0.2% 0.1%Lofa 43% 18% 31% 0.8% 0.4% 0.6%Margibi 63% 32% 47% 1.1% 0.8% 0.9%Maryland 30% 20% 26% 0.0% 0.1% 0.0%Montserrado 75% 57% 66% 5.0% 3.5% 4.1%Nimba 37% 27% 32% 0.8% 0.7% 0.8%River Cess 9% 4% 7% 0.0% 0.0% 0.0%Sinoe 189% 11% 16% 0.0% 0.1% 0.0%River Gee 16% 8% 12% 0.1% 0.1% 0.1%Gbarpolu 12% 2% 7% 0.3% 0.0% 0.2%NATIONAL 46% 34% 40% 1.9% 1.6% 1.8%Source: Ministry of Education, Liberia 2008/2009
Table 1.5.17: Estimates of Junior High Level Net and Gross Completion Rates by County and Sex, Liberia 2008/2009
Page34 Statistical Bulletin 2011
County GCR Male GCR Female GCR All NCR Male NCR Female NCR AllBomi 11% 7% 9% 0.2% 0.2% 0.2%Bong 21% 10% 15% 0.1% 0.1% 0.1%Grand Bassa 18% 10% 14% 0.1% 0.4% 0.2%Grand Cape Mount 3% 2% 2% 0.0% 0.0% 0.0%Grand Gedeh 16% 6% 11% 0.0% 0.0% 0.0%Grand Kru 7% 1% 4% 0.0% 0.0% 0.0%Lofa 23% 6% 15% 0.9% 0.0% 0.5%Margibi 32% 18% 25% 0.1% 0.1% 0.1%Maryland 24% 17% 21% 0.0% 0.0% 0.0%Montserrado 60% 46% 53% 5.3% 4.9% 5.1%Nimba 23% 14% 19% 0.5% 0.2% 0.4%River Cess 2% 0% 1% 0.0% 0.0% 0.0%Sinoe 10% 2% 6% 0.0% 0.0% 0.0%River Gee 7% 1% 4% 0.0% 0.0% 0.0%
2% 0% 1% 0.0% 0.0% 0.0%NATIONAL 34% 24% 29% 2.1% 2.0% 2.0%Source: Ministry of Education, Liberia 2008/2009
Table 1.5.18: Estimates of Senior High Level Net and Gross Completion by County and Sex, Liberia 2008/2009
Page35 Statistical Bulletin 2011
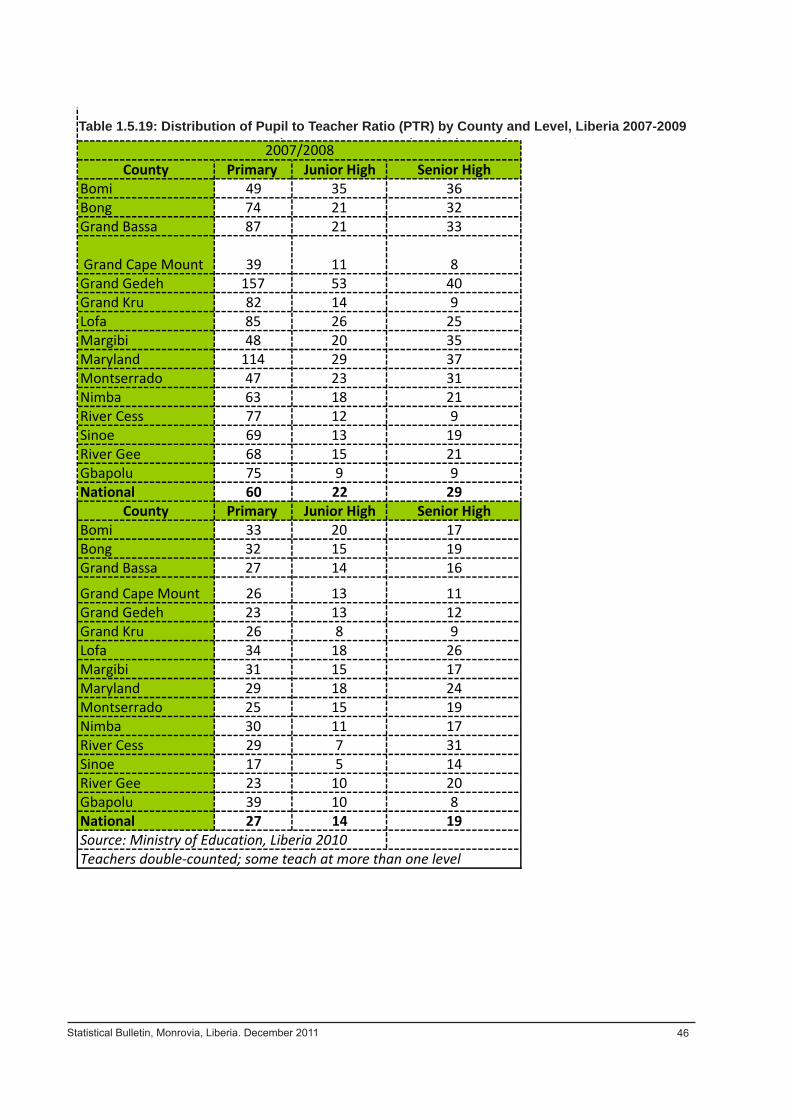
County Primary Junior High Senior HighBomi 49 35 36Bong 74 21 32Grand Bassa 87 21 33
Grand Cape Mount 39 11 8Grand Gedeh 157 53 40Grand Kru 82 14 9Lofa 85 26 25Margibi 48 20 35Maryland 114 29 37Montserrado 47 23 31Nimba 63 18 21River Cess 77 12 9Sinoe 69 13 19River Gee 68 15 21Gbapolu 75 9 9National 60 22 29
County Primary Junior High Senior HighBomi 33 20 17Bong 32 15 19Grand Bassa 27 14 16
Grand Cape Mount 26 13 11Grand Gedeh 23 13 12Grand Kru 26 8 9Lofa 34 18 26Margibi 31 15 17Maryland 29 18 24Montserrado 25 15 19Nimba 30 11 17River Cess 29 7 31Sinoe 17 5 14River Gee 23 10 20Gbapolu 39 10 8National 27 14 19Source: Ministry of Education, Liberia 2010Teachers double-counted; some teach at more than one level
2007/2008Table 1.5.19: Distribution of Pupil to Teacher Ratio (PTR) by County and Level, Liberia 2007-200
Page35 Statistical Bulletin 2011
Statistical Bulletin, Monrovia, Liberia. December 2011 46
Table 1.5.19: Distribution of Pupil to Teacher Ratio (PTR) by County and Level, Liberia 2007-2009
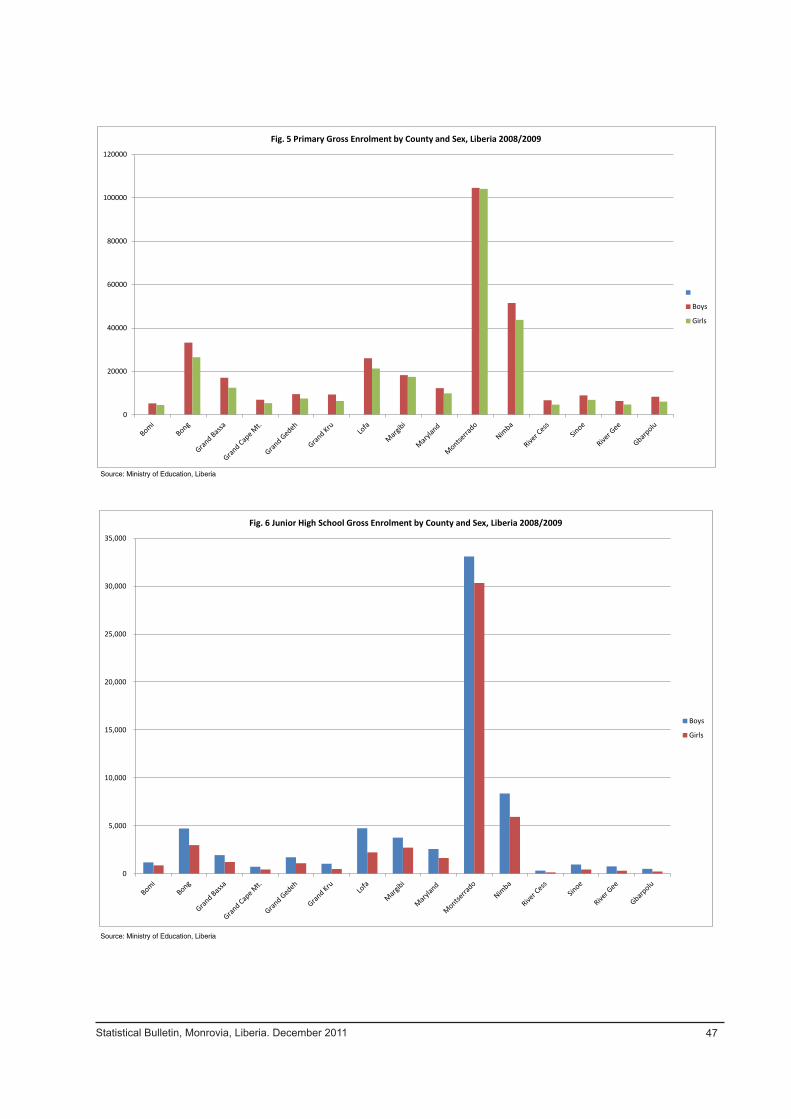
Source: Ministry of Education, Liberia
Source: Ministry of Education, Liberia
0
5,000
10,000
15,000
20,000
25,000
30,000
35,000
Fig. 6 Junior High School Gross Enrolment by County and Sex, Liberia 2008/2009
Boys
Girls
0
20000
40000
60000
80000
100000
120000
Fig. 5 Primary Gross Enrolment by County and Sex, Liberia 2008/2009
Boys
Girls
Page 36 Statistical Bulletin 2011
Statistical Bulletin, Monrovia, Liberia. December 2011 47
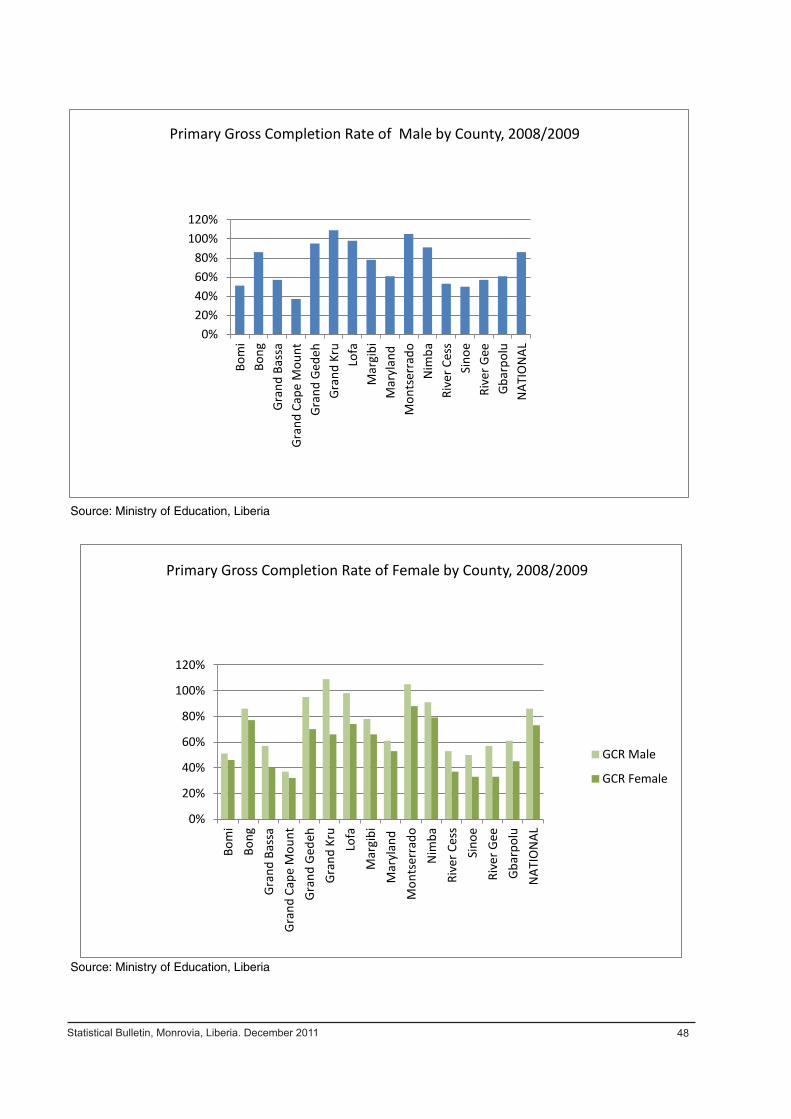
Source: Ministry of Education, Liberia
Source: Ministry of Education, Liberia
0% 20% 40% 60% 80%
100% 120%
Bom
i Bo
ng
Gran
d Ba
ssa
Gran
d Ca
pe M
ount
Gr
and
Gede
h Gr
and
Kru
Lofa
M
argi
bi
Mar
ylan
d
Mon
tser
rado
N
imba
Ri
ver C
ess
Sino
e Ri
ver G
ee
Gbar
polu
N
ATIO
NAL
Primary Gross Completion Rate of Male by County, 2008/2009
0%
20%
40%
60%
80%
100%
120%
Bom
i Bo
ng
Gran
d Ba
ssa
Gran
d Ca
pe M
ount
Gr
and
Gede
h Gr
and
Kru
Lofa
M
argi
bi
Mar
ylan
d
Mon
tser
rado
N
imba
Ri
ver C
ess
Sino
e Ri
ver G
ee
Gbar
polu
N
ATIO
NAL
Primary Gross Completion Rate of Female by County, 2008/2009
GCR Male
GCR Female
Page 37 Statistical Bulletin 2011
Statistical Bulletin, Monrovia, Liberia. December 2011 48

MF
MF
MF
MF
MF
MF
Tota
l%
1731
260
00
00
00
031
2657
0.19
%18
7521
58
69
0
00
00
013
390
223
0.72
%19
5437
43
14
53
48
0
00
015
099
249
0.81
%20
7255
39
33
18
25
48
53
00
177
166
343
1.11
%21
7651
44
63
17
14
43
10
3
318
314
132
41.
05%
2218
683
40
49
50
17
19
6
44
299
159
458
1.49
%23
7851
4928
37
28
28
9
12
1620
413
233
61.
09%
2435
3932
31
24
19
39
29
54
135
122
257
0.83
%25
498
162
269
13
2
18
9
11
2
10
4
12
2
15
1110
7553
916
145.
24%
2658
527
938
7
125
207
25
123
63
3536
1337
528
1865
6.06
%27
638
288
274
16
4
21
0
24
4
22
5
17
8
21
100
1368
974
2342
7.61
%28
363
137
330
24
2
19
9
33
6
28
8
23
6
10
211
612
8210
6723
497.
63%
2996
745
863
2
240
318
158
379
121
129
6724
2510
4434
6911
.27%
30-3
469
195
588
14
1
60
518
860
1
12
0
19
630
2,68
157
432
5510
.57%
35-3
913
187
948
17
0
42
810
866
3
14
6
60
398
2773
609
3382
10.9
9%>3
931
014
616
7
162
630
6551
7
82
38
913
520
1359
026
038.
46%
Age
not k
now
n82
577
589
0
832
1,31
696
31,
322
56
1
13
439
4,48
731
7076
5724
.87%
5,61
52,
790
4,79
02,
495
4,30
12,
350
4,39
91,
736
1,64
865
920
,753
10,0
3030
,783
Tota
l and
per
cent
age
by cl
ass
8,40
527
%7,
285
24%
6,65
122
%6,
135
20%
2,30
77%
67%
33%
Sou
rce:
Nat
iona
l Com
mis
sion
on
Hig
her
Edu
catio
n, 2
009/
2010
Gra
nd C
ape
Mou
nt
Tab
le 1
.6.2
: Gro
ss E
nrol
lmen
t in
Prim
ary
Sch
ool b
y C
ount
y, L
evel
, Sex
and
Pro
prie
tor,
Lib
eria
200
8/20
09
Boys
Girls
Boys
Girls
Boys
Girls
Boys
Girls
Boys
Girls
Tota
lGP
IBo
mi
3,37
8
2,87
4
467
38
1
89
8
79
0
49
6
47
9
5,
239
4,52
4
9,
763
0.93
Bong
24,2
16
18,6
56
4,99
0
4,
041
1,
352
1,
362
2,
647
2,
415
33
,205
26,4
74
59,6
79
0.88
Gran
d Ba
ssa
10,2
66
6,84
8
2,60
8
2,
207
1,
789
1,
347
2,
354
2,
026
17
,017
12,4
28
29,4
45
0.79
Gran
d Ca
pe M
t.5,
891
4,
476
53
8
395
184
154
340
315
6,95
3
5,
340
12,2
93
0.86
Gran
d Ge
deh
7,81
7
5,99
8
682
63
3
31
9
29
2
65
0
56
5
9,
468
7,48
8
16
,956
0.
86Gr
and
Kru
8,63
4
5,78
9
-
-
23
21
664
566
9,32
1
6,
376
15,6
97
0.76
Lofa
21,3
87
17,4
23
2,18
5
1,
732
7
10
2,41
6
2,12
1
25,9
95
21
,286
47
,281
0.
86M
argi
bi8,
631
7,
758
4,
280
4,30
0
4,05
3
4,06
9
1,29
3
1,27
9
18,2
57
17
,406
35
,663
0.
93M
aryl
and
8,46
9
6,62
0
596
41
1
1,
369
1,
018
1,
793
1,
802
12
,227
9,85
1
22
,078
0.
88M
onts
erra
do26
,767
23
,931
9,
843
10,1
35
47,5
44
49
,944
20,4
17
20
,064
104,
571
10
4,07
4
20
8,64
5
0.88
Nim
ba38
,101
31
,575
5,
143
4,36
8
2,89
1
2,78
3
5,40
3
4,96
8
51,5
38
43
,694
95
,232
0.
92Ri
ver C
ess
5,61
8
3,94
3
525
32
2
-
-
499
400
6,64
2
4,
665
11,3
07
0.83
Sino
e7,
187
5,
254
62
7
628
342
258
760
674
8,91
6
6,
814
15,7
30
0.88
Rive
r Gee
5,69
3
4,23
3
393
30
1
31
19
26
5
21
5
6,
382
4,76
8
11
,150
0.
86Gb
arpo
lu7,
726
5,
710
12
1
74
52
32
370
232
8,26
9
6,
048
14,3
17
0.75
NAT
ION
AL18
9,78
1
15
1,08
8
32
,998
29
,928
60
,854
62,0
99
40
,367
38,1
21
32
4,00
0
281,
236
605,
236
0.
88S
ourc
e: M
inis
try
of E
duca
tion,
Lib
eria
201
0
Tab
le 1
.5.2
0: E
nrol
men
t of i
nstit
utio
ns g
rant
ing
bacc
alau
reat
e de
gree
by
age
sex
and
clas
ses
2009
/201
0Fr
eshm
anSo
phom
ore
Juni
orSe
nior
Grad
uate
Tota
l
Prim
ary
Publ
ic S
choo
lCo
mm
unity
Sch
ool
Priv
ate
Scho
olM
issio
n Sc
hool
All S
choo
lPr
imar
yPr
imar
yPr
imar
yPr
imar
y
Pag
e 38
Sta
tistic
al B
ulle
tin 2
011
Statistical Bulletin, Monrovia, Liberia. December 2011 49
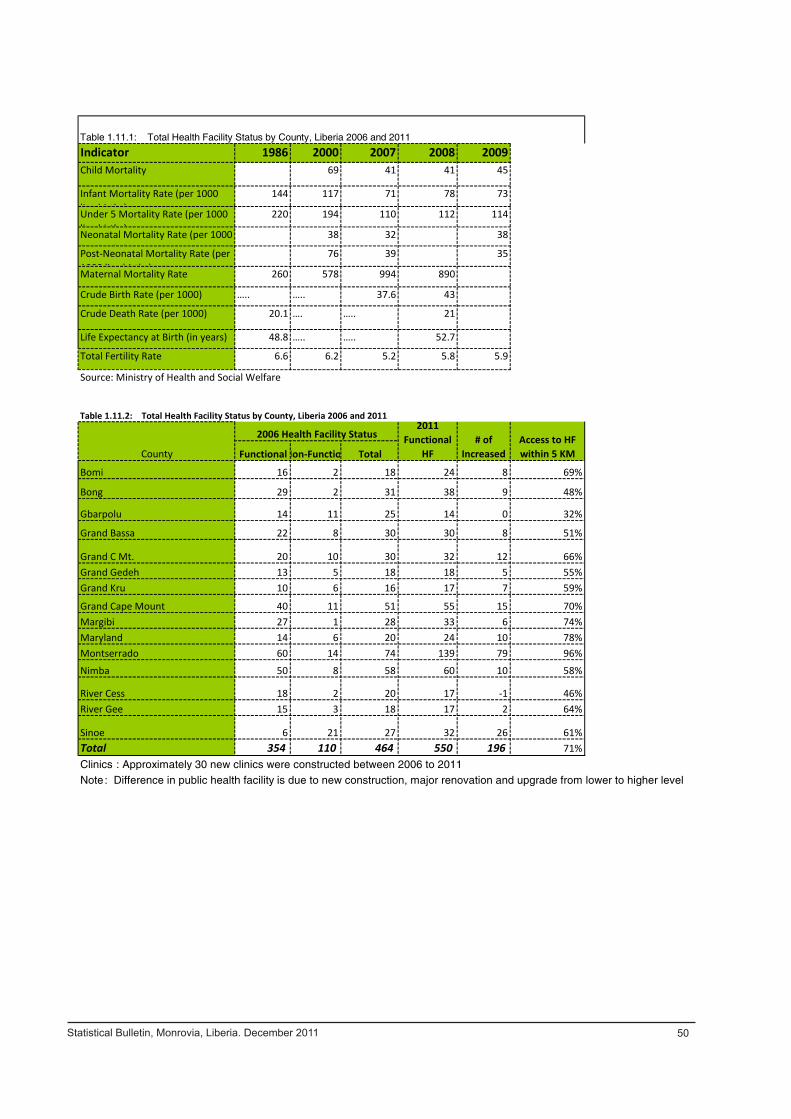
Indicator 1986 2000 2007 2008 2009Child Mortality 69 41 41 45
Infant Mortality Rate (per 1000 li births)
144 117 71 78 73
Under 5 Mortality Rate (per 1000 li births)
220 194 110 112 114
Neonatal Mortality Rate (per 1000 li births)
38 32 38
Post-Neonatal Mortality Rate (per 1000 live births)
76 39 35
Maternal Mortality Rate 260 578 994 890
Crude Birth Rate (per 1000) 37.6 43
Crude Death Rate (per 1000) 20.1 21
Life Expectancy at Birth (in years) 48.8 52.7
Total Fertility Rate 6.6 6.2 5.2 5.8 5.9
FunctionalNon-Functio Total
Bomi 16 2 18 24 8 69%
Bong 29 2 31 38 9 48%
Gbarpolu 14 11 25 14 0 32%
Grand Bassa 22 8 30 30 8 51%
Grand C Mt. 20 10 30 32 12 66%Grand Gedeh 13 5 18 18 5 55%Grand Kru 10 6 16 17 7 59%
Grand Cape Mount 40 11 51 55 15 70%Margibi 27 1 28 33 6 74%Maryland 14 6 20 24 10 78%Montserrado 60 14 74 139 79 96%Nimba 50 8 58 60 10 58%
River Cess 18 2 20 17 -1 46%River Gee 15 3 18 17 2 64%
Sinoe 6 21 27 32 26 61%Total 354 110 464 550 196 71%Clinics : Approximately 30 new clinics were constructed between 2006 to 2011Note : Difference in public health facility is due to new construction, major renovation and upgrade from lower to higher level
Table 1.11.1: Total Health Facility Status by County, Liberia 2006 and 2011
Source: Ministry of Health and Social Welfare
# of Increased
Access to HF within 5 KMCounty
2006 Health Facility Status2011
Functional HF
Table 1.11.2: Total Health Facility Status by County, Liberia 2006 and 2011
Page 39 Statistical Bulletin 2011
Statistical Bulletin, Monrovia, Liberia. December 2011 50
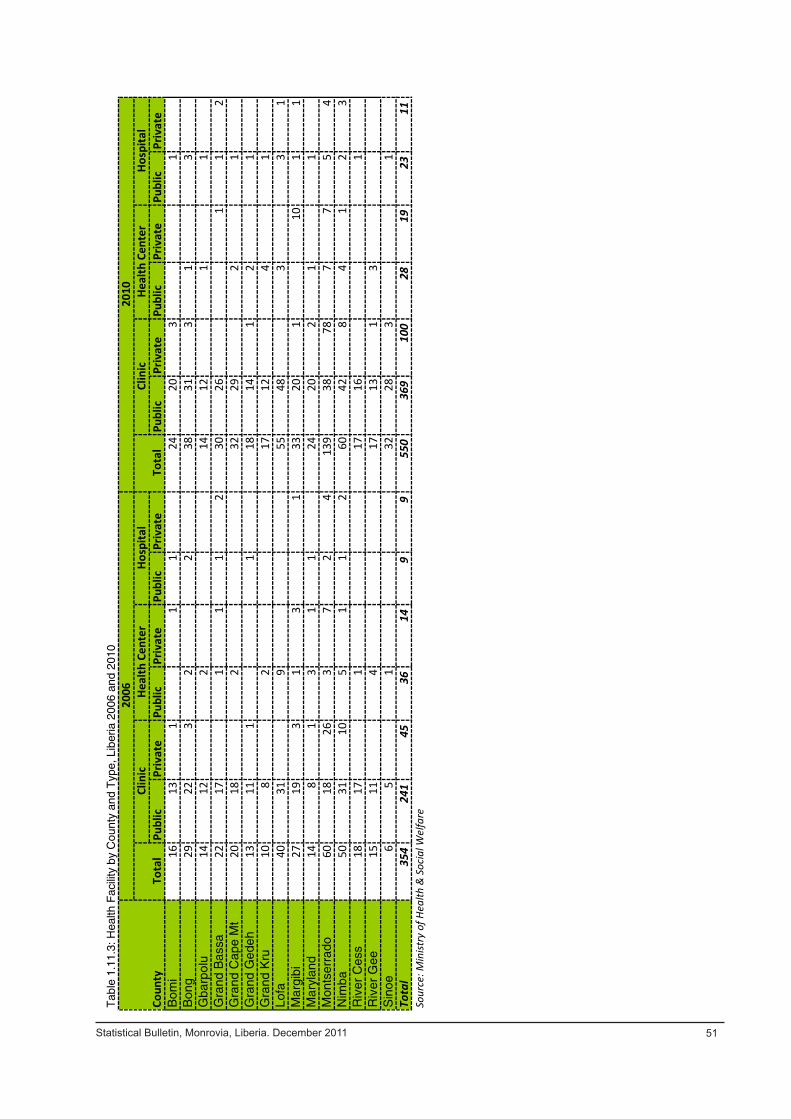
Publ
icPr
ivat
ePu
blic
Priv
ate
Publ
icPr
ivat
ePu
blic
Priv
ate
Publ
icPr
ivat
ePu
blic
Priv
ate
Bom
i16
131
11
2420
31
Bon
g29
223
22
3831
31
3G
barp
olu
1412
214
121
1G
rand
Bas
sa22
171
11
230
261
12
Gra
nd C
ape
Mt
2018
232
292
1G
rand
Ged
eh13
111
118
141
21
Gra
nd K
ru10
82
1712
41
Lofa
4031
955
483
31
Mar
gibi
2719
31
31
3320
110
11
Mar
ylan
d14
81
31
124
202
11
Mon
tser
rado
6018
263
72
4139
3878
77
54
Nim
ba50
3110
51
12
6042
84
12
3R
iver
Ces
s18
171
1716
1R
iver
Gee
1511
417
131
3S
inoe
65
132
283
1To
tal
354
241
4536
149
9550
369
100
2819
2311
Sour
ce: M
inist
ry o
f Hea
lth &
Soc
ial W
elfa
re
Clin
icHe
alth
Cen
ter
Hosp
ital
Tota
lCl
inic
Tab
le 1
.11.
3: H
ealth
Fac
ility
by
Cou
nty
and
Typ
e, L
iber
ia 2
006
and
2010
Coun
ty
2006
2010
Tota
lHo
spita
lHe
alth
Cen
ter
Pag
e 40
Sta
tistic
al B
ulle
tin 2
011
Statistical Bulletin, Monrovia, Liberia. December 2011 51
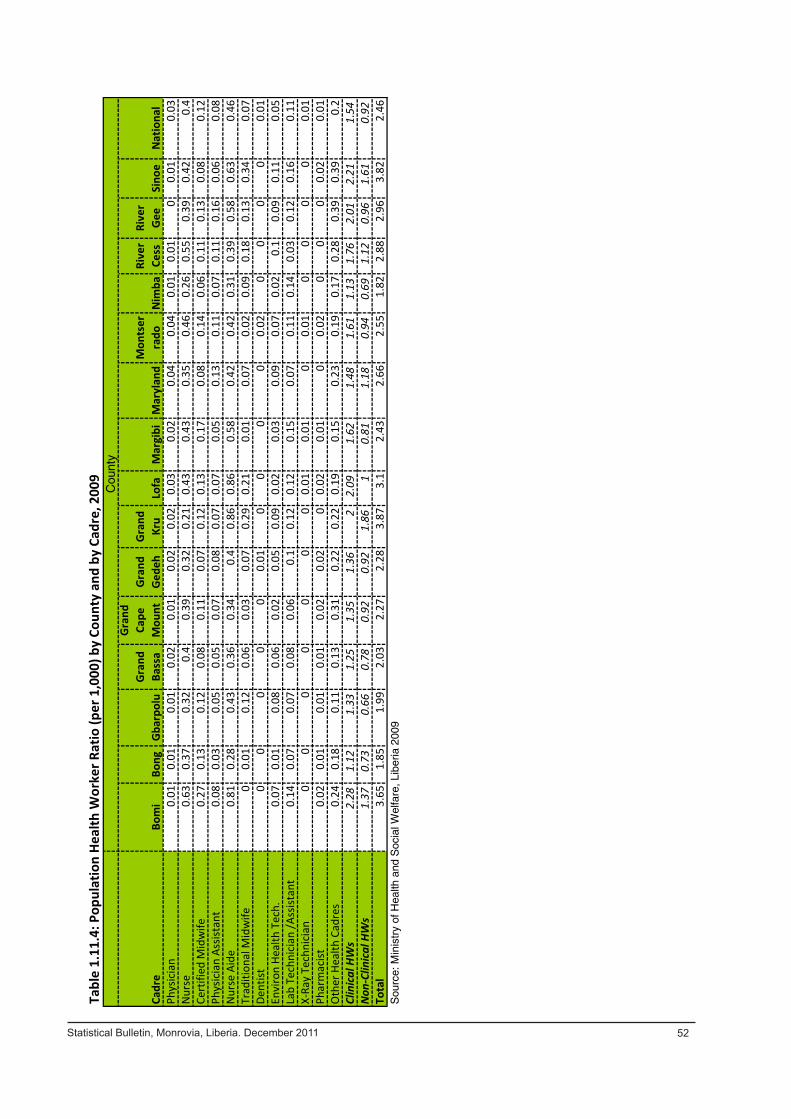
Cadr
e Bo
mi
Bong
Gbar
polu
Gran
d Ba
ssa
Gran
d Ca
pe
Mou
ntGr
and
Gede
hGr
and
Kru
Lofa
Mar
gibi
Mar
ylan
dM
onts
erra
doN
imba
Rive
r Ce
ssRi
ver
Gee
Sino
eN
atio
nal
Phys
icia
n0.
010.
010.
010.
020.
010.
020.
020.
030.
020.
040.
040.
010.
010
0.01
0.03
Nur
se0.
630.
370.
320.
40.
390.
320.
210.
430.
430.
350.
460.
260.
550.
390.
420.
4Ce
rtifi
ed M
idw
ife0.
270.
130.
120.
080.
110.
070.
120.
130.
170.
080.
140.
060.
110.
130.
080.
12Ph
ysic
ian
Assis
tant
0.08
0.03
0.05
0.05
0.07
0.08
0.07
0.07
0.05
0.13
0.11
0.07
0.11
0.16
0.06
0.08
Nur
se A
ide
0.81
0.28
0.43
0.36
0.34
0.4
0.86
0.86
0.58
0.42
0.42
0.31
0.39
0.58
0.63
0.46
Trad
ition
al M
idw
ife0
0.01
0.12
0.06
0.03
0.07
0.29
0.21
0.01
0.07
0.02
0.09
0.18
0.13
0.34
0.07
Dent
ist0
00
00
0.01
00
00
0.02
00
00
0.01
Envi
ron
Heal
th T
ech.
0.07
0.01
0.08
0.06
0.02
0.05
0.09
0.02
0.03
0.09
0.07
0.02
0.1
0.09
0.11
0.05
Lab
Tech
nici
an /A
ssist
ant
0.14
0.07
0.07
0.08
0.06
0.1
0.12
0.12
0.15
0.07
0.11
0.14
0.03
0.12
0.16
0.11
X-Ra
y Te
chni
cian
00
00
00
00.
010.
010
0.01
00
00
0.01
Phar
mac
ist0.
020.
010.
010.
010.
020.
020
0.02
0.01
00.
020
00
0.02
0.01
Oth
er H
ealth
Cad
res
0.24
0.18
0.11
0.13
0.31
0.22
0.22
0.19
0.15
0.23
0.19
0.17
0.28
0.39
0.39
0.2
Clin
ical
HW
s2.28
1.12
1.33
1.25
1.35
1.36
22.09
1.62
1.48
1.61
1.13
1.76
2.01
2.21
1.54
Non
-Clin
ical
HW
s1.37
0.73
0.66
0.78
0.92
0.92
1.86
10.81
1.18
0.94
0.69
1.12
0.96
1.61
0.92
Tota
l3.
651.
851.
992.
032.
272.
283.
873.
12.
432.
662.
551.
822.
882.
963.
822.
46S
ourc
e: M
inis
try
of H
ealth
and
Soc
ial W
elfa
re, L
iber
ia 2
009
Cou
nty
Tabl
e 1.
11.4
: Pop
ulat
ion
Heal
th W
orke
r Rat
io (p
er 1
,000
) by
Coun
ty a
nd b
y Ca
dre,
200
9
Pag
e 41
Sta
tistic
al B
ulle
tin 2
011
Statistical Bulletin, Monrovia, Liberia. December 2011 52
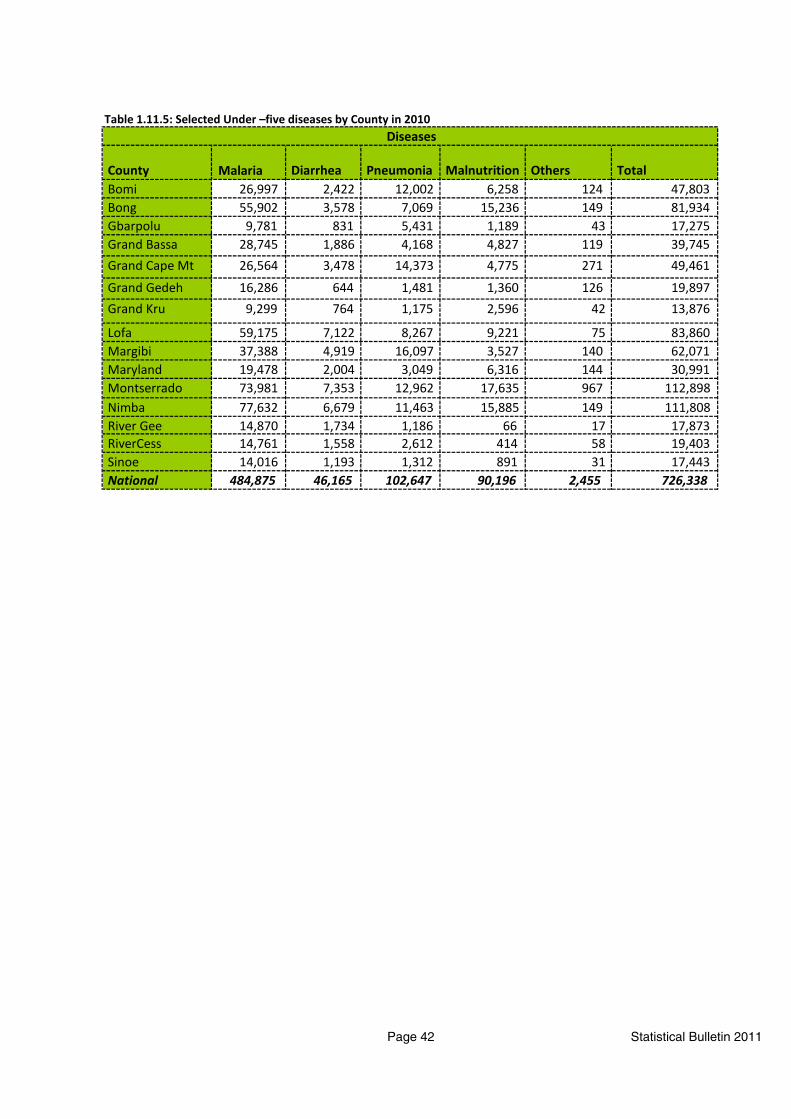
County Malaria Diarrhea Pneumonia Malnutrition Others Total Bomi 26,997 2,422 12,002 6,258 124 47,803 Bong 55,902 3,578 7,069 15,236 149 81,934 Gbarpolu 9,781 831 5,431 1,189 43 17,275 Grand Bassa 28,745 1,886 4,168 4,827 119 39,745 Grand Cape Mt 26,564 3,478 14,373 4,775 271 49,461
Grand Gedeh 16,286 644 1,481 1,360 126 19,897 Grand Kru 9,299 764 1,175 2,596 42 13,876
Lofa 59,175 7,122 8,267 9,221 75 83,860 Margibi 37,388 4,919 16,097 3,527 140 62,071 Maryland 19,478 2,004 3,049 6,316 144 30,991 Montserrado 73,981 7,353 12,962 17,635 967 112,898 Nimba 77,632 6,679 11,463 15,885 149 111,808 River Gee 14,870 1,734 1,186 66 17 17,873 RiverCess 14,761 1,558 2,612 414 58 19,403 Sinoe 14,016 1,193 1,312 891 31 17,443 National 484,875 46,165 102,647 90,196 2,455 726,338
Diseases
Page 42 Statistical Bulletin 2011

Statistical Bulletin, Monrovia, Liberia. December 2011 54
Coun
tyGy
n.M
edic
al
Obs
t. Pe
diat
ricAn
emia
ARI
Hep.
Hy
pert
. In
jury
M
alnu
tO
ther
s To
tal
Bom
i 11
244
179
344
6165
211
83
208
1,13
6Bo
ng
121
3,03
41,
950
3,32
485
655
541
124
336
134
6,54
717
,022
Gbar
polu
95
704
3449
628
410
2851
380
42,
284
G. B
assa
95
3,70
61,
387
2,89
442
977
415
194
405
653,
346
13,3
10G.
C. M
t 21
700
110
549
8319
40
4531
111,
059
2,80
3G.
Ged
eh
136
773
294
759
119
5425
6711
417
2,01
04,
368
G. K
ru
7122
334
381
914
27
201
516
1,27
8Lo
fa
132
6,10
81,
710
4,45
977
31,
049
9443
71,
226
8014
,171
30,2
39M
argi
bi
102
1,69
978
61,
866
760
708
1,44
629
253
164
7,63
115
,885
Mar
ylan
d 71
1,06
113
649
423
134
6524
515
1,35
63,
483
Mon
ts.
13,4
3439
,589
1,10
114
,663
5,61
88,
841
465,
789
4,86
06,
407
39,4
8813
9,83
6N
imba
43
03,
691
1,30
42,
897
967
237
5118
225
984
4,14
614
,248
Rive
r Gee
7
173
2611
66
70
55
317
051
8Ri
ver C
ess
2125
991
7223
281
2232
145
51,
005
Sino
e 0
664
050
493
380
5127
151,
499
2,89
1Libe
ria14
,747
62,628
9,14
233
,818
9,84
812
,618
1,72
77,31
98,15
06,90
383
,406
250,30
6
Tabl
e 1.
11.6
: In-
patie
nt A
dmis
sion
s by
Coun
ty in
201
0
Cond
ition
s
Pag
e 43
Sta
tistic
al B
ulle
tin 2
011
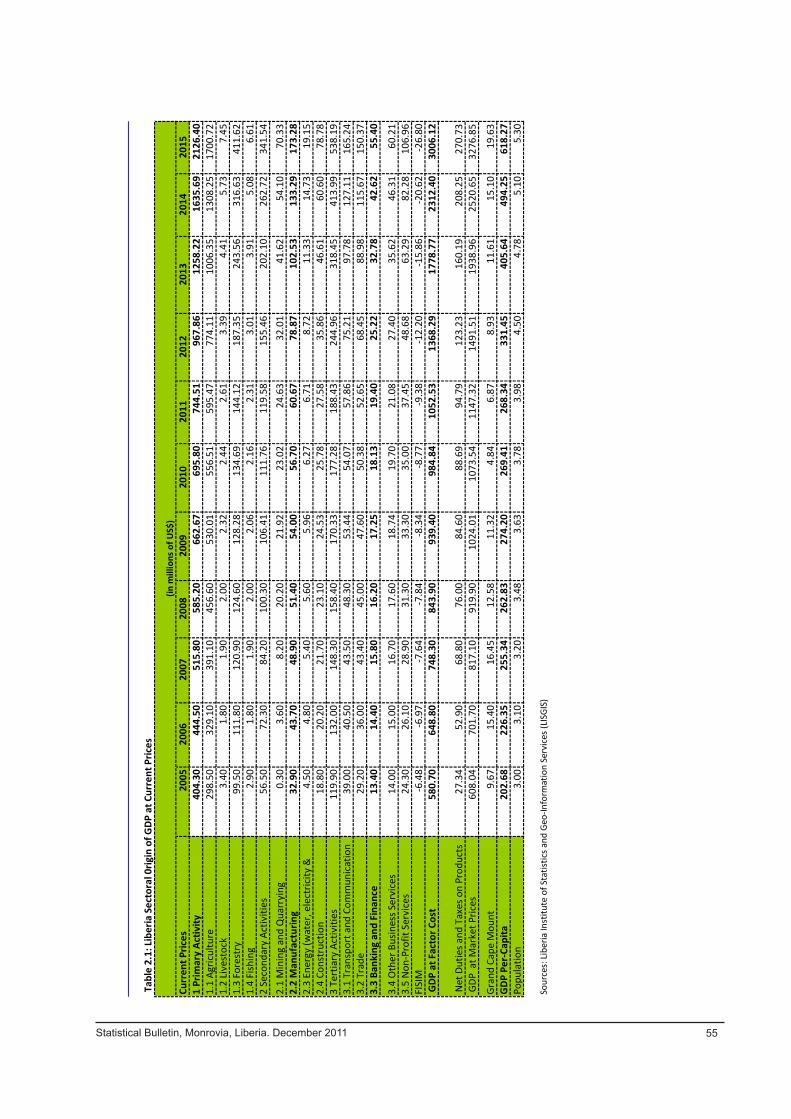
Curr
ent P
rices
2005
2006
2007
2008
2009
2010
2011
2012
2013
2014
2015
1 Pr
imar
y Ac
tivity
404.
3044
4.50
515.
8058
5.20
662.
6769
5.80
744.
5196
7.86
1258
.22
1635
.69
2126
.40
1.1
Agric
ultu
re29
8.50
329.
1039
1.10
456.
6053
0.01
556.
5159
5.47
774.
1110
06.3
513
08.2
517
00.7
21.
2 Li
vest
ock
3.40
1.80
1.90
2.00
2.32
2.44
2.61
3.39
4.41
5.73
7.45
1.3
Fore
stry
99.5
011
1.80
120.
9012
4.60
128.
2813
4.69
144.
1218
7.35
243.
5631
6.63
411.
621.
4 Fi
shin
g2.
901.
801.
902.
002.
062.
162.
313.
013.
915.
086.
612
Seco
ndar
y Ac
tiviti
es56
.50
72.3
084
.20
100.
3010
6.41
111.
7611
9.58
155.
4620
2.10
262.
7234
1.54
2.1
Min
ing
and
Qua
rryi
ng0.
303.
608.
2020
.20
21.9
223
.02
24.6
332
.01
41.6
254
.10
70.3
32.
2 M
anuf
actu
ring
32.9
043
.70
48.9
051
.40
54.0
056
.70
60.6
778
.87
102.
5313
3.29
173.
282.
3 En
ergy
(wat
er, e
lect
ricity
&
4.50
4.80
5.40
5.60
5.96
6.27
6.71
8.72
11.3
314
.73
19.1
52.
4 Co
nstr
uctio
n18
.80
20.2
021
.70
23.1
024
.53
25.7
827
.58
35.8
646
.61
60.6
078
.78
3 Te
rtia
ry A
ctiv
ities
119.
9013
2.00
148.
3015
8.40
170.
3317
7.28
188.
4324
4.96
318.
4541
3.99
538.
193.
1 Tr
ansp
ort a
nd C
omm
unic
atio
n39
.00
40.5
043
.50
48.3
053
.44
54.0
757
.86
75.2
197
.78
127.
1116
5.24
3.2
Trad
e29
.20
36.0
043
.40
45.0
047
.60
50.3
852
.65
68.4
588
.98
115.
6715
0.37
3.3
Bank
ing
and
Fina
nce
13.4
014
.40
15.8
016
.20
17.2
518
.13
19.4
025
.22
32.7
842
.62
55.4
0
3.4
Oth
er B
usin
ess S
ervi
ces
14.0
015
.00
16.7
017
.60
18.7
419
.70
21.0
827
.40
35.6
246
.31
60.2
13.
5 N
on-P
rofit
Ser
vice
s24
.30
26.1
028
.90
31.3
033
.30
35.0
037
.45
48.6
863
.29
82.2
810
6.96
FISI
M-6
.48
-6.9
7-7
.64
-7.8
4-8
.34
-8.7
7-9
.38
-12.
20-1
5.86
-20.
62-2
6.80
GDP
at F
acto
r Cos
t58
0.70
648.
8074
8.30
843.
9093
9.40
984.
8410
52.5
313
68.2
917
78.7
723
12.4
030
06.1
2
Net
Dut
ies a
nd T
axes
on
Prod
ucts
27.3
452
.90
68.8
076
.00
84.6
088
.69
94.7
912
3.23
160.
1920
8.25
270.
73 G
DP a
t Mar
ket P
rices
608.
0470
1.70
817.
1091
9.90
1024
.01
1073
.54
1147
.32
1491
.51
1938
.96
2520
.65
3276
.85
Gran
d Ca
pe M
ount
9.67
15.4
016
.45
12.5
811
.32
4.84
6.87
8.93
11.6
115
.10
19.6
3G
DP P
er-C
apita
202.
6822
6.35
255.
3426
2.83
274.
2026
9.41
268.
3433
1.45
405.
6449
4.25
618.
27Po
pula
tion
3.00
3.10
3.20
3.48
3.63
3.78
3.98
4.50
4.78
5.10
5.30
Sour
ces:
Lib
eria
Inst
itute
of S
tatis
tics a
nd G
eo-In
form
atio
n Se
rvic
es (L
ISGI
S)
(in m
illio
ns o
f US$
)
Tab
le 2
.1: L
iber
ia S
ecto
ral 0
rigin
of G
DP a
t Cur
rent
Pric
es
Pag
e 44
Sta
tistic
al B
ulle
tin 2
011
Statistical Bulletin, Monrovia, Liberia. December 2011 55

Curr
ent P
rices
2005
2006
2007
2008
2009
2010
2011
2012
2013
2014
2015
1 Pr
imar
y Ac
tivity
388.
7040
4.31
439.
4047
4.00
505.
7553
9.64
579.
0364
3.31
671.
3370
5.40
770.
061.
1 Ag
ricul
ture
289.
3029
5.31
321.
0035
1.90
375.
4840
0.63
429.
8847
7.60
498.
4052
3.70
571.
701.
2 Li
vest
ock
1.40
1.60
1.70
1.80
1.92
2.05
2.20
2.44
2.55
2.68
2.92
1.3
Fore
stry
96.5
010
5.80
115.
0011
8.50
126.
4413
4.91
144.
7516
0.82
167.
8317
6.35
192.
511.
4 Fi
shin
g1.
501.
601.
701.
801.
922.
052.
202.
442.
552.
682.
922
Seco
ndar
y Ac
tiviti
es54
.90
65.6
071
.30
78.0
283
.24
88.8
295
.30
105.
8811
0.49
116.
1012
6.75
2.1
Min
ing
and
Qua
rryi
ng0.
301.
271.
384.
324.
614.
925.
285.
876.
126.
447.
022.
2 M
anuf
actu
ring
31.9
041
.39
44.9
947
.29
50.4
653
.84
57.7
764
.18
66.9
770
.37
76.8
22.
3 En
ergy
(wat
er, e
lect
ricity
&
gas)
4.40
4.57
4.97
5.15
5.50
5.87
6.29
6.99
7.30
7.67
8.37
2.4
Cons
truc
tion
18.3
018
.37
19.9
621
.25
22.6
824
.20
25.9
628
.84
30.1
031
.63
34.5
33
Tert
iary
Act
iviti
es11
6.40
135.
8513
6.44
145.
7315
5.49
165.
9117
8.02
197.
7820
6.40
216.
8723
6.75
3.1
Tran
spor
t and
Com
mun
icat
ion
37.9
036
.82
40.0
244
.44
47.4
150
.59
54.2
860
.31
62.9
466
.13
72.1
93.
2 Tr
ade
28.3
036
.73
39.9
341
.40
44.1
747
.13
50.5
756
.19
58.6
461
.61
67.2
63.
3 Ba
nkin
g an
d Fi
nanc
e13
.00
13.3
714
.54
14.9
015
.90
16.9
718
.21
20.2
321
.11
22.1
824
.21
3.4
Oth
er B
usin
ess S
ervi
ces
13.6
024
.46
15.3
616
.19
17.2
818
.43
19.7
821
.98
22.9
324
.10
26.3
13.
5 N
on-P
rofit
Ser
vice
s23
.60
24.4
626
.59
28.8
030
.73
32.7
835
.18
39.0
840
.78
42.8
546
.78
FISI
M0.
000.
000.
000.
000.
00 G
DP a
t Fac
tor C
ost
560.
0060
5.75
647.
1469
7.74
744.
4979
4.37
852.
3694
6.98
988.
2210
38.3
811
33.5
5
Net
Dut
ies a
nd T
axes
on
Prod
ucts
17.3
049
.70
64.7
071
.40
84.3
094
.60
109.
9012
4.30
132.
7014
1.20
155.
80 G
DP a
t Mar
ket P
rices
577.
3065
5.45
711.
8476
9.14
828.
7988
8.97
962.
2610
71.2
811
20.9
211
79.5
812
89.3
5Re
al C
hang
eG
DP P
er-C
apita
192.
4321
1.44
222.
4522
1.23
228.
0323
4.88
242.
0423
8.06
234.
5023
1.29
243.
273
3.1
3.2
3.5
3.6
3.8
4.0
4.5
4.8
5.1
5.3
Sour
ces:
Lib
eria
Inst
itute
of S
tatis
tics a
nd G
eo-In
form
atio
n Se
rvic
es (L
ISGI
S)
Tabl
e 2.
2: L
iber
ia se
ctor
al 0
rigin
of G
.D.P
at C
onst
ant P
rice
(In m
illio
ns o
f US$
)
(i
n m
illio
ns o
f US$
)
Pag
e 45
Sta
tistic
al B
ulle
tin 2
011
Statistical Bulletin, Monrovia, Liberia. December 2011 56
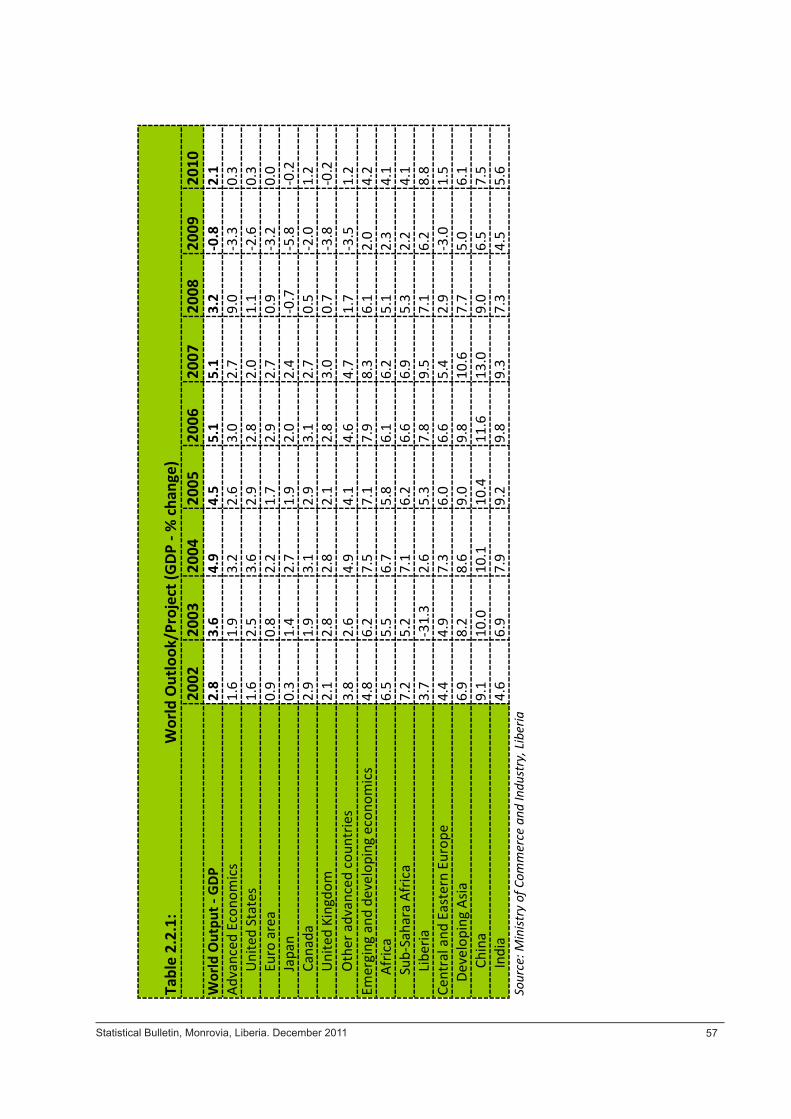
Statistical Bulletin, Monrovia, Liberia. December 2011 57
2002
2003
2004
2005
2006
2007
2008
2009
2010
Wor
ld O
utpu
t - G
DP2.
83.
64.
94.
55.
15.
13.
2-0
.82.
1Ad
vanc
ed E
cono
mic
s1.
61.
93.
22.
63.
02.
79.
0-3
.30.
3
U
nite
d St
ates
1.6
2.5
3.6
2.9
2.8
2.0
1.1
-2.6
0.3
Eur
o ar
ea0.
90.
82.
21.
72.
92.
70.
9-3
.20.
0
Ja
pan
0.3
1.4
2.7
1.9
2.0
2.4
-0.7
-5.8
-0.2
Can
ada
2.9
1.9
3.1
2.9
3.1
2.7
0.5
-2.0
1.2
Uni
ted
King
dom
2.1
2.8
2.8
2.1
2.8
3.0
0.7
-3.8
-0.2
Oth
er a
dvan
ced
coun
trie
s3.
82.
64.
94.
14.
64.
71.
7-3
.51.
2Em
ergi
ng a
nd d
evel
opin
g ec
onom
ics
4.8
6.2
7.5
7.1
7.9
8.3
6.1
2.0
4.2
Afric
a6.
55.
56.
75.
86.
16.
25.
12.
34.
1
Su
b-Sa
hara
Afr
ica
7.2
5.2
7.1
6.2
6.6
6.9
5.3
2.2
4.1
Lib
eria
3.7
-31.
32.
65.
37.
89.
57.
16.
28.
8Ce
ntra
l and
Eas
tern
Eur
ope
4.4
4.9
7.3
6.0
6.6
5.4
2.9
-3.0
1.5
D
evel
opin
g As
ia6.
98.
28.
69.
09.
810
.67.
75.
06.
1
C
hina
9.1
10.0
10.1
10.4
11.6
13.0
9.0
6.5
7.5
Ind
ia4.
66.
97.
99.
29.
89.
37.
34.
55.
6So
urce
: Min
istry
of C
omm
erce
and
Indu
stry
, Lib
eria
Tabl
e 2.
2.1:
W
orld
Out
look
/Pro
ject
(GDP
- %
cha
nge)
Pag
e 46
Sta
tistic
al B
ulle
tin 2
011

HS8 Digit Product Code and Description FOB ValueTotal 168,866,999.8803053000:Fish fillets, dried, salted or in brine, but not smoked 300.00 03055900:Dried fish not smoked (excl. cod) 375.00 03056900:Other fish salted or in brine but not dried or smoked, nes 900.00 07129000:Dried vegetables, nes 320.00 07131000:Dried peas, shelled 1,620.00 07139000:Dried leguminous vegetables, shelled, nes 15.00 08029010:08029010 450.00 08029090:08029090 4,030.00 09019000:Coffee husks and skins,coffee substitutes containing coffee 12,000.00 09041200:Pepper, crushed or ground 20.00 09109900:Other spices, nes 869.23 10030000:Barley 25,000.00 10059000:Maize (excl. seed) 15.00 10070000:Grain sorghum 41,257.50 11043000:Cereal germ, whole, rolled, flaked or ground 225.00 11062010:Flour,meal and powder of cassava(including cassava flakes or garri) 90.00 11062020:Flour,meal and powder of yarn 225.00 12074000:Sesamum seeds 100.00 15071000:Crude soya-bean oil 38,130.00 15079000:Soya-bean oil (excl. crude) and fractions 6,630.00
Grand Cape Mount 55,500.00 15111090:Other crude palm oil 107,260.00 15119090:Other crude palm oil 47,467.50 18010011:Superior quality raw cocoa beans 23,200.00 18010018:Other quality raw cocoa beans 118,272.00 18010019:Roasted cocoa beans 2,493,400.00 18010020:Broken cocoa beans 649,084.00 21031000:Soya sauce 4,000.00 21041010:Soups and broths preparations in blocks or loaves form 4,790.00 21042000:Homogenized composite food preparations 3,500.00 25084000:Other clays, nes 959.23 26011120:Non-agglomerated Iron ores fines 600,000.00 28151200:Sodium hydroxide in aqueous solution (soda lye or liquid soda) 2,200.00 28429000:Other salts of inorganic acids or peroxoacids (excl. azides) 15.00 30065000:First-aid boxes and kits 1,076.93
Table 2.3.1:Export by HS Code Eight Digit, Product Description and FOB Value In USD, Liberia, 2010
Page 47 Statistical Bulletin 2011
Statistical Bulletin, Monrovia, Liberia. December 2011 58

Statistical Bulletin, Monrovia, Liberia. December 2011 59
Table 2.3.1:Export by HS Code Eight Digit, Product Description and FOB Value In USD, Liberia, 2010 Cont'dHS8 Digit Product Code and Description FOB Value
34052000:Polishes, creams/similar preparat.for mainten.of woodwork 769.23 34059000:Other polishes, creams and similar preparations, nes 150.00 38081090:Other insecticides 180.00 39201000:Plates..., of polymers of ethylene, not reinforced, etc 533.91 39221000:Baths, shower-baths and wash-basins, of plastics 1,076.93 39239000:Articles for the packing of goods, of plastics, nes 125.00 39251000:Reservoirs... & sim. containers, capacity >300 l, of plastics 769.23 39261000:Office or school supplies of plastics 100.00 39269090:Other articles of plastics and articles of materials of headings 3901 to 3914 533.91 40011000:Natural rubber latex, in pry. forms/in plates, sheets/strip 59,339,374.33 40012900:Other natural rubber, in primary forms or in plates, etc, nes 74,513,682.86 42021920:Other Trunks, suitcases, vanity cases, executive cases, brief cases, school satchets and 533.91 42021990:Trunks,suit-cases,vanity cases,of other materialsCKD or blank by est.manuf 1,569.23 44011000:Fuel wood, in logs, in billets... or in similar forms 319,320.31
18,110.43 44111100:Fibreboard of a density >0.8g/cm3, not worked/surface covered 19,274.12 44130000:Densified wood, in blocks, plates, strips or profile shapes 14,850.30 44190000:Tableware and kitchenware, of wood 1,150.00 44219090:Other articles of woods 533.91 47032900:Semi- or bleached non-conif. chemical wood pulp, soda..., nes 110.00 48236000:Trays, dishes, plates and cups, etc, of paper or paperboard 1,946.16 49019100:Dictionaries&encyclopaedias, & serial instalments thereof 6,553.25 49019910:Scientific or school printed bks,brochures,leaflets & similar articles 1,011.18 49111000:Trade advertising material, commercial catalogues and the like 400.00 49119100:Pictures, designs and photographs 769.23 54079400:Printed woven fabrics of synthetic filament yarn, nes 360.00 63031200:Curtains, etc; valances of syn fibres, knitted or crocheted 533.91 63090000:Worn clothing and other worn articles 87,469.84 64019100:Other footwear covering the knee with outer soles and plastics on the uppers parts 5,364,415.00 64041100:Sports footwear; tennis shoes, basketball shoes, gym shoes, training shoes and the like, 562.50 64042000:Footwear with outer soles ofleather or composition leather 132.00 68041000:Millstones and grindstones for milling, grinding or pulping 300.00 69111000:Tableware and kitchenware, of porcelain or china 533.91 70132100:Drinking glasses of lead crystal 1,846.16 70139900:Glassware for toilet, office, indoor decorations, etc, nes 769.23 72044900:Ferrous waste and scrap, nes 6,750.00
Page 48 Statistical Bulletin 2011
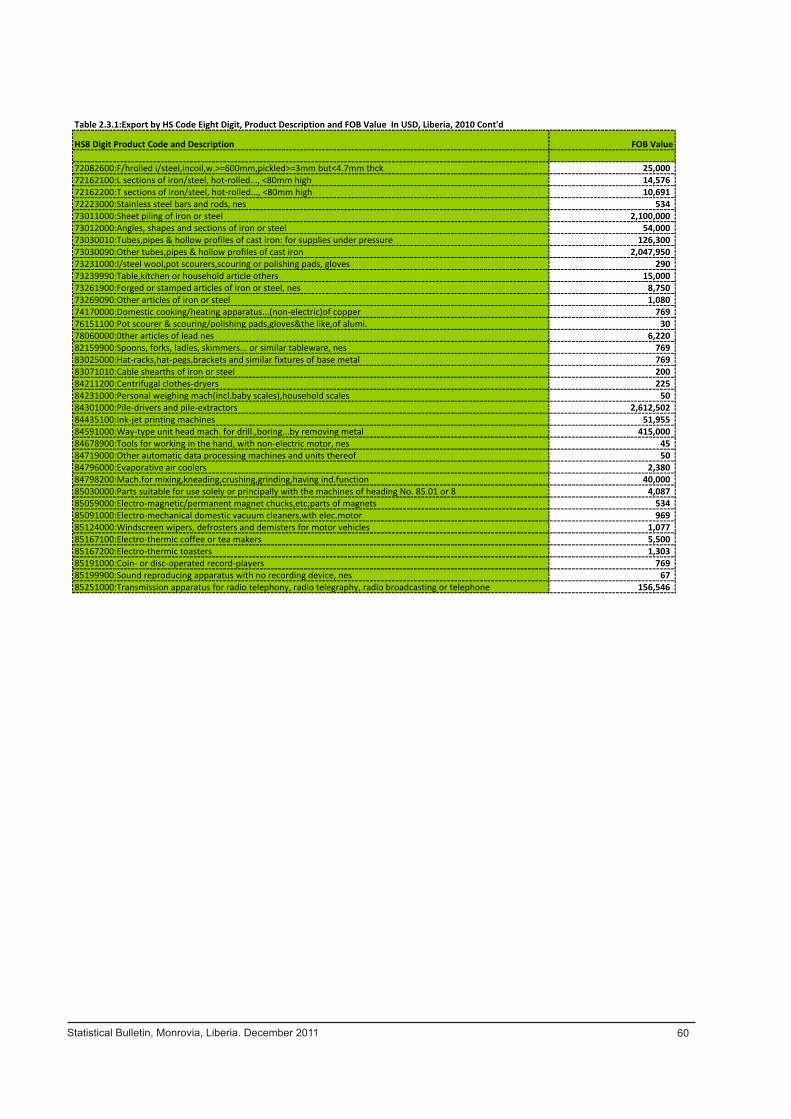
Table 2.3.1:Export by HS Code Eight Digit, Product Description and FOB Value In USD, Liberia, 2010 Cont'd
HS8 Digit Product Code and Description FOB Value
72082600:F/hrolled i/steel,incoil,w.>=600mm,pickled>=3mm but<4.7mm thck 25,000 72162100:L sections of iron/steel, hot-rolled..., <80mm high 14,576 72162200:T sections of iron/steel, hot-rolled..., <80mm high 10,691 72223000:Stainless steel bars and rods, nes 534 73011000:Sheet piling of iron or steel 2,100,000 73012000:Angles, shapes and sections of iron or steel 54,000 73030010:Tubes,pipes & hollow profiles of cast iron: for supplies under pressure 126,300 73030090:Other tubes,pipes & hollow profiles of cast iron 2,047,950 73231000:I/steel wool,pot scourers,scouring or polishing pads, gloves 290 73239990:Table,kitchen or household article others 15,000 73261900:Forged or stamped articles of iron or steel, nes 8,750 73269090:Other articles of iron or steel 1,080 74170000:Domestic cooking/heating apparatus...(non-electric)of copper 769 76151100:Pot scourer & scouring/polishing pads,gloves&the like,of alumi. 30 78060000:0ther articles of lead nes 6,220 82159900:Spoons, forks, ladles, skimmers... or similar tableware, nes 769 83025000:Hat-racks,hat-pegs,brackets and similar fixtures of base metal 769 83071010:Cable shearths of iron or steel 200 84211200:Centrifugal clothes-dryers 225 84231000:Personal weighing mach(incl.baby scales),household scales 50 84301000:Pile-drivers and pile-extractors 2,612,502 84435100:Ink-jet printing machines 51,955 84591000:Way-type unit head mach. for drill.,boring...by removing metal 415,000 84678900:Tools for working in the hand, with non-electric motor, nes 45 84719000:Other automatic data processing machines and units thereof 50 84796000:Evaporative air coolers 2,380 84798200:Mach.for mixing,kneading,crushing,grinding,having ind.function 40,000 85030000:Parts suitable for use solely or principally with the machines of heading No. 85.01 or 8 4,087 85059000:Electro-magnetic/permanent magnet chucks,etc;parts of magnets 534 85091000:Electro-mechanical domestic vacuum cleaners,wth elec.motor 969 85124000:Windscreen wipers, defrosters and demisters for motor vehicles 1,077 85167100:Electro-thermic coffee or tea makers 5,500 85167200:Electro-thermic toasters 1,303 85191000:Coin- or disc-operated record-players 769 85199900:Sound reproducing apparatus with no recording device, nes 67 85251000:Transmission apparatus for radio telephony, radio telegraphy, radio broadcasting or telephone 156,546
Page 49 Statistical Bulletin 2011
Statistical Bulletin, Monrovia, Liberia. December 2011 60

Table 2.3.1:Export by HS Code Eight Digit, Product Description and FOB Value In USD, Liberia, 2010 Cont'dHS8 Digit Product Code and Description FOB Value
72082600:F/hrolled i/steel,incoil,w.>=600mm,pickled>=3mm but<4.7mm thck 25,000.00 72162100:L sections of iron/steel, hot-rolled..., <80mm high 14,575.50 72162200:T sections of iron/steel, hot-rolled..., <80mm high 10,691.28 72223000:Stainless steel bars and rods, nes 533.91 73011000:Sheet piling of iron or steel 2,100,000.00 73012000:Angles, shapes and sections of iron or steel 54,000.00 73030010:Tubes,pipes & hollow profiles of cast iron: for supplies under pressure 126,300.00 73030090:Other tubes,pipes & hollow profiles of cast iron 2,047,950.00 73231000:I/steel wool,pot scourers,scouring or polishing pads, gloves 290.15 73239990:Table,kitchen or household article others 15,000.00 73261900:Forged or stamped articles of iron or steel, nes 8,750.00 73269090:Other articles of iron or steel 1,080.00 74170000:Domestic cooking/heating apparatus...(non-electric)of copper 769.25 76151100:Pot scourer & scouring/polishing pads,gloves&the like,of alumi. 30.00 78060000:0ther articles of lead nes 6,220.00 82159900:Spoons, forks, ladles, skimmers... or similar tableware, nes 769.23 83025000:Hat-racks,hat-pegs,brackets and similar fixtures of base metal 769.23 83071010:Cable shearths of iron or steel 200.00 84211200:Centrifugal clothes-dryers 225.00 84231000:Personal weighing mach(incl.baby scales),household scales 50.00 84301000:Pile-drivers and pile-extractors 2,612,501.90 84435100:Ink-jet printing machines 51,955.20 84591000:Way-type unit head mach. for drill.,boring...by removing metal 415,000.00 84678900:Tools for working in the hand, with non-electric motor, nes 44.99 84719000:Other automatic data processing machines and units thereof 50.00 84796000:Evaporative air coolers 2,380.07 84798200:Mach.for mixing,kneading,crushing,grinding,having ind.function 40,000.00 85030000:Parts suitable for use solely or principally with the machines of heading No. 85.01 or 8 4,086.76 85059000:Electro-magnetic/permanent magnet chucks,etc;parts of magnets 533.91 85091000:Electro-mechanical domestic vacuum cleaners,wth elec.motor 969.23 85124000:Windscreen wipers, defrosters and demisters for motor vehicles 1,076.84 85167100:Electro-thermic coffee or tea makers 5,500.00 85167200:Electro-thermic toasters 1,303.14 85191000:Coin- or disc-operated record-players 769.23 85199900:Sound reproducing apparatus with no recording device, nes 66.66 85251000:Transmission apparatus for radio telephony, radio telegraphy, radio broadcasting or tele 156,546.16
Page 50 Statistical Bulletin 2011
Statistical Bulletin, Monrovia, Liberia. December 2011 61
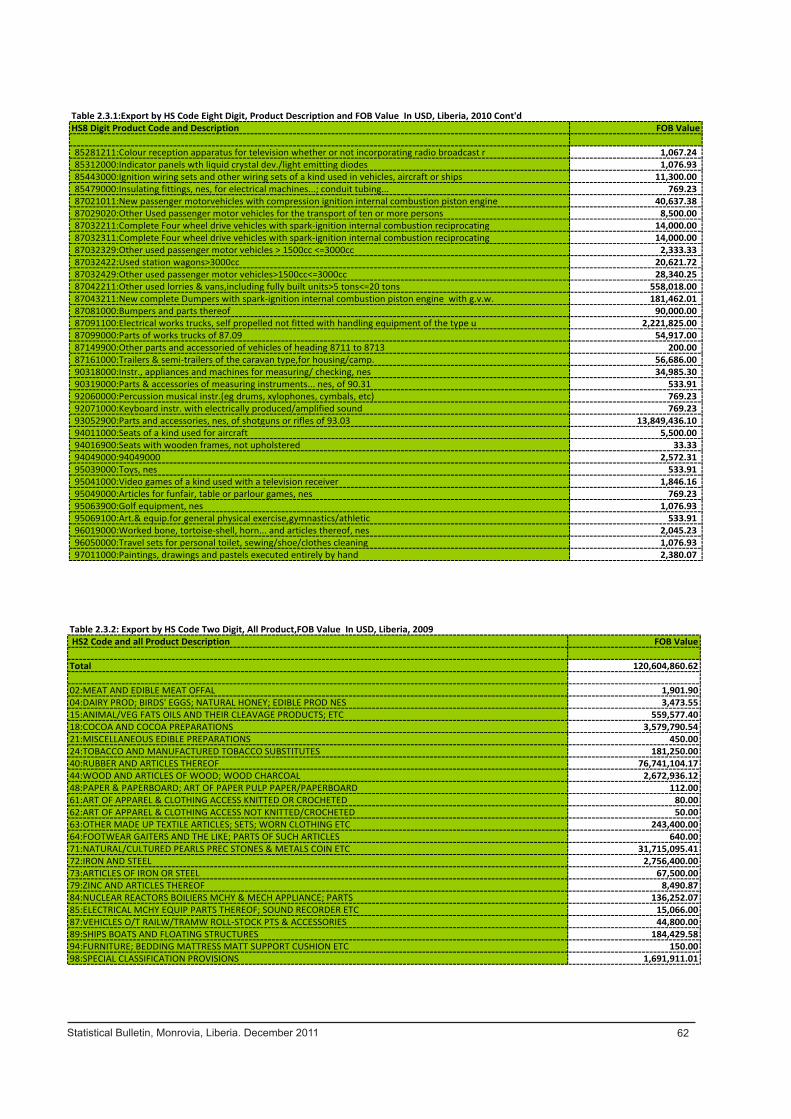
Statistical Bulletin, Monrovia, Liberia. December 2011 62
Table 2.3.1:Export by HS Code Eight Digit, Product Description and FOB Value In USD, Liberia, 2010 Cont'dHS8 Digit Product Code and Description FOB Value
85281211:Colour reception apparatus for television whether or not incorporating radio broadcast r 1,067.24 85312000:Indicator panels wth liquid crystal dev./light emitting diodes 1,076.93 85443000:Ignition wiring sets and other wiring sets of a kind used in vehicles, aircraft or ships 11,300.00 85479000:Insulating fittings, nes, for electrical machines...; conduit tubing... 769.23 87021011:New passenger motorvehicles with compression ignition internal combustion piston engine 40,637.38 87029020:Other Used passenger motor vehicles for the transport of ten or more persons 8,500.00 87032211:Complete Four wheel drive vehicles with spark-ignition internal combustion reciprocating 14,000.00 87032311:Complete Four wheel drive vehicles with spark-ignition internal combustion reciprocating 14,000.00 87032329:Other used passenger motor vehicles > 1500cc <=3000cc 2,333.33 87032422:Used station wagons>3000cc 20,621.72 87032429:Other used passenger motor vehicles>1500cc<=3000cc 28,340.25 87042211:Other used lorries & vans,including fully built units>5 tons<=20 tons 558,018.00 87043211:New complete Dumpers with spark-ignition internal combustion piston engine with g.v.w. 181,462.01 87081000:Bumpers and parts thereof 90,000.00 87091100:Electrical works trucks, self propelled not fitted with handling equipment of the type u 2,221,825.00 87099000:Parts of works trucks of 87.09 54,917.00 87149900:Other parts and accessoried of vehicles of heading 8711 to 8713 200.00 87161000:Trailers & semi-trailers of the caravan type,for housing/camp. 56,686.00 90318000:Instr., appliances and machines for measuring/ checking, nes 34,985.30 90319000:Parts & accessories of measuring instruments... nes, of 90.31 533.91 92060000:Percussion musical instr.(eg drums, xylophones, cymbals, etc) 769.23 92071000:Keyboard instr. with electrically produced/amplified sound 769.23 93052900:Parts and accessories, nes, of shotguns or rifles of 93.03 13,849,436.10 94011000:Seats of a kind used for aircraft 5,500.00 94016900:Seats with wooden frames, not upholstered 33.33 94049000:94049000 2,572.31 95039000:Toys, nes 533.91 95041000:Video games of a kind used with a television receiver 1,846.16 95049000:Articles for funfair, table or parlour games, nes 769.23 95063900:Golf equipment, nes 1,076.93 95069100:Art.& equip.for general physical exercise,gymnastics/athletic 533.91 96019000:Worked bone, tortoise-shell, horn... and articles thereof, nes 2,045.23 96050000:Travel sets for personal toilet, sewing/shoe/clothes cleaning 1,076.93 97011000:Paintings, drawings and pastels executed entirely by hand 2,380.07
Page 51 Statistical Bulletin 2011
Table 2.3.2: Export by HS Code Two Digit, All Product,FOB Value In USD, Liberia, 2009 HS2 Code and all Product Description FOB Value
Total 120,604,860.62
02:MEAT AND EDIBLE MEAT OFFAL 1,901.9004:DAIRY PROD; BIRDS' EGGS; NATURAL HONEY; EDIBLE PROD NES 3,473.5515:ANIMAL/VEG FATS OILS AND THEIR CLEAVAGE PRODUCTS; ETC 559,577.4018:COCOA AND COCOA PREPARATIONS 3,579,790.5421:MISCELLANEOUS EDIBLE PREPARATIONS 450.0024:TOBACCO AND MANUFACTURED TOBACCO SUBSTITUTES 181,250.0040:RUBBER AND ARTICLES THEREOF 76,741,104.1744:WOOD AND ARTICLES OF WOOD; WOOD CHARCOAL 2,672,936.1248:PAPER & PAPERBOARD; ART OF PAPER PULP PAPER/PAPERBOARD 112.0061:ART OF APPAREL & CLOTHING ACCESS KNITTED OR CROCHETED 80.0062:ART OF APPAREL & CLOTHING ACCESS NOT KNITTED/CROCHETED 50.0063:OTHER MADE UP TEXTILE ARTICLES; SETS; WORN CLOTHING ETC 243,400.0064:FOOTWEAR GAITERS AND THE LIKE; PARTS OF SUCH ARTICLES 640.0071:NATURAL/CULTURED PEARLS PREC STONES & METALS COIN ETC 31,715,095.4172:IRON AND STEEL 2,756,400.0073:ARTICLES OF IRON OR STEEL 67,500.0079:ZINC AND ARTICLES THEREOF 8,490.8784:NUCLEAR REACTORS BOILIERS MCHY & MECH APPLIANCE; PARTS 136,252.0785:ELECTRICAL MCHY EQUIP PARTS THEREOF; SOUND RECORDER ETC 15,066.0087:VEHICLES O/T RAILW/TRAMW ROLL-STOCK PTS & ACCESSORIES 44,800.0089:SHIPS BOATS AND FLOATING STRUCTURES 184,429.5894:FURNITURE; BEDDING MATTRESS MATT SUPPORT CUSHION ETC 150.0098:SPECIAL CLASSIFICATION PROVISIONS 1,691,911.01
Page 52 Statistical Bulletin 2011

Statistical Bulletin, Monrovia, Liberia. December 2011 63
Page 51 Statistical Bulletin 2011
Reference Export
Total 120,604,860.62MonthJanuary 6,597,380.74February 19,808,024.16March 3,941,063.27April 2,034,824.41May 2,972,449.02June 7,000,733.68July 15,598,049.99August 1,351,458.74September 3,606,259.13October 9,763,342.94November 20,394,112.59December 27,537,161.95
Reference Export
Total 168,866,999.88
Month
Grand Cape Mount 1,507,216.35February 24,353,045.12March 6,866,924.40April 58,007,473.27May 1,634,187.70June 5,013,093.56July 1,609,517.39August 55,254,561.75September 5,461,172.93October 5,123,144.68November 3,205,569.94December 831,092.79
Source: Liberia Institute of Statistics & Geo-Information Services
2009
2010
Table 2.3.3: Export by Reference Month In USD, Liberia Jan-Dec 2009 and 2010
Page 53 Statistical Bulletin 2011

Table 2.3.4: Export by HS Code, All Countries of Destination, FOB Value In USD, Liberia 2010 HS Country Code and Description FOB Value
Total 168,866,999.88 AE:UNITED ARAB EMIRATES 1,890,000.00AN:NETHERLANDS ANTILLES 40,000.00BE:BELGIUM 6,681,959.20CM:CAMEROON 6,055.43CN:CHINA 598,549.92DE:GERMANY 8,220.90DK:DENMARK 111.30ES:SPAIN 3,801,176.90ET:ETHIOPIA 16,722,019.76GB:UNITED KINGDOM 110,000.00GH:GHANA 53,766.78HK:HONG KONG 44,550.75
48,299.76LB:LEBANON 14,456.73MY:MALAYSIA 122,850.00NE:NIGER 36,542.50NG:NIGERIA 526,367.75NL:NETHERLANDS 15,800.00RU:RUSSIAN FEDERATION 34,985.30SE:SWEDEN 7,219.10SG:SINGAPORE 33,630.00SL:SIERRA LEONE 11,551,613.68SN:SENEGAL 18,104,966.68TG:TOGO 61,893.00UA:UKRAINE 200,324.35US:UNITED STATES 108,151,640.09Source: Liberia Institute of Statistics & Geo-Information Services
Table 2.3.5: RE-Export by Reference Month and Value In USD, Liberia, 2010Reference RE-EXPORT
Total 2,243,386.32
Month January 375,000.00February 61,893.00March 113,763.30April 20,000.00May 0.00June 113,635.00July 17,500.00August 1,220,345.00September 20,471.72October 130,686.76November 25,000.00December 145,091.54
Page 54 Statistical Bulletin 2011
Statistical Bulletin, Monrovia, Liberia. December 2011 64
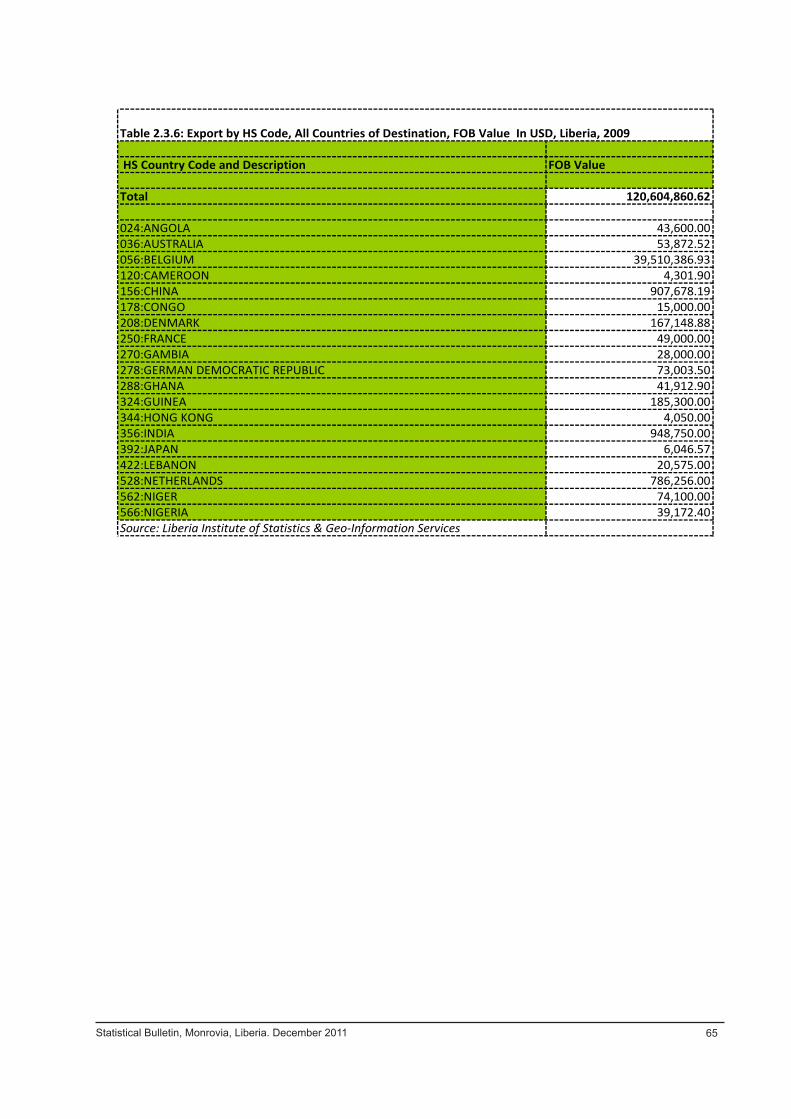
Statistical Bulletin, Monrovia, Liberia. December 2011 65
Table 2.3.6: Export by HS Code, All Countries of Destination, FOB Value In USD, Liberia, 2009
HS Country Code and Description FOB Value
Total 120,604,860.62
024:ANGOLA 43,600.00036:AUSTRALIA 53,872.52056:BELGIUM 39,510,386.93120:CAMEROON 4,301.90156:CHINA 907,678.19178:CONGO 15,000.00208:DENMARK 167,148.88250:FRANCE 49,000.00270:GAMBIA 28,000.00278:GERMAN DEMOCRATIC REPUBLIC 73,003.50288:GHANA 41,912.90324:GUINEA 185,300.00344:HONG KONG 4,050.00356:INDIA 948,750.00392:JAPAN 6,046.57422:LEBANON 20,575.00528:NETHERLANDS 786,256.00562:NIGER 74,100.00566:NIGERIA 39,172.40Source: Liberia Institute of Statistics & Geo-Information Services
Page 55 Statistical Bulletin 2011
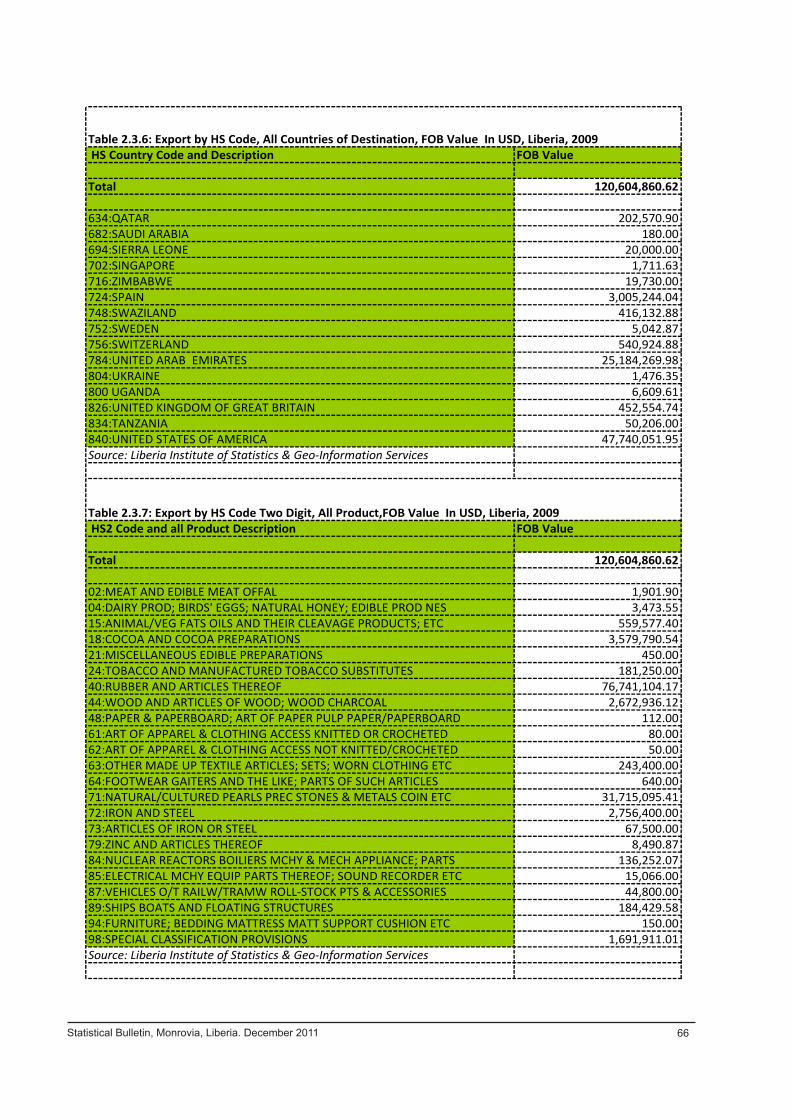
Table 2.3.6: Export by HS Code, All Countries of Destination, FOB Value In USD, Liberia, 2009 HS Country Code and Description FOB Value
Total 120,604,860.62
634:QATAR 202,570.90682:SAUDI ARABIA 180.00694:SIERRA LEONE 20,000.00702:SINGAPORE 1,711.63716:ZIMBABWE 19,730.00724:SPAIN 3,005,244.04748:SWAZILAND 416,132.88752:SWEDEN 5,042.87756:SWITZERLAND 540,924.88784:UNITED ARAB EMIRATES 25,184,269.98804:UKRAINE 1,476.35800 UGANDA 6,609.61826:UNITED KINGDOM OF GREAT BRITAIN 452,554.74834:TANZANIA 50,206.00840:UNITED STATES OF AMERICA 47,740,051.95Source: Liberia Institute of Statistics & Geo-Information Services
Table 2.3.7: Export by HS Code Two Digit, All Product,FOB Value In USD, Liberia, 2009 HS2 Code and all Product Description FOB Value
Total 120,604,860.62
02:MEAT AND EDIBLE MEAT OFFAL 1,901.9004:DAIRY PROD; BIRDS' EGGS; NATURAL HONEY; EDIBLE PROD NES 3,473.5515:ANIMAL/VEG FATS OILS AND THEIR CLEAVAGE PRODUCTS; ETC 559,577.4018:COCOA AND COCOA PREPARATIONS 3,579,790.5421:MISCELLANEOUS EDIBLE PREPARATIONS 450.0024:TOBACCO AND MANUFACTURED TOBACCO SUBSTITUTES 181,250.0040:RUBBER AND ARTICLES THEREOF 76,741,104.1744:WOOD AND ARTICLES OF WOOD; WOOD CHARCOAL 2,672,936.1248:PAPER & PAPERBOARD; ART OF PAPER PULP PAPER/PAPERBOARD 112.0061:ART OF APPAREL & CLOTHING ACCESS KNITTED OR CROCHETED 80.0062:ART OF APPAREL & CLOTHING ACCESS NOT KNITTED/CROCHETED 50.0063:OTHER MADE UP TEXTILE ARTICLES; SETS; WORN CLOTHING ETC 243,400.0064:FOOTWEAR GAITERS AND THE LIKE; PARTS OF SUCH ARTICLES 640.0071:NATURAL/CULTURED PEARLS PREC STONES & METALS COIN ETC 31,715,095.4172:IRON AND STEEL 2,756,400.0073:ARTICLES OF IRON OR STEEL 67,500.0079:ZINC AND ARTICLES THEREOF 8,490.8784:NUCLEAR REACTORS BOILIERS MCHY & MECH APPLIANCE; PARTS 136,252.0785:ELECTRICAL MCHY EQUIP PARTS THEREOF; SOUND RECORDER ETC 15,066.0087:VEHICLES O/T RAILW/TRAMW ROLL-STOCK PTS & ACCESSORIES 44,800.0089:SHIPS BOATS AND FLOATING STRUCTURES 184,429.5894:FURNITURE; BEDDING MATTRESS MATT SUPPORT CUSHION ETC 150.0098:SPECIAL CLASSIFICATION PROVISIONS 1,691,911.01Source: Liberia Institute of Statistics & Geo-Information Services
Page 56 Statistical Bulletin 2011
Statistical Bulletin, Monrovia, Liberia. December 2011 66
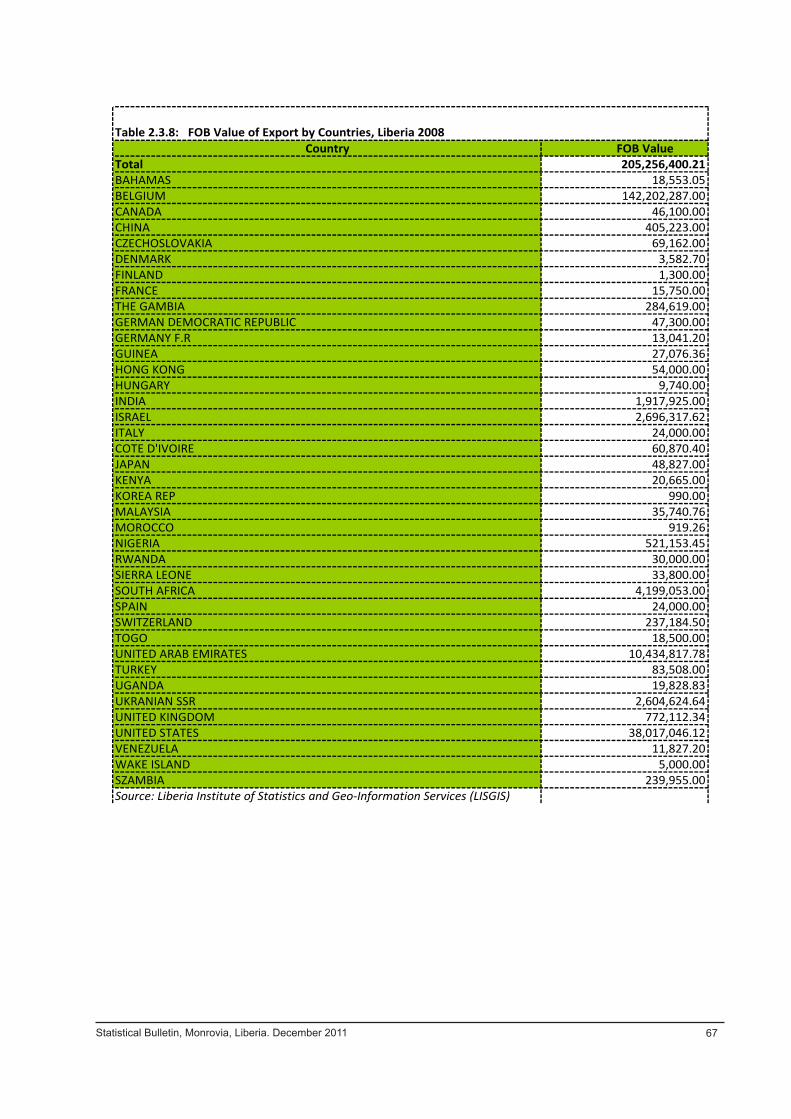
Country FOB ValueTotal 205,256,400.21BAHAMAS 18,553.05BELGIUM 142,202,287.00CANADA 46,100.00CHINA 405,223.00CZECHOSLOVAKIA 69,162.00DENMARK 3,582.70FINLAND 1,300.00FRANCE 15,750.00THE GAMBIA 284,619.00GERMAN DEMOCRATIC REPUBLIC 47,300.00GERMANY F.R 13,041.20GUINEA 27,076.36HONG KONG 54,000.00HUNGARY 9,740.00INDIA 1,917,925.00ISRAEL 2,696,317.62ITALY 24,000.00COTE D'IVOIRE 60,870.40JAPAN 48,827.00KENYA 20,665.00KOREA REP 990.00MALAYSIA 35,740.76MOROCCO 919.26NIGERIA 521,153.45RWANDA 30,000.00SIERRA LEONE 33,800.00SOUTH AFRICA 4,199,053.00SPAIN 24,000.00SWITZERLAND 237,184.50TOGO 18,500.00UNITED ARAB EMIRATES 10,434,817.78TURKEY 83,508.00UGANDA 19,828.83UKRANIAN SSR 2,604,624.64UNITED KINGDOM 772,112.34UNITED STATES 38,017,046.12VENEZUELA 11,827.20WAKE ISLAND 5,000.00SZAMBIA 239,955.00Source: Liberia Institute of Statistics and Geo-Information Services (LISGIS)
Table 2.3.8: FOB Value of Export by Countries, Liberia 2008
Page 57 Statistical Bulletin 2011
Statistical Bulletin, Monrovia, Liberia. December 2011 67

Table 2.4.1: Import by Reference Month In USD, Liberia Jan-Dec 2009 and 2010Reference Import
Total 673,193,126.00Month
January 100,879,685.09February 23,162,168.51March 32,839,971.70April 52,810,117.52May 24,451,617.38June 157,455,946.25July 104,823,743.44August 38,951,333.42September 41,060,641.48October 1,564,817.32November 45,729,322.78December 49,463,761.11
Reference Import
Total 594,716,781.25 Month
January 36,037,441.92
Grand Cape Mount 39,005,966.93 March 50,844,604.65 April 63,706,366.42 May 51,561,171.48 June 69,201,132.93 July 57,883,260.89 August 78,418,898.69 September 70,200,093.60 October 58,402,474.40 November 7,398,617.54 December 12,056,751.81 Source: Liberia Institute of Statistics and Geo-Information Services (LISGIS)
2009
2010
Page 58 Statistical Buleetin 2011
Statistical Bulletin, Monrovia, Liberia. December 2011 68
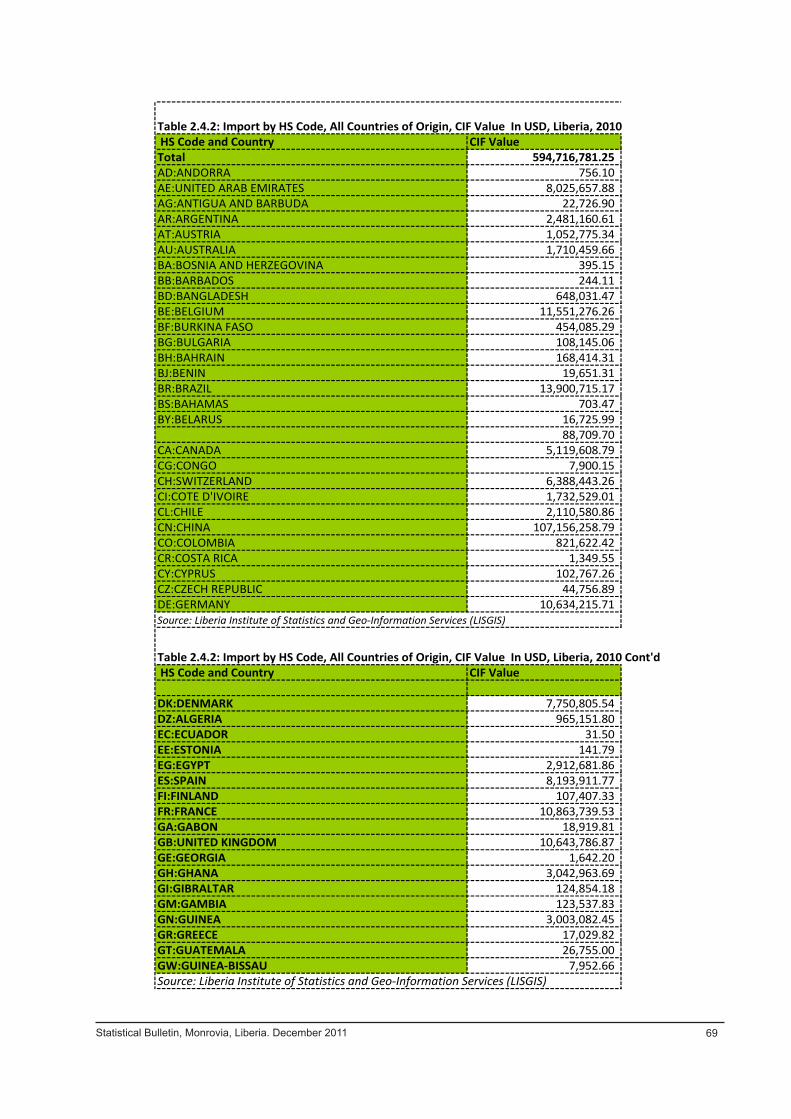
Table 2.4.2: Import by HS Code, All Countries of Origin, CIF Value In USD, Liberia, 2010 HS Code and Country CIF ValueTotal 594,716,781.25 AD:ANDORRA 756.10 AE:UNITED ARAB EMIRATES 8,025,657.88 AG:ANTIGUA AND BARBUDA 22,726.90 AR:ARGENTINA 2,481,160.61 AT:AUSTRIA 1,052,775.34 AU:AUSTRALIA 1,710,459.66 BA:BOSNIA AND HERZEGOVINA 395.15 BB:BARBADOS 244.11 BD:BANGLADESH 648,031.47 BE:BELGIUM 11,551,276.26 BF:BURKINA FASO 454,085.29 BG:BULGARIA 108,145.06 BH:BAHRAIN 168,414.31 BJ:BENIN 19,651.31 BR:BRAZIL 13,900,715.17 BS:BAHAMAS 703.47 BY:BELARUS 16,725.99
88,709.70 CA:CANADA 5,119,608.79 CG:CONGO 7,900.15 CH:SWITZERLAND 6,388,443.26 CI:COTE D'IVOIRE 1,732,529.01 CL:CHILE 2,110,580.86 CN:CHINA 107,156,258.79 CO:COLOMBIA 821,622.42 CR:COSTA RICA 1,349.55 CY:CYPRUS 102,767.26 CZ:CZECH REPUBLIC 44,756.89 DE:GERMANY 10,634,215.71 Source: Liberia Institute of Statistics and Geo-Information Services (LISGIS)
Table 2.4.2: Import by HS Code, All Countries of Origin, CIF Value In USD, Liberia, 2010 Cont'd HS Code and Country CIF Value
DK:DENMARK 7,750,805.54 DZ:ALGERIA 965,151.80 EC:ECUADOR 31.50 EE:ESTONIA 141.79 EG:EGYPT 2,912,681.86 ES:SPAIN 8,193,911.77 FI:FINLAND 107,407.33 FR:FRANCE 10,863,739.53 GA:GABON 18,919.81 GB:UNITED KINGDOM 10,643,786.87 GE:GEORGIA 1,642.20 GH:GHANA 3,042,963.69 GI:GIBRALTAR 124,854.18 GM:GAMBIA 123,537.83 GN:GUINEA 3,003,082.45 GR:GREECE 17,029.82 GT:GUATEMALA 26,755.00 GW:GUINEA-BISSAU 7,952.66 Source: Liberia Institute of Statistics and Geo-Information Services (LISGIS)
Page 59 Statistical Buleetin 2011
Statistical Bulletin, Monrovia, Liberia. December 2011 69

Table 2.4.2: Import by HS Code, All Countries of Origin, CIF Value In USD, Liberia, 2010 Cont'd
HS Code and Country CIF ValueHK:HONG KONG 990,757.77 HN:HONDURAS 37,527.63 HR:CROATIA 1,254,729.82 HU:HUNGARY 210,899.33 ID:INDONESIA 7,664,214.31 IE:IRELAND 1,267,412.59 IL:ISRAEL 891,867.76 IN:INDIA 26,869,183.37 IR:IRAN, ISLAMIC REPUBLIC OF 679,669.69 IT:ITALY 4,953,092.19 JM:JAMAICA 301.45 JO:JORDAN 2,012,918.99 JP:JAPAN 16,720,163.42 KE:KENYA 181,001.33 KH:CAMBODIA 42,192.75 KP:KOREA, DEMOCRATIC PEOPLE'S REP. OF 253,507.90 KR:KOREA, REPUBLIC OF 3,145,847.96 KW:KUWAIT 110,668.61 KZ:KAZAKSTAN 264.98 LA:LAO PEOPLE'S DEMOCRATIC REPUBLIC 37,817.38 LB:LEBANON 13,180,976.44 LK:SRI LANKA 234,482.82 LS:LESOTHO 13,094.25 LT:LITHUANIA 112,818.00 LU:LUXEMBOURG 1,758.00 LV:LATVIA 106.58 LY:LIBYAN ARAB JAMAHIRIYA 10,542.00 MA:MOROCCO 2,160,137.89 MC:MONACO 2,805,026.38 ML:MALI 11,258.63 MM:MYANMAR 4,593.09 MR:MAURITANIA 3,490,457.87 MT:MALTA 183,639.50 MW:MALAWI 41,000.00 MX:MEXICO 394,825.90 MY:MALAYSIA 18,874,157.23 NA:NAMIBIA 1,102,145.60 NC:NEW CALEDONIA 210.14 NE:NIGER 48,360.00 NG:NIGERIA 2,735,038.28 NI:NICARAGUA 1,843.20 NL:NETHERLANDS 18,009,360.26 NO:NORWAY 1,778,682.31 NZ:NEW ZEALAND 480,393.18 OM:OMAN 836,532.83 PA:PANAMA 9,258.31 PE:PERU 994,691.00 PH:PHILIPPINES 152,974.36 PK:PAKISTAN 4,655,013.62 PL:POLAND 1,618,707.77 PT:PORTUGAL 53,016.27 PY:PARAGUAY 97,211.78 Source: Liberia Institute of Statistics and Geo-Information Services (LISGIS)
Page 60 Statistical Buleetin 2011
Statistical Bulletin, Monrovia, Liberia. December 2011 70
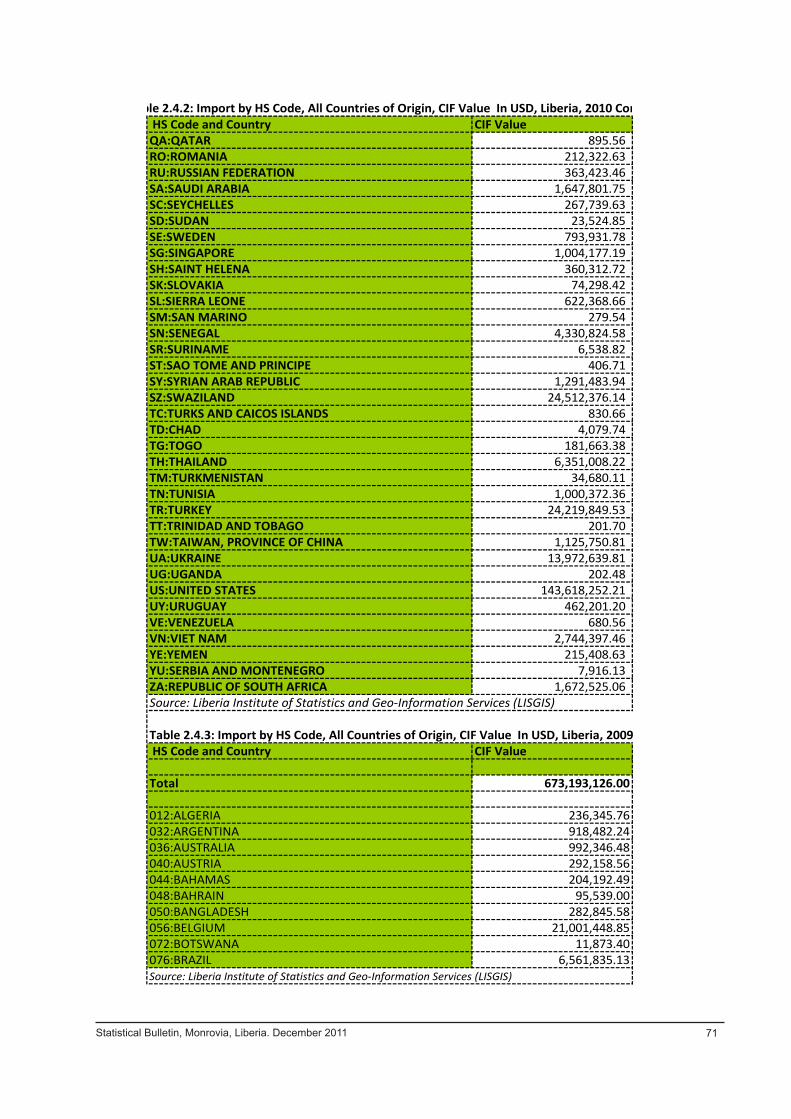
HS Code and Country CIF ValueQA:QATAR 895.56 RO:ROMANIA 212,322.63 RU:RUSSIAN FEDERATION 363,423.46 SA:SAUDI ARABIA 1,647,801.75 SC:SEYCHELLES 267,739.63 SD:SUDAN 23,524.85 SE:SWEDEN 793,931.78 SG:SINGAPORE 1,004,177.19 SH:SAINT HELENA 360,312.72 SK:SLOVAKIA 74,298.42 SL:SIERRA LEONE 622,368.66 SM:SAN MARINO 279.54 SN:SENEGAL 4,330,824.58 SR:SURINAME 6,538.82 ST:SAO TOME AND PRINCIPE 406.71 SY:SYRIAN ARAB REPUBLIC 1,291,483.94 SZ:SWAZILAND 24,512,376.14 TC:TURKS AND CAICOS ISLANDS 830.66 TD:CHAD 4,079.74 TG:TOGO 181,663.38 TH:THAILAND 6,351,008.22 TM:TURKMENISTAN 34,680.11 TN:TUNISIA 1,000,372.36 TR:TURKEY 24,219,849.53 TT:TRINIDAD AND TOBAGO 201.70 TW:TAIWAN, PROVINCE OF CHINA 1,125,750.81 UA:UKRAINE 13,972,639.81 UG:UGANDA 202.48 US:UNITED STATES 143,618,252.21 UY:URUGUAY 462,201.20 VE:VENEZUELA 680.56 VN:VIET NAM 2,744,397.46 YE:YEMEN 215,408.63 YU:SERBIA AND MONTENEGRO 7,916.13 ZA:REPUBLIC OF SOUTH AFRICA 1,672,525.06 Source: Liberia Institute of Statistics and Geo-Information Services (LISGIS)
Table 2.4.3: Import by HS Code, All Countries of Origin, CIF Value In USD, Liberia, 2009 HS Code and Country CIF Value
Total 673,193,126.00
012:ALGERIA 236,345.76032:ARGENTINA 918,482.24036:AUSTRALIA 992,346.48040:AUSTRIA 292,158.56044:BAHAMAS 204,192.49048:BAHRAIN 95,539.00050:BANGLADESH 282,845.58056:BELGIUM 21,001,448.85072:BOTSWANA 11,873.40076:BRAZIL 6,561,835.13Source: Liberia Institute of Statistics and Geo-Information Services (LISGIS)
ble 2.4.2: Import by HS Code, All Countries of Origin, CIF Value In USD, Liberia, 2010 Con
Page 61 Statistical Buleetin 2011
Statistical Bulletin, Monrovia, Liberia. December 2011 71

Statistical Bulletin, Monrovia, Liberia. December 2011 72
Table 2.4.3: Import by HS Code, All Countries of Origin, CIF Value In USD, Liberia, 2009 HS Code and Country CIF Value120:CAMEROON 25,447.08124:CANADA 1,447,751.29132:CAPE VERDE 170,095.05144:SRI LANKA 110,788.70152:CHILE 2,177,309.42156:CHINA 107,826,751.89158:TAIWAN 352,816.26170:COLOMBIA 471,608.47184:Cook Islands 77.00191:CROATIA 124,766.25196:CYPRUS 102,572.68204:BENIN 54,579.32208:DENMARK 5,353,538.15212:Dominican 44,186.00218:ECUADOR 82,162.50230:Ethiopia 96,347.10231:ETHIOPIA 14,912.55246:FINLAND 19,135.62250:FRANCE 13,721,273.82258:FRENCH POLYNESIA 45,503.52266:GABON 12,355.35270:GAMBIA 10,234,680.44276:GERMANY 1,048,223.56278:GERMAN DEMOCRATIC REPUBLIC 1,078,462.95280:GERMANY 22,949,303.31288:GHANA 6,084,621.78292:Gibraltar 40,730.81300:GREECE 37,926.00324:GUINEA 44,262,653.36328:GUYANA 167,870.13332:HAITI 4,820.00340:HONDURAS 625.62344:HONG KONG 1,045,425.79356:INDIA 19,964,026.84368:IRAQ 123,887.50360:INDONESIA 1,817,330.44364:IRAN 315,944.09372:IRELAND 429,337.23376:ISRAEL 253,309.36380:ITALY 2,979,570.66384:IVORY COAST 2,105,209.72392:JAPAN 20,140,487.93400:JORDAN 446,486.43404:KENYA 806,971.74408:KOREA DEMOCRATIC PEOPLE 820,199.58410:KOREA REP 183,983.22414:KUWAIT 85,112.50422:LEBANON 30,700,512.06446:Macao 22,925.00450:MADAGASCAR 83,406.84454:MALAWI 41,375.00458:MALAYSIA 6,899,518.89Source: Liberia Institute of Statistics and Geo-Information Services (LISGIS)
Page 62 Statistical Buleetin 2011

Table 2.4.3: Import by HS Code, All Countries of Origin, CIF Value In USD, Liberia, 2009 HS Code and Country CIF Value466:MALI 2,259.47470:MALTA 456,319.98478:MAURITANIA 2,572,761.95480:MAURITIUS 46,707.18492:MONACO 1,179,001.13504:MOROCO 2,315,246.49512:OMAN 357,683.24528:NETHERLANDS 21,339,141.57532:NETHERLAND ANTILLES 6,701,939.27536:NEUTRAL ZONE 25,372.00540:NEW CALEDONIA 2,617.56562:NIGER 6,375.00566:NIGERIA 10,733,334.41574:NORFOLK ISLAND 4,379.42578:NORWAY 2,605,588.33586:PAKISTAN 418,300.51590:PANAMA 593,129.10604:PERU 412,583.80608:PHILIPPINES 955.36616:POLAND 507,206.39620:PORTUGAL 99,454.09634:QATAR 6,023.96642:ROMANIA 172,703.99682:SAUDI ARABIA 970,718.38686:SENEGAL 1,324,866.65694:SIERRA LEONE 1,160,546.20702:SINGAPORE 17,815,458.04704:VIETNMA 93,135.05710:SOUTH AFRICA 4,412,247.20716:ZIMBABWE 9,740.00724:SPAIN 7,932,298.95748:SWAZILAND 117,370.40752:SWEDEN 8,282,367.17756:SWITZERLAND 7,068,413.93760:SYRIAN ARAB REPUBLIC 561,313.00764:THAILAND 8,001,467.14768:TOGO 383,475.60784:UNITED ARAB EMIRATE 24,488,131.96788:TUNISIA 333,235.68792:TURKEY 12,048,235.93796:TURKS AND CAICOS ISLAND 34,240.00800:UGANDA 895,974.27804:UKRAINE 30,771.24818:EGYPT 5,569,832.34826:UNITED KINGDOM OF GREAT BRITAIN 19,700,134.10840:UNITED STATES OF AMERICA 163,050,634.88858:URUGUAY 177,367.27886:YEMEN 39,694.00890:YUGOSLAVIA 106,388.12Source: Liberia Institute of Statistics and Geo-Information Services (LISGIS)
Page 63 Statistical Buleetin 2011
Statistical Bulletin, Monrovia, Liberia. December 2011 73
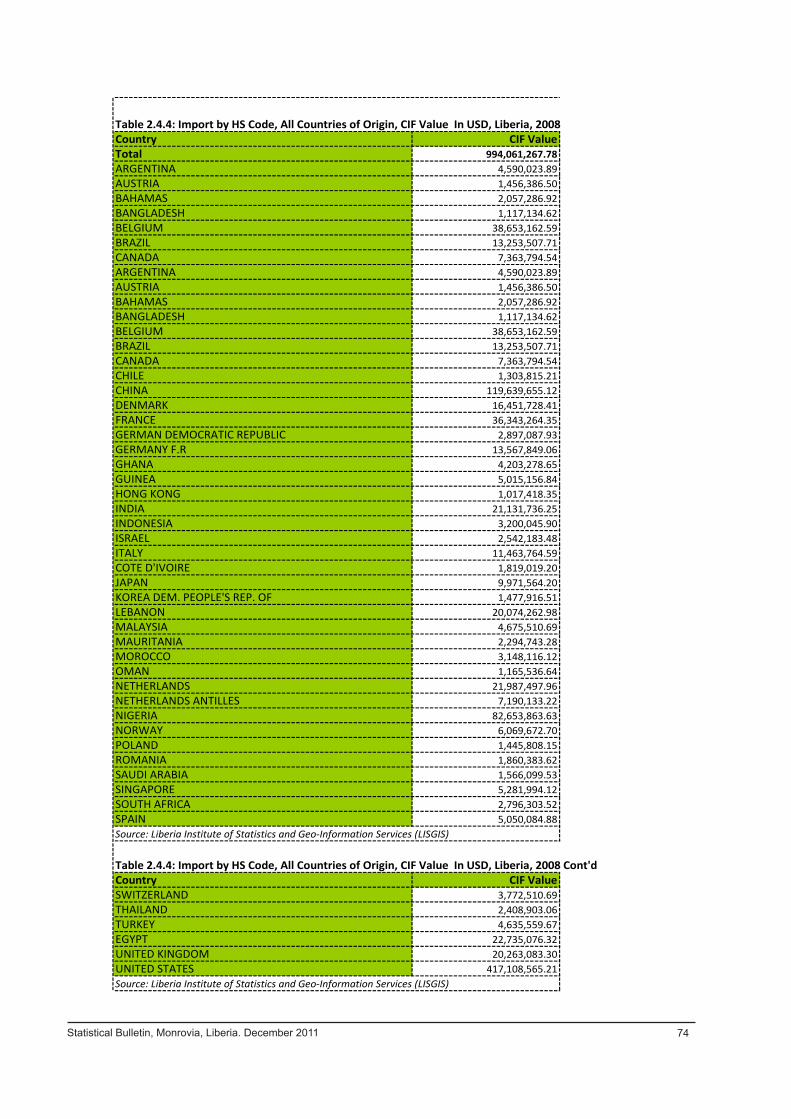
Table 2.4.4: Import by HS Code, All Countries of Origin, CIF Value In USD, Liberia, 2008Country CIF ValueTotal 994,061,267.78ARGENTINA 4,590,023.89AUSTRIA 1,456,386.50BAHAMAS 2,057,286.92BANGLADESH 1,117,134.62BELGIUM 38,653,162.59BRAZIL 13,253,507.71CANADA 7,363,794.54ARGENTINA 4,590,023.89AUSTRIA 1,456,386.50BAHAMAS 2,057,286.92BANGLADESH 1,117,134.62BELGIUM 38,653,162.59BRAZIL 13,253,507.71CANADA 7,363,794.54CHILE 1,303,815.21CHINA 119,639,655.12DENMARK 16,451,728.41FRANCE 36,343,264.35GERMAN DEMOCRATIC REPUBLIC 2,897,087.93GERMANY F.R 13,567,849.06GHANA 4,203,278.65GUINEA 5,015,156.84HONG KONG 1,017,418.35INDIA 21,131,736.25INDONESIA 3,200,045.90ISRAEL 2,542,183.48ITALY 11,463,764.59COTE D'IVOIRE 1,819,019.20JAPAN 9,971,564.20KOREA DEM. PEOPLE'S REP. OF 1,477,916.51LEBANON 20,074,262.98MALAYSIA 4,675,510.69MAURITANIA 2,294,743.28MOROCCO 3,148,116.12OMAN 1,165,536.64NETHERLANDS 21,987,497.96NETHERLANDS ANTILLES 7,190,133.22NIGERIA 82,653,863.63NORWAY 6,069,672.70POLAND 1,445,808.15ROMANIA 1,860,383.62SAUDI ARABIA 1,566,099.53SINGAPORE 5,281,994.12SOUTH AFRICA 2,796,303.52SPAIN 5,050,084.88Source: Liberia Institute of Statistics and Geo-Information Services (LISGIS)
Table 2.4.4: Import by HS Code, All Countries of Origin, CIF Value In USD, Liberia, 2008 Cont'dCountry CIF ValueSWITZERLAND 3,772,510.69THAILAND 2,408,903.06TURKEY 4,635,559.67EGYPT 22,735,076.32UNITED KINGDOM 20,263,083.30UNITED STATES 417,108,565.21Source: Liberia Institute of Statistics and Geo-Information Services (LISGIS)
Page 64 Statistical Buleetin 2011
Statistical Bulletin, Monrovia, Liberia. December 2011 74
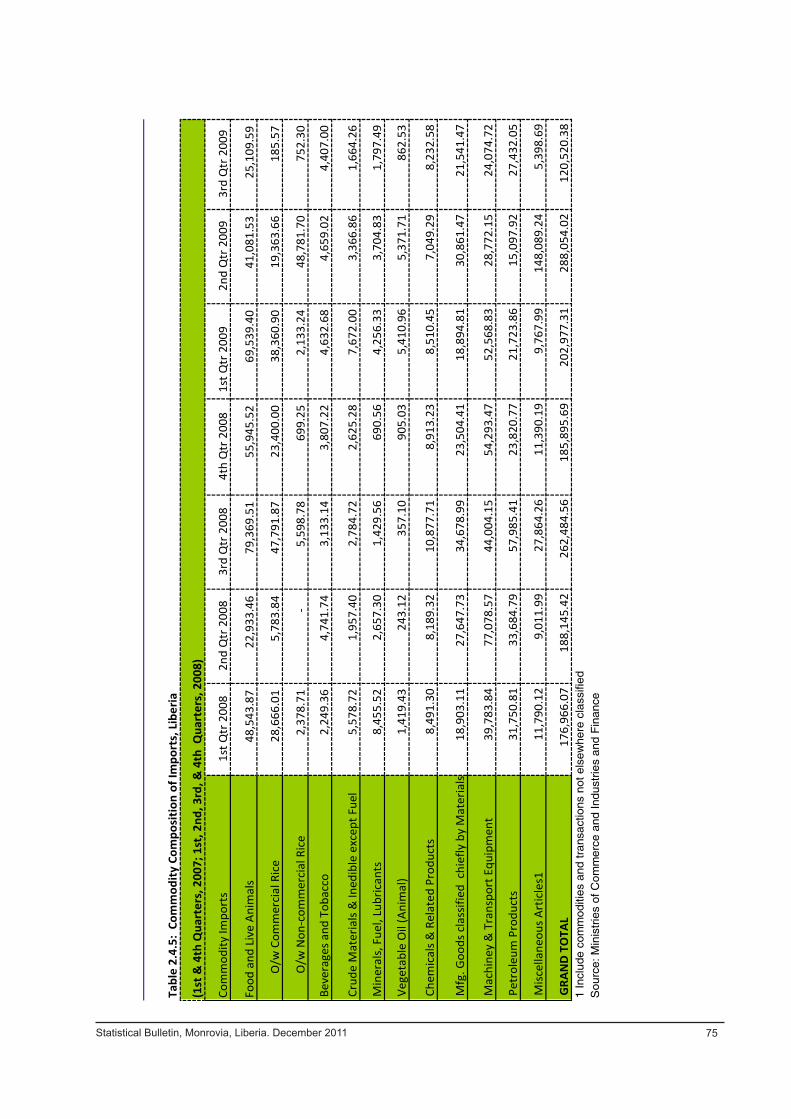
Com
mod
ity Im
port
s 1s
t Qtr
200
82n
d Q
tr 2
008
3rd
Qtr
200
84t
h Q
tr 2
008
1st Q
tr 2
009
2nd
Qtr
200
93r
d Q
tr 2
009
Food
and
Liv
e An
imal
s48
,543
.87
22
,933
.46
79,3
69.5
1
55
,945
.52
69,5
39.4
0
41
,081
.53
25,1
09.5
9
O/w
Com
mer
cial
Ric
e28
,666
.01
5,
783.
84
47
,791
.87
23,4
00.0
0
38
,360
.90
19,3
63.6
6
18
5.57
O/w
Non
-com
mer
cial
Ric
e2,
378.
71
-
5,59
8.78
699.
25
2,
133.
24
48,7
81.7
0
75
2.30
Beve
rage
s and
Tob
acco
2,24
9.36
4,74
1.74
3,13
3.14
3,80
7.22
4,
632.
68
4,65
9.02
4,40
7.00
Crud
e M
ater
ials
& In
edib
le e
xcep
t Fue
l5,
578.
72
1,
957.
40
2,
784.
72
2,
625.
28
7,67
2.00
3,
366.
86
1,
664.
26
Min
eral
s, F
uel,
Lubr
ican
ts8,
455.
52
2,
657.
30
1,
429.
56
69
0.56
4,25
6.33
3,
704.
83
1,
797.
49
Vege
tabl
e O
il (A
nim
al)
1,41
9.43
243.
12
35
7.10
905.
03
5,
410.
96
5,37
1.71
862.
53
Chem
ical
s & R
elat
ed P
rodu
cts
8,49
1.30
8,18
9.32
10,8
77.7
1
8,
913.
23
8,51
0.45
7,
049.
29
8,
232.
58
Mfg
. Goo
ds c
lass
ified
chi
efly
by
Mat
eria
ls18
,903
.11
27
,647
.73
34,6
78.9
9
23
,504
.41
18,8
94.8
1
30
,861
.47
21,5
41.4
7
Mac
hine
y &
Tra
nspo
rt E
quip
men
t39
,783
.84
77
,078
.57
44,0
04.1
5
54
,293
.47
52,5
68.8
3
28
,772
.15
24,0
74.7
2
Petr
oleu
m P
rodu
cts
31,7
50.8
1
33,6
84.7
9
57
,985
.41
23,8
20.7
7
21
,723
.86
15,0
97.9
2
27
,432
.05
Misc
ella
neou
s Art
icle
s111
,790
.12
9,
011.
99
27
,864
.26
11,3
90.1
9
9,
767.
99
148,
089.
24
5,39
8.69
GRA
ND
TO
TAL
176,
966.
07
188,
145.
42
262,
484.
56
185,
895.
69
202,
977.
31
288,
054.
02
120,
520.
38
Tabl
e 2.
4.5:
Com
mod
ity C
ompo
sitio
n of
Impo
rts,
Lib
eria
(1st
& 4
th Q
uart
ers,
200
7; 1
st, 2
nd, 3
rd, &
4th
Qua
rter
s, 2
008)
1 In
clud
e co
mm
oditi
es a
nd tr
ansa
ctio
ns n
ot e
lsew
here
cla
ssifi
edS
ourc
e: M
inis
trie
s of
Com
mer
ce a
nd In
dust
ries
and
Fin
ance
Pag
e 65
Sta
tistic
al B
ulle
tin 2
011
Statistical Bulletin, Monrovia, Liberia. December 2011 75
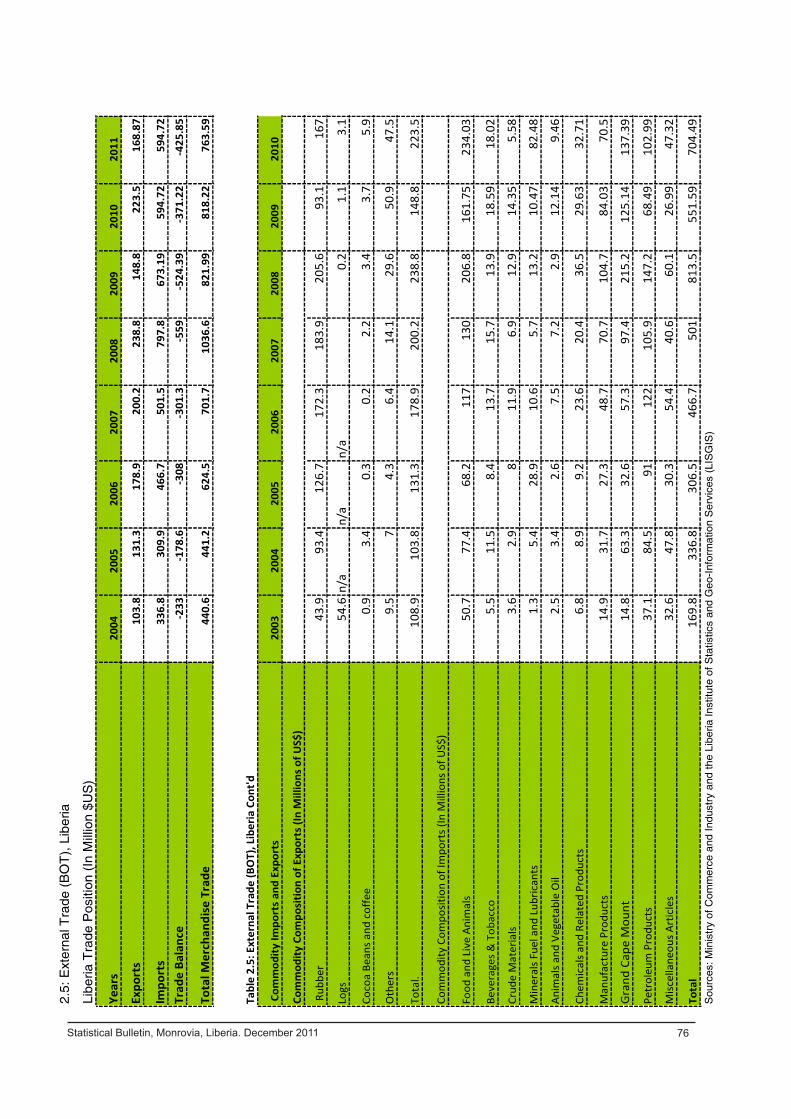
Year
s20
0420
0520
0620
0720
0820
0920
1020
11
Expo
rts
103.
813
1.3
178.
920
0.2
238.
814
8.8
223.
516
8.87
Impo
rts
336.
830
9.9
466.
750
1.5
797.
867
3.19
594.
7259
4.72
Trad
e Ba
lanc
e-2
33-1
78.6
-308
-301
.3-5
59-5
24.3
9-3
71.2
2-4
25.8
5
Tota
l Mer
chan
dise
Tra
de
440.
644
1.2
624.
570
1.7
1036
.682
1.99
818.
2276
3.59
Com
mod
ity Im
port
s an
d Ex
port
s20
0320
0420
0520
0620
0720
0820
0920
10
Com
mod
ity C
ompo
sitio
n of
Exp
orts
(In
Mill
ions
of U
S$)
Rub
ber
43.9
93.4
126.
717
2.3
183.
920
5.6
93.1
167
Logs
54.6
n/a
n/a
n/a
0.2
1.1
3.1
Coco
a Be
ans a
nd c
offe
e0.
93.
40.
30.
22.
23.
43.
75.
9
Oth
ers
9.5
74.
36.
414
.129
.650
.947
.5
Tota
l.10
8.9
103.
813
1.3
178.
920
0.2
238.
814
8.8
223.
5
Com
mod
ity C
ompo
sitio
n of
Impo
rts (
In M
illio
ns o
f US$
)
Food
and
Liv
e An
imal
s50
.777
.468
.211
713
020
6.8
161.
7523
4.03
Beve
rage
s & T
obac
co5.
511
.58.
413
.715
.713
.918
.59
18.0
2
Crud
e M
ater
ials
3.6
2.9
811
.96.
912
.914
.35
5.58
Min
eral
s Fue
l and
Lub
rican
ts1.
35.
428
.910
.65.
713
.210
.47
82.4
8
Anim
als a
nd V
eget
able
Oil
2.5
3.4
2.6
7.5
7.2
2.9
12.1
49.
46
Chem
ical
s and
Rel
ated
Pro
duct
s6.
88.
99.
223
.620
.436
.529
.63
32.7
1
Man
ufac
ture
Pro
duct
s14
.931
.727
.348
.770
.710
4.7
84.0
370
.5
Gra
nd C
ape
Mou
nt14
.863
.332
.657
.397
.421
5.2
125.
1413
7.39
Petr
oleu
m P
rodu
cts
37.1
84.5
9112
210
5.9
147.
268
.49
102.
99
Misc
ella
neou
s Art
icle
s32
.647
.830
.354
.440
.660
.126
.99
47.3
2
Tota
l16
9.8
336.
830
6.5
466.
750
181
3.5
551.
5970
4.49
Sou
rces
: M
inis
try
of C
omm
erce
and
Ind
ustr
y an
d th
e Li
beria
Ins
titut
e of
Sta
tistic
s an
d G
eo-I
nfor
mat
ion
Ser
vice
s (L
ISG
IS)
Libe
ria T
rade
Pos
ition
(In
Mill
ion
$US
)
2.5:
Ext
erna
l Tra
de (
BO
T),
Lib
eria
Tabl
e 2.
5: E
xter
nal T
rade
(BO
T), L
iber
ia C
ont'd
Pag
e 66
Sta
tistic
al B
ulle
tin 2
011
Statistical Bulletin, Monrovia, Liberia. December 2011 76
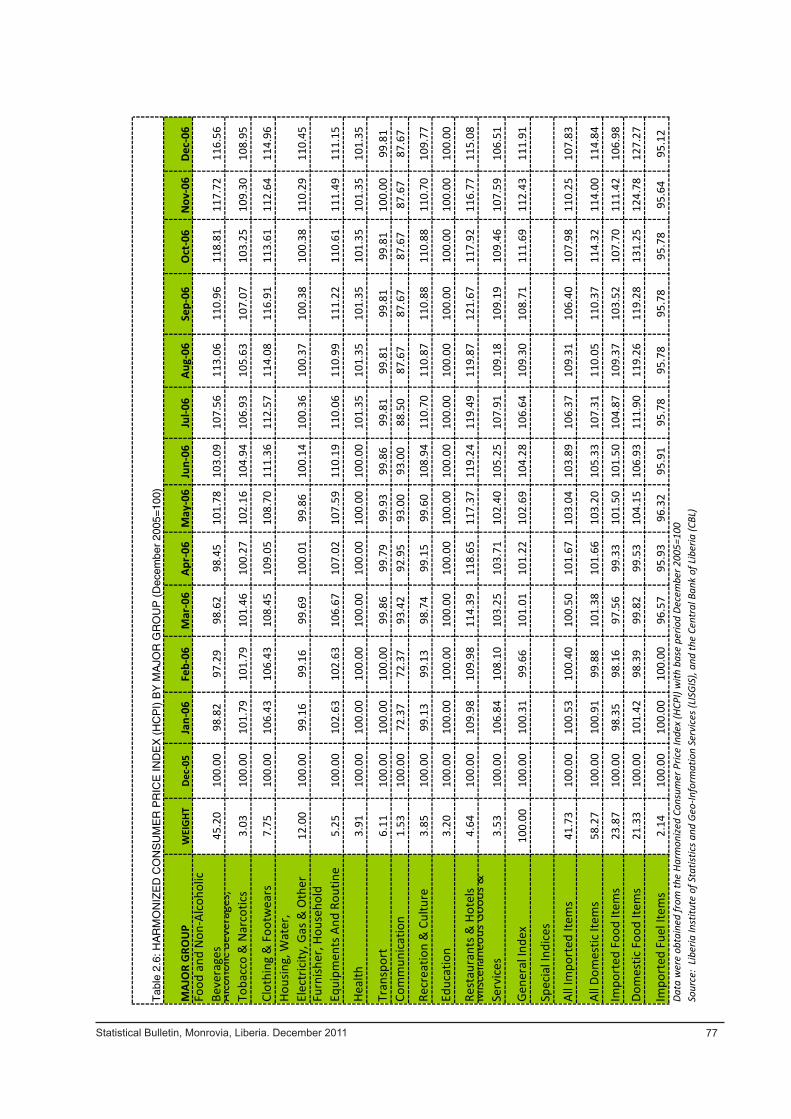
MAJ
OR
GRO
UP
WEI
GHT
Dec-
05Ja
n-06
Feb-
06M
ar-0
6Ap
r-06
May
-06
Jun-
06Ju
l-06
Aug-
06Se
p-06
Oct
-06
Nov
-06
Dec-
06Fo
od a
nd N
on-A
lcoh
olic
Be
vera
ges
45.2
010
0.00
98.8
297
.29
98.6
298
.45
101.
7810
3.09
107.
5611
3.06
110.
9611
8.81
117.
7211
6.56
Alco
holic
Bev
erag
es,
Toba
cco
& N
arco
tics
3.03
100.
0010
1.79
101.
7910
1.46
100.
2710
2.16
104.
9410
6.93
105.
6310
7.07
103.
2510
9.30
108.
95
Clot
hing
& F
ootw
ears
7.75
100.
0010
6.43
106.
4310
8.45
109.
0510
8.70
111.
3611
2.57
114.
0811
6.91
113.
6111
2.64
114.
96Ho
usin
g, W
ater
, El
ectr
icity
, Gas
& O
ther
12
.00
100.
0099
.16
99.1
699
.69
100.
0199
.86
100.
1410
0.36
100.
3710
0.38
100.
3811
0.29
110.
45Fu
rnish
er, H
ouse
hold
Eq
uipm
ents
And
Rou
tine
5.25
100.
0010
2.63
102.
6310
6.67
107.
0210
7.59
110.
1911
0.06
110.
9911
1.22
110.
6111
1.49
111.
15
Heal
th3.
9110
0.00
100.
0010
0.00
100.
0010
0.00
100.
0010
0.00
101.
3510
1.35
101.
3510
1.35
101.
3510
1.35
Tran
spor
t6.
1110
0.00
100.
0010
0.00
99.8
699
.79
99.9
399
.86
99.8
199
.81
99.8
199
.81
100.
0099
.81
Com
mun
icat
ion
1.53
100.
0072
.37
72.3
793
.42
92.9
593
.00
93.0
088
.50
87.6
787
.67
87.6
787
.67
87.6
7
Recr
eatio
n &
Cul
ture
3.85
100.
0099
.13
99.1
398
.74
99.1
599
.60
108.
9411
0.70
110.
8711
0.88
110.
8811
0.70
109.
77
Educ
atio
n3.
2010
0.00
100.
0010
0.00
100.
0010
0.00
100.
0010
0.00
100.
0010
0.00
100.
0010
0.00
100.
0010
0.00
Rest
aura
nts &
Hot
els
4.64
100.
0010
9.98
109.
9811
4.39
118.
6511
7.37
119.
2411
9.49
119.
8712
1.67
117.
9211
6.77
115.
08M
iscel
lane
ous G
oods
&
Serv
ices
3.53
100.
0010
6.84
108.
1010
3.25
103.
7110
2.40
105.
2510
7.91
109.
1810
9.19
109.
4610
7.59
106.
51
Gene
ral I
ndex
100.
0010
0.00
100.
3199
.66
101.
0110
1.22
102.
6910
4.28
106.
6410
9.30
108.
7111
1.69
112.
4311
1.91
Spec
ial I
ndic
es
All I
mpo
rted
Item
s41
.73
100.
0010
0.53
100.
4010
0.50
101.
6710
3.04
103.
8910
6.37
109.
3110
6.40
107.
9811
0.25
107.
83
All D
omes
tic It
ems
58.2
710
0.00
100.
9199
.88
101.
3810
1.66
103.
2010
5.33
107.
3111
0.05
110.
3711
4.32
114.
0011
4.84
Impo
rted
Foo
d Ite
ms
23.8
710
0.00
98.3
598
.16
97.5
699
.33
101.
5010
1.50
104.
8710
9.37
103.
5210
7.70
111.
4210
6.98
Dom
estic
Foo
d Ite
ms
21.3
310
0.00
101.
4298
.39
99.8
299
.53
104.
1510
6.93
111.
9011
9.26
119.
2813
1.25
124.
7812
7.27
Impo
rted
Fue
l Ite
ms
2.14
100.
0010
0.00
100.
0096
.57
95.9
396
.32
95.9
195
.78
95.7
895
.78
95.7
895
.64
95.1
2Da
ta w
ere
obta
ined
from
the
Harm
onize
d Co
nsum
er P
rice
Inde
x (H
CPI)
with
bas
e pe
riod
Dece
mbe
r 200
5=10
0 So
urce
: Lib
eria
Inst
itute
of S
tatis
tics a
nd G
eo-In
form
atio
n Se
rvice
s (LI
SGIS
), an
d th
e Ce
ntra
l Ban
k of
Lib
eria
(CBL
)
Tab
le 2
.6: H
AR
MO
NIZ
ED
CO
NS
UM
ER
PR
ICE
IND
EX
(H
CP
I) B
Y M
AJO
R G
RO
UP
(D
ecem
ber
2005
=10
0)
Pag
e 67
Sta
tistic
al B
ulle
tin 2
011
Statistical Bulletin, Monrovia, Liberia. December 2011 77

MAJ
OR
GRO
UP
WEI
GHT
Dec-
05Ja
n-07
Feb-
07M
ar-0
7Ap
r-07
May
-07
Jun-
07Ju
l-07
Aug-
07Se
p-07
Oct
-07
Nov
-07
Dec-
07Fo
od a
nd N
on-A
lcoh
olic
Be
vera
ges
45.2
010
0.00
116.
0211
6.23
116.
5112
2.87
118.
5112
6.83
132.
6513
2.15
134.
5513
2.08
135.
7113
8.00
Alco
holic
Bev
erag
es, T
obac
co
& N
arco
tics
3.03
100.
0010
8.02
105.
1810
5.03
107.
8710
9.56
107.
6311
1.29
111.
3911
0.78
110.
3411
0.78
109.
92
Clot
hing
& F
ootw
ears
7.75
100.
0011
9.00
121.
7111
9.42
118.
9911
7.38
120.
9812
1.12
122.
4612
1.38
118.
8911
7.38
121.
17
Hous
ing,
Wat
er, E
lect
ricity
, Ga
s & O
ther
Fue
l12
.00
100.
0011
0.15
110.
0410
9.99
110.
0310
8.96
109.
3410
9.25
109.
3310
9.63
109.
6211
3.05
113.
27
Furn
isher
, Hou
seho
ld
Equi
pmen
ts A
nd R
outin
e M
aint
aina
nce
of T
he H
ouse
5.25
100.
0011
3.75
113.
4911
2.23
109.
2611
0.62
111.
2511
4.36
115.
0511
8.64
121.
3511
7.95
117.
90
Heal
th3.
9110
0.00
100.
3410
0.00
100.
0010
0.00
100.
0010
0.00
100.
0010
0.00
100.
0010
0.00
100.
0010
0.00
Tran
spor
t6.
1110
0.00
99.6
410
0.35
100.
1710
0.17
100.
1710
1.90
102.
1910
2.19
121.
7912
1.38
123.
2812
5.04
Com
mun
icat
ion
1.53
100.
0085
.98
83.3
683
.34
83.4
183
.51
83.5
182
.13
82.2
882
.18
78.6
978
.52
78.9
0
Recr
eatio
n &
Cul
ture
3.85
100.
0011
1.63
111.
0211
0.93
111.
1811
1.56
112.
0011
1.32
111.
9511
2.14
112.
7011
1.37
115.
12
Educ
atio
n3.
2010
0.00
100.
0010
0.00
100.
0010
0.00
100.
0010
0.00
100.
0010
0.00
100.
0010
0.00
100.
0010
0.00
Rest
aura
nts &
Hot
els
4.64
100.
0011
5.86
121.
4711
8.96
114.
7012
1.29
121.
2512
0.77
121.
2112
1.76
121.
7212
1.33
121.
51M
iscel
lane
ous G
oods
&
Serv
ices
3.53
100.
0011
3.35
109.
1810
9.00
107.
6010
6.02
107.
3810
6.49
108.
5010
7.32
107.
2110
6.34
114.
73
Gene
ral I
ndex
100.
0010
0.00
112.
3311
2.60
112.
3411
4.87
113.
0411
7.27
120.
0912
0.13
122.
5312
1.28
123.
0712
4.96
Spec
ial I
ndic
es
All I
mpo
rted
Item
s41
.73
100.
0010
8.12
109.
6910
8.80
111.
4311
1.63
114.
3011
6.11
113.
9511
4.33
114.
5711
4.97
120.
71
All D
omes
tic It
ems
58.2
710
0.00
115.
3411
4.68
115.
0611
3.56
114.
0511
9.39
122.
9412
4.56
128.
4012
6.09
128.
8712
8.00
Impo
rted
Foo
d Ite
ms
23.8
710
0.00
105.
7310
7.91
107.
1811
2.10
113.
5011
6.40
118.
2611
3.83
114.
7711
6.30
116.
3212
3.64
Dom
estic
Foo
d Ite
ms
21.3
310
0.00
127.
5412
5.54
126.
9612
7.08
124.
1113
8.49
148.
7715
2.66
156.
6914
9.75
157.
4215
4.09
Impo
rted
Fue
l Ite
ms
2.14
100.
0094
.51
96.5
595
.71
95.7
195
.71
100.
6310
1.46
101.
4610
3.61
102.
4311
7.42
122.
44
Data
wer
e ob
tain
ed fr
om th
e Ha
rmon
ized
Cons
umer
Pric
e In
dex
(HCP
I) w
ith b
ase
perio
d De
cem
ber 2
005=
100
Sour
ce:
Libe
ria In
stitu
te o
f Sta
tistic
s and
Geo
-Info
rmat
ion
Serv
ices
(LIS
GIS)
, and
the
Cent
ral B
ank
of Li
beria
(CBL
)
Gran
d Ca
pe M
ount
Pag
e 68
Sta
tistic
al B
ulle
tin 2
011
Statistical Bulletin, Monrovia, Liberia. December 2011 78
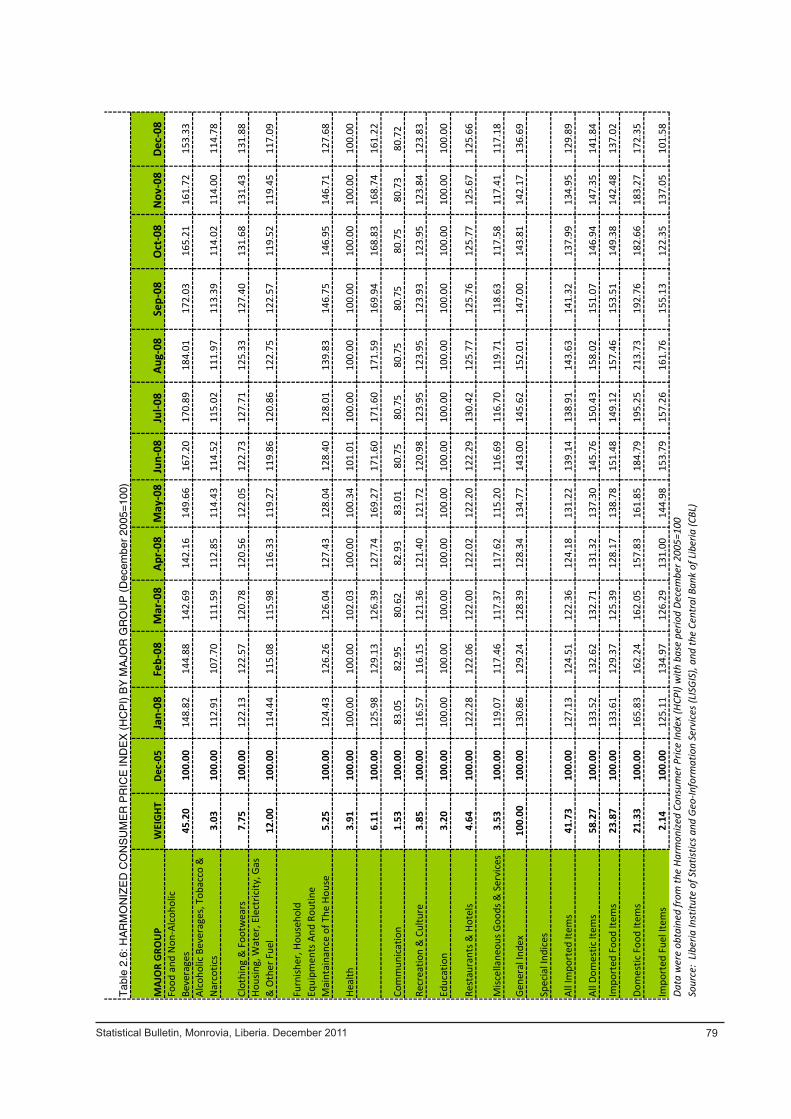
MAJ
OR
GRO
UP
WEI
GHT
Dec-
05Ja
n-08
Feb-
08M
ar-0
8Ap
r-08
May
-08
Jun-
08Ju
l-08
Aug-
08Se
p-08
Oct
-08
Nov
-08
Dec-
08Fo
od a
nd N
on-A
lcoh
olic
Be
vera
ges
45.2
010
0.00
148.
8214
4.88
142.
6914
2.16
149.
6616
7.20
170.
8918
4.01
172.
0316
5.21
161.
7215
3.33
Alco
holic
Bev
erag
es, T
obac
co &
N
arco
tics
3.03
100.
0011
2.91
107.
7011
1.59
112.
8511
4.43
114.
5211
5.02
111.
9711
3.39
114.
0211
4.00
114.
78
Clot
hing
& F
ootw
ears
7.75
100.
0012
2.13
122.
5712
0.78
120.
5612
2.05
122.
7312
7.71
125.
3312
7.40
131.
6813
1.43
131.
88Ho
usin
g, W
ater
, Ele
ctric
ity, G
as
& O
ther
Fue
l12
.00
100.
0011
4.44
115.
0811
5.98
116.
3311
9.27
119.
8612
0.86
122.
7512
2.57
119.
5211
9.45
117.
09
Furn
isher
, Hou
seho
ld
Equi
pmen
ts A
nd R
outin
e M
aint
aina
nce
of T
he H
ouse
5.25
100.
0012
4.43
126.
2612
6.04
127.
4312
8.04
128.
4012
8.01
139.
8314
6.75
146.
9514
6.71
127.
68
Heal
th3.
9110
0.00
100.
0010
0.00
102.
0310
0.00
100.
3410
1.01
100.
0010
0.00
100.
0010
0.00
100.
0010
0.00
6.11
100.
0012
5.98
129.
1312
6.39
127.
7416
9.27
171.
6017
1.60
171.
5916
9.94
168.
8316
8.74
161.
22
Com
mun
icat
ion
1.53
100.
0083
.05
82.9
580
.62
82.9
383
.01
80.7
580
.75
80.7
580
.75
80.7
580
.73
80.7
2
Recr
eatio
n &
Cul
ture
3.85
100.
0011
6.57
116.
1512
1.36
121.
4012
1.72
120.
9812
3.95
123.
9512
3.93
123.
9512
3.84
123.
83
Educ
atio
n3.
2010
0.00
100.
0010
0.00
100.
0010
0.00
100.
0010
0.00
100.
0010
0.00
100.
0010
0.00
100.
0010
0.00
Rest
aura
nts &
Hot
els
4.64
100.
0012
2.28
122.
0612
2.00
122.
0212
2.20
122.
2913
0.42
125.
7712
5.76
125.
7712
5.67
125.
66
Misc
ella
neou
s Goo
ds &
Ser
vice
s3.
5310
0.00
119.
0711
7.46
117.
3711
7.62
115.
2011
6.69
116.
7011
9.71
118.
6311
7.58
117.
4111
7.18
Gene
ral I
ndex
100.
0010
0.00
130.
8612
9.24
128.
3912
8.34
134.
7714
3.00
145.
6215
2.01
147.
0014
3.81
142.
1713
6.69
Spec
ial I
ndic
es
All I
mpo
rted
Item
s41
.73
100.
0012
7.13
124.
5112
2.36
124.
1813
1.22
139.
1413
8.91
143.
6314
1.32
137.
9913
4.95
129.
89
All D
omes
tic It
ems
58.2
710
0.00
133.
5213
2.62
132.
7113
1.32
137.
3014
5.76
150.
4315
8.02
151.
0714
6.94
147.
3514
1.84
Impo
rted
Foo
d Ite
ms
23.8
710
0.00
133.
6112
9.37
125.
3912
8.17
138.
7815
1.48
149.
1215
7.46
153.
5114
9.38
142.
4813
7.02
Dom
estic
Foo
d Ite
ms
21.3
310
0.00
165.
8316
2.24
162.
0515
7.83
161.
8518
4.79
195.
2521
3.73
192.
7618
2.66
183.
2717
2.35
Impo
rted
Fue
l Ite
ms
2.14
100.
0012
5.11
134.
9712
6.29
131.
0014
4.98
153.
7915
7.26
161.
7615
5.13
122.
3513
7.05
101.
58Da
ta w
ere
obta
ined
from
the
Harm
onize
d Co
nsum
er P
rice
Inde
x (H
CPI)
with
bas
e pe
riod
Dece
mbe
r 200
5=10
0 So
urce
: Lib
eria
Inst
itute
of S
tatis
tics a
nd G
eo-In
form
atio
n Se
rvice
s (LI
SGIS
), an
d th
e Ce
ntra
l Ban
k of
Lib
eria
(CBL
)
Tab
le 2
.6: H
AR
MO
NIZ
ED
CO
NS
UM
ER
PR
ICE
IND
EX
(H
CP
I) B
Y M
AJO
R G
RO
UP
(D
ecem
ber
2005
=10
0)
Pag
e 69
Sta
tistic
al B
ulle
tin 2
011
Statistical Bulletin, Monrovia, Liberia. December 2011 79
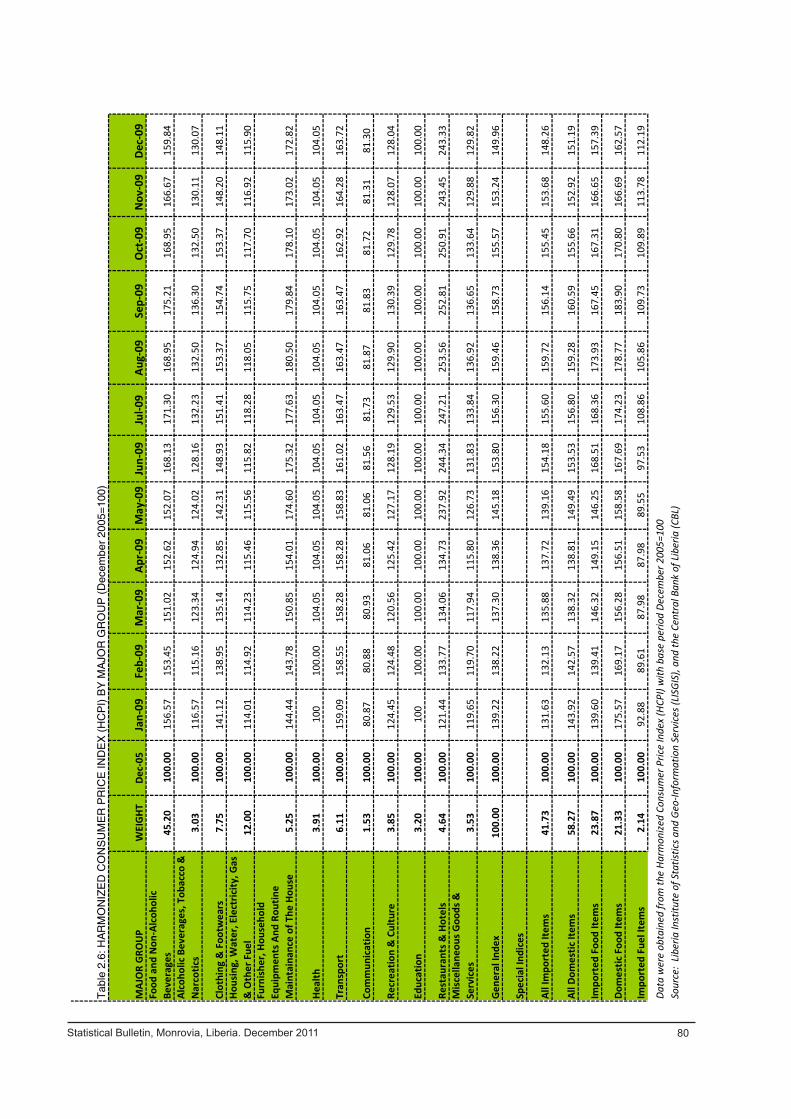
MAJ
OR
GRO
UP
WEI
GHT
Dec-
05Ja
n-09
Feb-
09M
ar-0
9Ap
r-09
May
-09
Jun-
09Ju
l-09
Aug-
09Se
p-09
Oct
-09
Nov
-09
Dec-
09Fo
od a
nd N
on-A
lcoh
olic
Be
vera
ges
45.2
010
0.00
156.57
153.45
151.02
152.62
152.07
168.13
171.30
168.95
175.21
168.95
166.67
159.84
Alco
holic
Bev
erag
es, T
obac
co &
N
arco
tics
3.03
100.
0011
6.57
115.16
123.34
124.94
124.02
128.16
132.23
132.50
136.30
132.50
130.11
130.07
Clot
hing
& F
ootw
ears
7.75
100.
0014
1.12
138.95
135.14
132.85
142.31
148.93
151.41
153.37
154.74
153.37
148.20
148.11
Hous
ing,
Wat
er, E
lect
ricity
, Gas
&
Oth
er F
uel
12.0
010
0.00
114.01
114.92
114.23
115.46
115.56
115.82
118.28
118.05
115.75
117.70
116.92
115.90
Furn
ishe
r, Ho
useh
old
Equi
pmen
ts A
nd R
outin
e M
aint
aina
nce
of T
he H
ouse
5.25
100.
0014
4.44
143.78
150.85
154.01
174.60
175.32
177.63
180.50
179.84
178.10
173.02
172.82
Heal
th3.
9110
0.00
100
100.00
104.05
104.05
104.05
104.05
104.05
104.05
104.05
104.05
104.05
104.05
Tran
spor
t6.
1110
0.00
159.09
158.55
158.28
158.28
158.83
161.02
163.47
163.47
163.47
162.92
164.28
163.72
Com
mun
icat
ion
1.53
100.
0080
.87
80.88
80.93
81.06
81.06
81.56
81.73
81.87
81.83
81.72
81.31
81.30
Recr
eatio
n &
Cul
ture
3.85
100.
0012
4.45
124.48
120.56
125.42
127.17
128.19
129.53
129.90
130.39
129.78
128.07
128.04
Educ
atio
n3.
2010
0.00
100
100.00
100.00
100.00
100.00
100.00
100.00
100.00
100.00
100.00
100.00
100.00
Rest
aura
nts &
Hot
els
4.64
100.
0012
1.44
133.77
134.06
134.73
237.92
244.34
247.21
253.56
252.81
250.91
243.45
243.33
Mis
cella
neou
s Goo
ds &
Se
rvic
es3.
5310
0.00
119.65
119.70
117.94
115.80
126.73
131.83
133.84
136.92
136.65
133.64
129.88
129.82
Gene
ral I
ndex
100.
0010
0.00
139.22
138.22
137.30
138.36
145.18
153.80
156.30
159.46
158.73
155.57
153.24
149.96
Spec
ial I
ndic
es
All I
mpo
rted
Item
s41
.73
100.
0013
1.63
132.13
135.88
137.72
139.16
154.18
155.60
159.72
156.14
155.45
153.68
148.26
All D
omes
tic It
ems
58.2
710
0.00
143.92
142.57
138.32
138.81
149.49
153.53
156.80
159.28
160.59
155.66
152.92
151.19
Impo
rted
Foo
d Ite
ms
23.8
710
0.00
139.60
139.41
146.32
149.15
146.25
168.51
168.36
173.93
167.45
167.31
166.65
157.39
Dom
estic
Foo
d Ite
ms
21.3
310
0.00
175.57
169.17
156.28
156.51
158.58
167.69
174.23
178.77
183.90
170.80
166.69
162.57
Impo
rted
Fue
l Ite
ms
2.14
100.
0092
.88
89.61
87.98
87.98
89.55
97.53
108.86
105.86
109.73
109.89
113.78
112.19
Data
wer
e ob
tain
ed fr
om th
e Ha
rmon
ized
Cons
umer
Pric
e In
dex
(HCP
I) w
ith b
ase
perio
d De
cem
ber 2
005=
100
Sour
ce:
Liber
ia In
stitu
te o
f Sta
tistic
s and
Geo
-Info
rmat
ion
Serv
ices (
LISG
IS),
and
the
Cent
ral B
ank
of L
iber
ia (C
BL)
Tab
le 2
.6: H
AR
MO
NIZ
ED
CO
NS
UM
ER
PR
ICE
IND
EX
(H
CP
I) B
Y M
AJO
R G
RO
UP
(D
ecem
ber
2005
=10
0)
Pag
e 70
Sta
tistic
al B
ulle
tin 2
011
Statistical Bulletin, Monrovia, Liberia. December 2011 80

MAJ
OR
GRO
UP
WEI
GHT
Dec-
05Ja
n-10
Feb-
10M
ar-1
0Ap
r-10
May
-10
Jun-
10Ju
l-10
Aug-
10Se
p-10
Oct
-10
Nov
-10
Dec-
10Fo
od a
nd N
on-A
lcoh
olic
Be
vera
ges
45.2
010
0.00
171.
2516
3.66
167.
5516
5.86
170.
2617
0.51
178.
3518
6.36
1878
.70
181.
2117
9.55
174.
20Al
coho
lic B
ever
ages
, Tob
acco
&
Nar
cotic
s3.
0310
0.00
134.
4613
8.92
137.
8913
8.46
141.
5614
4.03
142.
2114
0.28
139.
7914
0.37
144.
9814
8.16
Clot
hing
& F
ootw
ears
7.75
100.
0015
7.40
155.
4415
5.14
154.
2915
3.88
155.
8316
1.38
161.
7516
0.61
160.
9116
0.58
161.
23Ho
usin
g, W
ater
, Ele
ctric
ity, G
as
& O
ther
Fue
l12
.00
100.
0011
7.00
118.
6517
7.63
118.
7911
8.56
119.
2312
1.16
121.
9912
1.87
121.
6512
1.30
121.
02
Furn
isher
, Hou
seho
ld
Equi
pmen
ts A
nd R
outin
e M
aint
aina
nce
of T
he H
ouse
5.25
100.
0017
9.07
179.
9917
8.87
177.
1417
6.43
179.
2918
8.07
188.
4018
7.29
170.
3616
7.62
169.
54He
alth
3.91
100.
0010
4.05
104.
0510
4.05
104.
0510
4.05
104.
0510
4.39
104.
3910
4.39
104.
3610
4.39
104.
05Tr
ansp
ort
6.11
100.
0016
4.55
165.
3616
4.55
164.
8016
6.18
166.
1817
1.88
184.
3817
1.88
172.
1517
2.15
174.
06Co
mm
unic
atio
n1.
5310
0.00
81.7
681
.82
81.7
981
.68
81.6
081
.80
86.4
486
.47
86.3
986
.41
86.1
386
.17
Recr
eatio
n &
Cul
ture
3.85
100.
0012
9.92
130.
1613
0.06
129.
5912
9.25
130.
1013
0.43
130.
5513
0.55
131.
2213
0.05
130.
24Ed
ucat
ion
3.20
100.
0010
0.00
100.
0010
0.00
100.
0010
0.00
100.
0010
0.00
100.
0010
0.00
100.
0010
0.00
100.
00Re
stau
rant
s & H
otel
s 4.
6410
0.00
251.
5125
2.52
252.
1225
6.76
255.
3025
8.99
261.
1826
1.68
260.
1726
0.75
255.
7525
6.49
Misc
ella
neou
s Goo
ds &
Ser
vice
s3.
5310
0.00
135.
5113
5.20
138.
8313
2.67
131.
8413
3.52
134.
2913
5.38
133.
9113
4.31
130.
0513
0.37
Gene
ral I
ndex
100.
0010
0.00
157.
1515
4.04
155.
4415
4.85
156.
8115
7.64
162.
8316
5.56
166.
8816
3.19
161.
9315
9.88
Spec
ial I
ndic
esAl
l Im
port
ed It
ems
41.7
310
0.00
156.
4115
5.22
157.
2315
5.61
157.
3415
7.78
162.
6616
4.46
164.
9415
9.33
158.
3415
8.19
All D
omes
tic It
ems
58.2
710
0.00
157.
6915
3.20
154.
1615
4.31
156.
4315
7.54
162.
9516
5.04
168.
3716
5.95
164.
5116
1.10
Impo
rted
Foo
d Ite
ms
23.8
710
0.00
166.
5616
4.42
168.
6516
6.49
169.
0716
8.39
175.
7417
8.93
180.
3517
0.27
168.
7016
7.44
Dom
estic
Foo
d Ite
ms
21.3
310
0.00
176.
5016
2.81
166.
3216
5.16
171.
5917
2.87
181.
2718
6.20
195.
9219
3.46
191.
6918
1.76
Impo
rted
Fue
l Ite
ms
2.14
100.
0011
4.54
118.
6211
6.28
117.
0012
0.93
120.
9311
9.36
119.
3811
9.38
120.
1512
0.15
125.
58D
ata
wer
e ob
tain
ed fr
om th
e H
arm
oniz
ed C
onsu
mer
Pric
e In
dex
(HC
PI)
with
bas
e pe
riod
Dec
embe
r 20
05=
100
Sou
rce:
Lib
eria
Inst
itute
of S
tatis
tics
and
Geo
-Inf
orm
atio
n S
ervi
ces
(LIS
GIS
), a
nd th
e C
entr
al B
ank
of L
iber
ia (
CB
L)
Tab
le 2
.6: H
AR
MO
NIZ
ED
CO
NS
UM
ER
PR
ICE
IND
EX
(H
CP
I) B
Y M
AJO
R G
RO
UP
(D
ecem
ber
2005
=10
0)
Pag
e 71
Sta
tistic
al B
ulle
tin 2
011
Statistical Bulletin, Monrovia, Liberia. December 2011 81
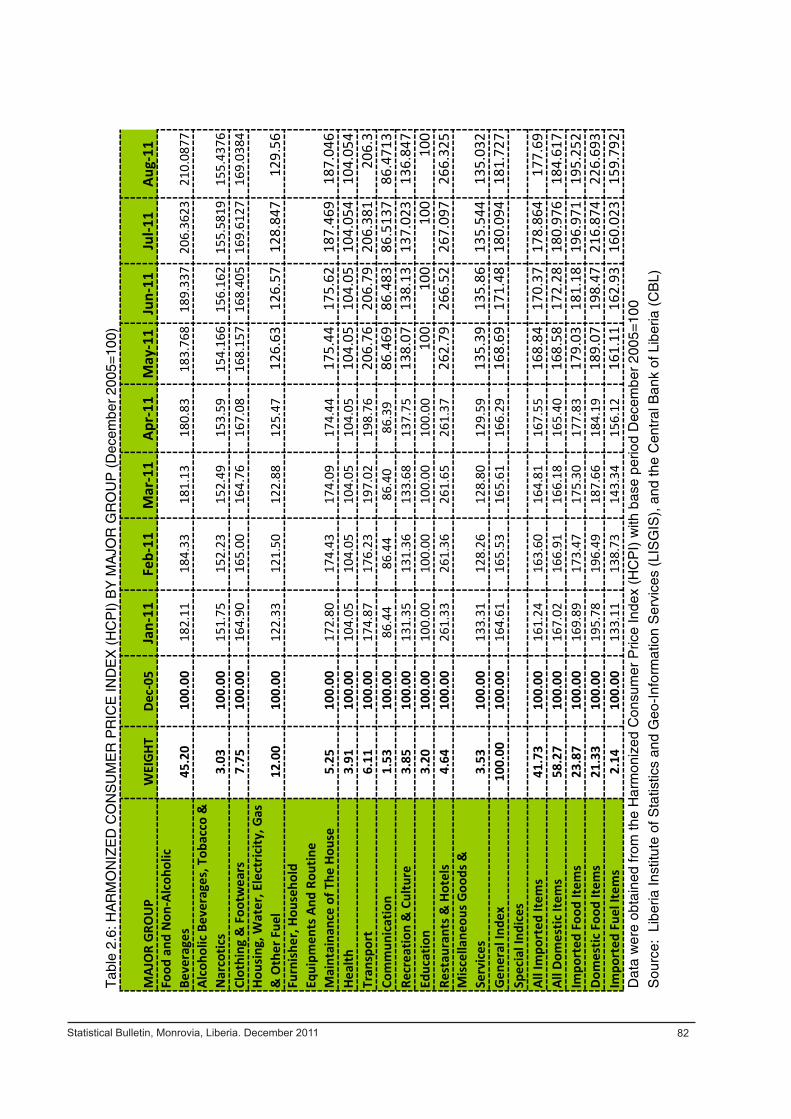
Pag
e 74
Sta
tistic
al B
ulle
tin 2
011
MAJ
OR
GRO
UP
WEI
GHT
Dec-
05Ja
n-11
Feb-
11M
ar-1
1Ap
r-11
May
-11
Jun-
11Ju
l-11
Aug-
11Fo
od a
nd N
on-A
lcoh
olic
Be
vera
ges
45.2
010
0.00
182.11
184.33
181.13
180.83
183.76
818
9.33
720
6.36
2321
0.08
77Al
coho
lic B
ever
ages
, Tob
acco
&
Nar
cotic
s3.
0310
0.00
151.75
152.23
152.49
153.59
154.16
615
6.16
215
5.58
1915
5.43
76Cl
othi
ng &
Foo
twea
rs7.
7510
0.00
164.90
165.00
164.76
167.08
168.15
716
8.40
516
9.61
2716
9.03
84Ho
usin
g, W
ater
, Ele
ctric
ity, G
as
& O
ther
Fue
l12
.00
100.
0012
2.33
121.50
122.88
125.47
126.63
126.57
128.84
712
9.56
Furn
ishe
r, Ho
useh
old
Equi
pmen
ts A
nd R
outin
e M
aint
aina
nce
of T
he H
ouse
5.25
100.
0017
2.80
174.43
174.09
174.44
175.44
175.62
187.46
918
7.04
6He
alth
3.91
100.
0010
4.05
104.05
104.05
104.05
104.05
104.05
104.05
410
4.05
4Tr
ansp
ort
6.11
100.
0017
4.87
176.23
197.02
198.76
206.76
206.79
206.38
120
6.3
Com
mun
icat
ion
1.53
100.
0086
.44
86.44
86.40
86.39
86.469
86.483
86.513
786
.471
3Re
crea
tion
& C
ultu
re3.
8510
0.00
131.35
131.36
133.68
137.75
138.07
138.13
137.02
313
6.84
7Ed
ucat
ion
3.20
100.
0010
0.00
100.00
100.00
100.00
100
100
100
100
Rest
aura
nts &
Hot
els
4.64
100.
0026
1.33
261.36
261.65
261.37
262.79
266.52
267.09
726
6.32
5M
isce
llane
ous G
oods
&
Serv
ices
3.53
100.
0013
3.31
128.26
128.80
129.59
135.39
135.86
135.54
413
5.03
2Ge
nera
l Ind
ex10
0.00
100.
0016
4.61
165.53
165.61
166.29
168.69
171.48
180.09
418
1.72
7Sp
ecia
l Ind
ices
All I
mpo
rted
Item
s41
.73
100.
0016
1.24
163.60
164.81
167.55
168.84
170.37
178.86
417
7.69
All D
omes
tic It
ems
58.2
710
0.00
167.02
166.91
166.18
165.40
168.58
172.28
180.97
618
4.61
7Im
port
ed F
ood
Item
s23
.87
100.
0016
9.89
173.47
175.30
177.83
179.03
181.18
196.97
119
5.25
2Do
mes
tic F
ood
Item
s21
.33
100.
0019
5.78
196.49
187.66
184.19
189.07
198.47
216.87
422
6.69
3Im
port
ed F
uel I
tem
s2.
1410
0.00
133.11
138.73
143.34
156.12
161.11
162.93
160.02
315
9.79
2D
ata
wer
e ob
tain
ed fr
om th
e H
arm
oniz
ed C
onsu
mer
Pric
e In
dex
(HC
PI)
with
bas
e pe
riod
Dec
embe
r 20
05=
100
Sou
rce:
Lib
eria
Inst
itute
of S
tatis
tics
and
Geo
-Inf
orm
atio
n S
ervi
ces
(LIS
GIS
), a
nd th
e C
entr
al B
ank
of L
iber
ia (
CB
L)
Tab
le 2
.6: H
AR
MO
NIZ
ED
CO
NS
UM
ER
PR
ICE
IND
EX
(H
CP
I) B
Y M
AJO
R G
RO
UP
(D
ecem
ber
2005
=10
0)
Pag
e 72
Sta
tistic
al B
ulle
tin 2
011
Statistical Bulletin, Monrovia, Liberia. December 2011 82
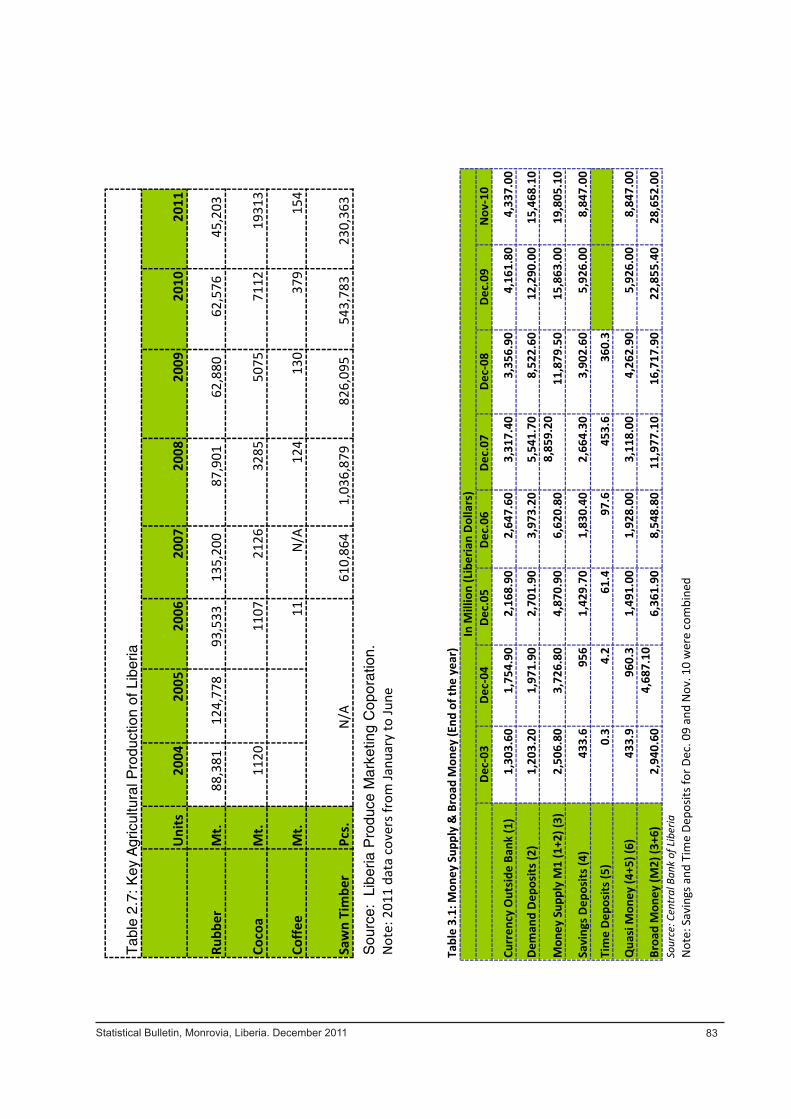
Uni
ts20
0420
0520
0620
0720
0820
0920
1020
11
Rubb
erM
t.88
,381
12
4,77
8
93
,533
135,
200
87,9
01
62
,880
62,5
76
45,2
03
Coco
a M
t.11
2011
0721
2632
8550
7571
1219
313
Coffe
eM
t.11
N/A
124
130
379
154
Saw
n Ti
mbe
rPc
s.
N
/A
610,
864
1,03
6,87
9
82
6,09
5
543,
783
230,
363
Sou
rce:
Lib
eria
Pro
duce
Mar
ketin
g C
opor
atio
n.N
ote:
201
1 da
ta c
over
s fro
m Ja
nuar
y to
June
Tab
le 2
.7: K
ey A
gric
ultu
ral P
rodu
ctio
n of
Lib
eria
Pag
e 74
Sta
tistic
al B
ulle
tin 2
011
Statistical Bulletin, Monrovia, Liberia. December 2011 83
Dec-
03De
c-04
Dec.
05
Dec.
06
Dec.
07
Dec-
08De
c.09
Nov
-10
Curr
ency
Out
side
Ban
k (1
) 1,
303.
601,
754.
902,
168.
902,
647.
603,
317.
403,
356.
904,
161.
804,
337.
00
Dem
and
Depo
sits
(2)
1,20
3.20
1,97
1.90
2,70
1.90
3,97
3.20
5,54
1.70
8,52
2.60
12,2
90.0
015
,468
.10
Mon
ey S
uppl
y M
1 (1
+2) (
3)
2,50
6.80
3,72
6.80
4,87
0.90
6,62
0.80
8,85
9.20
11,8
79.5
015
,863
.00
19,8
05.1
0
Savi
ngs D
epos
its (4
) 43
3.6
956
1,42
9.70
1,83
0.40
2,66
4.30
3,90
2.60
5,92
6.00
8,84
7.00
Tim
e De
posi
ts (5
) 0.
34.
261
.497
.645
3.6
360.
3
Qua
si M
oney
(4+5
) (6)
43
3.9
960.
31,
491.
001,
928.
003,
118.
004,
262.
905,
926.
008,
847.
00
Broa
d M
oney
(M2)
(3+6
) 2,
940.
604,
687.
106,
361.
908,
548.
8011
,977
.10
16,7
17.9
022
,855
.40
28,6
52.0
0So
urce
: Cen
tral
Ban
k of
Lib
eria
Not
e: S
avin
gs a
nd T
ime
Depo
sits f
or D
ec. 0
9 an
d N
ov. 1
0 w
ere
com
bine
d
Gran
d Ca
pe M
ount
In M
illio
n (L
iber
ian
Dolla
rs)
Tabl
e 3.
1: M
oney
Sup
ply
& B
road
Mon
ey (E
nd o
f the
yea
r)
Pag
e 75
Sta
tistic
al B
ulle
tin 2
011

2004
2005
2006
2007
2008
2009
2010
Dec
Dec
Dec
Dec
Dec
Dec
June
Net
For
eign
Ass
ets
(44,
646.
2)
(49,
175.
0)
(4
5,24
8.2)
(43,
461.
5)
(43,
137.
1)
(4
6,83
2.1)
17,6
74.3
Cen
tral
Ban
k(4
5,36
5.1)
(5
0,40
7.6)
(47,
049.
4)
(4
6,65
2.6)
(4
8,91
1.3)
(52,
811.
5)
10
,559
.6
D
epos
it M
oney
Ban
ks71
8.9
1,23
2.6
1,
801.
3
3,19
1.1
5,77
4.2
5,97
9.4
7,
114.
7
Use
of F
und
Cred
it
R
eeva
luat
ion
acco
unt
Net
Dom
estic
Ass
ets
76,1
94.5
55,5
36.9
53,7
03.8
55
,135
.2
59
,855
.0
69,6
87.5
7,77
7.9
Do
mes
tic C
redi
t62
,763
.9
69
,353
.0
68,3
95.9
72
,109
.0
75
,459
.6
86,5
06.2
25,3
37.5
Cla
ims o
n Go
vern
men
t (N
et)
60,9
19.9
67,2
15.4
65
,390
.1
67,6
07.2
68,8
62.1
75
,739
.8
13
,887
.2
Tota
l Cla
ims o
n Go
vern
men
t61
,145
.0
67
,467
.6
67,4
21.7
70
,798
.2
71
,207
.6
79,1
65.8
19,3
96.3
Trea
sury
Bill
s
Sto
cks a
nd B
onds
W
ays a
nd M
eans
Adv
ance
s
Ove
rdra
fts
O
ther
s (Lo
ans &
Adv
ance
s)
Gov
ernm
ent D
epar
tmen
ts
Go
vern
men
t Dep
osits
225.
1
25
2.2
2,03
1.6
3,
191.
0
2,
345.
5
3,
425.
9
5,50
9.1
Cla
ims o
n Pu
blic
Ent
erpr
ises
106.
3
83
.4
146.
6
131.
8
64
.4
1,
264.
2
2,03
8.0
Gran
d Ca
pe M
ount
1,73
7.7
2,
054.
2
2,85
9.2
4,
370.
0
6,
533.
1
9,
502.
1
9,41
2.4
O
ther
Item
s, N
et (A
sset
s +) /
113
,430
.6
13
,816
.1
14,6
92.0
16
,973
.8
15
,604
.6
16,8
18.7
17,5
59.6
6,
361.
9
8,45
5.7
11
,673
.7
16
,717
.9
22,8
55.4
25,4
52.2
Br
oad
Mon
ey (M
2)4,
687.
1
6,36
1.9
8,
455.
7
11,6
73.7
16,7
17.9
22
,855
.4
25
,452
.2
Rese
rve
mon
ey2,
910.
3
3,69
8.1
4,
842.
4
6,56
8.8
8,68
1.9
10,5
81.2
11,2
83.5
Tabl
e 3.
2.1:
Lib
eria
- B
anki
ng S
yste
m M
onet
ary
Surv
ey (In
Mill
ions
of L
iber
ian
dolla
rs, e
nd o
f per
iod)
Pag
e 76
Sta
tistic
al B
ulle
tin 2
011
Statistical Bulletin, Monrovia, Liberia. December 2011 84
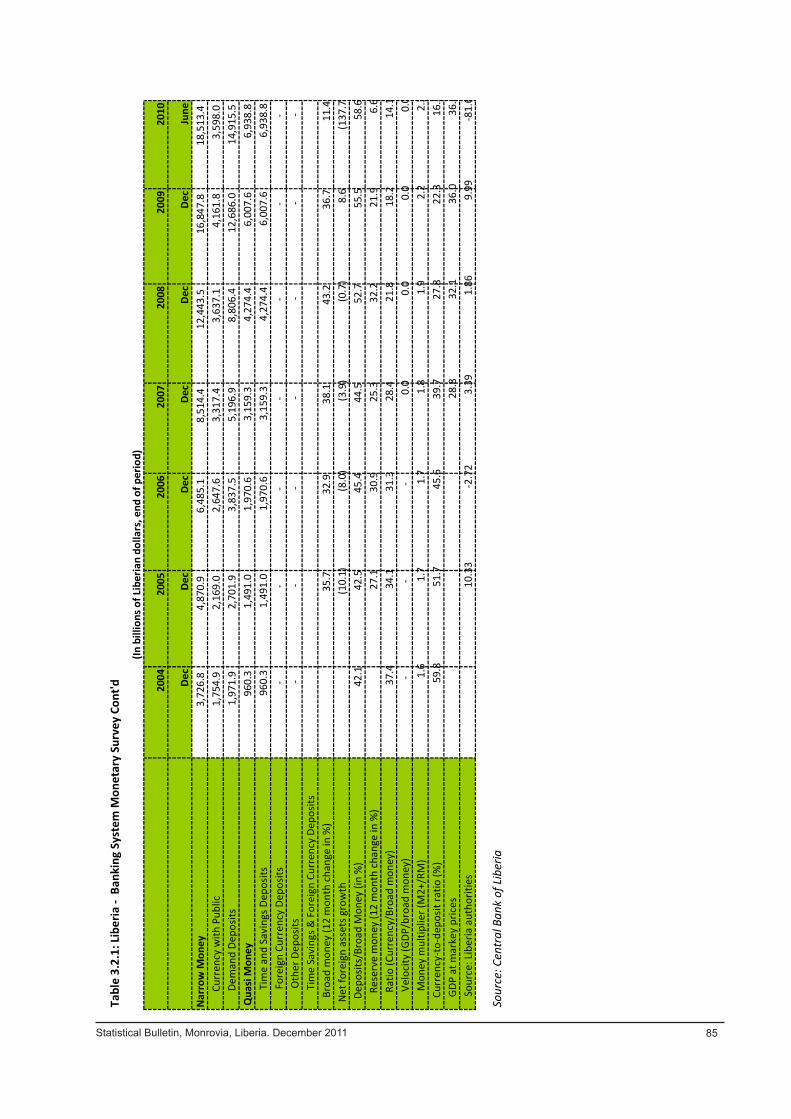
2004
2005
2006
2007
2008
2009
2010
Dec
Dec
Dec
Dec
Dec
Dec
June
Nar
row
Mon
ey3,
726.
8
4,87
0.9
6,
485.
1
8,51
4.4
12,4
43.5
16
,847
.8
18
,513
.4
Curr
ency
with
Pub
lic1,
754.
9
2,16
9.0
2,
647.
6
3,31
7.4
3,63
7.1
4,16
1.8
3,
598.
0
De
man
d De
posit
s1,
971.
9
2,70
1.9
3,
837.
5
5,19
6.9
8,80
6.4
12,6
86.0
14,9
15.5
Q
uasi
Mon
ey96
0.3
1,49
1.0
1,
970.
6
3,15
9.3
4,27
4.4
6,00
7.6
6,
938.
8
Ti
me
and
Savi
ngs D
epos
its96
0.3
1,49
1.0
1,
970.
6
3,15
9.3
4,27
4.4
6,00
7.6
6,
938.
8
Fo
reig
n Cu
rren
cy D
epos
its-
-
-
-
-
-
-
O
ther
Dep
osits
-
-
-
-
-
-
-
T
ime
Savi
ngs &
For
eign
Cur
renc
y De
posit
s B
road
mon
ey (1
2 m
onth
cha
nge
in %
)35
.7
32.9
38
.1
43
.2
36
.7
11.4
Net
fore
ign
asse
ts g
row
th(1
0.1)
(8
.0)
(3.9
)
(0.7
)
8.
6
(1
37.7
)
Dep
osits
/Bro
ad M
oney
(in
%)
42.1
42.5
45
.4
44.5
52.7
55.5
58
.6
Rese
rve
mon
ey (1
2 m
onth
cha
nge
in %
)27
.1
30.9
25
.3
32
.2
21
.9
6.6
Ratio
(Cur
renc
y/Br
oad
mon
ey)
37.4
34.1
31
.3
28.4
21.8
18.2
14
.1
Velo
city
(GDP
/bro
ad m
oney
)-
-
-
0.
0
0.0
0.0
0.0
Mon
ey m
ultip
lier (
M2+
/RM
)1.
6
1.7
1.7
1.8
1.
9
2.
2
2.
3
Curr
ency
-to-
depo
sit ra
tio (%
)59
.8
51
.7
45.6
39
.7
27
.8
22
.3
16.5
GDP
at m
arke
y pr
ices
28.8
32.1
36.0
36
.0
So
urce
: Lib
eria
aut
horit
ies
10.3
3-2
.72
3.39
1.86
9.99
-81.
66
Sour
ce: C
entr
al B
ank
of L
iber
ia
Tabl
e 3.
2.1:
Lib
eria
- B
anki
ng S
yste
m M
onet
ary
Surv
ey C
ont'd
(In b
illio
ns o
f Lib
eria
n do
llars
, end
of p
erio
d)
Pag
e 77
Sta
tistic
al B
ulle
tin 2
011
Statistical Bulletin, Monrovia, Liberia. December 2011 85
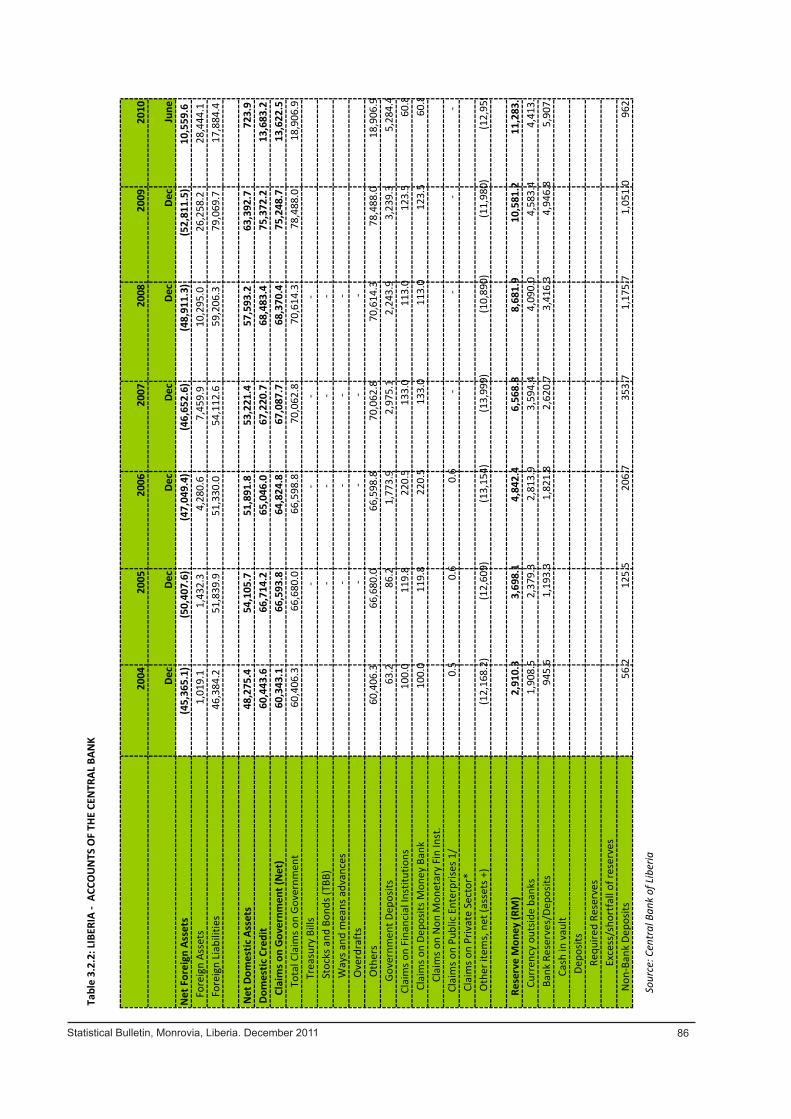
2004
2005
2006
2007
2008
2009
2010
Dec
Dec
Dec
Dec
Dec
Dec
June
Net
For
eign
Ass
ets
(45,
365.
1)
(50,
407.
6)
(4
7,04
9.4)
(46,
652.
6)
(48,
911.
3)
(5
2,81
1.5)
10,5
59.6
Fore
ign
Asse
ts1,
019.
1
1,43
2.3
4,
280.
6
7,45
9.9
10,2
95.0
26
,258
.2
28
,444
.1
Fo
reig
n Li
abili
ties
46,3
84.2
51,8
39.9
51
,330
.0
54,1
12.6
59,2
06.3
79
,069
.7
17
,884
.4
Net
Dom
estic
Ass
ets
48,2
75.4
54,1
05.7
51,8
91.8
53
,221
.4
57
,593
.2
63,3
92.7
723.
9
Dom
estic
Cre
dit
60,4
43.6
66,7
14.2
65,0
46.0
67
,220
.7
68
,483
.4
75,3
72.2
13,6
83.2
Clai
ms o
n Go
vern
men
t (N
et)
60,3
43.1
66,5
93.8
64,8
24.8
67
,087
.7
68
,370
.4
75,2
48.7
13,6
22.5
To
tal C
laim
s on
Gove
rnm
ent
60,4
06.3
66,6
80.0
66
,598
.8
70,0
62.8
70,6
14.3
78
,488
.0
18
,906
.9
Tr
easu
ry B
ills
-
-
-
-
Stoc
ks a
nd B
onds
(TBB
)-
-
-
-
W
ays a
nd m
eans
adv
ance
s-
-
-
-
O
verd
raft
s-
-
-
-
O
ther
s60
,406
.3
66
,680
.0
66,5
98.8
70
,062
.8
70
,614
.3
78,4
88.0
18,9
06.9
G
over
nmen
t Dep
osits
63.2
86.2
1,
773.
9
2,97
5.1
2,24
3.9
3,23
9.3
5,
284.
4
C
laim
s on
Fina
ncia
l Ins
titut
ions
100.
0
11
9.8
220.
5
133.
0
11
3.0
12
3.5
60.8
Cl
aim
s on
Depo
sits M
oney
Ban
k10
0.0
119.
8
22
0.5
13
3.0
113.
0
123.
5
60
.8
Cl
aim
s on
Non
Mon
etar
y Fi
n In
st.
Cla
ims o
n Pu
blic
Ent
erpr
ises 1
/0.
5
0.6
0.6
-
-
-
-
Cla
ims o
n Pr
ivat
e Se
ctor
* O
ther
item
s, n
et (a
sset
s +)
(12,
168.
2)
(12,
609)
(1
3,15
4)
(13,
999)
(10,
890)
(11,
980)
(1
2,95
9)
Re
serv
e M
oney
(RM
)2,
910.
3
3,69
8.1
4,
842.
4
6,56
8.8
8,68
1.9
10,5
81.2
11,2
83.5
Curr
ency
out
side
bank
s1,
908.
5
2,37
9.3
2,
813.
9
3,59
4.4
4,09
0.0
4,58
3.4
4,
413.
1
Bank
Res
erve
s/De
posit
s94
5.6
1,19
3.3
1,
821.
8
2,62
0.7
3,41
6.3
4,94
6.8
5,
907.
7
C
ash
in v
ault
Dep
osits
R
equi
red
Rese
rves
E
xces
s/sh
ortf
all o
f res
erve
s N
on-B
ank
Depo
sits
56.2
125.
5
20
6.7
35
3.7
1,17
5.7
1,05
1.0
96
2.7
Sour
ce: C
entr
al B
ank
of L
iber
ia
Tabl
e 3.
2.2:
LIB
ERIA
- A
CCO
UN
TS O
F TH
E CE
NTR
AL B
ANK
Pag
e 78
Sta
tistic
al B
ulle
tin 2
011
Statistical Bulletin, Monrovia, Liberia. December 2011 86
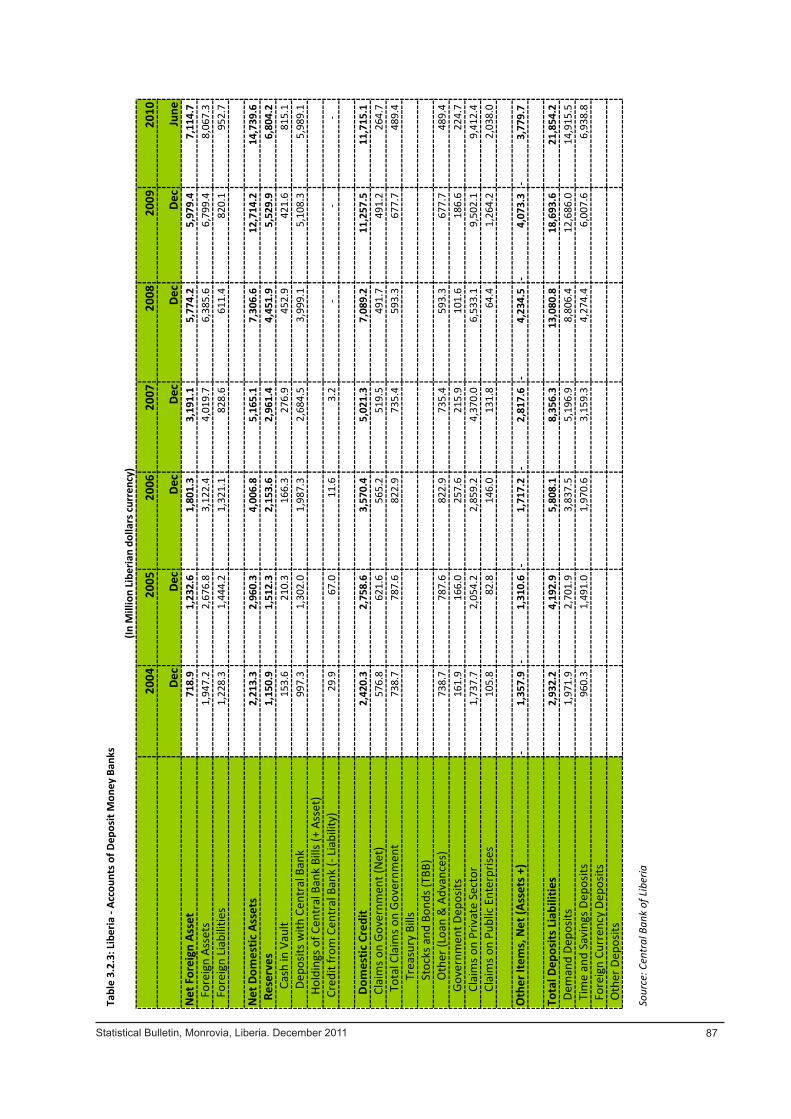
2004
2005
2006
2007
2008
2009
2010
Dec
Dec
Dec
Dec
Dec
Dec
June
Net
For
eign
Ass
et71
8.9
1,23
2.6
1,
801.
3
3,19
1.1
5,77
4.2
5,97
9.4
7,
114.
7
Fore
ign
Asse
ts1,
947.
2
2,67
6.8
3,
122.
4
4,01
9.7
6,38
5.6
6,79
9.4
8,
067.
3
Fore
ign
Liab
ilitie
s1,
228.
3
1,44
4.2
1,
321.
1
828.
6
61
1.4
82
0.1
952.
7
Net
Dom
estic
Ass
ets
2,21
3.3
2,
960.
3
4,00
6.8
5,
165.
1
7,
306.
6
12
,714
.2
14
,739
.6
Res
erve
s1,
150.
9
1,51
2.3
2,
153.
6
2,96
1.4
4,45
1.9
5,52
9.9
6,
804.
2
Ca
sh in
Vau
lt15
3.6
210.
3
16
6.3
27
6.9
452.
9
421.
6
81
5.1
De
posit
s with
Cen
tral
Ban
k99
7.3
1,30
2.0
1,
987.
3
2,68
4.5
3,99
9.1
5,10
8.3
5,
989.
1
Hol
ding
s of C
entr
al B
ank
Bills
(+ A
sset
)
Cred
it fr
om C
entr
al B
ank
(- Li
abili
ty)
29.9
67.0
11
.6
3.2
-
-
-
D
omes
tic C
redi
t2,
420.
3
2,75
8.6
3,
570.
4
5,02
1.3
7,08
9.2
11,2
57.5
11,7
15.1
Cla
ims o
n Go
vern
men
t (N
et)
576.
8
62
1.6
565.
2
519.
5
49
1.7
49
1.2
264.
7
T
otal
Cla
ims o
n Go
vern
men
t73
8.7
787.
6
82
2.9
73
5.4
593.
3
677.
7
48
9.4
Trea
sury
Bill
s
Stoc
ks a
nd B
onds
(TBB
)
Oth
er (L
oan
& A
dvan
ces)
738.
7
78
7.6
822.
9
735.
4
59
3.3
67
7.7
489.
4
G
over
nmen
t Dep
osits
161.
9
16
6.0
257.
6
215.
9
10
1.6
18
6.6
224.
7
C
laim
s on
Priv
ate
Sect
or1,
737.
7
2,05
4.2
2,
859.
2
4,37
0.0
6,53
3.1
9,50
2.1
9,
412.
4
Cla
ims o
n Pu
blic
Ent
erpr
ises
105.
8
82
.8
146.
0
131.
8
64
.4
1,
264.
2
2,03
8.0
Oth
er It
ems,
Net
(Ass
ets +
)1,
357.
9-
1,31
0.6
-
1,71
7.2
-
2,81
7.6
-
4,
234.
5-
4,
073.
3-
3,77
9.7
-
Tota
l Dep
osits
Lia
bilit
ies
2,93
2.2
4,
192.
9
5,80
8.1
8,
356.
3
13
,080
.8
18,6
93.6
21,8
54.2
D
eman
d De
posit
s1,
971.
9
2,70
1.9
3,
837.
5
5,19
6.9
8,80
6.4
12,6
86.0
14,9
15.5
T
ime
and
Savi
ngs D
epos
its96
0.3
1,49
1.0
1,
970.
6
3,15
9.3
4,27
4.4
6,00
7.6
6,
938.
8
F
orei
gn C
urre
ncy
Depo
sits
Oth
er D
epos
its
Sour
ce: C
entr
al B
ank
of L
iber
ia
Tabl
e 3.
2.3:
Lib
eria
- Ac
coun
ts o
f Dep
osit
Mon
ey B
anks
(In M
illio
n Li
beria
n do
llars
curr
ency
)
Pag
e 79
Sta
tistic
al B
ulle
tin 2
011
Statistical Bulletin, Monrovia, Liberia. December 2011 87
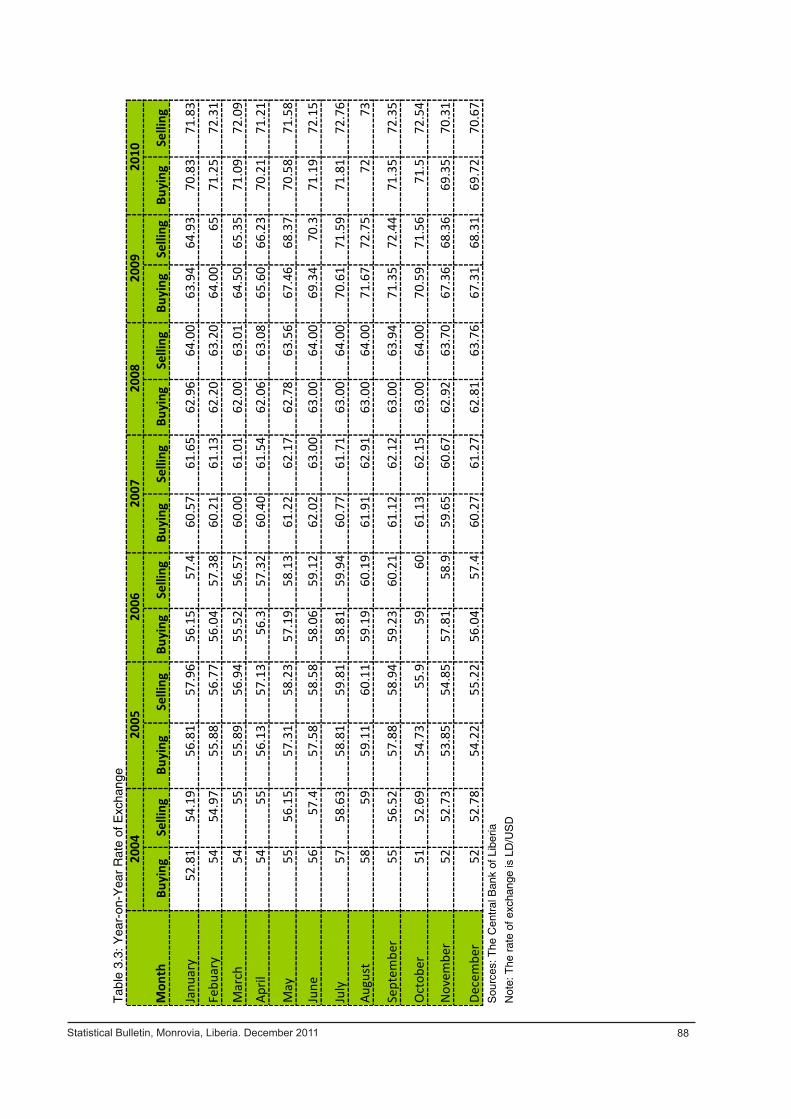
Buying
Selling
Buying
Selling
Buying
Selling
Buying
Selling
Buying
Selling
Buying
Selling
Buying
Selling
Janu
ary
52.8
154
.19
56.8
157
.96
56.1
557
.460
.57
61.6
562
.96
64.0
063
.94
64.9
370
.83
71.8
3
Febu
ary
5454
.97
55.8
856
.77
56.0
457
.38
60.2
161
.13
62.2
063
.20
64.0
065
71.2
572
.31
Mar
ch
5455
55.8
956
.94
55.5
256
.57
60.0
061
.01
62.0
063
.01
64.5
065
.35
71.0
972
.09
April
5455
56.1
357
.13
56.3
57.3
260
.40
61.5
462
.06
63.0
865
.60
66.2
370
.21
71.2
1
May
5556
.15
57.3
158
.23
57.1
958
.13
61.2
262
.17
62.7
863
.56
67.4
668
.37
70.5
871
.58
June
5657
.457
.58
58.5
858
.06
59.1
262
.02
63.0
063
.00
64.0
069
.34
70.3
71.1
972
.15
July
5758
.63
58.8
159
.81
58.8
159
.94
60.7
761
.71
63.0
064
.00
70.6
171
.59
71.8
172
.76
Augu
st58
5959
.11
60.1
159
.19
60.1
961
.91
62.9
163
.00
64.0
071
.67
72.7
572
73
Sept
embe
r55
56.5
257
.88
58.9
459
.23
60.2
161
.12
62.1
263
.00
63.9
471
.35
72.4
471
.35
72.3
5
Oct
ober
5152
.69
54.7
355
.959
6061
.13
62.1
563
.00
64.0
070
.59
71.5
671
.572
.54
Nov
embe
r52
52.7
353
.85
54.8
557
.81
58.9
59.6
560
.67
62.9
263
.70
67.3
668
.36
69.3
570
.31
Dece
mbe
r52
52.7
854
.22
55.2
256
.04
57.4
60.2
761
.27
62.8
163
.76
67.3
168
.31
69.7
270
.67
Sou
rces
: The
Cen
tral
Ban
k of
Lib
eria
2010
Not
e: T
he r
ate
of e
xcha
nge
is L
D/U
SD
Tab
le 3
.3: Y
ear-
on-Y
ear
Rat
e of
Exc
hang
e2005
2006
2007
2008
2009
2004
Mon
th
Pag
e 80
Sta
tistic
al B
ulle
tin 2
011
Statistical Bulletin, Monrovia, Liberia. December 2011 88
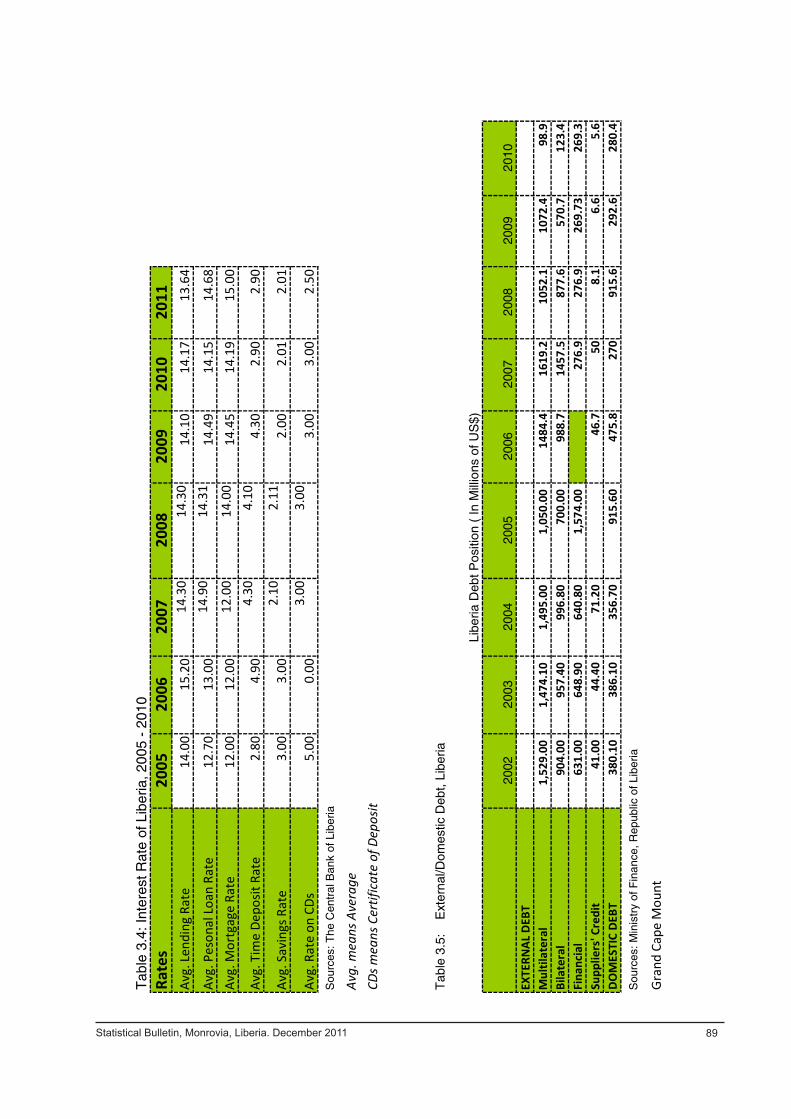
Rate
s20
0520
0620
0720
0820
0920
1020
11Av
g. L
endi
ng R
ate
14.0
015
.20
14.3
014
.30
14.1
014
.17
13.6
4
Avg.
Pes
onal
Loa
n Ra
te12
.70
13.0
014
.90
14.3
114
.49
14.1
514
.68
Avg.
Mor
tgag
e Ra
te12
.00
12.0
012
.00
14.0
014
.45
14.1
915
.00
Avg.
Tim
e De
posit
Rat
e2.
804.
904.
304.
104.
302.
902.
90
Avg.
Sav
ings
Rat
e3.
003.
002.
102.
112.
002.
012.
01
Avg.
Rat
e on
CDs
5.00
0.00
3.00
3.00
3.00
3.00
2.50
Avg.
mea
ns A
vera
geCD
s mea
ns C
ertif
icat
e of
Dep
osit
2002
2003
2004
2005
2006
2007
2008
2009
2010
EXTE
RNAL
DEB
TM
ultil
ater
al
1,52
9.00
1,47
4.10
1,
495.
00
1,05
0.00
14
84.4
1619
.210
52.1
1072
.498
.9Bi
late
ral
904.
00
95
7.40
996.
80
70
0.00
988.
714
57.5
877.
657
0.7
123.
4Fi
nanc
ial
631.
00
64
8.90
640.
80
1,
574.
00
276.
927
6.9
269.
7326
9.3
Supp
liers
' Cre
dit
41.0
0
44
.40
71
.20
46
.750
8.1
6.6
5.6
DOM
ESTI
C DE
BT38
0.10
386.
10
35
6.70
915.
60
47
5.8
270
915.
629
2.6
280.
4
Sou
rces
: Min
istr
y of
Fin
ance
, Rep
ublic
of L
iber
ia
Gran
d Ca
pe M
ount
Sou
rces
: The
Cen
tral
Ban
k of
Lib
eria
Tab
le 3
.4: I
nter
est R
ate
of L
iber
ia, 2
005
- 20
10
Tab
le 3
.5:
Ext
erna
l/Dom
estic
Deb
t, Li
beria
Lib
eria
Deb
t Pos
ition
( In
Mill
ions
of U
S$)
Pag
e 81
Sta
tistic
al B
ulle
tin 2
011
Statistical Bulletin, Monrovia, Liberia. December 2011 89

2002
2003
2004
2005
2006
2007
2008
2009
2010
2011
Janu
ary
19.5
12.8
4.2
15.7
7.2
1216
.56.4
12.9
4.74
Febr
uary
22
.411
3.9
16.1
713
14.8
711
.57.45
Mar
ch
23.8
10.2
3.1
16.8
6.4
11.2
14.3
6.9
13.2
6.54
April
17
.99.7
315
.87.4
13.5
11.7
7.8
11.9
7.39
May
18
.78.9
315
8.4
10.1
19.2
7.7
87.58
June
14
14.4
-1.1
16.6
6.8
12.5
227.6
2.5
8.78
July
9.3
12.8
114.7
712
.621
.37.3
4.2
10.6
Augu
st
8.8
14.3
9.1
4.6
89.9
26.5
4.9
3.3
10.27
Sept
embe
r 8.8
1012
.95.2
7.2
12.7
208
5.2
Oct
ober
8.5
8.3
138.6
5.8
8.6
18.6
8.2
4.9
Nov
embe
r 12
7.2
14.9
7.4
8.1
9.5
15.5
7.8
5.7
Dece
mbe
r 11
.15
16.1
78.9
11.7
9.4
9.7
6.6
Aver
age
Rate
ofIn
flatio
n 14
.610
.47.8
11.1
7.4
11.4
17.5
7.4
7.5
Sou
rce:
Lib
eria
Inst
itute
of S
tatis
tics
and
Geo
-Inf
orm
atio
n S
ervi
ces
(LIS
GIS
), a
nd th
e C
entr
al B
ank
of L
iber
ia (
CB
L)
Tabl
e 3.
6: Y
ear-
On-
Year
Rat
e of
Infla
tion,
Lib
eria
200
3-20
11
(May
199
8=10
0)
Mon
th
Year
Pag
e 82
Sta
tistic
al B
ulle
tin 2
011
Statistical Bulletin, Monrovia, Liberia. December 2011 90
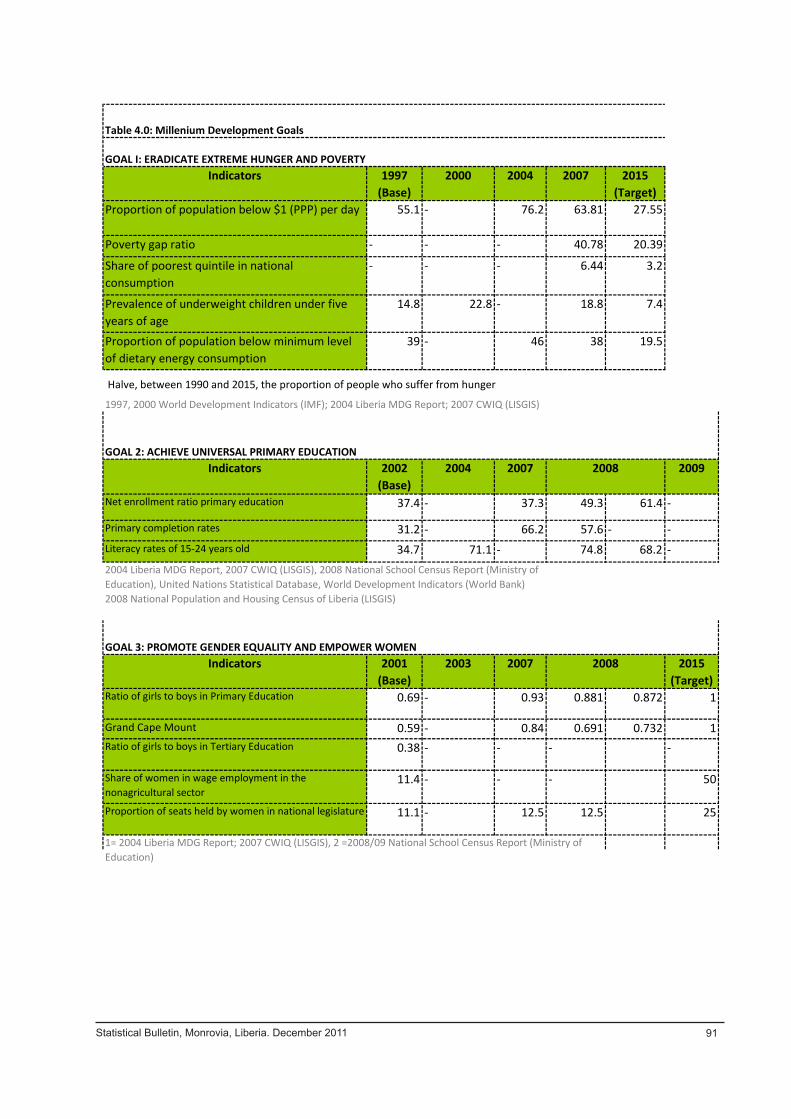
Statistical Bulletin, Monrovia, Liberia. December 2011 91
Indicators 1997 (Base)
2000 2004 2007 2015 (Target)
Proportion of population below $1 (PPP) per day 55.1 - 76.2 63.81 27.55
Poverty gap ratio - - - 40.78 20.39
Share of poorest quintile in national consumption
- - - 6.44 3.2
Prevalence of underweight children under five years of age
14.8 22.8 - 18.8 7.4
Proportion of population below minimum level of dietary energy consumption
39 - 46 38 19.5
Indicators 2002 (Base)
2004 2007 2009
Net enrollment ratio primary education 37.4 - 37.3 49.3 61.4 -
Primary completion rates 31.2 - 66.2 57.6 - -Literacy rates of 15-24 years old 34.7 71.1 - 74.8 68.2 -
Indicators 2001 (Base)
2003 2007 2015 (Target)
Ratio of girls to boys in Primary Education 0.69 - 0.93 0.881 0.872 1
Grand Cape Mount 0.59 - 0.84 0.691 0.732 1Ratio of girls to boys in Tertiary Education 0.38 - - - -
Share of women in wage employment in the nonagricultural sector
11.4 - - - 50
Proportion of seats held by women in national legislature 11.1 - 12.5 12.5 25
1= 2004 Liberia MDG Report; 2007 CWIQ (LISGIS), 2 =2008/09 National School Census Report (Ministry ofEducation)
2004 Liberia MDG Report, 2007 CWIQ (LISGIS), 2008 National School Census Report (Ministry of
2008
2008
Table 4.0: Millenium Development Goals
GOAL 3: PROMOTE GENDER EQUALITY AND EMPOWER WOMEN
GOAL 2: ACHIEVE UNIVERSAL PRIMARY EDUCATION
GOAL I: ERADICATE EXTREME HUNGER AND POVERTY
Education), United Nations Statistical Database, World Development Indicators (World Bank)2008 National Population and Housing Census of Liberia (LISGIS)
Halve, between 1990 and 2015, the proportion of people who suffer from hunger
1997, 2000 World Development Indicators (IMF); 2004 Liberia MDG Report; 2007 CWIQ (LISGIS)
Page 83 Statistical Bulletin 2011
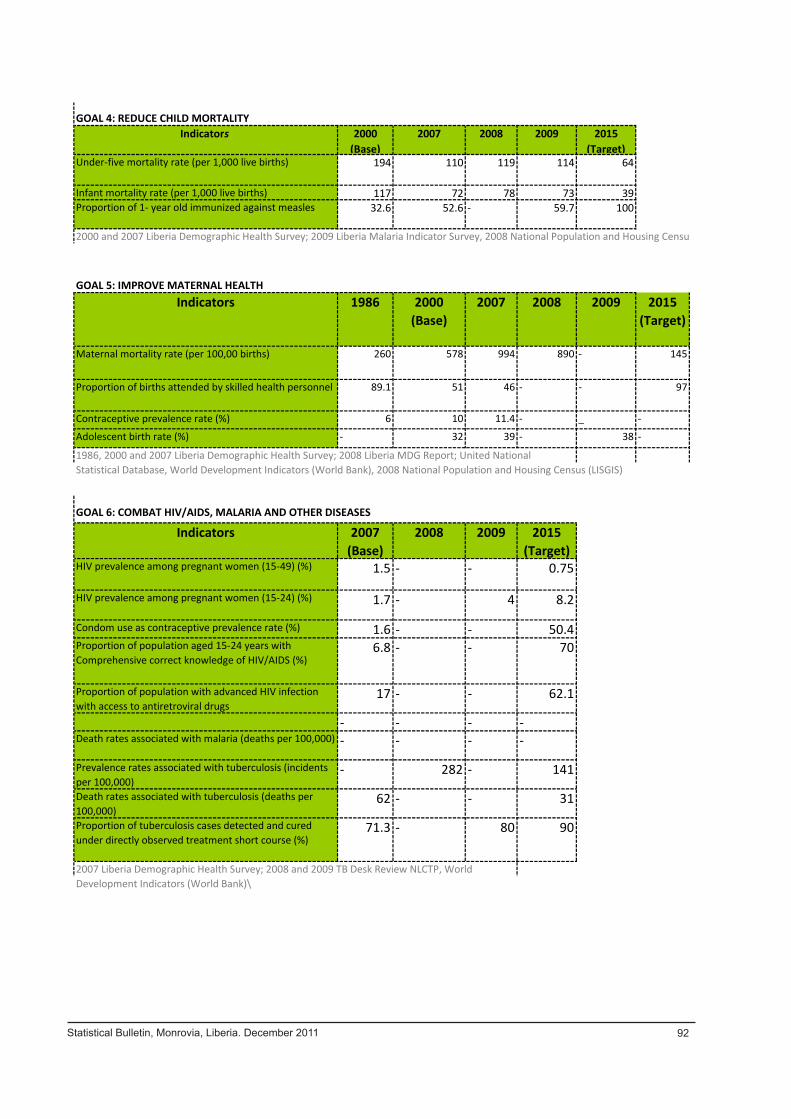
Indicators 2000 (Base)
2007 2008 2009 2015 (Target)
Under-five mortality rate (per 1,000 live births) 194 110 119 114 64
Infant mortality rate (per 1,000 live births) 117 72 78 73 39Proportion of 1- year old immunized against measles 32.6 52.6 - 59.7 100
2000 and 2007 Liberia Demographic Health Survey; 2009 Liberia Malaria Indicator Survey, 2008 National Population and Housing Census
Indicators 1986 2000 (Base)
2007 2008 2009 2015 (Target)
Maternal mortality rate (per 100,00 births) 260 578 994 890 - 145
Proportion of births attended by skilled health personnel 89.1 51 46 - - 97
Contraceptive prevalence rate (%) 6 10 11.4 - _ -
Adolescent birth rate (%) - 32 39 - 38 -
1986, 2000 and 2007 Liberia Demographic Health Survey; 2008 Liberia MDG Report; United NationalStatistical Database, World Development Indicators (World Bank), 2008 National Population and Housing Census (LISGIS)
Indicators 2007 (Base)
2008 2009 2015 (Target)
HIV prevalence among pregnant women (15-49) (%) 1.5 - - 0.75
HIV prevalence among pregnant women (15-24) (%) 1.7 - 4 8.2
Condom use as contraceptive prevalence rate (%) 1.6 - - 50.4Proportion of population aged 15-24 years with Comprehensive correct knowledge of HIV/AIDS (%)
6.8 - - 70
Proportion of population with advanced HIV infection with access to antiretroviral drugs
17 - - 62.1
- - - -Death rates associated with malaria (deaths per 100,000) - - - -
Prevalence rates associated with tuberculosis (incidents per 100,000)
- 282 - 141
Death rates associated with tuberculosis (deaths per 100,000)
62 - - 31
Proportion of tuberculosis cases detected and cured under directly observed treatment short course (%)
71.3 - 80 90
2007 Liberia Demographic Health Survey; 2008 and 2009 TB Desk Review NLCTP, WorldDevelopment Indicators (World Bank)\
GOAL 4: REDUCE CHILD MORTALITY
GOAL 5: IMPROVE MATERNAL HEALTH
GOAL 6: COMBAT HIV/AIDS, MALARIA AND OTHER DISEASES
Page 84 Statistical Bulletin 2011
Statistical Bulletin, Monrovia, Liberia. December 2011 92

Indicators 2010 2015 (Target)
Incidence and death rates associated with malaria halved 33 16
Prevalence of malaria in children under five (%) 32 18Proportion of children under 5 sleeping under insecticide treated bed nets (%)
27 80
Proportion of Children under 5 with fever who are 30 80
Proportion of pregnant women who slept under insecticide treated bed nets the previous night (%)
33 80
Proportion of women who received two or more intermittent preventive therapy during the last pregnancy in the previous two years (%)
45 80
Prevalence rate associated with TB (incidents per 1000,000)
282 141
TB case detection rate (%) 64 70Proportion of TB cases observed and treated with short course (%)
80 90
2009 Health Facility Survey, 2009 LMIS Report, 2008 TB Desk Review NLCTP, 2009 GFTAMReport NLTCP
Indicators 2005 2007 2009 2017 (Target)
Proportion of land covered by forest (%) 39 51 - 42.1Proportion of people with sustainable access to improved water sources (%)
61 65 75 77.5
Proportion of people with access to improved sanitation (%)
27 10 44 69.5
Urban 49 21.3 63Rural 7 3.4 272006 National Human Development Report, 2007 Liberia Demographic Health Survey, 2007 FederalDrug Administration (satellite imagery), 2009 Liberia Malaria Indicator Survey
Indicators 2005 2006 2007 2008 2009Public sector external debt outstanding (medium and long term) incl. arrears ($billions)
3.66 4.53 4. 54 3.16 1.72
Public sector external debt outstanding incl. arrears % of GDP
690 748 829.8 388.8 _
Public sector external debt outstanding incl. arrears of Exports
2402 2079 2094 - -
External public debt services charges % of GDP 22.3 23 22.1 - -Aid per capita (current US$) - - - 101.2 -Internet users (per 100 people) - - - 15 -Mobile cellular subscription (per 100 people) - - - 19 32
Central Bank of Liberia2007 International Monetary Fund Country Report, World Development Indicators (World Bank),
GOAL 8:DEVELOP A GLOBAL PARTNERSHIP FOR DEVELOPMENT
GOAL 6: COMBAT HIV/AIDS, MALARIA AND OTHER DISEASES CONT'D
GOAL 7: ENSURE ENVIRONMENTAL SUSTAINABILITY
Page 85 Statistical Bulletin 2011
Statistical Bulletin, Monrovia, Liberia. December 2011 93
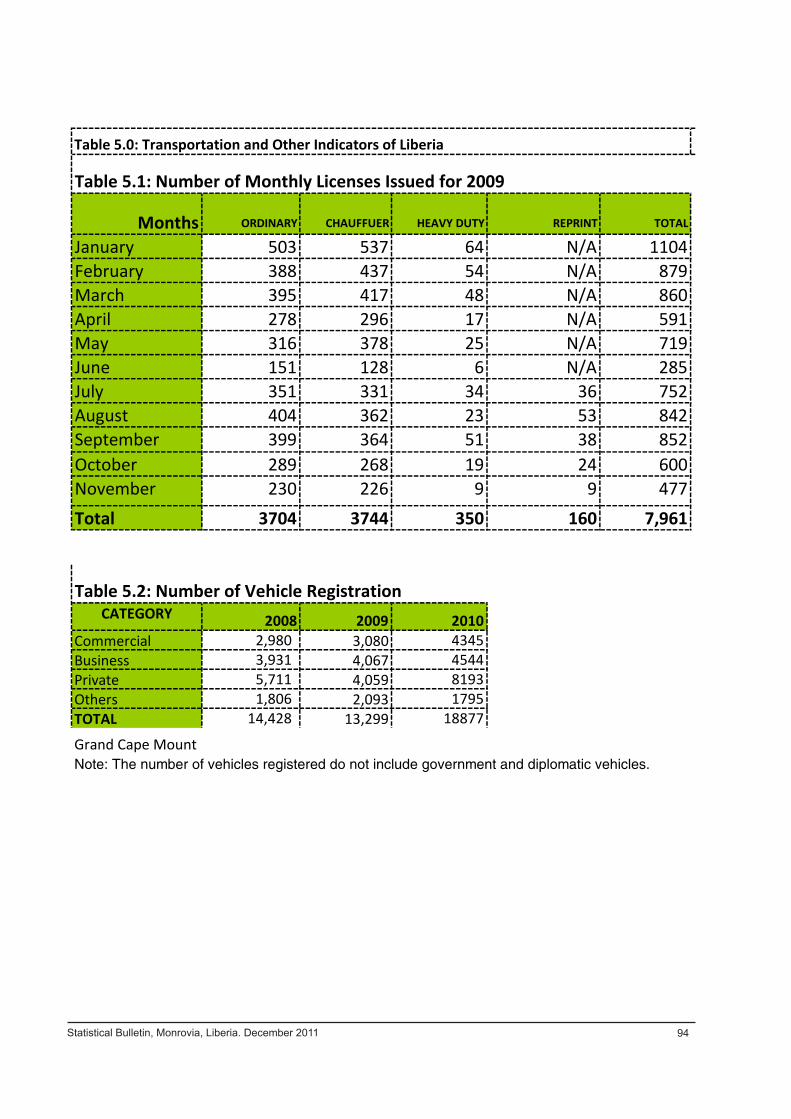
Statistical Bulletin, Monrovia, Liberia. December 2011 94
Months ORDINARY CHAUFFUER HEAVY DUTY REPRINT TOTAL
January 503 537 64 N/A 1104February 388 437 54 N/A 879March 395 417 48 N/A 860April 278 296 17 N/A 591May 316 378 25 N/A 719June 151 128 6 N/A 285July 351 331 34 36 752August 404 362 23 53 842September 399 364 51 38 852October 289 268 19 24 600November 230 226 9 9 477Total 3704 3744 350 160 7,961
CATEGORY 2008 2009 2010Commercial 2,980 3,080 4345Business 3,931 4,067 4544Private 5,711 4,059 8193Others 1,806 2,093 1795TOTAL 14,428 13,299 18877
Grand Cape MountNote: The number of vehicles registered do not include government and diplomatic vehicles.
Table 5.0: Transportation and Other Indicators of Liberia
Table 5.2: Number of Vehicle Registration
Table 5.1: Number of Monthly Licenses Issued for 2009
Page 86 Statistical Bulletin 2011

WAT
ER P
RODU
CTIO
NO
UTP
UT
LIN
EM
ayJu
neJu
lyAu
gust
Sept
embe
rO
ctob
erN
ovem
ber
Dec
embe
r16
" M
AIN
34,5
29.9
34,4
50.6
44,4
10.5
32,2
80.2
39,4
46.8
34,8
47.7
45,5
44.0
50,1
86.8
36"
MAI
N27
,089
.727
,563
.821
,264
.621
,468
.122
,876
.627
,166
.835
,635
.238
,389
.2
Whi
te P
lain
TOTA
L61
,619
.662
,014
.465
,675
.153
,748
.362
,323
.462
,014
.581
,179
.288
,576
.0Co
nsum
ptio
n18
,522
.819
,180
.320
,423
.117
,469
.720
,750
.619
,551
.220
,297
.820
,208
.6Ef
ficie
ncy
30%
31%
31%
33%
33%
32%
25%
23%
Tota
l Los
s 43
,096
.842
,834
.245
,252
.136
,278
.641
,572
.842
,463
.360
,881
.468
,367
.3
Wat
er P
rodu
ctio
nO
utpu
t Lin
eA
pril
May
June
July
Aug
ust
Sep
tem
ber
Oct
ober
Tot
al16
" M
AIN
39,8
68.9
38
,325
.3
36
,620
.8
31,3
98.6
33,7
08.5
35,7
06.4
37
,435
.2
253,
063.
6
36"
MAI
N80
,136
.5
77,0
33.8
73,6
07.8
63
,111
.2
64
,567
.7
68
,562
.2
72,1
54.1
49
9,17
3.3
Whi
te P
lain
TOTA
L12
0,00
5.4
11
5,35
9.1
11
0,22
8.6
94
,509
.9
98
,276
.2
10
4,26
8.6
10
9,58
9.3
75
2,23
7.0
Con
sum
ptio
n50
,186
.0
51
,617
.9
48
,365
.5
45
,299
.7
38
,640
.3
47
,080
.9
54
,453
.9
33
5,64
4.3
Effi
cien
cy0.
4
45%
44%
48%
39%
45%
50%
45%
Tot
al L
oss
69,8
19.4
1
63,7
41.1
9
61,8
63.0
8
49,2
10.1
2
59,6
35.8
8
57,1
87.6
7
55,1
35.3
3
416,
592.
68
Sou
rce:
Lib
eria
Wat
er a
nd S
ewer
Cor
pora
tion
Gran
d Ca
pe M
ount
OU
TPU
T LI
NE
April
May
June
July
Augu
stSe
ptem
ber
Oct
ober
Nov
embe
r16
" M
AIN
39,8
68.9
38,3
25.3
36,6
20.8
31,3
98.6
33,7
08.5
35,7
06.4
37,4
35.2
50,1
86.8
36"
MAI
N80
,136
.577
,033
.873
,607
.863
,111
.264
,567
.768
,562
.272
,154
.138
,389
.2
Whi
te P
lain
TOTA
L12
0,00
5.4
115,
359.
111
0,22
8.6
94,5
09.9
98,2
76.2
104,
268.
610
9,58
9.3
88,5
76.0
Cons
umpt
ion
50,2
76.0
51,6
17.9
48,3
65.5
45,2
99.7
38,6
40.3
47,0
80.9
54,4
53.9
20,2
08.6
Effic
ienc
y42
%45
%44
%48
%39
%45
%50
%23
%To
tal L
oss
69,7
29.4
63,7
41.2
61,8
63.1
49,2
10.1
59,6
35.9
57,1
87.7
55,1
35.3
68,3
67.3
(IN
'000
' GA
LLO
NS
)
Tabl
e 5.
3: P
RODU
CTIO
N A
ND
CON
SUM
PTIO
N P
ERFO
RMAN
CE IN
DICA
TOR
APRI
L - D
ECEM
BER,
200
8
(IN
'000
' GA
LLO
NS
)
MAY
- D
ECEM
BER,
200
7(I
N '0
00' G
ALL
ON
S)
APRI
L -
OCT
OBE
R, 2
009
(IN
'000
' GA
LLO
NS
)
JAN
UAR
Y - D
ECEM
BER,
200
8
Pag
e 87
Sta
tistic
al B
ulle
tin 2
011
Statistical Bulletin, Monrovia, Liberia. December 2011 95

Wat
er P
rodu
ctio
nO
utpu
t Lin
eJa
nuar
yF
ebru
ary
Mar
chA
pril
Aug
ust
Sep
tem
ber
Oct
ober
Nov
embe
rD
ecem
ber
16"
MAI
N39
,408
.2
40,2
75.4
39,9
53.5
58
,028
.2
51
,831
.0
45
,350
.6
49,1
09.7
50
,090
.1
61
,428
.7
36"
MAI
N72
,736
.1
73,9
09.9
59,9
30.3
72
,666
.0
68
,803
.5
65
,041
.8
73,6
44.5
75
,135
.1
92
,143
.0
Whi
te P
lain
TOTA
L11
2,14
4.3
11
4,18
5.2
99
,883
.8
13
0,69
4.2
12
0,63
4.5
11
0,39
2.4
12
2,75
4.2
12
5,22
5.2
153,
571.
7
Con
sum
ptio
n68
,948
.4
59
,415
.1
52
,688
.7
69
,582
.8
54
,869
.7
51
,116
.7
59
,641
.7
66
,885
.6
75
,494
.8
Effi
cien
cy61%
52%
53%
53%
45%
46%
49%
53%
0.5
T
otal
Los
s 43
,195
.86
54
,770
.19
47
,195
.16
61
,111
.45
65
,764
.75
59
,275
.66
63
,112
.45
58
,339
.66
78
,076
.9
Wat
er P
rodu
ctio
nO
utpu
t Lin
eJa
nuar
yF
ebru
ary
Mar
chA
pril
May
June
July
Aug
ust
16"
MAI
N71
,594
.0
64,9
56.4
59,2
11.7
36"
MAI
N10
7,39
1.1
97
,434
.6
88
,817
.5
Whi
te P
lain
TOTA
L17
8,98
5.1
16
2,39
0.9
14
8,02
9.2
C
onsu
mpt
ion
82,4
60.3
79,9
32.2
75,1
90.6
Effi
cien
cy46%
49%
51%
Tot
al L
oss
96,5
24.7
7
82,4
58.7
2
72,8
38.5
5
JAN
UAR
Y - D
ECEM
BER,
200
8 (I
N '0
00' G
ALL
ON
S)
Pag
e 88
Sta
tistic
al B
ulle
tin 2
011
Statistical Bulletin, Monrovia, Liberia. December 2011 96
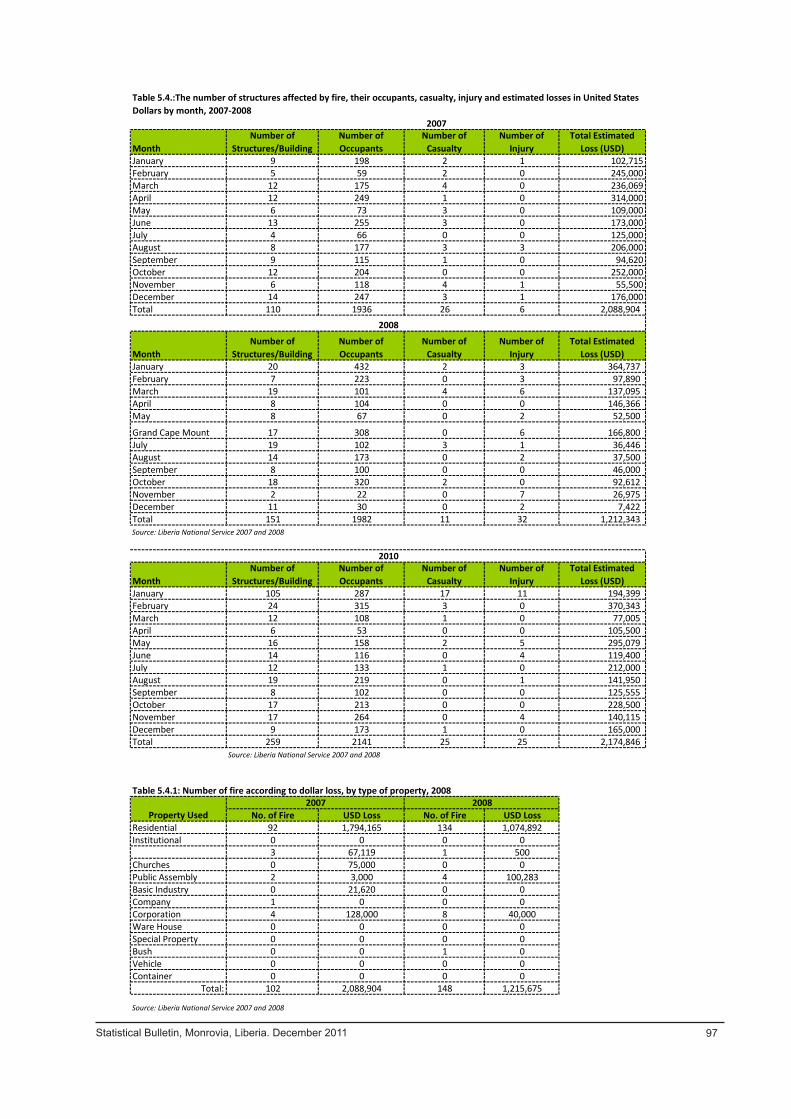
MonthNumber of
Structures/BuildingNumber of Occupants
Number of Casualty
Number of Injury
Total Estimated Loss (USD)
January 9 198 2 1 102,715February 5 59 2 0 245,000March 12 175 4 0 236,069April 12 249 1 0 314,000May 6 73 3 0 109,000June 13 255 3 0 173,000July 4 66 0 0 125,000August 8 177 3 3 206,000September 9 115 1 0 94,620October 12 204 0 0 252,000November 6 118 4 1 55,500December 14 247 3 1 176,000Total 110 1936 26 6 2,088,904
MonthNumber of
Structures/BuildingNumber of Occupants
Number of Casualty
Number of Injury
Total Estimated Loss (USD)
January 20 432 2 3 364,737 February 7 223 0 3 97,890 March 19 101 4 6 137,095 April 8 104 0 0 146,366 May 8 67 0 2 52,500
Grand Cape Mount 17 308 0 6 166,800 July 19 102 3 1 36,446 August 14 173 0 2 37,500 September 8 100 0 0 46,000 October 18 320 2 0 92,612 November 2 22 0 7 26,975 December 11 30 0 2 7,422 Total 151 1982 11 32 1,212,343 Source: Liberia National Service 2007 and 2008
MonthNumber of
Structures/BuildingNumber of Occupants
Number of Casualty
Number of Injury
Total Estimated Loss (USD)
January 105 287 17 11 194,399 February 24 315 3 0 370,343 March 12 108 1 0 77,005 April 6 53 0 0 105,500 May 16 158 2 5 295,079 June 14 116 0 4 119,400 July 12 133 1 0 212,000 August 19 219 0 1 141,950 September 8 102 0 0 125,555 October 17 213 0 0 228,500 November 17 264 0 4 140,115 December 9 173 1 0 165,000 Total 259 2141 25 25 2,174,846
Source: Liberia National Service 2007 and 2008
Table 5.4.1: Number of fire according to dollar loss, by type of property, 2008
No. of Fire USD Loss No. of Fire USD LossResidential 92 1,794,165 134 1,074,892Institutional 0 0 0 0
3 67,119 1 500Churches 0 75,000 0 0Public Assembly 2 3,000 4 100,283Basic Industry 0 21,620 0 0Company 1 0 0 0Corporation 4 128,000 8 40,000Ware House 0 0 0 0Special Property 0 0 0 0Bush 0 0 1 0Vehicle 0 0 0 0Container 0 0 0 0
Total: 102 2,088,904 148 1,215,675
Source: Liberia National Service 2007 and 2008
2007
Property Used2007 2008
Table 5.4.:The number of structures affected by fire, their occupants, casualty, injury and estimated losses in United States Dollars by month, 2007-2008
2008
2010
Page 89 Statistical Bulletin 2011
Statistical Bulletin, Monrovia, Liberia. December 2011 97
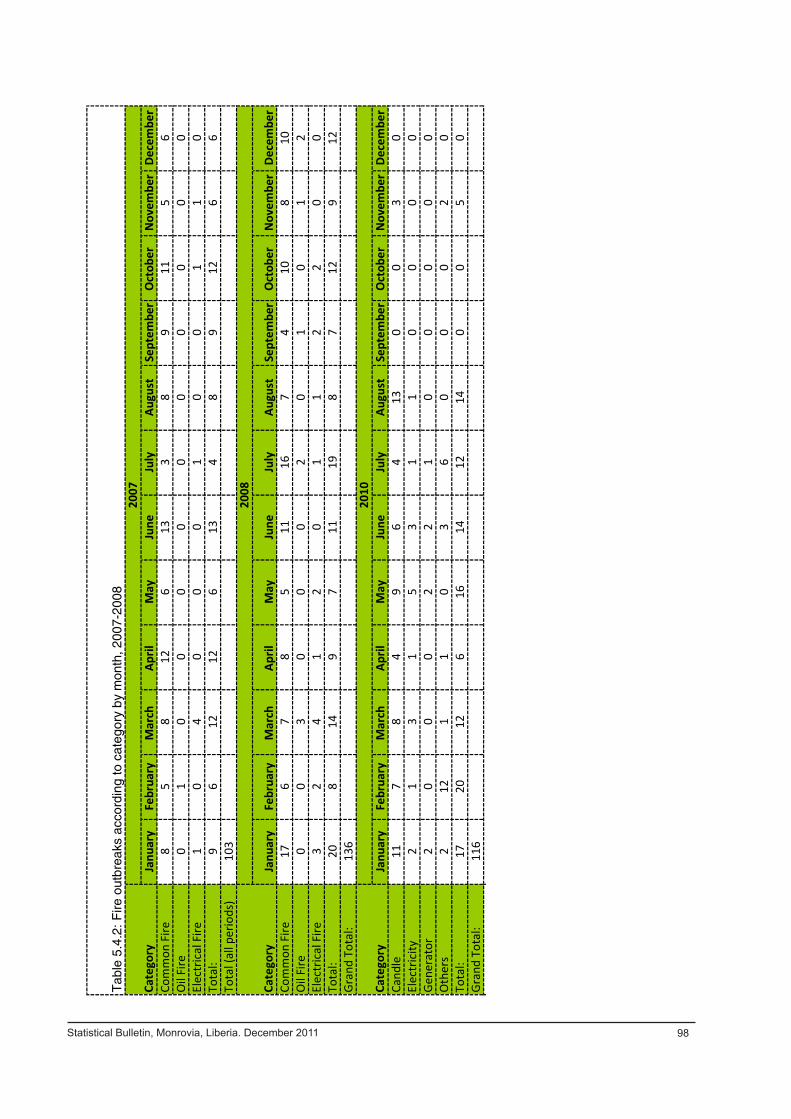
Janu
ary
Febr
uary
Mar
ch
April
M
ayJu
neJu
lyAu
gust
Sept
embe
rO
ctob
er
Nov
embe
rDe
cem
ber
Com
mon
Fire
85
812
613
38
911
56
Oil
Fire
01
00
00
00
00
00
Elec
tric
al F
ire1
04
00
01
00
11
0To
tal:
96
1212
613
48
912
66
Tota
l (al
l per
iods
)10
3
Janu
ary
Febr
uary
Mar
ch
April
M
ayJu
neJu
lyAu
gust
Sept
embe
rO
ctob
er
Nov
embe
rDe
cem
ber
Com
mon
Fire
176
78
511
167
410
810
Oil
Fire
00
30
00
20
10
12
Elec
tric
al F
ire3
24
12
01
12
20
0To
tal:
208
149
711
198
712
912
Gran
d To
tal:
136
Janu
ary
Febr
uary
Mar
ch
April
M
ayJu
neJu
lyAu
gust
Sept
embe
rO
ctob
er
Nov
embe
rDe
cem
ber
Cand
le11
78
49
64
130
03
0El
ectr
icity
21
31
53
11
00
00
Gene
rato
r2
00
02
21
00
00
0O
ther
s2
121
10
36
00
02
0To
tal:
1720
126
1614
1214
00
50
Gran
d To
tal:
116
Gran
d Ca
pe M
ount
Tab
le 5
.4.2
: Fire
out
brea
ks a
ccor
ding
to c
ateg
ory
by m
onth
, 200
7-20
08
Cate
gory
2010
Cate
gory
2007
Cate
gory
2008
Pag
e90
Sta
tistic
al B
ulle
tin 2
011
Statistical Bulletin, Monrovia, Liberia. December 2011 98
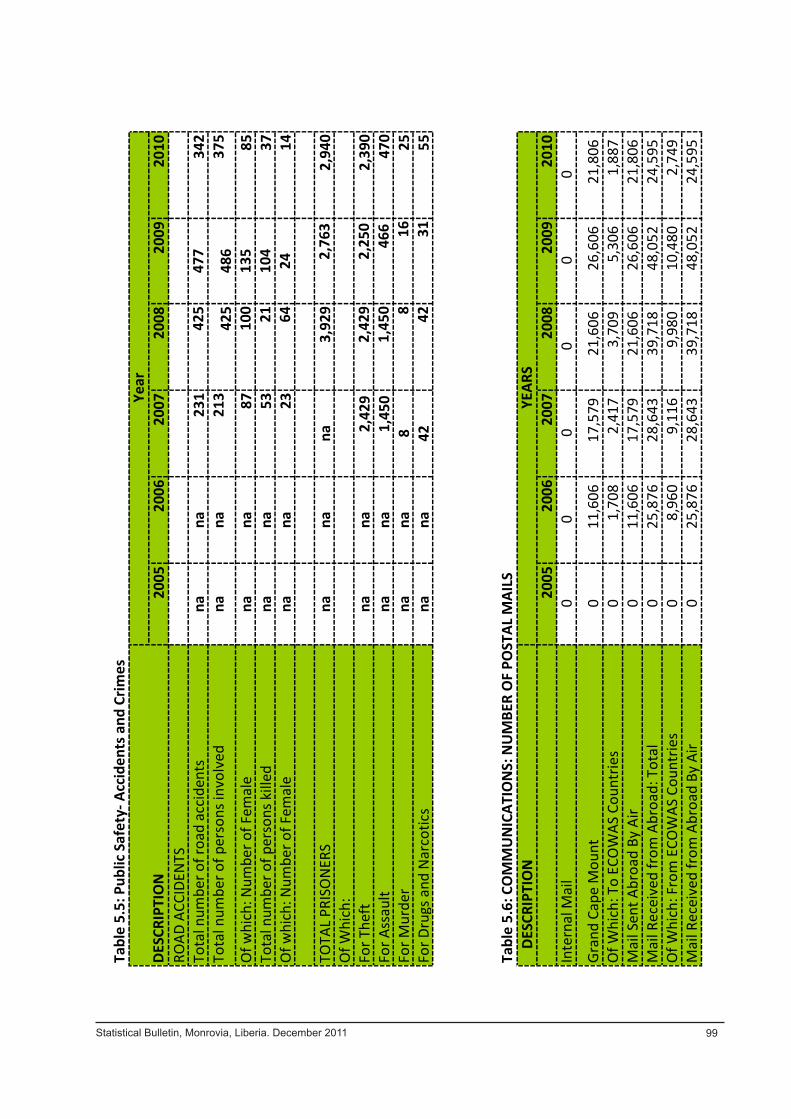
Tabl
e 5.
5: P
ublic
Saf
ety-
Acc
iden
ts a
nd C
rimes
2005
2006
2007
2008
2009
2010
ROAD
ACC
IDEN
TSTo
tal n
umbe
r of r
oad
acci
dent
sna
na23
142
547
734
2To
tal n
umbe
r of p
erso
ns in
volv
edna
na21
342
548
637
5
Of w
hich
: Num
ber o
f Fem
ale
nana
8710
013
585
Tota
l num
ber o
f per
sons
kill
edna
na53
2110
437
Of w
hich
: Num
ber o
f Fem
ale
nana
2364
24
14
TOTA
L PR
ISO
NER
Sna
nana
3
,929
2,7
63
2
,940
O
f Whi
ch:
For T
heft
nana
2
,429
2,4
29
2
,250
2,3
90
For A
ssau
ltna
na
1,4
50
1
,450
4
66
47
0 Fo
r Mur
der
nana
88
1625
For D
rugs
and
Nar
cotic
sna
na42
4231
55
D
ESCR
IPTI
ON
20
0520
0620
0720
0820
0920
10In
tern
al M
ail
00
00
00
Gran
d Ca
pe M
ount
011
,606
17
,579
21
,606
26
,606
21
,806
O
f Whi
ch: T
o EC
OW
AS C
ount
ries
01,
708
2,41
7
3,
709
5,30
6
1,
887
Mai
l Sen
t Abr
oad
By A
ir0
11,6
06
17,5
79
21,6
06
26,6
06
21,8
06
Mai
l Rec
eive
d fr
om A
broa
d: T
otal
025
,876
28
,643
39
,718
48
,052
24
,595
O
f Whi
ch: F
rom
ECO
WAS
Cou
ntrie
s0
8,96
0
9,
116
9,98
0
10
,480
2,
749
Mai
l Rec
eive
d fr
om A
broa
d By
Air
025
,876
28
,643
39
,718
48
,052
24
,595
DESC
RIPT
ION
YEAR
S
Year
Tabl
e 5.
6: C
OM
MU
NIC
ATIO
NS:
NU
MBE
R O
F PO
STAL
MAI
LS
Pag
e 91
Sta
tistic
al B
ulle
tin 2
011
Statistical Bulletin, Monrovia, Liberia. December 2011 99
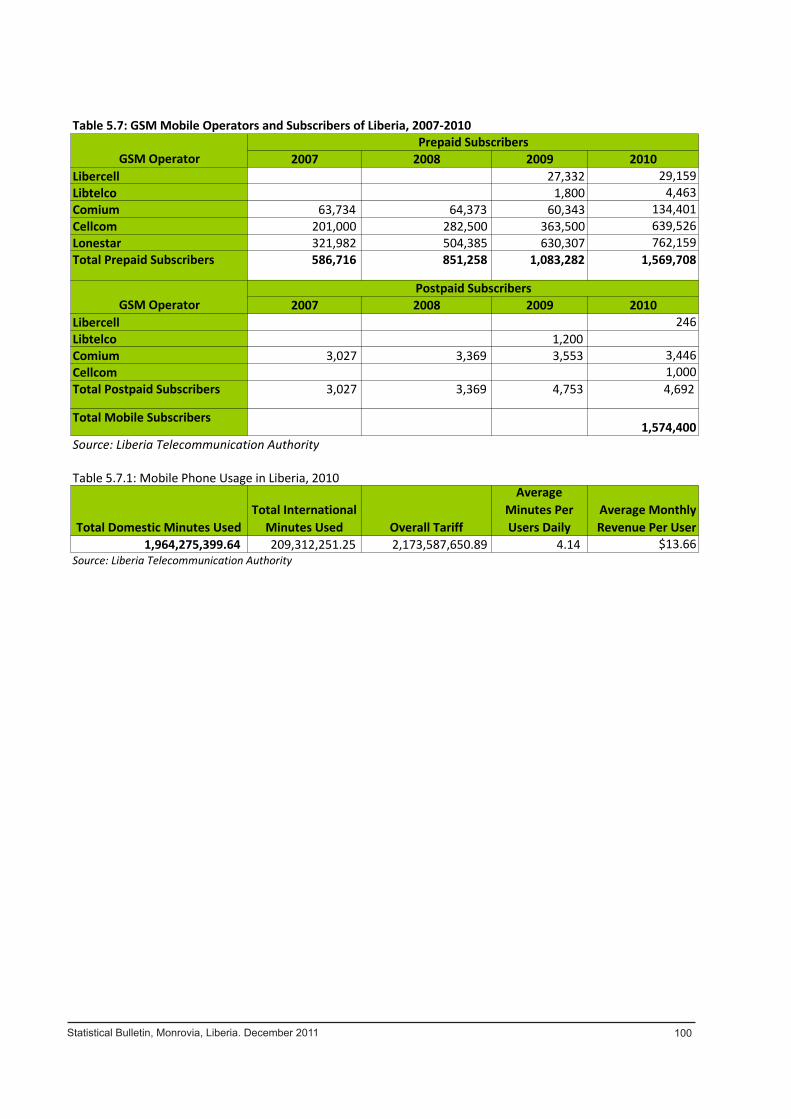
2007 2008 2009 2010Libercell 27,332 29,159 Libtelco 1,800 4,463 Comium 63,734 64,373 60,343 134,401 Cellcom 201,000 282,500 363,500 639,526 Lonestar 321,982 504,385 630,307 762,159 Total Prepaid Subscribers 586,716 851,258 1,083,282 1,569,708
2007 2008 2009 2010Libercell 246 Libtelco 1,200 Comium 3,027 3,369 3,553 3,446 Cellcom 1,000 Total Postpaid Subscribers 3,027 3,369 4,753 4,692
Total Mobile Subscribers 1,574,400
Total Domestic Minutes UsedTotal International
Minutes Used Overall Tariff
Average Minutes Per Users Daily
Average Monthly Revenue Per User
1,964,275,399.64 209,312,251.25 2,173,587,650.89 4.14 $13.66
Grand Cape Mount
Table 5.7.1: Mobile Phone Usage in Liberia, 2010
Source: Liberia Telecommunication Authority
Table 5.7: GSM Mobile Operators and Subscribers of Liberia, 2007-2010
GSM OperatorPrepaid Subscribers
GSM OperatorPostpaid Subscribers
Source: Liberia Telecommunication Authority
Page 92 Statistical Bulletin 2011
Statistical Bulletin, Monrovia, Liberia. December 2011 100


![Monetary Policy and Real Estate Prices: A Disaggregated ... · PDF fileReal Estate Prices: A Disaggregated Analysis for Switzerland ... Dupor [2005] analyzes in ... A Disaggregated](https://img.pdfslide.net/doc/110x75/5a79a5d87f8b9ae1468d0da8/monetary-policy-and-real-estate-prices-a-disaggregated-estate-prices-a-disaggregated.jpg)