Embed Size (px)
Citation preview

Statistical Cartoons
rpanel: simple interactive controls for R functionsusing the tcltk package
Ewan Crawford, Adrian Bowman
Department of Statistics, The University of Glasgow, UK
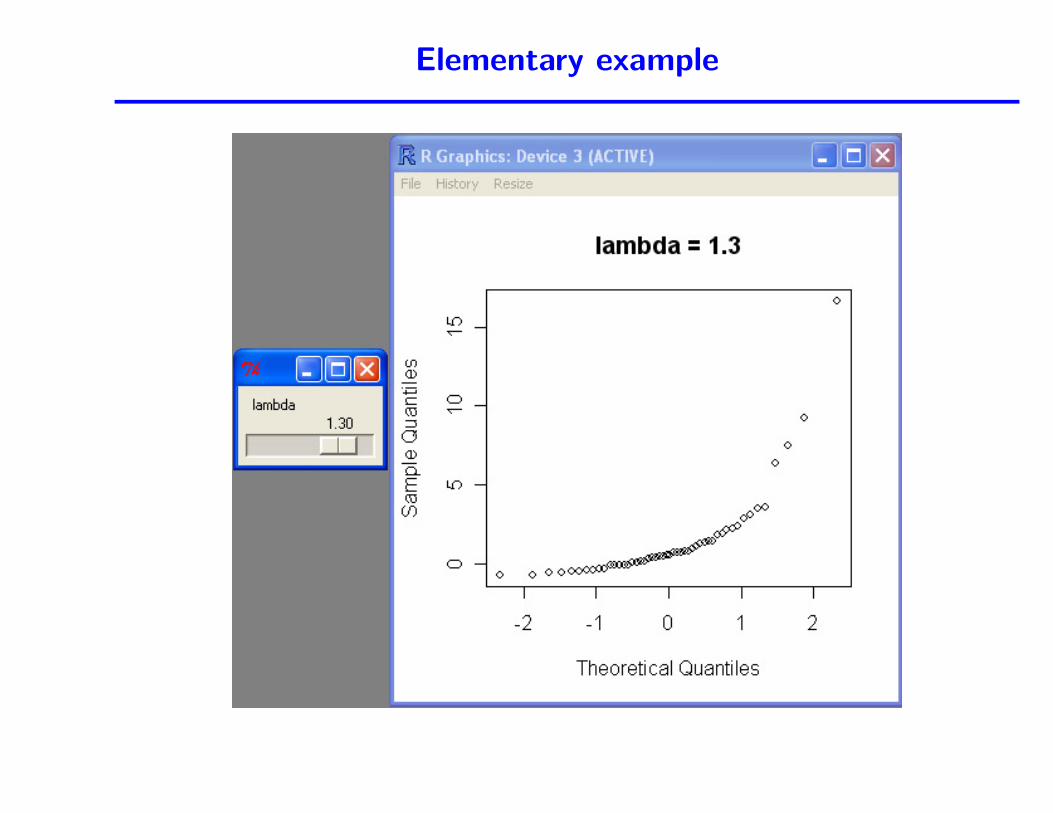
Elementary example

Code for example
library(rpanel)
x11(width=4,height=4)
qq.draw <- function(panel) {
z <- bc.fn(panel$y, panel$lambda)
qqnorm(z, main = paste("lambda =",
round(panel$lambda, 2)))
panel
}
panel <- rp.control(y = exp(rnorm(50)), lambda = 1)
rp.slider(panel, lambda, -2, 2, qq.draw,
showvalue = TRUE)
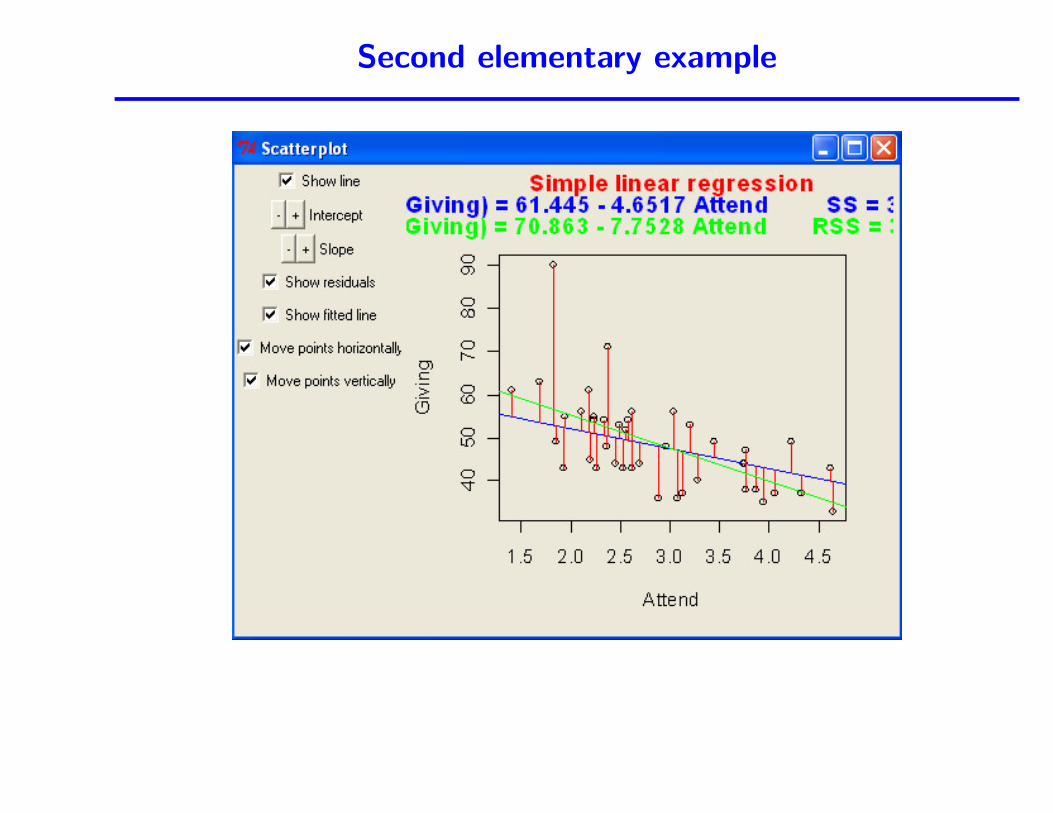
Second elementary example

Second elementary example
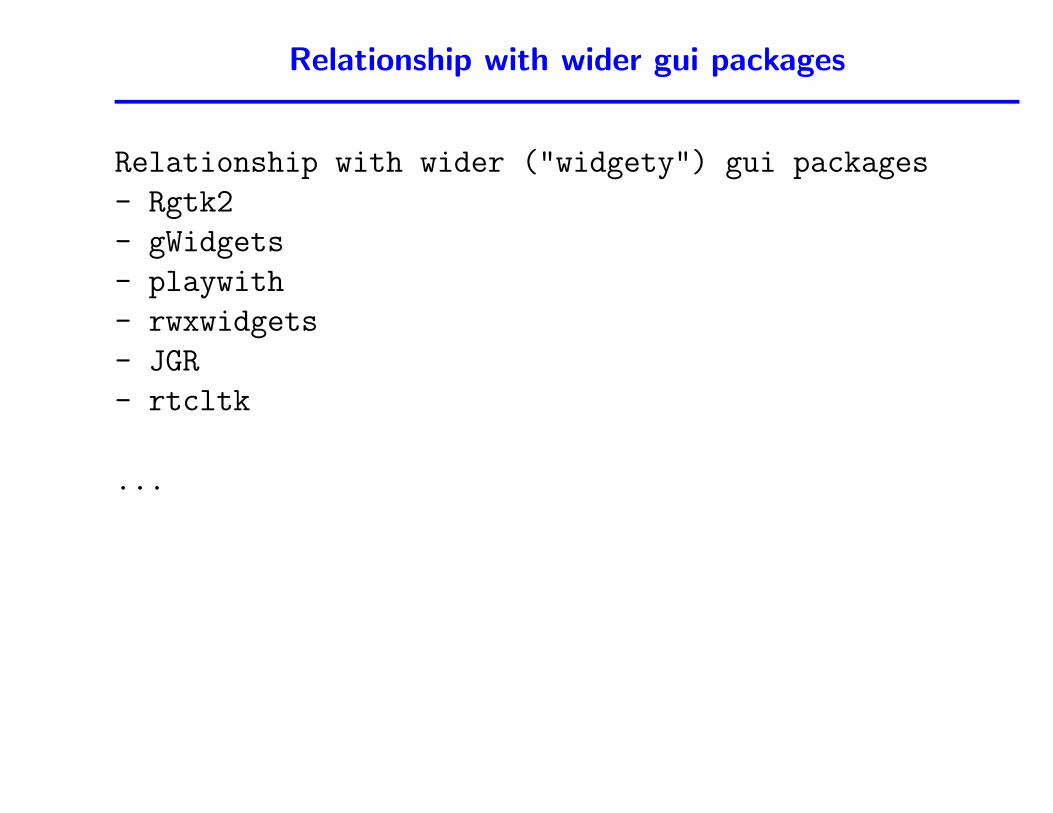
Relationship with wider gui packages
Relationship with wider ("widgety") gui packages
- Rgtk2
- gWidgets
- playwith
- rwxwidgets
- JGR
- rtcltk
...
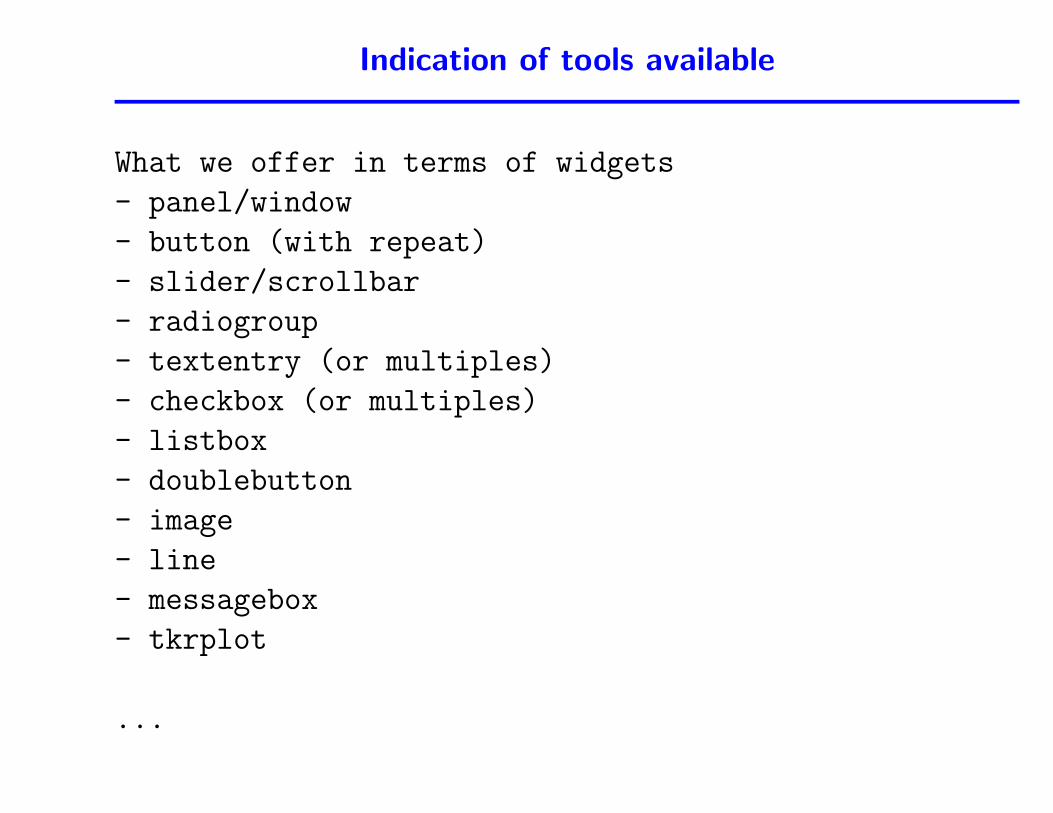
Indication of tools available
What we offer in terms of widgets
- panel/window
- button (with repeat)
- slider/scrollbar
- radiogroup
- textentry (or multiples)
- checkbox (or multiples)
- listbox
- doublebutton
- image
- line
- messagebox
- tkrplot
...
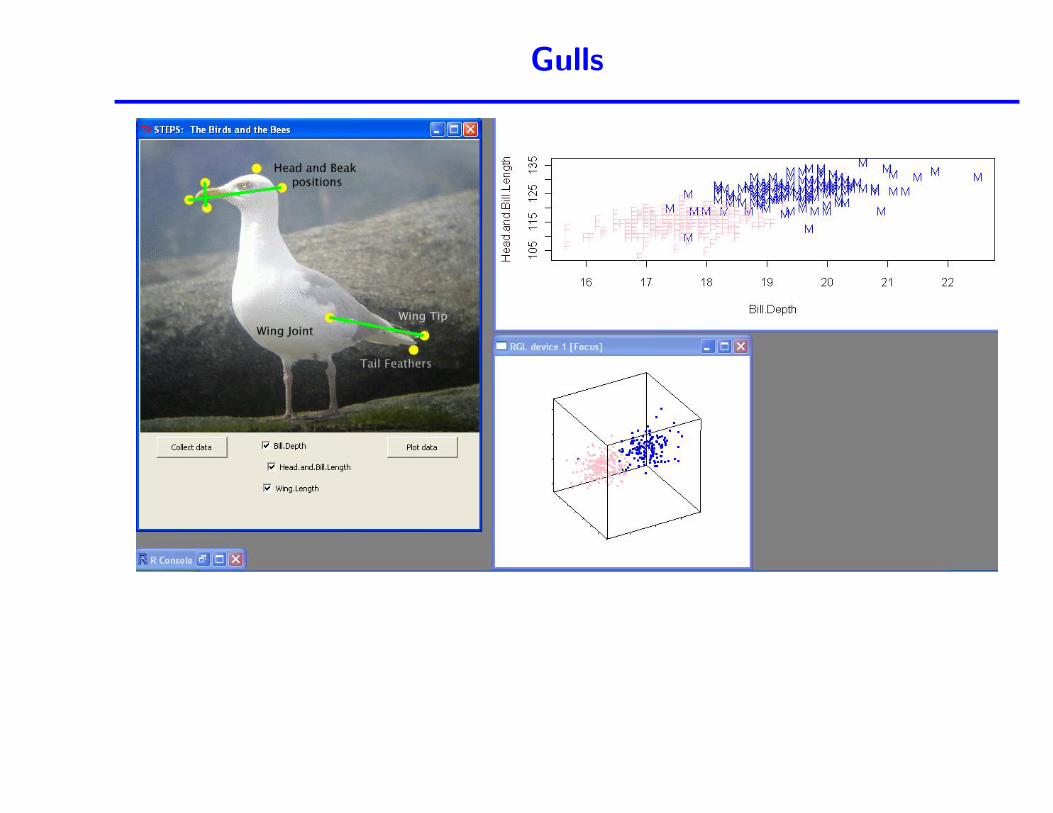
Gulls
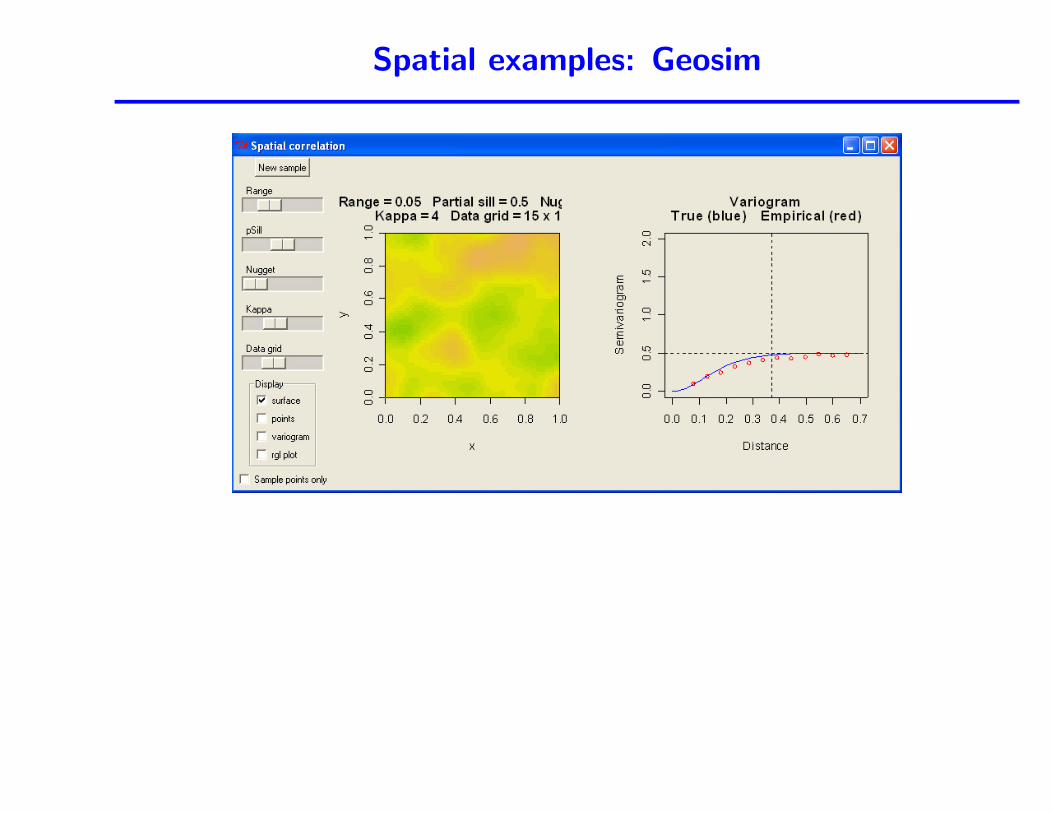
Spatial examples: Geosim
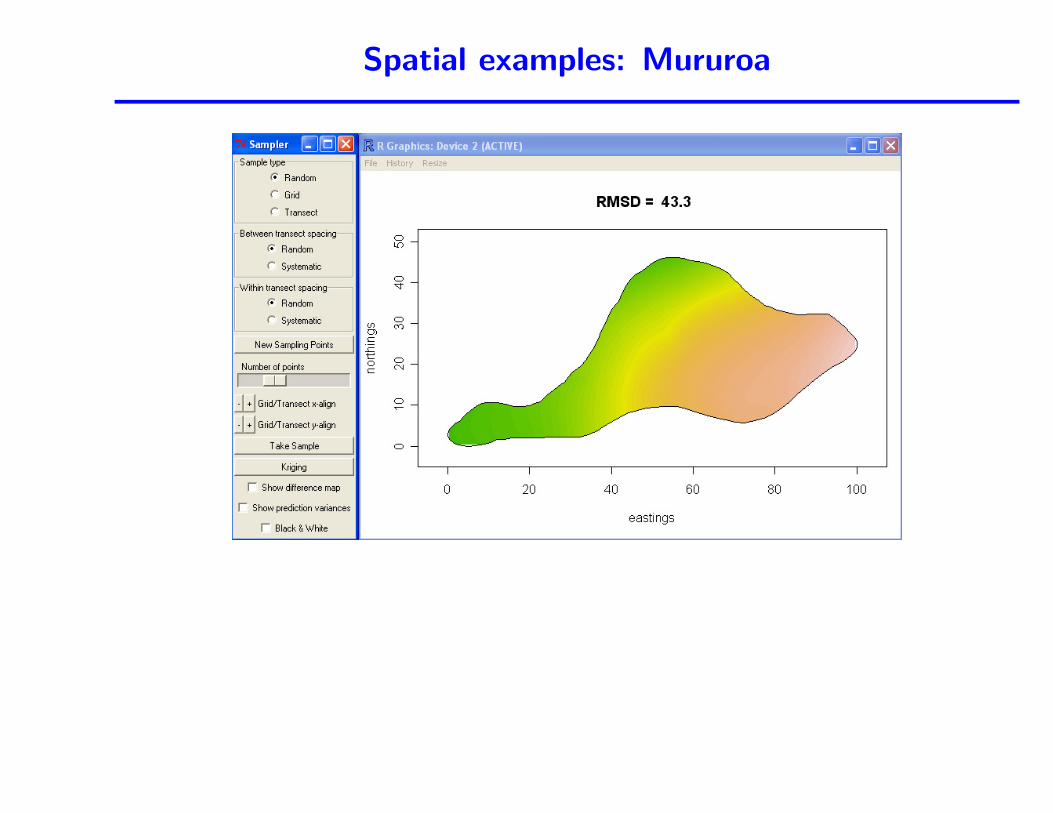
Spatial examples: Mururoa
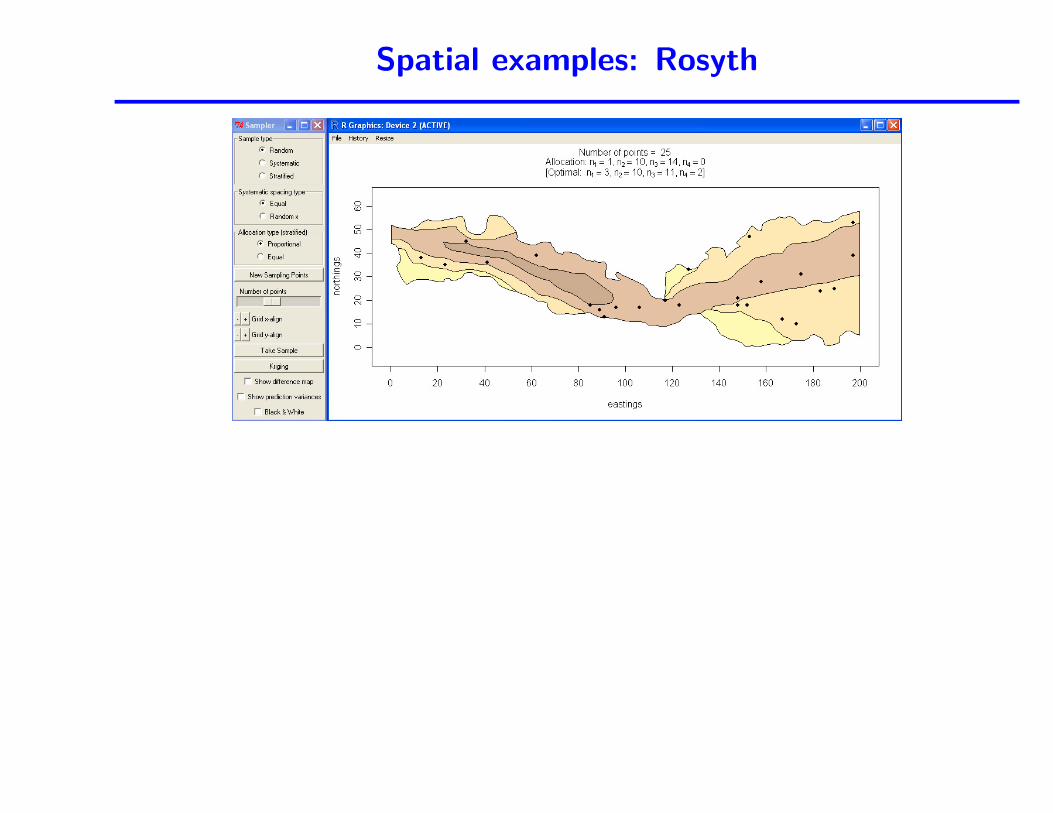
Spatial examples: Rosyth
Current developments
Current developments
- multi-line text box
- combo box
- pos/grid
- tabbed notebook
- fonts
- slider group
...
- essentially all BWidgets and TkTable
- More Cartoons

-
What
- what i’ll talk about, widgets and their uses
- cartoons explanation
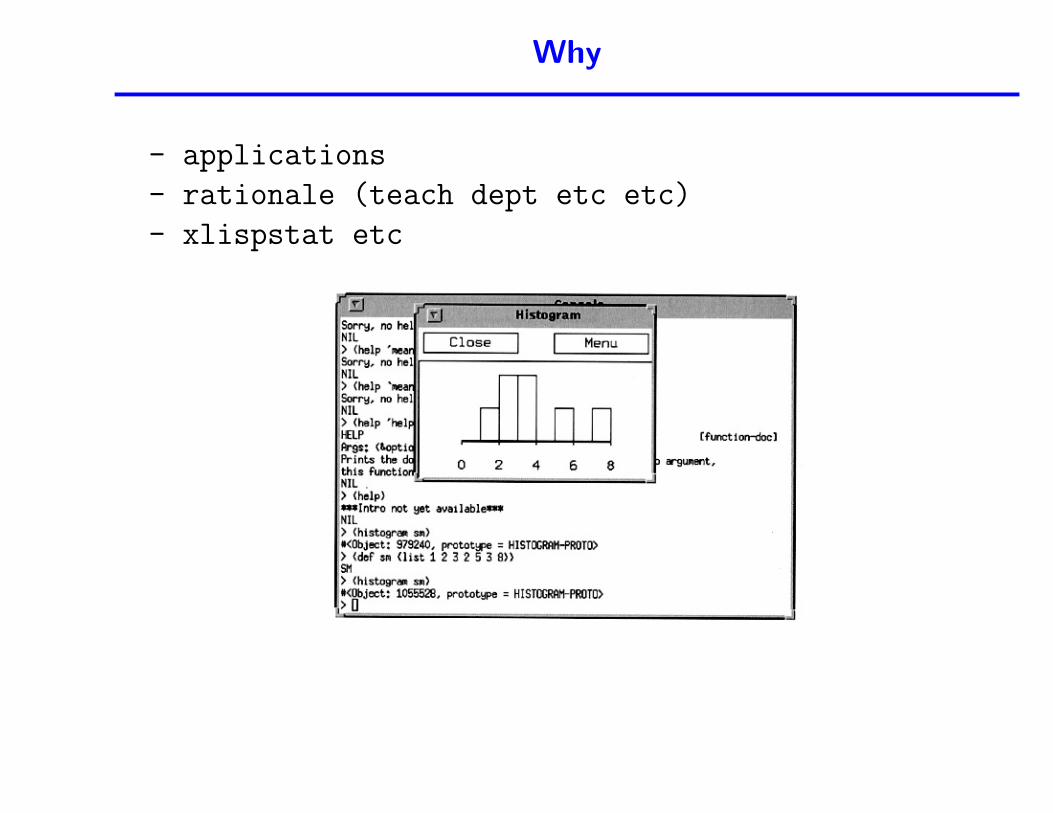
Why
- applications
- rationale (teach dept etc etc)
- xlispstat etc
soa2
Big heading: RGtk2
Sub heading: GTK+
Project page:
http://www.gtk.org
An example of what can be done with GTK+, The GIMP
Illustrated by image
soa2
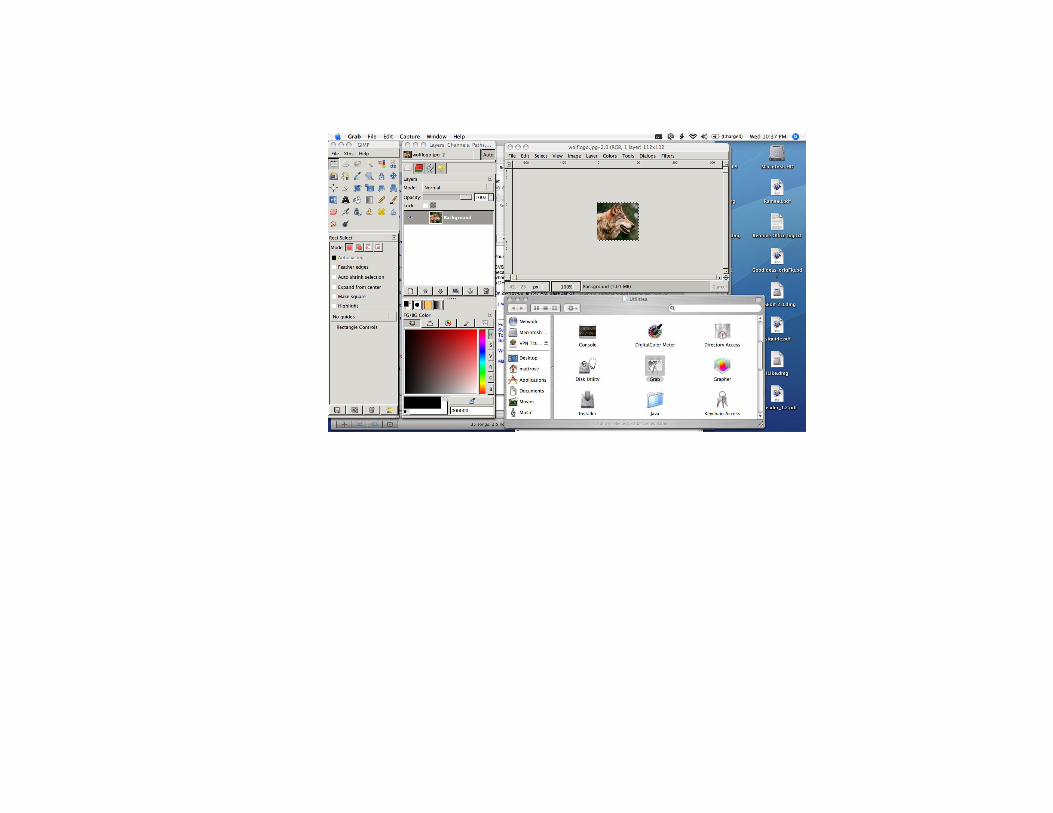
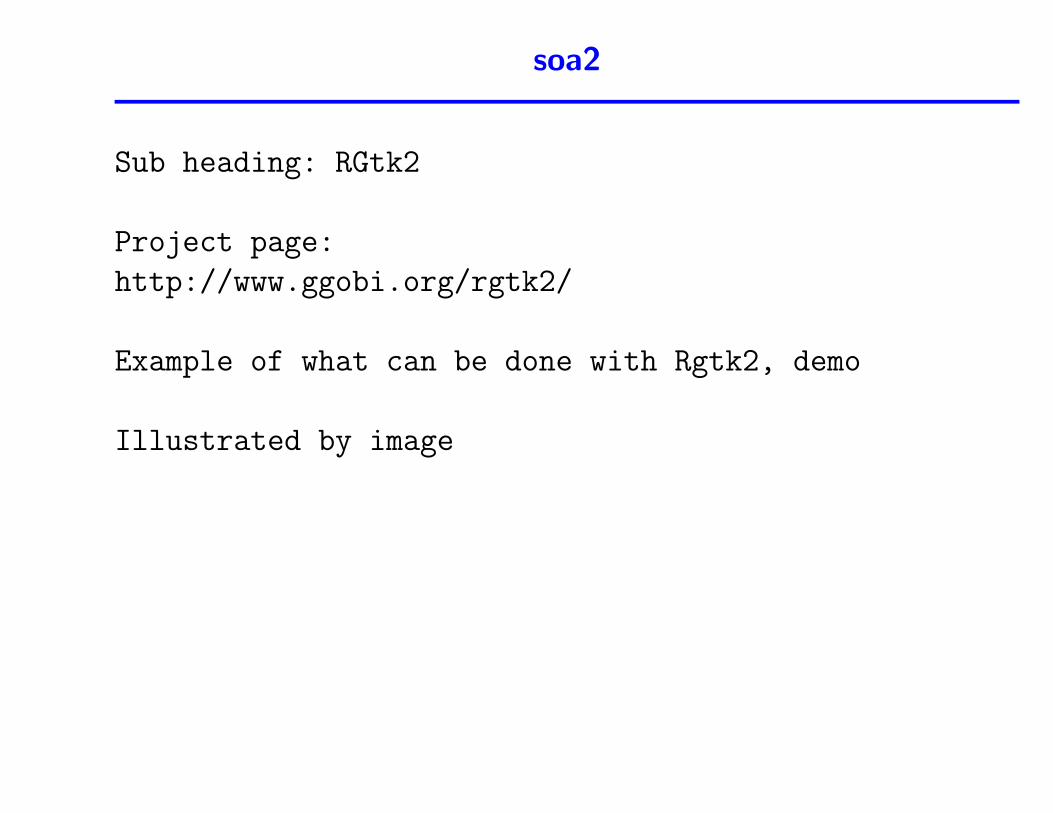
Sub heading: RGtk2
Project page:
http://www.ggobi.org/rgtk2/
Example of what can be done with Rgtk2, demo
Illustrated by image
soa2
** Third slide: (May not all fit on the one slide, see my note to you
about omitting the code below)
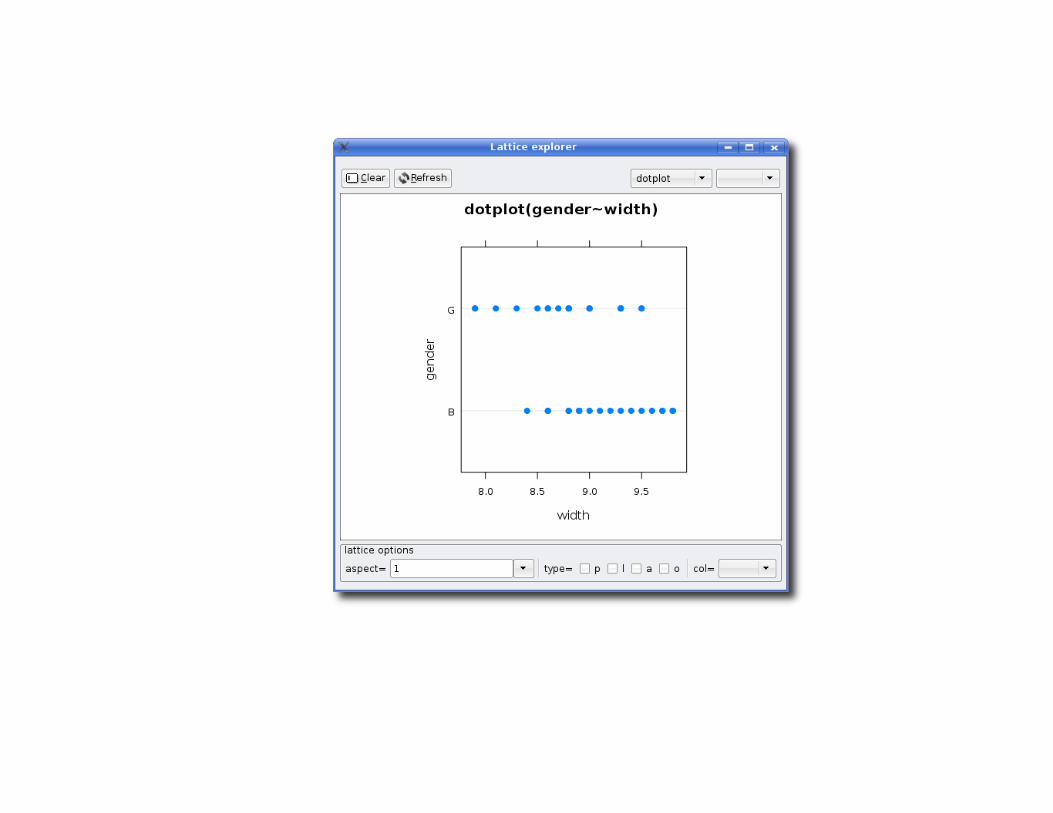
Big heading: Gwidgets
Project page:
http://wiener.math.csi.cuny.edu/pmg/gWidgets
Illustrated by images
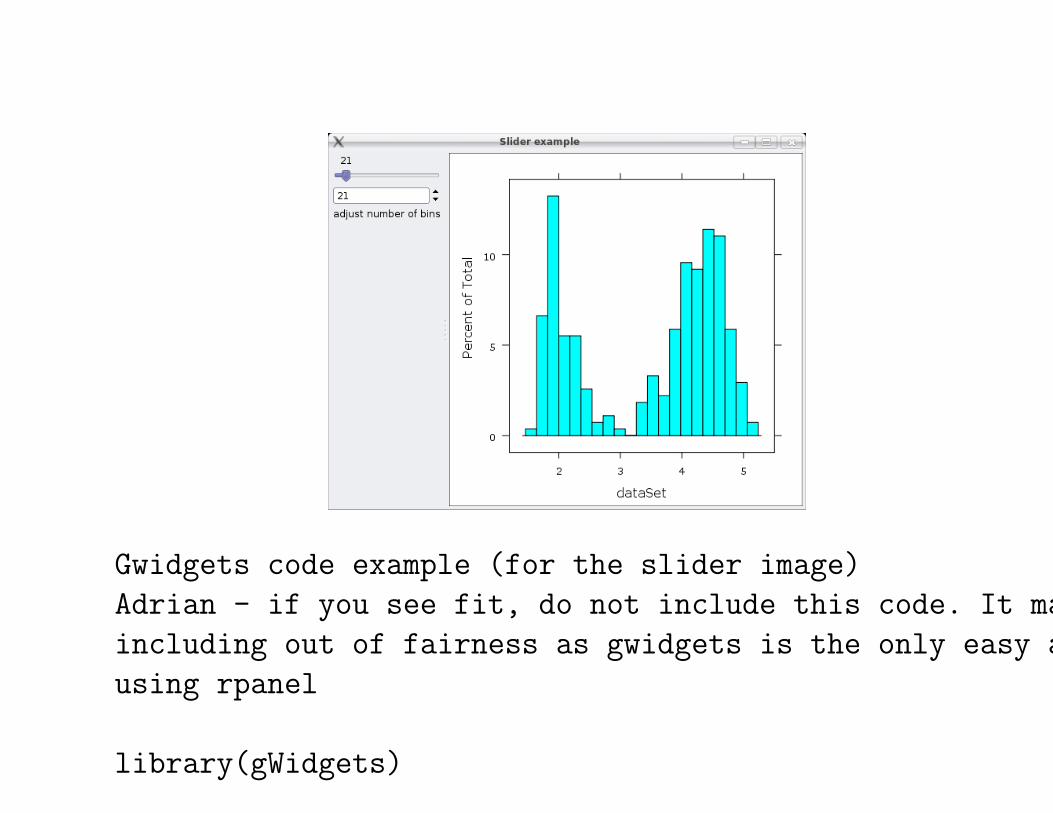
Gwidgets code example (for the slider image)
Adrian - if you see fit, do not include this code. It may be worth
including out of fairness as gwidgets is the only easy alternative to
using rpanel
library(gWidgets)
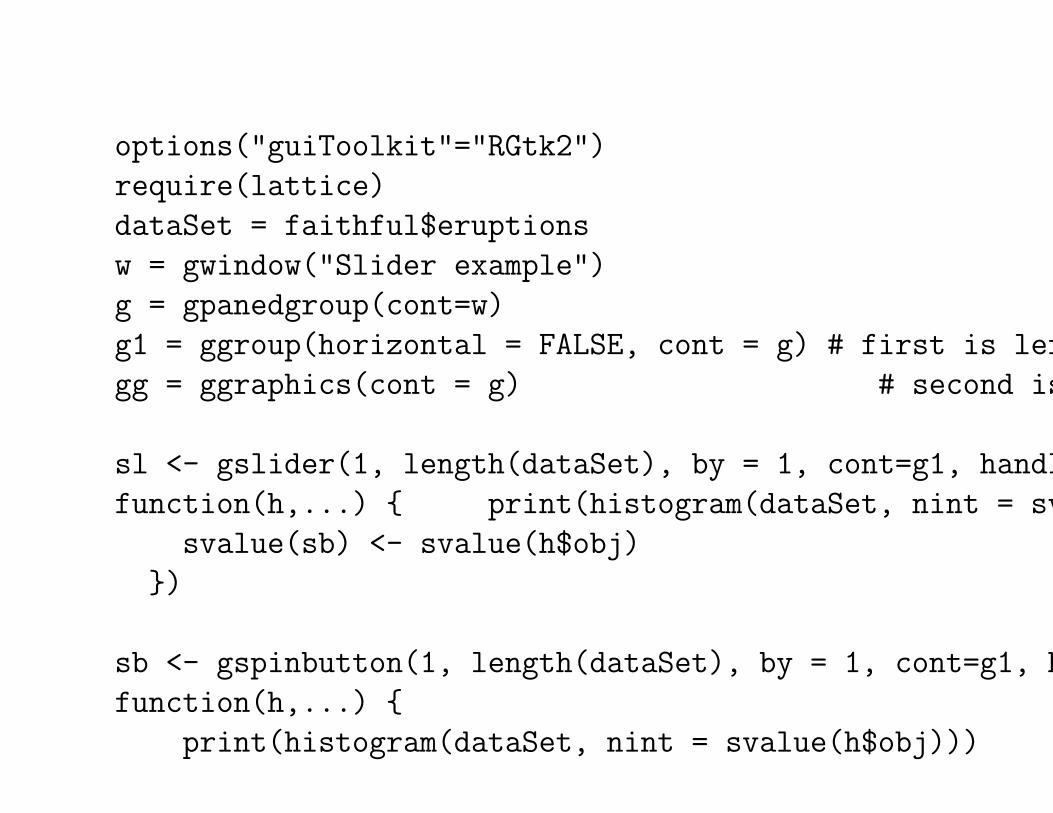
options("guiToolkit"="RGtk2")
require(lattice)
dataSet = faithful$eruptions
w = gwindow("Slider example")
g = gpanedgroup(cont=w)
g1 = ggroup(horizontal = FALSE, cont = g) # first is left
gg = ggraphics(cont = g) # second is right
sl <- gslider(1, length(dataSet), by = 1, cont=g1, handler =
function(h,...) { print(histogram(dataSet, nint = svalue(h$obj)))
svalue(sb) <- svalue(h$obj)
})
sb <- gspinbutton(1, length(dataSet), by = 1, cont=g1, handler =
function(h,...) {
print(histogram(dataSet, nint = svalue(h$obj)))
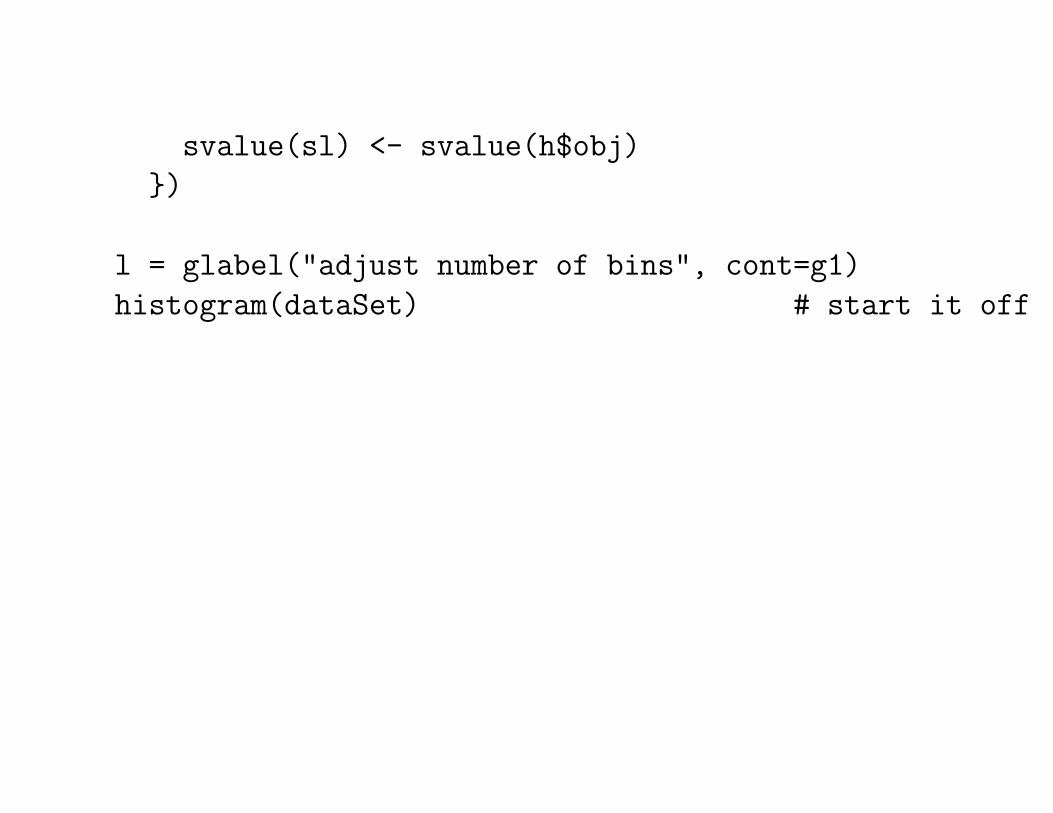
svalue(sl) <- svalue(h$obj)
})
l = glabel("adjust number of bins", cont=g1)
histogram(dataSet) # start it off
soa2
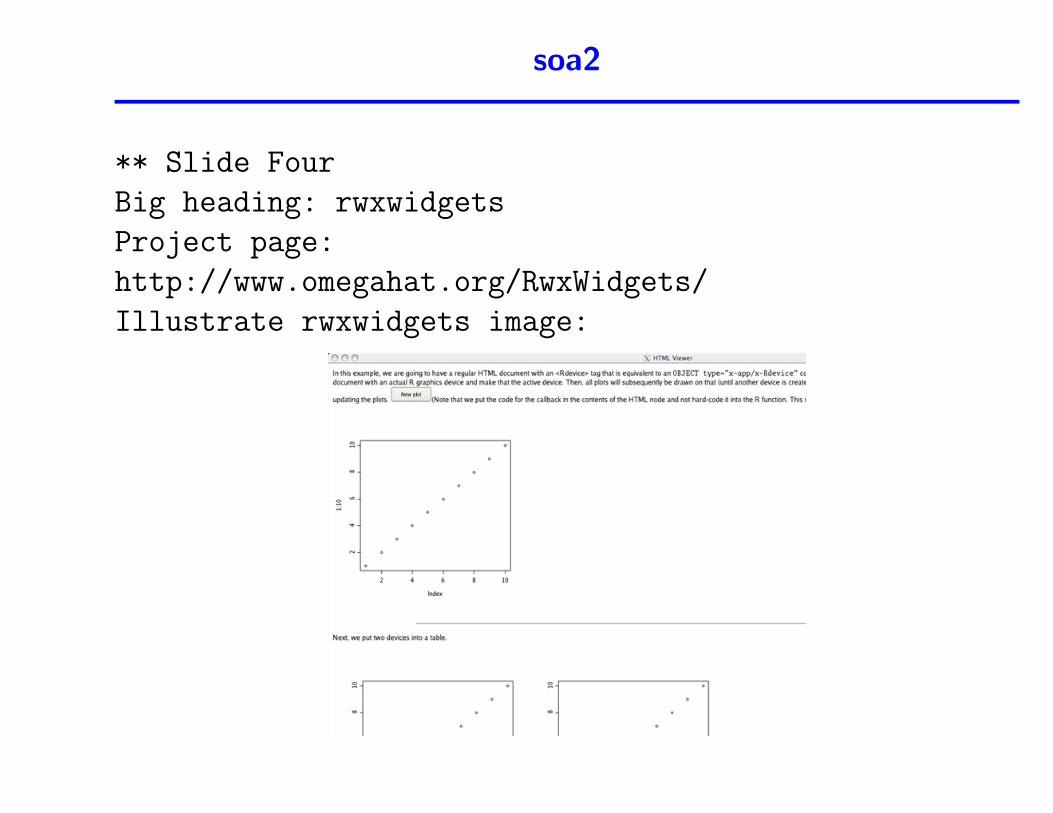
** Slide Four
Big heading: rwxwidgets
Project page:
http://www.omegahat.org/RwxWidgets/
Illustrate rwxwidgets image:
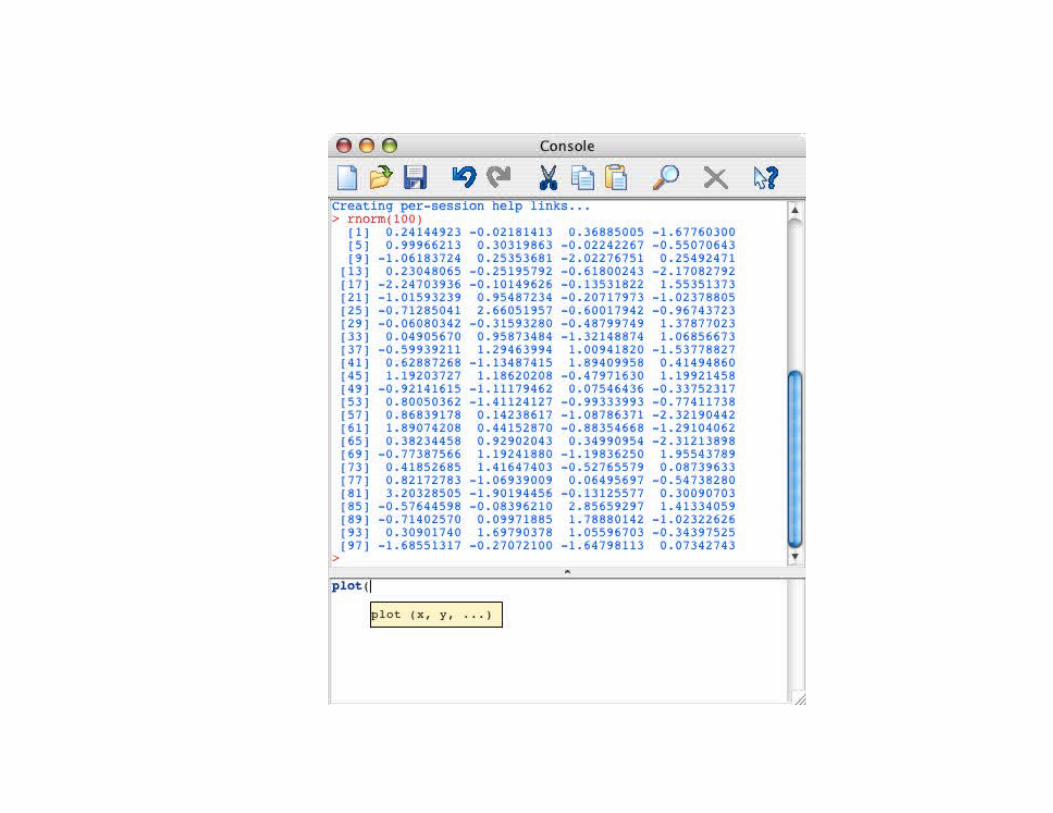
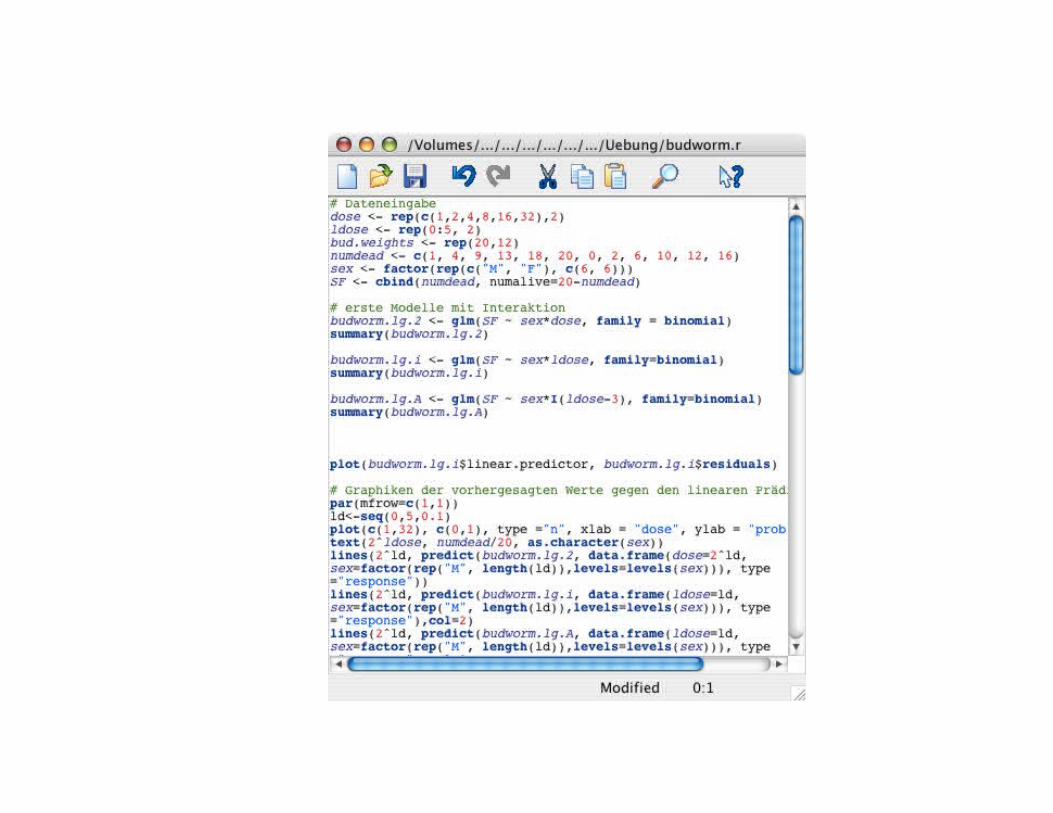
** Slide Five
Big heading: JGR
Project page:
http://rosuda.org/JGR/
Illustrations:
** Slide Five
** Slide Six
rtcltk
Pages:
http://bioinf.wehi.edu.au/~wettenhall/RTclTkExamples/
Illustative image: rtcltk_editbox2.jpg
soa
- ---as per lanc --- - get images -
+ new -> Playwith
method
- who did what
- adrian b, simon urbanek, gavin, richard b
- tcl/tk and internals
- list of controls/widgets/facilities (but not exhaustive?)
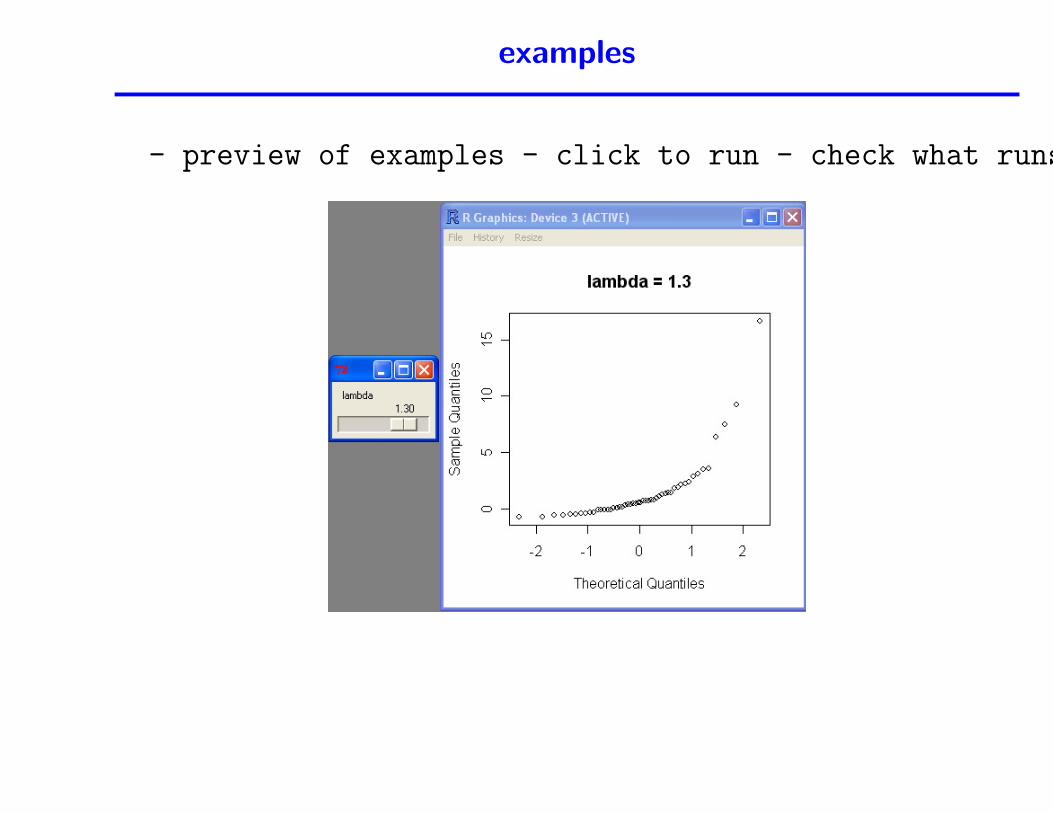
examples
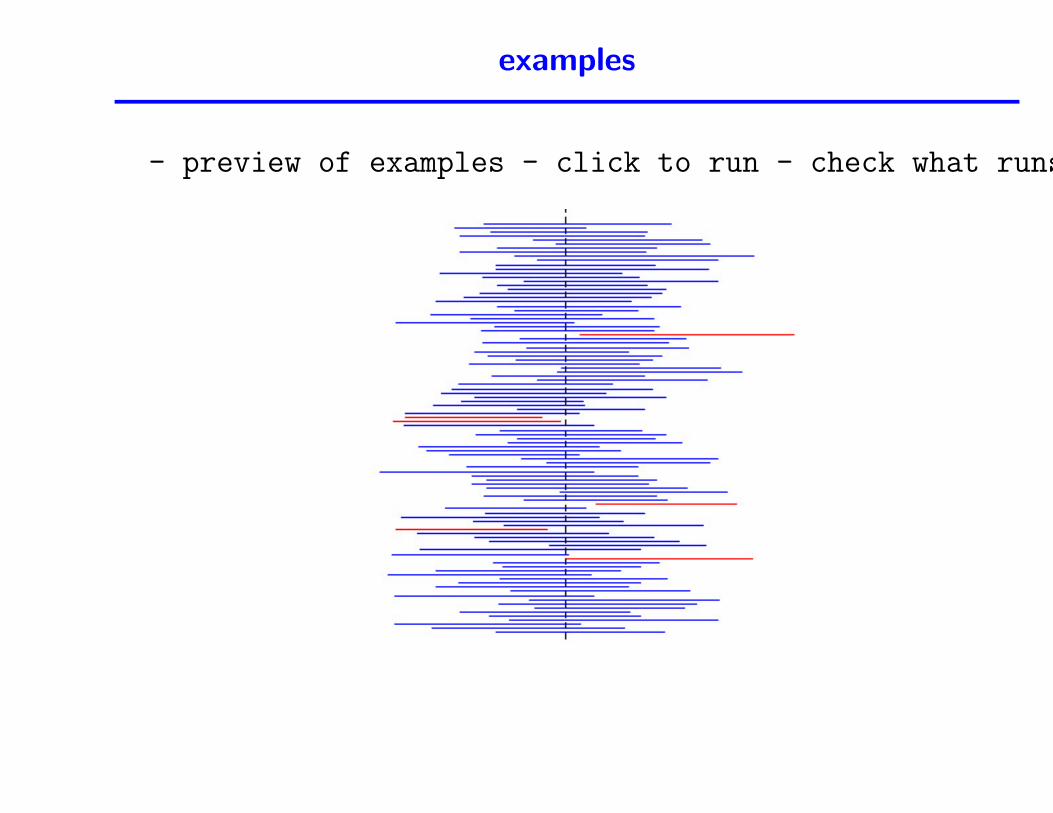
- preview of examples - click to run - check what runs -

examples
- preview of examples - click to run - check what runs -

examples
- tables(panel)

examples
- normal fitting
examples
- preview of examples - click to run - check what runs -

examples
- regression 1d
examples
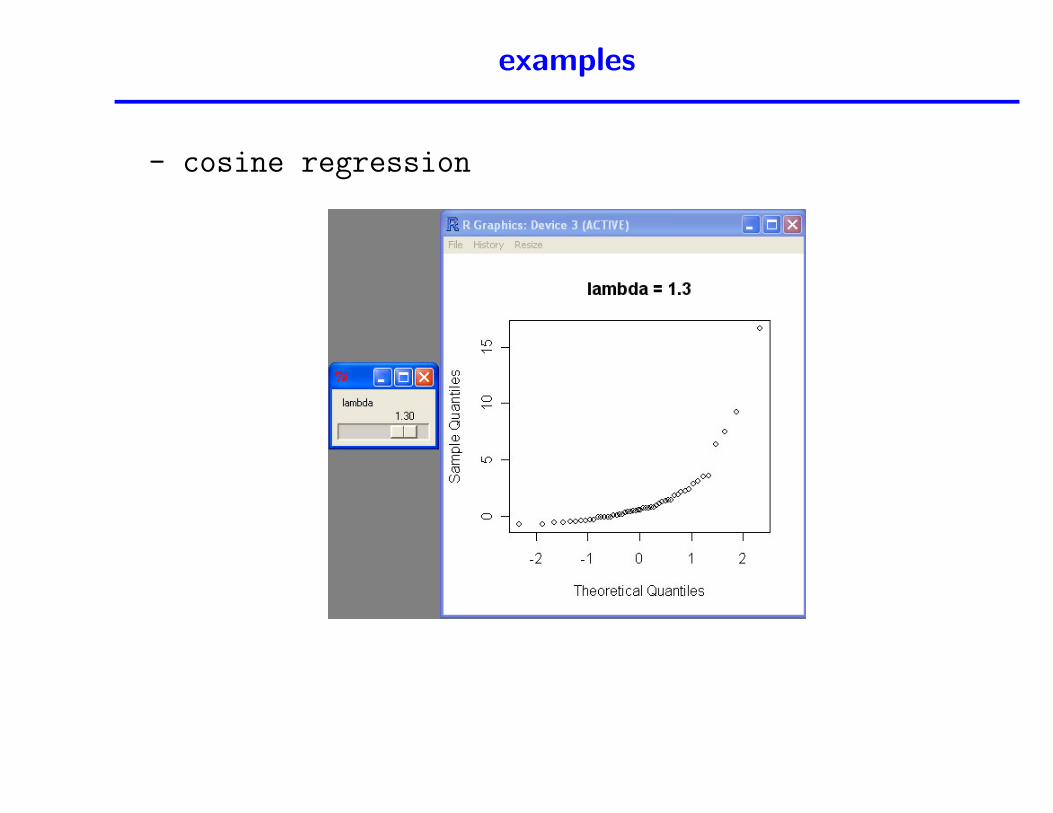
- cosine regression
examples
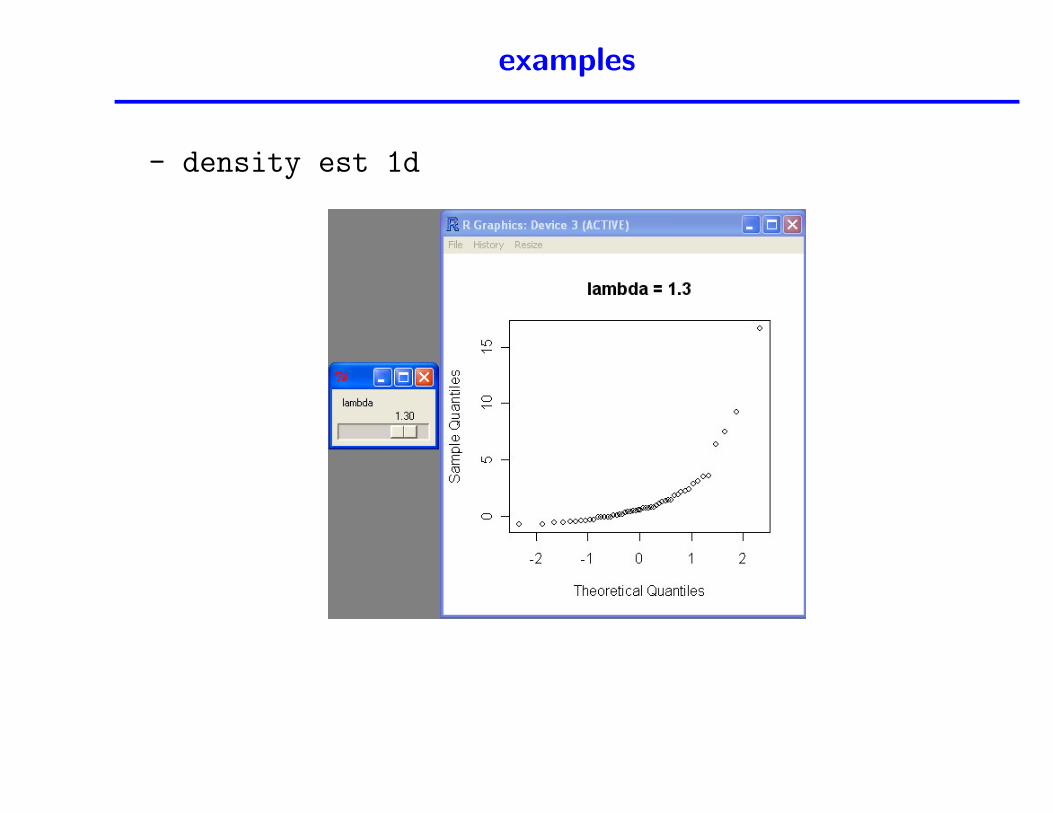
- density est 1d

examples
- gulls

examples
- clyde map

examples
- spatial sim
examples
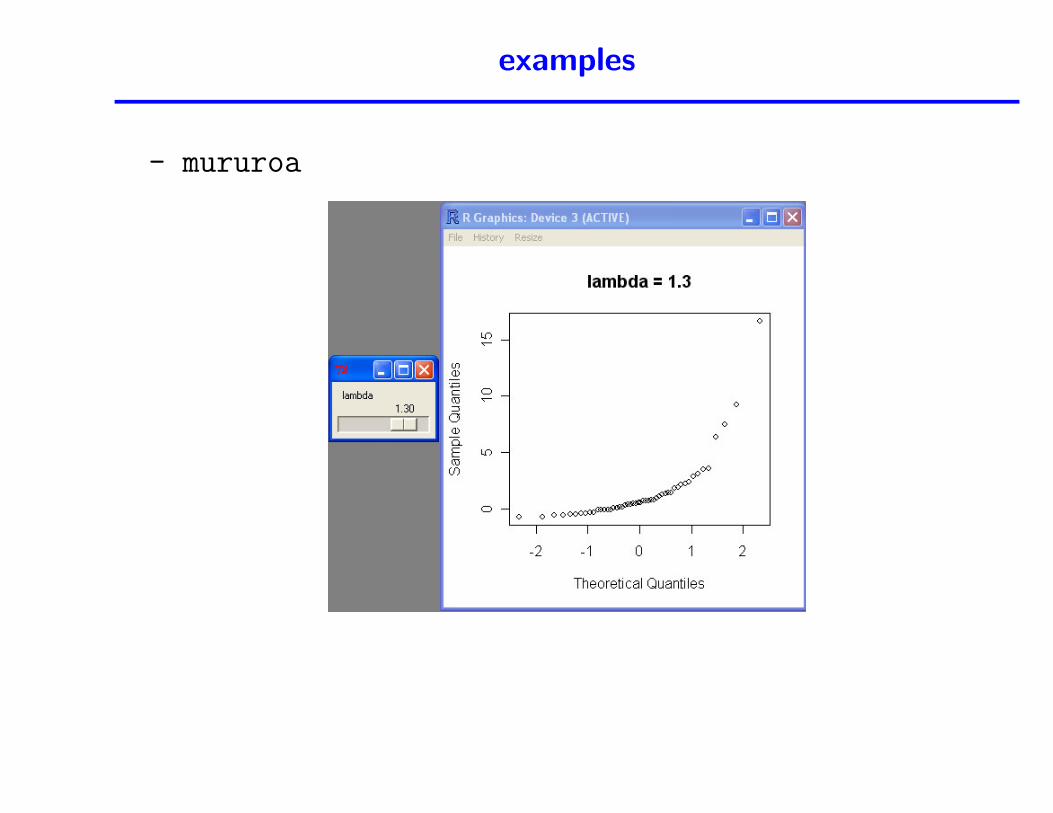
- mururoa

examples
- rosyth
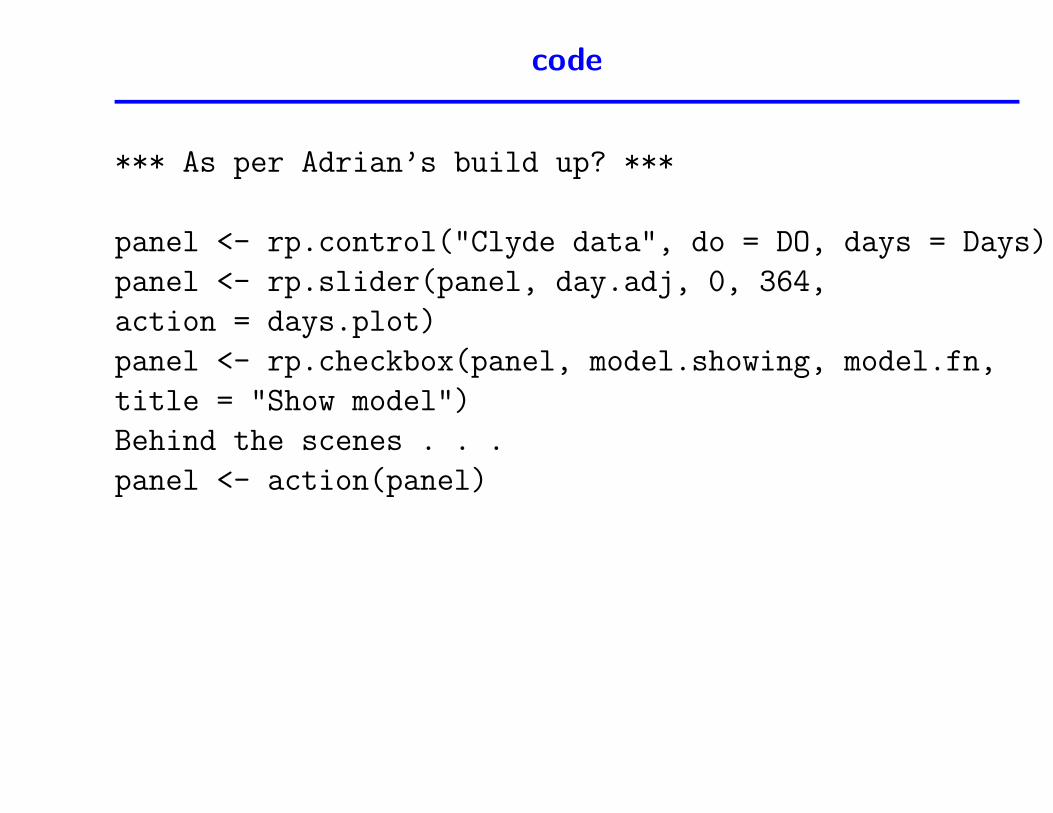
code
*** As per Adrian’s build up? ***
panel <- rp.control("Clyde data", do = DO, days = Days)
panel <- rp.slider(panel, day.adj, 0, 364,
action = days.plot)
panel <- rp.checkbox(panel, model.showing, model.fn,
title = "Show model")
Behind the scenes . . .
panel <- action(panel)
reaction
- discuss with AB
- applications
discussion
- my comments, pros, cons
- future plans
- pos, grid, notebook, combo ...

Web site
www.stats.gla.ac.uk/~adrian/rpanel