Embed Size (px)
Citation preview

STATISTICAL CENTER OF IRAN STATISTICAL CENTER OF IRAN
www.amar.org.ir Statistical Centre of Iran

NUMBERS AND GROWTHNUMBERS AND GROWTHNUMBERS AND GROWTH NUMBERS AND GROWTH OF POPULATIONOF POPULATION
www.amar.org.ir Statistical Centre of Iran
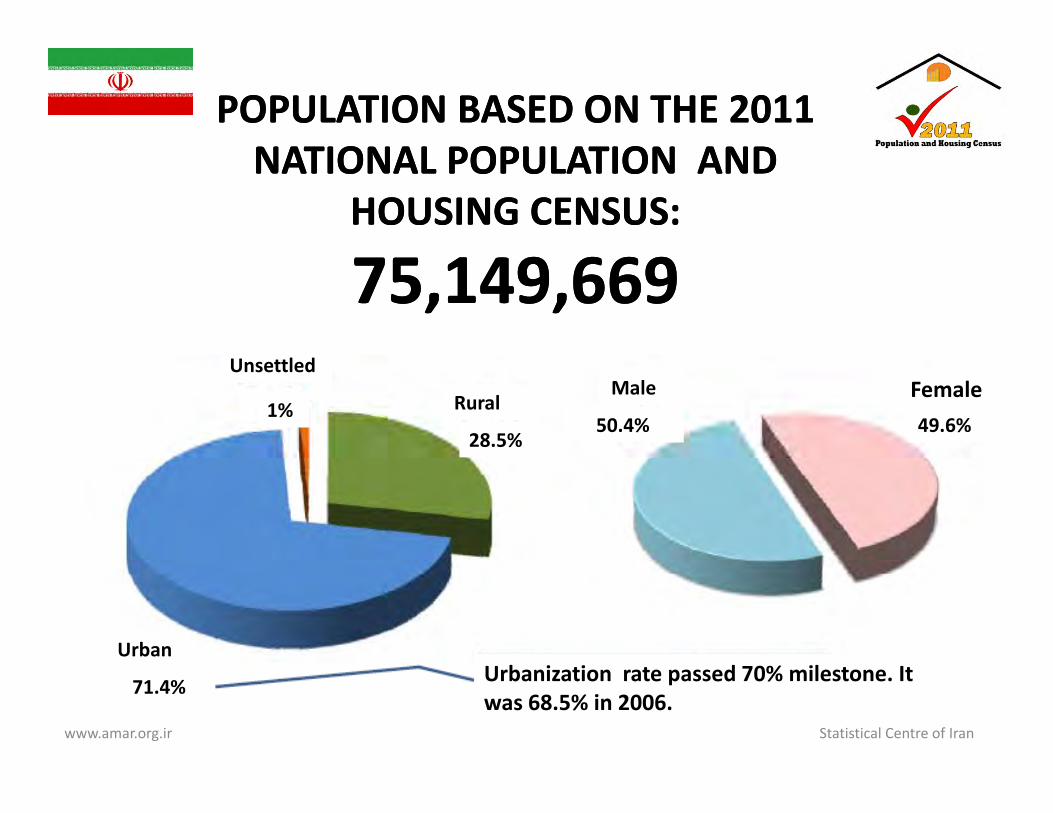
POPULATION BASED ON THE POPULATION BASED ON THE 2011 2011 NATIONAL POPULATION ANDNATIONAL POPULATION ANDNATIONAL POPULATION AND NATIONAL POPULATION AND
HOUSING CENSUS:HOUSING CENSUS:
7575,,149149,,669 669 Unsettled
1% Rural
28.5%
Male
50.4%
Female49.6%
Urban
71.4% Urbanization rate passed 70% milestone. It was 68.5% in 2006.
www.amar.org.ir Statistical Centre of Iran

POPULATION AND HOUSEHOLD:POPULATION AND HOUSEHOLD:19761976‐‐20112011Household
sizeHouseholdSex ratioFemaleMalePopulationYear
size
3.5521,185,64710237,244,00037,905,66975,149,6692011
4.0317,501,77110434,629,42035,866,36270,495,7822006
4.8412,398,23510329,540,32930,515,15960,055,4881996
5 119 673 93110524 164 04925 280 96149 445 010 5.119,673,93110524,164,04925,280,96149,445,0101986
5.026,711,62810616,352,39717,356,34733,708,7441976 , ,106, ,, ,, ,1976
www.amar.org.ir Statistical Centre of Iran
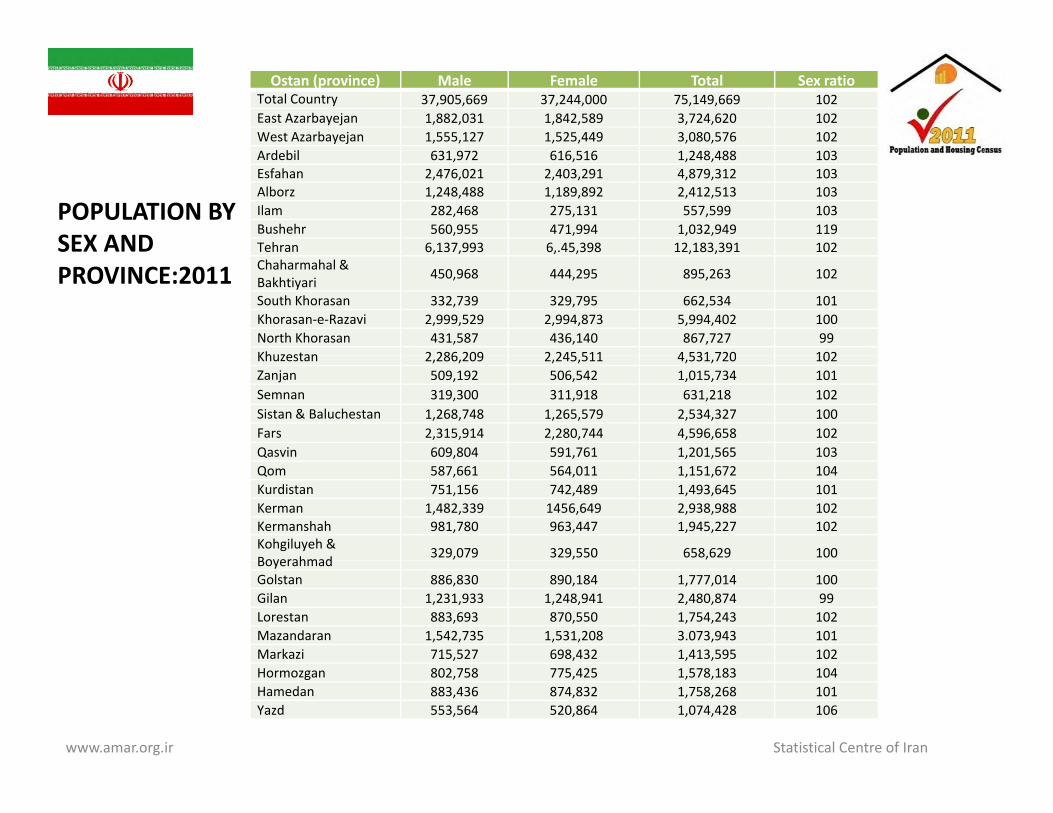
Ostan (province) Male Female Total Sex ratioTotal Country 37,905,669 37,244,000 75,149,669 102East Azarbayejan 1,882,031 1,842,589 3,724,620 102West Azarbayejan 1,555,127 1,525,449 3,080,576 102d b l
POPULATION BY SEX AND
Ardebil 631,972 616,516 1,248,488 103Esfahan 2,476,021 2,403,291 4,879,312 103Alborz 1,248,488 1,189,892 2,412,513 103Ilam 282,468 275,131 557,599 103Bushehr 560,955 471,994 1,032,949 119Tehran 6,137,993 6,.45,398 12,183,391 102
PROVINCE:2011, , , , , ,
Chaharmahal &Bakhtiyari 450,968 444,295 895,263 102
South Khorasan 332,739 329,795 662,534 101Khorasan‐e‐Razavi 2,999,529 2,994,873 5,994,402 100North Khorasan 431,587 436,140 867,727 99Khuzestan 2 286 209 2 245 511 4 531 720 102Khuzestan 2,286,209 2,245,511 4,531,720 102Zanjan 509,192 506,542 1,015,734 101Semnan 319,300 311,918 631,218 102Sistan & Baluchestan 1,268,748 1,265,579 2,534,327 100Fars 2,315,914 2,280,744 4,596,658 102Qasvin 609,804 591,761 1,201,565 103Q , , , ,Qom 587,661 564,011 1,151,672 104Kurdistan 751,156 742,489 1,493,645 101Kerman 1,482,339 1456,649 2,938,988 102Kermanshah 981,780 963,447 1,945,227 102Kohgiluyeh & Boyerahmad 329,079 329,550 658,629 100BoyerahmadGolstan 886,830 890,184 1,777,014 100Gilan 1,231,933 1,248,941 2,480,874 99Lorestan 883,693 870,550 1,754,243 102Mazandaran 1,542,735 1,531,208 3.073,943 101Markazi 715,527 698,432 1,413,595 102
www.amar.org.ir Statistical Centre of Iran
Hormozgan 802,758 775,425 1,578,183 104Hamedan 883,436 874,832 1,758,268 101Yazd 553,564 520,864 1,074,428 106
IlamLorestan
Gilan 0 640.62
0.440.430.33 Ardebil
H dEast AzarbayejanKermanshahKurdistan
Kohgiluyeh & BoyerahmadS h Kh0 81
0.760.730.690.660.64 Hamedan
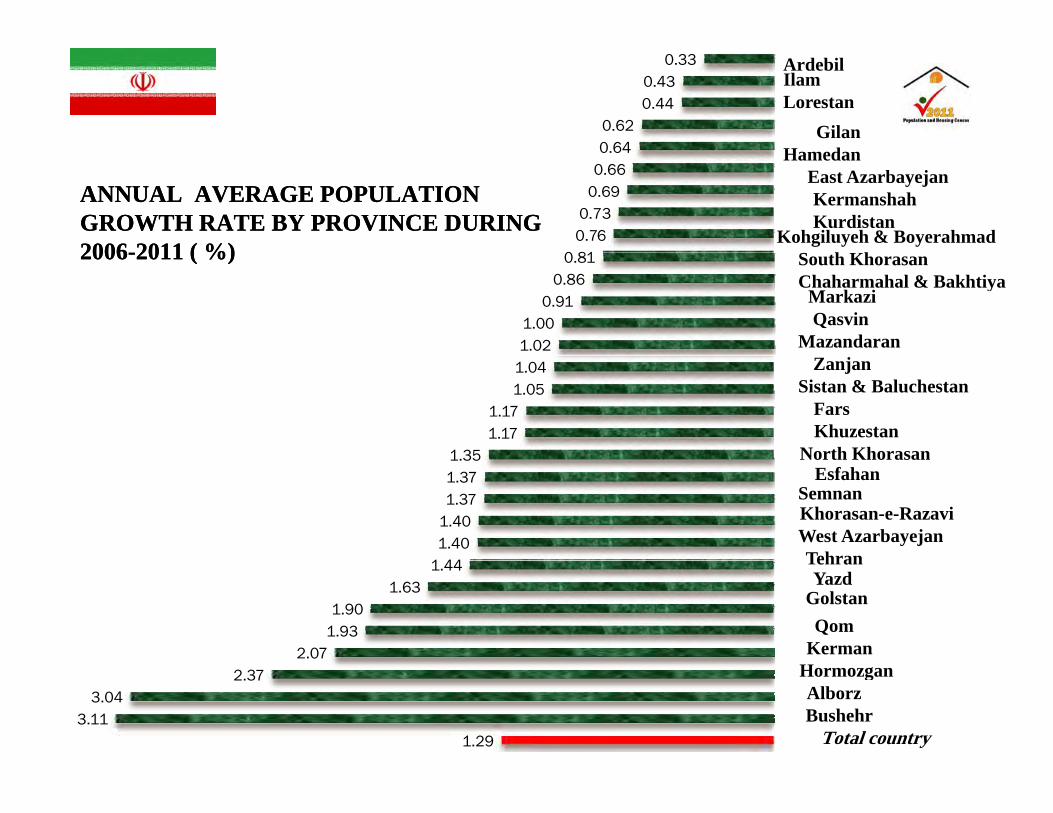
ANNUALANNUAL AVERAGE POPULATION AVERAGE POPULATION GROWTH RATE BY PROVINCE DURINGGROWTH RATE BY PROVINCE DURING20062006--20112011 ( %)( %) South Khorasan
Chaharmahal & BakhtiyaMarkaziQasvin
Mazandaran1.021.000.910.860.8120062006--2011 2011 ( %)( %)
ZanjanSistan & Baluchestan
FarsKhuzestan
North Khorasan1 351.171.171.051.04
North KhorasanEsfahan
SemnanKhorasan-e-RazaviWest AzarbayejanTehran1 44
1.401.401.371.371.35
TehranYazd
GolstanQom
Kerman2.071.931.90
1.631.44
HormozganAlborzBushehr
1.293.113.04
2.37
Total country
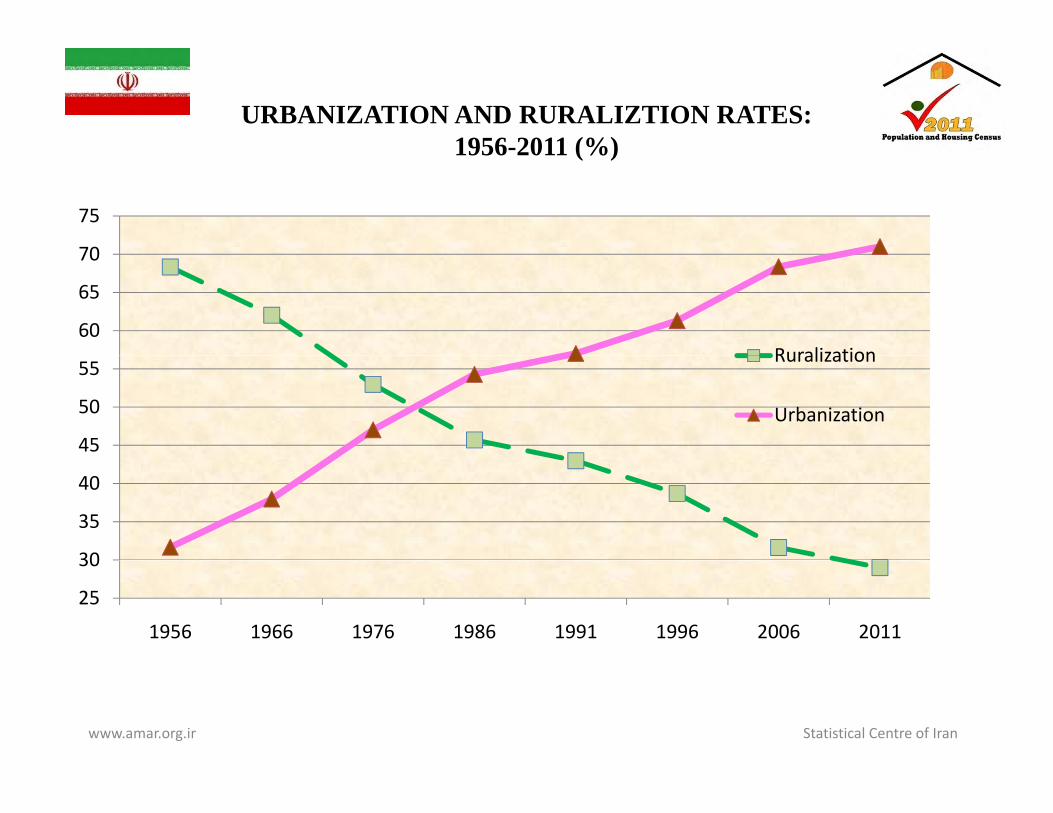
URBANIZATION AND RURALIZTION RATES:1956-2011 (%)1956-2011 (%)
70
75
60
65
70
Ruralization
45
50
55Ruralization
Urbanization
30
35
40
25
30
1956 1966 1976 1986 1991 1996 2006 2011
www.amar.org.ir Statistical Centre of Iran

13311400
NUMBER OF CITIES IN THE COUNTRY:1956‐2011
1012
800
1000
1200
201 271373
496612
400
600
800
201
0
200
1956 1966 1976 1986 1996 2006 2011
In 2011, 8 cities ( Tehran, Mashhad, Karaj, Esfahan, Tabriz, Shiraz, Ahvaz and Qom) have population of over one million.
1956 1966 1976 1986 1996 2006 2011
www.amar.org.ir Statistical Centre of Iran
In the 2011 National Population and Housing Census, city means each of geographic locality that has a municipality .
4346
45
50
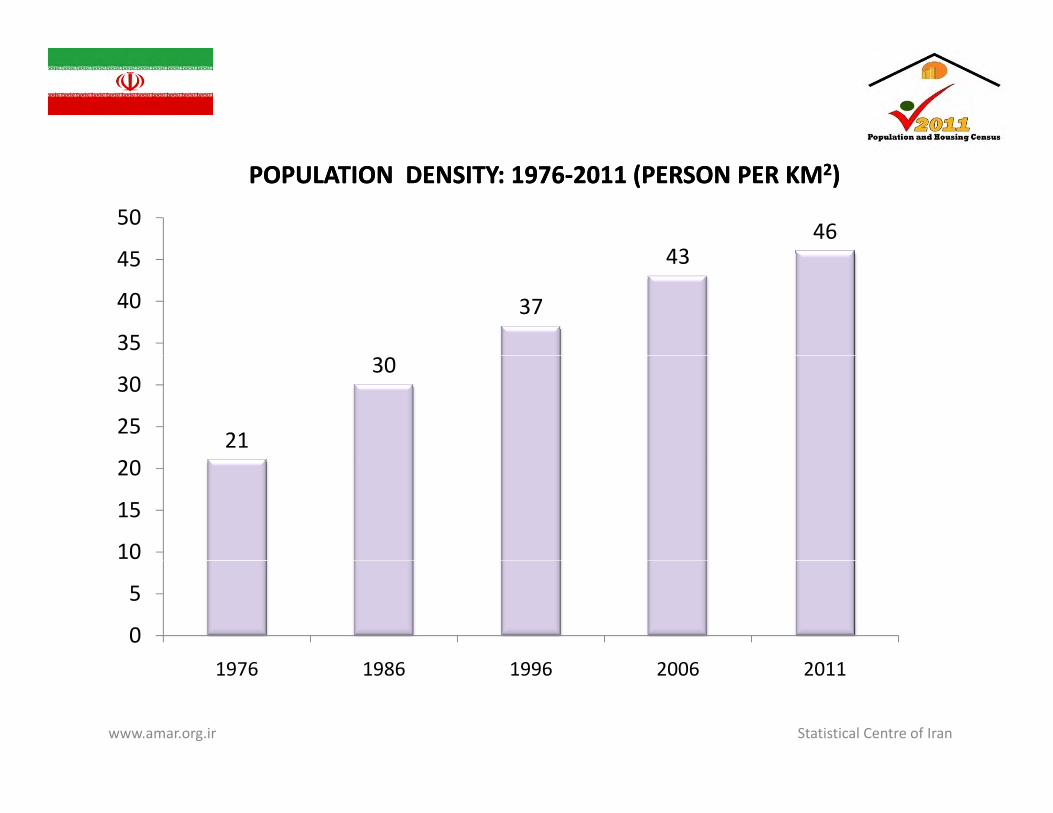
POPULATION DENSITY: POPULATION DENSITY: 19761976‐‐2011 2011 ((PERSON PER PERSON PER KMKM22))
37
43
35
40
45
21
30
25
30
10
15
20
0
5
1976 1986 1996 2006 2011
www.amar.org.ir Statistical Centre of Iran
1976 1986 1996 2006 2011
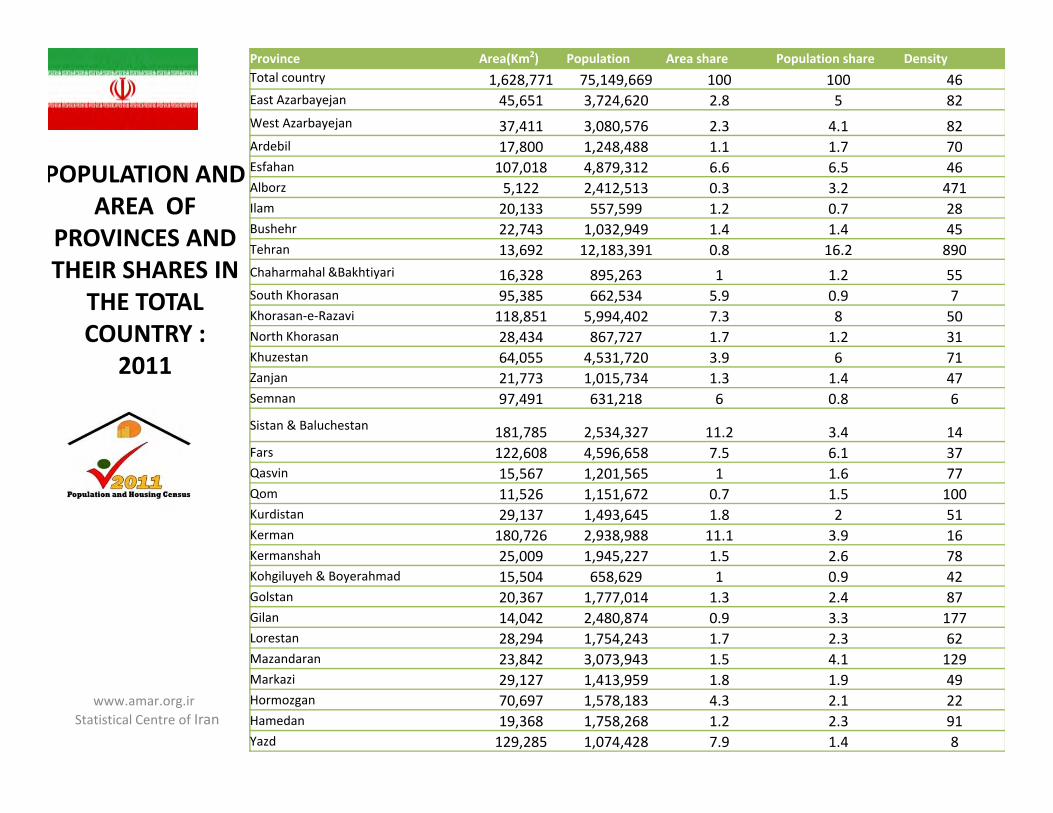
Province Area(Km2) Population Area share Population share Density Total country 1,628,771 75,149,669 100 100 46East Azarbayejan 45,651 3,724,620 2.8 5 82West Azarbayejan 37,411 3,080,576 2.3 4.1 82Ardebil 17,800 1,248,488 1.1 1.7 70Ardebil 17,800 1,248,488 1.1 1.7 70Esfahan 107,018 4,879,312 6.6 6.5 46Alborz 5,122 2,412,513 0.3 3.2 471Ilam 20,133 557,599 1.2 0.7 28Bushehr 22,743 1,032,949 1.4 1.4 45Tehran 13 692 12 183 391 0 8 16 2 890
POPULATION AND AREA OF
PROVINCES AND Tehran 13,692 12,183,391 0.8 16.2 890Chaharmahal &Bakhtiyari 16,328 895,263 1 1.2 55South Khorasan 95,385 662,534 5.9 0.9 7Khorasan‐e‐Razavi 118,851 5,994,402 7.3 8 50North Khorasan 28,434 867,727 1.7 1.2 31Khuzestan 64 055 4 531 720 3 9 6 71
THEIR SHARES IN THE TOTAL COUNTRY :
Khuzestan 64,055 4,531,720 3.9 6 71Zanjan 21,773 1,015,734 1.3 1.4 47Semnan 97,491 631,218 6 0.8 6
Sistan & Baluchestan 181,785 2,534,327 11.2 3.4 14Fars 122,608 4,596,658 7.5 6.1 37
2011
,608 ,596,658 5 6 3Qasvin 15,567 1,201,565 1 1.6 77Qom 11,526 1,151,672 0.7 1.5 100Kurdistan 29,137 1,493,645 1.8 2 51Kerman 180,726 2,938,988 11.1 3.9 16Kermanshah 25,009 1,945,227 1.5 2.6 7825,009 1,945,227 1.5 2.6 78Kohgiluyeh & Boyerahmad 15,504 658,629 1 0.9 42Golstan 20,367 1,777,014 1.3 2.4 87Gilan 14,042 2,480,874 0.9 3.3 177Lorestan 28,294 1,754,243 1.7 2.3 62Mazandaran 23,842 3,073,943 1.5 4.1 129a a da a 23,842 3,073,943 1.5 4.1 129Markazi 29,127 1,413,959 1.8 1.9 49Hormozgan 70,697 1,578,183 4.3 2.1 22Hamedan 19,368 1,758,268 1.2 2.3 91Yazd 129,285 1,074,428 7.9 1.4 8
www.amar.org.ir Statistical Centre of Iran
POPULATION COMPOSITION ANDPOPULATION COMPOSITION ANDPOPULATION COMPOSITION AND POPULATION COMPOSITION AND STRUCTURESTRUCTURE
www.amar.org.ir Statistical Centre of Iran

MEAN AGE OF POPULATION BY SEX:MEAN AGE OF POPULATION BY SEX:19761976‐‐20112011
D i ti 20112006199619861976Description
29.8627.9724.0321.722.4Both sexes
29.727.9824.1521.922.6Male
30.0327.9523.921.622.2Female
Mean age is the average age of people in a society.
www.amar.org.ir Statistical Centre of Iran

POPULATION MEDIAN AGE BY SEX:POPULATION MEDIAN AGE BY SEX:19761976‐‐2011 2011
20112006199619861976Description 20112006199619861976Description
2724.7319.4217.0117.4Both sexes
2724.7419.3816.9717.1Male
2724.7219.4517.0417.7Female
The age that divides a population into two numerically equal groups.www.amar.org.ir Statistical Centre of Iran
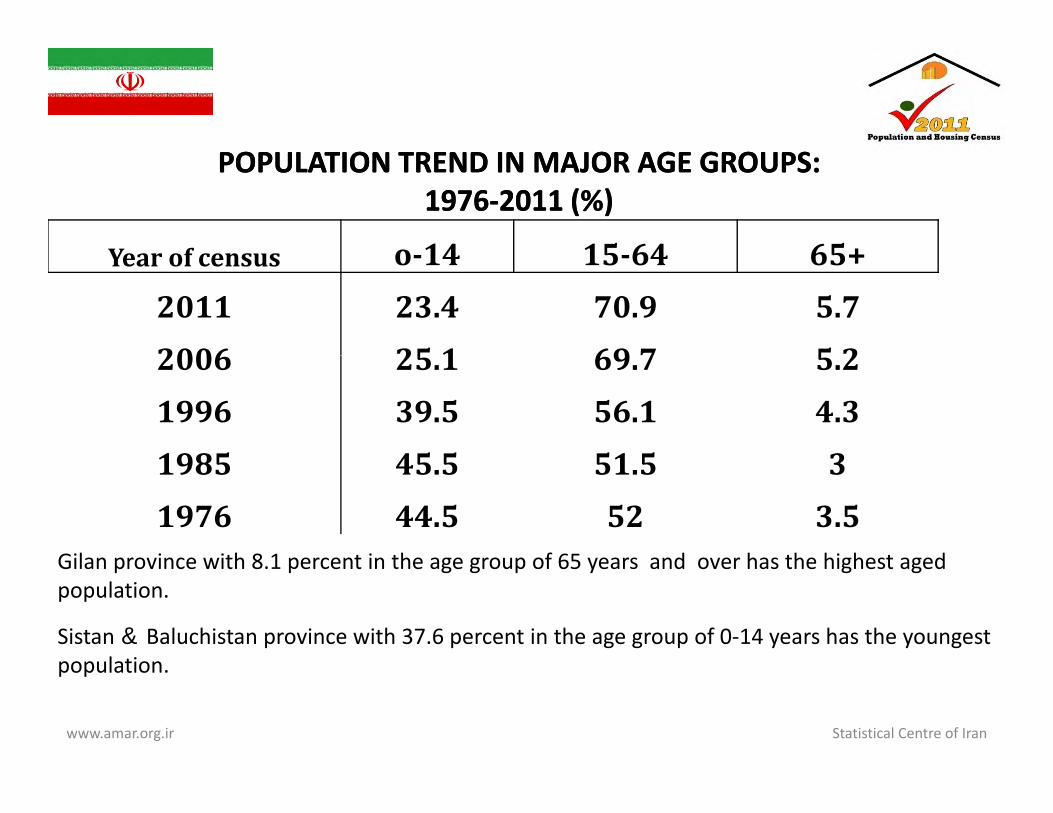
POPULATION TREND IN MAJOR AGE GROUPS:POPULATION TREND IN MAJOR AGE GROUPS:19761976‐‐2011 2011 (%)(%)
65+15 64o 14Y f 65+15‐64o‐14Yearofcensus
5.770.923.420115 269 725 12006 5.269.725.120064.356.139.51996351 545 51985
Gilan province with 8 1 percent in the age group of 65 years and over has the highest aged
351.545.519853.55244.51976
Gilan province with 8.1 percent in the age group of 65 years and over has the highest aged population.
Sistan & Baluchistan province with 37.6 percent in the age group of 0‐14 years has the youngest populationpopulation.
www.amar.org.ir Statistical Centre of Iran
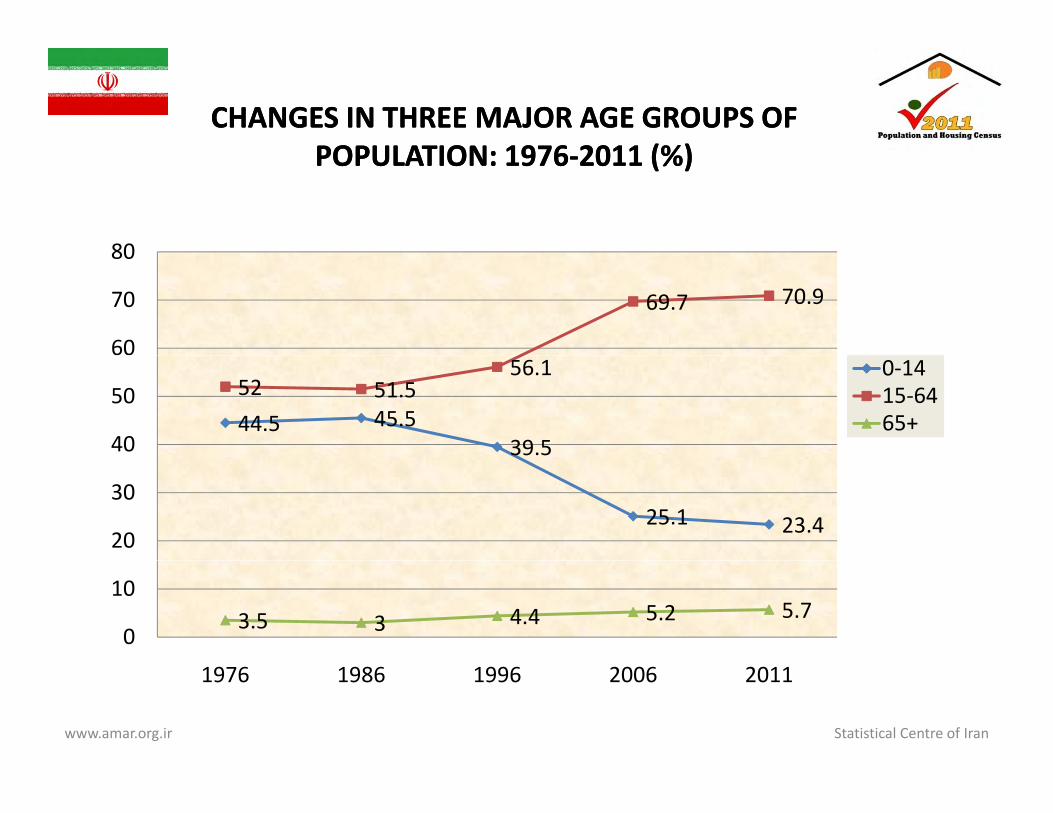
CHANGES IN THREE MAJOR AGE GROUPS OF CHANGES IN THREE MAJOR AGE GROUPS OF POPULATIONPOPULATION 19761976 20112011 (%)(%)POPULATION: POPULATION: 19761976‐‐2011 2011 (%)(%)
80
69.7 70.9
60
70
80
44.5 45.539.5
52 51.556.1
40
500‐1415‐6465+
25.1 23.420
30
3.5 3 4.4 5.2 5.70
10
www.amar.org.ir Statistical Centre of Iran
1976 1986 1996 2006 2011
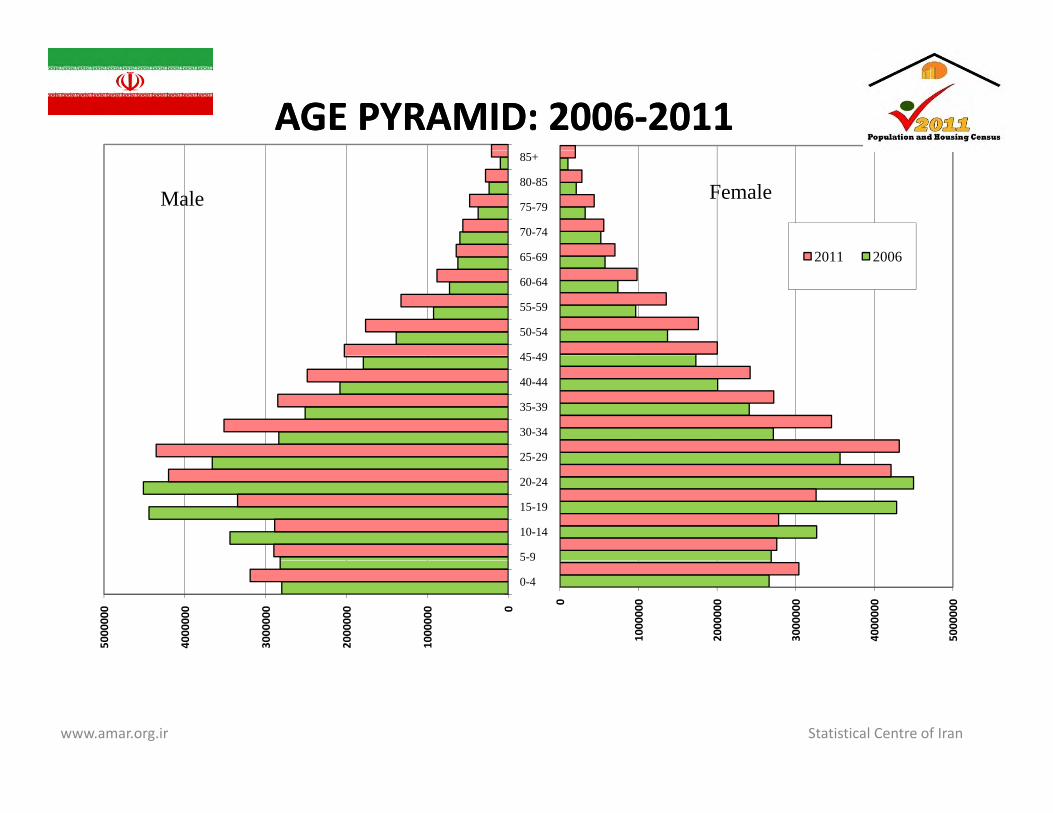
AGE PYRAMID: AGE PYRAMID: 20062006‐‐20112011
2011 200665 69
70-74
75-79
80-85
85+
Male Female
2011 2006
45 49
50-54
55-59
60-64
65-69
25-29
30-34
35-39
40-44
45-49
5-9
10-14
15-19
20-24
25-29
0
1000000
2000000
3000000
4000000
50000000
1000000
2000000
3000000
4000000
5000000
0-4
5 9
www.amar.org.ir Statistical Centre of Iran
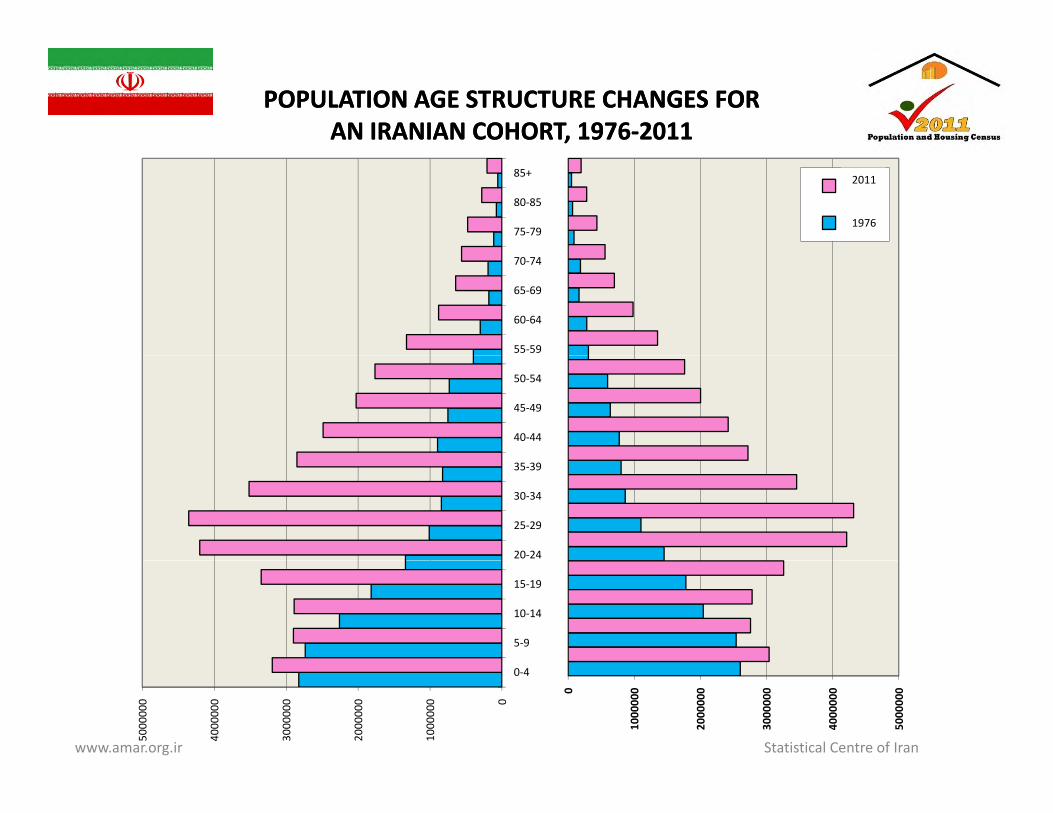
POPULATION AGE STRUCTURE CHANGES FOR POPULATION AGE STRUCTURE CHANGES FOR AN IRANIAN COHORT, AN IRANIAN COHORT, 19761976‐‐20112011
1390
135575‐79
80‐85
85+ 2011
1976
55‐59
60‐64
65‐69
70‐74
40‐44
45‐49
50‐54
20‐24
25‐29
30‐34
35‐39
5‐9
10‐14
15‐19
www.amar.org.ir Statistical Centre of Iran
0
1000000
2000000
3000000
4000000
5000000
0
1000000
2000000
3000000
4000000
5000000
0‐4
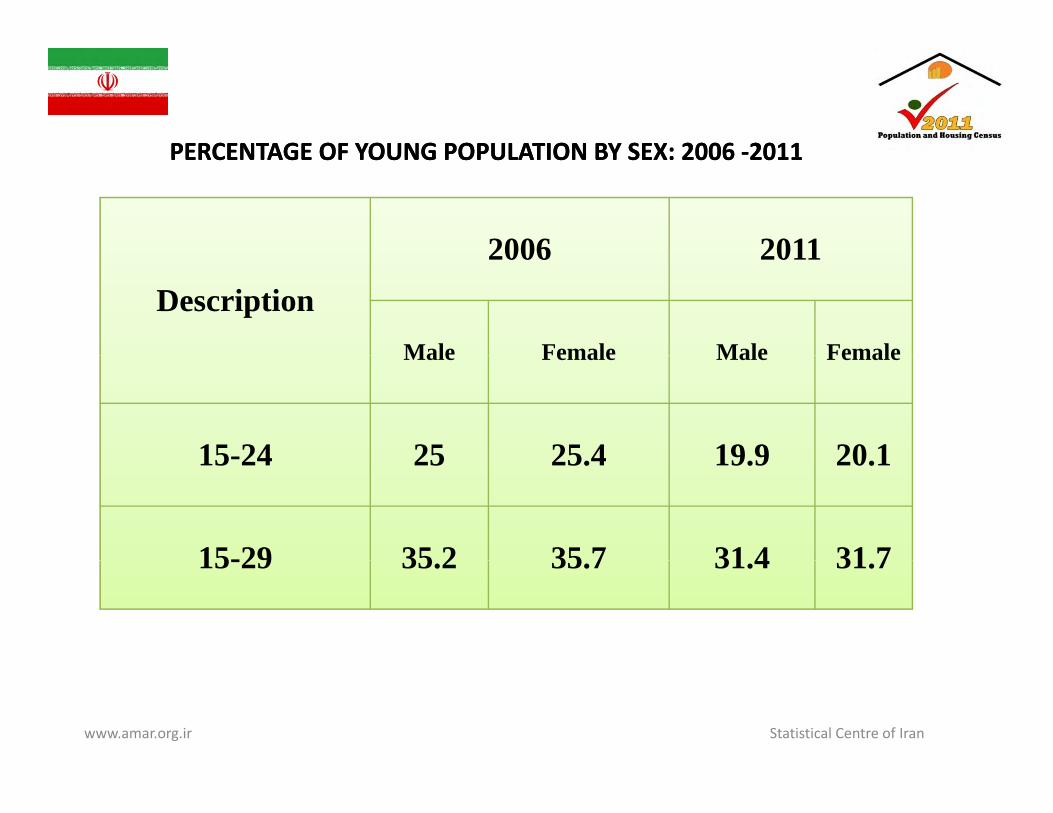
PERCENTAGE OF YOUNG POPULATION BY SEX:PERCENTAGE OF YOUNG POPULATION BY SEX: 20062006 20112011PERCENTAGE OF YOUNG POPULATION BY SEX: PERCENTAGE OF YOUNG POPULATION BY SEX: 2006 2006 ‐‐20112011
20112006 20112006Description
FemaleMaleFemaleMale FemaleMaleFemaleMale
20 119 925 42515-24 20.119.925.42515-24
31 731 435 735 215-29 31.731.435.735.215-29
www.amar.org.ir Statistical Centre of Iran

LIFE EXPECTANCY BY SEX:LIFE EXPECTANCY BY SEX:LIFE EXPECTANCY BY SEX:LIFE EXPECTANCY BY SEX:20062006‐‐20112011
20062011
Year and sexFemaleMaleFemaleMale
73.171.174.672.1Life expectancy
www.amar.org.ir Statistical Centre of Iran

HOUSEHOLD SIZEHOUSEHOLD SIZE AND AN
HEAD OF HOUSEHOLD
www.amar.org.ir Statistical Centre of Iran
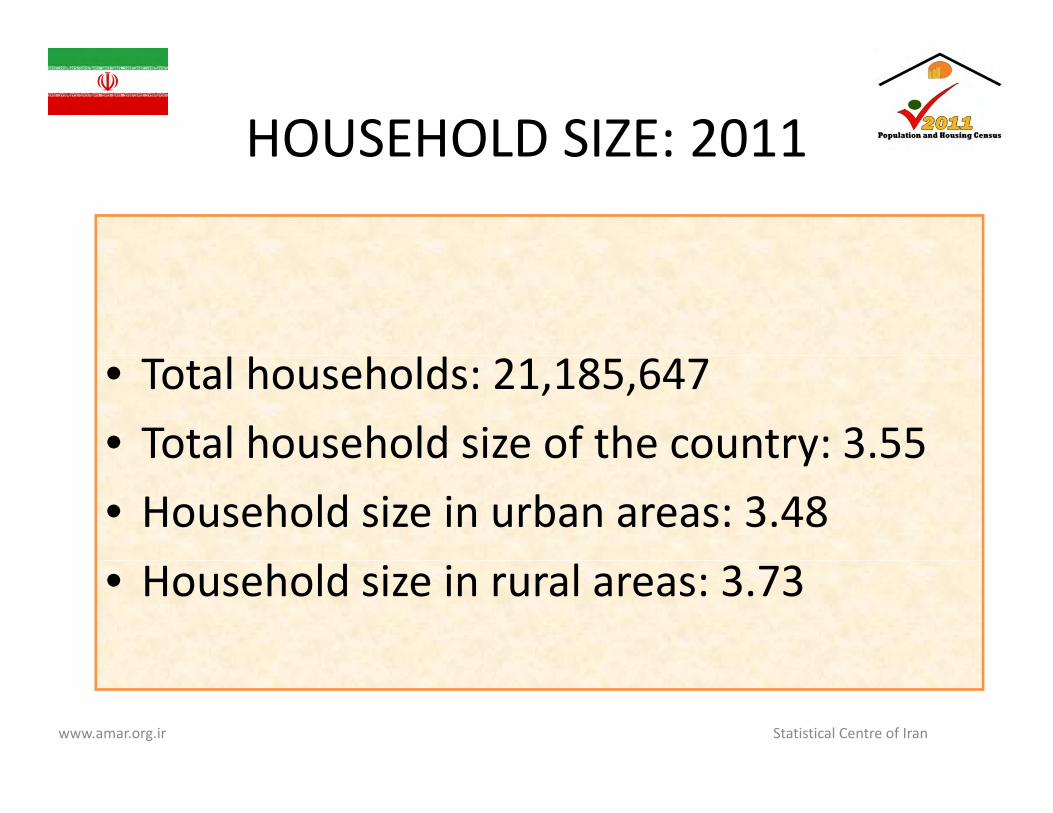
HOUSEHOLD SIZE: 2011HOUSEHOLD SIZE: 2011
• Total households: 21,185,647• Total household size of the country: 3.55ota ouse o d s e o t e cou t y: 3.55• Household size in urban areas: 3.48• Household size in rural areas: 3.73
www.amar.org.ir Statistical Centre of Iran
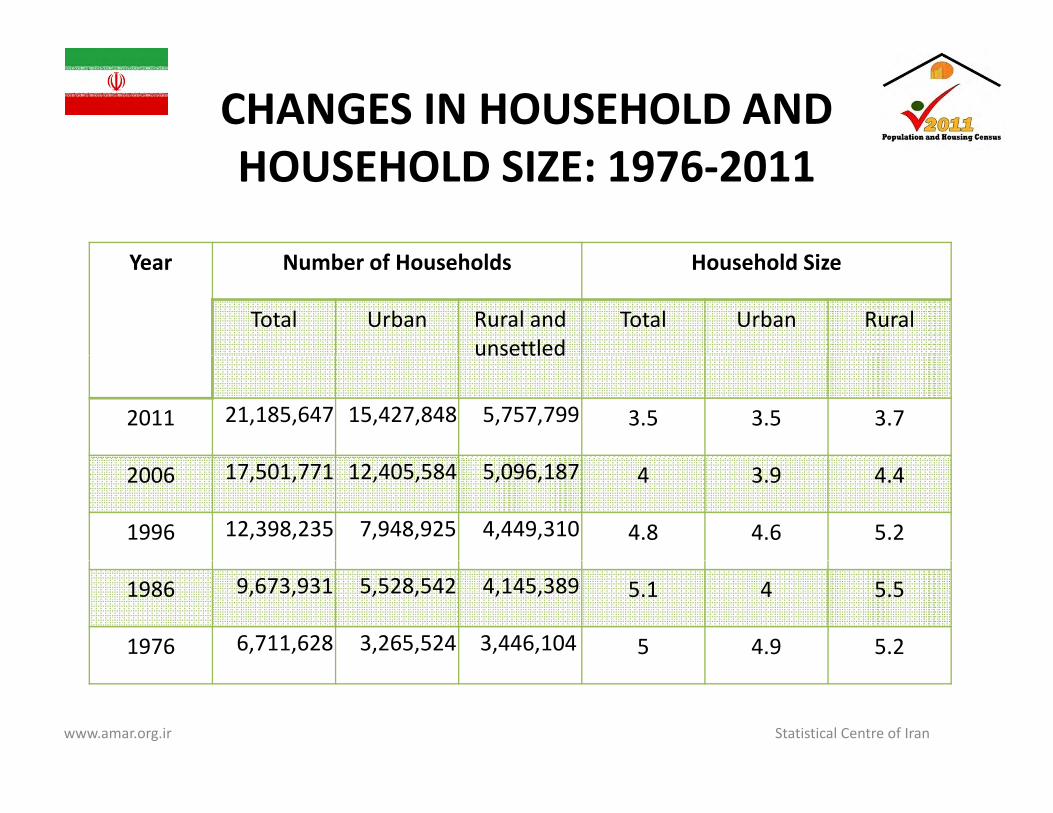
CHANGES IN HOUSEHOLD AND HOUSEHOLD SIZE: 1976‐2011
Household SizeNumber of HouseholdsYear
RuralUrbanTotalRural and unsettled
UrbanTotalunsettled
3.73.53.55,757,799 15,427,848 21,185,647 2011
4.43.945,096,187 12,405,584 17,501,771 2006
5.24.64.84,449,310 7,948,925 12,398,235 1996
5.545.14,145,389 5,528,542 9,673,931 1986
5.24.953,446,104 3,265,524 6,711,628 1976
www.amar.org.ir Statistical Centre of Iran

HOUSEHOLD SIZE BY PROVINCE: 2011
3 43.43.33.33.33.2
EsfahanAlborz
MarkaziMazandaran
TehranGilan
3.53.53.53.43.43.43.4
Khorasan‐e‐Razavi Hamedan
YazdEast Azarbayejan
QazvinSemnanEsfahan
3.73.73.63.63.63.53.5
FarsKermanshah
South Khorasan North Khorasan
QomZanjan
3 83.83.73.73.73.73.7
LorestanWest Azarbayejan
KermanKordestan
ArdebilGolestan
4 34.24.24.14.1
4.03.8
Si t & B l h tKohgiluyeh & Boyerahmad
BushehrIlam
KhuzestanHormozgan
Chaharmahal &Bakhtiyari
www.amar.org.ir Statistical Centre of Iran
3.54.3
Total countrySistan & Baluchestan
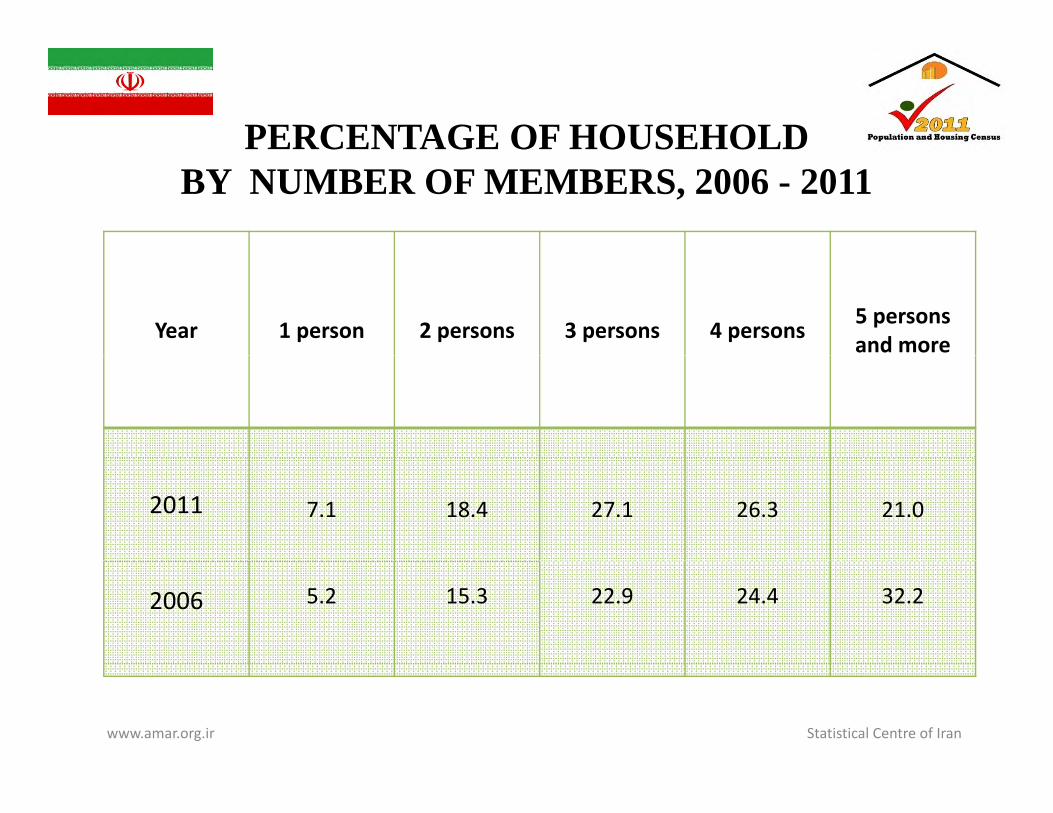
PERCENTAGE OF HOUSEHOLD BY NUMBER OF MEMBERS, 2006 - 2011
Year 1 person 2 persons 3 persons 4 persons 5 persons and more
2011 7.1 18.4 27.1 26.3 21.0
2006 5.2 15.3 22.9 24.4 32.2
www.amar.org.ir Statistical Centre of Iran
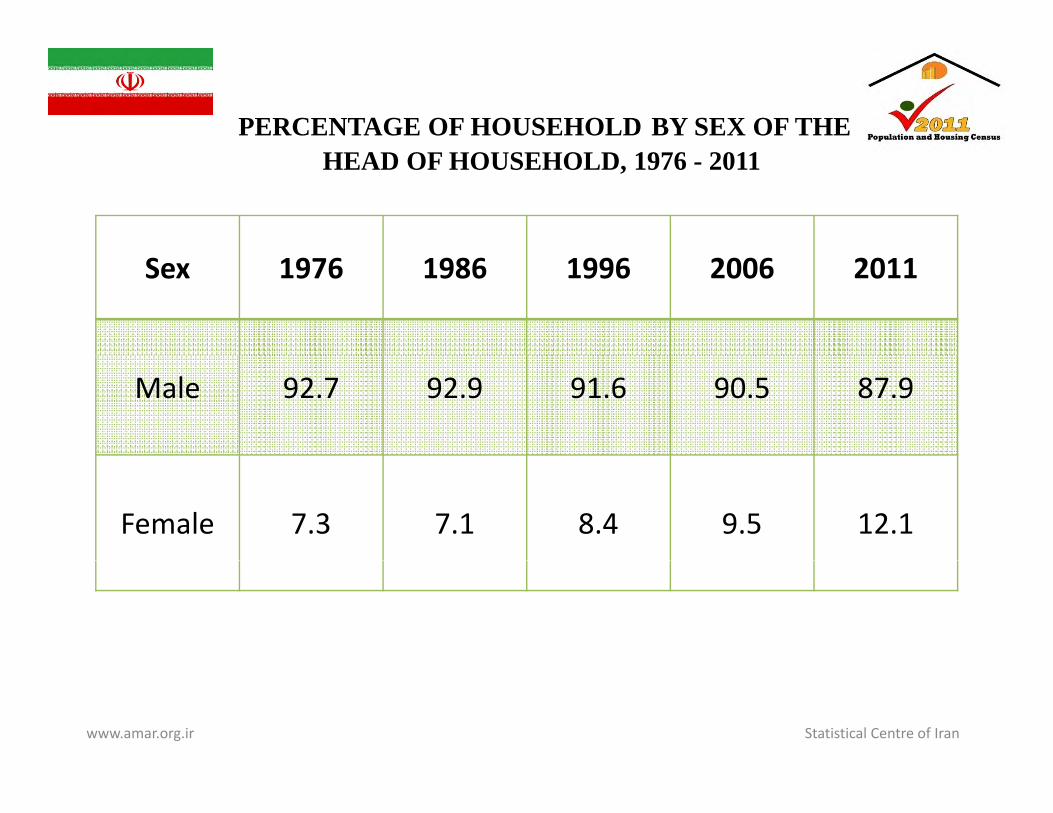
PERCENTAGE OF HOUSEHOLD BY SEX OF THE HEAD OF HOUSEHOLD, 1976 - 2011
Sex 1976 1986 1996 2006 2011
Male 92.7 92.9 91.6 90.5 87.9
Female 7.3 7.1 8.4 9.5 12.1
www.amar.org.ir Statistical Centre of Iran

DEMOGRAPHICDEMOGRAPHIC CHARACTERISTICSCHARACTERISTICS
www.amar.org.ir Statistical Centre of Iran

POPULATION BY RELIGION, 2006 - 2011
Year Muslim Christian Jew Zoroastrian Other Not stated
2011 74,682,938 117,704 8,756 25,271 49,101 265,899
2006 70,097,741 109,415 9,252 19,823 54,234 205,317
Muslim 99.4%
Not stated 0.3%Non-Muslim 0.3%
www.amar.org.ir Statistical Centre of Iran

POPULATION BY CITIZENSHIP, 2006 - 2011
Citizenship 2006 2011
Total country 70,495,782 75,149,669
Iran 68,901,154 73,461,474
Af h i 1 211 171 1 452 513Afghanistan 1,211,171 1,452,513
Iraq 44,094 51,506
P ki t 15 455 17 731Pakistan 15,455 17,731
Turkey 886 1,639
Other countries 32 410 24 290Other countries 32,410 24,290
Not stated 290,612 140,516
www.amar.org.ir Statistical Centre of Iran

POPULATION BY CITIZENSHIP AND PROVINCE, 2011
OstanOstan(province) Iran Afghanistan Iraq Pakistan Turkey Other Not stated
Total Country 73,461,474 1,452,513 51,506 17,731 1,639 24,290 140,516
Tehran 11,635,154 463,190 8,948 2,549 471 4,282 68,797
Khorasan‐e‐Razavi
5,770,337 205,859 6,619 2,092 110 1,988 7,397
Esfahan 4,700,566 168,496 4,361 507 35 1,277 4,070
Fars 4,485,829 104,963 1,285 471 89 1,002 3,019
Kerman 2,832,039 102,549 962 422 21 780 2,215
Qom 1,043,448 86,624 9,515 4,626 320 5,916 1,223
Alborz 2,332,397 72,300 940 395 61 636 5,784
Yazd 1 017 586 47 791 2 482 297 11 429 5 832Yazd 1,017,586 47,791 2,482 297 11 429 5,832
Markazi 1,376,937 32,698 696 81 11 273 3,263
Semnan 607,417 22,929 331 47 8 119 367
Sistan & Baluchestan 2,506,113 22,414 539 3,216 33 653 1,359Baluchestan
Hormozgan 1,553,644 20,964 455 862 17 718 1,523
Bushehr 1,009,607 20,545 311 201 21 164 2,100
Golestan 1,753,664 16,657 220 54 14 356 6,049, , , ,
Qazvin 1,183,867 15,929 400 116 25 432 796
Khuzestan 4,508,958 12,477 6,422 506 70 1,111 2,176www.amar.org.ir Statistical Centre of Iran
Ostan I Af h i I P ki T k O h Not
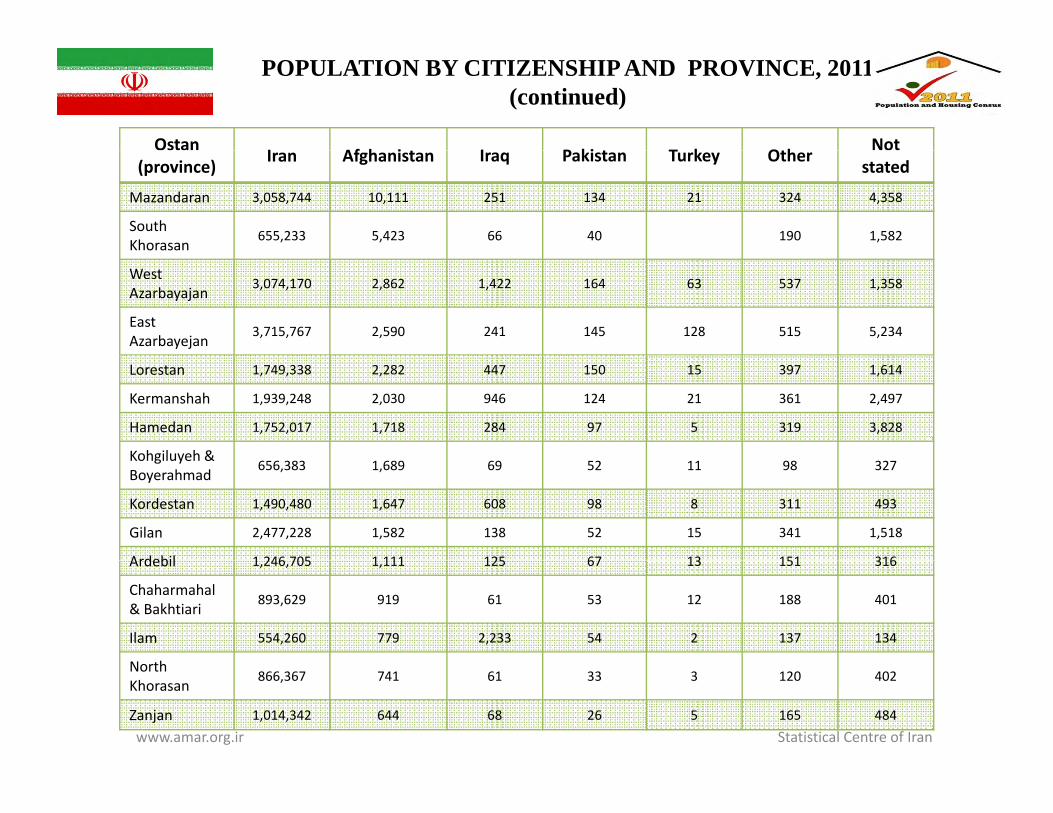
POPULATION BY CITIZENSHIP AND PROVINCE, 2011 (continued)
(province) Iran Afghanistan Iraq Pakistan Turkey Other stated
Mazandaran 3,058,744 10,111 251 134 21 324 4,358
South Khorasan 655,233 5,423 66 40 190 1,582
West Azarbayajan 3,074,170 2,862 1,422 164 63 537 1,358
East Azarbayejan 3,715,767 2,590 241 145 128 515 5,234
Lorestan 1,749,338 2,282 447 150 15 397 1,614
Kermanshah 1,939,248 2,030 946 124 21 361 2,497
Hamedan 1,752,017 1,718 284 97 5 319 3,828
Kohgiluyeh &Kohgiluyeh & Boyerahmad 656,383 1,689 69 52 11 98 327
Kordestan 1,490,480 1,647 608 98 8 311 493
Gilan 2,477,228 1,582 138 52 15 341 1,518
Ardebil 1 246 705 1 111 125 67 13 151 316Ardebil 1,246,705 1,111 125 67 13 151 316
Chaharmahal& Bakhtiari 893,629 919 61 53 12 188 401
Ilam 554,260 779 2,233 54 2 137 134
N thNorth Khorasan 866,367 741 61 33 3 120 402
Zanjan 1,014,342 644 68 26 5 165 484www.amar.org.ir Statistical Centre of Iran

POPULATION AGED 10 AND OVERBY MARITAL STATUS, 2006 - 2011
Year and sex Married Widowed Divorced Nevermarried
Not stated
2011
Male
Female
60.0
61.0
1.0
7.4
0.7
1.4
38.0
30.2
0.2
0.0
Male 54.6 1.0 0.5 43.4 0.5
2006 Female 56.7 6.5 0.9 35.4 0.6
www.amar.org.ir Statistical Centre of Iran
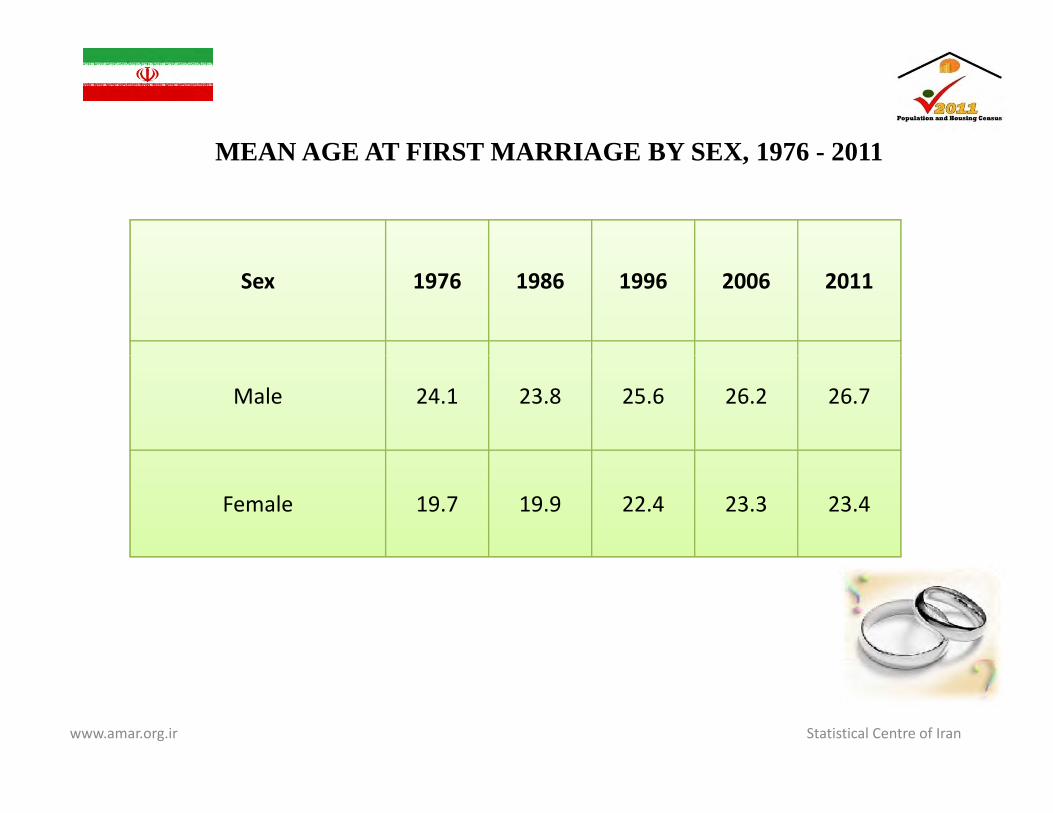
MEAN AGE AT FIRST MARRIAGE BY SEX 1976 2011MEAN AGE AT FIRST MARRIAGE BY SEX, 1976 - 2011
20112006199619861976Sex
26.726.225.623.824.1Male
23.423.322.419.919.7Female
www.amar.org.ir Statistical Centre of Iran
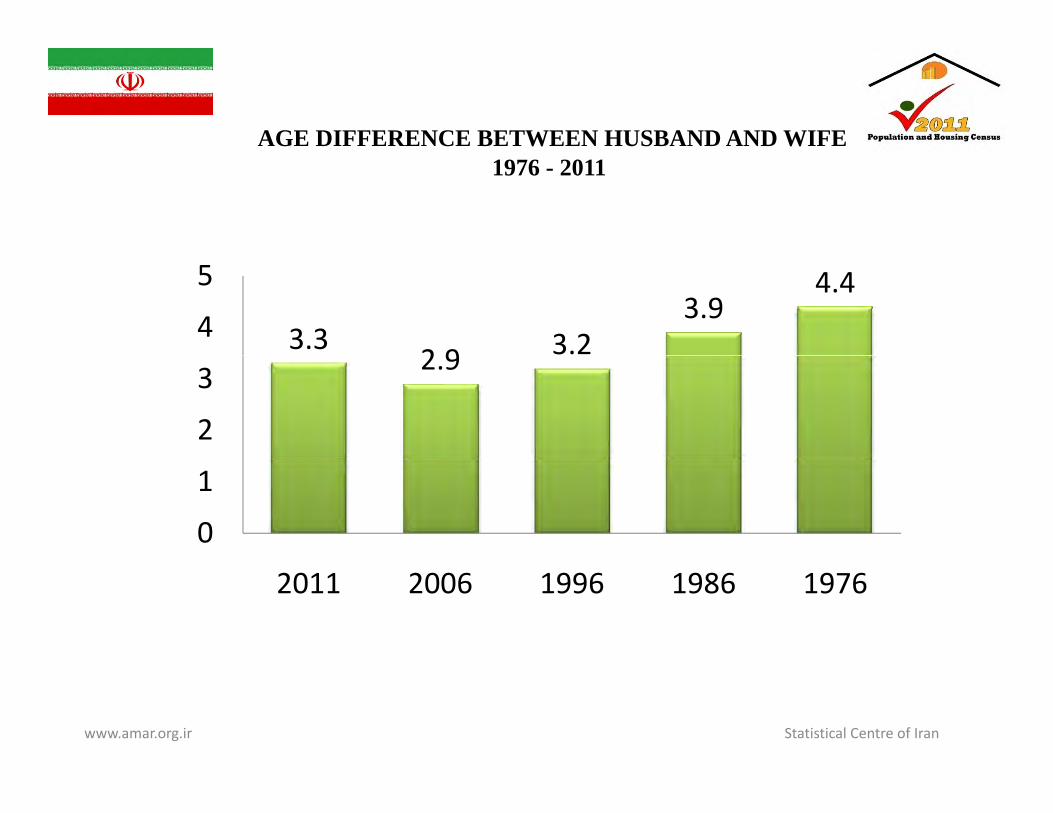
AGE DIFFERENCE BETWEEN HUSBAND AND WIFE1976 - 2011
3.32 9 3.2
3.94.4
4
5
2.9
2
3
0
1
2011 2006 1996 1986 1976
www.amar.org.ir Statistical Centre of Iran
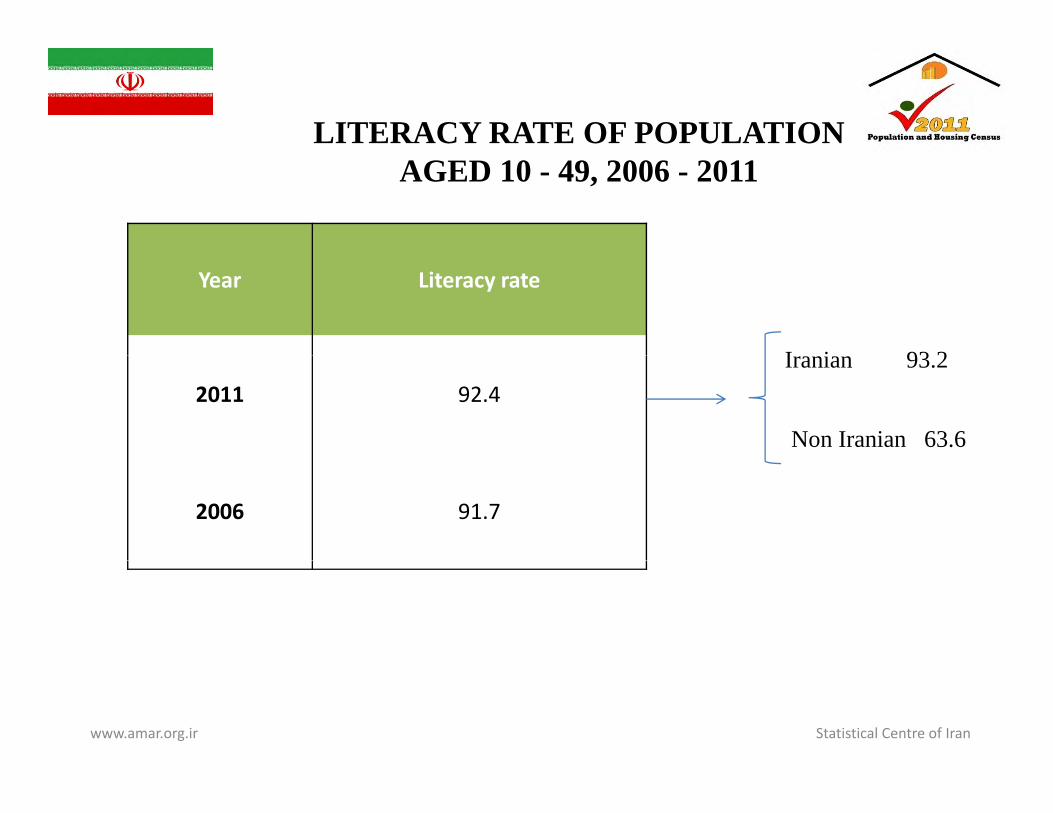
LITERACY RATE OF POPULATION AGED 10 - 49, 2006 - 2011
Year Literacy rate
I i 93 22011 92.4
Iranian 93.2
Non Iranian 63.6
2006 91.7
www.amar.org.ir Statistical Centre of Iran
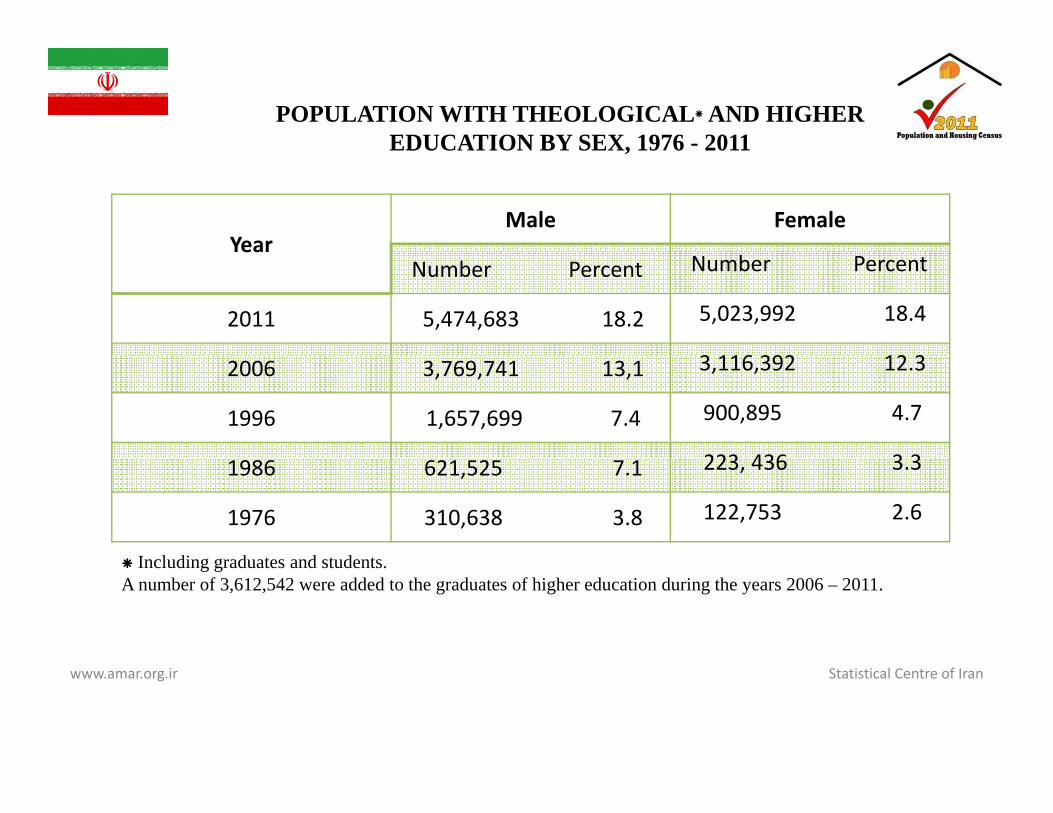
POPULATION WITH THEOLOGICAL AND HIGHER EDUCATION BY SEX, 1976 - 2011EDUCATION BY SEX, 1976 2011
YearMale Female
Number Percent Number Percent
2011 5,474,683 18.2 5,023,992 18.4
3 116 392 12 32006 3,769,741 13,1 3,116,392 12.3
1996 1,657,699 7.4 900,895 4.7
223 436 3 31986 621,525 7.1 223, 436 3.3
1976 310,638 3.8 122,753 2.6
Including graduates and students Including graduates and students.A number of 3,612,542 were added to the graduates of higher education during the years 2006 – 2011.
www.amar.org.ir Statistical Centre of Iran

NUMBER AND PERCENT OF POPULATION WITH THEOLOGICAL AND HIGHER EDUCATION BY FIELD OF
STUDY, 2011,
Field of study Number Percent
Educational sciences 584,413 5.6,
Humanities and arts 1,472,760 14.0
Social sciences, business and law 3,003,229 28.6Field of study is
Sciences, mathematics and computer 946,725 9.0
Engineering, production and manufacturing 2,941,464 28.0
study is presented according to the g
Agriculture and veterinary 373,398 3.6
Health and welfare 531,848 5.1
International Standard Classification
Services 291,283 2.8
Not specified 353,564 3.4
of Education (ISCED)
www.amar.org.ir Statistical Centre of Iran
Total 10,498, 675 100.0
MIGRATION
www.amar.org.ir Statistical Centre of Iran
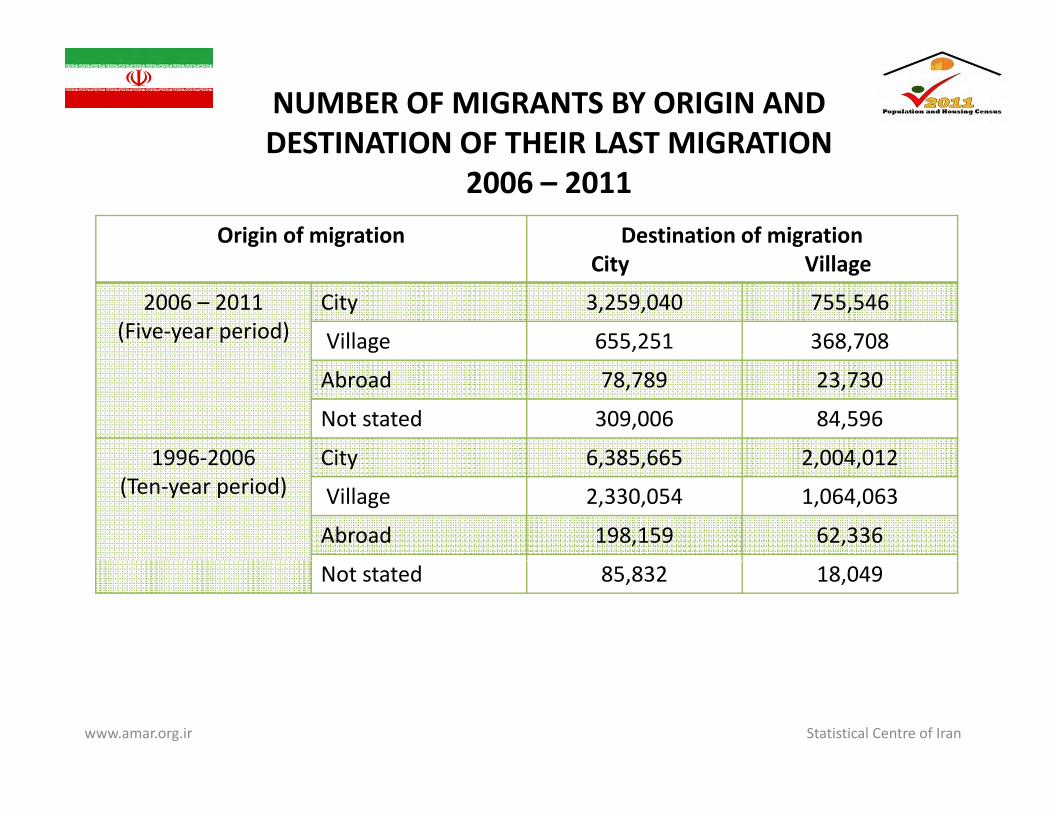
NUMBER OF MIGRANTS BY ORIGIN AND DESTINATION OF THEIR LAST MIGRATIONDESTINATION OF THEIR LAST MIGRATION
2006 – 2011Origin of migration Destination of migration
City Village
2006 – 2011(Five‐year period)
City 3,259,040 755,546
Village 655,251 368,708
Abroad 78,789 23,730
Not stated 309,006 84,596
1996 2006 City 6 385 665 2 004 0121996‐2006(Ten‐year period)
City 6,385,665 2,004,012
Village 2,330,054 1,064,063
Abroad 198,159 62,336
Not stated 85,832 18,049
www.amar.org.ir Statistical Centre of Iran

RELATIVE DISTRIBUTION OF MIGRANTS BY REASON OF MIGRATION AND URBAN AND RURAL AREAS:
2011
Seeking for Education Serving or Getting Accompanying Other or
Descriptionbetter work or job transferring
or end of education
completion of military service
better housing
household not stated
2011 Total 14.9 14.0 5.8 10.6 46.2 8.5
Urban 15.6 15.4 4.1 10.1 46.0 8.8
Rural 12.7 8.9 11.9 12.3 46.8 7.5
2006 18.9 9.9 10.3 ‐ * 46.0 14.9
*‐ This item was not available for the year 2006.
www.amar.org.ir Statistical Centre of Iran
CHARACTERISTICS OF HOUSING AND FACILITIES AVAILABLE TO THEFACILITIES AVAILABLE TO THE
HOUSEHOLD
www.amar.org.ir Statistical Centre of Iran

FACILITIES INDICATORS OF HOUSEHOLD, 2006‐2011
Percentage of households having
computer
Percentage of households having light
vehicle
Percentage of households having
motorcycles
Year
33.442.122.82011
22.3133.0624.72006
www.amar.org.ir Statistical Centre of Iran

NUMBER OF HOUSEHOLDS BY TYPE OF TENURE
Not stated
OtherFree of charge
Against service
RentedOwned building
(2)
Owned land and b ildi
Year
(2)building (1)
151,544 180,763 1,585,221 332,808 5,607,314 1,317,281 11,875,003 2011195,118 103,329 914,424 370,856 3,981,549 781,065 11,013,235 2006
( ) h h h ld h l d d b ld f h(1). The household owns the land and building of housing unit.(2). The household owns just the building of housing unit.
www.amar.org.ir Statistical Centre of Iran

TYPE OF HOUSING UNIT TENURE 1976 2011 (%)TENURE: 1976‐2011 (%)
Otherand not stated
Free of charge
Against service
RentedOwned building
Owned land and building
Year
1.67.51.626.66.356.42011
1.75.32.122.94.563.42006
0.48.12.615.6469.41996
0.97.82.1126.470.81986
0.78.2‐155.970.21976
www.amar.org.ir Statistical Centre of Iran
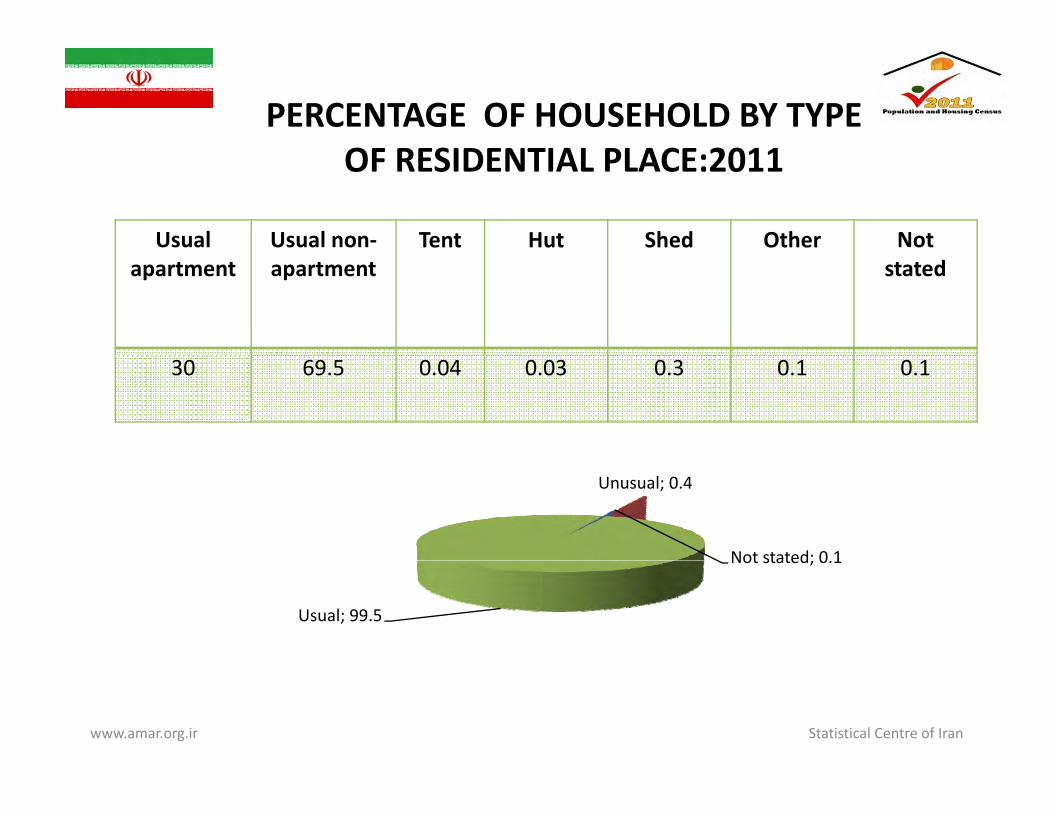
PERCENTAGE OF HOUSEHOLD BY TYPE OF RESIDENTIAL PLACE 2011OF RESIDENTIAL PLACE:2011
Not OtherShedHutTentUsual non‐Usualstatedapartmentapartment
0.10.10.30.030.0469.530
Not stated; 0 1
Unusual; 0.4
Not stated; 0.1
Usual; 99.5
www.amar.org.ir Statistical Centre of Iran
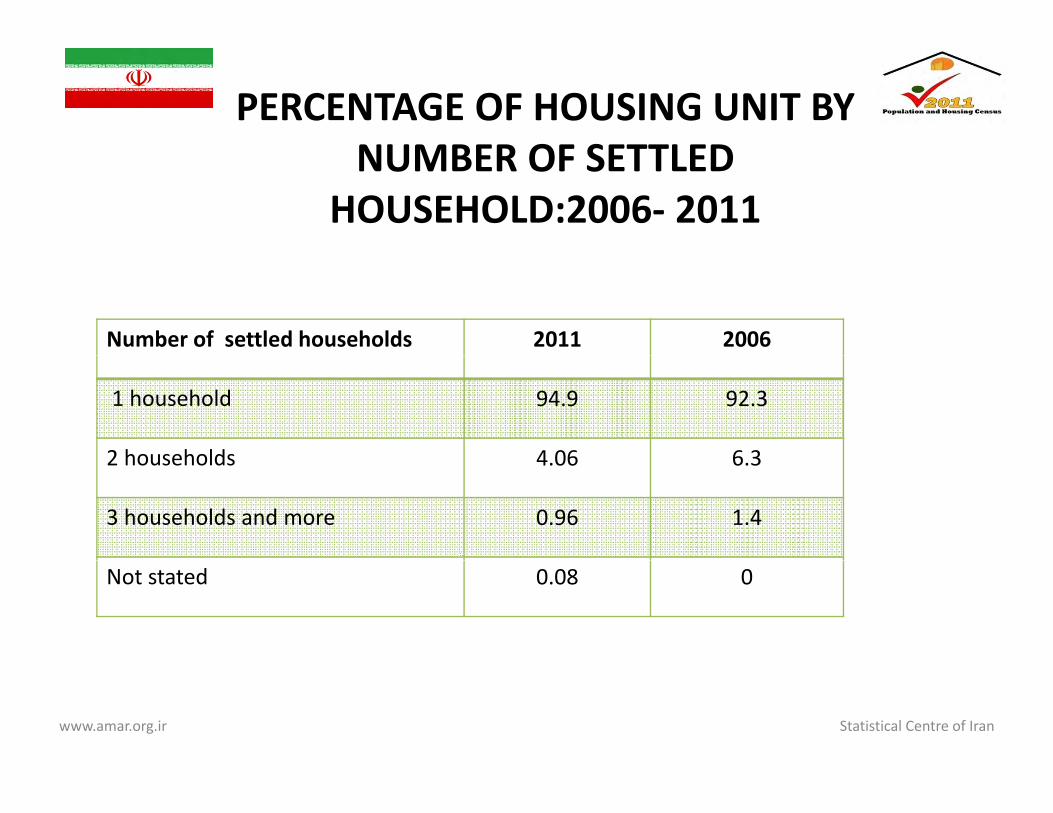
PERCENTAGE OF HOUSING UNIT BY NUMBER OF SETTLEDNUMBER OF SETTLED
HOUSEHOLD:2006‐ 2011
20062011Number of settled households
92.394.91 household
6 34 062 households 6.34.062 households
1.40.963 households and more
00.08Not stated
www.amar.org.ir Statistical Centre of Iran
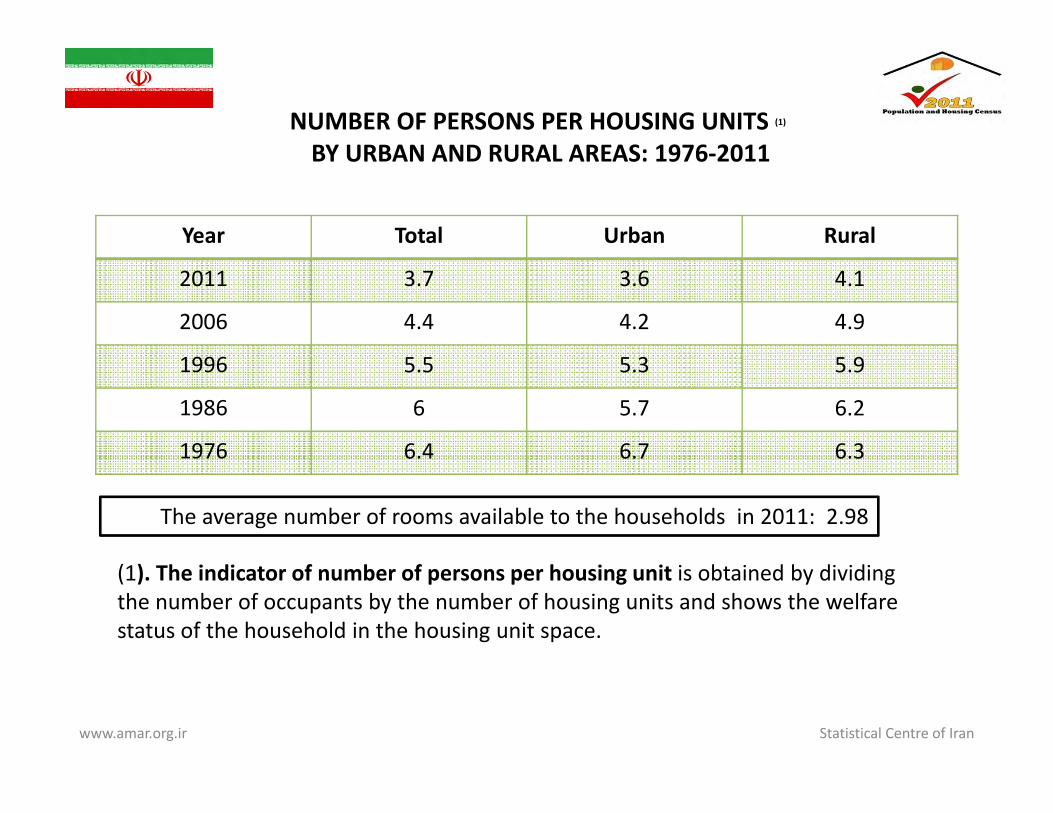
NUMBER OF PERSONS PER HOUSING UNITS (1)BY URBAN AND RURAL AREAS: 1976 2011BY URBAN AND RURAL AREAS: 1976‐2011
RuralUrbanTotalYear
4.13.63.72011
4.94.24.42006
5.95.35.51996
6.25.761986
6.36.76.41976 6.36.76.41976
The average number of rooms available to the households in 2011: 2.98
(1). The indicator of number of persons per housing unit is obtained by dividing the number of occupants by the number of housing units and shows the welfare status of the household in the housing unit space.
www.amar.org.ir Statistical Centre of Iran
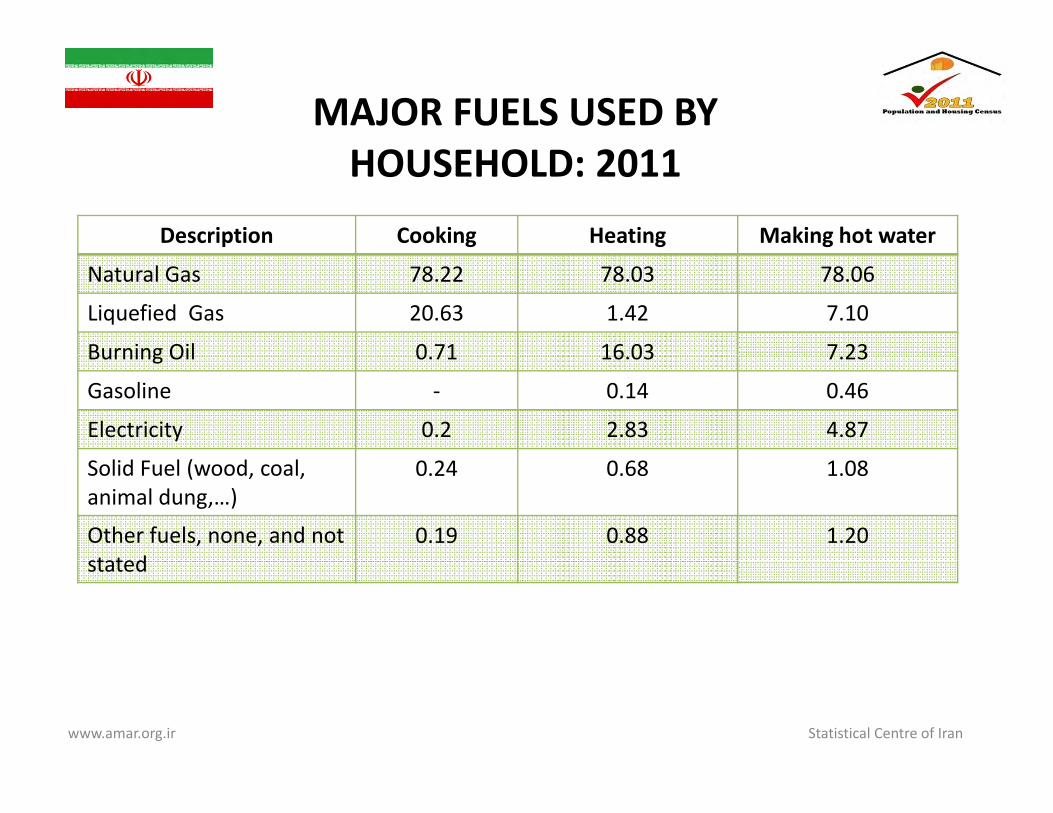
MAJOR FUELS USED BY HOUSEHOLD 2011HOUSEHOLD: 2011
Making hot waterHeatingCookingDescription
78.0678.0378.22Natural Gas
7.101.4220.63Liquefied Gas
7 2316 030 71Burning Oil 7.2316.030.71Burning Oil
0.460.14‐Gasoline
4.872.830.2Electricity
1.080.680.24Solid Fuel (wood, coal, animal dung,…)
1.200.880.19Other fuels, none, and not statedstated
www.amar.org.ir Statistical Centre of Iran
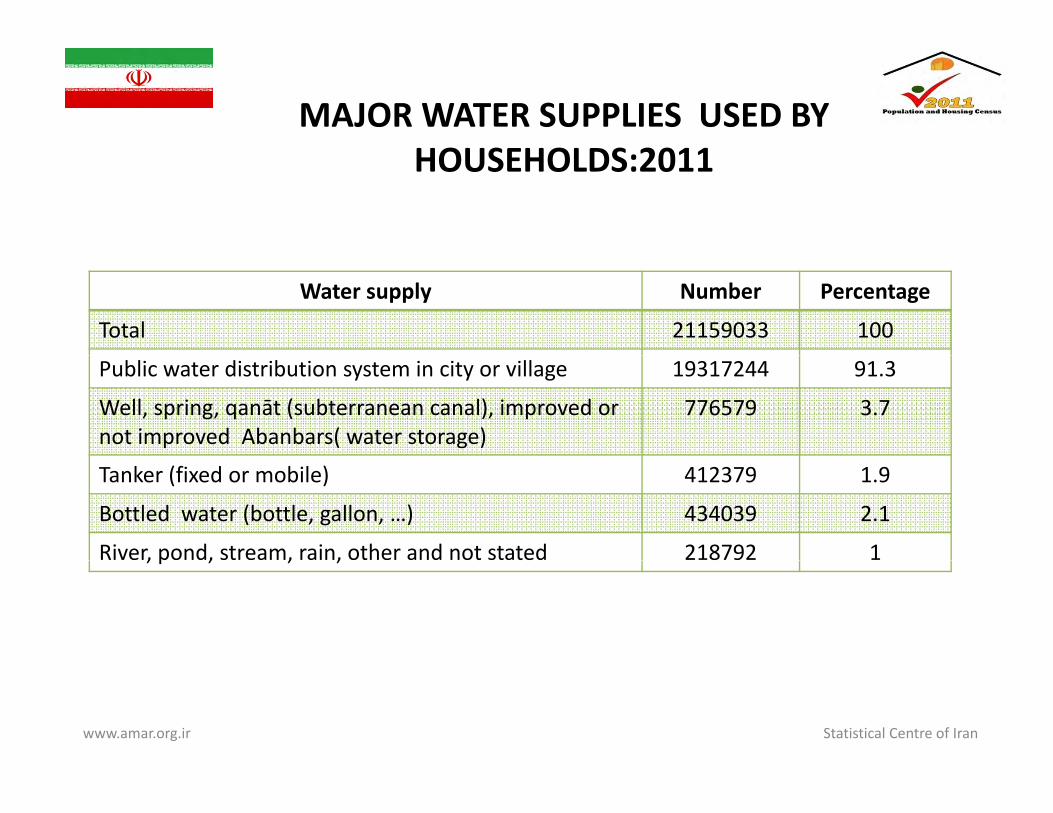
MAJOR WATER SUPPLIES USED BY HOUSEHOLDS 2011HOUSEHOLDS:2011
PercentageNumberWater supply
10021159033Total
91.319317244Public water distribution system in city or village
3.7776579Well, spring, qanāt (subterranean canal), improved or not improved Abanbars( water storage)
1.9412379Tanker (fixed or mobile)
2.1434039Bottled water (bottle, gallon, …)
1218792River, pond, stream, rain, other and not stated, p , , ,
www.amar.org.ir Statistical Centre of Iran

PRIVATE AND COLLECTIVE SETTLED HOUSEHOLDS USING PUBLIC WATER DISTRIBUTION SYSTEM BY OSTAN
(PROVINCE): 2011
Chaharmahal & BakhtiyariQazvinAlborz
Esfahan
Kermanshah Tehran
IlamMarkazi
Khorasan‐e‐RazaviYazd
Chaharmahal & Bakhtiyari
GolestanWest Azarbayejan
Kohgiluyeh & Boyerahmad Lorestan
QomEest Azarbayejan
Hamedan
FArdebilSemnan
KordestanZanjan
North KhorasanMazandaran
Sistan & BaluchestanHormozgan
BushehrKhuzestan
South khorasanKerman
Fars
www.amar.org.ir Statistical Centre of Iran
0 20 40 60 80 100 120
Gilan

CHARACTERISTICS OF THECHARACTERISTICS OF THE HOUSING UNIT
www.amar.org.ir Statistical Centre of Iran

CHANGES IN CONVENTIONAL HOUSING UNITS: 2006 ‐ 2011
Year Housing units* Absolute increase**
Relative increase** increase
2011 19,954,708 4,094,782 25.82006 15,859,926 5,089,814 47.3
UrbanUrban 2011 14,782,114 3,350,234 29.32006 11,431,880 4,518,150 65.4
Rural 2011 5,172,594 744,548 16.82006 4,428,046 571,664 14.8
*. Excluding vacant housing units and second accommodations.
** Absolute and relative increases for 2006 are related to the ten‐year period of 1996 –
www.amar.org.ir Statistical Centre of Iran
.Absolute and relative increases for 2006 are related to the ten year period of 1996 2006 and for the year 2011 they are related to the 5‐year period of 2006‐2011.

DISTRIBUTION OF VACANT HOUSING UNITS: 2006‐2011HOUSING UNITS: 2006 2011
Ostan (province) 2011 2006Total country 100 1,663,412 100 633,569Tehran 19.7 327,163 17.9 113,195Esfahan 8.5 140,942 11.7 73,905Khorasan‐e‐Razavi 6.6 110,135 7.9 50,325East Azarbay 6 100,477 5.5 34,821y , ,Fars 5.5 91,010 4.6 28,949Khuzestan 5.1 84,944 5.8 36,889Mazandaran 4.2 70,023 3.3 21,037Alborz 4.2 69,863 Included in TehranKerman 3.5 58,767 4.5 28,776Gilan 3.2 53,776 3.4 21,637
b j 3 9 3 9 9 Table was sortedWest Azarbayejan 3 49,175 3 19,191Sistan & Baluchestan 2.7 44,367 2.6 16,637Hormozgan 2.5 41,839 2.6 16,366Markazi 2.4 39,573 2.5 16,076Yazd 2.4 39,469 3.3 21,166Hamedan 2.2 37,365 1.7 10,882Kermanshah 1 7 27 891 1 9 12 248
Table was sorted according to the 2011 data.
Kermanshah 1.7 27,891 1.9 12,248Kordestan 1.6 27,419 1.8 11,109Qom 1.6 26,690 2.2 14,214Golestan 1.5 25,171 1.6 9,897Ardebil 1.4 24,107 1.7 10,898Lorestan 1.4 22,771 1.2 7,370Qazvin 1.3 22,205 1.6 10,031Bushehr 1.3 21,290 0.9 5,677Semnan 1.2 20,447 1.4 8,640Zanjan 1.2 20,070 1.2 7,601South Khorasan 1.1 18,061 1.4 8,896Chaharmahal & Bakhtiyari 1 16,131 0.8 5,334North Khorasan 0 8 12 617 0 8 5 094
www.amar.org.ir Statistical Centre of Iran
North Khorasan 0.8 12,617 0.8 5,094Kohgiluyeh & Boyerahmad 0.7 10,850 0.6 4,070Ilam 0.5 8,804 0.4 2,638

FLOOR AREA OF THE HOUSING (%)UNIT: 2006 – 2011 (%)
Floor area(m2) 2006 2011
50 m2 and less 13.21 9.86
75 ‐ 51 19.26 22.61
76 – 80 9 40 10 5176 80 9.40 10.51
81 – 100 19.55 21.65
101 – 150 23.62 23.49
151 – 200 9.49 7.38
201 – 300 4.21 2.76
301 – 500 1.04 0.64
501 m2 and over 0.21 0.07
Not stated ‐‐‐‐‐‐ 1.03
www.amar.org.ir Statistical Centre of Iran
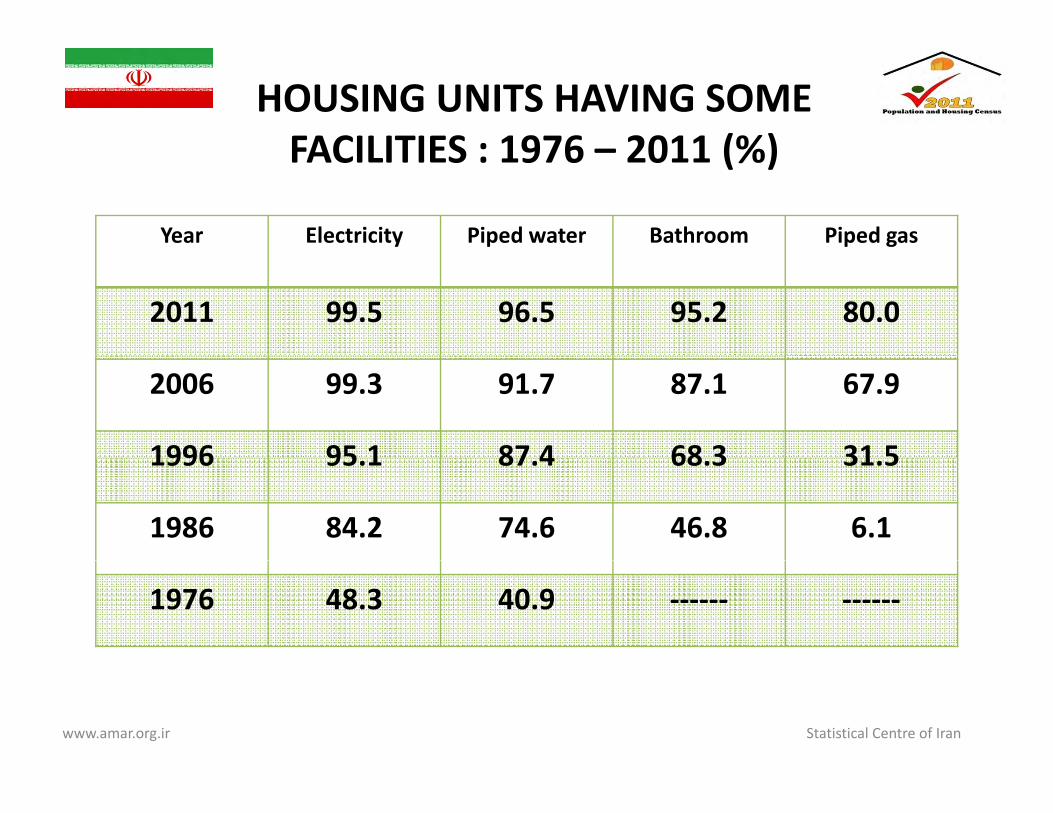
HOUSING UNITS HAVING SOME FACILITIES : 1976 – 2011 (%)FACILITIES : 1976 – 2011 (%)
Year Electricity Piped water Bathroom Piped gas
2011 99.5 96.5 95.2 80.0
2006 99.3 91.7 87.1 67.9
1996 95 1 87 4 68 3 31 51996 95.1 87.4 68.3 31.5
1986 84.2 74.6 46.8 6.1
1976 48.3 40.9 ‐‐‐‐‐‐ ‐‐‐‐‐‐
www.amar.org.ir Statistical Centre of Iran
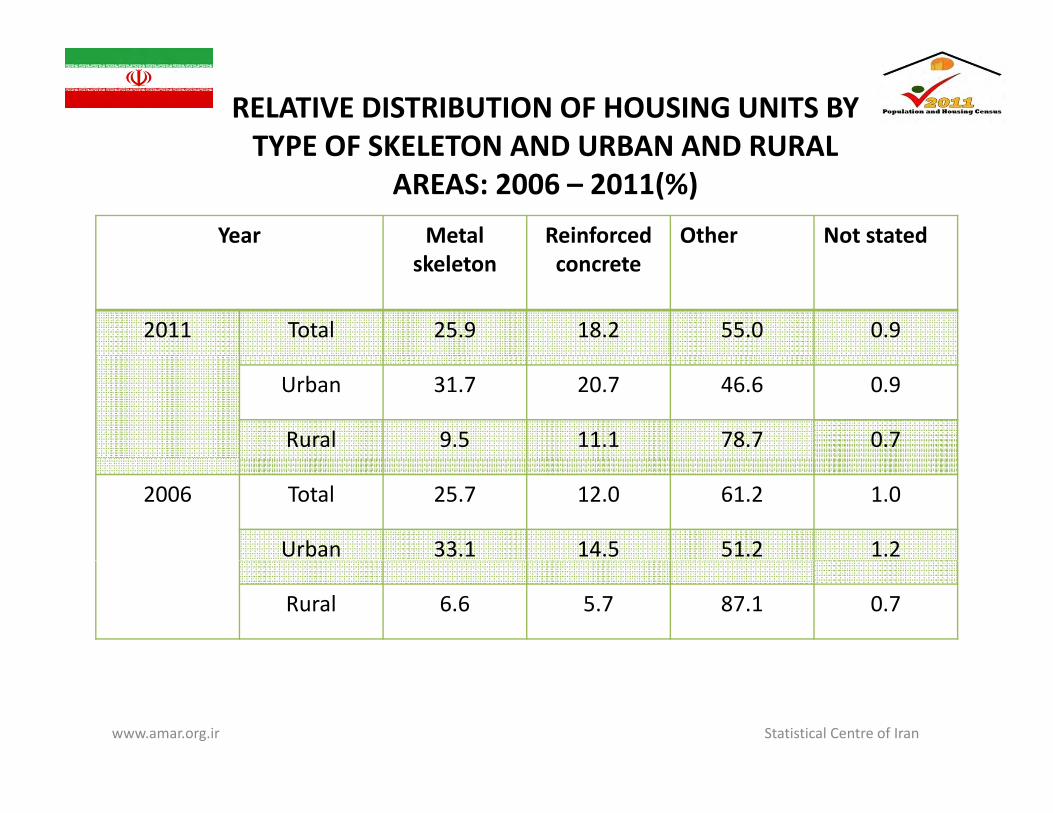
RELATIVE DISTRIBUTION OF HOUSING UNITS BY TYPE OF SKELETON AND URBAN AND RURALTYPE OF SKELETON AND URBAN AND RURAL
AREAS: 2006 – 2011(%)Year Metal Reinforced Other Not stated
skeleton concrete
2011 Total 25.9 18.2 55.0 0.9
Urban 31.7 20.7 46.6 0.9
Rural 9.5 11.1 78.7 0.7
2006 Total 25.7 12.0 61.2 1.0
Urban 33.1 14.5 51.2 1.2
Rural 6.6 5.7 87.1 0.7
www.amar.org.ir Statistical Centre of Iran
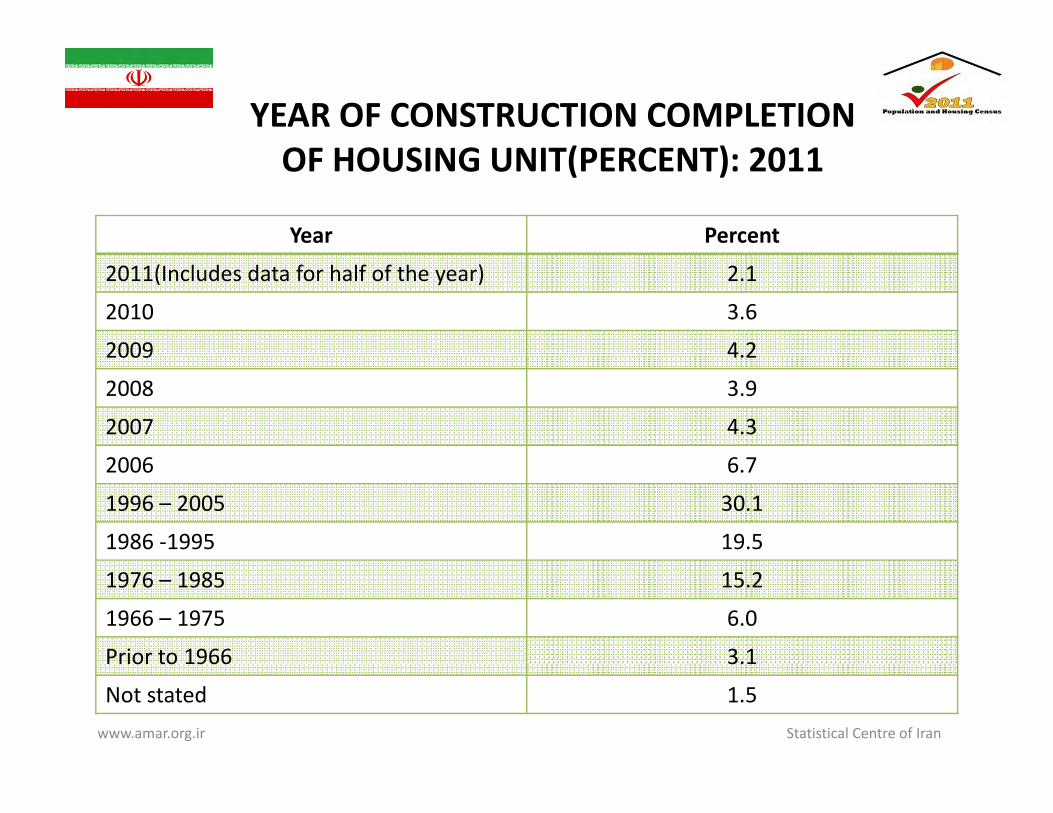
YEAR OF CONSTRUCTION COMPLETION OF HOUSING UNIT(PERCENT) 2011OF HOUSING UNIT(PERCENT): 2011
Year Percent
2011(Includes data for half of the year) 2.1
2010 3.6
2009 4.22009 4.2
2008 3.9
2007 4.3
2006 6 72006 6.7
1996 – 2005 30.1
1986 ‐1995 19.5
1976 – 1985 15.2
1966 – 1975 6.0
Prior to 1966 3.1Prior to 1966 3.1
Not stated 1.5www.amar.org.ir Statistical Centre of Iran
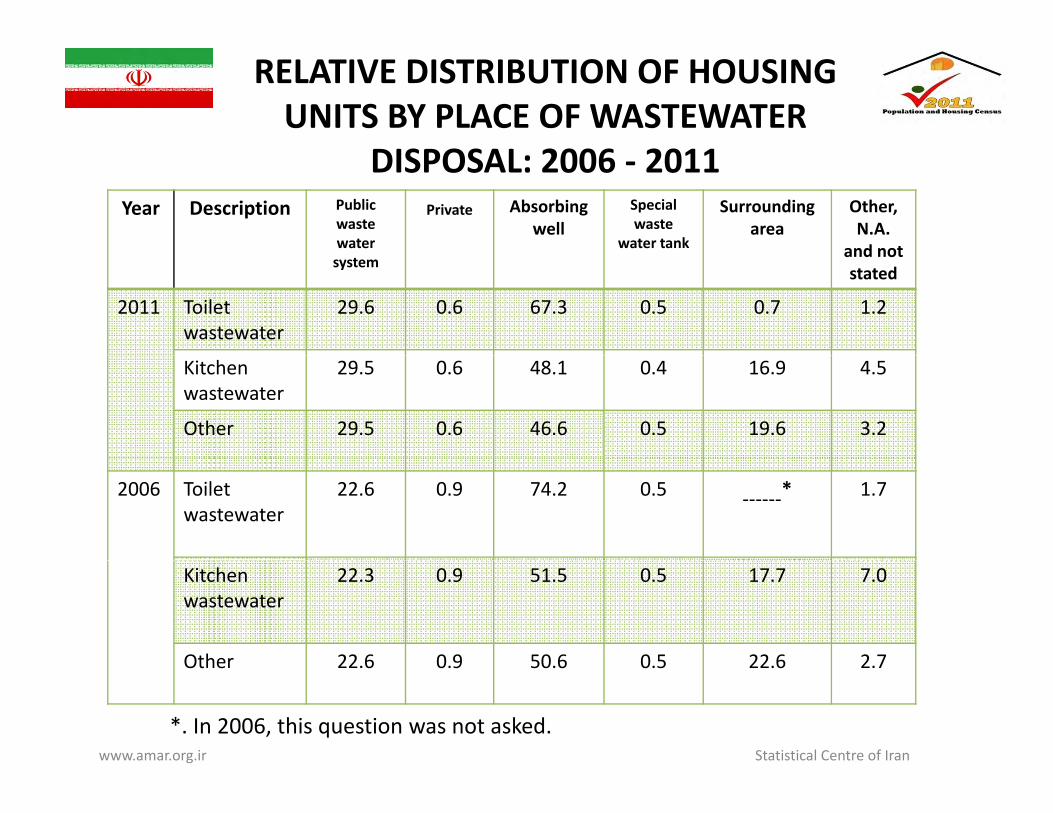
RELATIVE DISTRIBUTION OF HOUSING UNITS BY PLACE OF WASTEWATER
DISPOSAL 2006 2011DISPOSAL: 2006 ‐ 2011Year Description Public
waste water
Private Absorbing well
Special waste
water tank
Surrounding area
Other, N.A.
and notsystem
and not stated
2011 Toilet wastewater
29.6 0.6 67.3 0.5 0.7 1.2
Kitchen wastewater
29.5 0.6 48.1 0.4 16.9 4.5
Other 29.5 0.6 46.6 0.5 19.6 3.2
2006 Toilet wastewater
22.6 0.9 74.2 0.5 ‐‐‐‐‐‐* 1.7
Kitchen wastewater
22.3 0.9 51.5 0.5 17.7 7.0
Other 22 6 0 9 50 6 0 5 22 6 2 7Other 22.6 0.9 50.6 0.5 22.6 2.7
www.amar.org.ir Statistical Centre of Iran
*. In 2006, this question was not asked.