Embed Size (px)
Citation preview
Statistical Estimation of Correlated Genome Associationsto a Quantitative Trait NetworkSeyoung Kim, Eric P. Xing*
School of Computer Science, Carnegie Mellon University, Pittsburgh, Pennsylvania, United States of America
Abstract
Many complex disease syndromes, such as asthma, consist of a large number of highly related, rather than independent,clinical or molecular phenotypes. This raises a new technical challenge in identifying genetic variations associatedsimultaneously with correlated traits. In this study, we propose a new statistical framework called graph-guided fused lasso(GFlasso) to directly and effectively incorporate the correlation structure of multiple quantitative traits such as clinical metricsand gene expressions in association analysis. Our approach represents correlation information explicitly among thequantitative traits as a quantitative trait network (QTN) and then leverages this network to encode structured regularizationfunctions in a multivariate regression model over the genotypes and traits. The result is that the genetic markers that jointlyinfluence subgroups of highly correlated traits can be detected jointly with high sensitivity and specificity. While most of thetraditional methods examined each phenotype independently and combined the results afterwards, our approach analyzes allof the traits jointly in a single statistical framework. This allows our method to borrow information across correlatedphenotypes to discover the genetic markers that perturb a subset of the correlated traits synergistically. Using simulateddatasets based on the HapMap consortium and an asthma dataset, we compared the performance of our method with othermethods based on single-marker analysis and regression-based methods that do not use any of the relational information inthe traits. We found that our method showed an increased power in detecting causal variants affecting correlated traits. Ourresults showed that, when correlation patterns among traits in a QTN are considered explicitly and directly during a structuredmultivariate genome association analysis using our proposed methods, the power of detecting true causal SNPs with possiblypleiotropic effects increased significantly without compromising performance on non-pleiotropic SNPs.
Citation: Kim S, Xing EP (2009) Statistical Estimation of Correlated Genome Associations to a Quantitative Trait Network. PLoS Genet 5(8): e1000587. doi:10.1371/journal.pgen.1000587
Editor: John D. Storey, Princeton University, United States of America
Received December 23, 2008; Accepted July 6, 2009; Published August 14, 2009
Copyright: � 2009 Kim, Xing. This is an open-access article distributed under the terms of the Creative Commons Attribution License, which permits unrestricteduse, distribution, and reproduction in any medium, provided the original author and source are credited.
Funding: This material is based upon work supported by an NSF CAREER Award to EPX under grant No. DBI-0546594, NSF grant DBI-0640543, and NIH grant1R01GM087694. EPX is also supported by an Alfred P. Sloan Research Fellowship of Computer Science. The funders had no role in study design, data collectionand analysis, decision to publish, or preparation of the manuscript.
Competing Interests: The authors have declared that no competing interests exist.
* E-mail: [email protected]
Introduction
Many complex disease syndromes, such as diabetes, asthma,
and cancer, consist of a large number of highly related, rather than
independent, clinical phenotypes. Differences between these
syndromes involve a complex interplay of a large number of
genomic variations that perturb the function of disease-related
genes in the context of a regulatory network, rather than each gene
individually [1,2]. Thus, unraveling the causal genetic variations
and understanding the mechanisms of consequent cell and tissue
transformation requires an analysis that jointly considers the
epistatic, pleiotropic, and plastic interactions of elements and
modules within and between the genome, transcriptome, and
phenome. Until now, most popular approaches for genetic and
molecular analysis of diseases were mainly based on classical
statistical techniques, such as the linkage analysis of selected
markers [3,4]; quantitative trait locus (QTL) mapping [5,6]
conducted over one phenotype and one marker genotype at a
time, which are then corrected for multiple hypothesis testing
[7,8]; and primitive data mining methods, such as the clustering of
gene expressions and the high-level descriptive analysis of
molecular networks. Such approaches yield crude, usually
qualitative characterizations of the study subjects.
Numerous recent studies have shown that it is often more
informative to map intermediate steps in disease processes, such as
various disease-related clinical traits or expression levels of genes of
interest, rather than merely the binary case/control disease status,
to genetic marker loci [2,9–13]. These molecular and clinical traits
provide detailed insight to the relationship between genome
variations and disease phenotypes because they are more directly
influenced by the genotype variations. Furthermore, since many of
these intermediate traits in a complex multivariate phenotype are
highly correlated, combining information across multiple such
traits during the analysis of genome-phenome association can offer
a deeper insight on the possibly multi-factorial functional roles that
the associated genotype variations may play to give rise to the
disease under study. At the same time, they can provide a greater
power for detecting weak association signals that might have been
missed if each trait was analyzed separately.
In several recent attempts on expression quantitative trait locus
(eQTL) mapping, a significant focus has been placed on
identifying modules of co-expressed genes and the genotype
markers that perturb the whole module rather than a single gene.
For example, a genotype variation in a putative transcription
factor is likely to affect the expression levels of all of the genes
regulated by this common transcription factor. Under this
PLoS Genetics | www.plosgenetics.org 1 August 2009 | Volume 5 | Issue 8 | e1000587
scenario, once a group of genes are mapped to a common locus in
the genome, it is possible to examine whether the locus harbors a
transcription factor that targets the group of genes jointly in order
to understand the functional relationship between the genotype
marker and the gene module (e.g., [11]). Another example, which
will be explored in this paper, involves the study of complex
heterogeneous diseases such as asthma that cannot be character-
ized by a single phenotype, but are influenced by multiple factors.
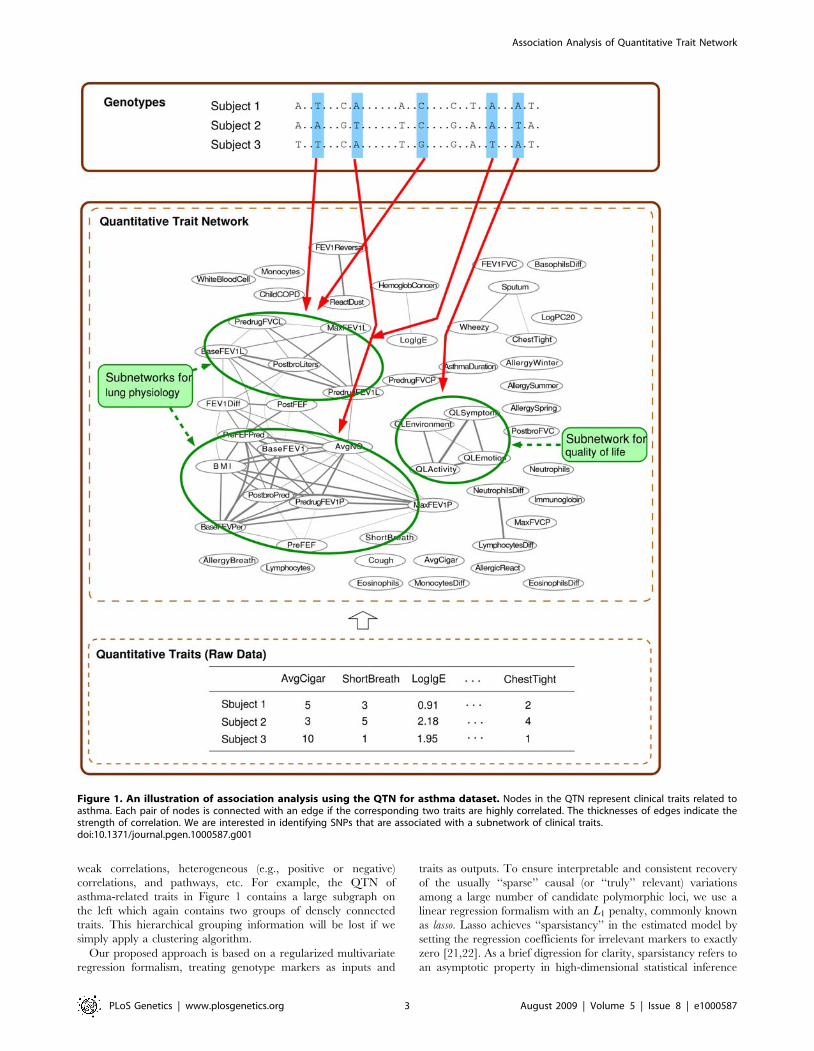
In Figure 1, the correlation structure of 53 clinical traits in an
asthma dataset collected as a part of the Severe Asthma Research
Program (SARP) [14] is represented as a quantitative trait network
(QTN). From a visual inspection of this network, it is apparent that
it contains several groups of inter-correlated traits that are
connected with weighted edges among them. Further investigation
reveals that each subnetwork in this QTN corresponds to different
clinical aspects of asthma, such as quality of life (the nodes for
QLEnvironment, QLSymptom, QLEmotion, and QLActivity),
asthma symptoms (the nodes for Wheezy, Sputum, ChestTight),
and lung physiology (the nodes for BaseFEV1, PreFEFPred,
PostbroPred, PredrugFEV1P, MaxFEV1P, etc.). It is natural for
one to suspect that such highly correlated traits in a subnetwork
may share some common genetic causes, and that analyzing a
group of traits in each subnetwork jointly rather than each trait
independently may help to better uncover such causes.
Recent advances in high-throughput sequencing and molecular
profiling technologies have made it both affordable and efficient to
observe DNA sequence variations over millions of genomic loci, to
measure the abundance of transcripts of virtually all known coding
sequences, and to measure a wide range of clinical traits in various
disease populations [5,6,15,16]. As more phenotype data are
available at a phenome scale, one immediate methodological
challenge arising in the analysis is how to detect joint associations
between a polymorphic marker to a phenome of multiple
correlated traits. Indeed, there has been a lack of statistical tools
for a joint analysis of multivariate traits, related via a QTN, in a
principled manner. In QTL mapping studies with pedigree data, a
principal component analysis (PCA) has been applied to extract
the components that explain the majority of the variation among
traits, and a single-trait association analysis has been performed on
each of the transformed trait separately [17,18]. However, this
approach involves only an indirect form of structural information
present in the traits, and has a limitation in that it is not obvious
how to interpret the derived phenotypes. In several previous
studies that incorporated a gene co-regulation network in a
genome-wide scan for associations [2,10,11], a heuristic procedure
was employed that combines results from two separate analyses,
one being traditional single-SNP/single-trait association tests and
the other being an ad hoc cluster analysis for finding gene modules
from the co-regulation network. Subsequently, each cluster would
undergo an examination to determine whether it contains a
significantly large fraction of genes that are mapped to a common
locus in the genome with a potential pleiotropic effect. This
primitive approach is essentially a multitude of single-marker/
single-trait analyses which involved no direct integration of
information across traits within a QTN during the association
tests themselves, since the clustering information was used only in
the post-processing step.
In a different approach to eQTL mapping, a module network
[19], which is a statistical model developed for uncovering
regulatory modules from gene expression data, was extended to
incorporate genotype information such that the expression levels of
genes regulated by the same regulator are explained by the
variations in both the expression levels of regulators and the
genotypes of markers in question [9,20]. This method estimated
modules and associations jointly by iterating between learning gene
modules through clustering and learning associations (i.e., which
genes and markers regulate the module). The expression levels of
genes in each module were summarized as an average of the
members within the module, and then this ‘‘average phenotype’’ was
mapped to genotypes and expression levels of other genes. However,
using an averaged value over traits in a module can lead to a
significant loss of information. For example, two genes in the same
module might be negatively correlated in their responses to the
common regulators, and an average of the two genes would conceal
their individual associations to the common regulators. Thus, this
method is not able to capture detailed relationships among multiple
correlated traits such as the asthma QTN in Figure 1.
We believe that explicitly incorporating the molecular and/or
clinical phenotype network as a trait correlation structure while
searching for genetic associations can significantly increase the
power of detecting pleiotropic effects. In this article, we present a
new statistical approach, called graph-guided fused lasso (GFlasso),
that can effectively address the general problem of association
mapping of multivariate traits related as a quantitative trait
network. Instead of using a two-stage method that performs single-
trait analyses and combines the results afterwards in light of
clusters of traits, our method directly infers markers with a
pleiotropic effect by combining information across multiple traits
in a single statistical framework, and does not require subnetworks
or trait clusters to be extracted a priori or at any point of running
the algorithm. The proposed GFlasso approach represents the
correlation pattern in multiple traits explicitly as a QTN, and
searches for genotype markers that are significantly and jointly
associated with multiple highly correlated traits that often appear
as a densely connected subnetwork within the whole network.
Indeed, the extent of the ‘‘jointness’’ in a marker-to-multitrait
association is automatically determined by the connectivities
among traits in the QTN, and is subject to the modulation of
the strengths of the trait correlations. Thus, the clustering
information is just one form of relationship implicitly captured
in the network, as the QTN is strictly richer than a trait-cluster. In
addition, a QTN may carry other relational information such as
Author Summary
An association study examines a phenotype againstgenotypic variations over a large set of individuals inorder to find the genetic variant that gives rise to thevariation in the phenotype. Many complex diseasesyndromes consist of a large number of highly relatedclinical phenotypes, and the patient cohorts are routinelysurveyed with a large number of traits, such as hundredsof clinical phenotypes and genome-wide profiling ofthousands of gene expressions, many of which arecorrelated. However, most of the conventional approachesfor association mapping or eQTL analysis consider a singlephenotype at a time instead of taking advantage of therelatedness of traits by analyzing them jointly. Assumingthat a group of tightly correlated traits may share acommon genetic basis, in this paper, we present a newframework for association analysis that searches forgenetic variations influencing a group of correlated traits.We explicitly represent the correlation information inmultiple quantitative traits as a quantitative trait networkand directly incorporate this network information to scanthe genome for association. Our results on simulated andasthma data show that our approach has a significantadvantage in detecting associations when a geneticmarker perturbs synergistically a group of traits.
Association Analysis of Quantitative Trait Network
PLoS Genetics | www.plosgenetics.org 2 August 2009 | Volume 5 | Issue 8 | e1000587
weak correlations, heterogeneous (e.g., positive or negative)
correlations, and pathways, etc. For example, the QTN of
asthma-related traits in Figure 1 contains a large subgraph on
the left which again contains two groups of densely connected
traits. This hierarchical grouping information will be lost if we
simply apply a clustering algorithm.
Our proposed approach is based on a regularized multivariate
regression formalism, treating genotype markers as inputs and
traits as outputs. To ensure interpretable and consistent recovery
of the usually ‘‘sparse’’ causal (or ‘‘truly’’ relevant) variations
among a large number of candidate polymorphic loci, we use a
linear regression formalism with an L1 penalty, commonly known
as lasso. Lasso achieves ‘‘sparsistancy’’ in the estimated model by
setting the regression coefficients for irrelevant markers to exactly
zero [21,22]. As a brief digression for clarity, sparsistancy refers to
an asymptotic property in high-dimensional statistical inference
Figure 1. An illustration of association analysis using the QTN for asthma dataset. Nodes in the QTN represent clinical traits related toasthma. Each pair of nodes is connected with an edge if the corresponding two traits are highly correlated. The thicknesses of edges indicate thestrength of correlation. We are interested in identifying SNPs that are associated with a subnetwork of clinical traits.doi:10.1371/journal.pgen.1000587.g001
Association Analysis of Quantitative Trait Network
PLoS Genetics | www.plosgenetics.org 3 August 2009 | Volume 5 | Issue 8 | e1000587
that for an estimator of a p-dimensional vector ~hh from nindependent and identically-distributed samples, where p&n, the
probability of recovering the true non-zero elements
S~fi : hi=0g in the estimator approaches one in the limit, if
the true non-zero elements are sparse in the sense that jSjƒn%p[22]. This property of lasso makes it a natural approach for
genome-wide association analysis, where the (sparse) set of markers
having non-zero regression coefficients are interpreted as the
markers truly associated with the phenotype. However, when
applied to an association mapping with multivariate traits, lasso is
equivalent to a single-trait analysis that needs to be repeated over
every single trait [23]. In other words, for a collection of possibly
related traits, each trait would be treated as independent of all of
the other traits, and regressed on a common set of marker
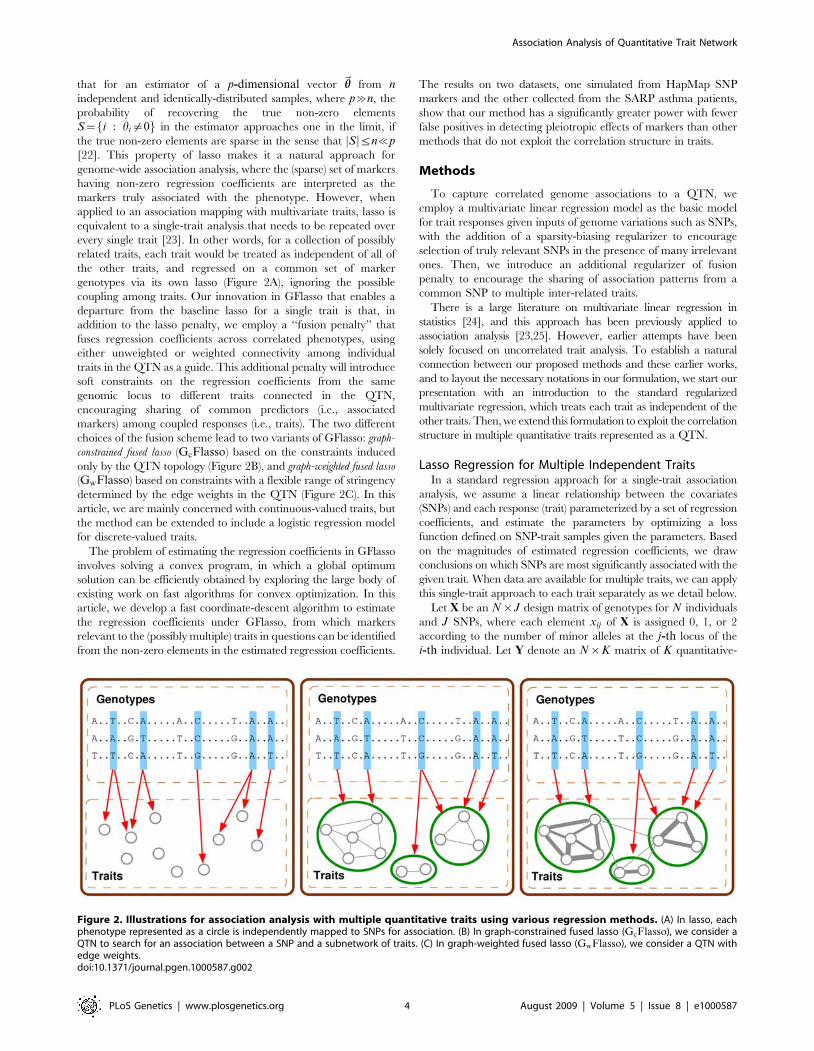
genotypes via its own lasso (Figure 2A), ignoring the possible
coupling among traits. Our innovation in GFlasso that enables a
departure from the baseline lasso for a single trait is that, in
addition to the lasso penalty, we employ a ‘‘fusion penalty’’ that
fuses regression coefficients across correlated phenotypes, using
either unweighted or weighted connectivity among individual
traits in the QTN as a guide. This additional penalty will introduce
soft constraints on the regression coefficients from the same
genomic locus to different traits connected in the QTN,
encouraging sharing of common predictors (i.e., associated
markers) among coupled responses (i.e., traits). The two different
choices of the fusion scheme lead to two variants of GFlasso: graph-
constrained fused lasso (GcFlasso) based on the constraints induced
only by the QTN topology (Figure 2B), and graph-weighted fused lasso
(GwFlasso) based on constraints with a flexible range of stringency
determined by the edge weights in the QTN (Figure 2C). In this
article, we are mainly concerned with continuous-valued traits, but
the method can be extended to include a logistic regression model
for discrete-valued traits.
The problem of estimating the regression coefficients in GFlasso
involves solving a convex program, in which a global optimum
solution can be efficiently obtained by exploring the large body of
existing work on fast algorithms for convex optimization. In this
article, we develop a fast coordinate-descent algorithm to estimate
the regression coefficients under GFlasso, from which markers
relevant to the (possibly multiple) traits in questions can be identified
from the non-zero elements in the estimated regression coefficients.
The results on two datasets, one simulated from HapMap SNP
markers and the other collected from the SARP asthma patients,
show that our method has a significantly greater power with fewer
false positives in detecting pleiotropic effects of markers than other
methods that do not exploit the correlation structure in traits.
Methods
To capture correlated genome associations to a QTN, we
employ a multivariate linear regression model as the basic model
for trait responses given inputs of genome variations such as SNPs,
with the addition of a sparsity-biasing regularizer to encourage
selection of truly relevant SNPs in the presence of many irrelevant
ones. Then, we introduce an additional regularizer of fusion
penalty to encourage the sharing of association patterns from a
common SNP to multiple inter-related traits.
There is a large literature on multivariate linear regression in
statistics [24], and this approach has been previously applied to
association analysis [23,25]. However, earlier attempts have been
solely focused on uncorrelated trait analysis. To establish a natural
connection between our proposed methods and these earlier works,
and to layout the necessary notations in our formulation, we start our
presentation with an introduction to the standard regularized
multivariate regression, which treats each trait as independent of the
other traits. Then, we extend this formulation to exploit the correlation
structure in multiple quantitative traits represented as a QTN.
Lasso Regression for Multiple Independent TraitsIn a standard regression approach for a single-trait association
analysis, we assume a linear relationship between the covariates
(SNPs) and each response (trait) parameterized by a set of regression
coefficients, and estimate the parameters by optimizing a loss
function defined on SNP-trait samples given the parameters. Based
on the magnitudes of estimated regression coefficients, we draw
conclusions on which SNPs are most significantly associated with the
given trait. When data are available for multiple traits, we can apply
this single-trait approach to each trait separately as we detail below.
Let X be an N|J design matrix of genotypes for N individuals
and J SNPs, where each element xij of X is assigned 0, 1, or 2
according to the number of minor alleles at the j-th locus of the
i-th individual. Let Y denote an N|K matrix of K quantitative-
Figure 2. Illustrations for association analysis with multiple quantitative traits using various regression methods. (A) In lasso, eachphenotype represented as a circle is independently mapped to SNPs for association. (B) In graph-constrained fused lasso (GcFlasso), we consider aQTN to search for an association between a SNP and a subnetwork of traits. (C) In graph-weighted fused lasso (GwFlasso), we consider a QTN withedge weights.doi:10.1371/journal.pgen.1000587.g002
Association Analysis of Quantitative Trait Network
PLoS Genetics | www.plosgenetics.org 4 August 2009 | Volume 5 | Issue 8 | e1000587
trait measurements over the same set of individuals. We use yk to
denote the k-th column (i.e., the k-th trait) of Y. A conventional
single-trait association via linear regression model can be applied
to this multiple-trait setting by fitting the model to X and each of
the K traits yk0s separately:
yk~Xbkzek, k~1, . . . ,K, ð1Þ
where bk:½b1k, . . . ,bJk�T is a column vector of regression
coefficients for the k-th trait that can be used in a statistical test
to detect SNP markers with a significant association, and ek is a
column vector of N independent error terms with mean 0 and a
constant variance. We center each column of X and Y such thatXiyik~0 and
Xixij~0, and consider the model in Eqn 1
without an intercept. Then, an estimate of B~fb1, . . . ,bKg can
be obtained by minimizing the residual sum of squares:
BB~argminX
k
(yk{Xbk)T :(yk{Xbk): ð2Þ
The set of SNPs associated with the k-th trait can be uncovered
from the non-zero elements of the estimated coefficient vector bk,
i.e., Sk:fj : bbjk=0g.In a typical genome-wide association mapping, one examines a
large number of marker loci with the goal of identifying only a
small number of markers associated with the given phenotype. A
naive application of the method in Eqn 2 to association mapping
with large J can cause several problems such as an unstable
estimate of regression coefficients and a poor interpretability of Sk
due to many irrelevant markers with non-zero regression
coefficients. In order to handle the situation with large J, sparse
regression methods such as forward stepwise selection [26], ridge
regression [25,27], and lasso [21] have been proposed. The main
idea behind these methods is to select a relatively small subset of
markers (or covariates) as associated with the trait, and set the
regression coefficients for the rest of the markers to zero. Forward
stepwise selection method iteratively selects one relevant marker at
a time while trying to improve the model fit based on Eqn 2.
However, it may not produce an optimal solution because of the
greedy nature of the algorithm. A different approach based on
regularization performs the selection in a continuous space by
penalizing the residual sum of squares in Eqn 2 with an Lq norm
(qw0) of bk0s and shrinking the regression coefficients toward
zero. For example, ridge regression is one such method that uses
an L2 norm. However, it only shrinks the regression coefficients
for irrelevant markers toward zero, and does not set them exactly
to zero. We use lasso that employs an L1 norm as a penalty
because it has the property of setting the parameters for irrelevant
markers exactly to zero. The lasso estimate of the regression
coefficients can be obtained by solving the following
L1-regularized linear regression:
BBlasso~argminX
k
(yk{Xbk)T :(yk{Xbk)zlX
k,j
jbjkj; ð3Þ
where l is a regularization parameter that controls the amount of
sparsity in the estimated regression coefficients. Setting l to a large
value increases the amount of penalization, setting more regression
coefficients to zero. Several efficient algorithms are available for
solving the optimization problem defined by Eqn 3 [21,28].
The lasso for multiple-trait association mapping defined in Eqn
3 is equivalent to solving a set of K independent regressions for
each trait with its own L1 penalty. In other words, it does not
provide any mechanism to combine information across multiple
traits such that the estimates BBlasso reflect the potential relatedness
in the regression coefficients for those correlated traits in the QTN
that can be potentially influenced by common SNPs. Below, we
extend the standard lasso and propose new penalized regression
methods for detecting markers with pleiotropic effect on correlated
quantitative traits.
Graph-Guided Fused Lasso for Multiple Correlated TraitsIn order to estimate the association strengths jointly for multiple
correlated traits while maintaining sparsity, we introduce another
penalty term called graph-guided fusion penalty into the lasso
framework. This novel penalty makes use of the complex
correlation pattern among the traits represented as a QTN, and
encourages the traits which appear highly correlated in the QTN
to be influenced by a common set of genetic markers. Thus, the
GFlasso estimate of the regression coefficients reveals joint
associations of each SNP with the correlated traits in the entire
subnetwork as well as associations with each individual trait.
We assume that a QTN, denoted by G, with a set of nodes Vand a set of edges E is available from a pre-processing step. Each
edge (m,l)[E in QTN G is associated with a weight that
corresponds to some measures of strength of the correlation
between the two nodes connected by the edge. In this article, we
adopt a simple and commonly-used approach for inferring a QTN
from data, where we first compute pairwise Pearson correlation
coefficients for all pairs of phenotypes using yk0s, and then connect
two nodes with an edge if their correlation coefficient is above a
given threshold r. The weight of each edge (m,l)[E is set to the
absolute value of the correlation coefficient, jrml j. This thresholded
correlation graph is also known as a relevance network, and has been
widely used as a representation of gene interaction networks
[29,30]. Other variations of the standard relevance network have
been suggested [31], and any of these QTNs as well as various
other methods for learning a QTN can also be used within our
proposed regression methods. The inference of a QTN and the
definition of a node-correlation score are left as a user-specified
option, and therefore, are not the main focus in this paper.
Below, we first introduce GcFlasso that makes use of only the
information of graph topology, and then, further extend this
method to GwFlasso to take into account the full information in
the QTN including edge weights.
Model I: GcFlassoGiven a QTN, it is reasonable to assume that if two traits are
highly correlated and connected with an edge in the QTN, their
variations across individuals are more likely to be explained by
genetic variations at the same loci. In GcFlasso, this bias is
encoded as an additional penalty term that encourages a fusion of
two regression coefficients bjm and bjl for each SNP marker j if
traits m and l are connected with an edge in the QTN, as follows:
BBGC~argminX
k
(yk{Xbk)T :(yk{Xbk)
zlX
k
X
j
jbjkjzcX
(m,l)[E
X
j
jbjm{sign(rml)bjl j,ð4Þ
where l and c denote the regularization parameters that determine
the amount of penalization from sparsity and fusion, respectively.
The last term in Eqn 4 is called a fusion penalty [32], also known as
a total variation cost in other contexts, and encourages (but does not
strictly enforce) bjm and sign(rml)bjl to take the same value by
Association Analysis of Quantitative Trait Network
PLoS Genetics | www.plosgenetics.org 5 August 2009 | Volume 5 | Issue 8 | e1000587
shrinking the difference between them toward zero. As a result, the
fusion penalty tends to flatten the values of regression coefficients for
each marker across multiple highly correlated phenotypes, so that
the strength of influence of each marker becomes similar across
those traits. We assume that if two traits m and l connected with an
edge in G are negatively correlated with rmlv0, the effect of each
marker on those traits takes an opposite direction, and we fuse bjm
and ({bjl), or equivalently, bjm and sign(rml)bjl . A larger value for
c leads to a greater fusion effect, or greater sparsity in
jbjm{sign(rml)bjl j0s.
The idea of using a fusion penalty has been first proposed in the
classical regression problem for a univariate response (i.e., single
output) and high-dimensional covariates to fuse the regression
coefficients of two adjacent covariates when the covariates are
assumed to be ordered such as in time [32]. This corresponds to
coupling pairs of elements in the adjacent rows of the same column
in the J|K coefficient matrix B in Eqn 4. In GcFlasso, we
employ a similar strategy in a multiple-output regression in order
to identify pleiotropic effect of markers. Now, we let the QTN
determine which pairs of regression coefficients should be fused,
and for each edge, fuse every such coupled coefficient pair that
corresponds to the elements of the corresponding two columns in
the same row of matrix B in Eqn 4. It is possible to show the
asymptotic properties of estimators of the GFlasso methods as
N?? analogous to the ones previously shown for lasso and fused
lasso [32,33]. Recall that in genetic association mapping, our main
goal is to recover the set of SNPs that are truly relevant to the traits
in question, rather than the strengths of the associations captured
by the magnitudes of elements in BB. Thus, for the k-th trait, the set
of associated SNPs can be recovered from BB as Sk:fj : bbjk=0g.When applied locally to a pair of regression coefficients for each
edge (m,l)[E in the QTN, the fusion penalty can combine
information across the two correlated traits for the given edge to
potentially increase power for detecting true associations while
reducing false positives. For example, if two traits connected by an
edge in the QTN are only weakly affected by a common SNP, the
fusion penalty for the corresponding edge can combine the two weak
signals, and detect the associations that might have been missed
under a single-trait analysis. Similarly, the information of a SNP
being irrelevant is combined across two correlated traits connected
with an edge, and both of the two regression coefficients for the
irrelevant SNP are fused to zero, resulting in fewer false positives.
When this edge-level fusion penalty is applied to all of the edges in
the entire QTN as in the graph-guided fusion penalty, the overall
effect is that GcFlasso discovers associations between a SNP and a
phenome as well as associations between a SNP and a single
phenotype. This is because for each edge in the QTN, the fusion
effect propagates through the neighboring edges, fusing the regression
coefficients for each pair of traits connected by an edge, where the
amount of such propagation is determined by the level of local edge
connectivities. For example, within the subnetwork of densely
connected traits that form a phenome, the fusion is effectively
applied to all of its member traits, leading to an association with the
phenome. On the other hand, if the edge connections are sparse
within a subset of nodes in the QTN because of weak correlations
among them, there will be little propagation of the fusion effect
through the edges in the subgroup. As we demonstrate in the
experiments, in the GFlasso estimate of B, the set of non-zero
regression coefficients tends to show a block structure with the same
or similar values across correlated traits (or a phenome) for each
genotype marker. Unlike other previous approaches for detecting the
pleiotropic effect, which usually first apply some clustering algorithms
to learn subgroups of traits and then search for genetic variations that
perturb each subgroup, GcFlasso uses the full information on the
correlation structure in the QTN, where the subgroup information is
embedded implicitly within the QTN as densely connected
subgraphs. Thus, GcFlasso incorporates the subgrouping informa-
tion from the QTN in a more flexible manner compared to previous
approaches based on a clustering algorithm.
Although, in principle, the graph-guided fusion penalty has a
smoothing effect on the rows of BB, and encourages similar
magnitudes of the association strengths from a given SNP to traits
within a densely connected subgraph, the application of GcFlassoand other GFlasso methods described in the sequel does not strictly
require the association strengths of each SNP to be identical across
all correlated traits in the observed data. We emphasize that the
GcFlasso penalty introduces a bias favoring closeness in the
magnitudes of the regression coefficients for correlated traits rather
than enforcing a hard constraint that the fused regression
coefficients must have the same value. In a high-dimensional
problem with many irrelevant SNPs, the benefit of this bias is often
greater than the potential disadvantage of obtaining biased (or
fused) results, if the appropriate amount of bias is introduced as
determined by the regularization parameters. Just as lasso achieves a
sparsity bias of the regression coefficients through the L1 penalty,
the fusion penalty plays the role of achieving another type of bias,
the sparsity in the differences of regression coefficients, by combining
information among multiple correlated traits according to the
topology of the QTN. As we demonstrate in our simulation study, in
a typical association study that involves many irrelevant SNPs, this
bias towards sparsity in the difference of regression coefficients for
neighboring traits helps increase power while reducing false
positives, since the information of a SNP being relevant or irrelevant
is shared across traits. A balance among the three terms in Eqn 4
that jointly define the objective function, the regression error, the
sparsity penalty, and the fusion penalty, will be reached if the
optimal regularization parameters l and c are used when estimating
BB. As we describe in the next section, such regularization
parameters can be chosen automatically through cross-validation.
Model II: GwFlassoNow, we describe an enhanced version of GcFlasso, the
GwFlasso, which exploits not only the graph topology of a QTN,
but also the edge weights thereof. The GwFlasso method weights
each term in the fusion penalty in Eqn 4 by the amount of correlation
between the two traits being fused, so that the amount of correlation
controls the amount of fusion for each edge. More generally,
GwFlasso weights each term in the fusion penalty with a
monotonically increasing function of the absolute values of correla-
tions, and finds an estimate of the regression coefficients as follows:
BBGW~argminX
k
(yk{Xbk)T :(yk{Xbk)
zlX
k
X
j
jbjkjzcX
(m,l)[E
f (rml)X
j
jbjm{sign(rml)bjl j,ð5Þ
from which the set of QTLs Sk,Vk can be uncovered. If the two traits
m and l are highly correlated in the QTN G with a relatively large
edge weight, the fusion effect over the two traits will intensify, and as a
result the difference between the two corresponding regression
coefficients bjm and bjl will be penalized more than those for other
pairs of traits with weaker correlation. In this article, we consider
f1(r)~jrj for G1wFlasso and f2(r)~r2 for G2
wFlasso. We note that
the GcFlasso is a special case of the GwFlasso with f (r)~1.
Compared to GcFlasso, GwFlasso is significantly more flexible
due to its usage of the edge weights to incorporate the strength of
correlation. For example, when two groups of highly correlated
Association Analysis of Quantitative Trait Network
PLoS Genetics | www.plosgenetics.org 6 August 2009 | Volume 5 | Issue 8 | e1000587

traits show a relatively weaker correlation across the two
subnetworks, GwFlasso can handle the hierarchical subgroup
structure and adjust the amount of fusion accordingly by weighting
each fusion term. In addition, when the association strength of a
SNP with pleiotropic effect varies over traits in a subnetwork,
GwFlasso can use different levels of correlations for different pairs
of traits to adjust the amount of fusion in GwFlasso. In this case,
GwFlasso tends to identify multiple blocks of fused regression
coefficients within the subnetwork, instead of a single block.
The Optimization AlgorithmThe optimization problems in Eqn 4 and Eqn 5 are convex, and
can be formulated as a quadratic programming problem using the
similar approach for solving the fused lasso problem [32].
Although there are many publicly available software packages
that efficiently solve such quadratic programming problems, these
approaches do not scale in terms of computation time to a large
problem involving hundreds or thousands of traits as is the case in
a typical multiple-trait association study [34]. Since the main
difficulty of directly optimizing Eqn 4 and Eqn 5 arises from the
non-smooth function of the L1 norm, we transform this problem to
an equivalent form that involves only smooth functions [35,36],
and use a fast coordinate-descent algorithm to find the estimates of
regression coefficients.
In this section, we describe a procedure for obtaining estimates
of the regression coefficients in GwFlasso. Since GcFlasso is a
special case of GwFlasso with f (r)~1, the same procedure can be
applied to GcFlasso in a straight-forward manner. It can be
shown that solving the optimization problem in Eqn 5 is
equivalent to solving the following problem with a smooth
function of L2-norm [35,36]:
GwFlasso : minb k , djk , djml
X
k
(yk{Xbk)T :(yk{Xbk)
zlX
j,k
(bjk)2
djk
zcX
(m,l)[E
f (rml)2X
j
(bjm{sign(rml)bjl)2
djml
ð6Þ
subject to :X
j,k
djk~1,X
(m,l)[E
X
j
djml~1,
djk§0 for all j, k,
djml§0 for all j, (m,l)[E,
where djk0s and djml
0s are additional variables that we need to
estimate. We solve the above problem using a coordinate-descent
approach that iteratively updates variables of interest, bk0s, and (djk
0s,
djml0s), until there is little improvement in the value of the objective
function. Using this approach, we first fix values of djk0s and djml
0s,
and find the update equation for bjk0s by differentiating the objective
function in Eqn 6 with respect to each bjk and setting it to 0. The
update formula for each bjk is given as:
bjk~fX
i
xij(yik{X
j’=j
xij’bj’k)
zc(X
(k,l)[E
f (rkl)2sign(rkl)bjl
djkl
zX
(m,k)[E
f (rmk)2sign(rmk)bjm
djmk
)g
=fX
i
x2ijz
l
djk
zcX
(k,l)[E
f (rkl)2
djkl
zcX
(m,k)[E
f (rmk)2
djmk
g:
Then, we fix bjk0s, and optimize Eqn 6 over djk
0s and djml0s using
the following update equations:
djk~jbjkjPj’,a jbj’aj
,
djml~f (rml)jbjm{sign(rml)bjl jP
(a,b)[E
Pj’
f (rab)jbj’a{sign(rab)bj’bj:
This coordinate-descent procedure finds the optimal bk0s for fixed
regularization parameters, l and c. The regularization parameters
l and c can be determined automatically by a cross-validation or
by using a validation set, as was suggested for fused lasso [32]. We
divide the dataset into two groups, a training set and a validation
set, and estimate the regression coefficients using the training set
by running the coordinate-descent procedure on a grid of the
regularization parameters l and c, and select the l and c that give
the regression coefficients with the lowest squared error on the
validation set. Given the regularization parameters that we chose
in this manner, we use the combined dataset of both the training
and validation sets in order to obtain the final estimate of the
regression coefficients.
The coordinate-descent algorithm for GwFlasso runs reason-
ably fast for fixed l and c, but for a large problem, this type of grid
search can be time-consuming. In order to improve the efficiency
in computation time, we take a gradient-descent approach that
iteratively updates l and c until we reach convergence with little
additional improvement in the cross-validation error C(l,c) as we
describe below. Given the values of the regularization parameters
at the t-th iteration (l(t),c(t)), we obtain (l(tz1),c(tz1)) as follows:
(l(tz1),c(tz1))/(l(t),c(t)){g+C(l(t),c(t)),
where the gradient +C(l(t),c(t)) is approximated by a finite
difference vector
+C(l(t),c(t))~(C(l(t)zh,c(t)){C(l(t),c(t))
h,C(l(t),c(t)zh){C(l(t),c(t))
h):
The term C(l,c) in the above equation can be evaluated by solving
Eqn 6 with the given l and c.
We determine the initial values l(0) and c(0) for the gradient
descent as follows. We first search for l(0) that produces the
minimum cross-validation error by solving lasso with c~0. Then,
we fix l at l(0), and perform another one-dimensional search in
the direction of c, starting from 0 to find the optimal c(0) for
GwFlasso along this path. In our experiments, we found that the
initial values obtained by this procedure was sufficiently close to
the global optimum, and that it converged to the optimum within
a relatively small number of iterations. Figure 3 shows a typical
example of cross-validation errors over the grid of (l,c) from
GwFlasso. In our experiments, we found that our gradient-
descent type of method converged roughly to the same values for
the l and c as were selected by the grid search method.
Results
Simulation StudyWe performed a simulation study to evaluate the power of the
proposed GFlasso methods, and compared the results with those
Association Analysis of Quantitative Trait Network
PLoS Genetics | www.plosgenetics.org 7 August 2009 | Volume 5 | Issue 8 | e1000587

from single-marker/single-trait regression analyses as well as other
multivariate regression methods.
We simulated genotype data of 50 SNPs for 250 individuals
based on the HapMap data [15] in the region of 8.79–9.20 M in
chromosome 7. The first 60 individuals came from the parents of
the HapMap CEU panel. We generated genotypes for additional
190 individuals by randomly mating the original 60 individuals
from the CEU panel. Since our primary goal was to evaluate the
advantage of exploiting correlation among multiple traits by using
GFlasso, we sampled 50 SNPs randomly from the 697 SNPs in the
region in order to reduce the correlation among SNPs from the
linkage disequilibrium (LD). We included only those SNPs with
minor allele frequencies greater than 0.1.
Given the simulated genotype, we set the number of phenotypes
to 10, and simulated the matrix of true regression coefficients by
first choosing SNP-trait pairs with true associations and assigning
values for the strengths of associations for the selected pairs as we
describe below. We assumed three groups of correlated traits of
sizes 3, 3, and 4. Three causal SNPs were randomly selected for
the first group of traits, and four causal SNPs were selected for
each of the other two groups, so that the shared relevant SNPs
induce correlation among the traits within each cluster. In
addition, we assumed another causal SNP for traits in both of
the first two clusters in order to model the situation of a higher-
level correlation structure across two subnetworks. Finally, we
assumed one additional causal SNP for all of the phenotypes. In
our simulation study, we assumed that shared causal SNPs are the
only factors that induce correlations among traits, although in
general there might be other genotypic effects or environmental
factors that influence the correlation structure among traits.
Once the SNP-trait pairs with true association were selected, we
considered the following two cases of association strengths for
these pairs, while setting the rest of the regression coefficients to 0.
N Case 1. The regression coefficients for all of the SNP-trait
pairs with true association were set to the same value. This
corresponds to the situation where the basic assumption of the
fusion penalty holds, and each SNP has the same effect across
the traits in each subnetwork.
N Case 2. The regression coefficients for the SNP-trait pairs with
true associations were set to different values randomly generated
from a uniform distribution over an interval ½a,b�. Here, our goal
is to see whether the GFlasso methods have the flexibility to
adjust the effect of fusion penalty in order to introduce an
appropriate amount of bias without sacrificing the power.
Then, we simulated phenotype data based on the linear
regression model with noise distributed as N(0,1), using the
simulated genotypes as covariates.
We compared the results from the GFlasso methods with those
from other methods given below:
N Single-SNP/single-trait regression analysis. We
used ({log p-valueð Þ) for each SNP-trait pair as a measure
of strength of association.
N Regularized multivariate regression methods fora single output such as ridge regression andlasso. These methods do not take into account the
correlation structure in traits. We used a validation set to
select the regularization parameter. The absolute values of the
regression coefficients were used as a measure of association
strength.
N PCA-based regression method for taking into accounttrait correlations. This method first transforms the output
variables (traits) into a smaller number of variables that explain
most of the variability in the original data, performs a standard
multivariate regression on each of the transformed output
separately, and then transforms the estimated regression
coefficients back into the original space [17,18]. Although it
considers the trait correlation structure through PCA, the
structural information in this approach is less explicit than in the
GFlasso methods. We used lasso as a sparse multivariate
regression method in the transformed output space. Again, the
absolute values of the regression coefficients were used as a
measure of association strength.
For methods that require a specification of the values of the
regularization parameters such as ridge regression, lasso, and the
GFlasso methods, we used (N{30) samples out of the total Nsamples as a training set, and the remaining 30 samples as a
validation set. Once we determined the regularization parameters,
we used the entire dataset of size N to estimate the final regression
coefficients given the selected regularization parameters.
As an illustrative example of the behaviors of the different methods,
a graphical display of the QTN and the estimated QTL sets fSkg for
all K traits in the QTN is presented in Figure 4 for a simulated dataset
of N~100 samples, with association strengths (i.e., regression
coefficients bjk0s) all set to 0.8 for SNP-trait pairs with true associations
(Case 1). The 10|10 trait correlation matrix in Figure 4A shows
blocks of correlated traits. Using a threshold r~0:3, we obtained a
QTN in Figure 4B, where the black pixels in the lower triangular part
indicate the presence of edges between two traits. Given the true
regression coefficients in Figure 4C, we recovered the SNP-trait pairs
with true association using our methods and competing ones
mentioned above. It is apparent from Figure 4 that many false
positives show up in the results of the single-marker/single-trait
analyses, multivariate regression methods, and the PCA-based method.
Furthermore, these reference benches do not identify the block
structure of SNPs affecting multiple traits jointly, which is clear in the
true regression coefficients. On the other hand, the results from
GcFlasso in Figures 4I–K show fewer false positives, and reveal clear
block structures. This experiment suggests that borrowing information
Figure 3. Cross-validation error surface over a grid ofregularization parameters (l ,ª ) from GwFlasso. Our goal is tofind values for l and c that give the lowest cross-validation error. Weuse a gradient-descent type of search algorithm to explore this surfaceof cross-validation error.doi:10.1371/journal.pgen.1000587.g003
Association Analysis of Quantitative Trait Network
PLoS Genetics | www.plosgenetics.org 8 August 2009 | Volume 5 | Issue 8 | e1000587

across correlated traits in a QTN, as in the GFlasso methods, can
significantly increase the power of discovering true causal SNPs. Since
GcFlasso uses an unweighted trait network, often the regression
coefficients for a given SNP have been fused excessively across traits
even between only weakly correlated traits, especially among the first
six traits on the upper left corner of Figure 4B that involve two smaller
subnetworks within the subnetwork. This undesirable property of
GcFlasso mostly disappeared when we incorporated the edge weights
in G1wFlasso and G2
wFlasso as shown in Figure 4J and Figure 4K.
Next, we systematically and quantitatively evaluated the
performance of the association methods based on two criteria,
sensitivity/specificity on the uncovered QTL sets Sk,Vk, and the
trait prediction error. The sensitivity and specificity measure
whether the given method can successfully detect the truly
associated SNPs with low false positives. The 1-specificity and
sensitivity are equivalent to type I error rate and 1-type II error rate,
respectively, and their plot is widely known as a receiver operating
characteristic (ROC) curve. Once we identify causal SNPs for a trait
related to disease susceptibility, we may want to use this information
to predict whether a new individual possessing the particular allele
at these causal SNP loci has an increased risk for the disease. The
trait prediction error measures the accuracy of this prediction by
evaluating the results of association analysis on a new set of
previously unseen individuals. In order to compute the prediction
error in our simulation study, we generated an additional dataset of
50 individuals, ynew and Xnew, and computed the phenotype
prediction error as the sum of squared differences between the true
values ynew and predicted values yynew of the phenotypes,Xk
(ynewk {yynew
k )’:(ynewk {yynew
k ), where yyknew~Xnew bbk. For both
criteria for measuring performance, we computed results averaged
over 50 randomly generated datasets. Below, we report the
performance of GFlasso under a wide spectrum of test conditions
likely to be encountered in a realistic genome-wide association
analysis of a QTN.
Varying Sample SizesFirst, we varied the sample size of the dataset to see how the sample
size affects the performance of the different methods for association
analysis. We used datasets of sizes 50, 100, 150, 200, and 250, with
association strength fixed at 0.5 for all associated SNP-trait pairs (Case
1), and we set the threshold r for trait correlations to be 0.3 to learn the
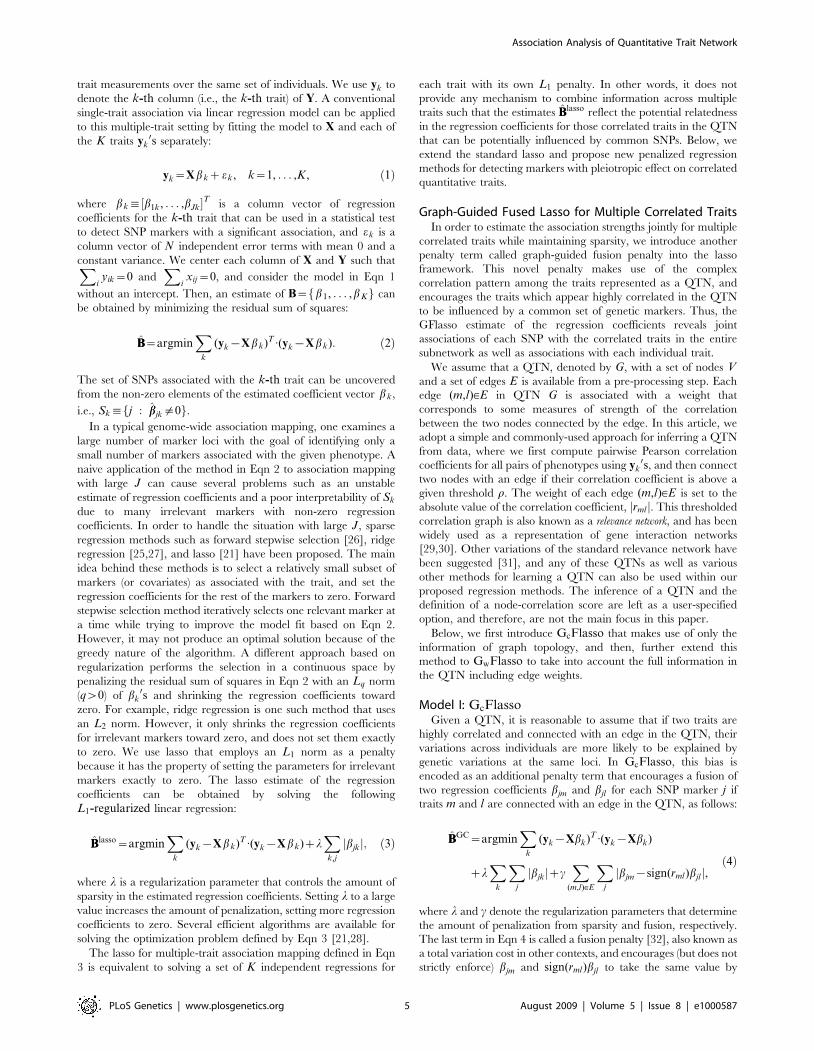
QTN. The results are summarized in Figure 5, where the ROC curves
were averaged over 50 datasets. The results confirmed that the lasso-
based methods such as lasso and GFlasso methods are more successful
in identifying true associations than the other methods. In addition, it
can be seen that the ROC curves for GcFlasso, G1wFlasso, and
Figure 4. Results of association analysis by different methods based on a single simulated dataset. Association strength 0.8 andthreshold r~0:3 for the QTN were used. (A) The 10|10 correlation coefficient matrix of traits. It contains three blocks of correlated traits of sizes 3, 3,and 4, respectively. (B) The correlation coefficient matrix in (A) thresholded at r~0:3. The black pixels in the lower triangular part of the matrixindicate edges included in GFlasso. (C) The true regression coefficients and sparsity pattern used in simulation. (D) {log p-valueð Þ, where p-valueswere obtained from single-SNP permutation tests performed for each phenotype separately. (E) Black pixels indicate SNP-trait pairs with significantassociation at a~0:01 based on the results of p-values in (D). Values of the estimated regression coefficients are shown for (F) ridge regression, (G)PCA-based regression, (H) lasso, (I) GcFlasso, (J) G1
wFlasso, and (K) G2wFlasso. In Panels (C)–(K), rows correspond to SNPs, and columns to
phenotypes. Columns for traits in (C)–(K) are aligned with the columns in (A) and (B).doi:10.1371/journal.pgen.1000587.g004
Association Analysis of Quantitative Trait Network
PLoS Genetics | www.plosgenetics.org 9 August 2009 | Volume 5 | Issue 8 | e1000587
G2wFlasso almost entirely overlap, whereas other methods are
significantly inferior. We found that across all sample sizes, including
a graph-guided fusion penalty as in GFlasso to take advantage of the
correlation structure in traits can significantly increase the power for
detecting true associations while reducing false positives, compared to
lasso and other methods.
Varying Signal-to-Noise RatiosWe examined how varying the signal-to-noise ratio affects the
performances of the different methods. We simulated datasets with
regression coefficients set to 0.3, 0.5, 0.8, and 1.0, respectively, with
sample size N~100. For each dataset, we set the values of the
regression coefficients to the same value (again, Case 1). A threshold of
r~0:1 was used to generate trait correlation networks. We applied
our methods and the other benchmark methods to recover the SNP-
trait pairs with true associations. The resulting ROC curves averaged
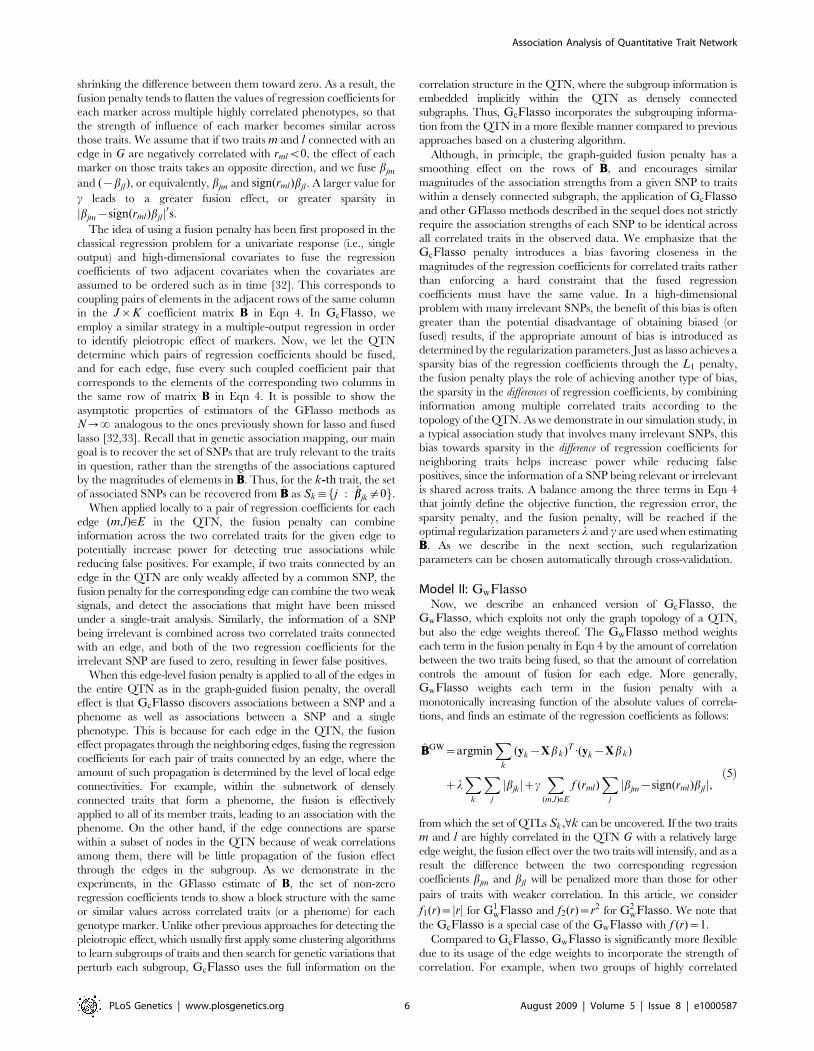
over 50 datasets are shown in Figure 6. It can be seen that the lasso-
based methods have a greater power with fewer false positives than the
other methods for all of the different signal-to-noise ratios. Among the
GFlasso methods, G1wFlasso and G2
wFlasso outperformed the other
methods for all of the four chosen association strengths. However, the
performance of GcFlasso was significantly compromised and became
worse than the standard lasso when the association strength was set to
high values of 0.8 and 1.0. This is because at the relatively low
threshold r~0:1, the QTN contained many edges between pairs of
traits that were only weakly correlated, and GcFlasso with
unweighted fusion penalty did not distinguish edges for strong
correlation from those for weak correlation. In contrast, G1wFlasso
and G2wFlasso had the flexibility to handle different strengths of trait
correlations in the QTN through a weighted fusion penalty, and
consistently outperformed the other methods.
Varying QTN Generation SchemesNext, we examined the sensitivity of the GFlasso methods to how
the trait correlation network is generated, by varying the threshold rof edge weights from 0.1 to 0.3, 0.5 and 0.7. With lower values of r,
more edges would be included in the QTN, some of which represent
only weak correlations. The purpose of this experiment was to see
whether the performance of the GFlasso methods is negatively
affected by the presence of these weak and possibly spurious edges
that were included due to noise rather than from a true correlation.
The results for QTL recovery averaged over 50 datasets with sample
size N~100 and association strength 0.8 (Case 1), are presented in
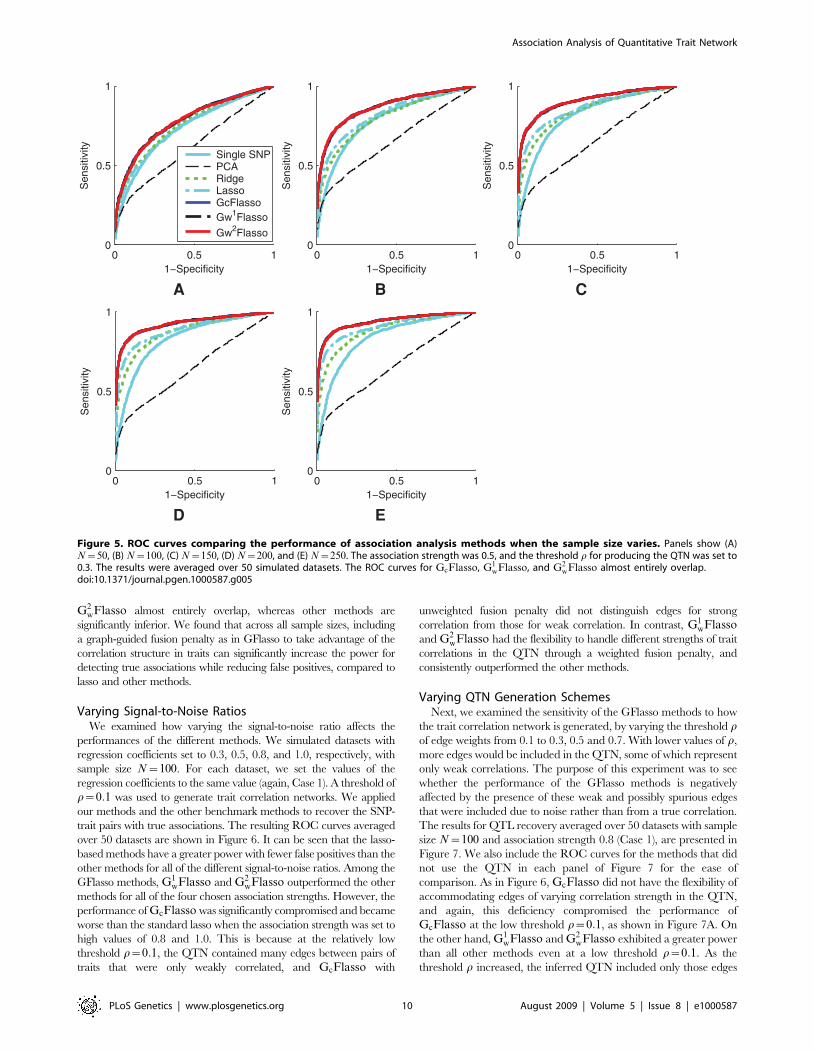
Figure 7. We also include the ROC curves for the methods that did
not use the QTN in each panel of Figure 7 for the ease of
comparison. As in Figure 6, GcFlasso did not have the flexibility of
accommodating edges of varying correlation strength in the QTN,
and again, this deficiency compromised the performance of
GcFlasso at the low threshold r~0:1, as shown in Figure 7A. On
the other hand, G1wFlasso and G2
wFlasso exhibited a greater power
than all other methods even at a low threshold r~0:1. As the
threshold r increased, the inferred QTN included only those edges
Figure 5. ROC curves comparing the performance of association analysis methods when the sample size varies. Panels show (A)N~50, (B) N~100, (C) N~150, (D) N~200, and (E) N~250. The association strength was 0.5, and the threshold r for producing the QTN was set to0.3. The results were averaged over 50 simulated datasets. The ROC curves for GcFlasso, G1
wFlasso, and G2wFlasso almost entirely overlap.
doi:10.1371/journal.pgen.1000587.g005
Association Analysis of Quantitative Trait Network
PLoS Genetics | www.plosgenetics.org 10 August 2009 | Volume 5 | Issue 8 | e1000587
with significant correlations. Thus, the performance of GcFlassoapproached that of G1
wFlasso and G2wFlasso, and the ROC curves
of the three methods in the GFlasso family overlapped almost
entirely (Figure 7B and Figure 7C). When the threshold became even
higher, e.g., r~0:7, the number of edges in the QTN became close
to 0, effectively removing the fusion penalty. As a result, the
performances of all of the graph-guided methods approached that of
lasso, and the four ROC curves became overlapping (Figure 7D).
Overall, we conclude that when flexible structured methods such as
G1wFlasso and G2
wFlasso are used, taking into account the
correlation structure in phenotypes improves the power of detecting
true causal SNPs regardless of the values for r. In addition, once the
QTN contains edges that capture strong correlations, including
more edges beyond this point by further lowering the threshold rdoes not significantly affect the performance of G1
wFlasso and
G2wFlasso.
Given the SNP-trait pairs that the association methods found as
associated, and the corresponding regression coefficients, we comput-
ed prediction errors to see if these SNPs with non-zero regression
coefficients had a predictive power for traits of previously unseen
individuals. Figure 8 shows the trait prediction error using the model
learned from the above experiments summarized in Figure 7. It can be
seen that G1wFlasso and G2
wFlasso generally offer a better predictive
power than other methods, except for the case where the set of edges
for the QTN becomes nearly empty due to the high correlation
threshold r~0:7 (Figure 8D). In this case, all of the GFlasso methods
and lasso performed similarly.
Variable Association Strength between a SNP andCorrelated Traits
Since the fusion penalty tends to fuse the regression coefficients
to be the same value within a densely connected subgraph, one
may suspect that the bias introduced by this penalty can reduce
the power when the true association strengths of a SNP to
different traits are not the same within each subgraph. In order to
examine how the performance is affected in this case, we
considered the situation where the association strengths of each
causal SNP are not uniform across traits within each subnetwork,
but vary within the interval of ½a,b� (Case 2). We experimented
with two different intervals [0.3, 0.6] and [0.6, 0.9], and
summarized the results in Figure 9. Sample size N~200 with
thresholds r~0:1 and 0.3 were used, and the ROC curves were
averaged over the 50 datasets. We found that GcFlassosometimes performed worse than lasso that does not take into
Figure 6. ROC curves comparing the performance of association analysis methods when the association strength varies. Panels showresults for association strength (A) 0.3, (B) 0.5, (C) 0.8, and (D) 1.0. The sample size was 100, and the threshold r for producing the QTN was set to 0.1.The results were averaged over 50 simulated datasets. In Panel (A), the ROC curves for GcFlasso, G1
wFlasso and G2wFlasso almost entirely overlap. In
Panel (B), the ROC curves for G1wFlasso and G2
wFlasso almost entirely overlap.doi:10.1371/journal.pgen.1000587.g006
Association Analysis of Quantitative Trait Network
PLoS Genetics | www.plosgenetics.org 11 August 2009 | Volume 5 | Issue 8 | e1000587

account the trait correlation structure, as can be seen in
Figure 9C. However, G1wFlasso and G2
wFlasso remained
dominating over the other methods. Our results suggest that
with the flexibility of the weighted fusion penalty as in G1wFlasso
and G2wFlasso, the benefit of borrowing information across
correlated traits outweighes the adverse effect of encouraging the
regression coefficients to be fused even when their values are not
the same.
Figure 7. ROC curves comparing association analysis methods when the threshold r for producing the QTN varies. Panels show thethreshold (A) r~0:1, (B) r~0:3, (C) r~0:5, and (D) r~0:7. The sample size was 100, and the association strength was 0.8. The results were averagedover 50 simulated datasets. In Panels (B) and (C), the ROC curves for GcFlasso, G1
wFlasso and G2wFlasso almost entirely overlap. In Panel (D), the ROC
curves for lasso, GcFlasso, G1wFlasso and G2
wFlasso almost entirely overlap.doi:10.1371/journal.pgen.1000587.g007
Figure 8. Comparison of association analysis methods in terms of phenotype prediction error. Panels show the prediction errors whenthe threshold r for producing the QTN is (A) r~0:1, (B) r~0:3, (C) r~0:5, and (D) r~0:7. The results were averaged over 50 simulated datasets. Thebox in each box plot shows the lower quartile, median, and upper quartile values, and the whiskers show the range of the prediction errors in the 50simulated datasets.doi:10.1371/journal.pgen.1000587.g008
Association Analysis of Quantitative Trait Network
PLoS Genetics | www.plosgenetics.org 12 August 2009 | Volume 5 | Issue 8 | e1000587

Computation Time and ScalabilityThe scalability of our methods can be assessed from Figure 10,
where the computation time for solving the optimization problem
for lasso, GcFlasso, G1wFlasso, and G2
wFlasso with fixed
regularization parameters is shown. In Figure 10A, the number
of traits in the QTN was fixed at 250, and the number of SNPs
varied over the illustrated range. With 100 SNPs and 250 traits,
the running time was around 20 minutes for the GFlasso methods,
suggesting that a sliding-window scheme along the genome would
be more reasonable for a whole-genome scan than considering all
of the SNPs in a single model. Figure 10B shows the time cost over
varying number of traits, with the total number of SNPs fixed at
50. We found that the GFlasso methods could handle at least
hundreds of traits reasonably well. For a large dataset with more
than several thousand traits, one might consider first breaking
down the whole network into smaller components and then
running GFlasso on each component separately.
Association Analysis of Polymorphisms in IL-4R Gene andSevere-Asthma Traits
We applied our methods to a dataset collected from 543 asthma
patients as a part of the Severe Asthma Research Program (SARP)
[14]. The genotype data were obtained for 34 SNPs within or near
the IL-4R gene that spans a 40 kb region on chromosome 16. This
gene has been previously shown to be implicated in severe asthma
[37]. We used the publicly available software PHASE [38] to
impute missing alleles and phase the genotypes. The phenotype
data included 53 clinical traits related to severe asthma such as age
of onset, family history, and severity of various symptoms. Our
goal was to examine whether any of the SNPs in the IL-4R gene
were associated with a subnetwork of correlated traits rather than
an individual trait. We standardized measurements for each
phenotype to have mean 0 and standard deviation 1 so that their
values were roughly in the same range across phenotypes.
Before searching for associations between SNPs and traits, we
first examined the correlation structure in the 53 clinical traits in
question. We first computed the pairwise correlations between
these traits as depicted in Figure 11A, and thresholded the
correlations at r~0:7 to obtain the QTN in Figure 1. The rows
and columns in the matrix in Figure 11A were ordered via an
agglomerative hierarchical clustering algorithm so that highly
correlated traits were next to each other in the linear ordering and
formed apparent blocks in the matrix corresponding to subsets of
highly inter-correlated traits. Recall that GcFlasso uses only edge
Figure 9. ROC curves comparing association analysis methods. The association strength of a causal SNP is not uniform across correlatedphenotypes that the SNP is associated with, and varies within the intervals of [0.3, 0.6] or [0.6, 0.9]. Panels show (A) association strength = [0.3, 0.6]when the threshold r~0:1 is used for QTNs, (B) association strength = [0.3, 0.6] when r~0:3, (C) association strength = [0.6, 0.9] when r~0:1, and (D)association strength = [0.6, 0.9] when r~0:3. The sample size was 200. The results were averaged over 50 simulated datasets.doi:10.1371/journal.pgen.1000587.g009
Association Analysis of Quantitative Trait Network
PLoS Genetics | www.plosgenetics.org 13 August 2009 | Volume 5 | Issue 8 | e1000587

connectivities but not their weights in the QTN. For the ease of
comparison, we graphically display this QTN in Figure 11B,
where the black pixel at position (i,j) indicates that the i-th and
j-th phenotypes are connected with an edge in the QTN. It is easy
to see the correspondences between the blocks (i.e., clusters) of
black pixels in Figure 11B and the subgraphs of correlated traits in
Figure 1. For example, the traits representing quality of life of the
patients (the nodes for QLEnvironment, QLSymptom, QLEmo-
tion, and QLActivity) appear as a small subnetwork near the
center of Figure 1 as well as the block of black pixels at the upper
left corner of Figure 11B. We find another subnetwork consisting
of three traits related to asthma symptoms (the nodes for Wheezy,
Sputum, ChestTight) near the upper right corner of Figure 1 and
as the second cluster from the left in Figure 11B. The cluster of
traits from columns 11 through 18 and the next cluster from
columns 19 through 25 in Figure 11B correspond to the two
densely connected subnetworks within the large subnetwork on the
left-hand side of Figure 1 that consists of traits related to lung
physiology (the nodes for BaseFEV1, PreFEFPred, PostbroPred,
PredrugFEV1P, MaxFEV1P, etc.). Based on Figure 1 and
Figure 11B, we concluded that the QTN obtained at threshold
r~0:7 captured the previously known clusters of asthma-related
traits, and we used this network in our multiple-trait association
analysis with GFlasso methods.
A comprehensive comparison of QTL mapping using GFlasso
and other methods is presented in Figures 11D–11L, of which
each panel displays the matrix of estimated association strengths of
all marker genotypes versus all phenotypic traits. The rows and
columns represent genotypes and phenotypes, respectively. The
phenotypes in the columns are ordered in the same way as in
Figure 11A and Figure 11B. We first performed a baseline single-
marker/single-trait pairwise association analysis with a permuta-
tion test, and obtained p-values after 5000 permutations. The
{log p-valueð Þ0s are shown in Figure 11D. Based on these
p-values, the SNP-trait pairs significant at a~0:05 and 0.01 are
shown as black pixels in Figure 11E and Figure 11F. The strengths
of associations found by the six different multivariate regression
methods including ridge regression, PCA-based method, lasso,
GcFlasso, G1wFlasso, and G2
wFlasso are shown in Figures 11G–
L, respectively. We selected the regularization parameters in lasso,
GcFlasso, G1wFlasso, and G2
wFlasso using a five-fold cross
validation. For all of these methods, we used the absolute values of
the estimated regression coefficients as a measure of association
strength.
As can be seen from Figure 11, all of the methods for association
analysis except for the PCA-based one in Figure 11H found the
SNP in row 30 near the bottom, known as Q551R, as significantly
associated with a block of correlated phenotypes in columns 11–18
of Figure 11A that are related to lung physiology (consisting of
BaseFEV1, PreFEFPred, AvgNO, BMI, PostbroPred, BaseFEV-
Per, PredrugFEV1P, MaxFEV1P, FEV1Diff, and PostFEF). In
particular, the p-values for this SNP across this block of traits from
the single-marker analyses were 2:0|10{4. This SNP Q551R
resides in exon 12 of gene IL-4R, and codes for amino-acid
changes in the intracellular signaling portion of the receptor. It has
been previously found to be associated with severe asthma and its
traits for lung physiology [37], and our results confirmed this
previous finding.
In addition, the results from the single-marker analyses in
Figures 11D–F showed that on the upstream of SNP Q551R,
there was a set of adjacent SNPs (rows 24–27) that had generally a
high level of association with the same subset of traits for lung-
physiology with p-values ranging from 2:0|10{4 to 7:6|10{3.
In contrast, lasso set the regression coefficients for most of this
block of SNPs to zero (Figure 11I). When we examined the LD
structure in this region as shown in Figure 11C, we found that the
SNPs in rows 26 and 27 were in a strong LD with SNP Q551R
(r2~0:89 and 0.76, respectively). Thus, lasso was able to ignore
the possibly irrelevant markers (rows 26 and 27) that are merely in
a strong LD with the causal SNP (SNP Q551R) by setting the
corresponding regression coefficients to zero. This confirmed that
lasso is an effective method for finding the sparse structure in
regression coefficients. On the other hand, the other two SNPs in
the same block in rows 24 and 25 were in a weak LD with SNP
Q551R (r2~0:29 and 0.42, respectively). This suggests that these
two SNPs might be unknown causal SNPs that lasso missed
because of its property of favoring sparsity. The results from ridge
regression as shown in Figure 11G did not show a sparse structure
as in the lasso estimates. In fact, in statistical literature, it is well-
known that ridge regression performs poorly in problems that
Figure 10. Comparison of the computation time for lasso, GcFlasso, G1wFlasso, and G2
wFlasso. (A) We varied the number of SNPs with thenumber of phenotypes fixed at 250. (B) We varied the number of phenotypes with the number of SNPs fixed at 50. The QTNs were obtained usingthreshold r~0:3. The number of edges in the QTNs ranged from 900 to 950 in each case.doi:10.1371/journal.pgen.1000587.g010
Association Analysis of Quantitative Trait Network
PLoS Genetics | www.plosgenetics.org 14 August 2009 | Volume 5 | Issue 8 | e1000587
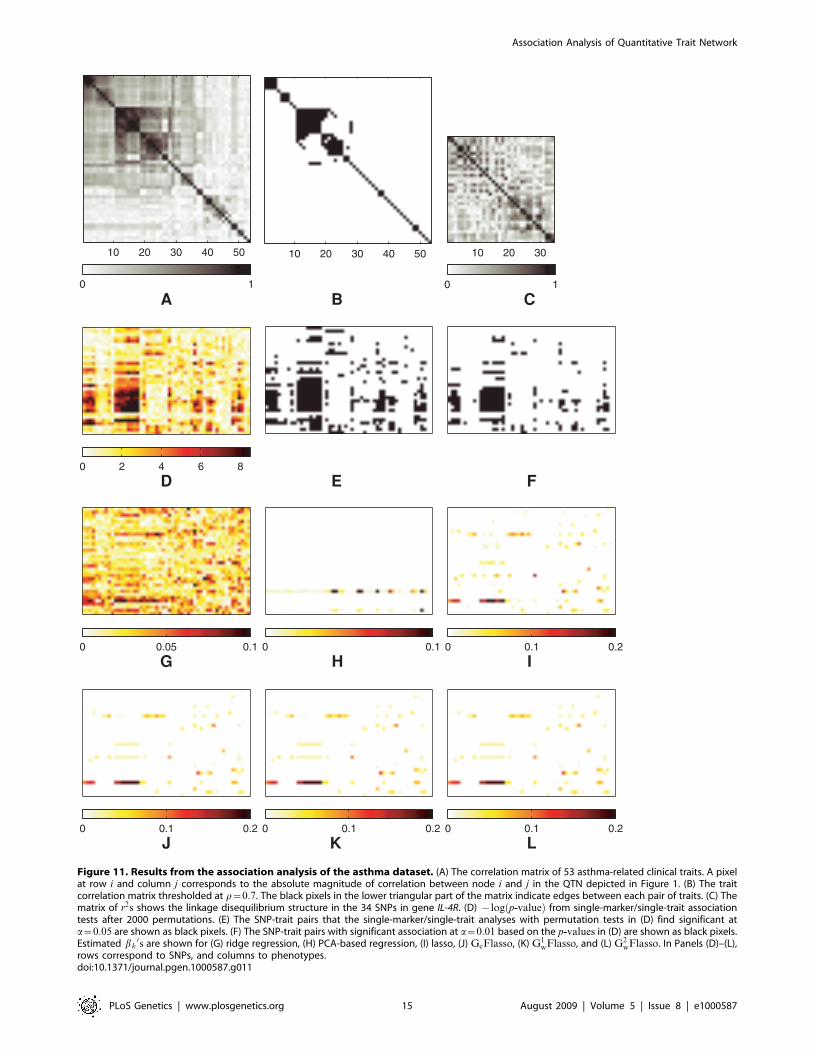
Figure 11. Results from the association analysis of the asthma dataset. (A) The correlation matrix of 53 asthma-related clinical traits. A pixelat row i and column j corresponds to the absolute magnitude of correlation between node i and j in the QTN depicted in Figure 1. (B) The traitcorrelation matrix thresholded at r~0:7. The black pixels in the lower triangular part of the matrix indicate edges between each pair of traits. (C) Thematrix of r2s shows the linkage disequilibrium structure in the 34 SNPs in gene IL-4R. (D) {log p-valueð Þ from single-marker/single-trait associationtests after 2000 permutations. (E) The SNP-trait pairs that the single-marker/single-trait analyses with permutation tests in (D) find significant ata~0:05 are shown as black pixels. (F) The SNP-trait pairs with significant association at a~0:01 based on the p-values in (D) are shown as black pixels.Estimated bk
0s are shown for (G) ridge regression, (H) PCA-based regression, (I) lasso, (J) GcFlasso, (K) G1wFlasso, and (L) G2
wFlasso. In Panels (D)–(L),rows correspond to SNPs, and columns to phenotypes.doi:10.1371/journal.pgen.1000587.g011
Association Analysis of Quantitative Trait Network
PLoS Genetics | www.plosgenetics.org 15 August 2009 | Volume 5 | Issue 8 | e1000587
require a selection of a small number of markers affecting
phenotypes, compared to lasso. Since the methods in the GFlasso
family include the lasso penalty, the results from GcFlasso,
G1wFlasso, and G2
wFlasso in Figures 11J–L showed the same
property of sparsity as lasso in their estimates, and the regression
coefficients corresponding to the SNPs in rows 24–27 and lung-
physiology traits were set to zero.
Because of the fusion penalty, the regression coefficients
estimated by our methods formed a block structure, where each
block corresponds to a SNP associated with several correlated
traits. It is clear that the horizontal bars in Figures 11J–L are
generally aligned with the blocks of highly correlated traits in
Figure 11A. Although the fusion penalty tends to fuse the values of
regression coefficients for each SNP across correlated traits to the
same value, each horizontal bar does not always necessarily consist
of regression coefficients of the same value, but often contain
several small blocks of fused values. This is because the fusion
penalty only introduces bias towards a shared association strength
of relevant SNPs among correlated traits with the flexibility of
adapting to the data rather than being a hard constraint. The
same block structure was much weaker in the results from lasso
shown in Figure 11I. For example, Figures 11J–L show that SNPs
rs3024660 (row 22) and rs3024622 (row 18) on the upstream of
SNP Q551R are associated with the same block of traits as SNP
Q551R, generating an interesting new hypothesis that these two
SNPs as well as SNP Q551R might be jointly associated with the
same subset of traits for lung physiology. Although the single-
marker/single-trait analyses also found these two SNPs reasonably
significant (p-values of SNP rs3024660 in the range of 2:0|10{4
and 4:0|10{4, and SNP rs3024622 in the range of 1:5|10{2
and 3:8|10{2 across the traits for lung physiology), the results
were more noisy with many positives for SNPs in LD such as SNPs
in rows 20–24. Also, this block structure shared by these two SNPs
and SNP Q551R was not obvious in the results of the other
multivariate regression methods that analyzed each trait separate-
ly.
In order to see how the threshold r for creating the QTN affects
the results, we fit lasso and our methods in the GFlasso family for
different values of r, and summarized the results in Table 1. When
the threshold was high at r~0:9, only a very small number of
edges were included in the QTN, and the graph-guided fusion
penalty of GFlasso had little effect. Thus, the number of non-zero
regression coefficients found by GcFlasso, G1wFlasso, and
G2wFlasso was similar to the result of lasso that does not have a
fusion penalty. When we lowered the threshold to r~0:7, the
number of non-zero regression coefficients decreased significantly
for the GFlasso methods. However, as we further lowered the
threshold, the number of non-zero regression coefficients generally
remained unchanged. This is because most of the significant
correlation structure was captured in the QTN at r~0:7 as can be
seen in Figure 11B. Adding more edges by further lowering r did
not add any significant correlation information to the QTN, and
the results of the GFlasso methods were not sensitive to these
additional edges with relatively little information.
In summary, the GFlasso methods identified the previously
known causal SNP (SNP Q551R) as significantly associated with
the lung physiology traits, while maintaining an overall sparse
pattern in estimated regression coefficients to reduce false
positives. The property of the GFlasso estimates having a block
structure for a SNP jointly associated with a set of correlated traits
led to an interesting new hypothesis that two additional SNPs
(rs3024660 and rs3024622) on the upstream of SNP Q551R may
be jointly influencing the same set of traits on lung physiology as
SNP Q551R, which may be validated in a future follow-up study.
Discussion
When multiple phenotypes are involved in association mapping,
it is important to combine the information across phenotypes and
make use of the full information available in data in order to
achieve the maximum power. Most of the previous approaches
either considered each phenotype separately, or used relatively
primitive types of phenotype correlation structures such as
surrogate phenotypes transformed through PCA or the mean
values of subgroups of phenotypes found by clustering algorithms.
Networks or graphs have been extensively studied as a
representation of the correlation structure of phenotypes such as
gene expression or clinical traits because they provide a flexible
and explicit form of representation for capturing dependencies
[39–41]. A QTN contains rich information on phenotype
interaction patterns such as densely connected subgraphs that
can be interpreted as a cluster of phenotypes participating in the
same biological process. Developing a tool for multiple-phenotype
association mapping that can directly leverage this full graph
structure of a QTN can offer a way to combine the large body of
previous research in network analysis with the work on association
mapping.
In this article, we proposed a new family of regression methods
called GFlasso that directly incorporates the correlation structure
represented as a QTN and uses this information to guide the
estimation process. These methods considered a multitude of
phenotypes jointly, and estimated a joint association model in a
single statistical framework. Often, we are interested in detecting
genetic variations that perturb a sub-module of phenotypes rather
than a single phenotype, and GFlasso achieved this through a
fusion penalty, in addition to the lasso penalty, that encourages
parsimony in the estimated model. The fusion penalty locally fused
two regression coefficients for a pair of correlated phenotypes, and
this effect propagated through edges of the QTN, effectively
applying fusion to all of the phenotypes within each subgraph.
GcFlasso used an unweighted graph structure as a guide to find a
subset of relevant covariates that jointly affect highly correlated
outputs, whereas GwFlasso used additional information of edge
weights to further control the coupling among phenotypes. Using
simulated and asthma datasets, we demonstrated that including
richer information on phenotype structure as in GwFlasso and
GcFlasso improves the accuracy in detecting true associations.
The fusion penalty in GFlasso introduced a bias that the
amount of influence of a shared QTL is similar over the set of
correlated traits in order to increase the power for detecting weak
signal and reduce false positives. The simulation results showed
that the benefit of information sharing due to the fusion penalty
outweighed the risk of low-variance bias on fused regression
Table 1. Summary of results for the association analysis ofthe asthma dataset.
rNumber ofedges Number of nonzero regression coefficients
Lasso GcFlasso G1wFlasso G2
wFlasso
0.3 421 105 106 108
0.5 165 125 108 107 107
0.7 71 105 105 110
0.9 11 125 123 123
doi:10.1371/journal.pgen.1000587.t001
Association Analysis of Quantitative Trait Network
PLoS Genetics | www.plosgenetics.org 16 August 2009 | Volume 5 | Issue 8 | e1000587

coefficients when in reality the magnitudes of the coefficients can
be highly variable. Perhaps a more effective approach and a
promising future direction would be to encourage each SNP
marker to be jointly relevant or irrelevant to the subset of
correlated traits, but still allow the marker to have a different
amount of influence on each of the traits. This would reduce the
bias introduced by the fusion penalty and further improve the
performance of GFlasso, since the only information shared across
correlated traits is the sparsity pattern but not the magnitudes of
the regression coefficients.
We have used a simple scheme of a thresholded correlation
graph for learning the QTN of phenotypes to be used in GFlasso.
Many different types of network-learning algorithms have been
developed previously. For example, graphical Gaussian models
(GGMs) [42] were constructed based on partial correlations that
capture the direct influence of interacting nodes, and have been
commonly used for inferring gene networks from microarray data
[43]. Furthermore, in order to handle the case of a large number
of nodes and a relatively small sample size, methods for estimating
sparse GGMs have been developed [44]. It would be interesting to
see if using more sophisticated graph learning algorithms can
improve the performance of GFlasso.
In this study, we assumed that the graph structure of a QTN is
available from a pre-processing step. One of the possible
extensions of the proposed method is to learn the QTN and the
regression coefficients jointly by combining GFlasso with the
graphical lasso [45] that learns a sparse covariance matrix for
phenotypes. In Geronemo and Lirnet, both the module network
structure and the markers of regulators regulating the modules
were learned simultaneously, although these methods only focused
on modeling the relationship between regulators and target genes
[9,20]. Extending GFlasso to learn both the graph structure and
regression coefficients jointly may further increase the power in an
association analysis.
For any new multivariate genetic-association methods, a natural
question is whether the new method can scale to a genome-scale
analysis. The current implementation of GFlasso leaves this to be
determined by a user-specified tradeoffs between power and
computation time. As shown in Figure 10, the larger the number
of traits and genotypes to be modeled jointly, naturally the greater
the computational cost. Thus, users are offered a wide range of
tradeoff between computation time and power of the analysis,
from single-marker/single-trait per test as in the conversional
analysis, to J-markers=K-traits per test with our methods still at a
reasonable time (comparable to the time cost of standard lasso),
where J,K*102. Therefore, instead of scanning the whole
genome one marker at a time for each trait separately as in a
classical analysis, with our method, one can scan J markers at a
time using a sliding window for each phenome represented as
subnetworks in a QTN. An important future direction is to scale
up our methods for even larger values of J and K , and our
proposed graph-guided regression formalism represents a nontriv-
ial and practical initial foray into this direction. We expect that
with the development of a new mathematical optimization
methodology and faster computing machinery, it will become
feasible to handle a wider range of structure sizes based on our
model, and a genome-wide association study can depart further
away from an unstructured single-marker/single-trait analysis.
Finally, it is important to point out that as of now GFlasso
considers only dependencies among phenotypes, and does not
assume any dependencies among the markers. Since recombina-
tions break chromosomes during meiosis at non-random sites,
segments of chromosomes rather than an individual nucleotide are
inherited as a unit from ancestors to descendants, creating a
relatively low diversity in observed haplotypes than would be
expected if each allele were inherited independently. Thus, SNPs in
high LD are likely to be jointly associated with a phenotype in a
regression-based penetrance function. In our future research, we
plan to apply the same idea of the graph-guided fusion penalty for
phenotypes to incorporate the LD structure among genotypes. It is
straightforward to introduce another fusion penalty for correlated
markers based on the genotype correlation graph and weight each
term in the penalty using values that reflect the recombination rates
and distances between each pair of genetic markers. This would
allow a genome-phenome association analysis for identifying a block
of correlated markers influencing a set of correlated phenotypes.
Software for our proposed method is available at http://www.
sailing.cs.cmu.edu/gflasso.html. A preliminary version of this
method was presented at the 19th international conference on
intelligent systems for molecular biology (ISMB 2009).
Acknowledgments
We thank Sally Wenzel, M.D. for providing the SARP dataset, and for her
helpful discussions on the asthma association study. We also thank Ross
Curtis and Kyung-Ah Sohn for their help with the implementation of the
software and the helpful discussion on simulation study.
Author Contributions
Conceived and designed the experiments: SK EPX. Performed the
experiments: SK. Analyzed the data: SK EPX. Contributed reagents/
materials/analysis tools: SK EPX. Wrote the paper: SK EPX.
References
1. Basso K, Margolin A, Stolovitzky G, Klein U, Dalla-Favera R, et al. (2005)
Reverse engineering of regulatory networks in human B cells. Nature Genetics
37: 382–90.
2. Chen Y, Zhu J, Lum P, Yang X, Pinto S, et al. (2008) Variations in DNA
elucidate molecular networks that cause disease. Nature 452: 429–35.
3. Easton D, Bishop D, Ford D, Crockford G (1993) Genetic linkage analysis in
familial breast and ovarian cancer: results from 214 families. American Jounal of
Human Genetics 52: 678–701.
4. Morley M, Molony C, Weber T, Devlin J, Ewens K, et al. (2004) Genetic
analysis of genome-wide variation in human gene expression. Nature 430:
743–747.
5. Cheung V, Spielman R, Ewens K, Weber T, Morley M, et al. (2005) Mapping
determinants of human gene expression by regional and genome-wide
association. Nature 437: 1365–1369.
6. Stranger B, Forrest M, Clark A, Minichiello M, Deutsch S, et al. (2005)
Genome-wide associations of gene expression variation in humans. PLoS
Genetics 1: 695–704.
7. Benjamini Y, Hochberg Y (1995) Controlling the false discovery rate: a practical
and powerful approach to multiple testing. Journal of the Royal Statistical
Society, Series B 57: 289–300.
8. Rosenberg P, Che A, Chen B (2005) Multiple hypothesis testing strategies for
genetic case-control association studies. Statistics in Medicine 25: 3134–3149.
9. Lee SI, Pe’er D, Dudley A, Church G, Koller D (2006) Identifying regulatory
mechanisms using individual variation reveals key role for chromatin
modification. PNAS 103: 14062–67.
10. Emilsson V, Thorleifsson G, Zhang B, Leonardson A, Zink F, et al. (2008)
Genetics of gene expression and its effect on disease. Nature 452: 423–28.
11. Zhu J, Zhang B, Smith E, Drees B, Brem R, et al. (2008) Integrating large-scale
functional genomic data to dissect the complexity of yeast regulatory networks.
Nature Genetics 40: 854–61.
12. Keller M, Choi Y, Wang P, Davis D, Rabaglia M, et al. (2008) A gene
expression network model of type 2 diabetes links cell cycle regulation in islets
with diabetes susceptibility. Genome Research 18: 706–16.
13. Ghazalpour A, Doss S, Kang H, Farber C, Wen P, et al. (2008) High-resolution
mapping of gene expression using association in an outbred mouse stock. PLoS
Genetics 4: e1000149.
14. Moore W, Bleecker E, Curran-Everett D, Erzurum S, Ameredes B, et al. (2007)
Characterization of the severe asthma phenotype by the National Heart, Lung,
and Blood Institute’s Severe Asthma Research Program. Journal of Allergy and
Clinical Immunology 119: 405–13.
Association Analysis of Quantitative Trait Network
PLoS Genetics | www.plosgenetics.org 17 August 2009 | Volume 5 | Issue 8 | e1000587

15. The International HapMap Consortium (2005) A haplotype map of the human
genome. Nature 437: 1399–1320.
16. Wellcome Trust Case Control Consortium (2007) Genome-wide association
study of 14,000 cases of seven common diseases and 3,000 shared controls.
Nature 447: 661–78.
17. Weller J, Wiggans G, Vanraden P, Ron M (1996) Application of a canonical
transformation to detection of quantitative trait loci with the aid of genetic
markers in a multi-trait experiment. Theoretical and Applied Genetics 92:
998–1002.
18. Mangin B, Thoquet B, Grimsley N (1998) Pleiotropic QTL analysis. Biometrics
54: 89–99.
19. Segal E, Shapira M, Regev A, Pe’er D, Botstein D, et al. (2003) Module
networks: identifying regulatory modules and their condition-specific regulators
from gene expression data. Nature Genetics 34: 166–78.
20. Lee SI, Dudley A, Drubin D, Silver P, Krogan N, et al. (2009) Learning a prior
on regulatory potential from eQTL data. PLoS Genetics 5: e1000358.
21. Tibshirani R (1996) Regression shrinkage and selection via the lasso. Journal of
Royal Statistical Society, Series B 58: 267–288.
22. Zhao P, Yu B (2006) On model selection consistency of lasso. Journal of
Machine Learning Research 7(Nov): 2541–2563.
23. Shi W, Lee K, Wahba G (2007) Detecting disease causing genes by LASSO-
Patternsearch algorithm. Technical Report 1140, Department of Statistics,
University of Wisconsin.
24. Hastie T, Tibshirani R, Friedman J (2003) The Elements of Statistical Learning.
New York: Springer.
25. Malo N, Libiger O, Schork N (2008) Accommodating linkage disequilibrium in
genetic-association analyses via ridge regression. American Journal of Human
Genetics 82: 375–85.
26. Weisberg S (1980) Applied Linear Regression. New York: Wiley.
27. Hoerl A, Kennard R, Baldwin K (1975) Ridge regression: some simulations.
Communications in Statistics - Theory and Methods 4: 105–23.
28. Efron B, Hastie T, Johnstone I, Tibshirani R (2004) Least angle regression.
Annals of Statistics 32: 407–499.
29. Butte A, Tamayo P, Slonim D, Golub T, Kohane I (2000) Discovering
functional relationships between RNA expression and chemotherapeutic
susceptibility using relevance networks. Proc Natl Acad Sci, USA 97: 12182–86.
30. Carter S, Brechbuhler C, Griffin M, Bond A (2004) Gene co-expression network
topology provides a framework for molecular characterization of cellular state.
Bioinformatics 20: 2242–50.
31. Zhang B, Horvath S (2005) A general framework for weighted gene co-
expression network analysis. Statistical Applications in Genetics and MolecularBiology 4: Article 17.
32. Tibshirani R, Saunders M, Rosset S, Zhu J, Knight K (2005) Sparsity and
smoothness via the fused lasso. Journal of Royal Statistical Society, Series B 67:91–108.
33. Knight K, Fu W (2000) Asymptotics for lasso-type estimators. The Annals ofStatistics 28: 1356–1378.
34. Kim S, Sohn KA, Xing EP (2009) A multivariate regression approach to
association analysis of quantitative trait network. In: Proceedings of the 16thInternational Conference on Intelligence Systems for Molecular Biology. pp
204–212.35. Rakotomamonjy A, Bach FR, Canu S, Grandvalet Y (2008) SimpleMKL.
Journal of Machine Learning Research 9: 2491–2521.36. Bach F (2008) Consistency of the group lasso and multiple kernel learning.
Journal of Machine Learning Research 9: 1179–1225.
37. Wenzel S, Balzar S, Ampleford E, Hawkins G, Busse W, et al. (2007) IL4Ramutations are associated with asthma exacerbations and mast cell/IgE
expression. American Journal of Respiratory and Critical Care Medicine 175:570–76.
38. Li N, Stephens M (2003) Modelling linkage disequilibrium, and identifying
recombination hotspots using SNP data. Genetics 165: 2213–2233.39. Butte A, Kohane I (2006) Creation and implications of a phenome-genome
network. Nature Biotechnology 24: 55–62.40. Mehan M, Nunez-Iglesias J, Kalakrishnan M, Waterman M, Zhou X (2008) An
integrative network approach to map the transcriptome to the phenome. In:Proceedings of the Conference on Research in Computational Molecular
Biology. pp 232–45.
41. Friedman N (2004) Inferring cellular networks using probabilistic graphicalmodels. Science 303: 799–805.
42. Toh H, Horimoto K (2002) Inference of a genetic network by a combinedapproach of cluster analysis and graphical gaussian modeling. Bioinformatics 18:
287–97.
43. Magwene P, Kim J (2004) Estimating genomic coexpression networks using first-order conditional independence. Genome Biology 5: R100.
44. Wille A, Zimmermann P, Vranova E, Furholz A, Laule O, et al. (2004) Sparsegraphical gaussian modeling of the isoprenoid gene network in arabidopsis
thaliana. Genome Biology 5: R92.45. Friedman J, Hastie T, Tibshirani R (2008) Sparse inverse covariance estimation
with the graphical lasso. Biostatistics 9: 432–441.
Association Analysis of Quantitative Trait Network
PLoS Genetics | www.plosgenetics.org 18 August 2009 | Volume 5 | Issue 8 | e1000587

![Genome-wide association study of salt tolerance at the ...germination stage is not significantly correlated with salt tolerance at other stages [4]. To date, few studies have focused](https://img.pdfslide.net/doc/110x75/6126264016ca746e222b3e6e/genome-wide-association-study-of-salt-tolerance-at-the-germination-stage-is.jpg)