Embed Size (px)
Citation preview

HAL Id: halshs-00523458https://halshs.archives-ouvertes.fr/halshs-00523458
Submitted on 5 Oct 2010
HAL is a multi-disciplinary open accessarchive for the deposit and dissemination of sci-entific research documents, whether they are pub-lished or not. The documents may come fromteaching and research institutions in France orabroad, or from public or private research centers.
L’archive ouverte pluridisciplinaire HAL, estdestinée au dépôt et à la diffusion de documentsscientifiques de niveau recherche, publiés ou non,émanant des établissements d’enseignement et derecherche français ou étrangers, des laboratoirespublics ou privés.
Statistical evidence of tax fraud on the carbonallowances market
Marius-Cristian Frunza, Dominique Guegan, Antonin Lassoudière
To cite this version:Marius-Cristian Frunza, Dominique Guegan, Antonin Lassoudière. Statistical evidence of tax fraudon the carbon allowances market. 2010. �halshs-00523458�
Documents de Travail du Centre d’Economie de la Sorbonne
Statistical evidence of tax fraud on the carbon
allowances market
Marius-Cristian FRUNZA, Dominique GUEGAN, Antonin LASSOUDIERE
2010.69
Maison des Sciences Économiques, 106-112 boulevard de L'Hôpital, 75647 Paris Cedex 13 http://ces.univ-paris1.fr/cesdp/CES-docs.htm
ISSN : 1955-611X

STATISTICAL EVIDENCE OF TAX FRAUD ON THE
CARBON ALLOWANCES MARKET
Marius-Cristian Frunza∗ Dominique Guegan† Antonin Lassoudiere ‡
June 27, 2010
Abstract
The aim of this paper is to show evidence and to quantify with forensic economet-ric methods the impact of the Value Added Tax fraud on European carbon allowancesmarkets. This fraud mainly occurred at the beginning of between the end of 2008 andthe beginning of 2009. In this paper we explore the financial mechanisms of the fraudand the impact on the market behavior as well as the reflexion on its econometric features.
In a previous work, we showed that the European carbon market is strongly influencedby fundamentals factors as oil, energy, gas, coal and equity prices. Therefore, we cali-brated Arbitrage Pricing Theory-like models and showed that they have a good forecastcapacity. Those models enabled us to quantify the impact of each factor on the market.In this study, we focused more precisely on the benchmark contract for European carbonemissions prices over 2008 and 2009. We observed that during the first semester of 2009,there is a significant drop in our model performances and robustness and that the part ofmarket volatility explained by fundamentals reduced. Therefore, we identified the periodwhere the market was driven by VAT fraud movements and we were able to measure thevalue of this fraud. Soon after governments passed a law that cut the possibility of fraudoccurrence the performance of the model improved rapidly.
We estimate the impact of the VAT extortion on the carbon market at 1.3 billion euros.
Keywords: Carbon, EUA, Energy, Arbitrage Pricing Theory, Switching regimes, HiddenMarkov Chain Model, Forecast.
1 Introduction
In the torments generated by the last economic fall new sources of illegitimate yields haverisen across the financial industry. The perpetual competition among investment profession-als for supplying with more attractive returns led in a lot of cases to cross not only the efficient∗Sagacarbon, a subsidiary of Caisse des Depots, [email protected]†PSE, Centre d’Economie de la Sorbonne, University Paris 1 Pantheon-Sorbonne and Sagacarbon, MSE,
106 bd de l’Hopital, 75013 Paris, France. Email: [email protected].. Tel: +33 1 40 07 82 98.‡Sagacarbon, a subsidiary of Caisse des Depots, [email protected]
1 Documents de Travail du Centre d'Economie de la Sorbonne - 2010.69

but also the legal frontier. As a result the number of investment institutions and marketsallegedly linked to fraud schemes multiplied over the last three years. From the historical lossof Jerome Kerviel reputed trader with Societe Generale to the massive havoc provoked bythe Madoff system the financial industry have passed through a challenging period in termof public image. If the new acts proposed by different investment authorities have enforcedthe role of the control function inside the financial institutions, less attention is payed tostatistical analysis of market fundamentals or trading styles that could show proofs of pricemanipulations or frauds. Econometric research as a forensic tool is a relatively new fieldand less literature is available on this topic. If ”pump and dump” schemes could be trackedby classic investigatory means, recent cases of market fraud show the necessity of a deeperstatistical analysis of mechanisms and consequences following the financial white collar crime.
The aim of this paper is first to extend the actual literature on carbon markets and on theuse of statistics as a forensic tool. Second we focus on a financial fraud that allegedly tookplace on a new market, the carbon emission allowances exchange. The fraud consisted mainlyin cashing out the Value Added Taxes proceedings from allowances sales instead of returningit to governments.
In the first part of the work we describe the mechanism of the fraud scheme and we give fewarguments that could explain the changes in market metrics. In the second part we explainour statistical methodology that brings relevant proofs for the fact that the VAT extortionscheme was not an isolated phenomena and had a serious influence on prices dynamics. Inthe third part we discuss the results. The fourth part concludes.
2 The carbon VAT scheme
The EU emission trading system (ETS) raised in 2005 and is now by far the largest multi-national scheme in the world (73 % of the value of the global carbon market in 2008). Thescheme is a ”cap and trade” system whose objective is to cut greenhouse gas emissions byallocating emission allowances (allocated for free or auctioned) which can then be transferredbetween operators. Phase 3 of the ETS (2013-2020) will incorporate a yearly decrease of thecap of 1.74 % per year, arriving at a reduction of 21 % below the 2005 emissions. Transfersof allowances between taxable persons are considered as a supply of service and were taxableat the place where the recipient is established.
During the summer of 2009, a number of suspected cases of fraud were detected in severalEU Member States and have led different EU governments to take swift action by includingthe greenhouse gas emission allowances in the list of supplies to which a (domestic) reversecharge system could be applied. As a consequence in June 2009 the governments of Franceand The Netherlands have removed the VAT from carbon permits.
2 Documents de Travail du Centre d'Economie de la Sorbonne - 2010.69

The so-called carousel Value Added Tax (VAT) fraud or missing trader fraud involving carbonemissions allowances, or carbon credits is summarized in Figure 1.
Figure 1: VAT carousel
The trading companies implied in the scheme allegedly imported large volumes of carbon cred-its VAT-free from other countries then sold the credits on French carbon market BlueNext,having already marked up the price with VAT. The market players purchasing the permitswould then have been able to claim the VAT back from the French government. But thesuspects allegedly never reported that VAT revenue, pocketing it instead.
The exchange handled a record 19.8 million metric tons of EU carbon permits on June 22009, according to data on Reuters. The previous record was 15.1 million tons on May 282009. The exchanged volumes felt nearly to zero following the announce of reverse charge ofVAT in the beginning of June 2009.
3 Forensics methodology
Our analysis shows that the VAT carousel represented a big part of the exchanged allowancesand this massive scheme influenced significantly the market prices. One consequence of thefraud is the unusual high volumes of permits exchanged in the market. In fact in the pickweeks of the carousel the number of transactions was around 10 times higher than normal.After the ban of VAT on carbon trades the volumes dropped and stabilized to a basal regimein the last part months of 2009.As explained in the Figure 1 the French carbon exchange was exposed to high quantities ofselling which should drive the market to significant contraction and to an asymmetric behav-
3 Documents de Travail du Centre d'Economie de la Sorbonne - 2010.69
ior. We investigate the fundamental level of permits’ prices during this period and also thedynamic of the skewness. In a market with a strong selling trend the prices would be pushedto a bearish behavior, thereby showing an excess of negative skewness.
In a previous work Frunza and Guegan [2010] provided a statistical study which identifies the”‘actual”’ main fundamentals for CO2 prices through an Arbitrage Price Theory (APT)-likemodel. We observed that Oil, Dark Spread, Spark Spread and CAC40 explain more than 75percent of the CO2 prices behavior and the dynamic feature of the dependencies. We usethese findings in order to demonstrate that during the VAT carousel the carbon prices ceasedto respond to fundamental driving factors but recovered promptly after the VAT ban rule.
4 Statistical results
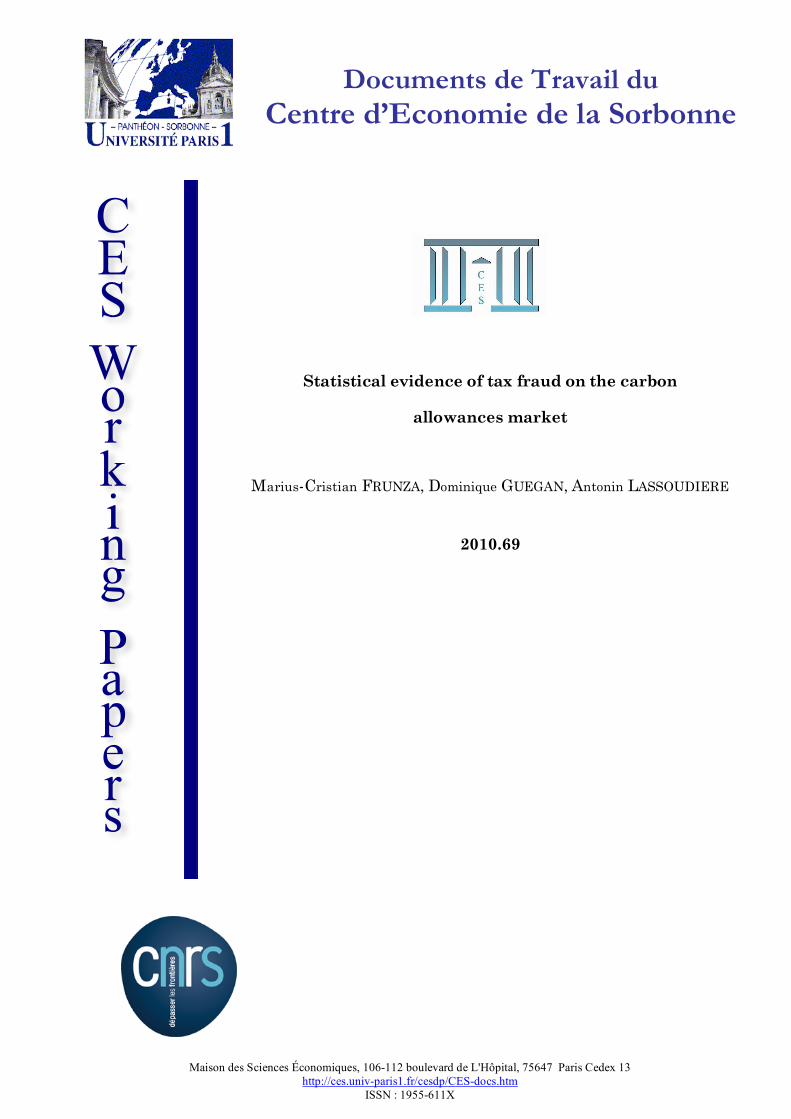
The Figure 2 shows the exchanged volumes of permits on BlueNext market. As expectedit picked on June 2 and drooped the day after the VAT ban announce. This finding showson one hand that a big stake of volumes were linked to the VAT crime and on the otherhand that once the carousel suspended the market lacked of fundamental value forcing the”clean” traders to cease shortly the activity. Moreover in February 2009 the prices touchedan historical low of 7 euros per ton which is significantly less than the minimal estimatedeconomic price of depolution which is around 10 euros per ton.
Figure 2: Volumes exchanged on Bluenext
The Figure 3 shows the evolution of the carbon yield skewness measured on a moving windowof 90 trading days. We observe that a phenomena of skew reverse appears in the end of 2008when the VAT carousel allegedly started. As the market become artificially long with largeoffering the daily yields become predominantly negative. We underline that the VAT fraud
4 Documents de Travail du Centre d'Economie de la Sorbonne - 2010.69

was an absolute 19.6% reyturn investement. The return was not linked by any means tomarket price, thereby pushing the permits to an unusual fundamental level. The skewnessreverse to non-negative levels shortly after the end of VAT fraud.
Figure 3: Skewness evolution of carbon yields
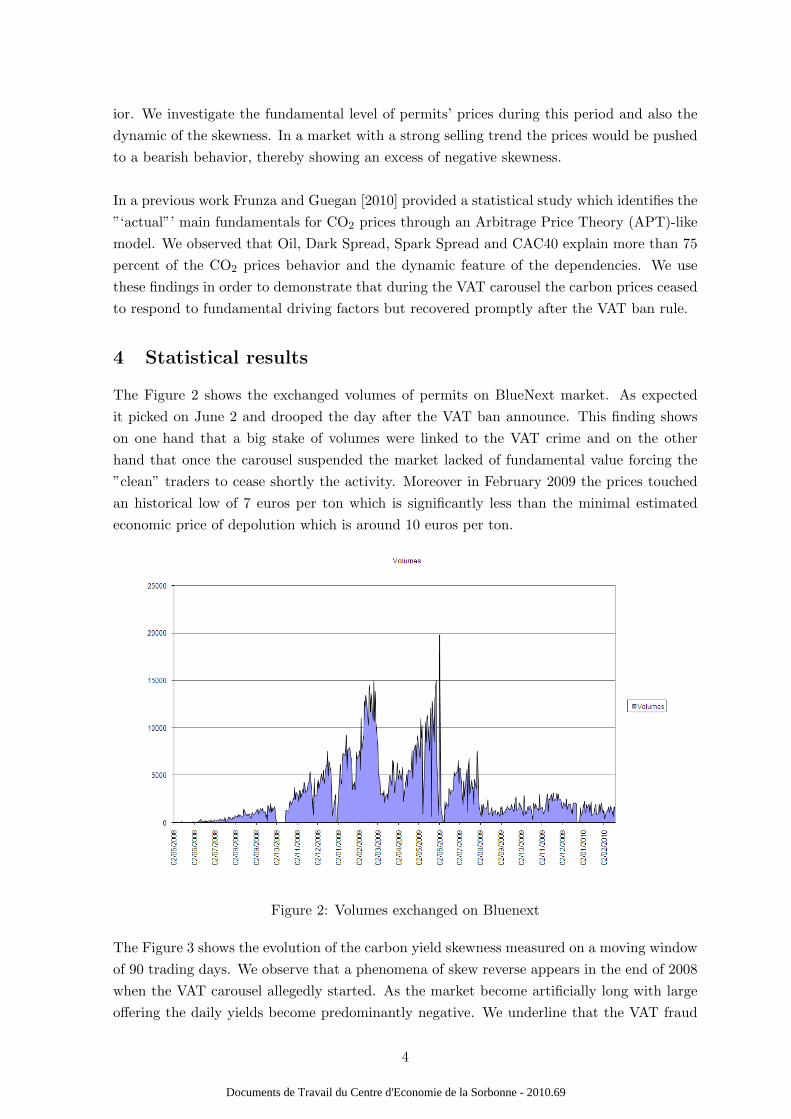
Our next argument turns around the fact that in a market strongly influenced by one strategywe would expect significant autocorrelation effect. We investigate the autocorrelation ofcarbon prices returns on the three period defined in the previous section. The Box-Ljungtest reject at 95% confidence level the null hypothesis on the ante and post period and acceptit for the VAT period.In this section we use the APT model developed by Ross [1976] in order to show the impactof the factors previously identified on the CO2 price evolution, and show calibration resultswith several noises. We make this calibration using EUA prices on the period 2006 - 2009.Using the historical time series we consider some models based on residuals that go from theclassical Brownian diffusion to more sophisticated generalized hyperbolic distributions.
The model has the following representation:
r = r + β1f1 + β2f2 + . . .+ βkfk + ε (1)
where
• r : The expected return of Carbon Allowance
5 Documents de Travail du Centre d'Economie de la Sorbonne - 2010.69
Figure 4: Focus on autocorrelation
• βi : The factor loading of factor i
• ε : The idosyncratic component
• E(fi) = 0 ∀i
• E(ε) = 0
Described by Ross [1976] and based on the underlying hypothesis that the markets are effi-cient the APT model assumes a Gaussian distribution of the residuals. Given the atypicalnature of the CO2 , the assumptions of the APT model are in some cases broken. Hence theresiduals do not follow a Normal distribution and the dependencies are not stationary overthe time. In order to overpass this issue we used different distributions to replace the clas-sic Gaussian modeling for residuals. Amongst the candidate functions t-Student, GED andNormal Inverse Gaussian (NIG) retained our attention for their capacity to take in accountheavy tails.
The Table 1 synthesis the results of our static calibration over the considered dataset usinga daily timestep, for different residual distributions. The discriminator element is the loglikelihood: the higher it is, the best is the modelling. It appears that the level of depen-dencies of CO2 price are generally close for the different models. But the degree of fitnessdepends highly of the chosen model. Hence the t-Student distribution for residuals captures
6 Documents de Travail du Centre d'Economie de la Sorbonne - 2010.69
well the behavior of the residuals and offers a good explanatory ratio for fundamental factors.
The Ljung-Box test of residuals autocorrelation show no presence of persistence at 99 percentof significance for all the distributions.
Gaussian GED T-Student NIG
Oil 0.131 0.103 0.122 0.116[0.055 0.205] [-0.149 0.352] [0.070 0.174] [0.063 0.169]
Dark Spread 0.262 0.2115 0.261 0.260[0.231 0.349] [0.014 0.468] [0.221 0.304] [0.221 0.302]
Spark Spread 0.002 0.0020 0.002 0.002[-0.001 0.003] [-0.009 0.033] [0.000 0.004] [0.001 0.004]
Equity 0.12 0.157 0.160 0.168[0.017 0.242] [-0.213 0.543] [0.088 0.247] [0.097 0.250]
R2 0.24 0.24 0.23 0.24
Log Likelihood 2054 2087 2092 2094
Table 1: Modelling results
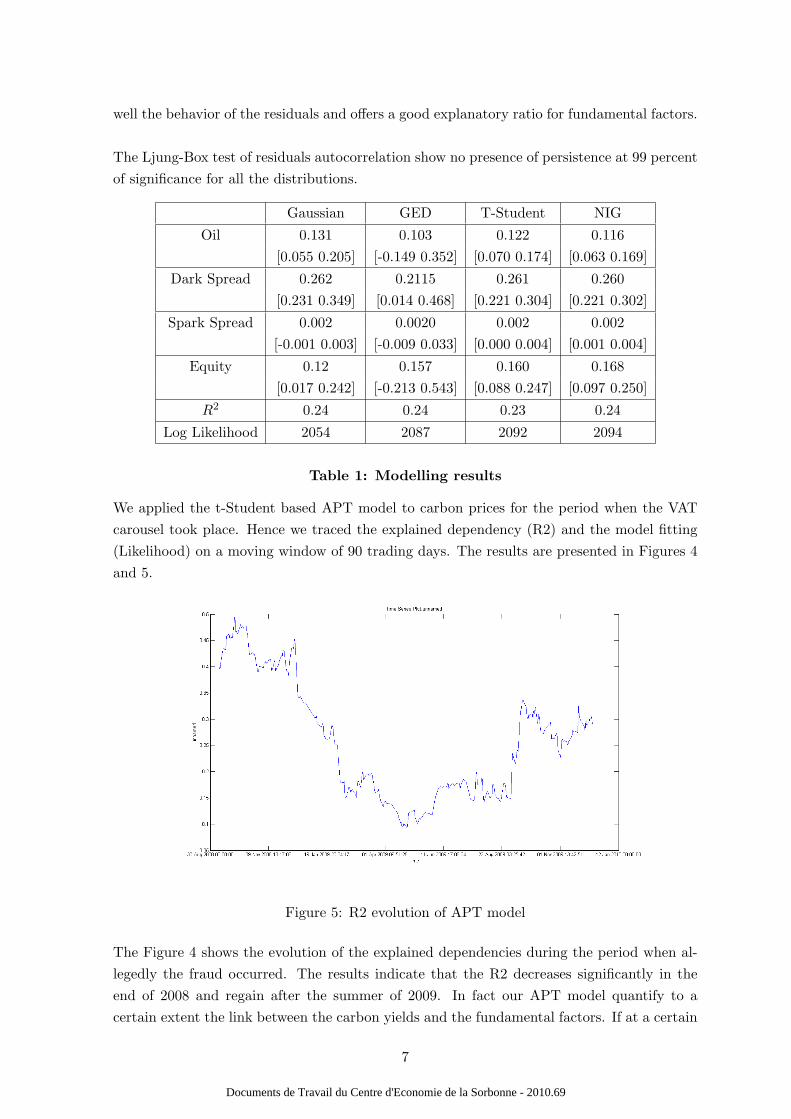
We applied the t-Student based APT model to carbon prices for the period when the VATcarousel took place. Hence we traced the explained dependency (R2) and the model fitting(Likelihood) on a moving window of 90 trading days. The results are presented in Figures 4and 5.
Figure 5: R2 evolution of APT model
The Figure 4 shows the evolution of the explained dependencies during the period when al-legedly the fraud occurred. The results indicate that the R2 decreases significantly in theend of 2008 and regain after the summer of 2009. In fact our APT model quantify to acertain extent the link between the carbon yields and the fundamental factors. If at a certain
7 Documents de Travail du Centre d'Economie de la Sorbonne - 2010.69
moment the carbon price is linked to some new factor the accuracy of our model diminishes.This situation occurred in our case during the VAT carousel when prices where establishedmainly by the scheme traders, thereby responding less to fundamentals.
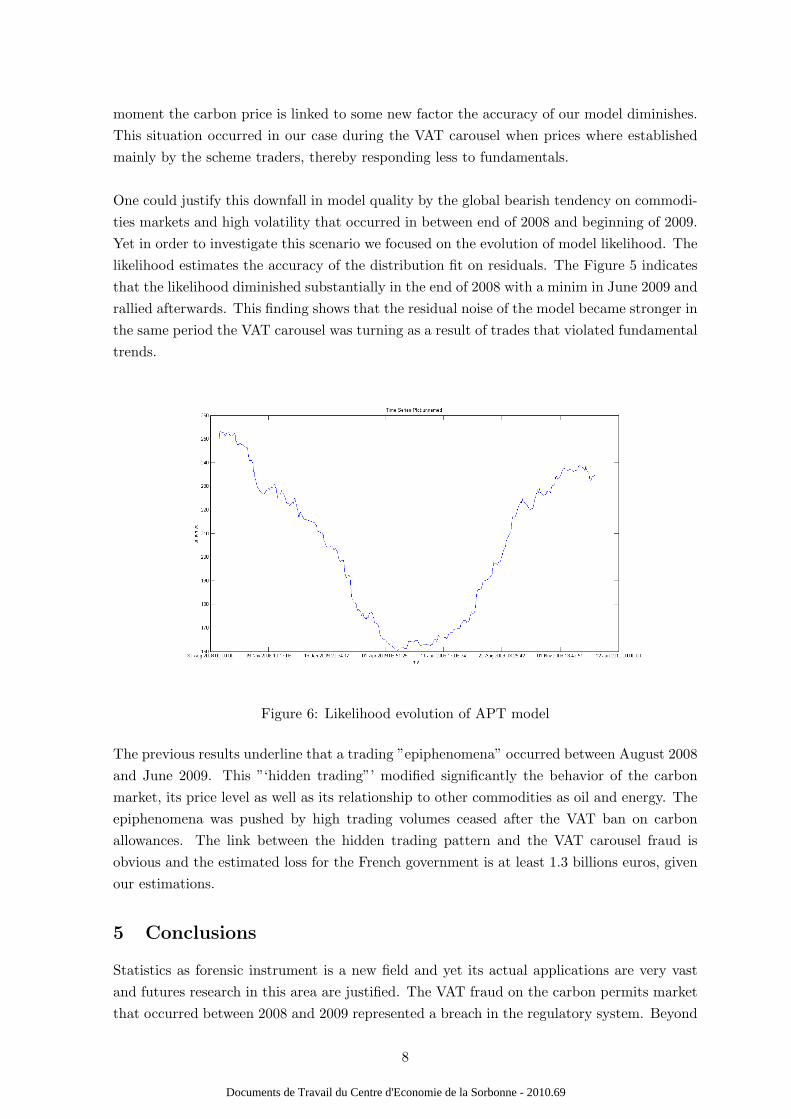
One could justify this downfall in model quality by the global bearish tendency on commodi-ties markets and high volatility that occurred in between end of 2008 and beginning of 2009.Yet in order to investigate this scenario we focused on the evolution of model likelihood. Thelikelihood estimates the accuracy of the distribution fit on residuals. The Figure 5 indicatesthat the likelihood diminished substantially in the end of 2008 with a minim in June 2009 andrallied afterwards. This finding shows that the residual noise of the model became stronger inthe same period the VAT carousel was turning as a result of trades that violated fundamentaltrends.
Figure 6: Likelihood evolution of APT model
The previous results underline that a trading ”epiphenomena” occurred between August 2008and June 2009. This ”‘hidden trading”’ modified significantly the behavior of the carbonmarket, its price level as well as its relationship to other commodities as oil and energy. Theepiphenomena was pushed by high trading volumes ceased after the VAT ban on carbonallowances. The link between the hidden trading pattern and the VAT carousel fraud isobvious and the estimated loss for the French government is at least 1.3 billions euros, givenour estimations.
5 Conclusions
Statistics as forensic instrument is a new field and yet its actual applications are very vastand futures research in this area are justified. The VAT fraud on the carbon permits marketthat occurred between 2008 and 2009 represented a breach in the regulatory system. Beyond
8 Documents de Travail du Centre d'Economie de la Sorbonne - 2010.69

the fund pocketing effect the scheme had a strong effect of market manipulation, by driftingcarbon prices behavior from its fundamental state. This situation reversed immediately afterthe French government banned the VAT trade. This type of analysis could be extended toother type of markets and trading system in order to track or search of abnormalities ortrading rules violations.
9 Documents de Travail du Centre d'Economie de la Sorbonne - 2010.69

References
[1] Artzner P., Delbaen F., Eber J., Heath D., Coherent Measures of Risk, MathematicalFinance, 1999, 3, 203-228
[2] Badescu, A., Kulperger, R. and Lazar, E., (2008). Option Valuation with Normal Mix-tureGARCH Models. Studies in Nonlinear Dynamics and Econometrics, 12 (2), 1580-1580.
[3] Benz E., Truck S., Modeling the price dynamics of CO2 emission allowances, ElsevierScience, 2008
[4] Brandorff-Nielsen, O.E., Processes of normal inverse Gaussian type, Finance andStochastics, 1998, 2, 41-68
[5] Christoffersen P., Jacobs K. (2002) Which volatility model for option valuation? WPCirano, Montreal, Canada.
[6] Chorro, C., Guegan, D. and Ielpo, F., (2009). Martingalized Historical approach forOption Pricing, , to appear in Finance Research Letters, 2009.
[7] Daskalakis G., Markellos N., Are the European Carbon markets efficient, Review ofFutures Markets, 2008, 17, 2, 103-128
[8] Daskalakis G., Psychoyios D., Markellos R., Modelling CO2 emission allowance pricesand derivatives: Evidence from European trading scheme, Journal of Banking and Fi-nance, 2009
[9] Diongue AK, Guegan D., Wolff R.C. (2009), BL-GARCH model with elliptical dis-tributed innovations. . To appear in Journal of Statistical Computation and Simulation,Nov 2009.
[10] Eberlein E., Prause K., The Generalized hyperbolic model: Fiancial derivatives and riskmanagement, Bull. London Math. Soc., 10,1998,300-325
[11] Frunza M.C., Guegan D., An economic view upon carbon emission allowances mar-ket, Working paper WP 2009-38, CES Universite Paris1 Pantheon-Sorbonne, 2009,ftp://mse.univ-paris1.fr/pub/mse/CES2009/09038.pdf.
[12] Hamilton J.D., A New Approach to the Economic Analysis of Nonstationary Time Seriesand the Business Cycle, Econometrica, 1989, 57, 2, 357-384
[13] Knittel, C., Roberts M., An empirical examination of restructured electricity prices,Energy Economics, 2005,September, 27, 5, 791-817
[14] Paolella M., Taschini L., An econometriv analyisis of emission Trading allowances, SwissFinance Institute, 2006, Research ¨papers, 06-26
[15] Schwartz E.S., The stochastic behavior of commodity prices: Implications for valuationand hedging, The Journal of Finance,1997,52,3,923-973
10 Documents de Travail du Centre d'Economie de la Sorbonne - 2010.69
[16] Schoutens W., Levy processes in Finance, Wiley series in Probability and Statistics,2003.
[17] Uhrig-Homburg M., Michael Wagner, Futures price dynamics of CO2 emission certificates-An empirical analysis, University of Karlsruhe, 2007
11 Documents de Travail du Centre d'Economie de la Sorbonne - 2010.69