Embed Size (px)
Citation preview
STATISTICAL HANDBOOK OF
JAPAN
2017

© 2017 by Statistics Bureau Ministry of Internal Affairs and Communications
Japan All rights reserved.
Edited and Published by
Statistics Bureau Ministry of Internal Affairs and Communications
Japan 19-1 Wakamatsu-cho, Shinjuku-ku
Tokyo 162-8668 Japan
Printed in Japan ISSN 0081-4792
http://www.stat.go.jp/english/data/handbook/index.htm

Preface
This handbook is designed to provide a clear and coherent overview of present-day Japan through statistics.
It provides statistical tables, figures, maps and photographs to portray conditions in modern-day Japan from a variety of perspectives, including demographics, economic and social trends, and culture. Most of the comments and statistical data for this purpose have been drawn from principal statistical publications available from government and other leading sources.
For more in-depth statistical information on Japan, readers are invited to peruse the Japan Statistical Yearbook.
We hope that this booklet will serve as a guide in your search for knowledge about Japan. We are always happy to receive opinions or requests from readers.
You can also view the contents of this booklet on the website of the Statistics Bureau.
September 2017
Masato CHINO Director-General Statistics Bureau Ministry of Internal Affairs and Communications Japan

Notes for Users
1. The present issue basically contains statistics that became available by May 31, 2017.
2. Unless otherwise indicated, "year" refers to the calendar year and "fiscal year" refers to the 12 months beginning April 1 of the year stated.
3. Metric units are used in all tables and figures in which the data are measured in weight, volume, length or area.
4. Unless otherwise indicated, amounts shown are in Japanese yen. Refer to Appendix 3 for exchange rates of JPY per U.S. dollar.
5. Statistical figures may not add up to the totals due to rounding.
6. The following symbols are used in the tables:
・・・ Data not available
- Magnitude zero or figures not applicable
0 or 0.0 Less than half of unit employed
# Marked break in series
* Provisional or estimate
7. Data relating to "China" generally exclude those for Hong Kong SAR, Macao SAR and Taiwan.
8. All contents of the present issue, including tables, figures, and maps, are also available on the website:
http://www.stat.go.jp/english/data/handbook/index.htm
9. When any contents of the present issue are to be quoted or copied in other media (print or electronic), the title is to be referred to as follows:
Source: Statistical Handbook of Japan 2017, Statistics Bureau, Ministry of Internal Affairs and Communications, Japan.

Contents Chapter 1 Land and Climate .......................................................................... 1
1. Land .............................................................................................................. 2 2. Climate .......................................................................................................... 4
Chapter 2 Population ....................................................................................... 7 1. Total Population ........................................................................................... 8 2. Households ................................................................................................. 10
(1) Household Size and Household Composition .................................... 10 (2) Elderly Households .............................................................................. 12
3. Declining Birth Rate and Aging Population ............................................. 13 4. Births and Deaths ....................................................................................... 15 5. Marriages and Divorces ............................................................................. 18 6. Population Density and Regional Distribution ......................................... 19
(1) Population Density ............................................................................... 19 (2) Population Distribution ........................................................................ 21
Chapter 3 Economy ........................................................................................ 22 1. Economic Development ............................................................................ 23 2. Bubble Economy and Its Collapse ............................................................ 24 3. Recent Economic Trends ........................................................................... 26 4. Industrial Structure ..................................................................................... 29
Chapter 4 Finance .......................................................................................... 34 1. National and Local Government Finance ................................................. 35
(1) National Government Finance ............................................................ 35 (2) Local Government Finance ................................................................. 38 (3) National and Local Government Finance ........................................... 40 (4) Tax ......................................................................................................... 43
2. Bank of Japan and Money Stock .............................................................. 44 3. Financial Institutions .................................................................................. 47 4. Financial Assets .......................................................................................... 49 5. Stock Market .............................................................................................. 50

Chapter 5 Agriculture, Forestry and Fisheries .......................................... 53 1. Overview of Agriculture, Forestry and Fisheries ..................................... 54 2. Agriculture .................................................................................................. 54
(1) Agricultural Production ........................................................................ 54 (2) Farmers and Farmland ......................................................................... 56
3. Forestry ....................................................................................................... 57 4. Fisheries ...................................................................................................... 59
(1) Fishery Production ............................................................................... 59 (2) Fishery Workers ................................................................................... 60
5. Self-Sufficiency in Food ............................................................................ 61
Chapter 6 Manufacturing and Construction ............................................. 64 1. Overview of the Manufacturing Sector .................................................... 65 2. Principal Industries in the Manufacturing Sector ..................................... 68
(1) Machinery Industry .............................................................................. 68 (2) Chemical Industry ................................................................................ 70 (3) Iron and Steel Industry ......................................................................... 70 (4) Fabricated Metal Products Industry .................................................... 71
3. Construction ............................................................................................... 71
Chapter 7 Energy ............................................................................................ 74 1. Supply and Demand .................................................................................. 75 2. Electric Power ............................................................................................ 80 3. Gas .............................................................................................................. 81
Chapter 8 Science and Technology/Information and Communication .. 82 1. Science and Technology ............................................................................ 83
(1) Researchers and R&D Expenditures .................................................. 83 (2) Technology Balance of Payments (Technology Trade) ..................... 85
2. Patents ......................................................................................................... 87 3. Information and Communication .............................................................. 89
(1) Diffusion of the Internet ....................................................................... 89 (2) Progress of Communication Technologies ......................................... 91 (3) Telephones ............................................................................................ 92 (4) Postal Service ....................................................................................... 93

Chapter 9 Transport ....................................................................................... 94 1. Domestic Transport .................................................................................... 95
(1) Domestic Passenger Transport ............................................................ 95 (2) Domestic Freight Transport ................................................................. 97
2. International Transport ............................................................................... 98 (1) International Passenger Transport ....................................................... 98 (2) International Freight Transport .......................................................... 101
Chapter 10 Commerce ................................................................................. 102 1. Wholesale and Retail ............................................................................... 103
(1) Wholesale Trade ................................................................................. 103 (2) Retail Trade ......................................................................................... 104
2. Eating and Drinking Places ..................................................................... 104
Chapter 11 Trade, International Balance of Payments, and International Cooperation ......................................................................... 105
1. Trade ......................................................................................................... 106 (1) Overview of Trade ............................................................................. 106 (2) Trade by Commodity ......................................................................... 107 (3) Trade by Country/Region ................................................................... 111
2. International Balance of Payments ......................................................... 114 3. International Cooperation ........................................................................ 116
Chapter 12 Labour ....................................................................................... 121
1. Labour Force ............................................................................................ 122 2. Employment ............................................................................................. 124
(1) Employment by Industry ................................................................... 125 (2) Employment by Occupation .............................................................. 127 (3) Employment by Employment Pattern .............................................. 128
3. Unemployment ......................................................................................... 131 4. Hours of Work and Wages ....................................................................... 133
Chapter 13 Family Budgets and Prices ..................................................... 136
1. Family Budgets ........................................................................................ 137 (1) Income and Expenditure .................................................................... 137 (2) Savings and Debts .............................................................................. 143 (3) Internet Shopping by Households ..................................................... 145

(4) Electronic Money ............................................................................... 147 2. Prices ......................................................................................................... 148
(1) Consumer Price Index (CPI) ............................................................. 149 (2) Corporate Goods and Services Producer Price Indices ................... 150
Chapter 14 Environment and Life ............................................................. 152
1. Environmental Issues ............................................................................... 153 2. Housing ..................................................................................................... 156 3. Traffic Accidents ...................................................................................... 159 4. Crime ........................................................................................................ 160
Chapter 15 Social Security, Health Care, and Public Hygiene .............. 162
1. Social Security .......................................................................................... 163 2. Health Care and Public Hygiene ............................................................. 166
Chapter 16 Education and Culture ........................................................... 171 1. School-Based Education .......................................................................... 172 2. Lifelong Learning .................................................................................... 176 3. Leisure Activities ..................................................................................... 177 4. Publishing and Mass Media .................................................................... 178 5. Cultural Assets .......................................................................................... 181
Chapter 17 Government System ................................................................ 184
1. Separation of Powers ............................................................................... 185 2. Legislative Branch ................................................................................... 187 3. Executive Branch ..................................................................................... 188 4. Judicial Branch ......................................................................................... 189 5. Local Governments .................................................................................. 190
Appendices 1. Population, Surface Area and Population Density by Prefecture .......... 192 2. Main Economic Indicators of Selected Countries ................................. 193 3. Foreign Exchange Rates .......................................................................... 197 4. Conversion Factors .................................................................................. 197

List of Tables
1.1 Surface Area of Japan ........................................................................ 2 1.2 Top 10 Countries According to Surface Area ................................... 2 1.3 Mountains ........................................................................................... 3 1.4 Rivers .................................................................................................. 3 1.5 Lakes ................................................................................................... 3 1.6 Surface Area by Use .......................................................................... 4 1.7 Temperature and Precipitation (Normal value) ................................ 6
2.1 Countries with a Large Population .................................................... 8 2.2 Trends in Population ........................................................................ 10 2.3 Households and Household Members ............................................. 11 2.4 Trends in Elderly Households ......................................................... 12 2.5 Age Structure of Population by Country ........................................ 14 2.6 Vital Statistics ................................................................................... 16 2.7 Changes of Mothers' Age at Childbirth .......................................... 17 2.8 Mean Age of First Marriage ............................................................ 18 2.9 Population of Major Cities .............................................................. 21 2.10 Population of Three Major Metropolitan Areas ............................. 21
3.1 Gross Domestic Product (Expenditure approach) .......................... 27 3.2 Changes in Industrial Structure ....................................................... 29 3.3 Gross Domestic Product by Type of Economic Activity ............... 30 3.4 Number of Establishments and Persons Engaged .......................... 32 3.5 Trends of Overseas Affiliated Company
(Manufacturing Industries) ............................................................. 33
4.1 Expenditures of General Account ................................................... 37 4.2 Local Government Finance (Ordinary accounts) ........................... 39 4.3 Expenditures of National and Local Governments
(Initial budget) ................................................................................. 40 4.4 Currency in Circulation (Outstanding at year-end) ........................ 45 4.5 Money Stock (Average amounts outstanding) ............................... 45 4.6 Financial Markets (Interest rates, etc.) ............................................ 46 4.7 Financial Assets and Liabilities of Japan ........................................ 49 4.8 Stock Prices (Tokyo Stock Exchange, first section) ....................... 51

5.1 Agricultural, Forestry and Fisheries Output ................................... 54 5.2 Agricultural Production ................................................................... 55 5.3 Production of Meat, Milk and Eggs ................................................ 55 5.4 Commercial Farm Households and Commercial Farmers ............ 56 5.5 Forest Land Area and Forest Resources ......................................... 57 5.6 Production by Fishery Type and Species ........................................ 60 5.7 Enterprises and Workers Engaged in the Marine Fishery
/Aquaculture Industry ..................................................................... 61 5.8 Supply of Cereal Grains .................................................................. 62
6.1 Establishments, Persons Engaged and Value of
Manufactured Goods Shipments of the Manufacturing Industry .. 66 6.2 Indices on Mining and Manufacturing ........................................... 67 6.3 Steel Production ............................................................................... 71 6.4 Construction Investment (Current prices) ...................................... 72
7.1 Trends in Total Primary Energy Supply and Percentage
by Energy Source ........................................................................... 77 7.2 Trends in Electricity Output and Power Consumption .................. 80 7.3 Trends in Production and Purchases, and Sales of Gas ................. 81
8.1 Trends in Research and Development ............................................ 83 8.2 Technology Trade by Business Enterprises .................................... 86 8.3 Patents ............................................................................................... 87 8.4 PCT International Applications by Country of Origin ................... 88 8.5 Status of Internet Use by Terminal by Age Group ......................... 90 8.6 Subscribers to Telecommunications Services ................................ 91 8.7 Postal Services .................................................................................. 93
9.1 Domestic Passenger Transport ........................................................ 96 9.2 Domestic Freight Transport ............................................................. 97 9.3 Japanese Travelers ............................................................................ 99 9.4 Foreign Visitors .............................................................................. 100 9.5 Seaborne Foreign Transport .......................................................... 101
10.1 Establishments and Persons Engaged
in the Wholesale and Retail Sector ............................................. 103 10.2 Eating and Drinking Places .......................................................... 104

11.1 Trends in Foreign Trade and Indices of Trade ............................. 107 11.2 Value of Exports and Imports, by Principal Commodity ............ 109 11.3 Trends in Exports and Imports by Country/Region ..................... 111 11.4 International Balance of Payments ............................................... 114 11.5 Trends in Japan's International Investment Position ................... 115 11.6 Reserve Assets ............................................................................... 115 11.7 Net Flow of Development Cooperation ....................................... 117 11.8 Regional Distribution of Bilateral ODA ...................................... 119 11.9 Number of Persons Involved in Technical Cooperation
by Type ....................................................................................... 120
12.1 Population by Labour Force Status .............................................. 123 12.2 Employment by Industry .............................................................. 126 12.3 Employment by Occupation ......................................................... 128 12.4 Employment by Employment Pattern .......................................... 129 12.5 Hours of Work and Wages (Monthly average) ............................ 134
13.1 Average Monthly Income and Expenditures
(Workers' households) ................................................................ 138 13.2 Average Monthly Consumption Expenditures by Age Group
(One-person households) ........................................................... 143 13.3 Average Amount of Savings and Debts (Workers' households) . 144 13.4 Amount of Savings and Debts by Age Group
of Household Head (Workers' households) .............................. 144 13.5 CPI for Major Categories of Goods and Services ....................... 149 13.6 Corporate Goods and Services Producer Price Indices ............... 151
14.1 Breakdown of Carbon Dioxide Emissions .................................. 153 14.2 Waste Generation and Disposal .................................................... 155 14.3 Housing Conditions ....................................................................... 158 14.4 Occupied Dwellings by Type of Building ................................... 158 14.5 Traffic Accidents and Casualties .................................................. 160 14.6 Trends in Crime (Penal code offenses) ........................................ 161
15.1 Trends in Social Security Benefit Expenditures
by Institutional Scheme ............................................................. 164 15.2 Medical Personnel at Work ........................................................... 168 15.3 Medical Care Institutions and Beds ............................................. 169

16.1 Educational Institutions in Japan .................................................. 172 16.2 Number of University Students .................................................... 174 16.3 Social Education Facilities and Users .......................................... 176 16.4 Major Leisure Activities by Gender (10 years old and over) ...... 177 16.5 Number of New Publications ....................................................... 179 16.6 Advertising Expenditures by Medium ......................................... 180 16.7 Cultural Properties Designated by the National Government .... 181 16.8 Heritage Sites Inscribed on the World Heritage List ................... 183
17.1 Diet Members by Political Group ................................................ 188 17.2 Successive Prime Ministers .......................................................... 189 17.3 Judicial Cases Newly Commenced, Terminated or Pending
(All courts) .................................................................................... 190
List of Figures
1.1 Famous Mountains of the World ....................................................... 3 1.2 Temperature and Precipitation (Normal value) ................................ 5
2.1 Population Pyramid ............................................................................ 8 2.2 Population Density by Country ......................................................... 9 2.3 Changes in Household Composition ............................................... 11 2.4 Changes in the Population Pyramid ................................................ 13 2.5 Proportion of Elderly Population by Country
(Aged 65 years and over) ............................................................. 14 2.6 Natural Population Change ............................................................. 15 2.7 Life Expectancy at Birth by Country .............................................. 17 2.8 Changes in Marriage Rate and Divorce Rate ................................. 19 2.9 Population Density by Prefecture ................................................... 20
3.1 Economic Growth Rates .................................................................. 23 3.2 National Wealth ................................................................................ 25 3.3 Gross Domestic Product
(Nominal prices, converted into U.S. dollars) ............................. 26 3.4 Economic Growth Rates (Quarterly changes) ............................... 28

3.5 Shares of Establishments and Persons Engaged by Scale of Operation ................................................................... 31
4.1 Revenues and Expenditures in the General Account ..................... 36 4.2 Composition of Revenue and Expenditure of General
Account Budget (Initial budget) ................................................... 38 4.3 Ratio of Net Total National and Local Expenditures by Function .. 41 4.4 National Government Bond Issue ................................................... 42 4.5 Ratio of General Government Gross Debt to GDP ........................ 43 4.6 Ratio of Taxation Burden to National Income by Country
(Actual basis) ................................................................................ 44 4.7 Assets of Domestically Licensed Banks
(Banking Accounts, end of year) ................................................. 48 4.8 Stock Price Index and Total Market Capitalization
(Tokyo Stock Exchange, first section, end of year) ..................... 50
5.1 Industrial Wood Supply and Self-Sufficiency Rate ....................... 58 5.2 Production by Type of Fishery ........................................................ 59 5.3 Self-Sufficiency Rates for Selected Categories
of Agricultural Produce .................................................................. 62 5.4 Trends in Food Self-Sufficiency Rates of Major Countries
(In terms of calories) ..................................................................... 63
6.1 Trends in Indices on Mining and Manufacturing ........................... 68 6.2 Building Construction Started by Use Objective ........................... 73
7.1 Total Primary Energy Supply .......................................................... 76 7.2 International Comparison of Energy/GDP Ratio ........................... 77 7.3 Trends in Final Energy Consumption and Real GDP .................... 78 7.4 Trends in Final Energy Consumption by Sector ............................ 79 7.5 Total Final Energy Consumption by Country ................................ 79
8.1 Researchers and Expenditures by Industry
(Business enterprises) ................................................................... 85 8.2 Composition of Technology Trade by Major Country/Region ..... 87 8.3 Changes in Patent Applications with Major Offices
by Japanese Applicants ................................................................. 89 8.4 Trends in Internet Usage Rate by Age Group ................................ 90 8.5 International Comparison of Fixed Broadband Subscribers ......... 92

8.6 Telephone Service Subscribers ........................................................ 93
9.1 Composition of Domestic Transport ............................................... 95 9.2 Japanese Overseas Travelers and Foreign Visitor Arrivals ............ 98
11.1 Foreign Trade .................................................................................. 106 11.2 Component Ratios of Foreign Trade by Commodity .................. 108 11.3 Japan's Major Export and Import Commodities ........................... 110 11.4 Trends in Japan's Trade by Country/Region ................................. 113 11.5 Yen Exchange Rate against the U.S. Dollar ................................. 116 11.6 Trends in ODA by Country ........................................................... 118 11.7 Distribution of Bilateral ODA by Sector ....................................... 119
12.1 Labour Force Participation Rate by Gender ................................. 124 12.2 Structure of Employment by Country ........................................... 125 12.3 Distribution of Employment by Industry ...................................... 127 12.4 Employment Pattern by Gender and Age ..................................... 129 12.5 Unemployment Rate and Ratio of Job Openings
to Job Seekers .............................................................................. 131 12.6 Unemployment Rates by Gender and Age ................................... 132 12.7 Unemployment Rates by Country ................................................ 133 12.8 Monthly Contractual Cash Earnings by Size of Enterprise ......... 135
13.1 Average Monthly Consumption Expenditures
(Two-or-more-person households) ............................................ 137 13.2 Balance of Income and Expenditures
(Monthly average, workers' households) .................................. 139 13.3 Annual Change in Household Income and Expenditures
(Workers' households) ................................................................ 140 13.4 Average Monthly Family Income and Expenditures
by Age Group of Household Head (Workers' households) ..... 141 13.5 Average Monthly Income and Expenditures
(Non-working elderly households) ........................................... 142 13.6 Proportion of Households Ordered over the Internet
(Two-or-more-person households) ............................................ 145 13.7 Ratio of Expenditure on Goods and Services Ordered
over the Internet (Two-or-more-person Households) .............. 146 13.8 Trends in Ownership and Utilization of Electronic Money
(All households) ......................................................................... 147

13.9 Price Trends (Percent change from previous year) ...................... 149 13.10 Regional Difference Index of Consumer Prices
by Selected Prefectures .............................................................. 150
14.1 Sources of Carbon Dioxide Emissions ........................................ 154 14.2 Recycling of Nonindustrial Waste ................................................ 156 14.3 Trends in Dwellings, Vacant Dwellings and Vacancy Rate ........ 157 14.4 Ratio of Housing with Universal Design Features ...................... 159
15.1 Trends in Social Security Benefit Expenditures by Sector ......... 165 15.2 National Contribution Ratio by Country ...................................... 166 15.3 Death Rates by Major Cause ........................................................ 167 15.4 Trends in Medical Care Expenditures .......................................... 170
16.1 Japanese School System ............................................................... 173 16.2 University Students by Major Subject ......................................... 174 16.3 Public Expenditures on Education ............................................... 175 16.4 Trends in Number of Publications ................................................ 178 16.5 Newspaper Circulation by Country .............................................. 179
17.1 Separation of Powers under the Constitution of Japan ............... 185 17.2 Government Organization ............................................................ 186 17.3 Government System by Level ...................................................... 191 17.4 Local Government Employees by Type of
Administrative Services ............................................................. 191

Photo Sources MORI Hiroshi; The Month of Photography, Tokyo 2017 ..............Cover photo Tateyama Kurobe Alpine Route. .......................................................... Chapter 1 Tachikawa City (Photo by Ryoukan Abe) ........................................... Chapter 2 MORI Shizuyo; The Month of Photography, Tokyo 2017 ................. Chapter 3 Kitano Meister Garden ......................................................................... Chapter 4 Kanto Regional Agricultural Administration Office ........................... Chapter 5 Japan Bridge Association Inc. .............................................................. Chapter 6 Yokohama Environmental Planning Bureau ....................................... Chapter 7 SoftBank Robotics Corp. ...................................................................... Chapter 8 Ministry of Land, Infrastructure, Transport and Tourism. Tokyo Airport Development Office, Kanto Regional Development Bureau. ................................................ Chapter 9 HARADA Ryouhei; The Month of Photography, Tokyo 2017 ....... Chapter 10 Nipponkoun.co.,ltd. ............................................................................. Chapter 11 NASUKAWA Fumio; The Month of Photography, Tokyo 2017 ..... Chapter 12 SATO Akiko; The Month of Photography, Tokyo 2017 ................... Chapter 13 JAXA ................................................................................................... Chapter 14 YUASA Haruyoshi; The Month of Photography, Tokyo 2017 ........ Chapter 15 City of Takayama ................................................................................ Chapter 16 Government Buildings Department, Minister's Secretariat, Ministry of Land, Infrastructure and Transport ................................. Chapter 17
Cover photo: Mt.Fuji
Mt. Fuji is the highest peak in Japan, with an elevation of 3,776 meters. In June 2013, it was registered as a World Cultural Heritage Site, making it the 17th World Heritage Site in Japan. As a component part of Mount Fuji that is registered as a World Cultural Heritage Site, Oshino Hakkai Springs is made up of eight springs. As a whole, Oshino Village in Yamanashi Prefecture, where the springs are scattered throughout, used to be an enormous lake.

“Statistical Handbook of Japan 2017” by Statistics Bureau, Japan
Chapter 1
Land and Climate
Tateyama Murododaira is one of the world's foremost areas of heavy snowfall. Bulldozers dig through the road that is buried in snow, little by little, by checking their positions using GPS. It takes about one month to open the road. Known as "Yuki-no-Otani (the Great Snow Canyon)", it is possible to walk this road surrounded by walls of snow during the event period.
© Tateyama Kurobe Alpine Route.

LAND AND CLIMATE
2
1. Land
Japan is an island nation situated off the eastern seaboard of the Eurasian continent in the northern hemisphere. The islands form a crescent-shaped archipelago stretching from northeast to southwest parallel to the continental coastline with the Sea of Japan in between. The land is located between approximately 20 to 45 degrees north latitude and between approximately 123 to 154 degrees east longitude. It consists of the main islands of Hokkaido, Honshu, Shikoku, Kyushu and Okinawa, and more than 6,800 smaller islands of varying sizes. Its surface area totals approximately 380,000 square kilometers, a figure equivalent to 0.3 percent of the global land mass.
Since the Japanese archipelago is located in a zone of relatively young tectonic plate movement, it is particularly prone to various physiographical phenomena. Therefore, the number of earthquakes in the country is quite high, and so is the proportion of active volcanoes. The land is full of undulations, with mountainous regions including hilly terrain accounting for about three-quarters of its total area. The mountains are generally steep and are intricately carved out by ravines. Hilly terrain extends between the mountainous regions and the plains.
Table 1.1Surface Area of Japan (2016)
(Square kilometers)District Area
Japan ........................ 377,972 Honshu .................... 231,231 Hokkaido ................. 83,424 Kyushu .................... 42,232 Shikoku ................... 18,804 Okinawa .................. 2,281Source: Ministry of Land, Infra-structure, Transport and Tourism.
Table 1.2Top 10 Countries According to Surface Area (2015) 1)
(1,000 square kilometers)Country Area
World ............................ 136,162 Russia ......................... 17,098 Canada ........................ 9,985 U.S.A. ......................... 9,834 China .......................... 9,600 Brazil .......................... 8,516 Australia ..................... 7,692 India ............................ 3,287 Argentina .................... 2,780 Kazakhstan ................. 2,725 Algeria ........................ 2,3821) Comprising land area and inland waters. Excluding polar regions and uninhabited islands.Source: United Nations.

LAND AND CLIMATE
3
Table 1.3Mountains (2016)
(Meters)Name
Mt. Fuji ........................... 3,776Mt. Kitadake ................... 3,193Mt. Ainodake .................. 3,190Mt. Okuhotaka ................ 3,190Mt. Yarigatake ................ 3,180Mt. Higashidake ............. 3,141Mt. Akaishi ..................... 3,121Mt. Karasawa .................. 3,110Mt. Kitahotaka ................ 3,106Mt. Obami ...................... 3,101Source: Ministry of Land, Infra-structure, Transport and Tourism.
Table 1.4Rivers (2015)
(Kilometers)Name
Shinano River ................. 367Tone River ...................... 322Ishikari River .................. 268Teshio River ................... 256Kitakami River ............... 249Abukuma River .............. 239Kiso River ....................... 229Mogami River ................. 229Tenryu River ................... 213Agano River .................... 210Source: Ministry of Land, Infra-structure, Transport and Tourism.
Table 1.5Lakes (2016)
(Square kilometers)Name
Lake Biwa ....................... 669.3Lake Kasumigaura .......... 168.2Lake Saroma ................... 151.6Lake Inawashiro ............. 103.2Lake Nakaumi ................ 85.7Lake Kussharo ................ 79.5Lake Shinji ...................... 79.3Lake Shikotsu ................. 78.5Lake Toya ....................... 70.7Lake Hamana .................. 64.9Source: Ministry of Land, Infra-structure, Transport and Tourism.
Height
Length
Area
0
1,000
2,000
3,000
4,000
5,000
6,000
7,000
8,000
9,000
10,000
8,848
6,959
5,892 6,194
4,810
3,776
Mt. Everest(Asia)
Mt. Aconcagua(S. America)
Mt. Kilimanjaro(Africa) Mt. Denali
(N. America)
Mont Blanc(Europe)
Mt. Fuji(Japan)
Source: National Astronomical Observatory of Japan.
m
Figure 1.1Famous Mountains of the World

LAND AND CLIMATE
4
Forestland and fields account for the largest portion of the nation's surface area. There are approximately 250,000 square kilometers of forestland and fields (which equates to 67 percent of the nation's surface area), followed by approximately 50,000 square kilometers of agricultural land (12 percent). Together, forestland, fields and agricultural land thus cover approximately 80 percent of the nation. There are approximately 20,000 square kilometers of land for buildings (5 percent).
2. Climate
The Japanese archipelago has a temperate marine climate. Though they may differ depending on the effects of seasonal winds and ocean currents, the changes in the four seasons are distinct. Japan typically experiences hot, humid summers and cold, dry winters. The topography of Honshu, however, features a series of major mountain ranges running from north to south. Because of this feature, the northwest monsoon in the winter brings humid conditions with heavy precipitation (snow) to the Sea of Japan side of Honshu but comparatively dry weather with low precipitation to the Pacific Ocean side. In summer, the winds blow mainly from the southeast, giving rise to hot and humid weather. Another unique characteristic of Japan's climate is that it has two long spells of rainy seasons, one in early summer when the southeast monsoon begins to blow, and the other in autumn when the winds cease. From summer to autumn, tropical cyclones generated in the Pacific Ocean to the south develop into typhoons and hit Japan, sometimes causing storm and flood damage.
Table 1.6Surface Area by Use
(1,000 square kilometers)
Year Total Forestlandand fields
Agriculturalland
Inlandwater Roads 1) Building
land 2) Others
1980 377.7 256.8 55.9 13.1 9.9 13.9 28.11990 377.7 255.2 53.3 13.1 11.4 16.0 28.72000 377.9 253.8 49.1 13.5 12.7 17.9 30.92010 377.9 253.5 46.7 13.3 13.6 19.0 31.9
Percentage distribution (%)2010 100.0 67.1 12.4 3.5 3.6 5.0 8.4
1) Including farm roads and forest roads, etc. 2) Including industrial land and other land for buildings. Source: Ministry of Land, Infrastructure, Transport and Tourism.

LAND AND CLIMATE
5
Source: Japan Meteorological Agency.
Figure 1.2Temperature and Precipitation (Normal value)(1981-2010 average)
0
10
20
30
0 100 200 300
Tokyo℃
Jan.FM
A
M
JJ
A
S
ON
D
mm
-10
0
10
20
30
0 100 200
Sapporo℃
Jan.FM
A
M
J
J A
S
O
N
D
mm
0
10
20
30
0 100 200 300
Kyoto
Jan. F
M
AM
J
JAS
O
N
D
mm
℃
0
10
20
30
0 100 200 300 400 500
Kagoshima
O
℃
mm
Jan. F
MA
M
JJ
AS
N
D0
10
20
30
40
0 100 200 300
Naha
F
AJ
℃
mm
Jan.
M
M
J AS
ON
D
0
10
20
30
0 100 200 300 400
Kanazawa
Jan.F
M
A
MJ
JA
S
ON
D
℃
mm
HOKKAIDO
HONSHU
SHIKOKUKYUSHU
OKINAWA
0
10
20
30
0 100 200
Takamatsu
Jan. FM
A
M J
JA
S
ON
D
℃
mm

LAND AND CLIMATE
6
Table 1.7Temperature and Precipitation (Normal value) (1981-2010 average)
Temperature (℃) Precipitation (mm)Observing
station Jan. Feb. Mar. Apr. May June July Aug. Sep. Oct. Nov. Dec. Annual 1)
High -0.6 0.1 4.0 11.5 17.3 21.5 24.9 26.4 22.4 16.2 8.5 2.1 12.9Low -7.0 -6.6 -2.9 3.2 8.3 12.9 17.3 19.1 14.2 7.5 1.3 -4.1 5.3
114 94 78 57 53 47 81 124 135 109 104 112 1,107High 9.6 10.4 13.6 19.0 22.9 25.5 29.2 30.8 26.9 21.5 16.3 11.9 19.8Low 0.9 1.7 4.4 9.4 14.0 18.0 21.8 23.0 19.7 14.2 8.3 3.5 11.6
52 56 118 125 138 168 154 168 210 198 93 51 1,529High 6.8 7.3 11.0 16.9 21.6 25.0 28.8 30.9 26.6 21.3 15.5 10.2 18.5Low 0.9 0.7 3.0 8.2 13.1 18.0 22.3 23.7 19.5 13.3 7.7 3.4 11.2
270 172 159 137 155 185 232 139 226 177 265 282 2,399High 8.9 9.7 13.4 19.9 24.6 27.8 31.5 33.3 28.8 22.9 17.0 11.6 20.8Low 1.2 1.4 4.0 9.0 14.0 18.8 23.2 24.3 20.3 13.6 7.8 3.2 11.7
50 68 113 116 161 214 220 132 176 121 71 48 1,491High 9.4 10.1 13.4 19.5 24.1 27.3 31.2 32.4 28.4 22.8 17.2 12.1 20.7Low 1.6 1.8 4.4 9.4 14.4 19.3 23.6 24.4 20.7 14.2 8.5 3.7 12.2
38 48 83 76 108 151 144 86 148 104 60 37 1,082High 12.8 14.3 17.0 21.6 25.2 27.6 31.9 32.5 30.1 25.4 20.3 15.3 22.8Low 4.6 5.7 8.4 12.7 17.1 21.0 25.3 25.6 22.8 17.5 11.9 6.7 14.9
78 112 180 205 221 452 319 223 211 102 92 71 2,266High 19.5 19.8 21.7 24.1 26.7 29.4 31.8 31.5 30.4 27.9 24.6 21.2 25.7Low 14.6 14.8 16.5 19.0 21.8 24.8 26.8 26.6 25.5 23.1 19.9 16.3 20.8
107 120 161 166 232 247 141 241 261 153 110 103 2,041
1) Annual average for temperature and annual total for precipitation.Source: Japan Meteorological Agency.
NahaTemp.
Prec.
TakamatsuTemp.
Prec.
KagoshimaTemp.
Prec.
KanazawaTemp.
Prec.
KyotoTemp.
Prec.
SapporoTemp.
Prec.
TokyoTemp.
Prec.

“Statistical Handbook of Japan 2017” by Statistics Bureau, Japan
Chapter 2
Population
"Premium Marriage Certificate" in Tachikawa City lets couples keep a memory of the moment that they become husband and wife in a tangible form. Since the marriage certificate is a duplicate, they are able to keep a copy on hand, and this premium certificate has also been gaining popularity since it can also be used as a picture frame. To have marrying couples show their attachment to the local area, and settle down and raise children there, local governments are expanding movements to create original marriage certificates as an approach toward local development and countermeasure to the falling birthrate. The number of marriages in 2016 was 620,523 couples, and the marriage rate was 5.0 (per 1,000 of the population).
© Tachikawa City (Photo by Ryoukan Abe)

POPULATION
8
1. Total Population
Japan's total population in 2016 was 126.93 million. This ranked eleventh in the world and made up 1.7 percent of the world's total. Japan's population density measured 340.8 persons per square kilometer in 2015, ranking ninth among countries with a population of 10 million or more.
0 400 800 1,2000
10
20
30
40
50
60
70
80
90
100
Figure 2.1Population Pyramid
Source: Statistics Bureau, MIC.
Thousands
04008001,200
Females
2016
1935
Age
Males
70 and 71 years: Birth rate declinedaround the end of World War Ⅱ.
67 to 69 years: Born in the first"baby boom" period (1947-49).
50 years: Born in 1966, "the year ofHinoeuma" (turns around every 60 years). Superstition says girls born in this year bring bad luck.
42 to 45 years: Born in the second"baby boom" period (1971-74).
77 years: Birth rate declined in 1938-39 due to the Sino-Japanese Incident. 100
and over
Table 2.1Countries with a Large Population (2016)
(Millions)Country Population Country Population
World ................................ 7,433 Pakistan ........................... 193 China ............................. 1,382 Nigeria ............................. 187 India ............................... 1,327 Bangladesh ...................... 163 U.S.A. ............................ 324 Russia .............................. 143 Indonesia ....................... 261 Mexico ............................ 129 Brazil ............................. 210 Japan ................................ 127Source: Statistics Bureau, MIC; United Nations.

POPULATION
9
From the eighteenth century through the first half of the nineteenth century, Japan's population remained steady at about 30 million. Following the Meiji Restoration in 1868, it began expanding in tandem with the drive to build a modern nation-state. In 1926, it reached 60 million, and in 1967, it surpassed the 100 million mark. However, Japan's population growth has slowed in more recent years, with the rate of population change about one percent from the 1960s through the 1970s. Since the 1980s, it has declined sharply. Japan's total population was 127.09 million according to the Population Census in 2015. This was a decrease by 962,607 people as compared to the previous Census (2010), indicating the first population decline since the initiation of the Population Census in 1920. In 2016, it was 126.93 million, down by 162,000 from the year before.
4.0
8.8
24.9
35.2
117.6
146.6
203.3
231.5
267.5
340.8
373.2
388.6
435.3
441.0
470.6
501.9
517.3
1236.8
Canada
Russia
Brazil
U.S.A.
France
China
Italy
Germany
U.K.
Japan
Belgium
Haiti
Burundi
India
Rwanda
Netherlands
Korea, Rep. of
Bangladesh
Figure 2.2Population Density by Country (2015)
= 50 persons(per square kilometer)= 50 persons(per square kilometer)
Source: Statistics Bureau, MIC; United Nations.

POPULATION
10
2. Households
(1) Household Size and Household Composition
The Population Census shows that Japan had 53.33 million private households (excluding "institutional households" such as students in school dormitories) in 2015, showing a consistent increase since the initiation of the Census. Of that total, 55.9 percent were nuclear-family households, and 34.6 percent were one-person households.
Table 2.2Trends in Population (as of October 1)
1872 1) 34,806 17,666 ... ... ... ... 911900 1) 43,847 22,051 33.9 60.7 5.4 0.83 1151910 1) 49,184 24,650 36.0 58.8 5.2 1.16 1291920 55,963 28,044 36.5 58.3 5.3 1.30 1471930 64,450 32,390 36.6 58.7 4.8 1.42 1691940 71,933 35,387 36.7 58.5 4.8 1.10 1881950 84,115 41,241 35.4 59.6 4.9 1.58 2261955 90,077 44,243 33.4 61.2 5.3 1.38 2421960 94,302 46,300 30.2 64.1 5.7 0.92 2541965 99,209 48,692 25.7 68.0 6.3 1.02 2671970 104,665 51,369 24.0 68.9 7.1 1.08 2811975 111,940 55,091 24.3 67.7 7.9 1.35 3011980 117,060 57,594 23.5 67.4 9.1 0.90 3141985 121,049 59,497 21.5 68.2 10.3 0.67 3251990 123,611 60,697 18.2 69.7 12.1 0.42 3321995 125,570 61,574 16.0 69.5 14.6 0.31 3372000 126,926 62,111 14.6 68.1 17.4 0.21 3402005 127,768 62,349 13.8 66.1 20.2 0.13 3432010 128,057 62,328 13.2 63.8 23.0 0.05 3432015 127,095 61,842 12.6 60.7 26.6 -0.15 3412016 126,933 61,766 12.4 60.3 27.3 -0.13 340
(Projection, 2017)2020 125,325 60,897 12.0 59.1 28.9 -0.32 3362030 119,125 57,697 11.1 57.7 31.2 -0.51 3192040 110,919 53,595 10.8 53.9 35.4 -0.71 2972050 101,923 49,257 10.6 51.8 37.7 -0.84 273
1) As of January 1.Source: Statistics Bureau, MIC; Ministry of Health, Labour and Welfare; Ministry of Land, Infrastructure, Transport and Tourism.
Populationdensity
(per km2)
Rate ofpopulation
change(%)
Year
Age composition (%)
0-14years
65 andover
Population (1,000)
Males 15-64

POPULATION
11
Table 2.3Households and Household Members
1970 30,297 … 103,351 3.41 104,665 5.51975 33,596 10.9 110,338 3.28 111,940 7.01980 35,824 6.6 115,451 3.22 117,060 4.61985 37,980 6.0 119,334 3.14 121,049 3.41990 40,670 7.1 121,545 2.99 123,611 2.11995 43,900 7.9 123,646 2.82 125,570 1.62000 46,782 6.6 124,725 2.67 126,926 1.12005 49,063 4.9 124,973 2.55 127,768 0.72010 51,842 5.7 125,546 2.42 128,057 0.22015 53,332 2.9 124,296 2.33 127,095 -0.8
1) Change over preceding Population Census. Source: Statistics Bureau, MIC.
Rate ofpopulation
change(%) 1)
Year
Privatehouse-holds
(1,000)
Privatehouseholdmembers(1,000)
Membersper
household
Population
(1,000)
Rate ofprivate househods
change(%) 1)
27.6
29.5
32.4
34.6
58.3
57.7
56.4
55.9
14.1
12.8
11.1
9.4
0 20 40 60 80 100
2000
2005
2010
2015
▲One-person households
▲Nuclear-family households
▲Others
Figure 2.3Changes in Household Composition
Source: Statistics Bureau, MIC.
%

POPULATION
12
From the 1920s to the mid-1950s, the average number of household members remained at about five. However, due to the increase in one-person households and nuclear families since the 1960s, the average size of households was down significantly in 1970, to 3.41 members. The number of household members has continued to decline, dropping to 2.33 in 2015. Although the Japanese population has shifted into decline, the number of households is expected to continue to increase for some years to come, as the size of the average household will shrink further. The number of households is projected to peak in 2019 and then decrease thereafter.
(2) Elderly Households
The number of elderly households (private households with household members 65 years of age or over) in 2015 was 21.71 million. They accounted for 40.7 percent of private households. There were 5.93 million one-person elderly households. Among these, there were approximately two times as many women as men.
Table 2.4Trends in Elderly Households
(Thousands)1995 2000 2005 2010 2015
Private households .......................... 43,900 46,782 49,063 51,842 53,332Elderly households ...................... 12,790 15,057 17,220 19,338 21,713 (percentage) ............................. 29.1 32.2 35.1 37.3 40.7
One-person households ........... 2,202 3,032 3,865 4,791 5,928Males ................................ 460 742 1,051 1,386 1,924Females ................................ 1,742 2,290 2,814 3,405 4,003
Aged-couple households 1) ...... 2,763 3,661 4,487 5,251 6,0791) Consisting of a husband 65 years of age and over and his wife 60 years of age and over.Source: Statistics Bureau, MIC.
Type of households
POPULATION
13
3. Declining Birth Rate and Aging Population
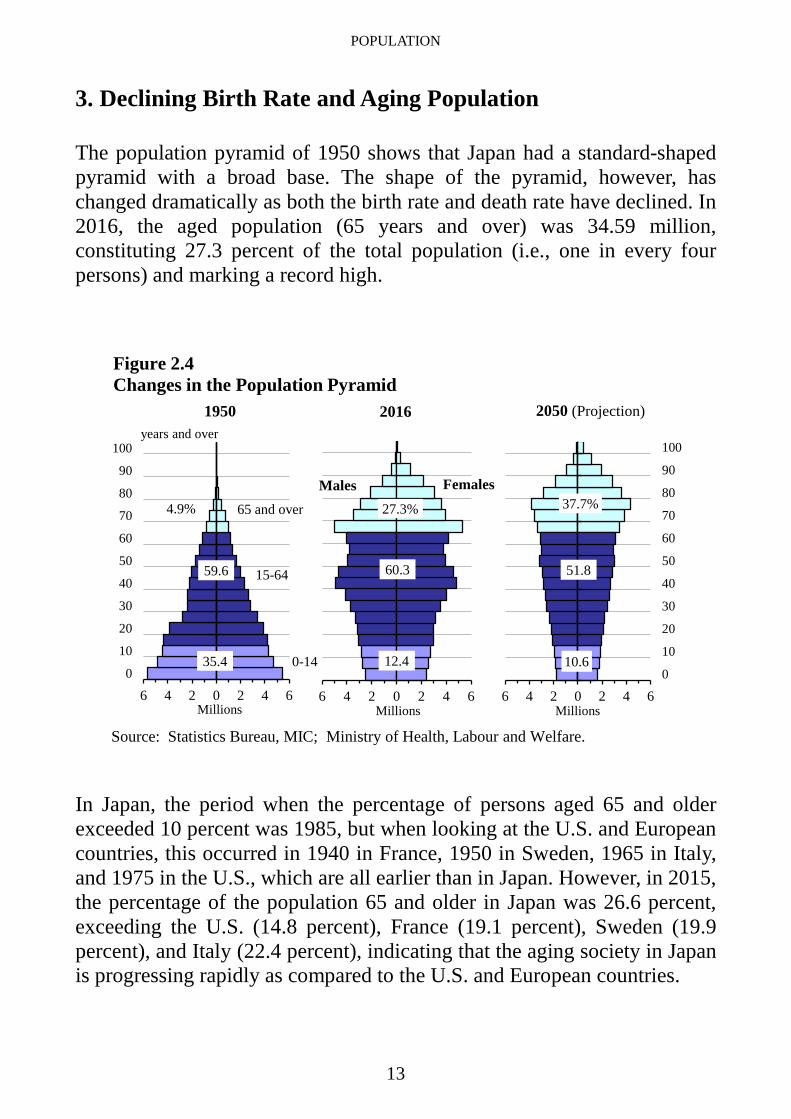
The population pyramid of 1950 shows that Japan had a standard-shaped pyramid with a broad base. The shape of the pyramid, however, has changed dramatically as both the birth rate and death rate have declined. In 2016, the aged population (65 years and over) was 34.59 million, constituting 27.3 percent of the total population (i.e., one in every four persons) and marking a record high.
In Japan, the period when the percentage of persons aged 65 and older exceeded 10 percent was 1985, but when looking at the U.S. and European countries, this occurred in 1940 in France, 1950 in Sweden, 1965 in Italy, and 1975 in the U.S., which are all earlier than in Japan. However, in 2015, the percentage of the population 65 and older in Japan was 26.6 percent, exceeding the U.S. (14.8 percent), France (19.1 percent), Sweden (19.9 percent), and Italy (22.4 percent), indicating that the aging society in Japan is progressing rapidly as compared to the U.S. and European countries.
6 4 2 0 2 4 60
10
20
30
40
50
60
70
80
90
100
6 4 2 0 2 4 6 6 4 2 0 2 4 60
10
20
30
40
50
60
70
80
90
100
Figure 2.4Changes in the Population Pyramid
0-14
Source: Statistics Bureau, MIC; Ministry of Health, Labour and Welfare.
years and over
Millions MillionsMillions
2050 (Projection)20161950
65 and over4.9%
35.4
27.3%
60.3
12.4
51.8
10.6
59.6 15-64
37.7%Males Females

POPULATION
14
0
5
10
15
20
25
30
35
40
1950 60 70 80 90 00 10 20 30 40 50
▲
ChinaKorea, Rep. of
Italy▼
▲
India
%
Source: Statistics Bureau, MIC; Ministry of Health, Labour and Welfare; United Nations.
▲
U.S.A.France
Japan▼
Sweden▼
Figure 2.5Proportion of Elderly Population by Country (Aged 65 years and over)
▼
Table 2.5Age Structure of Population by Country
(%)2015 2050 (projection)
Country 0-14 years 15-64 65 andover 0-14 years 15-64 65 and
overJapan ..................... 12.6 60.7 26.6 10.6 51.8 37.7Italy ....................... 13.7 63.9 22.4 13.0 51.9 35.1Korea, Rep. of ...... 14.0 72.9 13.1 11.4 53.4 35.1Germany ............... 12.9 65.9 21.2 12.4 55.2 32.3China .................... 17.2 73.2 9.6 13.5 58.9 27.6Canada .................. 16.0 67.9 16.1 14.9 58.7 26.4France ................... 18.5 62.4 19.1 16.8 56.9 26.3U.K. ...................... 17.8 64.5 17.8 16.6 58.7 24.7Sweden ................. 17.3 62.8 19.9 17.4 58.8 23.8Brazil .................... 23.0 69.1 7.8 15.0 62.2 22.8U.S.A. ................... 19.0 66.3 14.8 17.5 60.3 22.2Russia ................... 16.8 69.9 13.4 17.7 61.4 20.9India ..................... 28.8 65.6 5.6 19.1 67.1 13.7Source: Statistics Bureau, MIC; Ministry of Health, Labour and Welfare; United Nations.

POPULATION
15
On the other hand, in 2016, the child population (0-14 years) in Japan amounted to 15.78 million, accounting for 12.4 percent of the total population, which was the lowest level on record. In terms of their proportion of the total population, the aged (65 years and over) have surpassed the child population since 1997. The productive-age population (15-64 years) totaled 76.56 million. In share terms, it accounted for 60.3 percent of the entire population, continuing its decline since 1993. As a result, the ratio of the dependent population (the sum of aged and child population divided by the productive-age population) was 65.8 percent.
4. Births and Deaths
Population growth in Japan had primarily been driven by natural increase, while social increase played only a minor part. However, in 2005, the natural change rate (per 1,000 population) fell for the first time since 1899, and has since been on a declining trend. In 2016, the natural change rate was -2.6.
During the second baby boom, the live birth rate was at a level of 19 (per 1,000 population) between 1971 and 1973. Since the late 1970s, it has continued to fall. The rate for 2016 was 7.8.
Figure 2.6Natural Population Change
-5
0
5
10
15
20
25
30
1950 60 70 80 90 00 10 *16Source: Ministry of Health, Labour and Welfare.
Per 1,000 population
Live birth rate
Natural change rateDeath rate
*16

POPULATION
16
The decline in the live birth rate may partly be attributable to the rising maternal age at childbirth. The average mothers' age at first childbirth rose from 25.6 in 1970 to 30.7 in 2016. The total fertility rate was on a downward trend after dipping below 2.00 in 1975. It marked a record low of 1.26 in 2005 and started to increase after that. The total fertility rate reached 1.44 in 2016.
The death rate (per 1,000 population) was steady at 6.0 - 6.3 between 1975 and 1987, and maintained an uptrend since 1988, reflecting the aging of the population. It reached 10.5 in 2016.
Table 2.6Vital Statistics
Rates per 1,000 population 1)
YearMales Females
1950 28.1 10.9 60.1 17.2 3.65 a) 59.57 a) 62.971955 19.4 7.8 39.8 11.6 2.37 63.60 67.751960 17.2 7.6 30.7 9.6 2.00 65.32 70.191965 18.6 7.1 18.5 11.4 2.14 67.74 72.921970 18.8 6.9 13.1 11.8 2.13 69.31 74.661975 17.1 6.3 10.0 10.8 1.91 71.73 76.891980 13.6 6.2 7.5 7.3 1.75 73.35 78.761985 11.9 6.3 5.5 5.6 1.76 74.78 80.481990 10.0 6.7 4.6 3.3 1.54 75.92 81.901995 9.6 7.4 4.3 2.1 1.42 76.38 82.852000 9.5 7.7 3.2 1.8 1.36 77.72 84.602005 8.4 8.6 2.8 -0.2 1.26 78.56 85.522010 8.5 9.5 2.3 -1.0 1.39 79.55 86.302015 8.0 10.3 1.9 -2.3 1.45 80.79 87.05
2016* 7.8 10.5 2.0 -2.6 1.44 ... ...
1) The infant mortality rate is per 1,000 live births. 2) The average number of children thatwould be born alive to a hypothetical cohort of women if, throughout their reproductiveyears, the age-specific fertility rates for the specified year remained unchanged. a) 1950-1952 period.Source: Ministry of Health, Labour and Welfare.
Life expectancy at birth(years)
Totalfertilityrate 2)Live births Deaths Infant
mortalityNaturalchange

POPULATION
17
Average life expectancy in Japan climbed sharply after World War II, and is today at the highest level in the world. In 2015, the life expectancy at birth was 87.1 years for women and 80.8 years for men. Setting a new all-time record for both genders.
Figure 2.7Life Expectancy at Birth by Country
Years
Source: Ministry of Health, Labour and Welfare.
53.5
70.1
65.3
72.4
71.6
76.4
80.3
78.9
81.0
80.8
57.2
72.9
76.5
77.4
78.8
81.2
84.0
85.0
85.2
87.1
45 50 55 60 65 70 75 80 85 90
South Africa(2009)
Egypt (2015)
Russia (2014)
China (2010)
Brazil (2014)
U.S.A. (2013)
Sweden (2015)
France (2015)
Switzerland(2014)
Japan (2015)
0
Males
Females
Table 2.7Changes of Mothers' Age at Childbirth
Under 19 20-24 25-29 30-34 35-39 40 andover
1970 1,934 1.0 26.5 49.2 18.5 4.2 0.5 25.61980 1,577 0.9 18.8 51.4 24.7 3.7 0.4 26.41990 1,222 1.4 15.7 45.1 29.1 7.6 1.0 27.02000 1,191 1.7 13.6 39.5 33.3 10.6 1.2 28.02010 1,071 1.3 10.4 28.6 35.9 20.5 3.3 29.92015 1,006 1.2 8.4 26.1 36.3 22.7 5.3 30.7
2016* 977 1.1 8.4 25.7 36.3 22.9 5.6 30.7
Source: Ministry of Health, Labour and Welfare.
YearDistribution of mothers' age (%) 2)Number
of births(1,000) 1)
Mean agebearing first
child
1) Including mothers' ages that were not reported. 2) Percentage in relation to number ofbirths, excluding those for which mothers' ages were not reported.

POPULATION
18
5. Marriages and Divorces
The annual number of marriages in Japan exceeded one million couples in the early 1970s, which, coupled with the marriage rate (per 1,000 population) hovering over 10.0, showed an apparent marriage boom. However, both the number of couples and the marriage rate started declining thereafter. They rose again in the late 1980s, but in recent years, they have been on a declining trend in general. In 2011, 661,895 couples married, marking the first time this number fell below 700,000 couples. In 2016, 620,523 couples married, and the marriage rate was 5.0.
The mean age of first marriage was 31.1 for men and 29.4 for women in 2016. These were the same ages for both men and women as the previous year. The mean age of first marriage for men rose by 2.6 years, while that of women rose by 3.0 years over the past 20 years. (in 1996: grooms, 28.5; brides, 26.4). In addition, there has been an increasing trend in the percentage of lifetime non-marriages, reaching 23.4 percent for males and 14.1 percent for females in 2015, the highest percentages ever. The declining marriage rate, rising marrying age and increased choice of unmarried life in recent years as described above is one explanation for the dropping birth rate.
Table 2.8Mean Age of First Marriage
Year Groom Bride1950 25.9 23.01955 26.6 23.81960 27.2 24.41965 27.2 24.51970 26.9 24.21975 27.0 24.71980 27.8 25.21985 28.2 25.51990 28.4 25.91995 28.5 26.32000 28.8 27.02005 29.8 28.02010 30.5 28.82015 31.1 29.4
2016* 31.1 29.4Source: Ministry of Health, Labour and Welfare.

POPULATION
19
In contrast, divorces have shown an upward trend since the late 1960s, hitting a peak of 289,836 couples in 2002. Subsequently, both the number of divorces and the divorce rate have been declining since 2003. In 2016, the number of divorces totaled 216,805 couples, and the divorce rate (per 1,000 population) was 1.73.
6. Population Density and Regional Distribution
(1) Population Density
In 2015, Tokyo Metropolis had the largest population of 13.52 million among Japan's 47 prefectures, followed in decreasing order by the prefectures of Kanagawa, Osaka, Aichi, and Saitama. These five prefectures each had a population of seven million or more, and together accounted for 36.4 percent of the total population.
In addition, the population density in Tokyo Metropolis was the highest among Japan's prefectures, at 6,168.7 persons per square kilometer. This was almost 18.1 times the national average (340.8 persons per square kilometer).
0
2
4
6
8
10
12
1970 80 90 00 10
Source: Ministry of Health, Labour and Welfare.
Per 1,000 population
Marriage rate▼
Divorce rate▼
Figure 2.8Changes in Marriage Rate and Divorce Rate
*16

POPULATION
20
In 2015, there were 12 cities in Japan with a population of one million or more. Their total population topped 29 million, a figure equivalent to 23.2 percent of the national total. The largest single city was the 23 Cities of Tokyo Metropolis, with 9.27 million citizens. It was followed in decreasing order by Yokohama City (3.72 million), Osaka City (2.69 million), and Nagoya City (2.30 million).
Figure 2.9Population Density by Prefecture (2015)
Tokyo Metropolis
Source: Statistics Bureau, MIC.
(per square km)
Under 200200 - 299300 - 499500 - 9991,000 persons and over

POPULATION
21
(2) Population Distribution
The percentage of the urban population started increasing in the late 1950s. In 2010, 51.0 percent of the total population was concentrated in the three major metropolitan areas: the Kanto, Chukyo, and Kinki major metropolitan areas. Population density in the Kanto major metropolitan area was 2,631 persons per square kilometer. In the Chukyo major metropolitan area, it was 1,288 persons per square kilometer, and in the Kinki major metropolitan area, it was 1,484 persons per square kilometer.
Table 2.9Population of Major Cities
(Thousands)
2010 2015 2010 2015Tokyo, 23 Cities ........ 8,946 9,273 Kobe City ................... 1,544 1,537Yokohama City .......... 3,689 3,725 Kawasaki City ............ 1,426 1,475Osaka City ................. 2,665 2,691 Kyoto City .................. 1,474 1,475Nagoya City ............... 2,264 2,296 Saitama City .............. 1,222 1,264Sapporo City .............. 1,914 1,952 Hiroshima City ........... 1,174 1,194Fukuoka City ............. 1,464 1,539 Sendai City ................. 1,046 1,082Source: Statistics Bureau, MIC.
CitiesPopulation Population
Cities
Table 2.10Population of Three Major Metropolitan Areas 1) (2010)
Kanto major metropolitan area ....................... 36,923 28.8 14,034 2,631Chukyo major metropolitan area ..................... 9,107 7.1 7,072 1,288Kinki major metropolitan area ........................ 19,342 15.1 13,033 1,484Total of three major metropolitan areas .......... 65,373 51.0 34,138 1,915
Yokohama City, Kawasaki City, Sagamihara City, Saitama City, and Chiba City; Chukyo: Nagoya City; Kinki: Osaka City, Sakai City, Kyoto City, and Kobe City) and surrounding areas (cities, towns and villages).Source: Statistics Bureau, MIC.
1) Major metropolitan areas consist of central cities (Kanto: 23 Cities of Tokyo Metropolis,
Areas
Population (1,000)Percentageof the total
(%)
SurfaceArea(km2)
Populationdensity
(per km2)

“Statistical Handbook of Japan 2017” by Statistics Bureau, Japan
Chapter 3
Economy
In regions adjacent to the ocean, there is development of a variety of coastal and offshore fisheries, along with development of a marine product processing industry that targets these catches of fish. This is a photo of clam fishing. Clam fishing uses tidal flats and nearby shallow waters as the main fishing grounds, and clams are caught using fishing gear with a long handle from a boat at a water depth of two to three meters. When looking at the composition ratios of employees and GDP in 2015 by industry, the percentages accounted for by "agriculture, forestry and fisheries" is 4.0 percent for number of employees and 1.1 percent for GDP.
© MORI Shizuyo
ECONOMY
23
1. Economic Development
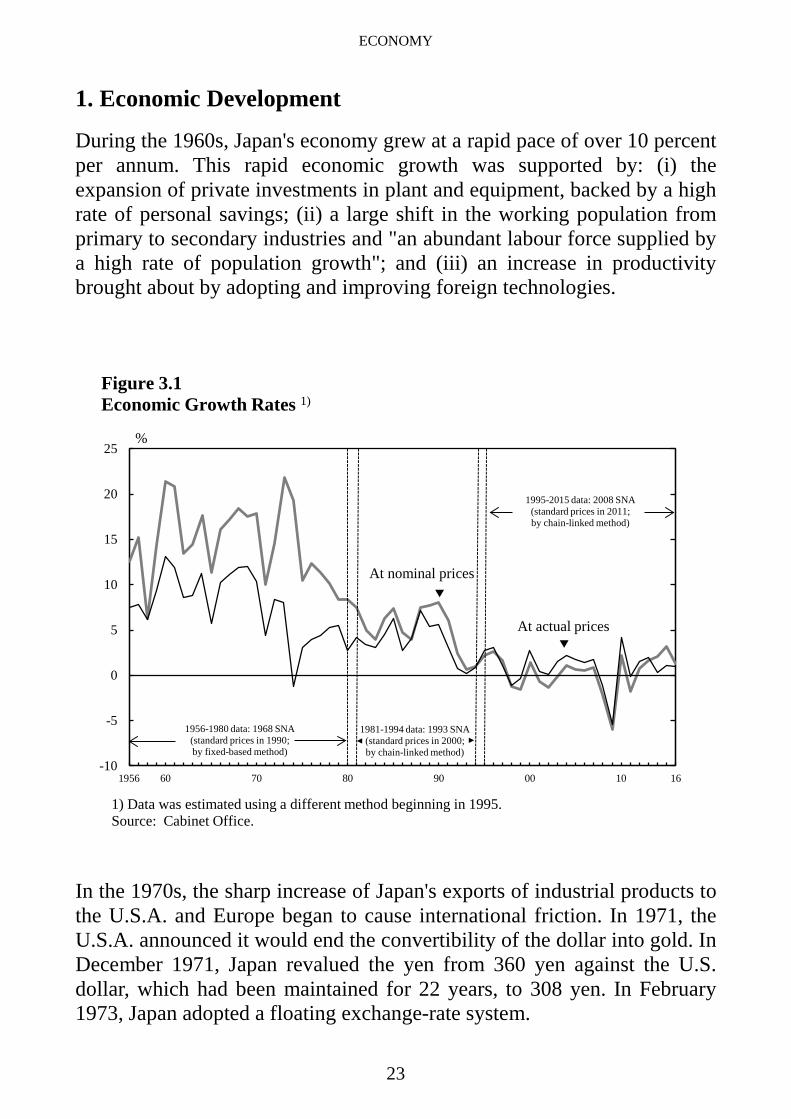
During the 1960s, Japan's economy grew at a rapid pace of over 10 percent per annum. This rapid economic growth was supported by: (i) the expansion of private investments in plant and equipment, backed by a high rate of personal savings; (ii) a large shift in the working population from primary to secondary industries and "an abundant labour force supplied by a high rate of population growth"; and (iii) an increase in productivity brought about by adopting and improving foreign technologies.
In the 1970s, the sharp increase of Japan's exports of industrial products to the U.S.A. and Europe began to cause international friction. In 1971, the U.S.A. announced it would end the convertibility of the dollar into gold. In December 1971, Japan revalued the yen from 360 yen against the U.S. dollar, which had been maintained for 22 years, to 308 yen. In February 1973, Japan adopted a floating exchange-rate system.
1) Data was estimated using a different method beginning in 1995.Source: Cabinet Office.
Figure 3.1Economic Growth Rates 1)
-10
-5
0
5
10
15
20
25
1956 60 70 80 90 00 10 16
At actual prices▼
%
At nominal prices▼
1956-1980 data: 1968 SNA(standard prices in 1990;by fixed-based method)
1995-2015 data: 2008 SNA(standard prices in 2011;by chain-linked method)
1981-1994 data: 1993 SNA(standard prices in 2000;by chain-linked method)

ECONOMY
24
In October 1973, the fourth Middle East War led to the first oil crisis, triggering high inflation. Accordingly, Japan recorded negative economic growth in 1974 for the first time in the post-war period. Following the second oil crisis in 1978, efforts were made to change Japan's industrial structure from "energy-dependent" to "energy-saving", enabling Japan to successfully overcome inflation.
In the 1980s, the trade imbalance with advanced industrial countries expanded because of the yen's appreciation. As part of administrative and financial reforms, Japan National Railways and Nippon Telegraph and Telephone Public Corporation were privatized. As a result, domestic demand-led economic growth was achieved.
2. Bubble Economy and Its Collapse
At the end of the 1980s, Japan's economy enjoyed favorable conditions, with stable wholesale prices and a low unemployment rate. Corporate profits were at their highest level in history, and corporate failures were at their lowest level, while investments in plant and equipment for manufacturing products, such as semiconductors, were very active. Stock and land prices continued to rise rapidly, and large-scale urban developments and resort facility developments in rural areas progressed at a very fast pace. However, excessive funds flowed into the stock and real estate markets, causing abnormal increases in capital asset values (forming an economic bubble).
At the end of 1980, Japan's net worth (national wealth) stood at 1,363 trillion yen, 5.6 times the GDP. It then increased, reaching 3,531 trillion yen, 8.0 times the GDP, at the end of 1990, owing to increasing land and stock prices. After that, Japan's national wealth began to decrease due to the collapse of the bubble economy. At the end of 2015, it was 3,290 trillion yen.
At the beginning of 1990, stock prices plummeted, followed by sharp declines in land prices. This marked the start of major economic recession (collapse of the bubble economy). Japan's financial and economic systems, which were excessively dependent on land, consequently approached collapse.

ECONOMY
25
Massive bad debts were created in financial institutions' loan portfolios, as corporate borrowers suffered serious losses due to declining land prices. As a result, shareholders' equity in financial institutions shrank. In 1997, large banks began to fail. In 1998 and 1999, the government injected public money into the banking sector to stabilize the financial system.
The Japanese economy began to make a moderate recovery in February 1999. This, however, was only a temporary phenomenon, as investments in plant and equipment were weak and the economy was too dependent on foreign demand and information and communication technologies. With the global decline in IT demand from mid-2000, Japan's exports to Asia dropped, necessitating adjustments of excess inventory and production facilities. In line with this, the Japanese economy again entered into an economic downturn in 2001.
Fixed assets and inventories
0
500
1,000
1,500
2,000
2,500
3,000
3,500
4,000
4,500
1980 82 84 86 88 90 92 94 96 98 00 02 04 06 08 10 12 1415
Figure 3.2National Wealth 1)
Trillion yen
1) Data was estimated using a different method beginning in 1994.Source: Cabinet Office.
Non-produced assets
Net external assets

ECONOMY
26
Through the economic recovery starting at the beginning of 2002, the corporate sector, centering on export-related industries, became favorable based on a reflection of the steady recovery of the global economy, and shifted mainly with a bullish tone up until mid-2007.
3. Recent Economic Trends
At the start of 2008, the Japanese economy was faced with a standstill in its path to recovery as private consumption and investments in plant and equipment fell flat and so did production. This occurred against the backdrop of soaring crude petroleum and raw material prices and repercussions from the American subprime mortgage loan problem that, since mid-2007, rapidly clouded future prospects for the world economy further. In addition, the bankruptcy of the major American securities firm Lehman Brothers in September 2008 led to a serious financial crisis in Europe and the U.S.A. Japan was also affected by the yen's rise and the sudden economic contraction in the U.S.A. and other countries. Declining exports contributed to a large drop in production and a sharp rise in unemployment.
Source: OECD.
Figure 3.3Gross Domestic Product (Nominal prices, converted into U.S. dollars)
0
4
8
12
16
20
1990 00 10
France
Germany
U.K.
U.S.A.
Japan
0
10
20
30
40
50
60
1990 00 10
Thousand U.S. dollars
Per capita
Trillion U.S. dollars
Total
1616

ECONOMY
27
Subsequently, the Japanese economy recovered with foreign demand and economic measures after April 2009, and came to a standstill starting around October 2010. In early 2011, however, it began to rally. The Great East Japan Earthquake that took place on March 11, 2011 and the nuclear power plant accident it caused weakened the economic recovery.
In order to achieve an early end to deflation and break free of economic stagnation, in January 2013, the government set forth its "three-arrows" strategy (also known as "Abenomics").
The first "arrow" is "aggressive monetary policy". The Bank of Japan (BOJ) made it clear that it would set a consumer price index annual growth rate of two percent as a "price stabilization target". The BOJ also introduced "quantitative and qualitative monetary easing" to double the monetary base over two years.
Table 3.1Gross Domestic Product 1) (Expenditure approach)
(Billion yen)
Item 2013 2014 2015 2016Gross domestic product (GDP) .......................... 508,781.4 510,489.2 515,973.4 521,206.9
Domestic demand ............................................... 517,680.9 519,525.0 523,120.9 525,159.2Private demand ................................................ 389,141.2 390,134.9 392,680.6 394,091.1
Private final consumption expenditure ......... 298,980.7 296,435.1 295,235.3 296,297.6Private Residential Investment ..................... 15,877.2 15,202.2 14,959.3 15,794.0Private plant and equipment ......................... 74,892.8 78,762.9 79,645.3 80,696.5Changes in inventories of private sectors ..... -632.8 -308.6 2,792.9 1,186.7
Public demand ................................................. 128,539.7 129,390.3 130,440.8 131,069.1Government final consumption expenditure ... 102,382.2 102,930.0 104,639.2 106,036.0Gross capital formation by public sectors .... 26,181.3 26,374.2 25,816.9 25,040.6Changes in inventories of public sectors ...... -23.1 72.3 -1.4 51.3
Net exports of goods and services ...................... -8,910.3 -8,892.0 -7,194.4 -4,142.3Exports of goods and services ...................... 73,835.6 80,695.2 83,071.2 84,054.4(less) Imports of goods and services ............. 82,745.9 89,587.3 90,265.6 88,196.7
(Reference)Trading gains/losses ........................................... -1,695.2 -2,304.2 5,161.0 9,471.3Gross domestic income ...................................... 507,086.2 508,185.0 521,134.4 530,678.2Net income from the rest of the world ................ 17,014.3 18,287.6 19,994.8 17,190.6
Incomes from the rest of the world .................. 23,808.7 26,973.8 29,731.3 27,477.1(less) Incomes to the rest of the world ............. 6,794.5 8,686.1 9,736.5 10,286.5
Gross national income (GNI) ............................. 524,100.5 526,472.6 541,129.2 547,868.81) Standard prices in 2011; by chain-linked methodSource: Cabinet Office.

ECONOMY
28
The second "arrow" is "flexible fiscal policy". An emergency economic stimulus package with a scale of approximately 10 trillion yen was developed.
The third "arrow" is "growth strategy that promotes private investment". Efforts are being made in growth strategies such as encouraging investments by private corporations based on the easing of regulations.
Under such approaches, the profits of companies shifted at high levels, and the employment and income environment improved and continued a moderate recovery. The latest economic recovery is thought to be in the process of continuation after bottoming out in November 2012. As the Japanese economy moves out of a deflation through approaches based on financial, monetary and growth policies, fiscal consolidation has been progressing and primary deficit has been shrinking, such as by centering on increased tax revenue, etc.
-3
-2
-1
0
1
2
3
Ⅰ Ⅱ Ⅲ Ⅳ Ⅰ Ⅱ Ⅲ Ⅳ Ⅰ Ⅱ Ⅲ Ⅳ Ⅰ Ⅱ Ⅲ Ⅳ Ⅰ Ⅱ Ⅲ Ⅳ Ⅰ
1) Quarterly estimates of GDP, 2008 SNA (standard prices in 2011; by chain-linked method; seasonally adjusted).Source: Cabinet Office.
Figure 3.4Economic Growth Rates 1) (Quarterly changes)
%
2012 13 14 15 16 17

ECONOMY
29
4. Industrial Structure
Japan's industrial structure has undergone a major transformation over the half century since the end of World War II. The chronological changes in the industrial structure during this period by industry share of employed persons and GDP show that shares in the primary industry in particular have fallen dramatically since 1970, when Japan experienced rapid economic growth. During the 1980s, the secondary industry's share of employed persons and GDP also began to decline gradually. On the other hand, the tertiary industry's shares of both employed persons and GDP have risen consistently.
Table 3.2Changes in Industrial Structure
(%)
Year Primary Secondary Tertiary Primary Secondary Tertiaryindustry industry industry industry industry industry
1950 48.6 21.8 29.7 - - -1955 41.2 23.4 35.5 19.2 33.7 47.01960 32.7 29.1 38.2 12.8 40.8 46.41965 24.7 31.5 43.7 9.5 40.1 50.31970 19.3 34.1 46.6 5.9 43.1 50.91975 13.9 34.2 52.0 5.3 38.8 55.91980 10.9 33.6 55.4 # 3.5 # 36.2 # 60.31985 9.3 33.2 57.5 3.0 34.9 62.01990 7.2 33.5 59.4 2.4 35.4 62.21995 # 6.0 # 31.3 # 62.7 # 1.8 # 30.4 # 67.82000 5.2 29.5 65.3 1.6 28.4 70.02005 4.9 26.4 68.6 1.2 25.8 73.02010 4.2 25.2 70.6 1.2 25.2 73.62015 4.0 25.0 71.0 1.1 26.2 72.7
Gross domestic product (GDP) 2)Employed persons 1)
1) Due to the revision of the Japan Standard Industrial Classification, the figures from 1995 onward are not strictly consistent with those for 1990 or earlier. 2) Data from 1955 to 1979 are based on the 1968 SNA. Data from 1980 onward are based on the 1993 SNA. Data in 1994 and afterwards differs in the estimation method.Source: Statistics Bureau, MIC; Cabinet Office.

ECONOMY
30
In 1970, the primary industry accounted for 19.3 percent of employed persons, the secondary industry for 34.1 percent, and the tertiary industry for 46.6 percent. In 2015, the corresponding shares of these three sectors were 4.0 percent, 25.0 percent and 71.0 percent, respectively.
As for GDP by type of economic activity, in 1970, the primary, secondary and tertiary industries accounted for 5.9 percent, 43.1 percent and 50.9 percent, respectively. In 2015, these figures for the primary, secondary and tertiary industries were 1.1 percent, 26.2 percent and 72.7 percent, respectively.
According to the "2016 Economic Census for Business Activity", there were 5.4 million establishments (excluding businesses whose operational details are unknown, national government services, and local government services) in Japan, at which a total of 57.4 million persons were employed. The average number of persons engaged per establishment was 10.7
Table 3.3Gross Domestic Product by Type of Economic Activity (2015)
(%)1995 2000 2005 2010 2015
Primary industryAgriculture, forestry and fishing ......................... 1.7 1.5 1.1 1.1 1.1
Secondary industryMining ................................................................. 0.2 0.1 0.1 0.1 0.1Manufacturing ..................................................... 23.5 22.6 21.6 20.8 20.4Construction ........................................................ 7.8 6.9 5.6 4.8 5.5
Tertiary industryElectricity, gas and water supply, waste management service ............................... 3.0 3.2 2.9 2.8 2.7Wholesale and retail trade ................................... 13.8 13.1 14.4 13.8 13.9Transport and postal activities ............................ 5.5 4.9 5.1 5.0 5.1Accommodation and food service activities ....... 3.1 3.1 2.7 2.6 2.5Information and communications ....................... 3.2 4.6 4.9 5.1 5.0Finance and insurance ......................................... 5.0 4.9 6.0 4.8 4.4Real estate .......................................................... 9.9 10.3 10.4 11.9 11.4Professional, scientific and technical activities ... 4.8 5.8 6.4 7.0 7.3Public administration .......................................... 4.8 5.2 5.1 5.3 5.0Education ............................................................ 3.6 3.6 3.6 3.6 3.6Human health and social work activities ............ 4.4 5.3 5.5 6.4 6.8Other service activities ........................................ 5.2 5.2 4.9 4.7 4.4
Source: Cabinet Office.

ECONOMY
31
establishments with less than 10 persons accounted for 77.2 percent of the total.
The number of establishments by the major groupings of the Japan Standard Industrial Classification was the most numerous in the "wholesale and retail trade" category, numbering 1.4 million, followed by "accommodations, eating and drinking services" and "construction". In terms of the number of persons engaged, establishments in the "wholesale and retail trade" ranked first as they employed 12.0 million persons, followed by "manufacturing" and "medical, health care and welfare".
Figure 3.5Shares of Establishments and Persons Engaged by Scale of Operation 1)
(2016)
11.4
57.2
12.2
19.9
15.4
12.3
32.4
9.4
28.7
0% 100%
Persons engaged
Establishments
1-4 persons▼
5-9▼
10-19▼
20-99
2)
100 persons and over 1.2
1) Preliminary tabulation. Excluding businesses whose operational details are unknown, national government services, and local government services. 2) Excluding establishments consisting of only loaned or dispatched employees.Source: Statistics Bureau, MIC.
0 100 %
▼
20 40 60 80

ECONOMY
32
The domestic manufacturing industry has progressed in relocating production bases overseas, stemming from approaches to cutting back on production costs, production in consumption areas, and fluctuations in exchange rates.
Table 3.4Number of Establishments and Persons Engaged 1) (2016)
Establishments Personsengaged
Total ............................................................................................ 5,359,975 57,439,652By industry
Primary industryAgriculture, forestry and fisheries ....................................... 32,675 366,949
Secondary industryMining and quarrying of stone and gravel ........................... 1,957 21,269Construction ........................................................................ 495,608 3,728,873Manufacturing ..................................................................... 453,810 8,925,749
Tertiary industryElectricity, gas, heat supply and water ................................. 4,874 194,036Information and communications ........................................ 64,527 1,663,836Transport and postal activities ............................................. 131,213 3,235,442Wholesale and retail trade ................................................... 1,357,030 12,012,080Finance and insurance ......................................................... 84,330 1,530,071Real estate and goods rental and leasing ............................. 355,102 1,479,307Scientific research, professional and technical services ...... 221,414 1,815,209Accommodations, eating and drinking services .................. 701,241 5,460,685Living-related and personal services and amusement services ... 470,744 2,419,128Education, learning support ................................................. 166,415 1,824,961Medical, health care and welfare ......................................... 430,265 7,419,831Compound services ............................................................. 33,872 480,172Services, n.e.c. ..................................................................... 354,898 4,862,054
By type of legal organizationsIndividual proprietorships ................................................... 2,011,800 5,740,540Corporations ........................................................................ 3,319,000 51,574,686 Companies ........................................................................ 2,895,256 43,212,387Organizations other than corporations ................................. 29,175 124,426
1) Preliminary tabulation. Excluding businesses whose operational details are unknown,national government services, and local government services.Source: Statistics Bureau, MIC.
Item

ECONOMY
33
According to the Ministry of Economy, Trade and Industry's "Survey of Overseas Business Activities", which surveys Japanese companies that have local affiliates overseas, the number of overseas affiliates in the manufacturing industry was 11,080 companies at the end of fiscal 2015, and the overseas production ratio was 25.3 percent in actual performance in fiscal 2015, indicating a 1.0 percentage point increase as compared to the previous fiscal year, reaching the highest level ever.
In the future, it is anticipated that companies in the manufacturing industry in Japan will expand their overseas business. There are many companies that are planning on expanding their business to India, China, Indonesia and Vietnam.
Table 3.5Trends of Overseas Affiliated Company (Manufacturing Industries)
(Million yen) (%) (Million yen) (%)2006 8,287 99,679,316 18.1 3,948,396 20.02007 8,318 111,040,510 19.1 4,231,847 19.52008 8,147 91,180,733 17.0 3,608,939 18.42009 8,399 78,305,761 17.0 2,058,685 15.92010 8,412 89,327,934 18.1 2,325,418 17.12011 8,684 88,289,996 18.0 3,082,273 21.52012 10,425 98,384,657 20.3 3,815,707 25.82013 10,545 116,997,649 22.9 4,646,055 29.42014 10,592 129,712,997 24.3 4,649,364 28.12015 11,080 134,996,164 25.3 4,571,639 25.5
Source: Ministry of Economy, Trade and Industry.
Ratio of overseascapital
investment 2)
1) Overseas production ratio = Sales of overseas affiliates/(Sales of overseas affiliates +Sales of domestic companies) × 100. 2) Ratio of overseas capital investment = Amount ofcapital investment in overseas affiliates/(Amount of capital investment in overseas affiliates+ Amount of capital investment in domestic companies) × 100.
Value ofcapital
investment
Number ofoverseasaffiliates
Fiscalyear
Value of SalesOverseas
productionratio 1)

“Statistical Handbook of Japan 2017” by Statistics Bureau, Japan
Chapter 4
Finance
Kitano Meister Garden is a facility that was renovated as an experience-based sightseeing spot, using the old Kitano Elementary School that closed down due to a decline in the number of children and damages from the Great Hanshin-Awaji Earthquake in 1995. There are stores that sell sundries and gifts, such as Kobe confectioneries and accessories, as well as studios where one can experience making crafts by hand and cafes. Kitano Meister Garden has been exemplified as a "best practice" in Japan, as a facility that contributes to the restoration of local industries based on cooperation by the city, residents, and companies. The settlement amount of commerce and industry expenses, which are expenditures for promotion, etc. of commerce and industry in local regions, of local governments was 5.5 trillion yen in fiscal 2015.
© Kitano Meister Garden

FINANCE
35
1. National and Local Government Finance
(1) National Government Finance
Japan's fiscal year starts in April, and ends in March of the following year. In setting the national budget, the government submits a proposed budget for the upcoming fiscal year to the Ordinary Session of the Diet, which begins in January. The proposal is then discussed, and an initial budget is approved usually before the fiscal year begins in April. In the event that the Diet does not approve the budget by the end of March, an interim budget comes into effect. The interim budget is effective from the beginning of April until such time when the proposed budget is approved. If it becomes necessary to amend the budget in the course of a fiscal year, the government submits a supplementary budget for Diet approval.
Japan's national budget consists of the general account, special accounts, and the budget for government-affiliated agencies. Using revenues from general sources such as taxes, the general account covers core national expenditures such as social security, public works, culture/education/ science, and national defense.
Special accounts are accounts established for the national government to carry out projects with specific objectives, and are managed and administered independently of the general account. The number and particulars of special accounts change from year to year; for fiscal 2017, a total of 13 special accounts have been established, including the national debt consolidation fund, the grants of allocation tax and transferred tax and the Great East Japan Earthquake recovery fund.
Government-affiliated agencies are entities established by special laws and are entirely funded by the government. Currently, the Japan Finance Corporation, the Okinawa Development Finance Corporation, Japan Bank of International Cooperation, and the Japan International Cooperation Agency (Loan Aid Section) are operated as government-affiliated agencies.

FINANCE
36
In national government finance, expenditure has continued to surpass revenue. Since fiscal 2008 in particular, the worsening economy has decreased tax revenue, contributing to an increasing gap between revenue and expenditure. Since fiscal 2009, bond issues have exceeded tax revenue in most years, but since fiscal 2013, tax revenue exceeded borrowing (on an initial budget basis).
The size of the general account budget for fiscal 2017 was 97 trillion yen, an increase of 0.7 trillion yen (0.8 percent) from the initial budget of fiscal 2016. This is equivalent to 17.6 percent of the fiscal 2017 GDP, forecasted by the government at 554 trillion yen.
Source: Ministry of Finance.
1) Based on settlements until FY2015, initial and supplementary budgets for FY2016, and draftbudget for FY2017. 2) Excludes some special accounts.
0
20
40
60
80
100
120
FY1990 95 00 05 10 15
Figure 4.1Revenues and Expenditures in the General Account 1)
Trillion yen
Expenditures
Tax Revenues
Government bond issues 2)
17

FINANCE
37
In fiscal 2017, major expenditures from the initial general account budget include social security (33.3 percent), national debt service (24.1 percent), local allocation tax grants, etc. (16.0 percent), public works (6.1 percent), education and science (5.5 percent), and national defense (5.3 percent).
With regard to revenue sources for the fiscal 2017 initial general account budget, income tax, consumption tax and corporation tax account for 48.7 percent. Even with the addition of other taxes and stamp revenues, these revenue sources only amount to 59.2 percent of the total revenue.
Table 4.1Expenditures of General Account
(Billion yen)
(A)+(B)+(C) (A)
1995 75,939 50,816 14,543 6,667 1,707 4,720 12,7952000 89,321 52,046 17,636 6,872 1,418 4,907 11,9102005 85,520 49,343 20,603 5,701 1,065 4,878 8,3912010 95,312 56,978 28,249 6,051 709 4,670 5,8032014 98,813 59,532 30,171 5,866 444 5,063 7,3212015 98,230 58,966 31,398 5,574 387 5,130 6,378
2016 1) 100,222 62,548 32,466 5,842 342 5,236 7,548 2017 2) 97,455 58,359 32,473 5,357 295 5,125 5,976
(B) (C)
1995 1,034 623 708 269 7,751 12,820 12,3022000 1,012 933 677 247 6,434 21,446 15,8292005 784 237 493 657 6,536 18,736 17,4412010 746 830 845 1,122 7,953 19,544 18,7902014 655 417 1,303 1,074 7,218 22,186 17,0962015 661 340 968 1,276 6,854 22,464 16,801
2016 1) 750 466 971 1,283 7,645 22,335 15,339 2017 2) 511 181 963 1,017 6,460 23,528 15,567
1) Revised budget. 2) Initial budget. Source: Ministry of Finance.
Generalexpendi-
turesTotalFiscal
yearSocial
security
Localallocationtax grants,
etc.
Fiscalyear
Educationand
sciencePensions National
defensePublicworks
Economiccooperation
Small- andmedium-sized
businesspromotion
Energymeasures
Foodstablesupply
Others
Nationaldebt
service

FINANCE
38
(2) Local Government Finance
There are two budget categories in local government finance: the ordinary accounts and the public business accounts. The former covers all kinds of expenses related to ordinary activities of the prefectural and municipal governments. The latter covers the budgets of independently accounted enterprises such as public enterprises (water supply and sewerage utilities,
Source: Ministry of Finance.
Figure 4.2Composition of Revenue and Expenditure of General Account Budget (Initial budget, FY2017)
Income tax18.4
Consump-tion tax
17.6
Other taxes and stamp revenues
10.5
Tax andstamp
revenues59.2%Corpora-
tion tax12.7
Others5.5
Government bond issues
35.3
Construction bonds
6.3
Specialdeficit-
financingbonds29.0 Revenue
97 trillion yen
Social security
33.3
Local allocation tax
grants, etc.16.0
Public works6.1
Education and science
5.5
National defense
5.3
Others9.7
Primary expenses
75.9%
Expenditure97 trillion
yen
National debt
service24.1

FINANCE
39
hospitals, etc.), the national health insurance accounts and the latter-stage elderly medical care accounts.
While expenditures such as national defense are administered solely by the national government, a large portion of expenditures that directly relate to the people's everyday lives are disbursed chiefly through local governments. In particular, a high proportion of the following expenditures are disbursed through local governments: public hygiene and sanitation expenses, which include areas such as medical service and waste disposal; school education expenses; expenses covering judicial, police and fire services; and public welfare expenses, which cover the development and management of welfare facilities for children, the elderly and the mentally and/or physically challenged.
The revenue composition of local governments usually remains almost the same each fiscal year, while their budget scale and structure vary from year to year. The largest portion of fiscal 2015 (net) revenues came from local taxes, accounting for 38.4 percent of the total. The second-largest source, 17.1 percent, was local allocation tax grants.
Table 4.2Local Government Finance 1) (Ordinary accounts)
(Million yen)Item FY2011 FY2012 FY2013 FY2014 FY2015
Revenues ....................................... 100,069,646 99,842,882 101,099,835 102,083,476 101,917,496 Local taxes .................................. 34,171,416 34,460,760 35,374,285 36,785,451 39,098,563 Local transfer taxes ..................... 2,169,911 2,271,480 2,558,842 2,936,867 2,679,246 Special local grants, etc. ............. 364,020 127,467 125,522 119,188 118,868 Local allocation tax .................... 18,752,268 18,289,826 17,595,454 17,431,428 17,390,640 Treasury disbursements .............. 15,927,963 15,425,766 16,412,481 15,461,868 15,221,213 Local government bonds ............ 11,760,270 12,337,932 12,284,850 11,518,456 10,688,010
Expenditures ................................ 97,002,646 96,418,554 97,412,028 98,522,799 98,405,225 General administration ............... 9,345,975 9,961,845 10,000,563 9,869,954 9,608,827 Public welfare ............................. 23,182,534 23,152,326 23,463,324 24,450,891 25,254,815 Sanitation .................................... 6,743,245 5,993,241 5,988,543 6,143,397 6,301,793 Agriculture, forestry and fishery 3,207,580 3,181,270 3,500,949 3,348,633 3,218,216 Commerce and industry .............. 6,547,758 6,206,903 5,915,650 5,509,540 5,516,105 Civil engineering work ............... 11,284,876 11,242,282 12,125,221 12,050,506 11,707,165 Education .................................... 16,176,813 16,147,943 16,087,778 16,658,138 16,795,536
Source: Ministry of Internal Affairs and Communications.
1) Settled figures of the net total of prefectural and municipal government accounts after deductingduplications. The breakdown consists of major items only.

FINANCE
40
(3) National and Local Government Finance
Finance refers to revenue and expenditure of administrative services from national and local governments. In the initial budget for fiscal 2016, the gross total of national government expenditure was 503 trillion yen, the net total was 246 trillion yen after eliminating duplications. Furthermore, the local public finance plan, which consists of the estimated sum of ordinary accounts for the following fiscal year for all local governments, amounted to 88 trillion yen. Therefore, after eliminating duplications between national and local accounts (38 trillion yen), the net total of both national and local government expenditures combined was 296 trillion yen.
The settlement amount for fiscal 2015, the net total of national and local government expenditures was 168 trillion yen. The national government disbursed 42 percent of this amount, while the local governments disbursed 58 percent.
Table 4.3Expenditures of National and Local Governments (Initial budget)
(Billion yen)Expenditures
FY1995 FY2000 FY2005 FY2010 FY2015 FY2016
General account ............. 70,987 84,987 82,183 92,299 96,342 96,722Special accounts ............ 241,718 318,689 411,944 367,074 403,553 403,852Government-affiliated agencies ....................... 8,086 7,661 4,678 3,135 2,216 2,077Gross total (national) .... 320,792 411,337 498,805 462,508 502,111 502,650
Duplications ................ 160,054 200,435 257,490 244,744 262,184 256,212Net total (national) ........ 160,738 210,902 241,316 217,764 239,927 246,438Local public finance plan ................. 82,509 88,930 83,769 82,127 87,768 87,670Gross total
(national + local) ........ 243,247 299,832 325,084 299,891 327,694 334,108Duplications ................ 32,035 37,216 32,689 31,563 35,484 37,937
Net total (national + local) ........ 211,213 262,616 292,395 268,328 292,211 296,171
Source: Ministry of Finance.
Item

FINANCE
41
A function-by-function breakdown of expenditures "directly related to people's lives" showed that social security expenditure accounted for the largest portion (33.7 percent), followed by public bonds (21.3 percent), general administration (11.8 percent), education (11.7 percent), and then land preservation and development (9.9 percent). Public bonds are issued to compensate for shortages of national and local revenues. Their issue volumes have increased mainly due to, for example, economic stimulus measures and decreasing tax revenues after the bubble economy ended at the beginning of 1990. A rising amount of public bond redemptions and an increase in social security expenditures associated with the progression of an aging society in recent years has resulted in public bonds and social security expenditures making up a high percentage of government expenditures net of overlaps. Issuance of government bonds increased after fiscal 2009 in comparison to years leading up to then, due to the effects of the bankruptcy of Lehman Brothers, but has decreased in recent years.
0
5
10
15
20
25
30
35
40
FY1995 97 99 01 03 05 07 09 11 13 15
Public bonds
Education
General administration
Figure 4.3Ratio of Net Total National and Local Expenditures by Function
Source: Ministry of Internal Affairs and Communications.
Social security
%
Commerce and industry
Land preservationand development

FINANCE
42
28.7 26.823.5 21.1 19.3
26.2
36.9 34.7 34.4 36.0 33.8 31.928.4 30.1 28.3
6.7 8.7
7.86.4
6.0
7.0
15.0
7.6 8.411.4
7.06.6
6.58.9
6.1
0
10
20
30
40
50
60
0
10
20
30
40
50
60
FY2003 04 05 06 07 08 09 10 11 12 13 14 15 16 17
Trillion yen %Bond dependency ratio
(right scale)
Figure 4.4National Government Bond Issue 1)
1) Based on settlements until FY2015, initial and supplementary budgets for FY2016, and draft budget for FY2017. 2) Excludes some special accounts. Source: Ministry of Finance.
Construction bonds(left scale)
Special deficit-financingbonds (left scale) 2)

FINANCE
43
Japan's ratio of outstanding general government debt to GDP, a stock measure in a fiscal context, has been increasing rapidly as compared to major industrial countries due to a steady advance of fiscal consolidation in the second half of 1990s, and is now the worst among major industrial countries.
(4) Tax
Taxes consist of national tax (income tax, corporation tax, etc.), which is paid to the national government, and local tax, which is paid to the local government of the place of residence. The ratio of taxation burden, which is the ratio of national and local taxes to national income, was 18.3 percent in fiscal 1975. This ratio gradually increased thereafter, reaching 27.7 percent in fiscal 1989. The ratio subsequently decreased due to the decline in tax revenue arising from the recession that ensued after the bubble
Figure 4.5Ratio of General Government Gross Debt to GDP
Source: Ministry of Finance.
0
50
100
150
200
250
300
2007 08 09 10 11 12 13 14 15 16 17
U.K.
Italy
%
Japan
Germany
France U.S.A.Canada

FINANCE
44
economy ended, reaching 20.6 percent in fiscal 2003. In fiscal 2017, it was 25.1 percent in terms of national and local taxes combined (15.2 percent for national tax and 9.9 percent for local tax). Japan's ratio is lower in comparison with other major industrial countries. However, the consumption tax rate was raised from five to eight percent on April 1, 2014. This was the first increase in 17 years. Hereafter, there is a possibility that the taxation burden will become heavier due to an increase in welfare and pension-related spending as the population ages.
15
20
25
30
35
40
45
1993 94 95 96 97 98 99 00 01 02 03 04 05 06 07 08 09 10 11 12 13 14
%
U.K.
Germany
Japan
U.S.A.
Figure 4.6Ratio of Taxation Burden to National Income by Country (Actual basis)
Source: Ministry of Finance.
0
France
2. Bank of Japan and Money Stock
As the central bank, the Bank of Japan (i) issues Bank of Japan notes, or the currency of Japan; (ii) manages and stores treasury funds and provides loans to the government; (iii) provides deposit and loan services to general
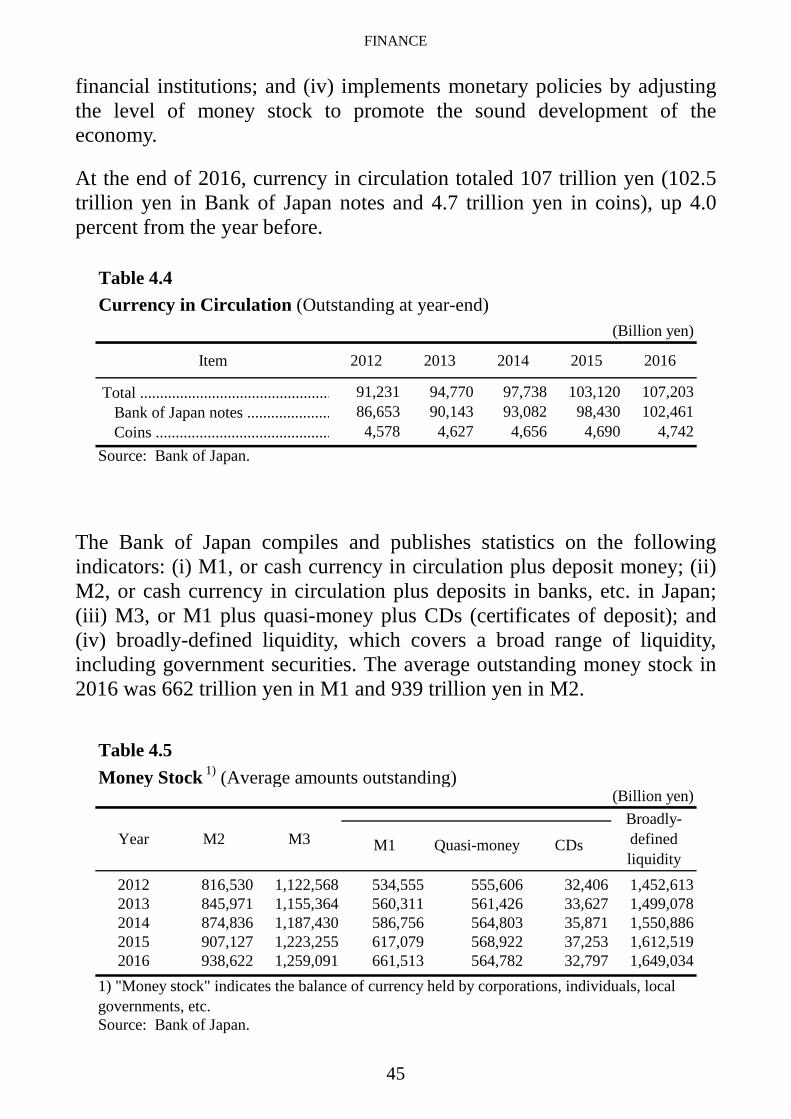
FINANCE
45
financial institutions; and (iv) implements monetary policies by adjusting the level of money stock to promote the sound development of the economy.
At the end of 2016, currency in circulation totaled 107 trillion yen (102.5 trillion yen in Bank of Japan notes and 4.7 trillion yen in coins), up 4.0 percent from the year before.
The Bank of Japan compiles and publishes statistics on the following indicators: (i) M1, or cash currency in circulation plus deposit money; (ii) M2, or cash currency in circulation plus deposits in banks, etc. in Japan; (iii) M3, or M1 plus quasi-money plus CDs (certificates of deposit); and (iv) broadly-defined liquidity, which covers a broad range of liquidity, including government securities. The average outstanding money stock in 2016 was 662 trillion yen in M1 and 939 trillion yen in M2.
Table 4.4Currency in Circulation (Outstanding at year-end)
(Billion yen)
Item 2012 2013 2014 2015 2016
Total ................................................ 91,231 94,770 97,738 103,120 107,203 Bank of Japan notes ..................... 86,653 90,143 93,082 98,430 102,461 Coins ............................................ 4,578 4,627 4,656 4,690 4,742Source: Bank of Japan.
Table 4.5Money Stock 1) (Average amounts outstanding)
(Billion yen)
M1 Quasi-money CDs
2012 816,530 1,122,568 534,555 555,606 32,406 1,452,6132013 845,971 1,155,364 560,311 561,426 33,627 1,499,0782014 874,836 1,187,430 586,756 564,803 35,871 1,550,8862015 907,127 1,223,255 617,079 568,922 37,253 1,612,5192016 938,622 1,259,091 661,513 564,782 32,797 1,649,034
Source: Bank of Japan.
Broadly-definedliquidity
M2 M3Year
1) "Money stock" indicates the balance of currency held by corporations, individuals, localgovernments, etc.

FINANCE
46
In January 2013, the government and the Bank of Japan decided to strengthen policy coordination in order to overcome deflation and achieve sustainable economic growth with stable prices. In April 2013, the Bank of Japan changed the operating target for money market operations from the uncollateralized overnight call rate to a monetary base to facilitate quantitative easing. The Bank of Japan first introduced Quantitative and Qualitative Monetary Easing (QQE) in April 2013; in January 2016, it decided to introduce "QQE with a Negative Interest Rate". In September 2016, the Bank decided to introduce "QQE with Yield Curve Control" by strengthening these two policy frameworks, in order to achieve the price stability target at the earliest possible time.
Japan's monetary base is the amount of currency supplied by the Bank of Japan. It is the combined total of banknotes in circulation, coins in circulation, and current account balances. The monetary base was 462.2 trillion yen as of the end of April 2017, up 19.7 percent from the same month of the previous year, and setting a new record high.
Table 4.6Financial Markets (Interest rates, etc.)
(% per annum)
2007 0.75 0.459 1.875 1.673 1.5002008 0.30 0.103 1.675 1.494 1.1652009 0.30 0.094 1.475 1.256 1.2852010 0.30 0.079 1.475 1.187 1.1202011 0.30 0.075 1.475 1.102 0.9802012 0.30 0.076 1.475 1.034 0.7952013 0.30 0.068 1.475 0.880 0.7402014 0.30 0.066 1.475 0.850 0.3202015 0.30 0.038 1.475 0.778 0.2652016 0.30 -0.058 1.475 0.623 0.040
Source: Bank of Japan.
1) Uncollateralized overnight. 2) Short-term loans. 3) Average of short-term loan contractsof domestically licensed banks.
Loan contractrates 3)
10 years' newlyissued Govt.bonds yields
End of yearBasic discountrate and basic
loan rateCall rates 1) Prime lending
rates 2)

FINANCE
47
3. Financial Institutions
In addition to the Bank of Japan, Japan's financial system is comprised of private and public financial institutions. Private financial institutions include those that accept deposits (banks, credit depositories, agricultural cooperatives, etc.) and those that do not (securities companies, insurance companies, etc.).
In the course of the financial system reform, mergers and restructuring progressed among major banks, resulting in their being reorganized into three major financial groups. Regional banks and credit depositories operating in their respective regions have been making efforts to their expand operations bases through corporate mergers. In September 2016, the number of offices, including the branches of financial institutions operated domestically, post offices handling postal savings had the largest network with 24,105 offices. This was followed by domestically licensed banks, including city banks and regional banks, with a combined total of 13,589 offices and branches.
The fundamental role of the bank sector was to adjust the surplus and deficiency of funds, but as the corporate sector has been in a surplus in recent years in Japan, the percentage of loans to bank funds has been on a downward trend almost consistently. The decline in percentage of national debt and increase in deposits in recent years are thought to be a result of the Bank of Japan buying national debt owned by banks due to the abovementioned monetary easing policy.

FINANCE
48
0
20
40
60
80
100
0
200
400
600
800
1,000
1,200
2000 02 04 06 08 10 12 14 16
Others LoansStocks Corporate bondsLocal government bonds National debtDeposits Ratio of loans to total (right scale)
Source: Bank of Japan.
Trillion yen
Figure 4.7Assets of Domestically Licensed Banks (Banking Accounts, end of year)
%
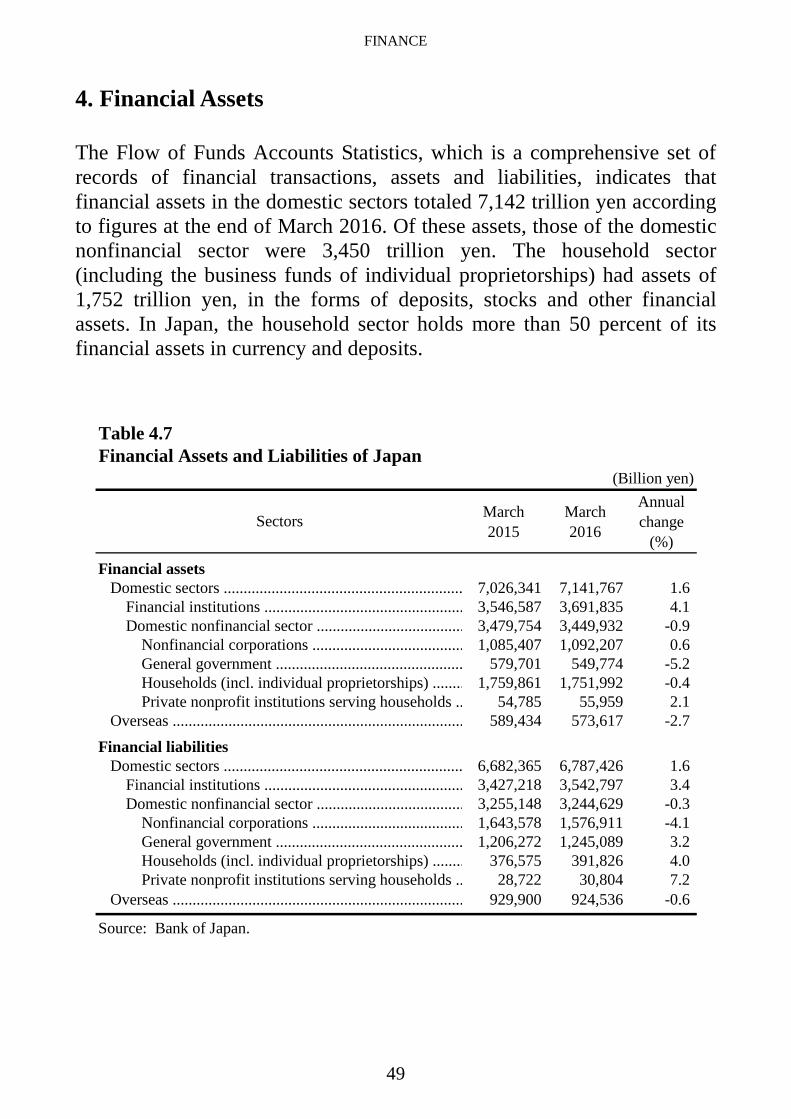
FINANCE
49
4. Financial Assets
The Flow of Funds Accounts Statistics, which is a comprehensive set of records of financial transactions, assets and liabilities, indicates that financial assets in the domestic sectors totaled 7,142 trillion yen according to figures at the end of March 2016. Of these assets, those of the domestic nonfinancial sector were 3,450 trillion yen. The household sector (including the business funds of individual proprietorships) had assets of 1,752 trillion yen, in the forms of deposits, stocks and other financial assets. In Japan, the household sector holds more than 50 percent of its financial assets in currency and deposits.
Table 4.7Financial Assets and Liabilities of Japan
(Billion yen)
March2015
March2016
Annualchange
(%)
Financial assetsDomestic sectors ............................................................ 7,026,341 7,141,767 1.6
Financial institutions .................................................. 3,546,587 3,691,835 4.1Domestic nonfinancial sector ..................................... 3,479,754 3,449,932 -0.9
Nonfinancial corporations ...................................... 1,085,407 1,092,207 0.6General government ............................................... 579,701 549,774 -5.2Households (incl. individual proprietorships) ........ 1,759,861 1,751,992 -0.4Private nonprofit institutions serving households .. 54,785 55,959 2.1
Overseas ......................................................................... 589,434 573,617 -2.7Financial liabilities
Domestic sectors ............................................................ 6,682,365 6,787,426 1.6Financial institutions .................................................. 3,427,218 3,542,797 3.4Domestic nonfinancial sector ..................................... 3,255,148 3,244,629 -0.3
Nonfinancial corporations ...................................... 1,643,578 1,576,911 -4.1General government ............................................... 1,206,272 1,245,089 3.2Households (incl. individual proprietorships) ........ 376,575 391,826 4.0Private nonprofit institutions serving households .. 28,722 30,804 7.2
Overseas ......................................................................... 929,900 924,536 -0.6
Source: Bank of Japan.
Sectors

FINANCE
50
5. Stock Market
Stock prices in Japan rose sharply in the second half of the 1980s, spearheading the bubble economy. However, the stock market started to fall in 1990 ahead of land prices. At the end of 1989, the total market capitalization of the first section of the Tokyo Stock Exchange was 591 trillion yen, but only three years later, at the end of 1992, it had dropped by more than 50 percent to 281 trillion yen. Even after recovering to 442 trillion yen at the end of 1999, the stock market repeatedly fell and rose afterwards. The September 2008 the bankruptcy of Lehman Brothers led to a fall in total market capitalization, which amounted to 251 trillion yen at the end of 2011.
0
1,000
2,000
3,000
0
100
200
300
400
500
600
700
80 82 84 86 88 90 92 94 96 98 00 02 04 06 08 10 12 14 16
Figure 4.8Stock Price Index and Total Market Capitalization(Tokyo Stock Exchange, first section, end of year)
Trillion yen
1) Index of the total market capitalization of all stocks listed on the first section of the Tokyo Stock Exchange against a base value of 100 as of January 4, 1968. There is no continuity between figures through June 2013 and those from July 2013 due to the integration of cash equity markets between the Tokyo Stock Exchange and the Osaka.Source: Tokyo Stock Exchange, Inc.
Total market capitalization
(left scale)TOPIX 1)
(right scale)

FINANCE
51
In 2012, the high yen in Japanese economy was corrected due to expectations toward anti-deflationary economic and fiscal policies by the new government, and share prices soared. In April 2013, changes in policies of the Bank of Japan were regarded as affecting stocks and markets, and the Nikkei Stock Average at the end of 2013 was 16,291.31 yen, representing an increase of 56.7 percent as compared to the end of 2012 (10,395.18 yen) and the first significant gain in 41 years. Afterwards, the Nikkei Stock Average in April 2015 recovered to the 20,000 yen level for the first time in 15 years and stood at 19,114.37 yen at the end of 2016.
Table 4.8Stock Prices (Tokyo Stock Exchange, first section)
1998 1,340 267,783,547 96,001,269 1,086.99 13,842.171999 1,364 442,443,338 178,041,139 1,722.20 18,934.342000 1,447 352,784,685 242,632,346 1,283.67 13,785.692001 1,491 290,668,537 199,844,292 1,032.14 10,542.622002 1,495 242,939,136 190,869,955 843.29 8,578.952003 1,533 309,290,031 237,905,753 1,043.69 10,676.642004 1,595 353,558,256 323,918,214 1,149.63 11,488.762005 1,667 522,068,129 459,136,406 1,649.76 16,111.432006 1,715 538,629,548 644,308,788 1,681.07 17,225.832007 1,727 475,629,039 735,333,528 1,475.68 15,307.782008 1,715 278,988,813 568,538,950 859.24 8,859.562009 1,684 302,712,168 368,679,737 907.59 10,546.442010 1,670 305,693,030 354,598,763 898.80 10,228.922011 1,672 251,395,748 341,587,524 728.61 8,455.352012 1,695 296,442,945 306,702,280 859.80 10,395.182013 1,774 458,484,253 640,193,836 # 1,302.29 16,291.312014 1,858 505,897,342 576,525,070 1,407.51 17,450.772015 1,934 571,832,889 696,509,496 1,547.30 19,033.712016 2,002 560,246,997 643,205,780 1,518.61 19,114.372017 Jan. 2,001 560,628,734 49,990,077 1,521.67 19,041.34
Feb. 2,001 565,825,277 50,914,304 1,535.32 19,118.99Mar. 2,011 558,610,633 55,089,902 1,512.60 18,909.26
YearNumberof listed
companies 1)
Totalmarket
capitalization 1)
(million yen)
Totaltradingvalue
(million yen)
NikkeiStock Average(225 issues) 1)
(yen)
TOPIX 1) 2)
Tokyo stockprice index,
average
1) End of year or month. 2) Index of the total market value of all stocks listed on the firstsection of the Tokyo Stock Exchange against a base value of 100 as of January 4, 1968.Source: Tokyo Stock Exchange, Inc.; Bank of Japan; Nikkei Inc.

FINANCE
52
At the end of March 2016, the total number of individual stockholders (individuals of Japanese nationality and domestic groups without corporate status) in possession of stocks listed on the Tokyo/Nagoya/Fukuoka/ Sapporo Stock Exchanges totaled 49.4 million. In value terms, the ratio of stocks they possessed was 17.5 percent. The ratio of Japanese stocks held by foreign investors (total of corporations and individuals) was 29.8 percent in value terms, decline for the first time in four years.
A survey conducted of 257 securities firms by the Japan Securities Dealers Association (JSDA) showed that 27.6 percent of those companies offered Internet trading at the end of September 2016. Internet trading thus accounted for 20.6 percent of the total value of stock brokerage transactions from the period of April 2016 to September 2016.

“Statistical Handbook of Japan 2017” by Statistics Bureau, Japan
Chapter 5
Agriculture, Forestry and Fisheries
According to the Statistical survey on Crops by the Ministry of Agriculture, Forestry and Fisheries, the planted area, crop yield, and shipment of lotus roots in 2015 in Ibaraki Prefecture ranked first in Japan. Percentages of crop yield (Ibaraki Prefecture: 29,000 tons; Japan: 56,700 tons) and shipment (Ibaraki Prefecture: 24,900 tons; Japan: 47,400 tons) accounted for more than half those of the entire country.
© Kanto Regional Agricultural Administration Office

AGRICULTURE, FORESTRY AND FISHERIES
54
1. Overview of Agriculture, Forestry and Fisheries
Over the course of Japan's economic growth, its agricultural, forestry and fishing industries employ fewer and fewer workers every year, and their GDP share has also dropped. The number of workers decreased from 13.40 million in 1960 (30.2 percent of the total workforce) to 2.28 million in 2015 (3.6 percent), and the GDP share of the industries fell from 12.8 percent in 1960 to 1.1 percent in 2015.
2. Agriculture
(1) Agricultural Production
Japan's total agricultural output in 2015 was 8.80 trillion yen, up 5.2 percent from the previous year. Crops yielded 5.63 trillion yen, up 4.9 percent from the previous year.
Table 5.1Agricultural, Forestry and Fisheries Output
(Billion yen)2011 2012 2013 2014 2015
Total ................................................. 10,082 10,333 10,327 10,319 10,826 Agriculture .................................... 8,246 8,525 8,467 8,364 8,798 Crops .......................................... 5,639 5,879 5,703 5,363 5,625
Rice ......................................... 1,850 2,029 1,781 1,434 1,499Vegetables ............................... 2,134 2,190 2,253 2,242 2,392Fruits and nuts ........................ 743 747 759 763 784
Livestock and its products .......... 2,551 2,588 2,709 2,945 3,118Beef cattle ............................... 463 503 519 594 689Dairy cattle .............................. 751 775 778 805 840Pigs ......................................... 536 537 575 633 621Chickens ................................. 753 724 784 853 905
Forestry ......................................... 417 392 425 451 436 Fisheries ........................................ 1,419 1,417 1,436 1,504 1,592Source: Ministry of Agriculture, Forestry and Fisheries.
Item

AGRICULTURE, FORESTRY AND FISHERIES
55
Table 5.2Agricultural Production
(Thousand tons)Products 2000 2005 2010 2014 2015
Cereal grains Rice ............................................ 9,490 9,074 8,483 8,439 7,989 Wheat ......................................... 688 875 571 852 1,004Vegetables, potatoes and legumes Potatoes ...................................... 2,898 2,752 2,290 2,456 2,406 Sweet potatoes ............................ 1,073 1,053 864 887 a) 814 Soybeans, dried .......................... 235 225 223 232 243 Cucumbers .................................. 767 675 588 549 550 Tomatoes .................................... 806 759 691 740 727 Cabbages .................................... 1,449 1,364 1,360 1,480 1,469 Chinese cabbages ....................... 1,036 924 889 914 895 Onions ........................................ 1,247 1,087 1,042 1,169 1,265 Lettuces ...................................... 537 552 538 578 568 Japanese radishes ....................... 1,876 1,627 1,496 1,452 1,434 Carrots ........................................ 682 615 596 633 633Fruits Mandarin oranges ....................... 1,143 1,132 786 875 778 Apples ........................................ 800 819 787 816 812 Grapes ........................................ 238 220 185 189 181 Japanese pears ............................ 393 362 259 271 247Industrial crops Crude tea .................................... a) 85 100 85 84 80 Sugar beets 1) .............................. 3,673 4,201 3,090 3,567 3,9251), a) Figures are total of major producing prefectures.Source: Ministry of Agriculture, Forestry and Fisheries.
Table 5.3Production of Meat, Milk and Eggs
(Tons)Products 2000 2005 2010 2014 2015
Pork ....................... 1,270,685 1,244,963 1,292,451 1,263,599 1,254,283Beef ....................... 529,674 498,428 514,078 501,480 480,419Veal ....................... 629 1,042 881 655 601Horse meat ............ 7,215 7,129 5,880 5,379 5,113Broilers .................. 1,551,101 1,702,001 1,835,091 1,946,449 … Cow milk ............... 8,497,278 8,285,215 7,720,456 7,334,264 7,379,234Eggs ....................... 2,540,075 2,481,000 2,515,323 2,501,921 2,520,873Source: Ministry of Agriculture, Forestry and Fisheries.

AGRICULTURE, FORESTRY AND FISHERIES
56
(2) Farmers and Farmland
In 2015, the number of farm households engaged in commercial farming (which refers to households with cultivated land under management of 0.3 hectares and over, or with annual sales of agricultural products amounting to 500,000 yen or more) was 1.33 million. Of these commercial farm households, 33.3 percent were full-time farm households, 12.4 percent were part-time farm households with farming income exceeding non-farming income, and 54.3 percent were part-time farm households with non-farming income exceeding farming income.
Of the commercial farm household members, 2.10 million people were engaged in farming as their principal occupation (commercial farmers) in 2015, of whom 63.5 percent were aged 65 years and over.
In 2015, the total income per commercial farm household was 4.96 million yen, up 8.7 percent from the previous year. Of that amount, 1.53 million yen was from farming income, 1.47 million yen from non-farming income, and 1.95 million yen from pension benefits and other sources.
Japan's cultivated acreage shrank year after year from 6.09 million hectares in 1961 to 4.47 million hectares in 2016. In the one-year period of 2016, there were 4,530 hectares of new cultivation but also a 29,900-hectare decrease. The most common cause for the decrease was degraded farmland, accounting for approximately 50 percent of all cases,
Table 5.4Commercial Farm Households and Commercial Farmers
Commercial farm households (1,000) Commercial farmers
Year Total Mainlyfarming
Mainlyother job (1,000)
1995 2,651 428 498 1,725 4,140 43.52000 2,337 426 350 1,561 3,891 52.92005 1,963 443 308 1,212 3,353 58.22010 1,631 451 225 955 2,606 61.62015 1,330 443 165 722 2,097 63.5
Source: Ministry of Agriculture, Forestry and Fisheries.
Full-time
Part-time Aged 65years and
over(%)

AGRICULTURE, FORESTRY AND FISHERIES
57
followed by land-use conversion for residential and other land uses, making up approximately 20 percent.
3. Forestry
Japan's forest land area is 25.08 million hectares (approximately 70 percent of the entire surface area of the country). Of this, natural forests account for 54 percent while planted forests, most of which are conifer plantations, make up 41 percent. Meanwhile, Japan's forest growing stock is 4,901 million cubic meters, of which 3,042 million cubic meters are from planted forests.
The growing stock of Japan's forest has increased, centering on planted forests on deforested sites right after World War II and during the period of rapid growth. Such forests are in a period of full-scale use as resources. From the perspectives of effective use of forest resources, proper development of preservation and multi-faceted functions of forests, and promotion of forestry industry and of mountainous areas, the use of domestic wood is being promoted through the use of timber in housing, public buildings, etc., energy use as woody biomass, and through PR and popularization activities to expand timber use.
Domestic wood supply (log conversion) totaled 21.8 million cubic meters in 2015, which is equivalent to about 40 percent of the peak in 1967 (52.7
Table 5.5Forest Land Area and Forest Resources (2012)
Municipal Private OthersForest land area (1,000 ha) ............. 25,081 7,674 2,919 14,437 51Forest growing stock (million m3) .. 4,901 1,152 558 3,184 7
Planted forest Land area (1,000 ha) ................. 10,289 2,327 1,287 6,662 14 Growing stock (million m3) ...... 3,042 467 350 2,221 3
Natural forest Land area (1,000 ha) ................. 13,429 4,717 1,495 7,186 30 Growing stock (million m3) ...... 1,858 684 207 963 4Source: Ministry of Agriculture, Forestry and Fisheries.
Item Total Nationalforest
Non-national forest

AGRICULTURE, FORESTRY AND FISHERIES
58
million cubic meters). In 2015, Japan's self-sufficiency rate for lumber was 30.8 percent. Currently, Japan depends mostly on imported lumber for pulp, woodchip, and plywood materials.
Although the number of workers engaged in forestry has declined due to a slowdown in domestic lumber production activities, the pace of decline has slackened in recent years. In 2015, there were 63,663 workers engaged in forestry, approximately one out of five workers was aged 65 and over, highlighting the aging of the labour force.
0
20
40
60
80
100
0
20
40
60
80
100
120
140
1960 65 70 75 80 85 90 95 00 05 10 15
Million cubic meters
Figure 5.1Industrial Wood Supply and Self-Sufficiency Rate 1)
%
Self-sufficiency rate (right scale)
1) The volume in log equivalent.Source: Ministry of Agriculture, Forestry and Fisheries.
Imported wood (left scale)Domestic wood
(left scale)

AGRICULTURE, FORESTRY AND FISHERIES
59
4. Fisheries
(1) Fishery Production
In Japan, a country surrounded by the ocean, the fishing industry has been developing since ancient times, and has contributed greatly to the lives of the Japanese, not only in economic terms, but also in promoting a food culture that is boasted to the world as Washoku. However, in recent years, the consumption of seafood has decreased due to changes in the environment surrounding food in Japan.
Japan's fishery output has been on the decline since 1989. Its 2016 fishery production totaled 4.31 million tons. Of this, marine fishery and aquaculture production amounted to 4.25 million tons.
0
2
4
6
8
10
12
14
1985 90 95 00 05 10 15
Figure 5.2Production by Type of Fishery
Million tons
1) Excluding figures lost in Iwate, Miyagi and Fukushima prefectures because of the Great East Japan Earthquake. Source: Ministry of Agriculture, Forestry and Fisheries.
Pelagic fisheries
Offshore fisheries
Coastal fisheries
Marine aquaculture
Inland water fisheries and aquaculture
111) 16

AGRICULTURE, FORESTRY AND FISHERIES
60
(2) Fishery Workers
The number of workers in the marine fishery industry (the workers who engage in work at sea for 30 days or more yearly) has been decreasing constantly. In 2016, there was a 4.0 percent decrease from the previous year, bringing the count to 160,020 workers. In every age group, the number of workers in the marine fishery industry decreased from the previous year.
Table 5.6Production by Fishery Type and Species
(Thousand tons)2000 2005 2010 2015 2016*
Total ......................................... 6,384 5,765 5,313 4,688 4,312 Marine fisheries ..................... 5,022 4,457 4,122 3,550 3,217 Tunas ................................... 286 239 208 190 166 Bonito .................................. 369 399 331 264 208 Sardine ................................ 150 28 70 340 375 Mackerels ............................ 346 620 492 557 489 Alaska pollack ..................... 300 194 251 180 134 Crabs ................................... 42 34 32 29 28 Squids ................................. 624 330 267 168 107 Marine aquaculture ................ 1,231 1,212 1,111 1,069 1,032 Yellowtails .......................... 137 160 139 140 141 Oysters ................................ 221 219 200 164 157 Laver ................................... 392 387 329 297 302 Wakame Sea weed .............. 67 63 52 49 48 Pearl (tons) .......................... 30 29 21 20 20 Inland water fisheries ............. 71 # 54 # 40 # 33 # 28 Salmons and trouts .............. 17 # 19 # 14 # 13 # 8 Sweetfish ............................. 11 # 7 # 3 # 2 # 2 Shellfishes ........................... 20 # 14 # 14 # 13 # 12 Inland water aquaculture ........ 61 # 42 39 36 35 Eel ....................................... 24 19 21 20 19 Trouts .................................. 15 12 9 8 8 Common carp ...................... 11 4 4 3 3Source: Ministry of Agriculture, Forestry and Fisheries.
Fishery type and species

AGRICULTURE, FORESTRY AND FISHERIES
61
As the aging of fishing vessels progresses and the fishery workers aging increases, fisheries have been gaining attention as a place for employment, based on the diversification of values regarding work and life, and support is also being provided for new fishery workers.
5. Self-Sufficiency in Food
Japan's food self-sufficiency rate in terms of calories, although there is a downward trend over the long term, the ratio has been fluctuating at a level of around 40 percent since fiscal 1997. Whereas the ratio was 53 percent in fiscal 1980, the ratio was 39 percent in fiscal 2015. The major reason behind the decrease in the food self-sufficiency rate is that despite a decrease in the domestic production force caused by a decline in agricultural workers, etc., westernization of the Japanese dietary life, and decline in consumption of rice, of which self-sufficiency within Japan is possible, consumption of livestock products and oils and fats, for which overseas dependence for feed and raw materials is inevitable, increased.
In fiscal 2015, the self-sufficiency rate (on an item-specific weight basis) was 100 percent for rice, 15 percent for wheat, nine percent for beans, 80 percent for vegetables, 40 percent for fruits, 54 percent for meats, and 59 percent for seafood. Although completely self-sufficient in rice, the staple food of its people, Japan relied almost entirely on imports for the supply of wheat and beans.
Table 5.7Enterprises and Workers Engaged in the Marine Fishery/Aquaculture Industry
Enterprises Workers
2000 145,930 137,690 8,240 260,200 … …2005 126,020 118,930 7,090 222,170 … …2010 103,740 98,300 5,440 202,880 128,270 74,6102015 85,210 80,570 4,640 166,610 100,520 66,1002016 81,880 77,370 4,500 160,020 95,740 64,280
Source: Ministry of Agriculture, Forestry and Fisheries.
Total Individualhouseholds
Corporateentities Total Self-
employed HiredYear

AGRICULTURE, FORESTRY AND FISHERIES
62
Table 5.8Supply of Cereal Grains
Rice1995 2,118 10,748 5.07 495 10,2902000 1,770 9,490 5.36 879 9,7902005 1,706 8,998 5.27 978 9,2222010 1,628 8,554 5.25 831 9,018
2015* 1,506 8,429 5.60 834 8,600Wheat
1995 151 444 2.93 5,750 6,3552000 183 688 3.76 5,688 6,3112005 214 875 4.10 5,292 6,2132010 207 571 2.76 5,473 6,384
2015* 213 1004 4.71 5,660 6,581Source: Ministry of Agriculture, Forestry and Fisheries.
Fiscal year Area planted(1,000 ha)
Production(1,000 t)
Yield perhectare (t)
Imports(1,000 t)
Supplies for domesticconsumption
(1,000 t)
0
2
4
6
8
10
12
FY95 00 05 10
Wheat
Production(left scale)
Million tons
Domestic supply(left scale)
FY95 00 05 10
Fruits
120
100
80
60
40
20
0
20
40
60
80
100
FY95 00 05 10
Meats
Self-sufficiencyrate (right scale)
FY1990 FY1990FY1990
Figure 5.2Self-Sufficiency Rates for Selected Categories of Agricultural Produce
Source: Ministry of Agriculture, Forestry and Fisheries.
%
0
2
4
6
8
10
12
FY95 00 05 10
Wheat
Production(left scale)
Million tons
Domestic supply(left scale)
FY95 00 05 10
Fruits
120
100
80
60
40
20
0
20
40
60
80
100
FY95 00 05 10
Meats
Self-sufficiencyrate (right scale)
FY1990 FY1990FY1990
Figure 5.2Self-Sufficiency Rates for Selected Categories of Agricultural Produce
%
0
2
4
6
8
10
12
14
FY95 00 05 10 14 15
Wheat
Production(left scale)
Million tons
Supplies for Domestic Consumption (left scale)
FY95 00 05 10 14 15
Fruits
120
100
80
60
40
20
0
20
40
60
80
100
FY95 00 05 10 14 15
Meats
Self-sufficiencyrate (right scale)
Figure 5.3Self-Sufficiency Rates for Selected Categories of Agricultural Produce
%
FY1995FY1995FY1995 ***

AGRICULTURE, FORESTRY AND FISHERIES
63
Japan's present food self-sufficiency rate is the lowest among major industrialized countries, and Japan is thus the world's leading net importer of agricultural products.
Figure 5.4Trends in Food Self-Sufficiency Rates of Major Countries 1)
(In terms of calories)
0
50
100
150
200
250
300
1998 99 00 01 02 03 04 05 06 07 08 09 10 11
%
U.S.A.▼
Canada▼
GermanySwitzerland
▼
France▼
U.K.▼
Japan
1) Estimates.Source: Ministry of Agriculture, Forestry and Fisheries.

“Statistical Handbook of Japan 2017” by Statistics Bureau, Japan
Chapter 6
Manufacturing and Construction
The construction industry is responsible for local infrastructure development and maintenance, and at the same time, it plays a large role in supporting people’s living and socioeconomics, as a local protector responsible for supporting the local economy and employment, and ensuring safety and security of the local society at the front line during disasters.
© Japan Bridge Association Inc.

MANUFACTURING AND CONSTRUCTION
65
1. Overview of the Manufacturing Sector
The proportion of added value produced in Japan's manufacturing sector to its nominal GDP has been around 20 percent recently, and the sector has a large ripple effect on other sectors.
In Japan, the September 2008 Lehman Brothers Bankruptcy led to a sharp drop in worldwide demand for the mainstays of Japan's manufacturing industries, namely, consumer durables such as automobiles and capital goods such as machine tools. Additionally, in 2011, the Great East Japan Earthquake, the historically high yen, and the slowing global economy contributed to sluggish domestic production. Anxiety about industrial hollowing out increased. Against such background, the Japanese government announced an economic policy ("Abenomics") in January 2013, resulting in the Japanese economy shifting to a recovery. Afterwards, in April 2014, there were impacts caused by a response to last-minute demand associated with the increase in consumption tax. However, the economy has continued a gradual upward momentum, and improvements in earnings can also be seen in enterprises in the manufacturing industry.
In 2014, there were 202,410 establishments (with four or more persons engaged) in the manufacturing sector. By industry, "food" had the most, with 27,115 establishments (component ratio of 13.4 percent), followed by "fabricated metal products" with 26,797 establishments (13.2 percent) and "production machinery" with 19,083 establishments (9.4 percent).
There were 7.40 million persons engaged, and by industry, "food" had the most, with 1.11 million persons engaged (component ratio of 15.0 percent), followed by "transportation equipment" with 0.98 million persons engaged (13.2 percent) and "fabricated metal products" with 0.58 million persons engaged (7.8 percent).
The value of manufactured goods shipments was 305.1 trillion yen, and by industry, "transportation equipment" had the most at 60.1 trillion yen (component ratio of 19.7 percent), followed by "chemical and related products" at 28.1 trillion yen (9.2 percent) and "food" at 25.9 trillion yen (8.5 percent).

MANUFACTURING AND CONSTRUCTION
66
Table 6.1Establishments, Persons Engaged and Value of Manufactured GoodsShipments of the Manufacturing Industry 1) (2014)
Value of manu-factured goods
shipments
(billion yen)
202,410 7,403,269 305,140Food ................................................................... 27,115 1,112,433 25,936Beverages, tobacco and feed .............................. 4,128 99,451 9,597Textile mill products .......................................... 13,430 268,135 3,822Lumber and wood products 2) ............................ 5,547 91,497 2,520Furniture and fixtures ......................................... 5,550 96,824 1,915Pulp, paper and paper products .......................... 5,969 181,868 6,974Printing and allied industries ............................. 11,664 268,880 5,416Chemical and related products ........................... 4,669 343,416 28,123Petroleum and coal products .............................. 931 24,830 18,659Plastic products 3) ............................................... 12,936 405,938 11,533Rubber products ................................................. 2,525 110,987 3,207Leather tanning, leather products and fur skins ....... 1,394 22,380 348Ceramic, stone and clay products ...................... 9,974 237,733 7,332Iron and steel ...................................................... 4,222 214,988 19,202Non-ferrous metals and products ....................... 2,594 138,587 9,422Fabricated metal products .................................. 26,797 576,707 13,933General-purpose machinery ............................... 7,141 308,841 10,103Production machinery ........................................ 19,083 550,642 16,591Business oriented machinery ............................. 4,159 204,404 7,034Electronic parts, devices and electronic circuits....... 4,267 382,110 13,818Electrical machinery, equipment and supplies ... 8,953 481,936 17,032Information and communication electronics equipment ......................................................... 1,501 151,851 8,628Transportation equipment .................................. 10,415 980,505 60,063Miscellaneous manufacturing products, n.e.c. ... 7,446 148,326 3,9331) Establishments with four or more persons engaged. 2) Excluding furniture.3) Excluding plastic furniture, plastic plate making for printing, etc., which are included in otherindustrial classification.Source: Ministry of Economy, Trade and Industry.
Industries
Manufacturing ........................................................
Number ofestablish-
ments
Number ofpersonsengaged

MANUFACTURING AND CONSTRUCTION
67
Based on the Indices on Mining and Manufacturing (2010 average=100), the production index for 2016 was 97.7, down 0.1 percent from the previous year, while shipments stood at 96.3, a decrease of 0.6 percent from the year before.
Table 6.2Indices on Mining and Manufacturing (2016)
(2010 average=100)
Annualgrowth
(%)
Annualgrowth
(%)
Annualgrowth
(%)
Annualgrowth
(%)97.7 -0.1 96.3 -0.6 106.4 -5.3 114.2 0.0
Manufacturing ........................ 97.7 -0.1 96.3 -0.6 106.4 -5.3 114.2 0.0Foods and tobacco ................ 96.6 0.1 94.8 -0.5 95.8 17.1 100.3 13.7Textiles ................................. 93.3 -2.2 92.7 -1.8 115.8 1.1 122.3 4.9Pulp, paper and paper products ............................... 98.3 0.6 96.8 0.5 102.0 -1.4 117.6 3.5Chemicals ............................. 100.1 3.1 97.1 3.2 102.7 -6.4 116.2 -1.4Petroleum and coal products ............................... 91.4 0.3 93.1 -1.9 78.9 -9.8 89.4 -3.4Plastic products .................... 98.6 1.5 96.6 1.4 106.4 -2.9 113.0 0.3Ceramics, stone and clay products ............................... 98.5 -0.7 99.3 -0.5 102.1 -5.4 112.1 0.4Iron and steel ........................ 92.4 -1.0 94.1 -0.5 119.9 3.7 126.5 9.0Non-ferrous metals ............... 98.5 2.1 97.3 2.1 109.0 -8.0 115.8 -4.7Fabricated metals .................. 92.8 -2.3 93.1 -2.4 109.6 -2.1 131.6 3.3General-purpose machinery .. 99.5 -2.0 99.6 -1.8 112.6 -3.1 117.8 -4.5Production machinery ........... 122.5 -1.2 124.1 -0.2 158.7 -14.3 122.8 3.5Business oriented machinery 102.6 1.4 105.1 0.8 111.3 -13.0 127.5 -2.7Electronic parts and devices ..... 96.4 -6.3 106.1 -8.8 82.1 -25.5 127.1 -5.7Electrical machinery ............. 100.1 -0.9 95.6 -2.6 153.3 7.5 148.3 10.8Information and communication electronics equipment ................ 55.3 0.7 46.5 -4.5 73.1 -3.6 129.5 3.4Transport equipment ............ 100.1 1.3 98.0 1.2 73.8 -18.4 82.7 -19.2Other manufacturing ............ 93.0 -0.7 94.2 -0.7 96.9 0.0 100.1 -1.8
Mining .................................... 89.8 -0.7 87.6 -1.2 99.9 3.6 119.0 8.8
(Reference)Electricity, gas, heat supply and water ............................... 88.9 -1.9 90.8 -1.3 - - - -
Source: Ministry of Economy, Trade and Industry.
Production 1)
1) Value added weights. 2) End of the year.
Mining and manufacturing ..
Industries
Inventory Ratio 3)Shipments Inventory 2)
3) Inventory ratio = Inventory quantity / Shipments quantity

MANUFACTURING AND CONSTRUCTION
68
2. Principal Industries in the Manufacturing Sector
This section describes the major industries in the manufacturing sector. For each industry, (a) is described by the "Census of Manufactures 2014 (with four or more persons engaged)", and (b) is described by the "Indices on Mining and Manufacturing" (2010 average=100).
(1) Machinery Industry
(A) Transport Equipment Industry
(a) In 2014, a total of 10,415 establishments, employed 980,505 persons, and shipped 60.1 trillion yen worth of products.
(b) In 2016, production and shipments increased by 1.3 percent and 1.2 percent, respectively, from the previous year. Production increased for the first time in two years, while shipments increased for the first time in four
60
80
100
120
140
160
Ⅰ Ⅱ Ⅲ Ⅳ Ⅰ Ⅱ Ⅲ Ⅳ Ⅰ Ⅱ Ⅲ Ⅳ Ⅰ Ⅱ Ⅲ Ⅳ Ⅰ Ⅱ Ⅲ Ⅳ Ⅰ Ⅱ Ⅲ Ⅳ Ⅰ Ⅱ Ⅲ Ⅳ
▲
Shipments
▲
Production 2)
▼
Inventory ratio 4)
1) Seasonal adjustment indices. 2) Value added weights. 3) End of the quarter. 4) Inventory ratio = Inventory quantity / Shipments quantity Source: Ministry of Economy, Trade and Industry.
Figure 6.1Trends in Indices on Mining and Manufacturing 1)
Inventory 3)
11
(2010 average=100)
2010 12 13 14 15 16

MANUFACTURING AND CONSTRUCTION
69
years. These increases were due to an increase in the production and shipments of "passenger cars", "motor vehicle parts", etc.
(B) Electrical Machinery, Equipment and Supplies Industry
(a) In 2014, a total of 8,953 establishments, employed 481,936 persons, and shipped 17.0 trillion yen worth of products.
(b) In 2016, production and shipments decreased by 0.9 percent and 2.6 percent, respectively, from the previous year, representing their second consecutive year of decrease. These decreases (in both production and shipments) were due to a decrease in "electrical rotating machinery", "wiring devices and luminaries", etc.
(C) Production Machinery Industry
(a) In 2014, a total of 19,083 establishments, employed 550,642 persons, and shipped 16.6 trillion yen worth of products.
(b) In 2016, production and shipments decreased by 1.2 percent and 0.2 percent, respectively, from the previous year, representing their first decrease in two years. These decreases (in both production and shipments) were due to a decrease in "engineering and construction machinery", "metal cutting machinery", etc.
(D) Electronic Parts and Devices Industry
(a) In 2014, a total of 4,267 establishments, employed 382,110 persons, and shipped 13.8 trillion yen worth of products.
(b) In 2016, production and shipments decreased by 6.3 percent and 8.8 percent, respectively, from the previous year, representing their first decrease in four years. These decreases (in both production and shipments) were due to a decrease in "electronic parts", "integrated circuits", etc.

MANUFACTURING AND CONSTRUCTION
70
(E) Information and Communication Electronics Equipment Industry
(a) In 2014, a total of 1,501 establishments, employed 151,851 persons, and shipped 8.6 trillion yen worth of products.
(b) In 2016, production increased by 0.7 percent and shipments decreased by 4.5 percent from the previous year. This marked the first increase in production in six years, and the sixth consecutive year of decrease in shipments. The increase in production was due to an increase in "household electronic machinery" and "electronic computers". The decrease in shipments was due to a decrease in "household electronic machinery", "electronic computers", etc.
(2) Chemical Industry
(a) In 2014, a total of 4,669 establishments, employed 343,416 persons, and shipped 28.1 trillion yen worth of products.
(b) In 2016, production and shipments increased by 3.1 percent and 3.2 percent, respectively, from the previous year, representing their second consecutive year of increase. The increase in production was due to an increase in "cosmetics", "soap, synthetic detergent and surface-active agents", etc. The increase in shipments was due to an increase in "plastic materials", "cosmetics", etc.
(3) Iron and Steel Industry
(a) In 2014, a total of 4,222 establishments, employed 214,988 persons, and shipped 19.2 trillion yen worth of products.
(b) In 2016, production and shipments decreased by 1.0 percent and 0.5 percent, respectively, from the previous year, representing their second consecutive year of decrease. The decrease in production was due to a decrease in "crude steel (incl. Semi-finished steel)", etc. The decrease in shipments was due to a decrease in "hot rolled steel", etc.

MANUFACTURING AND CONSTRUCTION
71
(4) Fabricated Metal Products Industry
(a) In 2014, a total of 26,797 establishments, employed 576,707 persons, and shipped 13.9 trillion yen worth of products.
(b) In 2016, production and shipments decreased by 2.3 percent and 2.4 percent, respectively, from the previous year. Production decreased for the fourth consecutive year, while shipments decreased for the third consecutive year. These decreases (for both production and shipments) were due to a decrease in "metal products of building", "fabricated structural metal products", etc.
3. Construction
The construction industry, accounting for about 10 percent of both GDP and all employed persons, is one of the core industries in Japan. Construction investments at current prices had been on a declining trend after reaching a peak of 84 trillion yen in fiscal 1992, and fell to half of this peak (42 trillion yen) in fiscal 2010, but turned upward in fiscal 2011.
Construction investments in fiscal 2015 amounted to 51.0 trillion yen at current prices, down 0.6 percent compared to the previous fiscal year; they totaled 46.6 trillion yen at constant fiscal 2005 prices, down 0.1 percent from the previous fiscal year.
Table 6.3Steel Production
(Thousand tons)Products 2012 2013 2014 2015 2016
Pig iron ................................... 81,405 83,849 83,872 81,011 80,186Ferro-alloys ............................ 908 938 923 937 885Crude steel .............................. 107,232 110,595 110,666 105,134 104,775Semi-finished steel ................. 104,571 107,991 107,856 102,858 102,574Ordinary hot-rolled steel ........ 74,911 77,006 76,968 74,133 73,187Special hot-rolled steel ........... 19,896 19,960 20,914 18,887 19,449Source: Ministry of Economy, Trade and Industry.
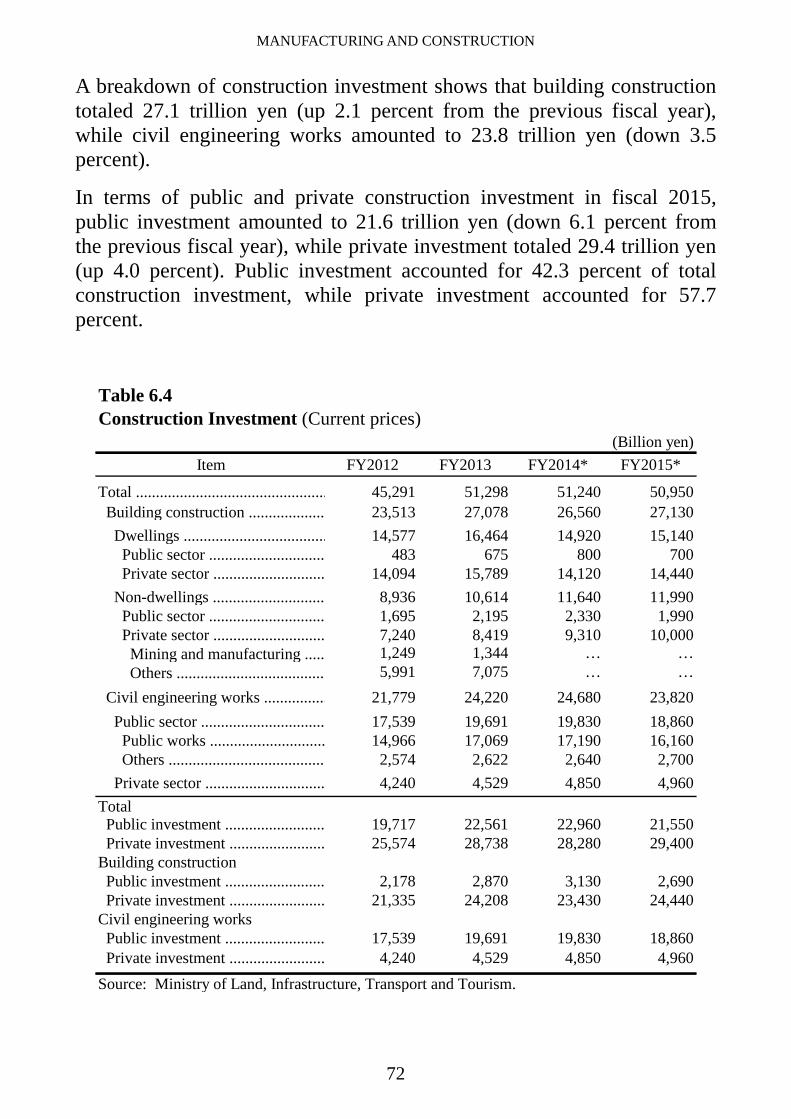
MANUFACTURING AND CONSTRUCTION
72
A breakdown of construction investment shows that building construction totaled 27.1 trillion yen (up 2.1 percent from the previous fiscal year), while civil engineering works amounted to 23.8 trillion yen (down 3.5 percent).
In terms of public and private construction investment in fiscal 2015, public investment amounted to 21.6 trillion yen (down 6.1 percent from the previous fiscal year), while private investment totaled 29.4 trillion yen (up 4.0 percent). Public investment accounted for 42.3 percent of total construction investment, while private investment accounted for 57.7 percent.
Table 6.4Construction Investment (Current prices)
(Billion yen)Item FY2012 FY2013 FY2014* FY2015*
Total ................................................ 45,291 51,298 51,240 50,950 Building construction ................... 23,513 27,078 26,560 27,130 Dwellings .................................... 14,577 16,464 14,920 15,140 Public sector ............................. 483 675 800 700 Private sector ............................ 14,094 15,789 14,120 14,440 Non-dwellings ............................ 8,936 10,614 11,640 11,990 Public sector ............................. 1,695 2,195 2,330 1,990 Private sector ............................ 7,240 8,419 9,310 10,000 Mining and manufacturing ..... 1,249 1,344 … … Others ..................................... 5,991 7,075 … … Civil engineering works ................ 21,779 24,220 24,680 23,820 Public sector ............................... 17,539 19,691 19,830 18,860 Public works ............................. 14,966 17,069 17,190 16,160 Others ....................................... 2,574 2,622 2,640 2,700 Private sector .............................. 4,240 4,529 4,850 4,960Total Public investment ......................... 19,717 22,561 22,960 21,550 Private investment ........................ 25,574 28,738 28,280 29,400Building construction Public investment ......................... 2,178 2,870 3,130 2,690 Private investment ........................ 21,335 24,208 23,430 24,440Civil engineering works Public investment ......................... 17,539 19,691 19,830 18,860 Private investment ........................ 4,240 4,529 4,850 4,960Source: Ministry of Land, Infrastructure, Transport and Tourism.

MANUFACTURING AND CONSTRUCTION
73
The 2016 total floor space of building construction starts was 132.96 million square meters, up 2.7 percent from the previous year. In particular, the floor space of buildings for wholesale and retail trade use increased by 6.1 percent compared to the previous year, to 8.02 million square meters. Meanwhile, the number of housing construction starts (in the case of apartment buildings, the number of apartment units was counted) increased for owned houses, rented and built-for-sale units alike, totaling 0.97 million housing units, up 6.4 percent from the previous year. This was an increase for the second consecutive year.
Figure 6.2Building Construction Started by Use Objective (2016)
1) Including dormitories and dormitories-industry concurrent use.Source: Ministry of Land, Infrastructure, Transport and Tourism.
Floor space
Construction cost
806040200%
100
Number of buildings
Dwelling 1)
Manufacturing
Others
Wholesale and retail trade
Medical, healthcare and welfare
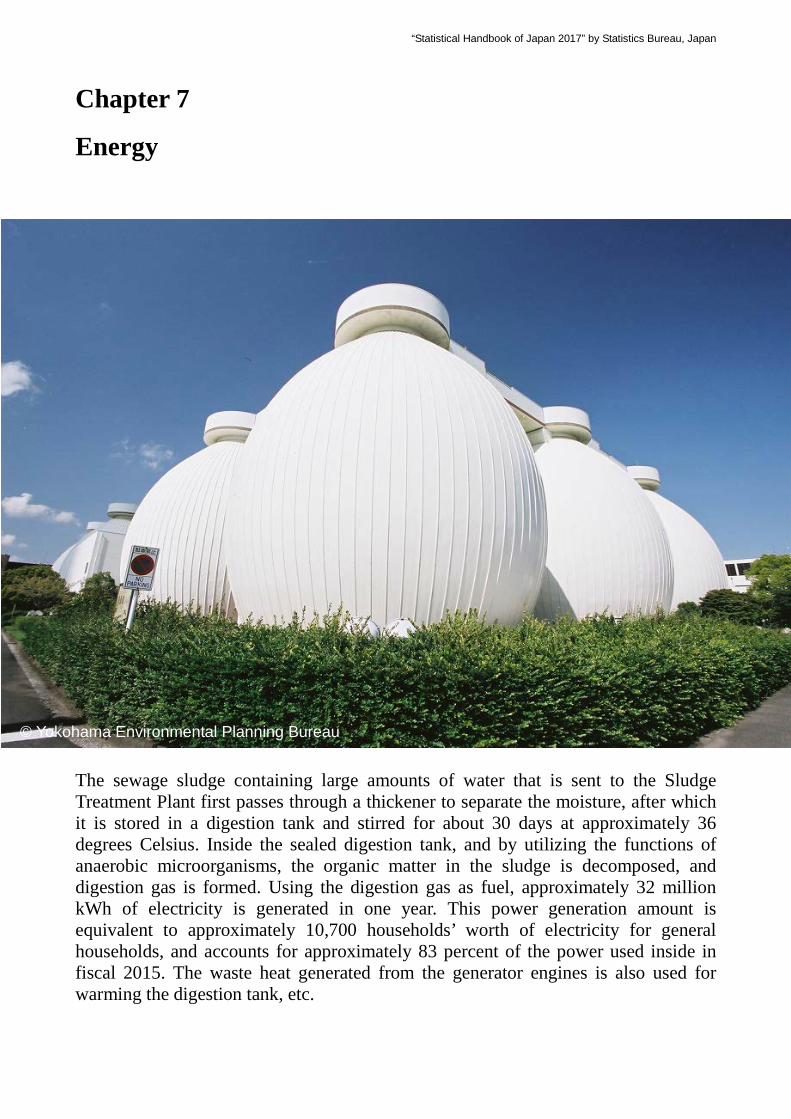
“Statistical Handbook of Japan 2017” by Statistics Bureau, Japan
Chapter 7
Energy
The sewage sludge containing large amounts of water that is sent to the Sludge Treatment Plant first passes through a thickener to separate the moisture, after which it is stored in a digestion tank and stirred for about 30 days at approximately 36 degrees Celsius. Inside the sealed digestion tank, and by utilizing the functions of anaerobic microorganisms, the organic matter in the sludge is decomposed, and digestion gas is formed. Using the digestion gas as fuel, approximately 32 million kWh of electricity is generated in one year. This power generation amount is equivalent to approximately 10,700 households’ worth of electricity for general households, and accounts for approximately 83 percent of the power used inside in fiscal 2015. The waste heat generated from the generator engines is also used for warming the digestion tank, etc.
© Yokohama Environmental Planning Bureau

ENERGY
75
1. Supply and Demand
Japan is dependent on imports for 90.5 percent of its energy supply. Since experiencing the two oil crises of the 1970s, Japan has taken measures to promote energy conservation, introduce alternatives to petroleum such as nuclear power, natural gas, coal, etc., and secure a stable supply of petroleum through stockpiling and other measures. As a result, its dependence on petroleum declined from 75.5 percent in fiscal 1973 to 43.5 percent in fiscal 2010. However, since the Great East Japan Earthquake, the percentage of fossil fuels has been increasing, as a substitute for nuclear power as fuel for power generation. The level of dependence on petroleum, which had been on a declining trend in recent years, increased to 47.2 percent in fiscal 2012. However, it is once again on a declining trend as the switch to LNG power and renewable energy progresses.
In fiscal 2015, the total primary energy supply in Japan was 20,934 petajoules, down 0.9 percent from the previous fiscal year. Its breakdown was: 44.7 percent in petroleum, 24.6 percent in coal, 22.3 percent in natural gas, 3.4 percent in hydro power, and 0.4 percent in nuclear power. Other sources were also used, though only in small quantities, including energy from waste, geothermal, and natural energy (photovoltaic, wind power, biomass energy, etc.).
Energy units
Joule (J) is employed as a common unit (International System of Units: SI) for energy across all energy sources in presenting international statistical information. The unit Petajoule (PJ: 1015 or quadrillion joules) is used here to reduce the number of digits. The energy of one kiloliter of petroleum is calculated using the following formulae: 1 kiloliter of petroleum = 3.87×10¹⁰ joules
1 petajoule = 1015 joules Petroleum is traded internationally using the volume unit of barrels. One barrel equals approximately 158.987 liters.

ENERGY
76
The government has been working to construct a new energy supply-demand structure oriented toward stable supply of energy and lowering energy costs. In this process, energy-saving and renewable energy that takes global warming into consideration has been introduced, and aims are being made toward reducing dependency on nuclear power.
0
5,000
10,000
15,000
20,000
25,000
30,000
FY1965 70 75 80 85 90 95 00 05 10 15
Petajoules
Figure 7.1Total Primary Energy Supply 1)
Coal
Petroleum
Nuclear 3)
Natural gas
Hydro
Others 2)
1) A different statistical method was used for the figures for FY1989 and prior. 2) Photovoltaic,wind power, geothermal energy, etc. 3) In fiscal 2014, the domestic suppy of nuclear energy was zero due to the suspended operation of all nuclear power plants in Japan.Source: Ministry of Economy, Trade and Industry.

ENERGY
77
Table 7.1Trends in Total Primary Energy Supply and Percentageby Energy Source
(Petajoules)Item FY2000 FY2005 FY2010 FY2014 FY2015
Total primary energy supply ..... 23,622 23,755 # 23,200 21,119 20,934Energy self-sufficiency (%) 1) .. 19.6 18.3 # 19.4 8.8 9.5Petroleum ................................. 12,008 11,634 10,088 9,436 9,358Coal .......................................... 4,286 4,829 4,997 5,088 5,156Natural gas ............................... 3,061 3,288 4,002 4,963 4,662Hydro ....................................... 778 668 703 687 710Nuclear .................................... 2,873 2,662 2,465 a) 0 79Others 2) ................................... 616 674 # 944 944 970
PercentagePetroleum ................................. 50.8 49.0 43.5 44.7 44.7Coal .......................................... 18.1 20.3 21.5 24.1 24.6Natural gas ............................... 13.0 13.8 17.2 23.5 22.3Hydro ....................................... 3.3 2.8 3.0 3.3 3.4Nuclear .................................... 12.2 11.2 10.6 0.0 0.4Others 2) ................................... 2.6 2.8 4.1 4.5 4.6
1) Domestic production of primary energy (including nuclear)/Domestic supply of primaryenergy × 100 2) Photovoltaic, wind power, geothermal energy, etc.a) In fiscal 2014, the domestic supply of nuclear energy was zero due to the suspendedoperation of all nuclear power plants in Japan.Source: Ministry of Economy, Trade and Industry.
0 1 2 3 4 5 6
U.K.Italy
JapanGermanyAustralia
FranceU.S.A.Canada
Korea, Rep. ofChinaIndia
Russia
Figure 7.2International Comparison of Energy/GDP Ratio 1) (2014)
1) Total primary energy supply (tons of oil equivalent)/GDP (thousand 2010 U.S. dollars).Source: International Energy Agency.
(Japan = 1)

ENERGY
78
Total primary energy supply per GDP is lower in Japan than in other industrialized countries. This indicates that Japan is one of the most energy-efficient countries in the world.
Energy consumption in Japan increased from the 1970s to 1990s, during which there were two oil shocks and a decrease in crude oil prices. However, in the 2000s, as crude oil prices rose again, energy consumption peaked in fiscal 2004, and then started decreasing. In fiscal 2014, real GDP was lower than in fiscal 2013, which added to a decrease in final energy consumption.
Final energy consumption in fiscal 2014 decreased 3.2 percent from the previous fiscal year, and even by sector, it has decreased in the industry sector, residential sector, and transportation sector.
0
100
200
300
400
500
600
0
3
6
9
12
15
18
1975 1980 1985 1990 1995 2000 2005 2010 14
1018J
FY
trillion yen, 2005 Japanese yen
Real GDP (right scale)
1) A different statistical method was used for the figures for FY1989 and prior.Source: Cabinet Office, Ministry of Economy, Trade and Industry.
Figure 7.3Trends in Final Energy Consumption and Real GDP 1)

ENERGY
79
0
3
6
9
12
15
18
FY1965 70 75 80 85 90 95 00 05 10
1018J
Residential
Industry
Transportation
1) A different statistical method was used for figures of FY1989 and prior.Source: Ministry of Economy, Trade and Industry.
14
Commercial Industry
Figure 7.4Trends in Final Energy Consumption by Sector 1)
0 50 100 150 200 250 300020,00040,00060,00080,000
China
U.S.A
India
Russia
Japan
Brazil
Germany
Canada
Petajoules Gigajoules
Figure 7.5Total Final Energy Consumption by Country (2014)
Source: United Nations.
Total Per capita

ENERGY
80
2. Electric Power
Approximately half of Japan's primary energy supply of petroleum, coal and other energy sources is converted into electric power.
Electricity output (including in-house power generation) in Japan totaled 1,024 billion kWh in fiscal 2015, down 2.8 percent from the previous fiscal year. Of this total, thermal power accounted for 88.7 percent; hydro power, 8.9 percent; nuclear power, 0.9 percent.
Table 7.2Trends in Electricity Output and Power Consumption 1)
(Million kWh)Item FY2000 FY2005 FY2010 FY2014 FY2015
Electricity Output Total ................................................. 1,091,500 1,157,926 1,156,888 1,053,717 1,024,179 Thermal ............................................ 669,177 761,841 771,306 955,352 908,779 Hydro ............................................... 96,817 86,350 90,681 86,942 91,383 Nuclear ............................................. 322,050 304,755 288,230 - 9,437 Others 2) ........................................... 3,456 4,980 6,671 11,423 14,580
Percentage Total ................................................. 100.0 100.0 100.0 100.0 100.0 Thermal ............................................ 61.3 65.8 66.7 90.7 88.7 Hydro ............................................... 8.9 7.5 7.8 8.3 8.9 Nuclear ............................................. 29.5 26.3 24.9 - 0.9 Others 2) ........................................... 0.3 0.4 0.6 1.1 1.4
Power Consumption Total ................................................. 982,066 1,043,800 1,056,441 969,430 955,235 Generated by electric power suppliers .. 858,078 918,265 931,059 855,353 841,542 Consumption of in-house generation .... 123,988 125,535 125,382 114,078 113,693
1) Including in-house generation. 2) Photovoltaic, wind power, geothermal energy, etc.Source: Ministry of Economy, Trade and Industry.

ENERGY
81
3. Gas
Gas production was 1,372 petajoules in fiscal 2015, down 0.7 percent from the previous fiscal year. Of this total, natural gas plus liquefied natural gas (LNG) accounted for 96.5 percent; and the remaining 3.5 percent was made up of petroleum gases, such as volatile oil and liquefied petroleum gas. Gas purchases for fiscal 2015 totaled 238 petajoules.
Gas sales for fiscal 2015 totaled 1,526 petajoules, or a year-on-year drop of 1.7 percent. Of this total, 55.2 percent was sold to industry, 25.3 percent to residential use, and 11.6 percent to the commercial sector.
Table 7.3Trends in Production and Purchases, and Sales of Gas 1)
(Petajoules)Item
Production and purchases 1,394 1,547 1,634 1,610
Production ......................... 1,235 (100.0) 1,288 (100.0) 1,382 (100.0) 1,372 (100.0) Petroleum gases 2) ........... 67 (5.4) 46 (3.6) 58 (4.2) 48 (3.5) Natural gas and LNG ...... 1,168 (94.6) 1,241 (96.4) 1,324 (95.8) 1,324 (96.5) Others .............................. - (-) - (-) - (-) - (-)
Purchases .......................... 159 (100.0) 259 (100.0) 252 (100.0) 238 (100.0) Coal gases ....................... 2 (1.3) - (-) - (-) - (-) Petroleum gases 3) ........... 10 (6.4) 6 (2.4) 4 (1.5) 3 (1.1) Natural gas and LNG 4) ... 147 (92.3) 253 (97.6) 248 (98.4) 236 (98.9) Others .............................. 0 (0.0) 0 (0.0) 0 (0.0) 0 (0.0)
Sales ................................... 1,359 (100.0) 1,477 (100.0) 1,553 (100.0) 1,526 (100.0) Residential ...................... 416 (30.6) 410 (27.7) 401 (25.8) 387 (25.3) Commercial .................... 205 (15.1) 198 (13.4) 181 (11.6) 177 (11.6) Industrial ......................... 619 (45.5) 738 (50.0) 848 (54.6) 842 (55.2) Others 5) .......................... 120 (8.8) 131 (8.9) 123 (7.9) 120 (7.9)
Source: Ministry of Economy, Trade and Industry.
FY2014FY2010 FY2015
1) Figures in parentheses indicate a percentage. 2) Benzine gas, liquefied petroleum gas,other petroleum-based gas. 3) Vaporized liquefied petroleum gas, other petroleum-basedgas. 4) Natural gas, vaporized liquefied natural gas. 5) Public offices, schools, medical
FY2005

“Statistical Handbook of Japan 2017” by Statistics Bureau, Japan
Chapter 8
Science and Technology/
Information and Communication Pepper is equipped with a function to recognize people’s emotions, and is a human robot with the ability to act and speak according to human emotions. Four directional microphones are embedded in its head, and Pepper is able to use these microphones to determine the position of sound sources and changes its direction depending on the person speaking. Pepper’s face is equipped with a 3D camera and two HD cameras, making it able to recognize nearby objects and human expressions by using these cameras and processing images using shape recognition software. In addition, Pepper is able to smoothly move its hands and body, and can turn freely in a 360-degree direction at a maximum speed of two kilometers per hour using three omni-directional wheels. Pepper’s head, arms, and back are equipped with 20 motors, which precisely control Pepper’s movements. Furthermore, since a high-capacity lithium-ion battery is built in, Pepper is able to speak and move autonomously and continuously for a maximum of 12 hours.
©
© SoftBank Robotics Corp.
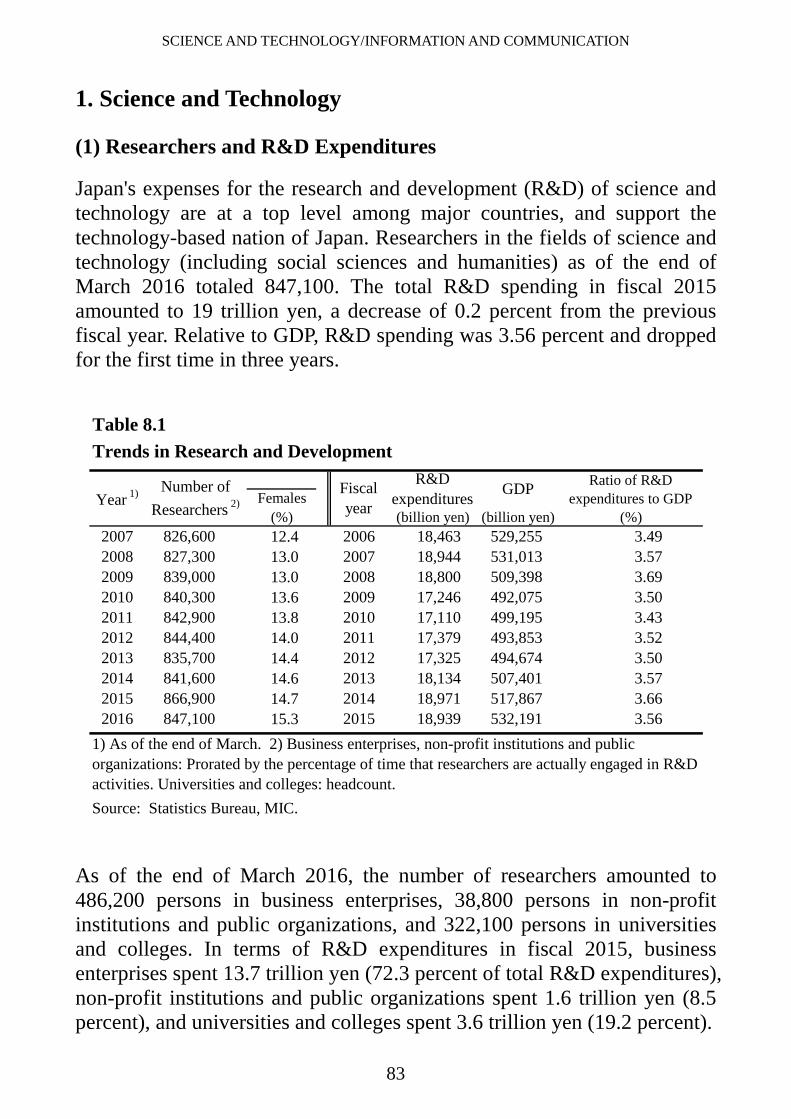
SCIENCE AND TECHNOLOGY/INFORMATION AND COMMUNICATION
83
1. Science and Technology
(1) Researchers and R&D Expenditures
Japan's expenses for the research and development (R&D) of science and technology are at a top level among major countries, and support the technology-based nation of Japan. Researchers in the fields of science and technology (including social sciences and humanities) as of the end of March 2016 totaled 847,100. The total R&D spending in fiscal 2015 amounted to 19 trillion yen, a decrease of 0.2 percent from the previous fiscal year. Relative to GDP, R&D spending was 3.56 percent and dropped for the first time in three years.
As of the end of March 2016, the number of researchers amounted to 486,200 persons in business enterprises, 38,800 persons in non-profit institutions and public organizations, and 322,100 persons in universities and colleges. In terms of R&D expenditures in fiscal 2015, business enterprises spent 13.7 trillion yen (72.3 percent of total R&D expenditures), non-profit institutions and public organizations spent 1.6 trillion yen (8.5 percent), and universities and colleges spent 3.6 trillion yen (19.2 percent).
Table 8.1Trends in Research and Development
2007 12.4 2006 18,463 529,255 3.492008 13.0 2007 18,944 531,013 3.572009 13.0 2008 18,800 509,398 3.692010 13.6 2009 17,246 492,075 3.502011 13.8 2010 17,110 499,195 3.432012 14.0 2011 17,379 493,853 3.522013 14.4 2012 17,325 494,674 3.502014 14.6 2013 18,134 507,401 3.572015 14.7 2014 18,971 517,867 3.662016 15.3 2015 18,939 532,191 3.56
Source: Statistics Bureau, MIC.
842,900844,400835,700841,600866,900847,100
Number ofResearchers 2)
Ratio of R&Dexpenditures to GDP
(%)
R&DexpendituresFemales
(%) (billion yen)
1) As of the end of March. 2) Business enterprises, non-profit institutions and publicorganizations: Prorated by the percentage of time that researchers are actually engaged in R&Dactivities. Universities and colleges: headcount.
839,000840,300
(billion yen)
GDPYear 1) Fiscal
year
826,600827,300
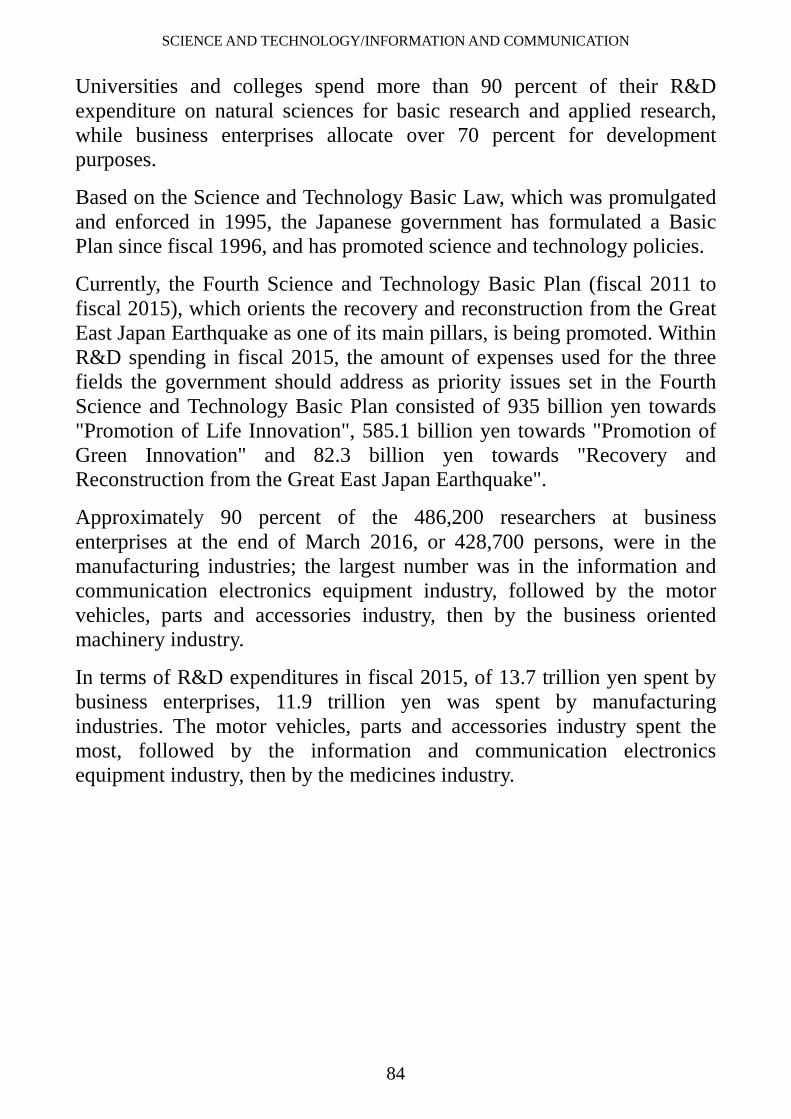
SCIENCE AND TECHNOLOGY/INFORMATION AND COMMUNICATION
84
Universities and colleges spend more than 90 percent of their R&D expenditure on natural sciences for basic research and applied research, while business enterprises allocate over 70 percent for development purposes.
Based on the Science and Technology Basic Law, which was promulgated and enforced in 1995, the Japanese government has formulated a Basic Plan since fiscal 1996, and has promoted science and technology policies.
Currently, the Fourth Science and Technology Basic Plan (fiscal 2011 to fiscal 2015), which orients the recovery and reconstruction from the Great East Japan Earthquake as one of its main pillars, is being promoted. Within R&D spending in fiscal 2015, the amount of expenses used for the three fields the government should address as priority issues set in the Fourth Science and Technology Basic Plan consisted of 935 billion yen towards "Promotion of Life Innovation", 585.1 billion yen towards "Promotion of Green Innovation" and 82.3 billion yen towards "Recovery and Reconstruction from the Great East Japan Earthquake".
Approximately 90 percent of the 486,200 researchers at business enterprises at the end of March 2016, or 428,700 persons, were in the manufacturing industries; the largest number was in the information and communication electronics equipment industry, followed by the motor vehicles, parts and accessories industry, then by the business oriented machinery industry.
In terms of R&D expenditures in fiscal 2015, of 13.7 trillion yen spent by business enterprises, 11.9 trillion yen was spent by manufacturing industries. The motor vehicles, parts and accessories industry spent the most, followed by the information and communication electronics equipment industry, then by the medicines industry.

SCIENCE AND TECHNOLOGY/INFORMATION AND COMMUNICATION
85
(2) Technology Balance of Payments (Technology Trade)
Technology trade is defined as the export or import of technology by business enterprises with other countries, such as patents, expertise, and technical guidance. In fiscal 2015, Japan earned 3949.8 billion yen from technology exports, which was up 7.9 percent from the previous fiscal year. This was the fourth consecutive increase. Of the total receipts, 74.7 percent was from overseas parent/subsidiary companies. Meanwhile, payments from technology imports stood at 602.6 billion yen, an increase of 17.5 percent compared with the previous fiscal year. It increased for the first time in two years. Of this figure, 22.6 percent was for payments to overseas parent/subsidiary companies.
Figure 8.1Researchers and Expenditures by Industry (Business enterprises)
⑦
Others
9.8
①
②
③
④
15.2
16.1%
38.1486,200 persons
⑤⑥
6.95.9
Researchers (as of end-March 2016) Expenditures (FY2015)
8.58.0
① Information and communication electronics equipment ② Motor vehicles, parts and accessories ③ Business oriented machinery ④ Electrical machinery, equipment and supplies ⑤ Chemical products ⑥Electronic parts, devices and electronic circuits ⑦ MedicinesSource: Statistics Bureau, MIC.
Others
13,686billion yen
34.6
②
③④
①
11.3
20.7%
10.76.08.2
⑤
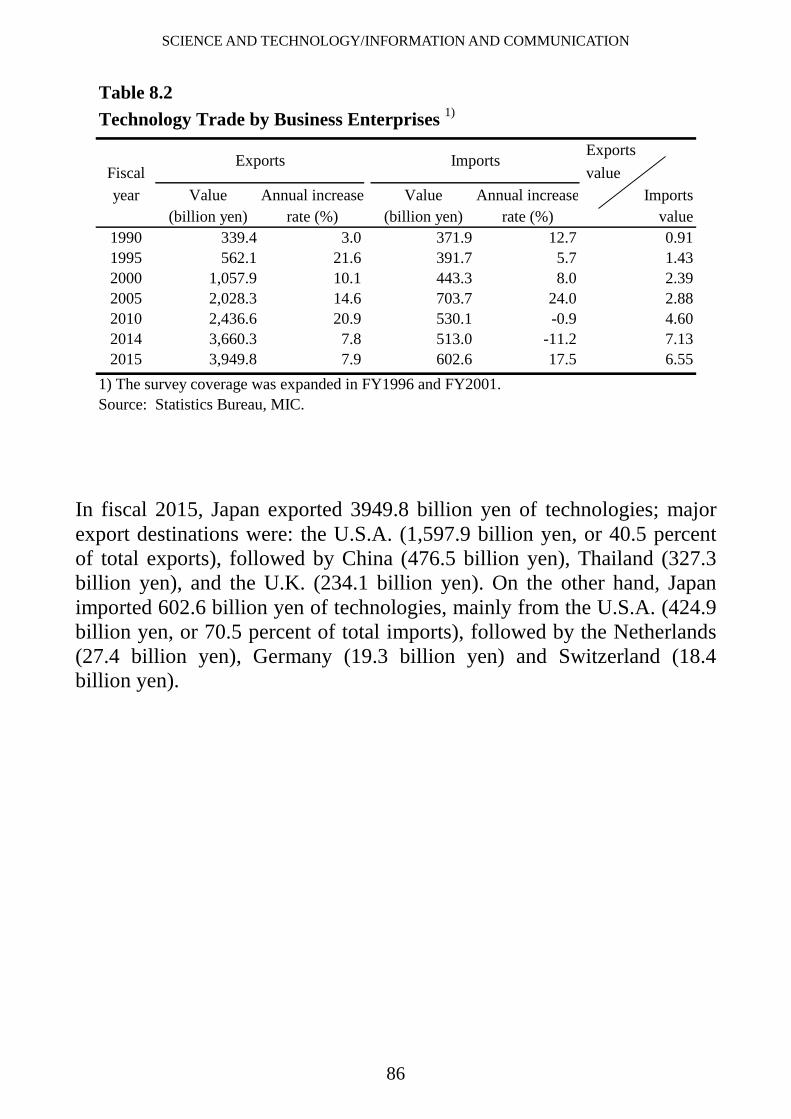
SCIENCE AND TECHNOLOGY/INFORMATION AND COMMUNICATION
86
In fiscal 2015, Japan exported 3949.8 billion yen of technologies; major export destinations were: the U.S.A. (1,597.9 billion yen, or 40.5 percent of total exports), followed by China (476.5 billion yen), Thailand (327.3 billion yen), and the U.K. (234.1 billion yen). On the other hand, Japan imported 602.6 billion yen of technologies, mainly from the U.S.A. (424.9 billion yen, or 70.5 percent of total imports), followed by the Netherlands (27.4 billion yen), Germany (19.3 billion yen) and Switzerland (18.4 billion yen).
Table 8.2Technology Trade by Business Enterprises 1)
ExportsFiscal valueyear Value Annual increase Value Annual increase Imports
(billion yen) rate (%) (billion yen) rate (%) value1990 339.4 3.0 371.9 12.7 0.911995 562.1 21.6 391.7 5.7 1.432000 1,057.9 10.1 443.3 8.0 2.392005 2,028.3 14.6 703.7 24.0 2.882010 2,436.6 20.9 530.1 -0.9 4.602014 3,660.3 7.8 513.0 -11.2 7.132015 3,949.8 7.9 602.6 17.5 6.55
1) The survey coverage was expanded in FY1996 and FY2001.Source: Statistics Bureau, MIC.
Exports Imports

SCIENCE AND TECHNOLOGY/INFORMATION AND COMMUNICATION
87
2. Patents
The total number of patent applications remained robust in and after 1998 as more than 400,000 applications were filed every year, but a gradual drop has been seen since 2006. It fell significantly in 2009. In 2015, there were 318,721 applications (down 2.2 percent from the previous year).
Table 8.3Patents
(Cases)1995 2000 2005 2010 2014 2015
Applications ........................... 369,215 436,865 427,078 344,598 325,989 318,721Registrations .......................... 109,100 125,880 122,944 222,693 227,142 189,358Existing vested rights ............. 681,459 1,040,607 1,123,055 1,423,432 1,920,490 1,946,568Source: Japan Patent Office.
Item
Figure 8.2Composition of Technology Trade by Major Country/Region(FY2015)
Source: Statistics Bureau, MIC.
U.K. 5.9
3949.8billion yen
40.5%23.1
12.1
Exports (receipts)
China
Others U.S.A.
602.6billion yen
70.5%
Imports (payments)
18.7Others
8.3
Mexico 2.8
India 3.6
Indonesia3.7
Thailand
Germany3.2
Switzerland3.1
U.S.A.
Netherlands4.5
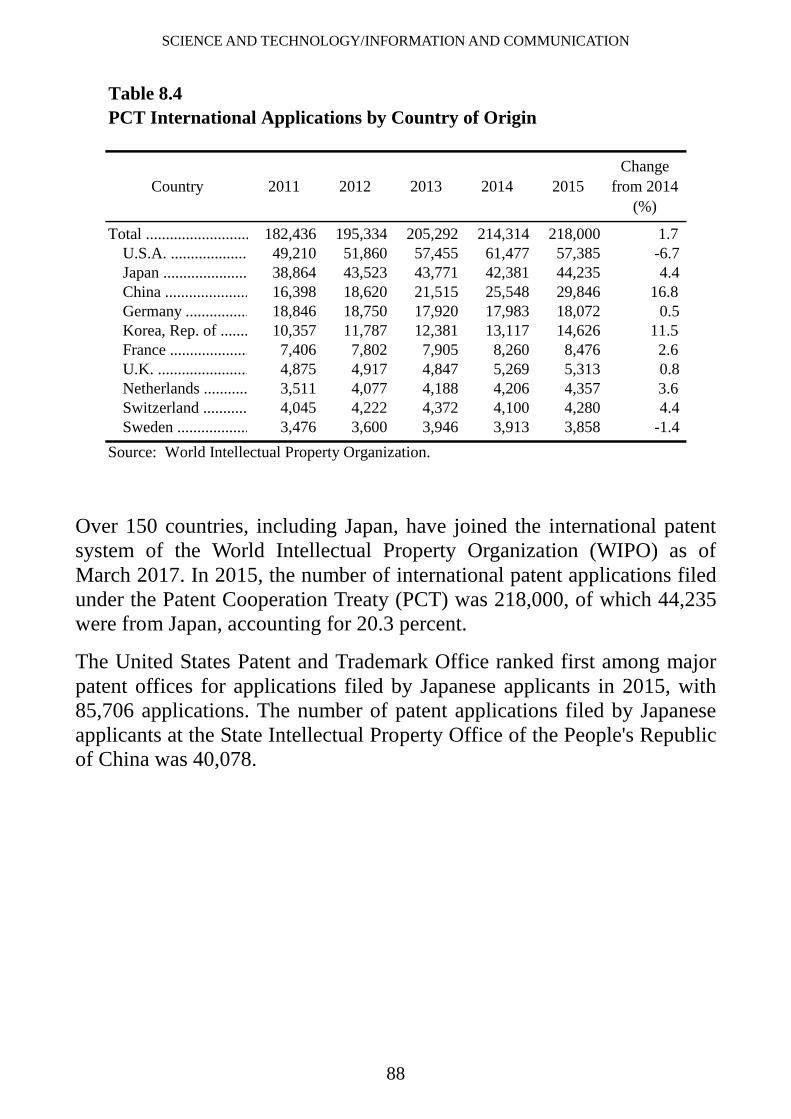
SCIENCE AND TECHNOLOGY/INFORMATION AND COMMUNICATION
88
Over 150 countries, including Japan, have joined the international patent system of the World Intellectual Property Organization (WIPO) as of March 2017. In 2015, the number of international patent applications filed under the Patent Cooperation Treaty (PCT) was 218,000, of which 44,235 were from Japan, accounting for 20.3 percent.
The United States Patent and Trademark Office ranked first among major patent offices for applications filed by Japanese applicants in 2015, with 85,706 applications. The number of patent applications filed by Japanese applicants at the State Intellectual Property Office of the People's Republic of China was 40,078.
Table 8.4PCT International Applications by Country of Origin
182,436 195,334 205,292 214,314 218,000 1.7U.S.A. ................... 49,210 51,860 57,455 61,477 57,385 -6.7Japan ..................... 38,864 43,523 43,771 42,381 44,235 4.4China ..................... 16,398 18,620 21,515 25,548 29,846 16.8Germany ................ 18,846 18,750 17,920 17,983 18,072 0.5Korea, Rep. of ....... 10,357 11,787 12,381 13,117 14,626 11.5France .................... 7,406 7,802 7,905 8,260 8,476 2.6U.K. ....................... 4,875 4,917 4,847 5,269 5,313 0.8Netherlands ........... 3,511 4,077 4,188 4,206 4,357 3.6Switzerland ........... 4,045 4,222 4,372 4,100 4,280 4.4Sweden .................. 3,476 3,600 3,946 3,913 3,858 -1.4
Source: World Intellectual Property Organization.
2012 2013 2014 2015Change
from 2014(%)
Total ..........................
Country 2011

SCIENCE AND TECHNOLOGY/INFORMATION AND COMMUNICATION
89
3. Information and Communication
(1) Diffusion of the Internet
The population of Internet users, the commercial use of which began in 1993, continues to increase. Since the end of 2013, the number of people who used the Internet over the past year as of the end of 2015 (individuals who are 6 years of age and older; Internet connected equipment includes any and all types of Internet connection devices, including PCs, cell phones, PHS (personal handyphone systems), smartphones, tablets and game consoles) exceeded 100 million people. According to the individual Internet usage rate by age group, the usage rate exceeded 90 percent in the
Figure 8.3Changes in Patent Applications with Major Offices by Japanese Applicants
EPO: European Patent Office; KIPO: Korean Intellectual Property Office; SIPO: State Intellectual Property Office of the People's Republic of China; USPTO: United States Patent and Trademark Office.Source: Japan Patent Office.
0
10,000
20,000
30,000
40,000
50,000
60,000
70,000
80,000
90,000
100,000
2005 06 07 08 09 10 11 12 13 14 15
USPTO
SIPO
EPO
KIPO

SCIENCE AND TECHNOLOGY/INFORMATION AND COMMUNICATION
90
age group of 13 to 59 year olds, and there is also a trend of expansion of usage by the age group of 60 to 79 year olds.
According to the status of Internet use by terminal by age group as of the end of 2015, the usage rate of PCs was the highest (56.8 percent), followed by smartphones (54.3 percent). Figures for the rate of Internet use by terminal by age group show that over 70 percent of people in each age group between 13 and 49 years use smartphones, surpassing usage of PCs.
0
20
40
60
80
100
Total 6-12 13-19 20-29 30-39 40-49 50-59 60-64 65-69 70-79 80 andover
%
2015
Figure 8.4Trends in Internet Usage Rate by Age Group 1)
1) Ages 6 years and over.Source: Ministry of Internal Affairs and Communications.
Total
2005
Table 8.5Status of Internet Use by Terminal by Age Group (2015)
%
Item Usagerate
6-12years 13-19 20-29 30-39 40-49 50-59 60 and
overPCs .................................. 56.8 35.8 57.4 73.3 68.9 71.5 64.9 38.3Mobile phones ................ 15.8 5.6 7.4 8.7 13.0 17.5 20.8 20.6Smartphones ................... 54.3 32.8 78.3 91.3 84.6 73.6 54.8 15.9Tablet Terminals ................ 18.3 27.6 23.5 20.4 23.5 24.5 20.1 8.1Source: Ministry of Internal Affairs and Communications.

SCIENCE AND TECHNOLOGY/INFORMATION AND COMMUNICATION
91
As of the end of 2015, 16.2 percent of enterprises had introduced teleworking. The most frequent teleworking pattern was mobile work, 60.3 percent, followed by working from home, 22.9 percent and working from a satellite office, 15.8 percent.
(2) Progress of Communication Technologies
The number of broadband (connection) subscribers as of the end of March 2016 was 160 million. Among the number of broadband subscribers, those with subscriptions for 3.9-4G mobile phones (LTE) were the highest, amounting to 87 million subscriptions and accounting for 54.5 percent of the total. Those with BWA (Broadband Wireless Access) service (access service connecting to networks via broadband wireless access systems using the 2.5GHz band [WiMAX, etc.]) was the second highest, with 35 million subscribers, making up 21.9 percent of the total.
Meanwhile, IP phone services (voice phone services that use Internet Protocol technology across part or all of the communication network), which use broadband circuits as access lines, entered full-scale use between 2002 and 2003. As of the end of March 2016, the total number of IP phone subscribers was 38 million.
Table 8.6Subscribers to Telecommunications Services 1)
(Thousands)Item 1995 2000 2005 2010 2015 2016
Public phones (NTT 2) only) ......... 801 736 442 283 184 171Fixed phone services .................... 59,936 55,547 51,626 37,918 24,081 21,703Mobile phone 3) ............................. 4,331 56,846 91,474 116,295 157,857 160,478IP phone ........................................ - - 8,305 23,172 35,641 38,456ISDN (Integrated Services Digital Network) ............................ 344 6,683 7,981 5,421 3,652 3,374DSL (Digital Subscriber Line) ...... - 0 13,676 9,735 3,753 3,204Cable Internet ................................ - 216 2,961 5,314 6,430 6,732FTTH (Fiber To The Home) ......... - - 2,890 17,802 26,607 27,868BWA (Broadband Wireless Access) .. - - - 153 19,466 35,2083.9-4G mobile phones (LTE) ............ - - - - 67,781 87,390International phone calls, sent and received ....................... 599,400 801,200 # 1,103,700 1,101,600 599,300 500,6001) End of March. 2) Nippon Telegraph and Telephone Corporation.3) Cell phones and PHS (Personal Handyphone System). Source: Ministry of Internal Affairs and Communications.

SCIENCE AND TECHNOLOGY/INFORMATION AND COMMUNICATION
92
In 2015, the number of fixed broadband subscribers in Japan was 39 million, the third-largest after China, 277 million and the U.S.A., 101 million.
(3) Telephones
The number of fixed phone service subscription contracts has continued to decrease in recent years. As of the end of March 2016, the number of fixed phone subscribers was 22 million (down 9.9 percent from the previous year). Meanwhile, the number of mobile phone subscribers (cell phones and personal handyphone systems) totaled 158 million at the end of March 2015, marking a rise by 1.7 percent year-on-year to 160 million at the end of March 2016.
0 20 40 60 80 100 120 140 160 180 200 220 240 260 280
China
U.S.A.
Japan
Germany
Russia
France
Brazil
U.K.
Korea, Rep. of
India
Millions
Figure 8.5International Comparison of Fixed Broadband Subscribers (2015)
Source: International Telecommunication Union.

SCIENCE AND TECHNOLOGY/INFORMATION AND COMMUNICATION
93
(4) Postal Service
As of the end of March 2017, Japan Post Co., Ltd. had 24,421 post offices nationwide. In fiscal 2016, post offices handled 21.9 billion items of domestic mail (including parcels), which was a 0.7 percent decrease from the previous fiscal year. Furthermore, the total quantity of international mail (letters, Express Mail Services [EMS], and parcels) sent in fiscal 2016 amounted to 46.5 million items, a decrease of 4.9 percent from the previous fiscal year.
Table 8.7Postal Services
(Millions)FY1995 FY2000 FY2005 FY2010 FY2015 FY2016
DomesticLetters .................... 24,262.9 26,114.4 22,666.1 19,757.9 17,981.0 17,684.0Parcels .................... 400.2 310.5 2,075.0 2,968.4 4,052.4 4,195.3
InternationalSent ........................ 122.8 106.0 77.5 54.2 48.9 46.5
Letters 1) ............. 119.9 104.3 76.1 52.8 44.1 42.3Parcels ................ 2.9 1.7 1.5 1.4 4.8 4.1
1) Including Express Mail Services (EMS). Source: Japan Post Co., Ltd.
Item
0
20
40
60
80
100
120
140
160
180
1999 00 01 02 03 04 05 06 07 08 09 10 11 12 13 14 15 16
Figure 8.6Telephone Service Subscribers
1) Subscribers of cell phones and PHS (Personal Handyphone System). Source: Ministry of Internal Affairs and Communications.
Millions
Fixed phonesMobile phones 1)


![Japan & World’s medical industry gathered here! · [China Health Statistical Yearbook, China Health and Family Planning Statistical Yearbook] ... "2013 Annual Report on the Survey](https://img.pdfslide.net/doc/110x75/60205ce470913614931fb427/japan-worldas-medical-industry-gathered-here-china-health-statistical.jpg)


![STATISTICAL RESEARCH DIVISION SERIES - Census.gov · STATISTICAL RESEARCH DIVISION REPORT SERIES ... Tokyo, Japan 106 ABSTRACT: ... Write X = [Zly] as the (N-L)x(L+l)](https://img.pdfslide.net/doc/110x75/5b4dfe597f8b9a9f3b8b516c/statistical-research-division-series-statistical-research-division-report.jpg)


