Embed Size (px)
DESCRIPTION
Statistical Inference: A Review of Chapters 12 and 13. Chapter 14. 14.1 Introduction. In this chapter we build a framework that helps decide which technique (or techniques) should be used in solving a problem. Logical flow chart of techniques for Chapters 12 and 13 is presented next. - PowerPoint PPT Presentation
Citation preview
1
Statistical Inference:A Review of
Chapters 12 and 13
Statistical Inference:A Review of
Chapters 12 and 13
Chapter 14

2
14.1 Introduction
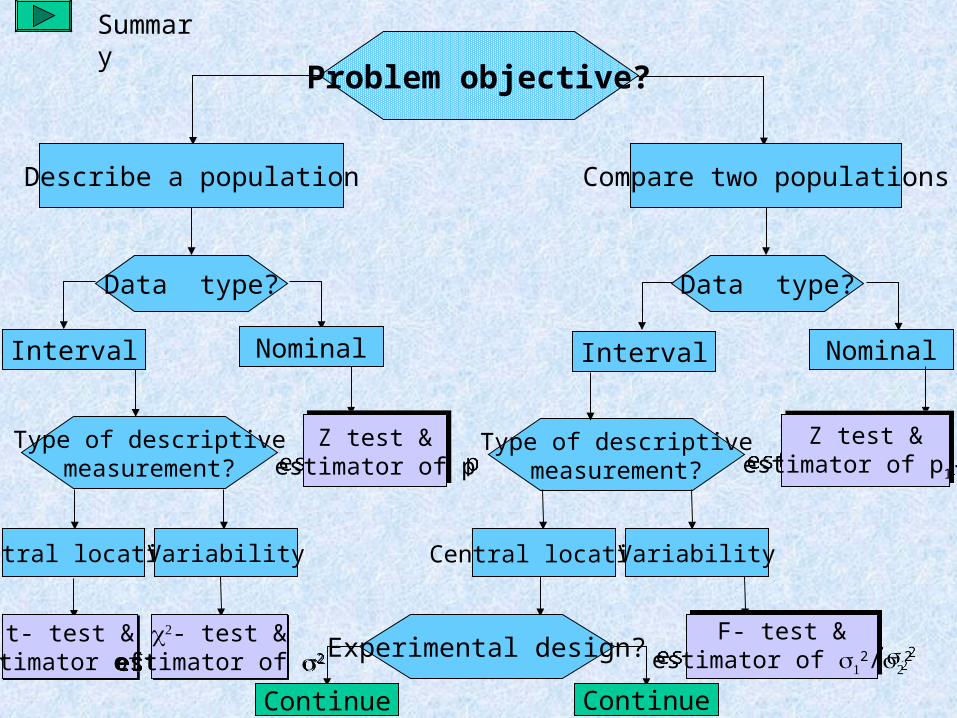
• In this chapter we build a framework that helps decide which technique (or techniques) should be used in solving a problem.
• Logical flow chart of techniques for Chapters 12 and 13 is presented next.
3
Problem objective?
Describe a population Compare two populations
Data type? Data type?
Interval Nominal Interval Nominal
Type of descriptivemeasurement?
Type of descriptivemeasurement?
Z test &estimator of p
Z test &estimator of p
Z test &estimator of p1-p2
Z test &estimator of p1-p2
Central location Variability Central location Variability
t- test &estimator of
t- test &estimator of
- test &estimator of 2
- test &estimator of 2
F- test &estimator of
2/2
F- test &estimator of
2/2Experimental design?
Continue Continue
Summary
4
Continue Continue
3
Problem objective?
Describe a population Compare two populations
Data type? Data type?
Interval Nominal Interval Nominal
Type of descriptivemeasurement?
Type of descriptivemeasurement?
Z test &estimator of p
Z test &estimator of p
Z test &estimator of p1-p2
Z test &estimator of p1-p2
Central location Variability Central location Variability
t- test &estimator of
t- test &estimator of
- test &estimator of 2
- test &estimator of 2
F- test &estimator of
2/2
F- test &estimator of
2/2Experimental design?
Continue Continue
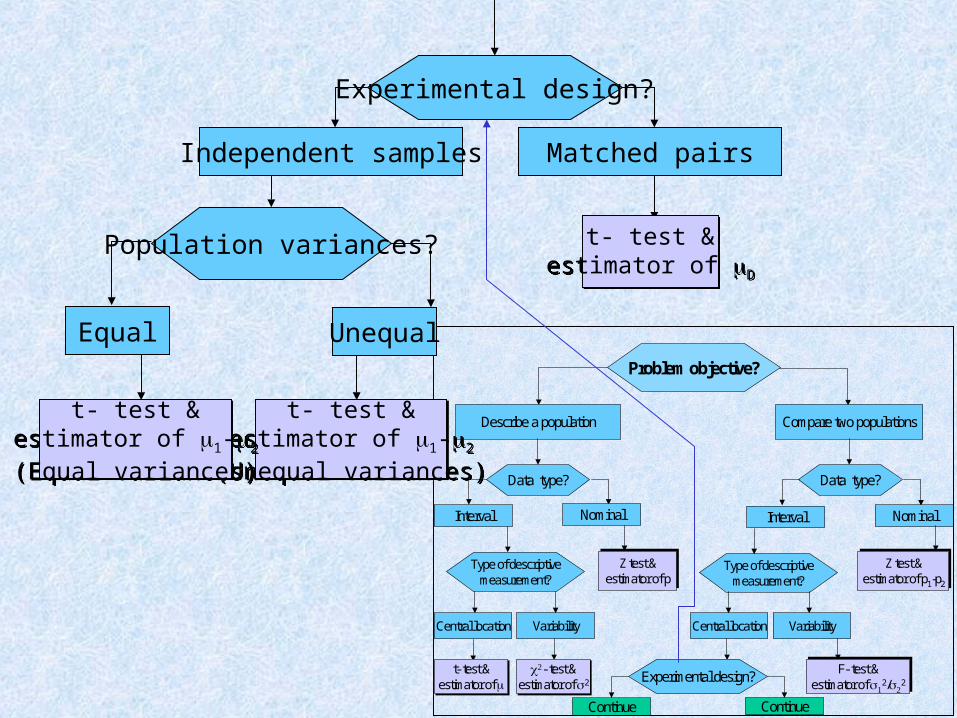
t- test &estimator of 1-2
(Unequal variances)
t- test &estimator of 1-2
(Unequal variances)
Population variances? t- test &estimator of D
t- test &estimator of D
t- test &estimator of 1-2
(Equal variances)
t- test &estimator of 1-2
(Equal variances)
Independent samples Matched pairs
Experimental design?
UnequalEqual
5
Identifying the appropriate technique
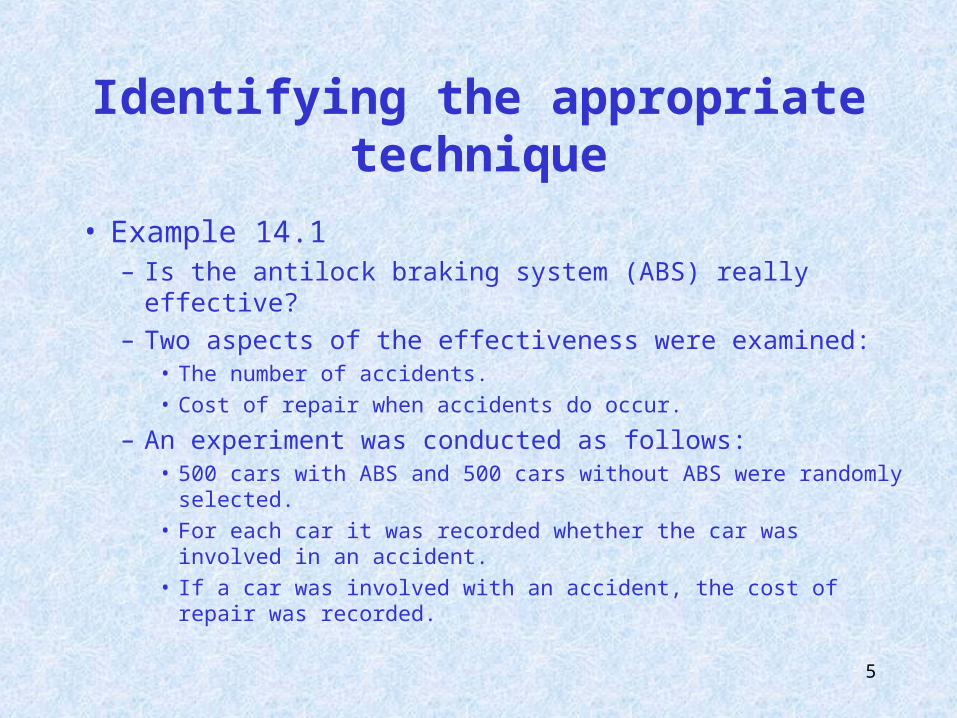
• Example 14.1– Is the antilock braking system (ABS) really effective?– Two aspects of the effectiveness were examined:
• The number of accidents. • Cost of repair when accidents do occur.
– An experiment was conducted as follows:• 500 cars with ABS and 500 cars without ABS were randomly selected.• For each car it was recorded whether the car was involved in an
accident.• If a car was involved with an accident, the cost of repair was recorded.
6
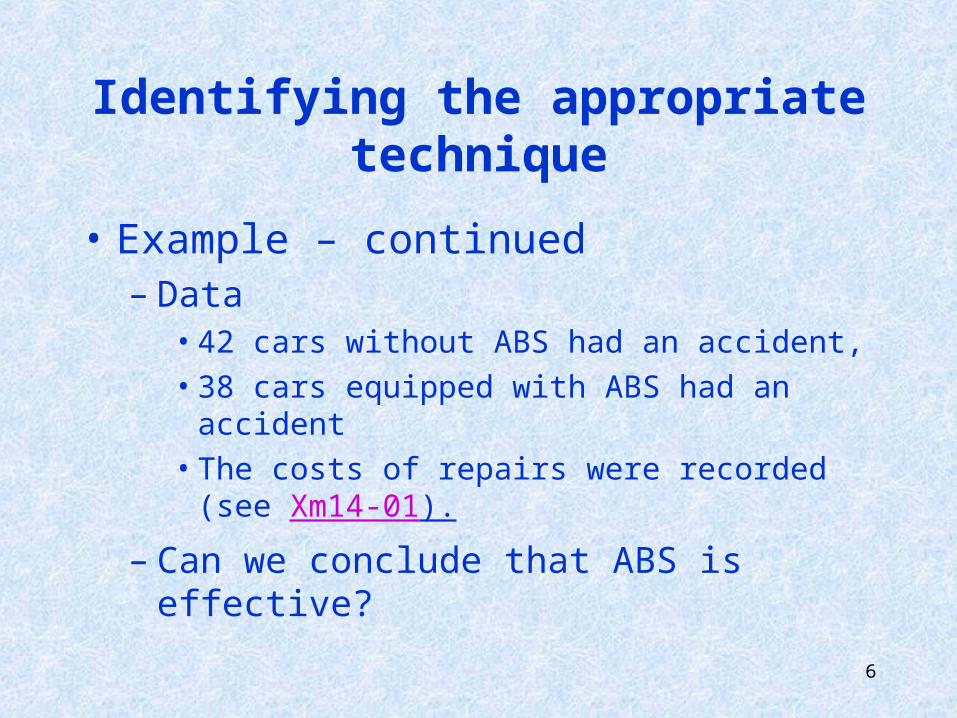
• Example – continued– Data
• 42 cars without ABS had an accident,• 38 cars equipped with ABS had an accident• The costs of repairs were recorded (see Xm14-01).
– Can we conclude that ABS is effective?
Identifying the appropriate technique
7
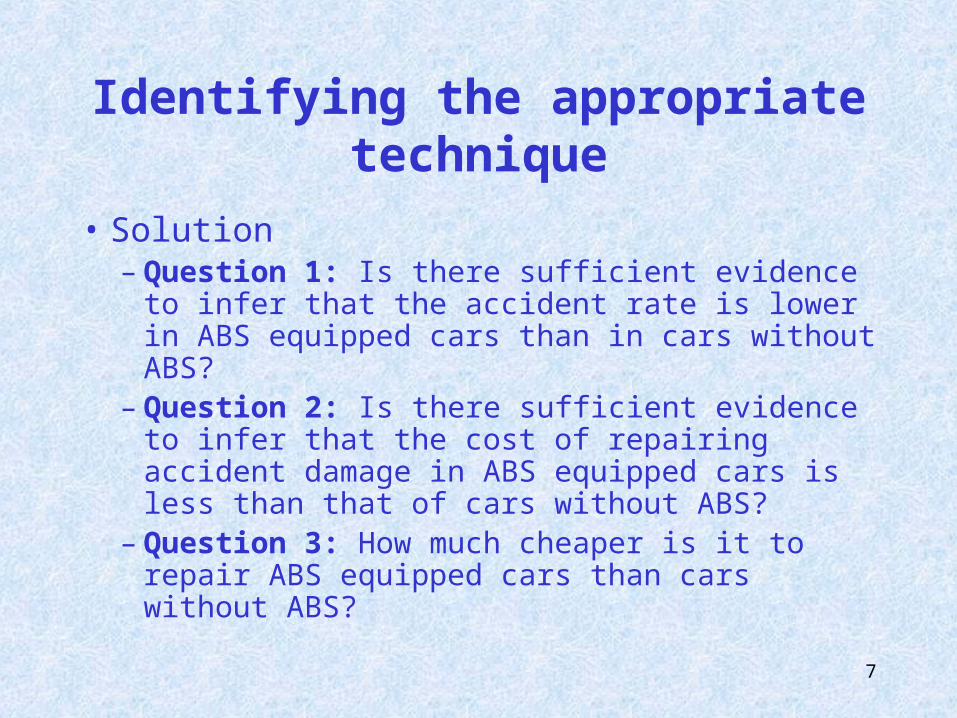
• Solution– Question 1: Is there sufficient evidence to infer that
the accident rate is lower in ABS equipped cars than in cars without ABS?
– Question 2: Is there sufficient evidence to infer that the cost of repairing accident damage in ABS equipped cars is less than that of cars without ABS?
– Question 3: How much cheaper is it to repair ABS equipped cars than cars without ABS?
Identifying the appropriate technique
8
Question 1: Compare the accident rates
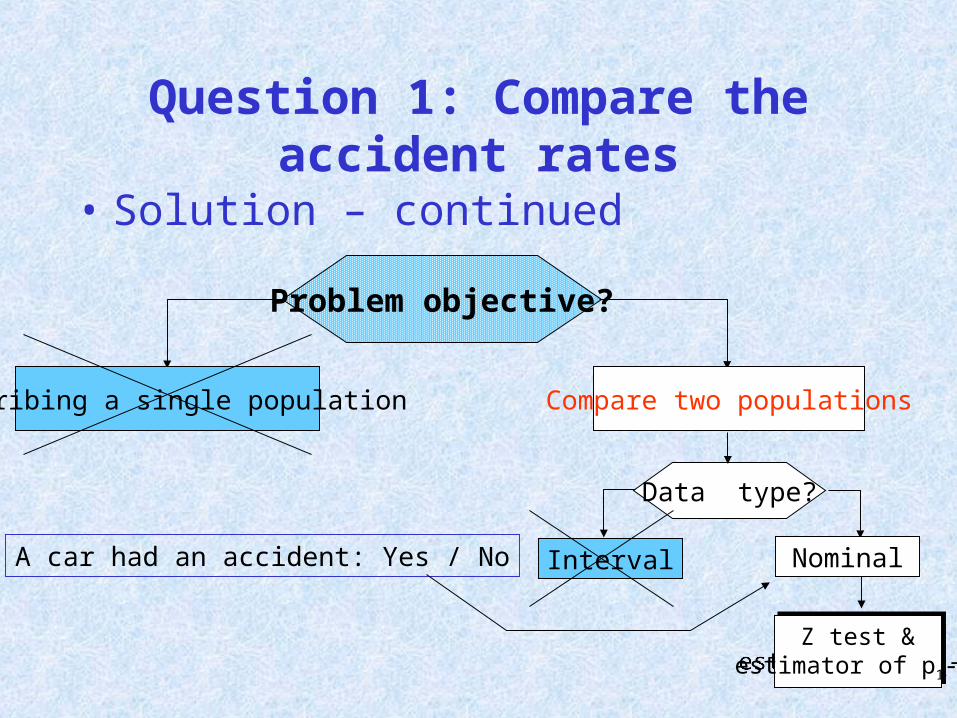
• Solution – continued
Problem objective?
Describing a single population Compare two populations
Data type?
Interval Nominal
Z test &estimator of p1-p2
Z test &estimator of p1-p2
A car had an accident: Yes / No
9
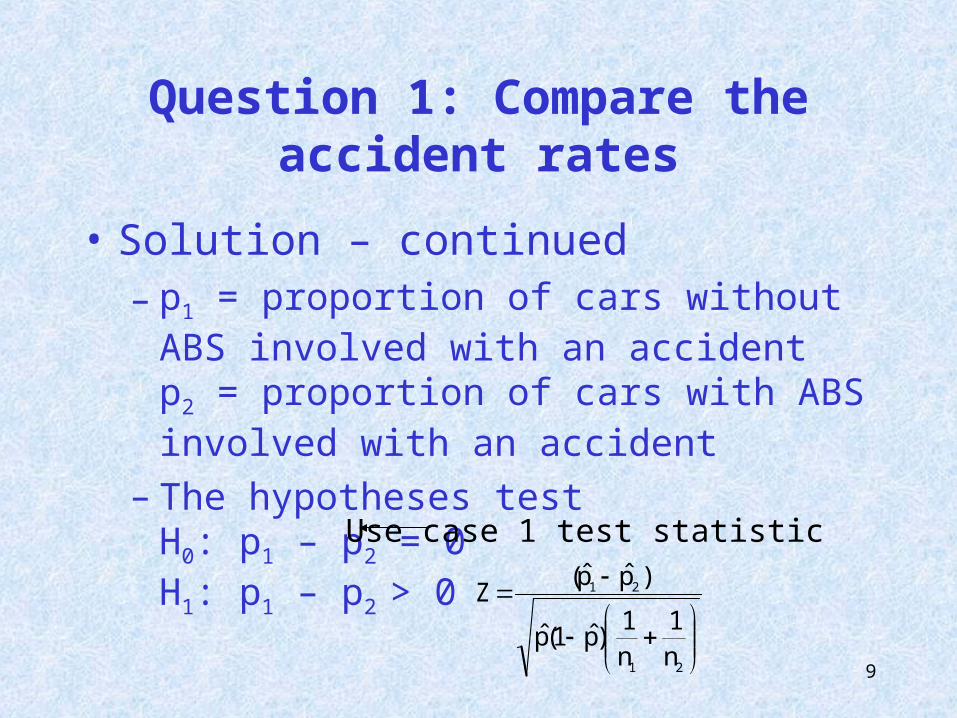
• Solution – continued– p1 = proportion of cars without ABS involved with an
accidentp2 = proportion of cars with ABS involved with an accident
– The hypotheses testH0: p1 – p2 = 0H1: p1 – p2 > 0
Use case 1 test statistic
21
21
n1
n1
)p̂1(p̂
)p̂p̂(Z
Question 1: Compare the accident rates
10
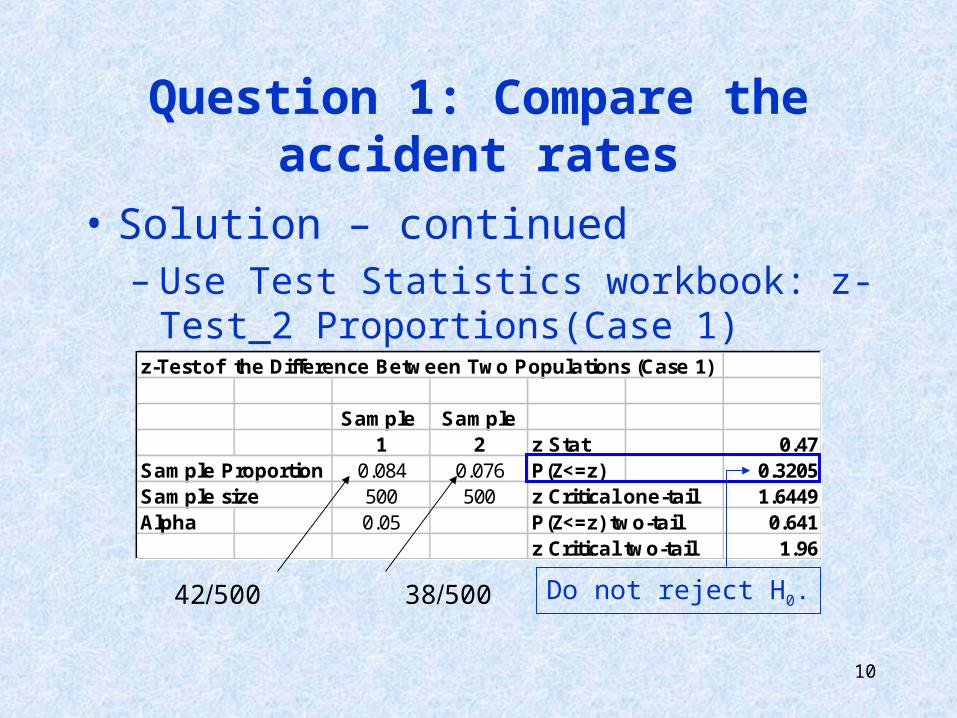
• Solution – continued – Use Test Statistics workbook: z-Test_2
Proportions(Case 1) worksheetz-Test of the Difference Between Two Populations (Case 1)
Sample Sample1 2 z Stat 0.47
Sample Proportion 0.084 0.076 P(Z<=z) 0.3205Sample size 500 500 z Critical one-tail 1.6449Alpha 0.05 P(Z<=z) two-tail 0.641
z Critical two-tail 1.96
42500 38500 Do not reject H0.
Question 1: Compare the accident rates
11
Question 2: Compare the mean repair costs per accident
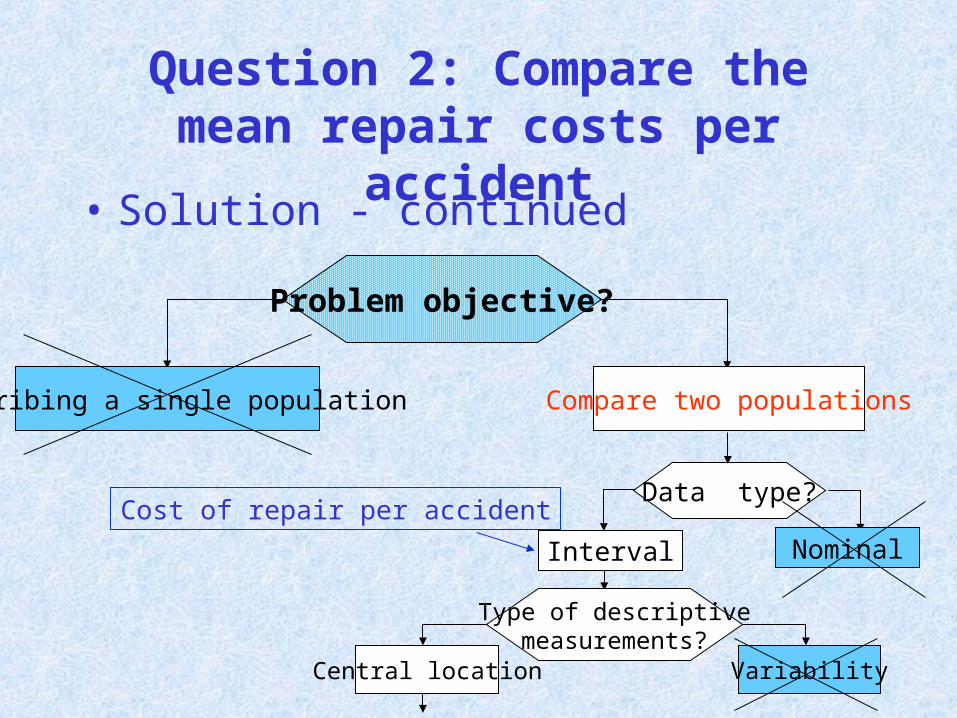
• Solution - continued
Problem objective?
Describing a single population Compare two populations
Data type?
Interval Nominal
Type of descriptivemeasurements?
Central location Variability
Cost of repair per accident
12
Equal
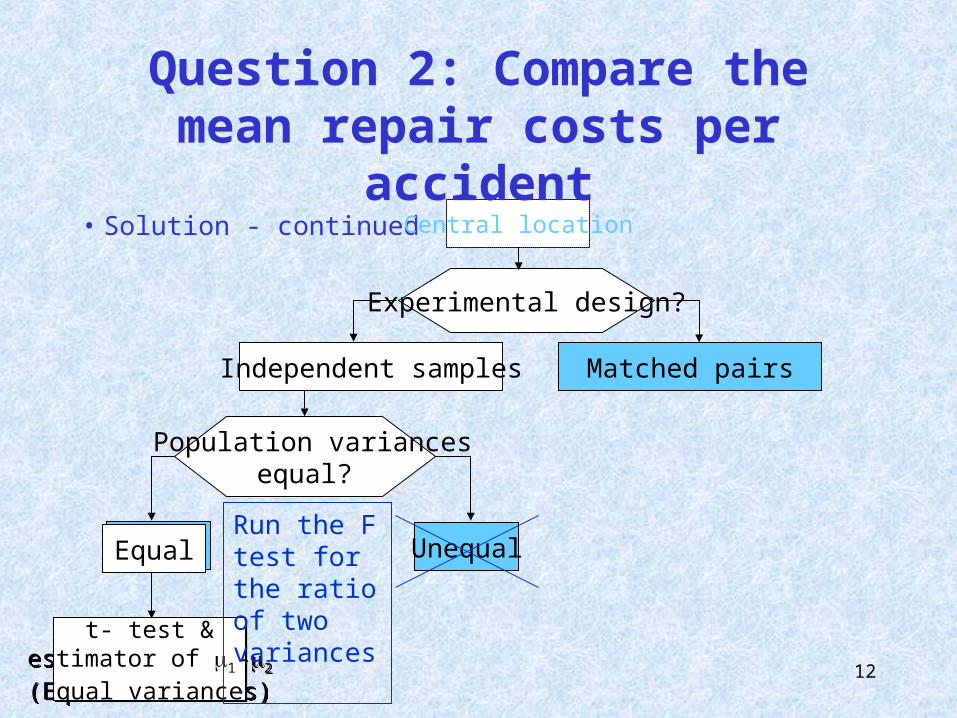
• Solution - continued
Population variancesequal?
Independent samples Matched pairs
Unequal
Experimental design?
Central location
t- test &estimator of 1-2
(Equal variances)
t- test &estimator of 1-2
(Equal variances)
Run the F test for the ratio of two variances.
Equal
Question 2: Compare the mean repair costs per accident
13
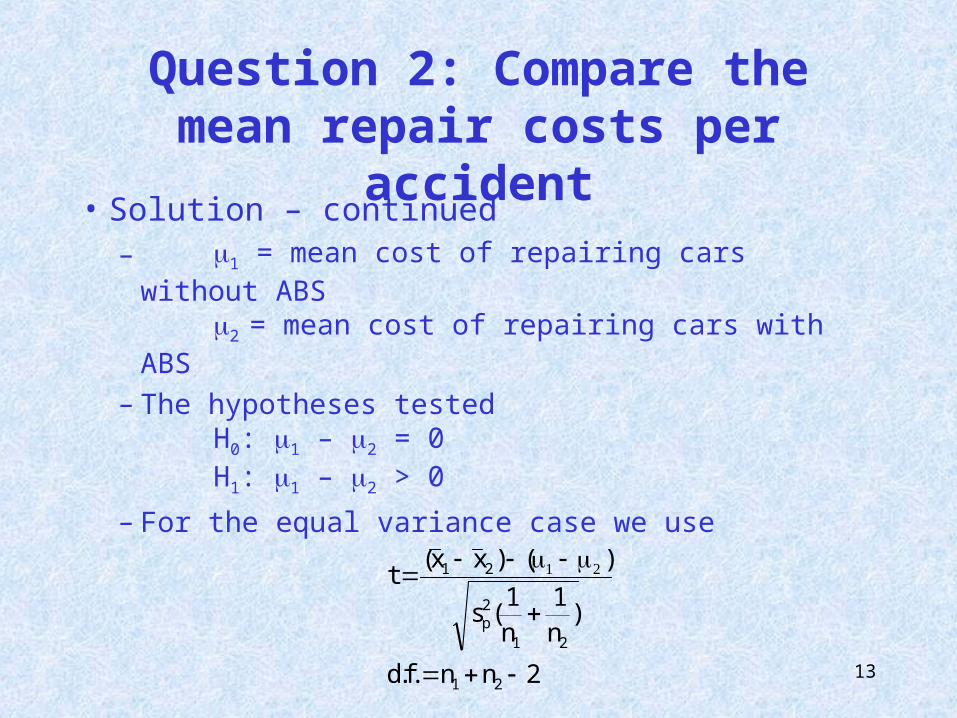
• Solution – continued– 1 = mean cost of repairing cars without ABS
2 = mean cost of repairing cars with ABS– The hypotheses tested
H0: 1 – 2 = 0H1: 1 – 2 > 0
– For the equal variance case we use
2nn.f.d
)n1
n1
(s
)()xx(t
21
21
2p
21
Question 2: Compare the mean repair costs per accident
14
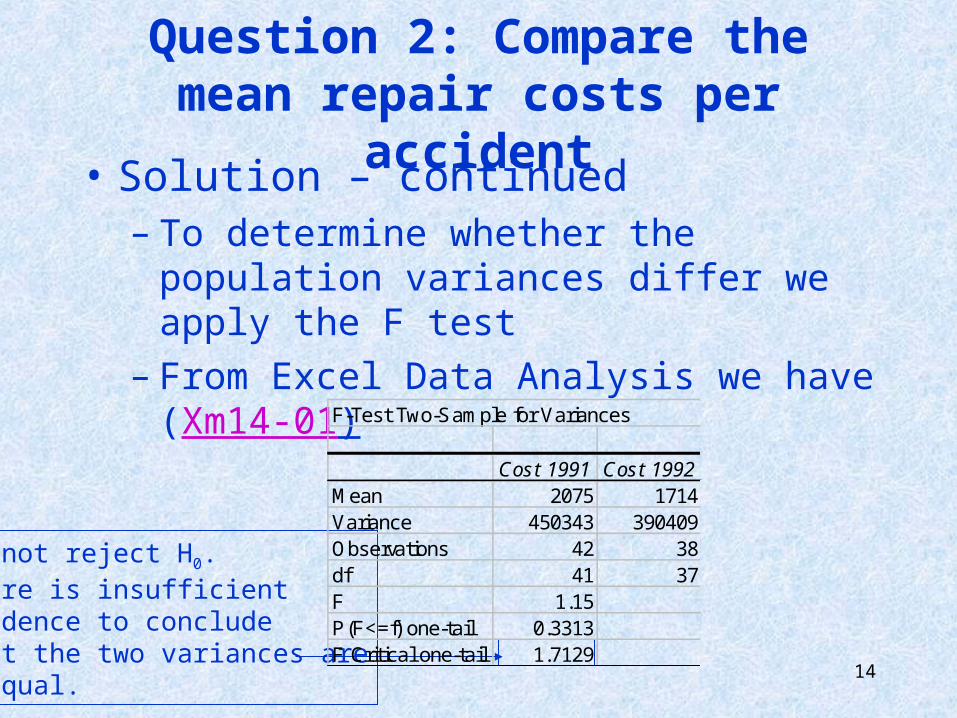
• Solution – continued– To determine whether the population variances differ
we apply the F test– From Excel Data Analysis we have (Xm14-01)
Do not reject H0.There is insufficientevidence to concludethat the two variances areunequal.
Question 2: Compare the mean repair costs per accident
F-Test Two-Sample for Variances
Cost 1991 Cost 1992Mean 2075 1714Variance 450343 390409Observations 42 38df 41 37F 1.15P(F<=f) one-tail 0.3313F Critical one-tail 1.7129
15
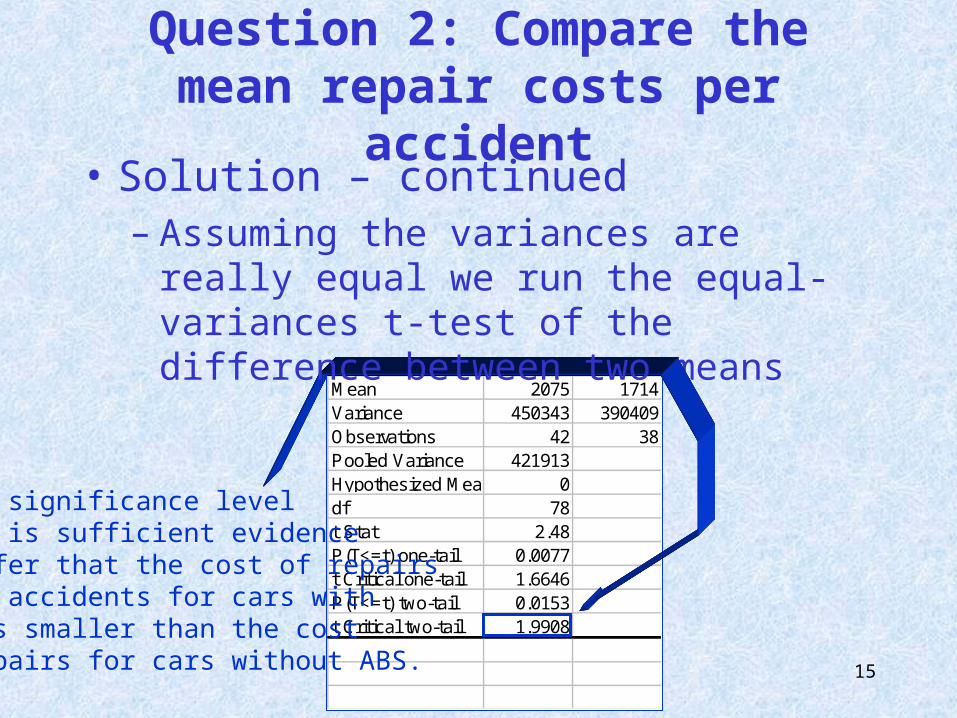
Mean 2075 1714Variance 450343 390409Observations 42 38Pooled Variance 421913Hypothesized Mean Difference0df 78t Stat 2.48P(T<=t) one-tail 0.0077t Critical one-tail 1.6646P(T<=t) two-tail 0.0153t Critical two-tail 1.9908
• Solution – continued – Assuming the variances are really equal we run the
equal-variances t-test of the difference between two means
At 5% significance levelthere is sufficient evidenceto infer that the cost of repairsafter accidents for cars with ABS is smaller than the cost of repairs for cars without ABS.
Question 2: Compare the mean repair costs per accident
16
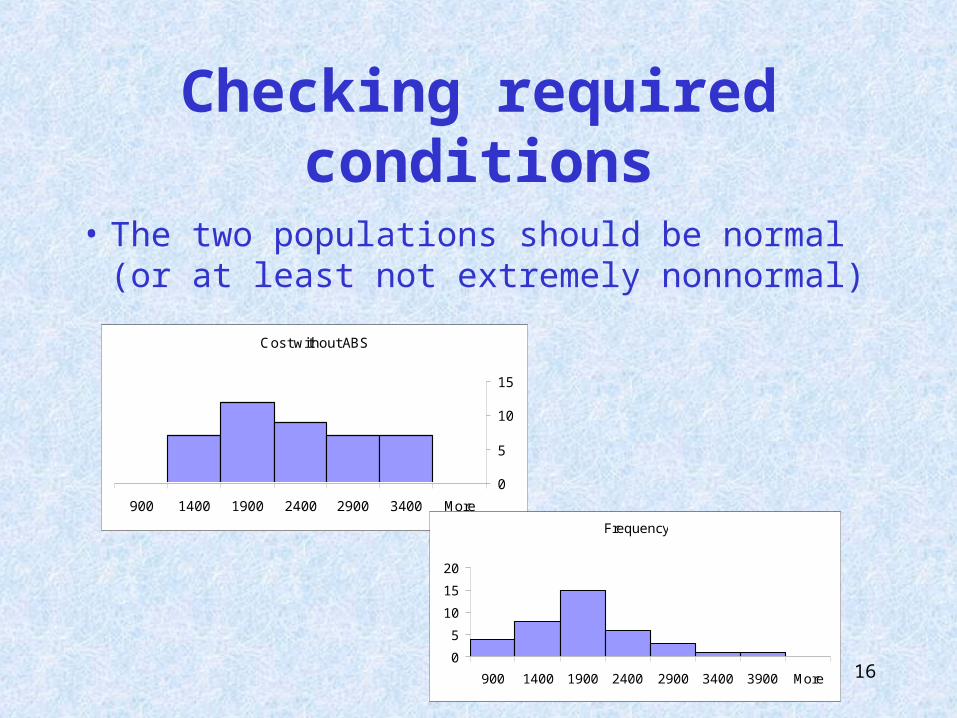
Checking required conditions
• The two populations should be normal (or at least not extremely nonnormal)
Cost without ABS
0
5
10
15
900 1400 1900 2400 2900 3400 More
Frequency
0
5
10
15
20
900 1400 1900 2400 2900 3400 3900 More
17
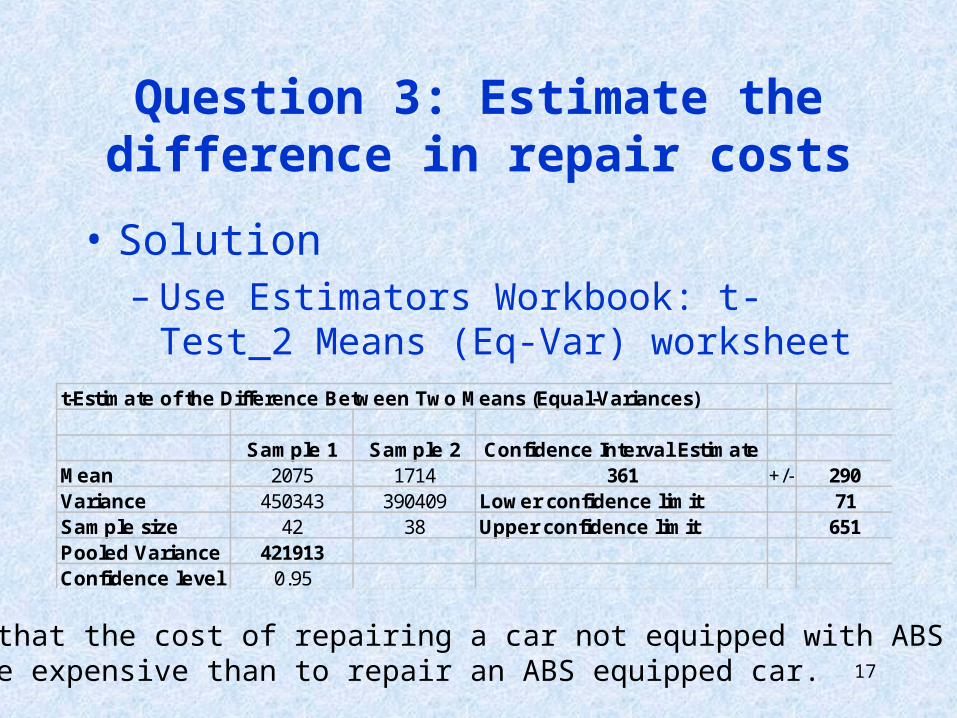
Question 3: Estimate the difference in repair costs
• Solution– Use Estimators Workbook: t-Test_2 Means (Eq-Var)
worksheett-Estimate of the Difference Between Two Means (Equal-Variances)
Sample 1 Sample 2 Confidence Interval EstimateMean 2075 1714 361 +/-' 290Variance 450343 390409 Lower confidence limit 71Sample size 42 38 Upper confidence limit 651Pooled Variance 421913Confidence level 0.95
We estimate that the cost of repairing a car not equipped with ABS is between $71 and $651 more expensive than to repair an ABS equipped car.