Embed Size (px)
Citation preview
www.statssa.gov.za [email protected] T +27 12 310 8911 F +27 12 310 8500 Private Bag X44, Pretoria, 0001, South Africa ISIbalo House, Koch Street, Salvokop, Pretoria, 0002
Statistical release P0305
Recorded live births
2013−2015
Embargoed until: 27 October 2016
10:00 ENQUIRIES: FORTHCOMING ISSUE: EXPECTED RELEASE DATE:
User Information Services 2016 August 2017
Tel.: 012 310 8600
STATISTICS SOUTH AFRICA P0305
Recorded live births, 2013−2015
i
Preface
This statistical release primarily presents information on recorded live births in South Africa, for births that occurred over the years 2013 to 2015 and were registered during each of the years’ processing phase. It also provides information on live birth occurrences from 1993 to 2012 to show trends and patterns in the occurrence and registration of live births. The release is based on births registered and collated through the national birth registration system that is maintained by the Department of Home Affairs.
PJ Lehohla Statistician-General
STATISTICS SOUTH AFRICA P0305
Recorded live births, 2013−2015
ii
Contents
Preface ..................................................................................................................................................................... i
1. Introduction ............................................................................................................................................... 1
2. Data and methods ..................................................................................................................................... 1
2.1 Data source ................................................................................................................................................. 1
2.2 Assessment of the quality of data ............................................................................................................... 2
2.3 Data analysis .............................................................................................................................................. 2
3. Birth registrations ..................................................................................................................................... 3
3.1 Trends in birth registration .......................................................................................................................... 3
3.2 Birth registrations by selected variables ..................................................................................................... 4
4. Birth occurrences ..................................................................................................................................... 6
4.1 Birth occurrences as at 29 February 2016 ................................................................................................. 7
4.2 Birth occurrences registered within 30 days from date of birth .................................................................. 8
4.3 Birth occurrences as at 02 July 2016........................................................................................................ 10
4.4 Baby forenames and surnames in South Africa, 2015 ............................................................................. 10
5. Concluding remarks ............................................................................................................................... 11
References ................................................................................................................................................................. 12
Tables .................................................................................................................................................................. 13
Table 1: Revised birth registrations for 2013−2015 ................................................................................................ 13
Table 2: Distribution of birth registrations by the number of days it took to register the birth, 2013−2015 ............ 13
Table 3: Birth registrations by status of registration, South Africa: 1993–2015 ...................................................... 14
Table 4: Birth registrations by age of the mother and status of registration, South Africa: 2013–2015 ................. 15
Table 5: Birth occurrences by year of birth and reference period, South Africa: 1993–2015 ................................. 16
Table 6: Birth occurrences (as at end of February 2016) by year of birth occurrence and year of birth registration, South Africa: 1993–2015 ...................................................................................................... 17
Table 7A: Number of births registered within 30 days of occurrence by month of birth occurrence and month of birth registration, South Africa: 2013 ......................................................................................... 18
Table 7B: Number of births registered within 30 days of occurrence by month of birth occurrence and month of birth registration, South Africa: 2014 ......................................................................................... 18
Table 7C: Number of births registered within 30 days of occurrence by month of birth occurrence and month of birth registration, South Africa: 2015 ......................................................................................... 19
Table 8: Number and percentage of births by age of mother, South Africa: 2013–2015 ....................................... 19
Table 9: Birth occurrences (as at 29 February 2016) by sex and year of birth, South Africa: 1993−2015 ................................................................................................................................................ 20
Table 10: Distribution of the top ten baby forenames and surnames, South Africa: 2015 ....................................... 20
STATISTICS SOUTH AFRICA P0305
Recorded live births, 2013−2015
iii
Figures .................................................................................................................................................................. 21
Figure 1: Birth registrations by status of registration, South Africa: 1993–2015 ...................................................... 21
Figure 2: Late birth registrations by year of birth, South Africa: 1981–2015 ........................................................... 22
Figure 3: Birth registrations by age of the mother and status of registration, South Africa: 2013–2015 ................. 23
Figure 4A: Birth registrations by province of birth registration and status of registration, South Africa: 2013 ........... 24
Figure 4B: Birth registrations by province of birth registration and status of registration, South Africa: 2014 ........... 25
Figure 4C: Birth registrations by province of birth registration and status of registration, South Africa: 2015 ........... 26
Figure 5: Sex ratios by province of birth registration, South Africa: 2013–2015 ...................................................... 27
Figure 6: Median age of the mother by year of birth, South Africa: 1998–2015 ...................................................... 28
Figure 7: Birth occurrences by province of birth registration, South Africa: 2013–2015 ......................................... 29
Figure 8: Percentage distribution of birth occurrences by year and month of birth, South Africa: 2009–2015 ....... 30
Appendices ........................................................................................................................................................ 31
Appendix A: Notice of birth form (DHA-24) – page 1 .......................................................................................... 31
Appendix B: Total birth registrations for 2013 by year of birth occurrence, province and district municipality ... 33
Appendix B1: Total birth registrations for 2014 by year of birth occurrence, province and district municipality ... 35
Appendix B2: Total birth registrations for 2015 by year of birth occurrence, province and district municipality ... 37
Appendix C: Birth registrations by registration status, sex, province and district municipality, 2013 ................. 39
Appendix C1: Birth registrations by registration status, sex, province and district municipality, 2014 ................. 41
Appendix C2: Birth registrations by registration status, sex, province and district municipality, 2015 ................. 43
Appendix D: Birth occurrences by year of birth and age of the mother, 2009–2015 .......................................... 45
Appendix E: Birth occurrences by province of birth registration and age of the mother, 2013−2015 ................ 46
Appendix F: Birth occurrences by year of birth and province and district municipality of birth registration, 2009–2015 .................................................................................................................. 47
Appendix G: Total birth occurrences by sex and month, 1993–1995 ................................................................. 49
Appendix G.1: Total birth occurrences by sex and month, 1996–1998 ................................................................. 50
Appendix G.2: Total birth occurrences by sex and month, 1999–2001 ................................................................. 51
Appendix G.3: Total birth occurrences by sex and month, 2002–2004 ................................................................. 52
Appendix G.4: Total birth occurrences by sex and month, 2005–2007 ................................................................. 53
Appendix G.5: Total birth occurrences by sex and month, 2008–2010 ................................................................. 54
Appendix G.6: Total birth occurrences by sex and month, 2011–2013 ................................................................. 55
Appendix G.7: Total birth occurrences by sex and month, 2014–2015 ................................................................. 56
Explanatory notes ..................................................................................................................................................... 57
General information .................................................................................................................................................. 59
STATISTICS SOUTH AFRICA P0305
Recorded live births, 2013−2015
1
1. Introduction
The registration of births allows for an individual’s citizenship to be recognised, making it possible for the individual to access and exercise their rights (Department of Home Affairs [DHA], 2015). Todres (2003, p32) defines birth registration as “the process by which a child’s birth is recorded in the civil register by the applicable government authority”. The author notes that registration “provides the first legal recognition of the child and is generally required for the child to obtain a birth certificate and as a result any other legal documents and rights” (Ibid.). Individuals who are not registered and have no proof of identify are at a high risk of social exclusion and lack of access to basic services such as education (UNICEF [United Nations Children’s Fund], 2002). Birth registration is not only important for individuals but for the state as well. Birth registration provides the necessary data required to inform effective planning for social and economic development; provide evidence needed to monitor development progress and advocate for policy change (United Nations [UN], 2014). Birth registration is also essential for the production and dissemination of vital statistics (United Nations Economic Commission for Africa [UNECA], 2016). The registration of births in South Africa is administered by the DHA and is governed by the Births and Deaths Registration Act, 1992 (Act No. 51 of 1992), which was amended as the Births and Deaths Registration Amendment Act, 2010 (Act No. 18 of 2010) (Republic of South Africa, 1992; Republic of South Africa, 2010). The Act states that a child ought to be registered within 30 days of birth using form DHA-24. Births registered after 30 days must comply with the prescribed requirements for Late Registration of Births (LRB) with the use of form DHA-24/LRB. The requirements include the submission of an affidavit for late registration; a certificate from the hospital or maternity home where the child was born acknowledging that the birth took place in that facility; and a clinic card, baptismal certificate, letter from the first school attended by the child, school reports and social worker's report for abandoned children (DHA, 2014). The government has made efforts to eliminate LRB by expanding birth registration facilities at selected hospitals and mobile units. The DHA held a birth registration indaba on 4 and 5 December 2015 to sensitize the public on the enforcement of late registration penalties; this will result in parents paying for late birth registrations. There is a concern, however, that the introduction of penalty fees could impose an unfair burden, particularly on poor sections of the population and could further delay the registration of the births (UNICEF, 2013). Late registration of births is a serious security risk for the country as they open possibilities for fraudulent entries into the National Population Register (NPR) (DHA, 2015). Once birth registration is completed, an unabridged birth certificate is issued to the applicant. Statistics South Africa (Stats SA) acquires the births data from DHA on an annual basis through the State Information Technology Agency (SITA). A print-out is also provided bi-annually. This report presents information on the number of live births recorded in the South African birth registration system at the Department of Home Affairs from 2013 to 2015. Data for 1993 to 2012 are also included to illustrate trends and patterns in the registration and occurrence of live births. The reporting of live births is shown by year of registration (the year in which the birth was registered) and occurrence year (the year in which the birth occurred).
2. Data and methods
2.1 Data source
This statistical release uses administrative data obtained from the DHA. The files obtained from the DHA include births registered within 30 days; births registered from 31 days to 364 days; births registered from age 1 to 14 years; births registered from 15 years; births registered in health facilities; and births that occurred among South Africans outside of South Africa. In this statistical release, births for 2013 and 2014 have been revised to correspond with previous releases with a 14-month observation period. In doing so, 2013 births were amended by removing the births registered in January and February 2013 as these were published in 2012. In addition, births registered in January and February 2014 which were excluded from the 2013 release were included for 2013 births. Similarly, births for 2014 have been adjusted to align with the 14-months observation period. Births for 2014 were revised by removing the births belonging to 2013 as per the 14-months reference period and included births for 2014 and earlier years that were registered in January and February 2015. A similar exercise was undertaken in
STATISTICS SOUTH AFRICA P0305
Recorded live births, 2013−2015
2
data preparation for 2015 births. For 2015, births registered from January 2015 to February 2016 were provided to Stats SA by the DHA.
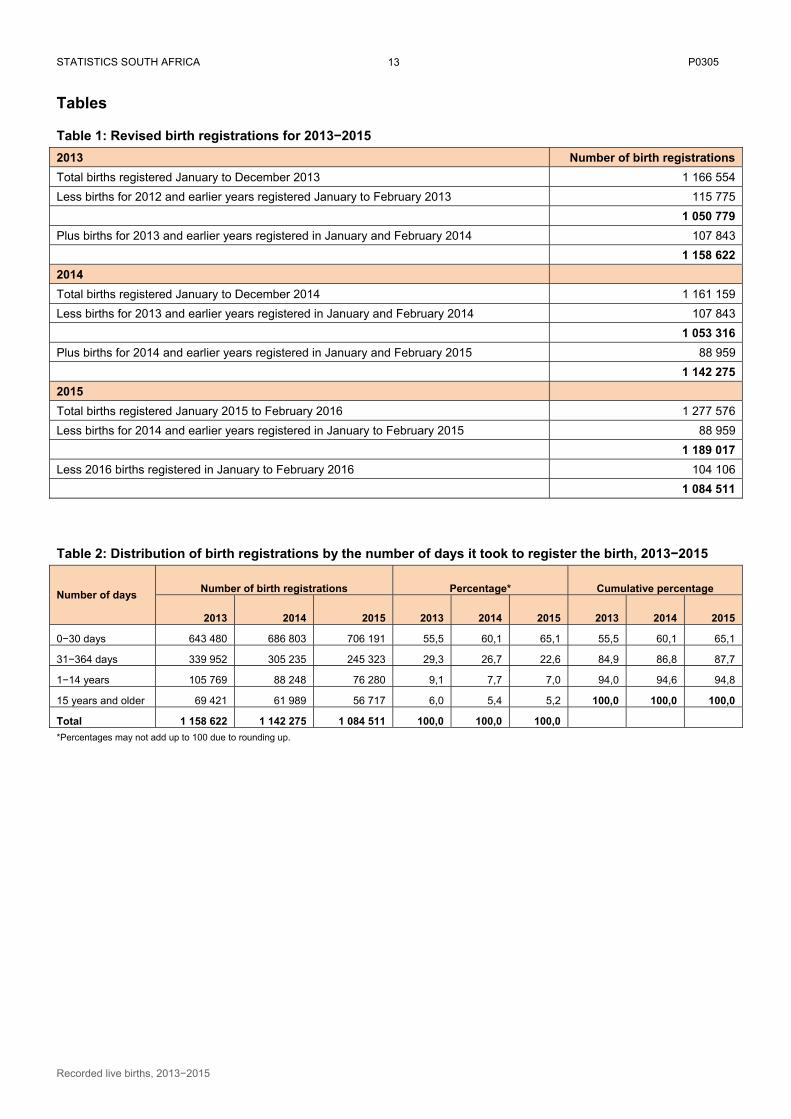
As previously indicated, in order to align with the 14-months observation period, births registered in January and February 2015 were allocated to 2014 and births for 2016 registered in January and February 2016 were removed. These were removed because they form part of the births for 2016 and not 2015 registration period. Table 1 on page 13 shows the amendments undertaken and final numbers for the three years (2013−2015).
2.2 Assessment of the quality of data
Completeness of birth registration
Estimation of completeness of any dataset is one of the key activities in the assessment of content validity and signals the readiness of data for use. Hill (2009) highlighted that the UN considers a 90% coverage rate of civil registration data as the minimum for usefulness of the data. The 2013 statistical release estimated the completeness of birth registration for the intercensal period 2007–2011 at 89,2% (Stats SA, 2015). For the 2013–2015 recorded live births statistical release, the same estimate of completeness is maintained. Completeness of data for the intercensal period 2011–2016 will be estimated and reported in the 2016 recorded live births release.
Timeliness of birth registration
Since March 2013, the Department of Home Affairs has registered births according to the Births and Deaths Registration Amendment Act (Act No. 18 of 2010), which stipulates that a birth must be registered within 30 days from the date of occurrence (Republic of South Africa, 2010). This resulted in a change in how the births data were processed and it was therefore important to revise the births registered for 2013 and 2014 as shown in Table 2 on page 13. Timeliness of birth registration in this statistical release refers to the number of days and years it took to register a birth from the date on which the birth occurred to the date the birth was registered at the DHA. Table 2 shows the number of days and years it took for births registered in 2013−2015 to be registered from the date of birth occurrence. In 2013, 55,5% of births were registered during the first 30 completed days of life, whilst 29,3% were registered after 30 days but before one year. In 2014, 60,1% of births were registered within the 30-days period in line with the Registration Act, followed by births registered after 30 days but below one year (26,7%). Similarly in 2015, the percentage of births registered in line with the required 30 days was 65,1% and 22,6% of births were registered within one year. Taken together, these proportions translate to 87,7% births registered within a year for 2015. In the three-year period, adherence to the legislation has improved, as shown by the increases in births registered within 30 days. In addition, births registered from 15 years and older have declined over the three years (6,0% [2013], 5,4% [2014] and 5,2% [2015]).
2.3 Data analysis
This release primarily presents descriptive statistics about recorded live births that occurred in South Africa between 2013 and 2015 using frequency tables and graphs. The focus on the analysis was on registered births and birth occurrences. Differentials by age of the mother, sex of child and province of registration are included. Additional information on months of birth occurrence, baby forenames and surnames and analysis of birth registration within 30 days is provided in the statistical release.
STATISTICS SOUTH AFRICA P0305
Recorded live births, 2013−2015
3
3. Birth registrations
3.1 Trends in birth registration
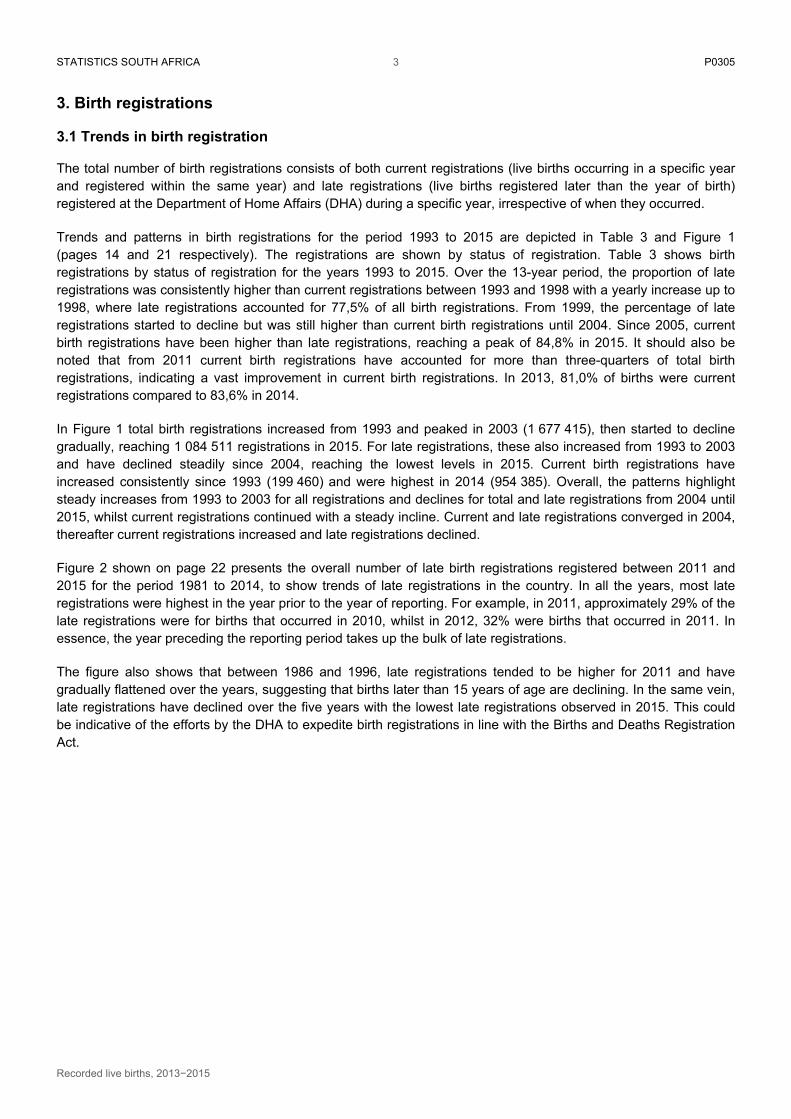
The total number of birth registrations consists of both current registrations (live births occurring in a specific year and registered within the same year) and late registrations (live births registered later than the year of birth) registered at the Department of Home Affairs (DHA) during a specific year, irrespective of when they occurred.
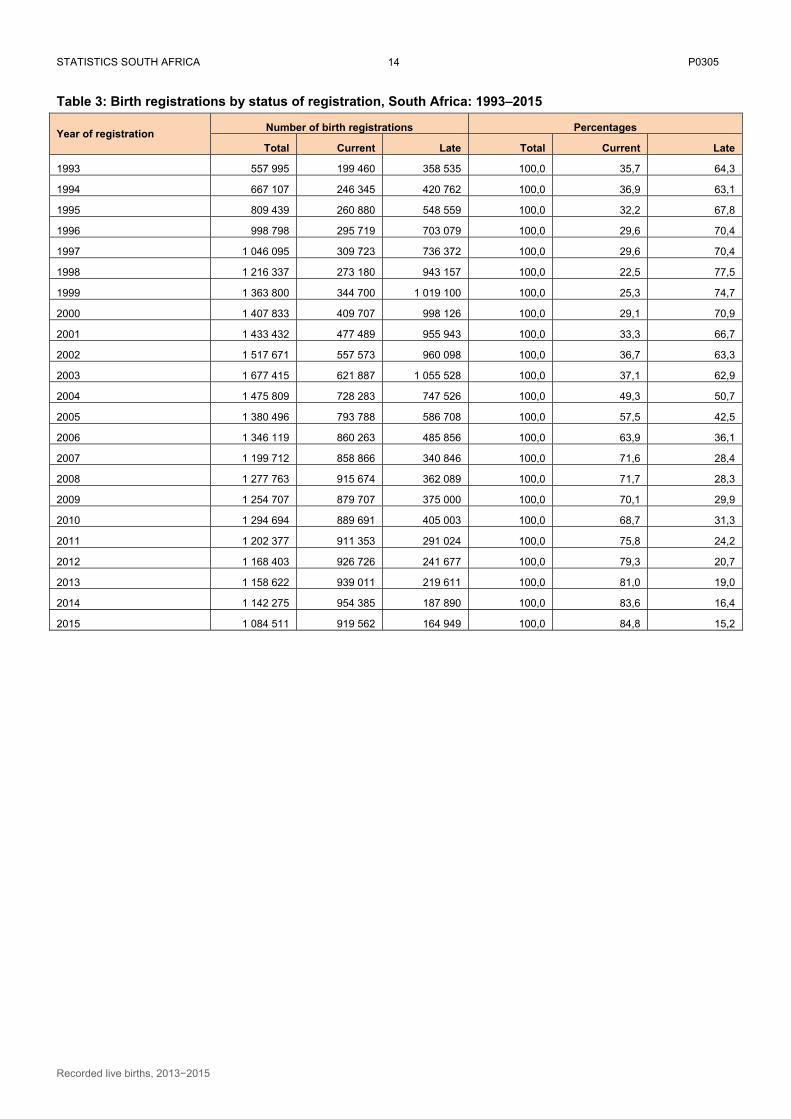
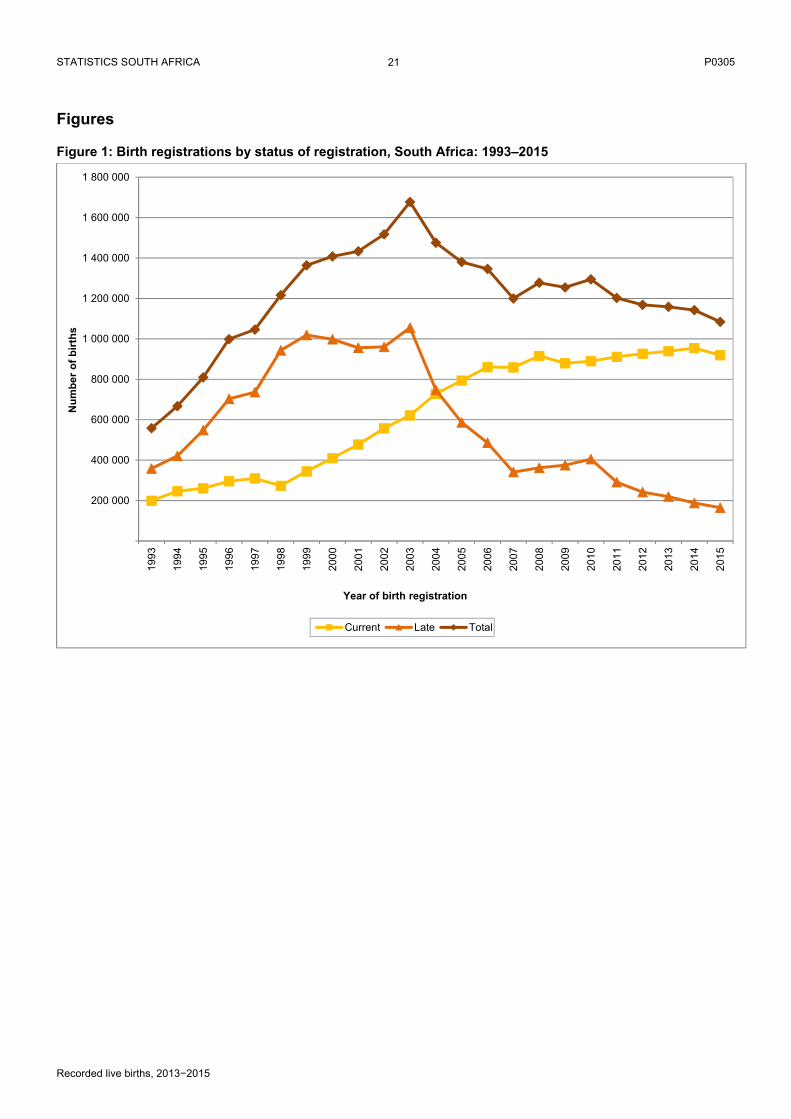
Trends and patterns in birth registrations for the period 1993 to 2015 are depicted in Table 3 and Figure 1 (pages 14 and 21 respectively). The registrations are shown by status of registration. Table 3 shows birth registrations by status of registration for the years 1993 to 2015. Over the 13-year period, the proportion of late registrations was consistently higher than current registrations between 1993 and 1998 with a yearly increase up to 1998, where late registrations accounted for 77,5% of all birth registrations. From 1999, the percentage of late registrations started to decline but was still higher than current birth registrations until 2004. Since 2005, current birth registrations have been higher than late registrations, reaching a peak of 84,8% in 2015. It should also be noted that from 2011 current birth registrations have accounted for more than three-quarters of total birth registrations, indicating a vast improvement in current birth registrations. In 2013, 81,0% of births were current registrations compared to 83,6% in 2014.
In Figure 1 total birth registrations increased from 1993 and peaked in 2003 (1 677 415), then started to decline gradually, reaching 1 084 511 registrations in 2015. For late registrations, these also increased from 1993 to 2003 and have declined steadily since 2004, reaching the lowest levels in 2015. Current birth registrations have increased consistently since 1993 (199 460) and were highest in 2014 (954 385). Overall, the patterns highlight steady increases from 1993 to 2003 for all registrations and declines for total and late registrations from 2004 until 2015, whilst current registrations continued with a steady incline. Current and late registrations converged in 2004, thereafter current registrations increased and late registrations declined.
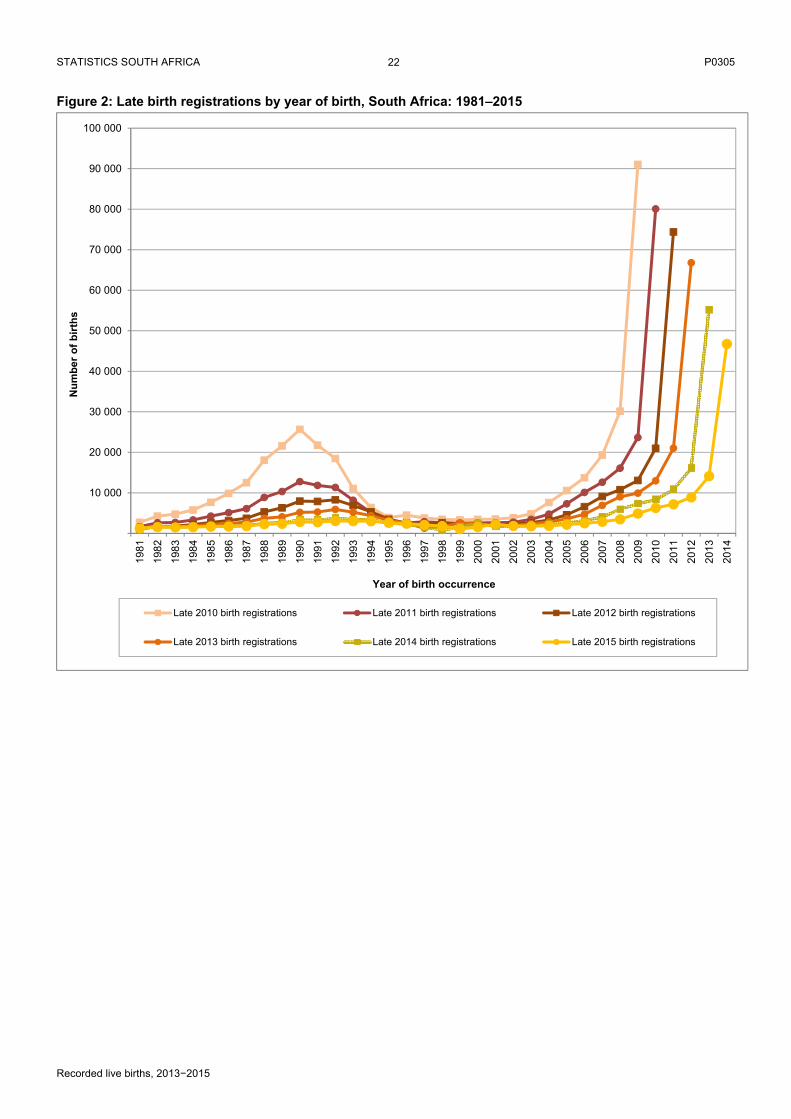
Figure 2 shown on page 22 presents the overall number of late birth registrations registered between 2011 and 2015 for the period 1981 to 2014, to show trends of late registrations in the country. In all the years, most late registrations were highest in the year prior to the year of reporting. For example, in 2011, approximately 29% of the late registrations were for births that occurred in 2010, whilst in 2012, 32% were births that occurred in 2011. In essence, the year preceding the reporting period takes up the bulk of late registrations.
The figure also shows that between 1986 and 1996, late registrations tended to be higher for 2011 and have gradually flattened over the years, suggesting that births later than 15 years of age are declining. In the same vein, late registrations have declined over the five years with the lowest late registrations observed in 2015. This could be indicative of the efforts by the DHA to expedite birth registrations in line with the Births and Deaths Registration Act.
STATISTICS SOUTH AFRICA P0305
Recorded live births, 2013−2015
4
3.2 Birth registrations by selected variables
Age of the mother
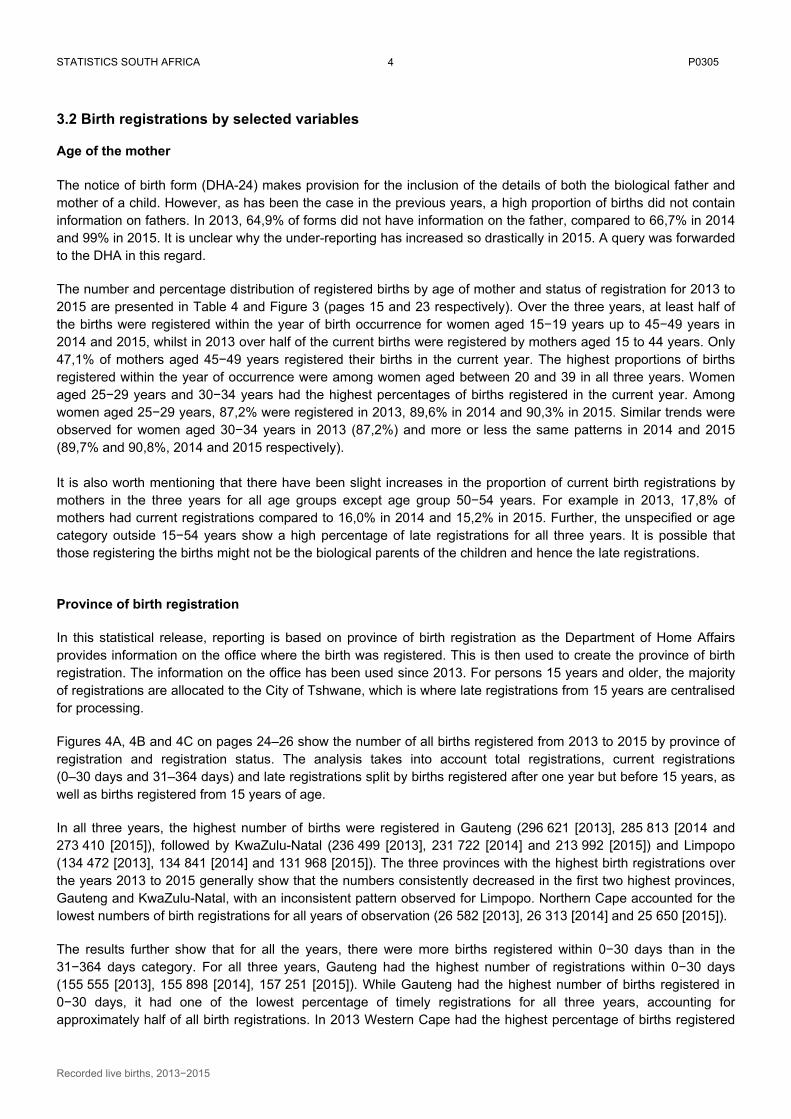
The notice of birth form (DHA-24) makes provision for the inclusion of the details of both the biological father and mother of a child. However, as has been the case in the previous years, a high proportion of births did not contain information on fathers. In 2013, 64,9% of forms did not have information on the father, compared to 66,7% in 2014 and 99% in 2015. It is unclear why the under-reporting has increased so drastically in 2015. A query was forwarded to the DHA in this regard.
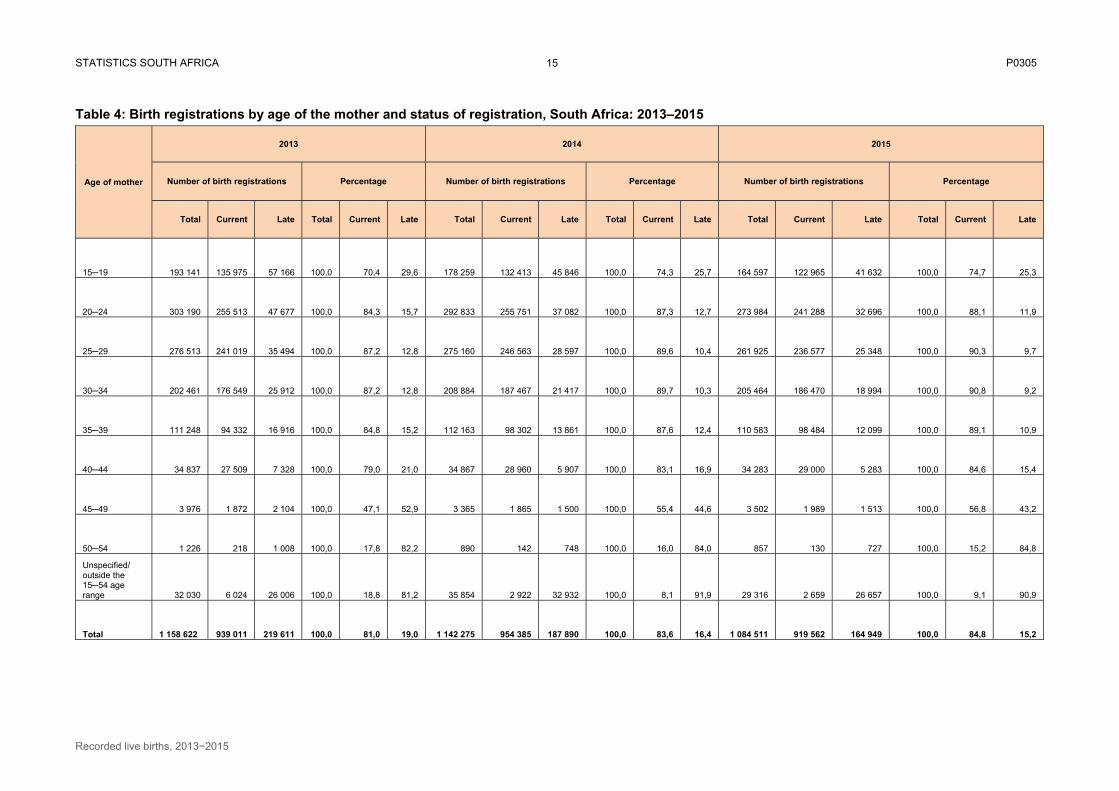
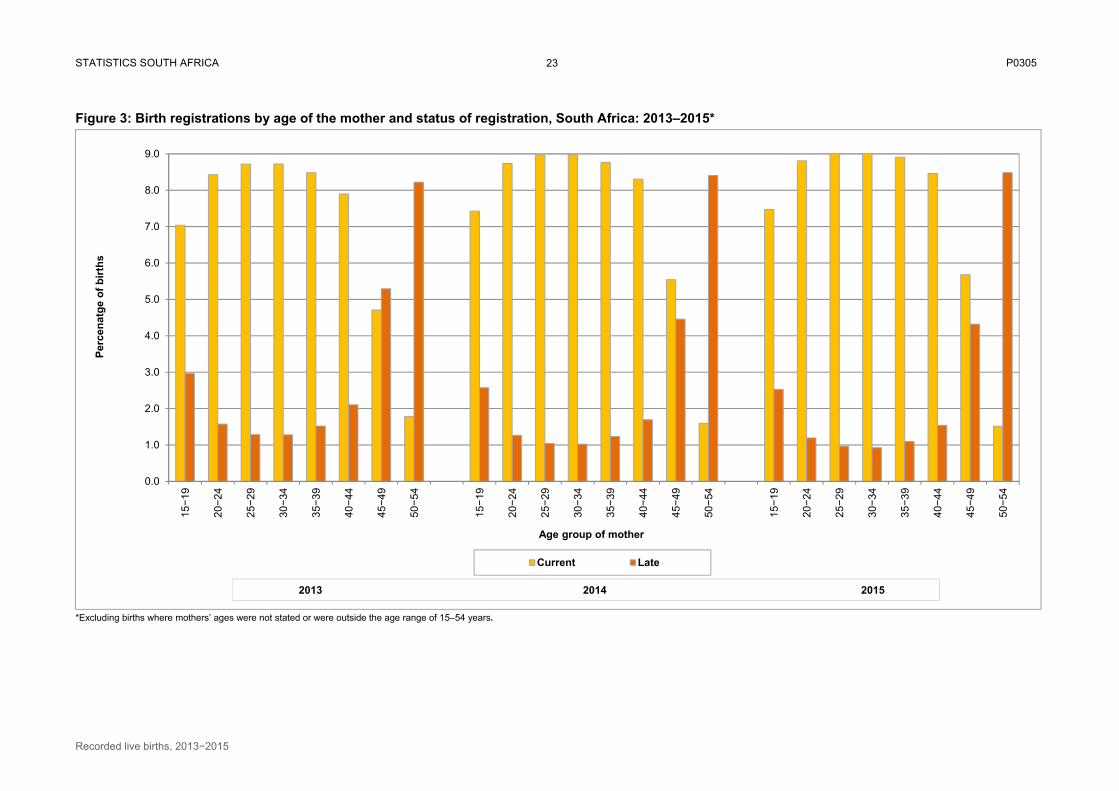
The number and percentage distribution of registered births by age of mother and status of registration for 2013 to 2015 are presented in Table 4 and Figure 3 (pages 15 and 23 respectively). Over the three years, at least half of the births were registered within the year of birth occurrence for women aged 15−19 years up to 45−49 years in 2014 and 2015, whilst in 2013 over half of the current births were registered by mothers aged 15 to 44 years. Only 47,1% of mothers aged 45−49 years registered their births in the current year. The highest proportions of births registered within the year of occurrence were among women aged between 20 and 39 in all three years. Women aged 25−29 years and 30−34 years had the highest percentages of births registered in the current year. Among women aged 25−29 years, 87,2% were registered in 2013, 89,6% in 2014 and 90,3% in 2015. Similar trends were observed for women aged 30−34 years in 2013 (87,2%) and more or less the same patterns in 2014 and 2015 (89,7% and 90,8%, 2014 and 2015 respectively). It is also worth mentioning that there have been slight increases in the proportion of current birth registrations by mothers in the three years for all age groups except age group 50−54 years. For example in 2013, 17,8% of mothers had current registrations compared to 16,0% in 2014 and 15,2% in 2015. Further, the unspecified or age category outside 15−54 years show a high percentage of late registrations for all three years. It is possible that those registering the births might not be the biological parents of the children and hence the late registrations.
Province of birth registration
In this statistical release, reporting is based on province of birth registration as the Department of Home Affairs provides information on the office where the birth was registered. This is then used to create the province of birth registration. The information on the office has been used since 2013. For persons 15 years and older, the majority of registrations are allocated to the City of Tshwane, which is where late registrations from 15 years are centralised for processing.
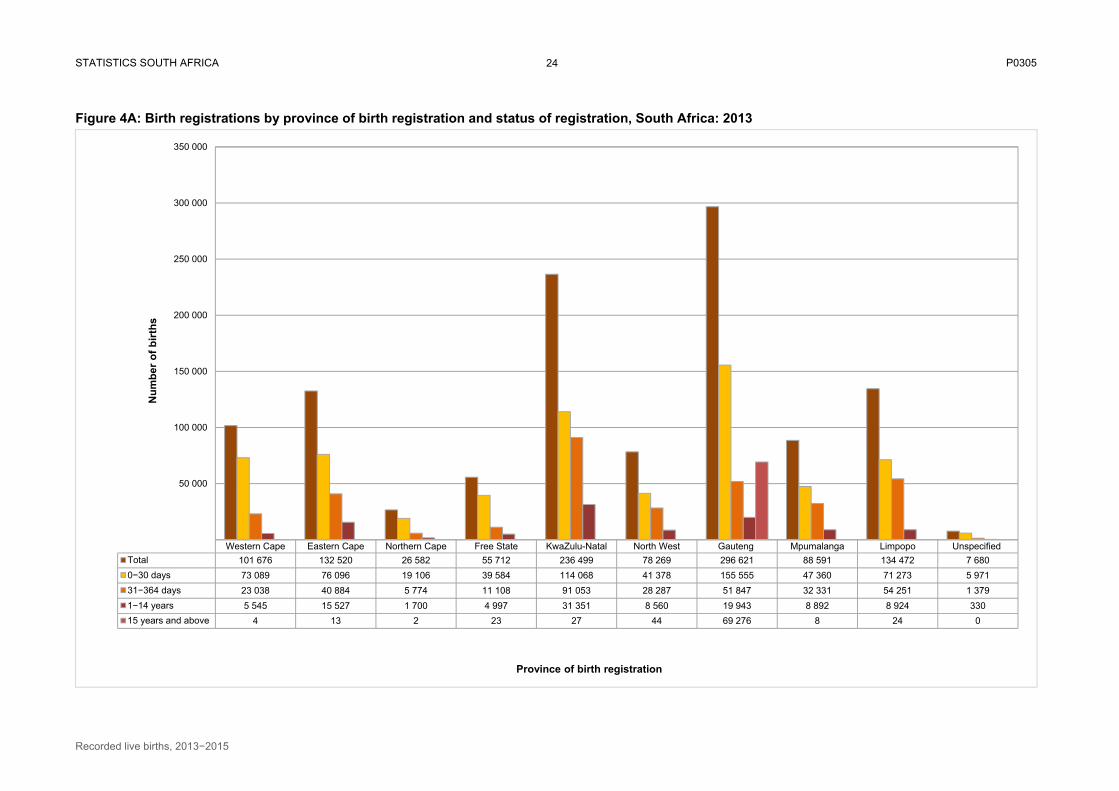
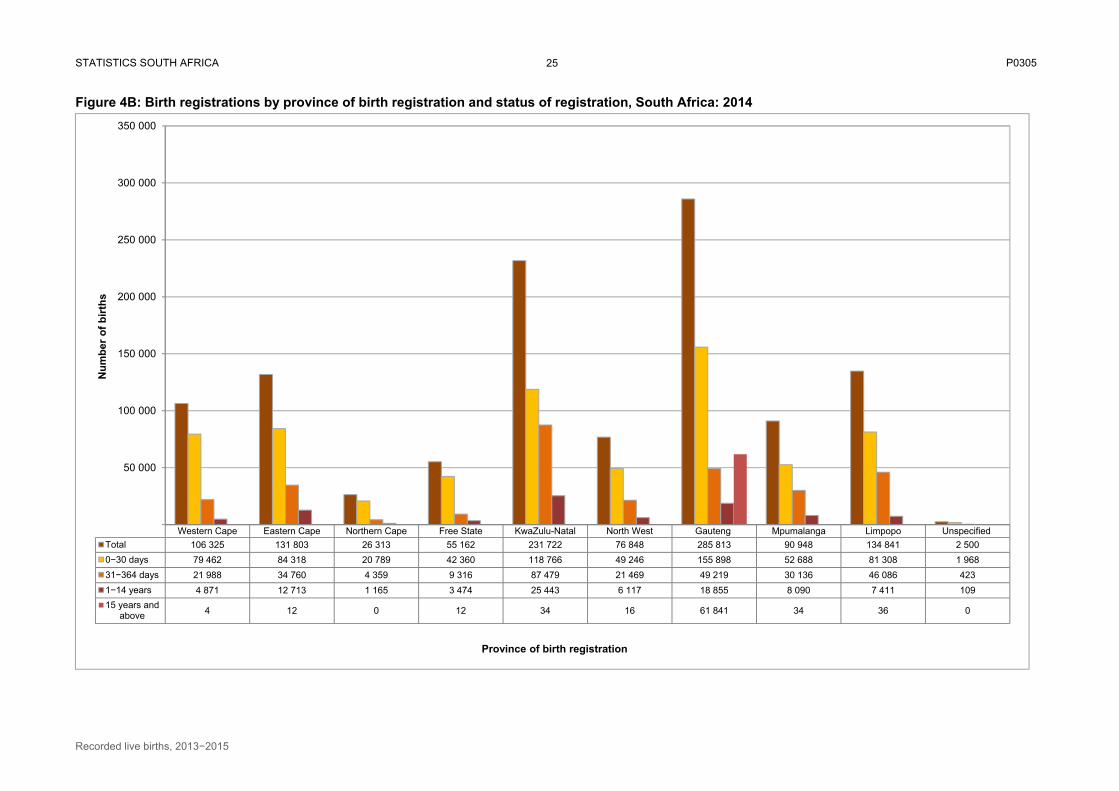
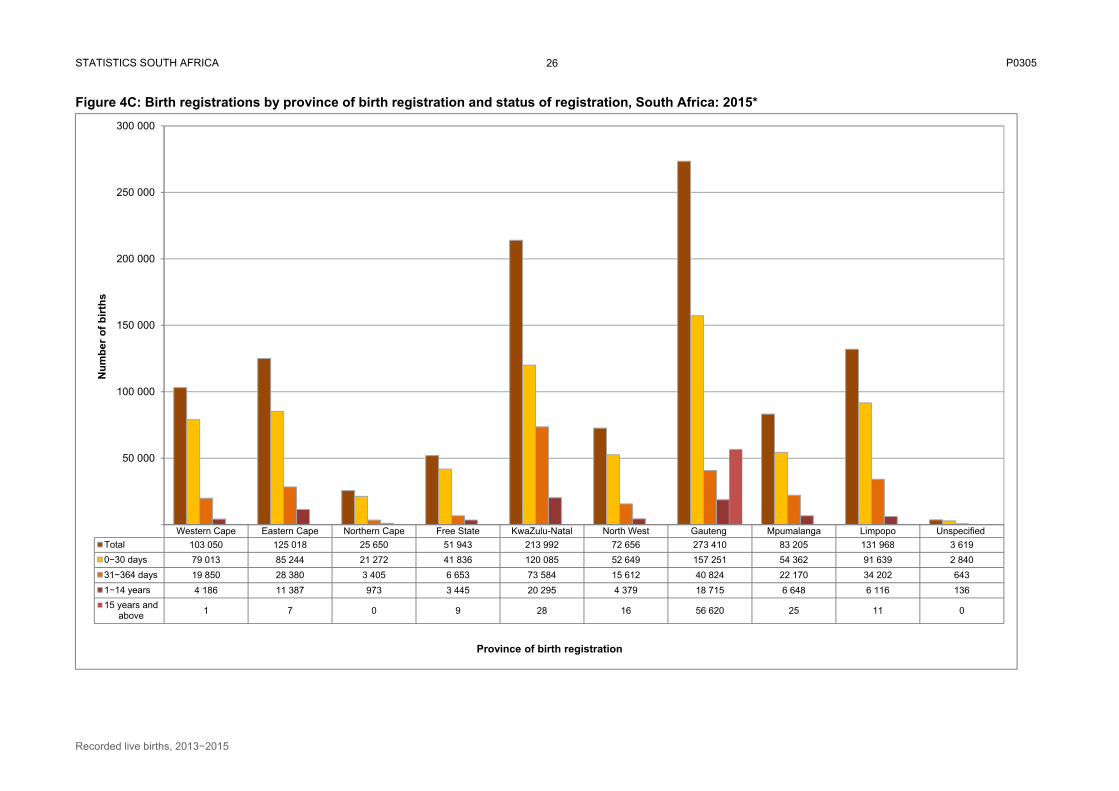
Figures 4A, 4B and 4C on pages 24–26 show the number of all births registered from 2013 to 2015 by province of registration and registration status. The analysis takes into account total registrations, current registrations (0–30 days and 31–364 days) and late registrations split by births registered after one year but before 15 years, as well as births registered from 15 years of age.
In all three years, the highest number of births were registered in Gauteng (296 621 [2013], 285 813 [2014 and 273 410 [2015]), followed by KwaZulu-Natal (236 499 [2013], 231 722 [2014] and 213 992 [2015]) and Limpopo (134 472 [2013], 134 841 [2014] and 131 968 [2015]). The three provinces with the highest birth registrations over the years 2013 to 2015 generally show that the numbers consistently decreased in the first two highest provinces, Gauteng and KwaZulu-Natal, with an inconsistent pattern observed for Limpopo. Northern Cape accounted for the lowest numbers of birth registrations for all years of observation (26 582 [2013], 26 313 [2014] and 25 650 [2015]).
The results further show that for all the years, there were more births registered within 0−30 days than in the 31−364 days category. For all three years, Gauteng had the highest number of registrations within 0−30 days (155 555 [2013], 155 898 [2014], 157 251 [2015]). While Gauteng had the highest number of births registered in 0−30 days, it had one of the lowest percentage of timely registrations for all three years, accounting for approximately half of all birth registrations. In 2013 Western Cape had the highest percentage of births registered
STATISTICS SOUTH AFRICA P0305
Recorded live births, 2013−2015
5
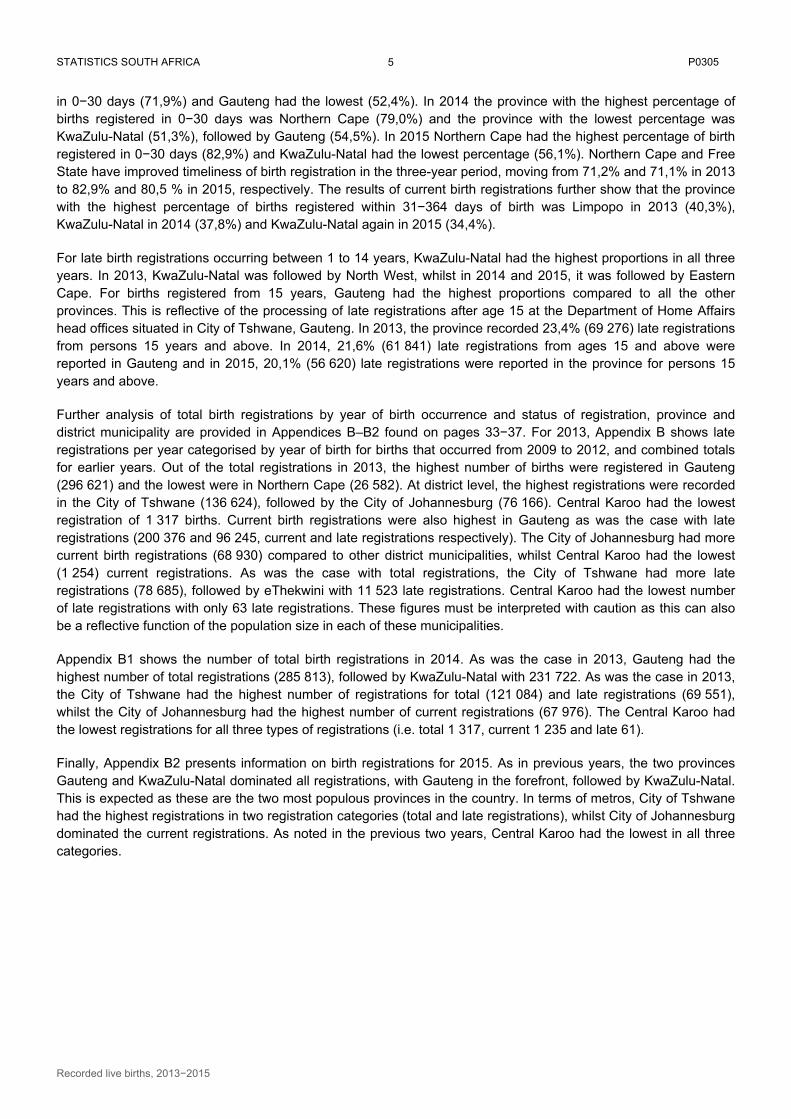
in 0−30 days (71,9%) and Gauteng had the lowest (52,4%). In 2014 the province with the highest percentage of births registered in 0−30 days was Northern Cape (79,0%) and the province with the lowest percentage was KwaZulu-Natal (51,3%), followed by Gauteng (54,5%). In 2015 Northern Cape had the highest percentage of birth registered in 0−30 days (82,9%) and KwaZulu-Natal had the lowest percentage (56,1%). Northern Cape and Free State have improved timeliness of birth registration in the three-year period, moving from 71,2% and 71,1% in 2013 to 82,9% and 80,5 % in 2015, respectively. The results of current birth registrations further show that the province with the highest percentage of births registered within 31−364 days of birth was Limpopo in 2013 (40,3%), KwaZulu-Natal in 2014 (37,8%) and KwaZulu-Natal again in 2015 (34,4%).
For late birth registrations occurring between 1 to 14 years, KwaZulu-Natal had the highest proportions in all three years. In 2013, KwaZulu-Natal was followed by North West, whilst in 2014 and 2015, it was followed by Eastern Cape. For births registered from 15 years, Gauteng had the highest proportions compared to all the other provinces. This is reflective of the processing of late registrations after age 15 at the Department of Home Affairs head offices situated in City of Tshwane, Gauteng. In 2013, the province recorded 23,4% (69 276) late registrations from persons 15 years and above. In 2014, 21,6% (61 841) late registrations from ages 15 and above were reported in Gauteng and in 2015, 20,1% (56 620) late registrations were reported in the province for persons 15 years and above.
Further analysis of total birth registrations by year of birth occurrence and status of registration, province and district municipality are provided in Appendices B–B2 found on pages 33−37. For 2013, Appendix B shows late registrations per year categorised by year of birth for births that occurred from 2009 to 2012, and combined totals for earlier years. Out of the total registrations in 2013, the highest number of births were registered in Gauteng (296 621) and the lowest were in Northern Cape (26 582). At district level, the highest registrations were recorded in the City of Tshwane (136 624), followed by the City of Johannesburg (76 166). Central Karoo had the lowest registration of 1 317 births. Current birth registrations were also highest in Gauteng as was the case with late registrations (200 376 and 96 245, current and late registrations respectively). The City of Johannesburg had more current birth registrations (68 930) compared to other district municipalities, whilst Central Karoo had the lowest (1 254) current registrations. As was the case with total registrations, the City of Tshwane had more late registrations (78 685), followed by eThekwini with 11 523 late registrations. Central Karoo had the lowest number of late registrations with only 63 late registrations. These figures must be interpreted with caution as this can also be a reflective function of the population size in each of these municipalities.
Appendix B1 shows the number of total birth registrations in 2014. As was the case in 2013, Gauteng had the highest number of total registrations (285 813), followed by KwaZulu-Natal with 231 722. As was the case in 2013, the City of Tshwane had the highest number of registrations for total (121 084) and late registrations (69 551), whilst the City of Johannesburg had the highest number of current registrations (67 976). The Central Karoo had the lowest registrations for all three types of registrations (i.e. total 1 317, current 1 235 and late 61).
Finally, Appendix B2 presents information on birth registrations for 2015. As in previous years, the two provinces Gauteng and KwaZulu-Natal dominated all registrations, with Gauteng in the forefront, followed by KwaZulu-Natal. This is expected as these are the two most populous provinces in the country. In terms of metros, City of Tshwane had the highest registrations in two registration categories (total and late registrations), whilst City of Johannesburg dominated the current registrations. As noted in the previous two years, Central Karoo had the lowest in all three categories.
STATISTICS SOUTH AFRICA P0305
Recorded live births, 2013−2015
6
Sex of the child
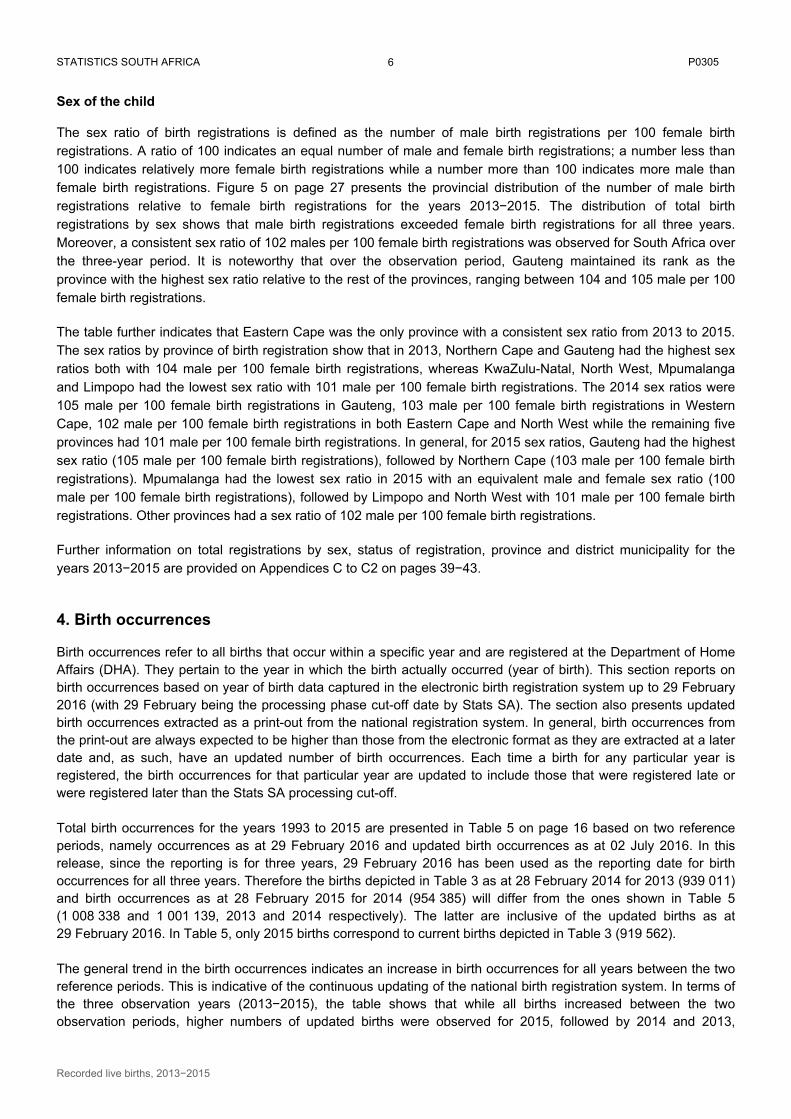
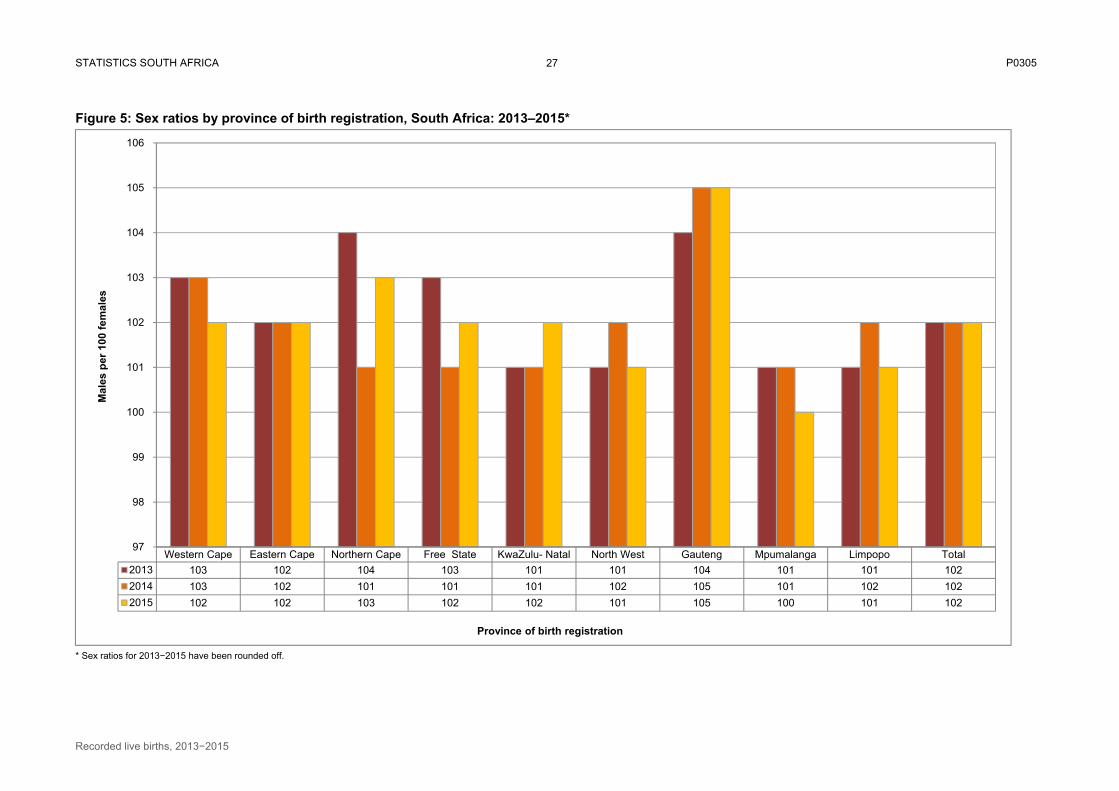
The sex ratio of birth registrations is defined as the number of male birth registrations per 100 female birth registrations. A ratio of 100 indicates an equal number of male and female birth registrations; a number less than 100 indicates relatively more female birth registrations while a number more than 100 indicates more male than female birth registrations. Figure 5 on page 27 presents the provincial distribution of the number of male birth registrations relative to female birth registrations for the years 2013−2015. The distribution of total birth registrations by sex shows that male birth registrations exceeded female birth registrations for all three years. Moreover, a consistent sex ratio of 102 males per 100 female birth registrations was observed for South Africa over the three-year period. It is noteworthy that over the observation period, Gauteng maintained its rank as the province with the highest sex ratio relative to the rest of the provinces, ranging between 104 and 105 male per 100 female birth registrations.
The table further indicates that Eastern Cape was the only province with a consistent sex ratio from 2013 to 2015. The sex ratios by province of birth registration show that in 2013, Northern Cape and Gauteng had the highest sex ratios both with 104 male per 100 female birth registrations, whereas KwaZulu-Natal, North West, Mpumalanga and Limpopo had the lowest sex ratio with 101 male per 100 female birth registrations. The 2014 sex ratios were 105 male per 100 female birth registrations in Gauteng, 103 male per 100 female birth registrations in Western Cape, 102 male per 100 female birth registrations in both Eastern Cape and North West while the remaining five provinces had 101 male per 100 female birth registrations. In general, for 2015 sex ratios, Gauteng had the highest sex ratio (105 male per 100 female birth registrations), followed by Northern Cape (103 male per 100 female birth registrations). Mpumalanga had the lowest sex ratio in 2015 with an equivalent male and female sex ratio (100 male per 100 female birth registrations), followed by Limpopo and North West with 101 male per 100 female birth registrations. Other provinces had a sex ratio of 102 male per 100 female birth registrations.
Further information on total registrations by sex, status of registration, province and district municipality for the years 2013−2015 are provided on Appendices C to C2 on pages 39−43.
4. Birth occurrences
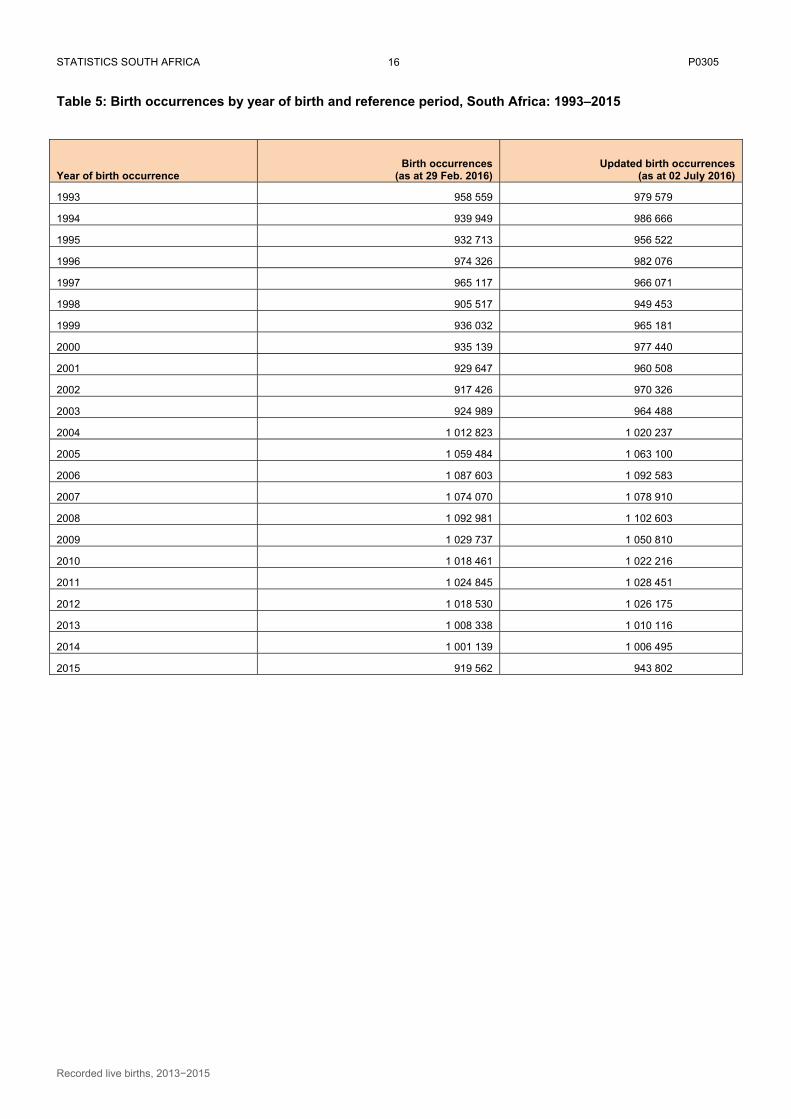
Birth occurrences refer to all births that occur within a specific year and are registered at the Department of Home Affairs (DHA). They pertain to the year in which the birth actually occurred (year of birth). This section reports on birth occurrences based on year of birth data captured in the electronic birth registration system up to 29 February 2016 (with 29 February being the processing phase cut-off date by Stats SA). The section also presents updated birth occurrences extracted as a print-out from the national registration system. In general, birth occurrences from the print-out are always expected to be higher than those from the electronic format as they are extracted at a later date and, as such, have an updated number of birth occurrences. Each time a birth for any particular year is registered, the birth occurrences for that particular year are updated to include those that were registered late or were registered later than the Stats SA processing cut-off. Total birth occurrences for the years 1993 to 2015 are presented in Table 5 on page 16 based on two reference periods, namely occurrences as at 29 February 2016 and updated birth occurrences as at 02 July 2016. In this release, since the reporting is for three years, 29 February 2016 has been used as the reporting date for birth occurrences for all three years. Therefore the births depicted in Table 3 as at 28 February 2014 for 2013 (939 011) and birth occurrences as at 28 February 2015 for 2014 (954 385) will differ from the ones shown in Table 5 (1 008 338 and 1 001 139, 2013 and 2014 respectively). The latter are inclusive of the updated births as at 29 February 2016. In Table 5, only 2015 births correspond to current births depicted in Table 3 (919 562). The general trend in the birth occurrences indicates an increase in birth occurrences for all years between the two reference periods. This is indicative of the continuous updating of the national birth registration system. In terms of the three observation years (2013−2015), the table shows that while all births increased between the two observation periods, higher numbers of updated births were observed for 2015, followed by 2014 and 2013,
STATISTICS SOUTH AFRICA P0305
Recorded live births, 2013−2015
7
respectively. The results show that while 1 008 338 births for 2013 had been captured by the 29th of February 2016, birth occurrences were updated to 1 010 116 by 02 July 2016, representing an increase of 1 778 births (0,2%) between the two reference periods. For 2014 births, a total of 1 006 495 births were captured by the 2nd of July 2016, up by 5 356 (0,5%) from 1 001 139 captured by the 29th of February 2016. The table further shows that by 29 February 2016, a total of 919 562 births that occurred in 2015 had been registered and captured on the national birth registration system. The number of births increased to 943 802 by the 2nd of July 2016. This was an update of 24 240 births (2,6%) from the births registered and captured as at 29 February 2016. The birth year 2008 had the highest number of birth occurrences, both as at 29 February 2016 and 02 July 2016 (1 092 981 and 1 102 603). The lowest number of birth occurrences was recorded in 2002 (917 426 births) for the 29 February 2016 processing cut-off. However, birth occurrences for 2002 increased by 5,8% to 970 326 births by 02 July 2016.
4.1 Birth occurrences as at 29 February 2016
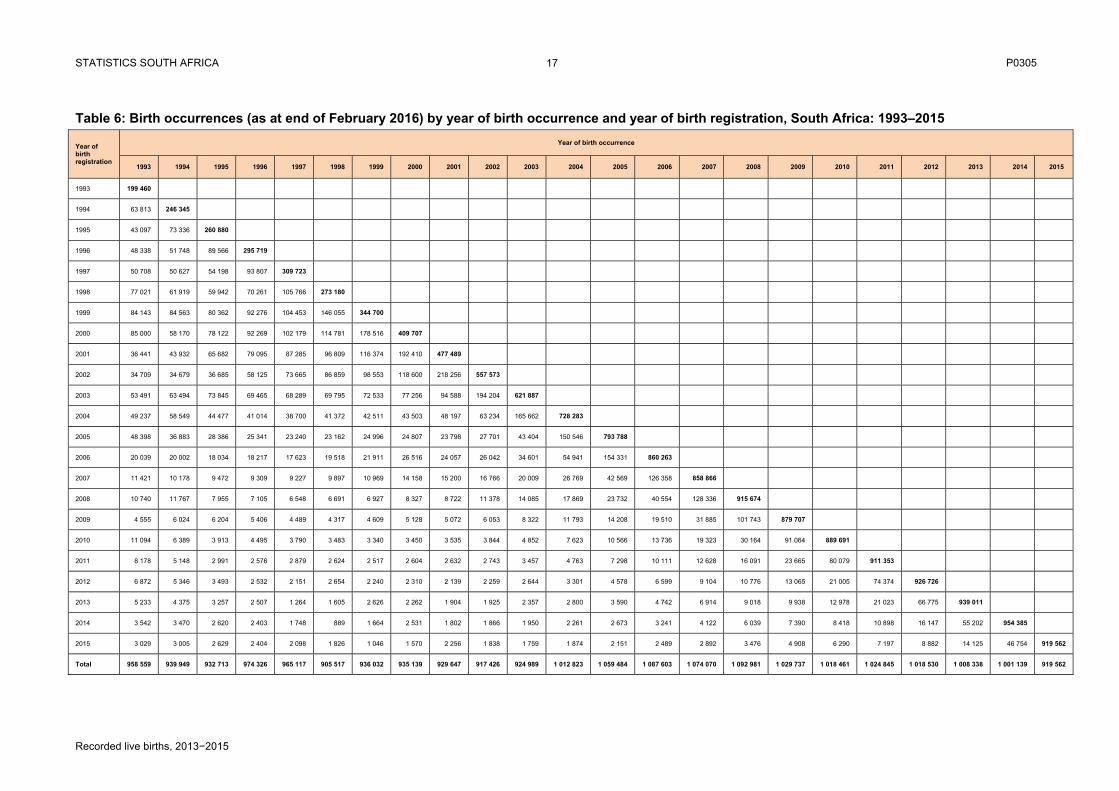
Birth occurrences for different years comprise current births (births registered within the year they occurred) and late registrations (births registered later than the year of their occurrence). Table 6 on page 17 shows the number of births that occurred over the years 1993 to 2015 classified by year of birth occurrence and year of birth registration. The figures in bold indicate all births that were registered within the year of occurrence, while those not in bold represent late birth registrations, indicating the year in which the late registration occurred. The 'Total' row shows the updated number of births registered up to the end of February 2016.
Table 6 shows that over the 23-year period (1993−2015), birth occurrences have varied. There was a steady decrease between 1993 and 1999, followed by an inconsistent pattern for the years 1996 to 1999. Between 2000 and 2002 there was a consistent decrease in the number of birth occurrences, after which birth occurrences took an upward trend until 2006. From 2007 to 2011, birth occurrences fluctuated. However, since 2012 yearly decreases have been observed. In total, between 1993 and 2015 there were approximately 23 million birth occurrences, averaging 981 521 birth occurrences. The average increases each year were due to the updating of the birth register with late registrations, as well as registrations of the current year of observation. All years prior to 2004 had birth occurrences below 981 521, while years between 2004 and 2015 had birth occurrences above this average.
As previously indicated, there was a total of 1 008 338 birth occurrences for 2013 as at the end of February 2016. This total comprised 939 011 births that were registered from 2013 up to 28 February 2014, 55 202 late registrations registered by 28 February 2015, and 14 125 late registrations for 2013 birth occurrences registered by the end of February 2016. The number of births in 2014 registered by 29 February 2016 was 1 001 139, which was an increase of 46 754 from the 954 385 births registered by 28 February 2015. The number of birth occurrences in 2015 registered up to 29 February 2016 was 919 562. This number is expected to increase in the next report because it only refers to births registered within the year of occurrence (current registrations) and does not include late registrations.
The results further show the importance of late registrations in the updating of birth occurrences. For instance, for 1993 while only 199 460 births were registered within the year in which they occurred, by the end of February 2016 the national population register had 958 559 births that occurred in 1993. This shows that most births for 1993 were registered later than the year they occurred, as 759 099 (79,2%) of the 1993 registrations were late registrations. The table further shows that for all the years, the highest number of late registrations were registered during the year immediately following the year of birth occurrence. Generally, before 2001, there were more late registrations than current registrations and thereafter the pattern was reversed. Over half of the births occurring between 1993 and 2000 were late registrations, with this pattern reversing for years later than 2000.
STATISTICS SOUTH AFRICA P0305
Recorded live births, 2013−2015
8
4.2 Birth occurrences registered within 30 days from date of birth
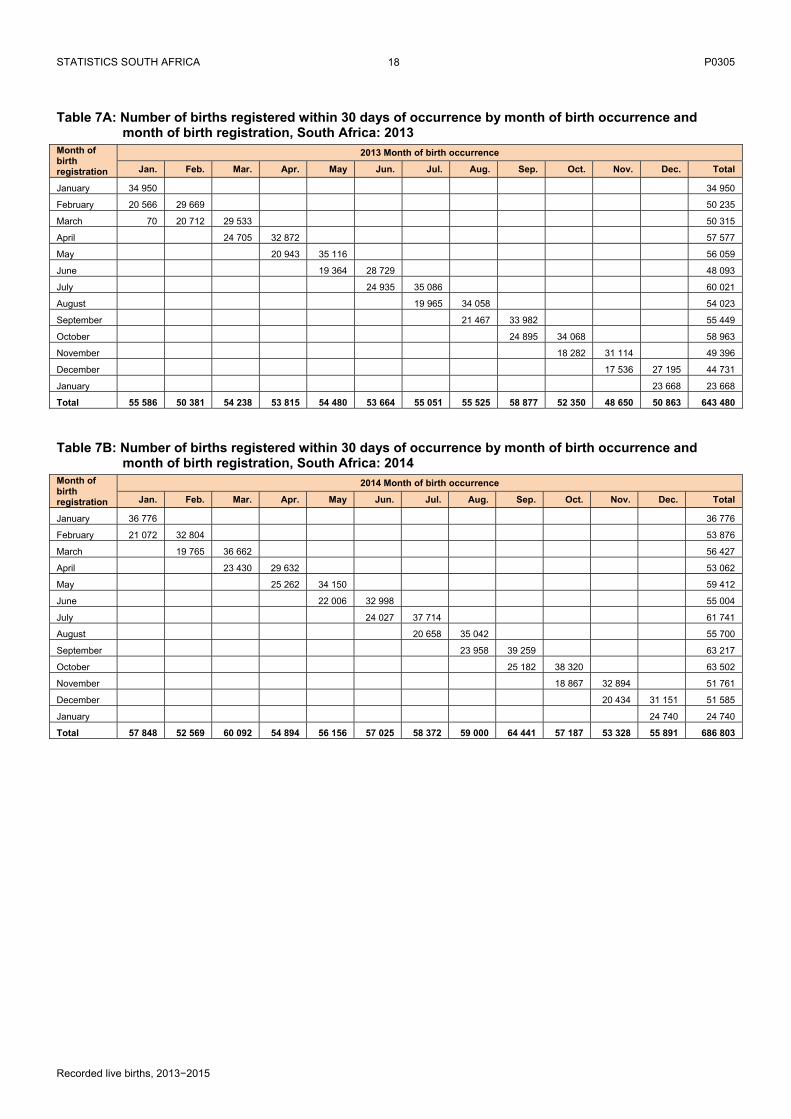
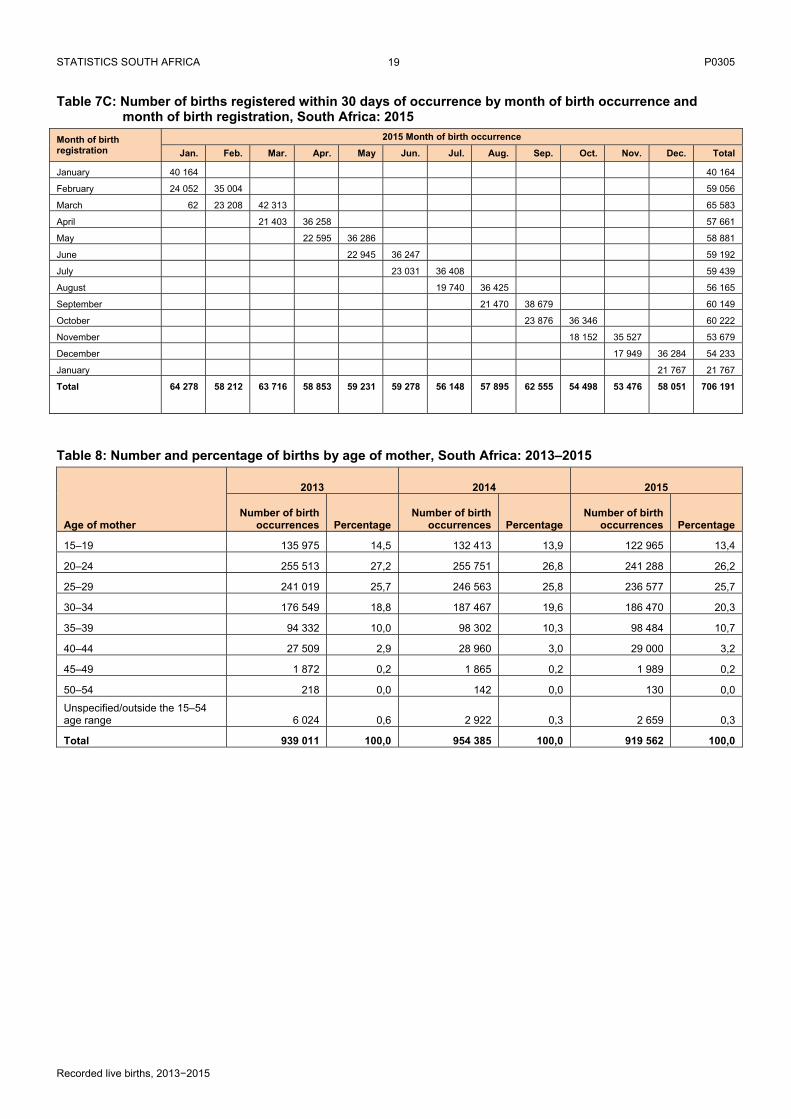
Birth registration is not only the cornerstone for individuals’ proof of identity and ensuing rights, but it also serves to monitor whether individuals are fulfilling their legal obligations by registering birth occurrences on time. Timeliness of birth registrations is imperative for achieving a well-functioning civil registration system with counts of births closer to the true number of birth occurrences. Enshrined in the Births and Deaths Registration Amendment Act, 2010 (Act No. 18 of 2010) is that all births occurring in South Africa must be registered within 30 days of occurrence. Based on the Amendment Act, births registered after 30 days are considered as late registrations. The tabulation of month of birth occurrence by month of birth registration provides necessary information for evaluating compliance to this requirement. Tables 7A, 7B and 7C on pages 18 and 19 present the distribution of births that occurred in 2013, 2014 and 2015, in that order, classified by month of birth occurrence and month of birth registration. The distribution of births that occurred in 2013 classified by month of birth occurrence and month of birth registration is presented in Table 7A. The table shows births that were registered within 30 days of birth occurrence and the month. A total of 643 480 births that occurred in 2013 were registered within 30 days of their occurrence. This means that from the 939 011 births that occurred in 2013, 68,5% were registered within 30 days of occurrence. The results also show that September had the highest number of births (58 877) registered before the end of 30 days from date of occurrence, followed by January (55 586). In contrast, November and February had the lowest number of births registered within 30 days of occurrence (48 650 and 50 381, respectively). Information on the number of 2014 births that complied with the 30 days legislation is provided in Table 7B. The table shows that a total of 686 803 birth occurrences for 2014 were registered within 30 days of occurrence, representing 72,0% of the 954 385 birth occurrences processed by Stats SA for 2014. In total, the highest number of birth occurrences that were registered within 30 days were for September (64 441), followed by March (60 092). February had the lowest number of births registered within the expiration of 30 days (52 569), trailed by November (53 328). Table 7C shows that for 2015, 706 191 (76,8%) of the 919 562 birth occurrences were registered before the end of 30 days. The highest number of births falling within the legislation were registered in January (64 278) and March (63 716). The lowest numbers were observed in November (53 476) and February (58 212). Taken together, the proportions of births registered within 30 days of occurrence increased persistently between 2013 and 2015 (68,5% [2013], 72,0% [2014] and 76,8% [2015]). The increase was by 3,5 percentage points from 2013 to 2014; 4,8 percentage points from 2014 to 2015; and 8,3 percentage points between 2013 and 2015. For both 2013 and 2014, September had the highest number of births registered within 30 days. In contrast, for 2015 most births registered within 30 days occurred in January. For all the years, November and February were the months that had lower numbers of births registered before the end of 30 days.
STATISTICS SOUTH AFRICA P0305
Recorded live births, 2013−2015
9
Age of the mother for births occurring from 2013–2015 Information on the age of the mother constitutes the basis for understanding the dynamics of childbearing. The information is crucial for planning, monitoring and evaluation of programmes focusing on maternal and child health, social welfare, access to family planning, curbing teenage pregnancies and safe motherhood initiatives. Table 8 on page 19 shows the number and percentage distribution of birth occurrences by age of the mother for the years 2013, 2014 and 2015. In general, the table shows that births in South Africa peak at age group 20−24 years and decrease with increasing age of the women. The table shows that women aged 20−24 years comprised the age cohort with the highest proportion of birth occurrences for all years but with decreasing proportions over the three-year period, from 27,2% in 2013, to 26,8% in 2014 and further down to 26,2% in 2015. Similarly, for all the years the second highest percentages of births were to women aged 25−29 years with stable proportions ranging between 25,7% and 25,8%. Mothers aged 30−34 years had the third highest proportions of births for all years. Their percentages indicated a persistent upward trend from 18,8% of births in 2013 to 20,3% of births occurring in 2015. Taken together, the three age groups (20−34 years) accounted for approximately 72,0% of all births for each of the years of observation. In terms of early childbearing, adolescents aged 15−19 years had higher proportions of births than women aged 35 years and above. In 2013, they accounted for 14,5% of all births, after which they accounted for 13,9% of all births in 2014 and 13,4% of all births in 2015. About 10,0% of births occurred to women aged 35−39 over the three-year period. Lastly, women aged 40−54 years had the lowest percentages of birth occurrences for all years. This is expected as women in this age group begin to complete their childbearing. Median age of the mother from 1998 to 2015
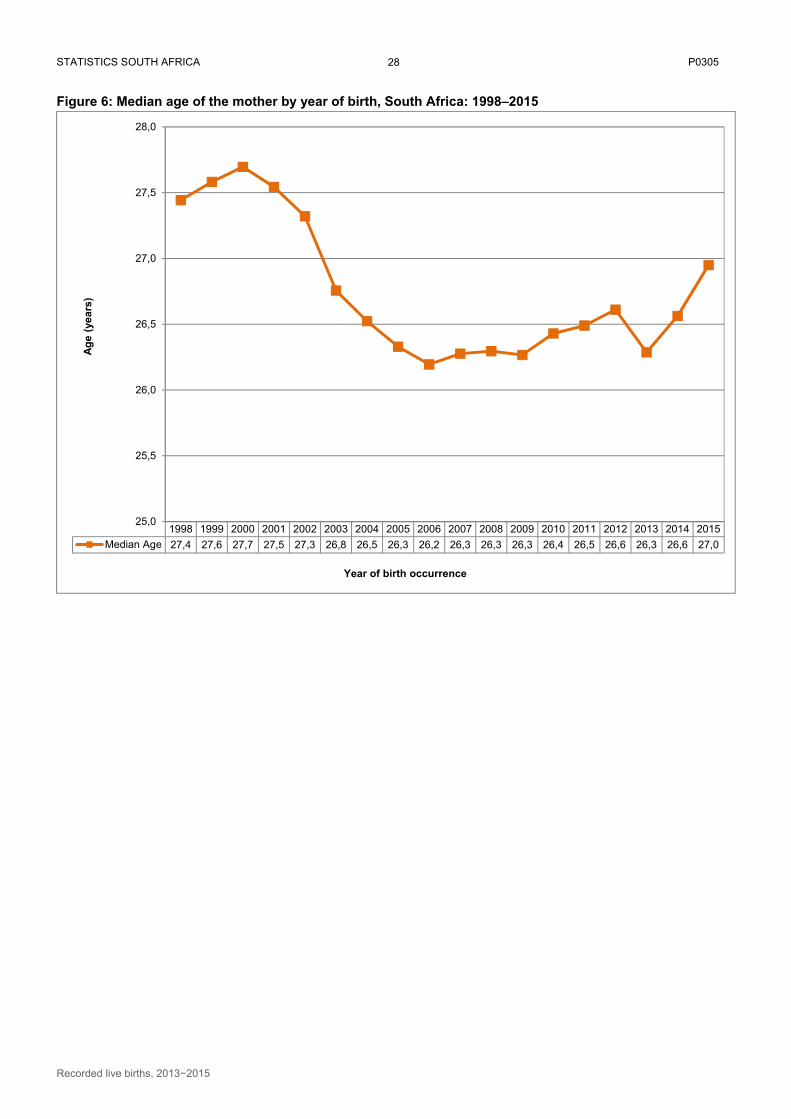
Median age of mothers specifies the exact age at which half of the mothers are younger and half are older. Figure 6 found on page 28 presents the median ages of the mothers for births occurring between 1998 and 2015. In the years 1998 to 2015, the median age of mothers hovered around 26 and 28 years. There was a consistent increase in the median age from 27,4 years in 1998 to a high of 27,7 years in 2000. Between 2003 and 2006, a gradual decrease was observed from 26,8 years in 2003 to 26,2 years in 2006; after that the median age remained somewhat similar up until 2009. It then increased gradually from 26,4 years in 2010 to 26,6 years in 2012, followed by a slight decrease to 26,3 years in 2013. The mean age of mothers was 26,6 years in 2014, increasing to 27,0 years in 2015.
Provincial distribution of births 2013–2015
Figure 7 on page 29 presents the distribution of 2013−2015 birth occurrences by province of birth registration. For all the years, Gauteng was the province with the highest birth registrations, closely followed by KwaZulu-Natal. Likewise, Northern Cape and Free State accounted for the lowest proportions of birth registrations over the three years. Appendix E found on page 46 provides more information on 2013, 2014 and 2015 birth occurrences updated as at 29 February 2016 by province of birth registration and age of the mother. The results show that for all the years, KwaZulu-Natal had the highest number of birth occurrences amongst women aged 15−24 years, while Gauteng had the highest numbers in the 25−44 age categories. In 2013, KwaZulu-Natal recorded the highest number of birth occurrences for women aged 45−49 years and 50−54 years. In 2014 and 2015, Gauteng had the highest numbers of birth occurrences among women aged 45−49 years, whilst Eastern Cape had higher numbers for women aged 50–54 years in both years. Further analyses of the provincial information shows that for all the years, Western Cape and Gauteng were the only provinces with birth occurrences peaking in the 25−29 age group, whereas for the rest of the provinces most birth occurrences were to women aged 20−24 years. A detailed distribution of birth occurrences by province and district municipality of birth registration for the years 2009 to 2015 is presented in Appendix F on pages 47−48. The distribution shows that at the provincial level between 2009 and 2012, total birth occurrences were highest in KwaZulu-Natal. Since 2013, Gauteng has been the province with the highest number of occurrences. District municipality information shows that City of Cape Town metropolitan area was the district with the highest number of birth occurrences from 2009 to 2012. However, over
STATISTICS SOUTH AFRICA P0305
Recorded live births, 2013−2015
10
the years 2013 to 2015, City of Tshwane became the metro with the highest number of registered birth occurrences.
4.3 Birth occurrences as at 02 July 2016
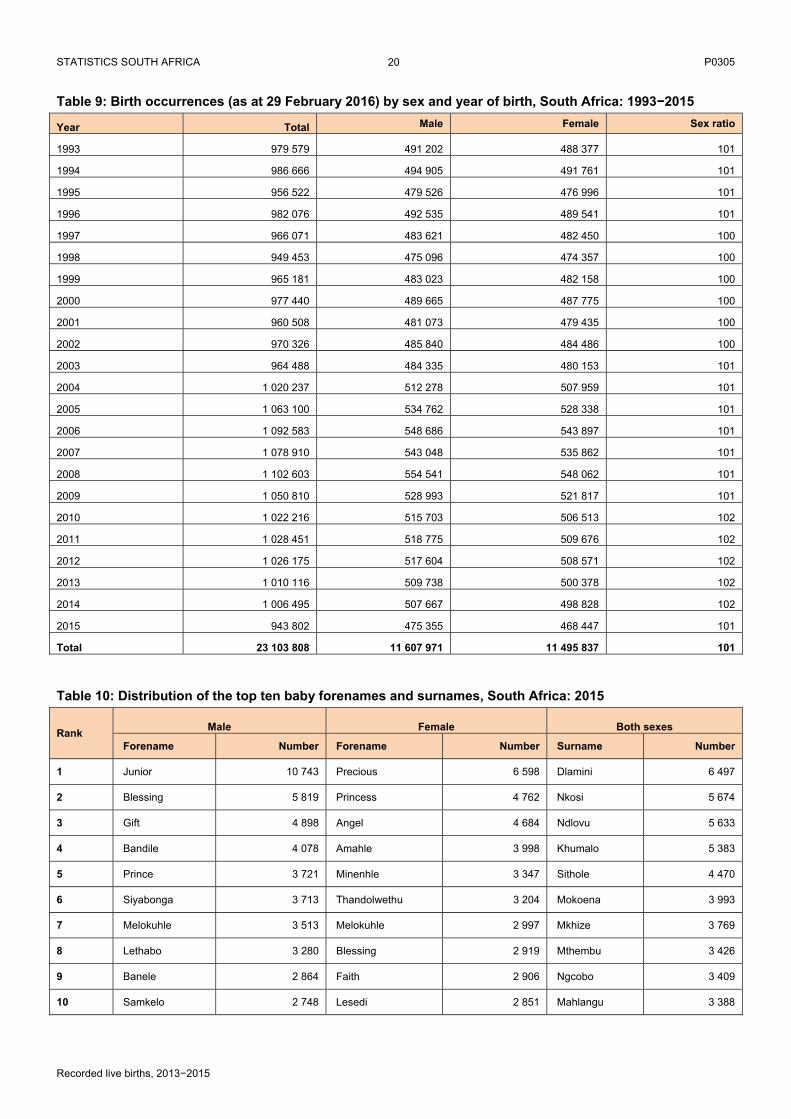
This sub-section provides birth occurrences by sex and year of birth as indicated in the national birth register as at 02 July 2016. Table 9 on page 20 shows that a total of about 23,1 million births that occurred between 1993 and 2015 were registered in the national birth register. On average, over the 23-year period there was a total of 1 004 513 births per year. The number of birth occurrences ranged between a low of 943 802 to a high of 1 102 603, with the lowest number occurring in 2015 and the highest in 2008. It should be noted that since the figures from the population register vary each time data are extracted, the number of birth occurrences for the various years will change when data are extracted at a later date. Sex of the child
Table 9 shows the number of birth occurrences by birth year and sex as well as the sex ratios of birth occurrences. Between 1997 and 2002 the sex ratio of birth occurrences was consistently around 100, indicating equivalent male and female births. For the other years, male births exceeded female births ranging between 101 and 102 male per 100 female births. The sex ratio of birth occurrences was 102 male per 100 female birth occurrences for the years 2010–2014. In 2015, the sex ratio slightly decreased to 101 male births per 100 female births. Month of birth as at 02 July 2015
Figure 8 on page 30 shows the percentage distribution of birth occurrences by year of birth occurrence (2009−2015) and month of birth updated as at 02 July 2016. It is observed that the pattern of birth occurrences by month and year of birth was largely similar over the seven years. The highest proportions of births occurred during the month of March for all the years except in 2010, where September had the highest percentage, while November had the lowest percentage of birth occurrences for all seven years. Appendices G–G7 on pages 49−56 present detailed information on birth occurrences from 1993 to 2015 by month of birth and sex.
4.4 Baby forenames and surnames in South Africa, 2015
The distribution of the top ten forenames and surnames for male and female births which occurred in 2015 is presented in Table 10 on page 20. The process of deriving the top ten forenames and surnames entailed summing up the frequencies for each forename and surname and ranking them from the highest frequency to the lowest frequency. The table shows that the most popular forename for males was Junior, followed by Blessing and Gift. Amongst females, the first three most common forenames were Precious, Princess and Angel, in that order. Melokuhle was the seventh most popular forename for both males and females. Blessing also featured in the top ten forenames for both sexes (second amongst males and eighth amongst females). It is noteworthy that, whereas most of the forenames were from the Nguni languages namely isiZulu, isiXhosa, isiNdebele and siSwati, the first three forenames for both males and females were English names. The most popular forenames in 2015 are generally expressions of pride, joy, thankfulness and appear to be religiously influenced.
The most common surname for both sexes was Dlamini, followed by Nkosi and Ndlovu. The top ten surnames generally come from the Nguni clans. The only non-Nguni surname that was in the top ten in 2015 was Mokoena and it occupied the sixth position.
STATISTICS SOUTH AFRICA P0305
Recorded live births, 2013−2015
11
5. Concluding remarks
Birth registration is the first form of legal identity, and the first right of all children; it enables them to exercise their rights to education, health care and other social services. Statistically, birth registration data allow for evidence-based policy making, implementation, monitoring and evaluation. The data allow the state to plan for the provision of health care, basic education and social welfare for the children. Additionally, the data are important for the development of indicators for monitoring such as the sustainable development goal indicators on maternal mortality rate, under-five mortality rate, neonatal mortality rate and adolescent birth rate which aim to ensure healthy lives and promote well-being for all at all ages. This recorded live birth release provided information on birth registrations and occurrences for births that occurred in the 2013−2015 period in South Africa. To provide information on the trends in birth occurrence and registration, information for the years 1993 to 2012 were included in the release. A total of 1 158 622 births were registered in 2013; 84,9% were current registrations, and 15,1% were late registrations. From a total of 1 142 275 births registered in 2014, 86,8% were current registrations, while 13,2% were late registrations. In 2015, there was a total of 1 084 511 birth registrations and 87,7% of these were current registrations, while 12,3% were late registrations. This shows that current registrations are improving. In 2013, there were 939 011 births registered in the year of occurrence; this increased to 954 385 birth registrations in 2014. For the year 2015, current birth registrations decreased to 919 562. Timeliness of birth registration improved for the births that occurred in 2013; 55,5% were registered during the first 30 completed days of life, whilst 29,3% were registered after 30 days but before one year. In 2014, 60,1% of births were registered within the 30 days, and 26,7% of births registered occurred after 30 days but not later than one year. In 2015, the percentage of births registered within 30 days was 65,1% and 22,6% by the end of one year. As the national population registry is continually being updated, it is expected that the total births for the previous years will increase annually. For example, the total number of registered births was 199 460 in 1993, however, by the year 2015 there were 958 559 registered births which occurred in 1993. Analysis of births by age of the mother shows that most births occurred among women aged 20−29 years and there were slightly more male births than female births with a sex ratio of 102 male birth registrations per 100 female birth registrations; this was consistent for the 2013−2015 year period. The highest birth occurrences were in Gauteng and KwaZulu-Natal and most births occurred in the months of January, March and September for the 2013−2015 period. While an increasing number of births are being registered in the year of birth, there is still a need to increase timeliness of birth registration, meaning that more births should be registered within 30 days of life as stipulated in the Births and Deaths Registration Act. The potential to improve birth registration coverage in South Africa exists as health facilities with maternity and obstetric units now provide registration services and the social grant system’s birth registration prerequisite complements the birth registration network. The Births and Deaths Registration Act also stipulates that birth registration in South Africa is universal, free for first-time applicants and compulsory; this should encourage timely birth registration. There is a need to improve on the quality of the information given during the birth registration process as there is a lot of important information such as the age of the mother and the father’s details missing from the notice of birth forms. This information is important to understand births in South Africa and is needed for evidence-based policy making. It is therefore important that the Department of Home Affairs (DHA) works towards improving the quality of this information by ensuring that the birth notification forms are completed fully and accurately, to allow for in-depth analysis of birth occurrences.
STATISTICS SOUTH AFRICA P0305
Recorded live births, 2013−2015
12
References
DHA (Department of Home Affairs). 2014. Birth Certificates, http://www.dha.gov.za/index.php/civic-services/birth-certificates. Accessed on 2 September 2016.
DHA (Department of Home Affairs). 2015. Address by the Minister of Home Affairs, Malusi Gigaba MP, to the Birth Registration Indaba in Durban on 4 December 2015. http://www.dha.gov.za/index.php/statements-speeches/710-address-by-the-minister-of-home-affairs-malusi-gigaba-mp-to-the-birth-registration-indaba-in-durban-on-4-december-2015. Accessed on 2 September 2016.
Hill, K. 2009. ‘What can be Done with Incomplete Civil Registration Data: Potentials and Pitfalls’, a paper presented at the International Statistics Institute.
Republic of South Africa. 1992. Births and Deaths Registration Act (Act No. 51 of 1992). Pretoria: Government of South Africa.
Republic of South Africa. 2010. Births and Deaths Registration Amendment Act (Act No. 18 of 2010). Pretoria: Government of South Africa.
Stats SA (Statistics South Africa). 2015. Recorded live births, 2013. Pretoria: Statistics South Africa.
UNICEF (United Nations Children’s Fund). 2002. Birth registration: Right from the start. Innocenti digest. Italy: Innocenti UNICEF Research Centre.
UNICEF (United Nations Children’s Fund). 2012. World Day of Prayer and Action for Children: A note on universal birth registration. UNICEF, New York
UNICEF (United Nations Children’s Fund). 2013. Every Child’s Birth Right: Inequities and trends in birth registration, UNICEF, New York. https://www.un.org/ruleoflaw/files/Embargoed_11_Dec_Birth_Registration_report_low_res.pdf. Accessed on 2 September 2016.
UNSTATS (United Nations Statistics). 2016. SDG Indicators Metadata repository, http://unstats.un.org/sdgs/metadata/ Accessed on 2 September 2016.
WHO (World Health Organization). 1992. International classification of diseases and related health problems, Tenth Revision. Geneva: World Health Organization.
Todres, J. 2003. Birth registration: An essential first step toward ensuring the rights of children Human Rights. Brief, 32.
Ensuring the Rights of All Children
STATISTICS SOUTH AFRICA P0305
Recorded live births, 2013−2015
13
Tables
Table 1: Revised birth registrations for 2013−2015
2013 Number of birth registrations
Total births registered January to December 2013 1 166 554
Less births for 2012 and earlier years registered January to February 2013 115 775
1 050 779
Plus births for 2013 and earlier years registered in January and February 2014 107 843
1 158 622
2014
Total births registered January to December 2014 1 161 159
Less births for 2013 and earlier years registered in January and February 2014 107 843
1 053 316
Plus births for 2014 and earlier years registered in January and February 2015 88 959
1 142 275
2015
Total births registered January 2015 to February 2016 1 277 576
Less births for 2014 and earlier years registered in January to February 2015 88 959
1 189 017
Less 2016 births registered in January to February 2016 104 106
1 084 511
Table 2: Distribution of birth registrations by the number of days it took to register the birth, 2013−2015
Number of days Number of birth registrations Percentage* Cumulative percentage
2013 2014 2015 2013 2014 2015 2013 2014 2015
0−30 days 643 480 686 803 706 191 55,5 60,1 65,1 55,5 60,1 65,1
31−364 days 339 952 305 235 245 323 29,3 26,7 22,6 84,9 86,8 87,7
1−14 years 105 769 88 248 76 280 9,1 7,7 7,0 94,0 94,6 94,8
15 years and older 69 421 61 989 56 717 6,0 5,4 5,2 100,0 100,0 100,0
Total 1 158 622 1 142 275 1 084 511 100,0 100,0 100,0
*Percentages may not add up to 100 due to rounding up.
STATISTICS SOUTH AFRICA P0305
Recorded live births, 2013−2015
14
Table 3: Birth registrations by status of registration, South Africa: 1993–2015
Year of registration Number of birth registrations Percentages
Total Current Late Total Current Late
1993 557 995 199 460 358 535 100,0 35,7 64,3
1994 667 107 246 345 420 762 100,0 36,9 63,1
1995 809 439 260 880 548 559 100,0 32,2 67,8
1996 998 798 295 719 703 079 100,0 29,6 70,4
1997 1 046 095 309 723 736 372 100,0 29,6 70,4
1998 1 216 337 273 180 943 157 100,0 22,5 77,5
1999 1 363 800 344 700 1 019 100 100,0 25,3 74,7
2000 1 407 833 409 707 998 126 100,0 29,1 70,9
2001 1 433 432 477 489 955 943 100,0 33,3 66,7
2002 1 517 671 557 573 960 098 100,0 36,7 63,3
2003 1 677 415 621 887 1 055 528 100,0 37,1 62,9
2004 1 475 809 728 283 747 526 100,0 49,3 50,7
2005 1 380 496 793 788 586 708 100,0 57,5 42,5
2006 1 346 119 860 263 485 856 100,0 63,9 36,1
2007 1 199 712 858 866 340 846 100,0 71,6 28,4
2008 1 277 763 915 674 362 089 100,0 71,7 28,3
2009 1 254 707 879 707 375 000 100,0 70,1 29,9
2010 1 294 694 889 691 405 003 100,0 68,7 31,3
2011 1 202 377 911 353 291 024 100,0 75,8 24,2
2012 1 168 403 926 726 241 677 100,0 79,3 20,7
2013 1 158 622 939 011 219 611 100,0 81,0 19,0
2014 1 142 275 954 385 187 890 100,0 83,6 16,4
2015 1 084 511 919 562 164 949 100,0 84,8 15,2
STATISTICS SOUTH AFRICA P0305
Recorded live births, 2013−2015
15
Table 4: Birth registrations by age of the mother and status of registration, South Africa: 2013–2015
Age of mother
2013 2014 2015
Number of birth registrations Percentage Number of birth registrations Percentage Number of birth registrations Percentage
Total Current Late Total Current Late Total Current Late Total Current Late Total Current Late Total Current Late
15─19 193 141 135 975 57 166 100,0 70,4 29,6 178 259 132 413 45 846 100,0 74,3 25,7 164 597 122 965 41 632 100,0 74,7 25,3
20─24 303 190 255 513 47 677 100,0 84,3 15,7 292 833 255 751 37 082 100,0 87,3 12,7 273 984 241 288 32 696 100,0 88,1 11,9
25─29 276 513 241 019 35 494 100,0 87,2 12,8 275 160 246 563 28 597 100,0 89,6 10,4 261 925 236 577 25 348 100,0 90,3 9,7
30─34 202 461 176 549 25 912 100,0 87,2 12,8 208 884 187 467 21 417 100,0 89,7 10,3 205 464 186 470 18 994 100,0 90,8 9,2
35─39 111 248 94 332 16 916 100,0 84,8 15,2 112 163 98 302 13 861 100,0 87,6 12,4 110 583 98 484 12 099 100,0 89,1 10,9
40─44 34 837 27 509 7 328 100,0 79,0 21,0 34 867 28 960 5 907 100,0 83,1 16,9 34 283 29 000 5 283 100,0 84,6 15,4
45─49 3 976 1 872 2 104 100,0 47,1 52,9 3 365 1 865 1 500 100,0 55,4 44,6 3 502 1 989 1 513 100,0 56,8 43,2
50─54 1 226 218 1 008 100,0 17,8 82,2 890 142 748 100,0 16,0 84,0 857 130 727 100,0 15,2 84,8
Unspecified/ outside the 15─54 age range 32 030 6 024 26 006 100,0 18,8 81,2 35 854 2 922 32 932 100,0 8,1 91,9 29 316 2 659 26 657 100,0 9,1 90,9
Total 1 158 622 939 011 219 611 100,0 81,0 19,0 1 142 275 954 385 187 890 100,0 83,6 16,4 1 084 511 919 562 164 949 100,0 84,8 15,2
STATISTICS SOUTH AFRICA P0305
Recorded live births, 2013−2015
16
Table 5: Birth occurrences by year of birth and reference period, South Africa: 1993–2015
Year of birth occurrence Birth occurrences
(as at 29 Feb. 2016) Updated birth occurrences
(as at 02 July 2016)
1993 958 559 979 579
1994 939 949 986 666
1995 932 713 956 522
1996 974 326 982 076
1997 965 117 966 071
1998 905 517 949 453
1999 936 032 965 181
2000 935 139 977 440
2001 929 647 960 508
2002 917 426 970 326
2003 924 989 964 488
2004 1 012 823 1 020 237
2005 1 059 484 1 063 100
2006 1 087 603 1 092 583
2007 1 074 070 1 078 910
2008 1 092 981 1 102 603
2009 1 029 737 1 050 810
2010 1 018 461 1 022 216
2011 1 024 845 1 028 451
2012 1 018 530 1 026 175
2013 1 008 338 1 010 116
2014 1 001 139 1 006 495
2015 919 562 943 802
STATISTICS SOUTH AFRICA P0305
Recorded live births, 2013−2015
17
Table 6: Birth occurrences (as at end of February 2016) by year of birth occurrence and year of birth registration, South Africa: 1993–2015
Year of birth registration
Year of birth occurrence
1993 1994 1995 1996 1997 1998 1999 2000 2001 2002 2003 2004 2005 2006 2007 2008 2009 2010 2011 2012 2013 2014 2015
1993 199 460
1994 63 813 246 345
1995 43 097 73 336 260 880
1996 48 338 51 748 89 566 295 719
1997 50 708 50 627 54 198 93 807 309 723
1998 77 021 61 919 59 942 70 261 105 766 273 180
1999 84 143 84 563 80 362 92 276 104 453 146 055 344 700
2000 85 000 58 170 78 122 92 269 102 179 114 781 178 516 409 707
2001 36 441 43 932 65 682 79 095 87 285 96 809 116 374 192 410 477 489
2002 34 709 34 679 36 685 58 125 73 665 86 859 98 553 118 600 218 256 557 573
2003 53 491 63 494 73 845 69 465 68 289 69 795 72 533 77 256 94 588 194 204 621 887
2004 49 237 58 549 44 477 41 014 38 700 41 372 42 511 43 503 48 197 63 234 165 662 728 283
2005 48 398 36 883 28 386 25 341 23 240 23 162 24 996 24 807 23 798 27 701 43 404 150 546 793 788
2006 20 039 20 002 18 034 18 217 17 623 19 518 21 911 26 516 24 057 26 042 34 601 54 941 154 331 860 263
2007 11 421 10 178 9 472 9 309 9 227 9 897 10 969 14 158 15 200 16 766 20 009 26 769 42 569 126 358 858 866
2008 10 740 11 767 7 955 7 105 6 548 6 691 6 927 8 327 8 722 11 378 14 085 17 869 23 732 40 554 128 336 915 674
2009 4 555 6 024 6 204 5 406 4 489 4 317 4 609 5 128 5 072 6 053 8 322 11 793 14 208 19 510 31 885 101 743 879 707
2010 11 094 6 389 3 913 4 495 3 790 3 483 3 340 3 450 3 535 3 844 4 852 7 623 10 566 13 736 19 323 30 164 91 064 889 691
2011 8 178 5 148 2 991 2 576 2 879 2 624 2 517 2 604 2 632 2 743 3 457 4 763 7 298 10 111 12 628 16 091 23 665 80 079 911 353
2012 6 872 5 346 3 493 2 532 2 151 2 654 2 240 2 310 2 139 2 259 2 644 3 301 4 578 6 599 9 104 10 776 13 065 21 005 74 374 926 726
2013 5 233 4 375 3 257 2 507 1 264 1 605 2 626 2 262 1 904 1 925 2 357 2 800 3 590 4 742 6 914 9 018 9 938 12 978 21 023 66 775 939 011
2014 3 542 3 470 2 620 2 403 1 748 889 1 664 2 531 1 802 1 866 1 950 2 261 2 673 3 241 4 122 6 039 7 390 8 418 10 898 16 147 55 202 954 385
2015 3 029 3 005 2 629 2 404 2 098 1 826 1 046 1 570 2 256 1 838 1 759 1 874 2 151 2 489 2 892 3 476 4 908 6 290 7 197 8 882 14 125 46 754 919 562
Total 958 559 939 949 932 713 974 326 965 117 905 517 936 032 935 139 929 647 917 426 924 989 1 012 823 1 059 484 1 087 603 1 074 070 1 092 981 1 029 737 1 018 461 1 024 845 1 018 530 1 008 338 1 001 139 919 562
STATISTICS SOUTH AFRICA P0305
Recorded live births, 2013−2015
18
Table 7A: Number of births registered within 30 days of occurrence by month of birth occurrence and month of birth registration, South Africa: 2013
Month of birth registration
2013 Month of birth occurrence
Jan. Feb. Mar. Apr. May Jun. Jul. Aug. Sep. Oct. Nov. Dec. Total
January 34 950 34 950
February 20 566 29 669 50 235
March 70 20 712 29 533 50 315
April 24 705 32 872 57 577
May 20 943 35 116 56 059
June 19 364 28 729 48 093
July 24 935 35 086 60 021
August 19 965 34 058 54 023
September 21 467 33 982 55 449
October 24 895 34 068 58 963
November 18 282 31 114 49 396
December 17 536 27 195 44 731
January 23 668 23 668
Total 55 586 50 381 54 238 53 815 54 480 53 664 55 051 55 525 58 877 52 350 48 650 50 863 643 480
Table 7B: Number of births registered within 30 days of occurrence by month of birth occurrence and month of birth registration, South Africa: 2014
Month of birth registration
2014 Month of birth occurrence
Jan. Feb. Mar. Apr. May Jun. Jul. Aug. Sep. Oct. Nov. Dec. Total
January 36 776 36 776
February 21 072 32 804 53 876
March 19 765 36 662 56 427
April 23 430 29 632 53 062
May 25 262 34 150 59 412
June 22 006 32 998 55 004
July 24 027 37 714 61 741
August 20 658 35 042 55 700
September 23 958 39 259 63 217
October 25 182 38 320 63 502
November 18 867 32 894 51 761
December 20 434 31 151 51 585
January 24 740 24 740
Total 57 848 52 569 60 092 54 894 56 156 57 025 58 372 59 000 64 441 57 187 53 328 55 891 686 803
STATISTICS SOUTH AFRICA P0305
Recorded live births, 2013−2015
19
Table 7C: Number of births registered within 30 days of occurrence by month of birth occurrence and month of birth registration, South Africa: 2015
Month of birth registration
2015 Month of birth occurrence
Jan. Feb. Mar. Apr. May Jun. Jul. Aug. Sep. Oct. Nov. Dec. Total
January 40 164 40 164
February 24 052 35 004 59 056
March 62 23 208 42 313 65 583
April 21 403 36 258 57 661
May 22 595 36 286 58 881
June 22 945 36 247 59 192
July 23 031 36 408 59 439
August 19 740 36 425 56 165
September 21 470 38 679 60 149
October 23 876 36 346 60 222
November 18 152 35 527 53 679
December 17 949 36 284 54 233
January 21 767 21 767
Total 64 278 58 212 63 716 58 853 59 231 59 278 56 148 57 895 62 555 54 498 53 476 58 051 706 191
Table 8: Number and percentage of births by age of mother, South Africa: 2013–2015
Age of mother
2013 2014 2015
Number of birth occurrences Percentage
Number of birth occurrences Percentage
Number of birth occurrences Percentage
15–19 135 975 14,5 132 413 13,9 122 965 13,4
20–24 255 513 27,2 255 751 26,8 241 288 26,2
25–29 241 019 25,7 246 563 25,8 236 577 25,7
30–34 176 549 18,8 187 467 19,6 186 470 20,3
35–39 94 332 10,0 98 302 10,3 98 484 10,7
40–44 27 509 2,9 28 960 3,0 29 000 3,2
45–49 1 872 0,2 1 865 0,2 1 989 0,2
50–54 218 0,0 142 0,0 130 0,0
Unspecified/outside the 15–54 age range 6 024 0,6 2 922 0,3 2 659 0,3
Total 939 011 100,0 954 385 100,0 919 562 100,0
STATISTICS SOUTH AFRICA P0305
Recorded live births, 2013−2015
20
Table 9: Birth occurrences (as at 29 February 2016) by sex and year of birth, South Africa: 1993−2015
Year Total Male Female Sex ratio
1993 979 579 491 202 488 377 101
1994 986 666 494 905 491 761 101
1995 956 522 479 526 476 996 101
1996 982 076 492 535 489 541 101
1997 966 071 483 621 482 450 100
1998 949 453 475 096 474 357 100
1999 965 181 483 023 482 158 100
2000 977 440 489 665 487 775 100
2001 960 508 481 073 479 435 100
2002 970 326 485 840 484 486 100
2003 964 488 484 335 480 153 101
2004 1 020 237 512 278 507 959 101
2005 1 063 100 534 762 528 338 101
2006 1 092 583 548 686 543 897 101
2007 1 078 910 543 048 535 862 101
2008 1 102 603 554 541 548 062 101
2009 1 050 810 528 993 521 817 101
2010 1 022 216 515 703 506 513 102
2011 1 028 451 518 775 509 676 102
2012 1 026 175 517 604 508 571 102
2013 1 010 116 509 738 500 378 102
2014 1 006 495 507 667 498 828 102
2015 943 802 475 355 468 447 101
Total 23 103 808 11 607 971 11 495 837 101
Table 10: Distribution of the top ten baby forenames and surnames, South Africa: 2015
Rank Male Female Both sexes
Forename Number Forename Number Surname Number
1 Junior 10 743 Precious 6 598 Dlamini 6 497
2 Blessing 5 819 Princess 4 762 Nkosi 5 674
3 Gift 4 898 Angel 4 684 Ndlovu 5 633
4 Bandile 4 078 Amahle 3 998 Khumalo 5 383
5 Prince 3 721 Minenhle 3 347 Sithole 4 470
6 Siyabonga 3 713 Thandolwethu 3 204 Mokoena 3 993
7 Melokuhle 3 513 Melokuhle 2 997 Mkhize 3 769
8 Lethabo 3 280 Blessing 2 919 Mthembu 3 426
9 Banele 2 864 Faith 2 906 Ngcobo 3 409
10 Samkelo 2 748 Lesedi 2 851 Mahlangu 3 388
STATISTICS SOUTH AFRICA P0305
Recorded live births, 2013−2015
21
Figures
Figure 1: Birth registrations by status of registration, South Africa: 1993–2015
200 000
400 000
600 000
800 000
1 000 000
1 200 000
1 400 000
1 600 000
1 800 000
199
3
199
4
199
5
199
6
199
7
199
8
199
9
200
0
200
1
200
2
200
3
200
4
200
5
200
6
200
7
200
8
200
9
201
0
201
1
201
2
201
3
201
4
201
5
Nu
mb
er o
f b
irth
s
Year of birth registration
Current Late Total
STATISTICS SOUTH AFRICA P0305
Recorded live births, 2013−2015
22
Figure 2: Late birth registrations by year of birth, South Africa: 1981–2015
10 000
20 000
30 000
40 000
50 000
60 000
70 000
80 000
90 000
100 00019
81
198
2
198
3
198
4
198
5
198
6
198
7
198
8
198
9
199
0
199
1
199
2
199
3
199
4
199
5
199
6
199
7
199
8
199
9
200
0
200
1
200
2
200
3
200
4
200
5
200
6
200
7
200
8
200
9
201
0
201
1
201
2
201
3
201
4
Nu
mb
er o
f b
irth
s
Year of birth occurrence
Late 2010 birth registrations Late 2011 birth registrations Late 2012 birth registrations
Late 2013 birth registrations Late 2014 birth registrations Late 2015 birth registrations
STATISTICS SOUTH AFRICA P0305
Recorded live births, 2013−2015
23
Figure 3: Birth registrations by age of the mother and status of registration, South Africa: 2013–2015*
*Excluding births where mothers’ ages were not stated or were outside the age range of 15–54 years.
0.0
1.0
2.0
3.0
4.0
5.0
6.0
7.0
8.0
9.0
15−
19
20−
24
25−
29
30−
34
35−
39
40−
44
45−
49
50−
54
15−
19
20−
24
25−
29
30−
34
35−
39
40−
44
45−
49
50−
54
15−
19
20−
24
25−
29
30−
34
35−
39
40−
44
45−
49
50−
54
Per
cen
atg
e o
f b
irth
s
Age group of mother
Current Late
2013 2014 2015
STATISTICS SOUTH AFRICA P0305
Recorded live births, 2013−2015
24
Figure 4A: Birth registrations by province of birth registration and status of registration, South Africa: 2013
Western Cape Eastern Cape Northern Cape Free State KwaZulu-Natal North West Gauteng Mpumalanga Limpopo Unspecified
Total 101 676 132 520 26 582 55 712 236 499 78 269 296 621 88 591 134 472 7 680
0−30 days 73 089 76 096 19 106 39 584 114 068 41 378 155 555 47 360 71 273 5 971
31−364 days 23 038 40 884 5 774 11 108 91 053 28 287 51 847 32 331 54 251 1 379
1−14 years 5 545 15 527 1 700 4 997 31 351 8 560 19 943 8 892 8 924 330
15 years and above 4 13 2 23 27 44 69 276 8 24 0
50 000
100 000
150 000
200 000
250 000
300 000
350 000N
um
ber
of
bir
ths
Province of birth registration
STATISTICS SOUTH AFRICA P0305
Recorded live births, 2013−2015
25
Figure 4B: Birth registrations by province of birth registration and status of registration, South Africa: 2014
Western Cape Eastern Cape Northern Cape Free State KwaZulu-Natal North West Gauteng Mpumalanga Limpopo Unspecified
Total 106 325 131 803 26 313 55 162 231 722 76 848 285 813 90 948 134 841 2 500
0−30 days 79 462 84 318 20 789 42 360 118 766 49 246 155 898 52 688 81 308 1 968
31−364 days 21 988 34 760 4 359 9 316 87 479 21 469 49 219 30 136 46 086 423
1−14 years 4 871 12 713 1 165 3 474 25 443 6 117 18 855 8 090 7 411 109
15 years andabove 4 12 0 12 34 16 61 841 34 36 0
50 000
100 000
150 000
200 000
250 000
300 000
350 000
Nu
mb
er o
f b
irth
s
Province of birth registration
STATISTICS SOUTH AFRICA P0305
Recorded live births, 2013−2015
26
Figure 4C: Birth registrations by province of birth registration and status of registration, South Africa: 2015*
Western Cape Eastern Cape Northern Cape Free State KwaZulu-Natal North West Gauteng Mpumalanga Limpopo Unspecified
Total 103 050 125 018 25 650 51 943 213 992 72 656 273 410 83 205 131 968 3 619
0−30 days 79 013 85 244 21 272 41 836 120 085 52 649 157 251 54 362 91 639 2 840
31−364 days 19 850 28 380 3 405 6 653 73 584 15 612 40 824 22 170 34 202 643
1−14 years 4 186 11 387 973 3 445 20 295 4 379 18 715 6 648 6 116 136
15 years andabove 1 7 0 9 28 16 56 620 25 11 0
50 000
100 000
150 000
200 000
250 000
300 000
Nu
mb
er o
f b
irth
s
Province of birth registration
STATISTICS SOUTH AFRICA P0305
Recorded live births, 2013−2015
27
Figure 5: Sex ratios by province of birth registration, South Africa: 2013–2015*
* Sex ratios for 2013−2015 have been rounded off.
Western Cape Eastern Cape Northern Cape Free State KwaZulu- Natal North West Gauteng Mpumalanga Limpopo Total
2013 103 102 104 103 101 101 104 101 101 102
2014 103 102 101 101 101 102 105 101 102 102
2015 102 102 103 102 102 101 105 100 101 102
97
98
99
100
101
102
103
104
105
106
Mal
es p
er 1
00 f
emal
es
Province of birth registration
STATISTICS SOUTH AFRICA P0305
Recorded live births, 2013−2015
28
Figure 6: Median age of the mother by year of birth, South Africa: 1998–2015
1998 1999 2000 2001 2002 2003 2004 2005 2006 2007 2008 2009 2010 2011 2012 2013 2014 2015
Median Age 27,4 27,6 27,7 27,5 27,3 26,8 26,5 26,3 26,2 26,3 26,3 26,3 26,4 26,5 26,6 26,3 26,6 27,0
25,0
25,5
26,0
26,5
27,0
27,5
28,0
Ag
e (y
ears
)
Year of birth occurrence
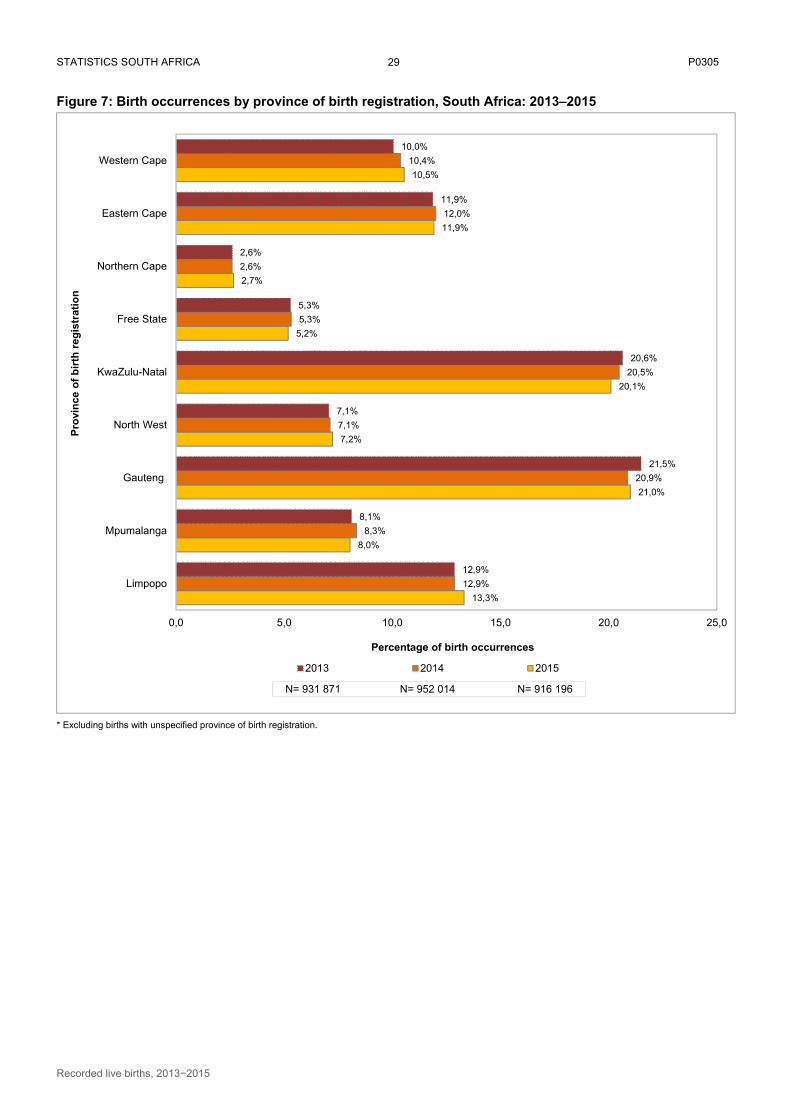
STATISTICS SOUTH AFRICA P0305
Recorded live births, 2013−2015
29
Figure 7: Birth occurrences by province of birth registration, South Africa: 2013–2015
* Excluding births with unspecified province of birth registration.
13,3%
8,0%
21,0%
7,2%
20,1%
5,2%
2,7%
11,9%
10,5%
12,9%
8,3%
20,9%
7,1%
20,5%
5,3%
2,6%
12,0%
10,4%
12,9%
8,1%
21,5%
7,1%
20,6%
5,3%
2,6%
11,9%
10,0%
0,0 5,0 10,0 15,0 20,0 25,0
Limpopo
Mpumalanga
Gauteng
North West
KwaZulu-Natal
Free State
Northern Cape
Eastern Cape
Western Cape
Percentage of birth occurrences
Pro
vin
ce o
f b
irth
reg
istr
atio
n
2013 2014 2015
N= 931 871 N= 952 014 N= 916 196
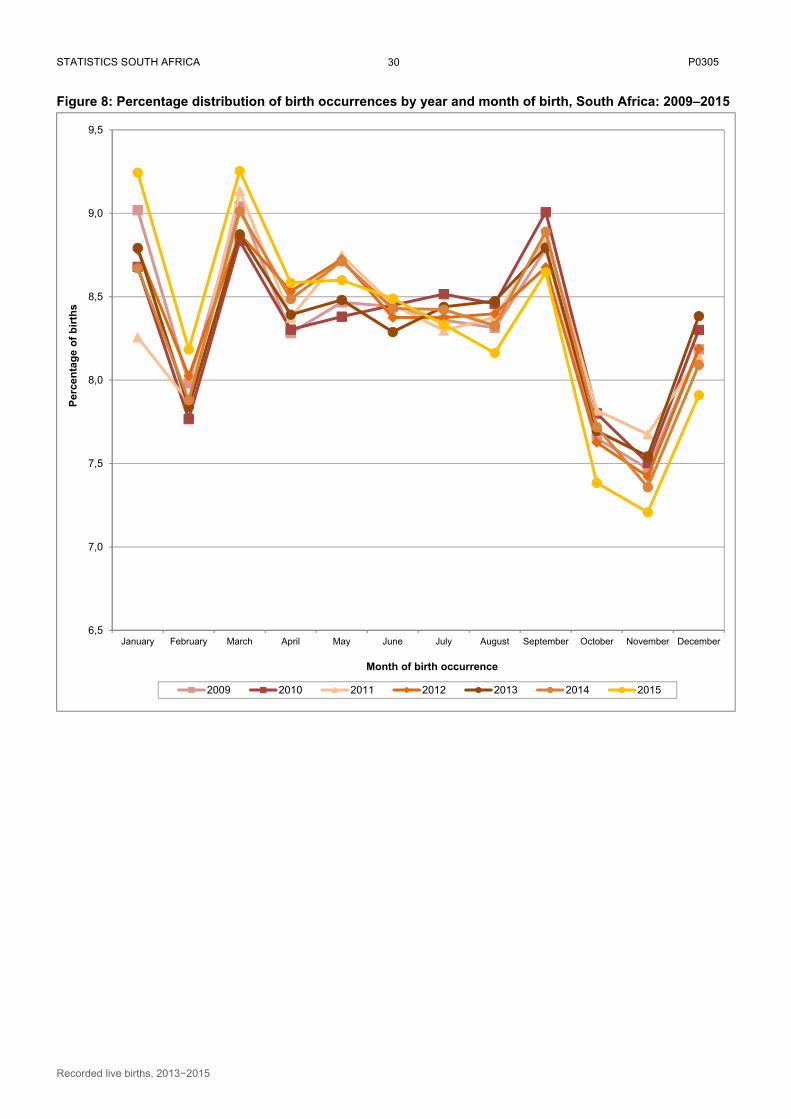
STATISTICS SOUTH AFRICA P0305
Recorded live births, 2013−2015
30
Figure 8: Percentage distribution of birth occurrences by year and month of birth, South Africa: 2009–2015
6,5
7,0
7,5
8,0
8,5
9,0
9,5
January February March April May June July August September October November December
Per
cen
tag
e o
f b
irth
s
Month of birth occurrence
2009 2010 2011 2012 2013 2014 2015
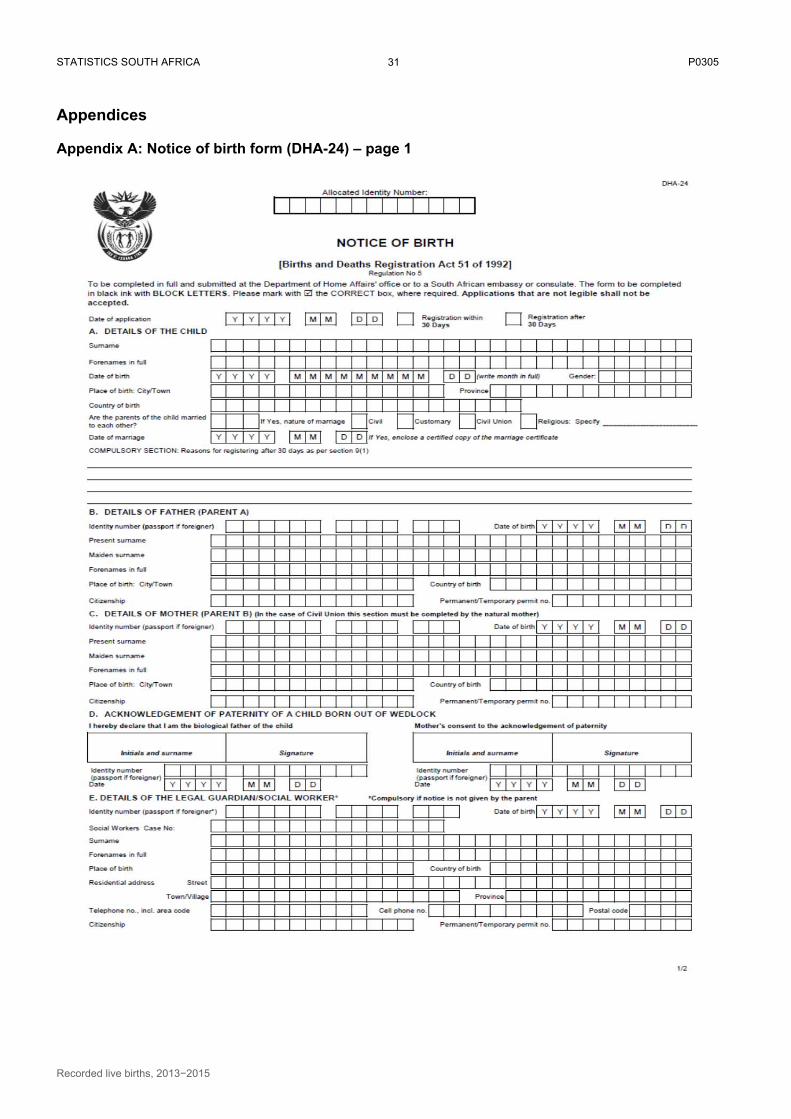
STATISTICS SOUTH AFRICA P0305
Recorded live births, 2013−2015
31
Appendices
Appendix A: Notice of birth form (DHA-24) – page 1
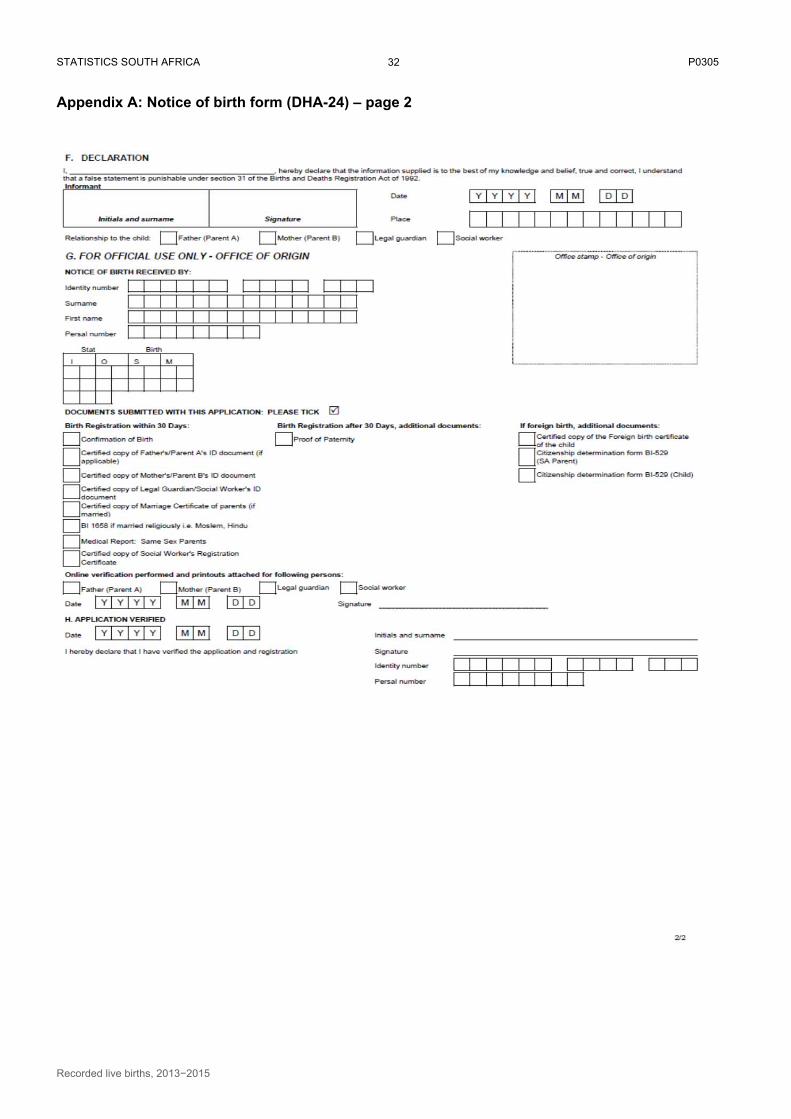
STATISTICS SOUTH AFRICA P0305
Recorded live births, 2013−2015
32
Appendix A: Notice of birth form (DHA-24) – page 2

STATISTICS SOUTH AFRICA P0305
Recorded live births, 2013−2015
33
Appendix B: Total birth registrations for 2013 by year of birth occurrence, province and district municipality*
Province and district municipality
Grand Total
2013 (current)
Late registrations
Total 2012 2011 2010 2009 2008 and
below
Total - South Africa 1 158 622 939 011 219 611 66 775 21 023 12 978 9 938 108 897
Western Cape
Cape Winelands 13 855 12 856 999 458 139 86 67 249
Central Karoo 1 317 1 254 63 34 6 3 7 13
City of Cape Town 66 087 60 848 5 239 2 336 828 551 385 1 139
Eden 10 768 10 012 756 369 100 54 38 195
Overberg 3 611 3 295 316 136 49 33 17 81
West Coast 6 038 5 332 706 385 84 67 34 136
Total 101 676 93 597 8 079 3 718 1 206 794 548 1 813
Eastern Cape
Alfred Nzo 16 868 13 030 3 838 1 774 503 360 270 931
Amatole 17 923 14 697 3 226 1 236 466 324 261 939
Buffalo City 12 390 11 458 932 399 132 97 74 230
Cacadu 6 194 5 193 1 001 434 168 89 65 245
Chris Hani 15 126 12 800 2 326 1 125 374 206 155 466
Joe Gqabi 5 925 4 897 1 028 448 140 97 71 272
Nelson Mandela Bay Metro 20 615 18 310 2 305 1 057 374 214 168 492
O.R. Tambo 37 479 30 231 7 248 3 358 1 037 573 474 1 806
Total 132 520 110 616 21 904 9 831 3 194 1 960 1 538 5 381
Northern Cape
Frances Baard 9 730 8 896 834 311 102 79 55 287
John Taolo Gaetsewe 6 313 5 822 491 265 47 45 23 111
Namakwa 1 827 1 727 100 34 18 9 7 32
Pixley ka Seme 3 489 3 069 420 178 49 33 39 121
Siyanda 5 223 4 646 577 252 59 49 22 195
Total 26 582 24 160 2 422 1 040 275 215 146 746
Free State
Fezile Dabi 8 474 7 298 1 176 425 127 97 85 442
Lejweleputswa 12 531 10 854 1 677 543 161 132 121 720
Mangaung 16 720 15 366 1 354 445 162 90 85 572
Thabo Mofutsanyane 15 523 13 846 1 677 484 165 134 104 790
Xhariep 2 464 1 953 511 164 53 48 32 214
Total 55 712 49 317 6 395 2 061 668 501 427 2 738
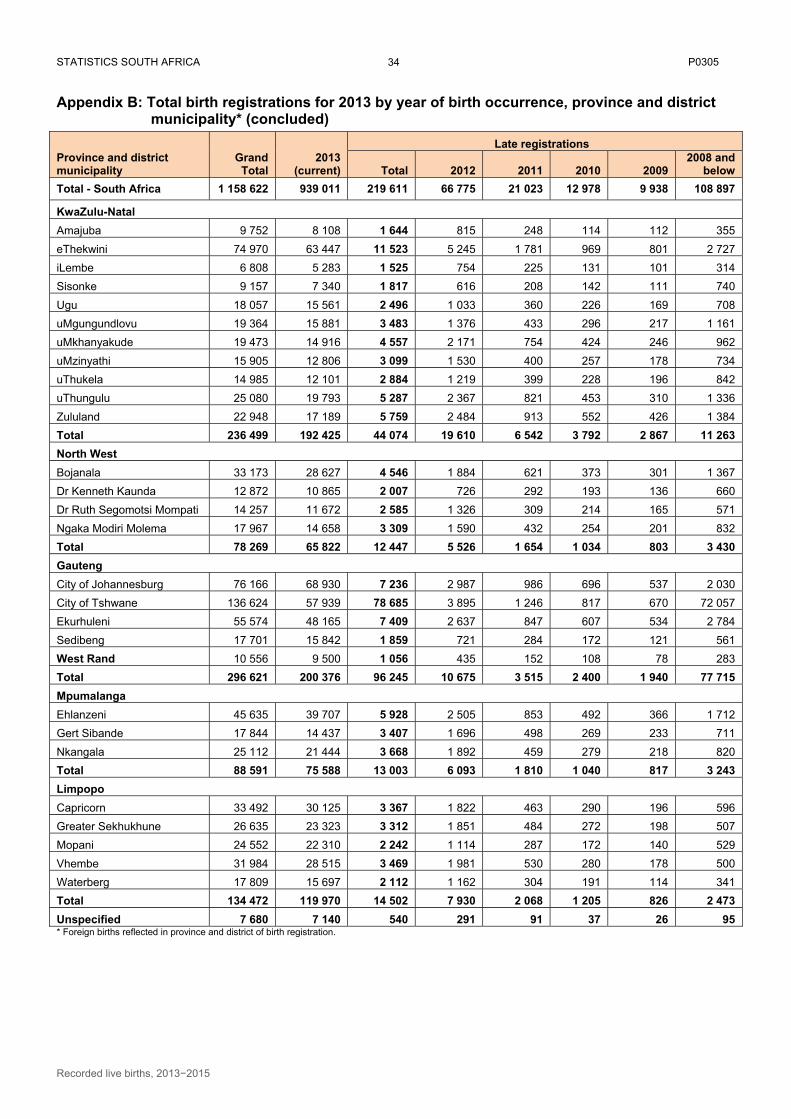
STATISTICS SOUTH AFRICA P0305
Recorded live births, 2013−2015
34
Appendix B: Total birth registrations for 2013 by year of birth occurrence, province and district municipality* (concluded)
* Foreign births reflected in province and district of birth registration.
Province and district municipality
Grand
Total
2013
(current)
Late registrations
Total 2012 2011 2010 2009 2008 and
below
Total - South Africa 1 158 622 939 011 219 611 66 775 21 023 12 978 9 938 108 897
KwaZulu-Natal
Amajuba 9 752 8 108 1 644 815 248 114 112 355
eThekwini 74 970 63 447 11 523 5 245 1 781 969 801 2 727
iLembe 6 808 5 283 1 525 754 225 131 101 314
Sisonke 9 157 7 340 1 817 616 208 142 111 740
Ugu 18 057 15 561 2 496 1 033 360 226 169 708
uMgungundlovu 19 364 15 881 3 483 1 376 433 296 217 1 161
uMkhanyakude 19 473 14 916 4 557 2 171 754 424 246 962
uMzinyathi 15 905 12 806 3 099 1 530 400 257 178 734
uThukela 14 985 12 101 2 884 1 219 399 228 196 842
uThungulu 25 080 19 793 5 287 2 367 821 453 310 1 336
Zululand 22 948 17 189 5 759 2 484 913 552 426 1 384
Total 236 499 192 425 44 074 19 610 6 542 3 792 2 867 11 263
North West
Bojanala 33 173 28 627 4 546 1 884 621 373 301 1 367
Dr Kenneth Kaunda 12 872 10 865 2 007 726 292 193 136 660
Dr Ruth Segomotsi Mompati 14 257 11 672 2 585 1 326 309 214 165 571
Ngaka Modiri Molema 17 967 14 658 3 309 1 590 432 254 201 832
Total 78 269 65 822 12 447 5 526 1 654 1 034 803 3 430
Gauteng
City of Johannesburg 76 166 68 930 7 236 2 987 986 696 537 2 030
City of Tshwane 136 624 57 939 78 685 3 895 1 246 817 670 72 057
Ekurhuleni 55 574 48 165 7 409 2 637 847 607 534 2 784
Sedibeng 17 701 15 842 1 859 721 284 172 121 561
West Rand 10 556 9 500 1 056 435 152 108 78 283
Total 296 621 200 376 96 245 10 675 3 515 2 400 1 940 77 715
Mpumalanga
Ehlanzeni 45 635 39 707 5 928 2 505 853 492 366 1 712
Gert Sibande 17 844 14 437 3 407 1 696 498 269 233 711
Nkangala 25 112 21 444 3 668 1 892 459 279 218 820
Total 88 591 75 588 13 003 6 093 1 810 1 040 817 3 243
Limpopo
Capricorn 33 492 30 125 3 367 1 822 463 290 196 596
Greater Sekhukhune 26 635 23 323 3 312 1 851 484 272 198 507
Mopani 24 552 22 310 2 242 1 114 287 172 140 529
Vhembe 31 984 28 515 3 469 1 981 530 280 178 500
Waterberg 17 809 15 697 2 112 1 162 304 191 114 341
Total 134 472 119 970 14 502 7 930 2 068 1 205 826 2 473
Unspecified 7 680 7 140 540 291 91 37 26 95
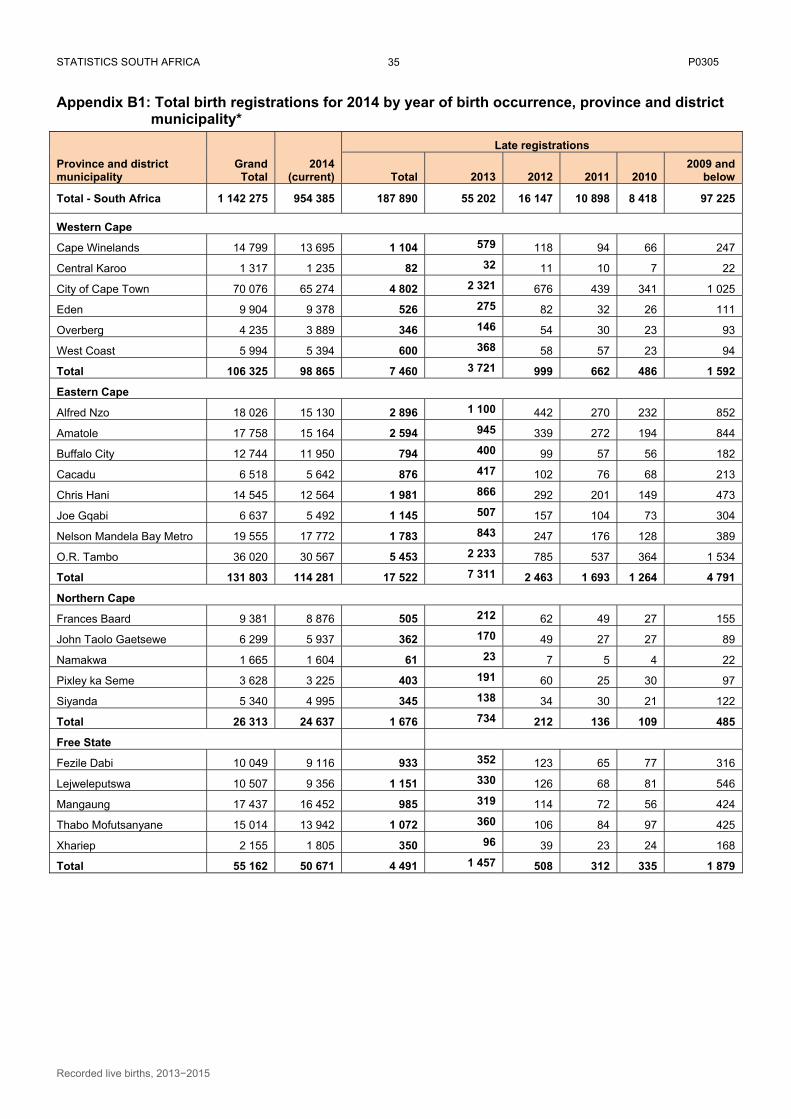
STATISTICS SOUTH AFRICA P0305
Recorded live births, 2013−2015
35
Appendix B1: Total birth registrations for 2014 by year of birth occurrence, province and district municipality*
Province and district municipality
Grand Total
2014 (current)
Late registrations
Total 2013 2012 2011 2010 2009 and
below
Total - South Africa 1 142 275 954 385 187 890 55 202 16 147 10 898 8 418 97 225
Western Cape
Cape Winelands 14 799 13 695 1 104 579 118 94 66 247
Central Karoo 1 317 1 235 82 32 11 10 7 22
City of Cape Town 70 076 65 274 4 802 2 321 676 439 341 1 025
Eden 9 904 9 378 526 275 82 32 26 111
Overberg 4 235 3 889 346 146 54 30 23 93
West Coast 5 994 5 394 600 368 58 57 23 94
Total 106 325 98 865 7 460 3 721 999 662 486 1 592
Eastern Cape
Alfred Nzo 18 026 15 130 2 896 1 100 442 270 232 852
Amatole 17 758 15 164 2 594 945 339 272 194 844
Buffalo City 12 744 11 950 794 400 99 57 56 182
Cacadu 6 518 5 642 876 417 102 76 68 213
Chris Hani 14 545 12 564 1 981 866 292 201 149 473
Joe Gqabi 6 637 5 492 1 145 507 157 104 73 304
Nelson Mandela Bay Metro 19 555 17 772 1 783 843 247 176 128 389
O.R. Tambo 36 020 30 567 5 453 2 233 785 537 364 1 534
Total 131 803 114 281 17 522 7 311 2 463 1 693 1 264 4 791
Northern Cape
Frances Baard 9 381 8 876 505 212 62 49 27 155
John Taolo Gaetsewe 6 299 5 937 362 170 49 27 27 89
Namakwa 1 665 1 604 61 23 7 5 4 22
Pixley ka Seme 3 628 3 225 403 191 60 25 30 97
Siyanda 5 340 4 995 345 138 34 30 21 122
Total 26 313 24 637 1 676 734 212 136 109 485
Free State
Fezile Dabi 10 049 9 116 933 352 123 65 77 316
Lejweleputswa 10 507 9 356 1 151 330 126 68 81 546
Mangaung 17 437 16 452 985 319 114 72 56 424
Thabo Mofutsanyane 15 014 13 942 1 072 360 106 84 97 425
Xhariep 2 155 1 805 350 96 39 23 24 168
Total 55 162 50 671 4 491 1 457 508 312 335 1 879
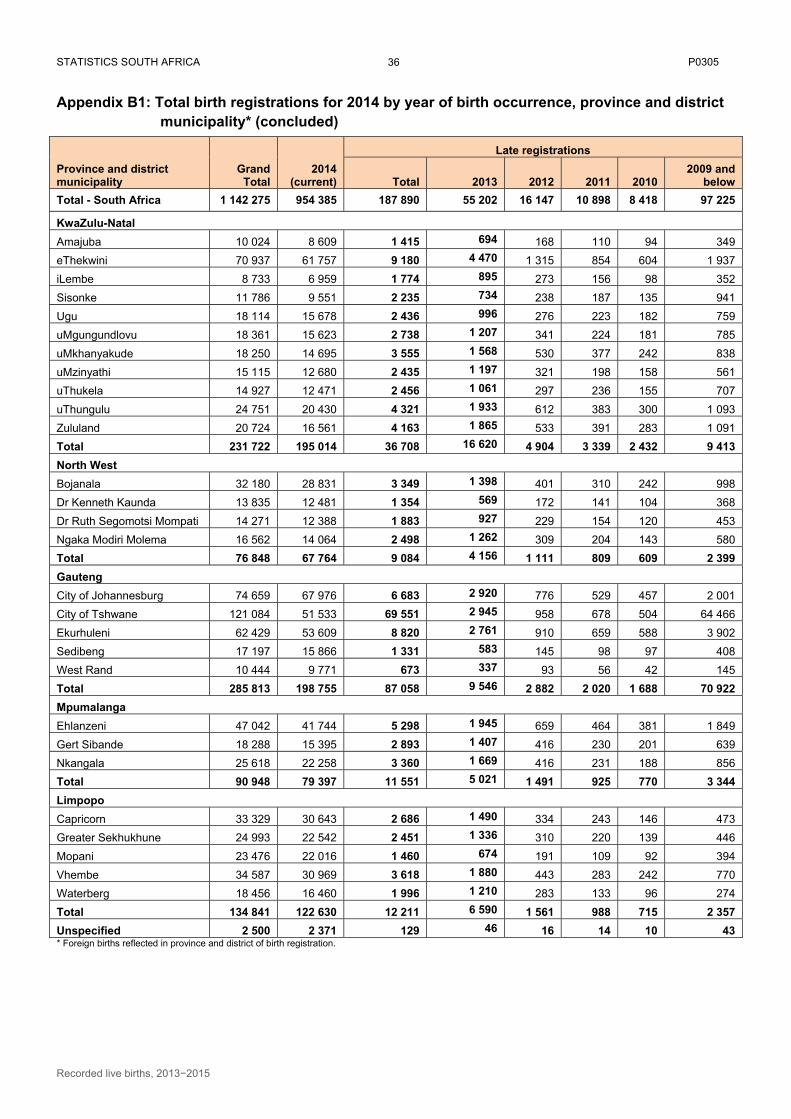
STATISTICS SOUTH AFRICA P0305
Recorded live births, 2013−2015
36
Appendix B1: Total birth registrations for 2014 by year of birth occurrence, province and district municipality* (concluded)
Province and district municipality
Grand Total
2014 (current)
Late registrations
Total 2013 2012 2011 2010 2009 and
below
Total - South Africa 1 142 275 954 385 187 890 55 202 16 147 10 898 8 418 97 225
KwaZulu-Natal
Amajuba 10 024 8 609 1 415 694 168 110 94 349
eThekwini 70 937 61 757 9 180 4 470 1 315 854 604 1 937
iLembe 8 733 6 959 1 774 895 273 156 98 352
Sisonke 11 786 9 551 2 235 734 238 187 135 941
Ugu 18 114 15 678 2 436 996 276 223 182 759
uMgungundlovu 18 361 15 623 2 738 1 207 341 224 181 785
uMkhanyakude 18 250 14 695 3 555 1 568 530 377 242 838
uMzinyathi 15 115 12 680 2 435 1 197 321 198 158 561
uThukela 14 927 12 471 2 456 1 061 297 236 155 707
uThungulu 24 751 20 430 4 321 1 933 612 383 300 1 093
Zululand 20 724 16 561 4 163 1 865 533 391 283 1 091
Total 231 722 195 014 36 708 16 620 4 904 3 339 2 432 9 413
North West
Bojanala 32 180 28 831 3 349 1 398 401 310 242 998
Dr Kenneth Kaunda 13 835 12 481 1 354 569 172 141 104 368
Dr Ruth Segomotsi Mompati 14 271 12 388 1 883 927 229 154 120 453
Ngaka Modiri Molema 16 562 14 064 2 498 1 262 309 204 143 580
Total 76 848 67 764 9 084 4 156 1 111 809 609 2 399
Gauteng
City of Johannesburg 74 659 67 976 6 683 2 920 776 529 457 2 001
City of Tshwane 121 084 51 533 69 551 2 945 958 678 504 64 466
Ekurhuleni 62 429 53 609 8 820 2 761 910 659 588 3 902
Sedibeng 17 197 15 866 1 331 583 145 98 97 408
West Rand 10 444 9 771 673 337 93 56 42 145
Total 285 813 198 755 87 058 9 546 2 882 2 020 1 688 70 922
Mpumalanga
Ehlanzeni 47 042 41 744 5 298 1 945 659 464 381 1 849
Gert Sibande 18 288 15 395 2 893 1 407 416 230 201 639
Nkangala 25 618 22 258 3 360 1 669 416 231 188 856
Total 90 948 79 397 11 551 5 021 1 491 925 770 3 344
Limpopo
Capricorn 33 329 30 643 2 686 1 490 334 243 146 473
Greater Sekhukhune 24 993 22 542 2 451 1 336 310 220 139 446
Mopani 23 476 22 016 1 460 674 191 109 92 394
Vhembe 34 587 30 969 3 618 1 880 443 283 242 770
Waterberg 18 456 16 460 1 996 1 210 283 133 96 274
Total 134 841 122 630 12 211 6 590 1 561 988 715 2 357
Unspecified 2 500 2 371 129 46 16 14 10 43 * Foreign births reflected in province and district of birth registration.
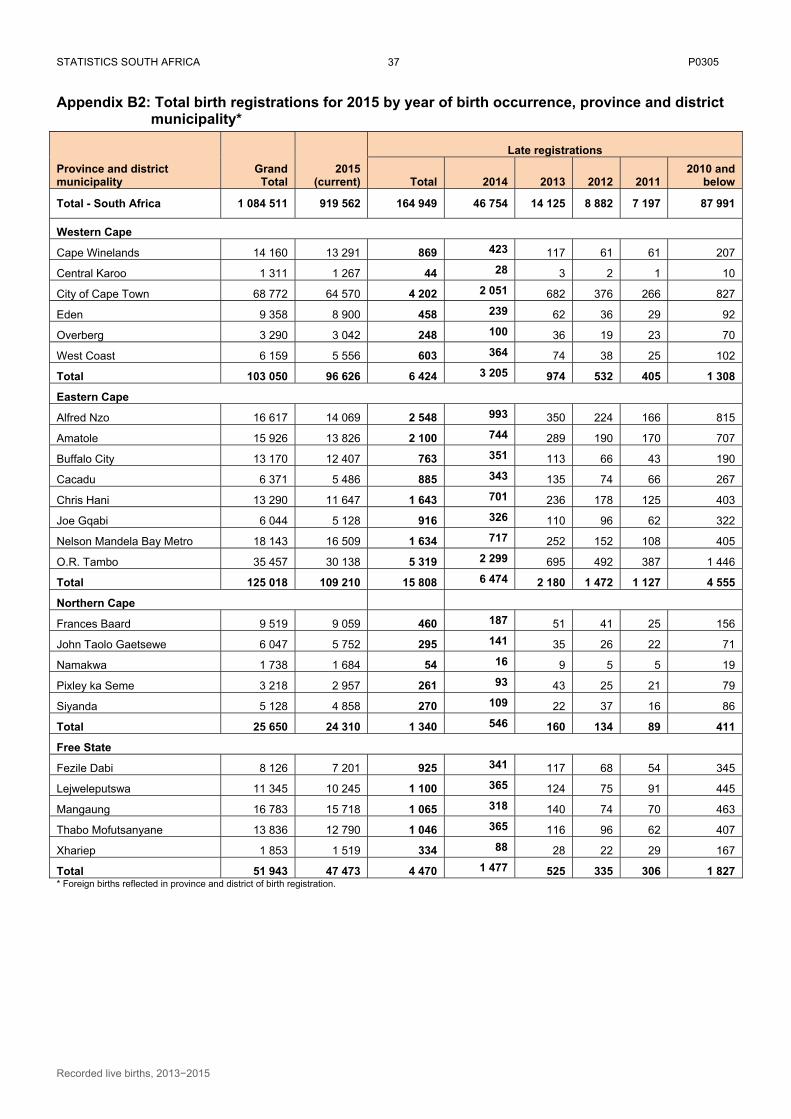
STATISTICS SOUTH AFRICA P0305
Recorded live births, 2013−2015
37
Appendix B2: Total birth registrations for 2015 by year of birth occurrence, province and district municipality*
Province and district municipality
Grand Total
2015 (current)
Late registrations
Total 2014 2013 2012 2011 2010 and
below
Total - South Africa 1 084 511 919 562 164 949 46 754 14 125 8 882 7 197 87 991
Western Cape
Cape Winelands 14 160 13 291 869 423 117 61 61 207
Central Karoo 1 311 1 267 44 28 3 2 1 10
City of Cape Town 68 772 64 570 4 202 2 051 682 376 266 827
Eden 9 358 8 900 458 239 62 36 29 92
Overberg 3 290 3 042 248 100 36 19 23 70
West Coast 6 159 5 556 603 364 74 38 25 102
Total 103 050 96 626 6 424 3 205 974 532 405 1 308
Eastern Cape
Alfred Nzo 16 617 14 069 2 548 993 350 224 166 815
Amatole 15 926 13 826 2 100 744 289 190 170 707
Buffalo City 13 170 12 407 763 351 113 66 43 190
Cacadu 6 371 5 486 885 343 135 74 66 267
Chris Hani 13 290 11 647 1 643 701 236 178 125 403
Joe Gqabi 6 044 5 128 916 326 110 96 62 322
Nelson Mandela Bay Metro 18 143 16 509 1 634 717 252 152 108 405
O.R. Tambo 35 457 30 138 5 319 2 299 695 492 387 1 446
Total 125 018 109 210 15 808 6 474 2 180 1 472 1 127 4 555
Northern Cape
Frances Baard 9 519 9 059 460 187 51 41 25 156
John Taolo Gaetsewe 6 047 5 752 295 141 35 26 22 71
Namakwa 1 738 1 684 54 16 9 5 5 19
Pixley ka Seme 3 218 2 957 261 93 43 25 21 79
Siyanda 5 128 4 858 270 109 22 37 16 86
Total 25 650 24 310 1 340 546 160 134 89 411
Free State
Fezile Dabi 8 126 7 201 925 341 117 68 54 345
Lejweleputswa 11 345 10 245 1 100 365 124 75 91 445
Mangaung 16 783 15 718 1 065 318 140 74 70 463
Thabo Mofutsanyane 13 836 12 790 1 046 365 116 96 62 407
Xhariep 1 853 1 519 334 88 28 22 29 167
Total 51 943 47 473 4 470 1 477 525 335 306 1 827 * Foreign births reflected in province and district of birth registration.
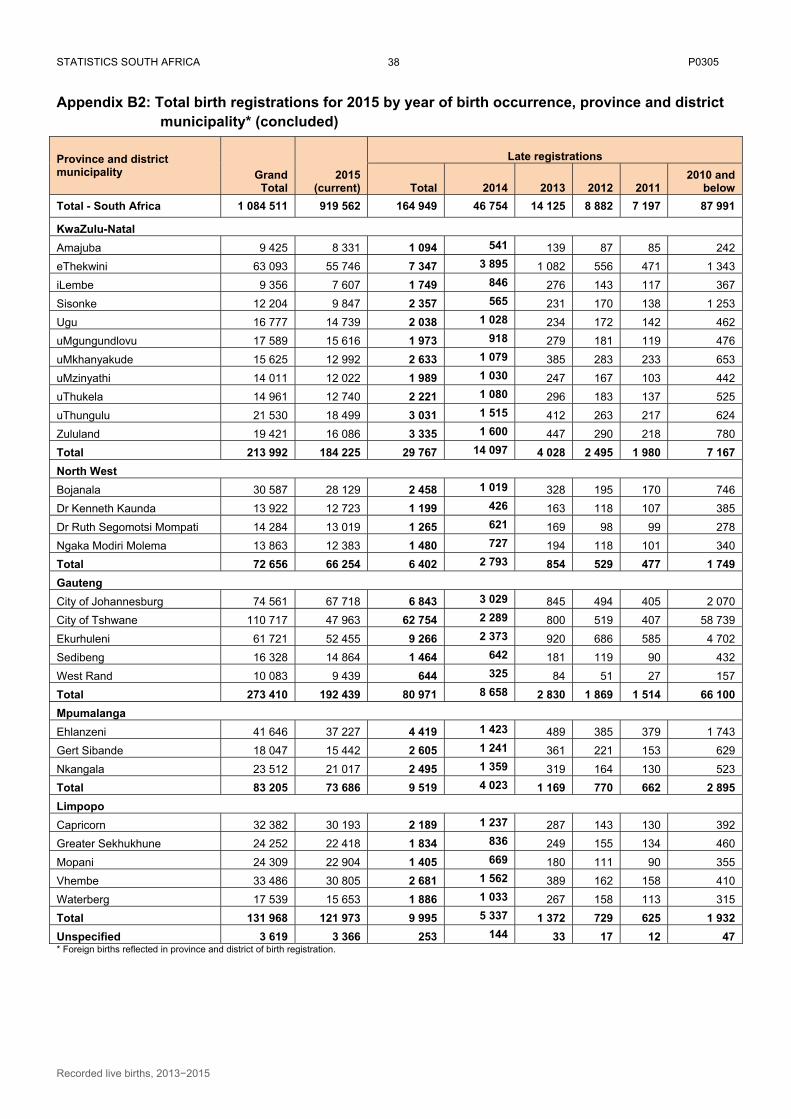
STATISTICS SOUTH AFRICA P0305
Recorded live births, 2013−2015
38
Appendix B2: Total birth registrations for 2015 by year of birth occurrence, province and district municipality* (concluded)
Province and district municipality Grand
Total 2015
(current)
Late registrations
Total 2014 2013 2012 2011 2010 and
below
Total - South Africa 1 084 511 919 562 164 949 46 754 14 125 8 882 7 197 87 991
KwaZulu-Natal
Amajuba 9 425 8 331 1 094 541 139 87 85 242
eThekwini 63 093 55 746 7 347 3 895 1 082 556 471 1 343
iLembe 9 356 7 607 1 749 846 276 143 117 367
Sisonke 12 204 9 847 2 357 565 231 170 138 1 253
Ugu 16 777 14 739 2 038 1 028 234 172 142 462
uMgungundlovu 17 589 15 616 1 973 918 279 181 119 476
uMkhanyakude 15 625 12 992 2 633 1 079 385 283 233 653
uMzinyathi 14 011 12 022 1 989 1 030 247 167 103 442
uThukela 14 961 12 740 2 221 1 080 296 183 137 525
uThungulu 21 530 18 499 3 031 1 515 412 263 217 624
Zululand 19 421 16 086 3 335 1 600 447 290 218 780
Total 213 992 184 225 29 767 14 097 4 028 2 495 1 980 7 167
North West
Bojanala 30 587 28 129 2 458 1 019 328 195 170 746
Dr Kenneth Kaunda 13 922 12 723 1 199 426 163 118 107 385
Dr Ruth Segomotsi Mompati 14 284 13 019 1 265 621 169 98 99 278
Ngaka Modiri Molema 13 863 12 383 1 480 727 194 118 101 340
Total 72 656 66 254 6 402 2 793 854 529 477 1 749
Gauteng
City of Johannesburg 74 561 67 718 6 843 3 029 845 494 405 2 070
City of Tshwane 110 717 47 963 62 754 2 289 800 519 407 58 739
Ekurhuleni 61 721 52 455 9 266 2 373 920 686 585 4 702
Sedibeng 16 328 14 864 1 464 642 181 119 90 432
West Rand 10 083 9 439 644 325 84 51 27 157
Total 273 410 192 439 80 971 8 658 2 830 1 869 1 514 66 100
Mpumalanga
Ehlanzeni 41 646 37 227 4 419 1 423 489 385 379 1 743
Gert Sibande 18 047 15 442 2 605 1 241 361 221 153 629
Nkangala 23 512 21 017 2 495 1 359 319 164 130 523
Total 83 205 73 686 9 519 4 023 1 169 770 662 2 895
Limpopo
Capricorn 32 382 30 193 2 189 1 237 287 143 130 392
Greater Sekhukhune 24 252 22 418 1 834 836 249 155 134 460
Mopani 24 309 22 904 1 405 669 180 111 90 355
Vhembe 33 486 30 805 2 681 1 562 389 162 158 410
Waterberg 17 539 15 653 1 886 1 033 267 158 113 315
Total 131 968 121 973 9 995 5 337 1 372 729 625 1 932
Unspecified 3 619 3 366 253 144 33 17 12 47 * Foreign births reflected in province and district of birth registration.
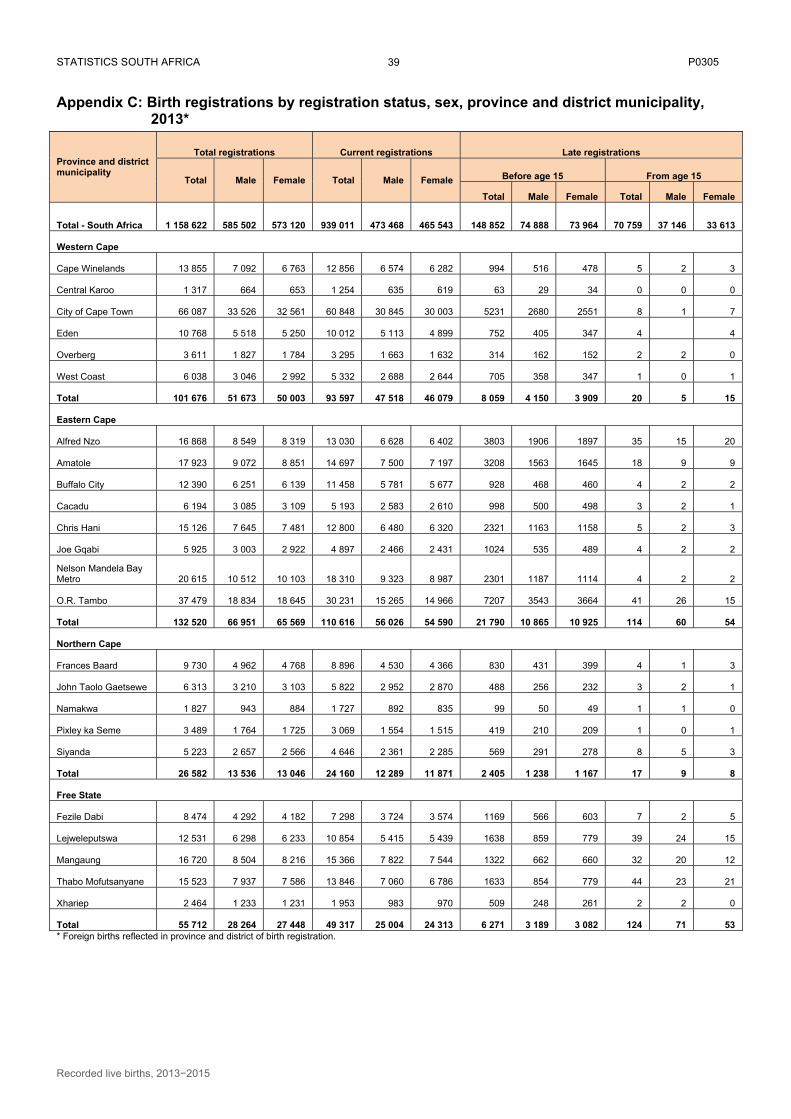
STATISTICS SOUTH AFRICA P0305
Recorded live births, 2013−2015
39
Appendix C: Birth registrations by registration status, sex, province and district municipality, 2013*
Province and district municipality
Total registrations Current registrations Late registrations
Total Male Female Total Male Female Before age 15 From age 15
Total Male Female Total Male Female
Total - South Africa 1 158 622 585 502 573 120 939 011 473 468 465 543 148 852 74 888 73 964 70 759 37 146 33 613
Western Cape
Cape Winelands 13 855 7 092 6 763 12 856 6 574 6 282 994 516 478 5 2 3
Central Karoo 1 317 664 653 1 254 635 619 63 29 34 0 0 0
City of Cape Town 66 087 33 526 32 561 60 848 30 845 30 003 5231 2680 2551 8 1 7
Eden 10 768 5 518 5 250 10 012 5 113 4 899 752 405 347 4 4
Overberg 3 611 1 827 1 784 3 295 1 663 1 632 314 162 152 2 2 0
West Coast 6 038 3 046 2 992 5 332 2 688 2 644 705 358 347 1 0 1
Total 101 676 51 673 50 003 93 597 47 518 46 079 8 059 4 150 3 909 20 5 15
Eastern Cape
Alfred Nzo 16 868 8 549 8 319 13 030 6 628 6 402 3803 1906 1897 35 15 20
Amatole 17 923 9 072 8 851 14 697 7 500 7 197 3208 1563 1645 18 9 9
Buffalo City 12 390 6 251 6 139 11 458 5 781 5 677 928 468 460 4 2 2
Cacadu 6 194 3 085 3 109 5 193 2 583 2 610 998 500 498 3 2 1
Chris Hani 15 126 7 645 7 481 12 800 6 480 6 320 2321 1163 1158 5 2 3
Joe Gqabi 5 925 3 003 2 922 4 897 2 466 2 431 1024 535 489 4 2 2
Nelson Mandela Bay Metro 20 615 10 512 10 103 18 310 9 323 8 987 2301 1187 1114 4 2 2
O.R. Tambo 37 479 18 834 18 645 30 231 15 265 14 966 7207 3543 3664 41 26 15
Total 132 520 66 951 65 569 110 616 56 026 54 590 21 790 10 865 10 925 114 60 54
Northern Cape
Frances Baard 9 730 4 962 4 768 8 896 4 530 4 366 830 431 399 4 1 3
John Taolo Gaetsewe 6 313 3 210 3 103 5 822 2 952 2 870 488 256 232 3 2 1
Namakwa 1 827 943 884 1 727 892 835 99 50 49 1 1 0
Pixley ka Seme 3 489 1 764 1 725 3 069 1 554 1 515 419 210 209 1 0 1
Siyanda 5 223 2 657 2 566 4 646 2 361 2 285 569 291 278 8 5 3
Total 26 582 13 536 13 046 24 160 12 289 11 871 2 405 1 238 1 167 17 9 8
Free State
Fezile Dabi 8 474 4 292 4 182 7 298 3 724 3 574 1169 566 603 7 2 5
Lejweleputswa 12 531 6 298 6 233 10 854 5 415 5 439 1638 859 779 39 24 15
Mangaung 16 720 8 504 8 216 15 366 7 822 7 544 1322 662 660 32 20 12
Thabo Mofutsanyane 15 523 7 937 7 586 13 846 7 060 6 786 1633 854 779 44 23 21
Xhariep 2 464 1 233 1 231 1 953 983 970 509 248 261 2 2 0
Total 55 712 28 264 27 448 49 317 25 004 24 313 6 271 3 189 3 082 124 71 53 * Foreign births reflected in province and district of birth registration.
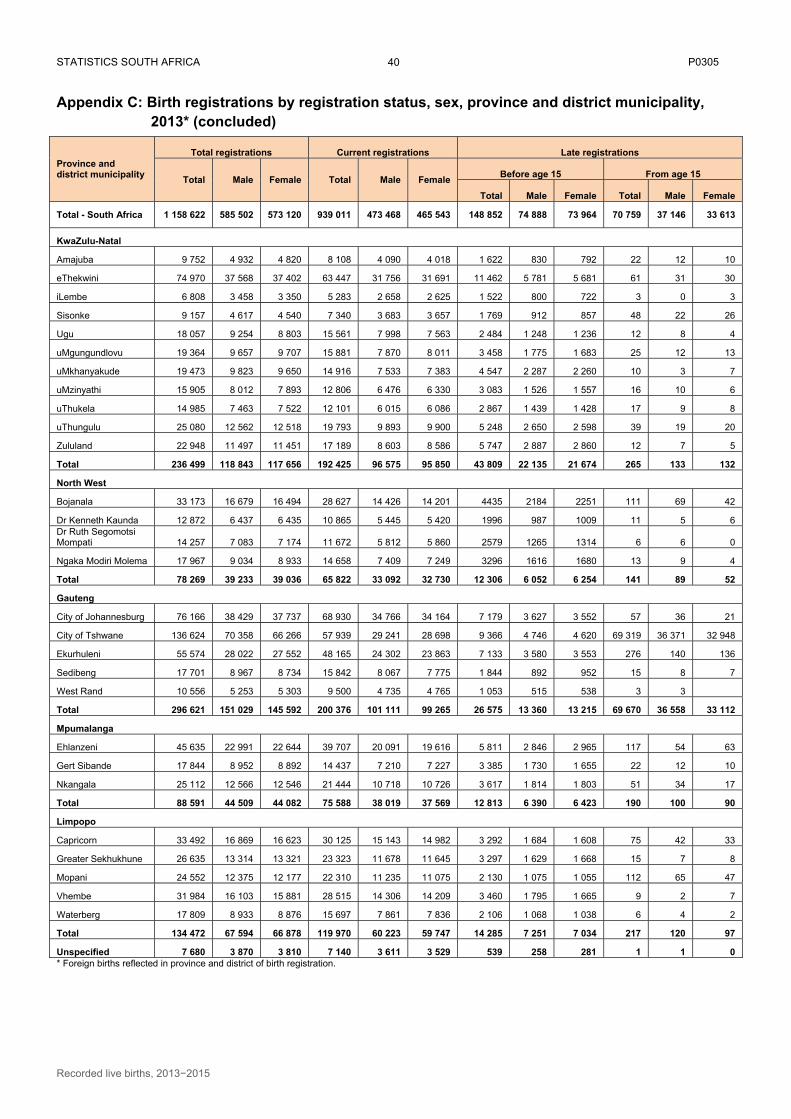
STATISTICS SOUTH AFRICA P0305
Recorded live births, 2013−2015
40
Appendix C: Birth registrations by registration status, sex, province and district municipality, 2013* (concluded)
Province and district municipality
Total registrations Current registrations Late registrations
Total Male Female Total Male Female Before age 15 From age 15
Total Male Female Total Male Female
Total - South Africa 1 158 622 585 502 573 120 939 011 473 468 465 543 148 852 74 888 73 964 70 759 37 146 33 613
KwaZulu-Natal
Amajuba 9 752 4 932 4 820 8 108 4 090 4 018 1 622 830 792 22 12 10
eThekwini 74 970 37 568 37 402 63 447 31 756 31 691 11 462 5 781 5 681 61 31 30
iLembe 6 808 3 458 3 350 5 283 2 658 2 625 1 522 800 722 3 0 3
Sisonke 9 157 4 617 4 540 7 340 3 683 3 657 1 769 912 857 48 22 26
Ugu 18 057 9 254 8 803 15 561 7 998 7 563 2 484 1 248 1 236 12 8 4
uMgungundlovu 19 364 9 657 9 707 15 881 7 870 8 011 3 458 1 775 1 683 25 12 13
uMkhanyakude 19 473 9 823 9 650 14 916 7 533 7 383 4 547 2 287 2 260 10 3 7
uMzinyathi 15 905 8 012 7 893 12 806 6 476 6 330 3 083 1 526 1 557 16 10 6
uThukela 14 985 7 463 7 522 12 101 6 015 6 086 2 867 1 439 1 428 17 9 8
uThungulu 25 080 12 562 12 518 19 793 9 893 9 900 5 248 2 650 2 598 39 19 20
Zululand 22 948 11 497 11 451 17 189 8 603 8 586 5 747 2 887 2 860 12 7 5
Total 236 499 118 843 117 656 192 425 96 575 95 850 43 809 22 135 21 674 265 133 132
North West
Bojanala 33 173 16 679 16 494 28 627 14 426 14 201 4435 2184 2251 111 69 42
Dr Kenneth Kaunda 12 872 6 437 6 435 10 865 5 445 5 420 1996 987 1009 11 5 6 Dr Ruth Segomotsi Mompati 14 257 7 083 7 174 11 672 5 812 5 860 2579 1265 1314 6 6 0
Ngaka Modiri Molema 17 967 9 034 8 933 14 658 7 409 7 249 3296 1616 1680 13 9 4
Total 78 269 39 233 39 036 65 822 33 092 32 730 12 306 6 052 6 254 141 89 52
Gauteng
City of Johannesburg 76 166 38 429 37 737 68 930 34 766 34 164 7 179 3 627 3 552 57 36 21
City of Tshwane 136 624 70 358 66 266 57 939 29 241 28 698 9 366 4 746 4 620 69 319 36 371 32 948
Ekurhuleni 55 574 28 022 27 552 48 165 24 302 23 863 7 133 3 580 3 553 276 140 136
Sedibeng 17 701 8 967 8 734 15 842 8 067 7 775 1 844 892 952 15 8 7
West Rand 10 556 5 253 5 303 9 500 4 735 4 765 1 053 515 538 3 3
Total 296 621 151 029 145 592 200 376 101 111 99 265 26 575 13 360 13 215 69 670 36 558 33 112
Mpumalanga
Ehlanzeni 45 635 22 991 22 644 39 707 20 091 19 616 5 811 2 846 2 965 117 54 63
Gert Sibande 17 844 8 952 8 892 14 437 7 210 7 227 3 385 1 730 1 655 22 12 10
Nkangala 25 112 12 566 12 546 21 444 10 718 10 726 3 617 1 814 1 803 51 34 17
Total 88 591 44 509 44 082 75 588 38 019 37 569 12 813 6 390 6 423 190 100 90
Limpopo
Capricorn 33 492 16 869 16 623 30 125 15 143 14 982 3 292 1 684 1 608 75 42 33
Greater Sekhukhune 26 635 13 314 13 321 23 323 11 678 11 645 3 297 1 629 1 668 15 7 8
Mopani 24 552 12 375 12 177 22 310 11 235 11 075 2 130 1 075 1 055 112 65 47
Vhembe 31 984 16 103 15 881 28 515 14 306 14 209 3 460 1 795 1 665 9 2 7
Waterberg 17 809 8 933 8 876 15 697 7 861 7 836 2 106 1 068 1 038 6 4 2
Total 134 472 67 594 66 878 119 970 60 223 59 747 14 285 7 251 7 034 217 120 97
Unspecified 7 680 3 870 3 810 7 140 3 611 3 529 539 258 281 1 1 0 * Foreign births reflected in province and district of birth registration.
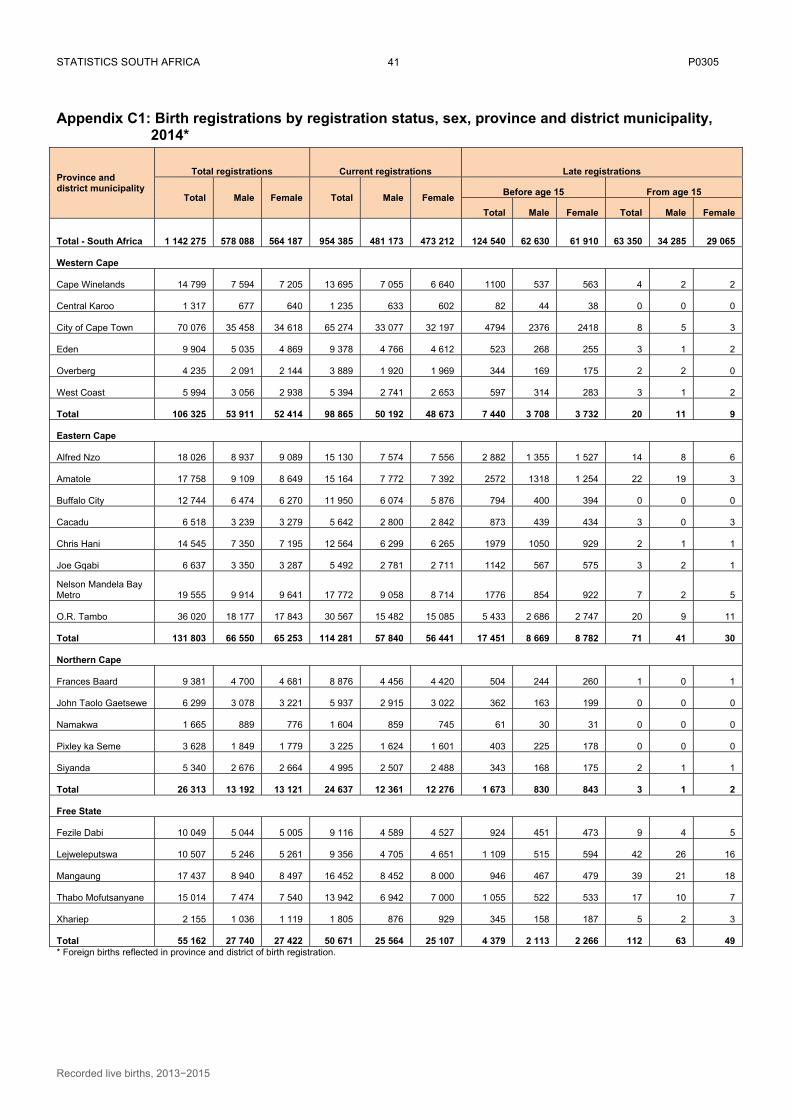
STATISTICS SOUTH AFRICA P0305
Recorded live births, 2013−2015
41
Appendix C1: Birth registrations by registration status, sex, province and district municipality, 2014*
Province and district municipality
Total registrations Current registrations Late registrations
Total Male Female Total Male Female Before age 15 From age 15
Total Male Female Total Male Female
Total - South Africa 1 142 275 578 088 564 187 954 385 481 173 473 212 124 540 62 630 61 910 63 350 34 285 29 065
Western Cape
Cape Winelands 14 799 7 594 7 205 13 695 7 055 6 640 1100 537 563 4 2 2
Central Karoo 1 317 677 640 1 235 633 602 82 44 38 0 0 0
City of Cape Town 70 076 35 458 34 618 65 274 33 077 32 197 4794 2376 2418 8 5 3
Eden 9 904 5 035 4 869 9 378 4 766 4 612 523 268 255 3 1 2
Overberg 4 235 2 091 2 144 3 889 1 920 1 969 344 169 175 2 2 0
West Coast 5 994 3 056 2 938 5 394 2 741 2 653 597 314 283 3 1 2
Total 106 325 53 911 52 414 98 865 50 192 48 673 7 440 3 708 3 732 20 11 9
Eastern Cape
Alfred Nzo 18 026 8 937 9 089 15 130 7 574 7 556 2 882 1 355 1 527 14 8 6
Amatole 17 758 9 109 8 649 15 164 7 772 7 392 2572 1318 1 254 22 19 3
Buffalo City 12 744 6 474 6 270 11 950 6 074 5 876 794 400 394 0 0 0
Cacadu 6 518 3 239 3 279 5 642 2 800 2 842 873 439 434 3 0 3
Chris Hani 14 545 7 350 7 195 12 564 6 299 6 265 1979 1050 929 2 1 1
Joe Gqabi 6 637 3 350 3 287 5 492 2 781 2 711 1142 567 575 3 2 1
Nelson Mandela Bay Metro 19 555 9 914 9 641 17 772 9 058 8 714 1776 854 922 7 2 5
O.R. Tambo 36 020 18 177 17 843 30 567 15 482 15 085 5 433 2 686 2 747 20 9 11
Total 131 803 66 550 65 253 114 281 57 840 56 441 17 451 8 669 8 782 71 41 30
Northern Cape
Frances Baard 9 381 4 700 4 681 8 876 4 456 4 420 504 244 260 1 0 1
John Taolo Gaetsewe 6 299 3 078 3 221 5 937 2 915 3 022 362 163 199 0 0 0
Namakwa 1 665 889 776 1 604 859 745 61 30 31 0 0 0
Pixley ka Seme 3 628 1 849 1 779 3 225 1 624 1 601 403 225 178 0 0 0
Siyanda 5 340 2 676 2 664 4 995 2 507 2 488 343 168 175 2 1 1
Total 26 313 13 192 13 121 24 637 12 361 12 276 1 673 830 843 3 1 2
Free State
Fezile Dabi 10 049 5 044 5 005 9 116 4 589 4 527 924 451 473 9 4 5
Lejweleputswa 10 507 5 246 5 261 9 356 4 705 4 651 1 109 515 594 42 26 16
Mangaung 17 437 8 940 8 497 16 452 8 452 8 000 946 467 479 39 21 18
Thabo Mofutsanyane 15 014 7 474 7 540 13 942 6 942 7 000 1 055 522 533 17 10 7
Xhariep 2 155 1 036 1 119 1 805 876 929 345 158 187 5 2 3
Total 55 162 27 740 27 422 50 671 25 564 25 107 4 379 2 113 2 266 112 63 49 * Foreign births reflected in province and district of birth registration.
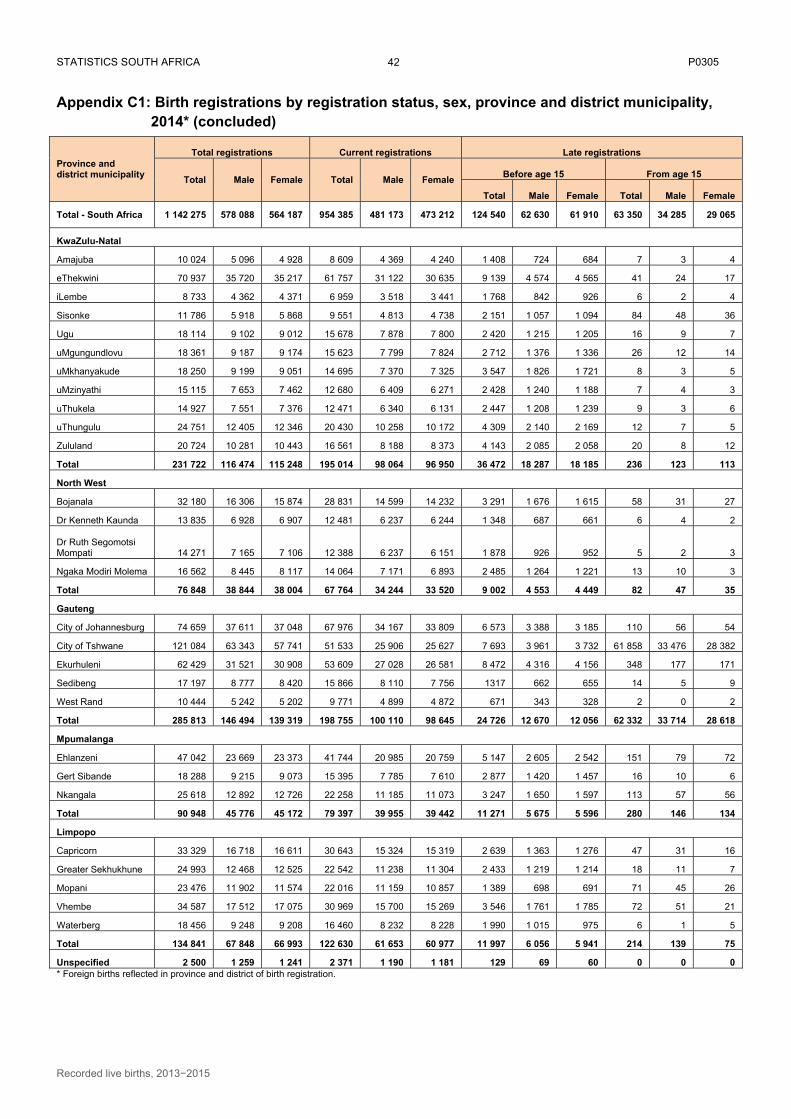
STATISTICS SOUTH AFRICA P0305
Recorded live births, 2013−2015
42
Appendix C1: Birth registrations by registration status, sex, province and district municipality, 2014* (concluded)
Province and district municipality
Total registrations Current registrations Late registrations
Total Male Female Total Male Female Before age 15 From age 15
Total Male Female Total Male Female
Total - South Africa 1 142 275 578 088 564 187 954 385 481 173 473 212 124 540 62 630 61 910 63 350 34 285 29 065
KwaZulu-Natal
Amajuba 10 024 5 096 4 928 8 609 4 369 4 240 1 408 724 684 7 3 4
eThekwini 70 937 35 720 35 217 61 757 31 122 30 635 9 139 4 574 4 565 41 24 17
iLembe 8 733 4 362 4 371 6 959 3 518 3 441 1 768 842 926 6 2 4
Sisonke 11 786 5 918 5 868 9 551 4 813 4 738 2 151 1 057 1 094 84 48 36
Ugu 18 114 9 102 9 012 15 678 7 878 7 800 2 420 1 215 1 205 16 9 7
uMgungundlovu 18 361 9 187 9 174 15 623 7 799 7 824 2 712 1 376 1 336 26 12 14
uMkhanyakude 18 250 9 199 9 051 14 695 7 370 7 325 3 547 1 826 1 721 8 3 5
uMzinyathi 15 115 7 653 7 462 12 680 6 409 6 271 2 428 1 240 1 188 7 4 3
uThukela 14 927 7 551 7 376 12 471 6 340 6 131 2 447 1 208 1 239 9 3 6
uThungulu 24 751 12 405 12 346 20 430 10 258 10 172 4 309 2 140 2 169 12 7 5
Zululand 20 724 10 281 10 443 16 561 8 188 8 373 4 143 2 085 2 058 20 8 12
Total 231 722 116 474 115 248 195 014 98 064 96 950 36 472 18 287 18 185 236 123 113
North West
Bojanala 32 180 16 306 15 874 28 831 14 599 14 232 3 291 1 676 1 615 58 31 27
Dr Kenneth Kaunda 13 835 6 928 6 907 12 481 6 237 6 244 1 348 687 661 6 4 2
Dr Ruth Segomotsi Mompati 14 271 7 165 7 106 12 388 6 237 6 151 1 878 926 952 5 2 3
Ngaka Modiri Molema 16 562 8 445 8 117 14 064 7 171 6 893 2 485 1 264 1 221 13 10 3
Total 76 848 38 844 38 004 67 764 34 244 33 520 9 002 4 553 4 449 82 47 35
Gauteng
City of Johannesburg 74 659 37 611 37 048 67 976 34 167 33 809 6 573 3 388 3 185 110 56 54
City of Tshwane 121 084 63 343 57 741 51 533 25 906 25 627 7 693 3 961 3 732 61 858 33 476 28 382
Ekurhuleni 62 429 31 521 30 908 53 609 27 028 26 581 8 472 4 316 4 156 348 177 171
Sedibeng 17 197 8 777 8 420 15 866 8 110 7 756 1317 662 655 14 5 9
West Rand 10 444 5 242 5 202 9 771 4 899 4 872 671 343 328 2 0 2
Total 285 813 146 494 139 319 198 755 100 110 98 645 24 726 12 670 12 056 62 332 33 714 28 618
Mpumalanga
Ehlanzeni 47 042 23 669 23 373 41 744 20 985 20 759 5 147 2 605 2 542 151 79 72
Gert Sibande 18 288 9 215 9 073 15 395 7 785 7 610 2 877 1 420 1 457 16 10 6
Nkangala 25 618 12 892 12 726 22 258 11 185 11 073 3 247 1 650 1 597 113 57 56
Total 90 948 45 776 45 172 79 397 39 955 39 442 11 271 5 675 5 596 280 146 134
Limpopo
Capricorn 33 329 16 718 16 611 30 643 15 324 15 319 2 639 1 363 1 276 47 31 16
Greater Sekhukhune 24 993 12 468 12 525 22 542 11 238 11 304 2 433 1 219 1 214 18 11 7
Mopani 23 476 11 902 11 574 22 016 11 159 10 857 1 389 698 691 71 45 26
Vhembe 34 587 17 512 17 075 30 969 15 700 15 269 3 546 1 761 1 785 72 51 21
Waterberg 18 456 9 248 9 208 16 460 8 232 8 228 1 990 1 015 975 6 1 5
Total 134 841 67 848 66 993 122 630 61 653 60 977 11 997 6 056 5 941 214 139 75
Unspecified 2 500 1 259 1 241 2 371 1 190 1 181 129 69 60 0 0 0 * Foreign births reflected in province and district of birth registration.
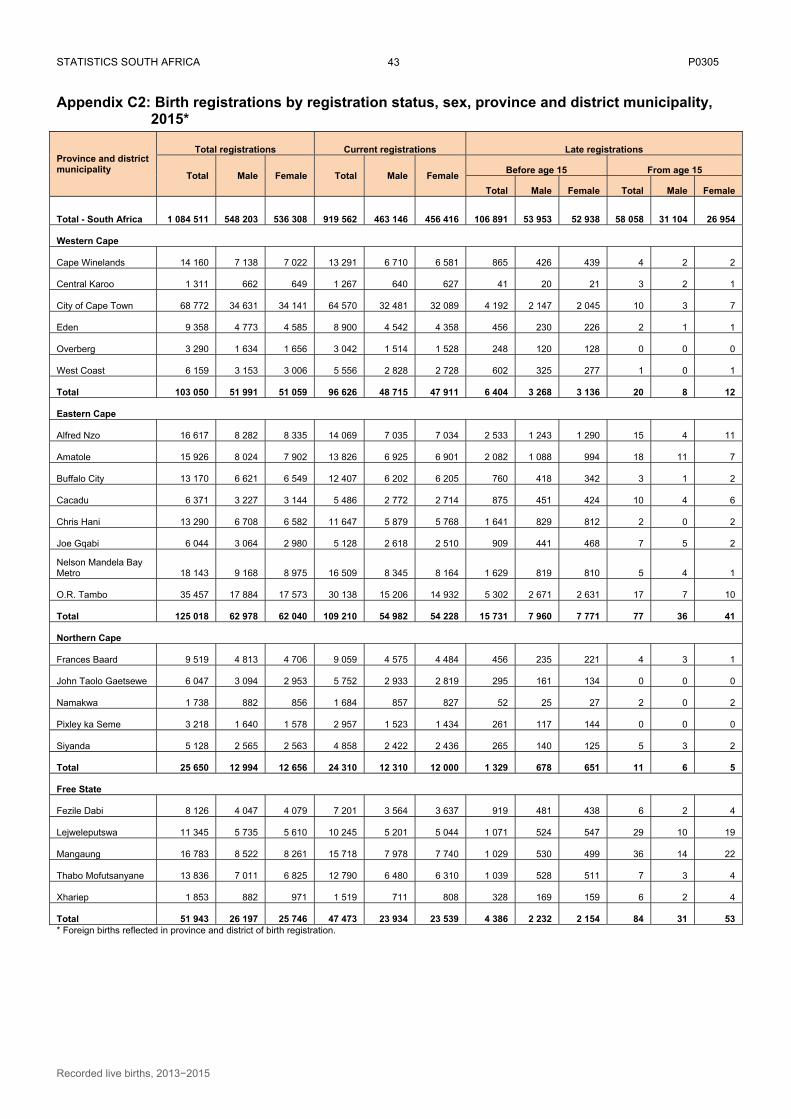
STATISTICS SOUTH AFRICA P0305
Recorded live births, 2013−2015
43
Appendix C2: Birth registrations by registration status, sex, province and district municipality, 2015*
Province and district municipality
Total registrations Current registrations Late registrations
Total Male Female Total Male Female Before age 15 From age 15
Total Male Female Total Male Female
Total - South Africa 1 084 511 548 203 536 308 919 562 463 146 456 416 106 891 53 953 52 938 58 058 31 104 26 954
Western Cape
Cape Winelands 14 160 7 138 7 022 13 291 6 710 6 581 865 426 439 4 2 2
Central Karoo 1 311 662 649 1 267 640 627 41 20 21 3 2 1
City of Cape Town 68 772 34 631 34 141 64 570 32 481 32 089 4 192 2 147 2 045 10 3 7
Eden 9 358 4 773 4 585 8 900 4 542 4 358 456 230 226 2 1 1
Overberg 3 290 1 634 1 656 3 042 1 514 1 528 248 120 128 0 0 0
West Coast 6 159 3 153 3 006 5 556 2 828 2 728 602 325 277 1 0 1
Total 103 050 51 991 51 059 96 626 48 715 47 911 6 404 3 268 3 136 20 8 12
Eastern Cape
Alfred Nzo 16 617 8 282 8 335 14 069 7 035 7 034 2 533 1 243 1 290 15 4 11
Amatole 15 926 8 024 7 902 13 826 6 925 6 901 2 082 1 088 994 18 11 7
Buffalo City 13 170 6 621 6 549 12 407 6 202 6 205 760 418 342 3 1 2
Cacadu 6 371 3 227 3 144 5 486 2 772 2 714 875 451 424 10 4 6
Chris Hani 13 290 6 708 6 582 11 647 5 879 5 768 1 641 829 812 2 0 2
Joe Gqabi 6 044 3 064 2 980 5 128 2 618 2 510 909 441 468 7 5 2
Nelson Mandela Bay Metro 18 143 9 168 8 975 16 509 8 345 8 164 1 629 819 810 5 4 1
O.R. Tambo 35 457 17 884 17 573 30 138 15 206 14 932 5 302 2 671 2 631 17 7 10
Total 125 018 62 978 62 040 109 210 54 982 54 228 15 731 7 960 7 771 77 36 41
Northern Cape
Frances Baard 9 519 4 813 4 706 9 059 4 575 4 484 456 235 221 4 3 1
John Taolo Gaetsewe 6 047 3 094 2 953 5 752 2 933 2 819 295 161 134 0 0 0
Namakwa 1 738 882 856 1 684 857 827 52 25 27 2 0 2
Pixley ka Seme 3 218 1 640 1 578 2 957 1 523 1 434 261 117 144 0 0 0
Siyanda 5 128 2 565 2 563 4 858 2 422 2 436 265 140 125 5 3 2
Total 25 650 12 994 12 656 24 310 12 310 12 000 1 329 678 651 11 6 5
Free State
Fezile Dabi 8 126 4 047 4 079 7 201 3 564 3 637 919 481 438 6 2 4
Lejweleputswa 11 345 5 735 5 610 10 245 5 201 5 044 1 071 524 547 29 10 19
Mangaung 16 783 8 522 8 261 15 718 7 978 7 740 1 029 530 499 36 14 22
Thabo Mofutsanyane 13 836 7 011 6 825 12 790 6 480 6 310 1 039 528 511 7 3 4
Xhariep 1 853 882 971 1 519 711 808 328 169 159 6 2 4
Total 51 943 26 197 25 746 47 473 23 934 23 539 4 386 2 232 2 154 84 31 53 * Foreign births reflected in province and district of birth registration.
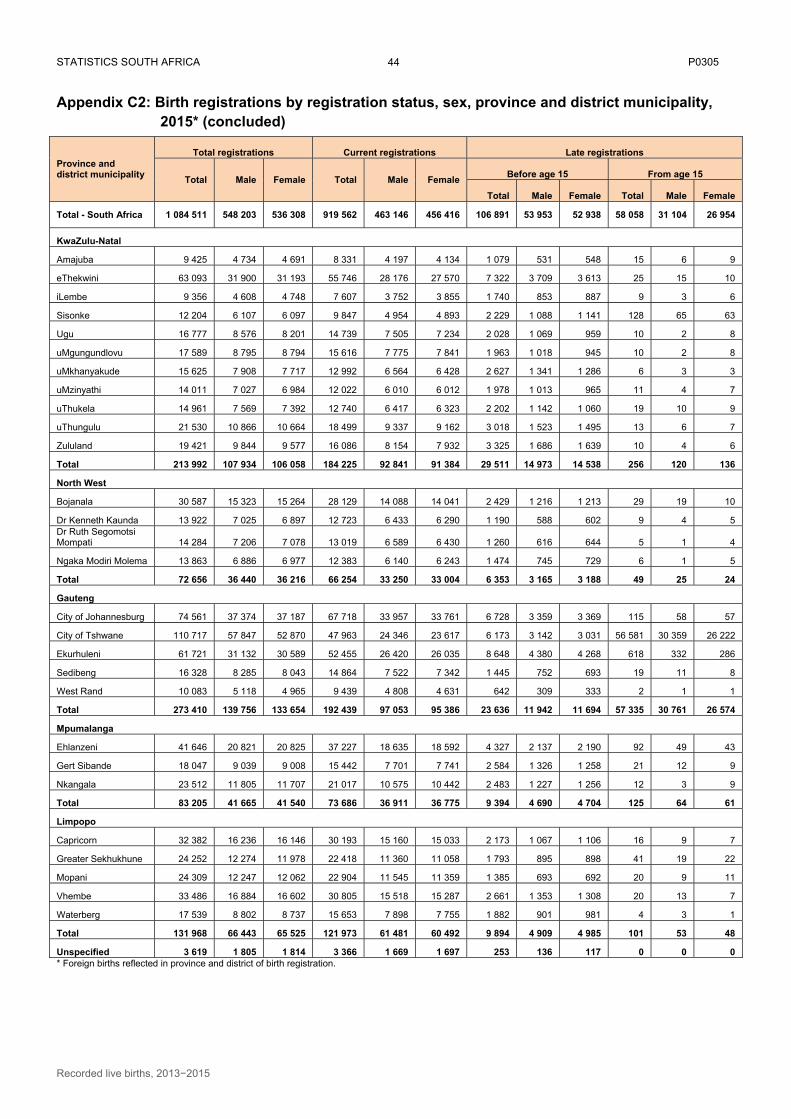
STATISTICS SOUTH AFRICA P0305
Recorded live births, 2013−2015
44
Appendix C2: Birth registrations by registration status, sex, province and district municipality, 2015* (concluded)
Province and district municipality
Total registrations Current registrations Late registrations
Total Male Female Total Male Female Before age 15 From age 15
Total Male Female Total Male Female
Total - South Africa 1 084 511 548 203 536 308 919 562 463 146 456 416 106 891 53 953 52 938 58 058 31 104 26 954
KwaZulu-Natal
Amajuba 9 425 4 734 4 691 8 331 4 197 4 134 1 079 531 548 15 6 9
eThekwini 63 093 31 900 31 193 55 746 28 176 27 570 7 322 3 709 3 613 25 15 10
iLembe 9 356 4 608 4 748 7 607 3 752 3 855 1 740 853 887 9 3 6
Sisonke 12 204 6 107 6 097 9 847 4 954 4 893 2 229 1 088 1 141 128 65 63
Ugu 16 777 8 576 8 201 14 739 7 505 7 234 2 028 1 069 959 10 2 8
uMgungundlovu 17 589 8 795 8 794 15 616 7 775 7 841 1 963 1 018 945 10 2 8
uMkhanyakude 15 625 7 908 7 717 12 992 6 564 6 428 2 627 1 341 1 286 6 3 3
uMzinyathi 14 011 7 027 6 984 12 022 6 010 6 012 1 978 1 013 965 11 4 7
uThukela 14 961 7 569 7 392 12 740 6 417 6 323 2 202 1 142 1 060 19 10 9
uThungulu 21 530 10 866 10 664 18 499 9 337 9 162 3 018 1 523 1 495 13 6 7
Zululand 19 421 9 844 9 577 16 086 8 154 7 932 3 325 1 686 1 639 10 4 6
Total 213 992 107 934 106 058 184 225 92 841 91 384 29 511 14 973 14 538 256 120 136
North West
Bojanala 30 587 15 323 15 264 28 129 14 088 14 041 2 429 1 216 1 213 29 19 10
Dr Kenneth Kaunda 13 922 7 025 6 897 12 723 6 433 6 290 1 190 588 602 9 4 5 Dr Ruth Segomotsi Mompati 14 284 7 206 7 078 13 019 6 589 6 430 1 260 616 644 5 1 4
Ngaka Modiri Molema 13 863 6 886 6 977 12 383 6 140 6 243 1 474 745 729 6 1 5
Total 72 656 36 440 36 216 66 254 33 250 33 004 6 353 3 165 3 188 49 25 24
Gauteng
City of Johannesburg 74 561 37 374 37 187 67 718 33 957 33 761 6 728 3 359 3 369 115 58 57
City of Tshwane 110 717 57 847 52 870 47 963 24 346 23 617 6 173 3 142 3 031 56 581 30 359 26 222
Ekurhuleni 61 721 31 132 30 589 52 455 26 420 26 035 8 648 4 380 4 268 618 332 286
Sedibeng 16 328 8 285 8 043 14 864 7 522 7 342 1 445 752 693 19 11 8
West Rand 10 083 5 118 4 965 9 439 4 808 4 631 642 309 333 2 1 1
Total 273 410 139 756 133 654 192 439 97 053 95 386 23 636 11 942 11 694 57 335 30 761 26 574
Mpumalanga
Ehlanzeni 41 646 20 821 20 825 37 227 18 635 18 592 4 327 2 137 2 190 92 49 43
Gert Sibande 18 047 9 039 9 008 15 442 7 701 7 741 2 584 1 326 1 258 21 12 9
Nkangala 23 512 11 805 11 707 21 017 10 575 10 442 2 483 1 227 1 256 12 3 9
Total 83 205 41 665 41 540 73 686 36 911 36 775 9 394 4 690 4 704 125 64 61
Limpopo
Capricorn 32 382 16 236 16 146 30 193 15 160 15 033 2 173 1 067 1 106 16 9 7
Greater Sekhukhune 24 252 12 274 11 978 22 418 11 360 11 058 1 793 895 898 41 19 22
Mopani 24 309 12 247 12 062 22 904 11 545 11 359 1 385 693 692 20 9 11
Vhembe 33 486 16 884 16 602 30 805 15 518 15 287 2 661 1 353 1 308 20 13 7
Waterberg 17 539 8 802 8 737 15 653 7 898 7 755 1 882 901 981 4 3 1
Total 131 968 66 443 65 525 121 973 61 481 60 492 9 894 4 909 4 985 101 53 48
Unspecified 3 619 1 805 1 814 3 366 1 669 1 697 253 136 117 0 0 0 * Foreign births reflected in province and district of birth registration.
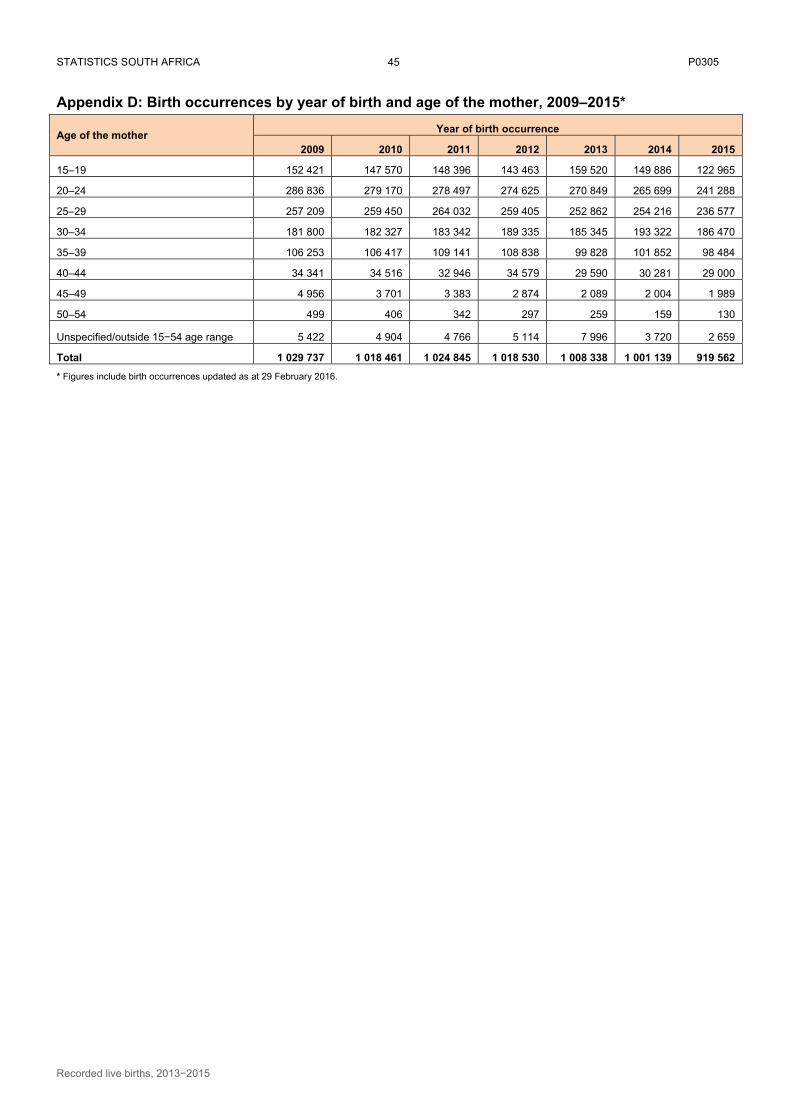
STATISTICS SOUTH AFRICA P0305
Recorded live births, 2013−2015
45
Appendix D: Birth occurrences by year of birth and age of the mother, 2009–2015*
Age of the mother Year of birth occurrence
2009 2010 2011 2012 2013 2014 2015
15–19 152 421 147 570 148 396 143 463 159 520 149 886 122 965
20–24 286 836 279 170 278 497 274 625 270 849 265 699 241 288
25–29 257 209 259 450 264 032 259 405 252 862 254 216 236 577
30–34 181 800 182 327 183 342 189 335 185 345 193 322 186 470
35–39 106 253 106 417 109 141 108 838 99 828 101 852 98 484
40–44 34 341 34 516 32 946 34 579 29 590 30 281 29 000
45–49 4 956 3 701 3 383 2 874 2 089 2 004 1 989
50–54 499 406 342 297 259 159 130
Unspecified/outside 15−54 age range 5 422 4 904 4 766 5 114 7 996 3 720 2 659
Total 1 029 737 1 018 461 1 024 845 1 018 530 1 008 338 1 001 139 919 562
* Figures include birth occurrences updated as at 29 February 2016.
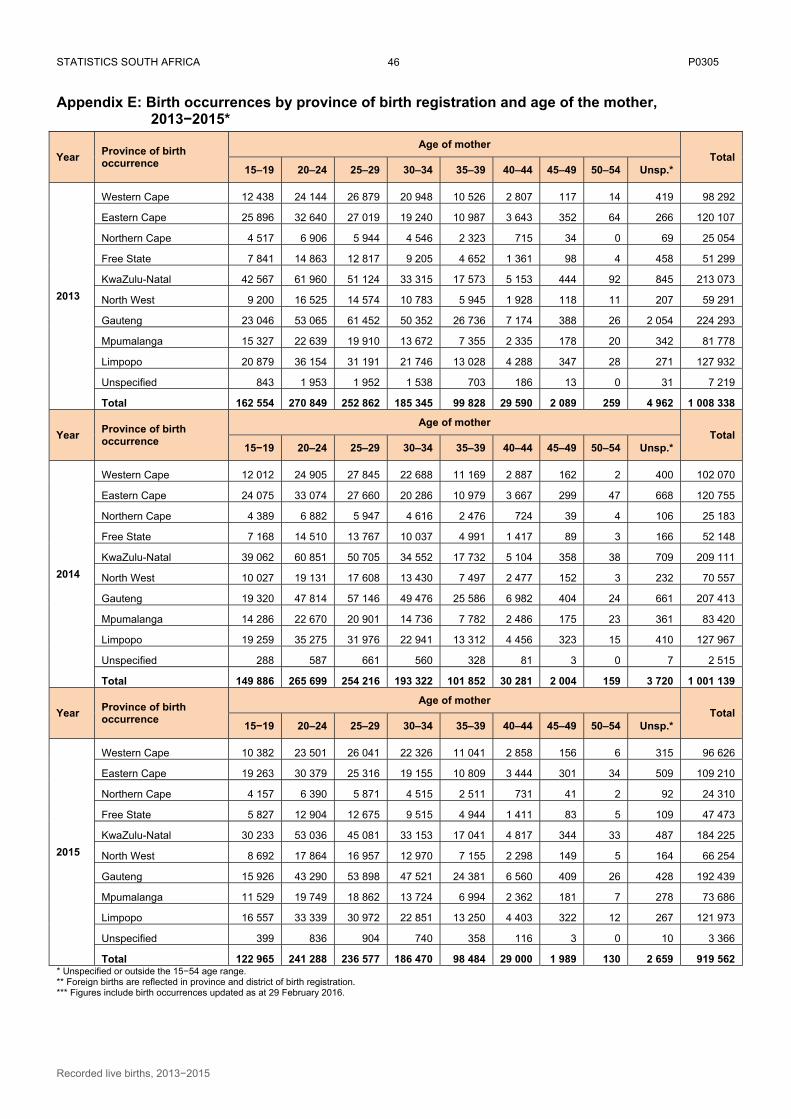
STATISTICS SOUTH AFRICA P0305
Recorded live births, 2013−2015
46
Appendix E: Birth occurrences by province of birth registration and age of the mother, 2013−2015*
Year Province of birth occurrence
Age of mother Total
15–19 20–24 25–29 30–34 35–39 40–44 45–49 50–54 Unsp.*
2013
Western Cape 12 438 24 144 26 879 20 948 10 526 2 807 117 14 419 98 292
Eastern Cape 25 896 32 640 27 019 19 240 10 987 3 643 352 64 266 120 107
Northern Cape 4 517 6 906 5 944 4 546 2 323 715 34 0 69 25 054
Free State 7 841 14 863 12 817 9 205 4 652 1 361 98 4 458 51 299
KwaZulu-Natal 42 567 61 960 51 124 33 315 17 573 5 153 444 92 845 213 073
North West 9 200 16 525 14 574 10 783 5 945 1 928 118 11 207 59 291
Gauteng 23 046 53 065 61 452 50 352 26 736 7 174 388 26 2 054 224 293
Mpumalanga 15 327 22 639 19 910 13 672 7 355 2 335 178 20 342 81 778
Limpopo 20 879 36 154 31 191 21 746 13 028 4 288 347 28 271 127 932
Unspecified 843 1 953 1 952 1 538 703 186 13 0 31 7 219
Total 162 554 270 849 252 862 185 345 99 828 29 590 2 089 259 4 962 1 008 338
Year Province of birth occurrence
Age of mother Total
15−19 20–24 25–29 30–34 35–39 40–44 45–49 50–54 Unsp.*
2014
Western Cape 12 012 24 905 27 845 22 688 11 169 2 887 162 2 400 102 070
Eastern Cape 24 075 33 074 27 660 20 286 10 979 3 667 299 47 668 120 755
Northern Cape 4 389 6 882 5 947 4 616 2 476 724 39 4 106 25 183
Free State 7 168 14 510 13 767 10 037 4 991 1 417 89 3 166 52 148
KwaZulu-Natal 39 062 60 851 50 705 34 552 17 732 5 104 358 38 709 209 111
North West 10 027 19 131 17 608 13 430 7 497 2 477 152 3 232 70 557
Gauteng 19 320 47 814 57 146 49 476 25 586 6 982 404 24 661 207 413
Mpumalanga 14 286 22 670 20 901 14 736 7 782 2 486 175 23 361 83 420
Limpopo 19 259 35 275 31 976 22 941 13 312 4 456 323 15 410 127 967
Unspecified 288 587 661 560 328 81 3 0 7 2 515
Total 149 886 265 699 254 216 193 322 101 852 30 281 2 004 159 3 720 1 001 139
Year Province of birth occurrence
Age of mother Total
15−19 20–24 25–29 30–34 35–39 40–44 45–49 50–54 Unsp.*
2015
Western Cape 10 382 23 501 26 041 22 326 11 041 2 858 156 6 315 96 626
Eastern Cape 19 263 30 379 25 316 19 155 10 809 3 444 301 34 509 109 210
Northern Cape 4 157 6 390 5 871 4 515 2 511 731 41 2 92 24 310
Free State 5 827 12 904 12 675 9 515 4 944 1 411 83 5 109 47 473
KwaZulu-Natal 30 233 53 036 45 081 33 153 17 041 4 817 344 33 487 184 225
North West 8 692 17 864 16 957 12 970 7 155 2 298 149 5 164 66 254
Gauteng 15 926 43 290 53 898 47 521 24 381 6 560 409 26 428 192 439
Mpumalanga 11 529 19 749 18 862 13 724 6 994 2 362 181 7 278 73 686
Limpopo 16 557 33 339 30 972 22 851 13 250 4 403 322 12 267 121 973
Unspecified 399 836 904 740 358 116 3 0 10 3 366
Total 122 965 241 288 236 577 186 470 98 484 29 000 1 989 130 2 659 919 562 * Unspecified or outside the 15−54 age range. ** Foreign births are reflected in province and district of birth registration. *** Figures include birth occurrences updated as at 29 February 2016.
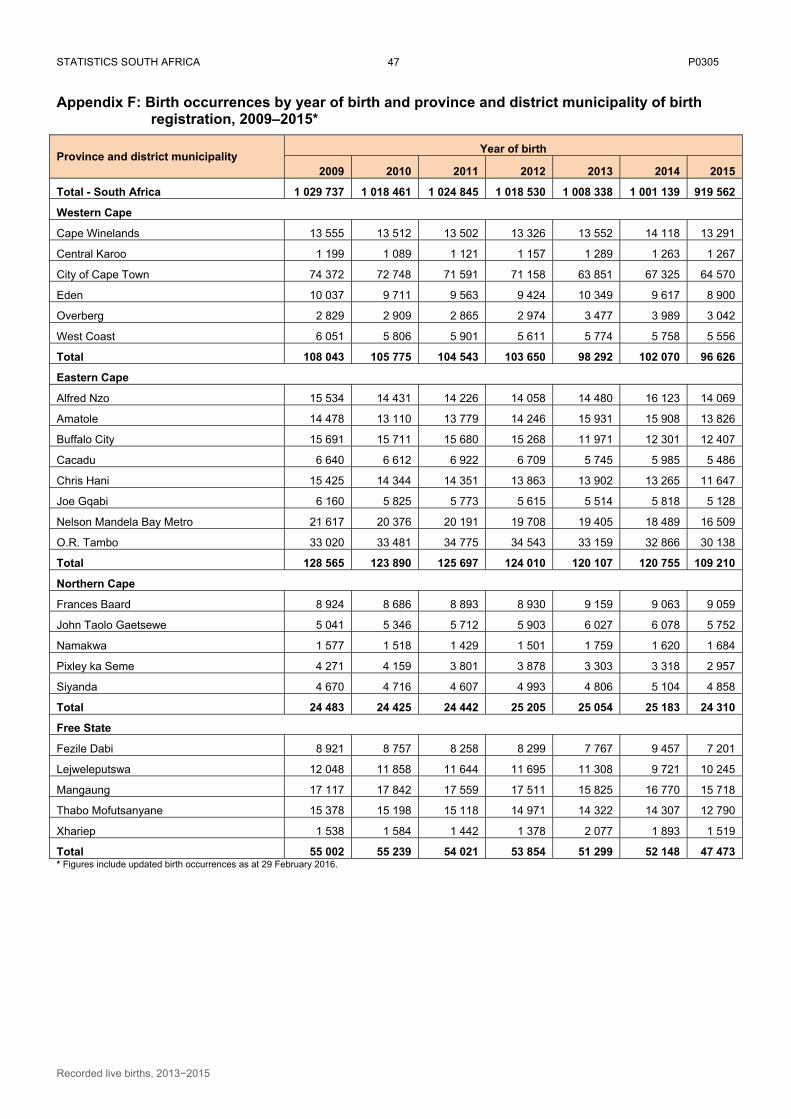
STATISTICS SOUTH AFRICA P0305
Recorded live births, 2013−2015
47
Appendix F: Birth occurrences by year of birth and province and district municipality of birth registration, 2009–2015*
Province and district municipality Year of birth
2009 2010 2011 2012 2013 2014 2015
Total - South Africa 1 029 737 1 018 461 1 024 845 1 018 530 1 008 338 1 001 139 919 562
Western Cape
Cape Winelands 13 555 13 512 13 502 13 326 13 552 14 118 13 291
Central Karoo 1 199 1 089 1 121 1 157 1 289 1 263 1 267
City of Cape Town 74 372 72 748 71 591 71 158 63 851 67 325 64 570
Eden 10 037 9 711 9 563 9 424 10 349 9 617 8 900
Overberg 2 829 2 909 2 865 2 974 3 477 3 989 3 042
West Coast 6 051 5 806 5 901 5 611 5 774 5 758 5 556
Total 108 043 105 775 104 543 103 650 98 292 102 070 96 626
Eastern Cape
Alfred Nzo 15 534 14 431 14 226 14 058 14 480 16 123 14 069
Amatole 14 478 13 110 13 779 14 246 15 931 15 908 13 826
Buffalo City 15 691 15 711 15 680 15 268 11 971 12 301 12 407
Cacadu 6 640 6 612 6 922 6 709 5 745 5 985 5 486
Chris Hani 15 425 14 344 14 351 13 863 13 902 13 265 11 647
Joe Gqabi 6 160 5 825 5 773 5 615 5 514 5 818 5 128
Nelson Mandela Bay Metro 21 617 20 376 20 191 19 708 19 405 18 489 16 509
O.R. Tambo 33 020 33 481 34 775 34 543 33 159 32 866 30 138
Total 128 565 123 890 125 697 124 010 120 107 120 755 109 210
Northern Cape
Frances Baard 8 924 8 686 8 893 8 930 9 159 9 063 9 059
John Taolo Gaetsewe 5 041 5 346 5 712 5 903 6 027 6 078 5 752
Namakwa 1 577 1 518 1 429 1 501 1 759 1 620 1 684
Pixley ka Seme 4 271 4 159 3 801 3 878 3 303 3 318 2 957
Siyanda 4 670 4 716 4 607 4 993 4 806 5 104 4 858
Total 24 483 24 425 24 442 25 205 25 054 25 183 24 310
Free State
Fezile Dabi 8 921 8 757 8 258 8 299 7 767 9 457 7 201
Lejweleputswa 12 048 11 858 11 644 11 695 11 308 9 721 10 245
Mangaung 17 117 17 842 17 559 17 511 15 825 16 770 15 718
Thabo Mofutsanyane 15 378 15 198 15 118 14 971 14 322 14 307 12 790
Xhariep 1 538 1 584 1 442 1 378 2 077 1 893 1 519
Total 55 002 55 239 54 021 53 854 51 299 52 148 47 473 * Figures include updated birth occurrences as at 29 February 2016.
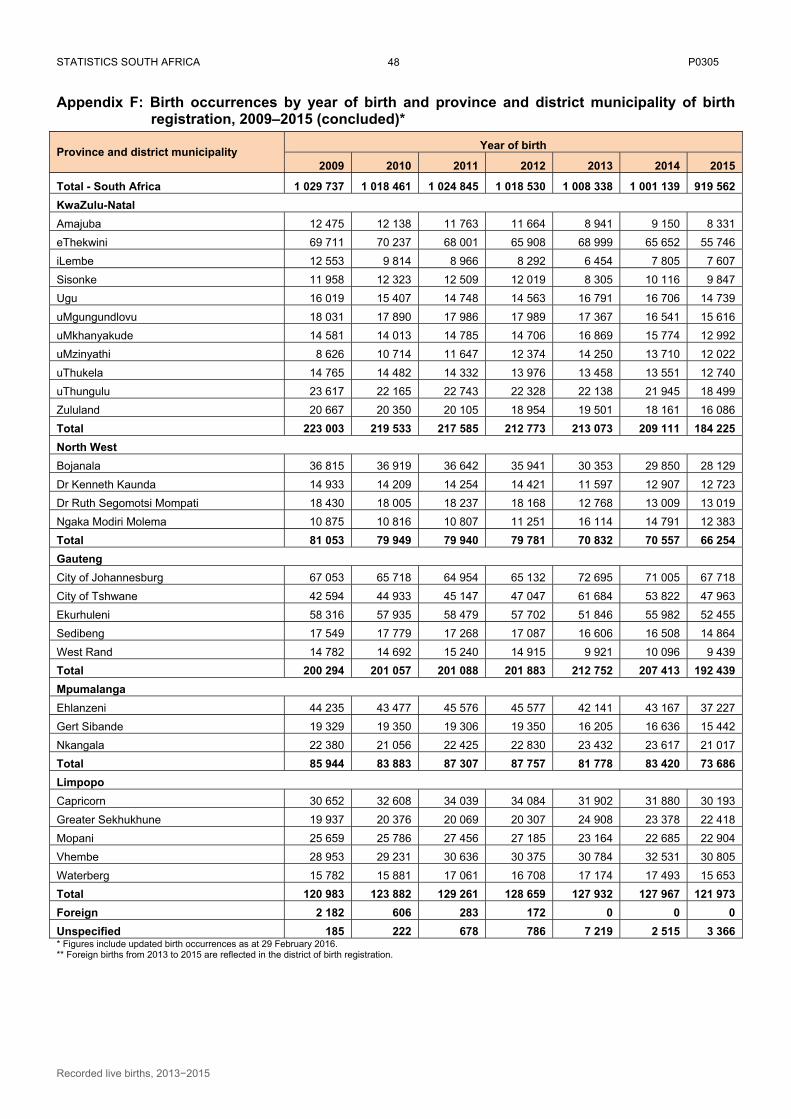
STATISTICS SOUTH AFRICA P0305
Recorded live births, 2013−2015
48
Appendix F: Birth occurrences by year of birth and province and district municipality of birth registration, 2009–2015 (concluded)*
Province and district municipality Year of birth
2009 2010 2011 2012 2013 2014 2015
Total - South Africa 1 029 737 1 018 461 1 024 845 1 018 530 1 008 338 1 001 139 919 562
KwaZulu-Natal
Amajuba 12 475 12 138 11 763 11 664 8 941 9 150 8 331
eThekwini 69 711 70 237 68 001 65 908 68 999 65 652 55 746
iLembe 12 553 9 814 8 966 8 292 6 454 7 805 7 607
Sisonke 11 958 12 323 12 509 12 019 8 305 10 116 9 847
Ugu 16 019 15 407 14 748 14 563 16 791 16 706 14 739
uMgungundlovu 18 031 17 890 17 986 17 989 17 367 16 541 15 616
uMkhanyakude 14 581 14 013 14 785 14 706 16 869 15 774 12 992
uMzinyathi 8 626 10 714 11 647 12 374 14 250 13 710 12 022
uThukela 14 765 14 482 14 332 13 976 13 458 13 551 12 740
uThungulu 23 617 22 165 22 743 22 328 22 138 21 945 18 499
Zululand 20 667 20 350 20 105 18 954 19 501 18 161 16 086
Total 223 003 219 533 217 585 212 773 213 073 209 111 184 225
North West
Bojanala 36 815 36 919 36 642 35 941 30 353 29 850 28 129
Dr Kenneth Kaunda 14 933 14 209 14 254 14 421 11 597 12 907 12 723
Dr Ruth Segomotsi Mompati 18 430 18 005 18 237 18 168 12 768 13 009 13 019
Ngaka Modiri Molema 10 875 10 816 10 807 11 251 16 114 14 791 12 383
Total 81 053 79 949 79 940 79 781 70 832 70 557 66 254
Gauteng
City of Johannesburg 67 053 65 718 64 954 65 132 72 695 71 005 67 718
City of Tshwane 42 594 44 933 45 147 47 047 61 684 53 822 47 963
Ekurhuleni 58 316 57 935 58 479 57 702 51 846 55 982 52 455
Sedibeng 17 549 17 779 17 268 17 087 16 606 16 508 14 864
West Rand 14 782 14 692 15 240 14 915 9 921 10 096 9 439
Total 200 294 201 057 201 088 201 883 212 752 207 413 192 439
Mpumalanga
Ehlanzeni 44 235 43 477 45 576 45 577 42 141 43 167 37 227
Gert Sibande 19 329 19 350 19 306 19 350 16 205 16 636 15 442
Nkangala 22 380 21 056 22 425 22 830 23 432 23 617 21 017
Total 85 944 83 883 87 307 87 757 81 778 83 420 73 686
Limpopo
Capricorn 30 652 32 608 34 039 34 084 31 902 31 880 30 193
Greater Sekhukhune 19 937 20 376 20 069 20 307 24 908 23 378 22 418
Mopani 25 659 25 786 27 456 27 185 23 164 22 685 22 904
Vhembe 28 953 29 231 30 636 30 375 30 784 32 531 30 805
Waterberg 15 782 15 881 17 061 16 708 17 174 17 493 15 653
Total 120 983 123 882 129 261 128 659 127 932 127 967 121 973
Foreign 2 182 606 283 172 0 0 0
Unspecified 185 222 678 786 7 219 2 515 3 366 * Figures include updated birth occurrences as at 29 February 2016. ** Foreign births from 2013 to 2015 are reflected in the district of birth registration.
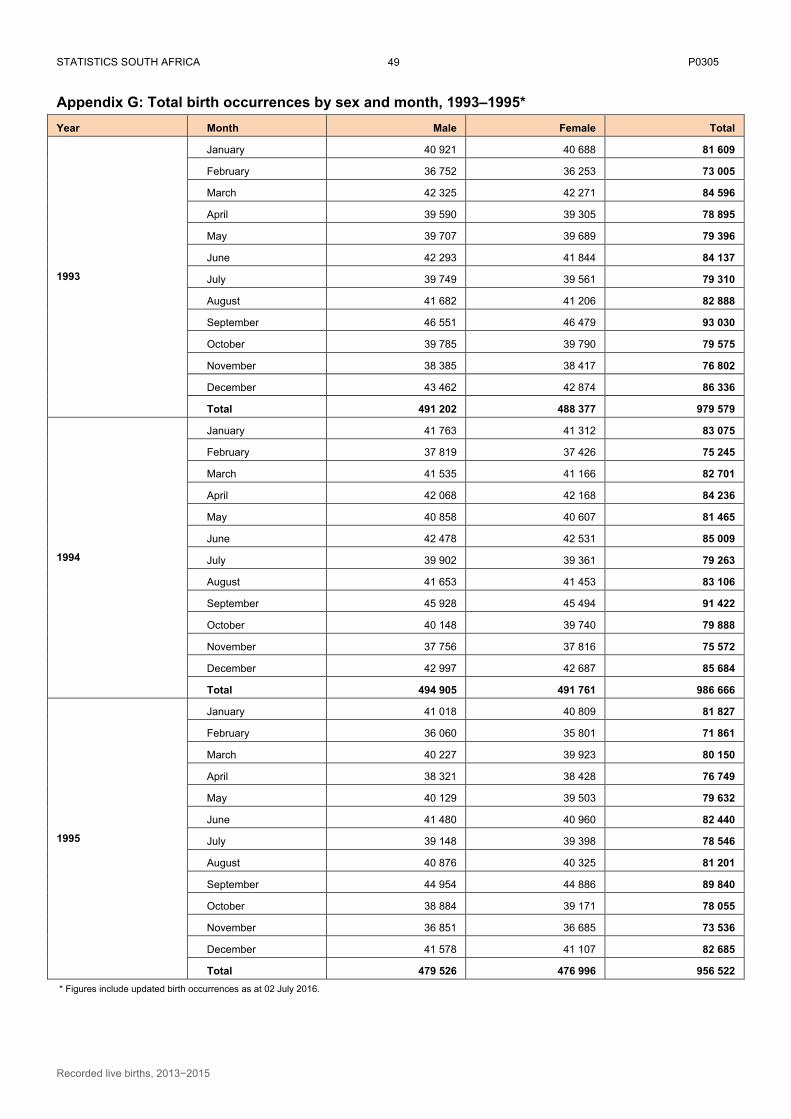
STATISTICS SOUTH AFRICA P0305
Recorded live births, 2013−2015
49
Appendix G: Total birth occurrences by sex and month, 1993–1995*
Year Month Male Female Total
1993
January 40 921 40 688 81 609
February 36 752 36 253 73 005
March 42 325 42 271 84 596
April 39 590 39 305 78 895
May 39 707 39 689 79 396
June 42 293 41 844 84 137
July 39 749 39 561 79 310
August 41 682 41 206 82 888
September 46 551 46 479 93 030
October 39 785 39 790 79 575
November 38 385 38 417 76 802
December 43 462 42 874 86 336
Total 491 202 488 377 979 579
1994
January 41 763 41 312 83 075
February 37 819 37 426 75 245
March 41 535 41 166 82 701
April 42 068 42 168 84 236
May 40 858 40 607 81 465
June 42 478 42 531 85 009
July 39 902 39 361 79 263
August 41 653 41 453 83 106
September 45 928 45 494 91 422
October 40 148 39 740 79 888
November 37 756 37 816 75 572
December 42 997 42 687 85 684
Total 494 905 491 761 986 666
1995
January 41 018 40 809 81 827
February 36 060 35 801 71 861
March 40 227 39 923 80 150
April 38 321 38 428 76 749
May 40 129 39 503 79 632
June 41 480 40 960 82 440
July 39 148 39 398 78 546
August 40 876 40 325 81 201
September 44 954 44 886 89 840
October 38 884 39 171 78 055
November 36 851 36 685 73 536
December 41 578 41 107 82 685
Total 479 526 476 996 956 522
* Figures include updated birth occurrences as at 02 July 2016.

STATISTICS SOUTH AFRICA P0305
Recorded live births, 2013−2015
50
Appendix G.1: Total birth occurrences by sex and month, 1996–1998*
Year Month Male Female Total
1996
January 42 750 42 774 85 524
February 37 839 37 408 75 247
March 41 278 41 555 82 833
April 40 082 39 446 79 528
May 40 639 40 571 81 210
June 42 906 42 433 85 339
July 40 388 40 341 80 729
August 41 787 41 430 83 217
September 46 108 45 971 92 079
October 39 661 38 948 78 609
November 36 791 36 915 73 706
December 42 306 41 749 84 055
Total 492 535 489 541 982 076
1997
January 41 845 41 694 83 539
February 37 253 37 189 74 442
March 42 622 42 456 85 078
April 39 788 40 029 79 817
May 39 814 39 823 79 637
June 40 877 41 187 82 064
July 40 512 40 357 80 869
August 40 586 40 803 81 389
September 44 951 44 499 89 450
October 38 641 38 102 76 743
November 36 018 35 643 71 661
December 40 714 40 668 81 382
Total 483 621 482 450 966 071
1998
January 40 931 41 243 82 174
February 37 198 37 114 74 312
March 41 907 41 752 83 659
April 38 929 39 465 78 394
May 39 909 39 445 79 354
June 40 335 40 220 80 555
July 39 200 38 744 77 944
August 39 658 40 025 79 683
September 44 207 43 854 88 061
October 38 030 37 897 75 927
November 35 373 35 107 70 480
December 39 419 39 491 78 910
Total 475 096 474 357 949 453 * Figures include updated birth occurrences as at 02 July 2016.

STATISTICS SOUTH AFRICA P0305
Recorded live births, 2013−2015
51
Appendix G.2: Total birth occurrences by sex and month, 1999–2001*
Year Month Male Female Total
1999
January 40 063 40 174 80 237
February 35 849 35 532 71 381
March 41 331 41 594 82 925
April 40 906 41 138 82 044
May 41 361 41 484 82 845
June 41 620 41 609 83 229
July 39 991 39 797 79 788
August 40 491 40 321 80 812
September 44 502 44 183 88 685
October 38 328 38 669 76 997
November 37 209 36 434 73 643
December 41 372 41 223 82 595
Total 483 023 482 158 965 181
2000
January 42 833 42 690 85 523
February 39 991 39 580 79 571
March 42 972 42 919 85 891
April 40 629 40 667 81 296
May 41 327 41 557 82 884
June 41 826 41 541 83 367
July 40 223 40 174 80 397
August 40 953 40 481 81 434
September 43 933 43 699 87 632
October 38 929 38 550 77 479
November 36 608 36 648 73 256
December 39 441 39 269 78 710
Total 489 665 487 775 977 440
2001
January 43 459 43 194 86 653
February 36 917 37 141 74 058
March 42 486 42 107 84 593
April 40 363 40 234 80 597
May 40 794 41 052 81 846
June 40 235 40 646 80 881
July 39 668 39 031 78 699
August 39 711 39 741 79 452
September 43 238 42 788 86 026
October 38 136 38 549 76 685
November 36 453 35 927 72 380
December 39 613 39 025 78 638
Total 481 073 487 775 960 508
* Figures include updated birth occurrences as at 02 July 2016.
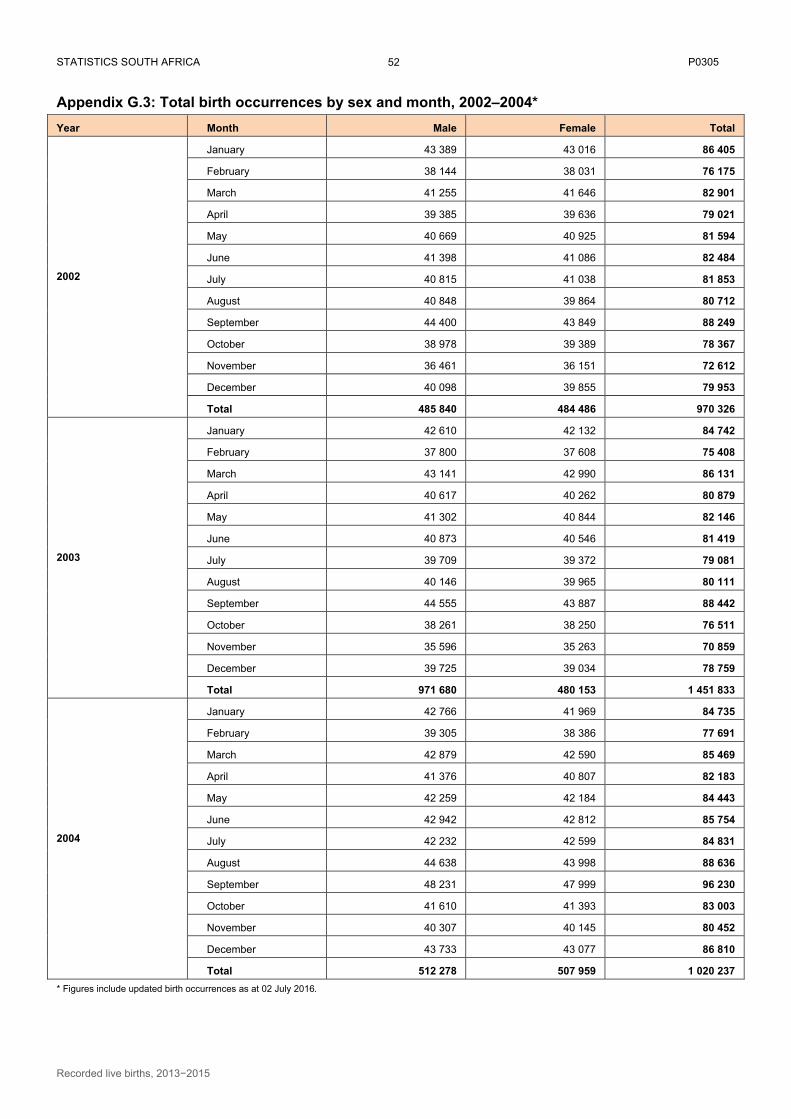
STATISTICS SOUTH AFRICA P0305
Recorded live births, 2013−2015
52
Appendix G.3: Total birth occurrences by sex and month, 2002–2004*
Year Month Male Female Total
2002
January 43 389 43 016 86 405
February 38 144 38 031 76 175
March 41 255 41 646 82 901
April 39 385 39 636 79 021
May 40 669 40 925 81 594
June 41 398 41 086 82 484
July 40 815 41 038 81 853
August 40 848 39 864 80 712
September 44 400 43 849 88 249
October 38 978 39 389 78 367
November 36 461 36 151 72 612
December 40 098 39 855 79 953
Total 485 840 484 486 970 326
2003
January 42 610 42 132 84 742
February 37 800 37 608 75 408
March 43 141 42 990 86 131
April 40 617 40 262 80 879
May 41 302 40 844 82 146
June 40 873 40 546 81 419
July 39 709 39 372 79 081
August 40 146 39 965 80 111
September 44 555 43 887 88 442
October 38 261 38 250 76 511
November 35 596 35 263 70 859
December 39 725 39 034 78 759
Total 971 680 480 153 1 451 833
2004
January 42 766 41 969 84 735
February 39 305 38 386 77 691
March 42 879 42 590 85 469
April 41 376 40 807 82 183
May 42 259 42 184 84 443
June 42 942 42 812 85 754
July 42 232 42 599 84 831
August 44 638 43 998 88 636
September 48 231 47 999 96 230
October 41 610 41 393 83 003
November 40 307 40 145 80 452
December 43 733 43 077 86 810
Total 512 278 507 959 1 020 237
* Figures include updated birth occurrences as at 02 July 2016.
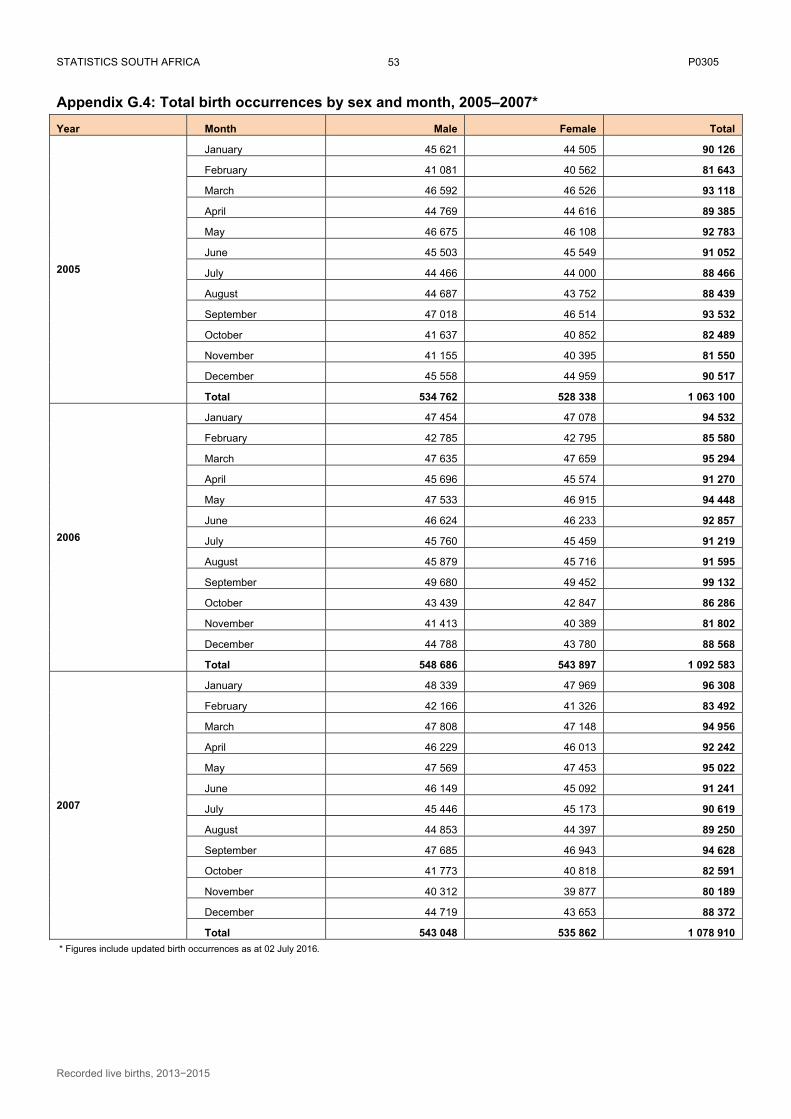
STATISTICS SOUTH AFRICA P0305
Recorded live births, 2013−2015
53
Appendix G.4: Total birth occurrences by sex and month, 2005–2007*
Year Month Male Female Total
2005
January 45 621 44 505 90 126
February 41 081 40 562 81 643
March 46 592 46 526 93 118
April 44 769 44 616 89 385
May 46 675 46 108 92 783
June 45 503 45 549 91 052
July 44 466 44 000 88 466
August 44 687 43 752 88 439
September 47 018 46 514 93 532
October 41 637 40 852 82 489
November 41 155 40 395 81 550
December 45 558 44 959 90 517
Total 534 762 528 338 1 063 100
2006
January 47 454 47 078 94 532
February 42 785 42 795 85 580
March 47 635 47 659 95 294
April 45 696 45 574 91 270
May 47 533 46 915 94 448
June 46 624 46 233 92 857
July 45 760 45 459 91 219
August 45 879 45 716 91 595
September 49 680 49 452 99 132
October 43 439 42 847 86 286
November 41 413 40 389 81 802
December 44 788 43 780 88 568
Total 548 686 543 897 1 092 583
2007
January 48 339 47 969 96 308
February 42 166 41 326 83 492
March 47 808 47 148 94 956
April 46 229 46 013 92 242
May 47 569 47 453 95 022
June 46 149 45 092 91 241
July 45 446 45 173 90 619
August 44 853 44 397 89 250
September 47 685 46 943 94 628
October 41 773 40 818 82 591
November 40 312 39 877 80 189
December 44 719 43 653 88 372
Total 543 048 535 862 1 078 910
* Figures include updated birth occurrences as at 02 July 2016.
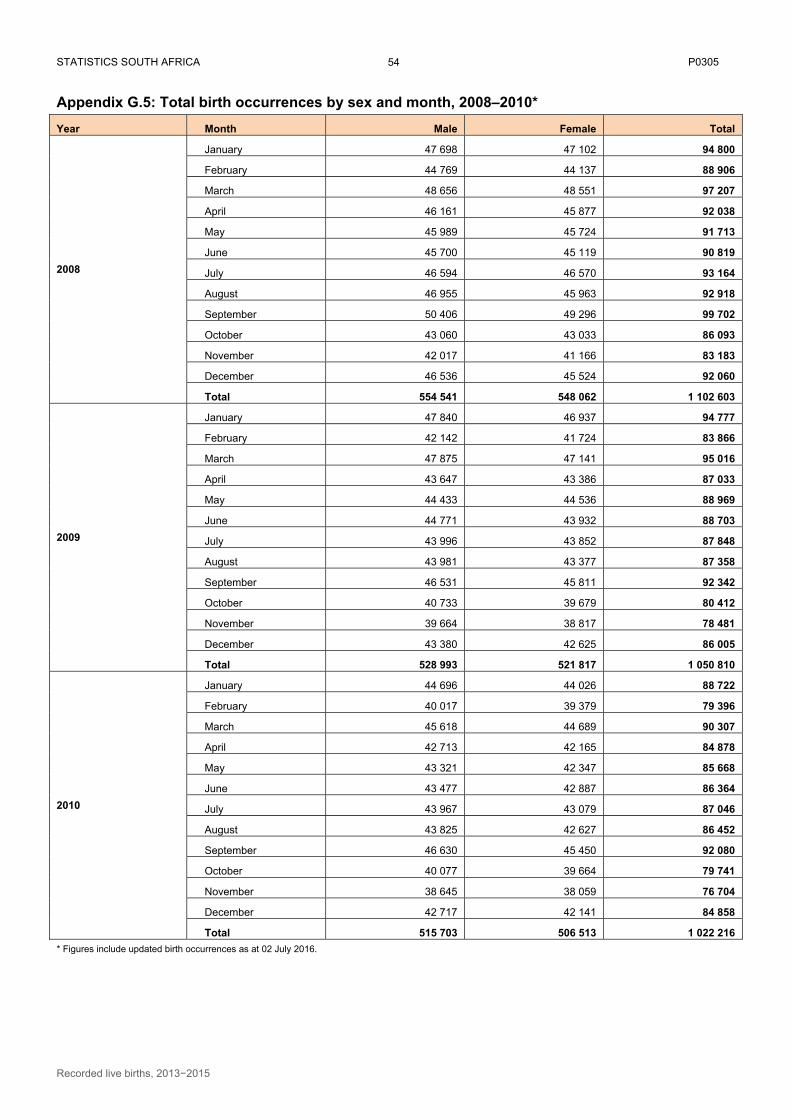
STATISTICS SOUTH AFRICA P0305
Recorded live births, 2013−2015
54
Appendix G.5: Total birth occurrences by sex and month, 2008–2010*
Year Month Male Female Total
2008
January 47 698 47 102 94 800
February 44 769 44 137 88 906
March 48 656 48 551 97 207
April 46 161 45 877 92 038
May 45 989 45 724 91 713
June 45 700 45 119 90 819
July 46 594 46 570 93 164
August 46 955 45 963 92 918
September 50 406 49 296 99 702
October 43 060 43 033 86 093
November 42 017 41 166 83 183
December 46 536 45 524 92 060
Total 554 541 548 062 1 102 603
2009
January 47 840 46 937 94 777
February 42 142 41 724 83 866
March 47 875 47 141 95 016
April 43 647 43 386 87 033
May 44 433 44 536 88 969
June 44 771 43 932 88 703
July 43 996 43 852 87 848
August 43 981 43 377 87 358
September 46 531 45 811 92 342
October 40 733 39 679 80 412
November 39 664 38 817 78 481
December 43 380 42 625 86 005
Total 528 993 521 817 1 050 810
2010
January 44 696 44 026 88 722
February 40 017 39 379 79 396
March 45 618 44 689 90 307
April 42 713 42 165 84 878
May 43 321 42 347 85 668
June 43 477 42 887 86 364
July 43 967 43 079 87 046
August 43 825 42 627 86 452
September 46 630 45 450 92 080
October 40 077 39 664 79 741
November 38 645 38 059 76 704
December 42 717 42 141 84 858
Total 515 703 506 513 1 022 216
* Figures include updated birth occurrences as at 02 July 2016.
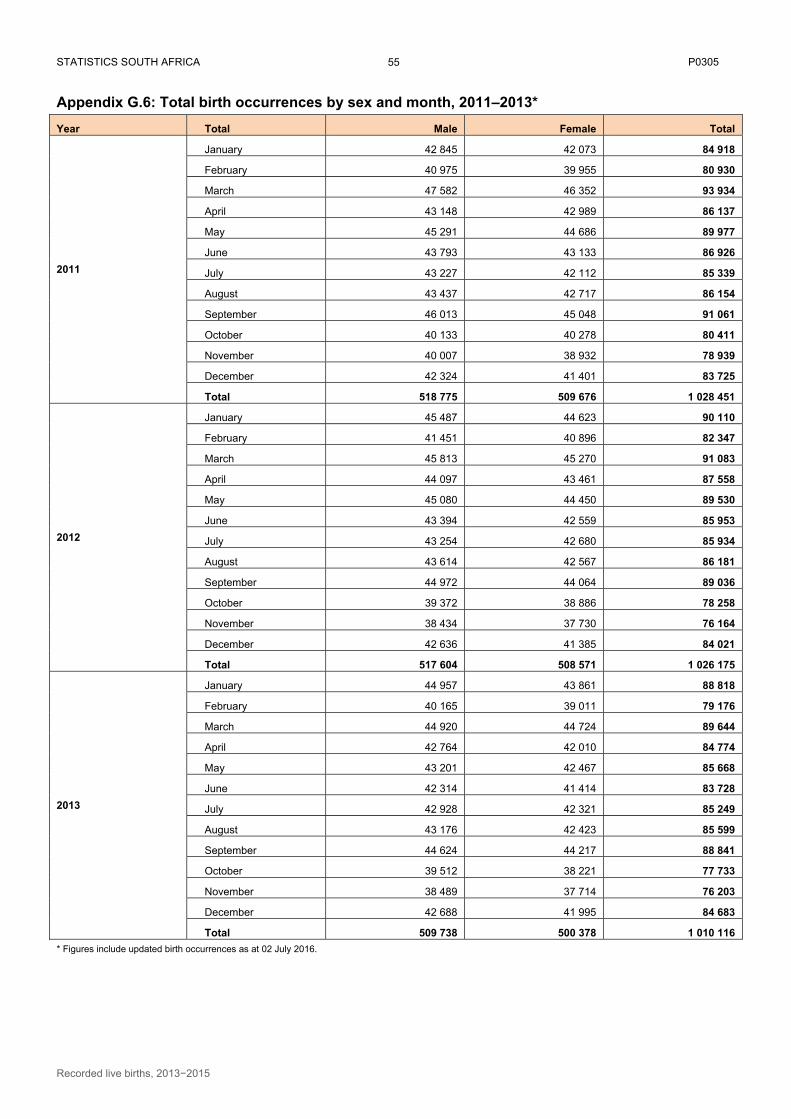
STATISTICS SOUTH AFRICA P0305
Recorded live births, 2013−2015
55
Appendix G.6: Total birth occurrences by sex and month, 2011–2013*
Year Total Male Female Total
2011
January 42 845 42 073 84 918
February 40 975 39 955 80 930
March 47 582 46 352 93 934
April 43 148 42 989 86 137
May 45 291 44 686 89 977
June 43 793 43 133 86 926
July 43 227 42 112 85 339
August 43 437 42 717 86 154
September 46 013 45 048 91 061
October 40 133 40 278 80 411
November 40 007 38 932 78 939
December 42 324 41 401 83 725
Total 518 775 509 676 1 028 451
2012
January 45 487 44 623 90 110
February 41 451 40 896 82 347
March 45 813 45 270 91 083
April 44 097 43 461 87 558
May 45 080 44 450 89 530
June 43 394 42 559 85 953
July 43 254 42 680 85 934
August 43 614 42 567 86 181
September 44 972 44 064 89 036
October 39 372 38 886 78 258
November 38 434 37 730 76 164
December 42 636 41 385 84 021
Total 517 604 508 571 1 026 175
2013
January 44 957 43 861 88 818
February 40 165 39 011 79 176
March 44 920 44 724 89 644
April 42 764 42 010 84 774
May 43 201 42 467 85 668
June 42 314 41 414 83 728
July 42 928 42 321 85 249
August 43 176 42 423 85 599
September 44 624 44 217 88 841
October 39 512 38 221 77 733
November 38 489 37 714 76 203
December 42 688 41 995 84 683
Total 509 738 500 378 1 010 116
* Figures include updated birth occurrences as at 02 July 2016.
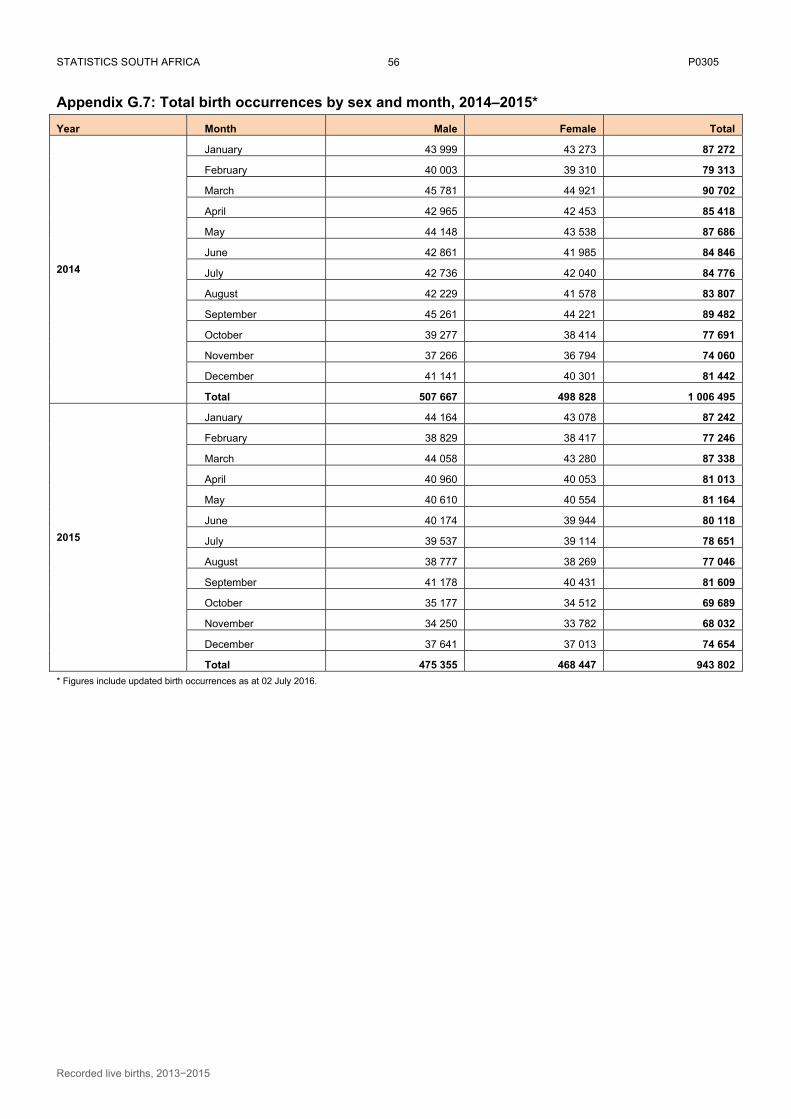
STATISTICS SOUTH AFRICA P0305
Recorded live births, 2013−2015
56
Appendix G.7: Total birth occurrences by sex and month, 2014–2015*
Year Month Male Female Total
2014
January 43 999 43 273 87 272
February 40 003 39 310 79 313
March 45 781 44 921 90 702
April 42 965 42 453 85 418
May 44 148 43 538 87 686
June 42 861 41 985 84 846
July 42 736 42 040 84 776
August 42 229 41 578 83 807
September 45 261 44 221 89 482
October 39 277 38 414 77 691
November 37 266 36 794 74 060
December 41 141 40 301 81 442
Total 507 667 498 828 1 006 495
2015
January 44 164 43 078 87 242
February 38 829 38 417 77 246
March 44 058 43 280 87 338
April 40 960 40 053 81 013
May 40 610 40 554 81 164
June 40 174 39 944 80 118
July 39 537 39 114 78 651
August 38 777 38 269 77 046
September 41 178 40 431 81 609
October 35 177 34 512 69 689
November 34 250 33 782 68 032
December 37 641 37 013 74 654
Total 475 355 468 447 943 802
* Figures include updated birth occurrences as at 02 July 2016.
STATISTICS SOUTH AFRICA P0305
Recorded live births, 2013−2015
57
Explanatory notes
Sources of data
The Department of Home Affairs (DHA) provides Statistics South Africa (Stats SA) with information on recorded live births. Two sets of birth statistics are provided: registration-based and occurrence-based data. Both these datasets come from the Nucleus Bureau of the DHA. When the officials at the various offices of the Department of Home Affairs capture the information about a birth, they do so directly onto the database at the Nucleus Bureau. These transactions are used to update the database of the birth register.
For the purpose of producing vital statistics, the following system is followed: each day, all civil transactions carried out at all the Department of Home Affairs offices are written onto a cassette. At the end of every month, a combined set of cassettes is created, containing all the transactions done for the month. These transactions are downloaded and the birth transactions are extracted for processing at Stats SA. The year in which the births are registered is the registration year. Using this information, Stats SA provides the breakdown of the registered births according to the year in which the births occurred.
While births information sent to Stats SA is the same as that in the population register, there is a difference of format between the two. On the one hand, Stats SA’s data are based on births registered during the year (registration-based), while on the other hand, entries in the population register reflect the date of birth. The date of registration of birth is not stored on the population registration file. For this reason, the population register can only be used to obtain birth data broken down by date of birth (occurrence-based).
By continuously updating the population register for late registration, the occurrence-based data from the population register get closer and closer to the true level of births. In a situation where birth registrations are complete (with very few late registrations), the occurrence-based perspective will be very similar to the registration-based perspective. However, if there are a large number of late registrations, the two perspectives will become widely dissimilar. With improvements in birth registration, the recorded data from the two sources will gradually converge.
The South African population register
The South African population register covers births, deaths, identity, marriages, divorces and movements of all South African citizens and permanent residents. The Births and Deaths Registration Act, 1992 (Act No. 51 of 1992) guides the registration of births and deaths throughout South Africa. The Act was subsequently amended in 1997 (Act No. 67 of 1997), in 1998 (Act No. 43 of 1998) and in 2010 (Act No. 18 of 2010). Another Act pertinent to the population register is the Identification Act, 1997 (Act No. 68 of 1997). This Act repealed previous Identification Acts (Act No. 72 of 1986, Act No. 21 of 1991, Act No. 4 of 1993, and Act No. 47 of 1995). Thus, each of the Acts dealing with any aspect of civil registration has implications for the information recorded into the population register.
From these Acts and amendments, the following persons and particulars are eligible to be included on the population register:
All children born of South African citizens and permanent residents when the notice of the birth is given within one year after the birth of the child.
All children born of South African citizens and permanent residents when the notice of the birth is given one year after the birth of the child together with the prescribed requirement for a late registration of birth.
All South African citizens and permanent residents who, upon attainment of the age of 16, applied for and were granted identification cards (or books).
All South African citizens and permanent residents who die at any age after birth. All South African citizens and permanent residents who depart permanently from South Africa. Persons whose particulars are not eligible for inclusion on the population register are listed below:
o Non-South African citizens who sojourn temporarily in the country. o All South African citizens and permanent residents who died before notice of their birth had been given.
STATISTICS SOUTH AFRICA P0305
Recorded live births, 2013−2015
58
Municipal demarcation
The Department of Home Affairs captured information on places based on office of birth registration. Stats SA re-classified the offices of birth registration into district councils and metropolitan areas based on the 2011 municipal boundaries. Certain magisterial districts are situated in more than one district council, in which case such magisterial districts are allocated to the district council where the majority of the land area falls. The only exception was with Nigel in Gauteng province. The majority of the land area of Nigel magisterial district is in Sedibeng District Council (which is mainly farm areas and therefore sparsely populated), while the majority of the population lives in the Ekurhuleni metropolitan area. As such, Nigel was classified under Ekurhuleni and not under Sedibeng. Maps for the old and the new classification are available from Stats SA on request.
Population group
As from 1991, no distinction is made between the different population groups on the data collected by the Department of Home Affairs. The statistics collected, therefore, refer to all population groups combined.
Definitions of concepts used
1.1 Live birth
The complete expulsion or extraction from its mother’s womb of a product of conception, irrespective of the duration of pregnancy, which, after such separation, breathes or shows any other evidence of life, such as beating of the heart, pulsation of the umbilical cord, or definite movement of voluntary muscles, whether or not the umbilical cord has been cut or the placenta is attached. Each product of such a birth is considered live born (WHO, 1992).
1.2 Recorded live births
The number of births recorded (registered) in a specific year, irrespective of when the birth actually occurred. The births recorded in any given year include the births that occurred during that year plus other births that occurred in years prior to the year of registration. It should be noted that not all births are recorded (registered).
1.3 Current birth registrations
This refers to the number of births occurring in a specific year and registered within the same year.
1.4 Late birth registrations
This refers to births occurring in a given calendar year but registered in subsequent calendar years. In this release, late registrations are grouped into two: (i) births registered after one year of birth but less than 15 years after birth; and (ii) births registered from 15 years after birth.
STATISTICS SOUTH AFRICA P0305
Recorded live births, 2013−2015
59
GENERAL INFORMATION
Stats SA publishes approximately 300 different statistical releases each year. It is not economically viable to produce them in more than one of South Africa's eleven official languages. Since the releases are used extensively, not only locally but also by international economic and social-scientific communities, Stats SA releases are published in English only. Stats SA has copyright on this publication. Users may apply the information as they wish, provided that they acknowledge Stats SA as the source of the basic data wherever they process, apply, utilise, publish or distribute the data; and also that they specify that the relevant application and analysis (where applicable) result from their own processing of the data. Advance release calendar An advance release calendar is disseminated on www.statssa.gov.za Stats SA products A complete set of Stats SA publications is available at the Stats SA Library and the following libraries: National Library of South Africa, Pretoria Division National Library of South Africa, Cape Town Division Natal Society Library, Pietermaritzburg Library of Parliament, Cape Town Bloemfontein Public Library Johannesburg Public Library Eastern Cape Library Services, King William’s Town Central Regional Library, Polokwane Central Reference Library, Nelspruit Central Reference Collection, Kimberley Central Reference Library, Mmabatho Stats SA also provides a subscription service. Electronic services A large range of data are available via on-line services, diskette and computer printouts. For more details about our electronic data services, contact 012 310 8600. You can visit us on the internet at: www.statssa.gov.za Enquiries User Information Services: Telephone number: 012 310 8600 Email address: [email protected] Orders/subscription services: Telephone number: 012 310 8044 Email address: [email protected] Technical enquiries: [email protected] Postal address: Private Bag X44, Pretoria, 0001
Produced by Stats SA