Embed Size (px)
Citation preview

U C L C a n c e r I n s t i t u t e
Statistical methods for the analysis
of Infinium DNA methylation data
Andrew Teschendorff
Statistical Genomics Group
UCL Cancer Institute
University College London
http://www.ucl.ac.uk/cancer/rescancerbiol/statisticalgenomics

U C L C a n c e r I n s t i t u t e
Outline
1. A beta mixture quantile dilation
normalisation method for 450k Illumina
Infinium data (type1/2 probe normalisation).
2. Confounding factors and Independent
Surrogate Variable Analysis (ISVA).
ISVA : Teschendorff et al Bioinformatics 2011
U C L C a n c e r I n s t i t u t e
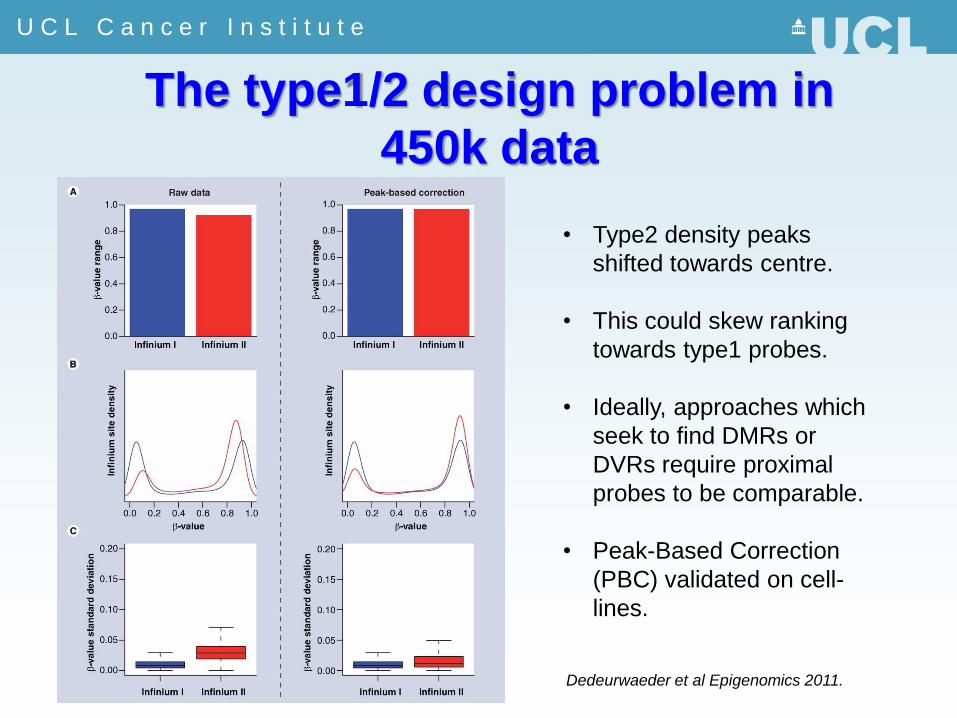
The type1/2 design problem in
450k data
• Type2 density peaks
shifted towards centre.
• This could skew ranking
towards type1 probes.
• Ideally, approaches which
seek to find DMRs or
DVRs require proximal
probes to be comparable.
• Peak-Based Correction
(PBC) validated on cell-
lines.
Dedeurwaeder et al Epigenomics 2011.

U C L C a n c e r I n s t i t u t e
PBC method on tumour tissue
• PBC method is problematic
when methylated peaks not
well-defined.
• Presence of “Holes”: the
holes are created due to
constant scaling factors.
• Need method that works for
broad peaks and avoids (as
much as possible) holes.

U C L C a n c e r I n s t i t u t e
A Beta-mixture quantile (BMIQ)
dilation normalisation strategy Type1 fit:
prob(M)
beta(M)
Type2 fit:
Desirable properties:
1. Number of U, H, M probes in each
design is determined by the beta
mixture model and is unchanged
by transformation.
2. Monotonic transformation.
3. Matching of densities at U and M
ends.
Dilation

U C L C a n c e r I n s t i t u t e
Assessment of BMIQ: tumour tissue
PBC BMIQ

U C L C a n c e r I n s t i t u t e
Assessment of BMIQ: cell-lines
Error over replicates Agreement with BPS
450k Data from
Dedeurwaeder et al Epigenomics 2011.

U C L C a n c e r I n s t i t u t e
Relative ranking of type1 vs type2
8 Breast Cancer vs
8 Normal Tissue Cancer tissue:
phenotypes A (18) vs B (14)
• PBC overcorrects data leading to a
relative enrichment of type2 probes
(caused by “holes”).
• Clear skew towards type1.
• Removed by PBC/BMIQ.

U C L C a n c e r I n s t i t u t e
Relative ranking of type1 vs type2
GBM: 49 CIMP+ vs 32 CIMP-
• PBC overcorrects data leading to a
relative enrichment of type2 probes
(caused by “holes”).
• Using regularised t-statistics to
rank features causes less of a
problem…..
GBM 450k data from Turcan S et al Nature March 2012
U C L C a n c e r I n s t i t u t e
Conclusions (I)
• Type1/2 bias creates a problem mainly if probes are
ranked according to absolute differential methylation.
• No strong type1/2 bias if probes ranked according to
regularized t-statistics (logit transform scale). However,
this may depend on phenotype, cell type, signal-to-noise
ratio,…etc.
• BMIQ/PBC reduce bias of type2 probes, however, at the
expense of increased inter-sample variance may
compromise cross-validation accuracy of type2 probes
(specially true for PBC).
• BMIQ outperforms PBC.
BMIQ appropriate in studies where there is type1/2 bias,
for DMR strategies and classification tasks.
U C L C a n c e r I n s t i t u t e
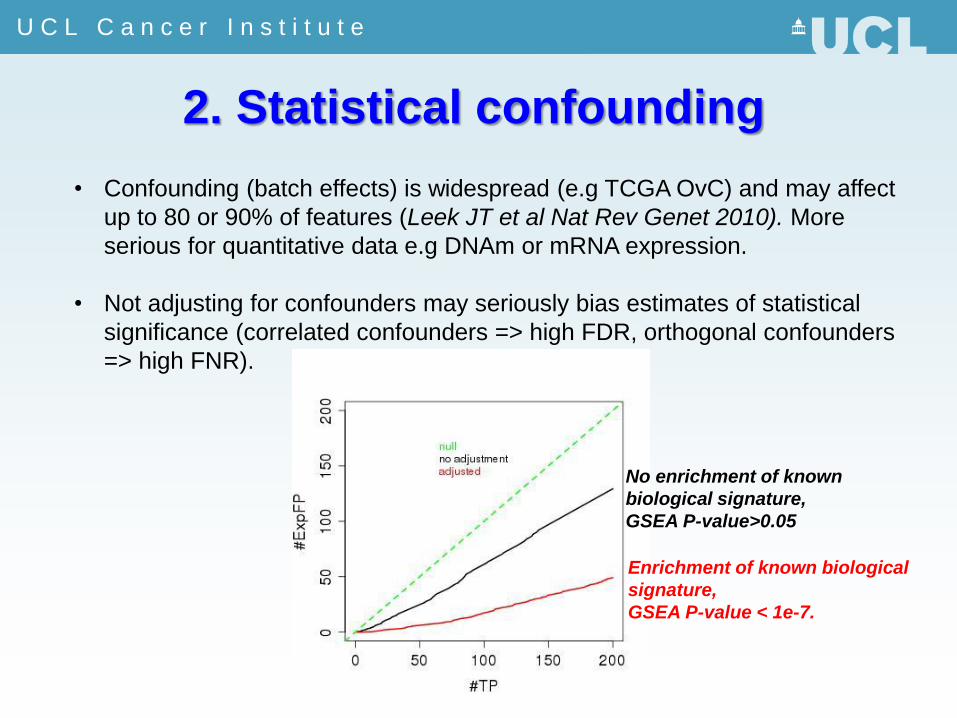
2. Statistical confounding
• Confounding (batch effects) is widespread (e.g TCGA OvC) and may affect
up to 80 or 90% of features (Leek JT et al Nat Rev Genet 2010). More
serious for quantitative data e.g DNAm or mRNA expression.
• Not adjusting for confounders may seriously bias estimates of statistical
significance (correlated confounders => high FDR, orthogonal confounders
=> high FNR).
No enrichment of known
biological signature,
GSEA P-value>0.05
Enrichment of known biological
signature,
GSEA P-value < 1e-7.

U C L C a n c e r I n s t i t u t e
Statistical confounding
• Unsupervised inter-array normalisation strategies (e.g quantile
normalisation) do not remove all variation associated with confounders
(Teschendorff AE et al PLoS One 2009, Leek JT et al Nat Rev Genet
2010), or may mask biologically/clinically important global differences in
DNA methylation (Moore LE et al Lancet Onc 2008).
• Explicit adjustment (e.g Johnson et al Biostatistics 2007 –COMBAT
algorithm): but what if factors are unknown or subject to measurement
error/uncertainty?

U C L C a n c e r I n s t i t u t e
Surrogate Variable Analysis (SVA)
Leek J T , Storey J D PNAS 2008;105:18718-18723
EBF(Y)EBSX
Y: Phenotype of interest (POI)
Biological variation of interest
Surrogate variable space
Confounding variation

U C L C a n c e r I n s t i t u t e
Drawbacks of SVA
• Framework is not flexible: suppose some confounders are
biological and adjustment for these is not required.
• Model misspecification: what if F(Y) is a poor model and
residual variation contains variation associated with POI ?
• Identifiability of confounders
is important if adjustment
required on a surrogate
variable subspace.
Biological variation of interest
Residual biological
variation of interest
Confounding variation
Surrogate variable space
Problem: the PCA/SVD used in SVA is not optimal.

U C L C a n c e r I n s t i t u t e
Blind source separation
Given these four images can we
reconstruct the original faces.?
?
? ?
?
One image One sample profile
One pixel One Probe
Pixel intensity Probe beta-value

U C L C a n c e r I n s t i t u t e
Blind Source Separation
Given these four images can we
reconstruct the original faces ?
?
? ?
?
One image One sample profile
One pixel One Probe
Pixel intensity Probe beta-value
One face One source of
data variation
ICA

U C L C a n c e r I n s t i t u t e
Independent Surrogate Variable Analysis
(I-SVA)
Teschendorff et al Bioinformatics 2011
KV
CFPOIV
V
K
|| UG F(Y) X
:selection Feature )4
)}(R)(R:{v
:selection subspace ISV & ISVsConstruct 3)
εASR
:ICA )2
RBF(Y)X
:matrix residual of Estimation )1
v
v
22
1k
kk

U C L C a n c e r I n s t i t u t e
ISVA vs SVA: modelling beadchip effects
in Illumina Infinium DNAm data
• ISVA outperforms SVA in
modelling beadchip effects
• Driven by sparse
(leptokurtic) sources.
Teschendorff A E et al.
Bioinformatics 2011;27:1496-1505

U C L C a n c e r I n s t i t u t e
Improved robustness of ISVA
DNAmSet3 SVA SVA* ISVA
aDMCs 201 163 225
nPCGTs 15 13 29
P-value 0.01 0.007 3e-7
DNAmSet1 SVA SVA* ISVA
aDMCs 688 688 902
nPCGTs 110 110 148
P-value 7e-26 7e-26 2e-34
DNAmSet2 SVA SVA* ISVA
aDMCs 4 8 232
nPCGTs 1 1 59
P-value 0.27 0.4 2e-19
DNAmSet4 SVA SVA* ISVA
aDMCs 185 479 469
nPCGTs 19 53 64
P-value 0.01 3e-11 8e-16
• Only ISVA captures
the age-PCGT DNAm
signature in all data
sets.
• Age-DNAm signatures:
Maegawa et al, Rakyan
et al, Teschendorff et al,
Genome Res. 2010.
Koch et al Aging 2011,
Bocklandt S et al PLoS
One 2011
Teschendorff A E et al.
Bioinformatics 2011;27:1496-1505

U C L C a n c e r I n s t i t u t e
Dimensionality estimation
“Diagnostic” SVD heatmap Dimensionality estimation can be
done using
Random Matrix Theory (RMT)
(Plerou et al Phys Rev E 2002)
RMT provides an analytical
framework in which to compare
observed properties of a data
matrix to universal properties of
random matrices.

U C L C a n c e r I n s t i t u t e
ISVA on 450k data (32 cancers)
“Diagnostic” SVD heatmap
ISV heatmap

U C L C a n c e r I n s t i t u t e
Conclusions (II)
• Confounders are often unknown or only approximations
to the real confounders are known therefore it is
better to model the confounders from the data itself.
• SVA may break down inspection of the surrogate
variable subspace subspace selection PCA/SVD
used in SVA not optimal.
• ISVA improves identifiabilty of confounders and
statistical inference (validated on 27k data), through use
of blind source separation algorithms.
• ISVA can be applied to 450k data (tested ~ 50k probes).