Embed Size (px)
Citation preview
bioengineering
Article
Statistical Modelling of Temperature and MoistureUptake of Biochars Exposed to Selected RelativeHumidity of Air
Luciane Bastistella 1, Patrick Rousset 2,3,*, Antonio Aviz 1, Armando Caldeira-Pires 4,Gilles Humbert 5 and Manoel Nogueira 6
1 Faculty of Mining and Environmental Engineering—Femma, Federal University of South and Southwest ofPará, Marabá 68507-590, PA, Brazil; [email protected] (L.B.); [email protected] (A.A.)
2 Joint Graduate School of Energy and Environment, Center of Excellence on Energy Technology andEnvironment-KMUTT, Bangkok 10140, Thailand
3 CIRAD, UPR BioWooEB, F-34398 Montpellier, France4 Department of Mechanical Engineering, University of Brasilia—UnB, Campus Universitário Darcy Ribeiro,
S/N, Asa Norte, Brasília 70910-900, DF, Brazil; [email protected] FerroPem, R & D Department, F-73025 Chambéry, France; [email protected] Faculty of Mechanical Engineering—Fem, Federal University of Pará, Belém 66075-900, PA, Brazil;
[email protected]* Correspondence: [email protected]
Received: 8 November 2017; Accepted: 8 February 2018; Published: 9 February 2018
Abstract: New experimental techniques, as well as modern variants on known methods, haverecently been employed to investigate the fundamental reactions underlying the oxidation of biochar.The purpose of this paper was to experimentally and statistically study how the relative humidityof air, mass, and particle size of four biochars influenced the adsorption of water and the increasein temperature. A random factorial design was employed using the intuitive statistical softwareXlstat. A simple linear regression model and an analysis of variance with a pairwise comparisonwere performed. The experimental study was carried out on the wood of Quercus pubescens,Cyclobalanopsis glauca, Trigonostemon huangmosun, and Bambusa vulgaris, and involved five relativehumidity conditions (22, 43, 75, 84, and 90%), two mass samples (0.1 and 1 g), and two particle sizes(powder and piece). Two response variables including water adsorption and temperature increasewere analyzed and discussed. The temperature did not increase linearly with the adsorption of water.Temperature was modeled by nine explanatory variables, while water adsorption was modeled byeight. Five variables, including factors and their interactions, were found to be common to the twomodels. Sample mass and relative humidity influenced the two qualitative variables, while particlesize and biochar type only influenced the temperature.
Keywords: biochars; moisture uptake; statistical modelling
1. Introduction
Spontaneous combustion has long been recognized as a fire hazard in stored coal and firesusually beginning as “hot spots” deep within the stockpile. Understanding the mechanisms by whichcarbon-based products get heated to the critical temperature is very important to suppress self-ignition,and ensure secure storage, transport, and handling. On the other hand, self-ignition may also beuseful in combustion processes if it occurs under controlled conditions. Therefore, self-ignition canbe categorized as a favorable or an unfavorable process which can be controlled by managing thedesired parameters.
Bioengineering 2018, 5, 13; doi:10.3390/bioengineering5010013 www.mdpi.com/journal/bioengineering
Bioengineering 2018, 5, 13 2 of 15
New experimental techniques, as well as modern variants on venerable methods, have recentlybeen employed to investigate the fundamental reactions underlying auto-ignition in great detail [1].A requirement for self-ignition to occur is that the material is sufficiently porous and reactive so thatadequate fuel and oxygen are available throughout the whole self-heating process. According toMiura [2], the initial conditions for coal self-heating include many factors which can be divided intotwo main types: the properties of coal (intrinsic factors) and the environment/storage conditions(extrinsic factors). Heating results from some chemical and/or physical processes occurring within thematerial and this phenomenon is mainly attributed to exothermic processes such as low temperatureoxidation, microbial metabolism, adsorption-desorption of water, and air oxidation with a productionof undissipated energy [3,4]. The first advances in self–heating investigations related to air relativehumidity were attributed to Davis, who studied the effect of moisture content on the spontaneouscombustion of coal using an adiabatic calorimeter. He compared the heat produced by coal incontact with dry and saturated oxygen and showed that the spontaneous combustion started at70 ◦C [5]. In the 1960s, Stott confirmed these results and proposed differential equations describingthe high-temperature oxidation of coal [6]. Other recent studies have been carried out to clarify themechanism of low-temperature oxidation of coal and showed that this process is in general very slowcompared to air moisture uptake [7,8]. A literature review has been made on present theories andmethods for the prediction of spontaneous ignition and has mainly focused on engineering modelsand small-scale methods [9].
The tendency to self-heating is also dependent on material size, so no quantification of a material’sself-ignition hazard is possible without incorporating system size and ambient temperature [10].Studying charcoal briquettes self-ignition, these authors concluded that a temperature of at least121 ◦C is required for self-ignition to occur in the largest commercially available bag size, 9 kg.No information and no correlation have been provided for small size samples (g). The effect ofparticle size with a diameter in the range 2–50 mm has been studied in a large-scale apparatus andhas shown that the spontaneous heating of coal leads to flaming combustion below a certain criticalrange [11]. The liability of spontaneous combustion of lignite increases with decreasing particle size,increasing moisture content of the coal, and decreasing humidity of the air [12]. The ignition delayof a biomass packed-bed has also been studied and showed an increase with fuel properties such asmoisture content and particle size, while it decreased with process conditions such as gas velocity andtemperature [13]. The information with a direct temperature increase measurement is expected to bean index to estimate the propensity to spontaneous combustion. The adsorption of water vapor onthe sample has been shown to play a crucial role in raising the sample temperature over the criticalself-ignition temperature [14].
The purpose of this work was to measure the adsorption rate of water vapor and temperaturechange of woody and non-woody biochars under various relative humidity conditions naturallyoccurring in arid, semi-arid, and humid climates. The role of sample size on spontaneous heating wasalso investigated based on experiments and statistical analyses.
2. Material and Method
2.1. Material
The four types of biochar used in this study represent major feedstocks and local commonbio-reducers in Yunnan Province in China. These are Quercus pubescens (Qp), Cyclobalanopsis glauca(Cg), Trigonostemon huangmosun (Th), and Bambusa vulgar (B), which are mainly hardwood except forbamboo which is a non woody biomass. All selected biomass materials were pyrolysed at 500 ◦Cand held for 60 min in order to be roughly similar to the industrial operating conditions of thefactory [15]. The proximate analyses followed the standard procedure of the American Society(ASTM D5142). The elemental composition of C, H, and N content was determined using a ThermoFlashEA 1112 Elemental Analyzer (Thermo Fisher Scientific Inc., Waltham, MA, USA) according to the
Bioengineering 2018, 5, 13 3 of 15
European standard XP CEN/TS 15104 and ASTM D5373 for solid biofuels and charcoals, respectively.The higher heating value (HHV) was experimentally determined with a calorimeter LECO AC350(LECO Corporation, Saint Joseph, MI, USA). The BET method was applied to provide a precise specificsurface area with Belsorp-max Bel Japan equipment (MicrotracBEL Corp., Osaka, Japan). This gear isdesigned for a wide range adsorption isotherm for surface area and pore size distribution analysis.It can measure adsorption isotherms from relative pressure as low as 1 × 10⁻⁸ (N2 at 77 K, Ar at 87 K),using a 13.3 Pa pressure transducer. The nitrogen adsorption-desorption of the samples was measuredat −196 ◦C. Prior to the measurements, the samples were degassed at 150 ◦C for 1 h. The properties ofthe experimental samples are shown in Table 1.
Table 1. Physicochemical characteristics of biochars.
PropertiesBiochar
Qp Cg Tr B
Proximate analysis (wt %, dry basis)
Ash 0.5 2.4 1.5 6.5Volatile matter 12.7 17.4 15.1 15.6
Volatile matter/Ash 25.4 7.3 10.1 2.4Fixed carbon 86.8 80.2 83.4 77.8
Ultimate analysis (wt %, dry basis and ash free)
C 89.6 86.3 89.3 82.2H 2.3 2.3 2.3 1.5N 0.5 0.3 0.3 0.5
O (by difference) 7.6 11.1 8.1 15.8H/C 0.02 0.03 0.02 0.02
High heating value (Mj·Kg−1) 33.9 32.7 33.8 30.4BET Surface area (m2·g−1) 292 62 86 40
2.2. Temperature Measurement
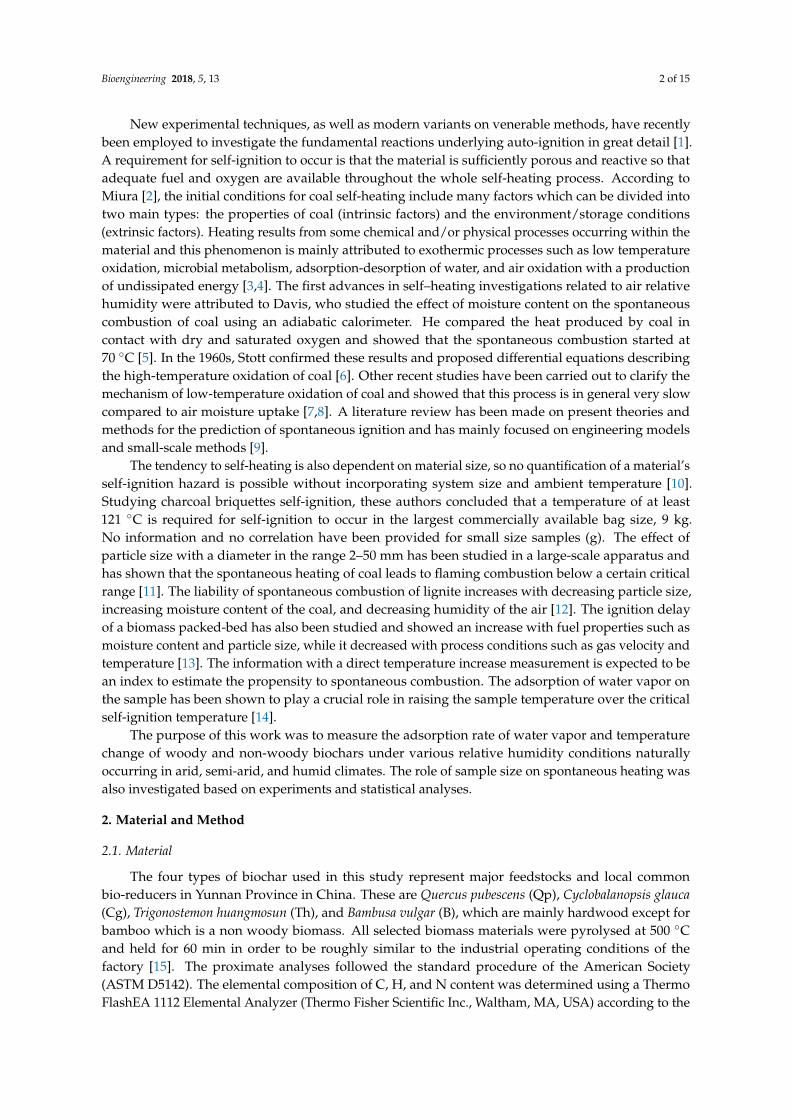
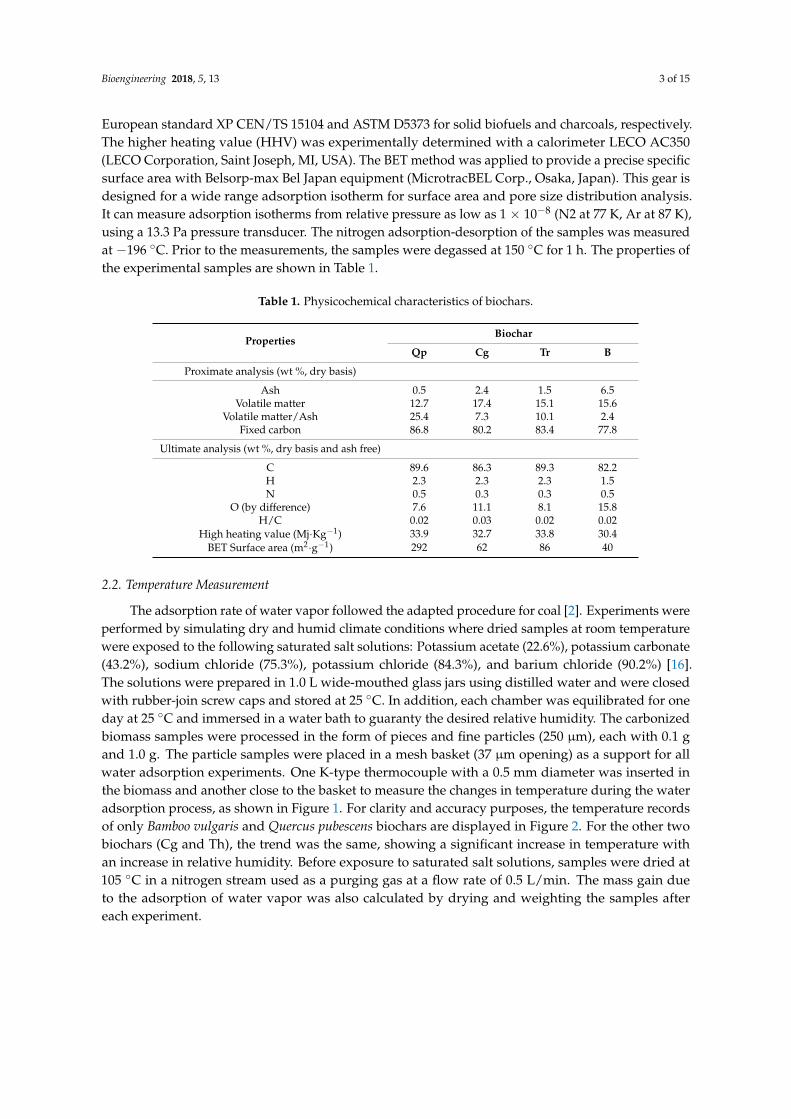
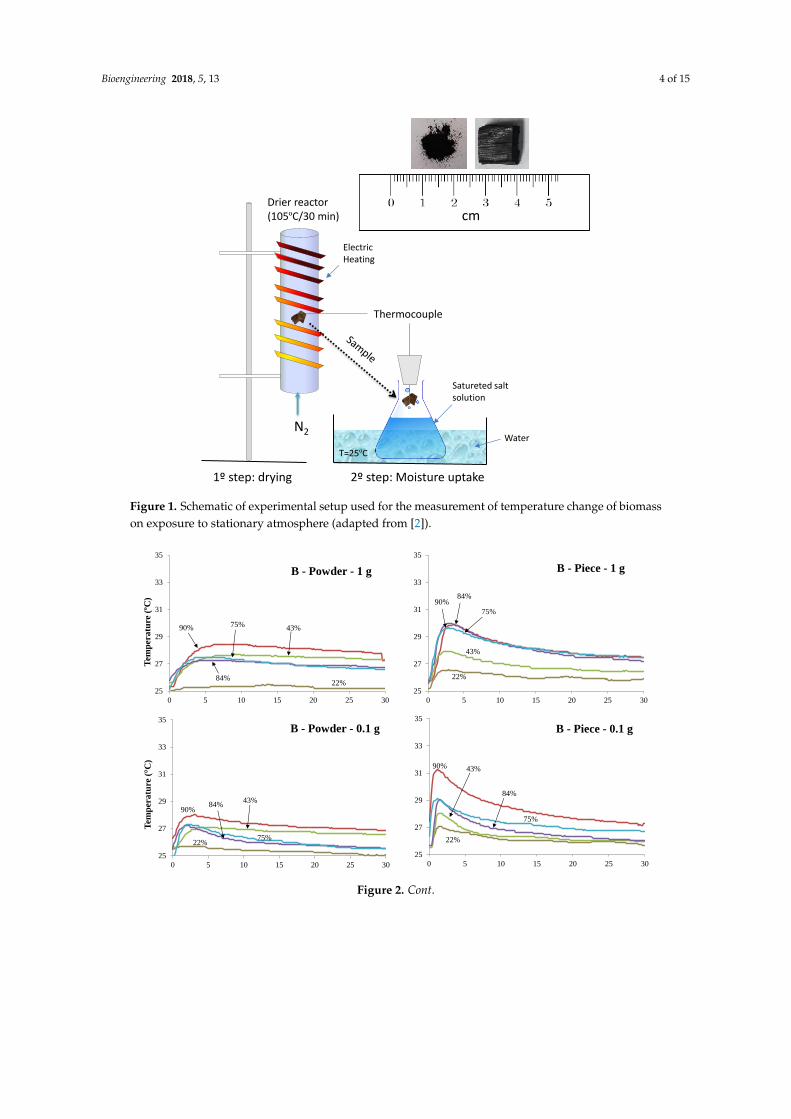
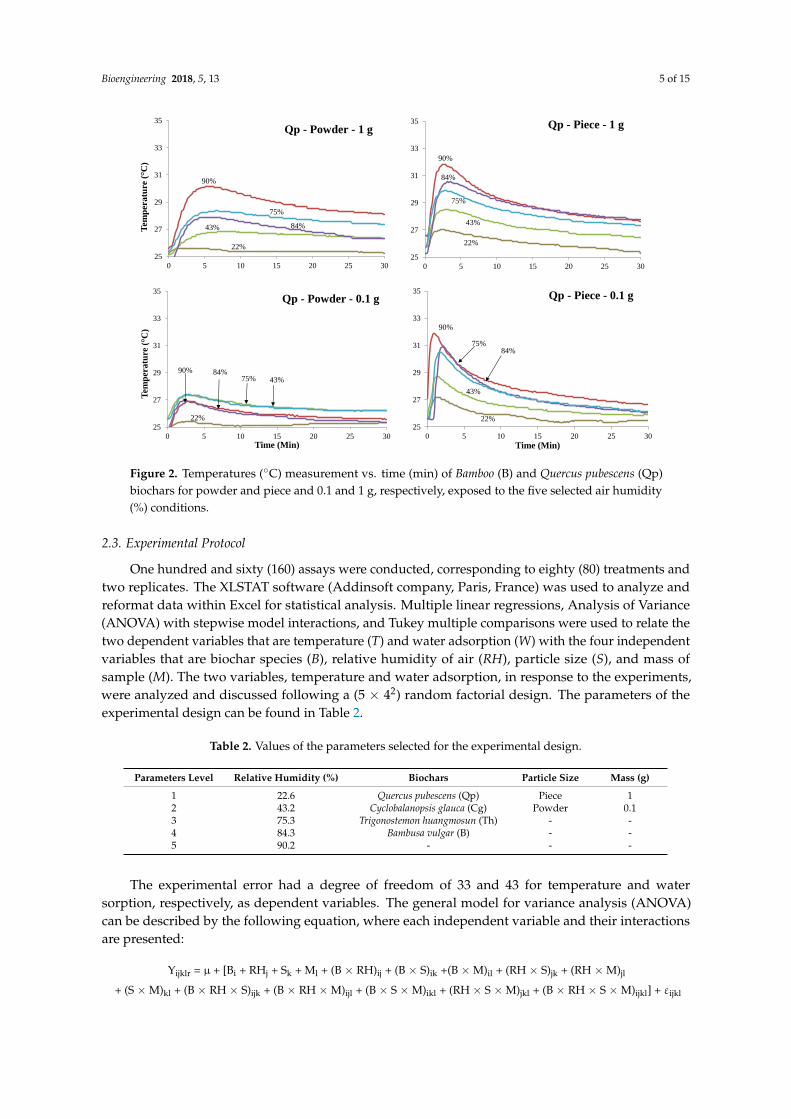
The adsorption rate of water vapor followed the adapted procedure for coal [2]. Experiments wereperformed by simulating dry and humid climate conditions where dried samples at room temperaturewere exposed to the following saturated salt solutions: Potassium acetate (22.6%), potassium carbonate(43.2%), sodium chloride (75.3%), potassium chloride (84.3%), and barium chloride (90.2%) [16].The solutions were prepared in 1.0 L wide-mouthed glass jars using distilled water and were closedwith rubber-join screw caps and stored at 25 ◦C. In addition, each chamber was equilibrated for oneday at 25 ◦C and immersed in a water bath to guaranty the desired relative humidity. The carbonizedbiomass samples were processed in the form of pieces and fine particles (250 µm), each with 0.1 gand 1.0 g. The particle samples were placed in a mesh basket (37 µm opening) as a support for allwater adsorption experiments. One K-type thermocouple with a 0.5 mm diameter was inserted inthe biomass and another close to the basket to measure the changes in temperature during the wateradsorption process, as shown in Figure 1. For clarity and accuracy purposes, the temperature recordsof only Bamboo vulgaris and Quercus pubescens biochars are displayed in Figure 2. For the other twobiochars (Cg and Th), the trend was the same, showing a significant increase in temperature withan increase in relative humidity. Before exposure to saturated salt solutions, samples were dried at105 ◦C in a nitrogen stream used as a purging gas at a flow rate of 0.5 L/min. The mass gain dueto the adsorption of water vapor was also calculated by drying and weighting the samples aftereach experiment.
Bioengineering 2018, 5, 13 4 of 15Bioengineering 2018, 5, x FOR PEER REVIEW 4 of 14
Figure 1. Schematic of experimental setup used for the measurement of temperature change of
biomass on exposure to stationary atmosphere (adapted from [2]).
N2
Thermocouple
T=25ºC
Satureted salt solution
Drier reactor (105ºC/30 min)
1º step: drying 2º step: Moisture uptake
ElectricHeating
Water
cm
25
27
29
31
33
35
0 5 10 15 20 25 30
Tem
per
atu
re ( C
)
90%
43%
75%22%
84%
B - Powder - 0.1 g
25
27
29
31
33
35
0 5 10 15 20 25 30
90%84%
75%
43%
22%
B - Piece - 1 g
25
27
29
31
33
35
0 5 10 15 20 25 30
Tem
per
atu
re (
ºC)
90%
84%
75% 43%
22%
B - Powder - 1 g
25
27
29
31
33
35
0 5 10 15 20 25 30
90%
84%
75%
43%
22%
B - Piece - 0.1 g
25
27
29
31
33
35
0 5 10 15 20 25 30
Tem
per
atu
re ( C
)
90%
84%
75%
43%
22%
Qp - Powder - 1 g
25
27
29
31
33
35
0 5 10 15 20 25 30
Tem
per
atu
re ( C
)
Time (Min)
90% 84%75% 43%
22%
Qp - Powder - 0.1 g
25
27
29
31
33
35
0 5 10 15 20 25 30
Time (Min)
90%
84%75%
43%
22%
Qp - Piece - 0.1 g
25
27
29
31
33
35
0 5 10 15 20 25 30
90%
84%
75%
43%
22%
Qp - Piece - 1 g
Figure 1. Schematic of experimental setup used for the measurement of temperature change of biomasson exposure to stationary atmosphere (adapted from [2]).
Bioengineering 2018, 5, x FOR PEER REVIEW 4 of 14
Figure 1. Schematic of experimental setup used for the measurement of temperature change of
biomass on exposure to stationary atmosphere (adapted from [2]).
N2
Thermocouple
T=25ºC
Satureted salt solution
Drier reactor (105ºC/30 min)
1º step: drying 2º step: Moisture uptake
ElectricHeating
Water
cm
25
27
29
31
33
35
0 5 10 15 20 25 30
Tem
per
atu
re ( C
)
90%
43%
75%22%
84%
B - Powder - 0.1 g
25
27
29
31
33
35
0 5 10 15 20 25 30
90%84%
75%
43%
22%
B - Piece - 1 g
25
27
29
31
33
35
0 5 10 15 20 25 30
Tem
per
atu
re (
ºC)
90%
84%
75% 43%
22%
B - Powder - 1 g
25
27
29
31
33
35
0 5 10 15 20 25 30
90%
84%
75%
43%
22%
B - Piece - 0.1 g
25
27
29
31
33
35
0 5 10 15 20 25 30
Tem
per
atu
re ( C
)
90%
84%
75%
43%
22%
Qp - Powder - 1 g
25
27
29
31
33
35
0 5 10 15 20 25 30
Tem
per
atu
re ( C
)
Time (Min)
90% 84%75% 43%
22%
Qp - Powder - 0.1 g
25
27
29
31
33
35
0 5 10 15 20 25 30
Time (Min)
90%
84%75%
43%
22%
Qp - Piece - 0.1 g
25
27
29
31
33
35
0 5 10 15 20 25 30
90%
84%
75%
43%
22%
Qp - Piece - 1 g Figure 2. Cont.
Bioengineering 2018, 5, 13 5 of 15Bioengineering 2018, 5, x FOR PEER REVIEW 5 of 14
Figure 2. Temperatures (°C) measurement vs. time (min) of Bamboo (B) and Quercus pubescens (Qp)
biochars for powder and piece and 0.1 and 1 g, respectively, exposed to the five selected air humidity
(%) conditions.
2.3. Experimental Protocol
One hundred and sixty (160) assays were conducted, corresponding to eighty (80) treatments
and two replicates. The XLSTAT software (Addinsoft company, Paris, France) was used to analyze
and reformat data within Excel for statistical analysis. Multiple linear regressions, Analysis of
Variance (ANOVA) with stepwise model interactions, and Tukey multiple comparisons were used
to relate the two dependent variables that are temperature (T) and water adsorption (W) with the
four independent variables that are biochar species (B), relative humidity of air (RH), particle size
(S), and mass of sample (M). The two variables, temperature and water adsorption, in response to
the experiments, were analyzed and discussed following a (5 × 42) random factorial design. The
parameters of the experimental design can be found in Table 2.
Table 2. Values of the parameters selected for the experimental design.
Parameters Level Relative Humidity (%) Biochars Particle Size Mass (g)
1 22.6 Quercus pubescens (Qp) Piece 1
2 43.2 Cyclobalanopsis glauca (Cg) Powder 0.1
3 75.3 Trigonostemon huangmosun (Th) - -
4 84.3 Bambusa vulgar (B) - -
5 90.2 - - -
The experimental error had a degree of freedom of 33 and 43 for temperature and water
sorption, respectively, as dependent variables. The general model for variance analysis (ANOVA)
can be described by the following equation, where each independent variable and their interactions
are presented:
25
27
29
31
33
35
0 5 10 15 20 25 30
Tem
per
atu
re ( C
)
90%
43%
75%22%
84%
B - Powder - 0.1 g
25
27
29
31
33
35
0 5 10 15 20 25 30
90%84%
75%
43%
22%
B - Piece - 1 g
25
27
29
31
33
35
0 5 10 15 20 25 30
Tem
per
atu
re (
ºC)
90%
84%
75% 43%
22%
B - Powder - 1 g
25
27
29
31
33
35
0 5 10 15 20 25 30
90%
84%
75%
43%
22%
B - Piece - 0.1 g
25
27
29
31
33
35
0 5 10 15 20 25 30
Tem
per
atu
re ( C
)
90%
84%
75%
43%
22%
Qp - Powder - 1 g
25
27
29
31
33
35
0 5 10 15 20 25 30
Tem
per
atu
re ( C
)
Time (Min)
90% 84%75% 43%
22%
Qp - Powder - 0.1 g
25
27
29
31
33
35
0 5 10 15 20 25 30
Time (Min)
90%
84%75%
43%
22%
Qp - Piece - 0.1 g
25
27
29
31
33
35
0 5 10 15 20 25 30
90%
84%
75%
43%
22%
Qp - Piece - 1 g
Figure 2. Temperatures (◦C) measurement vs. time (min) of Bamboo (B) and Quercus pubescens (Qp)biochars for powder and piece and 0.1 and 1 g, respectively, exposed to the five selected air humidity(%) conditions.
2.3. Experimental Protocol
One hundred and sixty (160) assays were conducted, corresponding to eighty (80) treatments andtwo replicates. The XLSTAT software (Addinsoft company, Paris, France) was used to analyze andreformat data within Excel for statistical analysis. Multiple linear regressions, Analysis of Variance(ANOVA) with stepwise model interactions, and Tukey multiple comparisons were used to relate thetwo dependent variables that are temperature (T) and water adsorption (W) with the four independentvariables that are biochar species (B), relative humidity of air (RH), particle size (S), and mass ofsample (M). The two variables, temperature and water adsorption, in response to the experiments,were analyzed and discussed following a (5 × 42) random factorial design. The parameters of theexperimental design can be found in Table 2.
Table 2. Values of the parameters selected for the experimental design.
Parameters Level Relative Humidity (%) Biochars Particle Size Mass (g)
1 22.6 Quercus pubescens (Qp) Piece 12 43.2 Cyclobalanopsis glauca (Cg) Powder 0.13 75.3 Trigonostemon huangmosun (Th) - -4 84.3 Bambusa vulgar (B) - -5 90.2 - - -
The experimental error had a degree of freedom of 33 and 43 for temperature and watersorption, respectively, as dependent variables. The general model for variance analysis (ANOVA)can be described by the following equation, where each independent variable and their interactionsare presented:
Yijklr = µ + [Bi + RHj + Sk + Ml + (B × RH)ij + (B × S)ik +(B × M)il + (RH × S)jk + (RH × M)jl
+ (S × M)kl + (B × RH × S)ijk + (B × RH × M)ijl + (B × S × M)ikl + (RH × S × M)jkl + (B × RH × S × M)ijkl] + εijkl
Bioengineering 2018, 5, 13 6 of 15
3. Results and Discussion
3.1. Overall Results
Tables 3 and 4 provide the average values for water adsorption (W) and the temperature (T) ofbiochar pieces and powdered biochar reached when exposed to five different conditions of relativehumidity. All samples show a significant increase in temperature. The higher the air humidity value is,the higher the increase in temperature is. This tendency is observed for almost all samples. The highestand fastest increase in temperature is observed for the piece of biochar characterized by the lowestweight (0.1 g) (Figure 2). The temperature profiles of the powdered biochar samples are significantlydifferent from the biochar piece samples and this is independent of the weight of the samples. Whilethe biochar piece samples required around 2 min to reach the peak temperature, the powdered biocharsamples required 5 to 8 min under the highest relative humidity conditions. Cg biochar and piecesamples reached the highest temperature (6 ◦C) for a relative humidity of 90.2%.
Table 3. Averaged values for water adsorption (%) from pieces and powdered biochars exposed todifferent relative humidities of air based on a random factorial design, considering two replicates pertest. (d.b. = dry basis).
Sample Size Mass (g)Relative Humidity (%)
22.6 43.2 75.3 84.3 90.2
Moisture Uptake (%) d.b.
Qp Piece0.1 0.14 2.97 5.30 3.95 1.961 0.43 0.28 2.22 3.23 2.20
Cg Piece0.1 0.00 3.25 5.43 6.96 4.871 0.13 1.32 3.55 3.49 1.72
Th Piece0.1 0.37 2.53 4.46 4.82 2.721 0.35 1.66 1.92 2.28 2.19
B Piece0.1 1.20 2.14 4.29 3.77 4.111 0.61 1.72 2.12 3.06 1.42
Qp Powder0.1 2.35 4.97 4.02 4.25 5.211 0.65 1.35 1.78 1.26 1.76
Cg Powder0.1 2.73 2.83 5.58 6.15 6.501 0.88 1.07 3.23 1.77 3.60
Th Powder0.1 0.31 2.36 2.33 5.10 3.771 0.70 1.10 1.00 2.12 2.05
B Powder0.1 1.72 2.96 2.37 6.24 3.521 0.83 1.51 1.74 1.81 2.07
Concerning the water vapor adsorption for all conditions, all the samples with a mass of 1.0 gshow a lower water vapor adsorption capacity than samples with a mass of 0.1 g. The values obtainedare more dispersed. However, the global trend shows that more mass of water vapor was adsorbedwhen the samples were exposed to higher levels of relative humidity. This difference is mainly due tothe difference in mass transfer in the samples [2]. The highest amount of water adsorbed is observedfor Cg (piece 0.1 g/84.3%), Cg (powder 0.1 g/90.2%), and B (powder 0.1 g/84.3%) with 7%, 6.5%,and 6.2%, respectively. For the powdered biochar samples, the better adsorption capacity can beexplained by the larger surface area exposed to outside conditions compared to the piece. The surfacearea is also an important physical property for self-ignition. A direct correlation between oxygenchemisorption and active surface area has been reported by Zhao [17]. However, this phenomenondoes not seem to be correlated to the BET results (Table 1), where (Qp) and (B) biochars with 292 and40 m2·g−1, respectively, did not show the strongest and lowest potential for spontaneous combustion,
Bioengineering 2018, 5, 13 7 of 15
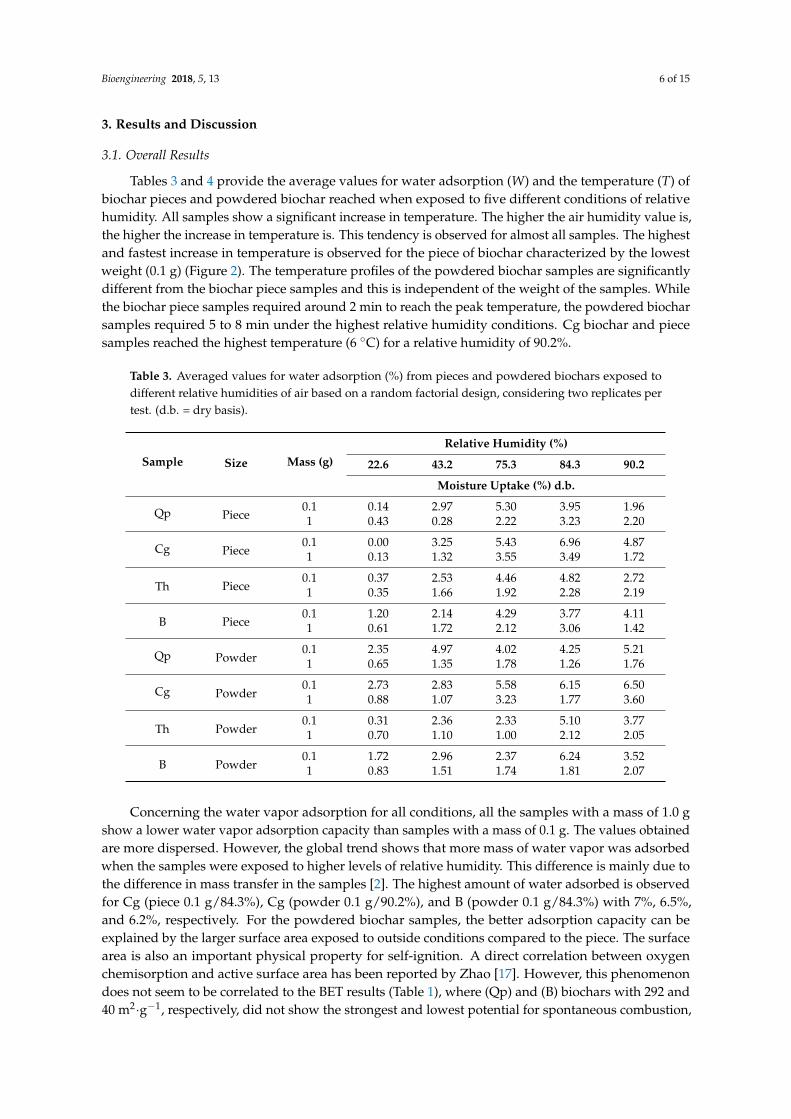
respectively. To confirm this, we performed a one-way balanced analysis of variance. As shown inFigure 3, the Tukey’s HSD (Honestly Significantly Different) test was applied to all pairwise differencesbetween means. As all the combinations shared the same letter, it can be concluded that the BET doesnot significantly affect water absorption (W) and temperature (T).
Table 4. Averaged values for temperature (◦C) increasing from pieces and powdered biochars exposedto different relative humidities of air based on a random factorial design, considering two replicatesper test.
Sample Size Mass (g)Relative Humidity (%)
22.6 43.2 75.3 84.3 90.2
∆T (◦C)
Qp Piece0.1 1.60 2.95 5.05 5.25 4.801.0 1.20 2.70 4.25 5.30 5.25
Cg Piece0.1 1.40 3.05 4.95 5.25 5.701.0 1.55 2.45 4.75 4.61 6.00
Th Piece0.1 1.15 2.45 3.85 4.50 5.301.0 1.15 2.50 3.35 4.20 4.40
B Piece0.1 1.10 2.55 2.75 3.40 3.501.0 1.40 2.25 3.8 4.45 4.10
Qp Powder0.1 0.55 1.70 1.85 2.10 2.251.0 0.35 1.70 2.75 3.10 4.55
Cg Powder0.1 0.65 1.40 2.35 2.00 2.551.0 0.65 1.80 5.35 2.00 4.95
Th Powder0.1 0.35 1.40 0.90 2.00 2.251.0 0.60 1.70 1.60 2.90 2.85
B Powder0.1 0.20 0.95 2.70 1.65 1.651.0 0.35 2.10 2.50 1.45 3.15
Bioengineering 2018, 5, x FOR PEER REVIEW 6 of 14
Yijklr = μ + [Bi + RHj + Sk + Ml + (B × RH)ij + (B × S)ik +(B × M)il + (RH × S)jk + (RH × M)jl
+ (S × M)kl + (B × RH × S)ijk + (B × RH × M)ijl + (B × S × M)ikl + (RH × S × M)jkl + (B × RH × S ×
M)ijkl] + εijkl
3. Results and Discussion
3.1. Overall Results
Table 3 andTable 4 provide the average values for water adsorption (W) and the temperature (T)
of biochar pieces and powdered biochar reached when exposed to five different conditions of
relative humidity. All samples show a significant increase in temperature. The higher the air
humidity value is, the higher the increase in temperature is. This tendency is observed for almost all
samples. The highest and fastest increase in temperature is observed for the piece of biochar
characterized by the lowest weight (0.1 g) (Figure 2). The temperature profiles of the powdered
biochar samples are significantly different from the biochar piece samples and this is independent of
the weight of the samples. While the biochar piece samples required around 2 min to reach the peak
temperature, the powdered biochar samples required 5 to 8 min under the highest relative humidity
conditions. Cg biochar and piece samples reached the highest temperature (6 °C) for a relative
humidity of 90.2%.
Concerning the water vapor adsorption for all conditions, all the samples with a mass of 1.0 g
show a lower water vapor adsorption capacity than samples with a mass of 0.1 g. The values
obtained are more dispersed. However, the global trend shows that more mass of water vapor was
adsorbed when the samples were exposed to higher levels of relative humidity. This difference is
mainly due to the difference in mass transfer in the samples [2]. The highest amount of water adsorbed
is observed for Cg (piece 0.1 g/84.3%), Cg (powder 0.1 g/90.2%), and B (powder 0.1 g/84.3%) with 7%,
6.5%, and 6.2%, respectively. For the powdered biochar samples, the better adsorption capacity can
be explained by the larger surface area exposed to outside conditions compared to the piece. The
surface area is also an important physical property for self-ignition. A direct correlation between
oxygen chemisorption and active surface area has been reported by Zhao [17]. However, this
phenomenon does not seem to be correlated to the BET results (Table 1), where (Qp) and (B) biochars
with 292 and 40 m2·g−1, respectively, did not show the strongest and lowest potential for spontaneous
combustion, respectively. To confirm this, we performed a one-way balanced analysis of variance. As
shown in Figure 3, the Tukey’s HSD (Honestly Significantly Different) test was applied to all pairwise
differences between means. As all the combinations shared the same letter, it can be concluded that the
BET does not significantly affect water absorption (W) and temperature (T).
Figure 3. Classification by Tukey’s test for water sorption (W) and temperature (T) averages versus
BET and ash content. The means with the same letter were not significantly different at 5% (α = 0.05).
A A
A
AA
AA
A
0
0.5
1
1.5
2
2.5
3
3.5
Mea
ns
2,4 0,5 6,5 1,5
Mass water uptake (%) Temperature (°C)
Ash content (%)
2.4 6.50.5 1.5
A A
A
AA
AA
A
0
0.5
1
1.5
2
2.5
3
3.5
Mea
ns
62 292 40 86
Mass water uptake (%) Temperature (°C)
BET (m².g-1)
Figure 3. Classification by Tukey’s test for water sorption (W) and temperature (T) averages versusBET and ash content. The means with the same letter were not significantly different at 5% (α = 0.05).
The above discussion shows that the adsorption of water vapor under different relative humidityconditions (Table 3) has the potential to raise the temperature of the samples. However, otherbiochar-related physical and chemical properties can also affect water sorption and consequentlythe increase in temperature (Table 4). For example, the mineral content acts as a heat sink [17]. With the
Bioengineering 2018, 5, 13 8 of 15
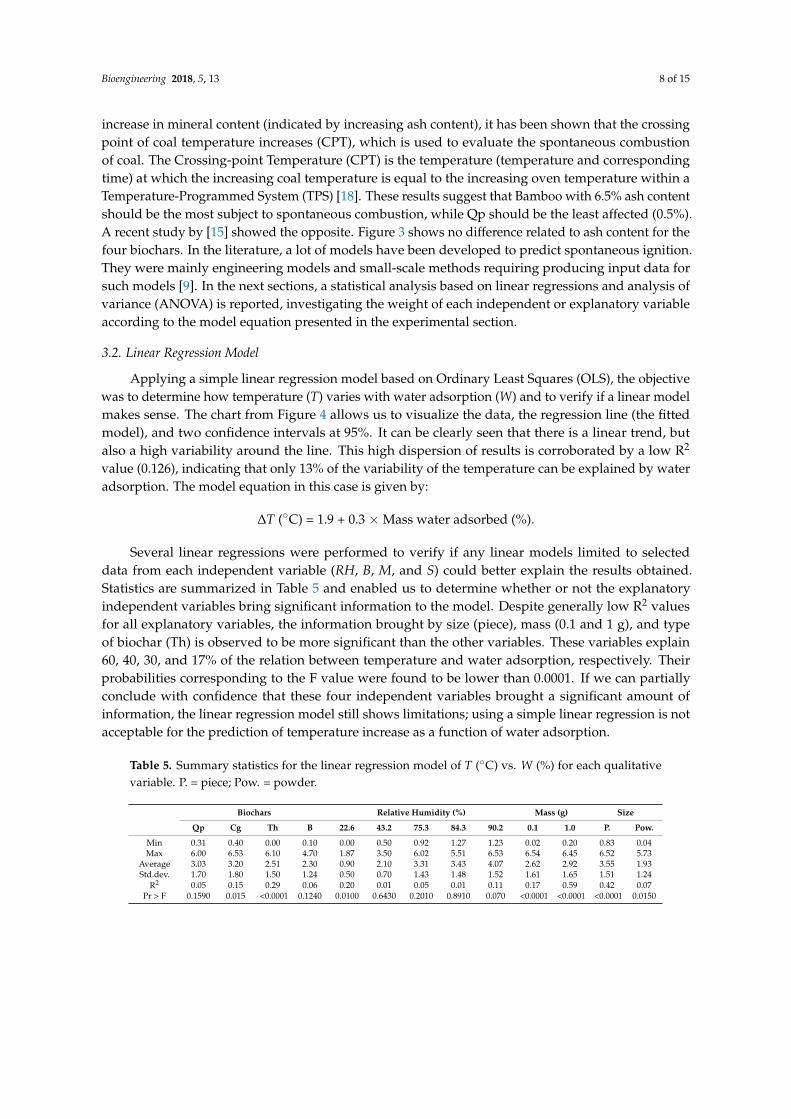
increase in mineral content (indicated by increasing ash content), it has been shown that the crossingpoint of coal temperature increases (CPT), which is used to evaluate the spontaneous combustionof coal. The Crossing-point Temperature (CPT) is the temperature (temperature and correspondingtime) at which the increasing coal temperature is equal to the increasing oven temperature within aTemperature-Programmed System (TPS) [18]. These results suggest that Bamboo with 6.5% ash contentshould be the most subject to spontaneous combustion, while Qp should be the least affected (0.5%).A recent study by [15] showed the opposite. Figure 3 shows no difference related to ash content for thefour biochars. In the literature, a lot of models have been developed to predict spontaneous ignition.They were mainly engineering models and small-scale methods requiring producing input data forsuch models [9]. In the next sections, a statistical analysis based on linear regressions and analysis ofvariance (ANOVA) is reported, investigating the weight of each independent or explanatory variableaccording to the model equation presented in the experimental section.
3.2. Linear Regression Model
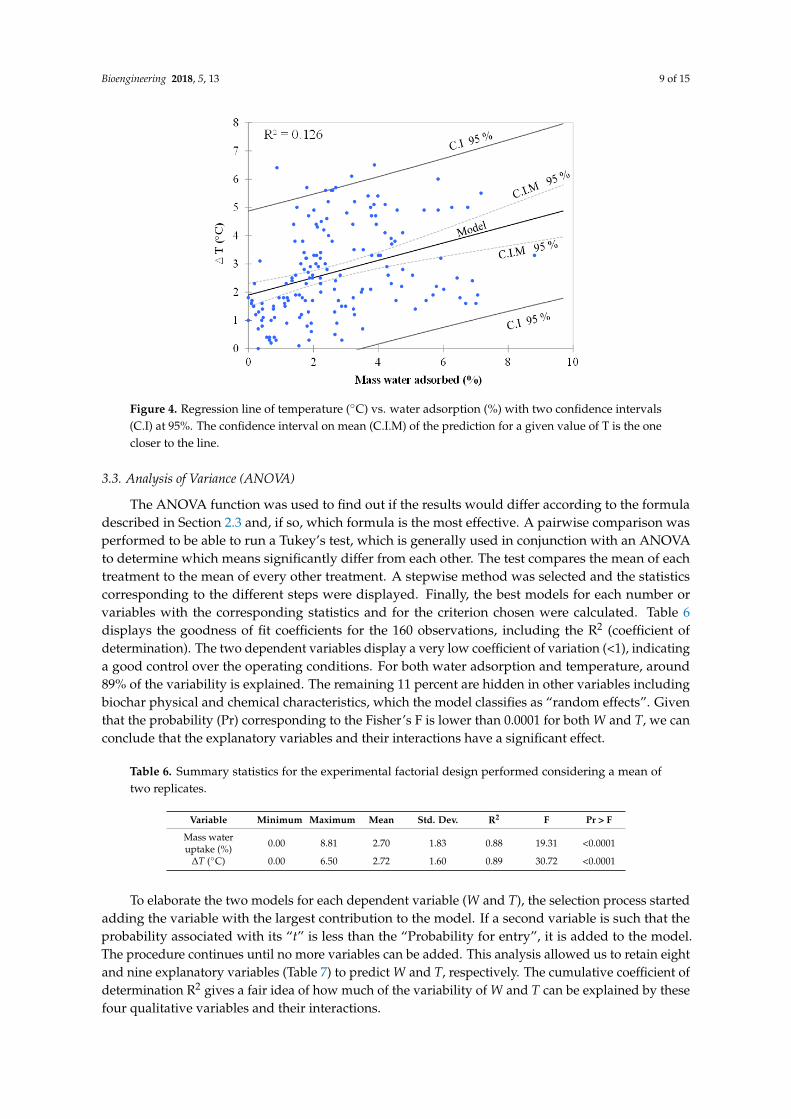
Applying a simple linear regression model based on Ordinary Least Squares (OLS), the objectivewas to determine how temperature (T) varies with water adsorption (W) and to verify if a linear modelmakes sense. The chart from Figure 4 allows us to visualize the data, the regression line (the fittedmodel), and two confidence intervals at 95%. It can be clearly seen that there is a linear trend, butalso a high variability around the line. This high dispersion of results is corroborated by a low R2
value (0.126), indicating that only 13% of the variability of the temperature can be explained by wateradsorption. The model equation in this case is given by:
∆T (◦C) = 1.9 + 0.3 × Mass water adsorbed (%).
Several linear regressions were performed to verify if any linear models limited to selecteddata from each independent variable (RH, B, M, and S) could better explain the results obtained.Statistics are summarized in Table 5 and enabled us to determine whether or not the explanatoryindependent variables bring significant information to the model. Despite generally low R2 valuesfor all explanatory variables, the information brought by size (piece), mass (0.1 and 1 g), and typeof biochar (Th) is observed to be more significant than the other variables. These variables explain60, 40, 30, and 17% of the relation between temperature and water adsorption, respectively. Theirprobabilities corresponding to the F value were found to be lower than 0.0001. If we can partiallyconclude with confidence that these four independent variables brought a significant amount ofinformation, the linear regression model still shows limitations; using a simple linear regression is notacceptable for the prediction of temperature increase as a function of water adsorption.
Table 5. Summary statistics for the linear regression model of T (◦C) vs. W (%) for each qualitativevariable. P. = piece; Pow. = powder.
Biochars Relative Humidity (%) Mass (g) Size
Qp Cg Th B 22.6 43.2 75.3 84.3 90.2 0.1 1.0 P. Pow.
Min 0.31 0.40 0.00 0.10 0.00 0.50 0.92 1.27 1.23 0.02 0.20 0.83 0.04Max 6.00 6.53 6.10 4.70 1.87 3.50 6.02 5.51 6.53 6.54 6.45 6.52 5.73
Average 3.03 3.20 2.51 2.30 0.90 2.10 3.31 3.43 4.07 2.62 2.92 3.55 1.93Std.dev. 1.70 1.80 1.50 1.24 0.50 0.70 1.43 1.48 1.52 1.61 1.65 1.51 1.24
R2 0.05 0.15 0.29 0.06 0.20 0.01 0.05 0.01 0.11 0.17 0.59 0.42 0.07Pr > F 0.1590 0.015 <0.0001 0.1240 0.0100 0.6430 0.2010 0.8910 0.070 <0.0001 <0.0001 <0.0001 0.0150
Bioengineering 2018, 5, 13 9 of 15
Bioengineering 2018, 5, x FOR PEER REVIEW 8 of 14
suggest that Bamboo with 6.5% ash content should be the most subject to spontaneous combustion,
while Qp should be the least affected (0.5%). A recent study by [15] showed the opposite. Figure 3
shows no difference related to ash content for the four biochars. In the literature, a lot of models have
been developed to predict spontaneous ignition. They were mainly engineering models and
small-scale methods requiring producing input data for such models [9]. In the next sections, a
statistical analysis based on linear regressions and analysis of variance (ANOVA) is reported,
investigating the weight of each independent or explanatory variable according to the model
equation presented in the experimental section.
3.2. Linear Regression Model
Applying a simple linear regression model based on Ordinary Least Squares (OLS), the
objective was to determine how temperature (T) varies with water adsorption (W) and to verify if a
linear model makes sense. The chart from Figure 4 allows us to visualize the data, the regression line
(the fitted model), and two confidence intervals at 95%. It can be clearly seen that there is a linear
trend, but also a high variability around the line. This high dispersion of results is corroborated by a
low R2 value (0.126), indicating that only 13% of the variability of the temperature can be explained
by water adsorption. The model equation in this case is given by:
∆T (°C) = 1.9 + 0.3 × Mass water adsorbed (%).
Several linear regressions were performed to verify if any linear models limited to selected data
from each independent variable (RH, B, M, and S) could better explain the results obtained. Statistics
are summarized in Table 5 and enabled us to determine whether or not the explanatory independent
variables bring significant information to the model. Despite generally low R2 values for all
explanatory variables, the information brought by size (piece), mass (0.1 and 1 g), and type of
biochar (Th) is observed to be more significant than the other variables. These variables explain 60,
40, 30, and 17% of the relation between temperature and water adsorption, respectively. Their
probabilities corresponding to the F value were found to be lower than 0.0001. If we can partially
conclude with confidence that these four independent variables brought a significant amount of
information, the linear regression model still shows limitations; using a simple linear regression is
not acceptable for the prediction of temperature increase as a function of water adsorption.
Figure 4. Regression line of temperature (°C) vs. water adsorption (%) with two confidence intervals
(C.I) at 95%. The confidence interval on mean (C.I.M) of the prediction for a given value of T is the
one closer to the line.
Figure 4. Regression line of temperature (◦C) vs. water adsorption (%) with two confidence intervals(C.I) at 95%. The confidence interval on mean (C.I.M) of the prediction for a given value of T is the onecloser to the line.
3.3. Analysis of Variance (ANOVA)
The ANOVA function was used to find out if the results would differ according to the formuladescribed in Section 2.3 and, if so, which formula is the most effective. A pairwise comparison wasperformed to be able to run a Tukey’s test, which is generally used in conjunction with an ANOVAto determine which means significantly differ from each other. The test compares the mean of eachtreatment to the mean of every other treatment. A stepwise method was selected and the statisticscorresponding to the different steps were displayed. Finally, the best models for each number orvariables with the corresponding statistics and for the criterion chosen were calculated. Table 6displays the goodness of fit coefficients for the 160 observations, including the R2 (coefficient ofdetermination). The two dependent variables display a very low coefficient of variation (<1), indicatinga good control over the operating conditions. For both water adsorption and temperature, around89% of the variability is explained. The remaining 11 percent are hidden in other variables includingbiochar physical and chemical characteristics, which the model classifies as “random effects”. Giventhat the probability (Pr) corresponding to the Fisher’s F is lower than 0.0001 for both W and T, we canconclude that the explanatory variables and their interactions have a significant effect.
Table 6. Summary statistics for the experimental factorial design performed considering a mean oftwo replicates.
Variable Minimum Maximum Mean Std. Dev. R2 F Pr > F
Mass wateruptake (%) 0.00 8.81 2.70 1.83 0.88 19.31 <0.0001
∆T (◦C) 0.00 6.50 2.72 1.60 0.89 30.72 <0.0001
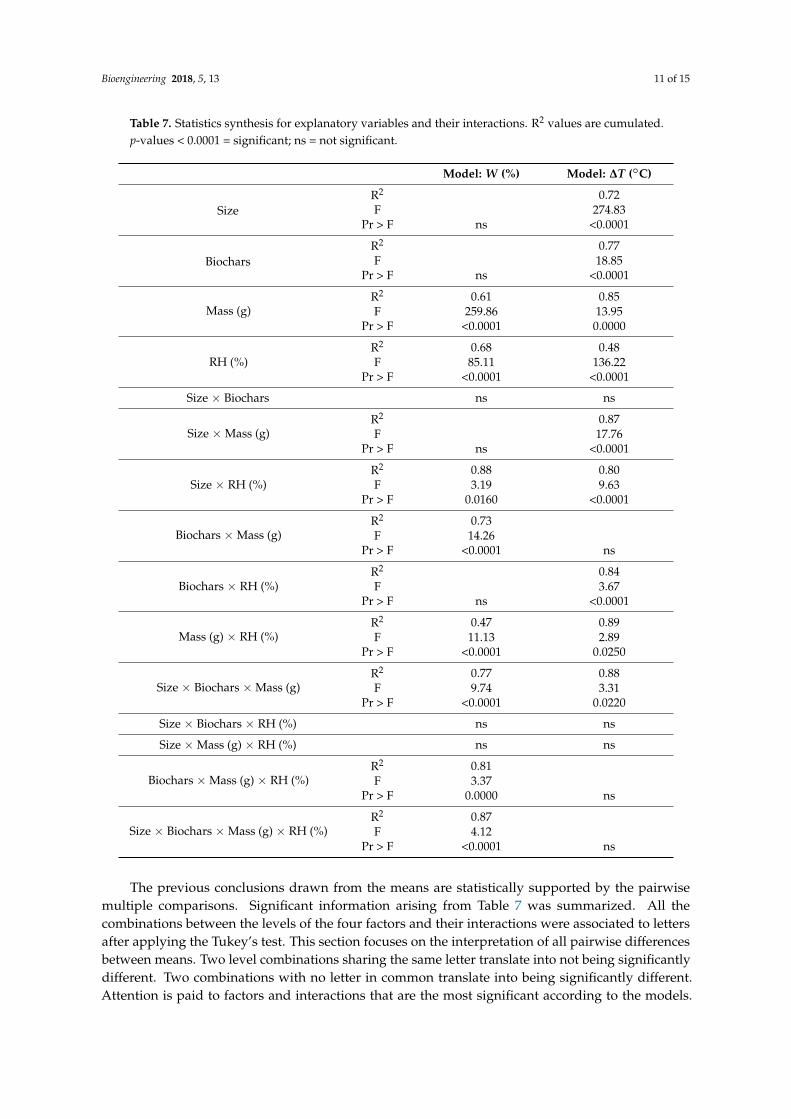
To elaborate the two models for each dependent variable (W and T), the selection process startedadding the variable with the largest contribution to the model. If a second variable is such that theprobability associated with its “t” is less than the “Probability for entry”, it is added to the model.The procedure continues until no more variables can be added. This analysis allowed us to retain eightand nine explanatory variables (Table 7) to predict W and T, respectively. The cumulative coefficient ofdetermination R2 gives a fair idea of how much of the variability of W and T can be explained by thesefour qualitative variables and their interactions.
Bioengineering 2018, 5, 13 10 of 15
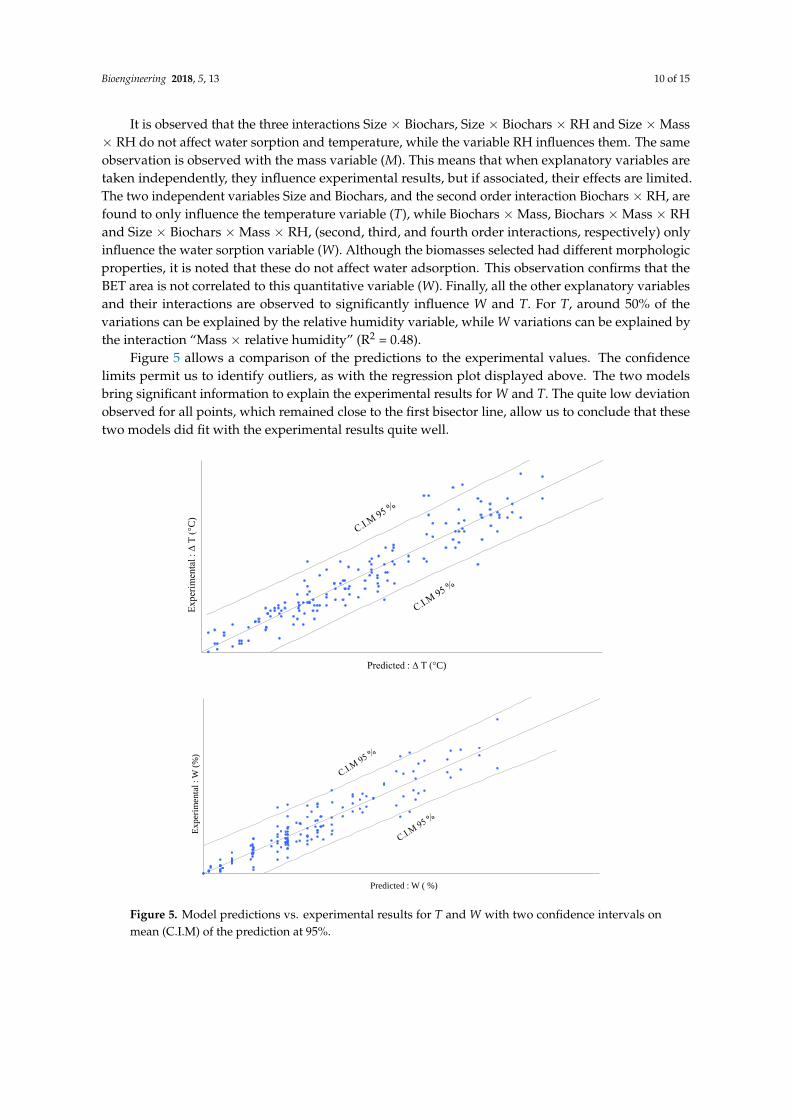
It is observed that the three interactions Size × Biochars, Size × Biochars × RH and Size × Mass× RH do not affect water sorption and temperature, while the variable RH influences them. The sameobservation is observed with the mass variable (M). This means that when explanatory variables aretaken independently, they influence experimental results, but if associated, their effects are limited.The two independent variables Size and Biochars, and the second order interaction Biochars × RH, arefound to only influence the temperature variable (T), while Biochars × Mass, Biochars × Mass × RHand Size × Biochars × Mass × RH, (second, third, and fourth order interactions, respectively) onlyinfluence the water sorption variable (W). Although the biomasses selected had different morphologicproperties, it is noted that these do not affect water adsorption. This observation confirms that theBET area is not correlated to this quantitative variable (W). Finally, all the other explanatory variablesand their interactions are observed to significantly influence W and T. For T, around 50% of thevariations can be explained by the relative humidity variable, while W variations can be explained bythe interaction “Mass × relative humidity” (R2 = 0.48).
Figure 5 allows a comparison of the predictions to the experimental values. The confidencelimits permit us to identify outliers, as with the regression plot displayed above. The two modelsbring significant information to explain the experimental results for W and T. The quite low deviationobserved for all points, which remained close to the first bisector line, allow us to conclude that thesetwo models did fit with the experimental results quite well.
Bioengineering 2018, 5, x FOR PEER REVIEW 11 of 14
Figure 5. Model predictions vs. experimental results for T and W with two confidence intervals on
mean (C.I.M) of the prediction at 95%.
The previous conclusions drawn from the means are statistically supported by the pairwise
multiple comparisons. Significant information arising from Table 7 was summarized. All the
combinations between the levels of the four factors and their interactions were associated to letters
after applying the Tukey’s test. This section focuses on the interpretation of all pairwise differences
between means. Two level combinations sharing the same letter translate into not being significantly
different. Two combinations with no letter in common translate into being significantly different.
Attention is paid to factors and interactions that are the most significant according to the models.
The following two factors and three interactions were identified: Mass, RH, Size × RH, Mass × RH,
and Size × Biochars × Mass.
As a reminder, the variable “Mass” is characterized by two values: 0.1 and 1 g. Figure 6 shows
two distinct groups (A and B) for both W and T. Although the difference between the water sorption
averages is evident (1.9%), this analysis of variance shows a significant difference for T, despite
relatively similar average values (2.55 °C and 2.90 °C). Concerning the explanatory variable RH, the
four pairs of categories are found to be different. The two RH pairs 84.3 × 75.3 and 90.2 × 75.3 do not
show any significant differences, while the means between 84.2 and 90.2 are significantly different
(3.1 and 3.9%). Except for 75.2%, all the other air relative humidity conditions show significant
differences with regard to the observed adsorption values. The highest and the lowest values are 3.87
and 0.84% for RH values of 84.4 and 22.6, respectively. The maximum temperature is obtained with the
highest relative humidity (3.95 °C) and the minimum temperature with the lowest RH (0.84 °C), as
corroborated by the literature [14]. We can conclude that these two factors (Mass and RH) played a
significant role in both the two models.
Experim
ental : ∆ T
( C
)
Predicted : ∆ T ( C)
Ex
per
imen
tal
: W
(%
)
Predicted : W ( %)
Figure 5. Model predictions vs. experimental results for T and W with two confidence intervals onmean (C.I.M) of the prediction at 95%.
Bioengineering 2018, 5, 13 11 of 15
Table 7. Statistics synthesis for explanatory variables and their interactions. R2 values are cumulated.p-values < 0.0001 = significant; ns = not significant.
Model: W (%) Model: ∆T (◦C)
SizeR2 0.72F 274.83
Pr > F ns <0.0001
BiocharsR2 0.77F 18.85
Pr > F ns <0.0001
Mass (g)R2 0.61 0.85F 259.86 13.95
Pr > F <0.0001 0.0000
RH (%)R2 0.68 0.48F 85.11 136.22
Pr > F <0.0001 <0.0001
Size × Biochars ns ns
Size × Mass (g)R2 0.87F 17.76
Pr > F ns <0.0001
Size × RH (%)R2 0.88 0.80F 3.19 9.63
Pr > F 0.0160 <0.0001
Biochars × Mass (g)R2 0.73F 14.26
Pr > F <0.0001 ns
Biochars × RH (%)R2 0.84F 3.67
Pr > F ns <0.0001
Mass (g) × RH (%)R2 0.47 0.89F 11.13 2.89
Pr > F <0.0001 0.0250
Size × Biochars × Mass (g)R2 0.77 0.88F 9.74 3.31
Pr > F <0.0001 0.0220
Size × Biochars × RH (%) ns ns
Size × Mass (g) × RH (%) ns ns
Biochars × Mass (g) × RH (%)R2 0.81F 3.37
Pr > F 0.0000 ns
Size × Biochars × Mass (g) × RH (%)R2 0.87F 4.12
Pr > F <0.0001 ns
The previous conclusions drawn from the means are statistically supported by the pairwisemultiple comparisons. Significant information arising from Table 7 was summarized. All thecombinations between the levels of the four factors and their interactions were associated to lettersafter applying the Tukey’s test. This section focuses on the interpretation of all pairwise differencesbetween means. Two level combinations sharing the same letter translate into not being significantlydifferent. Two combinations with no letter in common translate into being significantly different.Attention is paid to factors and interactions that are the most significant according to the models.
Bioengineering 2018, 5, 13 12 of 15
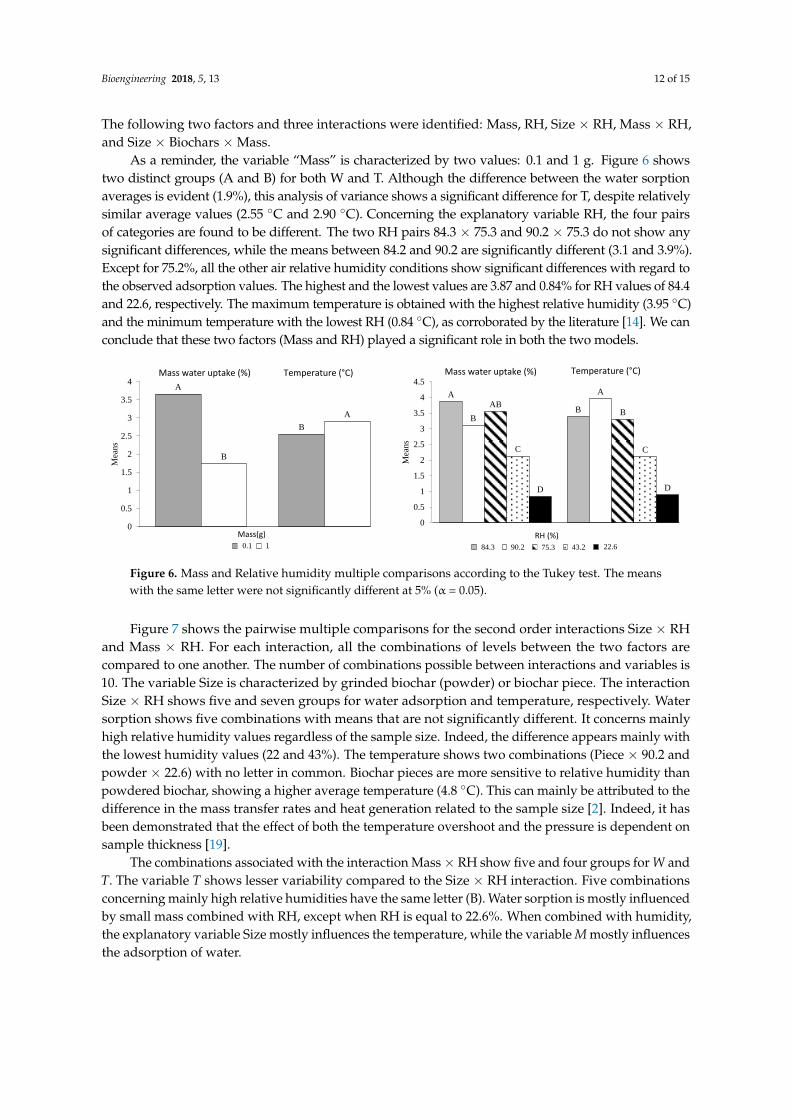
The following two factors and three interactions were identified: Mass, RH, Size × RH, Mass × RH,and Size × Biochars × Mass.
As a reminder, the variable “Mass” is characterized by two values: 0.1 and 1 g. Figure 6 showstwo distinct groups (A and B) for both W and T. Although the difference between the water sorptionaverages is evident (1.9%), this analysis of variance shows a significant difference for T, despite relativelysimilar average values (2.55 ◦C and 2.90 ◦C). Concerning the explanatory variable RH, the four pairsof categories are found to be different. The two RH pairs 84.3 × 75.3 and 90.2 × 75.3 do not show anysignificant differences, while the means between 84.2 and 90.2 are significantly different (3.1 and 3.9%).Except for 75.2%, all the other air relative humidity conditions show significant differences with regard tothe observed adsorption values. The highest and the lowest values are 3.87 and 0.84% for RH values of 84.4and 22.6, respectively. The maximum temperature is obtained with the highest relative humidity (3.95 ◦C)and the minimum temperature with the lowest RH (0.84 ◦C), as corroborated by the literature [14]. We canconclude that these two factors (Mass and RH) played a significant role in both the two models.Bioengineering 2018, 5, x FOR PEER REVIEW 12 of 14
Figure 6. Mass and Relative humidity multiple comparisons according to the Tukey test. The means
with the same letter were not significantly different at 5% (α = 0.05).
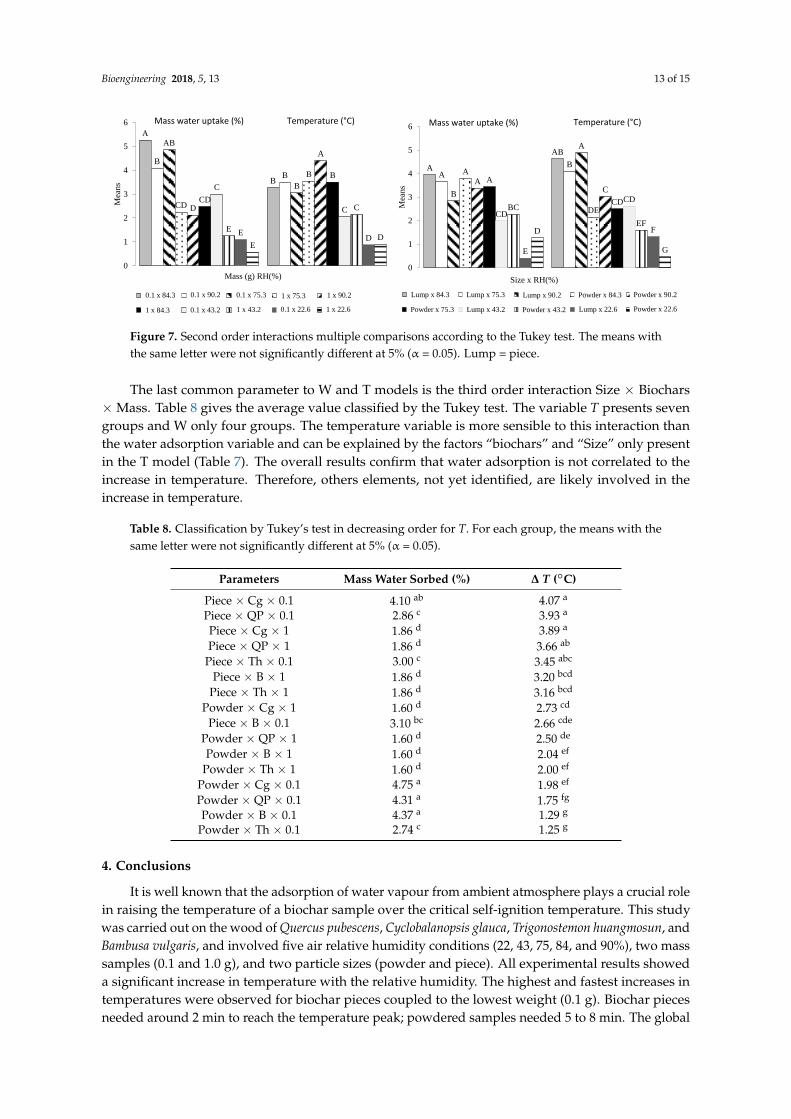
Figure 7 shows the pairwise multiple comparisons for the second order interactions Size × RH
and Mass × RH. For each interaction, all the combinations of levels between the two factors are
compared to one another. The number of combinations possible between interactions and variables is
10. The variable Size is characterized by grinded biochar (powder) or biochar piece. The interaction
Size × RH shows five and seven groups for water adsorption and temperature, respectively. Water
sorption shows five combinations with means that are not significantly different. It concerns mainly
high relative humidity values regardless of the sample size. Indeed, the difference appears mainly
with the lowest humidity values (22 and 43%). The temperature shows two combinations (Piece × 90.2
and powder × 22.6) with no letter in common. Biochar pieces are more sensitive to relative humidity
than powdered biochar, showing a higher average temperature (4.8 °C). This can mainly be attributed
to the difference in the mass transfer rates and heat generation related to the sample size [2]. Indeed,
it has been demonstrated that the effect of both the temperature overshoot and the pressure is
dependent on sample thickness [19].
The combinations associated with the interaction Mass × RH show five and four groups for W
and T. The variable T shows lesser variability compared to the Size × RH interaction. Five
combinations concerning mainly high relative humidities have the same letter (B). Water sorption is
mostly influenced by small mass combined with RH, except when RH is equal to 22.6%. When
combined with humidity, the explanatory variable Size mostly influences the temperature, while the
variable M mostly influences the adsorption of water.
Figure 7. Second order interactions multiple comparisons according to the Tukey test. The means
with the same letter were not significantly different at 5% (α = 0.05). Lump = piece.
The last common parameter to W and T models is the third order interaction Size × Biochars ×
Mass. Table 8 gives the average value classified by the Tukey test. The variable T presents seven
groups and W only four groups. The temperature variable is more sensible to this interaction than
A
BB
A
ABB
C C
D D
0
0.5
1
1.5
2
2.5
3
3.5
4
4.5
Mea
ns
84,3 90,2 75,3 43,2 22,6
Mass water uptake (%) Temperature (°C)
RH (%)
84.3 22.684.3 90.2 75.3 43.2
A
B
B
A
0
0.5
1
1.5
2
2.5
3
3.5
4
Mea
ns
0,1 1
Mass water uptake (%) Temperature (°C)
Mass(g)
0.1 1
A
AB
A
B
B
A
A
DE
AC
A
CD
CD
CDBC
EF
E
FD
G
0
1
2
3
4
5
6
Mea
ns
Size x RH(%)
Lump*84,3 Lump*75,3 Lump*90,2 Powder*84,3 Powder*90,2
Powder*75,3 Lump*43,2 Powder*43,2 Lump*22,6 Powder*22,6
Mass water uptake (%) Temperature (°C)
Lump x 84.3 Lump x 75.3
Powder x 75.3 Lump x 43.2
Lump x 90.2
Lump x 22.6Powder x 43.2
Powder x 84.3 Powder x 90.2
Powder x 22.6
A
B
B
B
AB
B
CD
B
D
A
CD
B
C
C
E
C
ED
ED
0
1
2
3
4
5
6
Mea
ns
Mass (g) RH(%)
0,1*84,3 0,1*90,2 0,1*75,3 1*75,3 1*90,2
1*84,3 0,1*43,2 1*43,2 0,1*22,6 1*22,6
Mass water uptake (%) Temperature (°C)
0.1 x 84.3 0.1 x 90.2 0.1 x 75.3 1 x 75.3 1 x 90.2
0.1 x 43.2 1 x 43.2 1 x 22.60.1 x 22.61 x 84.3
Figure 6. Mass and Relative humidity multiple comparisons according to the Tukey test. The meanswith the same letter were not significantly different at 5% (α = 0.05).
Figure 7 shows the pairwise multiple comparisons for the second order interactions Size × RHand Mass × RH. For each interaction, all the combinations of levels between the two factors arecompared to one another. The number of combinations possible between interactions and variables is10. The variable Size is characterized by grinded biochar (powder) or biochar piece. The interactionSize × RH shows five and seven groups for water adsorption and temperature, respectively. Watersorption shows five combinations with means that are not significantly different. It concerns mainlyhigh relative humidity values regardless of the sample size. Indeed, the difference appears mainly withthe lowest humidity values (22 and 43%). The temperature shows two combinations (Piece × 90.2 andpowder × 22.6) with no letter in common. Biochar pieces are more sensitive to relative humidity thanpowdered biochar, showing a higher average temperature (4.8 ◦C). This can mainly be attributed to thedifference in the mass transfer rates and heat generation related to the sample size [2]. Indeed, it hasbeen demonstrated that the effect of both the temperature overshoot and the pressure is dependent onsample thickness [19].
The combinations associated with the interaction Mass × RH show five and four groups for W andT. The variable T shows lesser variability compared to the Size × RH interaction. Five combinationsconcerning mainly high relative humidities have the same letter (B). Water sorption is mostly influencedby small mass combined with RH, except when RH is equal to 22.6%. When combined with humidity,the explanatory variable Size mostly influences the temperature, while the variable M mostly influencesthe adsorption of water.
Bioengineering 2018, 5, 13 13 of 15
Bioengineering 2018, 5, x FOR PEER REVIEW 12 of 14
Figure 6. Mass and Relative humidity multiple comparisons according to the Tukey test. The means
with the same letter were not significantly different at 5% (α = 0.05).
Figure 7 shows the pairwise multiple comparisons for the second order interactions Size × RH
and Mass × RH. For each interaction, all the combinations of levels between the two factors are
compared to one another. The number of combinations possible between interactions and variables is
10. The variable Size is characterized by grinded biochar (powder) or biochar piece. The interaction
Size × RH shows five and seven groups for water adsorption and temperature, respectively. Water
sorption shows five combinations with means that are not significantly different. It concerns mainly
high relative humidity values regardless of the sample size. Indeed, the difference appears mainly
with the lowest humidity values (22 and 43%). The temperature shows two combinations (Piece × 90.2
and powder × 22.6) with no letter in common. Biochar pieces are more sensitive to relative humidity
than powdered biochar, showing a higher average temperature (4.8 °C). This can mainly be attributed
to the difference in the mass transfer rates and heat generation related to the sample size [2]. Indeed,
it has been demonstrated that the effect of both the temperature overshoot and the pressure is
dependent on sample thickness [19].
The combinations associated with the interaction Mass × RH show five and four groups for W
and T. The variable T shows lesser variability compared to the Size × RH interaction. Five
combinations concerning mainly high relative humidities have the same letter (B). Water sorption is
mostly influenced by small mass combined with RH, except when RH is equal to 22.6%. When
combined with humidity, the explanatory variable Size mostly influences the temperature, while the
variable M mostly influences the adsorption of water.
Figure 7. Second order interactions multiple comparisons according to the Tukey test. The means
with the same letter were not significantly different at 5% (α = 0.05). Lump = piece.
The last common parameter to W and T models is the third order interaction Size × Biochars ×
Mass. Table 8 gives the average value classified by the Tukey test. The variable T presents seven
groups and W only four groups. The temperature variable is more sensible to this interaction than
A
BB
A
ABB
C C
D D
0
0.5
1
1.5
2
2.5
3
3.5
4
4.5
Mea
ns
84,3 90,2 75,3 43,2 22,6
Mass water uptake (%) Temperature (°C)
RH (%)
84.3 22.684.3 90.2 75.3 43.2
A
B
B
A
0
0.5
1
1.5
2
2.5
3
3.5
4
Mea
ns
0,1 1
Mass water uptake (%) Temperature (°C)
Mass(g)
0.1 1
A
AB
A
B
B
A
A
DE
AC
A
CD
CD
CDBC
EF
E
FD
G
0
1
2
3
4
5
6
Mea
ns
Size x RH(%)
Lump*84,3 Lump*75,3 Lump*90,2 Powder*84,3 Powder*90,2
Powder*75,3 Lump*43,2 Powder*43,2 Lump*22,6 Powder*22,6
Mass water uptake (%) Temperature (°C)
Lump x 84.3 Lump x 75.3
Powder x 75.3 Lump x 43.2
Lump x 90.2
Lump x 22.6Powder x 43.2
Powder x 84.3 Powder x 90.2
Powder x 22.6
A
B
B
B
AB
B
CD
B
D
A
CD
B
C
C
E
C
ED
ED
0
1
2
3
4
5
6M
ean
s
Mass (g) RH(%)
0,1*84,3 0,1*90,2 0,1*75,3 1*75,3 1*90,2
1*84,3 0,1*43,2 1*43,2 0,1*22,6 1*22,6
Mass water uptake (%) Temperature (°C)
0.1 x 84.3 0.1 x 90.2 0.1 x 75.3 1 x 75.3 1 x 90.2
0.1 x 43.2 1 x 43.2 1 x 22.60.1 x 22.61 x 84.3
Figure 7. Second order interactions multiple comparisons according to the Tukey test. The means withthe same letter were not significantly different at 5% (α = 0.05). Lump = piece.
The last common parameter to W and T models is the third order interaction Size × Biochars× Mass. Table 8 gives the average value classified by the Tukey test. The variable T presents sevengroups and W only four groups. The temperature variable is more sensible to this interaction thanthe water adsorption variable and can be explained by the factors “biochars” and “Size” only presentin the T model (Table 7). The overall results confirm that water adsorption is not correlated to theincrease in temperature. Therefore, others elements, not yet identified, are likely involved in theincrease in temperature.
Table 8. Classification by Tukey’s test in decreasing order for T. For each group, the means with thesame letter were not significantly different at 5% (α = 0.05).
Parameters Mass Water Sorbed (%) ∆ T (◦C)
Piece × Cg × 0.1 4.10 ab 4.07 a
Piece × QP × 0.1 2.86 c 3.93 a
Piece × Cg × 1 1.86 d 3.89 a
Piece × QP × 1 1.86 d 3.66 ab
Piece × Th × 0.1 3.00 c 3.45 abc
Piece × B × 1 1.86 d 3.20 bcd
Piece × Th × 1 1.86 d 3.16 bcd
Powder × Cg × 1 1.60 d 2.73 cd
Piece × B × 0.1 3.10 bc 2.66 cde
Powder × QP × 1 1.60 d 2.50 de
Powder × B × 1 1.60 d 2.04 ef
Powder × Th × 1 1.60 d 2.00 ef
Powder × Cg × 0.1 4.75 a 1.98 ef
Powder × QP × 0.1 4.31 a 1.75 fg
Powder × B × 0.1 4.37 a 1.29 g
Powder × Th × 0.1 2.74 c 1.25 g
4. Conclusions
It is well known that the adsorption of water vapour from ambient atmosphere plays a crucial rolein raising the temperature of a biochar sample over the critical self-ignition temperature. This studywas carried out on the wood of Quercus pubescens, Cyclobalanopsis glauca, Trigonostemon huangmosun, andBambusa vulgaris, and involved five air relative humidity conditions (22, 43, 75, 84, and 90%), two masssamples (0.1 and 1.0 g), and two particle sizes (powder and piece). All experimental results showeda significant increase in temperature with the relative humidity. The highest and fastest increases intemperatures were observed for biochar pieces coupled to the lowest weight (0.1 g). Biochar piecesneeded around 2 min to reach the temperature peak; powdered samples needed 5 to 8 min. The global
Bioengineering 2018, 5, 13 14 of 15
trend showed that a larger mass of water vapor was adsorbed when exposed to a higher relativehumidity. All samples with a mass of 1.0 g showed a lower water vapor adsorption compared tosamples at 0.1 g. A linear regression model based on the temperature and the water adsorption (W)showed a high dispersion of the results corroborated by a low R2 value (0.13). Two models wereelaborated for each dependent variable (W and T) to simulate water adsorption and temperature. Eightand nine qualitative variables and their interactions were selected for W and T, respectively. Samplemass and relative humidity influenced both W and T, while particle size and type of biochar mainlyinfluenced the temperature. Thus, these findings are very important not only for all scientific aspects,but also in practical applications. They will allow the creation of tabulations giving recommendationsfor charcoal cooling and storage considering the season (RH) and the critical size of the samples, andconsequently to anticipate cool flame phenomena.
Acknowledgments: The authors thank Gilles Humbert for his helpful collaboration providing all biomassestested in this study.
Author Contributions: Luciane Bastistella conceived and designed the experiments; Luciane Bastistellaand Antonio Aviz performed the experiments; Patrick Rousset and Luciane Bastistella analyzed the data;Manoel Nogueira and Armando Caldeira-Pires contributed reagents/materials/analysis tools; Patrick Roussetwrote the paper.
Conflicts of Interest: The authors declare no conflicts of interest.
References
1. Candelier, K.; Dibdiakova, J.; Volle, G.; Rousset, P. Study on chemical oxidation of heat treated lignocellulosicbiomass under oxygen exposure by sta-dsc-ftir analysis. Thermochim. Acta 2016, 644, 33–42. [CrossRef]
2. Miura, K. Adsorption of water vapor from ambient atmosphere onto coal fines leading to spontaneousheating of coal stockpile. Energy Fuels 2016, 30, 219–229. [CrossRef]
3. Joseph, C. Combustibles Solides. Charbon: De L'Extraction à La Combustion; Techniques de l’ingénieur: Paris,France, 2007.
4. Fierro, V.; Miranda, J.L.; Romero, C.; Andrés, J.M.; Arriaga, A.; Schmal, D.; Visser, G.H. Prevention ofspontaneous combustion in coal stockpiles: Experimental results in coal storage yard. Fuel Process. Technol.1999, 59, 23–34. [CrossRef]
5. Davis, J.D.; Byne, J.F. Influence of moisture on the spontaneous heating of coal. Ind. Eng. Chem. 1926, 18,233–236. [CrossRef]
6. Stott, J.B. Influence of moisture on the spontaneous heating of coal. Nature 1960, 188, 54. [CrossRef]7. Fujitsuka, H.; Ashida, R.; Kawase, M.; Miura, K. Examination of low-temperature oxidation of low-rank
coals, aiming at understanding their self-ignition tendency. Energy Fuels 2014, 28, 2402–2407. [CrossRef]8. Zádor, J.; Taatjes, C.A.; Fernandes, R.X. Kinetics of elementary reactions in low-temperature autoignition
chemistry. Prog. Energy Combust. Sci. 2011, 37, 371–421. [CrossRef]9. Blomqvist, P.; Persson, B. Spontaneous Ignition of Biofuels–A Literature Survey of Theoretical and Experimental
Methods; Spar: Amsterdam, The Netherlands, 2003.10. Wolters, F.C.; Pagni, P.J.; Frost, T.R.; Cuzzillo, B.R. Size constraints on self ignition of charcoal briquets.
Fire Saf. Sci. 2003, 7, 593–604. [CrossRef]11. Akgün, F.; Arisoy, A. Effect of particle size on the spontaneous heating of a coal stockpile. Combust. Flame
1994, 99, 137–146. [CrossRef]12. Küçük, A.; Kadıoglu, Y.; Gülaboglu, M.S. A study of spontaneous combustion characteristics of a turkish
lignite: Particle size, moisture of coal, humidity of air. Combust. Flame 2003, 133, 255–261. [CrossRef]13. Mahmoudi, A.H.; Hoffmann, F.; Markovic, M.; Peters, B.; Brem, G. Numerical modeling of self-heating and
self-ignition in a packed-bed of biomass using xdem. Combust. Flame 2016, 163, 358–369. [CrossRef]14. Miura, K.; Muangthong, T.; Wanapeera, J.; Ohgaki, H. Examination of rates of oxidation reaction and water
vapor adsorption at low temperatures for understanding spontaneous combustion of coal and biomass.In Proceedings of the Conference on Energy & Climate Change, Innovative for a Sustainable Future, SEE,Bangkok, Thailand, 28–30 November 2016.
Bioengineering 2018, 5, 13 15 of 15
15. Rousset, P.; Mondher, B.; Candellier, K.; Volle, G.; Dibdiakova, J.; Humbert, G. Comparing four bio-reducersself-ignition propensity by applying heat-based methods derived from coal. Thermochim. Acta 2017, 655,13–20. [CrossRef]
16. Messineo, A.; Ciulla, G.; Messineo, S.; Volpe, M.; Volpe, R. Evaluation of equilibrium moisture content inligno-cellulosic residues of olive culture. ARPN J. Eng. Appl. Sci. 2014, 9, 5–11.
17. Zhao, M.Y.; Enders, A.; Lehmann, J. Short- and long-term flammability of biochars. Biomass Bioenerg. 2014,69, 183–191. [CrossRef]
18. Xu, Y.-l.; Wang, L.-Y.; Tian, N.; Zhang, J.-P.; Yu, M.-G.; Delichatsios, M.A. Spontaneous combustion coalparameters for the crossing-point temperature (CPT) method in a temperature–programmed system (TPS).Fire Saf. J. 2017, 91, 147–154. [CrossRef]
19. Turner, I.; Rousset, P.; Rémond, R.; Perré, P. An experimental and theoretical investigation of the thermaltreatment of wood (Fagus sylvatica L.) in the range 200–260 ◦C. Int. J. Heat Mass Transf. 2010, 53, 715–725.[CrossRef]
© 2018 by the authors. Licensee MDPI, Basel, Switzerland. This article is an open accessarticle distributed under the terms and conditions of the Creative Commons Attribution(CC BY) license (http://creativecommons.org/licenses/by/4.0/).