Embed Size (px)
Citation preview
Statistical papers Series M No. 91
International Recommendations for Water Statistics
asdfUnited NationsNew York, 2012
Department of Economic and Social AffairsStatistics Division
ST/ESA/STAT/SER.M/91
DESAThe Department of Economic and Social Affairs of the United Nations Secretariat is a vital interface between global policies in the economic, social and environmental spheres and national action. The Department works in three main interlinked areas: (i) it compiles, gener-ates and analyses a wide range of economic, social and environmental data and information on which States Members of the United Nations draw to review common problems and to take stock of policy options; (ii) it facilitates the negotiations of Member States in many intergovernmental bodies on joint courses of action to address ongoing or emerging global challenges; and (iii) it advises interested Governments on the ways and means of translating policy frameworks developed in United Nations conferences and summits into programmes at the country level and, through technical assistance, helps build national capacities.
Note
The designations used and the presentation of material in this publication do not imply the expression of any opinion whatsoever on the part of the Secretariat of the United Nations concerning the legal status of any country, territory, city or area, or of its authorities, or con-cerning the delimitation of its frontiers or boundaries.
The term “country” as used in this publication also refers, as appropriate, to territories or areas.
The designations “developed regions” and “developing regions” are intended for sta-tistical convenience and do not necessarily express a judgement about the stage reached by a particular country or area in the development process.Symbols of United Nations documents are composed of capital letters combined with figures. Mention of such a symbol indicates a reference to a United Nations document.
ST/ESA/STAT/SER.M/91 UNITED NATIONS PUBLICATION
Sales No.: E.10.XVII.15 ISBN: 978-92-1-161545-6
Copyright © United Nations, 2012 All rights reserved
iii
Preface
International Recommendations for Water Statistics (IRWS) provides coherent principles, concepts and definitions for the collection and compilation of water statistics on a comparable basis. IRWS constitutes the first publication of international recommendations in the field of environment statistics and joins a family of international recommendations published by the United Nations Statistics Division.
IRWS is designed to assist all countries in the establishment and strengthening of a multipurpose information system for water in support of integrated water resources manage-ment. In particular, it:
(a) Supports the collection, compilation and dissemination of internationally compa-rable water statistics in countries;
(b) Supports the implementation of the System of Environmental-Economic Account-ing for Water (SEEA-Water);
(c) Provides the necessary information for deriving coherent and consistent indicators, enabling comparisons over time and between countries based on an agreed list of data items.
IRWS is organized in two parts. Part one, “International recommendations”, provides the main concepts on water statistics, including definitions and classifications of statistical units related to water and a list of recommended data items that countries are encouraged to compile. Part two, “Guidelines for implementation”, provides general guidelines on the col-lection and compilation of water statistics, in particular as regards data sources, data quality, data-collection strategies and dissemination. Annexes I to VI provide additional reference information, including supplementary data items; links between data items and SEEA-Water standard tables; links between data items and commonly used water-related indicators; and links between data items and international questionnaires.
IRWS supports a broad range of producers of water statistics, with varying levels of expertise and from a wide range of disciplines (e.g., statistics, hydrology, meteorology, agricul-ture, engineering, environmental sciences and economics). Although it is primarily designed for the producers of official national statistics, other organizations producing or using water statistics are also encouraged to use IRWS. In applying IRWS, countries should take into account their priorities with regard to water and the information required to inform deci-sions on water.
The drafting of IRWS was undertaken as part of the United Nations Statistics Division work programme on environment statistics and the implementation strategy for SEEA-Water, under the auspices of the Committee of Experts on Environmental-Economic Accounting. The Statistical Commission, at its forty-first session in February 2010, adopted IRWS and encouraged its implementation in countries.

v
Acknowledgements
International Recommendations for Water Statistics (IRWS) consolidates the experiences and practices of countries and international organizations in the field of water statistics. It has been developed in close collaboration and consultation with the Expert Group on Water Sta-tistics, which reviewed successive drafts of IRWS and commented on the issue papers drafted by the United Nations Statistics Division; other experts who provided advice on specific subjects; countries and international organizations that responded to the global consultation on the final draft of IRWS; and the Committee of Experts on Environmental-Economic Accounting, which recommended its adoption to the Statistical Commission.
The Expert Group on Water Statistics included (in alphabetical order of countries and agencies): Michael Nagy (Austrian Federal Environment Agency); Judicael Clevelario Jun-ior (Brazilian Institute of Geography and Statistics); François Soulard (Statistics Canada); Gan Hong (China Institute of Water Resources and Hydropower Research); Olga Luciano Lopez (former member of the Ministry of the Environment and Natural Resources of the Dominican Republic); Amit Yagur-Kroll (Israeli Central Bureau of Statistics); Ricardo Martinez-Lagunes (previously with the National Water Commission of Mexico and cur-rently with the Statistics Division); Karen Frenken (Food and Agriculture Organization of the United Nations (FAO)); Ashbindu Singh (United Nations Environment Programme); Jürgen Förster (Statistical Office of the European Communities (Eurostat); Kristina Taboul-chanas (Economic and Social Commission for Latin America and the Caribbean); Engin Koncagül (World Water Assessment Programme); and officials of the United Nations Sta-tistics Division.
The following experts provided additional feedback on drafts of IRWS: David Bar-ratt, Louise Minty and Robert Argent (Australian Bureau of Meteorology); Dianne Bourke, Bernard Morrison and Steven May (Australian Bureau of Statistics); Wafa Aboul Hosn (Economic and Social Commission for Western Asia); Amit Kohli (FAO); Cesar Augusto Ruiz (Guatemala National Statistics Institute); Pál Aujeszky (Hungarian Central Statisti-cal Office); Jac van der Gun and Sophie Vermooten (International Groundwater Resources Assessment Centre); Sjoerd Schenau (Statistics Netherlands); Ulrich Looser (Department of Water Affairs and Forestry of South Africa); and Ester Koch (Statistics South Africa).
The following experts participated in the global consultation on the final draft of IRWS, in addition to the members of the Expert Group: Katharina Lenz (Austrian Federal Environment Agency); Parmod Kumar Sharma (Census and Statistics Department, Hong Kong Special Administrative Region of China); Kong Pek Fong (Statistics and Census Service, Macao Special Administrative Region of China); Thomas Olsen (Statistics Den-mark); Thomas Grundmann and Christine Flachmann (German Federal Statistical Office); Munther Daoud Badriyah (Department of Statistics of Jordan); Danguole Krepstuliene (Statistics Lithuania); Anand Sookun (Mauritius Central Statistics Office); Roberto López Pérez (National Institute of Statistics and Geography of Mexico); Stephen Oakley (Statistics New Zealand); Daniela Anastasiu (National Institute of Statistics of Romania); Alexander Pflügler and Gabriela Mózesová (Statistical Office of Slovakia); Polonca Razboršek (Statisti-cal Office of Slovenia); Fernando Celestino Rey (Institute of National Statistics of Spain); Anna-Karin Westöö and Marianne Eriksson (Statistics Sweden); Monika Schaffner (Federal
International Recommendations for Watervi
Office for the Environment of Switzerland); Panut Manoonvoravong (Bureau of Research, Development and Hydrology of Thailand); Salvador Marconi (Economic and Social Com-mission for Latin America and the Caribbean); Beate Werner, Jean-Louis Weber, Markus Erhard, Philippe Crouzet and Stefan Jensen (European Environment Agency); Stephan Moll (Eurostat); Margaret Fitzgibbon (International Monetary Fund); Khamis Raddad (United Arab Emirates). The following organizations also provided feedback: the Brazilian Electric National System Operator; the Brazilian National System of Sanitation Information; the National Water Commission of Mexico; and the State Statistical Committee of Azerbaijan.
The following experts provided advice to the Statistics Division on specific issues: Fran-çois Guerquin and Koen Overkamp (United Nations Secretary General’s Advisory Board on Water and Sanitation); Frederik Pischke (UN-Water); Rolf Luyendijk (WHO/UNICEF Joint Monitoring Programme for Water Supply and Sanitation); and Mike Muller (World Water Assessment Programme).
A number of Statistics Division staff contributed to the preparation of IRWS, including Bram Edens (currently with Statistics Netherlands), Gulab Singh, Herman Smith, Ilaria Di Matteo and Ralf Becker. Initial drafts and research were undertaken by Michael Nagy, while a member of the staff of the Statistics Division (currently with the Austrian Federal Environ-ment Agency), and Khamis Raddad (Jordan), while consultant to the Statistics Division.
This publication was prepared under the responsibility of the Statistics Division. It was edited by Michael Vardon (previously with the United Nations Statistics Division and currently with the Australian Bureau of Statistics) and Jeremy Webb, with guidance and review provided by Alessandra Alfieri (Environmental-Economic Accounts), Eszter Horvath (Environment Statistics) and Ivo Havinga (Economic Statistics).
vii
Contents
Preface . . . . . . . . . . . . . . . . . . . . . . . . . . . . . . . . . . . . . . . . . . . . . . . . . . . iii Acknowledgements . . . . . . . . . . . . . . . . . . . . . . . . . . . . . . . . . . . . . . . . . . v Abbreviations . . . . . . . . . . . . . . . . . . . . . . . . . . . . . . . . . . . . . . . . . . . . . . xiii Introduction . . . . . . . . . . . . . . . . . . . . . . . . . . . . . . . . . . . . . . . . . . . . . . . 1
A. Background . . . . . . . . . . . . . . . . . . . . . . . . . . . . . . . . . . . . . . . . . . . . 1 B. The purpose of international recommendations and IRWS . . . . . . . . 1 C. The need for IRWS . . . . . . . . . . . . . . . . . . . . . . . . . . . . . . . . . . . . . . 2 D. A note on terminology . . . . . . . . . . . . . . . . . . . . . . . . . . . . . . . . . . . 3 E. Data items of IRWS . . . . . . . . . . . . . . . . . . . . . . . . . . . . . . . . . . . . . . 3 F. Users of IRWS . . . . . . . . . . . . . . . . . . . . . . . . . . . . . . . . . . . . . . . . . . 4 G. Future work . . . . . . . . . . . . . . . . . . . . . . . . . . . . . . . . . . . . . . . . . . . . 5
Part one. International recommendations I. Scope of water statistics . . . . . . . . . . . . . . . . . . . . . . . . . . . . . . . . . . . . . . 9
A. Introduction . . . . . . . . . . . . . . . . . . . . . . . . . . . . . . . . . . . . . . . . . . . 9 B. Coverage of IRWS . . . . . . . . . . . . . . . . . . . . . . . . . . . . . . . . . . . . . . . 9
1. Water statistics covered by IRWS . . . . . . . . . . . . . . . . . . . . . . . 9 2. Water statistics not covered by IRWS . . . . . . . . . . . . . . . . . . . . 9
C. The integrated nature of water statistics . . . . . . . . . . . . . . . . . . . . . . 10 1. Integrated water resources management . . . . . . . . . . . . . . . . . . 11 2. System of Environmental-Economic Accounting for Water . . . 11
D. Relationship of IRWS with other international statistical activities . . 12 1. IRWS and other international statistical standards and
guidance . . . . . . . . . . . . . . . . . . . . . . . . . . . . . . . . . . . . . . . . . . 12 2. International statistical data collections, compilations,
indicators and reports . . . . . . . . . . . . . . . . . . . . . . . . . . . . . . . . 12 II. Main concepts and frameworks . . . . . . . . . . . . . . . . . . . . . . . . . . . . . . . . 15
A. Introduction . . . . . . . . . . . . . . . . . . . . . . . . . . . . . . . . . . . . . . . . . . . 15 B. Main concepts . . . . . . . . . . . . . . . . . . . . . . . . . . . . . . . . . . . . . . . . . . 15
1. Water . . . . . . . . . . . . . . . . . . . . . . . . . . . . . . . . . . . . . . . . . . . . 15 2. The environment and water . . . . . . . . . . . . . . . . . . . . . . . . . . . . 16 3. The economy and water. . . . . . . . . . . . . . . . . . . . . . . . . . . . . . . 17 4. Society and water . . . . . . . . . . . . . . . . . . . . . . . . . . . . . . . . . . . 18 5. Integrated water resources management . . . . . . . . . . . . . . . . . . 19
C. Inland water resources . . . . . . . . . . . . . . . . . . . . . . . . . . . . . . . . . . . . 19 1. Renewable and non-renewable water resources . . . . . . . . . . . . . 19 2. Internal renewable water resources . . . . . . . . . . . . . . . . . . . . . . 19 3. Internal flow . . . . . . . . . . . . . . . . . . . . . . . . . . . . . . . . . . . . . . . 20 4. External renewable water resources . . . . . . . . . . . . . . . . . . . . . . 21
Page
International Recommendations for Waterviii
Page
5. Natural and actual renewable water resources . . . . . . . . . . . . . . 21 6. Exploitable water resources . . . . . . . . . . . . . . . . . . . . . . . . . . . . 22 7. Links between water resources and water accounts . . . . . . . . . . 22
D. System of Environmental-Economic Accounting for Water . . . . . . . 23 1. Stocks (assets) . . . . . . . . . . . . . . . . . . . . . . . . . . . . . . . . . . . . . . 23 2. Flows . . . . . . . . . . . . . . . . . . . . . . . . . . . . . . . . . . . . . . . . . . . . . 25 3. Water consumption . . . . . . . . . . . . . . . . . . . . . . . . . . . . . . . . . . 26
E. Spatial and temporal (time) references . . . . . . . . . . . . . . . . . . . . . . . . 26 1. Spatial references . . . . . . . . . . . . . . . . . . . . . . . . . . . . . . . . . . . . 26 2. Temporal (time) references . . . . . . . . . . . . . . . . . . . . . . . . . . . . 27
III. Statistical units and classifications . . . . . . . . . . . . . . . . . . . . . . . . . . . . . . 29 A. Introduction . . . . . . . . . . . . . . . . . . . . . . . . . . . . . . . . . . . . . . . . . . . 29 B. Statistical units of the environment . . . . . . . . . . . . . . . . . . . . . . . . . 29
1. Surface water bodies . . . . . . . . . . . . . . . . . . . . . . . . . . . . . . . . . 30 2. Aquifers . . . . . . . . . . . . . . . . . . . . . . . . . . . . . . . . . . . . . . . . . . . 31 3. Soil water . . . . . . . . . . . . . . . . . . . . . . . . . . . . . . . . . . . . . . . . . 31 4. Problems of classification . . . . . . . . . . . . . . . . . . . . . . . . . . . . . 32
C. Statistical units of the economy . . . . . . . . . . . . . . . . . . . . . . . . . . . . 32 1. Enterprises and establishments . . . . . . . . . . . . . . . . . . . . . . . . . 33 2. Households . . . . . . . . . . . . . . . . . . . . . . . . . . . . . . . . . . . . . . . . 33 3. Residence principle . . . . . . . . . . . . . . . . . . . . . . . . . . . . . . . . . . 34
D. Classification of establishments . . . . . . . . . . . . . . . . . . . . . . . . . . . . . 35 1. Classification by industries: International Standard Industrial
Classification of All Economic Activities, Revision 4 . . . . . . . . 35 2. Products and the Central Product Classification, Version 2 . . . 36 3. Industries important for water statistics . . . . . . . . . . . . . . . . . . 37 4. Classification of unit by institutional sectors . . . . . . . . . . . . . . . 42
E. Characteristics of statistical units . . . . . . . . . . . . . . . . . . . . . . . . . . . 42 1. Characteristics of inland water resources (bodies) . . . . . . . . . . . 42 2. Characteristics of economic units . . . . . . . . . . . . . . . . . . . . . . . 44
IV. Water data items . . . . . . . . . . . . . . . . . . . . . . . . . . . . . . . . . . . . . . . . . . . . 47 A. Introduction . . . . . . . . . . . . . . . . . . . . . . . . . . . . . . . . . . . . . . . . . . . 47 B. Collection and compilation of data items . . . . . . . . . . . . . . . . . . . . . 48
1. Units of measurement . . . . . . . . . . . . . . . . . . . . . . . . . . . . . . . . 48 2. Spatial and temporal (time) references . . . . . . . . . . . . . . . . . . . 48 3. Industry classification . . . . . . . . . . . . . . . . . . . . . . . . . . . . . . . . 49 4. Prioritization of data items for collection and compilation . . . . 49
C. Physical water data items . . . . . . . . . . . . . . . . . . . . . . . . . . . . . . . . . . 49 1. Stocks of water in the environment . . . . . . . . . . . . . . . . . . . . . . 49 2. Flows of water within the environment . . . . . . . . . . . . . . . . . . . 51 3. Flows of water from the environment to the economy . . . . . . . 55 4. Flows of water within the economy . . . . . . . . . . . . . . . . . . . . . . 57 5. Flows of water from the economy to the environment . . . . . . . 60 6. Losses of water from distribution networks and sewerage
systems . . . . . . . . . . . . . . . . . . . . . . . . . . . . . . . . . . . . . . . . . . . 62
Contents ix
Page
7. Waterborne emissions . . . . . . . . . . . . . . . . . . . . . . . . . . . . . . . . 63 8. Types of waterborne emissions to be measured . . . . . . . . . . . . . 65
D. Monetary water data items . . . . . . . . . . . . . . . . . . . . . . . . . . . . . . . . 66 1. Value and costs of water and sewerage services . . . . . . . . . . . . . 67 2. Taxes, subsidies and investment grants . . . . . . . . . . . . . . . . . . . 69 3. Assets and investment . . . . . . . . . . . . . . . . . . . . . . . . . . . . . . . 72 4. Tariffs and charges . . . . . . . . . . . . . . . . . . . . . . . . . . . . . . . . . . 74
E. Water-related social-demographic data items . . . . . . . . . . . . . . . . . . . 75 1. Main source of drinking water . . . . . . . . . . . . . . . . . . . . . . . . . 75 2. Main sanitation facilities . . . . . . . . . . . . . . . . . . . . . . . . . . . . . 76
Part two. Guidelines for implementation V. Data-collection strategy . . . . . . . . . . . . . . . . . . . . . . . . . . . . . . . . . . . . . 81
A. Introduction . . . . . . . . . . . . . . . . . . . . . . . . . . . . . . . . . . . . . . . . . . . 81 B. Determination of data needs . . . . . . . . . . . . . . . . . . . . . . . . . . . . . . . 82 C. Stakeholders and institutional arrangements . . . . . . . . . . . . . . . . . . . 84
1. Stakeholders . . . . . . . . . . . . . . . . . . . . . . . . . . . . . . . . . . . . . . . 84 2. Institutional arrangements . . . . . . . . . . . . . . . . . . . . . . . . . . . . 84 3. Data-sharing . . . . . . . . . . . . . . . . . . . . . . . . . . . . . . . . . . . . . . . 85
D. Review of existing water statistics . . . . . . . . . . . . . . . . . . . . . . . . . . . 87 E. Prioritization . . . . . . . . . . . . . . . . . . . . . . . . . . . . . . . . . . . . . . . . . . 87
1. Prioritizing data items . . . . . . . . . . . . . . . . . . . . . . . . . . . . . . . . 88 2. Prioritizing geographic regions . . . . . . . . . . . . . . . . . . . . . . . . . 88 3. Prioritizing frequency of data production . . . . . . . . . . . . . . . . . 88 4. Prioritizing industries and households . . . . . . . . . . . . . . . . . . . 89 5. Prioritizing water resources . . . . . . . . . . . . . . . . . . . . . . . . . . . . 89
F. Agreement on roles and responsibilities . . . . . . . . . . . . . . . . . . . . . . 89 VI. Data sources and methods . . . . . . . . . . . . . . . . . . . . . . . . . . . . . . . . . . . . 93
A. Introduction . . . . . . . . . . . . . . . . . . . . . . . . . . . . . . . . . . . . . . . . . . . 93 1. Note on terminology and references . . . . . . . . . . . . . . . . . . . . . 93
B. Overview of data sources . . . . . . . . . . . . . . . . . . . . . . . . . . . . . . . . . . 94 C. Survey data and methods . . . . . . . . . . . . . . . . . . . . . . . . . . . . . . . . . 96
1. Approaches to collection of water statistics via surveys . . . . . . . 96 2. Household surveys . . . . . . . . . . . . . . . . . . . . . . . . . . . . . . . . . . 100 3. Industrial surveys . . . . . . . . . . . . . . . . . . . . . . . . . . . . . . . . . . . 100 4. Agricultural surveys . . . . . . . . . . . . . . . . . . . . . . . . . . . . . . . . . 101 5. Summary of survey data-collection methods . . . . . . . . . . . . . . 102 6. Questionnaire design . . . . . . . . . . . . . . . . . . . . . . . . . . . . . . . . 103
D. Administrative data . . . . . . . . . . . . . . . . . . . . . . . . . . . . . . . . . . . . . . 104 1. Administrative data from government agencies . . . . . . . . . . . . . 105 2. Administrative data from non-governmental organizations . . . 106
E. Hydrological and meteorological data . . . . . . . . . . . . . . . . . . . . . . . . 107 F. Research data . . . . . . . . . . . . . . . . . . . . . . . . . . . . . . . . . . . . . . . . . . 110 G. Survey frames . . . . . . . . . . . . . . . . . . . . . . . . . . . . . . . . . . . . . . . . . . 112
VII. Metadata and data quality . . . . . . . . . . . . . . . . . . . . . . . . . . . . . . . . . . . 117 A. Introduction . . . . . . . . . . . . . . . . . . . . . . . . . . . . . . . . . . . . . . . . . . . 117
International Recommendations for Waterx
Page
B. Dimensions of data quality . . . . . . . . . . . . . . . . . . . . . . . . . . . . . . . . 117 1. Prerequisites of data quality. . . . . . . . . . . . . . . . . . . . . . . . . . . . 118 2. Accessibility . . . . . . . . . . . . . . . . . . . . . . . . . . . . . . . . . . . . . . . 119 3. Accuracy . . . . . . . . . . . . . . . . . . . . . . . . . . . . . . . . . . . . . . . . . . 119 4. Coherence . . . . . . . . . . . . . . . . . . . . . . . . . . . . . . . . . . . . . . . . . 121 5. Credibility . . . . . . . . . . . . . . . . . . . . . . . . . . . . . . . . . . . . . . . . . 122 6. Interpretability . . . . . . . . . . . . . . . . . . . . . . . . . . . . . . . . . . . . . 122 7. Relevance . . . . . . . . . . . . . . . . . . . . . . . . . . . . . . . . . . . . . . . . . 122 8. Timeliness . . . . . . . . . . . . . . . . . . . . . . . . . . . . . . . . . . . . . . . . . 122
C. Metadata . . . . . . . . . . . . . . . . . . . . . . . . . . . . . . . . . . . . . . . . . . . . . . 123 VIII. Data dissemination . . . . . . . . . . . . . . . . . . . . . . . . . . . . . . . . . . . . . . . . . 125
A. Introduction . . . . . . . . . . . . . . . . . . . . . . . . . . . . . . . . . . . . . . . . . . . 125 B. Dissemination principles . . . . . . . . . . . . . . . . . . . . . . . . . . . . . . . . . . 126
1. Statistical confidentiality . . . . . . . . . . . . . . . . . . . . . . . . . . . . . . 126 2. Equality . . . . . . . . . . . . . . . . . . . . . . . . . . . . . . . . . . . . . . . . . . 127 3. Objectivity . . . . . . . . . . . . . . . . . . . . . . . . . . . . . . . . . . . . . . . . 128
C. Information products . . . . . . . . . . . . . . . . . . . . . . . . . . . . . . . . . . . . 128 1. Organization and presentation of data . . . . . . . . . . . . . . . . . . . 129 2. Description and explanation of data . . . . . . . . . . . . . . . . . . . . . 130 3. Review of information products . . . . . . . . . . . . . . . . . . . . . . . . 130 4. Release and promotion . . . . . . . . . . . . . . . . . . . . . . . . . . . . . . . 130 5. Revisions of data . . . . . . . . . . . . . . . . . . . . . . . . . . . . . . . . . . . . 132
D. Monitoring the use of water statistics . . . . . . . . . . . . . . . . . . . . . . . . 132 E. International data-reporting . . . . . . . . . . . . . . . . . . . . . . . . . . . . . . . 133
References . . . . . . . . . . . . . . . . . . . . . . . . . . . . . . . . . . . . . . . . . . . . . . . . . 193
Annexes I. List of recommended data items . . . . . . . . . . . . . . . . . . . . . . . . . . . . . . . 135 II. List of supplementary data items . . . . . . . . . . . . . . . . . . . . . . . . . . . . . . . 149
A. Introduction . . . . . . . . . . . . . . . . . . . . . . . . . . . . . . . . . . . . . . . . . . . 149 B. Sources for supplementary data item definitions . . . . . . . . . . . . . . . . 164
III. Links between data items and inland water resources . . . . . . . . . . . . . . . 165 IV. Links between data items and SEEA-Water . . . . . . . . . . . . . . . . . . . . . . . 169
A. Introduction . . . . . . . . . . . . . . . . . . . . . . . . . . . . . . . . . . . . . . . . . . . 169 B. Tables . . . . . . . . . . . . . . . . . . . . . . . . . . . . . . . . . . . . . . . . . . . . . . . . 169
V. Water indicators and links between data items and WWAP and other indicators . . . . . . . . . . . . . . . . . . . . . . . . . . . . . . . . . . . . . . . . . . . . . . . . . 179
A. Introduction . . . . . . . . . . . . . . . . . . . . . . . . . . . . . . . . . . . . . . . . . . . 179 1. Use of indicators . . . . . . . . . . . . . . . . . . . . . . . . . . . . . . . . . . . . 179
B. Selection and characteristics of indicators . . . . . . . . . . . . . . . . . . . . 180 C. Links with indicators. . . . . . . . . . . . . . . . . . . . . . . . . . . . . . . . . . . . . 180
1. Links with MDG indicators related to water . . . . . . . . . . . . . . 181 2. Links with SEEA-Water indicators . . . . . . . . . . . . . . . . . . . . . . 182 3. Links with World Water Development Report indicators . . . . . . 185
VI. Measurement units and conversion factors . . . . . . . . . . . . . . . . . . . . . . . 191
Contents xi
Page
Tables III.1. Characteristics of inland water bodies relevant to water statistics . . . . . . . 42 III.2. Characteristics of economic units . . . . . . . . . . . . . . . . . . . . . . . . . . . . . . . 44 IV.1. Physical data items for inland water stocks . . . . . . . . . . . . . . . . . . . . . . . . 50 IV.2. Physical data items for flows into and out of the territory . . . . . . . . . . . . . 53 IV.3. Natural transfers of water between inland water resources . . . . . . . . . . . . 55 IV.4. Types of natural transfers of water between inland water resources . . . . . . 55 IV.5. Physical data items for flows from the environment to the economy . . . . . 55 IV.6. Physical data items for flows of water within the economy . . . . . . . . . . . . 58 IV.7. Physical data items for flows from the economy to the environment . . . . . 61 IV.8. Physical data items for losses from distribution networks and sewerage
systems . . . . . . . . . . . . . . . . . . . . . . . . . . . . . . . . . . . . . . . . . . . . . . . . . . . 62 IV.9. Data items for flows of waterborne emissions in the economy . . . . . . . . . . 63 IV.10. Data items for flows of waterborne emissions from the economy to the
environment . . . . . . . . . . . . . . . . . . . . . . . . . . . . . . . . . . . . . . . . . . . . . . . 64 IV.11. Value and costs of water and sewerage services . . . . . . . . . . . . . . . . . . . . . 68 IV.12. Taxes, subsidies and investment grants . . . . . . . . . . . . . . . . . . . . . . . . . . . 70 IV.13. Assets and investment . . . . . . . . . . . . . . . . . . . . . . . . . . . . . . . . . . . . . . . . 72 IV.14. Tariffs and charges for water supply and sewerage services . . . . . . . . . . . . 74 IV.15. Data items for the main source of drinking water used by populations
(MDG) . . . . . . . . . . . . . . . . . . . . . . . . . . . . . . . . . . . . . . . . . . . . . . . . . . . 75 IV.16. Data items for the main type of toilet and sewage disposal used by
populations (MDG) . . . . . . . . . . . . . . . . . . . . . . . . . . . . . . . . . . . . . . . . . 77 V.1. Organizations generally responsible for specific data items . . . . . . . . . . . . 90 VI.1. Summary of data items supported by different data sources . . . . . . . . . . . 95 VI.2. Types of data items that might be supported by adding water-related
questions to existing surveys . . . . . . . . . . . . . . . . . . . . . . . . . . . . . . . . . . . 98 VI.3. Data items supported by water-specific surveys of industries and
households . . . . . . . . . . . . . . . . . . . . . . . . . . . . . . . . . . . . . . . . . . . . . . . . . 101
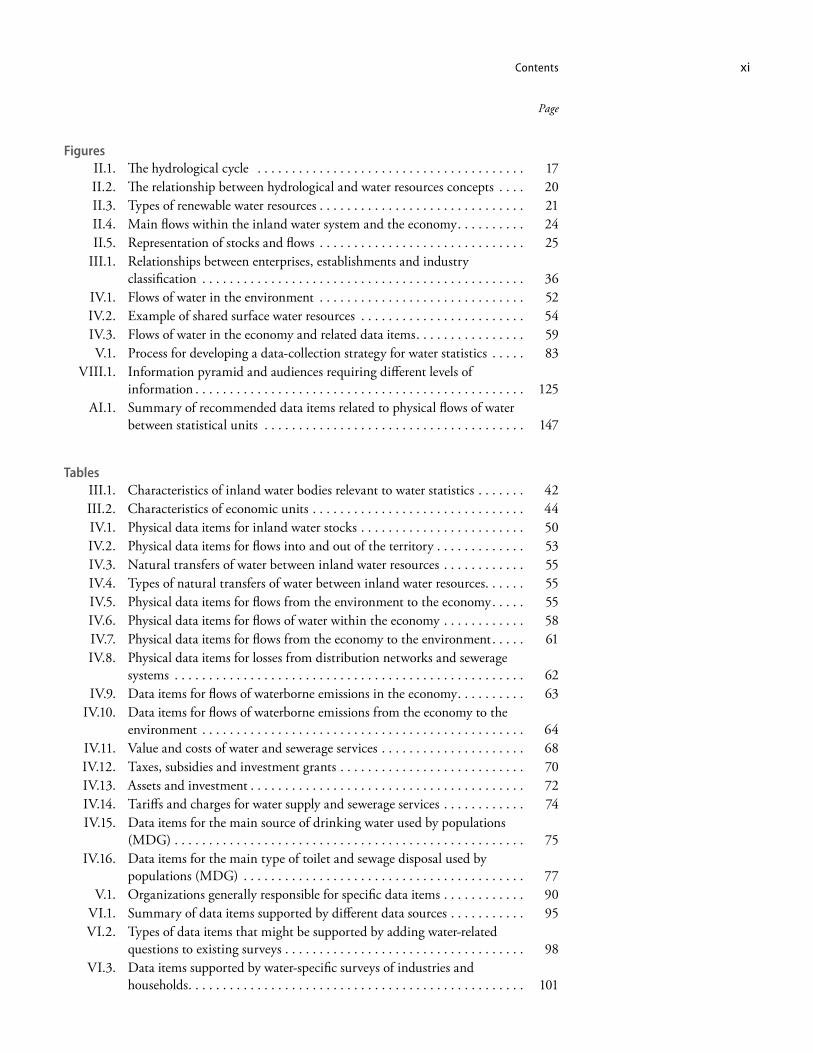
Figures II.1. The hydrological cycle . . . . . . . . . . . . . . . . . . . . . . . . . . . . . . . . . . . . . . . 17 II.2. The relationship between hydrological and water resources concepts . . . . 20 II.3. Types of renewable water resources . . . . . . . . . . . . . . . . . . . . . . . . . . . . . . 21 II.4. Main flows within the inland water system and the economy . . . . . . . . . . 24 II.5. Representation of stocks and flows . . . . . . . . . . . . . . . . . . . . . . . . . . . . . . 25 III.1. Relationships between enterprises, establishments and industry
classification . . . . . . . . . . . . . . . . . . . . . . . . . . . . . . . . . . . . . . . . . . . . . . . 36 IV.1. Flows of water in the environment . . . . . . . . . . . . . . . . . . . . . . . . . . . . . . 52 IV.2. Example of shared surface water resources . . . . . . . . . . . . . . . . . . . . . . . . 54 IV.3. Flows of water in the economy and related data items . . . . . . . . . . . . . . . . 59 V.1. Process for developing a data-collection strategy for water statistics . . . . . 83 VIII.1. Information pyramid and audiences requiring different levels of
information . . . . . . . . . . . . . . . . . . . . . . . . . . . . . . . . . . . . . . . . . . . . . . . . 125 AI.1. Summary of recommended data items related to physical flows of water
between statistical units . . . . . . . . . . . . . . . . . . . . . . . . . . . . . . . . . . . . . . 147
International Recommendations for Waterxii
Page
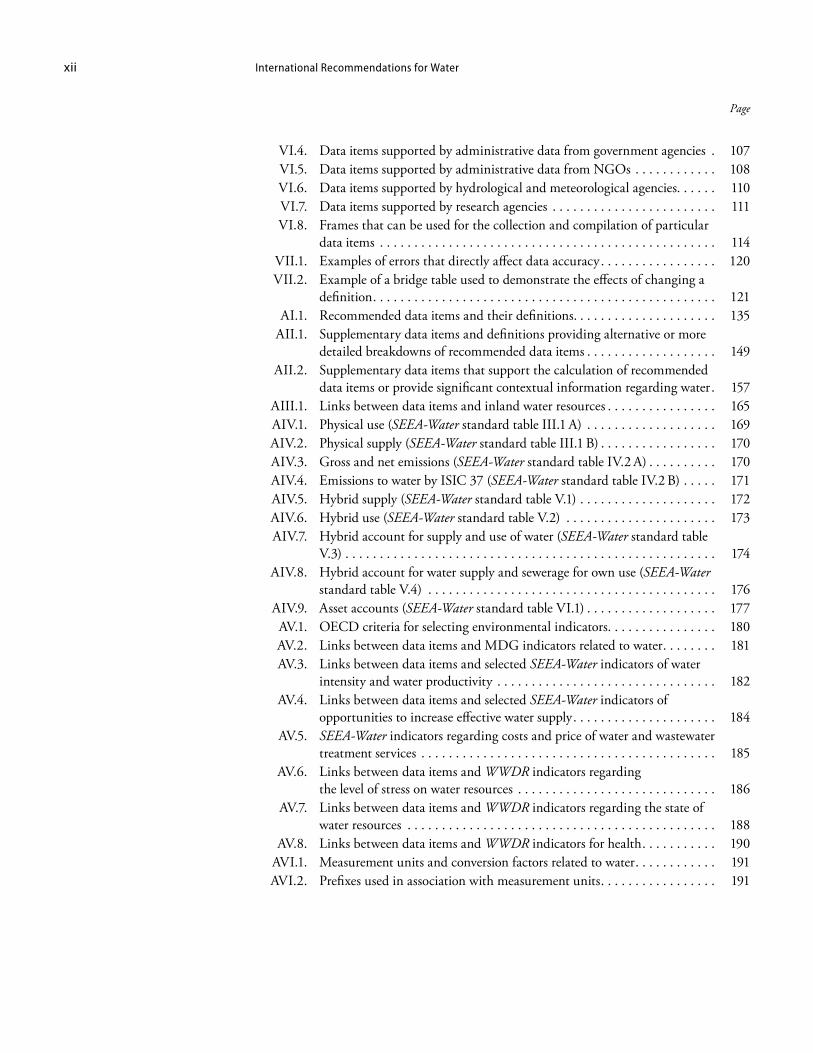
VI.4. Data items supported by administrative data from government agencies . 107 VI.5. Data items supported by administrative data from NGOs . . . . . . . . . . . . 108 VI.6. Data items supported by hydrological and meteorological agencies. . . . . . 110 VI.7. Data items supported by research agencies . . . . . . . . . . . . . . . . . . . . . . . . 111 VI.8. Frames that can be used for the collection and compilation of particular
data items . . . . . . . . . . . . . . . . . . . . . . . . . . . . . . . . . . . . . . . . . . . . . . . . . 114 VII.1. Examples of errors that directly affect data accuracy . . . . . . . . . . . . . . . . . 120 VII.2. Example of a bridge table used to demonstrate the effects of changing a
definition . . . . . . . . . . . . . . . . . . . . . . . . . . . . . . . . . . . . . . . . . . . . . . . . . . 121 AI.1. Recommended data items and their definitions. . . . . . . . . . . . . . . . . . . . . 135 AII.1. Supplementary data items and definitions providing alternative or more
detailed breakdowns of recommended data items . . . . . . . . . . . . . . . . . . . 149 AII.2. Supplementary data items that support the calculation of recommended
data items or provide significant contextual information regarding water . 157 AIII.1. Links between data items and inland water resources . . . . . . . . . . . . . . . . 165 AIV.1. Physical use (SEEA-Water standard table III.1 A) . . . . . . . . . . . . . . . . . . . 169 AIV.2. Physical supply (SEEA-Water standard table III.1 B) . . . . . . . . . . . . . . . . . 170 AIV.3. Gross and net emissions (SEEA-Water standard table IV.2 A) . . . . . . . . . . 170 AIV.4. Emissions to water by ISIC 37 (SEEA-Water standard table IV.2 B) . . . . . 171 AIV.5. Hybrid supply (SEEA-Water standard table V.1) . . . . . . . . . . . . . . . . . . . . 172 AIV.6. Hybrid use (SEEA-Water standard table V.2) . . . . . . . . . . . . . . . . . . . . . . 173 AIV.7. Hybrid account for supply and use of water (SEEA-Water standard table
V.3) . . . . . . . . . . . . . . . . . . . . . . . . . . . . . . . . . . . . . . . . . . . . . . . . . . . . . . 174 AIV.8. Hybrid account for water supply and sewerage for own use (SEEA-Water
standard table V.4) . . . . . . . . . . . . . . . . . . . . . . . . . . . . . . . . . . . . . . . . . . 176 AIV.9. Asset accounts (SEEA-Water standard table VI.1) . . . . . . . . . . . . . . . . . . . 177 AV.1. OECD criteria for selecting environmental indicators . . . . . . . . . . . . . . . . 180 AV.2. Links between data items and MDG indicators related to water . . . . . . . . 181 AV.3. Links between data items and selected SEEA-Water indicators of water
intensity and water productivity . . . . . . . . . . . . . . . . . . . . . . . . . . . . . . . . 182 AV.4. Links between data items and selected SEEA-Water indicators of
opportunities to increase effective water supply . . . . . . . . . . . . . . . . . . . . . 184 AV.5. SEEA-Water indicators regarding costs and price of water and wastewater
treatment services . . . . . . . . . . . . . . . . . . . . . . . . . . . . . . . . . . . . . . . . . . . 185 AV.6. Links between data items and WWDR indicators regarding
the level of stress on water resources . . . . . . . . . . . . . . . . . . . . . . . . . . . . . 186 AV.7. Links between data items and WWDR indicators regarding the state of
water resources . . . . . . . . . . . . . . . . . . . . . . . . . . . . . . . . . . . . . . . . . . . . . 188 AV.8. Links between data items and WWDR indicators for health . . . . . . . . . . . 190 AVI.1. Measurement units and conversion factors related to water . . . . . . . . . . . . 191 AVI.2. Prefixes used in association with measurement units . . . . . . . . . . . . . . . . . 191
xiii
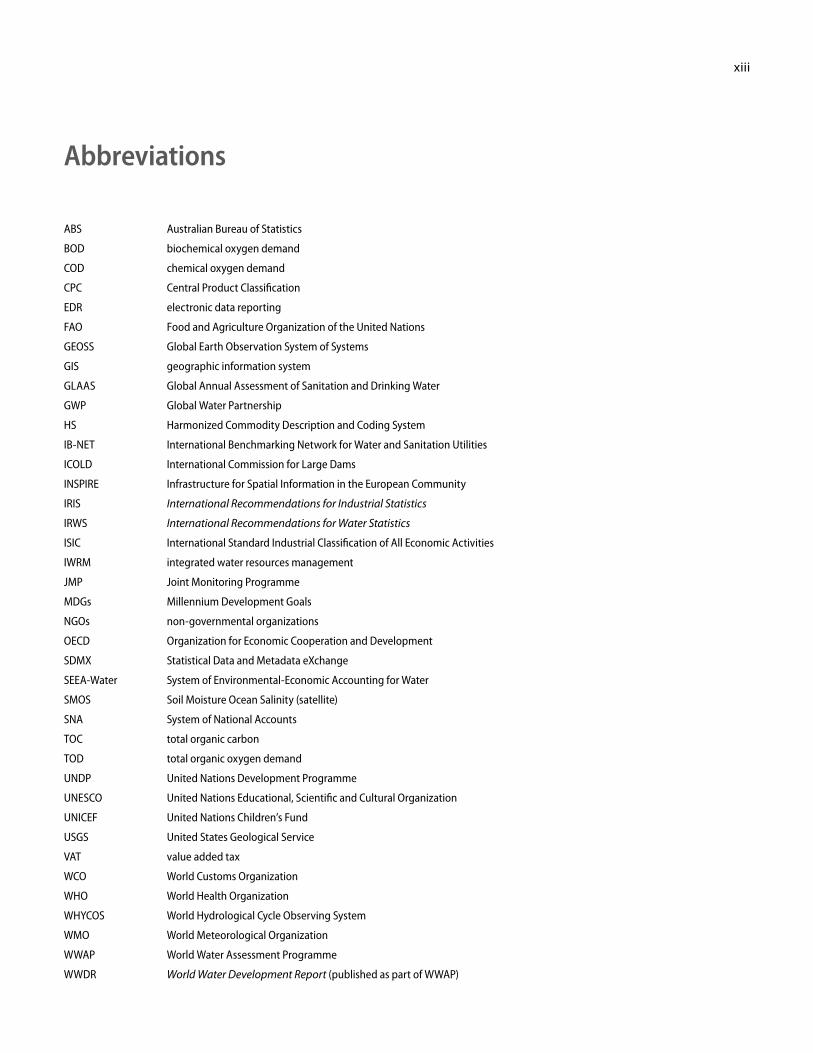
Abbreviations
ABS Australian Bureau of Statistics
BOD biochemical oxygen demand
COD chemical oxygen demand
CPC Central Product Classification
EDR electronic data reporting
FAO Food and Agriculture Organization of the United Nations
GEOSS Global Earth Observation System of Systems
GIS geographic information system
GLAAS Global Annual Assessment of Sanitation and Drinking Water
GWP Global Water Partnership
HS Harmonized Commodity Description and Coding System
IB-NET International Benchmarking Network for Water and Sanitation Utilities
ICOLD International Commission for Large Dams
INSPIRE Infrastructure for Spatial Information in the European Community
IRIS International Recommendations for Industrial Statistics
IRWS International Recommendations for Water Statistics
ISIC International Standard Industrial Classification of All Economic Activities
IWRM integrated water resources management
JMP Joint Monitoring Programme
MDGs Millennium Development Goals
NGOs non-governmental organizations
OECD Organization for Economic Cooperation and Development
SDMX Statistical Data and Metadata eXchange
SEEA-Water System of Environmental-Economic Accounting for Water
SMOS Soil Moisture Ocean Salinity (satellite)
SNA System of National Accounts
TOC total organic carbon
TOD total organic oxygen demand
UNDP United Nations Development Programme
UNESCO United Nations Educational, Scientific and Cultural Organization
UNICEF United Nations Children’s Fund
USGS United States Geological Service
VAT value added tax
WCO World Customs Organization
WHO World Health Organization
WHYCOS World Hydrological Cycle Observing System
WMO World Meteorological Organization
WWAP World Water Assessment Programme
WWDR World Water Development Report (published as part of WWAP)

1
Introduction
A. Background 1. Water is essential for life. It is a key element in ensuring the integrity of ecosys-tems and the goods and services they provide as well as in growing food, generating energy and producing all kinds of products and services. The growth of population, together with increasing competition for freshwater among agriculture, urban and industrial uses, results in unprecedented pressures on water resources, with many countries reaching conditions of water scarcity and facing limits to economic development. Moreover, water quality continues to decline, further limiting the availability of freshwater resources, and there is change in the global hydrological cycle due to human pressures.1 2. The integral role of water in development is widely recognized, and water issues are very high in the national and international development agendas, with several international agreements specifying targets for water supply and sanitation. At the global level, the most notable are the targets in the Millennium Development Goals (MDGs), namely, target 7.C, to halve, by 2015, the proportion of people without sustainable access to safe drinking water and basic sanitation, and the two related indicators: proportion of population using an improved water source, and proportion of population using an improved sanitation facility (indicators 7.8 and 7.9, respectively).2 The vital role of water is reflected also by the recent inclusion of a new indicator under target 7.A, the proportion of total water resources used (indicator 7.5), whose purpose is to integrate the principles of sustainable development into country policies and programmes and reverse the loss of environmental resources. 3. At the regional level, the European Union has established a community framework for water protection and management. By means of the European Union Water Framework Directive, the European Union provides for the management of inland water resources in order to prevent and reduce pollution, promote sustainable water use, protect the aquatic environment, improve the status of aquatic ecosystems and mitigate the effects of floods and droughts. The water framework directive also introduces the principles of cost recovery and polluter pays to achieve a common target value of good ecological status for all European water bodies by 2015 in the most cost-effective way, taking into account an economic analysis of water services and natural resources, including environmental costs. 4. Integrated water resources management (IWRM) and the assessment and moni-toring of water resources and their use call for improved water statistics that are based on consistent concepts, definitions and terminology and are better integrated with economic, social and environmental statistics.
B. The purpose of international recommendations and IRWS
5. International recommendations are an agreed intermediate output framework, con-sisting of a coherent set of principles, concepts and definitions of data items to be collected
1 UNEP, 2007, Global Environmental Outlook. Available from http://www.unep.org/geo/geo4/media/ (accessed 23 September 2009).
2 See United Nations Statistics Division website for the definition of MDG targets and indicators (http://mdgs.un.org/unsd/mdg/Metadata.aspx).
International Recommendations for Water2
and published in a particular field of statistics. The United Nations has published recom-mendations in a range of statistical fields to help establish coherent and uniform measure-ment of information. Examples of recommendations are those for distributive trade (United Nations, 2008), industry (United Nations, 2007), tourism, (United Nations, 2001), interna-tional migration (1998), population and housing censuses (United Nations, 2008) and a vital statistics system (United Nations, 2001). The users of international recommendations need to assess the applicability and practicability of implementing the recommendations, taking into account their circumstances; for example, identified user needs, resources, priorities and respondent burden. 6. International Recommendations for Water Statistics (IRWS) is the first of its kind in the field of environment statistics. Its development had started as part of the United Nations Statistics Division’s regular work programme to support countries in the establishment and strengthening of water statistics. With the adoption of the System of Environmental-Economic Accounting for Water (SEEA-Water) as an interim statistical standard by the Statistical Com-mission at its thirty-eighth session, the development of IRWS has been fully aligned with SEEA-Water and its implementation plan. Besides SEEA-Water, IRWS supports and uses pre-existing statistical standards and recommendations, for example, the International Standard Industrial Classification of All Economic Activities (ISIC), the Central Product Classification (CPC) and the International Recommendations for Industrial Statistics (IRIS). 7. The primary objective of IRWS is to assist countries in the establishment and strengthening of a multipurpose information system for water in support of IWRM; in particular, the recommendations to:
(a) Support the collection, compilation and dissemination of internationally compa-rable water statistics in countries;
(b) Support the implementation of SEEA-Water; (c) Provide the necessary information for deriving coherent and consistent indicators,
enabling comparisons over time and between countries from an agreed list of data items. This includes indicators used by the World Water Assessment Programme (WWAP), the Food and Agriculture Organization of the United Nations (FAO) and others.
C. The need for IRWS 8. This publication consolidates the experiences and practices of countries and inter-national organizations in the field of water statistics for the first time. The more important factors that have guided the preparation of IRWS are the following:
(a) The recognition of the need to improve basic water data and the integration of data from social, economic and environmental realms for the better management of water, in particular to enable the principles of IWRM to be implemented and to allow for issues that require high levels of data integration, such as climate change, to be assessed and analysed;
(b) The adoption of SEEA-Water as an interim international statistical standard, which strongly links data from the economy and the environment;
(c) The need for consistency in concepts, definitions and terminology in major statisti-cal collections and publications on water by international organizations, such as FAO, the World Meteorological Organization (WMO), WWAP, the Statistical Office of the European Communities (Eurostat), the European Environmental Agency (EEA) and the Organization for Economic Cooperation and Development (OECD);
Introduction 3
(d) The System of National Accounts, 2008 (2008 SNA), the International Standard Industrial Classification of All Economic Activities, Revision 4 (ISIC, Rev. 4) and the Central Product Classification, Version 2 (CPC, Ver. 2);
(e) The experience of countries in developing water statistics systems and conducting data collections adapted to their particular needs.
D. A note on terminology 9. Water statistics are multidisciplinary and span many different fields, and hydrolo-gists, national accountants and environment statisticians need to be able to communicate using a common terminology. IRWS uses a terminology for water statistics that builds on that developed for SEEA-Water. An achievement of SEEA-Water was to reach an agreement on a common language and terminology which is consistent with the specific terminologies of each field. 10. The terms and definitions of SEEA-Water were developed via an Electronic Discus-sion Group (EDG)3 moderated by the United Nations Statistics Division in cooperation with the Division for Sustainable Development of the United Nations Secretariat. These terms and definitions were further discussed and elaborated during the development of IRWS. When necessary, notes on terminology are provided at the beginning of the chapters and in the text.
E. Data items of IRWS 11 . IRWS provides a comprehensive list of “recommended data items” for the collection, compilation and reporting of basic water statistics. The recommended data items cover the stocks of water in the environment and the economy, the flows of water in and between the environment and the economy, and the social-demographic data needed for the monitoring of MDG target 7.C. Additional data items that complement the recommended data items to meet specific requirements are listed as “supplementary data items”. 12. The recommended data items are elaborated in chapter IV and listed in full in annex I. The data items are fully consistent with the concepts and definitions of SEEA-Water and are, to the greatest extent possible, consistent with other information sources, including the United Nations Statistics Division/United Nations Environment Programme (UNEP) Questionnaire on Environment Statistics, the OECD/Eurostat joint questionnaire on the state of the environment, the FAO AQUASTAT, the MDG indicators, the UNICEF/WHO Joint Monitoring Programme (JMP) Multiple Indicator Cluster Survey (MICS3) and the International Benchmarking Network for Water and Sanitation Utilities (IB-NET). 13. Each recommended data item has a unique alphanumeric code and items are ordered in a hierarchical classification that has 3 main headings and 15 tables, as follows:
• Physical data items• Inland water stocks (data items A)• Flows of water into and out of the territory (data items B-C)• Natural transfers of water between inland water resources (data items D)• Flows of water from the environment to the economy (data items E)• Flows of water within the economy (data items F-G)• Flows of water from the economy to the environment (data items H)• Losses of water from distribution networks and sewerage systems (data items I)
3 The work of EDG was based in particular on the review of the following glossaries: 2001 United Nations Statis-tics Division questionnaire on water resources; 2002 Joint OECD/Eurostat questionnaire on inland waters; 2001 FAO/AQUASTAT questionnaire; UNESCO/WMO international glossary of hydrology, 2nd ed., 1992; FAO/AQUASTAT online glossary; working copy of Terminology of Water Management: Flood Protection TERMDAT (United Nations, 1997); Glossary of Environment Statistics; Studies in Methods, Series F, No. 67.
International Recommendations for Water4
• Flows of waterborne emissions in the economy (data items J)• Flows of waterborne emissions from the economy to the environment (data items K)
• Monetary data items• Value and cost of water supply and sewerage services (data items L)• Taxes, subsidies and investment grants (data items M-N).• Assets and investment in water supply and sewerage infrastructure (data items
O-Q)• Tariffs and charges for water supply and sewerage services (data items R)
• Social-demographic data items• Main source of drinking water used by populations (data items S)• Main type of toilet and sewerage disposal used by populations (data items T)
14. Many countries have experience in building water statistics programmes. The pre-sent set of recommended data items has not been ranked by assigning priorities of importance based on the various stages of implementation of the recommendations. Rather, the approach adopted by IRWS is to adopt a universal list of water data items, statistics on which are to be collected and published and can be used for multiple purposes. IRWS is expected to be applicable to all countries, with no distinction between developed and developing countries, and therefore all countries are encouraged to adopt them. 15. Depending on user needs, further disaggregation of recommended data items and additional data items that go beyond the scope of those recommended may be necessary to meet specific requirements. A longer and more detailed list of “supplementary data items”, which complement the hierarchical classification of the recommended data items, is also presented in IRWS. 16 . IRWS is not intended to be prescriptive. Countries may choose a particular method for implementation of the recommendations, depending upon their own needs and capabili-ties, the needs of data users and the availability of data through statistical, administrative and other sources. It is recognized that water statistics systems have to balance the need for detailed data with the cost and response burden of collecting the data. The prioritization of data items for collection and compilation is discussed alongside institutional arrangements in chapter V. 17. It is important to note that the data items in IRWS may be coupled or compared with other official statistics and data. As such, the data items are useful for a range of analyses, for example, of issues related to IWRM or climate change.
F. Users of IRWS 18 . IRWS is designed to support a broad range of producers of water statistics with vary-ing levels of expertise from a wide range of disciplines (e.g., hydrology, meteorology, statistics, agriculture, engineering, environmental sciences and economics). While it has been primarily designed for the producers of official national statistics, those working in other organizations producing or using water statistics may also use it. 19. Water statistics are used for a variety of purposes, and the producers of water statis-tics need to closely liaise with the users of water statistics, including:
• Policy- and decision-makers, who use water statistics for integrated water resources policy and management at the international, national, regional and river basin levels, for allocating water resources efficiently, assessing the level of waterborne emissions and understanding the impacts of water management from and on all users and the environment
• The business community, which uses water statistics for evaluating competing demands from other industries for water resources, for assessing the efficiency of investments in water infrastructure, water use, emission control and water trading, where it exists.
Introduction 5
• Researchers, who study water resources, water use, water efficiency, waterborne emis-sions, competition for water resources, etc., at the international, national and subna-tional levels
• Compilers of water accounts, who make extensive use of water statistics for the compila-tion of (a) physical and monetary supply and use tables, (b) emissions accounts and (c) asset accounts
• The public, who benefit from the availability of timely water statistics to assess the conditions of water resources, the impact of economic activities on the availability of water, levels of waterborne emissions and the effectiveness of water management
20 . IRWS data items may be used to develop a range of indicators for policy and analytical purposes. Annex IV provides a discussion of indicators and also links the data items directly with the indicators of the World Water Development Report (WWDR) of the WWAP.4,5 WWDR is a three-yearly review of the state of the world’s freshwater resources. WWAP is the flagship programme of UN-Water, which is a consortium of United Nations agencies and programmes that work together on water-related issues.
G. Future work 21 . IRWS consolidates the experiences and practices of country and international organizations into a set of recommendations for water statistics. However, there are several areas of water statistics that require further investigation before they can be standardized, including water quality, environmental flows, water rights, water incorporated into prod-ucts, and the further integration of water data with social-demographic statistics and other statistical fields. 22 . IRWS does not fully develop the link between water and related social and demo-graphic aspects. While some social aspects can be included by disaggregating, for example, the household sector on the basis of social-demographic characteristics (rural versus urban, income, etc.), further work is needed to expand the statistical framework to include more of the social and demographic aspects of water, and in particular those relating to gender and health. 23. Water quality is an area of great interest, but at present there are no international standards or recommendations for water quality statistics. Some guidance on water quality is available from UNEP (2008)6 and is also included in part two of SEEA-Water, which contains the elements of water accounting that are not sufficiently mature to qualify as international standards. 24. Environmental flows and water rights are emerging areas of interest. Environmental flows, sometimes called minimum flows, are the volumes of water formally allocated for the benefit of the environment and not, for example, for economic purposes. Water rights are the legal instruments used to regulate access to particular bodies of water or to use precipitation. At present, there is little country or international experience in these areas, so further work is needed before the relevant international recommendations can be formulated. 25. Climate change is at the forefront of international concerns and water is a key con-sideration for policy- and decision-makers working on this topic. While water statistics can be used to show changing patterns of water availability and to assess some of the options available to deal with these changes, they need to be more fully integrated with other areas
4 WWAP, 2006, 2nd World Water Development Report: “Water: A Shared Responsibility”. Available from http://www.unesco.org/water/wwap/wwdr/index.shtml (accessed 20 July 2009).
5 WWAP, 2009, 3rd World Water Development Report: “Water in a Changing World”. Available from http://www.unesco.org/water/wwap/wwdr/wwdr3/pdf/WWDR3_Water_in_a_Changing_World.pdf (accessed 20 July 2009).
6 UNEP, 2008, Water Quality for Ecosystem and Human Health, 2nd ed. Available from http://www.gemswater.org/publications/pdfs/water_quality_human_health.pdf (accessed 20 June 2009).
International Recommendations for Water6
of statistics, in particular energy and air emission statistics, so as to provide a more fully integrated statistical system to deal with the topic of climate change. 26 . IRWS does not cover guidance on actual measurements or methods for the collection or calculation of the data items. Following the completion of IRWS, the United Nations Sta-tistics Division, with the assistance of the statistical community, will develop more detailed practical compilation guidelines to support IRWS and SEEA-Water. The guidelines will con-tain country examples and best practices, as well as additional details on how to collect and compile the data items, compile standard tables of SEEA-Water, fill in international question-naires and develop water indicators.

Part one
International recommendations

9
Chapter I
Scope of water statistics
A. Introduction 1.1. Chapter I describes the scope of water statistics covered by International Recommen-dations for Water Statistics (IRWS), notes specific exclusions in coverage and summarizes the international context in which these recommendations have been developed. The integrated nature of water statistics and the relationship of IRWS to other international statistical activi-ties are also presented.
B. Coverage of IRWS
1. Water statistics covered by IRWS
1.2 . IRWS covers physical and, where relevant, monetary data items relating to the stocks and flows of water within the environment, the flows of water from the environment to the economy (water abstraction), the stocks and flows of water within the economy (storage and use of water by the economy), and the flows of water from the economy to the environment (returns of water). This includes inflows and outflows of water to a particular territory of reference from neighbouring territories, the sea and the atmosphere (i.e., precipitation). 1.3. All inland waters are covered by IRWS, irrespective of their quality. These include freshwater, brackish water and saltwater. Freshwater is naturally occurring water having a low concentration of salt. Saltwater is found in the sea but also occurs as groundwater or in other inland water resources (e.g., the Dead Sea). Marine water resources are mostly outside the scope of IRWS but are considered when saltwater is abstracted from the sea (e.g., for desalina-tion or cooling). 1.4. While IRWS does not cover social aspects of water, it does include information on the population using improved water sources and sanitation facilities to support the produc-tion of the MDG indicators. 1.5. While the “recommended data items” follow a systems approach focusing on the stocks and flows of water and are structured in accordance with the concepts of the System of Environmental-Economic Accounting for Water (SEEA-Water), the “supplementary data items” cover several other data items that countries may wish to collect to meet specific information requirements (e.g., physical data on water-related infrastructure).
2. Water statistics not covered by IRWS
1.6. As noted in the introduction, some areas of water statistics are not included in IRWS for a variety of reasons. These include surface water and groundwater quality (i.e., water qual-ity in the ambient environment), drinking water quality, environmental flows, water rights, and health and gender statistics related to water use. In addition, the water incorporated into
International Recommendations for Water10
products, such as soft drinks, fruits and vegetables, are not covered. Bottled water, however, is listed as a supplementary data item because of its importance in some countries. 1.7. Surface water and groundwater quality is not covered because at present there is not sufficient international consensus to recommend data items related to water quality. Some guidance on compiling water statistics regarding water quality is available from the United Nations Environment Programme (UNEP) (2008)7 and is also included in part two of SEEA-Water, which contains the elements of water accounting that are not sufficiently mature to qualify as international standards. It should be noted that waterborne emissions are addressed in IRWS, and SEEA-Water includes waterborne emissions accounts as standard tables in part one. 1.8. Related to water quality are drinking water quality and certain special forms of pol-lution, for example, from solid waste. IRWS does not address drinking water quality because the World Health Organization (WHO) provides guidelines for the quality of drinking water (WHO, 2008).8 The dumping of solid waste in surface water bodies can cause pollution of surface water and groundwater. The relationship between solid waste and water quality is complicated and there is little national statistical practice in this area. 1.9. Environmental flows and water rights are two emerging areas of water statistics. In general, environmental flows are flows of water that could be used for economic purposes but instead are formally allocated for the benefit of the environment. Water rights are the legal instruments used to regulate access to particular bodies of water or to use precipitation. At present, there is relatively little country or international experience in collecting and reporting data on these issues. With time, it is expected that country practices can be developed into recommendations for these areas. 1.10. While statistics concerning health and gender are related to water statistics, they are not included in these recommendations. The WHO9 and others address issues related to health, while gender statistics are addressed by a range of agencies, including the United Nations Statistics Division.10
C. The integrated nature of water statistics 1.11. Because water is critical and intimately linked with socio-economic development, it is necessary for countries to move away from sectoral development and management of water resources and to adopt an integrated overall approach to water management (United Nations and World Water Assessment Programme, 2006). 1.12. Only by integrating economic, social, environmental and hydrological information can cohesive policies be designed in an informed and integrated manner. Water policy- and decision-makers need to assess and be aware of the likely consequences of different develop-ment paths on the environment, the economy and the people that depend on the economy and the environment for their livelihoods. Those determining the development of industries making extensive use of water resources, either as inputs in the production process or as sinks for the discharge of wastewater, need to be aware of the long-term consequences for water resources and the people that depend on them. This is particularly important in view of cli-mate change that is changing the distribution of water spatially and temporally, for example, decreasing rainfall in some places and increasing it in others.
7 UNEP, 2008, Water Quality for Ecosystem and Human Health, 2nd ed. Available from http://www.gemswater.org/publications/pdfs/water_quality_human_health.pdf (accessed 20 June 2009).
8 WHO, 2008, Drinking Water Guidelines. Available from http://www.who.int/water_sanitation_health/dwq/gdwq3rev/en/index.html (accessed 22 September 2009).
9 See, for example, WHO Water Sanitation and Health Project. Available from http://www.who.int/water_ sanitation_health/diseases/en/index.html.
10 See http://unstats.un.org/unsd/demographic/products/indwm/default.htm.
Scope of water statistics 11
1. Integrated water resources management
1.13. Integrated Water Resources Management (IWRM) is based on the perception of water as an integral part of the ecosystem, a natural resource and a social and economic good whose quantity and quality determine the nature of its utilization. To this end, water resources have to be protected, taking into account the functioning of aquatic ecosystems and the perenniality of the resource, in order to satisfy and reconcile needs for water in human activities. In developing and using water resources, priority has to be given to the satisfaction of basic needs and the safeguarding of ecosystems. Beyond these requirements, however, water users should be charged appropriately (see para. 18.8 of Agenda 2111). 1.14. IWRM calls for a sustainable management of water resources to ensure that there is enough water for future generations and that water meets appropriate quality standards. An IWRM approach promotes the coordinated development and management of water, land and related resources in order to maximize the resultant economic and social welfare in an equitable manner, without compromising the sustainability of vital ecosystems. This includes more coordinated development of (a) land and water, (b) surface and groundwater, (c) river basins and their coastal and marine environment, and (d) upstream and downstream interests (Global Water Partnership, 2004).12
1.15. For policy development, decision-making and planning, taking an IWRM approach requires that (a) policies and priorities take water resources implications into account, includ-ing the two-way relationship between macroeconomic policies and water development, man-agement and use; (b) there be cross-sectoral integration in policy development; (c) stakehold-ers be given a voice in water planning and management; (d) water-related decisions made at local and river-basin levels be in line with, or at least not in conflict with, the achievement of broad national objectives; and (e) water planning and strategies be integrated into broader social, economic and environmental goals (Global Water Partnership, 2004). 1.16 . IRWS supports IWRM by providing the definitions and structure of the basic water statistics needed to monitor progress towards many of the goals of IWRM. In particular, via the compilation of water accounts from water statistics, policy developers and decision mak-ers are provided with an integrated information system for understanding water resources, how they are used, and the benefits and costs of this use. While IRWS addresses many of the information needs of IWRM, it does not address them all.
2. System of Environmental-Economic Accounting for Water
1.17. SEEA-Water was developed to address the need for integrated information on water resources and their management. It was recognized that SEEA-Water provides a much-needed conceptual framework for organizing hydrological and economic information in support of IWRM.13 The Statistical Commission adopted SEEA-Water as an interim international statistical standard at its thirty-eighth session in March 2007. 1.18 . SEEA-Water is an elaboration of the handbook Integrated Environmental and Economic Accounting 2003 (United Nations and others, 2003), commonly referred to as SEEA-2003, which describes the interaction between the economy and the environment and covers the whole spectrum of natural resources and the environment. Both SEEA-2003 and SEEA-Water use as a basic framework the System of National Accounts (SNA), which is the standard system for the compilation of economic statistics and derivation of economic
11 Report of the United Nations Conference on Environment and Development, Rio de Janeiro, 3-14 June 1992, vol. I, Resolutions Adopted by the Conference. Sales No. E.93.I.8 and corrigendum. Resolution I, annex II (Agenda 21).
12 Catalyzing Change: A handbook for developing integrated water resources management (IWRM) and water efficiency strategies (see http://www.gwpforum.org/servlet/PSP?iNodeID=215&itemId=496).
13 See report of the Committee of Experts on Environmental-Economic Accounting (E/CN.3/2007/9), para. 22.
International Recommendations for Water12
indicators, the most notable being gross domestic product (GDP). The most recent version of SNA is the 2008 SNA.14
1.19 . SEEA-Water is a conceptual framework that describes a set of standard tables focus-ing on hydrological and economic information, which permits the analysis of the interaction between water and the economy. The standard tables constitute the minimum data set that all countries are encouraged to compile. It also includes a set of supplementary tables that consist of items that may be of interest to a country’s analysts, policy developers and decision makers. The supplementary tables are still experimental or not directly linked with SNA. The set of tables, standard and supplementary, were designed with the objective of facilitating the compilation of the accounts in countries and to obtain information that is comparable across countries and over time. Additional information on SEEA-Water is presented in chapter II.
D. Relationship of IRWS with other international statistical activities
1. IRWS and other international statistical standards and guidance
1.20 . IRWS is part of a suite of United Nations Statistics Division publications on water statistics. While SEEA-Water provides the integration framework to link hydrological infor-mation with economic statistics, IRWS explicitly defines a range of data that are needed for IWRM, collected by countries and compiled by international organizations, and it provides more details and guidance on the basic statistical data needed to populate SEEA-Water. 1.21 . SEEA-Water and IRWS are to be further supported by compilation guidelines. These guidelines will present the best practices and country examples of how to collect and compile the data items. They will also provide practical guidance on the compilation of the SEEA-Water standard tables, the completion of international questionnaires and the construction of indicators for national and international monitoring and reporting. 1.22 . IRWS is also part of a wider set of statistical standards, recommendations and guidance documents that support the international statistical system and ensure coherence between all types of official statistics. As such, IRWS draws information from other pre-existing international standards, recommendations and guidance documents. 1.23 . SNA and SEEA-Water have already been mentioned, but IRWS relies on many other existing international standards or recommendations. For example, IRWS builds on the expe-rience of the World Programme for the Census of Agriculture 2010, which has a list of data items that includes a set of water-related data items under the themes of irrigation and water management, and aquaculture. The publication International Recommendations for Industrial Statistics (IRIS) includes data items regarding water use and special data items to be collected from water suppliers or sewerage service providers. The publication Principles and Recommen-dations for Housing and Population Censuses, Revision 2, includes core topics, such as questions on the main source of drinking water, type of toilet and type of sewage disposal. 1.24 . IRWS also uses standard classifications, such as the International Standard Indus-trial Classification of All Economic Activities (ISIC) and the Central Product Classification (CPC), which constitute the basic infrastructure of official economic statistics.
2. International statistical data collections, compilations, indicators and reports
1.25. There are three regular international data collections regarding water resources and their use that collect data directly from countries. These are conducted by the Organization
14 See United Nations Statistics Division website (http://unstats.un.org/unsd/sna1993/draftingPhase/volume1.asp).
Scope of water statistics 13
for Economic Cooperation and Development (OECD) with Eurostat,15 the United Nations Statistics Division16 with UNEP and the Food and Agriculture Organization of the United Nations (FAO).17 In addition, the Joint Monitoring Programme conducted by WHO and the United Nations Children’s Fund (UNICEF) collects information on populations using improved sources of water and sanitation.18 Data are shared between international organiza-tions and are used by a range of organizations around the world. 1.26. Data collected by the international organizations serve multiple purposes. Much of the data collected by them is consistent with SEEA-Water and can also be used to populate the water accounts. The international questionnaires include a range of additional data items that are needed for water management and analysis. All these data items are covered by the recommended or supplementary data items of IRWS. 1.27. In addition to the international data collections, regional organizations and others collect water statistics regularly or from time to time. In many instances, such organizations use simplified versions of the questionnaires used by the United Nations Statistics Division/UNEP, OECD/Eurostat or FAO. International water data collections rely on national and subnational water data supplied by countries; it is therefore important to use consistent and coherent classifications and definitions for data items. In other cases, there are regional data collections that collect data at subnational levels corresponding to river basins. Regional data collections by river basin include the Mekong River Commission and the State of the Envi-ronment (SOE) reporting to the European Environment Agency and the Water Information System for Europe (WISE). 1.28. There are other international data compilations and indicator sets that rely on water statistics and these include the MDG indicators.19
15 See OECD website (http://www.oecd.org/topicstatsportal/0,3398,en_2825_495628_1_1_1_1_1,00.html) and Eurostat datasets and EU agency data (http://water.europa.eu/).
16 See UNSD website (http://unstats.un.org/unsd/environment/datacollect.htm). 17 See FAO Aquastat website (http://www.fao.org/nr/water/aquastat/main/index.stm). 18 Global annual assessment of sanitation and drinking water; see http://www.unwater.org./downloads/
GLAAS_2008_Pilot_Report.pdf. 19 See MDG indicators website (http://mdgs.un.org/unsd/mdg/Default.aspx).

15
Chapter II
Main concepts and frameworks
A. Introduction 2.1. Water statistics use and integrate concepts, definitions, classifications and frame-works from the hydrological sciences and environmental, economic, demographic and social statistics. Chapter II provides a brief overview of the main concepts related to water in the environment, the economy and society and the concepts related to inland water resources. It also introduces SEEA-Water, which provides the overarching framework for integrated environment and economic statistics for water. Additional details on the statistical units that make up the economy and the environment are provided in chapter III. 2.2. Section B outlines the key concepts used in environmental, economic and social-demographic statistics; section C covers inland water resources and related concepts; sec-tion D covers SEEA-Water; and section E covers spatial and temporal references used in water statistics.
B. Main concepts 1. Water
2.3. Water is a colourless, tasteless and odourless chemical substance composed of one oxygen atom and two hydrogen atoms with the chemical formula H2O. In most cases, water contains other dissolved chemicals that affect its colour, taste, odour, acidity and conductiv-ity. In water statistics, water refers to water and any dissolved, suspended or other chemicals or materials carried in the water (e.g., water includes saltwater and polluted water). 2.4. The distinction between freshwater and saltwater is an important consideration in water statistics. The International Glossary of Hydrology defines freshwater as naturally occur-ring water having a low concentration of salts, or generally accepted as suitable for abstraction and treatment to produce potable water (ISO/6107).20 However, an international standard for the definition of fresh water in terms of the salt content (e.g., in parts per million, grams per litre or electrolytic conductivity) is not available, although there is a considerable body of practice (engineering, agricultural and other practices). Different countries have different definitions regarding salinity. For example, the definition of freshwater in the United States of America and Canada is water with a concentration of salt of less than 1,000 parts per million,21 while in Australia it is water with a salt concentration of less than 500 parts per million.22
20 UNESCO-IHE, Freshwater (http://www.cig.ensmp.fr/~hubert/glu/HINDEN.HTM). 21 United States Geological Survey, Saline Water (http://ga.water.usgs.gov/edu/saline.html; and Environment
Canada: Fresh water http://www.ec.gc.ca/water/en/info/gloss/e_gloss.htm#F). 22 Australian Bureau of Statistics, Water Account, Australia (1993-94 to 1997-98: http://www.ausstats.abs.gov.au/
ausstats/subscriber.nsf/0/B1828F089084E50CCA2568D4000280DF/$File/46100_1998.pdf).
International Recommendations for Water16
2.5. Water has a number of special properties that make it essential for life, sanitation and many industrial processes. For example, water is a super solvent as it can dissolve many other chemicals, such as salt, sugar and even stone. Because of this property, water is essential for life on Earth because all organisms use water to transport chemicals within their bodies. Water is also used in many industrial processes to dissolve, transport or remove soluble chemicals, and in households water is used for hygiene and sanitation because it can dissolve and remove waste and germs. Water has a high specific heat capacity, which means it is able to absorb a lot more heat than most other chemicals. Water also has a high thermal conductivity, mean-ing it can absorb and release heat very quickly, making it suitable for use as a coolant. The abundance of water in the environment (mainly as salt water in seas and oceans), coupled with its high specific heat capacity and high thermal conductivity, means it is an essential component for the regulation of energy and climate on Earth. Water’s high specific heat capacity also makes it highly suitable for transporting energy, for example, by steam. Water has a high surface tension, allowing it to move into soils, roots and through very small blood vessels in animals. Water has many other physical and chemical properties. Information on these properties is available from the Internet and other sources.23
2. The environment and water
2.6. The environment is the physical surroundings, the living organisms and the interac-tions within and between the physical surroundings and living organisms. The Earth’s envi-ronment is seen by ecology and other physical sciences as comprising four principal spheres:
• The atmosphere: the gaseous layer surrounding the planet• The biosphere: the collection of all living organisms together with the decaying matter
produced by them• The hydrosphere: the water found on and below the planet’s surface in seas and oceans,
lakes, wetlands, rivers, soils, snow and ice and in aquifers (groundwater)• The lithosphere: the upper layer (100 km) and surface of the planet’s solid mass
2.7. These spheres or systems do not exist independently but interact constantly. For example, water vapour in the atmosphere condenses and falls to the ground, where it joins the hydrosphere to nourish plants and animals in the biosphere.24 2.8. The environment can be divided into the natural environment and the built or man-made environment, which includes built-up areas, parks and gardens, farm land, arti-ficial reservoirs, etc. Sometimes it is not easy to make the distinction between natural and man-made environments, and it will be based on the level of human influence exerted on a given environment. 2.9. Within the environment water occurs on the land’s surface in lakes, rivers, artificial reservoirs, snow, ice and glaciers, etc.; below the land’s surface (in groundwater and the soil); in the seas and oceans; in the air (e.g., as clouds); and in living organisms (e.g., in plants and animals). Natural processes create flows of water between inland water resources, the atmosphere, the seas and oceans. The natural processes of water movement are referred to as the hydrological cycle or the water cycle. Figure II.1 shows the main components of the hydrological cycle, which are reflected in the definition, classification and characteristics of the inland water resources; these are described in detail in chapter III and the data items of chapter IV. It should be noted that figure II.1 is not intended to show all components of the hydrological cycle.
23 For more information on water and its properties, see http://ga.water.usgs.gov/edu/waterproperties.html, http://www.physicalgeography.net/fundamentals/8a.html and http://www.uni.edu/~iowawet/H2OProperties.html.
24 Statistics Canada, November 2009, A Framework for Developing Environmental Statistics.
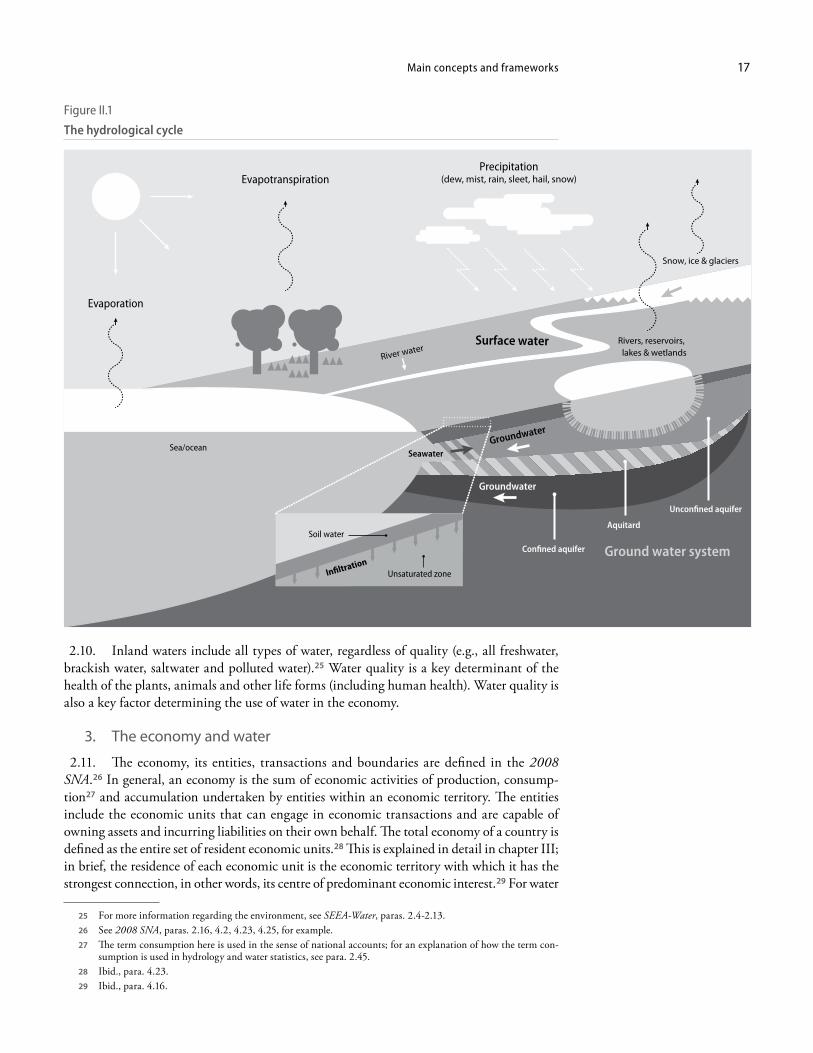
Main concepts and frameworks 17
2.10. Inland waters include all types of water, regardless of quality (e.g., all freshwater, brackish water, saltwater and polluted water).25 Water quality is a key determinant of the health of the plants, animals and other life forms (including human health). Water quality is also a key factor determining the use of water in the economy.
3. The economy and water
2.11. The economy, its entities, transactions and boundaries are defined in the 2008 SNA.26 In general, an economy is the sum of economic activities of production, consump-tion27 and accumulation undertaken by entities within an economic territory. The entities include the economic units that can engage in economic transactions and are capable of owning assets and incurring liabilities on their own behalf. The total economy of a country is defined as the entire set of resident economic units.28 This is explained in detail in chapter III; in brief, the residence of each economic unit is the economic territory with which it has the strongest connection, in other words, its centre of predominant economic interest.29 For water
25 For more information regarding the environment, see SEEA-Water, paras. 2.4-2.13. 26 See 2008 SNA, paras. 2.16, 4.2, 4.23, 4.25, for example. 27 The term consumption here is used in the sense of national accounts; for an explanation of how the term con-
sumption is used in hydrology and water statistics, see para. 2.45. 28 Ibid., para. 4.23. 29 Ibid., para. 4.16.
Figure II.1
The hydrological cycle
Evaporation
Evapotranspiration
Ground water system
Unconfined aquifer
Precipitation(dew, mist, rain, sleet, hail, snow)
Snow, ice & glaciers
River waterRivers, reservoirs,
lakes & wetlands
Sea/oceanGroundwater
Groundwater
Aquitard
Confined aquifer
Soil water
Infiltration
Unsaturated zone
Surface water
Seawater
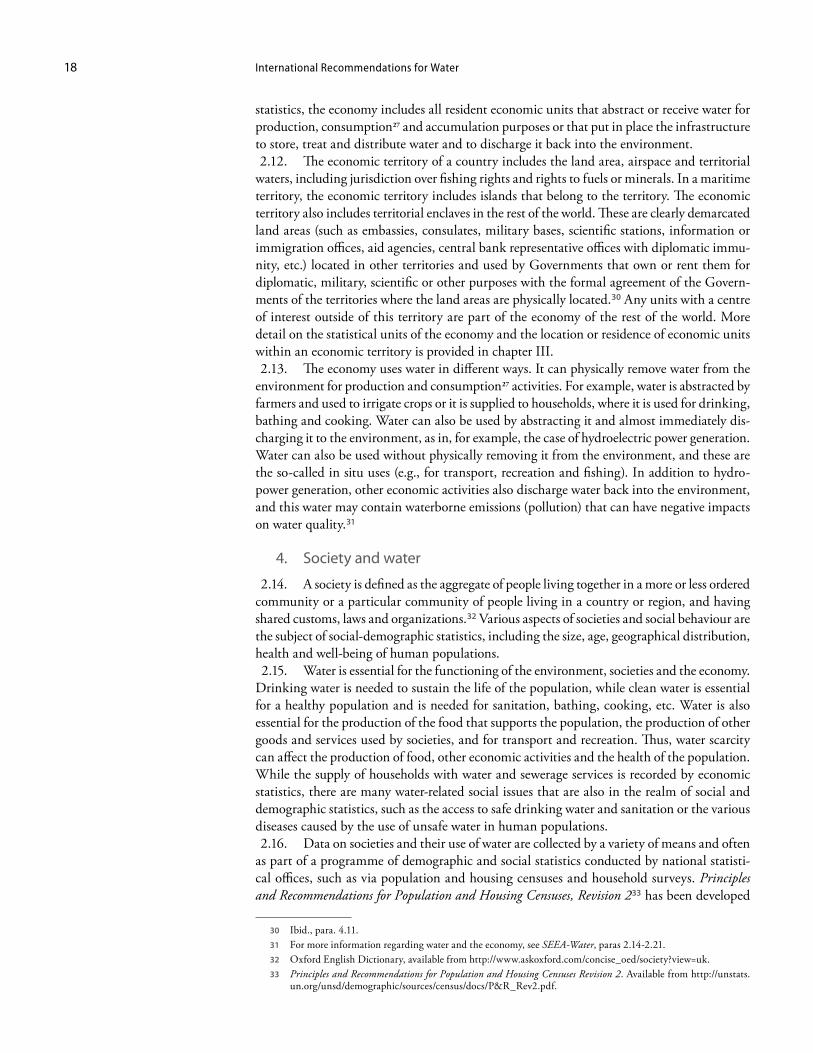
International Recommendations for Water18
statistics, the economy includes all resident economic units that abstract or receive water for production, consumption27 and accumulation purposes or that put in place the infrastructure to store, treat and distribute water and to discharge it back into the environment. 2.12. The economic territory of a country includes the land area, airspace and territorial waters, including jurisdiction over fishing rights and rights to fuels or minerals. In a maritime territory, the economic territory includes islands that belong to the territory. The economic territory also includes territorial enclaves in the rest of the world. These are clearly demarcated land areas (such as embassies, consulates, military bases, scientific stations, information or immigration offices, aid agencies, central bank representative offices with diplomatic immu-nity, etc.) located in other territories and used by Governments that own or rent them for diplomatic, military, scientific or other purposes with the formal agreement of the Govern-ments of the territories where the land areas are physically located.30 Any units with a centre of interest outside of this territory are part of the economy of the rest of the world. More detail on the statistical units of the economy and the location or residence of economic units within an economic territory is provided in chapter III. 2.13. The economy uses water in different ways. It can physically remove water from the environment for production and consumption27 activities. For example, water is abstracted by farmers and used to irrigate crops or it is supplied to households, where it is used for drinking, bathing and cooking. Water can also be used by abstracting it and almost immediately dis-charging it to the environment, as in, for example, the case of hydroelectric power generation. Water can also be used without physically removing it from the environment, and these are the so-called in situ uses (e.g., for transport, recreation and fishing). In addition to hydro-power generation, other economic activities also discharge water back into the environment, and this water may contain waterborne emissions (pollution) that can have negative impacts on water quality.31
4. Society and water
2.14. A society is defined as the aggregate of people living together in a more or less ordered community or a particular community of people living in a country or region, and having shared customs, laws and organizations.32 Various aspects of societies and social behaviour are the subject of social-demographic statistics, including the size, age, geographical distribution, health and well-being of human populations. 2.15. Water is essential for the functioning of the environment, societies and the economy. Drinking water is needed to sustain the life of the population, while clean water is essential for a healthy population and is needed for sanitation, bathing, cooking, etc. Water is also essential for the production of the food that supports the population, the production of other goods and services used by societies, and for transport and recreation. Thus, water scarcity can affect the production of food, other economic activities and the health of the population. While the supply of households with water and sewerage services is recorded by economic statistics, there are many water-related social issues that are also in the realm of social and demographic statistics, such as the access to safe drinking water and sanitation or the various diseases caused by the use of unsafe water in human populations. 2.16. Data on societies and their use of water are collected by a variety of means and often as part of a programme of demographic and social statistics conducted by national statisti-cal offices, such as via population and housing censuses and household surveys. Principles and Recommendations for Population and Housing Censuses, Revision 233 has been developed
30 Ibid., para. 4.11. 31 For more information regarding water and the economy, see SEEA-Water, paras 2.14-2.21. 32 Oxford English Dictionary, available from http://www.askoxford.com/concise_oed/society?view=uk. 33 Principles and Recommendations for Population and Housing Censuses Revision 2. Available from http://unstats.
un.org/unsd/demographic/sources/census/docs/P&R_Rev2.pdf.
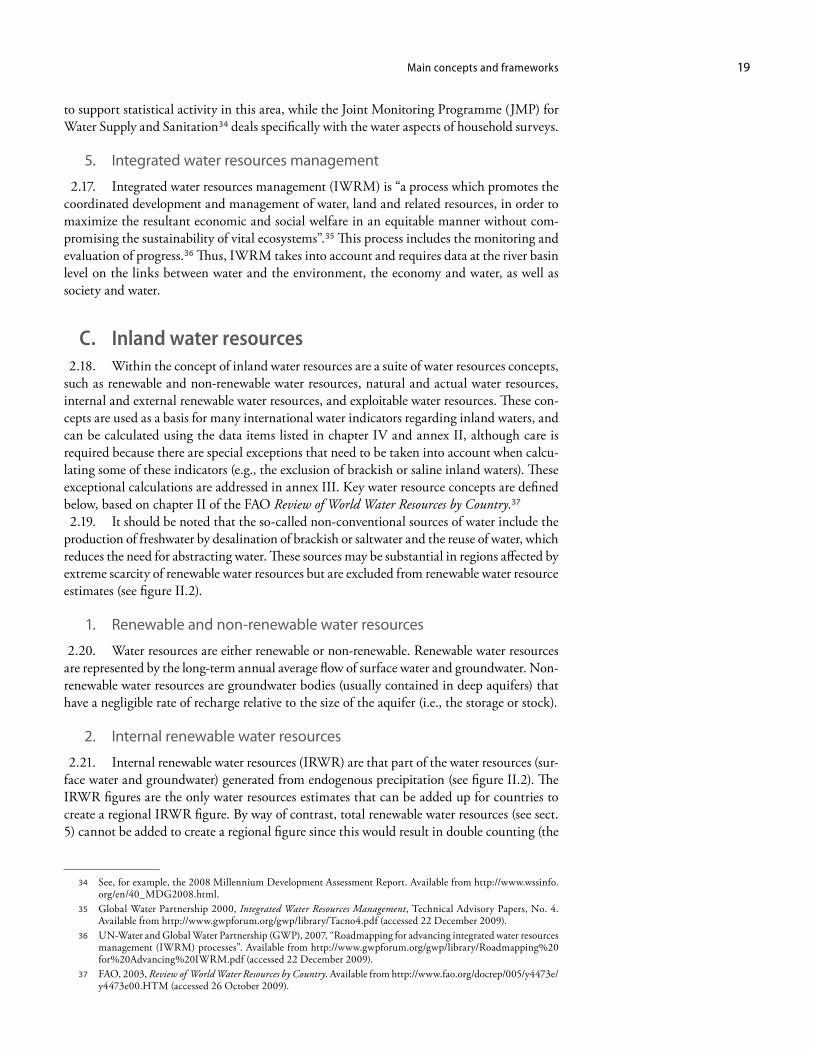
Main concepts and frameworks 19
to support statistical activity in this area, while the Joint Monitoring Programme (JMP) for Water Supply and Sanitation34 deals specifically with the water aspects of household surveys.
5. Integrated water resources management
2.17. Integrated water resources management (IWRM) is “a process which promotes the coordinated development and management of water, land and related resources, in order to maximize the resultant economic and social welfare in an equitable manner without com-promising the sustainability of vital ecosystems”.35 This process includes the monitoring and evaluation of progress.36 Thus, IWRM takes into account and requires data at the river basin level on the links between water and the environment, the economy and water, as well as society and water.
C. Inland water resources 2.18. Within the concept of inland water resources are a suite of water resources concepts, such as renewable and non-renewable water resources, natural and actual water resources, internal and external renewable water resources, and exploitable water resources. These con-cepts are used as a basis for many international water indicators regarding inland waters, and can be calculated using the data items listed in chapter IV and annex II, although care is required because there are special exceptions that need to be taken into account when calcu-lating some of these indicators (e.g., the exclusion of brackish or saline inland waters). These exceptional calculations are addressed in annex III. Key water resource concepts are defined below, based on chapter II of the FAO Review of World Water Resources by Country.37 2.19. It should be noted that the so-called non-conventional sources of water include the production of freshwater by desalination of brackish or saltwater and the reuse of water, which reduces the need for abstracting water. These sources may be substantial in regions affected by extreme scarcity of renewable water resources but are excluded from renewable water resource estimates (see figure II.2).
1. Renewable and non-renewable water resources
2.20. Water resources are either renewable or non-renewable. Renewable water resources are represented by the long-term annual average flow of surface water and groundwater. Non-renewable water resources are groundwater bodies (usually contained in deep aquifers) that have a negligible rate of recharge relative to the size of the aquifer (i.e., the storage or stock).
2. Internal renewable water resources
2.21. Internal renewable water resources (IRWR) are that part of the water resources (sur-face water and groundwater) generated from endogenous precipitation (see figure II.2). The IRWR figures are the only water resources estimates that can be added up for countries to create a regional IRWR figure. By way of contrast, total renewable water resources (see sect. 5) cannot be added to create a regional figure since this would result in double counting (the
34 See, for example, the 2008 Millennium Development Assessment Report. Available from http://www.wssinfo.org/en/40_MDG2008.html.
35 Global Water Partnership 2000, Integrated Water Resources Management, Technical Advisory Papers, No. 4. Available from http://www.gwpforum.org/gwp/library/Tacno4.pdf (accessed 22 December 2009).
36 UN-Water and Global Water Partnership (GWP), 2007, “Roadmapping for advancing integrated water resources management (IWRM) processes”. Available from http://www.gwpforum.org/gwp/library/Roadmapping%20for%20Advancing%20IWRM.pdf (accessed 22 December 2009).
37 FAO, 2003, Review of World Water Resources by Country. Available from http://www.fao.org/docrep/005/y4473e/y4473e00.HTM (accessed 26 October 2009).
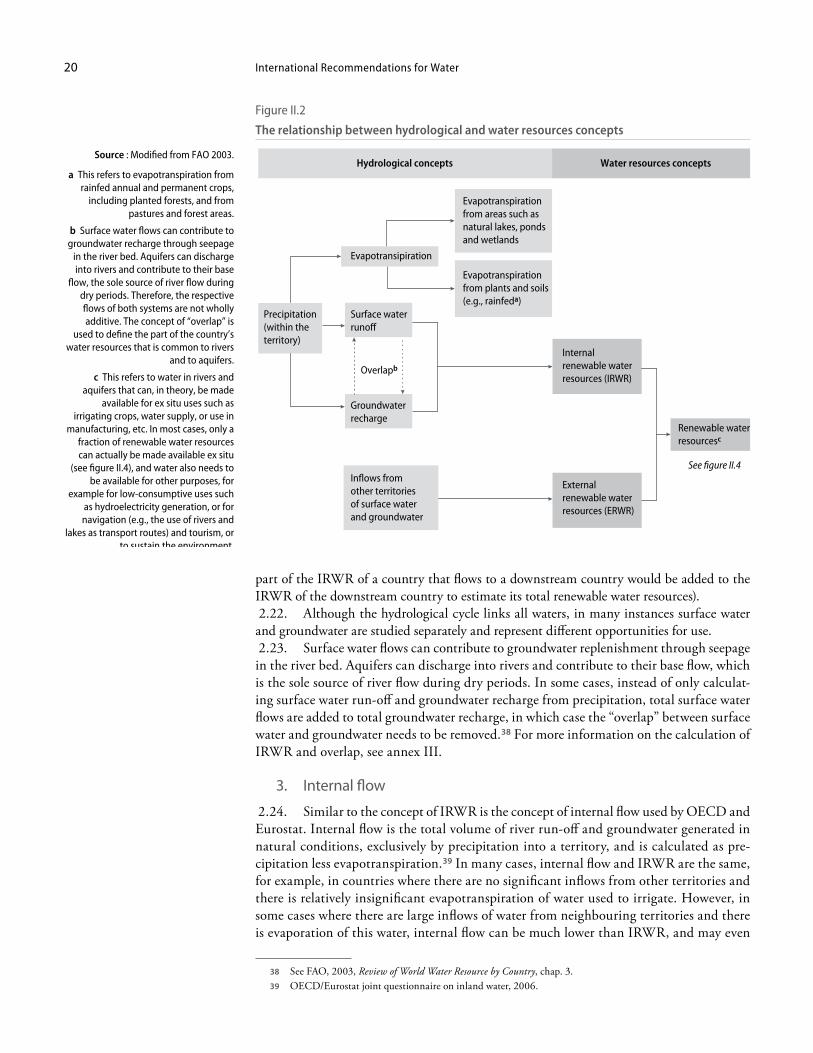
International Recommendations for Water20
part of the IRWR of a country that flows to a downstream country would be added to the IRWR of the downstream country to estimate its total renewable water resources). 2.22. Although the hydrological cycle links all waters, in many instances surface water and groundwater are studied separately and represent different opportunities for use. 2.23. Surface water flows can contribute to groundwater replenishment through seepage in the river bed. Aquifers can discharge into rivers and contribute to their base flow, which is the sole source of river flow during dry periods. In some cases, instead of only calculat-ing surface water run-off and groundwater recharge from precipitation, total surface water flows are added to total groundwater recharge, in which case the “overlap” between surface water and groundwater needs to be removed.38 For more information on the calculation of IRWR and overlap, see annex III.
3. Internal flow
2.24. Similar to the concept of IRWR is the concept of internal flow used by OECD and Eurostat. Internal flow is the total volume of river run-off and groundwater generated in natural conditions, exclusively by precipitation into a territory, and is calculated as pre-cipitation less evapotranspiration.39 In many cases, internal flow and IRWR are the same, for example, in countries where there are no significant inflows from other territories and there is relatively insignificant evapotranspiration of water used to irrigate. However, in some cases where there are large inflows of water from neighbouring territories and there is evaporation of this water, internal flow can be much lower than IRWR, and may even
38 See FAO, 2003, Review of World Water Resource by Country, chap. 3. 39 OECD/Eurostat joint questionnaire on inland water, 2006.
Figure II.2
The relationship between hydrological and water resources concepts
Precipitation(within the territory)
Evapotransipiration
Surface waterrunoff
Evapotranspirationfrom areas such asnatural lakes, pondsand wetlands
Evapotranspirationfrom plants and soils(e.g., rainfeda)
Renewable water resourcesc
See figure II.4
Hydrological concepts Water resources conceptsSource : Modified from FAO 2003.
Groundwaterrecharge
Inflows fromother territoriesof surface waterand groundwater
Internal renewable waterresources (IRWR)
Externalrenewable waterresources (ERWR)
Overlapb
a This refers to evapotranspiration from rainfed annual and permanent crops,
including planted forests, and from pastures and forest areas.
b Surface water flows can contribute to groundwater recharge through seepage
in the river bed. Aquifers can discharge into rivers and contribute to their base
flow, the sole source of river flow during dry periods. Therefore, the respective flows of both systems are not wholly additive. The concept of “overlap” is
used to define the part of the country’s water resources that is common to rivers
and to aquifers.
c This refers to water in rivers and aquifers that can, in theory, be made
available for ex situ uses such as irrigating crops, water supply, or use in
manufacturing, etc. In most cases, only a fraction of renewable water resources can actually be made available ex situ
(see figure II.4), and water also needs to be available for other purposes, for
example for low-consumptive uses such as hydroelectricity generation, or for navigation (e.g., the use of rivers and
lakes as transport routes) and tourism, or to sustain the environment.
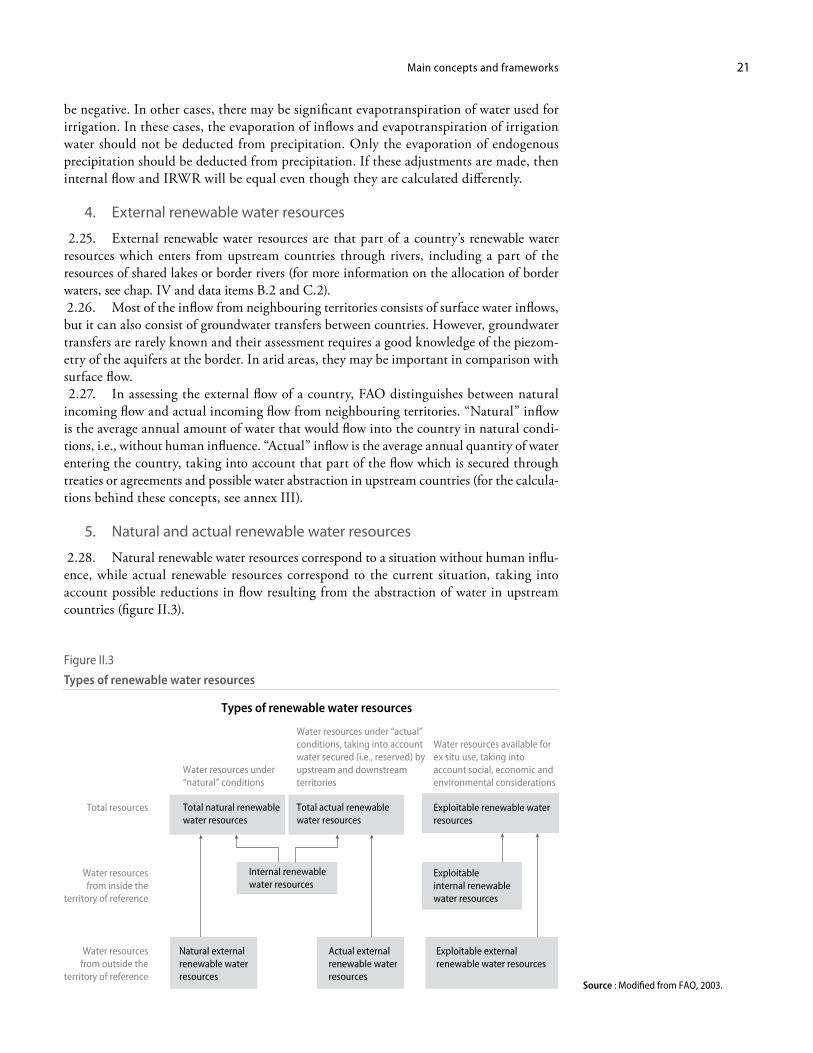
Main concepts and frameworks 21
be negative. In other cases, there may be significant evapotranspiration of water used for irrigation. In these cases, the evaporation of inflows and evapotranspiration of irrigation water should not be deducted from precipitation. Only the evaporation of endogenous precipitation should be deducted from precipitation. If these adjustments are made, then internal flow and IRWR will be equal even though they are calculated differently.
4. External renewable water resources
2.25. External renewable water resources are that part of a country’s renewable water resources which enters from upstream countries through rivers, including a part of the resources of shared lakes or border rivers (for more information on the allocation of border waters, see chap. IV and data items B.2 and C.2). 2.26. Most of the inflow from neighbouring territories consists of surface water inflows, but it can also consist of groundwater transfers between countries. However, groundwater transfers are rarely known and their assessment requires a good knowledge of the piezom-etry of the aquifers at the border. In arid areas, they may be important in comparison with surface flow. 2.27. In assessing the external flow of a country, FAO distinguishes between natural incoming flow and actual incoming flow from neighbouring territories. “Natural” inflow is the average annual amount of water that would flow into the country in natural condi-tions, i.e., without human influence. “Actual” inflow is the average annual quantity of water entering the country, taking into account that part of the flow which is secured through treaties or agreements and possible water abstraction in upstream countries (for the calcula-tions behind these concepts, see annex III).
5. Natural and actual renewable water resources
2.28. Natural renewable water resources correspond to a situation without human influ-ence, while actual renewable resources correspond to the current situation, taking into account possible reductions in flow resulting from the abstraction of water in upstream countries (figure II.3).
Figure II.3
Types of renewable water resources
Actual external renewable waterresources
Total actual renewablewater resources
Natural external renewable waterresources
Total natural renewablewater resources
Internal renewable water resources
Exploitable renewable water resources
Water resourcesfrom outside the
territory of reference
Water resourcesfrom inside the
territory of reference
Total resources
Types of renewable water resources
Exploitable internal renewablewater resources
Exploitable external renewable water resources
Source : Modified from FAO, 2003.
Water resources available for ex situ use, taking into account social, economic and environmental considerations
Water resources under “actual” conditions, taking into account water secured (i.e., reserved) by upstream and downstream territories
Water resources under “natural” conditions
International Recommendations for Water22
2.29. Natural renewable water resources are the total of a country’s IRWR and natural external renewable water resources (ERWR), including both surface water and groundwater generated annually, calculated as a long-term annual average. 2.30. Actual renewable water resources are the sum of IRWR and ERWR, taking into consideration the quantity of flow reserved to upstream and downstream countries through formal agreements (e.g., treaties) and possible reduction of external flow due to upstream water abstraction. Unlike natural renewable water resources, actual renewable water resources vary with time and water use patterns.
6. Exploitable water resources
2.31. Exploitable water resources are that part of the renewable water resources which is accessible for use (i.e., can be abstracted). These are sometimes referred to as manageable water resources or the water development potential. To determine the quantity of exploitable water resources, many factors have to be considered, such as the economic and environmental fea-sibility of storing floodwater behind dams or extracting groundwater; the physical possibility of catching water which naturally flows out to the sea; and the minimum flow requirements for navigation, environmental services, aquatic life, etc. 2.32. The volume of exploitable water resources varies according to:
(a) The natural conditions that may affect the development of water resources (regu-larity of the water regime, fragmentation of the hydrographic or hydrogeological systems, convenience of the sites for dams and water quality);
(b) The importance of demand for water, which will determine the acceptability of internal and external costs of water development and management;
(c) The allocation of, and arbitration between, competing in situ and ex situ uses (e.g., for transport versus irrigation).
It is important to note that flow conditions and other factors affect how much water is exploit-able. Regular flows of surface water (i.e., baseflow) and groundwater are generally exploitable, depending on such factors as how much surface water baseflow is evaporated and how much water is required to maintain minimal flow into the sea. Irregular flows of surface water con-sist of extreme irregular flows, which cannot be used, and potentially manageable irregular flows. How much of this water can be managed and used depends on such factors as artificial reservoir capacities, the variability of inflows to reservoirs, the quantity of water evaporated from artificial reservoirs and lakes, how much surface water run-off can be used directly, and what capacity there is for artificial recharge of aquifers. 2.33. In general, exploitable resources are significantly smaller than the total precipitation or run-off. Preferably, national data on exploitable water resources should include an indica-tion of the set of criteria considered, because this is important metadata (for information on metadata, see chap. VII). What is included and excluded in exploitable resources depends on the choice of a set of criteria (physical, socio-economic, environmental, etc.). What is included and excluded from exploitable resources varies from country to country and can change with time according to changes in national legislation or available technology. As such, exploitable water resources is an estimate of the renewable resources available for use in a given situation and period (i.e., expressed as volume per year).
7. Links between water resources and water accounts
2.34. Inland waters can be measured, using a systems approach, as stocks and flows as described in SEEA-Water. For renewable water resources, the physical quantity of the resource is expressed as a flow over time, e.g., the long-term annual average flow in millions of cubic metres per year, while for non-renewable water resources the resource is expressed as a physi-
Main concepts and frameworks 23
cal stock, e.g., millions of cubic metres of fossil groundwater.40 Inland water resources and the water abstracted from them have values which in principle can be measured in monetary units as stocks or flows. The SEEA-Water framework is elaborated in section D.
D. System of Environmental-Economic Accounting for Water
2.35. The SEEA-Water framework provides an integrated information system to study the interactions between the environment and the economy, thus supporting IWRM and other analyses. An overview of the SEEA-Water framework is presented in figure II.4, which provides a simplified presentation of the economy, the system of water resources and their interactions. The economy and the inland water resource system of a territory—or the “ter-ritory of reference”—are represented in figure II.4 as two separate boxes. The inland water resource system of a territory is composed of all water resources in the territory (surface water, groundwater and soil water) and the natural flows between them. The economy of a territory consists of resident water users who abstract water for production and consumption purposes; put in place the infrastructure to store, treat, distribute and discharge water; and discharge water back into the environment. 2.36. SEEA-Water covers the stocks and flows associated with water. Stocks can be within the environment or within the economy, while flows of water can be within the environment, within the economy, and between the environment and the economy. 2.37. By convention, water contained in artificial reservoirs and artificial channels are con-sidered part of inland water resources (i.e., the environment) rather than part of the economy. In many instances, natural watercourses have been modified and the distinction between what is natural and artificial is less important than the fact that these are surface water resources.
1. Stocks (assets)
2.38. Stocks are the quantity of a particular product or natural resource at a point in time. Stocks are identified in both economic and environment statistics, although the terminology varies depending on the context, and they can be measured in physical and monetary terms. Physical stocks of water may also have different levels of water quality. Assets are usually asso-ciated with stocks that have economic values, and in the SNA stocks are recorded in balance sheets in monetary terms for non-financial assets (produced and non-produced), financial assets and liabilities. In SEEA-Water, stocks are recorded in the asset accounts in physical terms (i.e., volume of water). 2.39. Stocks are measured at a point in time—and preferably at more than one point in time, such as the beginning and end of a year. The stocks at the beginning of a time period are called the opening stocks and those at the end of a period are called closing stocks. The dif-ference between opening and closing stocks is the result of flows (additions and subtractions) to the stocks. Stocks are typically measured on 31 December, i.e., at the end of the period (see also temporal references in sect. E). Stocks and flows are represented in figure II.5, and in this example a stock of 100 units exists at time 1 (31 December 2007) and a stock of 110 units at time 2 (31 December 2008). The difference of 10 is due to inflows of 30 and outflows of 20 over the period. 2.40. Water stocks (or assets) are classified by SEEA-Water as surface water, groundwater and soil water. Surface water is further disaggregated into artificial reservoirs, lakes, riv-ers, snow, ice and glaciers, etc. This classification is described in more detail in chapter III.
40 See FAO, “Non-renewable water resources”. Available from http://www.fao.org/nr/water/aquastat/data/glossary/search.html?termId=7314&submitBtn=s&cls=yes (accessed 22 October 2009).
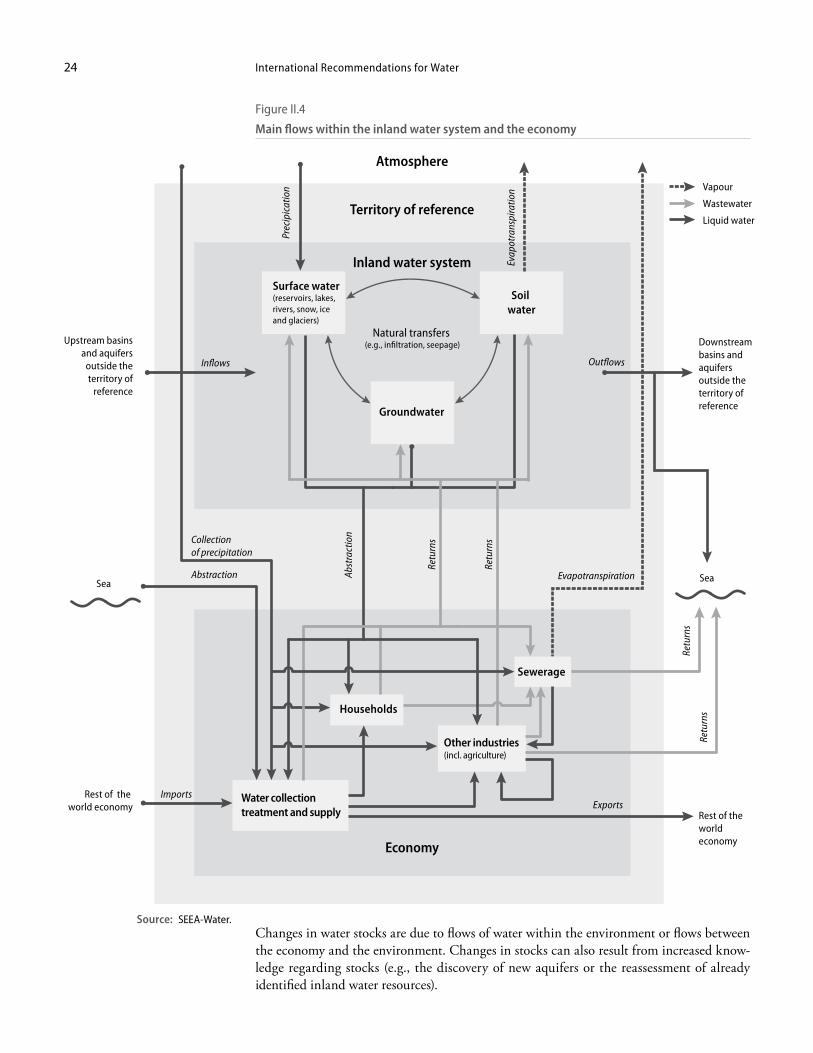
International Recommendations for Water24
Changes in water stocks are due to flows of water within the environment or flows between the economy and the environment. Changes in stocks can also result from increased know-ledge regarding stocks (e.g., the discovery of new aquifers or the reassessment of already identified inland water resources).
Figure II.4
Main flows within the inland water system and the economy
Other industries (incl. agriculture)
ImportsExports
Abstraction Sea
Atmosphere
Collection of precipitation
Households
Abst
ract
ion
Water collection treatment and supply
Natural transfers (e.g., infiltration, seepage)
Sea
Outflows
Evap
otra
nspi
ratio
n
Prec
ipic
atio
n
Evapotranspiration
Sewerage
Rest of the world economy
Rest of the world economy
Territory of reference
Retu
rns
Retu
rns
Retu
rns
Retu
rns
Upstream basins and aquifers
outside the territory of
reference
Downstream basins and aquifers outside the territory of reference
Surface water (reservoirs, lakes, rivers, snow, ice and glaciers)
Soil water
Inflows
Inland water system
Economy
Groundwater
Vapour
Wastewater
Liquid water
Source: SEEA-Water.
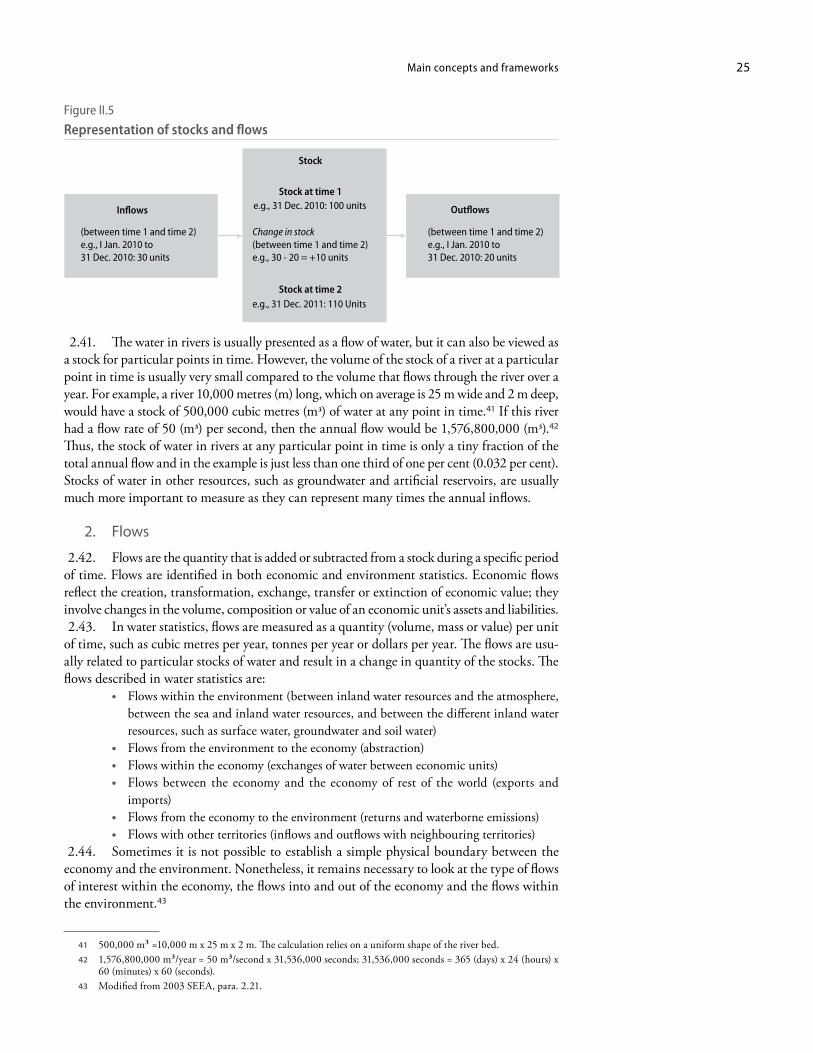
Main concepts and frameworks 25
2.41. The water in rivers is usually presented as a flow of water, but it can also be viewed as a stock for particular points in time. However, the volume of the stock of a river at a particular point in time is usually very small compared to the volume that flows through the river over a year. For example, a river 10,000 metres (m) long, which on average is 25 m wide and 2 m deep, would have a stock of 500,000 cubic metres (m3) of water at any point in time.41 If this river had a flow rate of 50 (m3) per second, then the annual flow would be 1,576,800,000 (m3).42 Thus, the stock of water in rivers at any particular point in time is only a tiny fraction of the total annual flow and in the example is just less than one third of one per cent (0.032 per cent). Stocks of water in other resources, such as groundwater and artificial reservoirs, are usually much more important to measure as they can represent many times the annual inflows.
2. Flows
2.42. Flows are the quantity that is added or subtracted from a stock during a specific period of time. Flows are identified in both economic and environment statistics. Economic flows reflect the creation, transformation, exchange, transfer or extinction of economic value; they involve changes in the volume, composition or value of an economic unit’s assets and liabilities. 2.43. In water statistics, flows are measured as a quantity (volume, mass or value) per unit of time, such as cubic metres per year, tonnes per year or dollars per year. The flows are usu-ally related to particular stocks of water and result in a change in quantity of the stocks. The flows described in water statistics are:
• Flows within the environment (between inland water resources and the atmosphere, between the sea and inland water resources, and between the different inland water resources, such as surface water, groundwater and soil water)
• Flows from the environment to the economy (abstraction)• Flows within the economy (exchanges of water between economic units)• Flows between the economy and the economy of rest of the world (exports and
imports)• Flows from the economy to the environment (returns and waterborne emissions)• Flows with other territories (inflows and outflows with neighbouring territories)
2.44. Sometimes it is not possible to establish a simple physical boundary between the economy and the environment. Nonetheless, it remains necessary to look at the type of flows of interest within the economy, the flows into and out of the economy and the flows within the environment.43
41 500,000 m3 =10,000 m x 25 m x 2 m. The calculation relies on a uniform shape of the river bed. 42 1,576,800,000 m3/year = 50 m3/second x 31,536,000 seconds; 31,536,000 seconds = 365 (days) x 24 (hours) x
60 (minutes) x 60 (seconds). 43 Modified from 2003 SEEA, para. 2.21.
Figure II.5
Representation of stocks and flows
Stock
Stock at time 1
Stock at time 2
e.g., 31 Dec. 2010: 100 units
e.g., 31 Dec. 2011: 110 Units
Change in stock(between time 1 and time 2)e.g., 30 - 20 = +10 units
Inflows Outflows
(between time 1 and time 2)e.g., I Jan. 2010 to 31 Dec. 2010: 30 units
(between time 1 and time 2)e.g., I Jan. 2010 to 31 Dec. 2010: 20 units
International Recommendations for Water26
3. Water consumption
2.45. The concept of consumption in water statistics and accounts differs from that of the SNA. In water statistics and accounts, the concept of water consumption gives an indication of the amount of water that is lost by the economy during use in the sense that it has entered the economy but has not returned either to water resources or to the sea. This happens because during use, part of the water is incorporated into products, evaporated, transpired by plants or simply consumed by households or livestock. It can be computed for each economic unit and for the whole economy (for links between data items and SEEA-Water, see annex IV). The concept of water consumption used in SEEA-Water is consistent with the hydrological concept. It differs, however, from the concept of consumption used in national accounts, which instead refers to water use.44
E. Spatial and temporal (time) references 1. Spatial references
2.46. Water statistics can provide data for water management at many geographic levels, from the local, to the river basin to the national and multinational levels. The choice of the spatial reference for the compilation of water statistics ultimately depends on the data needed by users (e.g., decision makers, analysts and researchers) and the resources available to data producers. 2.47. In general, four types of spatial boundaries are used in water statistics:
• Physical boundaries:• River basins and other surface water boundaries, such as sub-basins, drainage
basins and water catchments • Aquifers and other subsurface boundaries, including aquifer beds, complex
aquifer-aquitard systems, groundwater provinces and groundwater regions• Administrative regions • Service areas• Accounting catchments
2.48. Physical boundaries, in the form of river basins or aquifers, are fundamental to the hydrological cycle. These physical boundaries can span large areas and countries. Aquifers are below-ground reservoirs of water, while a river basin is an area having a common outlet for its surface run-off.45 River basins vary in size, depending on the common water body of interest, and large river basins may contain smaller sub-basins (or catchments). River basins are fundamental to understanding surface water resources because the water suppliers and users within a river basin directly affect the availability of water. In addition, water can flow naturally between river basins, or can be imported and exported by economic units located in different river basins but within the same country. 2.49. It is internationally recognized that a river basin is the most appropriate spatial ref-erence for IWRM (e.g., Agenda 21;46 and European Water Framework Directive, 200047). This is because the people and economic activities within a river basin will have an impact on the quantity and quality of water in the basin, and conversely the water available in a basin will affect the people and economic activities that rely on this water. Thus, river basins
44 Modified from SEEA-Water, para. 3.44. 45 UNESCO/WMO, International Glossary of Hydrology, 2nd ed., 1992. 46 Report of the United Nations Conference on Environment and Development, loc. cit. 47 Directive 2000/60/EC of the European Parliament and of the Council of 23 October 2000 establishing a frame-
work for Community action in the field of water policy. Available from http://eur-lex.europa.eu/LexUriServ/LexUriServ.do?uri=CELEX:32000L0060:EN:NOT.
Main concepts and frameworks 27
are suggested for the compilation of water statistics.48 However, in areas where groundwater is an important source of water, aquifers may also be appropriate spatial references for the compilation of water statistics. 2.50. An administrative region is a geographic area usually corresponding to a level of government (e.g., local, state/provincial or national). Since administrative regions are usually responsible for planning and economic policies within their jurisdiction, different regions are likely to have different laws, regulations, institutional arrangements and management practices relating to water. 2.51. Water suppliers or sewerage service providers, which may be government or non-government, will often have service areas that are related to the physical infrastructure which they own or operate to supply water or sewerage services. 2.52. Accounting catchments are defined in SEEA-Water because, depending on the char-acteristics of the administrative regions and river basins in a country, especially where there is a mismatch of boundaries, it may be useful to define regions for the compilation of water statistics and accounts for which both economic and physical data are more easily available. Such regions are statistical constructs or hybrids of administrative regions and river basins. Accounting catchments are used to provide the best possible match of economic, environmen-tal and social data, and they use a variety of spatial references. They are usually large enough that economic information is available.49 2.53. In practice, an accounting catchment is an administrative region, composed of all or parts of several river basins or a river basin composed of all or parts of several administra-tive regions.50 Usually, whole administrative regions are added together to form the nearest approximation of a river basin or vice versa.51 In defining accounting catchments, it is neces-sary to compare river basins and administrative boundaries to determine the best possible match based on practical considerations of data availability and data collection. Over time, the use of accounting catchments should lead to improvements in data collection and availability. 2.54. Each administrative region, river basin, service area or accounting catchment used for water statistics should have a unique identification code and name. If more than one spatial reference is used, then there should be more than one identification coding system and the codes used should be distinct. When the relevant boundaries are available electroni-cally, a geographical information system (GIS) can help clarify boundary issues related to water statistics.
2. Temporal (time) references
2.55. When integrating or collecting water data, it is important that the reference periods for the different data items be aligned. In water and economic statistics, the calendar year is the recommended temporal reference. However, in practice, water and economic data may not be available for calendar years. For example, for national accounts, many countries use a financial year, while for water statistics, they may use a hydrological year. A hydrological year is a 12-month period such that the overall changes in storage are minimal and carryover is reduced to a minimum.52 Financial and hydrological years may be the same as or different from calendar years.
48 An example of this in practice is Statistics Canada’s Standard Drainage Area Classification (SDAC) 2003. Available from http://www.statcan.gc.ca/subjects-sujets/standard-norme/sdac-ctad/sdac-ctad-eng.htm (accessed 20 December 2009).
49 SEEA-Water, para. 2.90 (available from http://unstats.un.org/unsd/envaccounting/SEEA-WaterDraftManual.pdf).
50 After SEEA-Water, para. 2.90. 51 See Edens and others, 2007, “Regional water accounts and the transformation of spatial data” (http://unstats.
un.org/unsd/envaccounting/londongroup/meeting11/LG11_SSWA_2a.pdf). 52 UNESCO/WMO, International Glossary of Hydrology, 2nd ed., 1992.
International Recommendations for Water28
2.56. It is generally recommended that annual water statistics be developed for the time period used in the national accounts, which in SNA is recommended to be the calendar year. This allows direct temporal comparability between the economic and environmental aspects of water statistics. 2.57. Annual water statistics will often hide seasonal variability in data, which in many cases is important to understand for water management purposes. Some water statistics, such as precipitation and other meteorological and hydrological data, are compiled more frequently (e.g., daily, weekly or monthly) to address these needs. However, while subannual data for aggregate water statistics would be ideal for the analysis of intra-annual variations, they are very resource-intensive to collect and, for the time being, are not considered feasible in many countries. For some water statistics, such as those on renewable water resources, long-term annual averages are the most appropriate temporal references.53 The temporal references for particular data items should be addressed in a data-collection strategy (see chap. V). 2.58. In social and demographic statistics, a range of reference periods are used. For cen-suses of population and housing, the reference period is usually a particular day of a particular year. This is referred to as the census day, although some censuses may take place over longer periods. Other household surveys may refer to a particular point in time or to other reference periods (e.g., a month or a year).
53 For example, a long-term annual average of 20 years is used in the OECD/Eurostat joint questionnaire on the state of the environment, section on inland waters, and by the United Nations Statistics Division/UNEP ques-tionnaire on the environment, section on water. FAO Aquastat uses a 30-year long-term annual average for the measurement of precipitation in countries.
29
Chapter III
Statistical units and classifications
A. Introduction 3.1. The purpose of chapter III is to address the definition and classification of statisti-cal units as they relate to the collection, compilation, analysis and dissemination of water statistics. A statistical unit is the entity about which information is sought and for which statistics are ultimately compiled.54 It is the unit at the base of statistical aggregates and to which tabulated data refer. 3.2. The determination of the statistical units of statistics on water in the environment, water in the economy and their interactions will help to:
• Define in more detail the components of the hydrological system and the economy about which data are compiled or from which data are collected
• Describe the main classifications of statistical units relevant to water statistics and provide recommendations on classification specific to water statistics
• Define the main characteristics of statistical units so that survey frames and the related statistical infrastructure needed for water statistics can be constructed or exist-ing infrastructure adapted
• Understand the classifications of statistical units for the disaggregation of the data items of chapter IV
3.3. The statistical unit may be an observation unit in which information is received and statistics are compiled or an analytical unit which statisticians create by splitting or combin-ing observation units with the help of estimations and imputations in order to supply more detailed and/or homogeneous data. A reporting unit is the entity from which the recom-mended data items are collected. 3.4. Section B addresses the statistical units of the environment, defines them for statis-tics on the hydrological system and introduces the classification of inland water resources. Section C presents the statistical units of the economy, including the description of enter-prises, establishments and households and the concept of residence. Section D addresses the classification of establishments to industries, and in so doing introduces ISIC, Revision 4, and CPC, Version 2, and the industries and products of particular importance for water statistics. Section E presents the characteristics that are recommended to be recorded for the statistical units.
B. Statistical units of the environment 3.5. The statistical units of the environment are the parts of the environment about which information is collected and statistics are compiled. In the case of water in the environment,
54 See United Nations Statistics Division, October 2007, “Statistical units”, para. 14 (http://unstats.un.org/unsd/isdts/docs/StatisticalUnits.pdf).
International Recommendations for Water30
these units are the inland water resources or water bodies (the areas or spaces that contain the water). The statistical units of the environment (in particular the hydrological system) may be observation units or analytical units but not reporting units. For example, a lake can be a statistical unit but any information about the lake will have to be reported by a unit of the economy that owns, manages or monitors the lake or any part thereof. 3.6. Each of the inland water resources has a range of complex and interrelated character-istics. For example, a river consists of the water flowing through the river, the riverbed, river-bank, the primary channel and maybe a series of secondary channels. The river also provides a habitat for living organisms (e.g., plants and animals) in the water or along the riverbed. In addition, the water in the river may also provide goods and services to the economy, such as water for irrigation, or serve as a transport route or a sink for emissions. A river, a riverbed or a riverbank may be owned or owned in part by different economic units. A river may also define administrative boundaries, such as national borders. 3.7. For the purposes of IRWS, the statistical units of the environment for inland waters are classified as surface water bodies (including artificial reservoirs) and aquifers, with a number of divisions below these levels. For example, a river may be divided into stretches or segments and a large lake may be divided into parts. The data items in chapter IV cover flows between environmental units and flows between environmental units and economic units. For IWRM and other purposes, information may be collected and com-piled regarding river basins or sub-basins (for example, resident population, land cover, land use or economic activities in these areas) and therefore such river basins and sub-basins may constitute statistical units.55 Water is also contained in soils and although they are also part of water resources, it is not necessary to include soil as a statistical unit for the purposes of water statistics.56
1. Surface water bodies
3.8. Surface water is contained in:• Lakes: depressions in the Earth’s surface occupied by bodies of standing water; lakes
generally contain large bodies of standing water but also include small and shallow water bodies, such as ponds and lagoons
• Rivers and streams: channels where water flows continuously or periodically• Wetlands: areas of marsh, fen, peatland, swamp or shallow water that are perma-
nently, intermittently or seasonally saturated with water • Glaciers: accumulation of ice of atmospheric origin, generally moving slowly on land
over a long period, including ice sheets, ice caps, ice fields, mountain glaciers, valley glaciers and cirque glaciers.57
• Snow and ice: areas where seasonal or permanent layers of snow and ice form on the ground surface
• Artificial reservoirs: man-made reservoirs used for storage, regulation and control of water resources
55 For example: Statistics Canada has a classification of such areas called the Standard Drainage Area Clas-sification (SDAC) 2003, available from http://www.statcan.gc.ca/subjects-sujets/standard-norme/sdac-ctad/sdac-ctad-eng.htm (accessed 21 December 2009); and the European Union has an Infrastruc-ture for Spatial Information in the European Community (INSPIRE), which includes river basins and sub-basins, along with rivers, etc., as hydrographic elements, available from http://inspire.jrc.ec.europa.eu/ reports/ImplementingRules/DataSpecifications/D2.3_Definition_of_Annex_Themes_and_scope_v3.0.pdf (accessed 21 December 2009).
56 Soils can be a relevant statistical unit for the environment where monthly data are available, for example, for agricultural areas; such data are often unavailable or difficult to collect and compile over large areas.
57 For an extensive list of types of glaciers, see the National Snow and Ice Data Center website. Available from http://nsidc.org/glaciers/questions/types.html (accessed 19 May 2009).
Statistical units and classifications 31
3.9. Artificial reservoirs represent a special case because their placement as a unit of the economy or the environment is the subject of an ongoing discussion. The issue is addressed in a paper of the London Group58 and is identified in SEEA-Water:
All water resource assets (. . .) are considered in the SEEA-Water as non-produced assets, that is, they are “non-financial assets that come into existence other than through processes of production” (para. 10.6, 1993 SNA). It could be argued, how-ever, that water contained in artificial reservoirs comes into existence through a production process: a dam has to be built, and, once the dam is in place, activities of operation and management of the dam that regulate the stock level of the water have to be exercised on a continuous and regular basis. The discussion on whether to consider water in a reservoir as a produced asset has not yet concluded. For this reason, the SEEA-Water has retained the classification of the SEEA-2003.59
3.10. The present situation is that while the wall of the reservoir (or dam wall) is part of the economy, the water behind it is not. Until the matter is resolved, it is recommended that artificial reservoirs be identified separately from other surface water resources, and countries may choose to adopt a presentation of data items that does not show artificial reservoirs as part of the environment.
2. Aquifers
3.11. Aquifers are underground zones that contain sufficient saturated permeable material to yield significant quantities of water to wells and springs. It is important to note that aquifers receive water from surface water bodies and precipitation that infiltrates into the ground, and from other parts of the groundwater system, such as aquitards.60 For the purposes of water statistics, only the groundwater in aquifers is measured because only that water can be used. Thus, aquifers are statistical units of the environment. Aquifers may be classified according to depth (e.g., shallow or deep) or as being unconfined or confined, as follows:61
• Unconfined aquifer: An unconfined aquifer, also known as a water table aquifer, is bounded below by an aquitard and has no overlying confining layer. Its upper bound-ary is the water level, which rises and falls freely. The water in a well penetrating an unconfined aquifer, which is at atmospheric pressure, does not rise above the water table.
• Confined aquifer: A confined aquifer is bounded above and below by an aquitard. The groundwater pressure is usually higher than the atmospheric pressure and if a well is drilled into the aquifer, the water level may rise above the top of the aquifer.
• In addition to confined aquifers there are semi-confined aquifers (so called leaky aquifers) that are bound above and below by aquitards that are either thin or absent in places, allowing leakage of water from surrounding aquifers or infiltration from surface water or precipitation. As in a confined aquifer, the groundwater pressure is usually higher than the atmospheric pressure.
3. Soil water
3.12. Water can be contained in the soil. Soil water is defined as water suspended in the uppermost belt of soil or in the zone of aeration near the ground surface that can be dis-
58 Water in artificial reservoirs: a produced asset? Available from http://unstats.un.org/unsd/envaccounting/ londongroup/meeting14/LG14_13a.pdf (accessed 22 June 2009).
59 SEEA-Water, para. 6.23. 60 An aquitard is a geological unit that is relatively impermeable over a short time frame. The unit may be perme-
able enough to transmit water in significant quantities when viewed over large areas and long periods, but the hydraulic conductivity of an aquitard is low enough to typically act as a “floor” for the groundwater table (FAO Aquastat glossary, available from http://www.fao.org/nr/water/aquastat/data/glossary/search.html (accessed 23 June 2009).
61 For the definition of unconfined and confined aquifers, see FAO Aquastat glossary, available from http://www.fao.org/nr/water/aquastat/data/glossary/search.html (accessed 23 June 2009).
International Recommendations for Water32
charged into the atmosphere by evaporation of soil water and transpiration from plants that take up soil water. When this water is used in agriculture production (i.e., plant evapotran-spiration in rain-fed agriculture) it is sometimes termed green water. 3.13. The soil containing water and the area it occupies could be considered a statistical unit of the environment but this is not necessary for IRWS.56
4. Problems of classification
3.14. It is important to note that it is sometimes difficult to classify or find the exact boundary between different water resources, such as where a lake ends and a river begins, where a river ends and an artificial reservoir begins or where a river ends and the sea begins. In practice, the units for inland waters need to be classified on the best information available, which may require some subjective judgement. 3.15. It is important to recognize that the classification of units is exclusive. That particu-lar unit must be either a lake or wetland—it cannot be both. 3.16. The classification of wetlands is a particularly difficult task. The definition of wet-lands provided is based on that of the Ramsar Convention on Wetlands. However, for the purposes of water statistics it has been modified, since the Convention takes a very broad approach in defining wetlands. Article 1.1 of the Convention states:
For the purpose of this Convention wetlands are areas of marsh, fen, peatland or water, whether natural or artificial, permanent or temporary, with water that is static or flowing, fresh, brackish or salt, including areas of marine water the depth of which at low tide does not exceed six metres.
3.17. Wetlands are further described in the Ramsar Convention Manual 200662 as:Areas where water is the primary factor controlling the environment and the associ-ated plant and animal life. They occur where the water table is at or near the surface of the land, or where the land is covered by shallow water.
3.18. Thus, the Ramsar definition of wetlands cuts across other definitions of water resources. That is, under the Ramsar definition, artificial reservoirs, lakes and ponds, rivers and streams could all be defined as wetlands. Also, the Ramsar definition includes marine areas outside the scope of IRWS, as in the classification of wetlands developed to support the Convention. 3.19. It is recommended that, for the purposes of IRWS, countries base the categorization of wetlands on water depth, and that areas of shallow water or permanently or temporary saturated soils be identified as wetlands, as indicated in the Ramsar Manual. Countries can record the classification of a particular water resource under the Ramsar Convention as one of the characteristics of statistical units (see sect. D). 3.20. Each of the environmental units for inland waters has a range of characteristics (see sect. D) and data items in chapter IV that are associated with them (i.e., data items A-E), such as the volume of water at a particular point in time held in artificial reservoirs (see chap. IV, data item A.1.1).
C. Statistical units of the economy 3.21. The information on the statistical units of the economy is drawn from the 2008 SNA63 and the IRIS.64
62 Ramsar Convention Secretariat, 2006, The Ramsar Convention Manual: a guide to the Convention on Wetlands (Ramsar, Islamic Republic of Iran, 1971), 4th ed. Ramsar Convention Secretariat, Gland, Switzerland. Available from http://www.ramsar.org/lib/lib_manual2006e.htm#cap1 (accessed 19 May 2009).
63 2008 SNA, available from http://unstats.un.org/unsd/sna1993/draftingPhase/WC-SNAvolume1.pdf. 64 United Nations Statistics Division, February 2008, International Recommendations for Industrial Statistics.
Available from http://unstats.un.org/unsd/statcom/doc08/BG-IndustrialStats.pdf.
Statistical units and classifications 33
3.22. It is essential to understand and define the statistical units of the economy as they interact with water. The economy abstracts water from the environment. Water is exchanged and used within the economy and discharged into the environment. The statistical units of the economy about which information is sought (e.g., how much water they abstract from the environment) and from which this information may be collected (e.g., via survey) are the establishments and households. These are referred to as economic units in IRWS (e.g., in the definition of data items). Economic units are units which can also report information about environment units.
1. Enterprises and establishments
3.23. An enterprise is an economic unit in its capacity as a producer of goods and services. An enterprise may operate one or more establishments, and may produce a variety of goods and services.65 In the course of the production, other goods and services will be consumed. The goods and services produced and consumed include water and sewerage services (for more information on these goods and services and CPC, Ver. 2, which is used to classify them, see paras. 3.24-3.71). 3.24. An establishment is an enterprise or part of an enterprise that is situated in a single location and in which (a) only a single (non-ancillary) productive activity is carried out or (b) the principal productive activity accounts for most of the value added.66 Establishments are also known as local kind-of-activity units (local KAUs).67 Establishments are classified to industries using ISIC, Rev. 4, on the basis of their principal productive activity (see sect. C). Establishments also include government (i.e., a government office is an establishment). 3.25. Since establishments have a single location, economic activities can be linked to specific locations and placed within river basins or administrative areas (see chap. II, sect. D). It is important to distinguish establishments within enterprises when an enterprise has more than one establishment, especially when establishments are involved in different pro-ductive activities, or when they have the same productive activities but are located in differ-ent river basins or administrative areas. For example, if an enterprise that is engaged in the making and selling of clothes consists of three establishments, including a factory making clothes (ISIC 14—manufacturing of wearing apparel) and two shops, in different cities, sell-ing clothes (both ISIC 47—retail trade), then it is important to separate the establishments within the enterprise. If they are not separated, then the water use (and other data of interest) might be incorrectly attributed to one ISIC (e.g., ISIC 47) rather than two (e.g., ISIC 14 and ISIC 47). In addition, if the establishments are located in different river basins or administra-tive areas, then the water use may be incorrectly allocated to one river basin or administrative area rather than two.
2. Households
3.26. A household is defined as a group of persons who share the same living accommo-dation, who pool some or all of their income and wealth, and who consume certain types of goods and services collectively, mainly housing and food. In general, each member of a household should have some claim upon the collective resources of the household. At least some decisions affecting consumption68 or other economic activities (as households can be producers) must be taken for the household as a whole.69
65 See 2008 SNA, para. 5.1. 66 Ibid., para. 5.3. 67 Ibid., para. 5.14. 68 The term consumption here is used in the sense of national accounts; for an explanation of how the term con-
sumption is used in hydrology and water statistics, see para. 2.45. 69 See 2008 SNA, para. 4.149.
International Recommendations for Water34
3.27. In demographic and social statistics, the concept of a household is based on the arrangements made by persons, individually or in groups, for providing themselves with food and other essentials for living.70 In general, the definition of a household used in demographic and social statistics and economic statistics are very closely approximated.71 3.28. The majority of the population live in households, but there are also persons liv-ing in institutions that are not members of a household and who constitute institutional households.72 Persons living permanently in an institution, or who may be expected to reside in an institution for a very long or indefinite period of time, are treated as belonging to a single institutional household when they have little or no autonomy of action or decision in economic matters.73 Some examples of persons belonging to institutional households are members of religious orders living in monasteries, convents or similar institutions; long-term patients in hospitals, including mental hospitals; prisoners serving long sentences; persons living permanently in retirement homes; and persons living on military bases. 3.29. Households receive water from other economic units and discharge water or water-borne emissions to economic units. They may also abstract water directly from the environ-ment or discharge water and waterborne emissions into the environment. Households can produce goods and services, including water, for sale or own use.
3. Residence principle
3.30. The residence principle is used to allocate economic units to an economic territory of reference. While each unit will have a physical location which can be assigned to a spatial reference (e.g., a geo-code, administrative area, river basin or accounting catchment), it is also necessary to determine whether the unit is a part of a country’s economic territory. 3.31. The residence of each unit is the economic territory with which it has the strong-est connection, in other words, its centre of predominant economic interest. In its broadest sense, an economic territory can be any geographic area or jurisdiction. The connection of entities to a particular economic territory is determined by such aspects as physical presence and being subject to the jurisdiction of the Government of the territory. The most commonly used concept of economic territory is the area under the effective economic control of a single Government. However, economic territory may be larger or smaller than this, as in a currency or economic union or a part of a country or the world.74
3.32. An economic unit is resident in a country when it has a centre of predominant economic interest in the economic territory of that country. An economic unit has a centre of predominant economic interest in an economic territory when there exists, within the economic territory, some location, dwelling, place of production or other premises on which or from which the unit engages and intends to continue engaging, either indefinitely or over a finite but long period of time, in economic activities and transactions on a significant scale. The location need not be fixed as long as it remains within the economic territory. Actual or intended location for one year or more is used as an operational definition; while the choice of one year as a specific period is somewhat arbitrary, it is adopted to avoid uncertainty and facilitate international consistency.75
3.33. In population statistics, in particular for population census purposes, the “usual resi-dence” is the place where the person lives at the time of the census and has been living for some time or intends to live for some time.76 Generally, most individuals enumerated have not
70 See Principles and Recommendations for Population and Housing Census, Revision 2, para. 1.448. 71 See 2008 SNA, para. 4.150. 72 See Principles and Recommendations for Population and Housing Census, Revision 2, para. 1.455. 73 See 2008 SNA, para. 4.152. 74 Ibid., para. 4.10. 75 Ibid., para. 4.14. 76 See Principles and Recommendations for Population and Housing Census, Revision 2, paras. 1.461-1.463.
Statistical units and classifications 35
moved for some time and thus defining their place of usual residence is clear. For others, the application of the definition can lead to many interpretations, particularly if the person has moved often. Principles and Recommendations for Population and Housing Censuses, Revision 2, para. 1.463, recommends that countries apply a threshold of 12 months when considering place of usual residence.
D. Classification of establishments 3.34. To examine the production and production functions of an economy in detail it is necessary to refer to more homogeneous groups of establishments of production.77 For that reason, establishments are classified to an industry based on the process applied in the pro-duction of goods and services.78 Establishments can also be classified by institutional sector based on the principal function, behaviour and objective of the establishment. 3.35. The classification of establishments by industry facilitates the aggregation, interpreta-tion and analysis of the data collected from or about the units. For example, it enables data users to monitor or target particular groups of establishments for policy- or decision-making. It enables the volumes and cost of water used (whether abstracted directly from the environ-ment or received from other economic units) by different industries to be compared. It can also show the relative reliance on different water resources of the various industries. In addition, because the classification of units is consistent with other statistical frameworks, it enables data to be more easily integrated, for example, to link the macro-aggregates of the 2008 SNA (e.g., industry valued added, intermediate consumption) to water statistics by water accounts. 3.36. The ideal situation is to identify and observe establishments engaged in only one productive activity. In practice, however, this is not always feasible, and establishments are classified on the basis of the principal activity using the International Standard Industrial Classification of All Economic Activities, Revision 4 (ISIC, Rev . 4).79
1. Classification by industries: International Standard Industrial Classification of All Economic Activities, Revision 4
3.37. An industry is a group of the establishments within the economy that are engaged in the same or similar kinds of production activity 80 (i.e., the type of activity undertaken to produce certain goods or services). Thus, the term industry includes agriculture, mining, manufacturing, service industries, etc. 3.38. The productive activity of economic units is termed a principal, secondary or ancil-lary activity, as follows:
• The principal activity of an economic unit is the activity whose value added exceeds that of any other activity carried out within the same unit and whose output must be suitable for delivery outside the economic unit81
• A secondary activity is an activity carried out within a single economic unit in addi-tion to the principal activity and whose output must be suitable for delivery outside the economic unit82
• An ancillary activity is incidental to the main activity of the economic unit. It facili-tates the efficient running of an enterprise but does not normally result in goods and services that can be marketed83
77 See 2008 SNA, para. 2.38 78 Ibid., para. 2.37. 79 Ibid., para. 2.39. 80 Ibid., para. 5.5. 81 Ibid., para. 5.8. 82 Ibid., para. 5.9. 83 Ibid., para. 5.10.
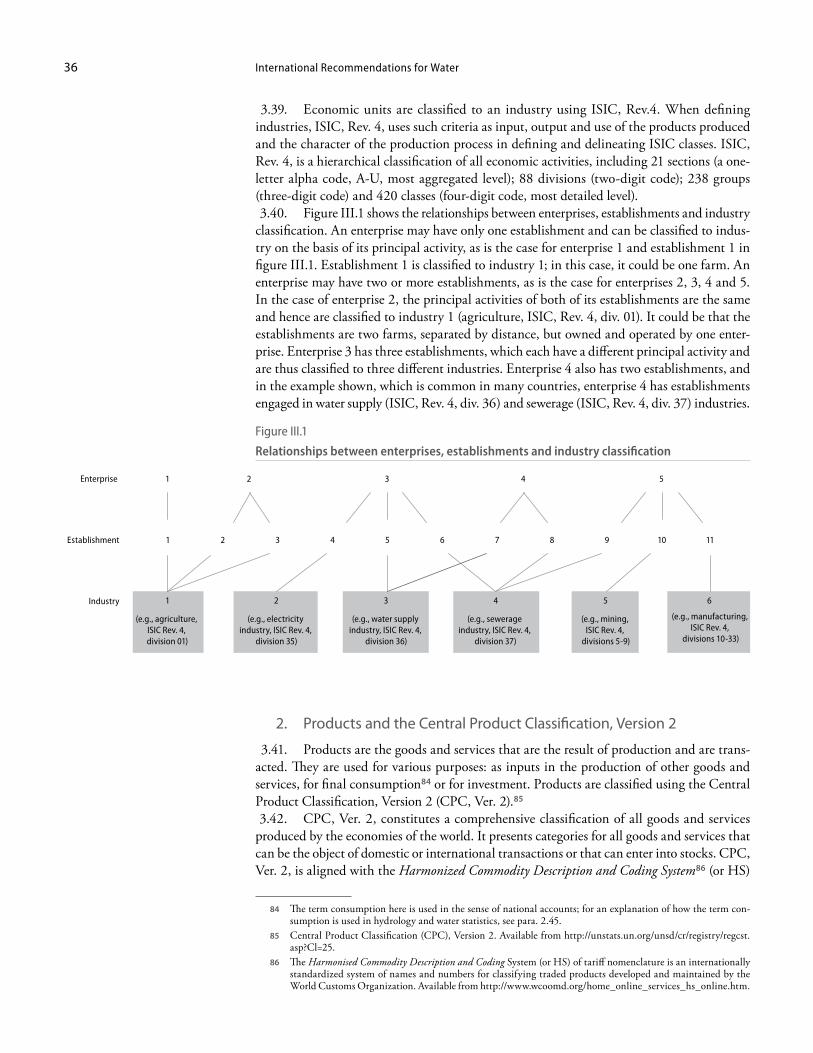
International Recommendations for Water36
2. Products and the Central Product Classification, Version 2
3.41. Products are the goods and services that are the result of production and are trans-acted. They are used for various purposes: as inputs in the production of other goods and services, for final consumption84 or for investment. Products are classified using the Central Product Classification, Version 2 (CPC, Ver. 2).85
3.42. CPC, Ver. 2, constitutes a comprehensive classification of all goods and services produced by the economies of the world. It presents categories for all goods and services that can be the object of domestic or international transactions or that can enter into stocks. CPC, Ver. 2, is aligned with the Harmonized Commodity Description and Coding System86 (or HS)
84 The term consumption here is used in the sense of national accounts; for an explanation of how the term con-sumption is used in hydrology and water statistics, see para. 2.45.
85 Central Product Classification (CPC), Version 2. Available from http://unstats.un.org/unsd/cr/registry/regcst.asp?Cl=25.
86 The Harmonised Commodity Description and Coding System (or HS) of tariff nomenclature is an internationally standardized system of names and numbers for classifying traded products developed and maintained by the World Customs Organization. Available from http://www.wcoomd.org/home_online_services_hs_online.htm.
3.39. Economic units are classified to an industry using ISIC, Rev.4. When defining industries, ISIC, Rev. 4, uses such criteria as input, output and use of the products produced and the character of the production process in defining and delineating ISIC classes. ISIC, Rev. 4, is a hierarchical classification of all economic activities, including 21 sections (a one-letter alpha code, A-U, most aggregated level); 88 divisions (two-digit code); 238 groups (three-digit code) and 420 classes (four-digit code, most detailed level). 3.40. Figure III.1 shows the relationships between enterprises, establishments and industry classification. An enterprise may have only one establishment and can be classified to indus-try on the basis of its principal activity, as is the case for enterprise 1 and establishment 1 in figure III.1. Establishment 1 is classified to industry 1; in this case, it could be one farm. An enterprise may have two or more establishments, as is the case for enterprises 2, 3, 4 and 5. In the case of enterprise 2, the principal activities of both of its establishments are the same and hence are classified to industry 1 (agriculture, ISIC, Rev. 4, div. 01). It could be that the establishments are two farms, separated by distance, but owned and operated by one enter-prise. Enterprise 3 has three establishments, which each have a different principal activity and are thus classified to three different industries. Enterprise 4 also has two establishments, and in the example shown, which is common in many countries, enterprise 4 has establishments engaged in water supply (ISIC, Rev. 4, div. 36) and sewerage (ISIC, Rev. 4, div. 37) industries.
Figure III.1
Relationships between enterprises, establishments and industry classification
1
1 2 3
1
(e.g., agriculture, ISIC Rev. 4, division 01)
(e.g., electricity industry, ISIC Rev. 4,
division 35)
(e.g., water supply industry, ISIC Rev. 4,
division 36)
(e.g., sewerage industry, ISIC Rev. 4,
division 37)
(e.g., mining, ISIC Rev. 4,
divisions 5-9)
(e.g., manufacturing, ISIC Rev. 4,
divisions 10-33)
Enterprise
Establishment
Industry
2
4 5 6
3
5
7 8 11
6
9
3 4
2 4 5
10
Statistical units and classifications 37
and is also based on the physical characteristics of goods or the nature of the services rendered. Each type of good or service distinguished in CPC, Ver. 2, is defined in such a way that it is normally produced by only one industry as defined in ISIC. 3.43. CPC, Ver. 2, identifies two products related to water: natural water (CPC, Ver. 2, 1800) and sewerage services (CPC, Ver. 2, 9410). A third product that is also of interest is bottled water (CPC, Ver. 2, 2441). 3.44. The definition of natural water (CPC, Ver. 2, 1800) is very broad and covers all types of water: water abstracted from the environment, water supplied and used within the economy and water discharged back into the environment. The exact boundaries of this class are sometimes difficult to distinguish and are usually determined by the statistical framework that uses CPC, Ver. 2. 3.45. The distinction between natural water (CPC, Ver. 2, 1800) and sewerage services (CPC, Ver. 2, 9410) is important. Water already used by one economic unit may be of suf-ficient quality to be used by another economic unit without treatment and hence is a supply of water (CPC, Ver. 2, 1800). However, other water supplied from one economic unit to another may contain waterborne emissions, as is the case for sewage being supplied to sewerage treatment facilities for treatment or disposal. In this case, the water is not classified as water (CPC, Ver. 2, 1800) but the service provided by the economic unit receiving it is classified as sewerage services (CPC, Ver. 2, 9410). 3.46. To reflect these different types of water flows, water statistics and accounts present flows of water first in terms of the type of flow (from the economy to the environment, within the economy and from the environment to the economy) and second in terms of the use of water (for example, water supplied to other economic units is further disaggregated to water, wastewater for treatment and disposal and wastewater not for treatment or disposal (for reuse)).
3. Industries important for water statistics
3.47. Some industries are of special relevance to water statistics because they use large quantities of water, discharge large quantities of sewage to other economic units or the envi-ronment or are major sources of waterborne emissions (pollution).87 They include:
• Agriculture (ISIC, Rev. 4, div. 01)• Mining and quarrying (ISIC, Rev. 4, divs. 05-09)• Manufacturing (ISIC, Rev. 4, divs. 10-33) • Electricity, gas, steam and air conditioning supply (ISIC, Rev. 4, div. 35)
• Hydroelectricity producers• Other types of electricity producers (e.g., coal, natural gas, nuclear, solar, wind)
• Water collection, treatment and supply (ISIC, Rev. 4, div. 36)• Sewerage (ISIC, Rev. 4, div. 37)
Agriculture
3.48. Agriculture (ISIC, Rev. 4, div. 01)88 includes establishments engaged in the exploi-tation of plant and animal natural resources, comprising the activities of growing crops, rais-ing and breeding animals, harvesting timber and other plants, animals or animal products from a farm or their natural habitats. Crop and animal production is a very large water user in most countries. For example, irrigators abstract water from surface water or groundwater or receive it from water suppliers, while rain-fed agriculture is a large direct user of water.
87 In SEEA-Water (see box 2.1), the economic activities primarily related to water, in the sense that they either provide water or water-related services, are listed as ISIC, Rev. 4, 0161, 36, 37, 39, 4923, 4930 and 8412. For analytical purposes, it is useful to collect and compile data for each of these industries, but in many cases data may not be separately identified by industry; rather, they may be aggregated with other industries’ data.
88 See ISIC, Rev. 4, explanatory note for division 01. Available from http://unstats.un.org/unsd/cr/registry/ regcs.asp?Cl=27&Lg=1&Co=01.
International Recommendations for Water38
Agriculture can also be a significant source of diffuse waterborne emissions, in particular nitrogen and phosphorus. 3.49. Agriculture includes the class “support activities for crop production” (ISIC, Rev. 4, class 0161). This class includes the operation of agricultural irrigation systems but does not include the provision of water (which activity belongs to ISIC, Rev. 4, div. 36) or any construction involved in the provision of this service. It includes, for example, the operation of spray or drip irrigation systems.
Mining
3.50. Mining (ISIC, Rev. 4, divs. 05-09)89 includes establishments engaged in the extrac-tion of minerals occurring naturally as solids (coal and ores), liquids (petroleum) or gases (natural gas) and also includes supplementary activities aimed at preparing the crude materi-als for marketing, such as crushing, grinding, cleaning, drying, sorting, concentrating ores, liquefaction of natural gas and agglomeration of solid fuels. 3.51. Mining industries may be significant water users and may also be significant sources of water discharges and waterborne emissions (pollution). Water use by mining industries includes abstracting water as a part of mine dewatering operations (i.e., removing water from mines to make them passable by labour and equipment so that minerals can be recovered) or the use of water in production processes (e.g., dust suppression and rock crushing). Water-borne emissions (pollution) may be dissolved in water or suspended in water, making the management of water around mine sites and mineral processing plants an important issue. In some cases, in particular in the case of remote mining operations, the mining industry may also supply water, as a secondary activity, to nearby towns for use in households or other economic units or to facilities that accommodate mine workers.
Manufacturing
3.52. Manufacturing (ISIC, Rev. 4, divs. 10-33)90 includes establishments engaged in the physical or chemical transformation of materials, substances or components into new products, although this cannot be used as the single universal criterion for defining manu-facturing. Units engaged in manufacturing are often described as plants, factories or mills and characteristically use power-driven machines and materials-handling equipment. Units that transform materials or substances into new products by hand or in the worker’s home and those engaged in the selling to the general public of products made on the same premises from which they are sold, such as bakeries and custom tailors, are also included. 3.53. The manufacturing industries use significant quantities of water in production pro-cesses and for cooling. Manufacturing industries also usually account for a significant propor-tion of the water discharged to sewerage industries (ISIC, Rev. 4, div. 37) or the environment. Since this water often contains waterborne emissions (pollution), many manufacturing estab-lishments also have their own wastewater treatment facilities and hence produce sewerage services (CPC, Ver. 2, 9410) as an ancillary activity. In some cases, these sewerage services are also provided to other economic units and hence these establishments are producing sewerage services as both a secondary activity and an ancillary activity. 3.54. Within the manufacturing industries, large water users typically include manufac-turers of food products (ISIC, Rev. 4, div. 10); beverages (ISIC, Rev. 4, div. 11); textiles (ISIC, Rev. 4, div. 13); leather and related products (ISIC, Rev. 4, div. 15); paper and paper products (ISIC, Rev. 4, div. 17); coke and refined petroleum products (ISIC, Rev. 4, div. 19); chemicals
89 Ibid., explanatory note for sect. B. Available from http://unstats.un.org/unsd/cr/registry/regcs.asp?Cl=27&Lg= 1&Co=B.
90 Ibid., explanatory note for sect. C. Available from http://unstats.un.org/unsd/cr/registry/regcs.asp?Cl=27&Lg= 1&Co=C.
Statistical units and classifications 39
and chemical products (ISIC, Rev. 4, div. 20); other non-metallic mineral products (ISIC, Rev. 4, div. 23); basic metals (ISIC, Rev. 4, div. 24); and fabricated metal products (except machinery and equipment) (ISIC, Rev. 4, div. 25).
Electricity, gas, steam and air conditioning supply
3.55. Electricity, gas, steam and air conditioning supply (ISIC, Rev. 4, div. 35),91 the “electricity industry” in IRWS), includes establishments engaged in the activity of providing electric power, natural gas, steam, hot water and the like through a permanent infrastructure (network) of lines, mains and pipes. Electricity generators use very large quantities of water for hydroelectricity generation and for cooling in thermal electricity generation stations. 3.56. Hydroelectric power generation uses water pulled by gravity to pass through tur-bines to generate electricity. Usually this water is directly abstracted by the power plant and returned immediately to the environment or supplied to other units in the economy. It is recommended that the units generating hydroelectricity be separately identified from other types of electricity producers since the water used is in most cases returned to the environment immediately after use. Generally, there are no waterborne emissions associated with water returned after being used for hydroelectricity generation.92
3.57. A special feature of the economic units engaged in hydroelectric power genera-tion is that they may produce two outputs—electricity and water. In most cases, where these two outputs are produced, the value of the output of electricity (CPC, Ver. 2, 171) is greater than that of the output of water (CPC, Ver. 2, 1800) and, thus, for the purposes of national accounts, they are classified to ISIC, Rev. 4, div. 35 (because the principal output is electricity). Again, where the units classified to ISIC, Rev. 4, div. 35 also supply water to other economic units, which is often the case, then this is recorded as a secondary activity. In national accounts, this is termed horizontal integration.93 In these cases, two establish-ments are created from the one enterprise—one classified to ISIC, Rev. 4, div. 35, producing electricity, and the other classified to ISIC, Rev. 4, div. 36, producing water. Creating two establishments from one enterprise is often difficult because the factors of production are the same, and assigning these factors of production to either water supply (ISIC, Rev. 4, div. 36) or electricity (ISIC, Rev. 4, div. 35) may be arbitrary.
Water collection, treatment and supply industry and the sewerage industry
3.58. The water collection, treatment and supply industry (ISIC, Rev. 4, div. 36), the “water supply industry” in IRWS, includes establishments engaged in water collection, treat-ment and distribution activities for household and industrial needs.94 The water supply indus-try includes:
• Abstraction of water from surface water (e.g., from rivers, lakes) and groundwater (e.g., from wells, bores, springs)
• Collection of rain water• Desalting of sea or groundwater to produce water as the principal product of interest• Purification of water for water supply purposes• Treatment of water for industrial and other purposes• Distribution of water through mains, by trucks or by other means• Operation of irrigation canals
91 Ibid., explanatory note for sect. D. Available from http://unstats.un.org/unsd/cr/registry/regcs.asp?Cl=27&Lg= 1&Co=D.
92 It is important to note that surface water quality can be affected by artificial reservoirs, including those used for hydroelectricity generation, due to the change in water flows and other factors.
93 See 2008 SNA, para. 5.21. 94 See ISIC, Rev. 4, explanatory note for class 3600. Available from http://unstats.un.org/unsd/cr/registry/regcs.
asp?Cl=27&Lg=1&Co=3600.
International Recommendations for Water40
3.59. The water collection, treatment and supply industry excludes:• Operation or supply of irrigation equipment for agricultural purposes (ISIC, Rev. 4,
class 0161)• Treatment of wastewater in order to prevent pollution (sewerage industry, ISIC, Rev.
4, div. 37)• (Long-distance) transport of water via pipelines (ISIC, Rev. 4, class 4930)
3.60. The sewerage industry (ISIC, Rev. 4, div. 37) receives large volumes of wastewater with a range of waterborne physical, biological and chemical pollutants. The sewerage indus-try (ISIC, Rev. 4, div. 37) includes establishments engaged in the following activities:95
• Operation of sewer systems or sewer treatment facilities• Collection and transportation of human or industrial wastewater from one or several
users, as well as rain water, by means of sewerage networks, collectors, tanks and other means of transport (sewage vehicles, etc.)
• Emptying and cleaning of cesspools and septic tanks, sinks and pits from sewage and servicing of chemical toilets
• Treatment of wastewater (including human and industrial wastewater, water from swimming pools, etc.) by means of physical, chemical and biological processes
• Maintenance and cleaning of sewers and drains, including sewer rodding 3.61. In many countries, the activities of water supply and sewerage service industries (ISIC, Rev. 4, divs. 36 and 37, respectively) are carried out within the same enterprise, although often at different establishments. When possible, the establishments of these enter-prises should be distinguished and allocated either to ISIC, Rev. 4, div. 36 or 37. This assists in understanding the supply and use of water within the economy and will help in the analy-sis of both the physical and monetary data items. This is usually possible since, unlike with hydropower generation, it is not usually a case of horizontal integration because the factors of production are usually separate (an exception is noted below). That is, the dams which collect water and the pipes which distribute it are distinct from the pipes that collect wastewater and deliver it to the wastewater treatment plants. 3.62. If it is not possible to split an enterprise involved in both water supply (ISIC, Rev. 4, div. 36) and sewerage (ISIC, Rev. 4, div. 37) into two establishments, then the enterprise will need to be classified on the basis of the product that generates the greatest value added. If it is water (CPC, Ver. 2, 1800) then it should be classified to ISIC, Rev. 4, div. 36, and sewerage services (CPC, Ver. 2, 9410) would be a secondary activity. If the sewerage services produce the greater value added, then the enterprise should be classified to ISIC, Rev. 4, div. 37, and the water supply would be a secondary activity. 3.63. In some cases, wastewater treatment plants will also make water (with or without treatment) available to other economic units for use. In this case, the factors of production of water (CPC, Ver. 2, 1800) and sewerage services (CPC, Ver. 2, 9410) are the same and hence it is a case of horizontal integration, and the collection and treatment (if any) of wastewater results in another marketable product (i.e., water) being produced. In this case, as in the gen-eration of hydroelectricity, it is difficult to separate the factors of production and hence the establishment is classified on the basis of the product that generates the greatest value added. 3.64. An important point for water statistics and the classification of economic units to industry is that in many countries Governments provide water (CPC, Ver. 2, 1800) or sewer-age services (CPC, Ver. 2, 9410). However, these economic units are classified to an industry on the basis of their productive activity, independently of their institutional sector, and thus the government-run economic units providing water or sewerage services are classified to water supply (ISIC, Rev. 4, div. 36) and sewerage (ISIC, Rev. 4, div. 37) industries, and not to public administration, defence and compulsory social security (ISIC, Rev. 4, div. 84).
95 Ibid., explanatory note for class 3700. Available from http://unstats.un.org/unsd/cr/registry/regcs.asp?Cl=27&Lg=1&Co=3700.
Statistical units and classifications 41
3.65. A related issue is the provision of water (CPC, Ver. 2, 1800) or sewerage services (CPC, Ver. 2, 9410) by non-governmental organizations (NGOs) (e.g., for the benefit of house-holds) or by cooperatives (e.g., an irrigation cooperative operated for the benefit of farmers). Again, these establishments are classified to an industry on the basis of their productive activ-ity, and if they are providing water (CPC, Ver. 2, 1800) or sewerage services (CPC, Ver. 2, 9410), then they should be classified to water supply (ISIC, Rev. 4, div. 36) and sewerage (ISIC, Rev. 4, div. 37) industries. Again, they are independently classified to an institutional sector.
Other industries
3.66. While the agriculture, electricity, water supply and sewerage industries are likely to be the most important for most countries, other industries may be of significance for some countries or for some users of water statistics, including:
• Forestry, fishing and aquaculture (ISIC, Rev. 4, divs. 02-03) • Water transport (ISIC, Rev. 4, div. 50)• Accommodation (ISIC, Rev. 4, div. 55)• Food and beverage services (ISIC, Rev. 4, div. 56)• Sports activities and amusement and recreation activities (ISIC, Rev. 4, div. 93)
3.67. Forestry and logging (ISIC, Rev. 4, div. 02)96 includes establishments engaged in the production of round wood for the forest-based manufacturing industries (ISIC, Rev. 4, divs. 16 and 17), as well as the extraction and gathering of wild growing non-wood forest products. Besides the production of timber, forestry activities result in products that undergo little pro-cessing, such as firewood, charcoal, woodchips and round wood used in an unprocessed form (e.g., pit props, pulpwood). These activities can be carried out in natural or planted forests. Economic units engaged in forestry will use water abstracted directly from the environment or receive it from water suppliers (ISIC, Rev. 4, div. 36). Where the forest industry is large or makes a regionally significant contribution to the economy or impact on water (via abstrac-tions or discharges), countries will need to distinguish between these units. 3.68. Fishing and aquaculture (ISIC, Rev. 4, div. 03)97 includes capture fishery and aqua-culture, covering the use of fish resources from marine, brackish or freshwater environments, with the goal of capturing or gathering fish, crustaceans, molluscs and other marine organ-isms and products. These activities, in particular freshwater fish farming, can use or pollute significant amounts of water. 3.69. Water transport (ISIC, Rev. 4, div. 50) includes inland water transport (ISIC, Rev. 4, group 502) and, for example, includes the units operating boats or barges on rivers and lakes to transport goods and people. In general, this group does not abstract a significant amount of water. However, this industry does use water “in situ” as the medium on which the transport occurs and without using water in this way, the industry would not be able to operate. In addition, this industry may also discharge water into the environment, and the discharge of ballast water, for example, is an issue in some countries. 3.70. The use of water and the waterborne emissions by tourists is of particular interest in some countries, such as places where there are large numbers of tourists but water is scarce. Tourism is not defined as an industry in ISIC, Rev. 4, but is a collection of activities under-taken by a range of establishments, classified to a large number of industries. The Australian National Accounts Tourism Satellite Account for 2006-200798 provides guidance on the definition of tourism and its relationship to industries. It is important to note that the con-
96 Ibid., explanatory note for division 02. Available from http://unstats.un.org/unsd/cr/registry/regcs.asp?Cl= 27&Lg=1&Co=02.
97 Ibid., explanatory note for division 03. Available from http://unstats.un.org/unsd/cr/registry/regcs.asp?Cl= 27&Lg=1&Co=03.
98 Australia Bureau of Statistics, Australian National Accounts, Tourism Satellite Account for 2006-07. Avail-able from www.ausstats.abs.gov.au/ausstats/subscriber.nsf/0/C7681ACFEC530658CA25742D001621DA/$File/52490_2006-07.pdf.
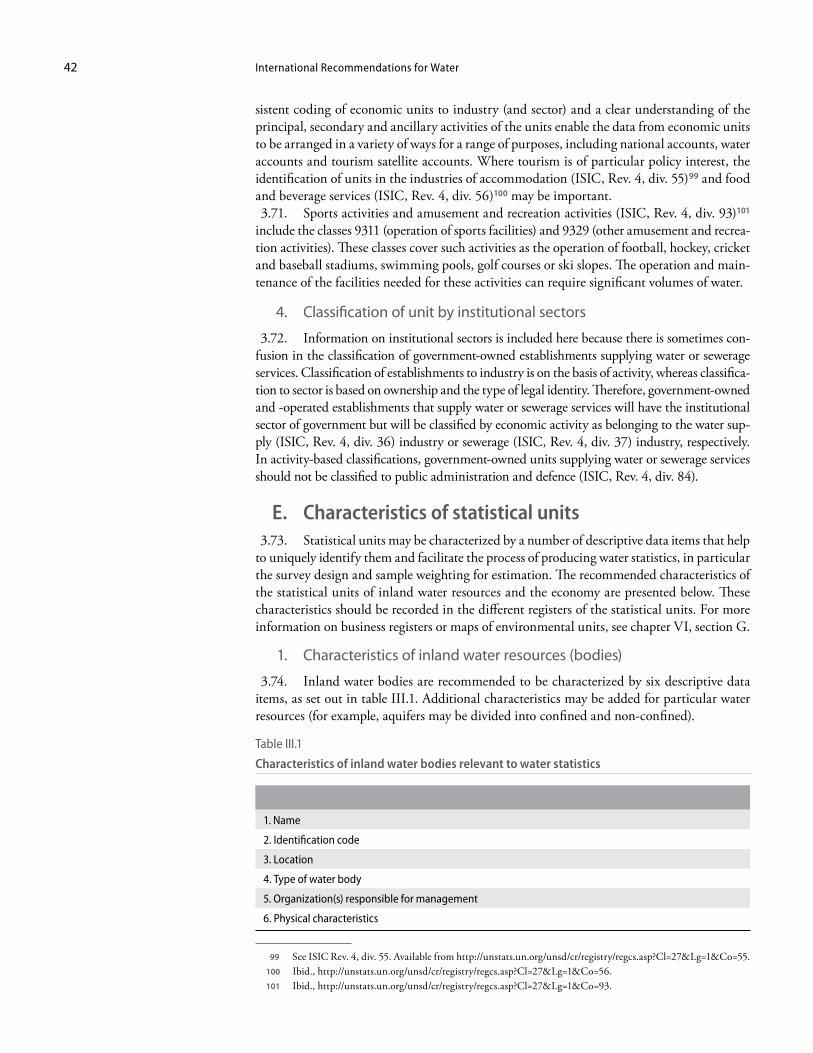
International Recommendations for Water42
sistent coding of economic units to industry (and sector) and a clear understanding of the principal, secondary and ancillary activities of the units enable the data from economic units to be arranged in a variety of ways for a range of purposes, including national accounts, water accounts and tourism satellite accounts. Where tourism is of particular policy interest, the identification of units in the industries of accommodation (ISIC, Rev. 4, div. 55)99 and food and beverage services (ISIC, Rev. 4, div. 56)100 may be important. 3.71. Sports activities and amusement and recreation activities (ISIC, Rev. 4, div. 93)101 include the classes 9311 (operation of sports facilities) and 9329 (other amusement and recrea-tion activities). These classes cover such activities as the operation of football, hockey, cricket and baseball stadiums, swimming pools, golf courses or ski slopes. The operation and main-tenance of the facilities needed for these activities can require significant volumes of water.
4. Classification of unit by institutional sectors
3.72. Information on institutional sectors is included here because there is sometimes con-fusion in the classification of government-owned establishments supplying water or sewerage services. Classification of establishments to industry is on the basis of activity, whereas classifica-tion to sector is based on ownership and the type of legal identity. Therefore, government-owned and -operated establishments that supply water or sewerage services will have the institutional sector of government but will be classified by economic activity as belonging to the water sup-ply (ISIC, Rev. 4, div. 36) industry or sewerage (ISIC, Rev. 4, div. 37) industry, respectively. In activity-based classifications, government-owned units supplying water or sewerage services should not be classified to public administration and defence (ISIC, Rev. 4, div. 84).
E. Characteristics of statistical units 3.73. Statistical units may be characterized by a number of descriptive data items that help to uniquely identify them and facilitate the process of producing water statistics, in particular the survey design and sample weighting for estimation. The recommended characteristics of the statistical units of inland water resources and the economy are presented below. These characteristics should be recorded in the different registers of the statistical units. For more information on business registers or maps of environmental units, see chapter VI, section G.
1. Characteristics of inland water resources (bodies)
3.74. Inland water bodies are recommended to be characterized by six descriptive data items, as set out in table III.1. Additional characteristics may be added for particular water resources (for example, aquifers may be divided into confined and non-confined).
Table III.1
Characteristics of inland water bodies relevant to water statistics
1. Name
2. Identification code
3. Location
4. Type of water body
5. Organization(s) responsible for management
6. Physical characteristics
99 See ISIC Rev. 4, div. 55. Available from http://unstats.un.org/unsd/cr/registry/regcs.asp?Cl=27&Lg=1&Co=55. 100 Ibid., http://unstats.un.org/unsd/cr/registry/regcs.asp?Cl=27&Lg=1&Co=56. 101 Ibid., http://unstats.un.org/unsd/cr/registry/regcs.asp?Cl=27&Lg=1&Co=93.
Statistical units and classifications 43
3.75. It is usual for lakes, rivers, wetlands, artificial reservoirs, glaciers and groundwater resources to be given a name, for example, Lake Baikal (Russian Federation), the Amazon (Brazil), Lake Kariba (Zambia and Zimbabwe), Malaspina Glacier (United States of America) and the Great Artesian Basin (Australia). In some cases, the name also accurately describes the type of water resource, as is the case with Lake Baikal and the Malaspina Glacier in the examples given above. However, this is not always true; for example, Lake Kariba is an arti-ficial reservoir. 3.76. An identification code is a unique number assigned to each inland water resource. This may comprise of digits identifying its geographic location, type, management or physical characteristics. The unique identification of the inland water resources is useful for:
• Identifying and organizing the complete population of inland water resources, which can, for example, be used as a sampling frame
• Assisting in the compilation of information about these units from a range of data sources (see chap. VI)
• Providing a population for sampling for statistical surveys to collect hydrological data 3.77. Identification codes should not change as long as the water resource (i.e., statisti-cal unit) exists, even if some of the statistical unit’s other characteristics change. Common identification codes, shared with hydrological institutions and other water research-related agencies, administrative authorities and other government departments greatly facilitate sta-tistical work, for example, ensuring that shared data can be readily attributed to the correct water resource (e.g., river, artificial reservoir, lake, aquifer). 3.78. The location of the water resources should ideally be recorded as a shape file readable by a geographic information system (GIS), such as a line or polygon for a river and polygons for lakes, artificial reservoirs and aquifers. The location can also be recorded as occurring within a particular river basin or administrative area. The geographic centre (or centroid) could be used for lakes and artificial reservoirs but is less meaningful for rivers. This infor-mation may be available in GIS from agencies responsible for hydrology, and may include elevation, depending on what the information is being used for. 3.79. The type of water body is allocated according to the classification provided in sec-tion B: artificial reservoirs; lakes; rivers; wetlands; snow, ice and glaciers; and aquifers. In many countries, there may be a further subdivision of these units. For example, rivers may be subdivided into stretches or segments or may be classified on the basis of the amount of water flowing through them over a particular period of time, while artificial reservoirs may be classified by their storage capacity, and groundwater by the nature of the aquifer (confined or unconfined). Some of these can be recorded in the physical characteristics of these units. 3.80. The organization(s) responsible for managing the water resource is an economic unit (or units) such as the Department of the Environment or a local government agency. The characteristics of these units, as outlined in section 2 on economic units, should also be recorded. This is important because it is from these units that information about the water resources may be collected (e.g., via survey or administrative means). In cases where more than one economic unit has responsibility for the management of a particular water resource, it is useful to identify the organization with principal responsibility for manage-ment and to note the roles of the other economic units. 3.81. The physical characteristics of inland water bodies include a range of data, some of which are described in the data items presented in chapter IV. However, it is useful to record some additional characteristics, such as the length, width and depth of artificial reservoirs, lakes and rivers. It should be noted that the physical characteristics may vary over time and that it may be useful to record ranges for particular characteristics (e.g., maximum, mini-mum, average). The characteristics should also include the location of the unit.
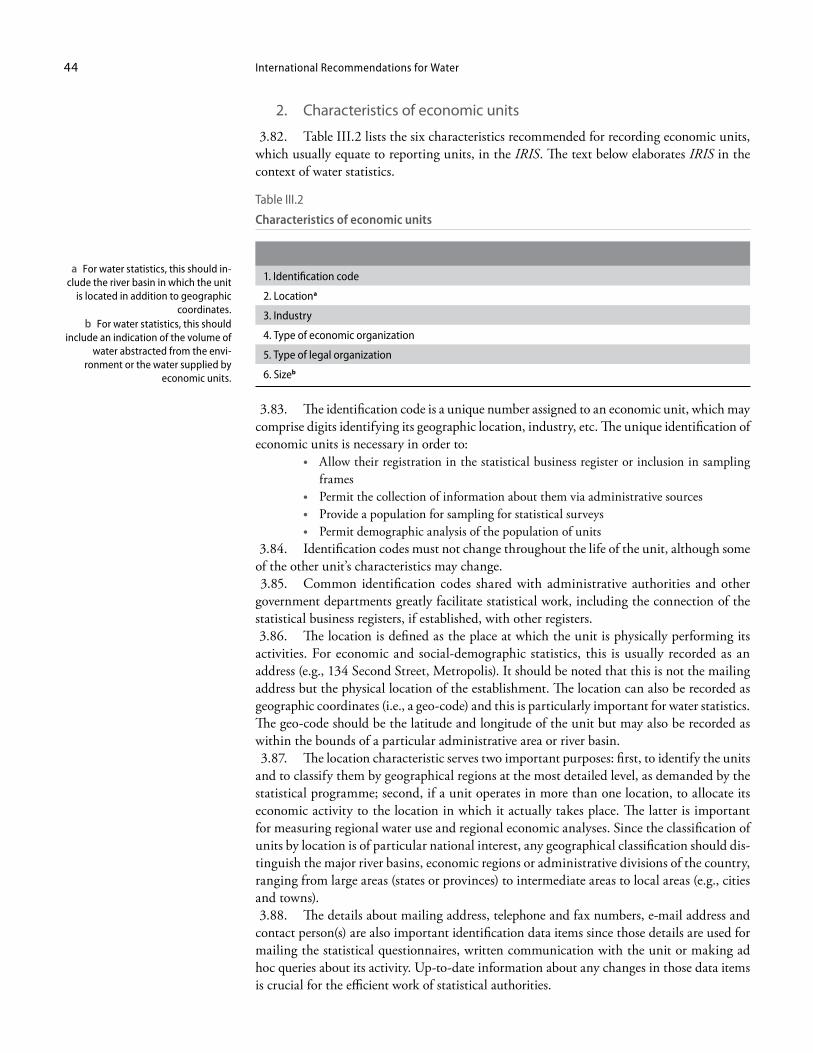
International Recommendations for Water44
2. Characteristics of economic units
3.82. Table III.2 lists the six characteristics recommended for recording economic units, which usually equate to reporting units, in the IRIS. The text below elaborates IRIS in the context of water statistics.
Table III.2
Characteristics of economic units
1. Identification code
2. Locationa
3. Industry
4. Type of economic organization
5. Type of legal organization
6. Sizeb
3.83. The identification code is a unique number assigned to an economic unit, which may comprise digits identifying its geographic location, industry, etc. The unique identification of economic units is necessary in order to:
• Allow their registration in the statistical business register or inclusion in sampling frames
• Permit the collection of information about them via administrative sources • Provide a population for sampling for statistical surveys • Permit demographic analysis of the population of units
3.84. Identification codes must not change throughout the life of the unit, although some of the other unit’s characteristics may change. 3.85. Common identification codes shared with administrative authorities and other government departments greatly facilitate statistical work, including the connection of the statistical business registers, if established, with other registers. 3.86. The location is defined as the place at which the unit is physically performing its activities. For economic and social-demographic statistics, this is usually recorded as an address (e.g., 134 Second Street, Metropolis). It should be noted that this is not the mailing address but the physical location of the establishment. The location can also be recorded as geographic coordinates (i.e., a geo-code) and this is particularly important for water statistics. The geo-code should be the latitude and longitude of the unit but may also be recorded as within the bounds of a particular administrative area or river basin. 3.87. The location characteristic serves two important purposes: first, to identify the units and to classify them by geographical regions at the most detailed level, as demanded by the statistical programme; second, if a unit operates in more than one location, to allocate its economic activity to the location in which it actually takes place. The latter is important for measuring regional water use and regional economic analyses. Since the classification of units by location is of particular national interest, any geographical classification should dis-tinguish the major river basins, economic regions or administrative divisions of the country, ranging from large areas (states or provinces) to intermediate areas to local areas (e.g., cities and towns). 3.88. The details about mailing address, telephone and fax numbers, e-mail address and contact person(s) are also important identification data items since those details are used for mailing the statistical questionnaires, written communication with the unit or making ad hoc queries about its activity. Up-to-date information about any changes in those data items is crucial for the efficient work of statistical authorities.
a For water statistics, this should in-clude the river basin in which the unit
is located in addition to geographic coordinates.
b For water statistics, this should include an indication of the volume of
water abstracted from the envi-ronment or the water supplied by
economic units.
Statistical units and classifications 45
3.89. The location in the case of multi-establishment enterprises presents a special case. Where an enterprise has only one establishment, it may or may not have one location and address. Often, the enterprise address is used for administrative purposes and the establish-ment address for statistical purposes. However, there is need for care when dealing with large complex enterprises. It is recommended that multi-establishment enterprises be requested to provide location details about each establishment they have, otherwise the establishment may be asked about the name and location of the enterprise that owns it so that a data set in the register on the enterprise and its own component establishments can be established. In some cases, it may be necessary to correspond with both the establishment and the enterprise, because in general the unit supplying information on water use, for example, may be different from the establishment providing financial details. 3.90. For water statistics, it is useful to record, in addition, the location of places where and from which water resource (e.g., surface or groundwater) economic units extract water from the environment and where water is discharged back into the environment. For example, an economic unit may extract water from a well (i.e., groundwater) for productive activities and discharge water to a river (i.e., surface water). This can be especially important for large agricultural operations, which may extract water from a number of sources over a wide area, possibly spanning river basins and administrative areas. 3.91. The industry (or “kind of activity” in IRIS) of an establishment is defined by the economic activities in which it is engaged and is classified according to ISIC, Rev. 4. Know-ing the industry of an establishment provides the first insight into the types of water use that might be occurring within an establishment. For example, establishments engaged in agri-culture (ISIC, Rev. 4, div. 01) may use water for irrigation, while an establishment engaged in electricity generation (ISIC, Rev. 4, div. 35) may use water for hydroelectricity generation or cooling in the case of thermal electricity generation. 3.92. The characteristic “type of economic organization” is intended to indicate whether the establishment is “the sole establishment” of the enterprise of immediate ownership or part of a “multi-establishment enterprise”. If further details are required on this aspect of the structure, the multi-establishment enterprises might be divided into classes according to the number of their constituent establishments or by the criteria used for classifying estab-lishments (employment, value added, etc.) that are most appropriate for each country. For the purpose of accurate measurement of production and all other flows in the economy, it is desirable to have the links between individual establishments and their parent enterprise clearly defined. 3.93. The kind of “legal organization” is another important characteristic of economic units and is a possible criterion for stratification of units for the purpose of statistical surveys. The kind of legal organization is the legal form of the economic entity which owns the unit (either the enterprise or the establishment). Further breakdowns of incorporated units by “incorporated enterprises” (corporations), except limited liability partnerships and coopera-tives, “limited liability partnerships” and “cooperatives” and “non-profit institutions”, and of unincorporated units by sole proprietors and partnerships not recognized as independent legal entities, may also be of interest. For more information on these categories and subcategories, see IRIS. This information can be used to determine the institutional sector of the unit. 3.94. Size is an important characteristic of economic units, which is essential for the design of statistical surveys and grossing up techniques (also called sample weighting). In general, the size classes of economic units can be defined either in terms of physical units (e.g., employ-ment or physical units of output) or in monetary terms (e.g., turnover or value of net assets). Monetary criteria can be used separately or in conjunction with employment criterion. For industry statistics, size is often based on the average number of persons employed because of its simplicity, general applicability, usefulness and international comparability. IRIS provides further guidance on the classification of economic units by size.

3.95. For water statistics, size as measured by number of employees or turnover may not be closely correlated with size in terms of total water use, including abstraction for own use and use of water from other economic units, water supplied and total discharges. It is therefore important for sample design and grossing up techniques to record the level of water use (both that abstracted from the environment or received from other economic units) as an additional size characteristic of economic units.
47
Chapter IV
Water data items
A. Introduction 4.1. Chapter IV provides a comprehensive list of data items and their definitions recom-mended for collection, compilation and dissemination of water statistics and accounts. The data items are presented as part of a hierarchical classification and constitute the basic build-ing blocks of water statistics. The data items can be used to produce national water statistics for different purposes; populate the standard tables of SEEA-Water; respond to international water questionnaires; and derive water indicators commonly used for national policymaking and by international agencies for monitoring and assessment. 4.2. Producers of water statistics are encouraged to use the recommended data items for developing basic water information. Depending on user needs, further disaggregation of the recommended data items and additional data items may be necessary to meet specific require-ments. A longer and more detailed list of these supplementary data items, which complements the hierarchical classification of the recommended data items, is presented in annex II. 4.3. The lists of data items in the present chapter and in annexes I and II are based on an assessment of existing country practices, user needs and the water statistics classifications in use by international agencies. Using these data items will ensure coherence of concepts and definitions, geographical areas and environmental domains. It is important, however, that countries prioritize data items for collection and compilation according to their own data needs (for more information on data-collection strategy, see chap. V). 4.4. The recommended data items are grouped under the main headings of physical, monetary and social-demographic data items. Physical data items are listed under the follow-ing subheadings:
• Stocks of water in the environment (data items A) • Flows of water within the environment (data items B-D)• Flows of water from the environment to the economy (data items E)• Flows of water within the economy (data items F-G)• Flows of water from the economy to the environment (data items H)• Losses of water from distribution networks and sewerage systems (data items I)• Flows of waterborne emissions (data items J-K)
4.5. Monetary data items are listed under the following subheadings: • Value and costs of water and sewerage services (data items L)• Taxes, subsidies and investment grants (data items M-N)• Assets and investments (data items O-Q)• Tariffs and charges for water supply and sewerage (data items R)
4.6. Social-demographic data items102 are listed under the following subheadings: • Main source of drinking water used by population (data items S)• Main type of toilet and sewage disposal used by population (data items T)
102 The social-demographic data items in this list are used to compile MDG indicators.
International Recommendations for Water48
4.7. Each data item has an individual alphanumeric code. The first part of the code is a capital letter that indicates the highest level of aggregation of the data item, which in most cases is the sum of the subsequent breakdowns. In some cases, an alternative breakdown of the primary data item is used; in those cases, the alternative secondary level is shown with a lower-case letter of the alphabet (e.g., A.a, A.b, A.c). In the case of the alternative breakdowns, the sum is still the same (A). 4.8. The same codes are used in annex I, which provides the full list of recommended data items in a single table, and in annexes III and IV, which demonstrate the relationship between the data items and the SEEA-Water standard tables and water indicators, respectively. In Annex III, the codes are presented in the corresponding cells of the SEEA-Water standard tables. Annex IV presents the water indicators used in the WWDR, along with formulas in which the data items are denoted by their codes.
B. Collection and compilation of data items 4.9. It is important to ensure that the units of measurement, the relevant spatial and temporal references and the characteristics of statistical units are recorded with the data items. Those issues are addressed in detail in chapters II, III and VI but are briefly summa-rized here. By recording this information, data items can be better aligned in terms of spatial and temporal references and can be presented in a number of different ways, at different levels of aggregation.
1. Units of measurement
4.10. The units of measurement depend on the data item. In general, for physical data items, cubic metres (m3) are used, except for the waterborne emissions, which use measures of mass (grams, kilograms, tonnes) or measured physical properties (e.g., chemical oxygen demand (COD)) of emissions. For the collection of primary data, other units of measure may also be used, such as units typically used by farmers to measure abstraction, but for the purposes of presenting data and for comparison, it is important to convert data into standard scientific measurement units (i.e., the metric system). Lists of units and conversion factors are provided in annex VI. 4.11. For monetary data items, local currency is used. The unit of measurement for social-demographic data items is the number of people or households belonging to defined groups.
2. Spatial and temporal (time) references
4.12. Data items can be collected with reference to a number of different spatial and temporal levels. Ideally, the statistical units to which data items refer should include a spe-cific geographic reference, allowing compilation of the data items at a number of geographic levels. Data items should be compiled, at a minimum, at the national level. Countries are also encouraged to compile data items at the level of river basins, aquifers (or groundwater system boundaries), administrative areas or accounting catchments, to facilitate the transna-tional and intranational spatial analysis of water information. This is particularly important for international or transboundary water resources. Additional details on spatial references are discussed in chapter II. Geographic information systems (GIS) are especially useful for managing and compiling water data items at different spatial levels. 4.13. For temporal references, data items will refer to either a point in time (in the case of stocks) or a period of time (in the case of flows). For stocks, the point in time may be the first day of the year, while for flows the time period is typically one year, although
Water data items 49
shorter time periods may be available or useful for many data items (e.g., daily data on precipitation). For the purposes of SEEA-Water, the temporal reference should coincide with the periods used in the national accounts to facilitate the integration of the physi-cal and monetary data items. Additional details on temporal references are discussed in chapter II.
3. Industry classification
4.14. As described in chapter III, it is important to record the principal economic activity of the economic unit so that all data items can be disaggregated by industry. All economic units should be classified at least to the division (i.e., two-digit) level of ISIC, Rev. 4, to ensure that data items are disaggregated at this level. 4.15. The quality of data may not always support this level of disaggregation. Therefore, the minimum level of disaggregation of data items should be in line with SEEA-Water stand-ard tables, which identify the following:
• Agriculture, forestry and fishing (ISIC 01-03) • Mining, manufacturing and construction (ISIC 05-33, 41-43) • Electricity supply (ISIC 35) • Water supply (ISIC 36) • Sewerage (ISIC 37) • All other industries (ISIC 38, 39, 45-99) • Households
4.16. As noted in chapter III, in some countries it may also be important to identify addi-tional industries or to further disaggregate the above-mentioned industries to meet national data needs.
4. Prioritization of data items for collection and compilation
4.17. It is important to prioritize data items for the optimal allocation of resources avail-able for their collection and compilation; however, priorities will differ for each region, country and river basin. The prioritization of data items is addressed in chapter V on data-collection strategies.
C. Physical water data items 1. Stocks of water in the environment
4.18. Inland water stocks (A) are the volumes (cubic metres) of water contained in surface water stocks, groundwater stocks and soil water at a particular point in time. They include freshwater, brackish and saline waters. 4.19. Inland water stocks (A) include water of all types of quality. In some cases, brack-ish and saline inland water are used in significant quantities for production and consump-tion activities, such as for desalination, cooling or irrigation of salt-resistant crops. Coun-tries may disaggregate inland waters into classes based on salinity level or other aspects of water quality. 4.20. The distinction between inland waters contained in different water bodies may not always be precise. For example, it may be difficult to make the distinction between what is a lake or an artificial reservoir, or where a river ends and a lake begins. When the separation between two water bodies is not possible, a category combining the two water bodies may be used for compiling statistics. It is important to remember that data items represent an exclu-sive categorization. For example, a water body can either be a lake or an artificial reservoir but not both a lake and an artificial reservoir.
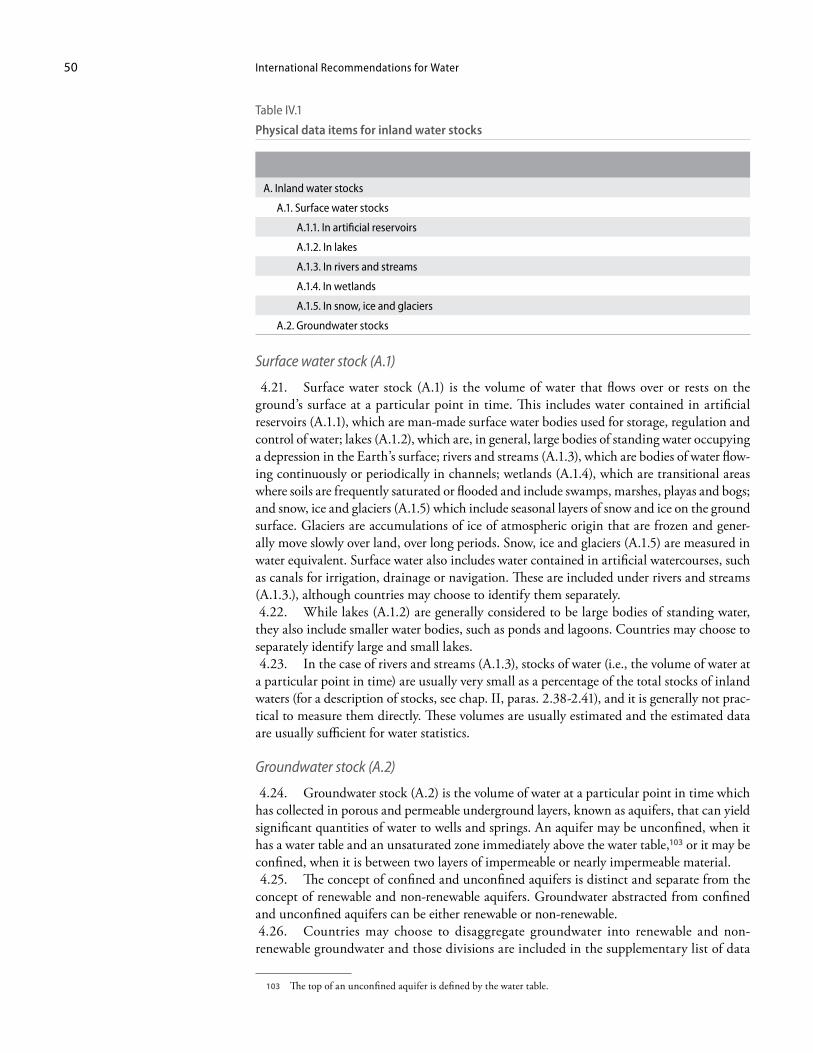
International Recommendations for Water50
Surface water stock (A.1)
4.21. Surface water stock (A.1) is the volume of water that flows over or rests on the ground’s surface at a particular point in time. This includes water contained in artificial reservoirs (A.1.1), which are man-made surface water bodies used for storage, regulation and control of water; lakes (A.1.2), which are, in general, large bodies of standing water occupying a depression in the Earth’s surface; rivers and streams (A.1.3), which are bodies of water flow-ing continuously or periodically in channels; wetlands (A.1.4), which are transitional areas where soils are frequently saturated or flooded and include swamps, marshes, playas and bogs; and snow, ice and glaciers (A.1.5) which include seasonal layers of snow and ice on the ground surface. Glaciers are accumulations of ice of atmospheric origin that are frozen and gener-ally move slowly over land, over long periods. Snow, ice and glaciers (A.1.5) are measured in water equivalent. Surface water also includes water contained in artificial watercourses, such as canals for irrigation, drainage or navigation. These are included under rivers and streams (A.1.3.), although countries may choose to identify them separately. 4.22. While lakes (A.1.2) are generally considered to be large bodies of standing water, they also include smaller water bodies, such as ponds and lagoons. Countries may choose to separately identify large and small lakes. 4.23. In the case of rivers and streams (A.1.3), stocks of water (i.e., the volume of water at a particular point in time) are usually very small as a percentage of the total stocks of inland waters (for a description of stocks, see chap. II, paras. 2.38-2.41), and it is generally not prac-tical to measure them directly. These volumes are usually estimated and the estimated data are usually sufficient for water statistics.
Groundwater stock (A.2)
4.24. Groundwater stock (A.2) is the volume of water at a particular point in time which has collected in porous and permeable underground layers, known as aquifers, that can yield significant quantities of water to wells and springs. An aquifer may be unconfined, when it has a water table and an unsaturated zone immediately above the water table,103 or it may be confined, when it is between two layers of impermeable or nearly impermeable material. 4.25. The concept of confined and unconfined aquifers is distinct and separate from the concept of renewable and non-renewable aquifers. Groundwater abstracted from confined and unconfined aquifers can be either renewable or non-renewable. 4.26. Countries may choose to disaggregate groundwater into renewable and non-renewable groundwater and those divisions are included in the supplementary list of data
103 The top of an unconfined aquifer is defined by the water table.
Table IV.1
Physical data items for inland water stocks
A. Inland water stocks
A.1. Surface water stocks
A.1.1. In artificial reservoirs
A.1.2. In lakes
A.1.3. In rivers and streams
A.1.4. In wetlands
A.1.5. In snow, ice and glaciers
A.2. Groundwater stocks
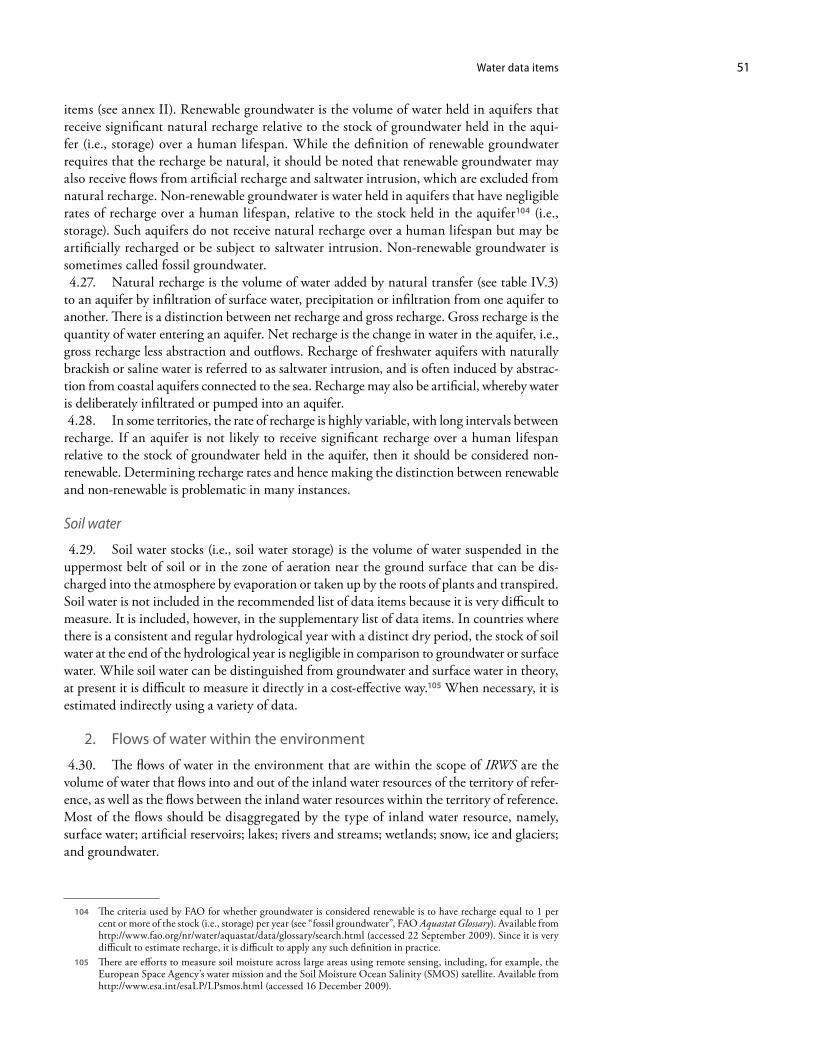
Water data items 51
items (see annex II). Renewable groundwater is the volume of water held in aquifers that receive significant natural recharge relative to the stock of groundwater held in the aqui-fer (i.e., storage) over a human lifespan. While the definition of renewable groundwater requires that the recharge be natural, it should be noted that renewable groundwater may also receive flows from artificial recharge and saltwater intrusion, which are excluded from natural recharge. Non-renewable groundwater is water held in aquifers that have negligible rates of recharge over a human lifespan, relative to the stock held in the aquifer104 (i.e., storage). Such aquifers do not receive natural recharge over a human lifespan but may be artificially recharged or be subject to saltwater intrusion. Non-renewable groundwater is sometimes called fossil groundwater. 4.27. Natural recharge is the volume of water added by natural transfer (see table IV.3) to an aquifer by infiltration of surface water, precipitation or infiltration from one aquifer to another. There is a distinction between net recharge and gross recharge. Gross recharge is the quantity of water entering an aquifer. Net recharge is the change in water in the aquifer, i.e., gross recharge less abstraction and outflows. Recharge of freshwater aquifers with naturally brackish or saline water is referred to as saltwater intrusion, and is often induced by abstrac-tion from coastal aquifers connected to the sea. Recharge may also be artificial, whereby water is deliberately infiltrated or pumped into an aquifer. 4.28. In some territories, the rate of recharge is highly variable, with long intervals between recharge. If an aquifer is not likely to receive significant recharge over a human lifespan relative to the stock of groundwater held in the aquifer, then it should be considered non-renewable. Determining recharge rates and hence making the distinction between renewable and non-renewable is problematic in many instances.
Soil water
4.29. Soil water stocks (i.e., soil water storage) is the volume of water suspended in the uppermost belt of soil or in the zone of aeration near the ground surface that can be dis-charged into the atmosphere by evaporation or taken up by the roots of plants and transpired. Soil water is not included in the recommended list of data items because it is very difficult to measure. It is included, however, in the supplementary list of data items. In countries where there is a consistent and regular hydrological year with a distinct dry period, the stock of soil water at the end of the hydrological year is negligible in comparison to groundwater or surface water. While soil water can be distinguished from groundwater and surface water in theory, at present it is difficult to measure it directly in a cost-effective way.105 When necessary, it is estimated indirectly using a variety of data.
2. Flows of water within the environment
4.30. The flows of water in the environment that are within the scope of IRWS are the volume of water that flows into and out of the inland water resources of the territory of refer-ence, as well as the flows between the inland water resources within the territory of reference. Most of the flows should be disaggregated by the type of inland water resource, namely, surface water; artificial reservoirs; lakes; rivers and streams; wetlands; snow, ice and glaciers; and groundwater.
104 The criteria used by FAO for whether groundwater is considered renewable is to have recharge equal to 1 per cent or more of the stock (i.e., storage) per year (see “fossil groundwater”, FAO Aquastat Glossary). Available from http://www.fao.org/nr/water/aquastat/data/glossary/search.html (accessed 22 September 2009). Since it is very difficult to estimate recharge, it is difficult to apply any such definition in practice.
105 There are efforts to measure soil moisture across large areas using remote sensing, including, for example, the European Space Agency’s water mission and the Soil Moisture Ocean Salinity (SMOS) satellite. Available from http://www.esa.int/esaLP/LPsmos.html (accessed 16 December 2009).
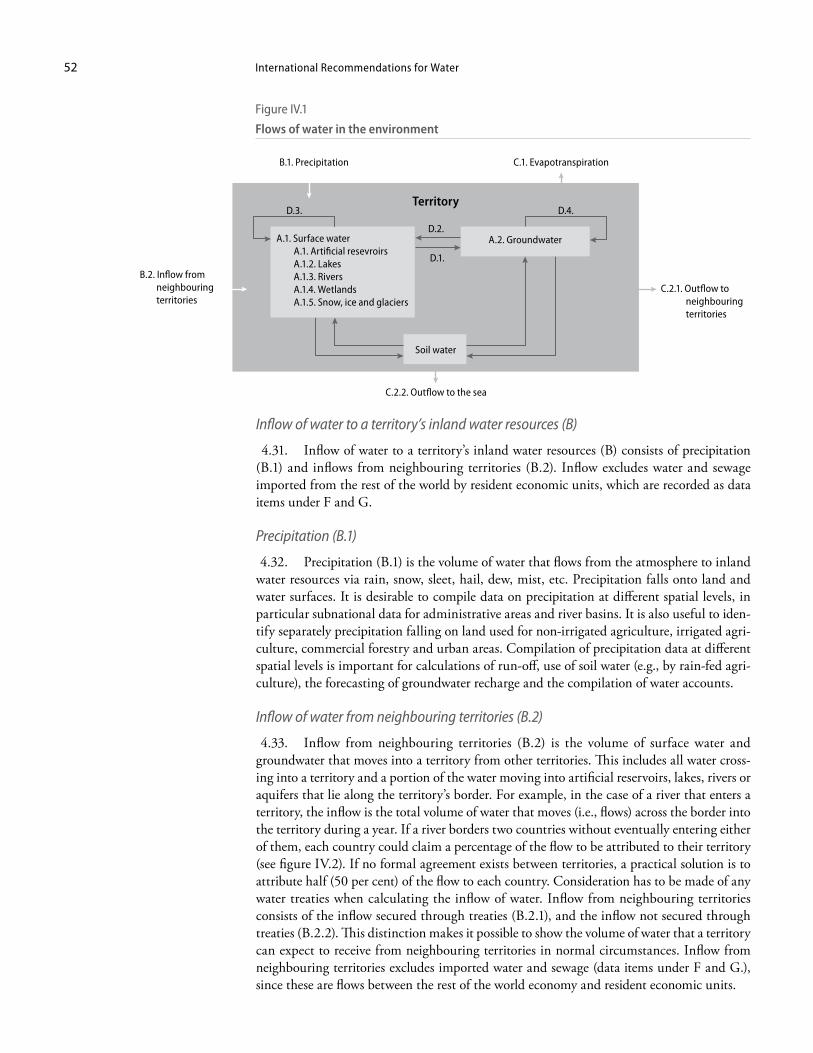
International Recommendations for Water52
Figure IV.1
Flows of water in the environment
Inflow of water to a territory’s inland water resources (B)
4.31. Inflow of water to a territory’s inland water resources (B) consists of precipitation (B.1) and inflows from neighbouring territories (B.2). Inflow excludes water and sewage imported from the rest of the world by resident economic units, which are recorded as data items under F and G.
Precipitation (B.1)
4.32. Precipitation (B.1) is the volume of water that flows from the atmosphere to inland water resources via rain, snow, sleet, hail, dew, mist, etc. Precipitation falls onto land and water surfaces. It is desirable to compile data on precipitation at different spatial levels, in particular subnational data for administrative areas and river basins. It is also useful to iden-tify separately precipitation falling on land used for non-irrigated agriculture, irrigated agri-culture, commercial forestry and urban areas. Compilation of precipitation data at different spatial levels is important for calculations of run-off, use of soil water (e.g., by rain-fed agri-culture), the forecasting of groundwater recharge and the compilation of water accounts.
Inflow of water from neighbouring territories (B.2)
4.33. Inflow from neighbouring territories (B.2) is the volume of surface water and groundwater that moves into a territory from other territories. This includes all water cross-ing into a territory and a portion of the water moving into artificial reservoirs, lakes, rivers or aquifers that lie along the territory’s border. For example, in the case of a river that enters a territory, the inflow is the total volume of water that moves (i.e., flows) across the border into the territory during a year. If a river borders two countries without eventually entering either of them, each country could claim a percentage of the flow to be attributed to their territory (see figure IV.2). If no formal agreement exists between territories, a practical solution is to attribute half (50 per cent) of the flow to each country. Consideration has to be made of any water treaties when calculating the inflow of water. Inflow from neighbouring territories consists of the inflow secured through treaties (B.2.1), and the inflow not secured through treaties (B.2.2). This distinction makes it possible to show the volume of water that a territory can expect to receive from neighbouring territories in normal circumstances. Inflow from neighbouring territories excludes imported water and sewage (data items under F and G.), since these are flows between the rest of the world economy and resident economic units.
Territory
Soil water
A.2. Groundwater
B.1. Precipitation
C.2.2. Outflow to the sea
B.2. Inflow from neighbouring territories
C.2.1. Outflow to neighbouring territories
D.3.
C.1. Evapotranspiration
A.1. Surface waterA.1. Artificial resevroirsA.1.2. LakesA.1.3. RiversA.1.4. WetlandsA.1.5. Snow, ice and glaciers
D.2.
D.4.
D.1.
Water data items 53
Outflow of water from a territory’s inland water resources (C)
4.34. The outflow of water from a territory’s inland water resources (C) consists of evapotranspiration of water from inland water resources (C.1) and the outflow of water to neighbouring territories and the sea (C.2). Outflow of water from a territory’s inland water resources excludes exported water and sewage (data items under F and G) as these are flows between resident economic units and the rest of the world, after being abstracted from the environment.
Evapotranspiration of water from inland water resources (C.1)
4.35. Evapotranspiration of water from inland water resources (C.1) is the volume of water that enters the atmosphere by vaporization of water into a gas through evaporation from land and water surfaces (C.1.1) and transpiration from plants (C.1.2). 4.36. Water statistics use actual evapotranspiration, which represents the amount of water that evaporates from land and water surfaces, as well as that which is transpired by vegeta-tion/plants when the ground is at its natural moisture content as determined by precipitation. Potential evaporation is a different concept and represents the amount of water that would be evaporated if there was unlimited water. Potential evaporation from an open water surface is sometimes called pan evaporation, because it is measured by recording the volume of water evaporated from a pan of water that is replenished regularly. Potential evaporation is not one of the recommended data items. 4.37. Evaporation of water (C.1.1) is the volume of water that enters the atmosphere by vaporization of liquid and solid water to a gas from water and land surfaces. This includes sublimation, which is water that is transformed from ice, snow or part of a glacier directly to water vapour without going through a liquid phase, i.e., without melting. Evaporation of water (C.1.1) consists of water that evaporates directly from surface water and water that evaporates from soil water. 4.38. Transpiration of water from plants (C.1.2) is the volume of water that enters the atmosphere by vaporization of liquid water to a gas from plant surfaces when the ground is at its natural moisture content, as determined by precipitation. If data are available, then transpiration from animals and people can be recorded as supplementary data item C.1.3.
Table IV.2
Physical data items for flows into and out of the territory
B. Inflow of water to a territory’s inland water resources
B.1. Precipitation
B.2. Inflow of water from neighbouring territories
B.2.1. Secured through treaties
B.2.2. Not secured through treaties
C. Outflow of water from a territory’s inland water resources
C.1. Evapotranspiration from inland water resources
C.1.1. Evaporation
C.1.2. Transpiration from plants
C.2. Outflow of water to neighbouring territories and the sea
C.2.1. To neighbouring territories
C.2.1.1. Secured by treaties
C.2.1.2. Not secured by treaties
C.2.2. To the sea
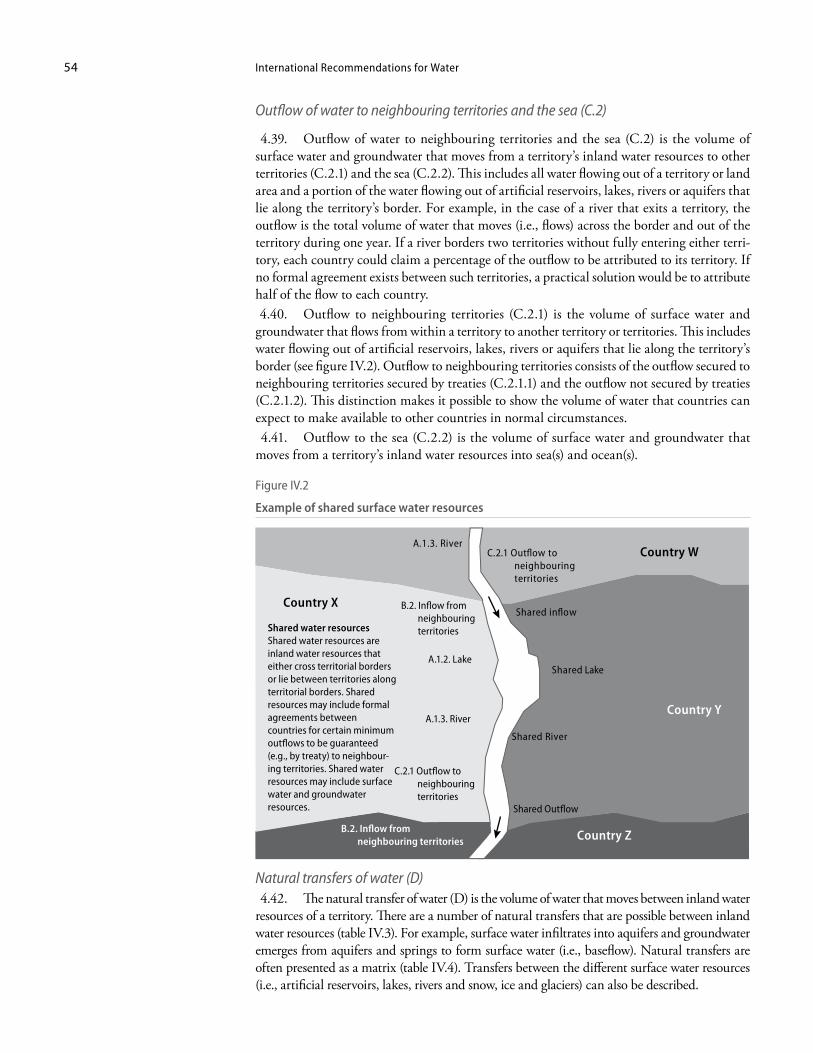
International Recommendations for Water54
Outflow of water to neighbouring territories and the sea (C.2)
4.39. Outflow of water to neighbouring territories and the sea (C.2) is the volume of surface water and groundwater that moves from a territory’s inland water resources to other territories (C.2.1) and the sea (C.2.2). This includes all water flowing out of a territory or land area and a portion of the water flowing out of artificial reservoirs, lakes, rivers or aquifers that lie along the territory’s border. For example, in the case of a river that exits a territory, the outflow is the total volume of water that moves (i.e., flows) across the border and out of the territory during one year. If a river borders two territories without fully entering either terri-tory, each country could claim a percentage of the outflow to be attributed to its territory. If no formal agreement exists between such territories, a practical solution would be to attribute half of the flow to each country. 4.40. Outflow to neighbouring territories (C.2.1) is the volume of surface water and groundwater that flows from within a territory to another territory or territories. This includes water flowing out of artificial reservoirs, lakes, rivers or aquifers that lie along the territory’s border (see figure IV.2). Outflow to neighbouring territories consists of the outflow secured to neighbouring territories secured by treaties (C.2.1.1) and the outflow not secured by treaties (C.2.1.2). This distinction makes it possible to show the volume of water that countries can expect to make available to other countries in normal circumstances. 4.41. Outflow to the sea (C.2.2) is the volume of surface water and groundwater that moves from a territory’s inland water resources into sea(s) and ocean(s).
Figure IV.2
Example of shared surface water resources
Country W
Country X Country Y
Country Z
Shared inflow
C.2.1 Outflow to neighbouring territories
A.1.3. River
Shared River
Shared Lake
Shared water resourcesShared water resources are inland water resources that either cross territorial borders or lie between territories along territorial borders. Shared resources may include formal agreements between countries for certain minimum outflows to be guaranteed (e.g., by treaty) to neighbour-ing territories. Shared water resources may include surface water and groundwater resources. Shared Outflow
C.2.1 Outflow to neighbouring territories
B.2. Inflow from neighbouring territories
B.2. Inflow from neighbouring territories
A.1.2. Lake
A.1.3. River
Country X
Country W
Country Y
Natural transfers of water (D) 4.42. The natural transfer of water (D) is the volume of water that moves between inland water resources of a territory. There are a number of natural transfers that are possible between inland water resources (table IV.3). For example, surface water infiltrates into aquifers and groundwater emerges from aquifers and springs to form surface water (i.e., baseflow). Natural transfers are often presented as a matrix (table IV.4). Transfers between the different surface water resources (i.e., artificial reservoirs, lakes, rivers and snow, ice and glaciers) can also be described.
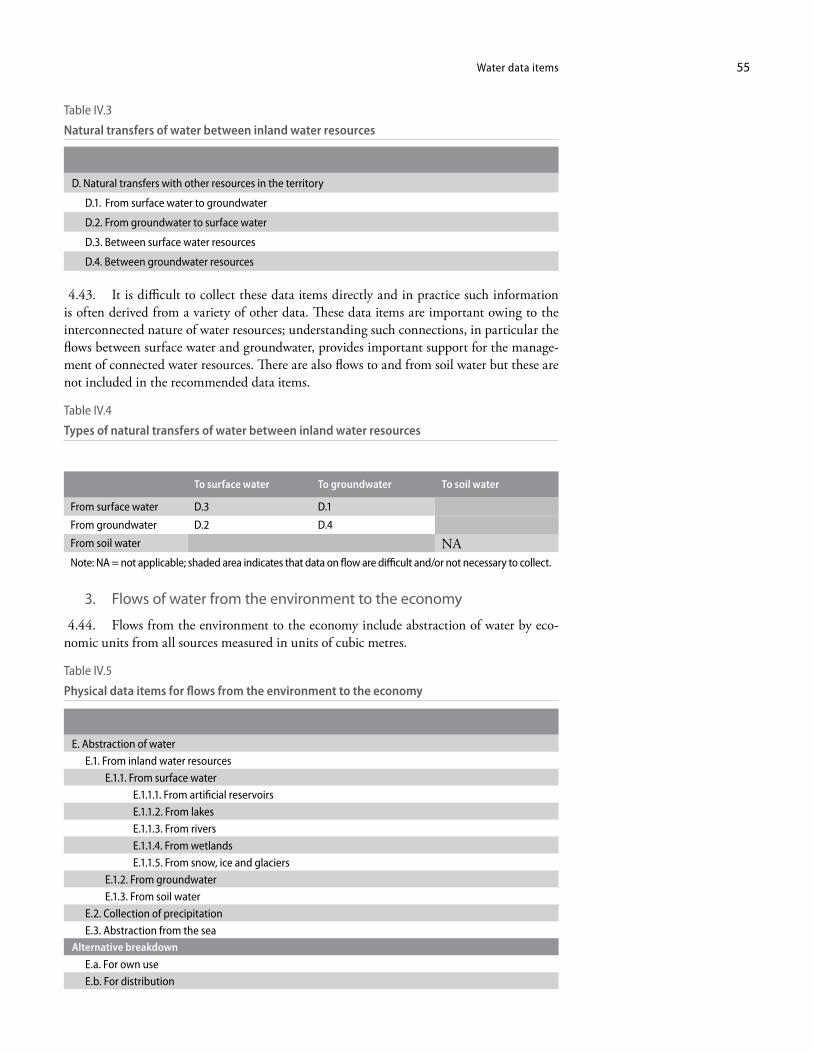
Water data items 55
Table IV.3
Natural transfers of water between inland water resources
D. Natural transfers with other resources in the territory
D.1. From surface water to groundwater
D.2. From groundwater to surface water
D.3. Between surface water resources
D.4. Between groundwater resources
4.43. It is difficult to collect these data items directly and in practice such information is often derived from a variety of other data. These data items are important owing to the interconnected nature of water resources; understanding such connections, in particular the flows between surface water and groundwater, provides important support for the manage-ment of connected water resources. There are also flows to and from soil water but these are not included in the recommended data items.
Table IV.4
Types of natural transfers of water between inland water resources
To surface water To groundwater To soil water
From surface water D.3 D.1
From groundwater D.2 D.4
From soil water NANote: NA = not applicable; shaded area indicates that data on flow are difficult and/or not necessary to collect.
3. Flows of water from the environment to the economy
4.44. Flows from the environment to the economy include abstraction of water by eco-nomic units from all sources measured in units of cubic metres.
Table IV.5
Physical data items for flows from the environment to the economy
E. Abstraction of water
E.1. From inland water resources
E.1.1. From surface water
E.1.1.1. From artificial reservoirs
E.1.1.2. From lakes
E.1.1.3. From rivers
E.1.1.4. From wetlands
E.1.1.5. From snow, ice and glaciers
E.1.2. From groundwater
E.1.3. From soil water
E.2. Collection of precipitation
E.3. Abstraction from the seaAlternative breakdown
E.a. For own use
E.b. For distribution
International Recommendations for Water56
Abstraction of water (E)
4.45. Abstraction of water (E) is the volume of water that is removed or collected by eco-nomic units directly from the environment. The abstraction of water is disaggregated by the source of water: inland water resources (E.1), collection of precipitation (E.2) and abstraction of water from the sea (E.3). Brackish and saline water abstracted for desalinization, cooling or other purposes from the sea, inland surface water or groundwater are recorded as abstraction from the sea (E.3), abstraction of water from surface water (E.1.1) and abstraction of water from groundwater (E.1.2), respectively. In some cases, it may be useful to disaggregate the water sources by salinity class. The volume of water abstracted may also be disaggregated by the purpose for which it is used. Examples of uses are included as supplementary data items (E.a and b). 4.46. In addition to disaggregating by source of water, abstraction can be disaggregated by the type of use, for example, for own use or for distribution. Further possible disaggregating of own use is by purpose: hydroelectricity generation, irrigation, mining, urban run-off, cooling, etc. (see annex II). Water used for hydroelectric power generation is considered an abstraction of water and should be separately identified by the disaggregation of the electricity industry (ISIC 35). In many cases, water abstracted for hydroelectric power generation is returned to the same water body and then abstracted for hydroelectricity generation again downstream. In some cases, the same water is used many times at different places in a river, e.g., in the Danube. 4.47. The water supply (ISIC 36), sewerage (ISIC 37) and agricultural (ISIC 03) indus-tries are usually the most important industries for this group of data items. The water supply industry (ISIC 36) is usually the main supplier of water to industries and households. Agri-culture usually accounts for the largest volume of abstraction. In countries with significant hydropower operations, the electricity industry (ISIC 35) is also an industry of importance. The sewerage industry (ISIC 37) is responsible for the management of urban run-off. For more details on these industries, see chapter III.
Abstraction of water from inland water resources (E.1)
4.48. Abstraction of water from inland water resources (E.1) is the volume of water that is removed by economic units from surface water (E.1.1), groundwater (E.1.2) and soil water (E.1.3). Abstraction of water from inland water resources excludes abstraction of water from the sea or ocean because these are not inland water resources. 4.49. Abstraction of water from surface water (E.1.1) is the volume of water removed by economic units from artificial reservoirs (E.1.1.1), lakes (E.1.1.2), rivers (E.1.1.3), wetlands (E.1.1.4) and snow, ice and glaciers (E.1.1.5). Bank filtration106 is considered an abstraction of surface water. The water supply and agricultural industries are the main industries of interest for these data items. 4.50. Abstraction of water from groundwater (E.1.2) is the volume of water removed by economic units from aquifers and springs. Abstraction of groundwater may be further disag-gregated by abstraction from renewable and non-renewable groundwater. Water is usually abstracted from aquifers via boreholes, dug wells107 or natural springs. Brackish and saline water may also be abstracted from aquifers. By convention, spring water is considered ground-water at the point of the spring.108
106 Bank filtration exploits sediments adjacent to surface water bodies to filter drinking water. Wells are dug in fine, sandy sediments next to surface water bodies. Water abstracted from these wells is filtered through the sediments, thus removing contaminants.
107 Boreholes are bored, driven or drilled into the ground to allow abstraction of groundwater from aquifers. To prevent the holes from caving in, boreholes are constructed with casing or pipes, which also provide protection against infiltration of contaminated run-off (e.g., urban run-off). Dug wells are dug into the ground to access groundwater from aquifers. Dug wells may or may not have lining or casing.
108 It is important to check what convention is used by other agencies and if there is a national convention on whether spring water is considered groundwater or surface water at the point of the spring.
Water data items 57
4.51. Abstraction of water from soil water (E.1.3) includes water use in rain-fed or non-irrigated agriculture and forestry. It is the volume of precipitation that falls onto agricultural fields and is then transpired or incorporated into crops, plantations, orchards, etc. This is broadly equivalent to the concept of green water.
Collection of precipitation (E.2)
4.52. Collection of precipitation (E.2) is the volume of water collected by economic units directly from falling rain, snow, sleet and hail or collected by contact with dew and mist. A typical example of collection of precipitation is roof rain harvesting by households, particu-larly in rural areas. 4.53. Urban run-off is considered to be the collection of precipitation. Urban run-off is the volume of water that does not naturally percolate into the ground or evaporate but flows via overland flow, underflow, channels or in pipes to a defined surface water channel or a constructed infiltration facility. By convention, urban run-off is recorded as a collection of precipitation by the sewerage industry (i.e., part of data item E.2 by ISIC 37) because it is this industry that has the responsibility for building and maintaining the infrastructure (e.g., drains) used to manage urban run-off.
Abstraction of water from the sea (E.3)
4.54. Abstraction of water from the sea (E.3) is the volume of saline water removed by economic units from seas and oceans. Water abstracted from the sea may be desalinated and supplied to other economic units or it may be used with or without desalinization (for example, for cooling) by the economic unit that abstracted the water. The main industries of interest for this data item are the water supply (ISIC 36) and electricity (ISIC 35) industries.Abstraction of water for own use (E.a) and for distribution (E.b). 4.55. Abstraction of water for own use (E.a) is the volume of water abstracted and used by the same economic unit. Abstraction for own use includes abstraction for hydroelectricity generation, irrigation, mining, urban run-off, cooling water and other uses (see annex II). In most cases, there is a close correlation between purpose of use and industry; for example, most water abstracted for hydroelectricity generation is abstracted by the electricity industry (ISIC 35) and water for irrigation is abstracted by the agricultural industry (ISIC 03). 4.56. Abstraction of water for distribution (E.b) is the volume of water abstracted for the purposes of being supplied to other economic units, often after treatment. Most water abstracted for distribution is abstracted by the water supply industry (ISIC 36). However, there may be other establishments, whose primary activity is not the collection, treatment or distribution of water, which abstract and supply water as a secondary activity. For example, some establishments that generate hydroelectric power are classified to electricity generation (ISIC 35) but may also supply water to other economic units as a secondary activity.
4. Flows of water within the economy
4.57. Flows of water within the economy include the supply and use of water by economic units. Supply and use of water are measured in units of cubic metres. These data items make use of the Central Product Classification (see chap. II). An overview of the data items related to the flows of water within the economy is provided in table IV.6 and figure IV.3. 4.58. It is very important to distinguish the water supply (ISIC 36) and sewerage (ISIC 37) industries when disaggregating by industry, because these industries will supply most of the water and receive most of the sewage, respectively, within an economy. Other industries of particular importance to these data items are agriculture (ISIC 03) and electricity (ISIC 35). 4.59. It is important to note that the recycling of water by economic units (i.e., within establishments) is not one of the recommended data items since it is not a flow between differ-
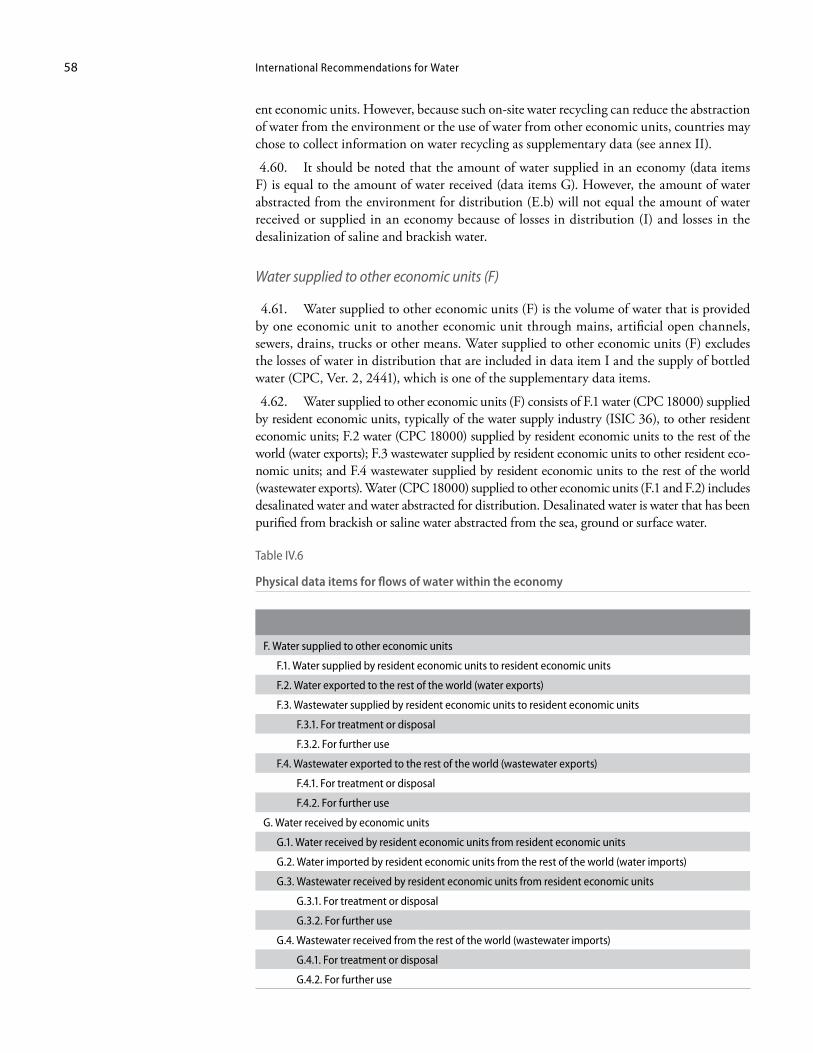
International Recommendations for Water58
ent economic units. However, because such on-site water recycling can reduce the abstraction of water from the environment or the use of water from other economic units, countries may chose to collect information on water recycling as supplementary data (see annex II).
4.60. It should be noted that the amount of water supplied in an economy (data items F) is equal to the amount of water received (data items G). However, the amount of water abstracted from the environment for distribution (E.b) will not equal the amount of water received or supplied in an economy because of losses in distribution (I) and losses in the desalinization of saline and brackish water.
Water supplied to other economic units (F)
4.61. Water supplied to other economic units (F) is the volume of water that is provided by one economic unit to another economic unit through mains, artificial open channels, sewers, drains, trucks or other means. Water supplied to other economic units (F) excludes the losses of water in distribution that are included in data item I and the supply of bottled water (CPC, Ver. 2, 2441), which is one of the supplementary data items.
4.62. Water supplied to other economic units (F) consists of F.1 water (CPC 18000) supplied by resident economic units, typically of the water supply industry (ISIC 36), to other resident economic units; F.2 water (CPC 18000) supplied by resident economic units to the rest of the world (water exports); F.3 wastewater supplied by resident economic units to other resident eco-nomic units; and F.4 wastewater supplied by resident economic units to the rest of the world (wastewater exports). Water (CPC 18000) supplied to other economic units (F.1 and F.2) includes desalinated water and water abstracted for distribution. Desalinated water is water that has been purified from brackish or saline water abstracted from the sea, ground or surface water.
Table IV.6
Physical data items for flows of water within the economy
F. Water supplied to other economic units
F.1. Water supplied by resident economic units to resident economic units
F.2. Water exported to the rest of the world (water exports)
F.3. Wastewater supplied by resident economic units to resident economic units
F.3.1. For treatment or disposal
F.3.2. For further use
F.4. Wastewater exported to the rest of the world (wastewater exports)
F.4.1. For treatment or disposal
F.4.2. For further use
G. Water received by economic units
G.1. Water received by resident economic units from resident economic units
G.2. Water imported by resident economic units from the rest of the world (water imports)
G.3. Wastewater received by resident economic units from resident economic units
G.3.1. For treatment or disposal
G.3.2. For further use
G.4. Wastewater received from the rest of the world (wastewater imports)
G.4.1. For treatment or disposal
G.4.2. For further use
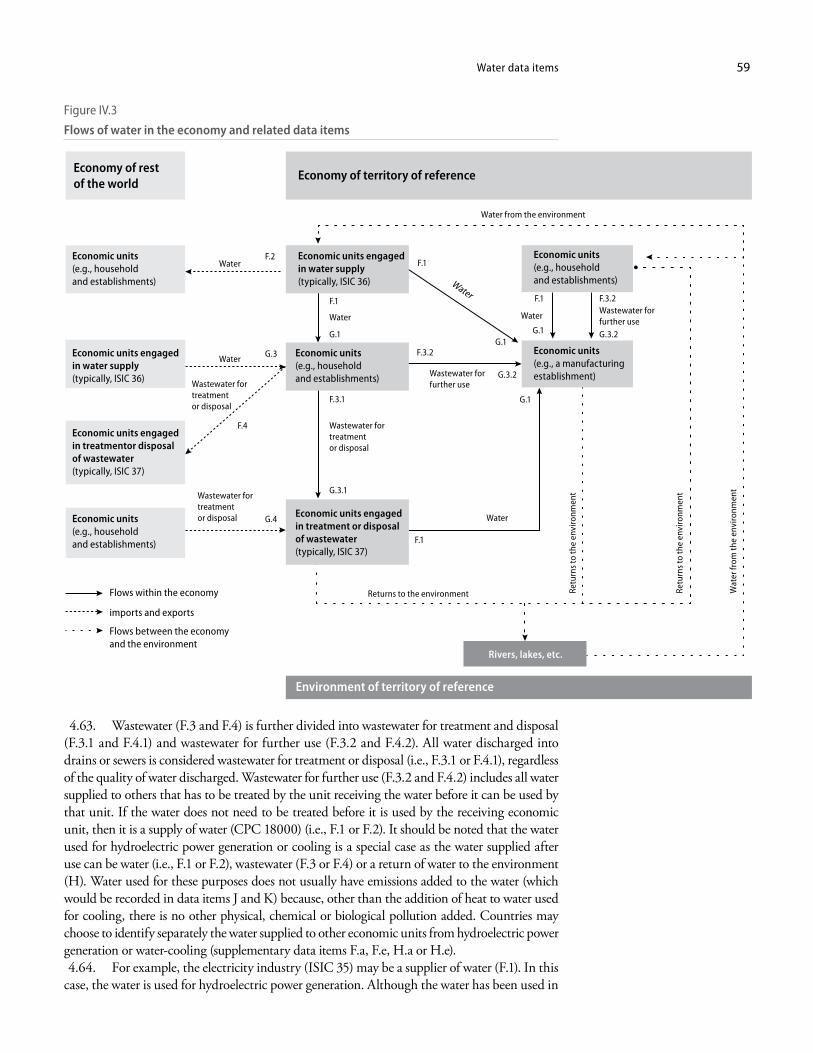
Water data items 59
4.63. Wastewater (F.3 and F.4) is further divided into wastewater for treatment and disposal (F.3.1 and F.4.1) and wastewater for further use (F.3.2 and F.4.2). All water discharged into drains or sewers is considered wastewater for treatment or disposal (i.e., F.3.1 or F.4.1), regardless of the quality of water discharged. Wastewater for further use (F.3.2 and F.4.2) includes all water supplied to others that has to be treated by the unit receiving the water before it can be used by that unit. If the water does not need to be treated before it is used by the receiving economic unit, then it is a supply of water (CPC 18000) (i.e., F.1 or F.2). It should be noted that the water used for hydroelectric power generation or cooling is a special case as the water supplied after use can be water (i.e., F.1 or F.2), wastewater (F.3 or F.4) or a return of water to the environment (H). Water used for these purposes does not usually have emissions added to the water (which would be recorded in data items J and K) because, other than the addition of heat to water used for cooling, there is no other physical, chemical or biological pollution added. Countries may choose to identify separately the water supplied to other economic units from hydroelectric power generation or water-cooling (supplementary data items F.a, F.e, H.a or H.e). 4.64. For example, the electricity industry (ISIC 35) may be a supplier of water (F.1). In this case, the water is used for hydroelectric power generation. Although the water has been used in
Figure IV.3
Flows of water in the economy and related data items
Economy of territory of reference
Environment of territory of reference
Economy of rest of the world
Economic units(e.g., householdand establishments)
Economic units(e.g., household and establishments)
Economic units engagedin treatmentor disposal of wastewater (typically, ISIC 37)
Economic units engaged in treatment or disposal of wastewater (typically, ISIC 37)
Water from the environment
Water
Water
Water
Wastewater fortreatment or disposal
Wastewater fortreatment or disposal
Economic units engagedin water supply(typically, ISIC 36)
Economic units engaged in water supply(typically, ISIC 36)
Economic units(e.g., household and establishments)
F.2
F.4
G.4
G.3
Economic units(e.g., household and establishments)
WaterWastewater forfurther use
Economic units(e.g., a manufacturingestablishment)
G.1 G.1
F.1 F.1
G.3.2
F.3.2
F.3.1
G.3.1
Retu
rns t
o th
e en
viro
nmen
t
Wastewater fortreatment or disposal
F.3.2
G.3.2Wastewater forfurther use
F.1
G.1
Retu
rns t
o th
e en
viro
nmen
t
Returns to the environment
F.1
G.1
Water
Wat
er fr
om th
e en
viro
nmen
t
Water
Rivers, lakes, etc.
Flows within the economy
imports and exports
Flows between the economy and the environment
International Recommendations for Water60
production processes, the quality of the water has been unaltered and it can be supplied for most uses without treatment. Similarly, the sewerage industry (ISIC 37) may also supply water (F.1) to economic units, such as to the water supply (ISIC 36) or agricultural (ISIC 01) industries. In many cases, this water has been treated by the sewerage industry and does not need to be treated by the receiver. However, if this water requires treatment by the receiver prior to use (i.e., it is supplied untreated), then it is a supply of wastewater not for treatment or disposal (for further use, F.3.2 or F.4.2). It should be noted that data items J and K record the waterborne emissions (or volume of pollution) contained in the water discharged by economic units. 4.65. There are two exceptions to the treatment before use criteria for classifying waste-water. The first is water that is treated to be made suitable for specialized processes, such as the sterilization of water for medical purposes or the purification or distillation of water for other industrial purposes. The second is the use of water filters by households. By convention, these flows are recorded as a supply of water (CPC 18000) (F.1 or F.2). 4.66. It is important to note that economic units of the water supply industry (ISIC 36) may supply water to other units of the water supply industry. These are known as intra-sectoral transfers and it is important to identify and record them. These transfers do not usually involve many units but may involve large volumes of water. How these transfers are presented depends on the purpose for which the data are used. In water accounts, the main supply and use tables are presented after deducting intra-sectoral transfers within the water supply industry (ISIC 36).
Water received from other economic units (G)
4.67. Water received from other economic units (G) is the volume of water that has been delivered from one economic unit to another economic unit, through mains, artificial open channels, sewers, drains, trucks or other means. Water received from other economic units (G) excludes water abstracted directly from the environment (included in data item E), and bottled water (CPC, Ver. 2, 2441), which is included as a supplementary data item. 4.68. Water received from other economic units (G) consists of G.1 water (CPC 18000) received by resident economic units from other resident economic units; G.2 water (CPC 18000) received by resident economic units from the rest of the world (water imports); G.3 wastewater received by resident economic units from other resident economic units; and G.4 wastewater received by resident economic units from the rest of the world (wastewater imports). Wastewater (G.3 and G.4) is further divided into wastewater received for treatment and disposal (G.3.1 and G.4.1) and wastewater received not for treatment and disposal (for further use, G.3.2 and G.4.2).
5. Flows of water from the economy to the environment
4.69. Flows of water (including polluted water) from the economy to the environment are called returns or discharges to the environment. They are measured in units of cubic metres. Returns should be disaggregated to industries and households. 4.70. The sewerage industry (ISIC 37) is particularly important, because this industry will return much of the water to the environment. Discharges are classified according to the receiving media (i.e., inland water resources, the sea or land) and to the type of water (e.g., treated water or untreated water). It is important to record the main waterborne emissions (K) contained in this water.
Returns of water to the environment (H)
4.71. Returns of water to the environment (H) are the volumes of water that flow from economic units directly to inland water resources (H.1), the sea (H.2) or to land (H.3). An alternative disaggregation is by treated (H.a) or untreated (H.b) water, while discharges after
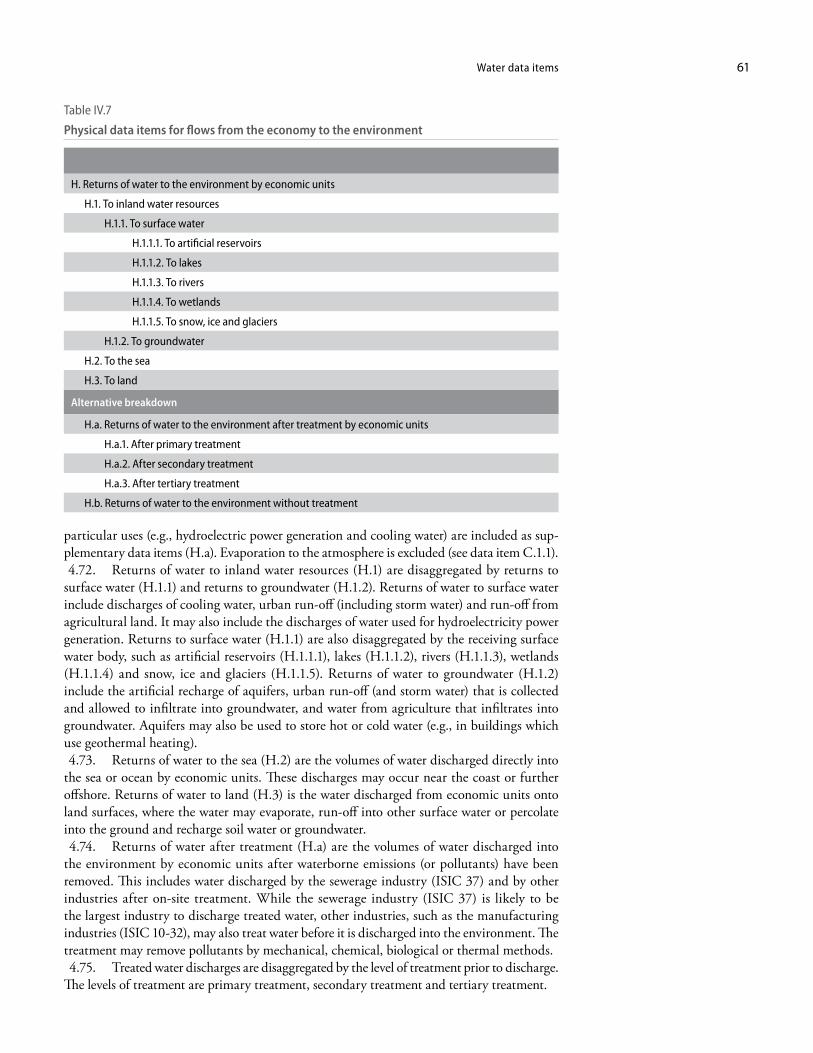
Water data items 61
particular uses (e.g., hydroelectric power generation and cooling water) are included as sup-plementary data items (H.a). Evaporation to the atmosphere is excluded (see data item C.1.1). 4.72. Returns of water to inland water resources (H.1) are disaggregated by returns to surface water (H.1.1) and returns to groundwater (H.1.2). Returns of water to surface water include discharges of cooling water, urban run-off (including storm water) and run-off from agricultural land. It may also include the discharges of water used for hydroelectricity power generation. Returns to surface water (H.1.1) are also disaggregated by the receiving surface water body, such as artificial reservoirs (H.1.1.1), lakes (H.1.1.2), rivers (H.1.1.3), wetlands (H.1.1.4) and snow, ice and glaciers (H.1.1.5). Returns of water to groundwater (H.1.2) include the artificial recharge of aquifers, urban run-off (and storm water) that is collected and allowed to infiltrate into groundwater, and water from agriculture that infiltrates into groundwater. Aquifers may also be used to store hot or cold water (e.g., in buildings which use geothermal heating). 4.73. Returns of water to the sea (H.2) are the volumes of water discharged directly into the sea or ocean by economic units. These discharges may occur near the coast or further offshore. Returns of water to land (H.3) is the water discharged from economic units onto land surfaces, where the water may evaporate, run-off into other surface water or percolate into the ground and recharge soil water or groundwater. 4.74. Returns of water after treatment (H.a) are the volumes of water discharged into the environment by economic units after waterborne emissions (or pollutants) have been removed. This includes water discharged by the sewerage industry (ISIC 37) and by other industries after on-site treatment. While the sewerage industry (ISIC 37) is likely to be the largest industry to discharge treated water, other industries, such as the manufacturing industries (ISIC 10-32), may also treat water before it is discharged into the environment. The treatment may remove pollutants by mechanical, chemical, biological or thermal methods. 4.75. Treated water discharges are disaggregated by the level of treatment prior to discharge. The levels of treatment are primary treatment, secondary treatment and tertiary treatment.
Table IV.7
Physical data items for flows from the economy to the environment
H. Returns of water to the environment by economic units
H.1. To inland water resources
H.1.1. To surface water
H.1.1.1. To artificial reservoirs
H.1.1.2. To lakes
H.1.1.3. To rivers
H.1.1.4. To wetlands
H.1.1.5. To snow, ice and glaciers
H.1.2. To groundwater
H.2. To the sea
H.3. To land
Alternative breakdown
H.a. Returns of water to the environment after treatment by economic units
H.a.1. After primary treatment
H.a.2. After secondary treatment
H.a.3. After tertiary treatment
H.b. Returns of water to the environment without treatment
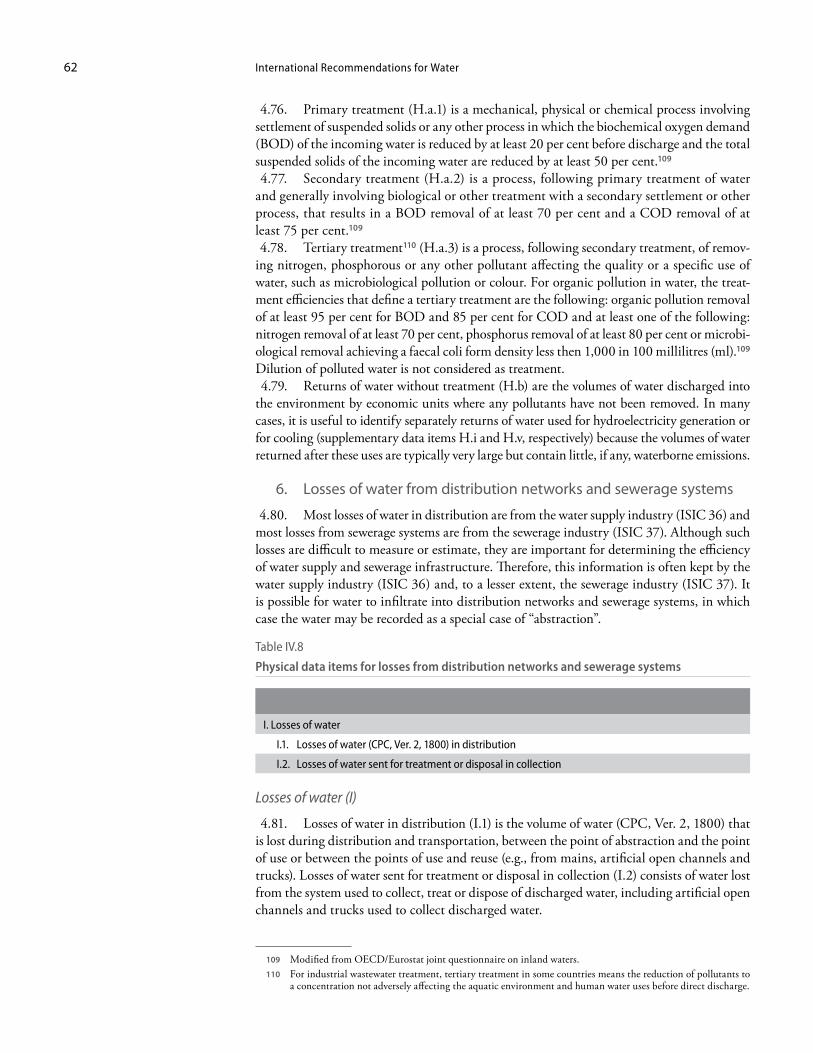
International Recommendations for Water62
4.76. Primary treatment (H.a.1) is a mechanical, physical or chemical process involving settlement of suspended solids or any other process in which the biochemical oxygen demand (BOD) of the incoming water is reduced by at least 20 per cent before discharge and the total suspended solids of the incoming water are reduced by at least 50 per cent.109
4.77. Secondary treatment (H.a.2) is a process, following primary treatment of water and generally involving biological or other treatment with a secondary settlement or other process, that results in a BOD removal of at least 70 per cent and a COD removal of at least 75 per cent.109
4.78. Tertiary treatment110 (H.a.3) is a process, following secondary treatment, of remov-ing nitrogen, phosphorous or any other pollutant affecting the quality or a specific use of water, such as microbiological pollution or colour. For organic pollution in water, the treat-ment efficiencies that define a tertiary treatment are the following: organic pollution removal of at least 95 per cent for BOD and 85 per cent for COD and at least one of the following: nitrogen removal of at least 70 per cent, phosphorus removal of at least 80 per cent or microbi-ological removal achieving a faecal coli form density less then 1,000 in 100 millilitres (ml).109 Dilution of polluted water is not considered as treatment. 4.79. Returns of water without treatment (H.b) are the volumes of water discharged into the environment by economic units where any pollutants have not been removed. In many cases, it is useful to identify separately returns of water used for hydroelectricity generation or for cooling (supplementary data items H.i and H.v, respectively) because the volumes of water returned after these uses are typically very large but contain little, if any, waterborne emissions.
6. Losses of water from distribution networks and sewerage systems
4.80. Most losses of water in distribution are from the water supply industry (ISIC 36) and most losses from sewerage systems are from the sewerage industry (ISIC 37). Although such losses are difficult to measure or estimate, they are important for determining the efficiency of water supply and sewerage infrastructure. Therefore, this information is often kept by the water supply industry (ISIC 36) and, to a lesser extent, the sewerage industry (ISIC 37). It is possible for water to infiltrate into distribution networks and sewerage systems, in which case the water may be recorded as a special case of “abstraction”.
Table IV.8
Physical data items for losses from distribution networks and sewerage systems
I. Losses of water
I.1. Losses of water (CPC, Ver. 2, 1800) in distribution
I.2. Losses of water sent for treatment or disposal in collection
Losses of water (I)
4.81. Losses of water in distribution (I.1) is the volume of water (CPC, Ver. 2, 1800) that is lost during distribution and transportation, between the point of abstraction and the point of use or between the points of use and reuse (e.g., from mains, artificial open channels and trucks). Losses of water sent for treatment or disposal in collection (I.2) consists of water lost from the system used to collect, treat or dispose of discharged water, including artificial open channels and trucks used to collect discharged water.
109 Modified from OECD/Eurostat joint questionnaire on inland waters. 110 For industrial wastewater treatment, tertiary treatment in some countries means the reduction of pollutants to
a concentration not adversely affecting the aquatic environment and human water uses before direct discharge.
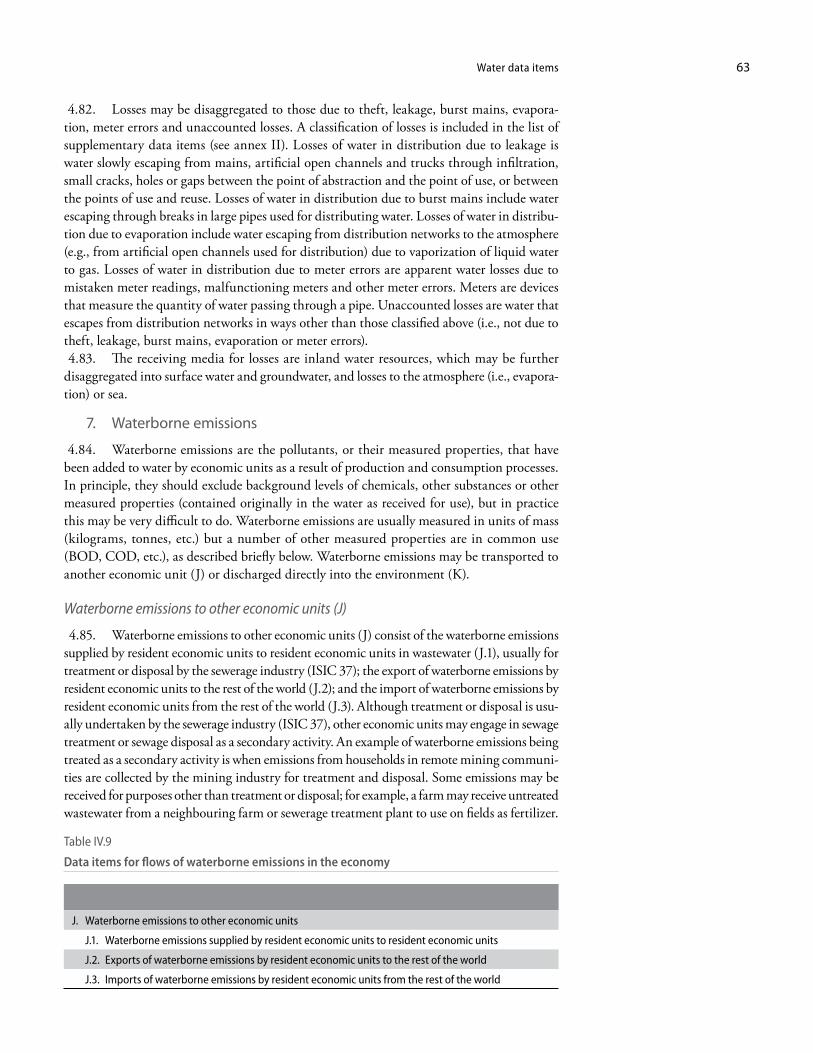
Water data items 63
4.82. Losses may be disaggregated to those due to theft, leakage, burst mains, evapora-tion, meter errors and unaccounted losses. A classification of losses is included in the list of supplementary data items (see annex II). Losses of water in distribution due to leakage is water slowly escaping from mains, artificial open channels and trucks through infiltration, small cracks, holes or gaps between the point of abstraction and the point of use, or between the points of use and reuse. Losses of water in distribution due to burst mains include water escaping through breaks in large pipes used for distributing water. Losses of water in distribu-tion due to evaporation include water escaping from distribution networks to the atmosphere (e.g., from artificial open channels used for distribution) due to vaporization of liquid water to gas. Losses of water in distribution due to meter errors are apparent water losses due to mistaken meter readings, malfunctioning meters and other meter errors. Meters are devices that measure the quantity of water passing through a pipe. Unaccounted losses are water that escapes from distribution networks in ways other than those classified above (i.e., not due to theft, leakage, burst mains, evaporation or meter errors). 4.83. The receiving media for losses are inland water resources, which may be further disaggregated into surface water and groundwater, and losses to the atmosphere (i.e., evapora-tion) or sea.
7. Waterborne emissions
4.84. Waterborne emissions are the pollutants, or their measured properties, that have been added to water by economic units as a result of production and consumption processes. In principle, they should exclude background levels of chemicals, other substances or other measured properties (contained originally in the water as received for use), but in practice this may be very difficult to do. Waterborne emissions are usually measured in units of mass (kilograms, tonnes, etc.) but a number of other measured properties are in common use (BOD, COD, etc.), as described briefly below. Waterborne emissions may be transported to another economic unit (J) or discharged directly into the environment (K).
Waterborne emissions to other economic units (J)
4.85. Waterborne emissions to other economic units (J) consist of the waterborne emissions supplied by resident economic units to resident economic units in wastewater (J.1), usually for treatment or disposal by the sewerage industry (ISIC 37); the export of waterborne emissions by resident economic units to the rest of the world (J.2); and the import of waterborne emissions by resident economic units from the rest of the world (J.3). Although treatment or disposal is usu-ally undertaken by the sewerage industry (ISIC 37), other economic units may engage in sewage treatment or sewage disposal as a secondary activity. An example of waterborne emissions being treated as a secondary activity is when emissions from households in remote mining communi-ties are collected by the mining industry for treatment and disposal. Some emissions may be received for purposes other than treatment or disposal; for example, a farm may receive untreated wastewater from a neighbouring farm or sewerage treatment plant to use on fields as fertilizer.
Table IV.9 Data items for flows of waterborne emissions in the economy
J. Waterborne emissions to other economic units
J.1. Waterborne emissions supplied by resident economic units to resident economic units
J.2. Exports of waterborne emissions by resident economic units to the rest of the world
J.3. Imports of waterborne emissions by resident economic units from the rest of the world
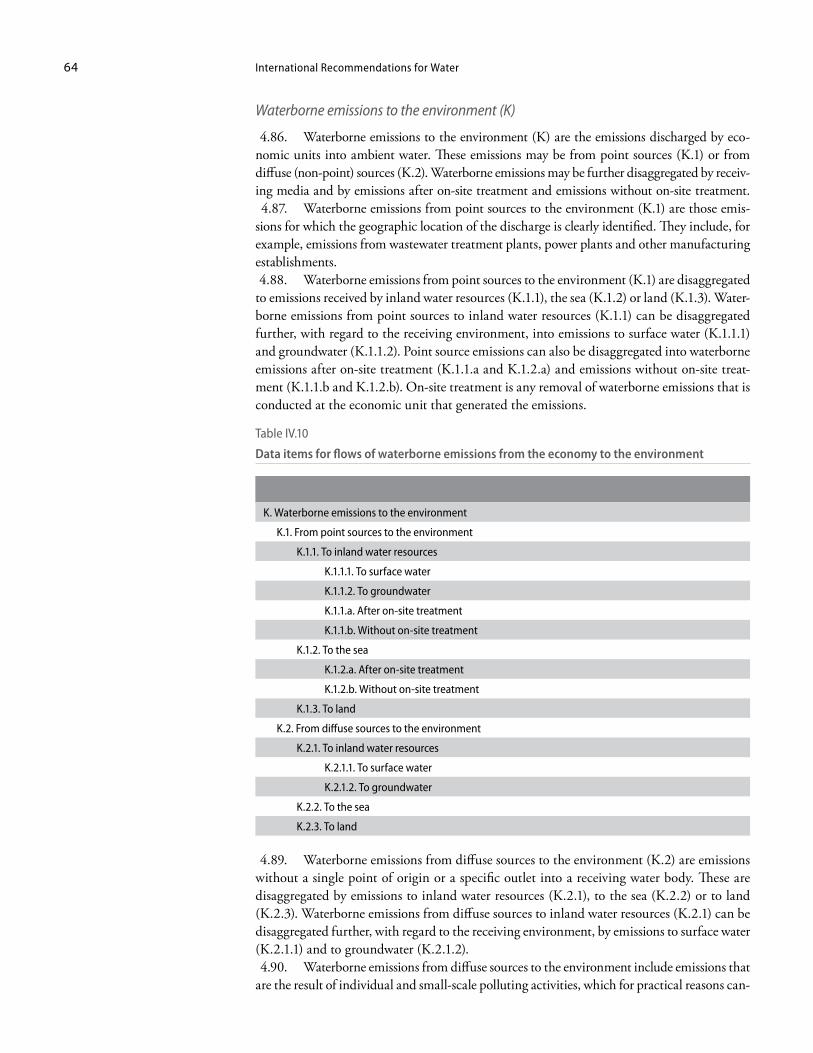
International Recommendations for Water64
Waterborne emissions to the environment (K)
4.86. Waterborne emissions to the environment (K) are the emissions discharged by eco-nomic units into ambient water. These emissions may be from point sources (K.1) or from diffuse (non-point) sources (K.2). Waterborne emissions may be further disaggregated by receiv-ing media and by emissions after on-site treatment and emissions without on-site treatment. 4.87. Waterborne emissions from point sources to the environment (K.1) are those emis-sions for which the geographic location of the discharge is clearly identified. They include, for example, emissions from wastewater treatment plants, power plants and other manufacturing establishments. 4.88. Waterborne emissions from point sources to the environment (K.1) are disaggregated to emissions received by inland water resources (K.1.1), the sea (K.1.2) or land (K.1.3). Water-borne emissions from point sources to inland water resources (K.1.1) can be disaggregated further, with regard to the receiving environment, into emissions to surface water (K.1.1.1) and groundwater (K.1.1.2). Point source emissions can also be disaggregated into waterborne emissions after on-site treatment (K.1.1.a and K.1.2.a) and emissions without on-site treat-ment (K.1.1.b and K.1.2.b). On-site treatment is any removal of waterborne emissions that is conducted at the economic unit that generated the emissions.
Table IV.10
Data items for flows of waterborne emissions from the economy to the environment
K. Waterborne emissions to the environment
K.1. From point sources to the environment
K.1.1. To inland water resources
K.1.1.1. To surface water
K.1.1.2. To groundwater
K.1.1.a. After on-site treatment
K.1.1.b. Without on-site treatment
K.1.2. To the sea
K.1.2.a. After on-site treatment
K.1.2.b. Without on-site treatment
K.1.3. To land
K.2. From diffuse sources to the environment
K.2.1. To inland water resources
K.2.1.1. To surface water
K.2.1.2. To groundwater
K.2.2. To the sea
K.2.3. To land
4.89. Waterborne emissions from diffuse sources to the environment (K.2) are emissions without a single point of origin or a specific outlet into a receiving water body. These are disaggregated by emissions to inland water resources (K.2.1), to the sea (K.2.2) or to land (K.2.3). Waterborne emissions from diffuse sources to inland water resources (K.2.1) can be disaggregated further, with regard to the receiving environment, by emissions to surface water (K.2.1.1) and to groundwater (K.2.1.2). 4.90. Waterborne emissions from diffuse sources to the environment include emissions that are the result of individual and small-scale polluting activities, which for practical reasons can-
Water data items 65
not be treated as individual point sources of pollution. An example is the run-off from urban areas or agricultural land. Urban run-off emissions occur when pollutants are washed away after being deposited in urban areas, often as a result of transport or other economic activities. Diffuse waterborne emissions of nutrients and hazardous chemicals occur when nutrients and hazardous chemicals from fertilizers and pesticides that have been spread over the soil and crops dissolve into water, which infiltrates into groundwater or runs off into surface water.
8. Types of waterborne emissions to be measured
4.91. The data items on waterborne emissions correspond with data items on water dis-charged to other economic units and to the environment. For example, point source water-borne emissions from the sewerage industry (ISIC 37) will record the emissions borne in the discharges of water from the sewerage industry (ISIC 37) to the environment. Diffuse waterborne emissions from agriculture correspond with the discharges of water from agricul-tural land. Diffuse emissions from urban areas correspond with the discharges of water from urban run-off. Waterborne emissions from other diffuse sources are not normally estimated for practical reasons. 4.92. Waterborne emissions can be measured directly as the quantity of pollutant con-tained in the water discharged, or indirectly by measuring the properties (i.e., the effects) of pollutants contained in the water. Measures of waterborne emissions include oxygen demand, quantities of nutrients (e.g., nitrogen, phosphorus and potassium), salts, the quantity of sus-pended solids, and quantities of specific hazardous substances (e.g., arsenic or cyanide). Ide-ally, natural background levels of oxygen demand, nutrients, suspended solids or hazardous substances (contained originally in the water as received for use) should be excluded from emissions statistics. In practice, these background concentrations are not always known and may be difficult to distinguish. 4.93. The recommended measures of waterborne emissions for which statistics should be collected and compiled include BOD, COD, nitrogen, phosphorus and total suspended solids. Countries should seek expert advice to determine which other hazardous substances to produce statistics on, because hazardous substances contained in waterborne emissions differ from country to country, depending on the existing economic activities and technologies or other biological and chemical considerations.111
4.94. It is important to be aware that the measurement of waterborne emissions can be expensive and may limit the number of hazardous substances for which waterborne emissions data are collected.
Oxygen demand
4.95. Oxygen demand is the demand for dissolved oxygen in water caused by organic and inorganic matter, and is measured using parameters such as BOD, COD and TOD (total organic oxygen demand). BOD refers to the content of biodegradable organic matter in water. This is the organic matter that can be easily destroyed (e.g., 5 days at 20°C and in the dark) by biological life, mainly bacteria, present in the wastewater. COD is the mass concentration of oxygen consumed under specific conditions by the chemical oxidation of organic and inorganic matter, in water, with bichromate. Other parameters describing the content of organic and oxidizable matter are TOC (total organic carbon) or TOD. They are relevant for operation of wastewater treatment plants but are not usually collected or compiled for water statistics.
111 For more information on the measurement for waterborne emissions, see European Environment Agency, “Guid-ance on the reporting required for assessing the state of, and trends in, the water environment at the European level”, 2009. Available from http://eea.eionet.europa.eu/Public/irc/eionet-circle/water/library?l=/reporting_ eionetwfd/guidance_2009pdf/_EN_1.0_&a=d (accessed 15 December 2009).
International Recommendations for Water66
Nutrients
4.96. Nutrients are the substances that organisms (i.e., plants and animals) need to grow and survive. However, too many nutrients can have serious impacts on human health and may lead to rapid plant growth and the depletion of oxygen and life in water (e.g., algal blooms, red tides). Key nutrients include nitrogen, phosphorus and potassium. Nitrogen occurs in several compounds, e.g., ammonia, ammonium, nitrite or nitrate, depending on such factors as acidity, temperature and oxygen concentration. Similarly, phosphorus can be found in different compounds, e.g., orthophosphates, condensed phosphates and organically bound phosphorus. Potassium is found in many minerals and clays and can be found in compounds dissolved in water, e.g., potassium hydroxide, potassium dichromate, potassium permanganate or potassium iodide.
Suspended solids
4.97. Suspended solids are small particles of solid pollutants in water that contribute to turbidity and resist separation by water treatment. Suspended solids are usually measured in terms of total suspended solids, which are also referred to as total suspended non-filterable solids (i.e., they cannot be filtered out of water using a filter).
Hazardous substances
4.98. Hazardous substances are substances that can harm humans or other organisms. Due to the large number of such substances and their highly varied effects under different circumstances, it should be decided on a case-by-case basis which substances are suitable for inclusion in statistical data collections. Examples of such substances, include.112
• Persistent hydrocarbons and persistent and bioaccumulable organic toxic substances• Arsenic and its compounds• Metals and their compounds (e.g., cadmium, mercury, copper, chromium, nickel,
lead and zinc)• Cyanides• Biocides and plant protection products• Organohalogen compounds and substances, which may form such compounds in
the aquatic environment. These are usually measured as AOX (absorbable organically bound halogens).
• Organophosphorous compounds• Organotin compounds• Substances and preparations (or the breakdown products of such) which have been
proven to possess carcinogenic or mutagenic properties or properties that may affect steroidogenic, thyroid, reproduction or other endocrine-related functions in or via the aquatic environment
D. Monetary water data items 4.99. Monetary data items relate to the abstraction of water by the economy from the envi-ronment, the supply and use of water, wastewater and sewerage services within the economy, and the discharge of water from the economy into the environment. They relate to water abstracted for own use and for distribution, as well as the wastewater received for treatment and disposal (e.g., by sewerage networks) and the water treated on-site before being discharged.
112 This list is not comprehensive and includes substances according to chemistry in some cases and their effects in other cases.
Water data items 67
4.100. These data items include information on the monetary value of the physical flows of water to, within and out from the economy, as well as on the value of the infrastructure used for water supply and sewerage services. The data items are measured in local currency. 4.101. The data items in this section are consistent with the data items of the IRIS, but have been interpreted and further elaborated to show details important for water statistics. In particular, they have been expanded to cover households as well as establishments. The equivalent data items of IRIS are indicated in the text as well as in the relevant tables (see tables IV.11-IV.14).
1. Value and costs of water and sewerage services
4.102. The data items below should be collected for all economic units (establishments and households), in particular for those engaged in water collection, treatment and supply, or sewerage collection and treatment activities for data items L.1, L.2 and L.3. Water collec-tion, treatment and supply are the primary activities of the water supply industry (ISIC 36), while wastewater collection and treatment are the primary activities of the sewerage industry (ISIC 37). Economic units classified to other industries may also undertake these as secondary activities and households may also have costs associated with supplying water and sewerage services for own use.
Value of shipments/sales/turnover (L.1) (IRIS 5.1)
4.103. Value of shipments/sales/turnover (L.1) is data item 5.1 of IRIS. For water statistics, it is further disaggregated to L.1.1, value of water sales (CPC 18000) and L.1.2, value of sales of sewerage services (CPC 94100). Each of these is further disaggregated by sales to resident economic units (L.1.1.1 and L.1.2.1) and sales (or exports) to the rest of the world (L.1.1.2 and L.1.2.2). For both sales of water and sewerage services, this excludes product taxes (e.g., value added taxes (VAT)) collected on behalf of government and subsidies, which are included in data items M.1 and N.1, respectively. In national accounts terms, this is known as the value at basic price. It should be noted that, since water is usually sold directly to water users by producers, there are usually no wholesale or retail margins and therefore these do not usually contribute to the difference between the basic price and the purchaser’s price. 4.104. The value of sales of water (CPC 18000) (L.1.1) includes charges for water and water supply service charges. For units of the water supply industry (ISIC 36), data item L.1.1 should represent the majority of the value of data item L.1. Data item L.1.1 is important where other industries, such as the electricity (ISIC 35) or sewerage industries (ISIC 37), supply water as a secondary activity. In national accounts terms, this is known as the purchaser’s price. 4.105. Sale of sewerage services (CPC 94100) (L.1.2) includes all charges for the supply of sewerage services. For units of the sewerage industry (ISIC 37), data item L.1.2 should represent the majority of the value of data item L.1. In national accounts terms, this is known as the purchaser’s price.
Compensation of employees (L.2) (IRIS 3.1)
4.106. Compensation of employees (L.2) is data item 3.1 of IRIS. This represents the remu-neration (in cash or in kind) paid to employees of economic units. For water statistics, data item L.2 is disaggregated to L.2.1, compensation of employees related to water supply activi-ties, and L.2.2, compensation of employees related to sewerage services. For units of the water supply industry (ISIC 36), the value of L.2.1 should be the majority of the value of L.2. Similarly, for units of the sewerage industry (ISIC 37), the value of L.2.2 should represent the majority of the value of L.2. 4.107. The data items L.2.1 and L.2.2 are directed also at units that produce water as a secondary product (e.g., hydroelectric power producers of the electricity industry (ISIC 35))
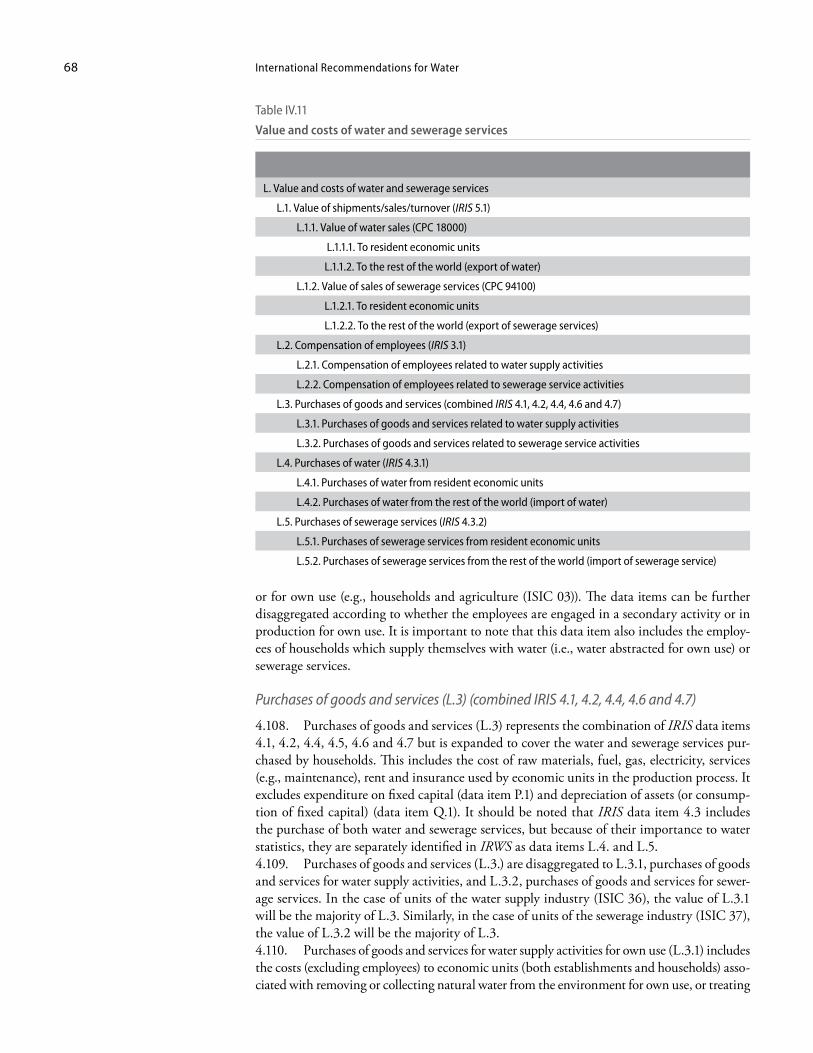
International Recommendations for Water68
or for own use (e.g., households and agriculture (ISIC 03)). The data items can be further disaggregated according to whether the employees are engaged in a secondary activity or in production for own use. It is important to note that this data item also includes the employ-ees of households which supply themselves with water (i.e., water abstracted for own use) or sewerage services.
Purchases of goods and services (L.3) (combined IRIS 4.1, 4.2, 4.4, 4.6 and 4.7)
4.108. Purchases of goods and services (L.3) represents the combination of IRIS data items 4.1, 4.2, 4.4, 4.5, 4.6 and 4.7 but is expanded to cover the water and sewerage services pur-chased by households. This includes the cost of raw materials, fuel, gas, electricity, services (e.g., maintenance), rent and insurance used by economic units in the production process. It excludes expenditure on fixed capital (data item P.1) and depreciation of assets (or consump-tion of fixed capital) (data item Q.1). It should be noted that IRIS data item 4.3 includes the purchase of both water and sewerage services, but because of their importance to water statistics, they are separately identified in IRWS as data items L.4. and L.5. 4.109. Purchases of goods and services (L.3.) are disaggregated to L.3.1, purchases of goods and services for water supply activities, and L.3.2, purchases of goods and services for sewer-age services. In the case of units of the water supply industry (ISIC 36), the value of L.3.1 will be the majority of L.3. Similarly, in the case of units of the sewerage industry (ISIC 37), the value of L.3.2 will be the majority of L.3. 4.110. Purchases of goods and services for water supply activities for own use (L.3.1) includes the costs (excluding employees) to economic units (both establishments and households) asso-ciated with removing or collecting natural water from the environment for own use, or treating
Table IV.11
Value and costs of water and sewerage services
L. Value and costs of water and sewerage services
L.1. Value of shipments/sales/turnover (IRIS 5.1)
L.1.1. Value of water sales (CPC 18000)
L.1.1.1. To resident economic units
L.1.1.2. To the rest of the world (export of water)
L.1.2. Value of sales of sewerage services (CPC 94100)
L.1.2.1. To resident economic units
L.1.2.2. To the rest of the world (export of sewerage services)
L.2. Compensation of employees (IRIS 3.1)
L.2.1. Compensation of employees related to water supply activities
L.2.2. Compensation of employees related to sewerage service activities
L.3. Purchases of goods and services (combined IRIS 4.1, 4.2, 4.4, 4.6 and 4.7)
L.3.1. Purchases of goods and services related to water supply activities
L.3.2. Purchases of goods and services related to sewerage service activities
L.4. Purchases of water (IRIS 4.3.1)
L.4.1. Purchases of water from resident economic units
L.4.2. Purchases of water from the rest of the world (import of water)
L.5. Purchases of sewerage services (IRIS 4.3.2)
L.5.1. Purchases of sewerage services from resident economic units
L.5.2. Purchases of sewerage services from the rest of the world (import of sewerage service)
Water data items 69
and cooling water for further use by the economic unit. These costs include the operating and maintenance costs of equipment used to abstract water but exclude government fees, which are included in other taxes on production (M.1), capital costs (P.1) and depreciation (Q.1). 4.111. Similarly, purchases of goods and services for sewerages services for own use (L.3.2) includes on-site wastewater treatment and the costs (excluding employees) of removing emis-sions or heat from wastewater generated, before discharging the water into the environment or supplying wastewater to other economic units. These costs include operating and mainte-nance costs of equipment used to treat wastewater but exclude government fees for discharg-ing water to the environment, which are included in other taxes on production (M.1), capital costs (P.1) and depreciation (Q.1). 4.112. Both L.3.1 and L.3.2 can be further disaggregated, according to whether the pur-chases are related to a secondary activity or production for own use.
Purchase of water (L.4) (IRIS 4.3.1)
4.113. Purchase of water (L.4) is equivalent to IRIS data item 4.3.1 but is expanded to cover the water purchased by households. It is the value of water received by establishments and households that has been supplied by other economic units, typically from the water supply industry (ISIC 36). This includes the cost of the water plus associated delivery charges. For example, the cost of water may be the price (e.g., $ per m3) of water multiplied by the volume (m3) received, plus any associated service charges for water supply. The purchase of water (L.4) is disaggregated to L.4.1, purchases from resident economic units, and L.4.2, purchases (or imports) from the rest of the word. 4.114. The purchases of both water (L.4) and sewerage services (L.5) are measured at the purchaser’s prices, which is the amount paid by the purchaser, excluding any deductible VAT or similar deductible tax, in order to take delivery of a unit of a good or service at the time and place required by the purchaser. The purchaser’s price of a good includes any transport charges paid separately by the purchaser to take delivery at the required time and place.113
Purchase of sewerage services (L.5) (IRIS 4.3.2)
4.115. The purchase of sewerage services (L.5.) is equivalent to data item 4.3.2 of IRIS but is expanded to cover the sewerage services purchased by households. It is the value of sewerage services received by establishments and households that have been supplied by other economic units, typically from the sewerage industry (ISIC 37). The purchase of sewerage services (L.5) is disaggregated to purchases from resident economic units (L.5.1) and purchases (or imports) from the rest of the word (L.5.2).
2. Taxes, subsidies and investment grants
4.116. Taxes are compulsory unrequited payments, in cash or in kind, made by economic units to the Government. Two main groups of taxes are identifiable—taxes on products and other taxes on production. It is recommended that only other taxes and subsidies be col-lected on production since these payments or receipts affect the behaviour of producers and are recorded in their business accounts. It is recommended that in statistical questionnaires, countries refer to the specific names and descriptions of taxes and subsidies as they exist in their national fiscal systems. 4.117. For water statistics, the main interest is in the taxes and fees related to water supply and sewerage services (M.1.1 and M.1.2, respectively) and the subsidies for water (N.1.1.1) and sewerage services (N.1.1.2). Government subsidies are common for the water supply (ISIC 36) and sewerage (ISIC 37) industries, but households and other industries may also receive
113 See 2008 SNA, paras. 6.215, 15.28, 2.73 and 3.83.
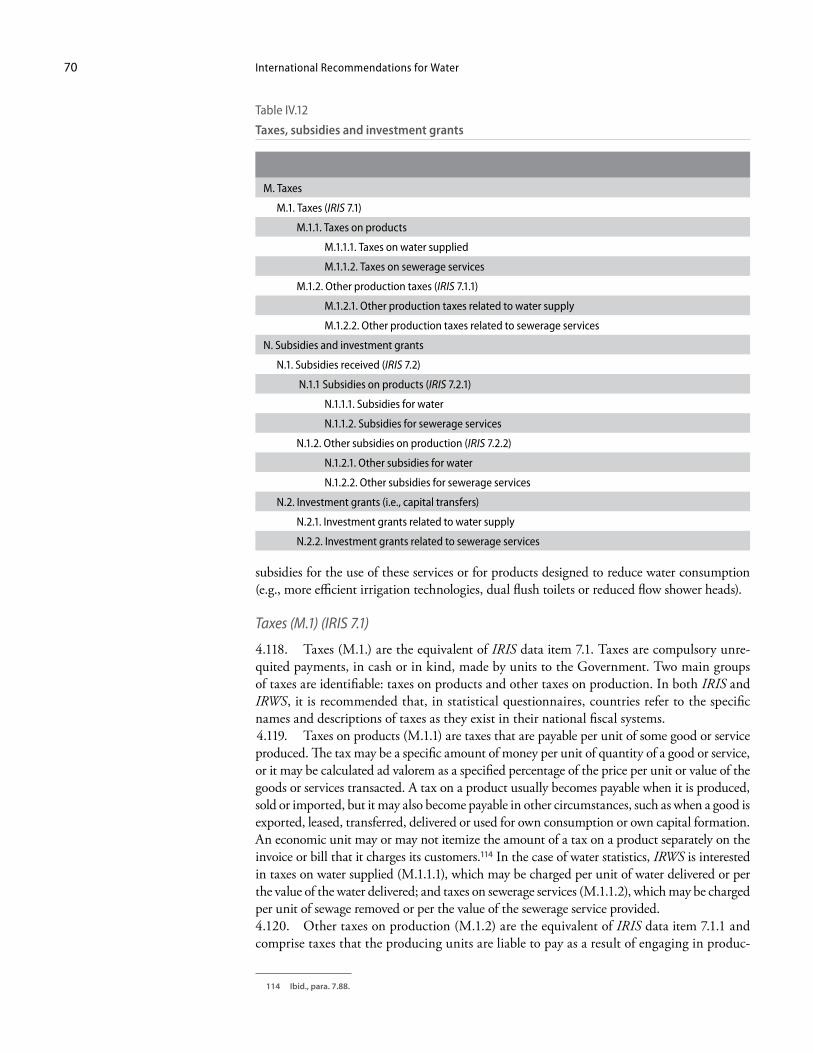
International Recommendations for Water70
subsidies for the use of these services or for products designed to reduce water consumption (e.g., more efficient irrigation technologies, dual flush toilets or reduced flow shower heads).
Taxes (M.1) (IRIS 7.1)
4.118. Taxes (M.1.) are the equivalent of IRIS data item 7.1. Taxes are compulsory unre-quited payments, in cash or in kind, made by units to the Government. Two main groups of taxes are identifiable: taxes on products and other taxes on production. In both IRIS and IRWS, it is recommended that, in statistical questionnaires, countries refer to the specific names and descriptions of taxes as they exist in their national fiscal systems. 4.119. Taxes on products (M.1.1) are taxes that are payable per unit of some good or service produced. The tax may be a specific amount of money per unit of quantity of a good or service, or it may be calculated ad valorem as a specified percentage of the price per unit or value of the goods or services transacted. A tax on a product usually becomes payable when it is produced, sold or imported, but it may also become payable in other circumstances, such as when a good is exported, leased, transferred, delivered or used for own consumption or own capital formation. An economic unit may or may not itemize the amount of a tax on a product separately on the invoice or bill that it charges its customers.114 In the case of water statistics, IRWS is interested in taxes on water supplied (M.1.1.1), which may be charged per unit of water delivered or per the value of the water delivered; and taxes on sewerage services (M.1.1.2), which may be charged per unit of sewage removed or per the value of the sewerage service provided. 4.120. Other taxes on production (M.1.2) are the equivalent of IRIS data item 7.1.1 and comprise taxes that the producing units are liable to pay as a result of engaging in produc-
114 Ibid., para. 7.88.
Table IV.12
Taxes, subsidies and investment grants
M. Taxes
M.1. Taxes (IRIS 7.1)
M.1.1. Taxes on products
M.1.1.1. Taxes on water supplied
M.1.1.2. Taxes on sewerage services
M.1.2. Other production taxes (IRIS 7.1.1)
M.1.2.1. Other production taxes related to water supply
M.1.2.2. Other production taxes related to sewerage services
N. Subsidies and investment grants
N.1. Subsidies received (IRIS 7.2)
N.1.1 Subsidies on products (IRIS 7.2.1)
N.1.1.1. Subsidies for water
N.1.1.2. Subsidies for sewerage services
N.1.2. Other subsidies on production (IRIS 7.2.2)
N.1.2.1. Other subsidies for water
N.1.2.2. Other subsidies for sewerage services
N.2. Investment grants (i.e., capital transfers)
N.2.1. Investment grants related to water supply
N.2.2. Investment grants related to sewerage services
Water data items 71
tion. As such, they represent a part of production costs and should be included in the value of output. Units pay them irrespective of profitability or otherwise of the production. These taxes consist mainly of taxes on the ownership or use of land, buildings or other assets used in production, or on the labour employed or compensation of employees paid. Examples are motor road vehicle taxes, duties and registration fees, business licences, payroll taxes, taxes on non-life insurance on assets and levies on the use of fixed assets. Also included are official fees and charges—that is, duties payable for specific public services, such as the testing of standards of weights and measures and provision of extracts from official registers of crime. 4.121. For water statistics, the taxes (M.1) paid by the water supply and sewerage industries (ISIC 36 and 37) are of particular interest. In cases where water and sewerage services are supplied by other industries as a secondary activity, then the proportion of taxes paid associ-ated with these activities should be identified separately. For example, if 10 per cent of the activity of an enterprise is associated with water supply and 90 per cent with other activities, the 10 per cent of the taxes should be identified separately as being for water supply. This treatment would also apply to subsidies received (N.1). 4.122. Other production taxes include the licence fees payable to the Government for the right to abstract water from the environment or to discharge water into the environment, and these are separately identified as other taxes on production related to water supply (M.1.2.1) and sewerage services (M.1.2.2). For water statistics, this includes the taxes paid by households. 4.123. It may not be possible to collect data about all taxes at the establishment level because these taxes are paid for by the parent enterprise. In such cases, these data items may need to be estimated or collected via statistical survey. In the first case, estimates may be based on all available information (administrative data from taxation offices, knowledge of fees for water abstraction, etc.), while in the second case the design of statistical questionnaires and subsequent data compilation should clearly indicate the type of taxes that have been reported.
Subsidies received (N.1) (IRIS 7.2)
4.124. Subsidies received (N) is the equivalent of IRIS data item 7.2 but is extended to cover households. This covers payments that government units make to producing units on the basis of their production activities or the quantities or values of the goods or services that they produce, sell or import. Subsidies are divided into subsidies on products (N.1.1) and other production subsides (N.1.2). Each of these is further disaggregated to subsidies on production for water (N.1.1.1 and N.1.2.1) and sewerage services (N.1.2.1 and N.1.2.2). 4.125. Subsidies on products (N.1.1) correspond to subsidies payable per unit of a good or service produced, either as a specific amount of money per unit of quantity of a good or ser-vice, or as a specified percentage of the price per unit; it may also be calculated as the differ-ence between a specified target price and the market price actually paid by a buyer. Subsidies for water (N.1.1.1) are payments to economic units to offset the cost of water and related water supply charges. For example, the water supply industry may receive subsidies for the volume of water supplied to the agriculture industry (ISIC 01) and households. Subsidies for sewerage services (N.1.1.2) may also be paid to the sewerage industry (ISIC 37). 4.126. Other subsidies on production (N.1.2) consist of subsidies, except subsidies on prod-ucts, which resident enterprises may receive as a consequence of engaging in production (e.g., subsidies on payroll or workforce or subsidies to reduce pollution). 4.127. Other subsidies for water (N.1.2.1) include payments not linked to the volume of water supplied to users. For example, the maintenance of water supply infrastructure (i.e., fixed assets) used to collect, treat or supply water. 4.128. Other subsidies for sewerage services (N.1.2.2) include payments not linked to the volume of sewage removed or the number of connections served, such as payments for the maintenance of the infrastructure used to collect, treat or dispose of wastewater.
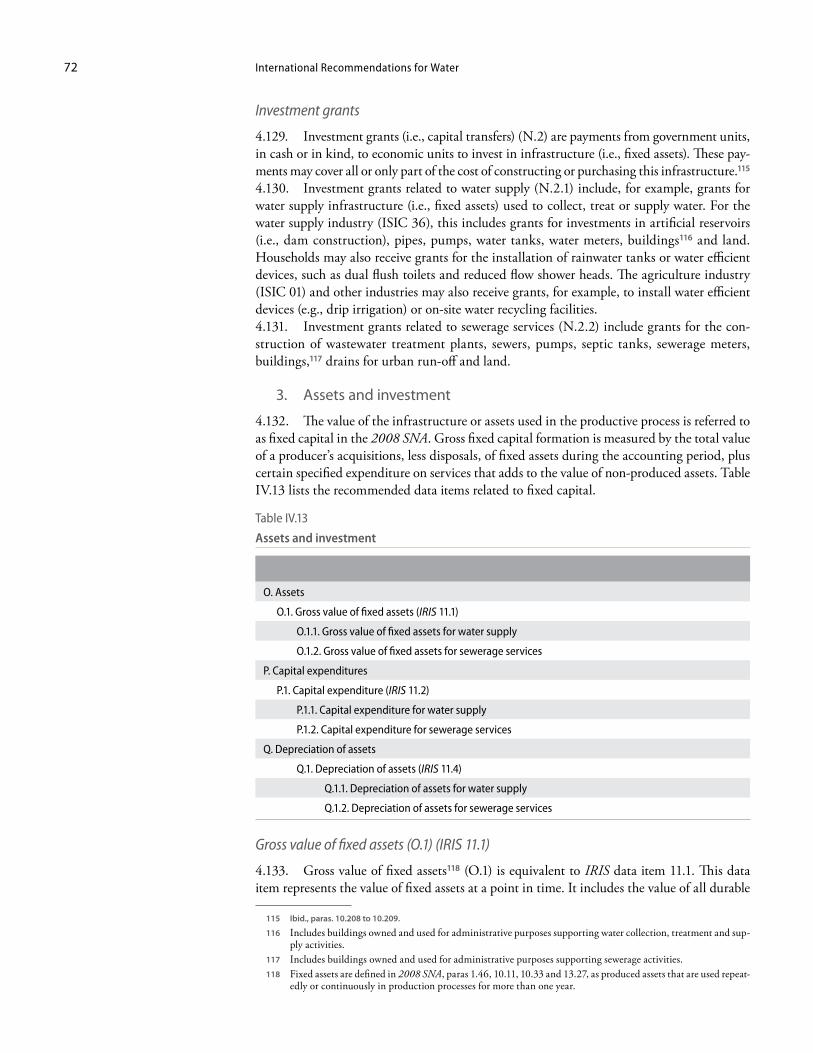
International Recommendations for Water72
Investment grants
4.129. Investment grants (i.e., capital transfers) (N.2) are payments from government units, in cash or in kind, to economic units to invest in infrastructure (i.e., fixed assets). These pay-ments may cover all or only part of the cost of constructing or purchasing this infrastructure.115
4.130. Investment grants related to water supply (N.2.1) include, for example, grants for water supply infrastructure (i.e., fixed assets) used to collect, treat or supply water. For the water supply industry (ISIC 36), this includes grants for investments in artificial reservoirs (i.e., dam construction), pipes, pumps, water tanks, water meters, buildings116 and land. Households may also receive grants for the installation of rainwater tanks or water efficient devices, such as dual flush toilets and reduced flow shower heads. The agriculture industry (ISIC 01) and other industries may also receive grants, for example, to install water efficient devices (e.g., drip irrigation) or on-site water recycling facilities. 4.131. Investment grants related to sewerage services (N.2.2) include grants for the con-struction of wastewater treatment plants, sewers, pumps, septic tanks, sewerage meters, buildings,117 drains for urban run-off and land.
3. Assets and investment
4.132. The value of the infrastructure or assets used in the productive process is referred to as fixed capital in the 2008 SNA. Gross fixed capital formation is measured by the total value of a producer’s acquisitions, less disposals, of fixed assets during the accounting period, plus certain specified expenditure on services that adds to the value of non-produced assets. Table IV.13 lists the recommended data items related to fixed capital.
Table IV.13
Assets and investment
O. Assets
O.1. Gross value of fixed assets (IRIS 11.1)
O.1.1. Gross value of fixed assets for water supply
O.1.2. Gross value of fixed assets for sewerage services
P. Capital expenditures
P.1. Capital expenditure (IRIS 11.2)
P.1.1. Capital expenditure for water supply
P.1.2. Capital expenditure for sewerage services
Q. Depreciation of assets
Q.1. Depreciation of assets (IRIS 11.4)
Q.1.1. Depreciation of assets for water supply
Q.1.2. Depreciation of assets for sewerage services
Gross value of fixed assets (O.1) (IRIS 11.1)
4.133. Gross value of fixed assets118 (O.1) is equivalent to IRIS data item 11.1. This data item represents the value of fixed assets at a point in time. It includes the value of all durable
115 Ibid., paras. 10.208 to 10.209.
116 Includes buildings owned and used for administrative purposes supporting water collection, treatment and sup-ply activities.
117 Includes buildings owned and used for administrative purposes supporting sewerage activities. 118 Fixed assets are defined in 2008 SNA, paras 1.46, 10.11, 10.33 and 13.27, as produced assets that are used repeat-
edly or continuously in production processes for more than one year.
Water data items 73
goods expected to have a productive life of more than one year and intended for use by the establishment (land, mineral deposits, timber tracts, etc., buildings, machinery, equipment and vehicles). Included are major additions, alterations and improvements to existing fixed assets that extend their normal economic life or raise their productivity. 4.134. Also included are the value of new fixed assets and additions and improvements to existing fixed assets made by the establishment’s own labour for its own use. While capital repair is included, expenditures for current repair and maintenance are excluded. Transac-tions in respect of financial claims and intangible assets (such as rights to mineral deposits and copyrights) are excluded. For water statistics, the data item is disaggregated into gross value of water supply (O.1.1) and of sewerage (O.1.2), which are expanded to cover the infrastructure owned by households. 4.135. Gross value of fixed assets for water supply (O.1.1) is the value of the infrastructure
used to abstract, manage, store, treat, distribute, pump and apply water. This includes artifi-cial reservoirs, pipes, pumps, water tanks, sprinkler systems, water meters, buildings and land owned and used for these activities. While the majority of this is likely to be owned by the water supply industry (ISIC 36), other industries (e.g., agriculture ISIC 01, electricity ISIC 35) and households will also possess water supply infrastructure. 4.136. Gross value of fixed assets for sewerage services (O.1.2) includes the value of the infrastructure used to collect, treat, store, distribute and discharge sewerage. This includes wastewater treatment plants, sewers, pumps, septic tanks, sewerage meters, buildings and the land owned and used for these activities. It includes infrastructure owned by the sewer-age industry (ISIC 37), as well as agriculture (ISIC 01), other industries and households used for the collection of sewage and disposal of water. 4.137. The value of urban run-off infrastructure is also included in data item O.1.2. This includes drains, culverts, pumps, pipes, infiltration facilities, buildings and land owned and used for the collection, treatment and discharge of urban run-off. 4.138. Where the same assets are used for multiple purposes, such as water supply and hydroelectric power generation, then the value of these assets should be divided between the two purposes. This should be done with all available information. In the absence of detailed information, this may be done using the value added from the assets used for economic production. For example, if an artificial reservoir is used to generate hydroelectricity and to supply water, then the proportion of value added from electricity production and water production may be used to assign the value of the asset for water supply. For example, if the value added from water supply is 30 per cent of the total value added by the establishment operating the reservoir, then 30 per cent of the total value of the reservoir asset value should be attributed to water supply. This method may also be used to attribute capital expenditure and depreciation for water supply and sewerage (data items P.1 and Q.1).
Capital expenditure (P.1) (IRIS 11.2)
4.139. Capital expenditure (P.1) is equivalent to IRIS data item 11.2 but is expanded to cover household expenditure on infrastructure for water supply and sewerage services.119 Capital expenditure (P.1) is the expenditure over a period of a year on fixed assets. Capital expendi-ture for water supply (P.1.1) is the expenditure on the water supply infrastructure used by economic units (i.e., both industries and households) for water collection, treatment or supply. This includes expenditure on the acquisition of pumps, pipes, dams, buildings, water tanks, vehicles, drilling rigs and land. Most of the expenditure may be expected in the water supply industry (ISIC 36). Capital expenditure for sewerage services (P.1.2) is expenditure on fixed assets used to collect, treat and dispose of wastewater, including urban run-off by establishments
119 Household expenditure on infrastructure is considered capital expenditure in the 2008 SNA, as opposed to consumption expenditure (see 2008 SNA, para.10.34).
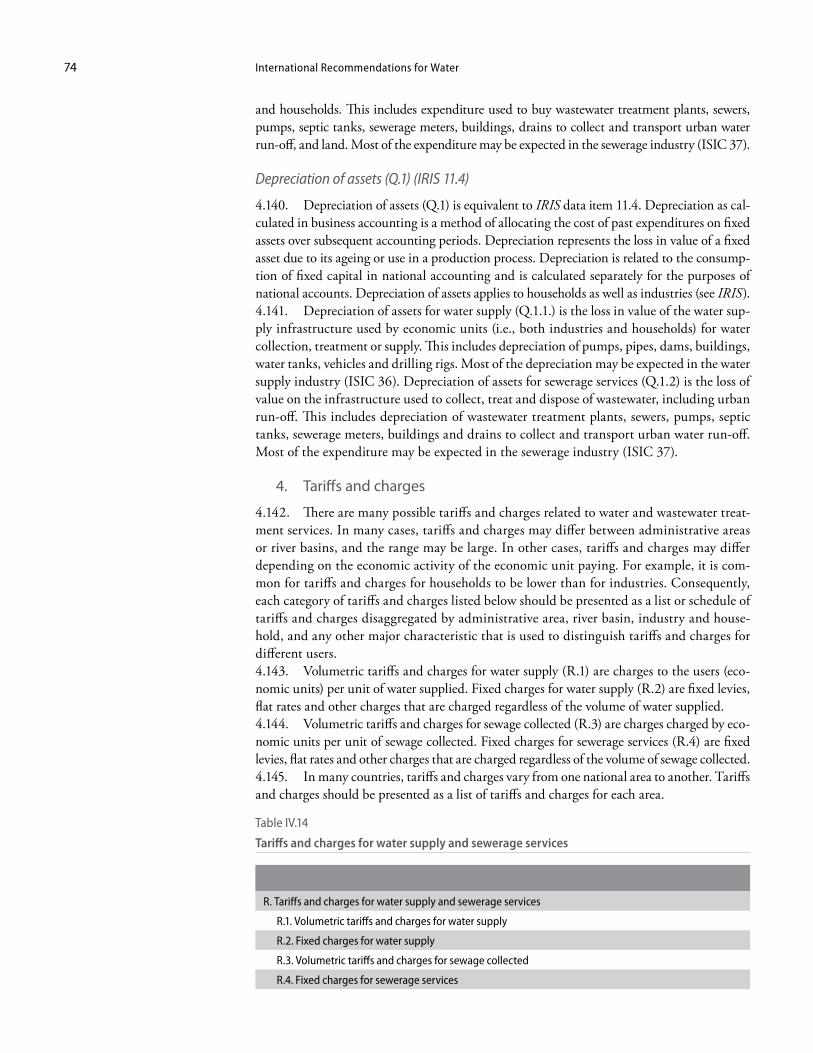
International Recommendations for Water74
and households. This includes expenditure used to buy wastewater treatment plants, sewers, pumps, septic tanks, sewerage meters, buildings, drains to collect and transport urban water run-off, and land. Most of the expenditure may be expected in the sewerage industry (ISIC 37).
Depreciation of assets (Q.1) (IRIS 11.4)
4.140. Depreciation of assets (Q.1) is equivalent to IRIS data item 11.4. Depreciation as cal-culated in business accounting is a method of allocating the cost of past expenditures on fixed assets over subsequent accounting periods. Depreciation represents the loss in value of a fixed asset due to its ageing or use in a production process. Depreciation is related to the consump-tion of fixed capital in national accounting and is calculated separately for the purposes of national accounts. Depreciation of assets applies to households as well as industries (see IRIS). 4.141. Depreciation of assets for water supply (Q.1.1.) is the loss in value of the water sup-ply infrastructure used by economic units (i.e., both industries and households) for water collection, treatment or supply. This includes depreciation of pumps, pipes, dams, buildings, water tanks, vehicles and drilling rigs. Most of the depreciation may be expected in the water supply industry (ISIC 36). Depreciation of assets for sewerage services (Q.1.2) is the loss of value on the infrastructure used to collect, treat and dispose of wastewater, including urban run-off. This includes depreciation of wastewater treatment plants, sewers, pumps, septic tanks, sewerage meters, buildings and drains to collect and transport urban water run-off. Most of the expenditure may be expected in the sewerage industry (ISIC 37).
4. Tariffs and charges
4.142. There are many possible tariffs and charges related to water and wastewater treat-ment services. In many cases, tariffs and charges may differ between administrative areas or river basins, and the range may be large. In other cases, tariffs and charges may differ depending on the economic activity of the economic unit paying. For example, it is com-mon for tariffs and charges for households to be lower than for industries. Consequently, each category of tariffs and charges listed below should be presented as a list or schedule of tariffs and charges disaggregated by administrative area, river basin, industry and house-hold, and any other major characteristic that is used to distinguish tariffs and charges for different users. 4.143. Volumetric tariffs and charges for water supply (R.1) are charges to the users (eco-nomic units) per unit of water supplied. Fixed charges for water supply (R.2) are fixed levies, flat rates and other charges that are charged regardless of the volume of water supplied. 4.144. Volumetric tariffs and charges for sewage collected (R.3) are charges charged by eco-nomic units per unit of sewage collected. Fixed charges for sewerage services (R.4) are fixed levies, flat rates and other charges that are charged regardless of the volume of sewage collected. 4.145. In many countries, tariffs and charges vary from one national area to another. Tariffs and charges should be presented as a list of tariffs and charges for each area.
Table IV.14
Tariffs and charges for water supply and sewerage services
R. Tariffs and charges for water supply and sewerage services
R.1. Volumetric tariffs and charges for water supply
R.2. Fixed charges for water supply
R.3. Volumetric tariffs and charges for sewage collected
R.4. Fixed charges for sewerage services
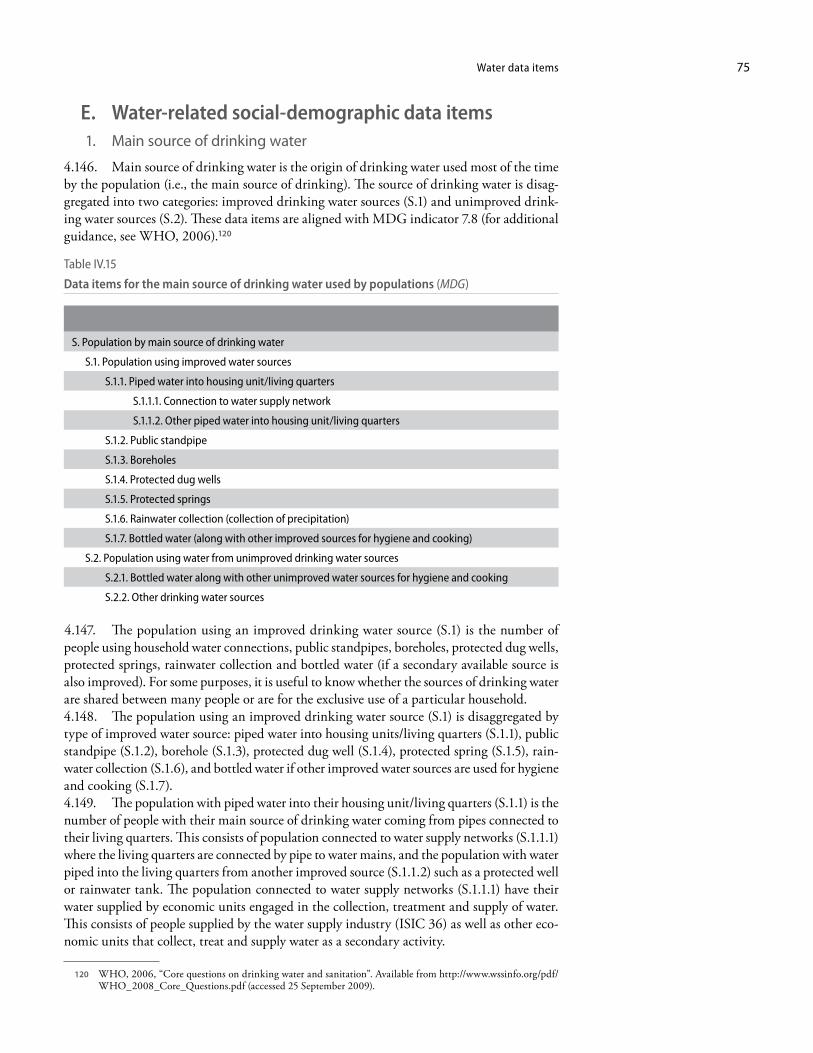
Water data items 75
E. Water-related social-demographic data items 1. Main source of drinking water
4.146. Main source of drinking water is the origin of drinking water used most of the time by the population (i.e., the main source of drinking). The source of drinking water is disag-gregated into two categories: improved drinking water sources (S.1) and unimproved drink-ing water sources (S.2). These data items are aligned with MDG indicator 7.8 (for additional guidance, see WHO, 2006).120
Table IV.15
Data items for the main source of drinking water used by populations (MDG)
S. Population by main source of drinking water
S.1. Population using improved water sources
S.1.1. Piped water into housing unit/living quarters
S.1.1.1. Connection to water supply network
S.1.1.2. Other piped water into housing unit/living quarters
S.1.2. Public standpipe
S.1.3. Boreholes
S.1.4. Protected dug wells
S.1.5. Protected springs
S.1.6. Rainwater collection (collection of precipitation)
S.1.7. Bottled water (along with other improved sources for hygiene and cooking)
S.2. Population using water from unimproved drinking water sources
S.2.1. Bottled water along with other unimproved water sources for hygiene and cooking
S.2.2. Other drinking water sources
4.147. The population using an improved drinking water source (S.1) is the number of people using household water connections, public standpipes, boreholes, protected dug wells, protected springs, rainwater collection and bottled water (if a secondary available source is also improved). For some purposes, it is useful to know whether the sources of drinking water are shared between many people or are for the exclusive use of a particular household. 4.148. The population using an improved drinking water source (S.1) is disaggregated by type of improved water source: piped water into housing units/living quarters (S.1.1), public standpipe (S.1.2), borehole (S.1.3), protected dug well (S.1.4), protected spring (S.1.5), rain-water collection (S.1.6), and bottled water if other improved water sources are used for hygiene and cooking (S.1.7). 4.149. The population with piped water into their housing unit/living quarters (S.1.1) is the number of people with their main source of drinking water coming from pipes connected to their living quarters. This consists of population connected to water supply networks (S.1.1.1) where the living quarters are connected by pipe to water mains, and the population with water piped into the living quarters from another improved source (S.1.1.2) such as a protected well or rainwater tank. The population connected to water supply networks (S.1.1.1) have their water supplied by economic units engaged in the collection, treatment and supply of water. This consists of people supplied by the water supply industry (ISIC 36) as well as other eco-nomic units that collect, treat and supply water as a secondary activity.
120 WHO, 2006, “Core questions on drinking water and sanitation”. Available from http://www.wssinfo.org/pdf/WHO_2008_Core_Questions.pdf (accessed 25 September 2009).
International Recommendations for Water76
4.150. Population using public standpipes (S.1.2) is the number of people with their main source of drinking water coming from a public water point. Standpipes are also known as taps or water fountains. Public standpipes can have one or more taps and are typically made of brickwork, masonry or concrete. The water from the pipes is usually supplied by economic units engaged in the collection, treatment and supply of water. 4.151. Population using boreholes (S.1.3) is the number of people with their main source of drinking water being water abstracted from groundwater via holes in the ground that have protective casings and covers. Boreholes may be bored, driven or drilled into the ground to allow abstraction of groundwater from aquifers. Casings prevent the holes from caving in as well as protecting against the infiltration of contaminated run-off (e.g., urban run-off). Protective covers on top of casings ensure that bird droppings and animals cannot fall down the borehole. Water is normally abstracted from boreholes using pumps.121 Boreholes include tube wells. 4.152. Population using protected dug wells (S.1.4) is the number of people with their main source of drinking water being water abstracted from groundwater via wells that were dug into aquifers, with a protective lining or casing that rises above ground level, a platform and a protective cover. A protected dug well is protected from run-off (e.g., urban run-off) because the well lining or casing is raised above ground level, the platform diverts spilled water away from the well, and the protective cover ensures that bird droppings and animals cannot fall down the well. Water may be drawn from wells via pumps or other mechanical means (e.g., a rope and bucket). 4.153. Population using protected springs (S.1.5.) is the number of people belonging to households and institutions with their main source of drinking water being abstracted from groundwater via springs protected by spring boxes. A spring box is a structure constructed of brick, masonry or concrete, built around the spring so that water flows directly out of the box into a pipe without being exposed to outside contamination from bird droppings, animals or run-off. 4.154. Population using rainwater collection (collection of precipitation) (S.1.6) is the num-ber of people with their main source of drinking water being the collection of rain, snow, sleet, hail, mist or dew, stored in containers, tanks or cisterns (e.g., roof rainwater harvesting). This water can be collected, or harvested from such surfaces as roofs, paved surfaces and other types of impermeable surfaces that direct water into storage tanks. 4.155. Population using bottled water (along with other improved sources for hygiene and cooking) (S.1.7) is the proportion of people with their main source of drinking water being from other economic units in closed bottles (20 litres in size or less). Bottled water includes only water that has been commercially bottled and excludes bottles filled by household mem-bers to store water collected from other sources. MDG indicator 7.8 requires that for bottled water to be included in the proportion of population using an improved drinking water source, there must be a source of improved water available for personal hygiene and cooking. 4.156. Population using unimproved drinking water sources (S.2) consists of the number of people using bottled water where an unimproved water source is used for hygiene or cooking (S.2.1), and all other sources of water (S.2.2). Other sources of water include mobile vendors, tanker trucks, unprotected wells, unprotected springs and surface water.
2. Main sanitation facilities
4.157. Main sanitation facilities are the facilities used most of the time to receive human excreta—faeces and urine. Main sanitation facilities are disaggregated into two categories: improved sanitation facilities (T.1) and unimproved sanitation facilities (T.2). These data items are aligned with MDG indicator 7.9. For assessing the access of the population to the
121 The pump may be powered by humans, animals, wind, electricity, diesel fuel or solar energy, for example.
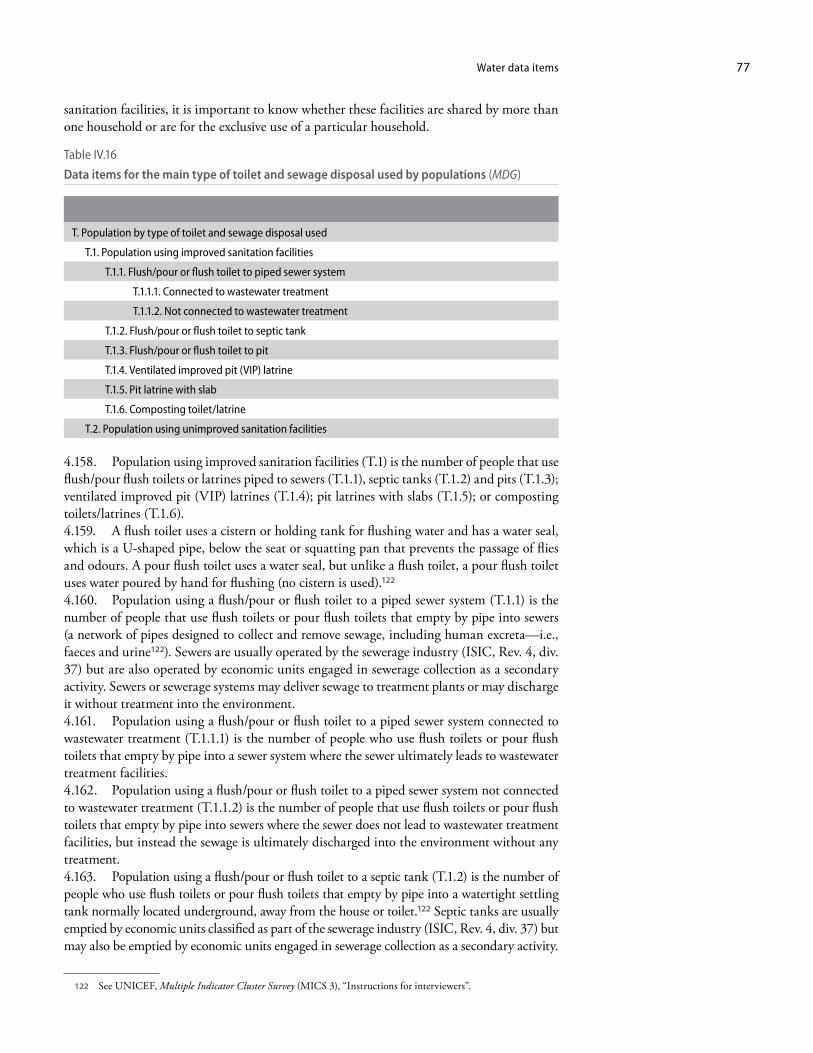
Water data items 77
sanitation facilities, it is important to know whether these facilities are shared by more than one household or are for the exclusive use of a particular household.
Table IV.16
Data items for the main type of toilet and sewage disposal used by populations (MDG)
T. Population by type of toilet and sewage disposal used
T.1. Population using improved sanitation facilities
T.1.1. Flush/pour or flush toilet to piped sewer system
T.1.1.1. Connected to wastewater treatment
T.1.1.2. Not connected to wastewater treatment
T.1.2. Flush/pour or flush toilet to septic tank
T.1.3. Flush/pour or flush toilet to pit
T.1.4. Ventilated improved pit (VIP) latrine
T.1.5. Pit latrine with slab
T.1.6. Composting toilet/latrine
T.2. Population using unimproved sanitation facilities
4.158. Population using improved sanitation facilities (T.1) is the number of people that use flush/pour flush toilets or latrines piped to sewers (T.1.1), septic tanks (T.1.2) and pits (T.1.3); ventilated improved pit (VIP) latrines (T.1.4); pit latrines with slabs (T.1.5); or composting toilets/latrines (T.1.6). 4.159. A flush toilet uses a cistern or holding tank for flushing water and has a water seal, which is a U-shaped pipe, below the seat or squatting pan that prevents the passage of flies and odours. A pour flush toilet uses a water seal, but unlike a flush toilet, a pour flush toilet uses water poured by hand for flushing (no cistern is used).122
4.160. Population using a flush/pour or flush toilet to a piped sewer system (T.1.1) is the number of people that use flush toilets or pour flush toilets that empty by pipe into sewers (a network of pipes designed to collect and remove sewage, including human excreta—i.e., faeces and urine122). Sewers are usually operated by the sewerage industry (ISIC, Rev. 4, div. 37) but are also operated by economic units engaged in sewerage collection as a secondary activity. Sewers or sewerage systems may deliver sewage to treatment plants or may discharge it without treatment into the environment. 4.161. Population using a flush/pour or flush toilet to a piped sewer system connected to wastewater treatment (T.1.1.1) is the number of people who use flush toilets or pour flush toilets that empty by pipe into a sewer system where the sewer ultimately leads to wastewater treatment facilities. 4.162. Population using a flush/pour or flush toilet to a piped sewer system not connected to wastewater treatment (T.1.1.2) is the number of people that use flush toilets or pour flush toilets that empty by pipe into sewers where the sewer does not lead to wastewater treatment facilities, but instead the sewage is ultimately discharged into the environment without any treatment. 4.163. Population using a flush/pour or flush toilet to a septic tank (T.1.2) is the number of people who use flush toilets or pour flush toilets that empty by pipe into a watertight settling tank normally located underground, away from the house or toilet.122 Septic tanks are usually emptied by economic units classified as part of the sewerage industry (ISIC, Rev. 4, div. 37) but may also be emptied by economic units engaged in sewerage collection as a secondary activity.
122 See UNICEF, Multiple Indicator Cluster Survey (MICS 3), “Instructions for interviewers”.
International Recommendations for Water78
4.164. Population using a flush/pour or flush toilet to a pit (T.1.3) is the number of people who use flush toilets or pour flush toilets that empty by pipe into a hole in the ground.122
4.165. Population using a ventilated improved pit (VIP) latrine (T.1.4) is the number of people who use pit latrines that are ventilated by a pipe extending above the latrine roof, where the open end of the vent pipe is covered with gauze mesh or fly-proof netting and the inside of the superstructure is kept dark.122
4.166. Population using a pit latrine with a slab (T.1.5) is the number of people who use holes in the ground for excreta collection, with a squatting slab, platform or seat that is firmly supported on all sides, easy to clean and raised above the surrounding ground level to prevent surface water from entering the pit.122
4.167. Population using a composting toilet/latrine (T.1.6) is the number of people who use toilets into which excreta and carbon-rich material are added (vegetable wastes, straw, grass, sawdust, ash) and for which special conditions are maintained to produce inoffensive compost. 4.168. Population using unimproved sanitation facilities (T.2) is the number of people who use:
• Flush or pour flush toilets that empty into the street, a yard or plot, artificial channel or some other nearby location, excluding flush or pour flush toilets that empty into pits, septic tanks or sewers122
• Pit latrines without slabs, for example, a hole in the ground for excreta collection, which does not have a squatting slab, platform or seat122
• Open pits, that is, simple holes in the ground to collect excreta122
• Buckets for the collection of faeces (and sometimes urine and anal cleaning material), which are periodically removed for treatment or disposal122
• Hanging toilet/hanging latrines built over the sea, a river or other body of water, into which excreta drops directly122
• No toilet facilities; for example, using bushes, trees, ditches or open spaces (such as fields, drainage channels, beaches, rivers or the sea) as a toilet, or burying excreta in dirt122
Part two
Guidelines for implementation

81
Chapter V
Data-collection strategy
A. Introduction 5.1. Part one of IRWS outlines the key concepts (chaps. II and III) and data items (chap. IV) that countries are recommended to compile as part of a comprehensive water statistics programme. Part two provides information on how those concepts and data items can be used in countries to produce water statistics. The establishment of a water statistics programme will start with the development of a data-collection strategy. 5.2. A data-collection strategy provides an agreed understanding of data needs and insti-tutional arrangements, as well as a set of priorities for the development of water statistics within countries. It clearly describes the roles and responsibilities of the main water data users and producers, including the institutional arrangements for ensuring the regular production of high-quality water statistics. This is particularly important since in many countries the institutional arrangements (e.g., legislation, formal and informal arrangements between agen-cies and data flows) for IWRM are poorly defined or confusing,123 which can lead to similar challenges in the production of water statistics. An important benefit of the development of a data-collection strategy is that it encourages the decision makers and policy analysts to consider the data they need to be more effective. 5.3. The development of a data-collection strategy is a difficult undertaking because of the large number of institutions typically involved in water management and the production of water statistics. This often results in overlapping or ambiguous responsibilities that may lead to unnecessary duplication of data-collection activities, significant gaps and deficiencies in existing water statistics, and an inability to integrate water statistics from different data sources. Integration of water statistics with other social-demographic, economic and environ-mental statistics can also be affected. 5.4. The purposes of a data-collection strategy include:
• Determining the needs of the users of water statistics• Reviewing existing water statistics, including:
• Increasing the knowledge of existing water statistics and related data sources and methods
• Assessing the use, accessibility and quality of existing water statistics (see chap. VII)
• Identifying the gaps or deficiencies of current data collections• Setting priorities for the production of water statistics• Strengthening the institutional arrangements for the production and use of water
statistics, including:• Facilitating the coordination between data producers and data users (i.e., all stake-
holders in water statistics)
123 GWP, 2004, Catalyzing Change: A handbook for developing integrated water resources management (IWRM) and water efficiency strategies, available from http://www.gwpforum.org/servlet/PSP?iNodeID=215&itemId=496; see, in particular, section entitled “Institutional roles”.
International Recommendations for Water82
• Facilitating collaboration and coordination within agencies• Providing a realistic plan for improving water statistics, including:
• Increasing the accessibility of data to decision makers and others• Eliminating or at least greatly reducing duplication of data collection by differ-
ent agencies (thus enabling resources to be freed to address gaps or deficiencies in water statistics)
• Ensuring that different data sources use consistent concepts and definitions—these should be the definitions of the data items (see chap. IV) and the related concepts and classifications (see chaps. II and III), including consistent temporal and spatial references and harmonizing of data presentation formats
5.5. A data-collection strategy should balance the needs of data users with the resources available to data producers and devise an appropriate work programme to meet the objectives of the strategy. A critical part of the development of the strategy is to involve data users and the developers of water policy, in particular, to ensure that the issues of most relevance to them are supported by data as quickly as possible. This is usually done by prioritizing data items, reviewing currently available data and their quality, and then assessing the options for increasing the number of data items produced and improving the quality of existing data. The options for producing the data items and for addressing the information gaps and deficiencies are outlined in more detail in chapter VI. Cost will be a major consideration when collect-ing data, and in most cases priorities and data quality will have to be balanced with the cost of data collection. Data producers should also consult with other data producers and data compilers to identify common data requirements and coordinate activities, thus minimizing respondent burdens and ensuring consistency of data. 5.6. Data-collection strategies address both short-term and long-term aspects of improv-ing water statistics. Long-term aspects include identifying the priority areas for improvements (e.g., increasing the scope, coverage and quality of water statistics, using common classifica-tions), while the key short-term aspect is to provide a clear plan for efficiently producing and developing water statistics. This includes identifying what can be done with existing resources and what additional resources may be needed to address priority information gaps and defi-ciencies. The short-term aspects of the strategy can be addressed in an implementation plan. 5.7. Figure V.1 presents an overview of the process of developing a data-collection strat-egy for water statistics. It is presented as a series of discrete steps, although in reality some of the steps are undertaken simultaneously and may overlap. In addition, it is important to note that the process is a cycle. 5.8. To begin the process, an agency needs to take the lead. The lead agency usually identifies the issues at a general level and then engages other agencies to develop a process whereby the data issues can be explored in greater depth. Leadership can come from a range of agencies, but it is most often assumed by the national statistical office or a water or envi-ronment government agency. 5.9. Chapter V guides users through the necessary steps in the development of a data-collection strategy and describes the issues that need to be addressed by such strategies. This information is arranged under the following headings: determination of data needs (sect. B), stakeholders and institutional arrangements (sect. C), review of existing water sta-tistics (sect. D), prioritization (sect. E) and agreement on roles and responsibilities (sect. F).
B. Determination of data needs 5.10. IWRM recognizes that stakeholder participation and the institutional framework are vital considerations for efficient water management.124 This is also true for the produc-
124 See GWP, 2008, “Developing and managing river basins: the need for adaptive, multilevel, collaborative insti-tutional arrangements” (http://www.gwpforum.org/gwp/library/River%20basins_Brief%20IWMI_GWP.pdf).
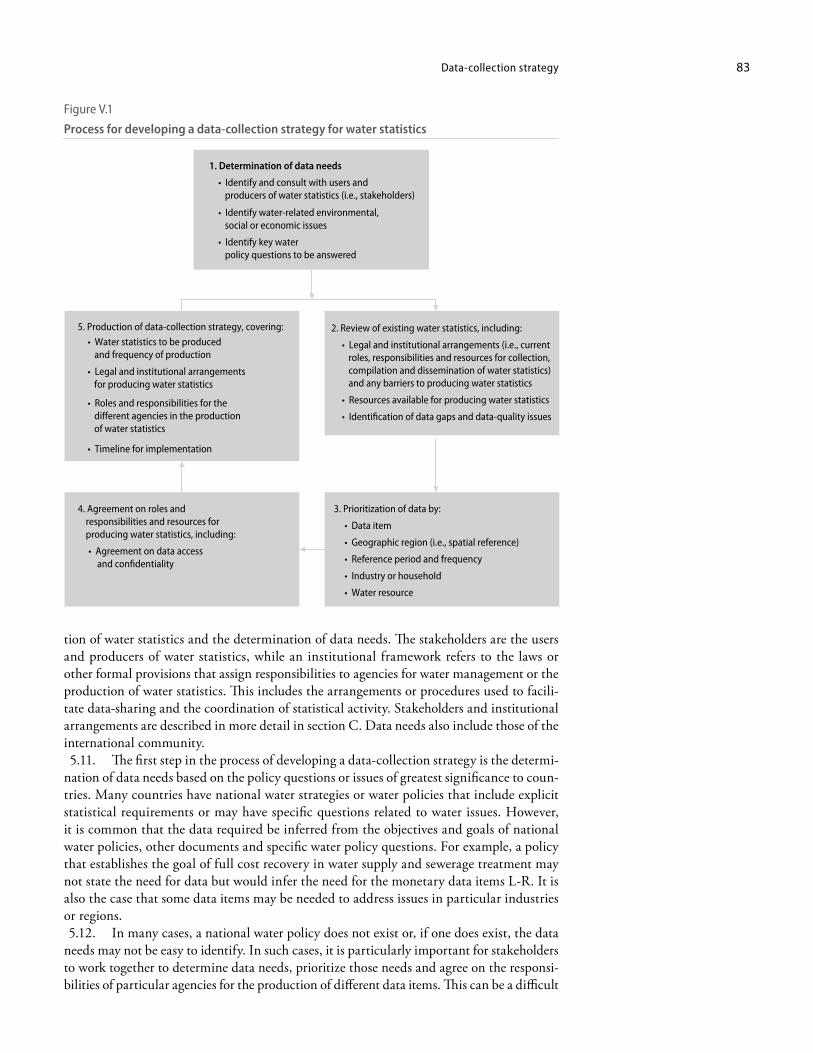
Data-collection strategy 83
tion of water statistics and the determination of data needs. The stakeholders are the users and producers of water statistics, while an institutional framework refers to the laws or other formal provisions that assign responsibilities to agencies for water management or the production of water statistics. This includes the arrangements or procedures used to facili-tate data-sharing and the coordination of statistical activity. Stakeholders and institutional arrangements are described in more detail in section C. Data needs also include those of the international community. 5.11. The first step in the process of developing a data-collection strategy is the determi-nation of data needs based on the policy questions or issues of greatest significance to coun-tries. Many countries have national water strategies or water policies that include explicit statistical requirements or may have specific questions related to water issues. However, it is common that the data required be inferred from the objectives and goals of national water policies, other documents and specific water policy questions. For example, a policy that establishes the goal of full cost recovery in water supply and sewerage treatment may not state the need for data but would infer the need for the monetary data items L-R. It is also the case that some data items may be needed to address issues in particular industries or regions. 5.12. In many cases, a national water policy does not exist or, if one does exist, the data needs may not be easy to identify. In such cases, it is particularly important for stakeholders to work together to determine data needs, prioritize those needs and agree on the responsi-bilities of particular agencies for the production of different data items. This can be a difficult
Figure V.1
Process for developing a data-collection strategy for water statistics
5. Production of data-collection strategy, covering:
• Water statistics to be produced and frequency of production
• Roles and responsibilities for the
different agencies in the productionof water statistics
• Timeline for implementation
1. Determination of data needs
• Identify and consult with users and producers of water statistics (i.e., stakeholders)
• Identify water-related environmental, social or economic issues
• Identify key waterpolicy questions to be answered
• Legal and institutional arrangementsfor producing water statistics
2. Review of existing water statistics, including:
• Legal and institutional arrangements (i.e., current roles, responsibilities and resources for collection, compilation and dissemination of water statistics) and any barriers to producing water statistics
• Resources available for producing water statistics
• Identification of data gaps and data-quality issues
4. Agreement on roles and responsibilities and resources for producing water statistics, including:
• Agreement on data access and confidentiality
3. Prioritization of data by:
• Data item
• Geographic region (i.e., spatial reference)
• Reference period and frequency
• Industry or household
• Water resource
International Recommendations for Water84
task, particularly where human and financial resources are limited and the institutional framework for data production is poorly developed.
C. Stakeholders and institutional arrangements 1. Stakeholders
5.13. The stakeholders typically involved in the production and use of water statistics include:
• National statistical offices• Government agencies (at the national, state/provincial or local levels) responsible for:
• Water • Meteorology and hydrology• Agriculture• Environment (including environment protection authorities)• Energy (especially where there is significant use of hydropower)• Central planning• Finance (or central banks)• Geology or geological survey• Land use and land planning
• Water suppliers and sewerage service providers (government and non-government)• Water research organizations (e.g., government agencies, universities)• Non-governmental organizations (e.g., water industry associations, farmer associa-
tions) 5.14. The types of data used and produced by these organizations vary, as do the methods used in the production of statistics (for more detail, see chapter VI). Some agencies will be large and operate in a number of locations and it is common for one agency to have management or data-collection functions in a variety of places. In addition, different parts of a single agency may have different responsibilities and interests. In such cases, high-level coordination may be needed to address the possibility of conflicting views originating from within one agency.
2. Institutional arrangements
5.15. The development of a data-collection strategy occurs within the context of institutional arrangements and the historical roles and responsibilities of different agencies. It is essential to fully understand the legal and administrative responsibilities of the agencies producing and using water statistics. It is common for government agencies to have responsibilities for water policy, water management and the production of water statistics. It is also common to have responsibilities spread over different levels of government. For example, sometimes water man-agement is the responsibility of state/provincial or local governments or regional authorities. 5.16. Responsibilities for water management and water statistics are often divided by economic activity. For example, a government agency responsible for agriculture may have responsibility for the management of irrigated agriculture and the collection of data on the water used by agriculture (ISIC, Rev. 4, div. 01), while a national statistical office may have responsibility for the economic statistics related to all industries, including water supply and sewerage industries (ISIC, Rev. 4, divs. 36 and 37, respectively). 5.17. Responsibilities for water statistics can also be divided in terms of data items. For example, an agency responsible for the environment may have responsibility for statistics related to water pollution (e.g., data items J-K), while an agency responsible for meteorology may monitor and report precipitation (data item B.1). In some cases, there will be overlapping areas (i.e., the same or similar data are collected by different organizations).
Data-collection strategy 85
5.18. Many agencies produce water information for their own monitoring, analysis or enforcement purposes. Often these data are unknown or unavailable to other agencies (both users and producers of water statistics) that could use these data for other purposes. Even if agencies are aware of what data exist, they may not have access to the data, metadata or information on data quality. In such cases, they may be unable to determine how well these data might meet their own needs or those of other potential data users. 5.19. The legal framework, official roles and responsibilities of the agencies involved in water management and the production of water statistics vary between countries. All countries need mechanisms for the coordination of water statistics and these should be described in the data-collection strategy. Some countries may need to establish coordination mechanisms, while oth-ers will already have them. Coordination is often done through committees or working groups on water statistics composed of the main users and producers of data. These committees or working groups can be the result of formal agreements or memorandums of understanding. 5.20. Regardless of whether they have to be established or already exist, the committees or working groups need to address both strategic issues and practical considerations. Stra-tegic issues include what data should be produced, when it should be produced and which organizations should be responsible for the collection, integration and dissemination of water statistics. Practical considerations include such issues as what methods are to be used to collect and process the data, as well as in what format the data are to be disseminated. Coordination usually works at two levels. For example, a high-level committee addresses the strategic issues of what to produce and who will produce it, while a working group (or working groups) focus on the practical considerations of how to produce water statistics. 5.21. The coordination mechanisms should include regular meetings of stakeholders. This provides a platform for cooperation and helps to promote a sound understanding of data requirements. It may also help to identify in advance changes to surveys or administrative processes that may affect the availability of data, and alternative arrangements to be made. Similarly, a coordination mechanism may enable surveys or administrative processes to be modified to suit the data needs of a larger number of users, and allow for the synchronization of survey activity and publication of data. To assist with coordination, it is useful for each producer of water statistics to identify a focal point or main contact for data-related issues, such as a person in charge of water statistics or information management. 5.22. As mentioned in the introduction, an agency needs to take the lead in water statis-tics. However, in some countries there may be no single lead agency but rather several agen-cies taking leadership in different areas of water statistics or at different times. For example, national statistical agencies may take the lead in the physical flows within the economy and the monetary data items, while water or environment agencies may take the lead in physical stocks and waterborne emissions. Whether or not a lead agency is identified, it is imperative that agencies work together to produce a comprehensive range of water statistics.
3. Data-sharing
5.23. The sharing of data between agencies has many benefits. For the collectors, cost may be eliminated or reduced compared to the cost of initiating a new data collection, if the information can be obtained from existing data sources. Data-sharing also eliminates the pos-sibility of conflicting data being produced, and can reduce the burden (i.e., data are collected only once and used by multiple agencies) of respondents, in this case the establishments or households that are reporting the data. 5.24. The sharing of data between agencies can occur in a number of ways, but because of sensitivities about data confidentiality, such arrangements need to be formalized, usually by data-sharing agreements. In some cases, environmental information systems may be estab-
International Recommendations for Water86
lished.125 Some of the practicalities and legal aspects of accessing water statistics and sharing data will be discovered during the identification and review of current water statistics (see sects. D and E); a common problem is that some agencies are unwilling or unable to share data for legal, institutional or other reasons. 5.25. Often, agencies will be unwilling to share data because they fear that the sharing of data will reveal information that may be used unfairly against them, or that it will expose data gaps and deficiencies for which they could be criticized. They may also believe that there is no benefit in sharing data and that by sharing data they will weaken their own position. 5.26. In such cases, the data-collection strategy will need to articulate clearly the value added by sharing data and should address the concerns of agencies worried about the conse-quences of exposing their data to great scrutiny or that their importance may be diminished by so doing. If these concerns are not addressed, there is little chance that the agencies will accept the strategy and agree to share data. 5.27. Data-sharing agreements should clearly define procedures for requesting, sharing and attributing data. Since data are usually transferred in electronic formats, these formats must be agreed on and special attention should be paid to the security of the data dur-ing transfer (e.g., during transmission via the Internet). They also need to include agreed metadata (see chap. VII) and provide a clear statement of the purposes for which the shared data may be used. It is usual to specify that the data may be used only for statistical pur-poses and that data relating to individual statistical units will remain confidential. That is, the data of individual units cannot be disclosed to third parties and the data collected for statistical purposes cannot be used for compliance and enforcement. National statistical offices in particular will always need to guarantee the confidentiality of the data collected by them in surveys. Agreements should also specify how the data are to be acknowledged in the publications of other agencies. 5.28. To maintain the trust and confidence of those providing data via surveys or other means (i.e., the respondents), all producers of water statistics need to have procedures in place to prevent the disclosure of individual unit record data. These include:
• Rules and regulations to prevent disclosure, including penalties for disclosing confi-dential data
• Restrictions of access to individual data to those that require the information in the performance of their statistical duties
• Special aggregation rules and output review procedures to prevent residual disclo-sure when aggregations of survey or other confidential data are disseminated (see chap. VIII)
• Protection of the individual data when unit records are made available for research purposes (e.g., by making all records anonymous or ensuring that access to data is bound by confidentiality provisions)
• Appropriate guarding of the confidentiality of data during storage and the process of the destruction of records
• Steps to secure the premises of the data-producing agency and its computer systems to prevent unauthorized access to individual data
5.29. In the case of water statistics, confidentiality can present a problem for the water supply and sewerage industries (ISIC, Rev. 4, divs. 36 and 37), because in some countries there are very few establishments engaged in the activities of these industries and there may be monopoly providers for water supply and sewerage services. This problem grows with increasing levels of geographic detail (i.e., it is more serious at the river basin level than at the national level) and industry disaggregation (i.e., it is more serious at the class or 4-digit
125 See, for example, Status of Environment Statistics in Mauritius: Country Report (2007). Available from http://unstats.un.org/unsd/environment/envpdf/UNSD_UNEP_ECA%20Workshop/Mauritius.pdf (accessed 4 Janu-ary 2010).
Data-collection strategy 87
level than at the division or 2-digit level of ISIC, Rev. 4). In these cases, data producers will need to work with the units and industries affected and agree on the level of detail that may be disclosed.
D. Review of existing water statistics 5.30. The development of water statistics in countries and the production of a data-collection strategy requires a careful review of the existing water statistics. The purpose is to identify what data currently exist, determine the quality of the data and assess it against data needs identified, in order to establish priorities for the collection of additional data or the improvement of the quality of existing data. 5.31. The water statistics identified will probably be in the form of data sets, which are a collection of data items about a particular statistical population or populations, such as house-holds, establishments, or a particular water resource (e.g., artificial reservoirs or rivers). The information in the data sets identified should be compared against the list of recommended data items (chap. IV) and catalogued. 5.32. The catalogue should include metadata (see chap. VII), including the name of the dataset, the agency responsible for its production, a contact name within the agency, the data items contained in the dataset, the methods and classifications used, the frequency of pro-duction, and the scope and coverage of the data set (e.g., the temporal and spatial references, industries covered, the types of economic units or water resources about which data are held). 5.33. Each data set should also be assessed against data quality criteria. A number of frame-works for assessing the quality of statistics have been developed by international, national and other statistical organizations.126 The elements of data quality and how these may be assessed are set out in more detail in chapter VII. 5.34. The data gaps and deficiencies identified from the review should be listed explicitly. This process should identify data items not collected by any agency; those that are collected but are of poor quality or limited in scope or coverage (temporal, geographic, industry, etc); those that are based on historical estimates or on limited data; and those that are inaccessible for legal reasons or because the institutional framework is poor. 5.35. A common finding from this process is that government agencies do not use the same classification systems. In particular, the classification of industries may not be consist-ent with ISIC. In this case, agencies should be encouraged to use ISIC and, as an interim measure, a concordance between the industry classification in use and ISIC can be developed.
E. Prioritization 5.36. While the recommended list of data items (chap. IV) should be compiled by all coun-tries, it is recognized that not all countries will have the resources available to produce high-quality statistics for all data items in the short to medium terms. Therefore, it will be necessary for many countries to identify the highest-priority data items, industries (e.g., agriculture, water supply industry) and geographic regions (e.g., densely populated regions, water-scarce regions) for their particular circumstances. It is often the case that there is a significant overlap of priorities. For example, because agriculture is a large water user, data item E, abstraction of water (in par-ticular by agriculture (ISIC, Rev. 4, div. 01)) in rural regions will be a priority for most countries. 5.37. While recognizing resource constraints and the need for prioritization, the long-term aim of a data-collection strategy should be to provide a clear view of how all of the data items in chap. IV for the main ISIC groupings and all of the river basins wholly or partly within a country can be produced.
126 For more details, see chap. VII.
International Recommendations for Water88
1. Prioritizing data items
5.38. Chapter IV breaks the data items down into 16 categories. Different data items will be more relevant to some countries than to others. For example, water-scarce countries (e.g., those with low or highly variable rainfall) could be expected to focus more on water avail-ability (data items A-E) and water use within the economy (data items F-G). Countries with a large manufacturing industry may focus more on waterborne emissions (data items J and K) than countries without significant manufacturing. In addition, agencies within countries will have different priorities based upon their mandate and the needs of their data users. For example, a meteorological agency will have as one of its first priorities data on precipitation (data item B.1), whereas a national statistical office will probably have as priority data the population using improved water sources (data item S).
2. Prioritizing geographic regions
5.39. National water statistics need to be disaggregated to be more useful for water man-agement and policymaking. Within countries, different geographic regions will have differ-ent environmental, economic and social-demographic characteristics. With respect to envi-ronmental characteristics, regions that have low levels of precipitation or are dependent on groundwater or water from neighbouring territories are likely to have a higher priority for data when compared to regions with relatively abundant amounts of water. 5.40. With respect to the economic characteristics of different regions, those with large water-using industries or industries that generate large amounts of pollution will be more important than the regions with industries using lesser amounts of water and producing less pollution. Rural regions will be important because agriculture (ISIC, Rev. 4, div. 01) uses large volumes of water and is also a significant source of diffuse waterborne emissions. Regions where there is a significant concentration of manufacturing industries (ISIC, Rev. 4, divs. 10-33) may also be important since they are typically a significant producer of point-source pollution (i.e., waterborne emissions). Regions regularly subjected to flooding, where water quality is naturally low or where historical activity has polluted the environment may also be important areas for water statistics. 5.41. Regions with large or growing populations or economies may also be a priority. These are likely to have a large or increasing demand for water and sewerage services by households, as well as growing demands for water in use by industries. 5.42. Water resources that are shared between countries, for example, where a river forms a border or where water flows from one country to another, are likely to be priority regions for countries. They may be especially important where rivers and river basins span several countries (e.g., the Danube, Mekong, Nile and Zambezi rivers).
3. Prioritizing frequency of data production
5.43. For the purposes of higher-level decision-making by Governments, it is usually suf-ficient to have water statistics produced at annual intervals. However, different data items may be available at different frequencies from different data sources. For example, it is usual for water suppliers (ISIC, Rev. 4, div. 36) to monitor the amount of water stored in artifi-cial reservoirs (data item A.1.1) daily. This is because the amount changes frequently due to natural transfers (data item D) and the abstraction of water by the economy (data item E), which is important for the purposes of managing this particular water resource. However, for national, high-level decision-making it is usually not necessary to have such detail, even if it is available. The frequency of data production should be dictated by the rate of change in the data item being measured and the purpose for which the data are used. This will mean that some data may be produced annually, while other data may be produced at shorter (e.g., monthly or quarterly) or longer (e.g., biennial, three-, four- or five-yearly) intervals.
Data-collection strategy 89
4. Prioritizing industries and households
5.44. Industries of particular relevance to water statistics because they supply or use signifi-cant volumes of water or are significant sources of waterborne emissions are the water supply (ISIC, Rev. 4, div. 36), sewerage (ISIC, Rev. 4, div. 37), agriculture (ISIC, Rev. 4, div. 01), electricity (ISIC, Rev. 4, div. 35) and manufacturing (ISIC, Rev. 4, divs. 10-33) industries. These industries are described in detail in chapter III. There may be other industries that are important for particular countries, such as the industries associated with tourism in areas with high tourism where water may be limited (e.g., small islands). Furthermore, while some countries will find the divisions (two-digit code) of ISIC, Rev. 2, sufficient, other countries may find that disaggregation of some divisions to groups (three-digit code) or classes (four-digit code) is required. 5.45. It is also common practice in most countries to prioritize the larger establishments of the economy (as determined by economic measures such as value added and employment), regardless of their industry classification. This is because large establishments are generally more important than smaller units in estimation procedures (and therefore should be com-pletely enumerated if they are surveyed). 5.46. In addition to industries, households are almost always a high priority in countries. The health and well-being of people are closely associated with access to water and improved sanitation facilities, and in recognition of these data items (S and T, respectively) are included in the Millennium Development Goals.
5. Prioritizing water resources
5.47. Within countries, different water resources will be important. In all countries, pre-cipitation (B.1) will be a critical data item, especially because of changing patterns of precipi-tation due to climate change. In addition, in most countries the volume of water in artificial reservoirs (A.1.1) and groundwater (A.2), as well as the abstractions of water by economic units from these and other water resources (data item E.1), will be priority data items. For countries with water flowing into or out of their territory via rivers or groundwater, the data items on inflow (B.2) and outflow (C.2) are also critical.
F. Agreement on roles and responsibilities 5.48. Once the existing data and institutional arrangements are known, understood and assessed against the priorities for information, an agreement on which data items are to be produced by which agencies is needed. This agreement should be accepted by the main users and producers of water statistics and published as part of the data-collection strategy. 5.49. The identification of the agencies responsible for specific data items is a critical part of the agreement and the strategy. It may be useful to show the agencies responsible for the different data items in a tabular form (see table V.1; this example is a generalization but it provides a clear overview of which agencies will produce which data items). Such tables can be elaborated by countries to show the organizations and data items appropriate to them, as well as to show the details of frequency, time of production, spatial resolution, etc. 5.50. The strategy should also provide the main working details of data production, such as a timetable, the identification of methods (see chap. VI) and general strategies to be used to produce the required data items. For example, the strategy may identify a “bottom-up” or “top-down” approach to the collection and compilation of different data items. 5.51. An example of the “bottom-up” approach would be to collect or compile the statis-tics from sources associated with each river basin within a territory of reference and to add these together to provide a national total. This is typically the starting point for the inland water resources stocks and flows within the environment (data items A-D). The “top-down”
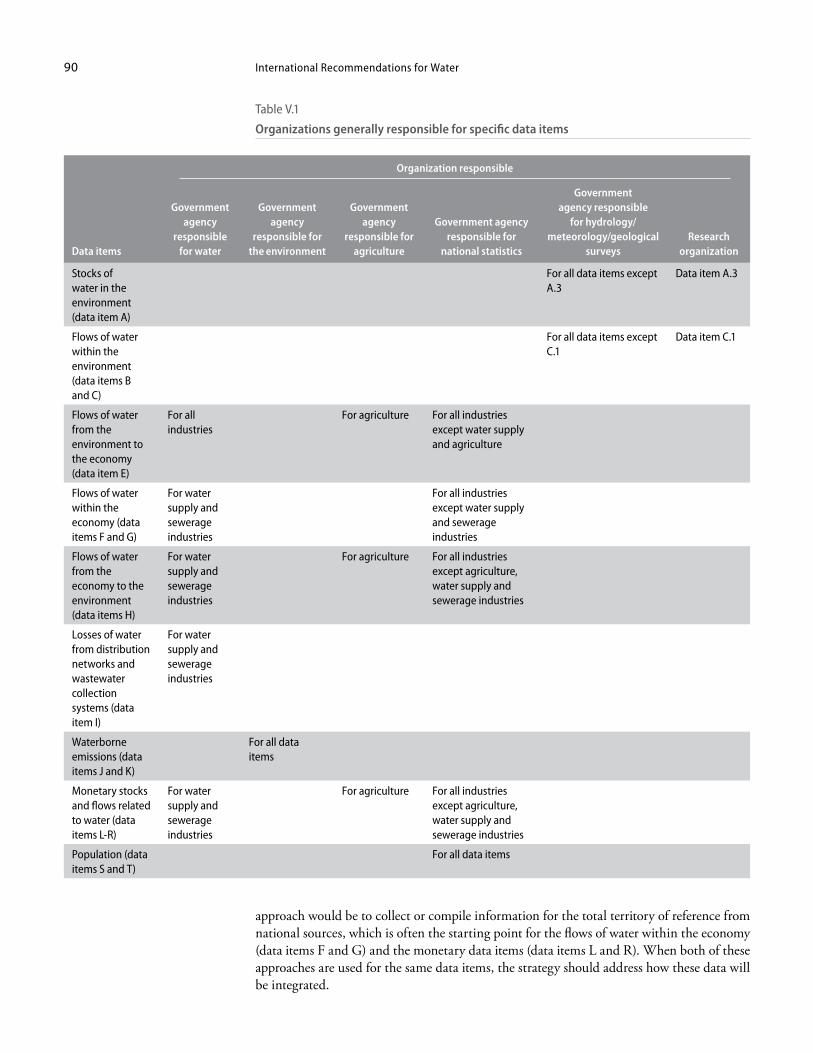
International Recommendations for Water90
approach would be to collect or compile information for the total territory of reference from national sources, which is often the starting point for the flows of water within the economy (data items F and G) and the monetary data items (data items L and R). When both of these approaches are used for the same data items, the strategy should address how these data will be integrated.
Table V.1
Organizations generally responsible for specific data items
Organization responsible
Data items
Government agency
responsible for water
Government agency
responsible for the environment
Government agency
responsible for agriculture
Government agency responsible for
national statistics
Government agency responsible
for hydrology/meteorology/geological
surveysResearch
organization
Stocks of water in the environment (data item A)
For all data items except A.3
Data item A.3
Flows of water within the environment (data items B and C)
For all data items except C.1
Data item C.1
Flows of water from the environment to the economy (data item E)
For all industries
For agriculture For all industries except water supply and agriculture
Flows of water within the economy (data items F and G)
For water supply and sewerage industries
For all industries except water supply and sewerage industries
Flows of water from the economy to the environment (data items H)
For water supply and sewerage industries
For agriculture For all industries except agriculture, water supply and sewerage industries
Losses of water from distribution networks and wastewater collection systems (data item I)
For water supply and sewerage industries
Waterborne emissions (data items J and K)
For all data items
Monetary stocks and flows related to water (data items L-R)
For water supply and sewerage industries
For agriculture For all industries except agriculture, water supply and sewerage industries
Population (data items S and T)
For all data items
Data-collection strategy 91
5.52. The fully elaborated data-collection strategy, covering the statistics to be produced, the legal and institutional arrangements, the roles and responsibilities of the different agencies and the timeline for implementation, should be made available in a published form and its implementation should be regularly monitored. 5.53. In the Latin America and Caribbean region, it has been very useful to have a formal inter-agency committee or round table that plans, at the national level, the collection of water statistics and environmental statistics in general. These committees are composed of high-level decision makers representing the major stakeholders in the country. These committees have improved the sustainability of the inter-agency work on water statistics in countries where such programmes have traditionally been vulnerable to changes in the administration, for example, as well as to staff turnover. This mechanism also has the benefit of allowing agen-cies to plan and allocate the necessary time and resources to collaborative work with other agencies, knowing they have the support of high-level decision makers.

93
Chapter VI
Data sources and methods
A. Introduction 6.1. Water statistics rely on many data sources and a variety of data-collection and com-pilation methods. In general the data falls into two distinct categories: data on the physical environment (i.e., stocks and flows of water in the environment) and physical and monetary data regarding water and economic units (e.g., flows of water between the environment and the economy and flows of water within the economy). The data sources and collection meth-ods used to produce the data items depend on the practices in countries, including the insti-tutional arrangements and level of human and financial resources available. 6.2. Data on the physical environment are usually collected by direct (scientific) observa-tion by agencies responsible for hydrological and meteorological monitoring and research. Data from or about economic units (i.e., establishments and households)127 are usually col-lected by two basic means: accessing data collected for administrative and other non-statistical purposes or by direct statistical surveys. In either case, the original providers of the data and the original sources of the data are the same, namely, the economic units and the records kept by these units. Surveys are usually conducted by the national statistical system, while administrative data are held by many government agencies and some NGOs. 6.3. Chapter VI describes the main data sources and methods used in water statistics. A general overview (sect. B) is followed by the detailed description of survey data and methods (sect. C), administrative data (sect. D), hydrological and meteorological data (sect. E), and research data (sect. F). Each of these data sources are discussed with reference to a description of the data, the agencies that keep the data, advantages and difficulties of using each data source and how they are related to the data items in chapter IV. Section G deals with survey frames, which are the lists of statistical units for/from which data are collected and compiled. 6.4. More detailed information on data sources and methods will be provided in the data-compilation guidelines that will be published to support IRWS and may also be found in a range of other resources accessible via the Internet, many of which are referenced in the following sections of chapter VI.
1. Note on terminology and references
6.5. The terminology and definitions used in chapters VI to VIII are derived primarily from the common vocabulary for the Statistical Data and Metadata eXchange (SDMX),128 although other sources, such as the OECD glossary of statistical terms129 and other references are also used, as appropriate.
127 See chap. III. 128 See SDMX, available from http://www.sdmx.org/ (accessed 15 June 2009); SDMX is sponsored by BIS, ECB,
Eurostat, IBRD, IMF, OECD and the United Nations. 129 OECD, Glossary of Statistical Terms. Available from http://stats.oecd.org/glossary/ (accessed 15 June 2009).
International Recommendations for Water94
6.6. The following terms used in chapter VI are taken from the SDMX Glossary of Statistical Terms,130 unless otherwise noted:
• Data source: a specific data set, metadata set, database or metadata repository from which data or metadata may be obtained
• Datasets: any organized collection of data • Derived data: data items derived from other data items using mathematical, logical or
other types of transformations, e.g., arithmetic formula, composition or aggregation• Estimates: values inferred from incomplete data sets by applying rules or methods.
Incomplete data sets include sample survey data • Frame (or survey frame): a list, map or other specification of the units which define a
population to be completely enumerated or sampled• Metadata: data that defines and describes other data • Survey: an investigation about the characteristics of a given population by means of
collecting data from a sample of that population and estimating their characteristics through the systematic use of statistical methodology
B. Overview of data sources 6.7. The main data sources used for producing the data items of IRWS consist of:
• Survey data• Administrative data• Hydrological/meteorological data• Research data
6.8. Surveys and administrative data sources are used mostly to produce the data from or about economic units, while hydrological/meteorological data and research data are used mostly to produce the data items related to the environmental units (their stocks and flows). National statistical offices traditionally collect data via surveys and by accessing administrative records, and this can also include the collection of hydrological/meteorological data from other agencies. 6.9. Survey data are collected directly from the economic units concerned. This is done either by collecting data from all the units in the population (i.e., a census) or by collecting data from only a few representative units scientifically selected from the survey frame (i.e., a sample survey). It should be noted that surveys under this definition are restricted to those which collect information directly from economic units (households or establishments). Sur-veys of physical resources, such as groundwater, conducted by technical teams are included in hydrological/meteorological data. 6.10. Government administrative processes are often set up to monitor and enforce legislation and regulations and this sometimes includes compiling a register of the economic units. These registers may be of households or establishments and also contain a variety of data about these units. For statistical purposes, most administrative data are received from government agencies. However, administrative data may also come from NGOs, such as industry associations. 6.11. Hydrological and meteorological data concern the water cycle (see figure II.1). Such data are usually collected by agencies responsible for weather forecasting and water resources management but may also be collected by agencies responsible for mining or geological surveys. Collection methods include the use of field monitoring stations (i.e., constituting a sample) and remote-sensing, and modelling techniques are frequently used when estimating related data items. Agencies collecting hydrological data may also collect data regarding flows between the environment and the economy. 6.12. Research data are typically collected and compiled by universities, research agencies or NGOs, which may have a number of research projects and programmes related to water and
130 SDMX Metadata Common Vocabulary, 2008. Available from http://data.un.org/Glossary.aspx?q=datamart[SDMX (accessed 10 July 2009).
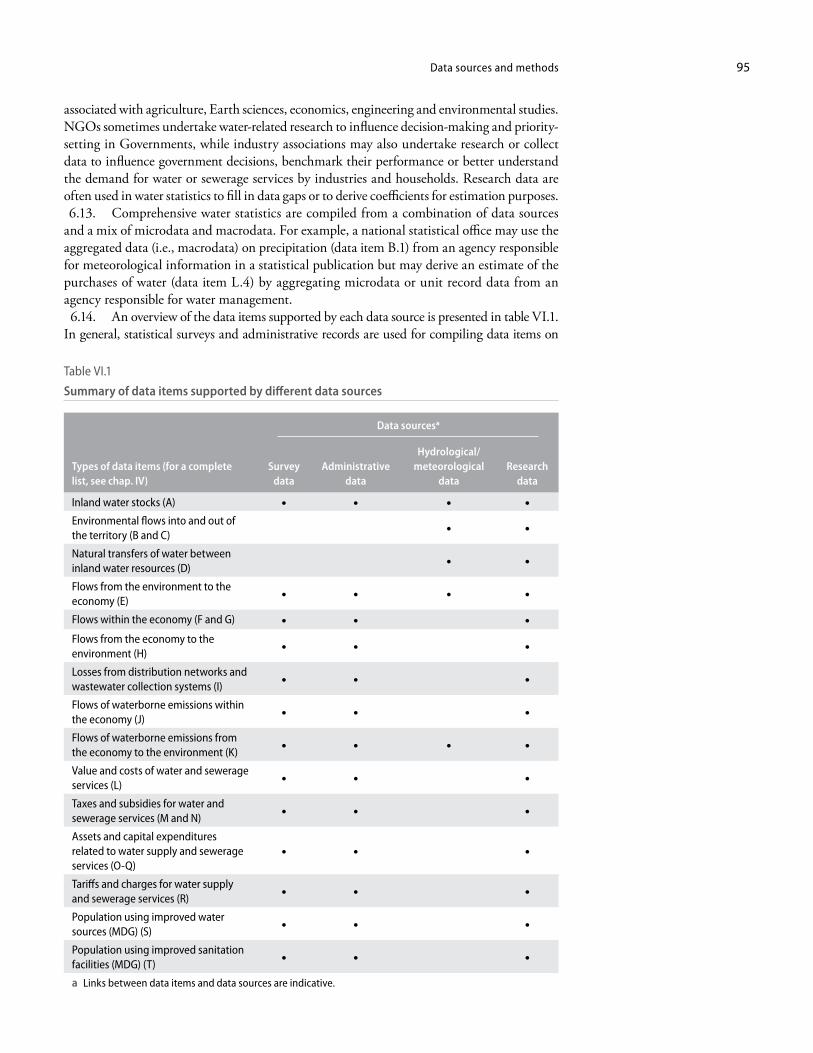
Data sources and methods 95
associated with agriculture, Earth sciences, economics, engineering and environmental studies. NGOs sometimes undertake water-related research to influence decision-making and priority-setting in Governments, while industry associations may also undertake research or collect data to influence government decisions, benchmark their performance or better understand the demand for water or sewerage services by industries and households. Research data are often used in water statistics to fill in data gaps or to derive coefficients for estimation purposes. 6.13. Comprehensive water statistics are compiled from a combination of data sources and a mix of microdata and macrodata. For example, a national statistical office may use the aggregated data (i.e., macrodata) on precipitation (data item B.1) from an agency responsible for meteorological information in a statistical publication but may derive an estimate of the purchases of water (data item L.4) by aggregating microdata or unit record data from an agency responsible for water management. 6.14. An overview of the data items supported by each data source is presented in table VI.1. In general, statistical surveys and administrative records are used for compiling data items on
Table VI.1
Summary of data items supported by different data sources
Data sourcesa
Types of data items (for a complete list, see chap. IV)
Survey data
Administrative data
Hydrological/ meteorological
dataResearch
data
Inland water stocks (A) • • • •
Environmental flows into and out of the territory (B and C)
• •
Natural transfers of water between inland water resources (D)
• •
Flows from the environment to the economy (E)
• • • •
Flows within the economy (F and G) • • •
Flows from the economy to the environment (H)
• • •
Losses from distribution networks and wastewater collection systems (I)
• • •
Flows of waterborne emissions within the economy (J)
• • •
Flows of waterborne emissions from the economy to the environment (K)
• • • •
Value and costs of water and sewerage services (L)
• • •
Taxes and subsidies for water and sewerage services (M and N)
• • •
Assets and capital expenditures related to water supply and sewerage services (O-Q)
• • •
Tariffs and charges for water supply and sewerage services (R)
• • •
Population using improved water sources (MDG) (S)
• • •
Population using improved sanitation facilities (MDG) (T)
• • •
a Links between data items and data sources are indicative.
International Recommendations for Water96
flows of water between the environment and the economy and within the economy, while hydro-logical and meteorological data sources are usually used for compiling data items on stocks and flows of water within the environment. Data from research agencies may cover all data items.
C. Survey data and methods 6.15. There are two types of surveys: (a) censuses and (b) sample surveys. A census is a survey that collects data from the entire population of interest. A sample survey is a survey carried out using a sampling method, i.e., in which data are collected from a portion of the population of interest only and not the whole population.131 The portion of the population surveyed is called the sample. Sampling methods are used to select the sample and ensure that certain levels of accuracy are achieved from the survey. 6.16. Many of the data items in chapter IV are or can be collected by census or sample survey. The type and accuracy of water data items derived from these sources depends on many factors: the characteristics of the target population, the sample size, the survey mode, the ability of respondents to recall or to have stored records on the data sought, the design of questionnaires, the response rate to the survey, and the response rate to specific questions in the survey.
1. Approaches to collection of water statistics via surveys
6.17. There are two general approaches used to collect water statistics by statistical survey. The first approach involves adding water-related questions to surveys primarily intended to collect data on other topics, such as adding questions to regular surveys of households or establishments. The second approach uses surveys primarily intended to collect water statistics. The latter approach is typically used for the water supply (ISIC 36) and sewerage (ISIC 37) industries and large water-using industries, such as agriculture (ISIC 01) and energy (ISIC 35), particularly if there is a significant level of hydropower generation. 6.18. A third approach is to combine the first two approaches. In this case, some basic water-related questions are added to another questionnaire, and depending on the responses, a second and more detailed questionnaire primarily about water may be sent. For example, an agricultural survey may contain the question whether the respondent used water for irri-gation. If the answer is yes, then a second, more detailed questionnaire is sent on different aspects of water use. This approach is sometimes referred to as a two-stage survey or the use of “trigger” questions. A two-stage survey is useful if it is expected that a large number of population selected in the first sample survey would be out of scope or would be insignificant contributors to total estimates. 6.19. Regardless of which approach is used, provision should be made for intensive follow-up. All questionnaires should ask for contact details of a person to whom follow-up ques-tions may be asked. A summary of survey data-collection methods that can be used, such as personal interviews, self-completed survey forms and electronic data collections, is provided in section C.5. 6.20. It is important to ensure that the measurement units used are clearly identified and correctly reported in the questionnaire. Good questionnaire design will help to minimize the chances of misreporting units. In some instances, conversion factors will need to be provided (e.g., between cubic metres and acre-feet or cubic metres and megalitres). 6.21. Regardless of the approach used, in many instances the respondents to question-naires may not have the data or knowledge necessary to answer all questions. This can lead to a high rate of non-response or inaccurate responses. Some respondents, in particular
131 See International Statistical Institute, The Oxford Dictionary of Statistical Terms, Yadolah Dodge, ed. (Oxford University Press, 2003).
Data sources and methods 97
small water users, may have difficulty quantifying some water data items. To assist such respondents, the questionnaire should provide an instruction to the effect that where the information is not known from direct measurement, careful estimates may be reported. Large water users will usually be able to estimate water abstraction and use figures. Over time, the responses to questions of water can be expected to improve as those surveyed become more familiar with the questions and as they start to store the information required in their own recording systems. 6.22. While respondents to surveys have less reason to deliberately misreport data, when compared with some administrative data collections used for monitoring and enforcement, deliberate misreporting can still occur. Again, this can be minimized by good survey design, but the degree to which the respondents trust the agency undertaking the survey will affect the quality of the data. Surveys conducted by national statistical offices usually guarantee that the individual data collected are strictly confidential and will be used only for statisti-cal purposes (i.e., not for compliance or enforcement (see chap. VIII)). However, in practice respondents may not fully trust the confidentiality guarantee and it is highly unlikely that they will voluntarily report gross violations of the law.
Adding questions on water data items to other surveys
6.23. Adding questions on the water data items to surveys not primarily intended for the purpose of collecting water data is a practice used in many countries. Examples include questions added to agriculture (ISIC, Rev. 4, div. 01), mining (ISIC, Rev. 4, divs. 05-09), manufacturing (ISIC, Rev. 4, divs. 10-33) and service industry surveys, as well as house-hold surveys and censuses of population and housing (see table VI.2). Such surveys are usually conducted by national statistics offices or by other parts of the official statistical system of a country. 6.24. The main advantages of adding questions to other surveys are:
• It is less expensive than collecting data by a separate survey• The response burden is minimized• Water data can be directly compared with other data collected
6.25. Adding questions to other surveys is less expensive than developing and running separate surveys that primarily concern water. For example, savings are made with regard to printing questionnaires, postage, data capture and other processes, such as questionnaire design and testing. Using existing questionnaires minimizes response burden because only a few extra questions are usually added. The water data collected in this way can be directly linked to and compared with other social-demographic or economic data collected as the primary purpose of the survey. 6.26. The main difficulties of collecting water data items by adding water-related questions to other surveys include:
• Limited space available for additional questions in existing surveys• The survey frame, stratification of the population and sample selection may not be
ideal for water statistics, since the main subject of the survey is not water• Respondents may not be familiar with water terms or the information needed to
answer water-related questions• Acceptance of additional water questions on the questionnaire by stakeholders
6.27. There is a limit to the size of survey questionnaires, which will in turn limit the amount of water data that can be collected. In many instances, it is possible to add a small number of questions (one to four) about water. In most cases, these will be at the end of the questionnaire and probably as a separate group of questions, but it may also be possible to integrate water-related questions into the original structure of the questionnaire. In industrial surveys, for example, expenditures on water or sewerage services and investments in water supply and sewerage infrastructure may be grouped with other types of expenditures, while
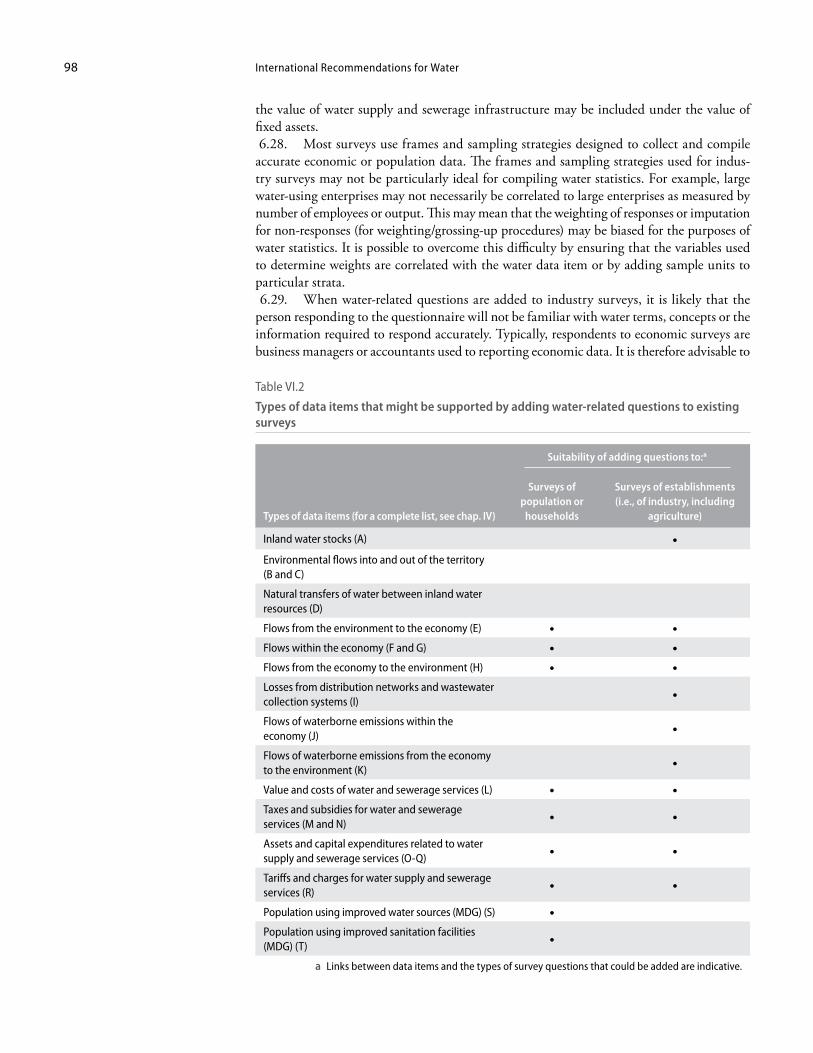
International Recommendations for Water98
the value of water supply and sewerage infrastructure may be included under the value of fixed assets. 6.28. Most surveys use frames and sampling strategies designed to collect and compile accurate economic or population data. The frames and sampling strategies used for indus-try surveys may not be particularly ideal for compiling water statistics. For example, large water-using enterprises may not necessarily be correlated to large enterprises as measured by number of employees or output. This may mean that the weighting of responses or imputation for non-responses (for weighting/grossing-up procedures) may be biased for the purposes of water statistics. It is possible to overcome this difficulty by ensuring that the variables used to determine weights are correlated with the water data item or by adding sample units to particular strata. 6.29. When water-related questions are added to industry surveys, it is likely that the person responding to the questionnaire will not be familiar with water terms, concepts or the information required to respond accurately. Typically, respondents to economic surveys are business managers or accountants used to reporting economic data. It is therefore advisable to
Table VI.2
Types of data items that might be supported by adding water-related questions to existing surveys
Types of data items (for a complete list, see chap. IV)
Suitability of adding questions to:a
Surveys of population or
households
Surveys of establishments (i.e., of industry, including
agriculture)
Inland water stocks (A) •
Environmental flows into and out of the territory (B and C)
Natural transfers of water between inland water resources (D)
Flows from the environment to the economy (E) • •
Flows within the economy (F and G) • •
Flows from the economy to the environment (H) • •
Losses from distribution networks and wastewater collection systems (I)
•
Flows of waterborne emissions within the economy (J)
•
Flows of waterborne emissions from the economy to the environment (K)
•
Value and costs of water and sewerage services (L) • •
Taxes and subsidies for water and sewerage services (M and N)
• •
Assets and capital expenditures related to water supply and sewerage services (O-Q)
• •
Tariffs and charges for water supply and sewerage services (R)
• •
Population using improved water sources (MDG) (S) •
Population using improved sanitation facilities (MDG) (T)
•
a Links between data items and the types of survey questions that could be added are indicative.
Data sources and methods 99
ask for the contact details of a person to whom follow-up questions on water can be directed. In large businesses, this could be an environmental manager. 6.30. When proposing to add water questions to existing questionnaires, there is often resistance from those responsible for conducting the survey. Concerns about the difficultly of questions and the ability of respondents to provide accurate data may be raised. In such cases, it is necessary to explain the importance of the data to those responsible for conducting the survey; to ensure that the questionnaire is well designed; and to ensure that interviewers, if used, are appropriately trained. These issues are discussed in more detail below.
Surveys primarily intended for collecting water data
6.31. Water-specific surveys can be censuses or sample surveys. Examples of water-specific surveys include censuses and surveys of agriculture (ISIC 01), electricity (ISIC 35),132 water supply (ISIC 36) and sewerage (ISIC 37), other industries and households. 6.32. The advantages of collecting data by surveys primarily intended for collecting water data are:
• The survey frame and sampling used can be selected with the specific purpose of col-lecting and compiling water statistics
• Consistent concepts and definitions can be used in survey questions• Confidentiality of survey data encourages honest reporting• The most suitable type of survey mode for collecting water data can be selected• If used, interviewers can be trained to provide clarification and guidance to responders
on water terms, concepts and definitions 6.33. Surveys primarily intended for collecting water data can use frames and sample selec-tion that are tailored to water statistics. This ensures that the sample is better able to represent the target population in terms of estimating the water data items. For example, the coverage of economic units engaged in industries and geographic regions can be tailored specifically to the needs of water statistics. 6.34. Undertaking a survey to collect data items on water allows greater control in ensur-ing that water statistics concepts and definitions are used. Terms used in surveys may differ from the terms used to describe the data items in chapter IV because they may be understood to mean different things in the survey population. For this reason, the terms used in a survey should reflect (i.e., should be translated into) the common language used by the population being surveyed. All questionnaires should be tested to assess the best questionnaire design to collect the data required. 6.35. When undertaking a water-specific survey, the most appropriate method for collect-ing data can be selected. For example, because of the need to clarify some of the terms and concepts used in water statistics, personal interviews rather than mail-out/mail-back ques-tionnaires may be preferred (see sect. C.5). Enumerators can be trained in the use of terms and concepts and may therefore be able to increase both the response rate and the accuracy of responses. The method of data collection needs to be selected on the basis of expected improvements in the quality of responses relative to the additional costs involved. 6.36. When collecting survey data from water-specific surveys, the main difficulties are:
• Additional respondent burden• Cost in terms of finance, human resources and time• Lack of a suitable register, list or map to use as a survey frame
6.37. Every additional survey or question in a survey adds to the response burden. Increased response burden is known to reduce both the response rate to questionnaires and the accuracy of those responses.
132 Electricity generators use significant quantities of water for hydroelectricity generation and for cooling in thermal or nuclear electricity generation plants. For this reason, surveys of electricity generators often include questions on water.
International Recommendations for Water100
6.38. Conducting a water-specific survey is resource-intensive. For example, a frame needs to be selected or developed, the target populations identified, samples selected, questionnaires designed and tested and data items collected and compiled. These tasks require skilled staff and significant amounts of time to ensure successful data collection and compilation. 6.39. In some instances, the frames for surveys may not be ideal. For example, survey designers may lack information on the location of economic units in river basins and hence may not allow for a sample selection to be optimized for estimating data items by river basin.
2. Household surveys
6.40. Household surveys can be used to collect water statistics. Detailed guidance on household surveys can be found in Principles and Recommendations for Housing and Popula-tion Censuses 2010 (PRHPC) 133 and the UNICEF/WHO Joint Monitoring Programme’s Multiple Indicator Cluster Survey 3 Manual (MICS3).134
6.41 . Principles and Recommendations for Housing and Population Censuses recommends that the following data related to household water and sanitation be collected by countries: the water supply system, the main source of drinking water, the type of toilet, the type of sewage disposal, bathing facilities, and the availability of hot water. 6.42. The Multiple Indicator Cluster Survey 3 Manual survey collects data about water and sanitation, including the main source of drinking water for members of the household; the main source of water used by the household for other purposes, such as cooking and hand-washing; household water treatment; the time to the source of water; the person collecting the water; and the type of toilet facility used by the household. 6.43. Data from the population and housing censuses and household surveys can be used to compile data items on the population using improved water sources (S) and sanitation facilities (T). These data items correspond with MDG indicators 7.8, on the use of improved drinking water sources, and 7.9, on the use of improved sanitation facilities. 6.44. Social and demographic statistics can also be used, together with other information and coefficients, to derive estimates on the abstraction of water from inland water resources (E.1), the use of water (G.1), the discharge of wastewater to other economic units (e.g., sewer-age) (F.3), and waterborne emissions to other economic units (J). This macrodata may have significant margins of error, depending on the quality of coefficients and other information. 6.45. Household budget surveys can be used to collect monetary data on household expen-ditures related to the use of water and sewerage services. 6.46. Household surveys with the primary purpose of collecting water data may also be implemented. The data items that can be supported by household surveys are listed in table VI.3. The advantages and disadvantages of water-related surveys of households are described in paragraphs 6.31 to 6.39.
3. Industrial surveys
6.47. Industrial surveys include surveys of mining (ISIC 05-09), manufacturing (ISIC 10-33), electricity (ISIC 35), water supply (ISIC 36), sewerage (ISIC 37) and other industries (excluding agriculture (see sect. C.4)). Surveys of these industries are usually undertaken as a regular part of an economic statistics programme. IRIS135 provides guidance on the content of the surveys for these industries. 6.48 . IRIS recommends that the costs of water and sewerage services be collected and compiled for all industries. These data items correspond with the purchases of water (L.4)
133 United Nations Statistics Division, 2008, available from http://unstats.un.org/unsd/demographic/sources/ census/docs/P&R_Rev2.pdf (accessed 3 January 2009).
134 UNICEF/WHO, available from http://www.childinfo.org/mics3_manual.html (accessed 4 April 2009). 135 United Nations Statistics Division, 2008. Available from http://unstats.un.org/unsd/industry/docs/M90.pdf
(accessed 14 June 2009).
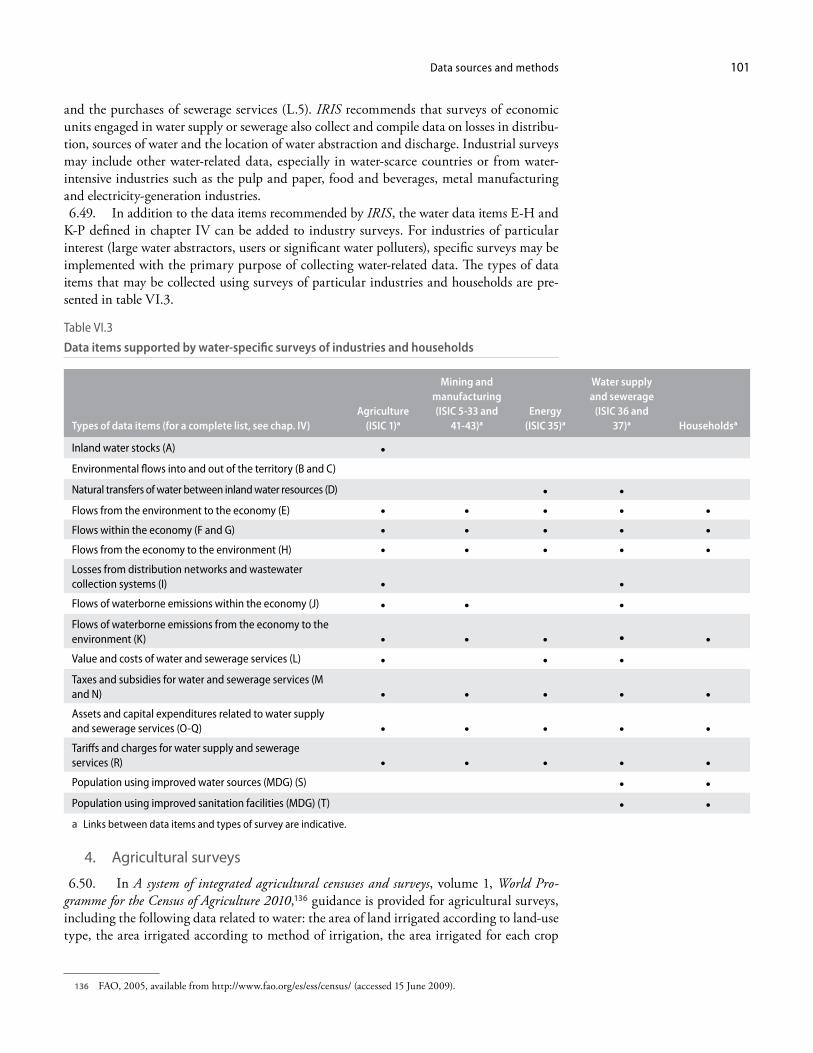
Data sources and methods 101
and the purchases of sewerage services (L.5). IRIS recommends that surveys of economic units engaged in water supply or sewerage also collect and compile data on losses in distribu-tion, sources of water and the location of water abstraction and discharge. Industrial surveys may include other water-related data, especially in water-scarce countries or from water-intensive industries such as the pulp and paper, food and beverages, metal manufacturing and electricity -generation industries. 6.49. In addition to the data items recommended by IRIS, the water data items E-H and K-P defined in chapter IV can be added to industry surveys. For industries of particular interest (large water abstractors, users or significant water polluters), specific surveys may be implemented with the primary purpose of collecting water-related data. The types of data items that may be collected using surveys of particular industries and households are pre-sented in table VI.3.
Table VI.3
Data items supported by water-specific surveys of industries and households
Types of data items (for a complete list, see chap. IV)Agriculture
(ISIC 1)a
Mining and manufacturing (ISIC 5-33 and
41-43)a
Energy (ISIC 35)a
Water supply and sewerage
(ISIC 36 and 37)a Householdsa
Inland water stocks (A) •
Environmental flows into and out of the territory (B and C)
Natural transfers of water between inland water resources (D) • •
Flows from the environment to the economy (E) • • • • •
Flows within the economy (F and G) • • • • •
Flows from the economy to the environment (H) • • • • •
Losses from distribution networks and wastewater collection systems (I) • •
Flows of waterborne emissions within the economy (J) • • •
Flows of waterborne emissions from the economy to the environment (K) • • • • •
Value and costs of water and sewerage services (L) • • •
Taxes and subsidies for water and sewerage services (M and N) • • • • •
Assets and capital expenditures related to water supply and sewerage services (O-Q) • • • • •
Tariffs and charges for water supply and sewerage services (R) • • • • •
Population using improved water sources (MDG) (S) • •
Population using improved sanitation facilities (MDG) (T) • •
a Links between data items and types of survey are indicative.
4. Agricultural surveys
6.50. In A system of integrated agricultural censuses and surveys, volume 1, World Pro-gramme for the Census of Agriculture 2010,136 guidance is provided for agricultural surveys, including the following data related to water: the area of land irrigated according to land-use type, the area irrigated according to method of irrigation, the area irrigated for each crop
136 FAO, 2005, available from http://www.fao.org/es/ess/census/ (accessed 15 June 2009).
International Recommendations for Water102
type, the sources of irrigation water, payment terms for irrigation water, other types of water-management practice, and the presence of drainage equipment. 6.51. In addition, the water data items E-H and K-P defined in chapter IV can be col-lected from economic units engaged in agriculture by adding questions to regular agriculture surveys or censuses. However, because of limitations on the number of questions which may be added, countries may choose to run a separate water-specific survey of agriculture.
5. Summary of survey data-collection methods
6.52. A range of survey methods can be used to collect water data, including personal interviews, self-completed surveys and other methods.137 In general, personal interviews are preferable where the data to be collected are more complex, while self-completed question-naires are suitable where the questions are relatively straightforward and concepts are clear.
Personal interviews
6.53. Face-to-face interviews involve trained interviewers visiting people to collect ques-tionnaire data. It is a good approach for ensuring a high response rate to a sample survey or census, and trained interviewers usually gather better quality data. However, there are some disadvantages to this approach. Respondents may not always be available for interviews and the costs associated with the employment, training and travel of interviewers can be high. 6.54. Computer-assisted personal interviewing (CAPI) is a form of personal interviewing, but instead of completing a questionnaire, the interviewer brings along a laptop or hand-held computer to enter the information directly into the database. This method saves the time involved in processing the data, as well as saving the interviewer from carrying around hundreds of questionnaires. However, this type of data-collection method can be expensive to set up and requires that interviewers have computer and typing skills. Also, in remote areas there can be problems associated with the breakdown of computers and lack of access to repair facilities. 6.55. Telephone interviews involve trained interviewers phoning people to collect ques-tionnaire data. This method is quicker and less expensive than face-to-face interviewing. However, only people with telephones can be interviewed and the respondent can end the interview very easily. 6.56. Computer-assisted telephone interviewing (CATI) is a type of telephone interview, but in this case the interviewer keys respondent answers directly into a computer. This saves the time involved in processing data but can be expensive to set up and requires interviewers to have computer and typing skills; however, it is still less expensive than CAPI.
Self-completed surveys
6.57. A mail survey is a common method of conducting economic surveys. It is a relatively inexpensive method of collecting data that can distribute large numbers of questionnaires in a short time. It provides the opportunity to contact hard-to-reach people and respondents are able to complete the questionnaire in their own time. Mail surveys do require an up-to-date list of names and addresses, however. In addition, there is also the need to keep the question-naire simple and straightforward. A major disadvantage of a mail survey is that it usually has lower response rates than other data-collection methods. This may lead to problems with data quality. Also, people with a limited ability to read may experience problems. 6.58. A hand-delivered questionnaire is a self-enumerated survey hand-delivered to respondents and mailed back by them after completion. This method usually results in better response rates than a mail survey and is particularly suitable when information is needed from
137 The present summary of survey data-collection methods is adapted from Statistics Canada, Power from Data: Data Collection Methods. Available from http://www.statcan.gc.ca/edu/power-pouvoir/ch2/methods-methodes/5214773-eng.htm (accessed 11 June 2009).
Data sources and methods 103
several household members. The hand-delivered with pick-up method can also be used. The hand-delivered with respondent mail-back method can reduce the cost of collecting forms and gives a greater sense of privacy for respondents concerned with someone entering their home or business to collect the forms. 6.59. Often the most satisfactory collection strategy uses a combination of methods. For example, mail surveys have proven to be quite efficient when designed as a follow-up for those who did not respond to telephone interviews.
Other methods
6.60. Electronic data reporting (EDR) gives the respondents the option of reporting data electronically rather than filling out the usual paper questionnaire. The growing use of the Internet has brought greater attention to EDR. However, it is difficult to find a quick and easy way of reporting answers through the Internet without compromising confidentiality, privacy and data quality. At present, use of EDR is rare but countries are undertaking pilot projects to further develop EDR methods. 6.61. Other methods include direct observation, such as that used in pricing surveys, or the use of existing administrative records. The choice of method depends on various factors, including complexity and length of questionnaire, sensitivity of requested information, geo-graphical dispersion of survey population, cost and time frame.
6. Questionnaire design
6.62. Questionnaire design is a fundamental consideration when conducting a survey and it is therefore important to be aware of some of the considerations that should be addressed in this regard.138 A range of materials are available to assist with questionnaire design.139 6.63. A questionnaire is a set of questions designed to collect information from a respond-ent. Regardless of how data are collected, questionnaires play a central role in the data-collection process. They have a major impact on respondent behaviour, interviewer perfor-mance, collection cost and respondent relations, and therefore on data quality. The biggest challenge in developing a questionnaire is to translate the objectives of the data-collection process into a well conceptualized and methodologically sound study. 6.64. In light of the foregoing, the design of questionnaires should take the following into account:
• Survey objectives and data requirements• Method of data collection• Response burden and the target population• Data capture requirements• Data quality• The language used (e.g., complex words and terminology should be avoided)• How questions are framed (e.g., double-barrelled and loaded questions should be
avoided. Decisions need to be made about whether the questionnaire should include open questions in addition to closed questions.)
• Formatting and layout (e.g., clear headings, spaces for responses and clear instruc-tions)
6.65. A well-designed questionnaire efficiently collects the required data with a minimum number of errors. It facilitates the coding and capture of data and it leads to an overall reduc-
138 The present summary of questionnaire design considerations is adapted from Statistics Canada, Statistics Can-ada Quality Guidelines 2003, available from http://www.statcan.gc.ca/pub/12-539-x/index-eng.htm (accessed 27 May 2009); and Statistics Power from Data, available from http://www.statcan.gc.ca/edu/power-pouvoir/ch2/questionnaires/5214775-eng.htm (accessed 25 May 2009).
139 For example, D. A. Dillman, 2007, Mail and Internet Surveys: The Tailored Design Method, 2nd ed. (Wiley, Hoboken, United States of America).
International Recommendations for Water104
tion in the cost and time associated with data collection and processing. Good questionnaires impose a low response burden and are both respondent and interviewer friendly. They ask relevant questions and minimize the amount of editing and imputation that is required. All questionnaires should be evaluated periodically.
D. Administrative data 6.66. Administrative data are kept by government agencies and NGOs and may be used for statistical purposes. Government agencies keep administrative records of economic units (e.g., registers of households and establishments), as well as information about these units (e.g., number of employees, amount of tax paid and connections to water supply and sewerage networks) in response to legislation and regulations as well as for internal management purposes. Traditionally, most administrative data have been obtained from government agencies but they may also come from NGOs. For example, industry associa-tions will have lists of their members and may also have information about their members. In particular, associations of water suppliers and sewerage providers are good sources of information in many countries, and in some countries conduct surveys of their members. 6.67. The main advantages of administrative data sources are:
• The cost of collecting such data is less than that for surveys• The level of response burden on economic units is minimized• Complete coverage is assured of units under administration
6.68. The main benefit of using administrative data is that the cost of collecting such data is usually much less than establishing and conducting a survey. In addition, the level of response burden on economic units is minimized because units only have to respond to the administrative organizations rather than to the administrative organizations and the organization(s) conducting the survey(s). 6.69. Administrative data sources usually have complete coverage of the population to which the administrative process applies. While this is an advantage, it may cause certain difficulties as the population of interest (or target population) for the purposes of admin-istration may differ from the population of interest for water statistics, resulting in sample bias or under-coverage. For example, a permit may be required for groundwater abstrac-tions greater than a certain limit (or threshold) and it may be that many economic units abstract water at quantities below the limit for which permits are required and hence are not included in the data collected by the administrative agency. In addition, the spatial and temporal coverage of the administrative data may also be different from that required for water statistics. Administrative data are usually related to administrative regions (see chap. II), rather than river basins. 6.70. The main difficulties with using administrative data sources include:
• Differences between administrative and statistical terms and definitions • Administrative data collection that may change without regard to statistical consid-
erations• Multiple databases managed by multiple authorities• Risk of bias in data due to deliberate misreporting• Data that may not be checked or validated for statistical purposes• Possible restriction of access to data • Coverage of economic units or geographic regions that may not match statistical
requirements 6.71. With administrative data, there is a risk of differences between administrative and statistical terms and definitions. When using administrative data, the terms and definitions used by administrative datasets should be compared with the terms and definitions used in
Data sources and methods 105
chapter IV. A concordance can often be developed and over time it is possible to work with the agencies responsible for the administrative data to harmonize terms and definitions. 6.72. Administrative processes may change in response to new legislation, polices or pro-cedures, usually without regard for the impact on statistical systems. It is important to work with the administrative data sources and maintain good communication, so that any changes to administrative data collection are at least known in advance. 6.73. Administrative data related to water are likely to be kept by several agencies, espe-cially when water management is decentralized to regional water authorities or state, pro-vincial and local governments, as advocated by IWRM. When there is more than one gov-ernment agency administering water, there is a risk that the data from each agency may be conflicting or cannot be directly compared owing to differences in terms and definitions or for other reasons. For example, some agencies may include only water abstraction for con-sumptive uses and will not record water abstracted for use as cooling water or hydroelectric power generation. In addition, it is usual for government agencies to have different identifiers for the same unit, as well as different filing systems and computer databases, which can make finding and comparing data difficult and time-consuming. 6.74. Since many of the administrative data are collected for regulatory purposes, there may be an incentive for units to misreport data (e.g., to hide violations of regulations). Delib-erate misreporting can lead to biases in data, for example, the under- (or over-)estimation of abstraction of water (E), waterborne emissions (J-K), or water returned to the environment (H) based on information from permits. 6.75. Administrative agencies should verify that the data collected are accurate, particu-larly if the purpose of the data is to ensure compliance with regulations. However, this type of data validation may be different from statistical validation because the purpose of adminis-trative validation is usually to identify violations of regulations or collect payments in respect of permits. For example, validation may only involve a check that the data do not exceed a certain threshold, rather than checking consistency in time, within and among reporting units. Data validation should ensure that data are accurate, for example, that the data items have been classified correctly, the correct measurement units used, totals add up and data are consistent internally and with other available data. 6.76. Access to administrative data may be limited by laws or policies, particularly those regarding privacy or confidentiality. It is usually necessary to have access to the microdata to validate their quality and if necessary to re-aggregate. To gain access to microdata, national statistics offices and others compiling water statistics should provide guarantees of confidentiality and data security to administrative data sources. In many cases, national statistics offices and other agencies will already have the legal, administrative and practical measures necessary to protect privacy and confidentiality and statistical laws will guar-antee access to administrative data by statistical offices for statistical purposes. If this is not the case, in order to facilitate the use of administrative data for statistical purposes, it will be useful to negotiate a data-sharing agreement with administrative organizations (see chap. V).
1. Administrative data from government agencies
6.77. Administrative data may be held by national, state/provincial or local government agencies. Each country will have its own institutional arrangements and laws related to admin-istering inland water resources, water supply, sewerage, irrigation, hydroelectricity, etc. There may also be other laws, such as on taxation or public health, that may be associated with water data items. 6.78. In general, water data items may be sourced from government agencies with respon-sibilities for:
• Agriculture
International Recommendations for Water106
• Environment• Energy • Water resource management• Water supply and sanitation• Taxation
6.79. Table VI.4 shows the data items that may be held by such agencies. Government agencies with responsibilities for water management, supply or sanitation are usually a major data source for many data items. In many countries, Governments own and operate eco-nomic units engaged in water supply and sewerage operations. Even when economic units engaged in water supply and sewerage are not owned by the Government, government agen-cies are likely to collect information from these units regularly for administrative purposes. In addition, water agencies are likely to issue permits for water abstraction or the discharge of wastewater and waterborne emissions. 6.80. Agencies responsible for agriculture may have data on the use of water in this indus-try as well other data that may be useful for estimating data items for which there is no direct information. For example, an agricultural agency may issue permits for water abstraction or permits to irrigate land. In addition, use of water by an irrigated crop can be approximated by the area of the crops irrigated, the soil type and meteorological conditions, all of which may be collected by agricultural agencies. 6.81. In countries where there is significant generation of electricity by hydropower, the agencies responsible for energy will usually have information relating to data items. Large volumes of water are used for hydropower generation and the economic units involved usually supply water to other economic units. Even when countries do not have hydropower, energy agencies may have information on water because large volumes are used for cooling. 6.82. Government agencies concerned with other areas are also potential sources of data, such as agencies concerned with taxation, health, social welfare or emergency management. In the case of taxation, in many countries there are tax concessions for water use or the pur-chase or construction of water supply and sanitation infrastructure, while in some counties VAT applies to water. In addition, taxation agencies will have a range of economic data on the economic units using water. Agencies responsible for health and social welfare may have data relating to population data items.
2. Administrative data from non-governmental organizations
6.83. Administrative data or their equivalent may also be collected by NGOs, such as industry associations for irrigation, mining, energy or water supply and sanitation, as well as charities and aid organizations (table VI.5). Industry associations could have, for example, lists of economic units engaged in the economic activity they represent (e.g., irrigation, water supply and sewerage). They may also have information on some of the data items they have collected. In addition, some water suppliers and sewerage service providers may voluntarily provide data for the purposes of international comparisons.140
6.84. Other NGOs, such as humanitarian or civil society organizations with expertise in housing or health, may have data on the numbers of households abstracting water from the environment or those with access to toilets connected to sewers. It is important to note that data from NGOs are often collected in part for advocacy purposes, and it is important to understand the reasons why an NGO has collected and compiled data and any bias that may arise from its interest.
140 See International Benchmarking Network for Water and Sanitation Utilities (IB-NET). Available from http://www.ib-net.org/ (accessed 16 June 2009).
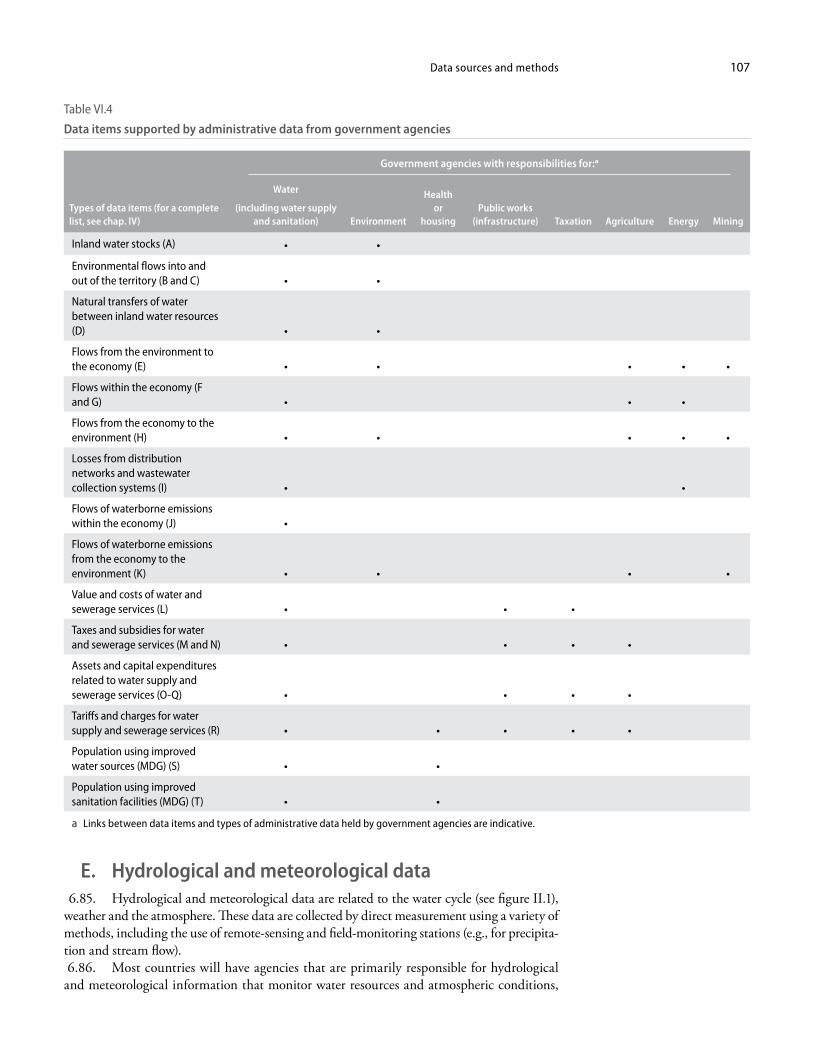
Data sources and methods 107
E. Hydrological and meteorological data 6.85. Hydrological and meteorological data are related to the water cycle (see figure II.1), weather and the atmosphere. These data are collected by direct measurement using a variety of methods, including the use of remote-sensing and field-monitoring stations (e.g., for precipita-tion and stream flow). 6.86. Most countries will have agencies that are primarily responsible for hydrological and meteorological information that monitor water resources and atmospheric conditions,
Table VI.4
Data items supported by administrative data from government agencies
Government agencies with responsibilities for:a
Types of data items (for a complete list, see chap. IV)
Water
(including water supply and sanitation) Environment
Health or
housingPublic works
(infrastructure) Taxation Agriculture Energy Mining
Inland water stocks (A) • •
Environmental flows into and out of the territory (B and C) • •
Natural transfers of water between inland water resources (D) • •
Flows from the environment to the economy (E) • • • • •
Flows within the economy (F and G) • • •
Flows from the economy to the environment (H) • • • • •
Losses from distribution networks and wastewater collection systems (I) • •
Flows of waterborne emissions within the economy (J) •
Flows of waterborne emissions from the economy to the environment (K) • • • •
Value and costs of water and sewerage services (L) • • •
Taxes and subsidies for water and sewerage services (M and N) • • • •
Assets and capital expenditures related to water supply and sewerage services (O-Q) • • • •
Tariffs and charges for water supply and sewerage services (R) • • • • •
Population using improved water sources (MDG) (S) • •
Population using improved sanitation facilities (MDG) (T) • •
a Links between data items and types of administrative data held by government agencies are indicative.
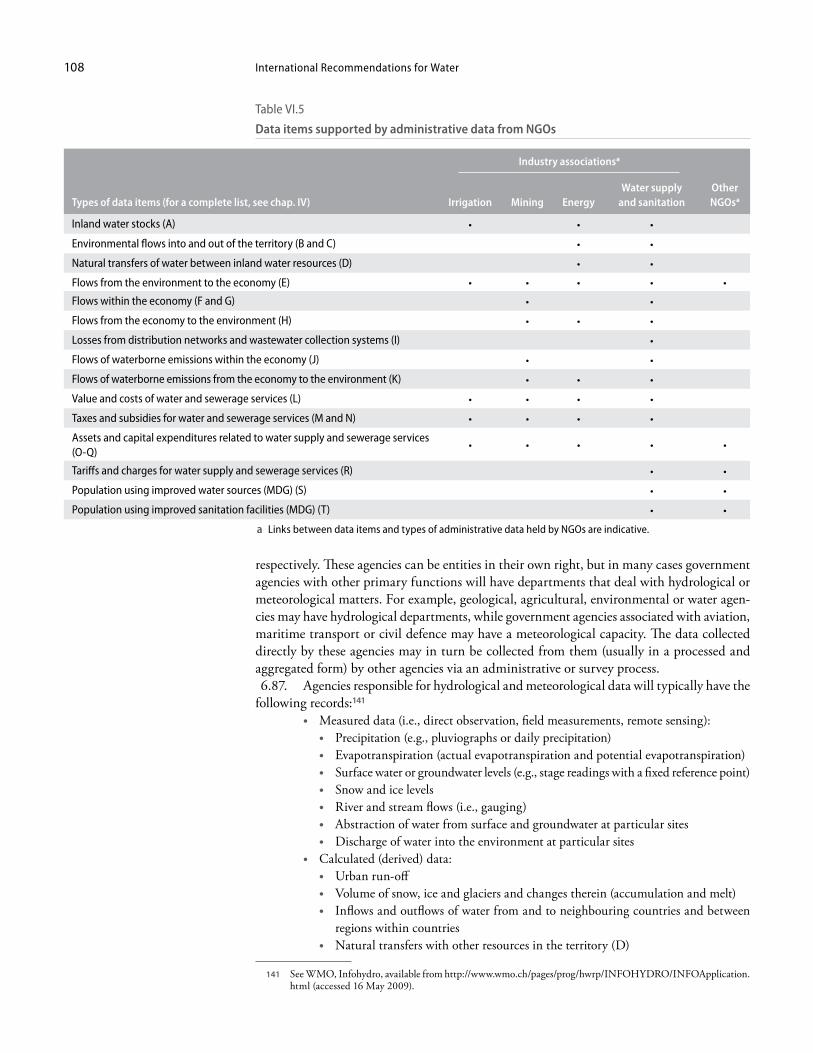
International Recommendations for Water108
respectively. These agencies can be entities in their own right, but in many cases government agencies with other primary functions will have departments that deal with hydrological or meteorological matters. For example, geological, agricultural, environmental or water agen-cies may have hydrological departments, while government agencies associated with aviation, maritime transport or civil defence may have a meteorological capacity. The data collected directly by these agencies may in turn be collected from them (usually in a processed and aggregated form) by other agencies via an administrative or survey process. 6.87. Agencies responsible for hydrological and meteorological data will typically have the following records:141
• Measured data (i.e., direct observation, field measurements, remote sensing):• Precipitation (e.g., pluviographs or daily precipitation)• Evapotranspiration (actual evapotranspiration and potential evapotranspiration)• Surface water or groundwater levels (e.g., stage readings with a fixed reference point)• Snow and ice levels• River and stream flows (i.e., gauging)• Abstraction of water from surface and groundwater at particular sites• Discharge of water into the environment at particular sites
• Calculated (derived) data:• Urban run-off• Volume of snow, ice and glaciers and changes therein (accumulation and melt)• Inflows and outflows of water from and to neighbouring countries and between
regions within countries• Natural transfers with other resources in the territory (D)
141 See WMO, Infohydro, available from http://www.wmo.ch/pages/prog/hwrp/INFOHYDRO/INFOApplication.html (accessed 16 May 2009).
Table VI.5
Data items supported by administrative data from NGOs
Industry associationsa
Types of data items (for a complete list, see chap. IV) Irrigation Mining Energy Water supply
and sanitation Other NGOsa
Inland water stocks (A) • • •
Environmental flows into and out of the territory (B and C) • •
Natural transfers of water between inland water resources (D) • •
Flows from the environment to the economy (E) • • • • •
Flows within the economy (F and G) • •
Flows from the economy to the environment (H) • • •
Losses from distribution networks and wastewater collection systems (I) •
Flows of waterborne emissions within the economy (J) • •
Flows of waterborne emissions from the economy to the environment (K) • • •
Value and costs of water and sewerage services (L) • • • •
Taxes and subsidies for water and sewerage services (M and N) • • • •
Assets and capital expenditures related to water supply and sewerage services (O-Q)
• • • • •
Tariffs and charges for water supply and sewerage services (R) • •
Population using improved water sources (MDG) (S) • •
Population using improved sanitation facilities (MDG) (T) • •
a Links between data items and types of administrative data held by NGOs are indicative.
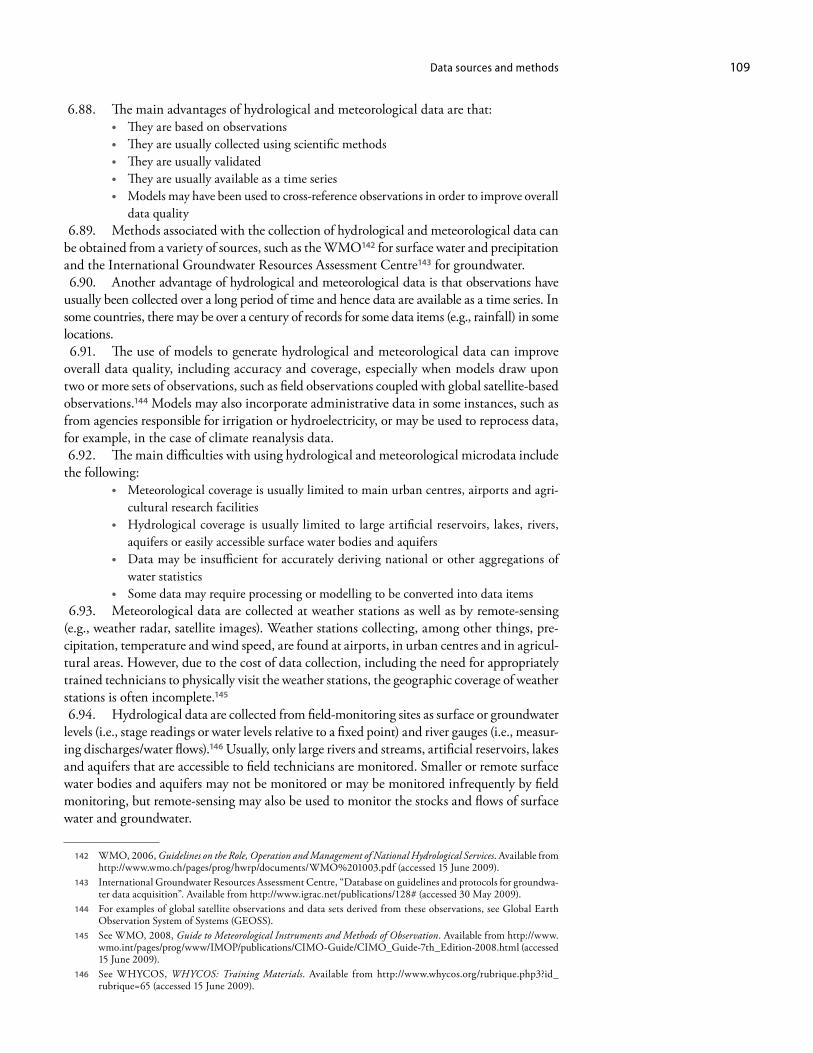
Data sources and methods 109
6.88. The main advantages of hydrological and meteorological data are that:• They are based on observations• They are usually collected using scientific methods• They are usually validated• They are usually available as a time series• Models may have been used to cross-reference observations in order to improve overall
data quality 6.89. Methods associated with the collection of hydrological and meteorological data can be obtained from a variety of sources, such as the WMO142 for surface water and precipitation and the International Groundwater Resources Assessment Centre143 for groundwater. 6.90. Another advantage of hydrological and meteorological data is that observations have usually been collected over a long period of time and hence data are available as a time series. In some countries, there may be over a century of records for some data items (e.g., rainfall) in some locations. 6.91. The use of models to generate hydrological and meteorological data can improve overall data quality, including accuracy and coverage, especially when models draw upon two or more sets of observations, such as field observations coupled with global satellite-based observations.144 Models may also incorporate administrative data in some instances, such as from agencies responsible for irrigation or hydroelectricity, or may be used to reprocess data, for example, in the case of climate reanalysis data. 6.92. The main difficulties with using hydrological and meteorological microdata include the following:
• Meteorological coverage is usually limited to main urban centres, airports and agri-cultural research facilities
• Hydrological coverage is usually limited to large artificial reservoirs, lakes, rivers, aquifers or easily accessible surface water bodies and aquifers
• Data may be insufficient for accurately deriving national or other aggregations of water statistics
• Some data may require processing or modelling to be converted into data items 6.93. Meteorological data are collected at weather stations as well as by remote-sensing (e.g., weather radar, satellite images). Weather stations collecting, among other things, pre-cipitation, temperature and wind speed, are found at airports, in urban centres and in agricul-tural areas. However, due to the cost of data collection, including the need for appropriately trained technicians to physically visit the weather stations, the geographic coverage of weather stations is often incomplete.145
6.94. Hydrological data are collected from field-monitoring sites as surface or groundwater levels (i.e., stage readings or water levels relative to a fixed point) and river gauges (i.e., measur-ing discharges/water flows).146 Usually, only large rivers and streams, artificial reservoirs, lakes and aquifers that are accessible to field technicians are monitored. Smaller or remote surface water bodies and aquifers may not be monitored or may be monitored infrequently by field monitoring, but remote-sensing may also be used to monitor the stocks and flows of surface water and groundwater.
142 WMO, 2006, Guidelines on the Role, Operation and Management of National Hydrological Services. Available from http://www.wmo.ch/pages/prog/hwrp/documents/WMO%201003.pdf (accessed 15 June 2009).
143 International Groundwater Resources Assessment Centre, “Database on guidelines and protocols for groundwa-ter data acquisition”. Available from http://www.igrac.net/publications/128# (accessed 30 May 2009).
144 For examples of global satellite observations and data sets derived from these observations, see Global Earth Observation System of Systems (GEOSS).
145 See WMO, 2008, Guide to Meteorological Instruments and Methods of Observation. Available from http://www.wmo.int/pages/prog/www/IMOP/publications/CIMO-Guide/CIMO_Guide-7th_Edition-2008.html (accessed 15 June 2009).
146 See WHYCOS, WHYCOS: Training Materials. Available from http://www.whycos.org/rubrique.php3?id_ rubrique=65 (accessed 15 June 2009).
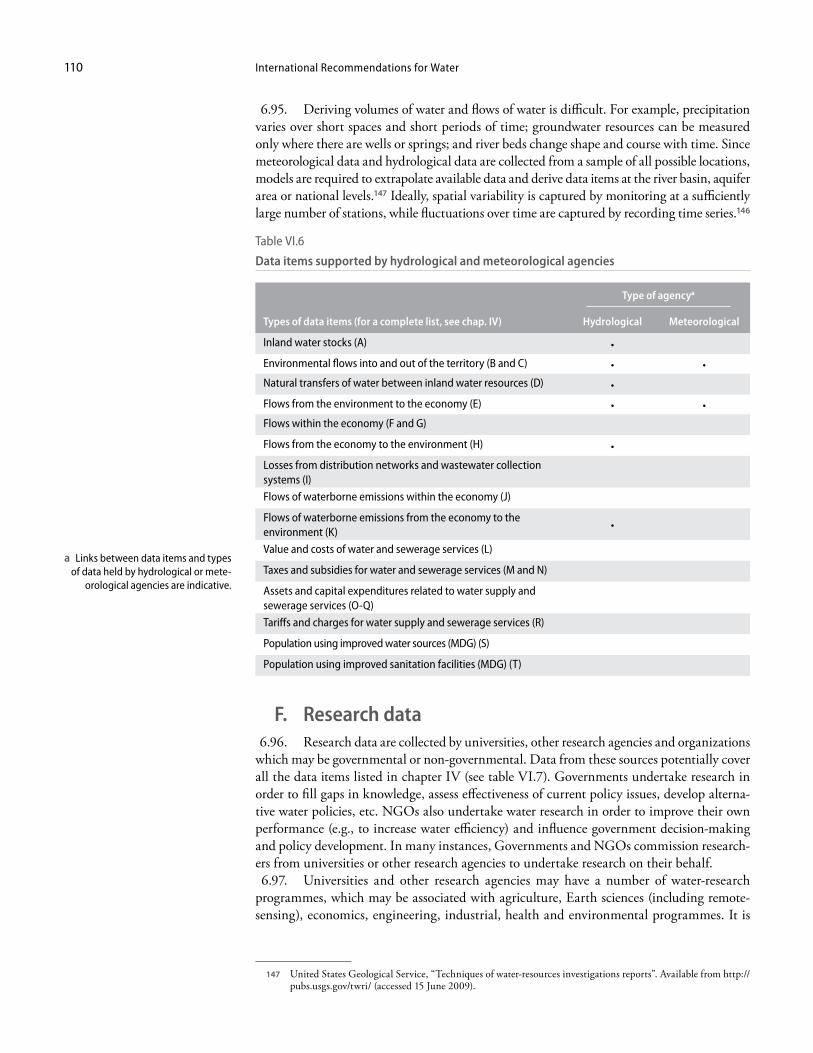
International Recommendations for Water110
6.95. Deriving volumes of water and flows of water is difficult. For example, precipitation varies over short spaces and short periods of time; groundwater resources can be measured only where there are wells or springs; and river beds change shape and course with time. Since meteorological data and hydrological data are collected from a sample of all possible locations, models are required to extrapolate available data and derive data items at the river basin, aquifer area or national levels.147 Ideally, spatial variability is captured by monitoring at a sufficiently large number of stations, while fluctuations over time are captured by recording time series.146
Table VI.6
Data items supported by hydrological and meteorological agencies
Type of agencya
Types of data items (for a complete list, see chap. IV) Hydrological Meteorological
Inland water stocks (A) •
Environmental flows into and out of the territory (B and C) • •
Natural transfers of water between inland water resources (D) •
Flows from the environment to the economy (E) • •
Flows within the economy (F and G)
Flows from the economy to the environment (H) •
Losses from distribution networks and wastewater collection systems (I)
Flows of waterborne emissions within the economy (J)
Flows of waterborne emissions from the economy to the environment (K)
•
Value and costs of water and sewerage services (L)
Taxes and subsidies for water and sewerage services (M and N)
Assets and capital expenditures related to water supply and sewerage services (O-Q)
Tariffs and charges for water supply and sewerage services (R)
Population using improved water sources (MDG) (S)
Population using improved sanitation facilities (MDG) (T)
F. Research data 6.96. Research data are collected by universities, other research agencies and organizations which may be governmental or non-governmental. Data from these sources potentially cover all the data items listed in chapter IV (see table VI.7). Governments undertake research in order to fill gaps in knowledge, assess effectiveness of current policy issues, develop alterna-tive water policies, etc. NGOs also undertake water research in order to improve their own performance (e.g., to increase water efficiency) and influence government decision-making and policy development. In many instances, Governments and NGOs commission research-ers from universities or other research agencies to undertake research on their behalf. 6.97. Universities and other research agencies may have a number of water-research programmes, which may be associated with agriculture, Earth sciences (including remote-sensing), economics, engineering, industrial, health and environmental programmes. It is
147 United States Geological Service, “Techniques of water-resources investigations reports”. Available from http://pubs.usgs.gov/twri/ (accessed 15 June 2009).
a Links between data items and types of data held by hydrological or mete-
orological agencies are indicative.
Data sources and methods 111
common for there to be multiple ongoing water research programmes within a single organi-zation. The data collected and produced depend on the focus of the research. 6.98. Water-related agricultural research will focus on abstraction of water by agriculture (part of E.1), waterborne emissions to the environment (K), and the economic aspects of water use and wastewater disposal (e.g., data items L-P). Research data often includes water use coefficients for crops grown under rain-fed or irrigated conditions (i.e., rain-fed agriculture or irrigated agriculture). 6.99. Engineering research into water may include data on the abstraction of water (E) by industry, particularly by the water supply industry (ISIC, Rev. 3, div. 36), flows of water in the economy (F-G), waterborne emissions (H), returns to the environment (H) and losses in distri-bution (I). Civil engineering programmes may also be interested in stocks of water in artificial reservoirs (A.1.1), and water abstracted from inland water resources (E.1) for hydroelectricity generation or cooling in electricity generation. Engineering and economic programmes may include data regarding the economics of water supply and sewerage collection (L-R). Civil engineering and geography programmes may also collect data on storm water run-off and wastewater collection systems. 6.100. Earth sciences, including geography, geology and remote-sensing programmes, usu-ally focus on collecting microdata and deriving macrodata regarding inland water resources (A), inflows (B) and outflows (C), natural transfers (D), the abstraction of water from inland water resources (E.1), returns of water (L) and waterborne emissions to the environment (H). Geography programmes that include human geography may also be interested in water supply (S) and sanitation (T). 6.101. The main advantages of research data are the following:
• The are usually available for free or for low cost• They minimize the response burden• They can be used to fill data gaps• They are useful for developing water coefficients
Table VI.7
Data items supported by research agencies
Type of researcha
Types of data items (for a complete list, see chap. IV) Agricultural Engineering Geographic
and geological Hydrological and meteorological
Inland water stocks (A) • • • •
Environmental flows into and out of the territory (B and C) • •
Natural transfers of water between inland water resources (D) • •
Flows from the environment to the economy (E) • • • •
Flows within the economy (F and G) • •
Flows from the economy to the environment (H) • • •
Losses from distribution networks and wastewater collection systems (I) •
Flows of waterborne emissions within the economy (J) • •
Flows of waterborne emissions from the economy to the environment (K) • •
Value and costs of water and sewerage services (L) • •
Taxes and subsidies for water and sewerage services (M and N) • •
Assets and capital expenditures related to water supply and sewerage services (O-Q)
• •
Tariffs and charges for water supply and sewerage services (R) • •
Population using improved water sources (MDG) (S) •
Population using improved sanitation facilities (MDG) (T) •
a Links between data items and types of research are indicative.
International Recommendations for Water112
6.102. In many instances, research data will be available for free or at a small cost. This makes such data relatively cheap, compared to conducting a water-specific survey. Because research data has already been collected, using this data minimizes the response burden. 6.103. Research data are often used for filling data gaps. Case studies or limited time series data can be used to estimate coefficients, which can then be used with other data to derive data items listed in chapter IV. The application of coefficients is similar to weighting statistical survey data. Research data can also be used to provide the context to water-related issues and to explain or help interpret data from other sources. For example, research may be able to demonstrate a causal link between certain data items, whereas data from other sources may show only a correlation. 6.104. The main difficulties with research data include the following:
• Data will often use terms and definitions that differ from those used in statistics• Access to microdata may be limited• Metadata may be missing• Often data are available only for case examples (i.e., limited areas or industries)• Often data are available on a one-time basis.
6.105. Research data often use terms and definitions that are not consistent with terms and definitions used in other studies or the data items listed in chapter IV. It is important to check terms used in research data and any other metadata that are available regarding the methods used to collect data. The amount of metadata available will vary significantly between differ-ent NGOs and research organizations. 6.106. Many research projects consist of case studies. Case studies tend to be one-off studies with limited time series and a specific location and context. The results can be extrapolated to other areas if other relevant information is available. Much research is limited to areas sur-rounding universities, research institutes or field stations. This information may be used to generate estimates for larger areas by converting the results of research into coefficients that allow relationships between the water data items to be extrapolated.148
G. Survey frames 6.107. To conduct surveys, it is necessary to have a survey frame, which is a list, map or other specification of units that defines a population for which information is wanted. The frame defines the units of interest that may be completely enumerated (i.e., census) or sampled via survey. 6.108. For water statistics, a frame is required for the units of the environment (e.g., a list of artificial reservoirs, lakes, rivers, wetlands, glaciers, snowfields and aquifers) and the economy (e.g., lists of establishments and households). Frames can be developed from a number of different sources, such as hydrological data (e.g., hydrological maps), business registers, censuses (e.g., housing and population censuses), membership lists for industry associations (e.g., water supply and sewerage associations or irrigation associa-tions) or administrative records (e.g., lists of organizations undertaking activities that Governments regulate). More than one frame is usually required to produce comprehen-sive water statistics. 6.109. There are two types of frames used in data collection:
• List-based frames• Area-based frames
6.110. In a list-based collection, the initial sample is selected from a pre-existing list of units; in the case of economic statistics this will ideally consist of establishments, but in many cases will consist of enterprises (for more details on the distinction between establish-
148 For more information on the use and limitations of coefficients, see United States Geological Service, 2007, Guidelines for Preparation of State Water-Use Estimates for 2005. Available from http://water.usgs.gov/watuse/.
Data sources and methods 113
ments and enterprises, see chap. II). There are a number of lists that can be used as a frame for organizing the collection and compilation of water data from statistical units. These are summarized in table VI.8. 6.111. In an area-based survey, the initial sample units are a set of geographic areas. After one or more stages of selection, a sample of areas is identified, within which establishments or households are listed. From this list, the sample is selected and data collected. 6.112. Lists of artificial reservoirs, lakes, rivers, wetlands, glaciers and snow fields, and aquifers may be held by agencies responsible for water-resources management, hydrology, geology and mining. If information is missing or there is no such list for a particular type of unit, gaps can be filled using an area-based frame. Thus, for a particular area, all units (e.g., rivers or glaciers) located within the area and their characteristics as identified in chapter III are recorded using GIS149 or a map. In some cases, it may be necessary to visit some areas in order to determine some of the characteristics. Lists of artificial reservoirs, lakes, rivers, wetlands, glaciers and snow fields, and aquifers are used for the data items regarding inland water resource stocks (A), environmental flows into and out of the territory (B and C), and natural transfers of water between inland water resources (D). 6.113. A list of units engaged in economic activities usually takes the form of a business register. The development and use of business registers is covered in detail by IRIS.150 The business register is important for data items on the flows of water from the environment to the economy (data item E), flows within the economy (data items F-G, J and L-R) and the flows from the economy to the environment (data items H and K). 6.114. Lists of establishments engaged in the activities of water supply and sewerage are often held by industry associations. They may also have other information about their members (e.g., location of establishment, size of establishment) that would enable a survey frame to be created. Many national associations are members of the International Water Association.151
6.115. In some countries, business registers only exist for enterprises and not for establish-ments. In these cases, the enterprises with the activities of water supply and sewerage need to be disaggregated to the establishment level. Ideally, all registers should be of establish-ments and should include all the characteristics of economic units described in chapter III. While business registers will normally contain information on the economic size of the business, such as employment, output and registration requirements (including legal organization), they do not usually include information directly related to their importance in water statistics, such as the volume of water use or discharges. This can limit the useful-ness of such lists for the design of water-specific surveys, especially stratified random sample surveys of water use. 6.116. Since business registers usually lack information regarding water use, additional lists can be used to gain more information on characteristics that support the development of water statistics on industries. Lists of irrigators, units engaged in water supply and the sewerage industry or electricity generators may be kept for administrative or other purposes. There may also be lists of large water users available from water suppliers or government agencies regulating water use. Having such lists facilitates the collection and compilation of data items for industries known to be large water users. 6.117. The survey frame for households is discussed extensively in the Principles and Recommendations for Housing and Population Censuses 2010. A frame for households is important for the data items on the type of water supply used by populations (S) and the
149 This may include aerial photographs or satellite images. 150 See United Nations Statistics Division, 2008, International Recommendations for Industry Statistics 2008. Avail-
able from http://unstats.un.org/unsd/industry/guidelines.asp (accessed 15 June 2009). 151 See International Water Association, available from http://www.iwahq.org/templates/ld_templates/
layout _632897.aspx?ObjectId=632922 (accessed 9 July 2009).
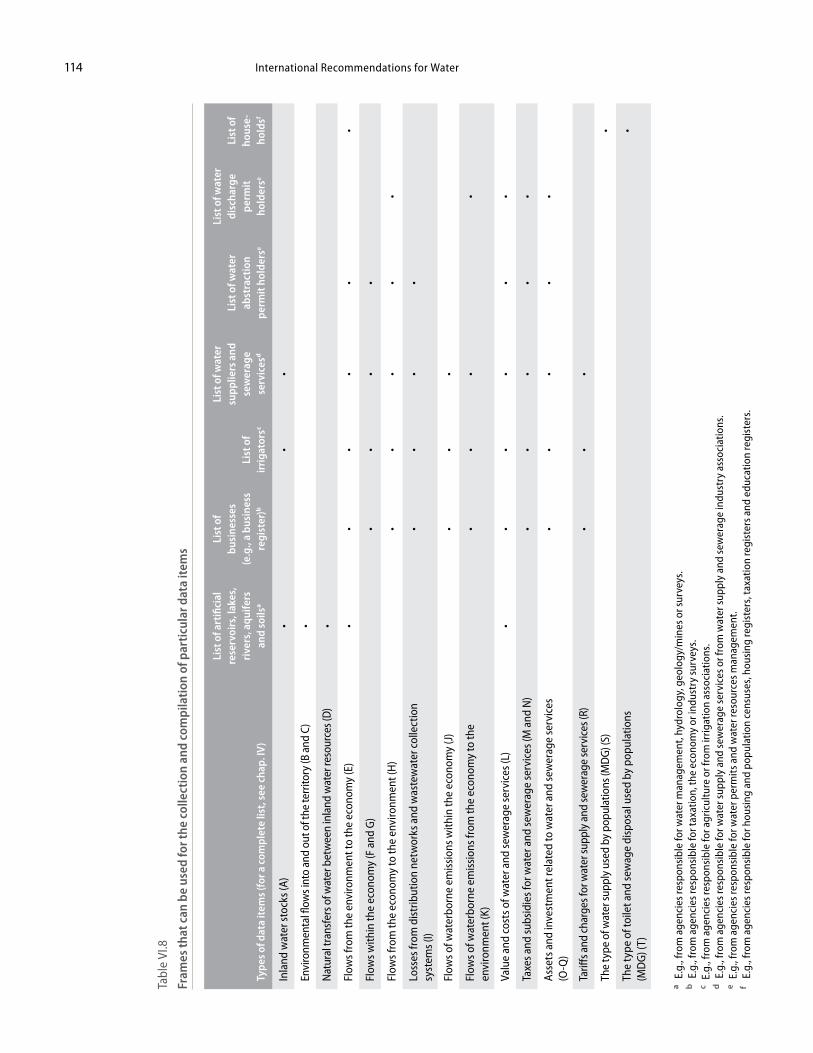
International Recommendations for Water114
Tabl
e VI
.8
Fram
es th
at c
an b
e us
ed fo
r the
col
lect
ion
and
com
pila
tion
of p
arti
cula
r dat
a it
ems
Type
s of d
ata
item
s (fo
r a c
ompl
ete
list,
see
chap
. IV
)
List
of a
rtifi
cial
re
serv
oirs
, lak
es,
rive
rs, a
quife
rs
and
soils
a
List
of
busi
ness
es
(e.g
., a
busi
ness
re
gist
er)b
List
of
irri
gato
rsc
List
of w
ater
su
pplie
rs a
nd
sew
erag
e se
rvic
esd
List
of w
ater
ab
stra
ctio
n pe
rmit
hol
ders
e
List
of w
ater
di
scha
rge
perm
it
hold
erse
List
of
hous
e-ho
ldsf
Inla
nd w
ater
stoc
ks (A
)•
••
Envi
ronm
enta
l flow
s int
o an
d ou
t of t
he te
rrito
ry (B
and
C)
•
Nat
ural
tran
sfer
s of w
ater
bet
wee
n in
land
wat
er re
sour
ces (
D)
•
Flow
s fro
m th
e en
viro
nmen
t to
the
econ
omy
(E)
••
••
••
Flow
s with
in th
e ec
onom
y (F
and
G)
••
••
Flow
s fro
m th
e ec
onom
y to
the
envi
ronm
ent (
H)
••
••
•
Loss
es fr
om d
istr
ibut
ion
netw
orks
and
was
tew
ater
col
lect
ion
syst
ems (
I)•
••
•
Flow
s of w
ater
born
e em
issi
ons w
ithin
the
econ
omy
(J)
••
•
Flow
s of w
ater
born
e em
issi
ons f
rom
the
econ
omy
to th
e en
viro
nmen
t (K)
••
••
Valu
e an
d co
sts o
f wat
er a
nd se
wer
age
serv
ices
(L)
••
••
••
Taxe
s and
subs
idie
s for
wat
er a
nd se
wer
age
serv
ices
(M a
nd N
)•
••
••
Ass
ets a
nd in
vest
men
t rel
ated
to w
ater
and
sew
erag
e se
rvic
es
(O-Q
)•
••
••
Tariff
s and
cha
rges
for w
ater
supp
ly a
nd se
wer
age
serv
ices
(R)
••
•
The
type
of w
ater
supp
ly u
sed
by p
opul
atio
ns (M
DG)
(S)
•
The
type
of t
oile
t and
sew
age
disp
osal
use
d by
pop
ulat
ions
(M
DG
) (T)
•
a E.
g., f
rom
age
ncie
s res
pons
ible
for w
ater
man
agem
ent,
hydr
olog
y, g
eolo
gy/m
ines
or s
urve
ys.
b E.g
., fr
om a
genc
ies r
espo
nsib
le fo
r tax
atio
n, th
e ec
onom
y or
indu
stry
surv
eys.
c E.g
., fr
om a
genc
ies r
espo
nsib
le fo
r agr
icul
ture
or f
rom
irrig
atio
n as
soci
atio
ns.
d E.g
., fr
om a
genc
ies r
espo
nsib
le fo
r wat
er su
pply
and
sew
erag
e se
rvic
es o
r fro
m w
ater
supp
ly a
nd s
ewer
age
indu
stry
ass
ocia
tions
.e E
.g.,
from
age
ncie
s res
pons
ible
for w
ater
per
mits
and
wat
er re
sour
ces m
anag
emen
t.f
E.g.
, fro
m a
genc
ies r
espo
nsib
le fo
r hou
sing
and
pop
ulat
ion
cens
uses
, hou
sing
regi
ster
s, ta
xatio
n re
gist
ers a
nd e
duca
tion
regi
ster
s.
Data sources and methods 115
type of toilet and sewage disposal used by populations (T). These frames are typically area-based, with enumerators physically visiting particular areas and identifying each household within that area. 6.118. The identification codes used in the different frames should provide the possibility of linking the individual environmental and economic units. Examples include linking a business establishment to the lake, aquifer or soil they abstract water from; linking an envi-ronmental unit, such as an artificial reservoir or river, with the economic unit responsible for its management; and linking the economic unit that discharges water to the environment with the surface water bodies or aquifers into which they discharge water.

117
Chapter VII
Metadata and data quality
A. Introduction 7.1. Metadata and assessments of data quality are essential because they provide data users with the information necessary to properly analyse, understand and use a given set of data. In general, metadata are the information about a set of data in terms of the concepts, sources and methods used to collect, compile and disseminate statistics. Data quality is usu-ally described as a suite of data quality dimensions. 7.2. Metadata and data-quality assessment apply to all areas of statistics and, as a result, much of the discussion below is relevant to other fields of statistics. Similarly, the discussions of metadata and data quality found in other international recommendations or in the guide-lines produced by international agencies (e.g., the discussion on data quality in the IRIS 152 and the data-quality indicators developed by Eurostat153) are relevant to water statistics. 7.3. While metadata are mainly intended for data users, there are also benefits for the producers of information. The knowledge gained from generating metadata may lead to enhancements in both the production of data (e.g., lower costs and improved data quality) and the dissemination of data (e.g., dissemination of comprehensive, timely, accessible and reliable data). For example, while documenting metadata, it may become apparent that some data regarding the water supply industry has had to be derived, but the addition of extra questions to an existing questionnaire could improve data quality by collecting actual data. Metadata also provide a mechanism for comparing practices in the compilation of statistics within and between countries. This may encourage agencies and countries to implement international standards and to adopt best practices in the compilation of water statistics. 7.4. Chapter VII first describes the dimensions of data quality (sect. B), and then dis-cusses metadata and provides a recommended list of metadata items for water statistics data sets (sect. C). It should be noted that because the concepts of data quality and metadata are interrelated, the listing of metadata elements includes most of the dimensions of data quality described in section B.
B. Dimensions of data quality 7.5. To assess data quality, it is necessary to go beyond assessing accuracy, i.e., the degree to which data correctly represents the real world, which is how data quality has traditionally been assessed. Countries are encouraged to systematically assess data quality using the fol-lowing eight dimensions:154
152 United Nations Statistics Division, 2008, International Recommendations for Industrial Statistics 2008. Available from http://unstats.un.org/unsd/industry/docs/M90.pdf (accessed 15 June 2009).
153 See Eurostat, 2005, “Standard quality indicators”. Available from http://epp.eurostat.ec.europa.eu/pls/portal/docs/PAGE/PGP_DS_QUALITY/TAB47143233/STANDARD%20QUALITY%20INDICATORS.PDF (accessed 22 April 2009).
154 OECD, 2003, Quality Framework for OECD Statistical Activities Version 2003/1. Available from http://www.oecd.org/document/43/0,3343,en_2649_33715_21571947_1_1_1_1,00.html (accessed 9 December 2010).
International Recommendations for Water118
• Prerequisites of quality• Accessibility• Accuracy• Coherence• Credibility• Interpretability• Relevance• Timeliness
7.6. It is important to note that the dimensions of quality are interrelated. Any action taken to address one aspect can affect other elements of data quality. For example, in increas-ing the timeliness of data, the degree of accuracy may be reduced. 7.7. Indications of data quality may be quantitative or qualitative.155 Data quality assess-ments have traditionally focused on the statistical measures of accuracy, such as standard error. However, accuracy is only one dimension of data quality, and scoring systems that allow comparison across data-quality dimensions have been developed.156 Qualitative state-ments to indicate data quality and to highlight priority areas for data improvement have also been used,157 and in practice a combination of both quantitative and qualitative methods are applied to indicate data quality.
1. Prerequisites of data quality
7.8. The prerequisites of data quality are the systems, methods and resources required to support the effective collection, compilation and dissemination of water statistics, including all institutional and organizational conditions that have an impact on the quality of statistics. The elements of this dimension cover the legal basis for the compilation of data; the adequacy of data-sharing and coordination among data-producing agencies; the assurance of confiden-tiality of data provided by data producers to respondents; the adequacy of human, financial and technical resources for implementing water statistics programmes; the implementation of measures to ensure the efficient use of resources, and the awareness of quality issues by data producers. For example, it is important to have adequately trained staff that understand statistical principles and methods as well as water concepts and data. Those staff in turn need adequate information technology and office facilities, along with training, to ensure they can produce quality water statistics. 7.9. Since there are many agencies involved in water data collection, compilation and dissemination (see chap. VI), it is important to have effective legal and institutional arrange-ments and working relations that facilitate the sharing of data and cooperation on water statistics of mutual interest. Examples of the prerequisites for water statistics would be:
• Laws that clearly define the responsibility of agencies for the collection, integration and distribution of water statistics
• Laws that require economic units to report water statistics to the agencies responsible for their collection
• The existence of formal committees or councils responsible for coordinating water sta-tistics
155 IMF, 2003, Data Quality Assessment Framework–Generic Framework. Available from http://dsbb.imf.org/vgn/images/pdfs/dqrs_Genframework.pdf (accessed 23 September 2009).
156 See, for example, W. F. M. de Vries, 1998, “How are we doing? Performance indicators for national statistical systems”, in Netherlands Official Statistics, vol. 13, Spring 1998, available from http://dsbb.imf.org/vgn/images/pdfs/nld.pdf (accessed 31 March 2009); and ECB, 2006, Euro Area Balance of Payments and International Invest-ment Position Statistics, available from http://www.ecb.int/pub/pdf/other/bop_intinvpos-2006en.pdf (accessed 31 March 2009).
157 See, for example, I. P. Fellegi and J. Ryten, 2000, A Peer Review of the Swiss Statistical System. Available from http://www.bfs.admin.ch/bfs/portal/en/index/institutionen/oeffentliche_statistik/bundesstatistik/entwicklungen__trends/peer _review.parsys.0005.downloadList.00051.DownloadFile.tmp/peerreviewe.pdf (accessed 31 March 2009).
Metadata and data quality 119
• The existence of formal agreements for the sharing of data between data-collecting agencies
7.10. Having a legal basis for water statistics can help data quality in a number of ways; for example, it may help prioritize data for collection and compilation. If it includes a budget for water statistics, it may help ensure adequate resources to support the collection and compilation of water statistics. Additional information on institutional arrangements, laws and agreements related to water statistics and the coordination of water statistics may be found in chapter V.
2. Accessibility
7.11. Accessibility is the ease with which statistics can be obtained from data producers and understood by users. This includes the ease with which the existence of information can be ascertained, the suitability of the form of data (e.g., tables, graphs, maps, indicators), and the mode of dissemination (e.g., web or paper publications). Other aspects of accessibility include the availability of metadata and the existence of user support services. Accessibility also includes the affordability of data. The accessibility of data is related to dissemination and how effectively water statistics are promoted, published and made searchable on the web. Chapter VIII provides additional information on these issues. 7.12. For water statistics, accessibility can be assessed by:
• The amount and clarity of the information available, both on the web and in paper publications
• The range of information products available (see chap. VIII, sect. C)• The availability of staff to answer specific questions about water statistics and the data
sources and methods used to produce them
3. Accuracy
7.13. The accuracy of statistics is the degree to which the data correctly estimate the true value of the data item (i.e., how closely they approximate reality). Accuracy is fundamental to all statistics. It has many attributes and in practice there is not a single aggregate measure of accuracy. In general, it is characterized in terms of sampling and non-sampling errors. Sam-pling errors are traditionally decomposed into bias (systematic error) and variance (random error). Table VII.1 provides some examples of the types of errors that affect data accuracy. 7.14. Common causes of inaccuracy in water statistics include:
• Direct measurement errors (e.g., due to uncalibrated or inaccurate water meters or errors associated with river flow gaugings)
• Modelling errors, associated with estimates requiring hydrological models (e.g., river flows estimated on the basis of stage readings or estimated quantities of groundwater)
• Response errors in water surveys (e.g., respondents to surveys are usually not experts in water and may make estimates which are inaccurate). Other common response errors include:• Measurement unit errors (e.g., respondents report in gallons instead of cubic
metres)• Transcription errors (e.g., respondents accidentally fill in numbers in the wrong
order, changing the value)• Misplaced decimal point and multiples of measurement units (e.g., respondents report
in cubic metres when the measurement unit requested is thousands of cubic metres)• Specification errors, often due to a lack of suitable frames (e.g., large water-using
establishments may be omitted from a survey because they are unknown, i.e., they were not on the list)
• Systematic errors, when collecting and compiling administrative data (e.g., due to a lack of data quality control)
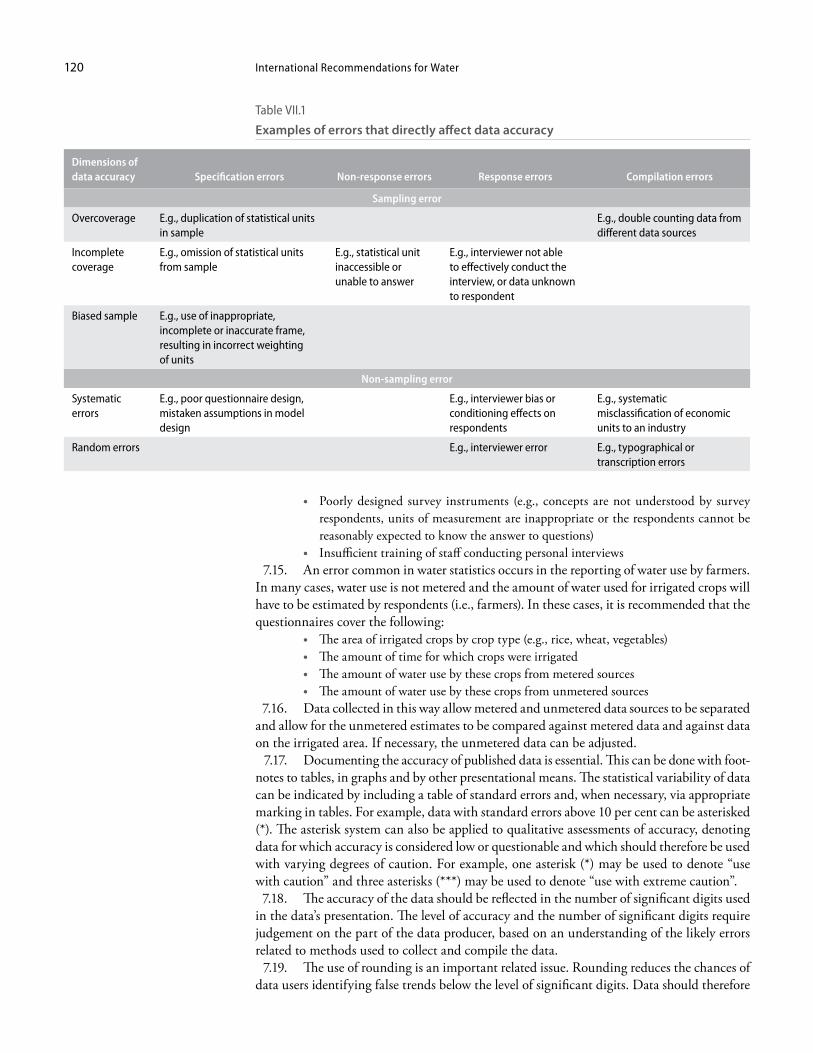
International Recommendations for Water120
• Poorly designed survey instruments (e.g., concepts are not understood by survey respondents, units of measurement are inappropriate or the respondents cannot be reasonably expected to know the answer to questions)
• Insufficient training of staff conducting personal interviews 7.15. An error common in water statistics occurs in the reporting of water use by farmers. In many cases, water use is not metered and the amount of water used for irrigated crops will have to be estimated by respondents (i.e., farmers). In these cases, it is recommended that the questionnaires cover the following:
• The area of irrigated crops by crop type (e.g., rice, wheat, vegetables)• The amount of time for which crops were irrigated• The amount of water use by these crops from metered sources• The amount of water use by these crops from unmetered sources
7.16. Data collected in this way allow metered and unmetered data sources to be separated and allow for the unmetered estimates to be compared against metered data and against data on the irrigated area. If necessary, the unmetered data can be adjusted. 7.17. Documenting the accuracy of published data is essential. This can be done with foot-notes to tables, in graphs and by other presentational means. The statistical variability of data can be indicated by including a table of standard errors and, when necessary, via appropriate marking in tables. For example, data with standard errors above 10 per cent can be asterisked (*). The asterisk system can also be applied to qualitative assessments of accuracy, denoting data for which accuracy is considered low or questionable and which should therefore be used with varying degrees of caution. For example, one asterisk (*) may be used to denote “use with caution” and three asterisks (***) may be used to denote “use with extreme caution”. 7.18. The accuracy of the data should be reflected in the number of significant digits used in the data’s presentation. The level of accuracy and the number of significant digits require judgement on the part of the data producer, based on an understanding of the likely errors related to methods used to collect and compile the data. 7.19. The use of rounding is an important related issue. Rounding reduces the chances of data users identifying false trends below the level of significant digits. Data should therefore
Table VII.1
Examples of errors that directly affect data accuracy
Dimensions of data accuracy Specification errors Non-response errors Response errors Compilation errors
Sampling error
Overcoverage E.g., duplication of statistical units in sample
E.g., double counting data from different data sources
Incomplete coverage
E.g., omission of statistical units from sample
E.g., statistical unit inaccessible or unable to answer
E.g., interviewer not able to effectively conduct the interview, or data unknown to respondent
Biased sample E.g., use of inappropriate, incomplete or inaccurate frame, resulting in incorrect weighting of units
Non-sampling error
Systematic errors
E.g., poor questionnaire design, mistaken assumptions in model design
E.g., interviewer bias or conditioning effects on respondents
E.g., systematic misclassification of economic units to an industry
Random errors E.g., interviewer error E.g., typographical or transcription errors
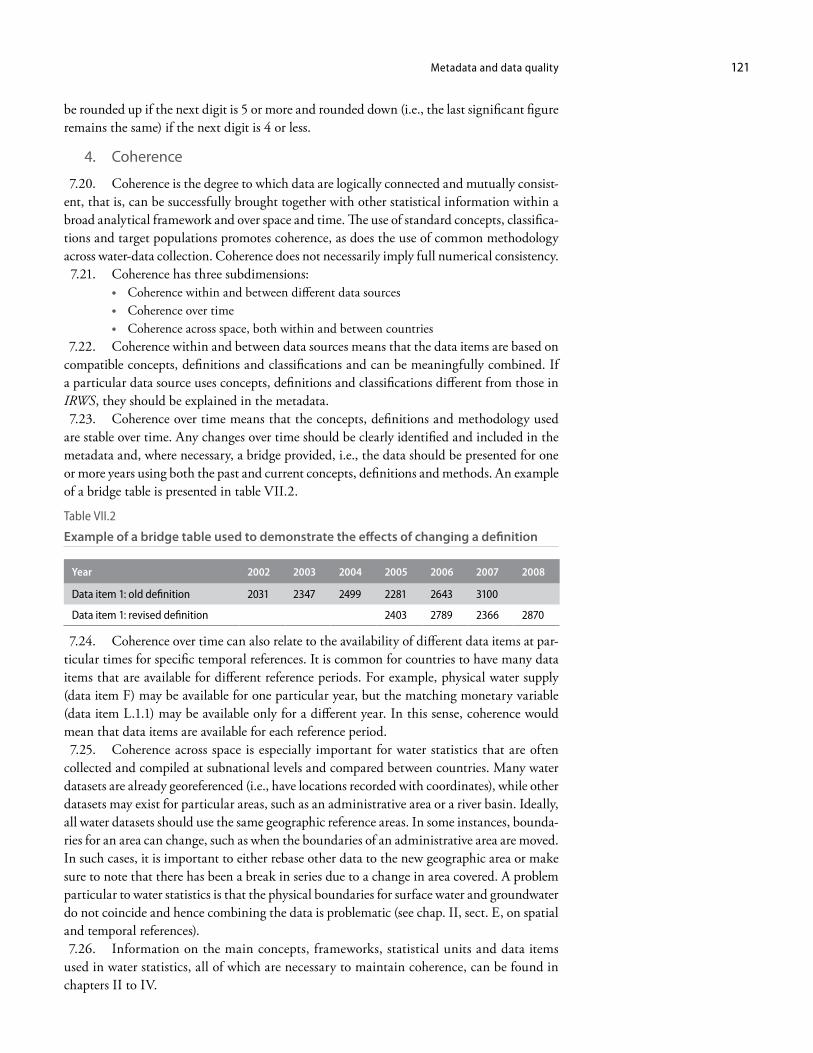
Metadata and data quality 121
be rounded up if the next digit is 5 or more and rounded down (i.e., the last significant figure remains the same) if the next digit is 4 or less.
4. Coherence
7.20. Coherence is the degree to which data are logically connected and mutually consist-ent, that is, can be successfully brought together with other statistical information within a broad analytical framework and over space and time. The use of standard concepts, classifica-tions and target populations promotes coherence, as does the use of common methodology across water-data collection. Coherence does not necessarily imply full numerical consistency. 7.21. Coherence has three subdimensions:
• Coherence within and between different data sources• Coherence over time• Coherence across space, both within and between countries
7.22. Coherence within and between data sources means that the data items are based on compatible concepts, definitions and classifications and can be meaningfully combined. If a particular data source uses concepts, definitions and classifications different from those in IRWS, they should be explained in the metadata. 7.23. Coherence over time means that the concepts, definitions and methodology used are stable over time. Any changes over time should be clearly identified and included in the metadata and, where necessary, a bridge provided, i.e., the data should be presented for one or more years using both the past and current concepts, definitions and methods. An example of a bridge table is presented in table VII.2.
Table VII.2
Example of a bridge table used to demonstrate the effects of changing a definition
Year 2002 2003 2004 2005 2006 2007 2008
Data item 1: old definition 2031 2347 2499 2281 2643 3100
Data item 1: revised definition 2403 2789 2366 2870
7.24. Coherence over time can also relate to the availability of different data items at par-ticular times for specific temporal references. It is common for countries to have many data items that are available for different reference periods. For example, physical water supply (data item F) may be available for one particular year, but the matching monetary variable (data item L.1.1) may be available only for a different year. In this sense, coherence would mean that data items are available for each reference period. 7.25. Coherence across space is especially important for water statistics that are often collected and compiled at subnational levels and compared between countries. Many water datasets are already georeferenced (i.e., have locations recorded with coordinates), while other datasets may exist for particular areas, such as an administrative area or a river basin. Ideally, all water datasets should use the same geographic reference areas. In some instances, bounda-ries for an area can change, such as when the boundaries of an administrative area are moved. In such cases, it is important to either rebase other data to the new geographic area or make sure to note that there has been a break in series due to a change in area covered. A problem particular to water statistics is that the physical boundaries for surface water and groundwater do not coincide and hence combining the data is problematic (see chap. II, sect. E, on spatial and temporal references). 7.26. Information on the main concepts, frameworks, statistical units and data items used in water statistics, all of which are necessary to maintain coherence, can be found in chapters II to IV.
International Recommendations for Water122
5. Credibility
7.27. The credibility of water statistics refers to the confidence that users have in the producers of the data. User confidence is built over time. One important aspect is trust in the objectivity of the data, that is, that they are perceived to be produced professionally in accordance with appropriate statistical standards and transparent methods, and with confi-dence that there is no external interference in the data produced or its timing of release. 7.28. For water statistics, a review process prior to publication will increase the credibility of the data, especially if the publication is being published for the first time. The data should be reviewed by the organizations that provide data as well as other relevant experts or stakeholders. Joint publications also tend to increase credibility. For example, in some countries water statistics are jointly published by the national statistical office and ministries of water or environment. 7.29. More information related to the credibility of data and the agencies producing data, including the review process, is included in chapter VIII.
6. Interpretability
7.30. The interpretability of data is closely related to user understanding of data and depends on how information, including adequate metadata, is communicated. Of particular importance is the understanding of temporal and spatial references. Feedback and queries from water data users will provide an indication of the interpretability of water data, but quantitative measures of interpretability of data are difficult to establish. 7.31. The interpretability of data depends on how data are presented, and the same data may need to be presented in a variety of forms for different users. For example, indicators, summary graphs and maps may be needed for decision makers and the general public, while more detailed tables and access to microdata may be needed for analysts and researchers. Data are often interpreted in relation to issues of interest to particular interest groups, including industry associations, environmental NGOs and households. This dimension of data quality overlaps, to a degree, with relevance (see para. 7.32). The different audiences and their data needs are discussed in chapter VIII, while chapter IX of SEEA-Water includes examples of applications of water accounts.
7. Relevance
7.32. The relevance of water statistics reflects the degree to which they meet the needs of users and potential users. To assess the relevance of water statistics requires the identification of data users and topics, as well as the spatial and temporal reference periods for which they need data. This is covered in detail in chapter V. In brief, data producers need to balance the different needs of current and potential users to produce a water statistics programme that goes as far as possible in satisfying the most important needs of users, including both the coverage and content of water statistics, within resource constraints. A key consideration in the relevance of data is the frequency with which data are available (e.g., annually, biennially, quinquennially). 7.33. Feedback regarding the relevance of water statistics and how well they address key water questions should be gathered from data users. Agencies should also catalogue the use of water statistics by other government agencies, business, the general public and international organizations. Without this feedback and information, it is not possible to assess the relevance of water statistics. For more information on working with user groups and stakeholders to ensure that water statistics are relevant, see chapter V; for information on tracking the use of disseminated water statistics, see chapter VIII.
8. Timeliness
7.34. The timeliness of water statistics refers to the amount of time between the end of the reference period to which the data pertain and the date on which the data are available
Metadata and data quality 123
for use. Data should be made available as soon as possible after the reference period. As a general guide, data for a particular reference period (e.g., a year, a quarter or a month) should be available within one additional reference period. For example, if the reference period is one calendar year, then data for the year 2007 should be available before the end of 2008. Similarly, if the data are for the first quarter of the year, then they should be made available before the end of the second quarter. If this guideline is met, then the information can be said to be timely. 7.35. Timeliness is also related to the existence and meeting of a publication schedule. A publication schedule comprises a set of release dates or may involve a commitment to release water data within a prescribed time period. If there is a long, unexplained delay between the advertised release date and the actual release date of water statistics, then the information would not be timely. More information on publication schedules and timeliness is included in chapter VIII.
C. Metadata 7.36. Metadata are “data about data”, the pieces of information used to describe datasets. The fundamental purpose of metadata is to enable users to understand, analyse and use sta-tistics. Metadata are needed because most users are not familiar with statistical production processes and thus need documentation to understand the data and the degree of confidence they can attach to any decisions based on them. Metadata help users transform statistical data into information that can be used for policy- and decision-making. Appropriate metadata are especially important for water data shared between organizations since in most countries water statistics are compiled from many data sources. Metadata can also facilitate efficient searching, locating and sharing of data. 7.37. The wide range of possible users of water statistics also means that a broad spectrum of metadata requirements has to be addressed. Data producers must make sufficient metadata available to enable both casual and sophisticated data users to assess the suitability of the data for their purposes. 7.38. In general, metadata include information on:
• Each of the dimensions of data quality• Data items and their definitions, including any exceptions to international standards• Classifications and frameworks used to organize data• Data sources and methods• Characteristics of statistical units for which data have been collected and compiled • Spatial coverage of water statistics, including any gaps• Temporal coverage of water statistics, including any gaps• Publication details (e.g., publication date, agency or agencies publishing the data)• Acknowledgements, especially with regard to any cooperation or collaboration on
water statistics with other organizations or individuals• Contact details for enquiries
7.39. Countries may develop a layered approach to metadata presentation and dissemina-tion for groups of users, in which each successive layer provides more detail. Two levels of metadata are usually presented:
• Structural metadata—an integral part of the data presented, such as in table captions, headings and footnotes
• Reference metadata—details on the content and quality of data that may accompany the tables or be presented separately via the Internet or in occasional publications
7.40. At present, there is no single metadata standard that covers all applications. Rather, a number of metadata frameworks have been developed for specific purposes. These include:
International Recommendations for Water124
• SDMX158 for official statistics • Dublin Core Metadata Initiative (the Dublin Core), 159 a general framework designed
for all types of data• ISO-19115,160 for geographic information• Data Documentation Initiative,161 for social data• World Meteorological Organization Core Metadata Standard, v0-2(WMO2004)162 • Hydrologic Information—Metadata: Semantic structure for the description of hydro-
logic data (GRDC Metadata Profile—Final draft)163
• Infrastructure for Spatial Information in the European Community (INSPIRE): Data Specification on Hydrography—Guideline164
• A draft proposal for a metadata standard for water statistics is in preparation by UNEP and Eurostat, including 22 elements identified, based mainly on SDMX and ISO-19115 definitions
7.41. In Europe, a major recent development has been the legal establishment of the Infrastructure for Spatial Information in the European Community (INSPIRE).165 INSPIRE, along with technical annexes, defines how metadata and data quality are described for environmental data, including water statistics. INSPIRE includes guidance in relation to water or “hydrography”. Under INSPIRE, geo-referenced water statistics are referenced to water bodies that are the “building blocks”166 in the context of the Water Framework Directive (WFD).167
7.42. Despite the fact that metadata are essential, they are frequently of poor quality, only partially complete or missing altogether. This may be because metadata documenta-tion has been left to the end of the data collection and compilation processes and rushed as a result, or in some cases has simply not been completed, such as when other projects take priority. 7.43. For these reasons, it is important to plan time for metadata documentation and to ensure that it is available and up to date when data are disseminated. If this is not the case, then the accessibility and interpretability of data will suffer and the sharing of data between agencies will be hampered. Metadata tend to improve over time, particularly when agencies have rigorous documentation of data sources and methods.
158 Available from http://www.sdmx.org/ (accessed 26 June 2009). 159 Available from http://dublincore.org/ (accessed 26 June 2009). 160 Available from http://www.iso.org/iso/catalogue_detail.htm?csnumber=26020 (accessed 26 June 2009). 161 Available from http://www.icpsr.umich.edu/DDI/ (accessed 26 June 2009). 162 WMO, 2004. Available from http://www.wmo.int/pages/prog/www/WDM/Metadata/WMOCore_
v0-2_040916/ (accessed 26 July 2009). 163 GRDC, 2009. Available from http://www.bafg.de/cln_007/nn_317460/GRDC/EN/02__Services/04__
Report__Series/39__metadata.html?__nnn=true (accessed 27 July 2009). 164 INSPIRE Thematic WG Hydrography, 2009. Available from http://inspire.jrc.ec.europa.eu/documents/Data_
Specifications/INSPIRE_DataSpecification_HY_v3.0.pdf (accessed 9 July 2009). 165 INSPIRE was established through the entering into force of directive 2007/2/EC of the European Parliament
and Council on 14 March 2007 (available from http://eur-lex.europa.eu/JOHtml.do?uri=OJ:L:2007:108:SOM:EN:HTML (accessed 12 December 2009)).
166 These “building blocks” are essentially environmental units for water. 167 Accompanying INSPIRE are explanatory documents covering several environmental reporting purposes; for
more information, see INSPIRE Drafting Team, “Data specifications”, 2008, available from http://inspire.jrc.ec.europa.eu/reports/ImplementingRules/DataSpecifications/D2.3_Definition_of_Annex_Themes_and_scope_v3.0.pdf (accessed 18 March 2008). It should be noted that access to reference documents and related datasets is facilitated through the Water Information System for Europe (WISE), available from http://water.europa.eu/en/welcome (accessed 12 December 2009).
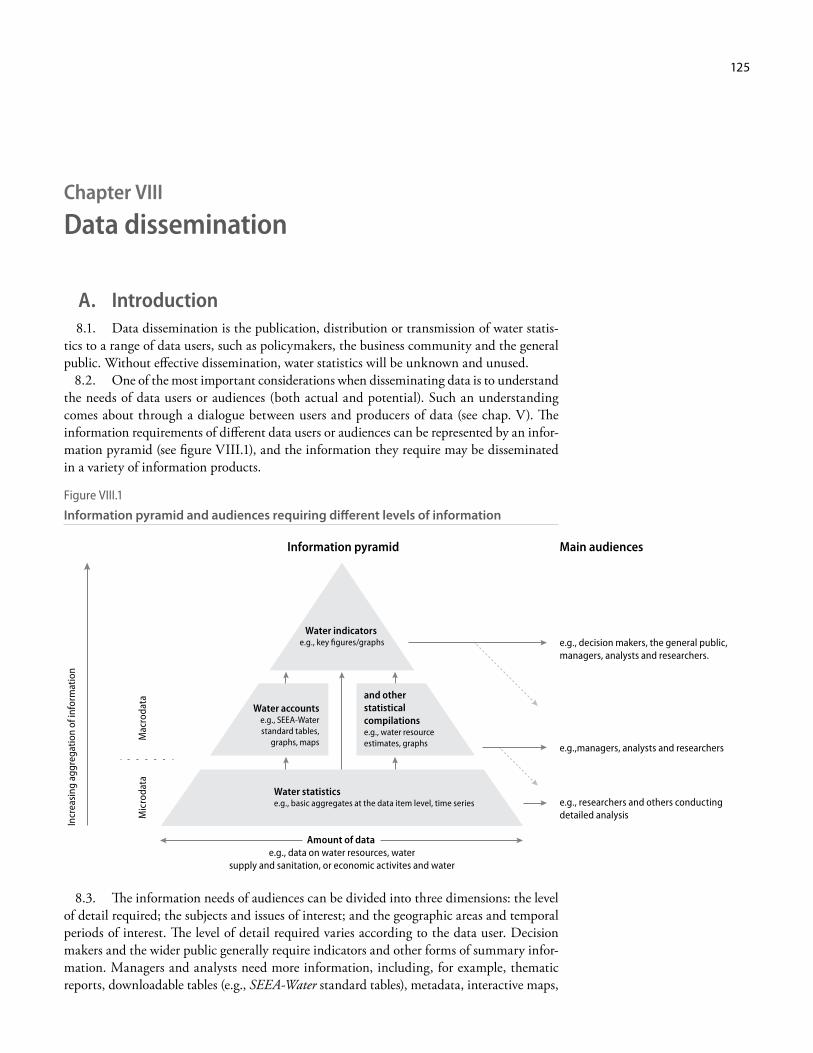
125
Chapter VIII
Data dissemination
A. Introduction 8.1. Data dissemination is the publication, distribution or transmission of water statis-tics to a range of data users, such as policymakers, the business community and the general public. Without effective dissemination, water statistics will be unknown and unused. 8.2. One of the most important considerations when disseminating data is to understand the needs of data users or audiences (both actual and potential). Such an understanding comes about through a dialogue between users and producers of data (see chap. V). The information requirements of different data users or audiences can be represented by an infor-mation pyramid (see figure VIII.1), and the information they require may be disseminated in a variety of information products.
Figure VIII.1
Information pyramid and audiences requiring different levels of information
Amount of data e.g., data on water resources, water
supply and sanitation, or economic activites and water
Information pyramid
Incr
easi
ng a
ggre
gatio
n of
info
rmat
ion
e.g., decision makers, the general public, managers, analysts and researchers.
e.g.,managers, analysts and researchers
e.g., researchers and others conducting detailed analysis
Main audiences
Mac
roda
taM
icro
data
Water statistics e.g., basic aggregates at the data item level, time series
Water accounts e.g., SEEA-Water standard tables,
graphs, maps
and other statistical compilations e.g., water resource estimates, graphs
Water indicators e.g., key figures/graphs
8.3. The information needs of audiences can be divided into three dimensions: the level of detail required; the subjects and issues of interest; and the geographic areas and temporal periods of interest. The level of detail required varies according to the data user. Decision makers and the wider public generally require indicators and other forms of summary infor-mation. Managers and analysts need more information, including, for example, thematic reports, downloadable tables (e.g., SEEA-Water standard tables), metadata, interactive maps,
International Recommendations for Water126
presentations, seminars and access to staff that can explain the data. Researchers require the greatest level of detail, for example, time series data, more detailed industry, temporal or geographic breakdowns, and in some cases access to microdata. It is important to note that for researchers, access to microdata may be provided as long as confidentiality is maintained (e.g., via confidentialized unit record files168). Different audiences may also require informa-tion at different spatial and temporal scales. 8.4. Chapter VIII describes the main principles of dissemination (sect. B), the different types of information products (sect. C), monitoring the use of water statistics (sect. D) and international data reporting (sect. E).
B. Dissemination principles 8.5. Water statistics are disseminated in a variety of information products matching the different needs of each audience. Regardless of the audience or type of information product, three basic principles guide the dissemination of water statistics: confidentiality, equality of access, and objectivity.169
1. Statistical confidentiality
8.6. Statistical confidentiality primarily concerns the data collected by national statisti-cal offices from establishments, households or persons but is also relevant to other govern-ment agencies that collect data. Statistical acts and regulations usually require that the individual data provided by respondents to surveys are kept confidential. This requirement is embodied in the United Nations Fundamental Principles of Official Statistics,170 which states that “individual data collected by statistical agencies for statistical compilation, whether or not they refer to natural or legal persons, are to be strictly confidential and used exclusively for statistical purposes”. 8.7. The requirement for confidentiality helps to build trust with data providers and hence increases the likelihood of accurate and timely reporting of data. 8.8. Water statistics, whether collected by survey or from administrative and other sources, are usually published in the form of tables, often accompanied by graphs or dia-grams, such as maps. Water statistics should not reveal data about individual establishments, households or persons but rather contain aggregated information. 8.9. It is sometimes possible to deduce information about these units from aggregated information, especially when the contribution of a single unit dominates the total. To pro-tect against the disclosure of data from an individual establishment, household or person, statistical disclosure control techniques are used. These are a set of methods to reduce the risk of disclosing information on the individual units. The first step in the statistical dis-closure control is the identification of the sensitive statistics (or individual cells of tables) that may reveal information about individual units. These are identified using a dominance rule, as follows:
• If the sum of the contributions of a specified number of units accounts for more than a specified proportion of the total cell value, then this cell value cannot be published
8.10. The logic of the dominance rule is that if the value regarding one unit dominates a particular cell value then it is possible to deduce its contribution fairly accurately. For example:
• If there is data for only one unit in a cell, then the contribution will be disclosed exactly
168 See ABS, 2009, Managing Confidentialised Unit Record Files . Available from http://www.abs.gov.au/ausstats/[email protected]/mf/1406.0.55.004/ (accessed 17 July 2009).
169 Eurostat, 1998, Handbook on the Design and Implementation of Business Surveys (Luxembourg). 170 See Statistical Commission, Fundamental Principles of Official Statistics. Available from http://unstats.un.org/
unsd/dnss/gp/fundprinciples.aspx (accessed 16 June 2009).
Data dissemination 127
• If a cell total comprises values from only two economic units, then each one of these units can know (and hence disclose to others) the contribution of the other by sub-tracting its own contribution from the total cell value
8.11. In business statistics, a commonly accepted rule is that each cell in a table should have at least three establishments contributing to its value. For cells with the largest numbers, the three units with the largest values should not dominate, i.e., they should not account for more than 70 per cent of the cell value. 8.12. Common practices to protect against the disclosure of confidential data are:
• Aggregation• Suppression• Other methods
8.13. Aggregation means that a confidential cell in a table is aggregated with another cell so that the information disseminated is the aggregate of the two individual cells. This often results in aggregation of data that are confidential at the class (4-digit) level of ISIC and the publication of this aggregate (non-confidential) data at the group (3-digit) level of ISIC. 8.14. Suppression means removing records from a database or table that contains confi-dential data. This is a method that allows statisticians not to publish the values in sensitive cells, while publishing the original values of the others (primary suppression). Suppressing only one cell in a table, however, means that the calculation of totals for the higher levels to which that cell belongs cannot be calculated. In this case, other cells must also be sup-pressed to guarantee the protection of the values under the primary cells; this is called secondary suppression. 8.15. Other methods of protecting against the disclosure of confidential data include controlled rounding and perturbation, which are more sophisticated techniques. Controlled rounding allows statisticians to modify the original value of each cell by rounding it up or down to a near multiple of a base number. Perturbation represents a linear programming variant of the controlled rounding technique. 8.16. The statistical units of the environment are a special type of unit from the point of view of confidentiality. Data regarding environmental units should always be confidential if they reveal information about individual economic units (i.e., establishments or households). An example is an establishment that owns a particular artificial reservoir. However, if data regarding an individual environmental unit are already publicly available (e.g., flow data for a particular river), then there is no need to keep these data confidential.
2. Equality
8.17. All data users should be able to access data under equal terms; in particular, they should be able to access data at the same time. To that end, water statistics should be released at a predetermined time and data producers should develop and announce (e.g., post on the web) a release calendar or timetable for the release of water statistics. The cal-endar and announcement should specify not only when but how the water statistics will be released (e.g., as an electronic information product on the web or in hard copy). Data should not be released ahead of the announced release date to any user: to do so could bring into question the objectivity of the data producer. For countries in the early stages of developing water statistics programmes, it may be necessary to qualify the release calendar by noting that because water statistics are still developing, there may be some delays in their production. In the event of a delay, the release calendar should be revised and key data users advised directly. 8.18. In addition to the release calendar, the availability of water statistics can be made public in a number of ways, such as by identifying and contacting key data users and posting notices on websites and newsletters of other organizations. A press release (discussed in more detail below) can also be used to announce the availability of water statistics.
International Recommendations for Water128
8.19. It is important that all data users have access to the same level of information. That is, more detailed data should not be available to some users but not to others. Differing levels of access to data could bring into question the objectivity of the data producer.
3. Objectivity
8.20. Water statistics should not be accompanied by subjective interpretations, judge-ments or recommendations. This principle also applies to producers of water statistics who are responsible for policy development, decision-making, monitoring or enforcement. Since it is often the case that organizations producing official water statistics are also responsible for policy development and law enforcement, it is recommended that any subjective interpreta-tions, judgements or recommendations related to the data be published separately, after the release of the data. The Handbook of Statistical Organization171 and the Fundamental Principles of Official Statistics172 provide more guidance on what is appropriate for official statistics with regard to presenting facts, analysis and interpretation. 8.21. Objectivity also extends to the way water statistics are used and interpreted by users. National statistical offices and other data producers are entitled to comment on erroneous interpretation and misuse of statistics.173 For example, if an organization misrepresents data on water use in a prominent newspaper article, then the statistical office can respond to the newspaper by providing a brief letter, for publication in the newspaper, referring to the origi-nal article and factually clarifying how to interpret the statistics correctly.
C. Information products 8.22. Water statistics are disseminated in many types of information products. For exam-ple, it is common to disseminate water statistics in the form of water accounts or in thematic reports. Water statistics can also be published in information products that focus on particu-lar areas (e.g., river basins, states/provinces), parts of the economy (agriculture, water supply and sewerage, households, etc.) or issues (water quality, water pricing, water scarcity and drought, etc.). Water statistics are also published in general summary information products, such as statistical yearbooks, or are published graphically along with other information (e.g., in an atlas) on the web. 8.23. Examples of the water statistics and accounts publications produced by countries can be found in the Searchable Archive of Publications on Environmental-Economic Account-ing.174 International examples of the publication of water statistics include the World Water Development Reports 175 and the Human Development Report 2006: Beyond scarcity: Power, poverty and the global water crisis.176 Many international agencies also include water data on the web and in databases, such as the FAO Aquastat;177 the website of the Division for Sustainable Development, Department of Economic and Social Affairs of the United Nations
171 United Nations Statistics Division, 2003, Handbook of Statistical Organization, 3rd ed. Available from http://unstats.un.org/unsd/dnss/hb/default.aspx.
172 United Nations Statistical Commission, 1994, Fundamental Principles of Official Statistics. Available from http://unstats.un.org/unsd/dnss/gp/fundprinciples.aspx (accessed 16 June 2009).
173 Ibid., principle 4, “Prevention of misuse”. Available from http://unstats.un.org/unsd/methods/statorg/default.htm.
174 United Nations Statistics Division search archive. Available from http://unstats.un.org/unsd/envaccounting/ceea/archive/Introduction.asp.
175 WWAP, 2003, 2006, 2009. Available from http://www.unesco.org/water/wwap/wwdr/ (accessed 17 June 2009). 176 UNDP, 2006, Human Development Report 2006: Beyond scarcity: Power, poverty and the global water crisis. Avail-
able from http://hdr.undp.org/en/reports/global/hdr2006/ (accessed 18 June 2009). 177 See http://www.fao.org/NR/WATER/AQUASTAT/main/index.stm (accessed 30 June 2009).
Data dissemination 129
Secretariat;178 the United Nations Statistics Division’s environmental indicators database;179 and the WHO/UNICEF Joint Monitoring Programme on Water Supply and Sanitation.180 On a regional basis, the Water Information System for Europe181 provides the main entry point for Europe. 8.24. Water statistics can be disseminated in hard copy or electronic formats. Hard copy information products are currently the most widely used and are particularly important in countries where much of the population has limited access to the Internet (e.g., in developing countries). It is increasingly common for hard copy information products to be released in an electronic form as well, such as in a PDF file or as a set of accompanying data tables that can be downloaded from the Internet. Searchable databases on the web are also becoming more and more common. 8.25. When producing information products, a number of factors need to be considered, including the organization and presentation of data, the description and explanation of data, the review of information products, release and promotion, and the revision of data. These are outlined in more detail below.
1. Organization and presentation of data
8.26. Information products need to be logically organized and well presented. The most important data should be found at the beginning of the publication, with increasing levels of detail progressively included. A short executive summary (e.g., one to two pages), containing key data and interpretive text, should be included in all publications. Headings, subheadings and sidebars can be used to strengthen the organization of information products. For all information products, the classifications, definitions, spatial and temporal references used, as well as the data sources and methods, should be clearly identifiable. 8.27. Standardized tables and graphs should be used for the presentation of data. For water statistics, the standard tables of SEEA-Water are an example of how to present water data. These tables can be elaborated to show, for example, additional industry and subnational data. 8.28. Standard templates for the presentation of figures and graphs should also be used. Such templates specify the typeface (font), font size, line weight, spacing, wording, placement of wording and appearance of titles and labels. There should be an explanation of rounding practices, and data should not use more significant digits than are consistent with the accu-racy of the data. Footnotes, asterisks (*) or other marks can be used in tables to highlight issues of data quality (see chap. VII). The headings and captions for graphics and tables should be concise and should accurately describe the data contained therein. 8.29. Maps are commonly used to present water statistics because water data and informa-tion are strongly related to geographic areas, especially river basins. These maps may include surface water bodies, river basins, aquifers, land-use information, emissions, the percentage of population connected to water supply in an area, the volume of water abstracted in different areas, or the unit cost of water in different areas. Many other data items can be presented in maps, especially if GIS are being used to compile and present data. The use of maps and GIS is particularly important when disseminating data to audiences interested in climate change and its impacts. 8.30. For electronic information products, it is usual to keep tables, databases and geo-graphic datasets as simple as possible. For example, it is often easier for data users to download a CSV file or spreadsheet of data than to use an interactive table or database, which tend to be difficult and costly to design and are in some cases used by relatively few users. Interactive maps have a wide audience that may include water specialists and non-specialists alike.
178 See http://www.un.org/esa/dsd/dsd_aofw_wat/wat_index.shtml (accessed 18 June 2009). 179 See http://unstats.un.org/unsd/environment/qindicators.htm (accessed 8 December 2009). 180 See http://www.wssinfo.org/en/welcome.html (accessed 8 December 2009). 181 See http://water.europa.eu/en/welcome (accessed 6 July 2009).
International Recommendations for Water130
8.31. Where data are made available in an interactive database or map, a pilot version should be tested on a range of potential users. This should assist the database designers with the layout of the interface, functionality, response time of the web connections to the database and usability.
2. Description and explanation of data
8.32. The text contained in information products should not only describe and explain data but also highlight important figures or trends, including, for example, actual values, percentage distributions or rates of change. 8.33. The language used should be objective (see sect. B.3), precise and as simple as possible. Depending on the intended audience, some loss of precision may sometimes be an acceptable trade-off for a more readable text. It is also important to make sure that any conclusions are consistent with the statistics presented. Always avoid drawing conclusions on causality because this can be difficult to judge or prove and may undermine the impartiality of water statistics.
3. Review of information products
8.34. Information products need to be reviewed carefully prior to their release. The pur-pose of a review is to assess whether data and methods are adequately described, written descriptions of data are consistent with numerical data, key data or findings have been high-lighted, and data are consistent with other information sources. 8.35. For new information products, a formal review process should be established. The review should be undertaken by at least three suitably qualified external stakeholders, includ-ing reviewers from organizations that provided data or expertise used in the information product. Experts on both water (i.e., the subject matter) and statistical methods should be involved. For the organization producing the information, there should be a review by at least two other persons from within the organization to check for consistency of figures used in the text, tables and charts; the accuracy of external data and references; simple arithmetic and other possible errors.182
8.36. In the case of a statistical agency, the data and text need to receive final approval of the chief statistician or an official delegated by the Chief. In other agencies, this would be a person whose authority is similar to that of the chief statistician (i.e., the head of agency). 8.37. For more information on reviewing water statistics information products, see the guidelines on dissemination in the Statistics Canada Quality Guidelines 2003.183
4. Release and promotion
8.38. The release date of an information product is the date on which it is published, i.e., the date it is made available to data users. This date should be advertised in advance in a release calendar and key stakeholders should also be made aware of the date prior to release. 8.39. To ensure wide use of information products, releases need to be accompanied by promotional activities, and the timing of the release is an important consideration. Water statistics may be released to coincide with special national or international water events, such as World Water Day184 or World Water Week.185 This enables the producers of water statistics to take advantage of the promotional activities undertaken by a range of national and international agencies to make people aware of the importance of water. In many cases,
182 See Handbook of Statistical Organization, 3rd ed., The Operation and Organization of a Statistical Agency. 183 Statistics Canada, 2003. Available from http://www.statcan.gc.ca/bsolc/olc-cel/olc-cel?catno=12-539-
X&CHROPG=1&lang=eng (accessed 15 June 2009). 184 For more information on World Water Day, see http://www.worldwaterday.org/. 185 For more information on World Water Week, see http://www.worldwaterweek.org/worldwaterweek/about.asp.
Data dissemination 131
the media will devote attention to water issues around these times and will be looking for new material to illustrate a range of water issues. It is also important to avoid releasing water statistics on days when there are other major data releases, since these may divert attention away from water statistics. For example, water statistics should not be released at the same time that results of the population census or the national accounts are published. 8.40. If different water statistics are going to be released by different government organiza-tions, the timing of the release of data should be coordinated, in particular if the data relate to the same spatial and temporal references. Release can be simultaneous or staggered, with the aim being to maximize the use and understanding of each set of water statistics. 8.41. Promotional material must be targeted at specific audiences, in particular the media (e.g., using press releases (see below)) and the key stakeholders. This is done by sending cop-ies of reports and accompanying summary sheets to water decision makers, managers and analysts in government agencies that have an interest in water statistics. This can also involve holding seminars, which also enables interaction with data users so that, for example, ques-tions on data can be answered immediately. Dissemination also includes the traditional activities of placing information products in libraries and on the web. 8.42. The promotion of water statistics should include activities undertaken by data pro-ducers to reach the public. Seminars have already been mentioned, but other activities may include having exhibits regarding important water facts (i.e., important water statistics) at relevant water meetings or events. Another way of increasing awareness of water statistics and the importance of water is to create educational materials for inclusion in the curriculum of schools or in university courses. 8.43. The media play an important role in disseminating water statistics. The press and other mass media (e.g., television, radio and online news media) act as intermediaries in the relay of information to both the general public and water specialists. The media relay informa-tion at a range of scales from local to national levels, depending on whether the information is of local or national interest. 8.44. Agencies producing water statistics will, to some extent, have to rely on the media to ensure that availability of water statistics is known to all audiences. This creates a series of challenges, which have to be addressed, including:
• Ensuring that online news media, newspapers, television, radio and magazines are all aware of new water statistics
• Ensuring that the statistical office is responsive, even outside of normal office hours, to the deadlines of the media
• Identifying a spokesperson for water information products from which the media may seek clarification or comment
• Providing, along with the latest water data, an interpretive text so that press reports are balanced and accurate
• Periodically reviewing with media the arrangements made to ensure efficient dis-semination
• Making all possible efforts to present new water statistics in a manner that minimizes misinterpretation and enhances clarity
8.45. Many agencies have made permanent arrangements with the media to help dissemi-nate information products. It is important to work with media liaison sections or units when promoting upcoming information products.186 8.46. All agencies that provided the data or expertise used in an information product should be acknowledged and made aware that the data are to be published. Publicly acknow-ledging all contributors, for example, in the acknowledgements or footnotes also encourages
186 For more information regarding the press and media, see Handbook of Statistical Organization, 3rd ed., The Operation and Organization of a Statistical Agency.
International Recommendations for Water132
the wider dissemination of information products by all contributors. When produced in hard copy, these agencies should be given complimentary copies.
5. Revisions of data
8.47. The revision of data is an inescapable statistical activity in all countries. In some cases, revisions are planned as part of a staged approach to the release of preliminary data that are later replaced by final data, or when there are changes in data sources and methods that result in a series break. It is also inevitable that some errors will occur in the collection and compilation of statistics and no matter how diligent the quality assurance, some of these errors will be published. It is essential that the revision of data be done transparently and, in the case of the correction of errors, as soon as they are detected. Revised data must be accompanied by a statement outlining clearly the reasons for the revision. In the case of planned revisions, this can be done in the information product for which the data are released. In cases where changes in data sources or methodology are expected, users should be given advance notice both of this and of the likely impact on the quality of the data. In the case of errors detected after publishing, this should be done by a public announcement (e.g., on the website) and through direct contact with the data users. 8.48. All revisions, whether planned or not, must be explained to users in a way that gives assurance that the changes are for statistical reasons alone (and are not politically motivated, for example).
D. Monitoring the use of water statistics 8.49. To assess the relevance and accessibility of water statistics, it is necessary to under-stand and monitor the use of the information products that include them, such as by:
• Contacting key data users and asking for feedback on the information products pro-duced
• Keeping any news articles that refer to water statistics• Monitoring web page statistics (e.g., hits, time spent on pages related to water statistics
web pages)• Monitoring the number of hard-copy information products sold (this should also
include some indication of the types of organizations purchasing the information products)
• Monitoring the number of requests for free water statistics information products (including some indication of what types of organization request them)
• Recording enquiries regarding water statistics (e.g., enquiries about the meaning of certain data or whether there are more detailed data available)
• Checking web search engines at least once a quarter to see how highly information products are ranked by keyword
• Cataloguing any other information products that refer to published water statistics, including government policies and related announcements, books, academic articles and websites
8.50. At least once a year, this information should be consolidated to provide a picture of the use of water statistics, and that picture should be reviewed by the producers of water statistics and, if they have been established, working groups or steering committees for the development of water statistics.
Data dissemination 133
E. International data-reporting 8.51. In addition to the dissemination of water statistics within countries, data are also provided by countries to a range of international organizations. The data reported to inter-national organizations should be accompanied by metadata; in particular, the classifications and methods used to produce the data. This is important because the data are used for inter-national comparisons and the global assessment of water issues, and the reports that result may have influence on the policies and decisions of countries. Submissions of national water statistics to international organizations should be effectively coordinated to avoid reporting inconsistent national figures. 8.52. The United Nations Statistics Division, along with other international organiza-tions, continues to coordinate its data-collection activities and share data. At present, there are several international initiatives collecting data from countries or agencies within countries and, when necessary, estimating data from all available sources, including:
• FAO Aquastat• OECD/Eurostat joint questionnaire on the state of the environment, section entitled
“Inland Waters”• UNICEF Multiple Indicator Cluster Survey (for the MDGs)• United Nations Statistics Division/UNEP water questionnaire• WHO Global Annual Assessment of Sanitation and Drinking Water• World Bank IB-NET • WWAP (compilation of existing data by UN-Water)

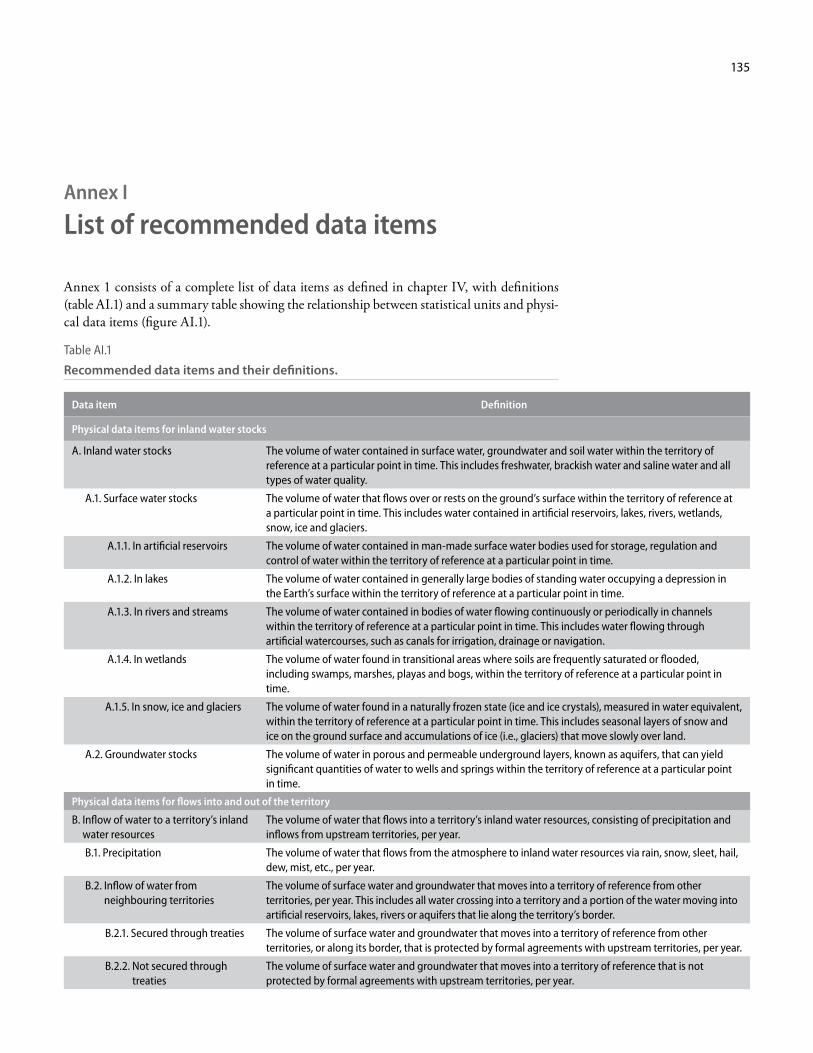
135
Annex I
List of recommended data items
Annex 1 consists of a complete list of data items as defined in chapter IV, with definitions (table AI.1) and a summary table showing the relationship between statistical units and physi-cal data items (figure AI.1).
Table AI.1
Recommended data items and their definitions.
Data item Definition
Physical data items for inland water stocks
A. Inland water stocks The volume of water contained in surface water, groundwater and soil water within the territory of reference at a particular point in time. This includes freshwater, brackish water and saline water and all types of water quality.
A.1. Surface water stocks The volume of water that flows over or rests on the ground’s surface within the territory of reference at a particular point in time. This includes water contained in artificial reservoirs, lakes, rivers, wetlands, snow, ice and glaciers.
A.1.1. In artificial reservoirs The volume of water contained in man-made surface water bodies used for storage, regulation and control of water within the territory of reference at a particular point in time.
A.1.2. In lakes The volume of water contained in generally large bodies of standing water occupying a depression in the Earth’s surface within the territory of reference at a particular point in time.
A.1.3. In rivers and streams The volume of water contained in bodies of water flowing continuously or periodically in channels within the territory of reference at a particular point in time. This includes water flowing through artificial watercourses, such as canals for irrigation, drainage or navigation.
A.1.4. In wetlands The volume of water found in transitional areas where soils are frequently saturated or flooded, including swamps, marshes, playas and bogs, within the territory of reference at a particular point in time.
A.1.5. In snow, ice and glaciers The volume of water found in a naturally frozen state (ice and ice crystals), measured in water equivalent, within the territory of reference at a particular point in time. This includes seasonal layers of snow and ice on the ground surface and accumulations of ice (i.e., glaciers) that move slowly over land.
A.2. Groundwater stocks The volume of water in porous and permeable underground layers, known as aquifers, that can yield significant quantities of water to wells and springs within the territory of reference at a particular point in time.
Physical data items for flows into and out of the territory
B. Inflow of water to a territory’s inland water resources
The volume of water that flows into a territory’s inland water resources, consisting of precipitation and inflows from upstream territories, per year.
B.1. Precipitation The volume of water that flows from the atmosphere to inland water resources via rain, snow, sleet, hail, dew, mist, etc., per year.
B.2. Inflow of water from neighbouring territories
The volume of surface water and groundwater that moves into a territory of reference from other territories, per year. This includes all water crossing into a territory and a portion of the water moving into artificial reservoirs, lakes, rivers or aquifers that lie along the territory’s border.
B.2.1. Secured through treaties The volume of surface water and groundwater that moves into a territory of reference from other territories, or along its border, that is protected by formal agreements with upstream territories, per year.
B.2.2. Not secured through treaties
The volume of surface water and groundwater that moves into a territory of reference that is not protected by formal agreements with upstream territories, per year.
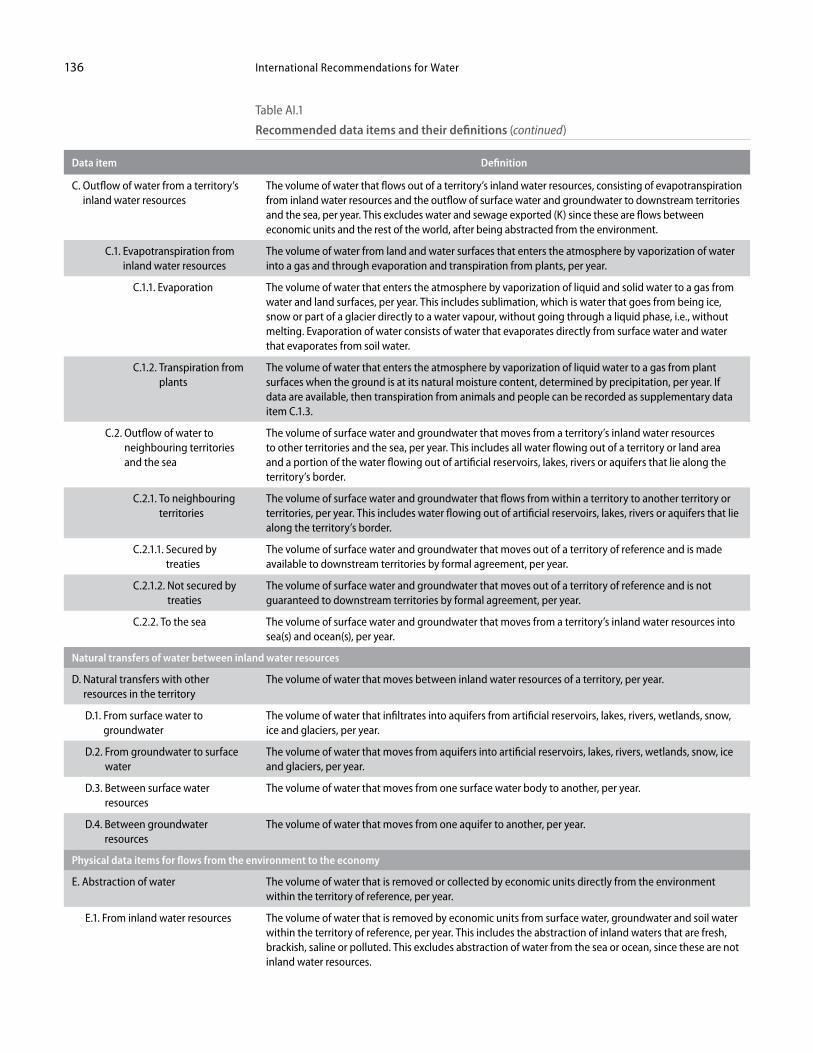
International Recommendations for Water136
Data item Definition
C. Outflow of water from a territory’s inland water resources
The volume of water that flows out of a territory’s inland water resources, consisting of evapotranspiration from inland water resources and the outflow of surface water and groundwater to downstream territories and the sea, per year. This excludes water and sewage exported (K) since these are flows between economic units and the rest of the world, after being abstracted from the environment.
C.1. Evapotranspiration from inland water resources
The volume of water from land and water surfaces that enters the atmosphere by vaporization of water into a gas and through evaporation and transpiration from plants, per year.
C.1.1. Evaporation The volume of water that enters the atmosphere by vaporization of liquid and solid water to a gas from water and land surfaces, per year. This includes sublimation, which is water that goes from being ice, snow or part of a glacier directly to a water vapour, without going through a liquid phase, i.e., without melting. Evaporation of water consists of water that evaporates directly from surface water and water that evaporates from soil water.
C.1.2. Transpiration from plants
The volume of water that enters the atmosphere by vaporization of liquid water to a gas from plant surfaces when the ground is at its natural moisture content, determined by precipitation, per year. If data are available, then transpiration from animals and people can be recorded as supplementary data item C.1.3.
C.2. Outflow of water to neighbouring territories and the sea
The volume of surface water and groundwater that moves from a territory’s inland water resources to other territories and the sea, per year. This includes all water flowing out of a territory or land area and a portion of the water flowing out of artificial reservoirs, lakes, rivers or aquifers that lie along the territory’s border.
C.2.1. To neighbouring territories
The volume of surface water and groundwater that flows from within a territory to another territory or territories, per year. This includes water flowing out of artificial reservoirs, lakes, rivers or aquifers that lie along the territory’s border.
C.2.1.1. Secured by treaties
The volume of surface water and groundwater that moves out of a territory of reference and is made available to downstream territories by formal agreement, per year.
C.2.1.2. Not secured by treaties
The volume of surface water and groundwater that moves out of a territory of reference and is not guaranteed to downstream territories by formal agreement, per year.
C.2.2. To the sea The volume of surface water and groundwater that moves from a territory’s inland water resources into sea(s) and ocean(s), per year.
Natural transfers of water between inland water resources
D. Natural transfers with other resources in the territory
The volume of water that moves between inland water resources of a territory, per year.
D.1. From surface water to groundwater
The volume of water that infiltrates into aquifers from artificial reservoirs, lakes, rivers, wetlands, snow, ice and glaciers, per year.
D.2. From groundwater to surface water
The volume of water that moves from aquifers into artificial reservoirs, lakes, rivers, wetlands, snow, ice and glaciers, per year.
D.3. Between surface water resources
The volume of water that moves from one surface water body to another, per year.
D.4. Between groundwater resources
The volume of water that moves from one aquifer to another, per year.
Physical data items for flows from the environment to the economy
E. Abstraction of water The volume of water that is removed or collected by economic units directly from the environment within the territory of reference, per year.
E.1. From inland water resources The volume of water that is removed by economic units from surface water, groundwater and soil water within the territory of reference, per year. This includes the abstraction of inland waters that are fresh, brackish, saline or polluted. This excludes abstraction of water from the sea or ocean, since these are not inland water resources.
Table AI.1
Recommended data items and their definitions (continued)
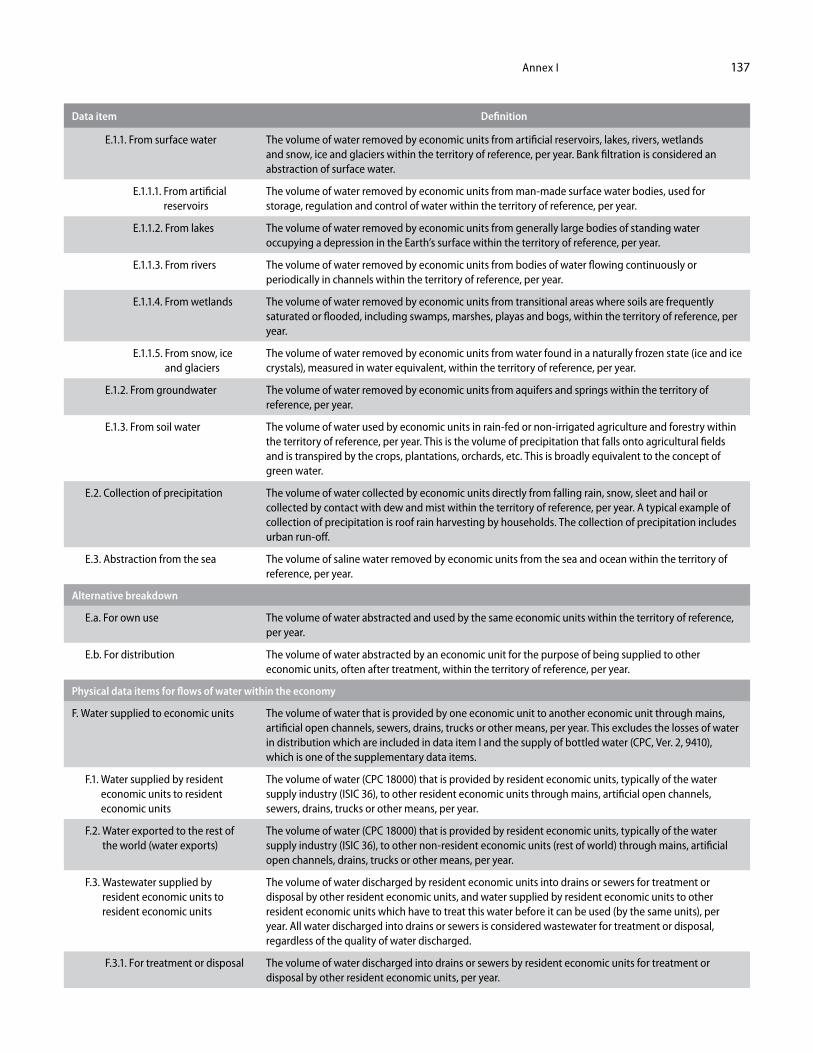
Annex I 137
Data item Definition
E.1.1. From surface water The volume of water removed by economic units from artificial reservoirs, lakes, rivers, wetlands and snow, ice and glaciers within the territory of reference, per year. Bank filtration is considered an abstraction of surface water.
E.1.1.1. From artificial reservoirs
The volume of water removed by economic units from man-made surface water bodies, used for storage, regulation and control of water within the territory of reference, per year.
E.1.1.2. From lakes The volume of water removed by economic units from generally large bodies of standing water occupying a depression in the Earth’s surface within the territory of reference, per year.
E.1.1.3. From rivers The volume of water removed by economic units from bodies of water flowing continuously or periodically in channels within the territory of reference, per year.
E.1.1.4. From wetlands The volume of water removed by economic units from transitional areas where soils are frequently saturated or flooded, including swamps, marshes, playas and bogs, within the territory of reference, per year.
E.1.1.5. From snow, ice and glaciers
The volume of water removed by economic units from water found in a naturally frozen state (ice and ice crystals), measured in water equivalent, within the territory of reference, per year.
E.1.2. From groundwater The volume of water removed by economic units from aquifers and springs within the territory of reference, per year.
E.1.3. From soil water The volume of water used by economic units in rain-fed or non-irrigated agriculture and forestry within the territory of reference, per year. This is the volume of precipitation that falls onto agricultural fields and is transpired by the crops, plantations, orchards, etc. This is broadly equivalent to the concept of green water.
E.2. Collection of precipitation The volume of water collected by economic units directly from falling rain, snow, sleet and hail or collected by contact with dew and mist within the territory of reference, per year. A typical example of collection of precipitation is roof rain harvesting by households. The collection of precipitation includes urban run-off.
E.3. Abstraction from the sea The volume of saline water removed by economic units from the sea and ocean within the territory of reference, per year.
Alternative breakdown
E.a. For own use The volume of water abstracted and used by the same economic units within the territory of reference, per year.
E.b. For distribution The volume of water abstracted by an economic unit for the purpose of being supplied to other economic units, often after treatment, within the territory of reference, per year.
Physical data items for flows of water within the economy
F. Water supplied to economic units The volume of water that is provided by one economic unit to another economic unit through mains, artificial open channels, sewers, drains, trucks or other means, per year. This excludes the losses of water in distribution which are included in data item I and the supply of bottled water (CPC, Ver. 2, 9410), which is one of the supplementary data items.
F.1. Water supplied by resident economic units to resident economic units
The volume of water (CPC 18000) that is provided by resident economic units, typically of the water supply industry (ISIC 36), to other resident economic units through mains, artificial open channels, sewers, drains, trucks or other means, per year.
F.2. Water exported to the rest of the world (water exports)
The volume of water (CPC 18000) that is provided by resident economic units, typically of the water supply industry (ISIC 36), to other non-resident economic units (rest of world) through mains, artificial open channels, drains, trucks or other means, per year.
F.3. Wastewater supplied by resident economic units to resident economic units
The volume of water discharged by resident economic units into drains or sewers for treatment or disposal by other resident economic units, and water supplied by resident economic units to other resident economic units which have to treat this water before it can be used (by the same units), per year. All water discharged into drains or sewers is considered wastewater for treatment or disposal, regardless of the quality of water discharged.
F.3.1. For treatment or disposal The volume of water discharged into drains or sewers by resident economic units for treatment or disposal by other resident economic units, per year.
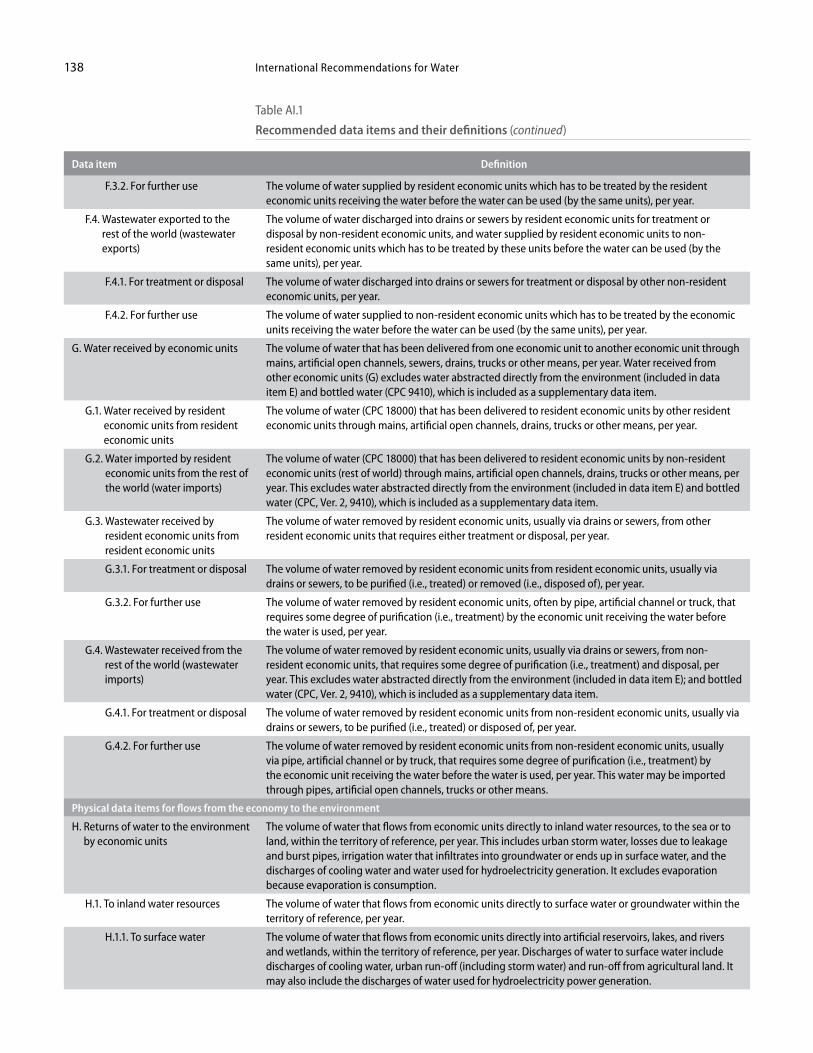
International Recommendations for Water138
Data item Definition
F.3.2. For further use The volume of water supplied by resident economic units which has to be treated by the resident economic units receiving the water before the water can be used (by the same units), per year.
F.4. Wastewater exported to the rest of the world (wastewater exports)
The volume of water discharged into drains or sewers by resident economic units for treatment or disposal by non-resident economic units, and water supplied by resident economic units to non-resident economic units which has to be treated by these units before the water can be used (by the same units), per year.
F.4.1. For treatment or disposal The volume of water discharged into drains or sewers for treatment or disposal by other non-resident economic units, per year.
F.4.2. For further use The volume of water supplied to non-resident economic units which has to be treated by the economic units receiving the water before the water can be used (by the same units), per year.
G. Water received by economic units The volume of water that has been delivered from one economic unit to another economic unit through mains, artificial open channels, sewers, drains, trucks or other means, per year. Water received from other economic units (G) excludes water abstracted directly from the environment (included in data item E) and bottled water (CPC 9410), which is included as a supplementary data item.
G.1. Water received by resident economic units from resident economic units
The volume of water (CPC 18000) that has been delivered to resident economic units by other resident economic units through mains, artificial open channels, drains, trucks or other means, per year.
G.2. Water imported by resident economic units from the rest of the world (water imports)
The volume of water (CPC 18000) that has been delivered to resident economic units by non-resident economic units (rest of world) through mains, artificial open channels, drains, trucks or other means, per year. This excludes water abstracted directly from the environment (included in data item E) and bottled water (CPC, Ver. 2, 9410), which is included as a supplementary data item.
G.3. Wastewater received by resident economic units from resident economic units
The volume of water removed by resident economic units, usually via drains or sewers, from other resident economic units that requires either treatment or disposal, per year.
G.3.1. For treatment or disposal The volume of water removed by resident economic units from resident economic units, usually via drains or sewers, to be purified (i.e., treated) or removed (i.e., disposed of), per year.
G.3.2. For further use The volume of water removed by resident economic units, often by pipe, artificial channel or truck, that requires some degree of purification (i.e., treatment) by the economic unit receiving the water before the water is used, per year.
G.4. Wastewater received from the rest of the world (wastewater imports)
The volume of water removed by resident economic units, usually via drains or sewers, from non-resident economic units, that requires some degree of purification (i.e., treatment) and disposal, per year. This excludes water abstracted directly from the environment (included in data item E); and bottled water (CPC, Ver. 2, 9410), which is included as a supplementary data item.
G.4.1. For treatment or disposal The volume of water removed by resident economic units from non-resident economic units, usually via drains or sewers, to be purified (i.e., treated) or disposed of, per year.
G.4.2. For further use The volume of water removed by resident economic units from non-resident economic units, usually via pipe, artificial channel or by truck, that requires some degree of purification (i.e., treatment) by the economic unit receiving the water before the water is used, per year. This water may be imported through pipes, artificial open channels, trucks or other means.
Physical data items for flows from the economy to the environment
H. Returns of water to the environment by economic units
The volume of water that flows from economic units directly to inland water resources, to the sea or to land, within the territory of reference, per year. This includes urban storm water, losses due to leakage and burst pipes, irrigation water that infiltrates into groundwater or ends up in surface water, and the discharges of cooling water and water used for hydroelectricity generation. It excludes evaporation because evaporation is consumption.
H.1. To inland water resources The volume of water that flows from economic units directly to surface water or groundwater within the territory of reference, per year.
H.1.1. To surface water The volume of water that flows from economic units directly into artificial reservoirs, lakes, and rivers and wetlands, within the territory of reference, per year. Discharges of water to surface water include discharges of cooling water, urban run-off (including storm water) and run-off from agricultural land. It may also include the discharges of water used for hydroelectricity power generation.
Table AI.1
Recommended data items and their definitions (continued)
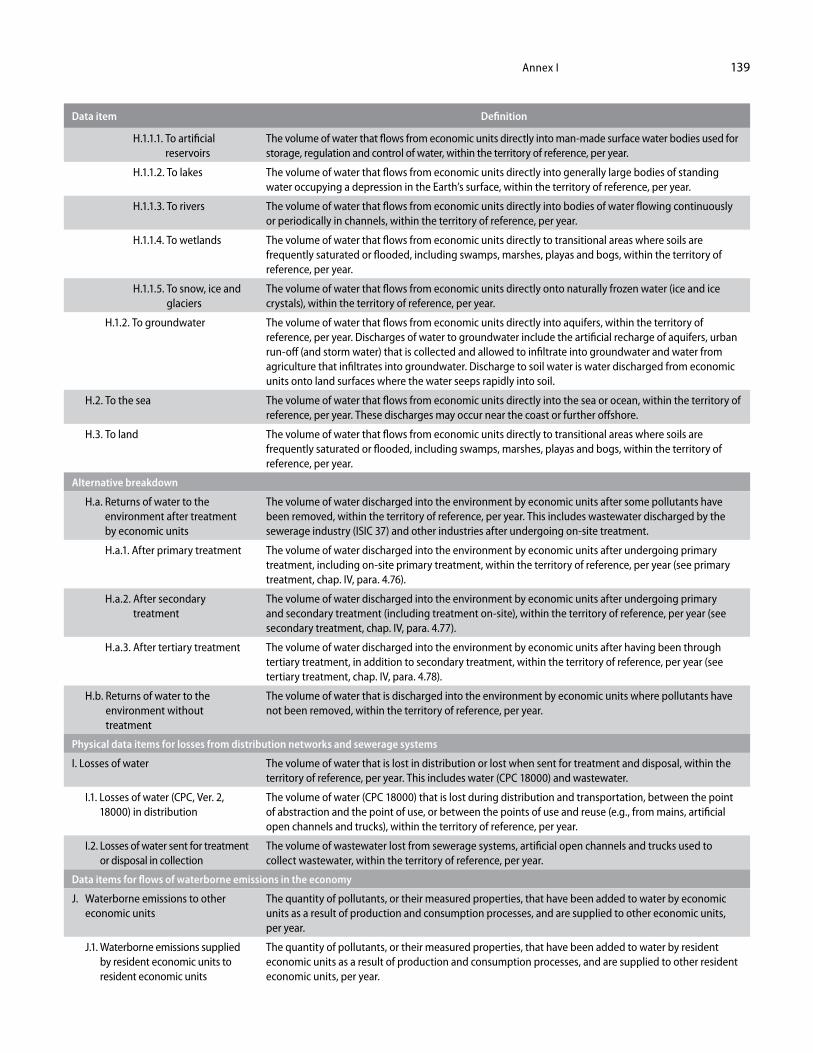
Annex I 139
Data item Definition
H.1.1.1. To artificial reservoirs
The volume of water that flows from economic units directly into man-made surface water bodies used for storage, regulation and control of water, within the territory of reference, per year.
H.1.1.2. To lakes The volume of water that flows from economic units directly into generally large bodies of standing water occupying a depression in the Earth’s surface, within the territory of reference, per year.
H.1.1.3. To rivers The volume of water that flows from economic units directly into bodies of water flowing continuously or periodically in channels, within the territory of reference, per year.
H.1.1.4. To wetlands The volume of water that flows from economic units directly to transitional areas where soils are frequently saturated or flooded, including swamps, marshes, playas and bogs, within the territory of reference, per year.
H.1.1.5. To snow, ice and glaciers
The volume of water that flows from economic units directly onto naturally frozen water (ice and ice crystals), within the territory of reference, per year.
H.1.2. To groundwater The volume of water that flows from economic units directly into aquifers, within the territory of reference, per year. Discharges of water to groundwater include the artificial recharge of aquifers, urban run-off (and storm water) that is collected and allowed to infiltrate into groundwater and water from agriculture that infiltrates into groundwater. Discharge to soil water is water discharged from economic units onto land surfaces where the water seeps rapidly into soil.
H.2. To the sea The volume of water that flows from economic units directly into the sea or ocean, within the territory of reference, per year. These discharges may occur near the coast or further offshore.
H.3. To land The volume of water that flows from economic units directly to transitional areas where soils are frequently saturated or flooded, including swamps, marshes, playas and bogs, within the territory of reference, per year.
Alternative breakdown
H.a. Returns of water to the environment after treatment by economic units
The volume of water discharged into the environment by economic units after some pollutants have been removed, within the territory of reference, per year. This includes wastewater discharged by the sewerage industry (ISIC 37) and other industries after undergoing on-site treatment.
H.a.1. After primary treatment The volume of water discharged into the environment by economic units after undergoing primary treatment, including on-site primary treatment, within the territory of reference, per year (see primary treatment, chap. IV, para. 4.76).
H.a.2. After secondary treatment
The volume of water discharged into the environment by economic units after undergoing primary and secondary treatment (including treatment on-site), within the territory of reference, per year (see secondary treatment, chap. IV, para. 4.77).
H.a.3. After tertiary treatment The volume of water discharged into the environment by economic units after having been through tertiary treatment, in addition to secondary treatment, within the territory of reference, per year (see tertiary treatment, chap. IV, para. 4.78).
H.b. Returns of water to the environment without treatment
The volume of water that is discharged into the environment by economic units where pollutants have not been removed, within the territory of reference, per year.
Physical data items for losses from distribution networks and sewerage systems
I. Losses of water The volume of water that is lost in distribution or lost when sent for treatment and disposal, within the territory of reference, per year. This includes water (CPC 18000) and wastewater.
I.1. Losses of water (CPC, Ver. 2, 18000) in distribution
The volume of water (CPC 18000) that is lost during distribution and transportation, between the point of abstraction and the point of use, or between the points of use and reuse (e.g., from mains, artificial open channels and trucks), within the territory of reference, per year.
I.2. Losses of water sent for treatment or disposal in collection
The volume of wastewater lost from sewerage systems, artificial open channels and trucks used to collect wastewater, within the territory of reference, per year.
Data items for flows of waterborne emissions in the economy
J. Waterborne emissions to other economic units
The quantity of pollutants, or their measured properties, that have been added to water by economic units as a result of production and consumption processes, and are supplied to other economic units, per year.
J.1. Waterborne emissions supplied by resident economic units to resident economic units
The quantity of pollutants, or their measured properties, that have been added to water by resident economic units as a result of production and consumption processes, and are supplied to other resident economic units, per year.
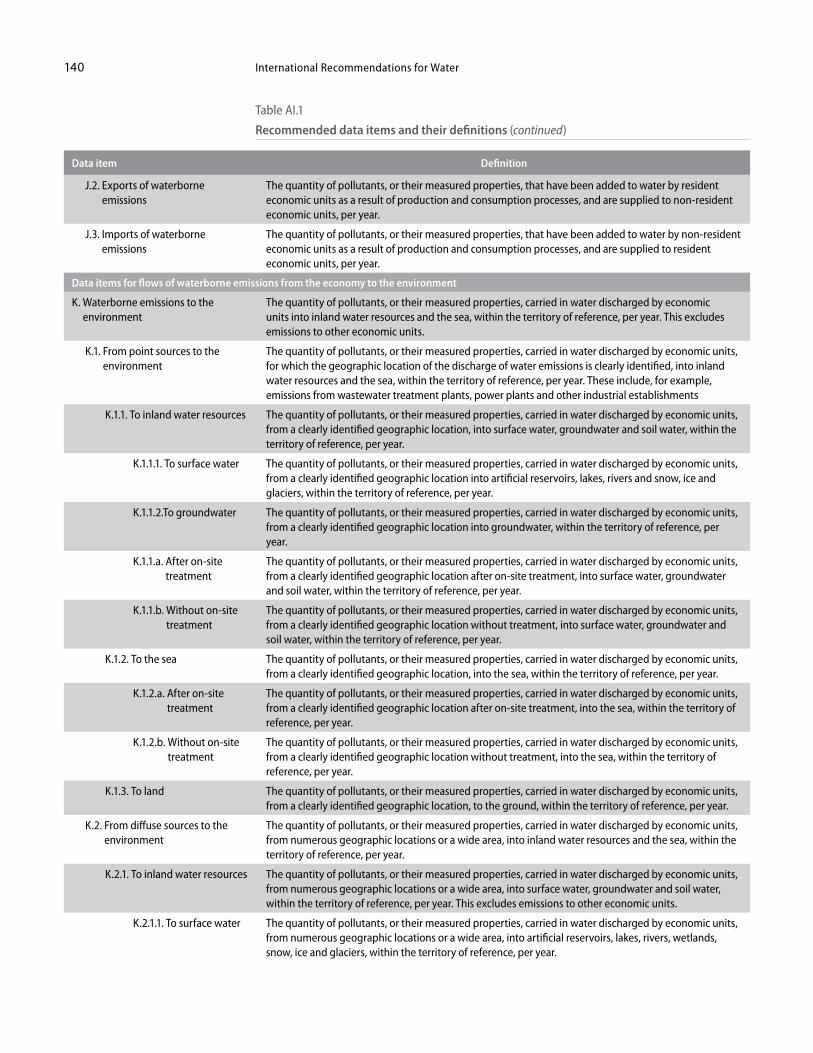
International Recommendations for Water140
Data item Definition
J.2. Exports of waterborne emissions
The quantity of pollutants, or their measured properties, that have been added to water by resident economic units as a result of production and consumption processes, and are supplied to non-resident economic units, per year.
J.3. Imports of waterborne emissions
The quantity of pollutants, or their measured properties, that have been added to water by non-resident economic units as a result of production and consumption processes, and are supplied to resident economic units, per year.
Data items for flows of waterborne emissions from the economy to the environment
K. Waterborne emissions to the environment
The quantity of pollutants, or their measured properties, carried in water discharged by economic units into inland water resources and the sea, within the territory of reference, per year. This excludes emissions to other economic units.
K.1. From point sources to the environment
The quantity of pollutants, or their measured properties, carried in water discharged by economic units, for which the geographic location of the discharge of water emissions is clearly identified, into inland water resources and the sea, within the territory of reference, per year. These include, for example, emissions from wastewater treatment plants, power plants and other industrial establishments
K.1.1. To inland water resources The quantity of pollutants, or their measured properties, carried in water discharged by economic units, from a clearly identified geographic location, into surface water, groundwater and soil water, within the territory of reference, per year.
K.1.1.1. To surface water The quantity of pollutants, or their measured properties, carried in water discharged by economic units, from a clearly identified geographic location into artificial reservoirs, lakes, rivers and snow, ice and glaciers, within the territory of reference, per year.
K.1.1.2.To groundwater The quantity of pollutants, or their measured properties, carried in water discharged by economic units, from a clearly identified geographic location into groundwater, within the territory of reference, per year.
K.1.1.a. After on-site treatment
The quantity of pollutants, or their measured properties, carried in water discharged by economic units, from a clearly identified geographic location after on-site treatment, into surface water, groundwater and soil water, within the territory of reference, per year.
K.1.1.b. Without on-site treatment
The quantity of pollutants, or their measured properties, carried in water discharged by economic units, from a clearly identified geographic location without treatment, into surface water, groundwater and soil water, within the territory of reference, per year.
K.1.2. To the sea The quantity of pollutants, or their measured properties, carried in water discharged by economic units, from a clearly identified geographic location, into the sea, within the territory of reference, per year.
K.1.2.a. After on-site treatment
The quantity of pollutants, or their measured properties, carried in water discharged by economic units, from a clearly identified geographic location after on-site treatment, into the sea, within the territory of reference, per year.
K.1.2.b. Without on-site treatment
The quantity of pollutants, or their measured properties, carried in water discharged by economic units, from a clearly identified geographic location without treatment, into the sea, within the territory of reference, per year.
K.1.3. To land The quantity of pollutants, or their measured properties, carried in water discharged by economic units, from a clearly identified geographic location, to the ground, within the territory of reference, per year.
K.2. From diffuse sources to the environment
The quantity of pollutants, or their measured properties, carried in water discharged by economic units, from numerous geographic locations or a wide area, into inland water resources and the sea, within the territory of reference, per year.
K.2.1. To inland water resources The quantity of pollutants, or their measured properties, carried in water discharged by economic units, from numerous geographic locations or a wide area, into surface water, groundwater and soil water, within the territory of reference, per year. This excludes emissions to other economic units.
K.2.1.1. To surface water The quantity of pollutants, or their measured properties, carried in water discharged by economic units, from numerous geographic locations or a wide area, into artificial reservoirs, lakes, rivers, wetlands, snow, ice and glaciers, within the territory of reference, per year.
Table AI.1
Recommended data items and their definitions (continued)
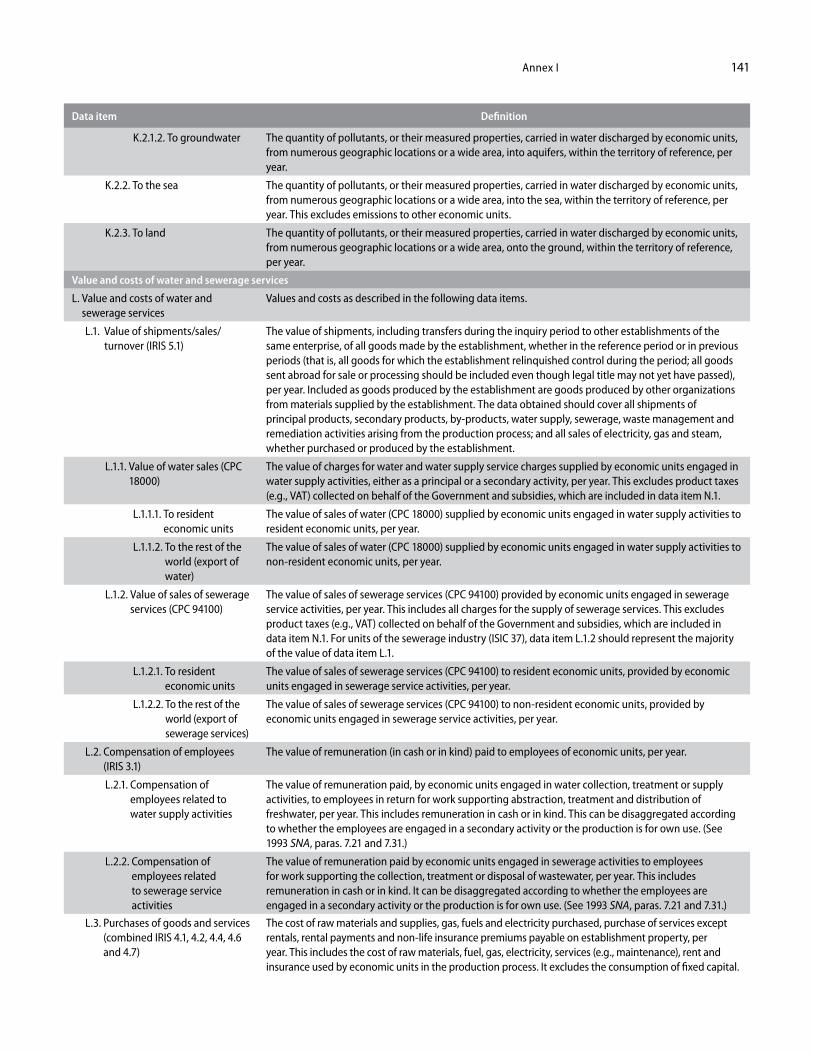
Annex I 141
Data item Definition
K.2.1.2. To groundwater The quantity of pollutants, or their measured properties, carried in water discharged by economic units, from numerous geographic locations or a wide area, into aquifers, within the territory of reference, per year.
K.2.2. To the sea The quantity of pollutants, or their measured properties, carried in water discharged by economic units, from numerous geographic locations or a wide area, into the sea, within the territory of reference, per year. This excludes emissions to other economic units.
K.2.3. To land The quantity of pollutants, or their measured properties, carried in water discharged by economic units, from numerous geographic locations or a wide area, onto the ground, within the territory of reference, per year.
Value and costs of water and sewerage services
L. Value and costs of water and sewerage services
Values and costs as described in the following data items.
L.1. Value of shipments/sales/turnover (IRIS 5.1)
The value of shipments, including transfers during the inquiry period to other establishments of the same enterprise, of all goods made by the establishment, whether in the reference period or in previous periods (that is, all goods for which the establishment relinquished control during the period; all goods sent abroad for sale or processing should be included even though legal title may not yet have passed), per year. Included as goods produced by the establishment are goods produced by other organizations from materials supplied by the establishment. The data obtained should cover all shipments of principal products, secondary products, by-products, water supply, sewerage, waste management and remediation activities arising from the production process; and all sales of electricity, gas and steam, whether purchased or produced by the establishment.
L.1.1. Value of water sales (CPC 18000)
The value of charges for water and water supply service charges supplied by economic units engaged in water supply activities, either as a principal or a secondary activity, per year. This excludes product taxes (e.g., VAT) collected on behalf of the Government and subsidies, which are included in data item N.1.
L.1.1.1. To resident economic units
The value of sales of water (CPC 18000) supplied by economic units engaged in water supply activities to resident economic units, per year.
L.1.1.2. To the rest of the world (export of water)
The value of sales of water (CPC 18000) supplied by economic units engaged in water supply activities to non-resident economic units, per year.
L.1.2. Value of sales of sewerage services (CPC 94100)
The value of sales of sewerage services (CPC 94100) provided by economic units engaged in sewerage service activities, per year. This includes all charges for the supply of sewerage services. This excludes product taxes (e.g., VAT) collected on behalf of the Government and subsidies, which are included in data item N.1. For units of the sewerage industry (ISIC 37), data item L.1.2 should represent the majority of the value of data item L.1.
L.1.2.1. To resident economic units
The value of sales of sewerage services (CPC 94100) to resident economic units, provided by economic units engaged in sewerage service activities, per year.
L.1.2.2. To the rest of the world (export of sewerage services)
The value of sales of sewerage services (CPC 94100) to non-resident economic units, provided by economic units engaged in sewerage service activities, per year.
L.2. Compensation of employees (IRIS 3.1)
The value of remuneration (in cash or in kind) paid to employees of economic units, per year.
L.2.1. Compensation of employees related to water supply activities
The value of remuneration paid, by economic units engaged in water collection, treatment or supply activities, to employees in return for work supporting abstraction, treatment and distribution of freshwater, per year. This includes remuneration in cash or in kind. This can be disaggregated according to whether the employees are engaged in a secondary activity or the production is for own use. (See 1993 SNA, paras. 7.21 and 7.31.)
L.2.2. Compensation of employees related to sewerage service activities
The value of remuneration paid by economic units engaged in sewerage activities to employees for work supporting the collection, treatment or disposal of wastewater, per year. This includes remuneration in cash or in kind. It can be disaggregated according to whether the employees are engaged in a secondary activity or the production is for own use. (See 1993 SNA, paras. 7.21 and 7.31.)
L.3. Purchases of goods and services (combined IRIS 4.1, 4.2, 4.4, 4.6 and 4.7)
The cost of raw materials and supplies, gas, fuels and electricity purchased, purchase of services except rentals, rental payments and non-life insurance premiums payable on establishment property, per year. This includes the cost of raw materials, fuel, gas, electricity, services (e.g., maintenance), rent and insurance used by economic units in the production process. It excludes the consumption of fixed capital.
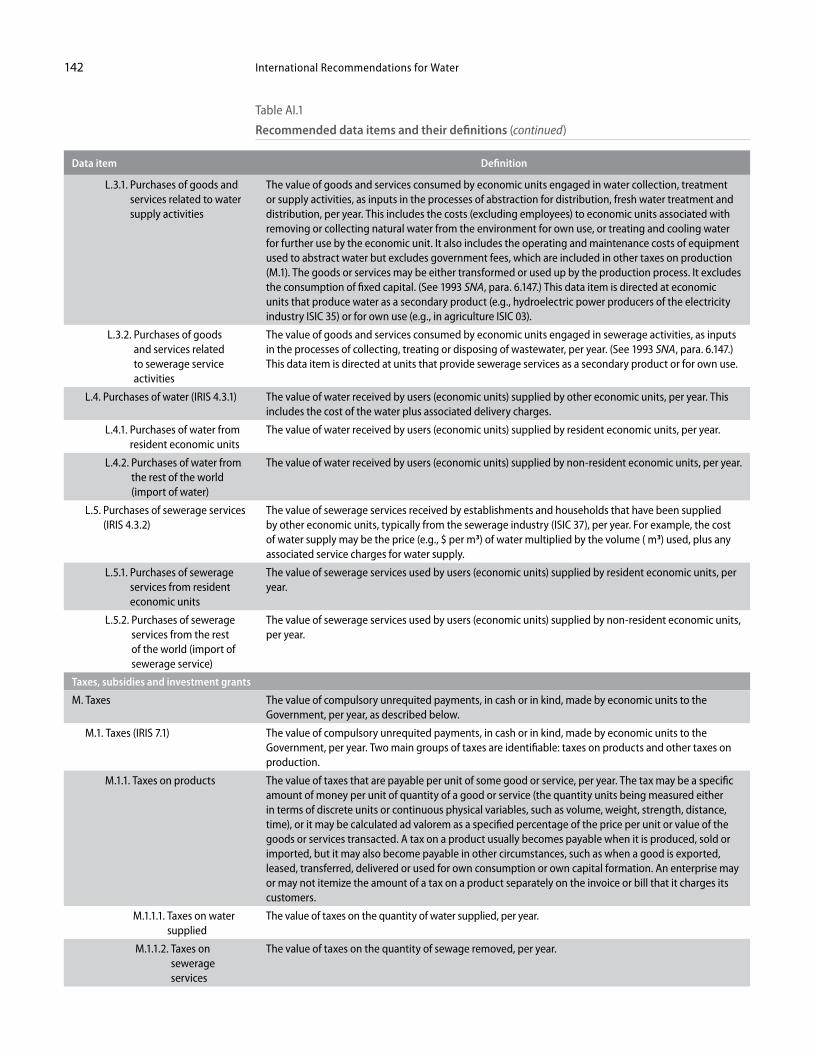
International Recommendations for Water142
Data item Definition
L.3.1. Purchases of goods and services related to water supply activities
The value of goods and services consumed by economic units engaged in water collection, treatment or supply activities, as inputs in the processes of abstraction for distribution, fresh water treatment and distribution, per year. This includes the costs (excluding employees) to economic units associated with removing or collecting natural water from the environment for own use, or treating and cooling water for further use by the economic unit. It also includes the operating and maintenance costs of equipment used to abstract water but excludes government fees, which are included in other taxes on production (M.1). The goods or services may be either transformed or used up by the production process. It excludes the consumption of fixed capital. (See 1993 SNA, para. 6.147.) This data item is directed at economic units that produce water as a secondary product (e.g., hydroelectric power producers of the electricity industry ISIC 35) or for own use (e.g., in agriculture ISIC 03).
L.3.2. Purchases of goods and services related to sewerage service activities
The value of goods and services consumed by economic units engaged in sewerage activities, as inputs in the processes of collecting, treating or disposing of wastewater, per year. (See 1993 SNA, para. 6.147.) This data item is directed at units that provide sewerage services as a secondary product or for own use.
L.4. Purchases of water (IRIS 4.3.1) The value of water received by users (economic units) supplied by other economic units, per year. This includes the cost of the water plus associated delivery charges.
L.4.1. Purchases of water from resident economic units
The value of water received by users (economic units) supplied by resident economic units, per year.
L.4.2. Purchases of water from the rest of the world (import of water)
The value of water received by users (economic units) supplied by non-resident economic units, per year.
L.5. Purchases of sewerage services (IRIS 4.3.2)
The value of sewerage services received by establishments and households that have been supplied by other economic units, typically from the sewerage industry (ISIC 37), per year. For example, the cost of water supply may be the price (e.g., $ per m3) of water multiplied by the volume ( m3) used, plus any associated service charges for water supply.
L.5.1. Purchases of sewerage services from resident economic units
The value of sewerage services used by users (economic units) supplied by resident economic units, per year.
L.5.2. Purchases of sewerage services from the rest of the world (import of sewerage service)
The value of sewerage services used by users (economic units) supplied by non-resident economic units, per year.
Taxes, subsidies and investment grants
M. Taxes The value of compulsory unrequited payments, in cash or in kind, made by economic units to the Government, per year, as described below.
M.1. Taxes (IRIS 7.1) The value of compulsory unrequited payments, in cash or in kind, made by economic units to the Government, per year. Two main groups of taxes are identifiable: taxes on products and other taxes on production.
M.1.1. Taxes on products The value of taxes that are payable per unit of some good or service, per year. The tax may be a specific amount of money per unit of quantity of a good or service (the quantity units being measured either in terms of discrete units or continuous physical variables, such as volume, weight, strength, distance, time), or it may be calculated ad valorem as a specified percentage of the price per unit or value of the goods or services transacted. A tax on a product usually becomes payable when it is produced, sold or imported, but it may also become payable in other circumstances, such as when a good is exported, leased, transferred, delivered or used for own consumption or own capital formation. An enterprise may or may not itemize the amount of a tax on a product separately on the invoice or bill that it charges its customers.
M.1.1.1. Taxes on water supplied
The value of taxes on the quantity of water supplied, per year.
M.1.1.2. Taxes on sewerage services
The value of taxes on the quantity of sewage removed, per year.
Table AI.1
Recommended data items and their definitions (continued)
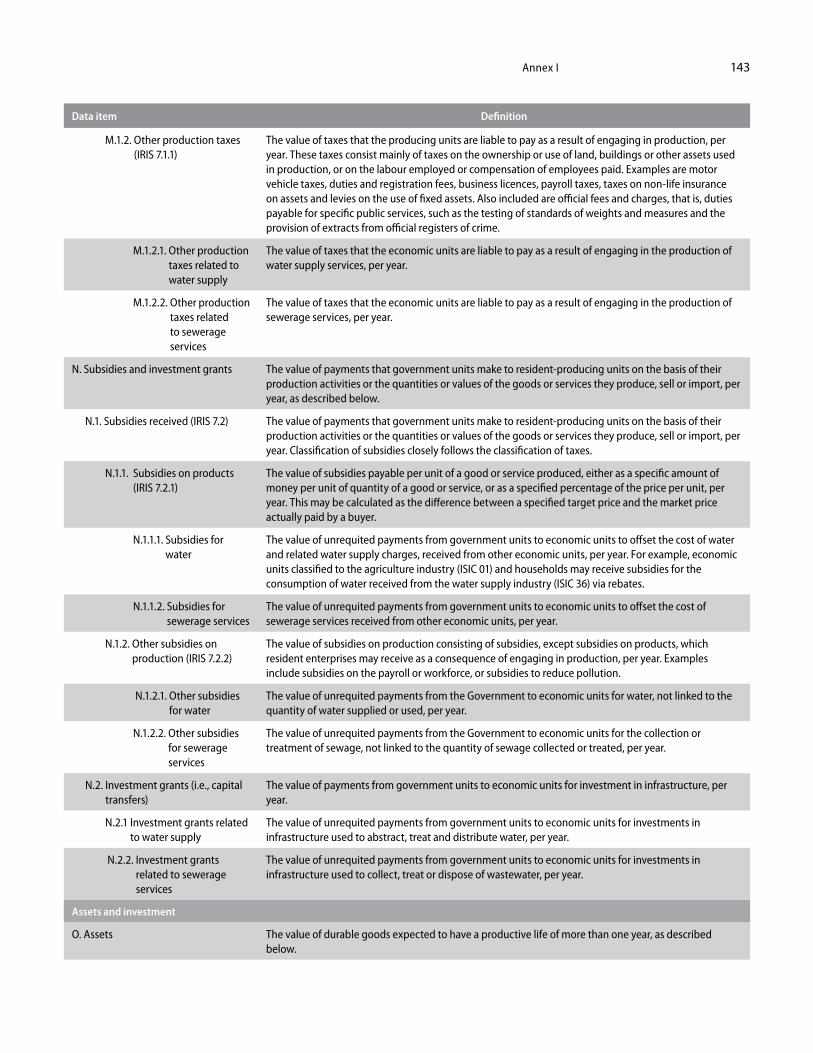
Annex I 143
Data item Definition
M.1.2. Other production taxes (IRIS 7.1.1)
The value of taxes that the producing units are liable to pay as a result of engaging in production, per year. These taxes consist mainly of taxes on the ownership or use of land, buildings or other assets used in production, or on the labour employed or compensation of employees paid. Examples are motor vehicle taxes, duties and registration fees, business licences, payroll taxes, taxes on non-life insurance on assets and levies on the use of fixed assets. Also included are official fees and charges, that is, duties payable for specific public services, such as the testing of standards of weights and measures and the provision of extracts from official registers of crime.
M.1.2.1. Other production taxes related to water supply
The value of taxes that the economic units are liable to pay as a result of engaging in the production of water supply services, per year.
M.1.2.2. Other production taxes related to sewerage services
The value of taxes that the economic units are liable to pay as a result of engaging in the production of sewerage services, per year.
N. Subsidies and investment grants The value of payments that government units make to resident-producing units on the basis of their production activities or the quantities or values of the goods or services they produce, sell or import, per year, as described below.
N.1. Subsidies received (IRIS 7.2) The value of payments that government units make to resident-producing units on the basis of their production activities or the quantities or values of the goods or services they produce, sell or import, per year. Classification of subsidies closely follows the classification of taxes.
N.1.1. Subsidies on products (IRIS 7.2.1)
The value of subsidies payable per unit of a good or service produced, either as a specific amount of money per unit of quantity of a good or service, or as a specified percentage of the price per unit, per year. This may be calculated as the difference between a specified target price and the market price actually paid by a buyer.
N.1.1.1. Subsidies for water
The value of unrequited payments from government units to economic units to offset the cost of water and related water supply charges, received from other economic units, per year. For example, economic units classified to the agriculture industry (ISIC 01) and households may receive subsidies for the consumption of water received from the water supply industry (ISIC 36) via rebates.
N.1.1.2. Subsidies for sewerage services
The value of unrequited payments from government units to economic units to offset the cost of sewerage services received from other economic units, per year.
N.1.2. Other subsidies on production (IRIS 7.2.2)
The value of subsidies on production consisting of subsidies, except subsidies on products, which resident enterprises may receive as a consequence of engaging in production, per year. Examples include subsidies on the payroll or workforce, or subsidies to reduce pollution.
N.1.2.1. Other subsidies for water
The value of unrequited payments from the Government to economic units for water, not linked to the quantity of water supplied or used, per year.
N.1.2.2. Other subsidies for sewerage services
The value of unrequited payments from the Government to economic units for the collection or treatment of sewage, not linked to the quantity of sewage collected or treated, per year.
N.2. Investment grants (i.e., capital transfers)
The value of payments from government units to economic units for investment in infrastructure, per year.
N.2.1 Investment grants related to water supply
The value of unrequited payments from government units to economic units for investments in infrastructure used to abstract, treat and distribute water, per year.
N.2.2. Investment grants related to sewerage services
The value of unrequited payments from government units to economic units for investments in infrastructure used to collect, treat or dispose of wastewater, per year.
Assets and investment
O. Assets The value of durable goods expected to have a productive life of more than one year, as described below.
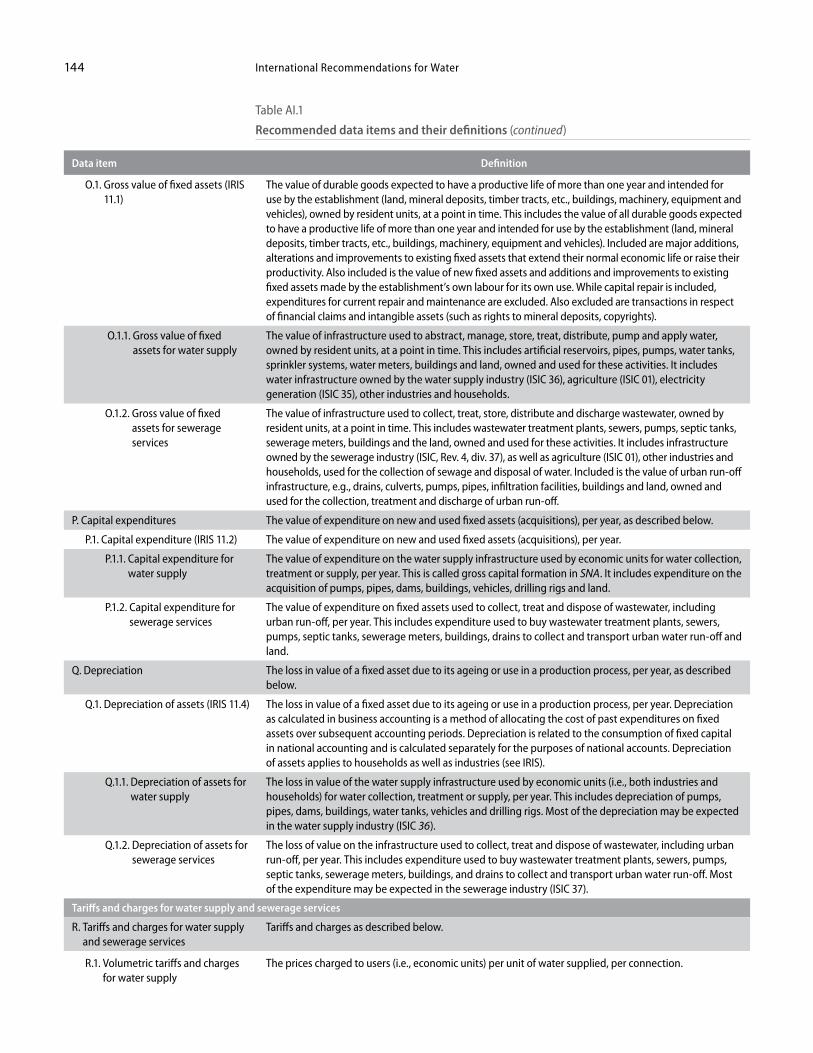
International Recommendations for Water144
Data item Definition
O.1. Gross value of fixed assets (IRIS 11.1)
The value of durable goods expected to have a productive life of more than one year and intended for use by the establishment (land, mineral deposits, timber tracts, etc., buildings, machinery, equipment and vehicles), owned by resident units, at a point in time. This includes the value of all durable goods expected to have a productive life of more than one year and intended for use by the establishment (land, mineral deposits, timber tracts, etc., buildings, machinery, equipment and vehicles). Included are major additions, alterations and improvements to existing fixed assets that extend their normal economic life or raise their productivity. Also included is the value of new fixed assets and additions and improvements to existing fixed assets made by the establishment’s own labour for its own use. While capital repair is included, expenditures for current repair and maintenance are excluded. Also excluded are transactions in respect of financial claims and intangible assets (such as rights to mineral deposits, copyrights).
O.1.1. Gross value of fixed assets for water supply
The value of infrastructure used to abstract, manage, store, treat, distribute, pump and apply water, owned by resident units, at a point in time. This includes artificial reservoirs, pipes, pumps, water tanks, sprinkler systems, water meters, buildings and land, owned and used for these activities. It includes water infrastructure owned by the water supply industry (ISIC 36), agriculture (ISIC 01), electricity generation (ISIC 35), other industries and households.
O.1.2. Gross value of fixed assets for sewerage services
The value of infrastructure used to collect, treat, store, distribute and discharge wastewater, owned by resident units, at a point in time. This includes wastewater treatment plants, sewers, pumps, septic tanks, sewerage meters, buildings and the land, owned and used for these activities. It includes infrastructure owned by the sewerage industry (ISIC, Rev. 4, div. 37), as well as agriculture (ISIC 01), other industries and households, used for the collection of sewage and disposal of water. Included is the value of urban run-off infrastructure, e.g., drains, culverts, pumps, pipes, infiltration facilities, buildings and land, owned and used for the collection, treatment and discharge of urban run-off.
P. Capital expenditures The value of expenditure on new and used fixed assets (acquisitions), per year, as described below.
P.1. Capital expenditure (IRIS 11.2) The value of expenditure on new and used fixed assets (acquisitions), per year.
P.1.1. Capital expenditure for water supply
The value of expenditure on the water supply infrastructure used by economic units for water collection, treatment or supply, per year. This is called gross capital formation in SNA. It includes expenditure on the acquisition of pumps, pipes, dams, buildings, vehicles, drilling rigs and land.
P.1.2. Capital expenditure for sewerage services
The value of expenditure on fixed assets used to collect, treat and dispose of wastewater, including urban run-off, per year. This includes expenditure used to buy wastewater treatment plants, sewers, pumps, septic tanks, sewerage meters, buildings, drains to collect and transport urban water run-off and land.
Q. Depreciation The loss in value of a fixed asset due to its ageing or use in a production process, per year, as described below.
Q.1. Depreciation of assets (IRIS 11.4) The loss in value of a fixed asset due to its ageing or use in a production process, per year. Depreciation as calculated in business accounting is a method of allocating the cost of past expenditures on fixed assets over subsequent accounting periods. Depreciation is related to the consumption of fixed capital in national accounting and is calculated separately for the purposes of national accounts. Depreciation of assets applies to households as well as industries (see IRIS).
Q.1.1. Depreciation of assets for water supply
The loss in value of the water supply infrastructure used by economic units (i.e., both industries and households) for water collection, treatment or supply, per year. This includes depreciation of pumps, pipes, dams, buildings, water tanks, vehicles and drilling rigs. Most of the depreciation may be expected in the water supply industry (ISIC 36).
Q.1.2. Depreciation of assets for sewerage services
The loss of value on the infrastructure used to collect, treat and dispose of wastewater, including urban run-off, per year. This includes expenditure used to buy wastewater treatment plants, sewers, pumps, septic tanks, sewerage meters, buildings, and drains to collect and transport urban water run-off. Most of the expenditure may be expected in the sewerage industry (ISIC 37).
Tariffs and charges for water supply and sewerage services
R. Tariffs and charges for water supply and sewerage services
Tariffs and charges as described below.
R.1. Volumetric tariffs and charges for water supply
The prices charged to users (i.e., economic units) per unit of water supplied, per connection.
Table AI.1
Recommended data items and their definitions (continued)
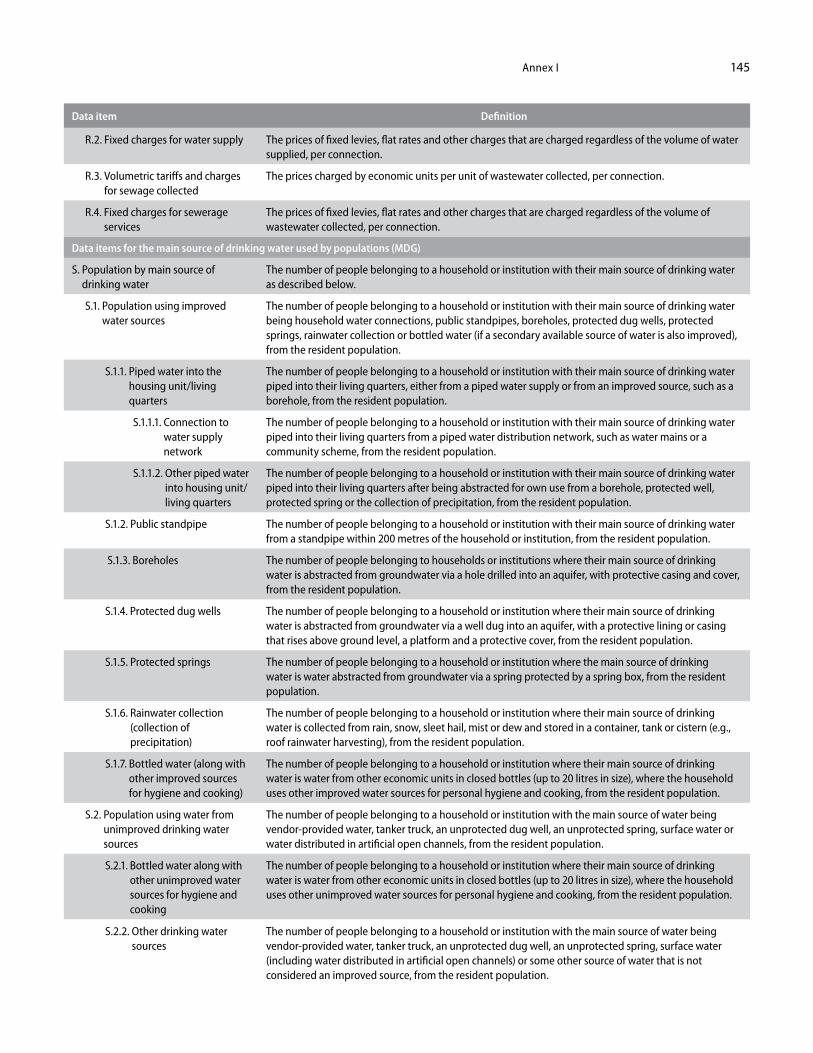
Annex I 145
Data item Definition
R.2. Fixed charges for water supply The prices of fixed levies, flat rates and other charges that are charged regardless of the volume of water supplied, per connection.
R.3. Volumetric tariffs and charges for sewage collected
The prices charged by economic units per unit of wastewater collected, per connection.
R.4. Fixed charges for sewerage services
The prices of fixed levies, flat rates and other charges that are charged regardless of the volume of wastewater collected, per connection.
Data items for the main source of drinking water used by populations (MDG)
S. Population by main source of drinking water
The number of people belonging to a household or institution with their main source of drinking water as described below.
S.1. Population using improved water sources
The number of people belonging to a household or institution with their main source of drinking water being household water connections, public standpipes, boreholes, protected dug wells, protected springs, rainwater collection or bottled water (if a secondary available source of water is also improved), from the resident population.
S.1.1. Piped water into the housing unit/living quarters
The number of people belonging to a household or institution with their main source of drinking water piped into their living quarters, either from a piped water supply or from an improved source, such as a borehole, from the resident population.
S.1.1.1. Connection to water supply network
The number of people belonging to a household or institution with their main source of drinking water piped into their living quarters from a piped water distribution network, such as water mains or a community scheme, from the resident population.
S.1.1.2. Other piped water into housing unit/living quarters
The number of people belonging to a household or institution with their main source of drinking water piped into their living quarters after being abstracted for own use from a borehole, protected well, protected spring or the collection of precipitation, from the resident population.
S.1.2. Public standpipe The number of people belonging to a household or institution with their main source of drinking water from a standpipe within 200 metres of the household or institution, from the resident population.
S.1.3. Boreholes The number of people belonging to households or institutions where their main source of drinking water is abstracted from groundwater via a hole drilled into an aquifer, with protective casing and cover, from the resident population.
S.1.4. Protected dug wells The number of people belonging to a household or institution where their main source of drinking water is abstracted from groundwater via a well dug into an aquifer, with a protective lining or casing that rises above ground level, a platform and a protective cover, from the resident population.
S.1.5. Protected springs The number of people belonging to a household or institution where the main source of drinking water is water abstracted from groundwater via a spring protected by a spring box, from the resident population.
S.1.6. Rainwater collection (collection of precipitation)
The number of people belonging to a household or institution where their main source of drinking water is collected from rain, snow, sleet hail, mist or dew and stored in a container, tank or cistern (e.g., roof rainwater harvesting), from the resident population.
S.1.7. Bottled water (along with other improved sources for hygiene and cooking)
The number of people belonging to a household or institution where their main source of drinking water is water from other economic units in closed bottles (up to 20 litres in size), where the household uses other improved water sources for personal hygiene and cooking, from the resident population.
S.2. Population using water from unimproved drinking water sources
The number of people belonging to a household or institution with the main source of water being vendor-provided water, tanker truck, an unprotected dug well, an unprotected spring, surface water or water distributed in artificial open channels, from the resident population.
S.2.1. Bottled water along with other unimproved water sources for hygiene and cooking
The number of people belonging to a household or institution where their main source of drinking water is water from other economic units in closed bottles (up to 20 litres in size), where the household uses other unimproved water sources for personal hygiene and cooking, from the resident population.
S.2.2. Other drinking water sources
The number of people belonging to a household or institution with the main source of water being vendor-provided water, tanker truck, an unprotected dug well, an unprotected spring, surface water (including water distributed in artificial open channels) or some other source of water that is not considered an improved source, from the resident population.
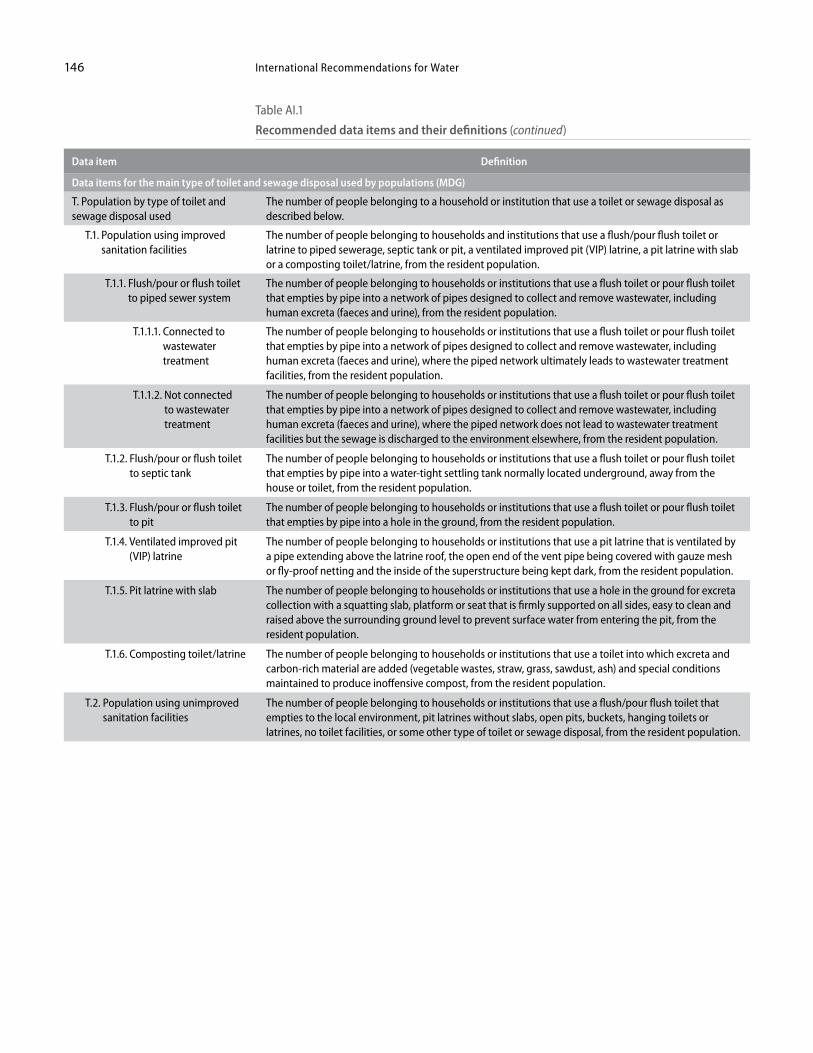
International Recommendations for Water146
Data item Definition
Data items for the main type of toilet and sewage disposal used by populations (MDG)
T. Population by type of toilet and sewage disposal used
The number of people belonging to a household or institution that use a toilet or sewage disposal as described below.
T.1. Population using improved sanitation facilities
The number of people belonging to households and institutions that use a flush/pour flush toilet or latrine to piped sewerage, septic tank or pit, a ventilated improved pit (VIP) latrine, a pit latrine with slab or a composting toilet/latrine, from the resident population.
T.1.1. Flush/pour or flush toilet to piped sewer system
The number of people belonging to households or institutions that use a flush toilet or pour flush toilet that empties by pipe into a network of pipes designed to collect and remove wastewater, including human excreta (faeces and urine), from the resident population.
T.1.1.1. Connected to wastewater treatment
The number of people belonging to households or institutions that use a flush toilet or pour flush toilet that empties by pipe into a network of pipes designed to collect and remove wastewater, including human excreta (faeces and urine), where the piped network ultimately leads to wastewater treatment facilities, from the resident population.
T.1.1.2. Not connected to wastewater treatment
The number of people belonging to households or institutions that use a flush toilet or pour flush toilet that empties by pipe into a network of pipes designed to collect and remove wastewater, including human excreta (faeces and urine), where the piped network does not lead to wastewater treatment facilities but the sewage is discharged to the environment elsewhere, from the resident population.
T.1.2. Flush/pour or flush toilet to septic tank
The number of people belonging to households or institutions that use a flush toilet or pour flush toilet that empties by pipe into a water-tight settling tank normally located underground, away from the house or toilet, from the resident population.
T.1.3. Flush/pour or flush toilet to pit
The number of people belonging to households or institutions that use a flush toilet or pour flush toilet that empties by pipe into a hole in the ground, from the resident population.
T.1.4. Ventilated improved pit (VIP) latrine
The number of people belonging to households or institutions that use a pit latrine that is ventilated by a pipe extending above the latrine roof, the open end of the vent pipe being covered with gauze mesh or fly-proof netting and the inside of the superstructure being kept dark, from the resident population.
T.1.5. Pit latrine with slab The number of people belonging to households or institutions that use a hole in the ground for excreta collection with a squatting slab, platform or seat that is firmly supported on all sides, easy to clean and raised above the surrounding ground level to prevent surface water from entering the pit, from the resident population.
T.1.6. Composting toilet/latrine The number of people belonging to households or institutions that use a toilet into which excreta and carbon-rich material are added (vegetable wastes, straw, grass, sawdust, ash) and special conditions maintained to produce inoffensive compost, from the resident population.
T.2. Population using unimproved sanitation facilities
The number of people belonging to households or institutions that use a flush/pour flush toilet that empties to the local environment, pit latrines without slabs, open pits, buckets, hanging toilets or latrines, no toilet facilities, or some other type of toilet or sewage disposal, from the resident population.
Table AI.1
Recommended data items and their definitions (continued)
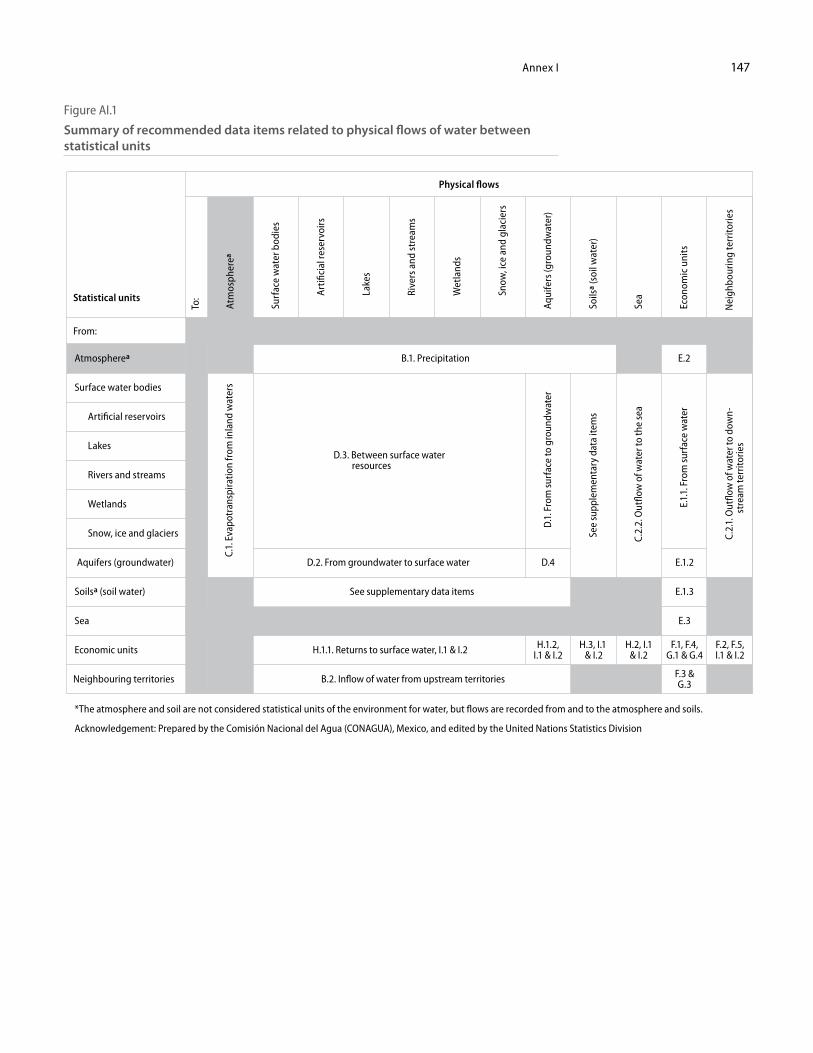
Annex I 147
Figure AI.1
Summary of recommended data items related to physical flows of water between statistical units
To:
Neighbouring territories
From:
Atmospherea B.1. Precipitation
D.3. Between surface water resources
D.2. From groundwater to surface water
See supplementary data items
H.1.1. Returns to surface water, I.1 & I.2
B.2. Inflow of water from upstream territories
E.2
E.1.2D.4
E.1.3
E.3
F.3 &G.3
F.2, F.5,I.1 & I.2
F.1, F.4,G.1 & G.4
H.2, I.1& I.2
H.3, I.1 & I.2
H.1.2,I.1 & I.2
Surface water bodies
Artificial reservoirs
Lakes
Rivers and streams
Wetlands
Snow, ice and glaciers
Aquifers (groundwater)
Soilsa (soil water)
Sea
Economic units
*The atmosphere and soil are not considered statistical units of the environment for water, but flows are recorded from and to the atmosphere and soils.
Acknowledgement: Prepared by the Comisión Nacional del Agua (CONAGUA), Mexico, and edited by the United Nations Statistics Division
Statistical units
Physical flows
Nei
ghbo
urin
g te
rrito
ries
Atm
osph
erea
C.1.
Eva
potr
ansp
iratio
n fr
om in
land
wat
ers
D.1
. Fro
m su
rfac
e to
gro
undw
ater
See
supp
lem
enta
ry d
ata
item
s
C.2.
2. O
utflo
w o
f wat
er to
the
sea
E.1.
1. F
rom
surf
ace
wat
er
C.2.
1. O
utflo
w o
f wat
er to
dow
n-
str
eam
terr
itorie
s
Surf
ace
wat
er b
odie
s
Art
ifici
al re
serv
oirs
Lake
s
Rive
rs a
nd s
trea
ms
Wet
land
s
Snow
, ice
and
gla
cier
s
Aqui
fers
(gro
undw
ater
)
Soils
a (so
il w
ater
)
Sea
Econ
omic
uni
ts

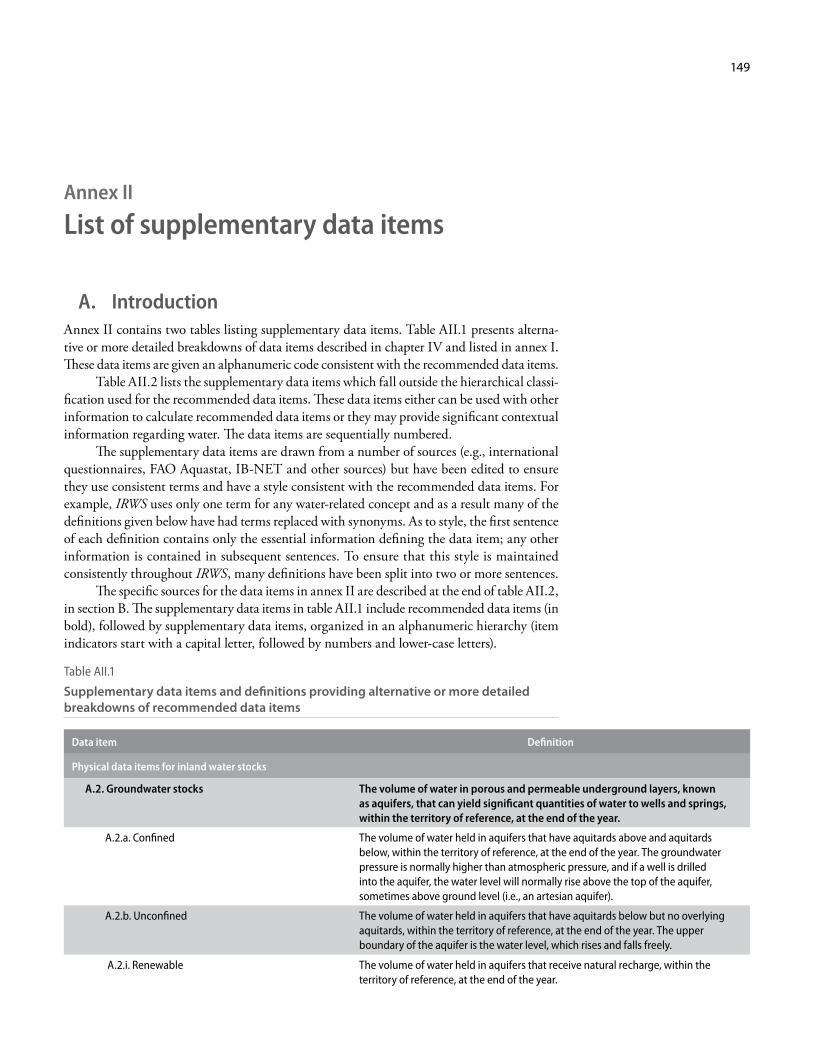
149
Annex II
List of supplementary data items
A. IntroductionAnnex II contains two tables listing supplementary data items. Table AII.1 presents alterna-tive or more detailed breakdowns of data items described in chapter IV and listed in annex I. These data items are given an alphanumeric code consistent with the recommended data items.
Table AII.2 lists the supplementary data items which fall outside the hierarchical classi-fication used for the recommended data items. These data items either can be used with other information to calculate recommended data items or they may provide significant contextual information regarding water. The data items are sequentially numbered.
The supplementary data items are drawn from a number of sources (e.g., international questionnaires, FAO Aquastat, IB-NET and other sources) but have been edited to ensure they use consistent terms and have a style consistent with the recommended data items. For example, IRWS uses only one term for any water-related concept and as a result many of the definitions given below have had terms replaced with synonyms. As to style, the first sentence of each definition contains only the essential information defining the data item; any other information is contained in subsequent sentences. To ensure that this style is maintained consistently throughout IRWS, many definitions have been split into two or more sentences.
The specific sources for the data items in annex II are described at the end of table AII.2, in section B. The supplementary data items in table AII.1 include recommended data items (in bold), followed by supplementary data items, organized in an alphanumeric hierarchy (item indicators start with a capital letter, followed by numbers and lower-case letters).
Table AII.1
Supplementary data items and definitions providing alternative or more detailed breakdowns of recommended data items
Data item Definition
Physical data items for inland water stocks
A.2. Groundwater stocks The volume of water in porous and permeable underground layers, known as aquifers, that can yield significant quantities of water to wells and springs, within the territory of reference, at the end of the year.
A.2.a. Confined The volume of water held in aquifers that have aquitards above and aquitards below, within the territory of reference, at the end of the year. The groundwater pressure is normally higher than atmospheric pressure, and if a well is drilled into the aquifer, the water level will normally rise above the top of the aquifer, sometimes above ground level (i.e., an artesian aquifer).
A.2.b. Unconfined The volume of water held in aquifers that have aquitards below but no overlying aquitards, within the territory of reference, at the end of the year. The upper boundary of the aquifer is the water level, which rises and falls freely.
A.2.i. Renewable The volume of water held in aquifers that receive natural recharge, within the territory of reference, at the end of the year.
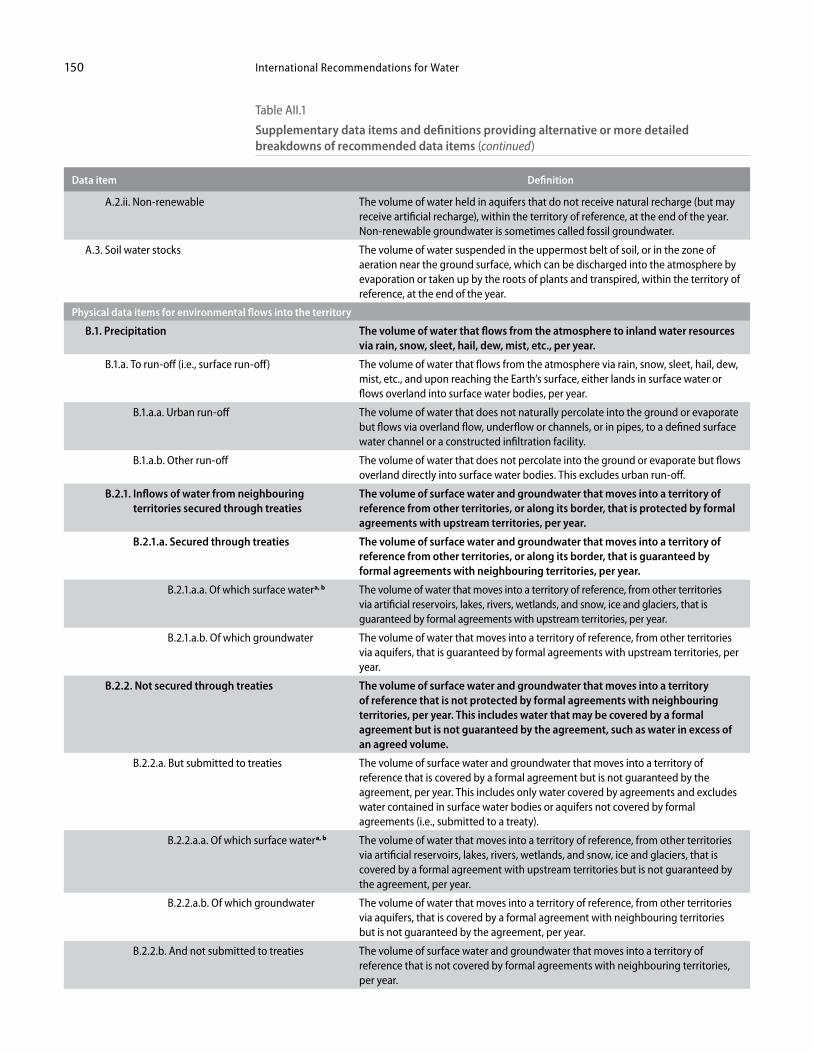
International Recommendations for Water150
Data item Definition
A.2.ii. Non-renewable The volume of water held in aquifers that do not receive natural recharge (but may receive artificial recharge), within the territory of reference, at the end of the year. Non-renewable groundwater is sometimes called fossil groundwater.
A.3. Soil water stocks The volume of water suspended in the uppermost belt of soil, or in the zone of aeration near the ground surface, which can be discharged into the atmosphere by evaporation or taken up by the roots of plants and transpired, within the territory of reference, at the end of the year.
Physical data items for environmental flows into the territory
B.1. Precipitation The volume of water that flows from the atmosphere to inland water resources via rain, snow, sleet, hail, dew, mist, etc., per year.
B.1.a. To run-off (i.e., surface run-off) The volume of water that flows from the atmosphere via rain, snow, sleet, hail, dew, mist, etc., and upon reaching the Earth’s surface, either lands in surface water or flows overland into surface water bodies, per year.
B.1.a.a. Urban run-off The volume of water that does not naturally percolate into the ground or evaporate but flows via overland flow, underflow or channels, or in pipes, to a defined surface water channel or a constructed infiltration facility.
B.1.a.b. Other run-off The volume of water that does not percolate into the ground or evaporate but flows overland directly into surface water bodies. This excludes urban run-off.
B.2.1. Inflows of water from neighbouring territories secured through treaties
The volume of surface water and groundwater that moves into a territory of reference from other territories, or along its border, that is protected by formal agreements with upstream territories, per year.
B.2.1.a. Secured through treaties The volume of surface water and groundwater that moves into a territory of reference from other territories, or along its border, that is guaranteed by formal agreements with neighbouring territories, per year.
B.2.1.a.a. Of which surface water a, b The volume of water that moves into a territory of reference, from other territories via artificial reservoirs, lakes, rivers, wetlands, and snow, ice and glaciers, that is guaranteed by formal agreements with upstream territories, per year.
B.2.1.a.b. Of which groundwater The volume of water that moves into a territory of reference, from other territories via aquifers, that is guaranteed by formal agreements with upstream territories, per year.
B.2.2. Not secured through treaties The volume of surface water and groundwater that moves into a territory of reference that is not protected by formal agreements with neighbouring territories, per year. This includes water that may be covered by a formal agreement but is not guaranteed by the agreement, such as water in excess of an agreed volume.
B.2.2.a. But submitted to treaties The volume of surface water and groundwater that moves into a territory of reference that is covered by a formal agreement but is not guaranteed by the agreement, per year. This includes only water covered by agreements and excludes water contained in surface water bodies or aquifers not covered by formal agreements (i.e., submitted to a treaty).
B.2.2.a.a. Of which surface water a, b The volume of water that moves into a territory of reference, from other territories via artificial reservoirs, lakes, rivers, wetlands, and snow, ice and glaciers, that is covered by a formal agreement with upstream territories but is not guaranteed by the agreement, per year.
B.2.2.a.b. Of which groundwater The volume of water that moves into a territory of reference, from other territories via aquifers, that is covered by a formal agreement with neighbouring territories but is not guaranteed by the agreement, per year.
B.2.2.b. And not submitted to treaties The volume of surface water and groundwater that moves into a territory of reference that is not covered by formal agreements with neighbouring territories, per year.
Table AII.1
Supplementary data items and definitions providing alternative or more detailed breakdowns of recommended data items (continued)
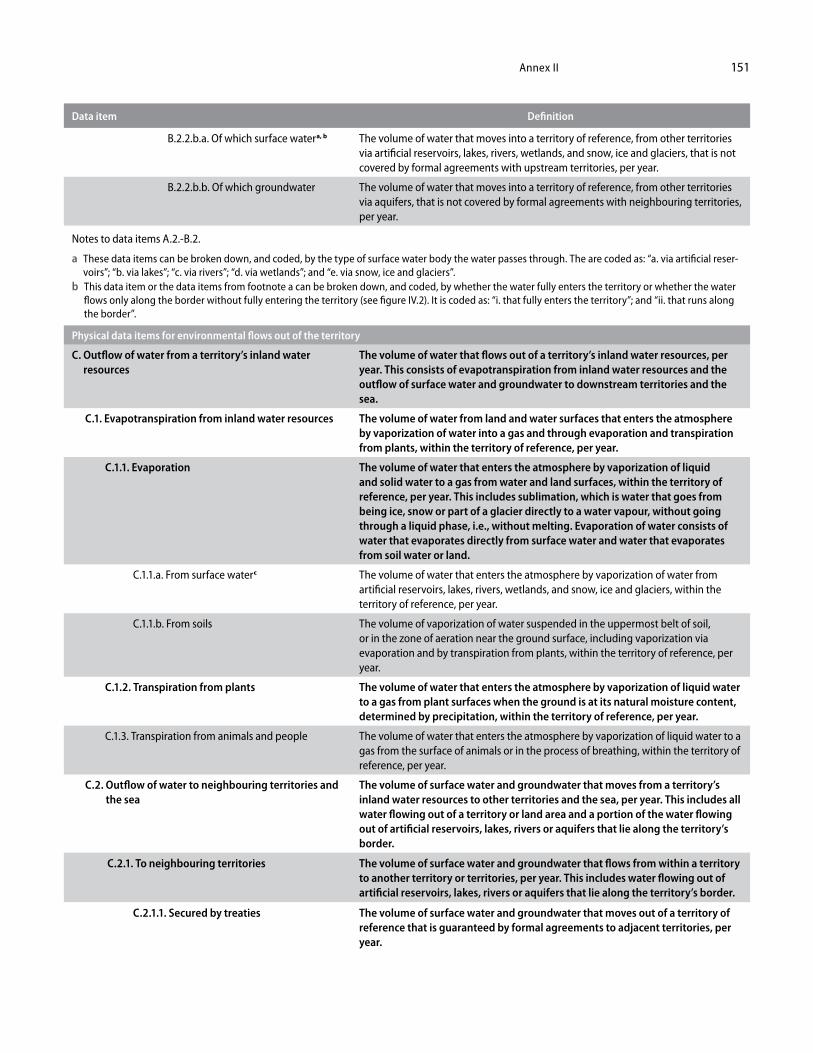
Annex II 151
Data item Definition
B.2.2.b.a. Of which surface water a, b The volume of water that moves into a territory of reference, from other territories via artificial reservoirs, lakes, rivers, wetlands, and snow, ice and glaciers, that is not covered by formal agreements with upstream territories, per year.
B.2.2.b.b. Of which groundwater The volume of water that moves into a territory of reference, from other territories via aquifers, that is not covered by formal agreements with neighbouring territories, per year.
Notes to data items A.2.-B.2.
a These data items can be broken down, and coded, by the type of surface water body the water passes through. The are coded as: “a. via artificial reser-voirs”; “b. via lakes”; “c. via rivers”; “d. via wetlands”; and “e. via snow, ice and glaciers”.
b This data item or the data items from footnote a can be broken down, and coded, by whether the water fully enters the territory or whether the water flows only along the border without fully entering the territory (see figure IV.2). It is coded as: “i. that fully enters the territory”; and “ii. that runs along the border”.
Physical data items for environmental flows out of the territory
C. Outflow of water from a territory’s inland water resources
The volume of water that flows out of a territory’s inland water resources, per year. This consists of evapotranspiration from inland water resources and the outflow of surface water and groundwater to downstream territories and the sea.
C.1. Evapotranspiration from inland water resources The volume of water from land and water surfaces that enters the atmosphere by vaporization of water into a gas and through evaporation and transpiration from plants, within the territory of reference, per year.
C.1.1. Evaporation The volume of water that enters the atmosphere by vaporization of liquid and solid water to a gas from water and land surfaces, within the territory of reference, per year. This includes sublimation, which is water that goes from being ice, snow or part of a glacier directly to a water vapour, without going through a liquid phase, i.e., without melting. Evaporation of water consists of water that evaporates directly from surface water and water that evaporates from soil water or land.
C.1.1.a. From surface water c The volume of water that enters the atmosphere by vaporization of water from artificial reservoirs, lakes, rivers, wetlands, and snow, ice and glaciers, within the territory of reference, per year.
C.1.1.b. From soils The volume of vaporization of water suspended in the uppermost belt of soil, or in the zone of aeration near the ground surface, including vaporization via evaporation and by transpiration from plants, within the territory of reference, per year.
C.1.2. Transpiration from plants The volume of water that enters the atmosphere by vaporization of liquid water to a gas from plant surfaces when the ground is at its natural moisture content, determined by precipitation, within the territory of reference, per year.
C.1.3. Transpiration from animals and people The volume of water that enters the atmosphere by vaporization of liquid water to a gas from the surface of animals or in the process of breathing, within the territory of reference, per year.
C.2. Outflow of water to neighbouring territories and the sea
The volume of surface water and groundwater that moves from a territory’s inland water resources to other territories and the sea, per year. This includes all water flowing out of a territory or land area and a portion of the water flowing out of artificial reservoirs, lakes, rivers or aquifers that lie along the territory’s border.
C.2.1. To neighbouring territories The volume of surface water and groundwater that flows from within a territory to another territory or territories, per year. This includes water flowing out of artificial reservoirs, lakes, rivers or aquifers that lie along the territory’s border.
C.2.1.1. Secured by treaties The volume of surface water and groundwater that moves out of a territory of reference that is guaranteed by formal agreements to adjacent territories, per year.
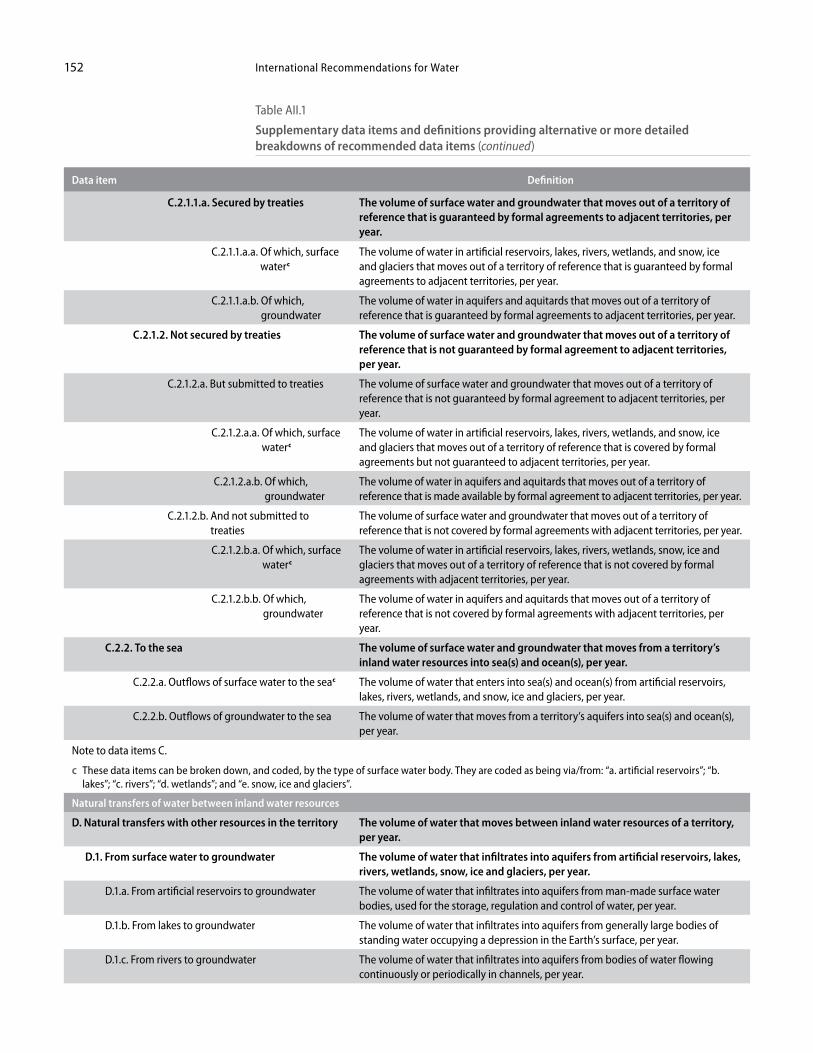
International Recommendations for Water152
Data item Definition
C.2.1.1.a. Secured by treaties The volume of surface water and groundwater that moves out of a territory of reference that is guaranteed by formal agreements to adjacent territories, per year.
C.2.1.1.a.a. Of which, surface water c
The volume of water in artificial reservoirs, lakes, rivers, wetlands, and snow, ice and glaciers that moves out of a territory of reference that is guaranteed by formal agreements to adjacent territories, per year.
C.2.1.1.a.b. Of which, groundwater
The volume of water in aquifers and aquitards that moves out of a territory of reference that is guaranteed by formal agreements to adjacent territories, per year.
C.2.1.2. Not secured by treaties The volume of surface water and groundwater that moves out of a territory of reference that is not guaranteed by formal agreement to adjacent territories, per year.
C.2.1.2.a. But submitted to treaties The volume of surface water and groundwater that moves out of a territory of reference that is not guaranteed by formal agreement to adjacent territories, per year.
C.2.1.2.a.a. Of which, surface water c
The volume of water in artificial reservoirs, lakes, rivers, wetlands, and snow, ice and glaciers that moves out of a territory of reference that is covered by formal agreements but not guaranteed to adjacent territories, per year.
C.2.1.2.a.b. Of which, groundwater
The volume of water in aquifers and aquitards that moves out of a territory of reference that is made available by formal agreement to adjacent territories, per year.
C.2.1.2.b. And not submitted to treaties
The volume of surface water and groundwater that moves out of a territory of reference that is not covered by formal agreements with adjacent territories, per year.
C.2.1.2.b.a. Of which, surface water c
The volume of water in artificial reservoirs, lakes, rivers, wetlands, snow, ice and glaciers that moves out of a territory of reference that is not covered by formal agreements with adjacent territories, per year.
C.2.1.2.b.b. Of which, groundwater
The volume of water in aquifers and aquitards that moves out of a territory of reference that is not covered by formal agreements with adjacent territories, per year.
C.2.2. To the sea The volume of surface water and groundwater that moves from a territory’s inland water resources into sea(s) and ocean(s), per year.
C.2.2.a. Outflows of surface water to the seac The volume of water that enters into sea(s) and ocean(s) from artificial reservoirs, lakes, rivers, wetlands, and snow, ice and glaciers, per year.
C.2.2.b. Outflows of groundwater to the sea The volume of water that moves from a territory’s aquifers into sea(s) and ocean(s), per year.
Note to data items C.
c These data items can be broken down, and coded, by the type of surface water body. They are coded as being via/from: “a. artificial reservoirs”; “b. lakes”; “c. rivers”; “d. wetlands”; and “e. snow, ice and glaciers”.
Natural transfers of water between inland water resources
D. Natural transfers with other resources in the territory The volume of water that moves between inland water resources of a territory, per year.
D.1. From surface water to groundwater The volume of water that infiltrates into aquifers from artificial reservoirs, lakes, rivers, wetlands, snow, ice and glaciers, per year.
D.1.a. From artificial reservoirs to groundwater The volume of water that infiltrates into aquifers from man-made surface water bodies, used for the storage, regulation and control of water, per year.
D.1.b. From lakes to groundwater The volume of water that infiltrates into aquifers from generally large bodies of standing water occupying a depression in the Earth’s surface, per year.
D.1.c. From rivers to groundwater The volume of water that infiltrates into aquifers from bodies of water flowing continuously or periodically in channels, per year.
Table AII.1
Supplementary data items and definitions providing alternative or more detailed breakdowns of recommended data items (continued)
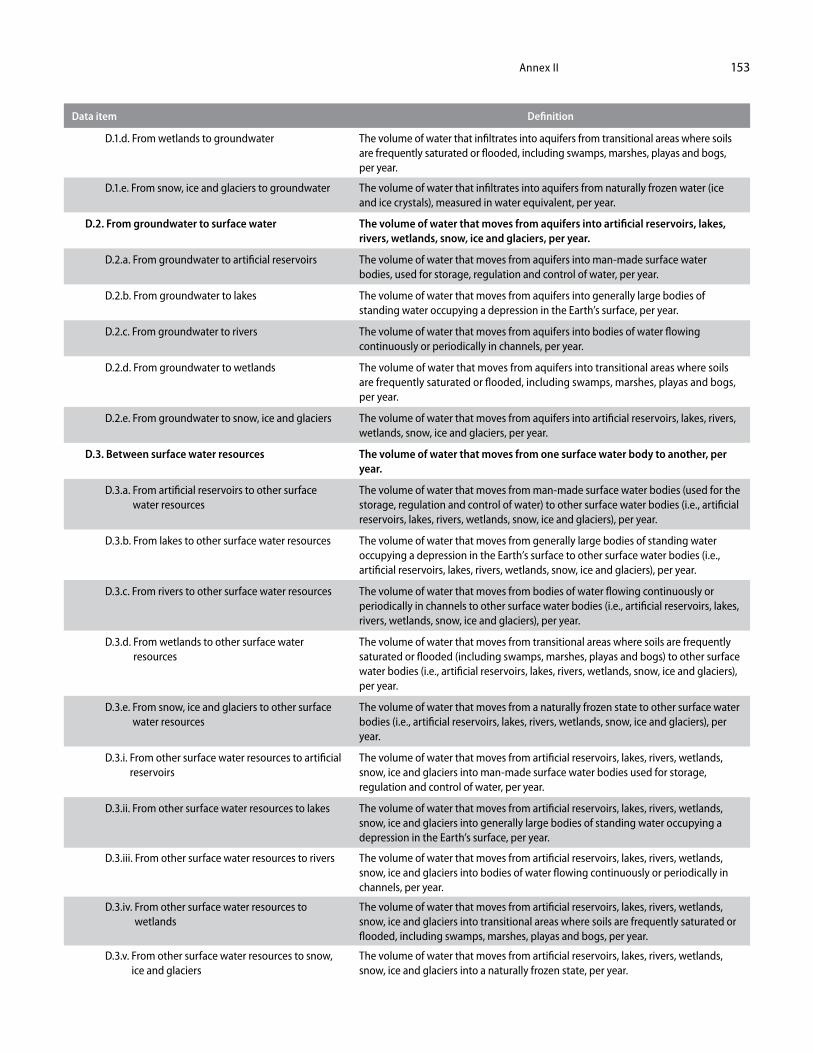
Annex II 153
Data item Definition
D.1.d. From wetlands to groundwater The volume of water that infiltrates into aquifers from transitional areas where soils are frequently saturated or flooded, including swamps, marshes, playas and bogs, per year.
D.1.e. From snow, ice and glaciers to groundwater The volume of water that infiltrates into aquifers from naturally frozen water (ice and ice crystals), measured in water equivalent, per year.
D.2. From groundwater to surface water The volume of water that moves from aquifers into artificial reservoirs, lakes, rivers, wetlands, snow, ice and glaciers, per year.
D.2.a. From groundwater to artificial reservoirs The volume of water that moves from aquifers into man-made surface water bodies, used for storage, regulation and control of water, per year.
D.2.b. From groundwater to lakes The volume of water that moves from aquifers into generally large bodies of standing water occupying a depression in the Earth’s surface, per year.
D.2.c. From groundwater to rivers The volume of water that moves from aquifers into bodies of water flowing continuously or periodically in channels, per year.
D.2.d. From groundwater to wetlands The volume of water that moves from aquifers into transitional areas where soils are frequently saturated or flooded, including swamps, marshes, playas and bogs, per year.
D.2.e. From groundwater to snow, ice and glaciers The volume of water that moves from aquifers into artificial reservoirs, lakes, rivers, wetlands, snow, ice and glaciers, per year.
D.3. Between surface water resources The volume of water that moves from one surface water body to another, per year.
D.3.a. From artificial reservoirs to other surface water resources
The volume of water that moves from man-made surface water bodies (used for the storage, regulation and control of water) to other surface water bodies (i.e., artificial reservoirs, lakes, rivers, wetlands, snow, ice and glaciers), per year.
D.3.b. From lakes to other surface water resources The volume of water that moves from generally large bodies of standing water occupying a depression in the Earth’s surface to other surface water bodies (i.e., artificial reservoirs, lakes, rivers, wetlands, snow, ice and glaciers), per year.
D.3.c. From rivers to other surface water resources The volume of water that moves from bodies of water flowing continuously or periodically in channels to other surface water bodies (i.e., artificial reservoirs, lakes, rivers, wetlands, snow, ice and glaciers), per year.
D.3.d. From wetlands to other surface water resources
The volume of water that moves from transitional areas where soils are frequently saturated or flooded (including swamps, marshes, playas and bogs) to other surface water bodies (i.e., artificial reservoirs, lakes, rivers, wetlands, snow, ice and glaciers), per year.
D.3.e. From snow, ice and glaciers to other surface water resources
The volume of water that moves from a naturally frozen state to other surface water bodies (i.e., artificial reservoirs, lakes, rivers, wetlands, snow, ice and glaciers), per year.
D.3.i. From other surface water resources to artificial reservoirs
The volume of water that moves from artificial reservoirs, lakes, rivers, wetlands, snow, ice and glaciers into man-made surface water bodies used for storage, regulation and control of water, per year.
D.3.ii. From other surface water resources to lakes The volume of water that moves from artificial reservoirs, lakes, rivers, wetlands, snow, ice and glaciers into generally large bodies of standing water occupying a depression in the Earth’s surface, per year.
D.3.iii. From other surface water resources to rivers The volume of water that moves from artificial reservoirs, lakes, rivers, wetlands, snow, ice and glaciers into bodies of water flowing continuously or periodically in channels, per year.
D.3.iv. From other surface water resources to wetlands
The volume of water that moves from artificial reservoirs, lakes, rivers, wetlands, snow, ice and glaciers into transitional areas where soils are frequently saturated or flooded, including swamps, marshes, playas and bogs, per year.
D.3.v. From other surface water resources to snow, ice and glaciers
The volume of water that moves from artificial reservoirs, lakes, rivers, wetlands, snow, ice and glaciers into a naturally frozen state, per year.
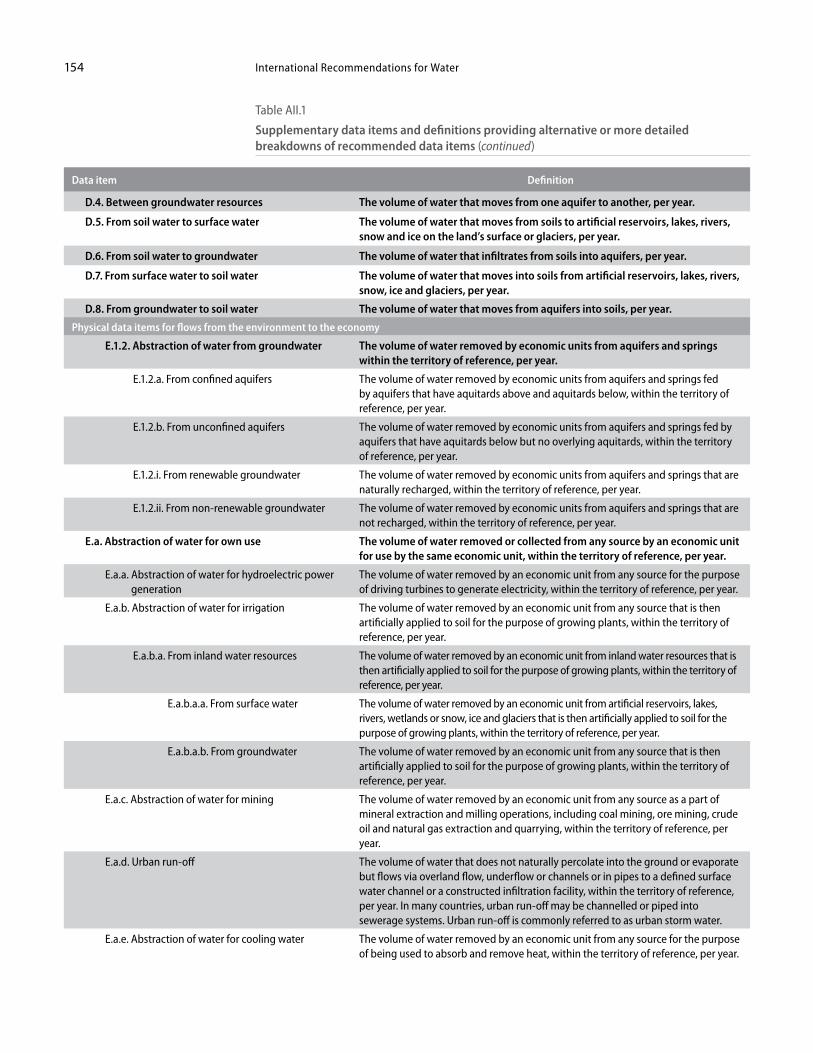
International Recommendations for Water154
Data item Definition
D.4. Between groundwater resources The volume of water that moves from one aquifer to another, per year.
D.5. From soil water to surface water The volume of water that moves from soils to artificial reservoirs, lakes, rivers, snow and ice on the land’s surface or glaciers, per year.
D.6. From soil water to groundwater The volume of water that infiltrates from soils into aquifers, per year.
D.7. From surface water to soil water The volume of water that moves into soils from artificial reservoirs, lakes, rivers, snow, ice and glaciers, per year.
D.8. From groundwater to soil water The volume of water that moves from aquifers into soils, per year.
Physical data items for flows from the environment to the economy
E.1.2. Abstraction of water from groundwater The volume of water removed by economic units from aquifers and springs within the territory of reference, per year.
E.1.2.a. From confined aquifers The volume of water removed by economic units from aquifers and springs fed by aquifers that have aquitards above and aquitards below, within the territory of reference, per year.
E.1.2.b. From unconfined aquifers The volume of water removed by economic units from aquifers and springs fed by aquifers that have aquitards below but no overlying aquitards, within the territory of reference, per year.
E.1.2.i. From renewable groundwater The volume of water removed by economic units from aquifers and springs that are naturally recharged, within the territory of reference, per year.
E.1.2.ii. From non-renewable groundwater The volume of water removed by economic units from aquifers and springs that are not recharged, within the territory of reference, per year.
E.a. Abstraction of water for own use The volume of water removed or collected from any source by an economic unit for use by the same economic unit, within the territory of reference, per year.
E.a.a. Abstraction of water for hydroelectric power generation
The volume of water removed by an economic unit from any source for the purpose of driving turbines to generate electricity, within the territory of reference, per year.
E.a.b. Abstraction of water for irrigation The volume of water removed by an economic unit from any source that is then artificially applied to soil for the purpose of growing plants, within the territory of reference, per year.
E.a.b.a. From inland water resources The volume of water removed by an economic unit from inland water resources that is then artificially applied to soil for the purpose of growing plants, within the territory of reference, per year.
E.a.b.a.a. From surface water The volume of water removed by an economic unit from artificial reservoirs, lakes, rivers, wetlands or snow, ice and glaciers that is then artificially applied to soil for the purpose of growing plants, within the territory of reference, per year.
E.a.b.a.b. From groundwater The volume of water removed by an economic unit from any source that is then artificially applied to soil for the purpose of growing plants, within the territory of reference, per year.
E.a.c. Abstraction of water for mining The volume of water removed by an economic unit from any source as a part of mineral extraction and milling operations, including coal mining, ore mining, crude oil and natural gas extraction and quarrying, within the territory of reference, per year.
E.a.d. Urban run-off The volume of water that does not naturally percolate into the ground or evaporate but flows via overland flow, underflow or channels or in pipes to a defined surface water channel or a constructed infiltration facility, within the territory of reference, per year. In many countries, urban run-off may be channelled or piped into sewerage systems. Urban run-off is commonly referred to as urban storm water.
E.a.e. Abstraction of water for cooling water The volume of water removed by an economic unit from any source for the purpose of being used to absorb and remove heat, within the territory of reference, per year.
Table AII.1
Supplementary data items and definitions providing alternative or more detailed breakdowns of recommended data items (continued)
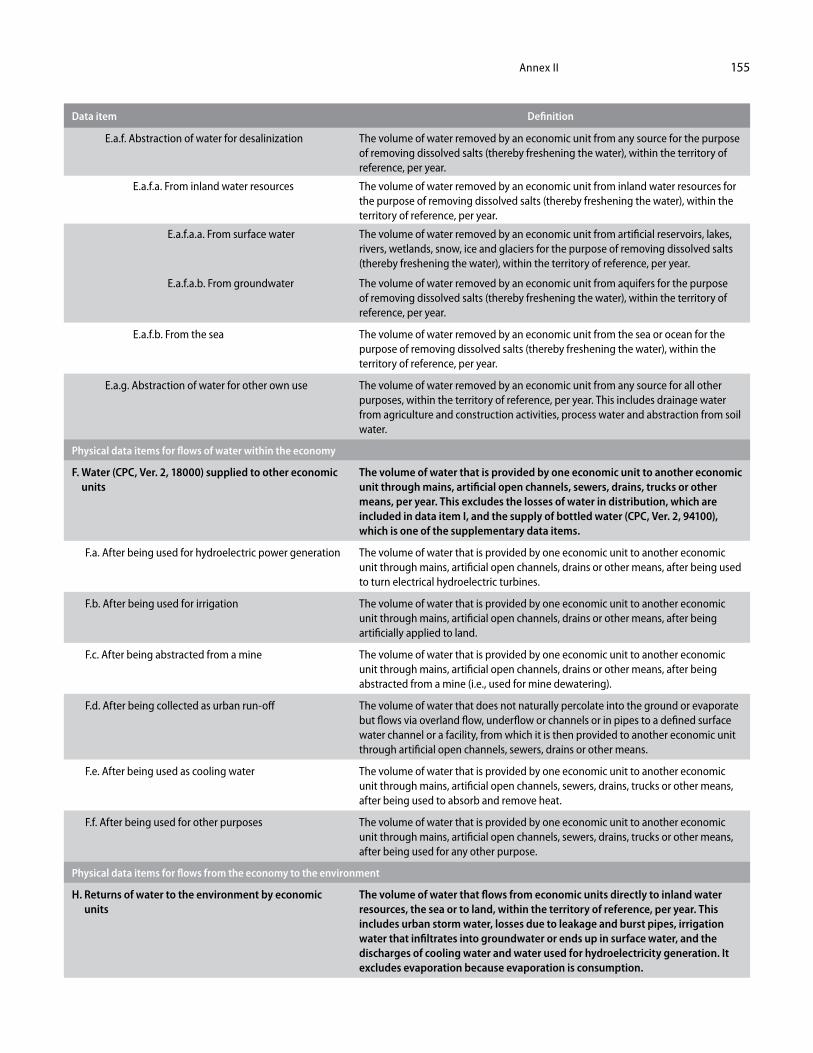
Annex II 155
Data item Definition
E.a.f. Abstraction of water for desalinization The volume of water removed by an economic unit from any source for the purpose of removing dissolved salts (thereby freshening the water), within the territory of reference, per year.
E.a.f.a. From inland water resources The volume of water removed by an economic unit from inland water resources for the purpose of removing dissolved salts (thereby freshening the water), within the territory of reference, per year.
E.a.f.a.a. From surface water The volume of water removed by an economic unit from artificial reservoirs, lakes, rivers, wetlands, snow, ice and glaciers for the purpose of removing dissolved salts (thereby freshening the water), within the territory of reference, per year.
E.a.f.a.b. From groundwater The volume of water removed by an economic unit from aquifers for the purpose of removing dissolved salts (thereby freshening the water), within the territory of reference, per year.
E.a.f.b. From the sea The volume of water removed by an economic unit from the sea or ocean for the purpose of removing dissolved salts (thereby freshening the water), within the territory of reference, per year.
E.a.g. Abstraction of water for other own use The volume of water removed by an economic unit from any source for all other purposes, within the territory of reference, per year. This includes drainage water from agriculture and construction activities, process water and abstraction from soil water.
Physical data items for flows of water within the economy
F. Water (CPC, Ver. 2, 18000) supplied to other economic units
The volume of water that is provided by one economic unit to another economic unit through mains, artificial open channels, sewers, drains, trucks or other means, per year. This excludes the losses of water in distribution, which are included in data item I, and the supply of bottled water (CPC, Ver. 2, 94100), which is one of the supplementary data items.
F.a. After being used for hydroelectric power generation The volume of water that is provided by one economic unit to another economic unit through mains, artificial open channels, drains or other means, after being used to turn electrical hydroelectric turbines.
F.b. After being used for irrigation The volume of water that is provided by one economic unit to another economic unit through mains, artificial open channels, drains or other means, after being artificially applied to land.
F.c. After being abstracted from a mine The volume of water that is provided by one economic unit to another economic unit through mains, artificial open channels, drains or other means, after being abstracted from a mine (i.e., used for mine dewatering).
F.d. After being collected as urban run-off The volume of water that does not naturally percolate into the ground or evaporate but flows via overland flow, underflow or channels or in pipes to a defined surface water channel or a facility, from which it is then provided to another economic unit through artificial open channels, sewers, drains or other means.
F.e. After being used as cooling water The volume of water that is provided by one economic unit to another economic unit through mains, artificial open channels, sewers, drains, trucks or other means, after being used to absorb and remove heat.
F.f. After being used for other purposes The volume of water that is provided by one economic unit to another economic unit through mains, artificial open channels, sewers, drains, trucks or other means, after being used for any other purpose.
Physical data items for flows from the economy to the environment
H. Returns of water to the environment by economic units
The volume of water that flows from economic units directly to inland water resources, the sea or to land, within the territory of reference, per year. This includes urban storm water, losses due to leakage and burst pipes, irrigation water that infiltrates into groundwater or ends up in surface water, and the discharges of cooling water and water used for hydroelectricity generation. It excludes evaporation because evaporation is consumption.
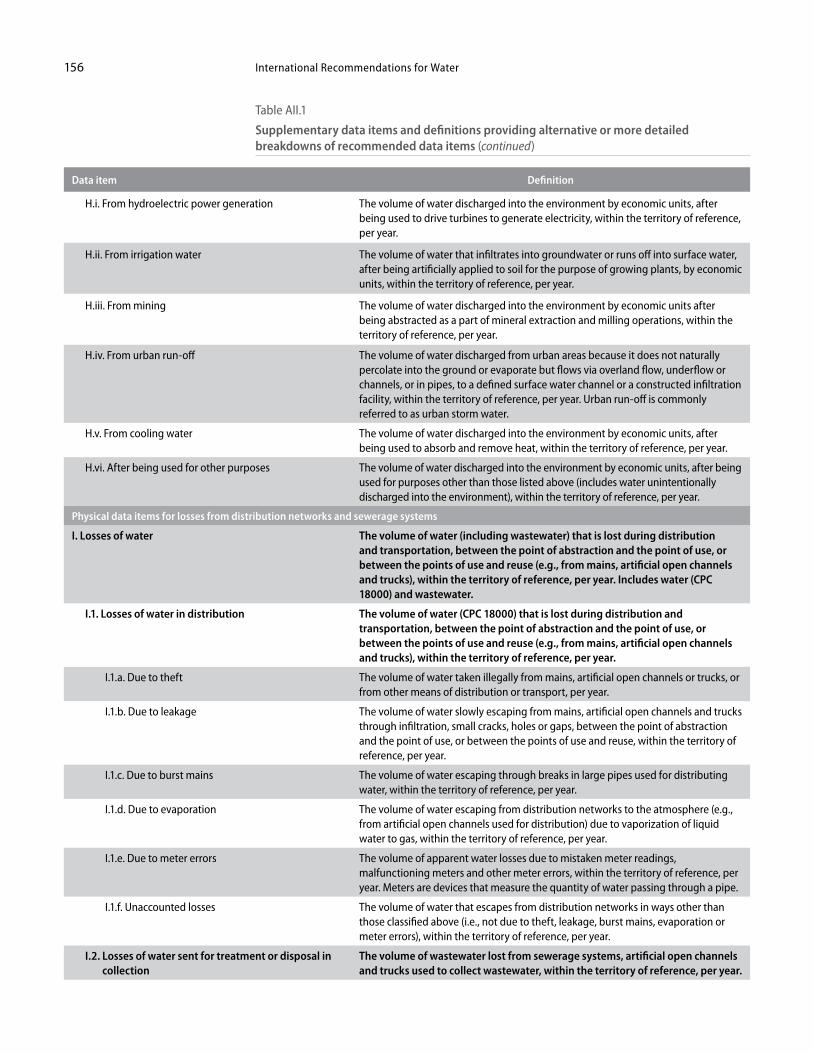
International Recommendations for Water156
Data item Definition
H.i. From hydroelectric power generation The volume of water discharged into the environment by economic units, after being used to drive turbines to generate electricity, within the territory of reference, per year.
H.ii. From irrigation water The volume of water that infiltrates into groundwater or runs off into surface water, after being artificially applied to soil for the purpose of growing plants, by economic units, within the territory of reference, per year.
H.iii. From mining The volume of water discharged into the environment by economic units after being abstracted as a part of mineral extraction and milling operations, within the territory of reference, per year.
H.iv. From urban run-off The volume of water discharged from urban areas because it does not naturally percolate into the ground or evaporate but flows via overland flow, underflow or channels, or in pipes, to a defined surface water channel or a constructed infiltration facility, within the territory of reference, per year. Urban run-off is commonly referred to as urban storm water.
H.v. From cooling water The volume of water discharged into the environment by economic units, after being used to absorb and remove heat, within the territory of reference, per year.
H.vi. After being used for other purposes The volume of water discharged into the environment by economic units, after being used for purposes other than those listed above (includes water unintentionally discharged into the environment), within the territory of reference, per year.
Physical data items for losses from distribution networks and sewerage systems
I. Losses of water The volume of water (including wastewater) that is lost during distribution and transportation, between the point of abstraction and the point of use, or between the points of use and reuse (e.g., from mains, artificial open channels and trucks), within the territory of reference, per year. Includes water (CPC 18000) and wastewater.
I.1. Losses of water in distribution The volume of water (CPC 18000) that is lost during distribution and transportation, between the point of abstraction and the point of use, or between the points of use and reuse (e.g., from mains, artificial open channels and trucks), within the territory of reference, per year.
I.1.a. Due to theft The volume of water taken illegally from mains, artificial open channels or trucks, or from other means of distribution or transport, per year.
I.1.b. Due to leakage The volume of water slowly escaping from mains, artificial open channels and trucks through infiltration, small cracks, holes or gaps, between the point of abstraction and the point of use, or between the points of use and reuse, within the territory of reference, per year.
I.1.c. Due to burst mains The volume of water escaping through breaks in large pipes used for distributing water, within the territory of reference, per year.
I.1.d. Due to evaporation The volume of water escaping from distribution networks to the atmosphere (e.g., from artificial open channels used for distribution) due to vaporization of liquid water to gas, within the territory of reference, per year.
I.1.e. Due to meter errors The volume of apparent water losses due to mistaken meter readings, malfunctioning meters and other meter errors, within the territory of reference, per year. Meters are devices that measure the quantity of water passing through a pipe.
I.1.f. Unaccounted losses The volume of water that escapes from distribution networks in ways other than those classified above (i.e., not due to theft, leakage, burst mains, evaporation or meter errors), within the territory of reference, per year.
I.2. Losses of water sent for treatment or disposal in collection
The volume of wastewater lost from sewerage systems, artificial open channels and trucks used to collect wastewater, within the territory of reference, per year.
Table AII.1
Supplementary data items and definitions providing alternative or more detailed breakdowns of recommended data items (continued)
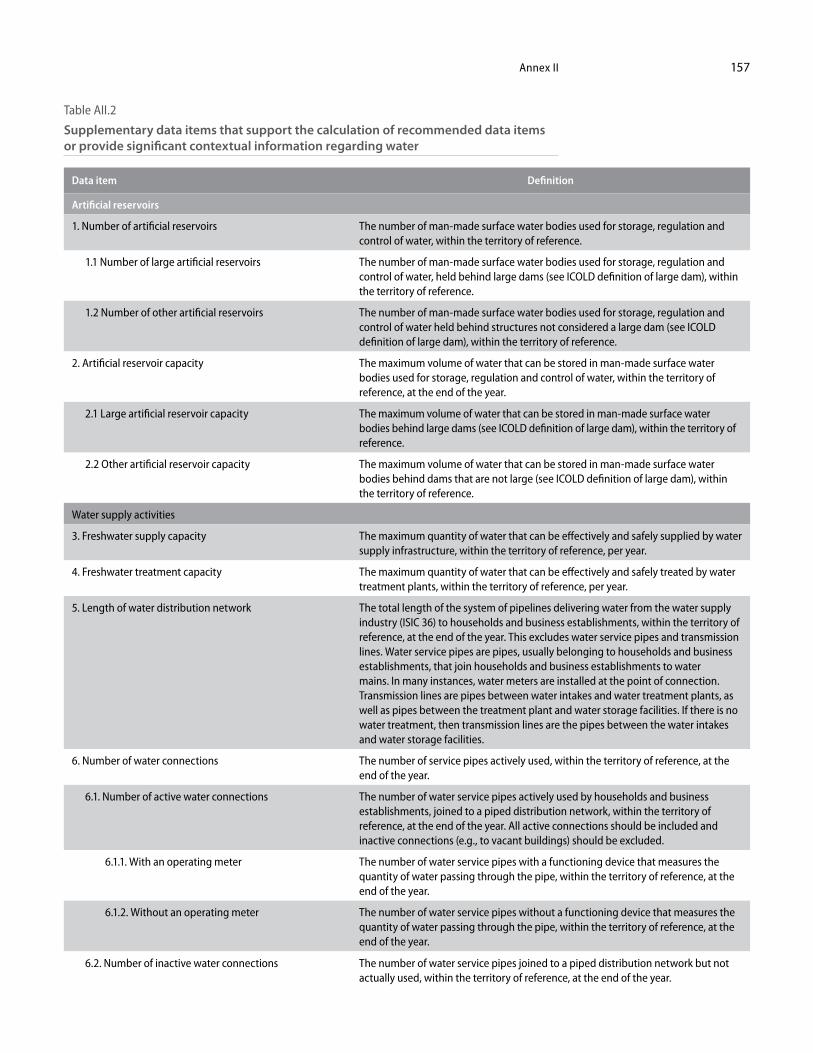
Annex II 157
Table AII.2
Supplementary data items that support the calculation of recommended data items or provide significant contextual information regarding water
Data item Definition
Artificial reservoirs
1. Number of artificial reservoirs The number of man-made surface water bodies used for storage, regulation and control of water, within the territory of reference.
1.1 Number of large artificial reservoirs The number of man-made surface water bodies used for storage, regulation and control of water, held behind large dams (see ICOLD definition of large dam), within the territory of reference.
1.2 Number of other artificial reservoirs The number of man-made surface water bodies used for storage, regulation and control of water held behind structures not considered a large dam (see ICOLD definition of large dam), within the territory of reference.
2. Artificial reservoir capacity The maximum volume of water that can be stored in man-made surface water bodies used for storage, regulation and control of water, within the territory of reference, at the end of the year.
2.1 Large artificial reservoir capacity The maximum volume of water that can be stored in man-made surface water bodies behind large dams (see ICOLD definition of large dam), within the territory of reference.
2.2 Other artificial reservoir capacity The maximum volume of water that can be stored in man-made surface water bodies behind dams that are not large (see ICOLD definition of large dam), within the territory of reference.
Water supply activities
3. Freshwater supply capacity The maximum quantity of water that can be effectively and safely supplied by water supply infrastructure, within the territory of reference, per year.
4. Freshwater treatment capacity The maximum quantity of water that can be effectively and safely treated by water treatment plants, within the territory of reference, per year.
5. Length of water distribution network The total length of the system of pipelines delivering water from the water supply industry (ISIC 36) to households and business establishments, within the territory of reference, at the end of the year. This excludes water service pipes and transmission lines. Water service pipes are pipes, usually belonging to households and business establishments, that join households and business establishments to water mains. In many instances, water meters are installed at the point of connection. Transmission lines are pipes between water intakes and water treatment plants, as well as pipes between the treatment plant and water storage facilities. If there is no water treatment, then transmission lines are the pipes between the water intakes and water storage facilities.
6. Number of water connections The number of service pipes actively used, within the territory of reference, at the end of the year.
6.1. Number of active water connections The number of water service pipes actively used by households and business establishments, joined to a piped distribution network, within the territory of reference, at the end of the year. All active connections should be included and inactive connections (e.g., to vacant buildings) should be excluded.
6.1.1. With an operating meter The number of water service pipes with a functioning device that measures the quantity of water passing through the pipe, within the territory of reference, at the end of the year.
6.1.2. Without an operating meter The number of water service pipes without a functioning device that measures the quantity of water passing through the pipe, within the territory of reference, at the end of the year.
6.2. Number of inactive water connections The number of water service pipes joined to a piped distribution network but not actually used, within the territory of reference, at the end of the year.
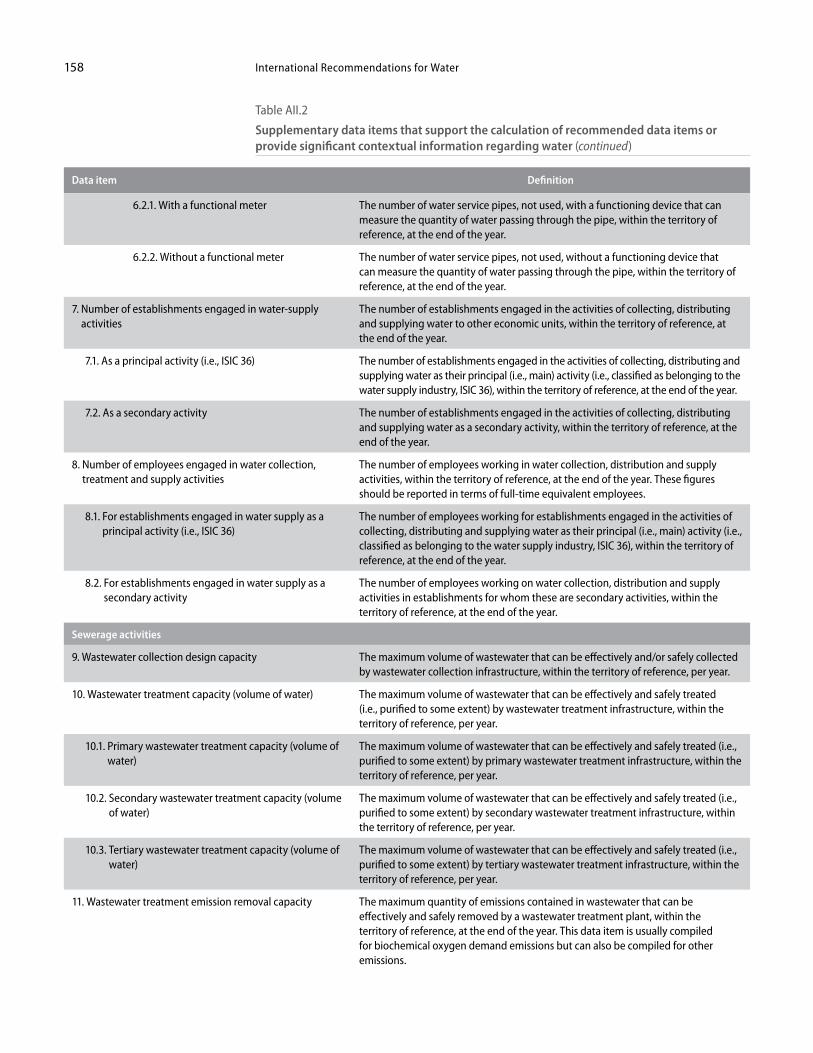
International Recommendations for Water158
Data item Definition
6.2.1. With a functional meter The number of water service pipes, not used, with a functioning device that can measure the quantity of water passing through the pipe, within the territory of reference, at the end of the year.
6.2.2. Without a functional meter The number of water service pipes, not used, without a functioning device that can measure the quantity of water passing through the pipe, within the territory of reference, at the end of the year.
7. Number of establishments engaged in water-supply activities
The number of establishments engaged in the activities of collecting, distributing and supplying water to other economic units, within the territory of reference, at the end of the year.
7.1. As a principal activity (i.e., ISIC 36) The number of establishments engaged in the activities of collecting, distributing and supplying water as their principal (i.e., main) activity (i.e., classified as belonging to the water supply industry, ISIC 36), within the territory of reference, at the end of the year.
7.2. As a secondary activity The number of establishments engaged in the activities of collecting, distributing and supplying water as a secondary activity, within the territory of reference, at the end of the year.
8. Number of employees engaged in water collection, treatment and supply activities
The number of employees working in water collection, distribution and supply activities, within the territory of reference, at the end of the year. These figures should be reported in terms of full-time equivalent employees.
8.1. For establishments engaged in water supply as a principal activity (i.e., ISIC 36)
The number of employees working for establishments engaged in the activities of collecting, distributing and supplying water as their principal (i.e., main) activity (i.e., classified as belonging to the water supply industry, ISIC 36), within the territory of reference, at the end of the year.
8.2. For establishments engaged in water supply as a secondary activity
The number of employees working on water collection, distribution and supply activities in establishments for whom these are secondary activities, within the territory of reference, at the end of the year.
Sewerage activities
9. Wastewater collection design capacity The maximum volume of wastewater that can be effectively and/or safely collected by wastewater collection infrastructure, within the territory of reference, per year.
10. Wastewater treatment capacity (volume of water) The maximum volume of wastewater that can be effectively and safely treated (i.e., purified to some extent) by wastewater treatment infrastructure, within the territory of reference, per year.
10.1. Primary wastewater treatment capacity (volume of water)
The maximum volume of wastewater that can be effectively and safely treated (i.e., purified to some extent) by primary wastewater treatment infrastructure, within the territory of reference, per year.
10.2. Secondary wastewater treatment capacity (volume of water)
The maximum volume of wastewater that can be effectively and safely treated (i.e., purified to some extent) by secondary wastewater treatment infrastructure, within the territory of reference, per year.
10.3. Tertiary wastewater treatment capacity (volume of water)
The maximum volume of wastewater that can be effectively and safely treated (i.e., purified to some extent) by tertiary wastewater treatment infrastructure, within the territory of reference, per year.
11. Wastewater treatment emission removal capacity The maximum quantity of emissions contained in wastewater that can be effectively and safely removed by a wastewater treatment plant, within the territory of reference, at the end of the year. This data item is usually compiled for biochemical oxygen demand emissions but can also be compiled for other emissions.
Table AII.2
Supplementary data items that support the calculation of recommended data items or provide significant contextual information regarding water (continued)
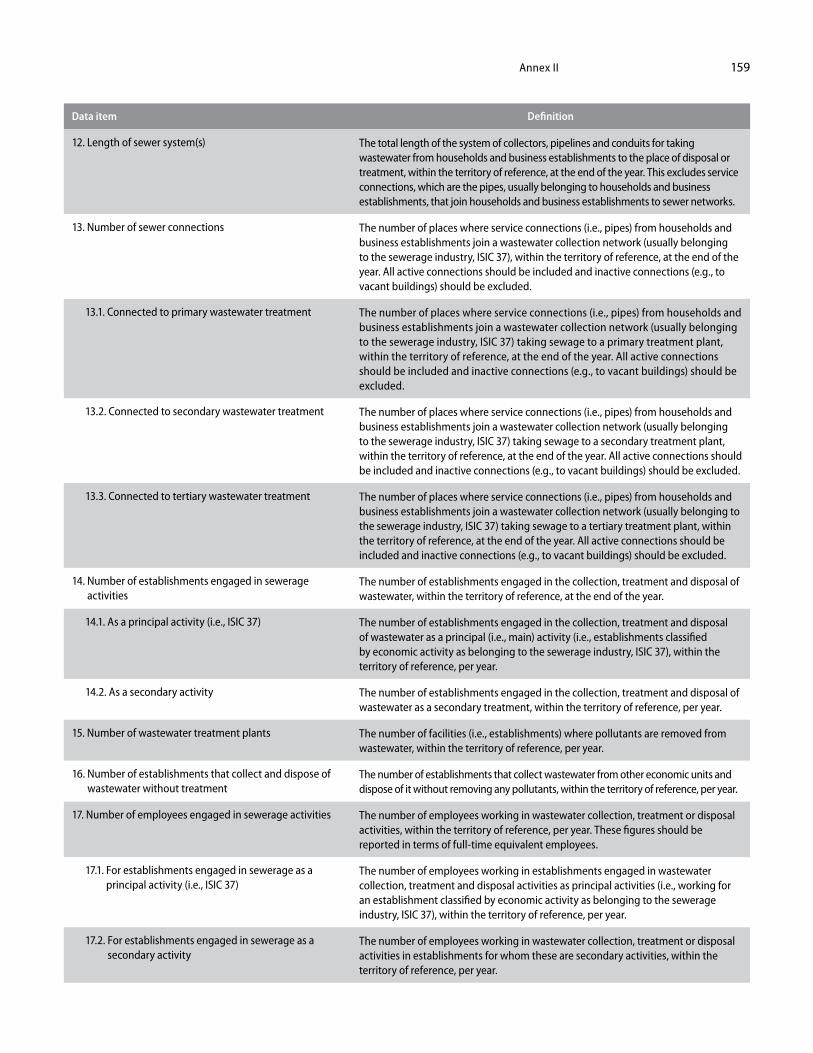
Annex II 159
Data item Definition
12. Length of sewer system(s) The total length of the system of collectors, pipelines and conduits for taking wastewater from households and business establishments to the place of disposal or treatment, within the territory of reference, at the end of the year. This excludes service connections, which are the pipes, usually belonging to households and business establishments, that join households and business establishments to sewer networks.
13. Number of sewer connections The number of places where service connections (i.e., pipes) from households and business establishments join a wastewater collection network (usually belonging to the sewerage industry, ISIC 37), within the territory of reference, at the end of the year. All active connections should be included and inactive connections (e.g., to vacant buildings) should be excluded.
13.1. Connected to primary wastewater treatment The number of places where service connections (i.e., pipes) from households and business establishments join a wastewater collection network (usually belonging to the sewerage industry, ISIC 37) taking sewage to a primary treatment plant, within the territory of reference, at the end of the year. All active connections should be included and inactive connections (e.g., to vacant buildings) should be excluded.
13.2. Connected to secondary wastewater treatment The number of places where service connections (i.e., pipes) from households and business establishments join a wastewater collection network (usually belonging to the sewerage industry, ISIC 37) taking sewage to a secondary treatment plant, within the territory of reference, at the end of the year. All active connections should be included and inactive connections (e.g., to vacant buildings) should be excluded.
13.3. Connected to tertiary wastewater treatment The number of places where service connections (i.e., pipes) from households and business establishments join a wastewater collection network (usually belonging to the sewerage industry, ISIC 37) taking sewage to a tertiary treatment plant, within the territory of reference, at the end of the year. All active connections should be included and inactive connections (e.g., to vacant buildings) should be excluded.
14. Number of establishments engaged in sewerage activities
The number of establishments engaged in the collection, treatment and disposal of wastewater, within the territory of reference, at the end of the year.
14.1. As a principal activity (i.e., ISIC 37) The number of establishments engaged in the collection, treatment and disposal of wastewater as a principal (i.e., main) activity (i.e., establishments classified by economic activity as belonging to the sewerage industry, ISIC 37), within the territory of reference, per year.
14.2. As a secondary activity The number of establishments engaged in the collection, treatment and disposal of wastewater as a secondary treatment, within the territory of reference, per year.
15. Number of wastewater treatment plants The number of facilities (i.e., establishments) where pollutants are removed from wastewater, within the territory of reference, per year.
16. Number of establishments that collect and dispose of wastewater without treatment
The number of establishments that collect wastewater from other economic units and dispose of it without removing any pollutants, within the territory of reference, per year.
17. Number of employees engaged in sewerage activities The number of employees working in wastewater collection, treatment or disposal activities, within the territory of reference, per year. These figures should be reported in terms of full-time equivalent employees.
17.1. For establishments engaged in sewerage as a principal activity (i.e., ISIC 37)
The number of employees working in establishments engaged in wastewater collection, treatment and disposal activities as principal activities (i.e., working for an establishment classified by economic activity as belonging to the sewerage industry, ISIC 37), within the territory of reference, per year.
17.2. For establishments engaged in sewerage as a secondary activity
The number of employees working in wastewater collection, treatment or disposal activities in establishments for whom these are secondary activities, within the territory of reference, per year.
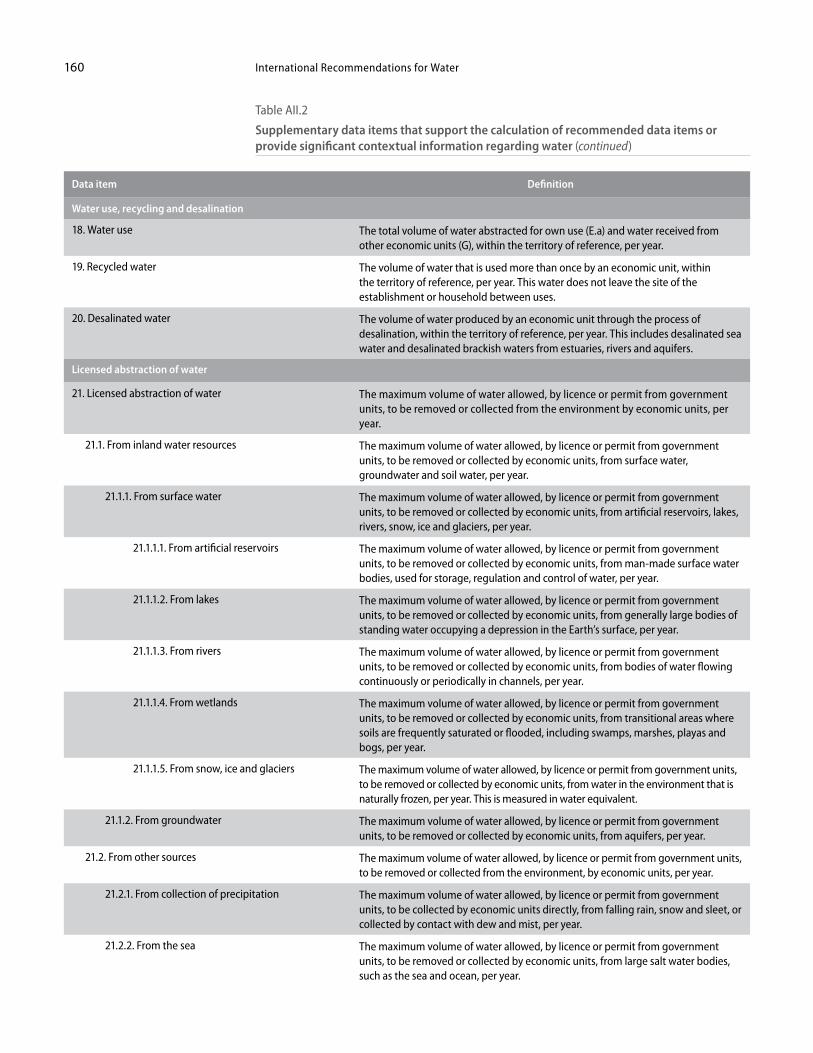
International Recommendations for Water160
Data item Definition
Water use, recycling and desalination
18. Water use The total volume of water abstracted for own use (E.a) and water received from other economic units (G), within the territory of reference, per year.
19. Recycled water The volume of water that is used more than once by an economic unit, within the territory of reference, per year. This water does not leave the site of the establishment or household between uses.
20. Desalinated water The volume of water produced by an economic unit through the process of desalination, within the territory of reference, per year. This includes desalinated sea water and desalinated brackish waters from estuaries, rivers and aquifers.
Licensed abstraction of water
21. Licensed abstraction of water The maximum volume of water allowed, by licence or permit from government units, to be removed or collected from the environment by economic units, per year.
21.1. From inland water resources The maximum volume of water allowed, by licence or permit from government units, to be removed or collected by economic units, from surface water, groundwater and soil water, per year.
21.1.1. From surface water The maximum volume of water allowed, by licence or permit from government units, to be removed or collected by economic units, from artificial reservoirs, lakes, rivers, snow, ice and glaciers, per year.
21.1.1.1. From artificial reservoirs The maximum volume of water allowed, by licence or permit from government units, to be removed or collected by economic units, from man-made surface water bodies, used for storage, regulation and control of water, per year.
21.1.1.2. From lakes The maximum volume of water allowed, by licence or permit from government units, to be removed or collected by economic units, from generally large bodies of standing water occupying a depression in the Earth’s surface, per year.
21.1.1.3. From rivers The maximum volume of water allowed, by licence or permit from government units, to be removed or collected by economic units, from bodies of water flowing continuously or periodically in channels, per year.
21.1.1.4. From wetlands The maximum volume of water allowed, by licence or permit from government units, to be removed or collected by economic units, from transitional areas where soils are frequently saturated or flooded, including swamps, marshes, playas and bogs, per year.
21.1.1.5. From snow, ice and glaciers The maximum volume of water allowed, by licence or permit from government units, to be removed or collected by economic units, from water in the environment that is naturally frozen, per year. This is measured in water equivalent.
21.1.2. From groundwater The maximum volume of water allowed, by licence or permit from government units, to be removed or collected by economic units, from aquifers, per year.
21.2. From other sources The maximum volume of water allowed, by licence or permit from government units, to be removed or collected from the environment, by economic units, per year.
21.2.1. From collection of precipitation The maximum volume of water allowed, by licence or permit from government units, to be collected by economic units directly, from falling rain, snow and sleet, or collected by contact with dew and mist, per year.
21.2.2. From the sea The maximum volume of water allowed, by licence or permit from government units, to be removed or collected by economic units, from large salt water bodies, such as the sea and ocean, per year.
Table AII.2
Supplementary data items that support the calculation of recommended data items or provide significant contextual information regarding water (continued)
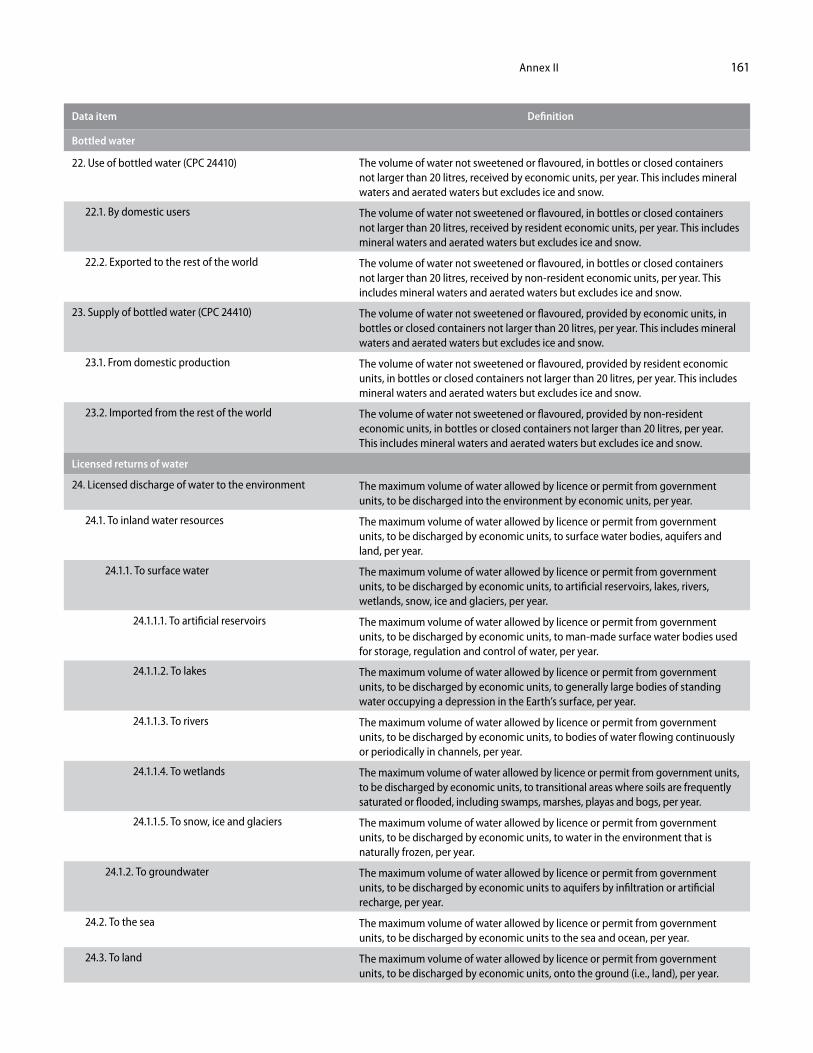
Annex II 161
Data item Definition
Bottled water
22. Use of bottled water (CPC 24410) The volume of water not sweetened or flavoured, in bottles or closed containers not larger than 20 litres, received by economic units, per year. This includes mineral waters and aerated waters but excludes ice and snow.
22.1. By domestic users The volume of water not sweetened or flavoured, in bottles or closed containers not larger than 20 litres, received by resident economic units, per year. This includes mineral waters and aerated waters but excludes ice and snow.
22.2. Exported to the rest of the world The volume of water not sweetened or flavoured, in bottles or closed containers not larger than 20 litres, received by non-resident economic units, per year. This includes mineral waters and aerated waters but excludes ice and snow.
23. Supply of bottled water (CPC 24410) The volume of water not sweetened or flavoured, provided by economic units, in bottles or closed containers not larger than 20 litres, per year. This includes mineral waters and aerated waters but excludes ice and snow.
23.1. From domestic production The volume of water not sweetened or flavoured, provided by resident economic units, in bottles or closed containers not larger than 20 litres, per year. This includes mineral waters and aerated waters but excludes ice and snow.
23.2. Imported from the rest of the world The volume of water not sweetened or flavoured, provided by non-resident economic units, in bottles or closed containers not larger than 20 litres, per year. This includes mineral waters and aerated waters but excludes ice and snow.
Licensed returns of water
24. Licensed discharge of water to the environment The maximum volume of water allowed by licence or permit from government units, to be discharged into the environment by economic units, per year.
24.1. To inland water resources The maximum volume of water allowed by licence or permit from government units, to be discharged by economic units, to surface water bodies, aquifers and land, per year.
24.1.1. To surface water The maximum volume of water allowed by licence or permit from government units, to be discharged by economic units, to artificial reservoirs, lakes, rivers, wetlands, snow, ice and glaciers, per year.
24.1.1.1. To artificial reservoirs The maximum volume of water allowed by licence or permit from government units, to be discharged by economic units, to man-made surface water bodies used for storage, regulation and control of water, per year.
24.1.1.2. To lakes The maximum volume of water allowed by licence or permit from government units, to be discharged by economic units, to generally large bodies of standing water occupying a depression in the Earth’s surface, per year.
24.1.1.3. To rivers The maximum volume of water allowed by licence or permit from government units, to be discharged by economic units, to bodies of water flowing continuously or periodically in channels, per year.
24.1.1.4. To wetlands The maximum volume of water allowed by licence or permit from government units, to be discharged by economic units, to transitional areas where soils are frequently saturated or flooded, including swamps, marshes, playas and bogs, per year.
24.1.1.5. To snow, ice and glaciers The maximum volume of water allowed by licence or permit from government units, to be discharged by economic units, to water in the environment that is naturally frozen, per year.
24.1.2. To groundwater The maximum volume of water allowed by licence or permit from government units, to be discharged by economic units to aquifers by infiltration or artificial recharge, per year.
24.2. To the sea The maximum volume of water allowed by licence or permit from government units, to be discharged by economic units to the sea and ocean, per year.
24.3. To land The maximum volume of water allowed by licence or permit from government units, to be discharged by economic units, onto the ground (i.e., land), per year.
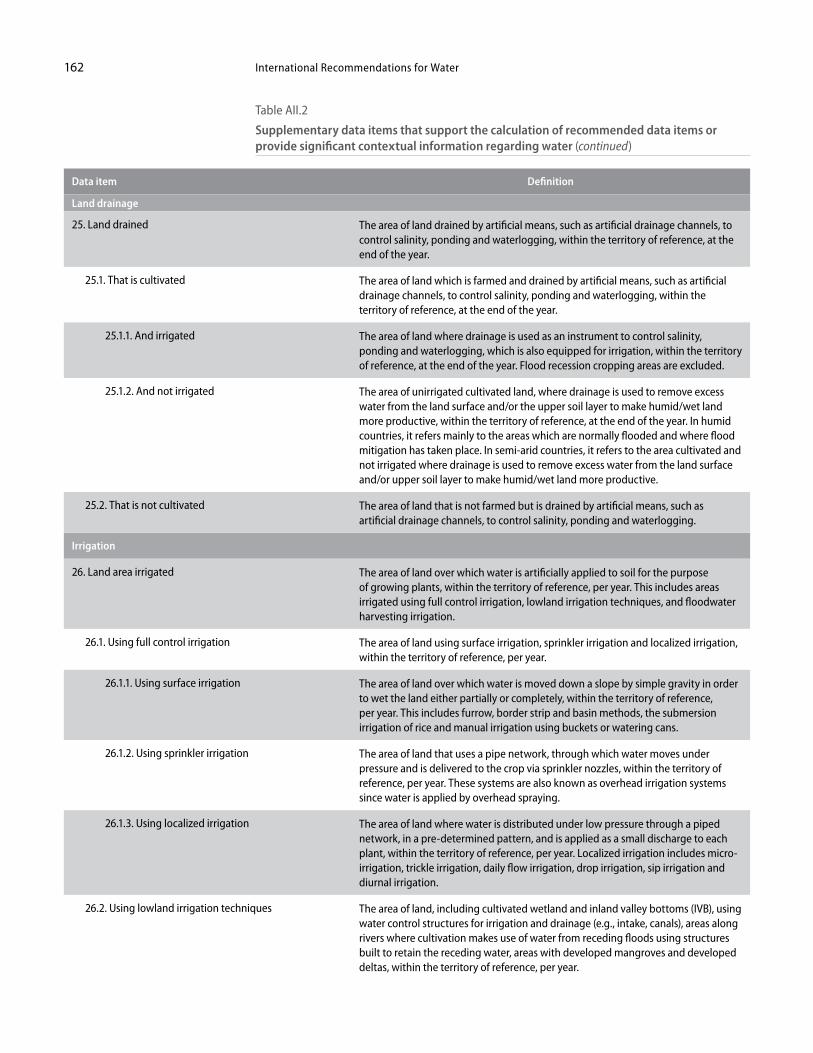
International Recommendations for Water162
Data item Definition
Land drainage
25. Land drained The area of land drained by artificial means, such as artificial drainage channels, to control salinity, ponding and waterlogging, within the territory of reference, at the end of the year.
25.1. That is cultivated The area of land which is farmed and drained by artificial means, such as artificial drainage channels, to control salinity, ponding and waterlogging, within the territory of reference, at the end of the year.
25.1.1. And irrigated The area of land where drainage is used as an instrument to control salinity, ponding and waterlogging, which is also equipped for irrigation, within the territory of reference, at the end of the year. Flood recession cropping areas are excluded.
25.1.2. And not irrigated The area of unirrigated cultivated land, where drainage is used to remove excess water from the land surface and/or the upper soil layer to make humid/wet land more productive, within the territory of reference, at the end of the year. In humid countries, it refers mainly to the areas which are normally flooded and where flood mitigation has taken place. In semi-arid countries, it refers to the area cultivated and not irrigated where drainage is used to remove excess water from the land surface and/or upper soil layer to make humid/wet land more productive.
25.2. That is not cultivated The area of land that is not farmed but is drained by artificial means, such as artificial drainage channels, to control salinity, ponding and waterlogging.
Irrigation
26. Land area irrigated The area of land over which water is artificially applied to soil for the purpose of growing plants, within the territory of reference, per year. This includes areas irrigated using full control irrigation, lowland irrigation techniques, and floodwater harvesting irrigation.
26.1. Using full control irrigation The area of land using surface irrigation, sprinkler irrigation and localized irrigation, within the territory of reference, per year.
26.1.1. Using surface irrigation The area of land over which water is moved down a slope by simple gravity in order to wet the land either partially or completely, within the territory of reference, per year. This includes furrow, border strip and basin methods, the submersion irrigation of rice and manual irrigation using buckets or watering cans.
26.1.2. Using sprinkler irrigation The area of land that uses a pipe network, through which water moves under pressure and is delivered to the crop via sprinkler nozzles, within the territory of reference, per year. These systems are also known as overhead irrigation systems since water is applied by overhead spraying.
26.1.3. Using localized irrigation The area of land where water is distributed under low pressure through a piped network, in a pre-determined pattern, and is applied as a small discharge to each plant, within the territory of reference, per year. Localized irrigation includes micro-irrigation, trickle irrigation, daily flow irrigation, drop irrigation, sip irrigation and diurnal irrigation.
26.2. Using lowland irrigation techniques The area of land, including cultivated wetland and inland valley bottoms (IVB), using water control structures for irrigation and drainage (e.g., intake, canals), areas along rivers where cultivation makes use of water from receding floods using structures built to retain the receding water, areas with developed mangroves and developed deltas, within the territory of reference, per year.
Table AII.2
Supplementary data items that support the calculation of recommended data items or provide significant contextual information regarding water (continued)
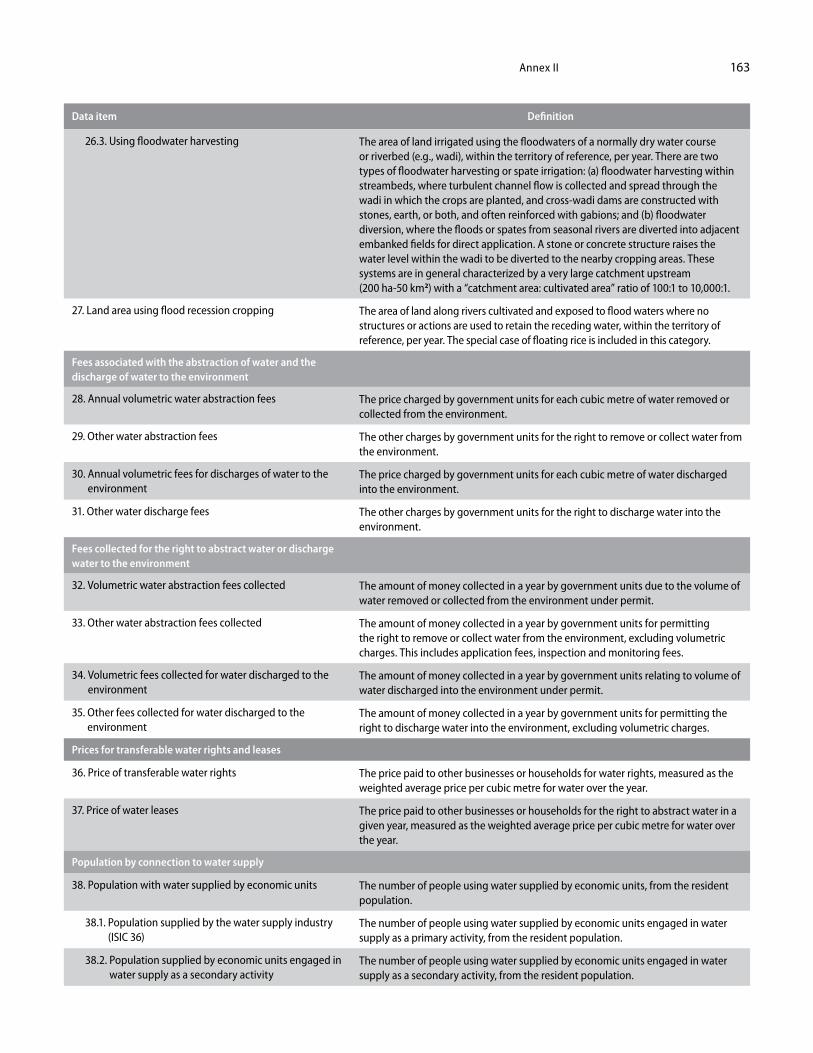
Annex II 163
Data item Definition
26.3. Using floodwater harvesting The area of land irrigated using the floodwaters of a normally dry water course or riverbed (e.g., wadi), within the territory of reference, per year. There are two types of floodwater harvesting or spate irrigation: (a) floodwater harvesting within streambeds, where turbulent channel flow is collected and spread through the wadi in which the crops are planted, and cross-wadi dams are constructed with stones, earth, or both, and often reinforced with gabions; and (b) floodwater diversion, where the floods or spates from seasonal rivers are diverted into adjacent embanked fields for direct application. A stone or concrete structure raises the water level within the wadi to be diverted to the nearby cropping areas. These systems are in general characterized by a very large catchment upstream (200 ha-50 km2) with a “catchment area: cultivated area” ratio of 100:1 to 10,000:1.
27. Land area using flood recession cropping The area of land along rivers cultivated and exposed to flood waters where no structures or actions are used to retain the receding water, within the territory of reference, per year. The special case of floating rice is included in this category.
Fees associated with the abstraction of water and the discharge of water to the environment
28. Annual volumetric water abstraction fees The price charged by government units for each cubic metre of water removed or collected from the environment.
29. Other water abstraction fees The other charges by government units for the right to remove or collect water from the environment.
30. Annual volumetric fees for discharges of water to the environment
The price charged by government units for each cubic metre of water discharged into the environment.
31. Other water discharge fees The other charges by government units for the right to discharge water into the environment.
Fees collected for the right to abstract water or discharge water to the environment
32. Volumetric water abstraction fees collected The amount of money collected in a year by government units due to the volume of water removed or collected from the environment under permit.
33. Other water abstraction fees collected The amount of money collected in a year by government units for permitting the right to remove or collect water from the environment, excluding volumetric charges. This includes application fees, inspection and monitoring fees.
34. Volumetric fees collected for water discharged to the environment
The amount of money collected in a year by government units relating to volume of water discharged into the environment under permit.
35. Other fees collected for water discharged to the environment
The amount of money collected in a year by government units for permitting the right to discharge water into the environment, excluding volumetric charges.
Prices for transferable water rights and leases
36. Price of transferable water rights The price paid to other businesses or households for water rights, measured as the weighted average price per cubic metre for water over the year.
37. Price of water leases The price paid to other businesses or households for the right to abstract water in a given year, measured as the weighted average price per cubic metre for water over the year.
Population by connection to water supply
38. Population with water supplied by economic units The number of people using water supplied by economic units, from the resident population.
38.1. Population supplied by the water supply industry (ISIC 36)
The number of people using water supplied by economic units engaged in water supply as a primary activity, from the resident population.
38.2. Population supplied by economic units engaged in water supply as a secondary activity
The number of people using water supplied by economic units engaged in water supply as a secondary activity, from the resident population.
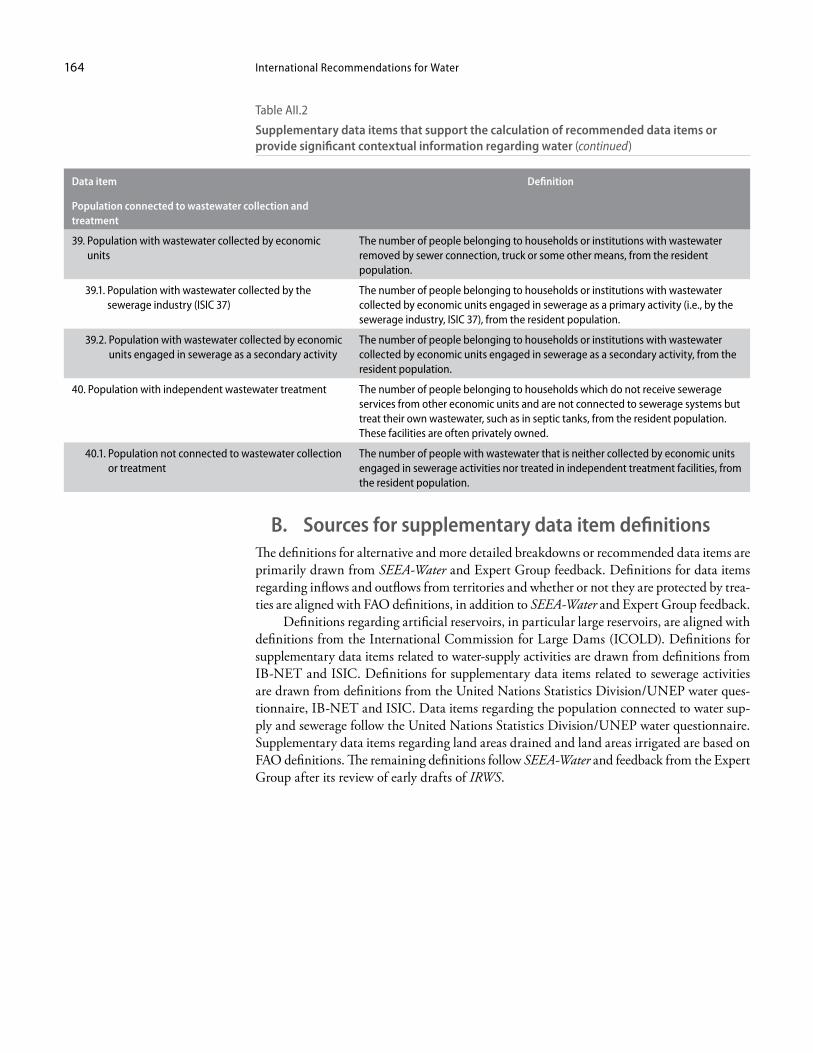
International Recommendations for Water164
Data item Definition
Population connected to wastewater collection and treatment
39. Population with wastewater collected by economic units
The number of people belonging to households or institutions with wastewater removed by sewer connection, truck or some other means, from the resident population.
39.1. Population with wastewater collected by the sewerage industry (ISIC 37)
The number of people belonging to households or institutions with wastewater collected by economic units engaged in sewerage as a primary activity (i.e., by the sewerage industry, ISIC 37), from the resident population.
39.2. Population with wastewater collected by economic units engaged in sewerage as a secondary activity
The number of people belonging to households or institutions with wastewater collected by economic units engaged in sewerage as a secondary activity, from the resident population.
40. Population with independent wastewater treatment The number of people belonging to households which do not receive sewerage services from other economic units and are not connected to sewerage systems but treat their own wastewater, such as in septic tanks, from the resident population. These facilities are often privately owned.
40.1. Population not connected to wastewater collection or treatment
The number of people with wastewater that is neither collected by economic units engaged in sewerage activities nor treated in independent treatment facilities, from the resident population.
Table AII.2
Supplementary data items that support the calculation of recommended data items or provide significant contextual information regarding water (continued)
B. Sources for supplementary data item definitionsThe definitions for alternative and more detailed breakdowns or recommended data items are primarily drawn from SEEA-Water and Expert Group feedback. Definitions for data items regarding inflows and outflows from territories and whether or not they are protected by trea-ties are aligned with FAO definitions, in addition to SEEA-Water and Expert Group feedback. Definitions regarding artificial reservoirs, in particular large reservoirs, are aligned with definitions from the International Commission for Large Dams (ICOLD). Definitions for supplementary data items related to water-supply activities are drawn from definitions from IB-NET and ISIC. Definitions for supplementary data items related to sewerage activities are drawn from definitions from the United Nations Statistics Division/UNEP water ques-tionnaire, IB-NET and ISIC. Data items regarding the population connected to water sup-ply and sewerage follow the United Nations Statistics Division/UNEP water questionnaire. Supplementary data items regarding land areas drained and land areas irrigated are based on FAO definitions. The remaining definitions follow SEEA-Water and feedback from the Expert Group after its review of early drafts of IRWS.
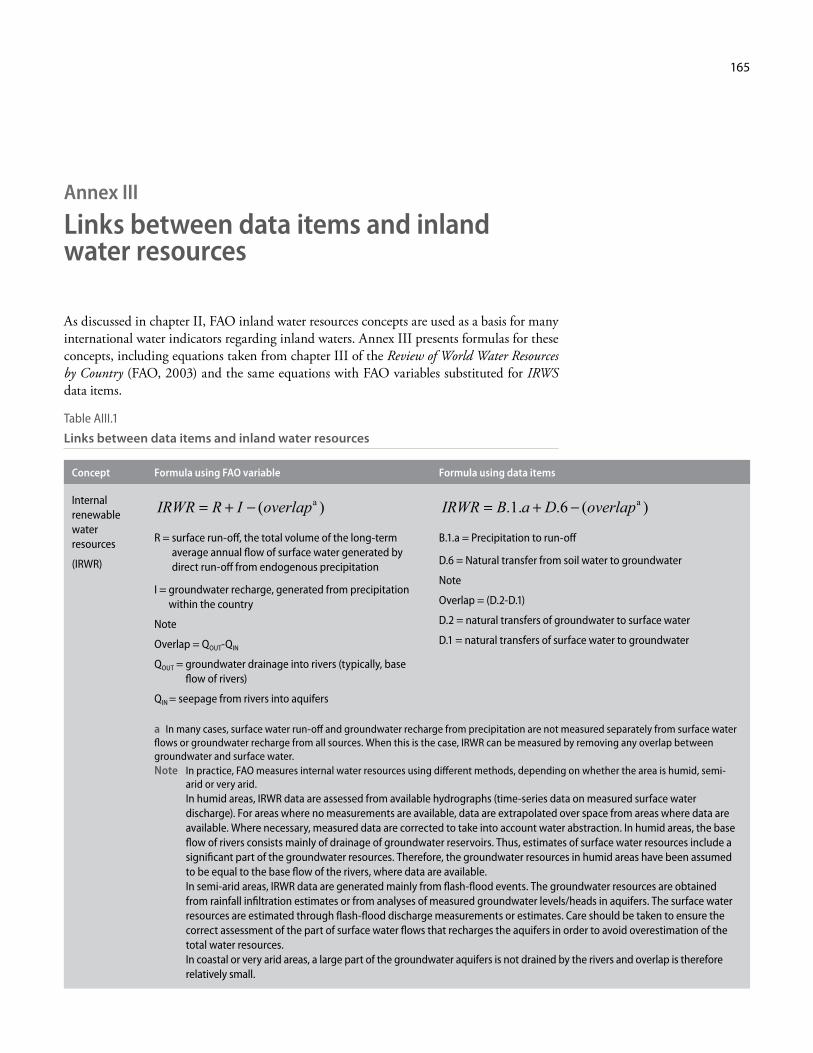
165
Annex III
Links between data items and inland water resources
As discussed in chapter II, FAO inland water resources concepts are used as a basis for many international water indicators regarding inland waters. Annex III presents formulas for these concepts, including equations taken from chapter III of the Review of World Water Resources by Country (FAO, 2003) and the same equations with FAO variables substituted for IRWS data items.
Table AIII.1
Links between data items and inland water resources
Concept Formula using FAO variable Formula using data items
Internal renewable water resources
(IRWR)
IRWR R I overlap= + − ( )a
R = surface run-off, the total volume of the long-term average annual flow of surface water generated by direct run-off from endogenous precipitation
I = groundwater recharge, generated from precipitation within the country
Note
Overlap = QOUT-QIN
QOUT = groundwater drainage into rivers (typically, base flow of rivers)
QIN = seepage from rivers into aquifers
IRWR B a D overlap= + −. . . ( )1 6 a
B.1.a = Precipitation to run-off
D.6 = Natural transfer from soil water to groundwater
Note
Overlap = (D.2-D.1)
D.2 = natural transfers of groundwater to surface water
D.1 = natural transfers of surface water to groundwater
a In many cases, surface water run-off and groundwater recharge from precipitation are not measured separately from surface water flows or groundwater recharge from all sources. When this is the case, IRWR can be measured by removing any overlap between groundwater and surface water.Note In practice, FAO measures internal water resources using different methods, depending on whether the area is humid, semi-
arid or very arid. In humid areas, IRWR data are assessed from available hydrographs (time-series data on measured surface water discharge). For areas where no measurements are available, data are extrapolated over space from areas where data are available. Where necessary, measured data are corrected to take into account water abstraction. In humid areas, the base flow of rivers consists mainly of drainage of groundwater reservoirs. Thus, estimates of surface water resources include a significant part of the groundwater resources. Therefore, the groundwater resources in humid areas have been assumed to be equal to the base flow of the rivers, where data are available. In semi-arid areas, IRWR data are generated mainly from flash-flood events. The groundwater resources are obtained from rainfall infiltration estimates or from analyses of measured groundwater levels/heads in aquifers. The surface water resources are estimated through flash-flood discharge measurements or estimates. Care should be taken to ensure the correct assessment of the part of surface water flows that recharges the aquifers in order to avoid overestimation of the total water resources. In coastal or very arid areas, a large part of the groundwater aquifers is not drained by the rivers and overlap is therefore relatively small.
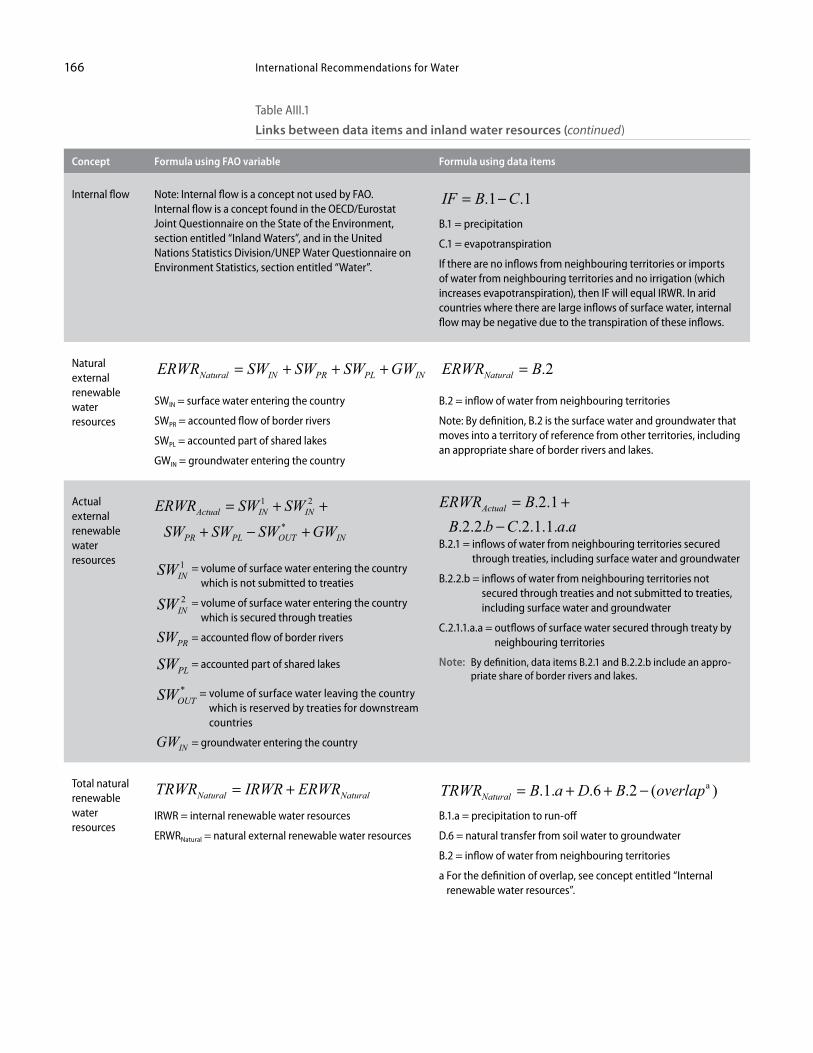
International Recommendations for Water166
Concept Formula using FAO variable Formula using data items
Internal flow Note: Internal flow is a concept not used by FAO. Internal flow is a concept found in the OECD/Eurostat Joint Questionnaire on the State of the Environment, section entitled “Inland Waters”, and in the United Nations Statistics Division/UNEP Water Questionnaire on Environment Statistics, section entitled “Water”.
IF B C= −. .1 1B.1 = precipitation
C.1 = evapotranspiration
If there are no inflows from neighbouring territories or imports of water from neighbouring territories and no irrigation (which increases evapotranspiration), then IF will equal IRWR. In arid countries where there are large inflows of surface water, internal flow may be negative due to the transpiration of these inflows.
Natural external renewable water resources
ERWR SW SW SW GWNatural IN PR PL IN= + + +
SWIN = surface water entering the country
SWPR = accounted flow of border rivers
SWPL = accounted part of shared lakes
GWIN = groundwater entering the country
ERWR BNatural = .2
B.2 = inflow of water from neighbouring territories
Note: By definition, B.2 is the surface water and groundwater that moves into a territory of reference from other territories, including an appropriate share of border rivers and lakes.
Actual external renewable water resources
ERWR SW SWSW SW SW GW
Actual IN IN
PR PL OUT IN
= + +
+ − +
1 2
*
SWIN1 = volume of surface water entering the country
which is not submitted to treaties
SWIN2 = volume of surface water entering the country
which is secured through treaties
SWPR = accounted flow of border rivers
SWPL = accounted part of shared lakes
SWOUT* = volume of surface water leaving the country
which is reserved by treaties for downstream countries
GWIN = groundwater entering the country
B.2.1 = inflows of water from neighbouring territories secured through treaties, including surface water and groundwater
B.2.2.b = inflows of water from neighbouring territories not secured through treaties and not submitted to treaties, including surface water and groundwater
C.2.1.1.a.a = outflows of surface water secured through treaty by neighbouring territories
Note: By definition, data items B.2.1 and B.2.2.b include an appro-priate share of border rivers and lakes.
Total natural renewable water resources
TRWR IRWR ERWRNatural Natural= +IRWR = internal renewable water resources
ERWRNatural = natural external renewable water resources
TRWR B a D B overlapNatural = + + −. . . . ( )1 6 2 a
B.1.a = precipitation to run-off
D.6 = natural transfer from soil water to groundwater
B.2 = inflow of water from neighbouring territories
a For the definition of overlap, see concept entitled “Internal renewable water resources”.
Table AIII.1
Links between data items and inland water resources (continued)
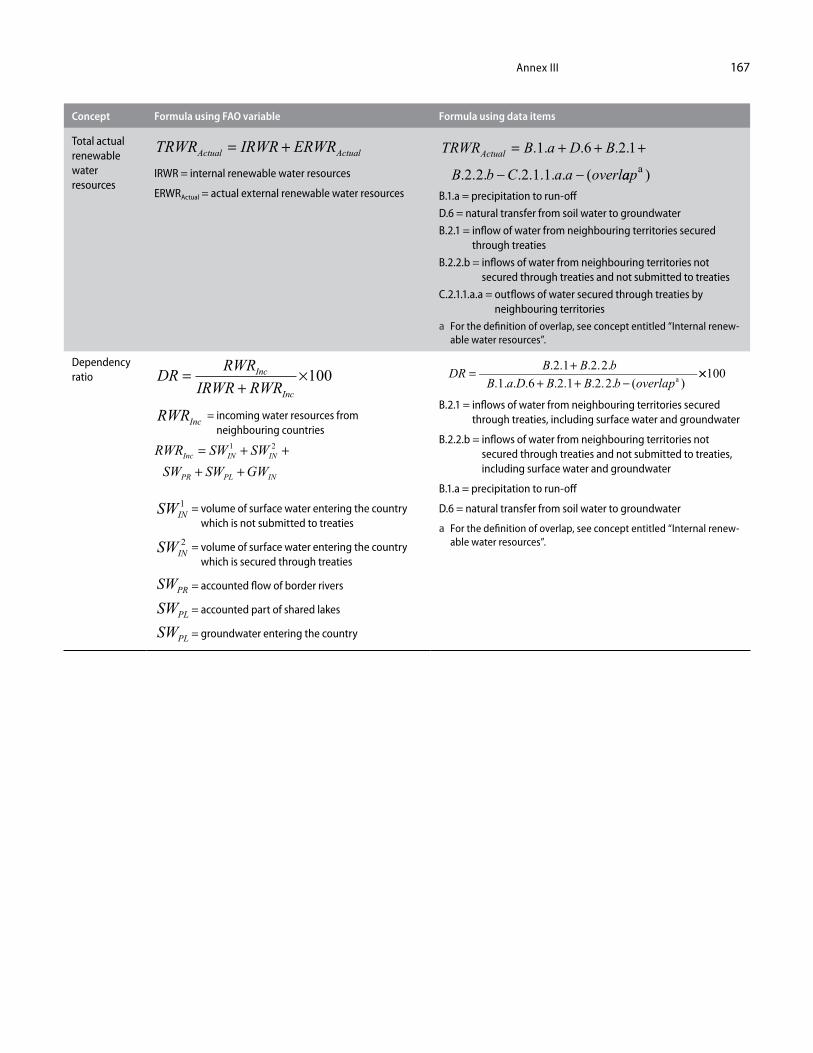
Annex III 167
Concept Formula using FAO variable Formula using data items
Total actual renewable water resources
TRWR IRWR ERWRActual Actual= +IRWR = internal renewable water resources
ERWRActual = actual external renewable water resources B.1.a = precipitation to run-off
D.6 = natural transfer from soil water to groundwater
B.2.1 = inflow of water from neighbouring territories secured through treaties
B.2.2.b = inflows of water from neighbouring territories not secured through treaties and not submitted to treaties
C.2.1.1.a.a = outflows of water secured through treaties by neighbouring territories
a For the definition of overlap, see concept entitled “Internal renew-able water resources”.
Dependency ratio DR RWR
IRWR RWRInc
Inc
=+
×100
RWRInc = incoming water resources from neighbouring countries
RWR SW SWSW SW GW
Inc IN IN
PR PL IN
= + ++ +
1 2
SWIN1 = volume of surface water entering the country
which is not submitted to treaties
SWIN2 = volume of surface water entering the country
which is secured through treaties
SWPR = accounted flow of border rivers
SWPL = accounted part of shared lakes
SWPL = groundwater entering the country
B.2.1 = inflows of water from neighbouring territories secured through treaties, including surface water and groundwater
B.2.2.b = inflows of water from neighbouring territories not secured through treaties and not submitted to treaties, including surface water and groundwater
B.1.a = precipitation to run-off
D.6 = natural transfer from soil water to groundwater
a For the definition of overlap, see concept entitled “Internal renew-able water resources”.

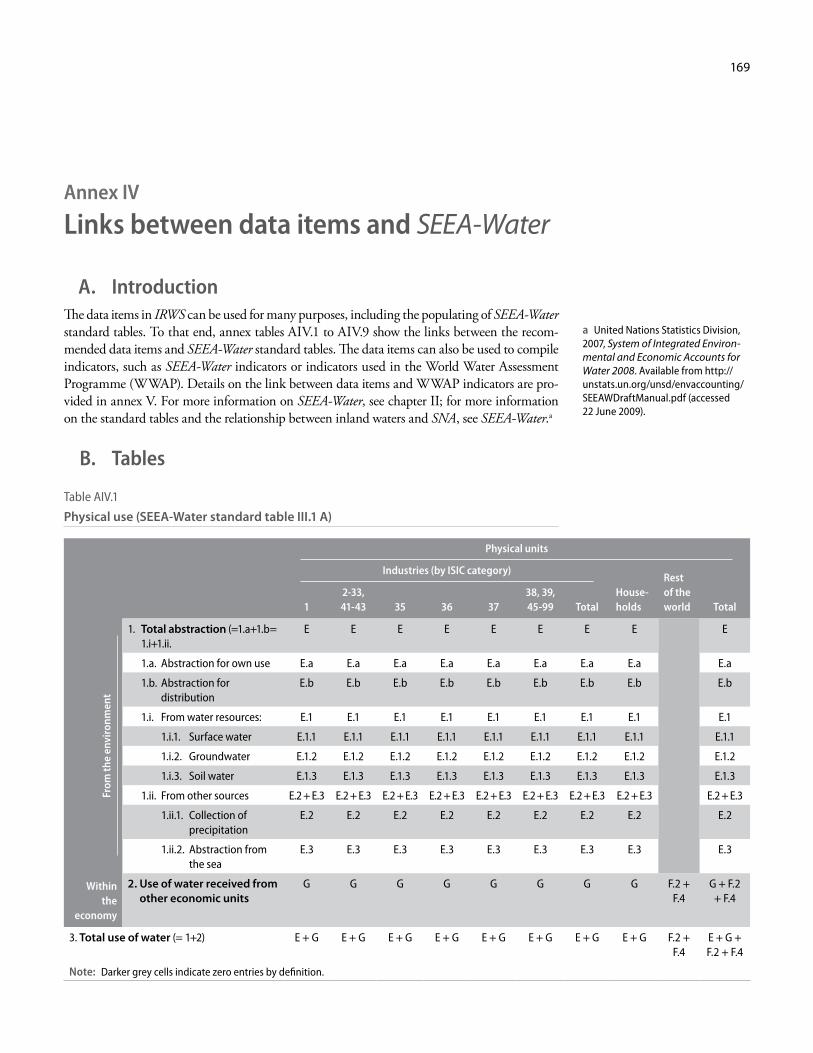
169
Annex IV
Links between data items and SEEA-Water
A. IntroductionThe data items in IRWS can be used for many purposes, including the populating of SEEA-Water standard tables. To that end, annex tables AIV.1 to AIV.9 show the links between the recom-mended data items and SEEA-Water standard tables. The data items can also be used to compile indicators, such as SEEA-Water indicators or indicators used in the World Water Assessment Programme (WWAP). Details on the link between data items and WWAP indicators are pro-vided in annex V. For more information on SEEA-Water, see chapter II; for more information on the standard tables and the relationship between inland waters and SNA, see SEEA-Water.a
B. Tables
Table AIV.1
Physical use (SEEA-Water standard table III.1 A)
Physical units
Industries (by ISIC category)
House-holds
Rest of the world Total1
2-33, 41-43 35 36 37
38, 39, 45-99 Total
From
the
envi
ronm
ent
1. Total abstraction (=1.a+1.b= 1.i+1.ii.
E E E E E E E E E
1.a. Abstraction for own use E.a E.a E.a E.a E.a E.a E.a E.a E.a
1.b. Abstraction for distribution
E.b E.b E.b E.b E.b E.b E.b E.b E.b
1.i. From water resources: E.1 E.1 E.1 E.1 E.1 E.1 E.1 E.1 E.1
1.i.1. Surface water E.1.1 E.1.1 E.1.1 E.1.1 E.1.1 E.1.1 E.1.1 E.1.1 E.1.1
1.i.2. Groundwater E.1.2 E.1.2 E.1.2 E.1.2 E.1.2 E.1.2 E.1.2 E.1.2 E.1.2
1.i.3. Soil water E.1.3 E.1.3 E.1.3 E.1.3 E.1.3 E.1.3 E.1.3 E.1.3 E.1.3
1.ii. From other sources E.2 + E.3 E.2 + E.3 E.2 + E.3 E.2 + E.3 E.2 + E.3 E.2 + E.3 E.2 + E.3 E.2 + E.3 E.2 + E.3
1.ii.1. Collection of precipitation
E.2 E.2 E.2 E.2 E.2 E.2 E.2 E.2 E.2
1.ii.2. Abstraction from the sea
E.3 E.3 E.3 E.3 E.3 E.3 E.3 E.3 E.3
Within the
economy
2. Use of water received from other economic units
G G G G G G G G F.2 + F.4
G + F.2 + F.4
3. Total use of water (= 1+2) E + G E + G E + G E + G E + G E + G E + G E + G F.2 + F.4
E + G + F.2 + F.4
Note: Darker grey cells indicate zero entries by definition.
a United Nations Statistics Division, 2007, System of Integrated Environ-mental and Economic Accounts for Water 2008. Available from http://unstats.un.org/unsd/envaccounting/SEEAWDraftManual.pdf (accessed 22 June 2009).
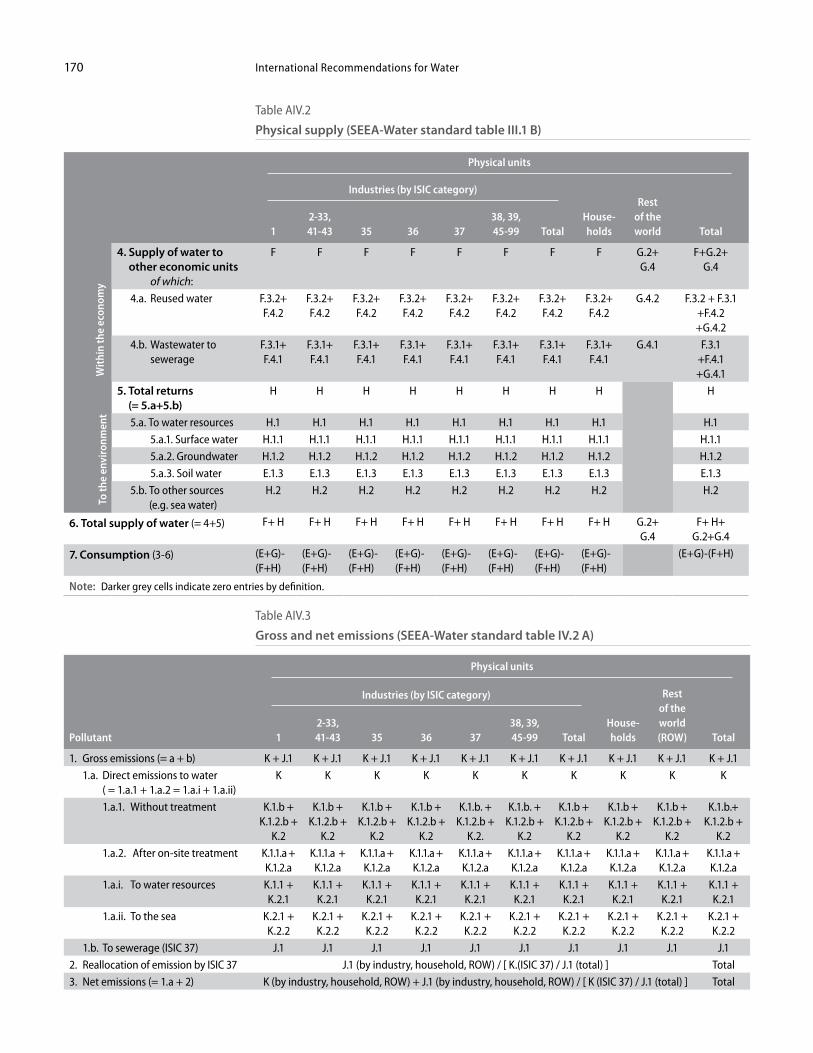
International Recommendations for Water170
Table AIV.2
Physical supply (SEEA-Water standard table III.1 B)
Physical units
Industries (by ISIC category)
House-holds
Rest of the world1
2-33, 41-43 35 36 37
38, 39, 45-99 Total Total
Wit
hin
the
econ
omy
4. Supply of water to other economic units of which:
F F F F F F F F G.2+ G.4
F+G.2+ G.4
4.a. Reused water F.3.2+ F.4.2
F.3.2+ F.4.2
F.3.2+ F.4.2
F.3.2+ F.4.2
F.3.2+ F.4.2
F.3.2+ F.4.2
F.3.2+ F.4.2
F.3.2+ F.4.2
G.4.2 F.3.2 + F.3.1 +F.4.2 +G.4.2
4.b. Wastewater to sewerage
F.3.1+ F.4.1
F.3.1+ F.4.1
F.3.1+ F.4.1
F.3.1+ F.4.1
F.3.1+ F.4.1
F.3.1+ F.4.1
F.3.1+ F.4.1
F.3.1+ F.4.1
G.4.1 F.3.1 +F.4.1 +G.4.1
To th
e en
viro
nmen
t
5. Total returns (= 5.a+5.b)
H H H H H H H H H
5.a. To water resources H.1 H.1 H.1 H.1 H.1 H.1 H.1 H.1 H.1
5.a.1. Surface water H.1.1 H.1.1 H.1.1 H.1.1 H.1.1 H.1.1 H.1.1 H.1.1 H.1.1
5.a.2. Groundwater H.1.2 H.1.2 H.1.2 H.1.2 H.1.2 H.1.2 H.1.2 H.1.2 H.1.2
5.a.3. Soil water E.1.3 E.1.3 E.1.3 E.1.3 E.1.3 E.1.3 E.1.3 E.1.3 E.1.3
5.b. To other sources (e.g. sea water)
H.2 H.2 H.2 H.2 H.2 H.2 H.2 H.2 H.2
6. Total supply of water (= 4+5) F+ H F+ H F+ H F+ H F+ H F+ H F+ H F+ H G.2+ G.4
F+ H+ G.2+G.4
7. Consumption (3-6) (E+G)-(F+H)
(E+G)-(F+H)
(E+G)-(F+H)
(E+G)-(F+H)
(E+G)-(F+H)
(E+G)-(F+H)
(E+G)-(F+H)
(E+G)-(F+H)
(E+G)-(F+H)
Note: Darker grey cells indicate zero entries by definition.
Table AIV.3
Gross and net emissions (SEEA-Water standard table IV.2 A)
Physical units
Pollutant
Industries (by ISIC category)
House-holds
Rest of the world (ROW)1
2-33, 41-43 35 36 37
38, 39, 45-99 Total Total
1. Gross emissions (= a + b) K + J.1 K + J.1 K + J.1 K + J.1 K + J.1 K + J.1 K + J.1 K + J.1 K + J.1 K + J.1
1.a. Direct emissions to water ( = 1.a.1 + 1.a.2 = 1.a.i + 1.a.ii)
K K K K K K K K K K
1.a.1. Without treatment K.1.b + K.1.2.b +
K.2
K.1.b + K.1.2.b +
K.2
K.1.b + K.1.2.b +
K.2
K.1.b + K.1.2.b +
K.2
K.1.b. + K.1.2.b +
K.2.
K.1.b. + K.1.2.b +
K.2
K.1.b + K.1.2.b +
K.2
K.1.b + K.1.2.b +
K.2
K.1.b + K.1.2.b +
K.2
K.1.b.+ K.1.2.b +
K.2
1.a.2. After on-site treatment K.1.1.a + K.1.2.a
K.1.1.a + K.1.2.a
K.1.1.a + K.1.2.a
K.1.1.a + K.1.2.a
K.1.1.a + K.1.2.a
K.1.1.a + K.1.2.a
K.1.1.a + K.1.2.a
K.1.1.a + K.1.2.a
K.1.1.a + K.1.2.a
K.1.1.a + K.1.2.a
1.a.i. To water resources K.1.1 + K.2.1
K.1.1 + K.2.1
K.1.1 + K.2.1
K.1.1 + K.2.1
K.1.1 + K.2.1
K.1.1 + K.2.1
K.1.1 + K.2.1
K.1.1 + K.2.1
K.1.1 + K.2.1
K.1.1 + K.2.1
1.a.ii. To the sea K.2.1 + K.2.2
K.2.1 + K.2.2
K.2.1 + K.2.2
K.2.1 + K.2.2
K.2.1 + K.2.2
K.2.1 + K.2.2
K.2.1 + K.2.2
K.2.1 + K.2.2
K.2.1 + K.2.2
K.2.1 + K.2.2
1.b. To sewerage (ISIC 37) J.1 J.1 J.1 J.1 J.1 J.1 J.1 J.1 J.1 J.1
2. Reallocation of emission by ISIC 37 J.1 (by industry, household, ROW) / [ K.(ISIC 37) / J.1 (total) ] Total
3. Net emissions (= 1.a + 2) K (by industry, household, ROW) + J.1 (by industry, household, ROW) / [ K (ISIC 37) / J.1 (total) ] Total
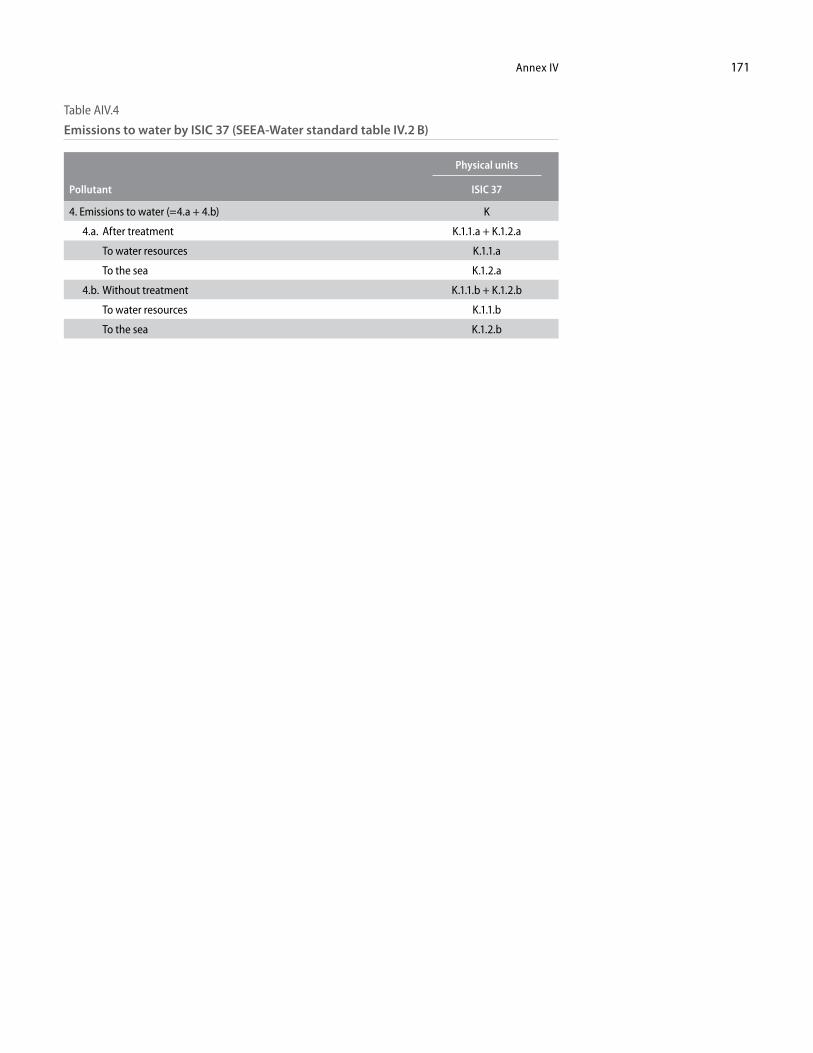
Annex IV 171
Table AIV.4
Emissions to water by ISIC 37 (SEEA-Water standard table IV.2 B)
Pollutant
Physical units
ISIC 37
4. Emissions to water (=4.a + 4.b) K
4.a. After treatment K.1.1.a + K.1.2.a
To water resources K.1.1.a
To the sea K.1.2.a
4.b. Without treatment K.1.1.b + K.1.2.b
To water resources K.1.1.b
To the sea K.1.2.b
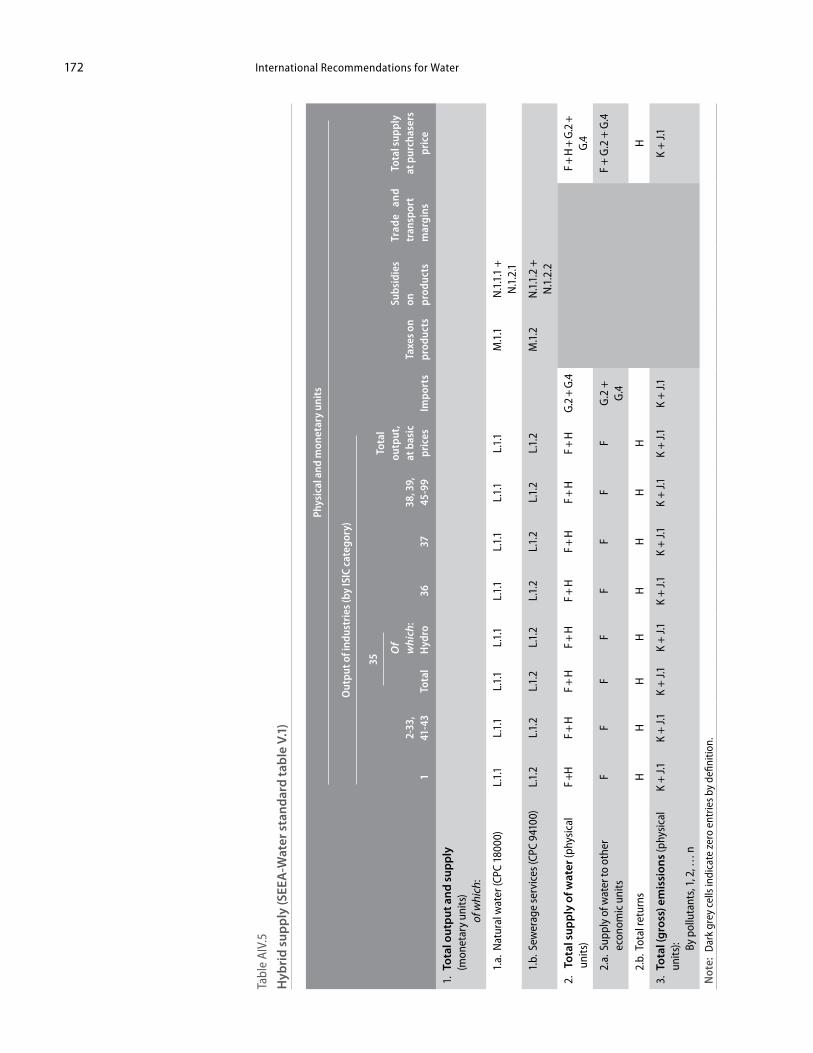
International Recommendations for Water172
Tabl
e AI
V.5
Hyb
rid
supp
ly (S
EEA
-Wat
er s
tand
ard
tabl
e V.
1)
Phys
ical
and
mon
etar
y un
its
Out
put o
f ind
ustr
ies (
by IS
IC c
ateg
ory)
Impo
rts
Taxe
s on
prod
ucts
Subs
idie
s on
pr
oduc
ts
Trad
e an
d tr
ansp
ort
mar
gins
Tota
l sup
ply
at p
urch
aser
s pr
ice
12-
33,
41-4
3
35
3637
38, 3
9,
45-9
9
Tota
l ou
tput
, at
bas
ic
pric
esTo
tal
Of
whi
ch:
Hyd
ro
1. T
otal
out
put a
nd s
uppl
y (m
onet
ary
units
)
of
whi
ch:
1.
a. N
atur
al w
ater
(CPC
180
00)
L.1.
1L.
1.1
L.1.
1L.
1.1
L.1.
1L.
1.1
L.1.
1L.
1.1
M.1
.1N
.1.1
.1 +
N
.1.2
.1
1.
b. S
ewer
age
serv
ices
(CPC
941
00)
L.1.
2L.
1.2
L.1.
2L.
1.2
L.1.
2L.
1.2
L.1.
2L.
1.2
M.1
.2N
.1.1
.2 +
N
.1.2
.2
2.
Tota
l sup
ply
of w
ater
(phy
sica
l un
its)
F +H
F + H
F + H
F + H
F + H
F + H
F + H
F + H
G.2
+ G.
4F +
H +
G.2
+
G.4
2.
a. S
uppl
y of
wat
er to
oth
er
econ
omic
uni
tsF
FF
FF
FF
FG
.2 +
G
.4F
+ G
.2 +
G.4
2.
b. T
otal
retu
rns
HH
HH
HH
HH
H
3. T
otal
(gro
ss) e
mis
sion
s (ph
ysic
al
units
):
By p
ollu
tant
s, 1,
2, …
n
K +
J.1
K +
J.1
K +
J.1
K +
J.1
K +
J.1
K +
J.1
K +
J.1
K +
J.1
K +
J.1
K +
J.1
Not
e: D
ark
grey
cel
ls in
dica
te z
ero
entr
ies b
y de
finiti
on.
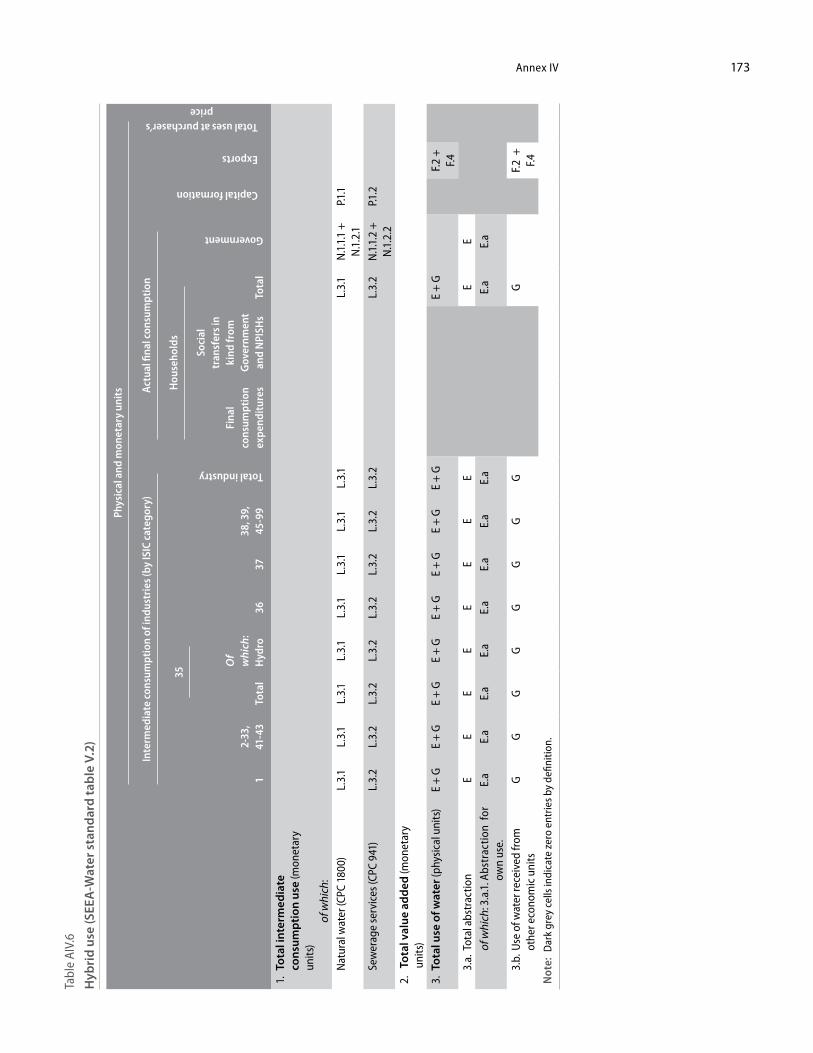
Annex IV 173Ta
ble
AIV.
6
Hyb
rid
use
(SEE
A-W
ater
sta
ndar
d ta
ble
V.2)
Phys
ical
and
mon
etar
y un
its
Inte
rmed
iate
con
sum
ptio
n of
indu
stri
es (b
y IS
IC c
ateg
ory)
Act
ual fi
nal c
onsu
mpt
ion
Capital formation
Exports
Total uses at purchaser’s price
12-
33,
41-4
3
35
3637
38, 3
9,
45-9
9
Total industry
Hou
seho
lds
Government
Tota
l
Of
whi
ch:
Hyd
ro
Fina
l co
nsum
ptio
n ex
pend
itur
es
Soci
al
tran
sfer
s in
kind
from
G
over
nmen
t an
d N
PISH
sTo
tal
1. T
otal
inte
rmed
iate
co
nsum
ptio
n us
e (m
onet
ary
units
)
of
whi
ch:
N
atur
al w
ater
(CPC
180
0)L.
3.1
L.3.
1L.
3.1
L.3.
1L.
3.1
L.3.
1L.
3.1
L.3.
1L.
3.1
N.1
.1.1
+
N.1
.2.1
P.1.1
Se
wer
age
serv
ices
(CPC
941
)L.
3.2
L.3.
2L.
3.2
L.3.
2L.
3.2
L.3.
2L.
3.2
L.3.
2L.
3.2
N.1
.1.2
+
N.1
.2.2
P.1.2
2.
Tota
l val
ue a
dded
(mon
etar
y un
its)
3. T
otal
use
of w
ater
(phy
sica
l uni
ts)
E +
GE
+ G
E +
GE
+ G
E +
GE
+ G
E +
GE
+ G
E +
GF.
2 +
F.4
3.
a. T
otal
abs
trac
tion
EE
EE
EE
EE
EE
of w
hich
: 3.a
.1. A
bstr
actio
n fo
r ow
n us
e.E.
aE.
aE.
aE.
aE.
aE.
aE.
aE.
aE.
aE.
a
3.
b. U
se o
f wat
er re
ceiv
ed fr
om
othe
r eco
nom
ic u
nits
GG
GG
GG
GG
GF.
2 +
F.4
Not
e: D
ark
grey
cel
ls in
dica
te z
ero
entr
ies b
y de
finiti
on.
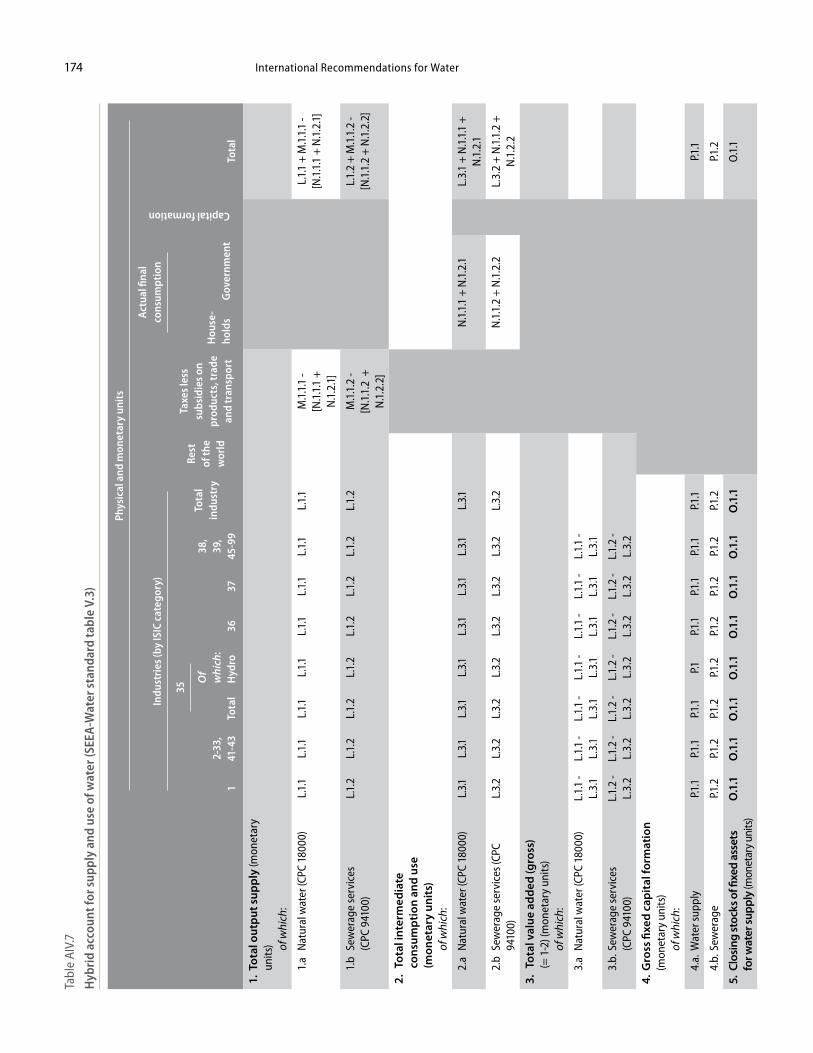
International Recommendations for Water174Ta
ble
AIV.
7
Hyb
rid
acco
unt f
or s
uppl
y an
d us
e of
wat
er (S
EEA
-Wat
er s
tand
ard
tabl
e V.
3)
Phys
ical
and
mon
etar
y un
its
Indu
stri
es (b
y IS
IC c
ateg
ory)
Act
ual fi
nal
cons
umpt
ion
Capital formation
Tota
l1
2-33
, 41
-43
35
3637
38,
39,
45-9
9
Tota
l in
dust
ry
Rest
of
the
wor
ld
Taxe
s les
s su
bsid
ies o
n pr
oduc
ts, t
rade
an
d tr
ansp
ort
Hou
se-
hold
sG
over
nmen
tTo
tal
Of
whi
ch:
Hyd
ro
1. T
otal
out
put s
uppl
y (m
onet
ary
units
)
of w
hich
:
1.
a N
atur
al w
ater
(CPC
180
00)
L.1.
1L.
1.1
L.1.
1L.
1.1
L.1.
1L.
1.1
L.1.
1L.
1.1
M.1
.1.1
- [N
.1.1
.1 +
N
.1.2
.1]
L.1.
1 +
M.1
.1.1
- [N
.1.1
.1 +
N.1
.2.1]
1.
b Se
wer
age
serv
ices
(C
PC 9
4100
)L.
1.2
L.1.
2L.
1.2
L.1.
2L.
1.2
L.1.
2L.
1.2
L.1.
2M
.1.1
.2 -
[N.1
.1.2
+
N.1
.2.2
]
L.1.
2 +
M.1
.1.2
- [N
.1.1
.2 +
N.1
.2.2
]
2. T
otal
inte
rmed
iate
co
nsum
ptio
n an
d us
e (m
onet
ary
unit
s)
of
whi
ch:
2.
a N
atur
al w
ater
(CPC
180
00)
L.3.1
L.3.1
L.3.1
L.3.1
L.3.1
L.3.1
L.3.1
L.3.1
N.1
.1.1
+ N
.1.2
.1L.
3.1
+ N
.1.1
.1 +
N
.1.2
.1
2.
b Se
wer
age
serv
ices
(CPC
94
100)
L.3.
2L.
3.2
L.3.
2L.
3.2
L.3.
2L.
3.2
L.3.
2L.
3.2
N.1
.1.2
+ N
.1.2
.2L.
3.2
+ N
.1.1
.2 +
N
.1.2
.2
3. T
otal
val
ue a
dded
(gro
ss)
(= 1
-2) (
mon
etar
y un
its)
of
whi
ch:
3.
a N
atur
al w
ater
(CPC
180
00)
L.1.
1 -
L.3.
1L.
1.1
- L.
3.1
L.1.
1 -
L.3.
1L.
1.1
- L.
3.1
L.1.
1 -
L.3.
1L.
1.1
- L.
3.1
L.1.
1 -
L.3.
1
3.
b. S
ewer
age
serv
ices
(C
PC 9
4100
)L.
1.2
- L.
3.2
L.1.
2 -
L.3.
2L.
1.2
- L.
3.2
L.1.
2 -
L.3.
2L.
1.2
- L.
3.2
L.1.
2 -
L.3.
2L.
1.2
- L.
3.2
4. G
ross
fixe
d ca
pita
l for
mat
ion
(mon
etar
y un
its)
of
whi
ch:
4.
a. W
ater
supp
lyP.1
.1P.1
.1P.1
.1P.1
P.1.1
P.1.1
P.1.1
P.1.1
P.1.1
4.
b. S
ewer
age
P.1.2
P.1.2
P.1.2
P.1.2
P.1.2
P.1.2
P.1.2
P.1.2
P.1.2
5. C
losi
ng st
ocks
of fi
xed
asse
ts
for w
ater
supp
ly (m
onet
ary
units
)O
.1.1
O.1
.1O
.1.1
O.1
.1O
.1.1
O.1
.1O
.1.1
O.1
.1O
.1.1
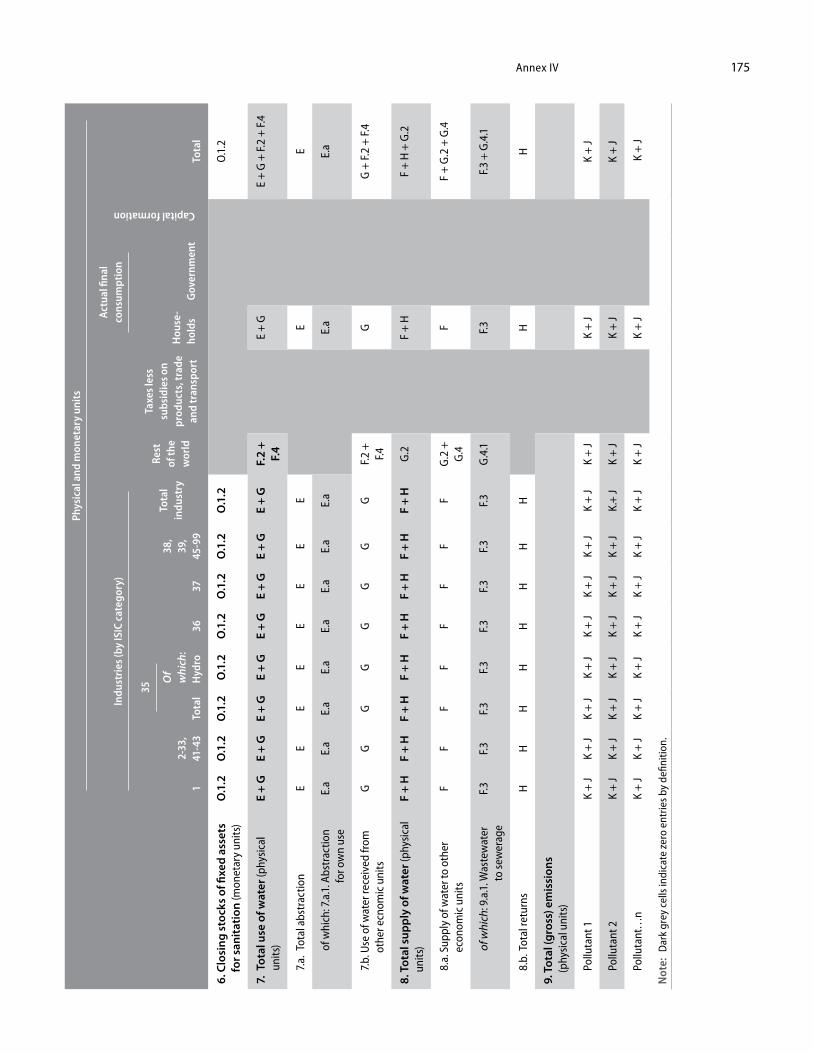
Annex IV 175Ph
ysic
al a
nd m
onet
ary
unit
s
Indu
stri
es (b
y IS
IC c
ateg
ory)
Act
ual fi
nal
cons
umpt
ion
Capital formation
Tota
l1
2-33
, 41
-43
35
3637
38,
39,
45-9
9
Tota
l in
dust
ry
Rest
of
the
wor
ld
Taxe
s les
s su
bsid
ies o
n pr
oduc
ts, t
rade
an
d tr
ansp
ort
Hou
se-
hold
sG
over
nmen
tTo
tal
Of
whi
ch:
Hyd
ro
6. C
losi
ng s
tock
s of
fixe
d as
sets
fo
r san
itat
ion
(mon
etar
y un
its)
O.1
.2O
.1.2
O.1
.2O
.1.2
O.1
.2O
.1.2
O.1
.2O
.1.2
O.1
.2
7. T
otal
use
of w
ater
(phy
sica
l un
its)
E +
GE
+ G
E +
GE
+ G
E +
GE
+ G
E +
GE
+ G
F.2
+ F.
4E
+ G
E +
G +
F.2
+ F.
4
7.
a. T
otal
abs
trac
tion
EE
EE
EE
EE
EE
of w
hich
: 7.a
.1. A
bstr
actio
n fo
r ow
n us
eE.
aE.
aE.
aE.
aE.
aE.
aE.
aE.
aE.
aE.
a
7.
b. U
se o
f wat
er re
ceiv
ed fr
om
othe
r ecn
omic
uni
tsG
GG
GG
GG
GF.
2 +
F.4
GG
+ F.
2 +
F.4
8. T
otal
sup
ply
of w
ater
(phy
sica
l un
its)
F +
HF
+ H
F +
HF
+ H
F +
HF
+ H
F +
HF
+ H
G.2
F +
HF
+ H
+ G
.2
8.
a. S
uppl
y of
wat
er to
oth
er
econ
omic
uni
tsF
FF
FF
FF
FG
.2 +
G
.4F
F +
G.2
+ G
.4
of w
hich
: 9.a
.1. W
aste
wat
er
to se
wer
age
F.3
F.3
F.3
F.3
F.3
F.3
F.3
F.3
G.4
.1F.
3F.
3 +
G.4
.1
8.
b. T
otal
retu
rns
HH
HH
HH
HH
HH
9. T
otal
(gro
ss) e
mis
sion
s (p
hysi
cal u
nits
)
Po
lluta
nt 1
K +
JK
+ J
K +
JK
+ J
K +
JK
+ J
K +
JK
+ J
K +
JK
+ J
K +
J
Po
lluta
nt 2
K +
JK
+ J
K +
JK
+ J
K +
JK
+ J
K +
JK.
+ J
K +
JK
+ J
K +
J
Po
lluta
nt…
nK
+ J
K +
JK
+ J
K +
JK
+ J
K +
JK
+ J
K +
JK
+ J
K +
J
K
+ J
Not
e: D
ark
grey
cel
ls in
dica
te z
ero
entr
ies b
y de
finiti
on.
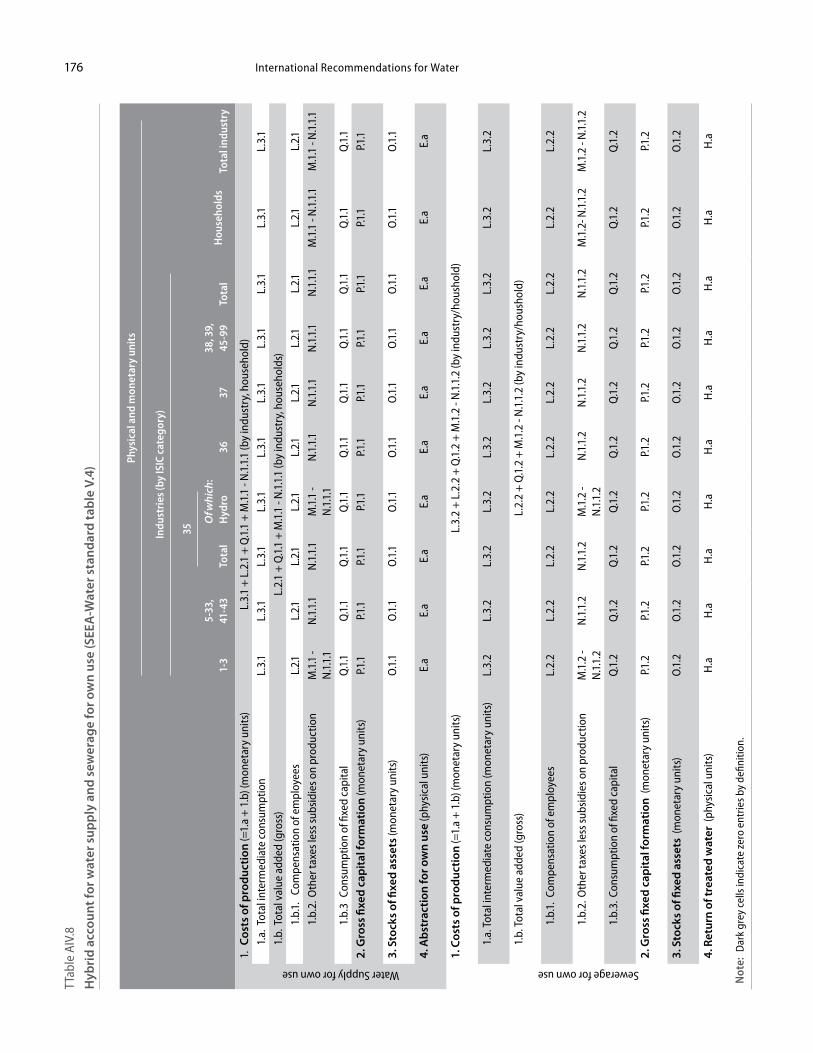
International Recommendations for Water176TT
able
AIV
.8
Hyb
rid
acco
unt f
or w
ater
sup
ply
and
sew
erag
e fo
r ow
n us
e (S
EEA
-Wat
er s
tand
ard
tabl
e V.
4)
Phys
ical
and
mon
etar
y un
its
Indu
stri
es (b
y IS
IC c
ateg
ory)
Hou
seho
lds
Tota
l ind
ustr
y1-
35-
33,
41-4
3
35
3637
38, 3
9,
45-9
9To
tal
Tota
lO
f whi
ch:
Hyd
ro
Water Supply for own use
1. C
osts
of p
rodu
ctio
n (=
1.a
+ 1
.b) (
mon
etar
y un
its)
L.3.
1 +
L.2
.1 +
Q.1
.1 +
M.1
.1 -
N.1
.1.1
(by
indu
stry
, hou
seho
ld)
1.
a. T
otal
inte
rmed
iate
con
sum
ptio
nL.
3.1
L.3.
1L.
3.1
L.3.
1L.
3.1
L.3.
1L.
3.1
L.3.
1L.
3.1
L.3.
1
1.
b. T
otal
val
ue a
dded
(gro
ss)
L.2.
1 +
Q.1
.1 +
M.1
.1 -
N.1
.1.1
(by
indu
stry
, hou
seho
lds)
1.b.
1.
Com
pens
atio
n of
em
ploy
ees
L.2.1
L.2.1
L.2.1
L.2.1
L.2.1
L.2.1
L.2.1
L.2.1
L.2.1
L.2.1
1.b.
2. O
ther
taxe
s les
s sub
sidi
es o
n pr
oduc
tion
M.1
.1 -
N.1
.1.1
N.1
.1.1
N.1
.1.1
M.1
.1 -
N.1
.1.1
N.1
.1.1
N.1
.1.1
N.1
.1.1
N.1
.1.1
M.1
.1 -
N.1
.1.1
M.1
.1 -
N.1
.1.1
1.b.
3 Co
nsum
ptio
n of
fixe
d ca
pita
lQ
.1.1
Q.1
.1Q
.1.1
Q.1
.1Q
.1.1
Q.1
.1Q
.1.1
Q.1
.1Q
.1.1
Q.1
.1
2. G
ross
fixe
d ca
pita
l for
mat
ion
(mon
etar
y un
its)
P.1.1
P.1.1
P.1.1
P.1.1
P.1.1
P.1.1
P.1.1
P.1.1
P.1.1
P.1.1
3. S
tock
s of
fixe
d as
sets
(mon
etar
y un
its)
O.1
.1O
.1.1
O.1
.1O
.1.1
O.1
.1O
.1.1
O.1
.1O
.1.1
O.1
.1O
.1.1
4. A
bstr
actio
n fo
r ow
n us
e (p
hysi
cal u
nits
)E.
aE.
aE.
aE.
aE.
aE.
aE.
aE.
aE.
aE.
a
Sewerage for own use
1. C
osts
of p
rodu
ctio
n (=
1.a
+ 1
.b) (
mon
etar
y un
its)
L.3.
2 +
L.2
.2 +
Q.1
.2 +
M.1
.2 -
N.1
.1.2
(by
indu
stry
/hou
shol
d)
1.
a. T
otal
inte
rmed
iate
con
sum
ptio
n (m
onet
ary
units
)L.
3.2
L.3.
2L.
3.2
L.3.
2L.
3.2
L.3.
2L.
3.2
L.3.
2L.
3.2
L.3.
2
1.
b. T
otal
val
ue a
dded
(gro
ss)
L.2.
2 +
Q.1
.2 +
M.1
.2 -
N.1
.1.2
(by
indu
stry
/hou
shol
d)
1.b.
1. C
ompe
nsat
ion
of e
mpl
oyee
sL.
2.2
L.2.
2L.
2.2
L.2.
2L.
2.2
L.2.
2L.
2.2
L.2.
2L.
2.2
L.2.
2
1.b.
2. O
ther
taxe
s les
s sub
sidi
es o
n pr
oduc
tion
M.1
.2 -
N.1
.1.2
N.1
.1.2
N.1
.1.2
M.1
.2 -
N.1
.1.2
N.1
.1.2
N.1
.1.2
N.1
.1.2
N.1
.1.2
M.1
.2- N
.1.1
.2M
.1.2
- N
.1.1
.2
1.b.
3. C
onsu
mpt
ion
of fi
xed
capi
tal
Q.1
.2Q
.1.2
Q.1
.2Q
.1.2
Q.1
.2Q
.1.2
Q.1
.2Q
.1.2
Q.1
.2Q
.1.2
2. G
ross
fixe
d ca
pita
l for
mat
ion
(mon
etar
y un
its)
P.1.2
P.1.2
P.1.2
P.1.2
P.1.2
P.1.2
P.1.2
P.1.2
P.1.2
P.1.2
3. S
tock
s of
fixe
d as
sets
(m
onet
ary
units
)O
.1.2
O.1
.2O
.1.2
O.1
.2O
.1.2
O.1
.2O
.1.2
O.1
.2O
.1.2
O.1
.2
4. R
etur
n of
trea
ted
wat
er (
phys
ical
uni
ts)
H.a
H.a
H.a
H.a
H.a
H.a
H.a
H.a
H.a
H.a
Not
e: D
ark
grey
cel
ls in
dica
te z
ero
entr
ies b
y de
finiti
on.
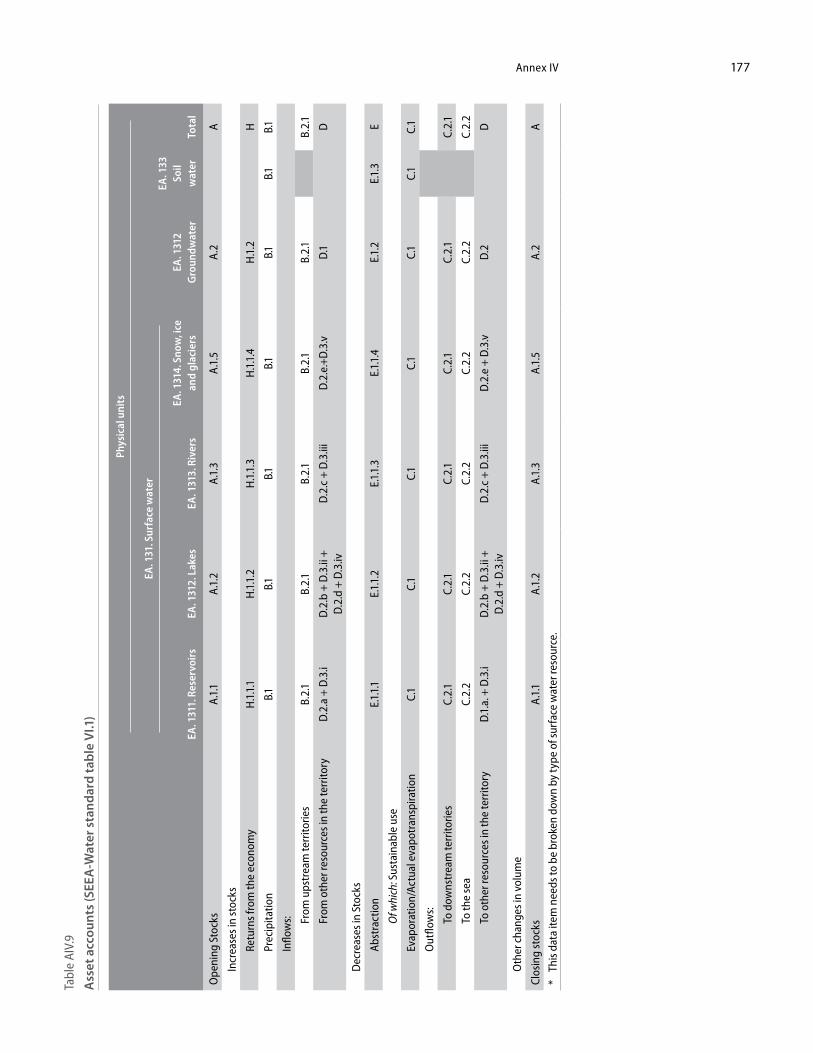
Annex IV 177Ta
ble
AIV.
9
Ass
et a
ccou
nts
(SEE
A-W
ater
sta
ndar
d ta
ble
VI.1
)
Phys
ical
uni
ts
EA. 1
31. S
urfa
ce w
ater
EA. 1
312
Gro
undw
ater
EA. 1
33
Soil
wat
erTo
tal
EA. 1
311.
Res
ervo
irs
EA. 1
312.
Lak
esEA
. 131
3. R
iver
sEA
. 131
4. S
now
, ice
an
d gl
acie
rs
Ope
ning
Sto
cks
A.1
.1A
.1.2
A.1
.3A
.1.5
A.2
A
In
crea
ses i
n st
ocks
Retu
rns f
rom
the
econ
omy
H.1
.1.1
H.1
.1.2
H.1
.1.3
H.1
.1.4
H.1
.2H
Prec
ipita
tion
B.1
B.1
B.1
B.1
B.1
B.1
B.1
Inflo
ws:
Fr
om u
pstr
eam
terr
itorie
sB.
2.1
B.2.
1B.
2.1
B.2.
1B.
2.1
B.2.
1
Fr
om o
ther
reso
urce
s in
the
terr
itory
D.2
.a +
D.3
.iD
.2.b
+ D
.3.ii
+
D.2
.d +
D.3
.ivD
.2.c
+ D
.3.ii
iD
.2.e
.+D
.3.v
D.1
D
D
ecre
ases
in S
tock
s
Abst
ract
ion
E.1.
1.1
E.1.
1.2
E.1.
1.3
E.1.
1.4
E.1.
2E.
1.3
E
O
f whi
ch: S
usta
inab
le u
se
Evap
orat
ion/
Actu
al e
vapo
tran
spira
tion
C.1
C.1
C.1
C.1
C.1
C.1
C.1
Out
flow
s:
To
dow
nstr
eam
terr
itorie
sC.
2.1
C.2.
1C.
2.1
C.2.
1C.
2.1
C.2.
1
To
the
sea
C.2.
2C.
2.2
C.2.
2C.
2.2
C.2.
2C.
2.2
To
oth
er re
sour
ces i
n th
e te
rrito
ryD
.1.a
. + D
.3.i
D.2
.b +
D.3
.ii +
D
.2.d
+ D
.3.iv
D.2
.c +
D.3
.iii
D.2
.e +
D.3
.vD
.2D
O
ther
cha
nges
in v
olum
e
Clos
ing
stoc
ksA
.1.1
A.1
.2A
.1.3
A.1
.5A
.2A
* T
his d
ata
item
nee
ds to
be
brok
en d
own
by ty
pe o
f sur
face
wat
er re
sour
ce.

179
Annex V
Water indicators and links between data items and WWAP and other indicators
A. IntroductionAnnex V creates a link between data items and some of the most frequently used water indica-tors, showing how a wide range of indicators can be derived from them. The focus is on the indicators for IWRM and those used by the World Water Assessment Programme (WWAP), which every three years produces the World Water Development Report (WWDR) for UN-Water. Other indicators covered include MDG indicators and SEEA-Water indicators, while data from a large number of different sources are also used.
1. Use of indicators
Indicators are used to synthesize and present complex information. They are a means of summarizing, simplifying and communicating information to decision makers, policy ana-lysts, researchers, the business community and the general public. They are used for making comparisons over time, within and between countries and industries, and for identifying factors that lead to the better management of water resources. For example, water indicators are used to:
• Monitor and evaluate how effectively water resources are managed and used• Assess progress against targets set by Governments• Identify areas or industries for improvements in water efficiency or pollution control• Make more informed strategic decisions on investment in water supply and sewerage
infrastructure • Identify and prioritize areas for research• Assess water use in the economy and the impact of its use on water resources
Indicators can be individual data items, aggregates, ratios or some other form of derived data. Some of the data items described in chapter IV are already used as indicators for par-ticular purposes. However, it is more common that water indicators combine several of the data items with economic, environmental or social-demographic statistics.
The demand for easy-to-interpret data covering a wide range of water issues has led to the development of a large number of indicators. While many indicators are in use, many are similar in their content or objective. It is not possible, however, to provide a definitive list of water indicators that can be applied in all countries, in all circumstances, at all times and for all purposes, given the diversity of user needs. The understanding of water (including better knowledge of scientific, economic and social-demographic issues related to water) and data availability will also change over time. Therefore, the approach taken in IRWS is to describe the characteristics of indicators and then describe some of the indicators for supporting IWRM. The indicator list described for IWRM is not exhaustive, but it includes all of the major indicator types and can be updated over time.
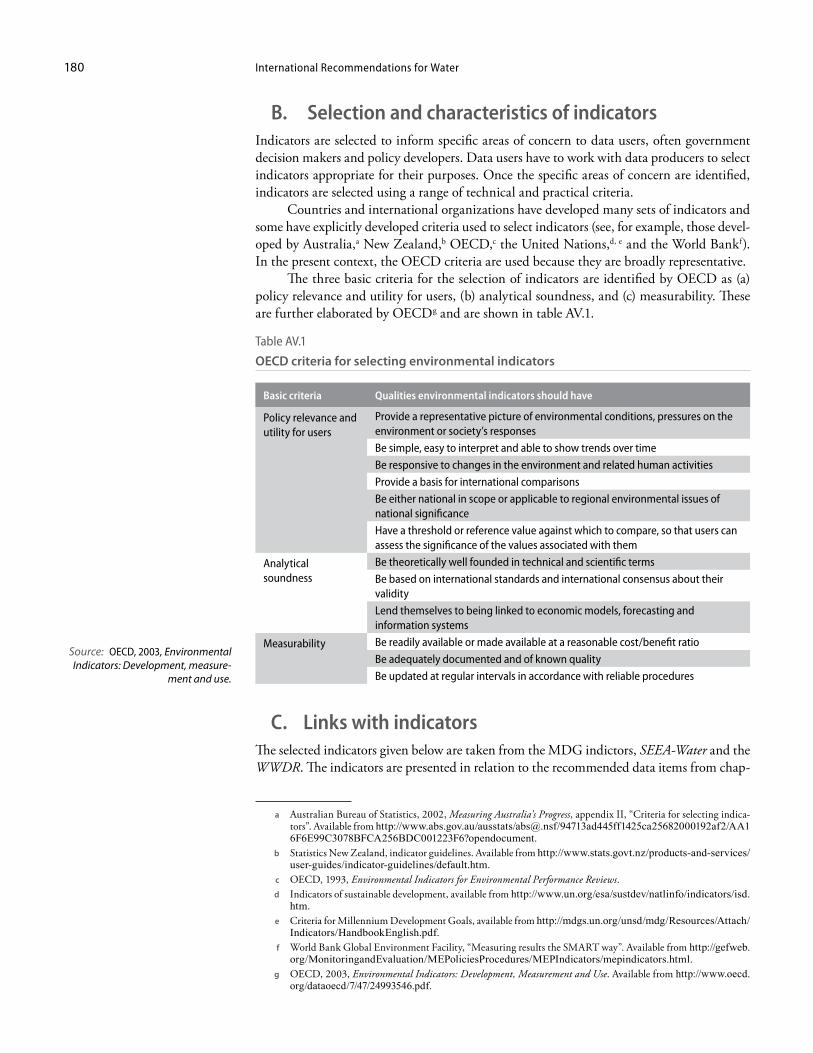
International Recommendations for Water180
B. Selection and characteristics of indicatorsIndicators are selected to inform specific areas of concern to data users, often government decision makers and policy developers. Data users have to work with data producers to select indicators appropriate for their purposes. Once the specific areas of concern are identified, indicators are selected using a range of technical and practical criteria.
Countries and international organizations have developed many sets of indicators and some have explicitly developed criteria used to select indicators (see, for example, those devel-oped by Australia,a New Zealand,b OECD,c the United Nations,d, e and the World Bankf). In the present context, the OECD criteria are used because they are broadly representative.
The three basic criteria for the selection of indicators are identified by OECD as (a) policy relevance and utility for users, (b) analytical soundness, and (c) measurability. These are further elaborated by OECD g and are shown in table AV.1.
Table AV.1
OECD criteria for selecting environmental indicators
Basic criteria Qualities environmental indicators should have
Policy relevance and utility for users
Provide a representative picture of environmental conditions, pressures on the environment or society’s responses
Be simple, easy to interpret and able to show trends over time
Be responsive to changes in the environment and related human activities
Provide a basis for international comparisons
Be either national in scope or applicable to regional environmental issues of national significance
Have a threshold or reference value against which to compare, so that users can assess the significance of the values associated with them
Analytical soundness
Be theoretically well founded in technical and scientific terms
Be based on international standards and international consensus about their validity
Lend themselves to being linked to economic models, forecasting and information systems
Measurability Be readily available or made available at a reasonable cost/benefit ratio
Be adequately documented and of known quality
Be updated at regular intervals in accordance with reliable procedures
C. Links with indicatorsThe selected indicators given below are taken from the MDG indictors, SEEA-Water and the WWDR. The indicators are presented in relation to the recommended data items from chap-
Source: OECD, 2003, Environmental Indicators: Development, measure-
ment and use.
a Australian Bureau of Statistics, 2002, Measuring Australia’s Progress, appendix II, “Criteria for selecting indica-tors”. Available from http://www.abs.gov.au/ausstats/[email protected]/94713ad445ff1425ca25682000192af2/AA16F6E99C3078BFCA256BDC001223F6?opendocument.
b Statistics New Zealand, indicator guidelines. Available from http://www.stats.govt.nz/products-and-services/user-guides/indicator-guidelines/default.htm.
c OECD, 1993, Environmental Indicators for Environmental Performance Reviews. d Indicators of sustainable development, available from http://www.un.org/esa/sustdev/natlinfo/indicators/isd.
htm. e Criteria for Millennium Development Goals, available from http://mdgs.un.org/unsd/mdg/Resources/Attach/
Indicators/HandbookEnglish.pdf. f World Bank Global Environment Facility, “Measuring results the SMART way”. Available from http://gefweb.
org/MonitoringandEvaluation/MEPoliciesProcedures/MEPIndicators/mepindicators.html. g OECD, 2003, Environmental Indicators: Development, Measurement and Use. Available from http://www.oecd.
org/dataoecd/7/47/24993546.pdf.
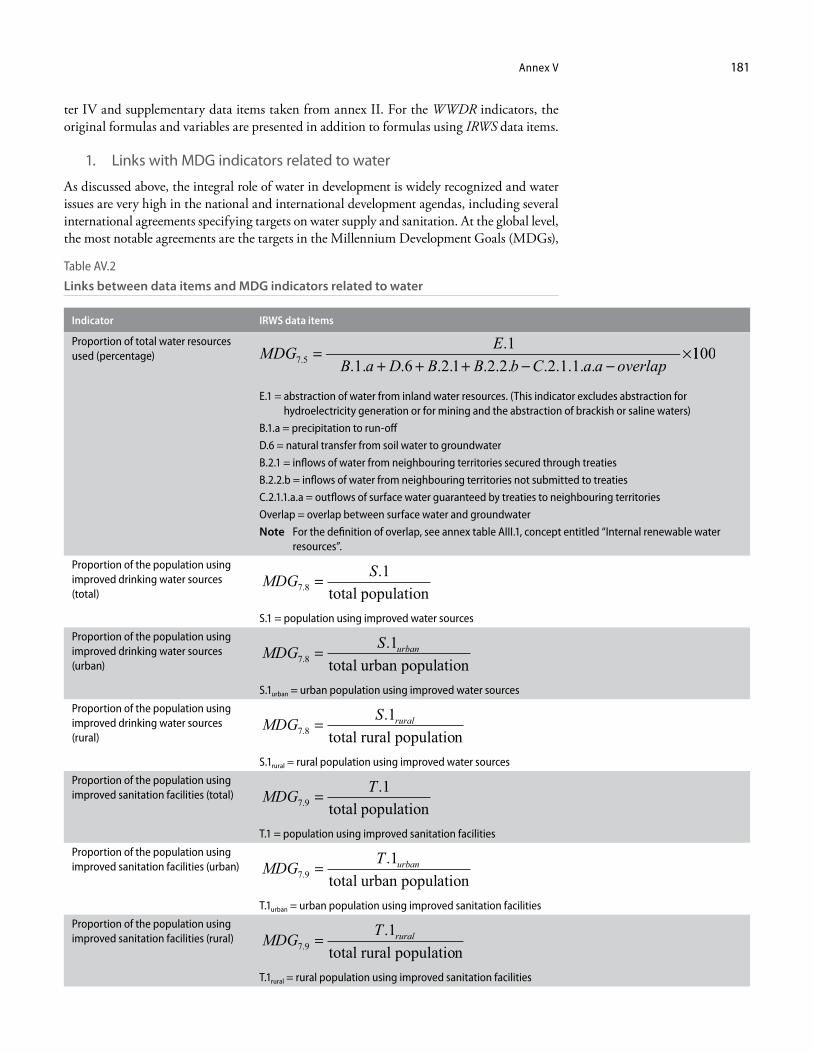
Annex V 181
ter IV and supplementary data items taken from annex II. For the WWDR indicators, the original formulas and variables are presented in addition to formulas using IRWS data items.
1. Links with MDG indicators related to water
As discussed above, the integral role of water in development is widely recognized and water issues are very high in the national and international development agendas, including several international agreements specifying targets on water supply and sanitation. At the global level, the most notable agreements are the targets in the Millennium Development Goals (MDGs),
Table AV.2
Links between data items and MDG indicators related to water
Indicator IRWS data items
Proportion of total water resources used (percentage)
E.1 = abstraction of water from inland water resources. (This indicator excludes abstraction for hydroelectricity generation or for mining and the abstraction of brackish or saline waters)
B.1.a = precipitation to run-off
D.6 = natural transfer from soil water to groundwater
B.2.1 = inflows of water from neighbouring territories secured through treaties
B.2.2.b = inflows of water from neighbouring territories not submitted to treaties
C.2.1.1.a.a = outflows of surface water guaranteed by treaties to neighbouring territories
Overlap = overlap between surface water and groundwater
Note For the definition of overlap, see annex table AIII.1, concept entitled “Internal renewable water resources”.
Proportion of the population using improved drinking water sources (total)
MDG S7 8
1.
.=total population
S.1 = population using improved water sources
Proportion of the population using improved drinking water sources (urban)
MDG S urban7 8
1.
.=total urban population
S.1urban = urban population using improved water sources
Proportion of the population using improved drinking water sources (rural)
MDG S rural7 8
1.
.=total rural population
S.1rural = rural population using improved water sources
Proportion of the population using improved sanitation facilities (total) MDG T
7 91
..=
total populationT.1 = population using improved sanitation facilities
Proportion of the population using improved sanitation facilities (urban) MDG T urban
7 91
..=
total urban populationT.1urban = urban population using improved sanitation facilities
Proportion of the population using improved sanitation facilities (rural) MDG T rural
7 91
..=
total rural populationT.1rural = rural population using improved sanitation facilities
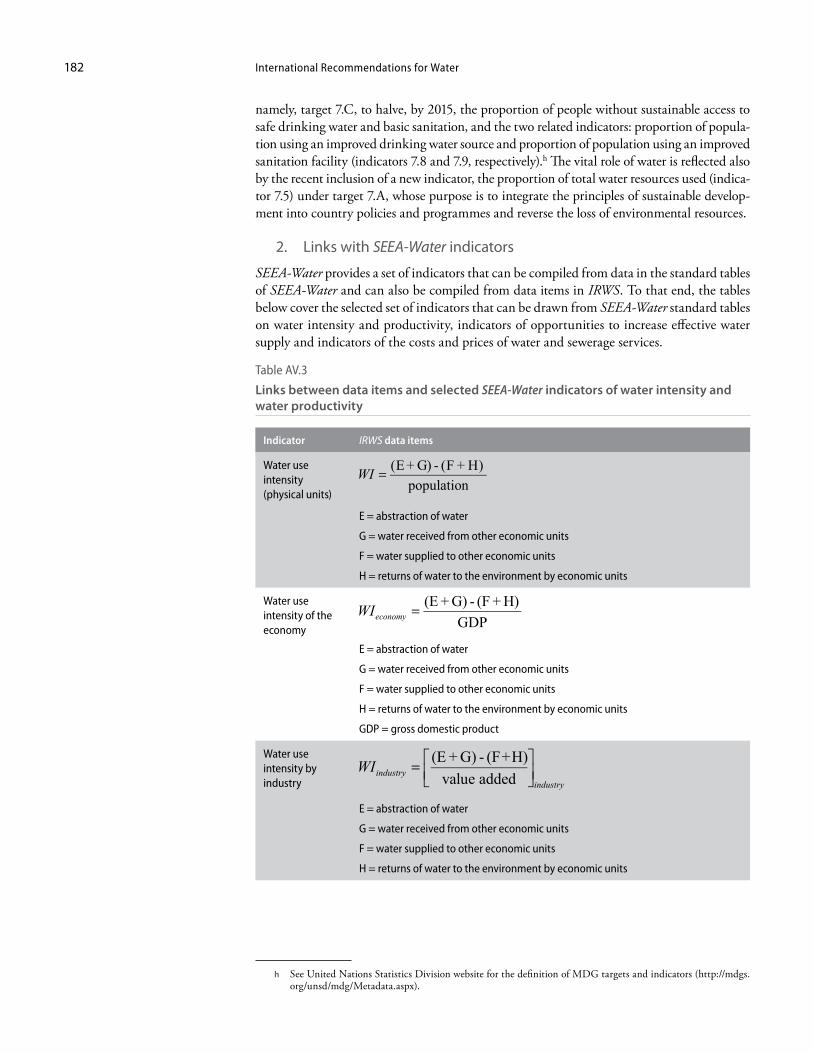
International Recommendations for Water182
namely, target 7.C, to halve, by 2015, the proportion of people without sustainable access to safe drinking water and basic sanitation, and the two related indicators: proportion of popula-tion using an improved drinking water source and proportion of population using an improved sanitation facility (indicators 7.8 and 7.9, respectively).h The vital role of water is reflected also by the recent inclusion of a new indicator, the proportion of total water resources used (indica-tor 7.5) under target 7.A, whose purpose is to integrate the principles of sustainable develop-ment into country policies and programmes and reverse the loss of environmental resources.
2. Links with SEEA-Water indicators
SEEA-Water provides a set of indicators that can be compiled from data in the standard tables of SEEA-Water and can also be compiled from data items in IRWS. To that end, the tables below cover the selected set of indicators that can be drawn from SEEA-Water standard tables on water intensity and productivity, indicators of opportunities to increase effective water supply and indicators of the costs and prices of water and sewerage services.
Table AV.3
Links between data items and selected SEEA-Water indicators of water intensity and water productivity
Indicator IRWS data items
Water use intensity (physical units)
E = abstraction of water
G = water received from other economic units
F = water supplied to other economic units
H = returns of water to the environment by economic units
Water use intensity of the economy
E = abstraction of water
G = water received from other economic units
F = water supplied to other economic units
H = returns of water to the environment by economic units
GDP = gross domestic product
Water use intensity by industry
E = abstraction of water
G = water received from other economic units
F = water supplied to other economic units
H = returns of water to the environment by economic units
h See United Nations Statistics Division website for the definition of MDG targets and indicators (http://mdgs.org/unsd/mdg/Metadata.aspx).
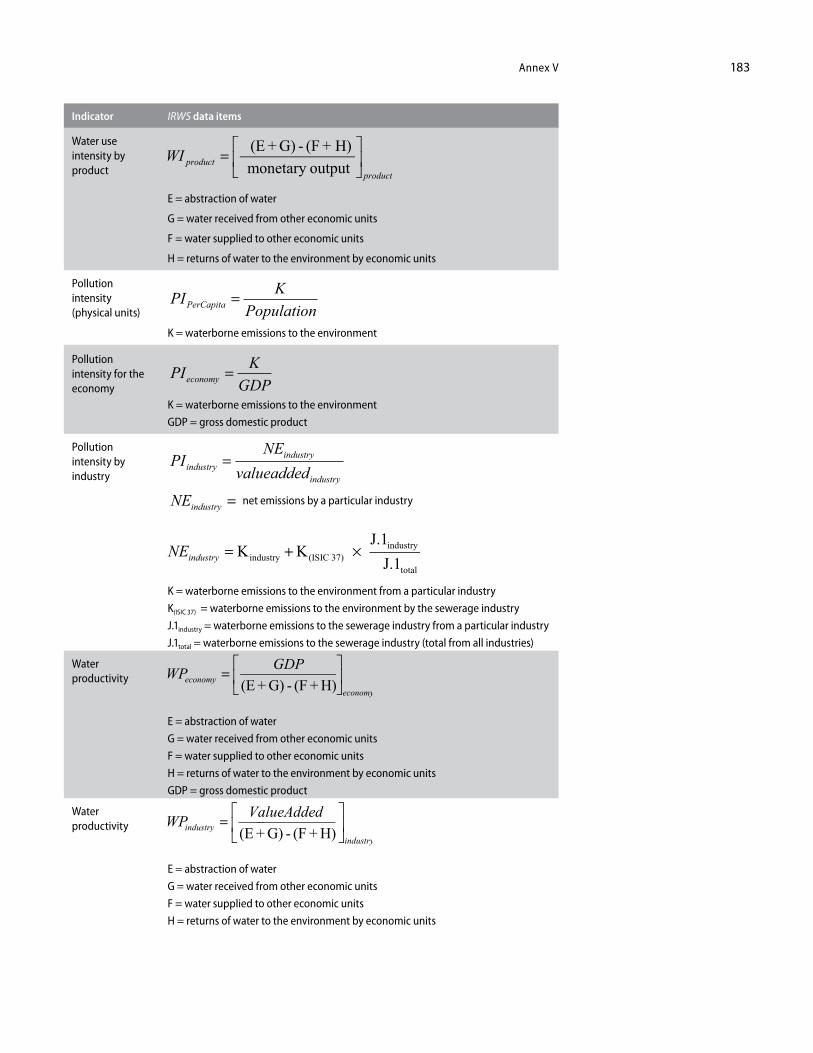
Annex V 183
Indicator IRWS data items
Water use intensity by product
E = abstraction of water
G = water received from other economic units
F = water supplied to other economic units
H = returns of water to the environment by economic units
Pollution intensity (physical units)
PI KPopulationPerCapita =
K = waterborne emissions to the environment
Pollution intensity for the economy
PI KGDPeconomy =
K = waterborne emissions to the environment
GDP = gross domestic product
Pollution intensity by industry
PINE
valueaddedindustryindustry
industry
=
NEindustry = net emissions by a particular industry
NEindustry = + ×K K J.1 J.1industry (ISIC 37)
industry
total
K = waterborne emissions to the environment from a particular industry
K(ISIC 37) = waterborne emissions to the environment by the sewerage industry
J.1industry = waterborne emissions to the sewerage industry from a particular industry
J.1total = waterborne emissions to the sewerage industry (total from all industries)
Water productivity
E = abstraction of water
G = water received from other economic units
F = water supplied to other economic units
H = returns of water to the environment by economic units
GDP = gross domestic product
Water productivity
E = abstraction of water
G = water received from other economic units
F = water supplied to other economic units
H = returns of water to the environment by economic units
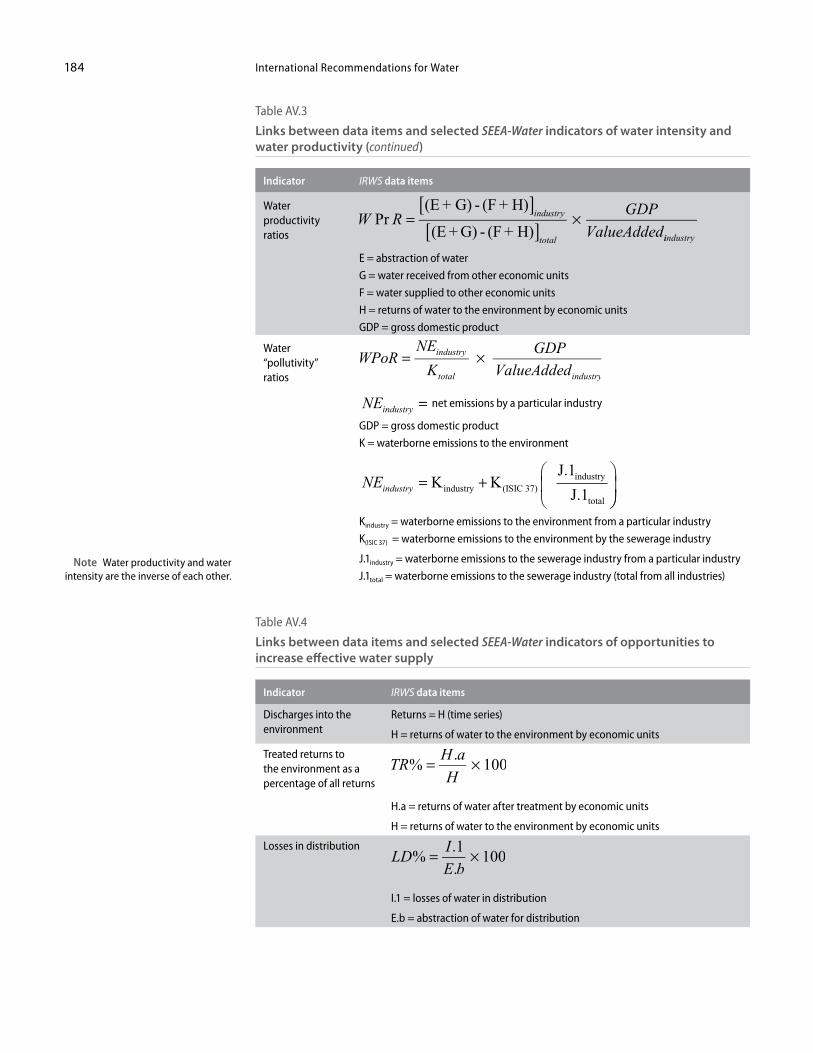
International Recommendations for Water184
Indicator IRWS data items
Water productivity ratios
E = abstraction of water
G = water received from other economic units
F = water supplied to other economic units
H = returns of water to the environment by economic units
GDP = gross domestic product
Water “pollutivity” ratios
NEindustry = net emissions by a particular industry
GDP = gross domestic product
K = waterborne emissions to the environment
NEindustry = +
K K
J.1 J.1industry (ISIC 37)
industry
total
Kindustry = waterborne emissions to the environment from a particular industry
K(ISIC 37) = waterborne emissions to the environment by the sewerage industry
J.1industry = waterborne emissions to the sewerage industry from a particular industry
J.1total = waterborne emissions to the sewerage industry (total from all industries)
Table AV.4
Links between data items and selected SEEA-Water indicators of opportunities to increase effective water supply
Indicator IRWS data items
Discharges into the environment
Returns = H (time series)
H = returns of water to the environment by economic units
Treated returns to the environment as a percentage of all returns
H.a = returns of water after treatment by economic units
H = returns of water to the environment by economic units
Losses in distribution
I.1 = losses of water in distribution
E.b = abstraction of water for distribution
Note Water productivity and water intensity are the inverse of each other.
Table AV.3
Links between data items and selected SEEA-Water indicators of water intensity and water productivity (continued)
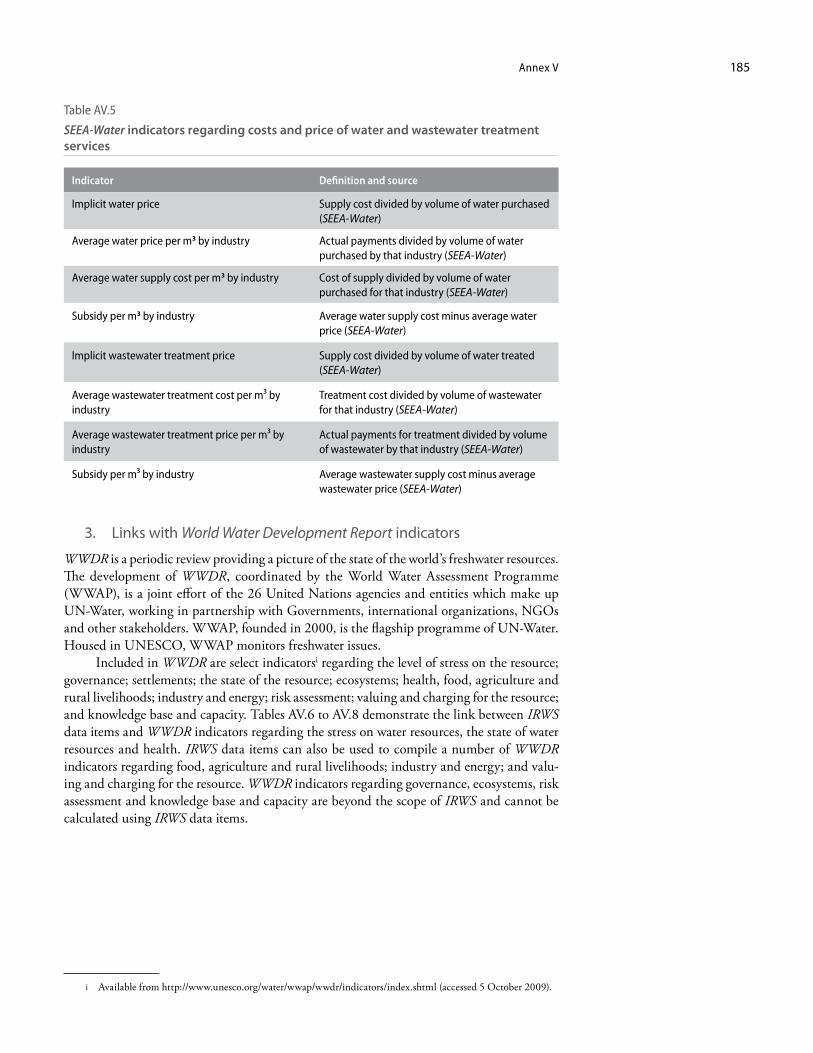
Annex V 185
3. Links with World Water Development Report indicators
WWDR is a periodic review providing a picture of the state of the world’s freshwater resources. The development of WWDR, coordinated by the World Water Assessment Programme (WWAP), is a joint effort of the 26 United Nations agencies and entities which make up UN-Water, working in partnership with Governments, international organizations, NGOs and other stakeholders. WWAP, founded in 2000, is the flagship programme of UN-Water. Housed in UNESCO, WWAP monitors freshwater issues.
Included in WWDR are select indicatorsi regarding the level of stress on the resource; governance; settlements; the state of the resource; ecosystems; health, food, agriculture and rural livelihoods; industry and energy; risk assessment; valuing and charging for the resource; and knowledge base and capacity. Tables AV.6 to AV.8 demonstrate the link between IRWS data items and WWDR indicators regarding the stress on water resources, the state of water resources and health. IRWS data items can also be used to compile a number of WWDR indicators regarding food, agriculture and rural livelihoods; industry and energy; and valu-ing and charging for the resource. WWDR indicators regarding governance, ecosystems, risk assessment and knowledge base and capacity are beyond the scope of IRWS and cannot be calculated using IRWS data items.
Table AV.5
SEEA-Water indicators regarding costs and price of water and wastewater treatment services
Indicator Definition and source
Implicit water price Supply cost divided by volume of water purchased (SEEA-Water)
Average water price per m3 by industry Actual payments divided by volume of water purchased by that industry (SEEA-Water)
Average water supply cost per m3 by industry Cost of supply divided by volume of water purchased for that industry (SEEA-Water)
Subsidy per m3 by industry Average water supply cost minus average water price (SEEA-Water)
Implicit wastewater treatment price Supply cost divided by volume of water treated (SEEA-Water)
Average wastewater treatment cost per m³ by industry
Treatment cost divided by volume of wastewater for that industry (SEEA-Water)
Average wastewater treatment price per m³ by industry
Actual payments for treatment divided by volume of wastewater by that industry (SEEA-Water)
Subsidy per m³ by industry Average wastewater supply cost minus average wastewater price (SEEA-Water)
i Available from http://www.unesco.org/water/wwap/wwdr/indicators/index.shtml (accessed 5 October 2009).
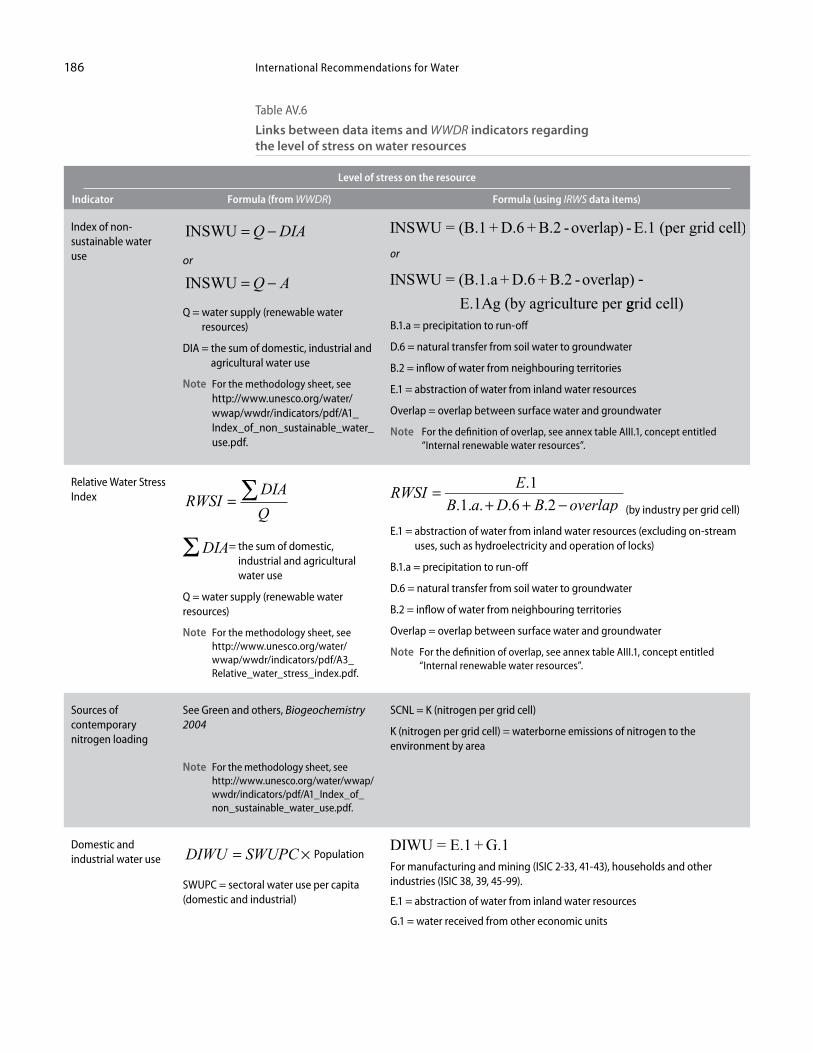
International Recommendations for Water186
Table AV.6
Links between data items and WWDR indicators regarding the level of stress on water resources
Level of stress on the resource
Indicator Formula (from WWDR) Formula (using IRWS data items)
Index of non-sustainable water use
INSWU = −Q DIA
or
INSWU = −Q A
Q = water supply (renewable water resources)
DIA = the sum of domestic, industrial and agricultural water use
Note For the methodology sheet, see http://www.unesco.org/water/wwap/wwdr/indicators/pdf/A1_ Index_of_non_sustainable_water _use.pdf.
or
B.1.a = precipitation to run-off
D.6 = natural transfer from soil water to groundwater
B.2 = inflow of water from neighbouring territories
E.1 = abstraction of water from inland water resources
Overlap = overlap between surface water and groundwater
Note For the definition of overlap, see annex table AIII.1, concept entitled “Internal renewable water resources”.
Relative Water Stress Index RWSI
DIAQ
= ∑
DIAΣ = the sum of domestic, industrial and agricultural water use
Q = water supply (renewable water resources)
Note For the methodology sheet, see http://www.unesco.org/water/wwap/wwdr/indicators/pdf/A3_ Relative_water_stress_index.pdf.
(by industry per grid cell)
E.1 = abstraction of water from inland water resources (excluding on-stream uses, such as hydroelectricity and operation of locks)
B.1.a = precipitation to run-off
D.6 = natural transfer from soil water to groundwater
B.2 = inflow of water from neighbouring territories
Overlap = overlap between surface water and groundwater
Note For the definition of overlap, see annex table AIII.1, concept entitled “Internal renewable water resources”.
Sources of contemporary nitrogen loading
See Green and others, Biogeochemistry 2004
Note For the methodology sheet, see http://www.unesco.org/water/wwap/wwdr/indicators/pdf/A1_Index_of_non_sustainable_water_use.pdf.
SCNL = K (nitrogen per grid cell)
K (nitrogen per grid cell) = waterborne emissions of nitrogen to the environment by area
Domestic and industrial water use DIWU SWUPC= × Population
SWUPC = sectoral water use per capita (domestic and industrial)
For manufacturing and mining (ISIC 2-33, 41-43), households and other industries (ISIC 38, 39, 45-99).
E.1 = abstraction of water from inland water resources
G.1 = water received from other economic units
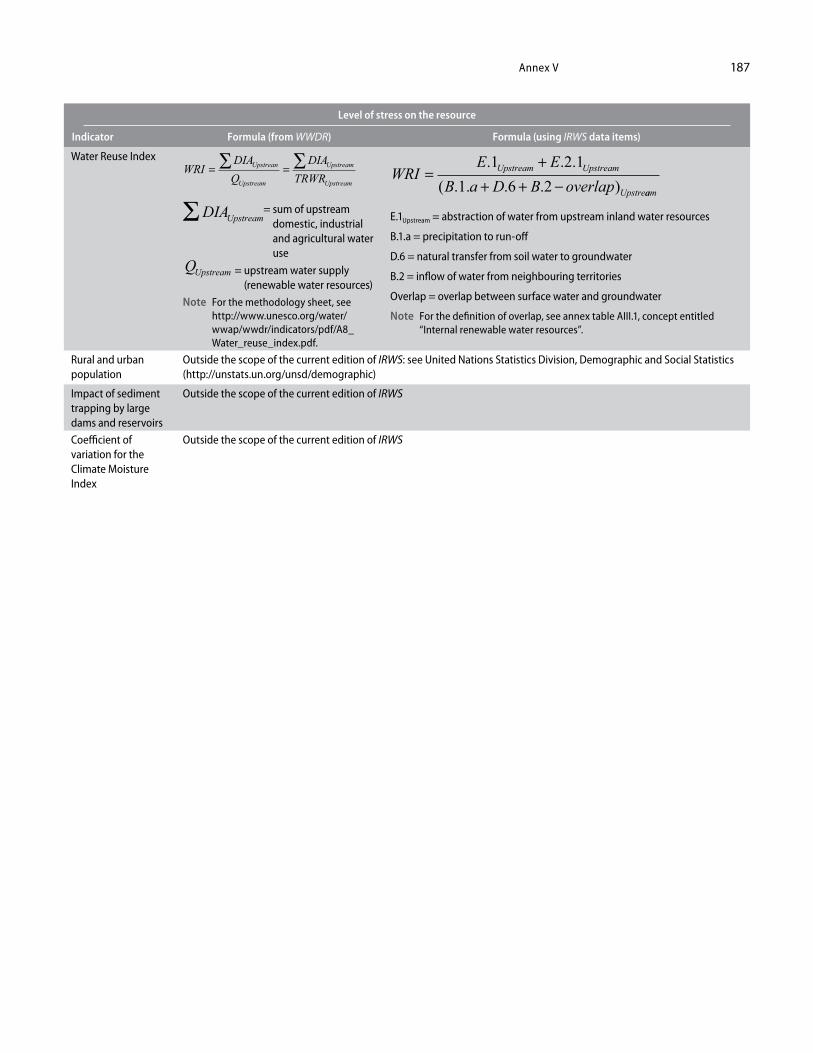
Annex V 187
Level of stress on the resource
Indicator Formula (from WWDR) Formula (using IRWS data items)
Water Reuse IndexWRI
DIAQ
DIATRWR
Upstrean
Upstream
Upstream
Upstream
= =∑ ∑
DIAUpstreamΣ = sum of upstream domestic, industrial and agricultural water use
QUpstream = upstream water supply (renewable water resources)
Note For the methodology sheet, see http://www.unesco.org/water/wwap/wwdr/indicators/pdf/A8_ Water_reuse_index.pdf.
WRIE E
B a D B overlapUpstream Upstream
Upstre
=+
+ + −. . .
( . . . . )1 2 1
1 6 2 aam
E.1Upstream = abstraction of water from upstream inland water resources
B.1.a = precipitation to run-off
D.6 = natural transfer from soil water to groundwater
B.2 = inflow of water from neighbouring territories
Overlap = overlap between surface water and groundwater
Note For the definition of overlap, see annex table AIII.1, concept entitled “Internal renewable water resources”.
Rural and urban population
Outside the scope of the current edition of IRWS: see United Nations Statistics Division, Demographic and Social Statistics (http://unstats.un.org/unsd/demographic)
Impact of sediment trapping by large dams and reservoirs
Outside the scope of the current edition of IRWS
Coefficient of variation for the Climate Moisture Index
Outside the scope of the current edition of IRWS
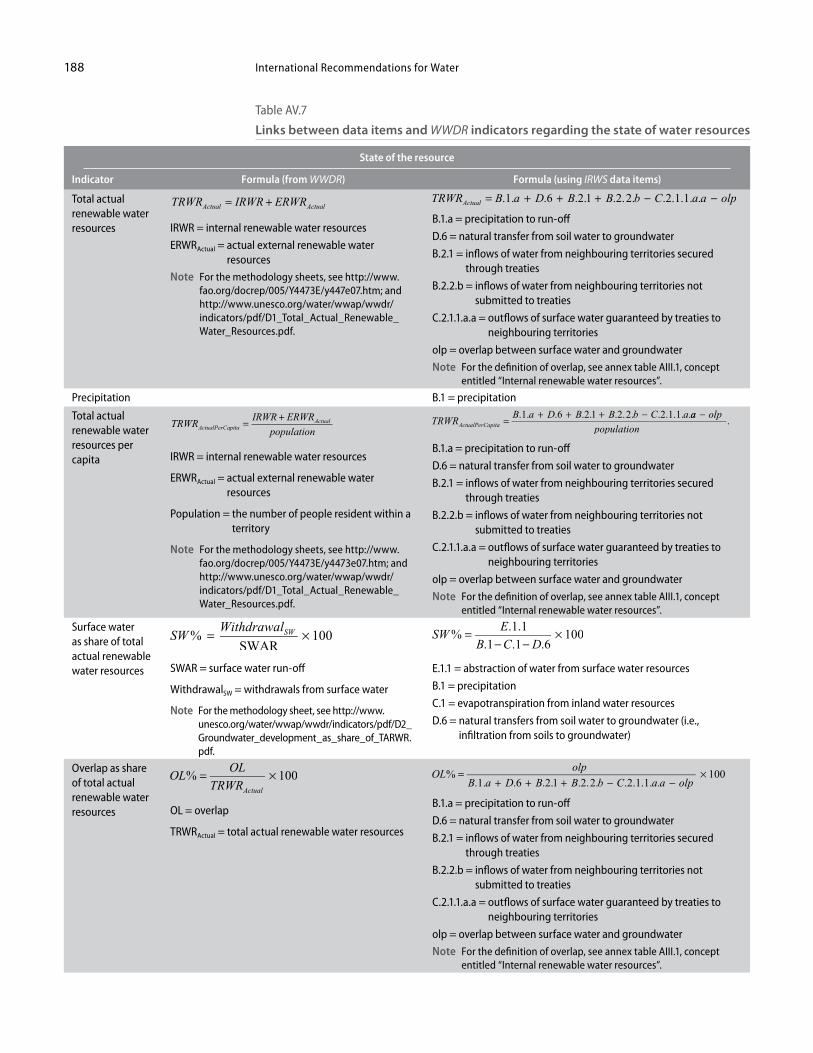
International Recommendations for Water188
Table AV.7
Links between data items and WWDR indicators regarding the state of water resources
State of the resource
Indicator Formula (from WWDR) Formula (using IRWS data items)
Total actual renewable water resources
TRWR IRWR ERWRActual Actual= +
IRWR = internal renewable water resources
ERWRActual = actual external renewable water resources
Note For the methodology sheets, see http://www.fao.org/docrep/005/Y4473E/y447e07.htm; and http://www.unesco.org/water/wwap/wwdr/indicators/pdf/D1_Total_Actual_Renewable_ Water_Resources.pdf.
B.1.a = precipitation to run-off
D.6 = natural transfer from soil water to groundwater
B.2.1 = inflows of water from neighbouring territories secured through treaties
B.2.2.b = inflows of water from neighbouring territories not submitted to treaties
C.2.1.1.a.a = outflows of surface water guaranteed by treaties to neighbouring territories
olp = overlap between surface water and groundwater
Note For the definition of overlap, see annex table AIII.1, concept entitled “Internal renewable water resources”.
Precipitation B.1 = precipitation
Total actual renewable water resources per capita
TRWR IRWR ERWRpopulationActualPerCapita
Actual= +
IRWR = internal renewable water resources
ERWRActual = actual external renewable water resources
Population = the number of people resident within a territory
Note For the methodology sheets, see http://www.fao.org/docrep/005/Y4473E/y4473e07.htm; and http://www.unesco.org/water/wwap/wwdr/ indicators/pdf/D1_Total_Actual_Renewable_ Water_Resources.pdf.
B.1.a = precipitation to run-off
D.6 = natural transfer from soil water to groundwater
B.2.1 = inflows of water from neighbouring territories secured through treaties
B.2.2.b = inflows of water from neighbouring territories not submitted to treaties
C.2.1.1.a.a = outflows of surface water guaranteed by treaties to neighbouring territories
olp = overlap between surface water and groundwater
Note For the definition of overlap, see annex table AIII.1, concept entitled “Internal renewable water resources”.
Surface water as share of total actual renewable water resources SWAR = surface water run-off
WithdrawalSW = withdrawals from surface water
Note For the methodology sheet, see http://www.unesco.org/water/wwap/wwdr/indicators/pdf/D2_ Groundwater_development_as_share_of_TARWR.pdf.
E.1.1 = abstraction of water from surface water resources
B.1 = precipitation
C.1 = evapotranspiration from inland water resources
D.6 = natural transfers from soil water to groundwater (i.e., infiltration from soils to groundwater)
Overlap as share of total actual renewable water resources OL = overlap
TRWRActual = total actual renewable water resources
B.1.a = precipitation to run-off
D.6 = natural transfer from soil water to groundwater
B.2.1 = inflows of water from neighbouring territories secured through treaties
B.2.2.b = inflows of water from neighbouring territories not submitted to treaties
C.2.1.1.a.a = outflows of surface water guaranteed by treaties to neighbouring territories
olp = overlap between surface water and groundwater
Note For the definition of overlap, see annex table AIII.1, concept entitled “Internal renewable water resources”.
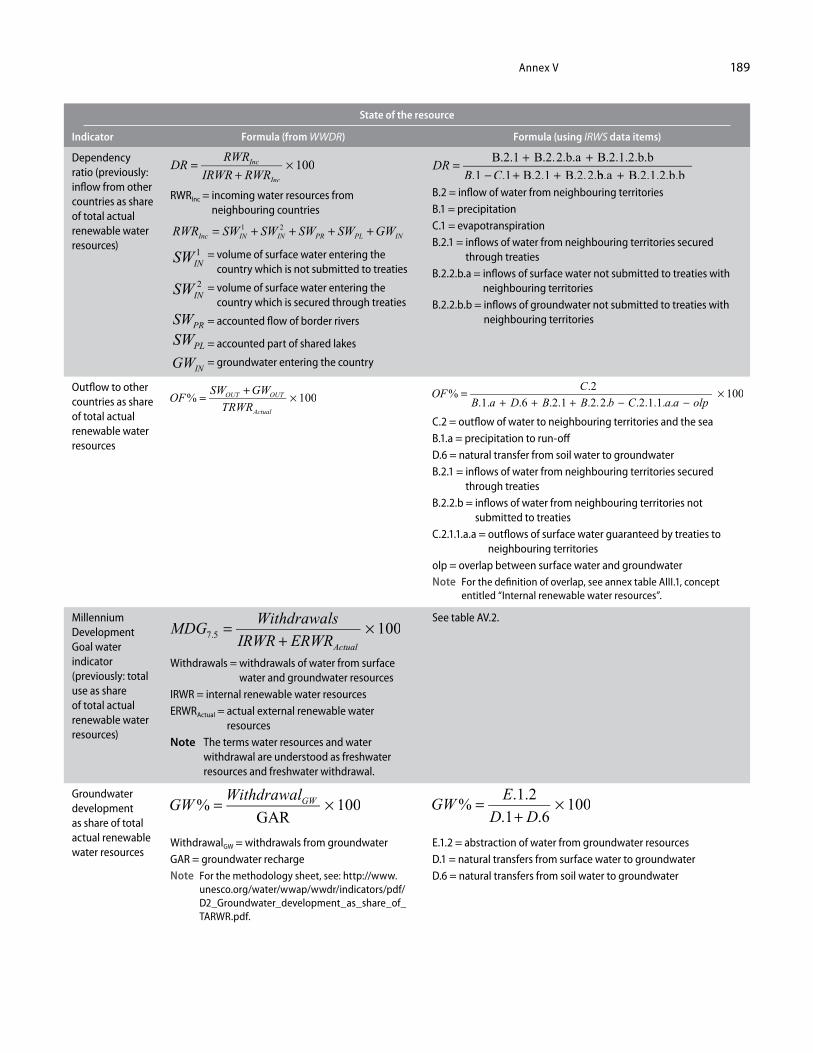
Annex V 189
State of the resource
Indicator Formula (from WWDR) Formula (using IRWS data items)
Dependency ratio (previously: inflow from other countries as share of total actual renewable water resources)
RWRInc = incoming water resources from neighbouring countries
RWR SW SW SW SW GWInc IN IN PR PL IN= + + + +1 2
SWIN1
= volume of surface water entering the
country which is not submitted to treaties
SWIN2 = volume of surface water entering the
country which is secured through treaties
SWPR = accounted flow of border rivers
SWPL = accounted part of shared lakes
GWIN = groundwater entering the country
B.2 = inflow of water from neighbouring territoriesB.1 = precipitationC.1 = evapotranspirationB.2.1 = inflows of water from neighbouring territories secured
through treatiesB.2.2.b.a = inflows of surface water not submitted to treaties with
neighbouring territoriesB.2.2.b.b = inflows of groundwater not submitted to treaties with
neighbouring territories
Outflow to other countries as share of total actual renewable water resources
C.2 = outflow of water to neighbouring territories and the seaB.1.a = precipitation to run-offD.6 = natural transfer from soil water to groundwaterB.2.1 = inflows of water from neighbouring territories secured
through treatiesB.2.2.b = inflows of water from neighbouring territories not
submitted to treatiesC.2.1.1.a.a = outflows of surface water guaranteed by treaties to
neighbouring territoriesolp = overlap between surface water and groundwater Note For the definition of overlap, see annex table AIII.1, concept
entitled “Internal renewable water resources”.
Millennium Development Goal water indicator (previously: total use as share of total actual renewable water resources)
Withdrawals = withdrawals of water from surface water and groundwater resources
IRWR = internal renewable water resourcesERWRActual = actual external renewable water
resourcesNote The terms water resources and water
withdrawal are understood as freshwater resources and freshwater withdrawal.
See table AV.2.
Groundwater development as share of total actual renewable water resources
WithdrawalGW = withdrawals from groundwaterGAR = groundwater rechargeNote For the methodology sheet, see: http://www.
unesco.org/water/wwap/wwdr/indicators/pdf/D2_Groundwater_development_as_share_of_TARWR.pdf.
E.1.2 = abstraction of water from groundwater resourcesD.1 = natural transfers from surface water to groundwaterD.6 = natural transfers from soil water to groundwater
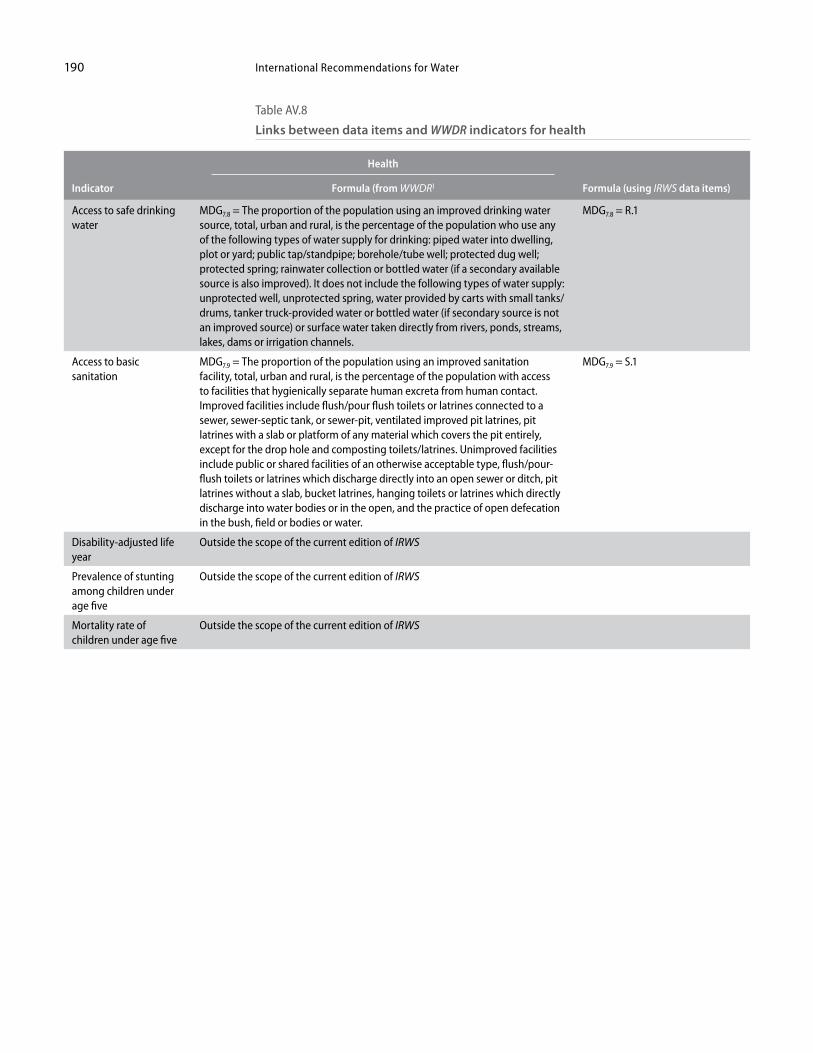
International Recommendations for Water190
Table AV.8
Links between data items and WWDR indicators for health
Health
Indicator Formula (from WWDR) Formula (using IRWS data items)
Access to safe drinking water
MDG7.8 = The proportion of the population using an improved drinking water source, total, urban and rural, is the percentage of the population who use any of the following types of water supply for drinking: piped water into dwelling, plot or yard; public tap/standpipe; borehole/tube well; protected dug well; protected spring; rainwater collection or bottled water (if a secondary available source is also improved). It does not include the following types of water supply: unprotected well, unprotected spring, water provided by carts with small tanks/drums, tanker truck-provided water or bottled water (if secondary source is not an improved source) or surface water taken directly from rivers, ponds, streams, lakes, dams or irrigation channels.
MDG7.8 = R.1
Access to basic sanitation
MDG7.9 = The proportion of the population using an improved sanitation facility, total, urban and rural, is the percentage of the population with access to facilities that hygienically separate human excreta from human contact. Improved facilities include flush/pour flush toilets or latrines connected to a sewer, sewer-septic tank, or sewer-pit, ventilated improved pit latrines, pit latrines with a slab or platform of any material which covers the pit entirely, except for the drop hole and composting toilets/latrines. Unimproved facilities include public or shared facilities of an otherwise acceptable type, flush/pour-flush toilets or latrines which discharge directly into an open sewer or ditch, pit latrines without a slab, bucket latrines, hanging toilets or latrines which directly discharge into water bodies or in the open, and the practice of open defecation in the bush, field or bodies or water.
MDG7.9 = S.1
Disability-adjusted life year
Outside the scope of the current edition of IRWS
Prevalence of stunting among children under age five
Outside the scope of the current edition of IRWS
Mortality rate of children under age five
Outside the scope of the current edition of IRWS
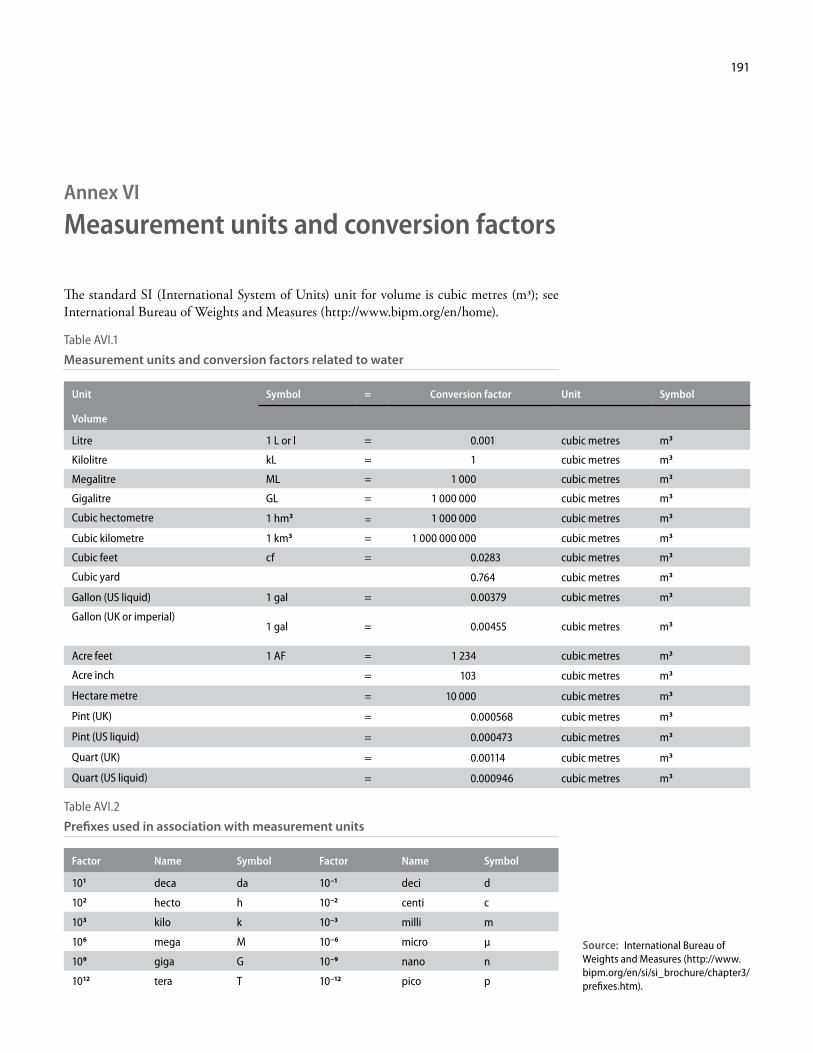
191
Annex VI
Measurement units and conversion factors
The standard SI (International System of Units) unit for volume is cubic metres (m3); see International Bureau of Weights and Measures (http://www.bipm.org/en/home).
Table AVI.1
Measurement units and conversion factors related to water
Unit Symbol = Conversion factor Unit Symbol
Volume
Litre 1 L or l = 0.001 cubic metres m3
Kilolitre kL = 1 cubic metres m3
Megalitre ML = 1 000 cubic metres m3
Gigalitre GL = 1 000 000 cubic metres m3
Cubic hectometre 1 hm3 = 1 000 000 cubic metres m3
Cubic kilometre 1 km3 = 1 000 000 000 cubic metres m3
Cubic feet cf = 0.0283 cubic metres m3
Cubic yard 0.764 cubic metres m3
Gallon (US liquid) 1 gal = 0.00379 cubic metres m3
Gallon (UK or imperial)1 gal = 0.00455 cubic metres m3
Acre feet 1 AF = 1 234 cubic metres m3
Acre inch = 103 cubic metres m3
Hectare metre = 10 000 cubic metres m3
Pint (UK) = 0.000568 cubic metres m3
Pint (US liquid) = 0.000473 cubic metres m3
Quart (UK) = 0.00114 cubic metres m3
Quart (US liquid) = 0.000946 cubic metres m3
Table AVI.2
Prefixes used in association with measurement units
Factor Name Symbol Factor Name Symbol
101 deca da 10−1 deci d
102 hecto h 10−2 centi c
103 kilo k 10−3 milli m
106 mega M 10−6 micro µ
109 giga G 10−9 nano n
1012 tera T 10−12 pico p
Source: International Bureau of Weights and Measures (http://www.bipm.org/en/si/si_brochure/chapter3/prefixes.htm).

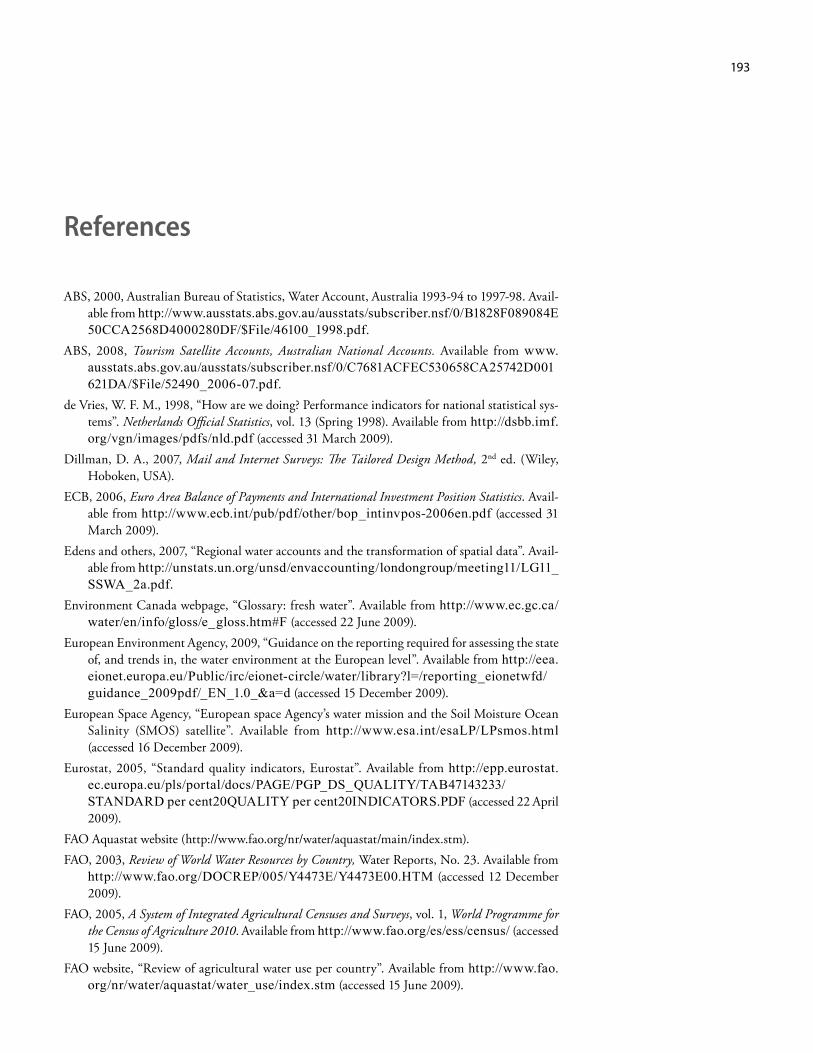
193
References
ABS, 2000, Australian Bureau of Statistics, Water Account, Australia 1993-94 to 1997-98. Avail-able from http://www.ausstats.abs.gov.au/ausstats/subscriber.nsf/0/B1828F089084E50CCA2568D4000280DF/$File/46100_1998.pdf.
ABS, 2008, Tourism Satellite Accounts, Australian National Accounts. Available from www. ausstats.abs.gov.au/ausstats/subscriber.nsf/0/C7681ACFEC530658CA25742D001621DA/$File/52490_2006-07.pdf.
de Vries, W. F. M., 1998, “How are we doing? Performance indicators for national statistical sys-tems”. Netherlands Official Statistics, vol. 13 (Spring 1998). Available from http://dsbb.imf.org/vgn/images/pdfs/nld.pdf (accessed 31 March 2009).
Dillman, D. A., 2007, Mail and Internet Surveys: The Tailored Design Method, 2nd ed. (Wiley, Hoboken, USA).
ECB, 2006, Euro Area Balance of Payments and International Investment Position Statistics. Avail-able from http://www.ecb.int/pub/pdf/other/bop_intinvpos-2006en.pdf (accessed 31 March 2009).
Edens and others, 2007, “Regional water accounts and the transformation of spatial data”. Avail-able from http://unstats.un.org/unsd/envaccounting/londongroup/meeting11/LG11_SSWA_2a.pdf.
Environment Canada webpage, “Glossary: fresh water”. Available from http://www.ec.gc.ca/water/en/info/gloss/e_gloss.htm#F (accessed 22 June 2009).
European Environment Agency, 2009, “Guidance on the reporting required for assessing the state of, and trends in, the water environment at the European level”. Available from http://eea.eionet.europa.eu/Public/irc/eionet-circle/water/library?l=/reporting_eionetwfd/guidance_2009pdf/_EN_1.0_&a=d (accessed 15 December 2009).
European Space Agency, “European space Agency’s water mission and the Soil Moisture Ocean Salinity (SMOS) satellite”. Available from http://www.esa.int/esaLP/LPsmos.html (accessed 16 December 2009).
Eurostat, 2005, “Standard quality indicators, Eurostat”. Available from http://epp. eurostat.ec.europa.eu/pls/portal/docs/PAGE/PGP_DS_QUALITY/TAB47143233/ STANDARD per cent20QUALITY per cent20INDICATORS.PDF (accessed 22 April 2009).
FAO Aquastat website (http://www.fao.org/nr/water/aquastat/main/index.stm). FAO, 2003, Review of World Water Resources by Country, Water Reports, No. 23. Available from
http://www.fao.org/DOCREP/005/Y4473E/Y4473E00.HTM (accessed 12 December 2009).
FAO, 2005, A System of Integrated Agricultural Censuses and Surveys, vol. 1, World Programme for the Census of Agriculture 2010. Available from http://www.fao.org/es/ess/census/ (accessed 15 June 2009).
FAO website, “Review of agricultural water use per country”. Available from http://www.fao.org/nr/water/aquastat/water_use/index.stm (accessed 15 June 2009).
International Recommendations for Water194
Fellegi, I. P., and J. Ryten, 2000, A Peer Review of the Swiss Statistical System (Swiss Federal Statisti-cal Office). Available from http://www.bfs.admin.ch/bfs/portal/en/index/ institutionen/oeffentliche_statistik/bundesstatistik/entwicklungen__trends/peer_review.parsys.0005.downloadList.00051.DownloadFile.tmp/peerreviewe.pdf (accessed 31 March 2009).
GLAAS, 2008, Global Annual Assessment of Sanitation and Drinking Water. Available from http://www.unwater.org./downloads/GLAAS_2008_Pilot_Report.pdf (accessed 22 June 2009).
Global Earth Observation System of Systems (GEOSS). Available from http://www. earthobservations.org/ (accessed 5 January 2010).
GWP, 2008, “Developing and managing river basins: the need for adaptive, multilevel, collabora-tive institutional arrangements”. Available from http://www.gwpforum.org/gwp/library/River per cent20basins_Brief per cent20IWMI_GWP.pdf.
GWP, 2004, Catalyzing Change: A handbook for developing integrated water resources management (IWRM) and water efficiency strategies, section entitled “Institutional roles”. Available from http://www.gwpforum.org/servlet/PSP?iNodeID=215&itemId=496.
International Benchmarking Network for Water and Sanitation Utilities (IB-NET). Available from http://www.ib-net.org/ (accessed 16 June 2009).
International Statistical Institute, “The Oxford Dictionary of Statistical Terms”, edited by Yadolah Dodge (Oxford University Press, 2003).
INSPIRE, Drafting Team, “Data specifications”, 2008. Available from http://inspire.jrc.ec.europa.eu/reports/ImplementingRules/DataSpecifications/D2.3_Definition_of_Annex_Themes_and_scope_v3.0.pdf (accessed 18 March 2008).
INSPIRE, Thematic WG Hydrography, 2009. Available from http://inspire.jrc.ec.europa.eu/documents/Data_Specifications/INSPIRE_DataSpecification_HY_v3.0.pdf (accessed 9 July 2009).
Nagy and others, 2009, “Water in artificial reservoirs: a produced asset?” Available from http://unstats.un.org/unsd/envaccounting/londongroup/meeting14/LG14_13a.pdf (accessed 22 June 2009).
National Snow and Ice Data Center webpage. Available from http://nsidc.org/glaciers/ questions/types.html (accessed 19 May 2009).
OECD 2003, Quality Framework for OECD Statistical Activities, Version 2003/1. Available from http://www.oecd.org/document/43/0,3343,en_2649_33715_21571947_1_1_1_1,00.html (accessed 9 December 2010).
OECD, Glossary of Statistical Terms. Available from http://stats.oecd.org/glossary/ (accessed 15 June 2009).
OECD website (http://www.oecd.org/topicstatsportal/0,3398,en_2825_495628_1_1_1_1_1,00.html) and Eurostat datasets and EU agency data (available from http://water.europa.eu/).
OECD/Eurostat, 2006, Joint Questionnaire on the State of the Environment: Inland Waters.
Oxford English Dictionary. Available from http://www.askoxford.com/concise_oed/society?view=uk.
Ramsar Convention Secretariat, 2006, The Ramsar Convention Manual: a guide to the Convention on Wetlands
(Ramsar, Islamic Republic of Iran, 1971), 4th ed., Ramsar Convention Secretariat, Gland, Switzer-land. Available from http://www.ramsar.org/lib/lib_manual2006e.htm#cap1 (accessed 19 May 2009).
Report of the Committee of Experts on Environmental-Economic Accounting (E/CN.3/2007/9).
References 195
SDMX, 2008, Metadata Common Vocabulary. Available from http://sdmx.org/wp-content/uploads/2008/02/sdmx_annex4_metadata_common_vocabulary_draft_febru-ary_2008.doc (accessed 15 June 2009).
SDMX webpage, Statistical Data and Metadata Exchange. Available from http://www.sdmx.org/ (accessed 22 June 2009).
SNA, 2008, System of National Accounts 2008. Available from http://unstats.un.org/unsd/sna1993/draftingPhase/WC-SNAvolume1.pdf (accessed 22 June 2009).
Statistics Canada, 2003, Statistics Canada Quality Guidelines 2003, available from http://www.statcan.gc.ca/pub/12-539-x/index-eng.htm (accessed 27 May 2009); and Statistics Canada website, Statistics Power from Data, available from http://www.statcan.gc.ca/edu/power-pouvoir/ch2/questionnaires/5214775-eng.htm (accessed 25 May 2009).
Statistics Canada, 2003, Standard Drainage Area Classification (SDAC) 2003. Available from http://www.statcan.gc.ca/subjects-sujets/standard-norme/sdac-ctad/sdac-ctad-eng.htm (accessed 20 December 2009).
Statistics Canada website, Statistics: Power from Data. Available from http://www.statcan.gc.ca/edu/power-pouvoir/toc-tdm/5214718-eng.htm (accessed 15 June 2009).
Thaunoo-Chadee, P., and S. Sham-Jacmohum, 2007, Status of Environment Statistics in Mau-ritius: Country Report. Available from http://unstats.un.org/unsd/environment/envpdf/UNSD_UNEP_ECA per cent20Workshop/Mauritius.pdf (accessed 4 January 2010).
United Nations, 2008, 2008 Millennium Development Assessment Report. Available from http://www.wssinfo.org/en/40_MDG2008.html).
United Nations, Department of Economic and Social Affairs, Division for Sustainable Develop-ment webpage, Water (http://www.un.org/esa/dsd/dsd_aofw_wat/wat_index.shtml (accessed 18 June 2009)).
UNDP, 2006, Human Development Report 2006: Beyond scarcity: Power, poverty and the global water crisis. Available from http://hdr.undp.org/en/reports/global/hdr2006/ (accessed 18 June 2009).
UNESCO/WMO, 1992, International Glossary of Hydrology, 2nd ed. Available from http:// webworld.unesco.org/water/ihp/db/glossary/glu/aglu.htm (accessed 22 June 2009).
UNICEF/WHO Joint Monitoring Programme, 2005, Multiple Indicator Cluster Survey 3 (MICS3) Manual. Available from http://www.childinfo.org/mics3_manual.html (accessed 15 June 2009).
United Nations Statistics Division, 2008, International Recommendations for Industrial Statistics, 2008. Available from http://unstats.un.org/unsd/industry/docs/M90.pdf (accessed 14 June 2009).
United Nations Statistics Division, 2008, Principles and Recommendations for Population and Housing Censuses, Revision 2. Available from http://unstats.un.org/unsd/demographic/sources/census/docs/P&R_Rev2.pdf.
United Nations Statistics Division webpage, MDG indicators (http://mdgs.un.org/unsd/mdg/Default.aspx (accessed 22 June 2009)).
United Nations Statistics Division webpage, “Statistics and indicators for women and men” (http://unstats.un.org/unsd/demographic/products/indwm/default.htm (accessed 22 June 2009)).
United Nations Statistics Division webpage, definition of MDG targets and indicators (http://mdgs.un.org/unsd/mdg/Metadata.aspx (accessed 22 June 2009)).
United Nations Statistics Division webpage, searchable archive. Available from http://unstats.un.org/unsd/envaccounting/ceea/archive/Introduction.asp.
International Recommendations for Water196
United Nations Statistics Division website, “Data collection”. Available from http://unstats.un.org/unsd/environment/datacollect.htm (accessed 22 June 2009).
United Nations Statistics Division, 1950, The Preparation of Sampling Survey Reports. Avail-able from http://unstats.un.org/unsd/publication/SeriesC/SeriesC_1_revised.pdf (accessed 15 June 2009) .
United Nations Statistics Division, 1994, Strategies for Measuring Industrial Structure and Growth. Available from http://unstats.un.org/unsd/publication/SeriesF/SeriesF_65E.pdf (accessed 15 June 2009).
United Nations Statistics Division, 2003, Handbook of Statistical Organization, 3rd ed., The Opera-tion and Organization of a Statistical Agency.
United Nations Statistics Division, 2007, Statistical Units. Available from http://unstats.un.org/unsd/isdts/docs/StatisticalUnits.pdf (accessed 22 June 2009).
United Nations Statistics Division, 2007, System of Integrated Environmental and Economic Accounts for Water 2008. Available from http://unstats.un.org/unsd/envaccounting/SEEA-WaterDraftManual.pdf (accessed 22 June 2009).
United Nations Statistics Division, 2008, International Recommendations for Industrial Statistics 2008. Available from http://unstats.un.org/unsd/industry/guidelines.asp (accessed 15 June 2009).
United Nations Statistics Division, 2008, Central Product Classification, Version 2 (CPC, Ver. 2). Available from http://unstats.un.org/unsd/cr/registry/cpc-2.asp (accessed 2 February 2012).
United Nations Statistics Division, 2008, Principles and Recommendations for Population and Housing Censuses, Revision 2. Available from http://unstats.un.org/unsd/demographic/sources/census/docs/P&R_Rev2.pdf (accessed 3 January 2009).
United Nations Statistics Division, 2008, International Standard Industrial Classification (ISIC) of all Economic Activities, Revision 4. Available from http://unstats.un.org/unsd/cr/registry/isic-4.asp (accessed 22 June 2009).
United Nations Statistics Division, 2012 (forthcoming), System of Integrated Environmental-Economic Accounts for Water (SEEA-Water). Available from http://unstats.un.org/unsd/envac-counting/seeaw/ (accessed 2 February 2012).
USGS webpage, “Saline water” (http://ga.water.usgs.gov/edu/saline.html (accessed 22 June 2009)).
USGS, 2007, Guidelines for Preparation of State Water-Use Estimates for 2005. Available from http://water.usgs.gov/watuse/.
USGS, webpage, Techniques of Water-Resources Investigations Reports. Available from http://pubs.usgs.gov/twri/ (accessed 15 June 2009).
USGS, webpage, USGS Handbook for Collecting Water-use Data (web pages) and Guidelines for Preparation of State Water-Use Estimates (2005 and 2000). Available from http://water.usgs.gov/watuse/ (accessed 15 June 2009).
Water Information System for Europe (WISE). Available from http://water.europa.eu/en/ welcome (accessed 12 December 2009).
WCO, webpage, The Harmonized Commodity Description and Coding System (HS) (http://www.wcoomd.org/home_online_services_hs_online.htm (accessed 22 June 2009)).
WHO, Water Sanitation and Health Project of WHO. Available from http://www.who.int/water_sanitation_health/diseases/en/index.html.
WHYCOS webpage, WHYCOS: Training Materials. Available from http://www.whycos.org/rubrique.php3?id_rubrique=65 (accessed 15 June 2009).
WMO webpage, Infohydro (http://www.wmo.ch/pages/prog/hwrp/INFOHYDRO/INFOApplication.html (accessed 16 May 2009)).
References 197
WMO, 2001, Exchange of Hydrological Data and Products. Available from http://www.wmo.ch/pages/prog/hwrp/documents/TD74.pdf (accessed 15 June 2009).
WMO, 2003, Hydrological Data Management: Present State and Trends. Available from http://www.whycos.org/IMG/pdf/964_E.pdf (accessed 15 June 2009).
WMO, 2006, Guidelines on the Role, Operation and Management of National Hydrological Ser-vices. Available from http://www.wmo.int/pages/prog/hwrp/documents/WMO%201003.pdf (accessed 15 June 2009).
WMO, 2008, Guide to Meteorological Instruments and Methods of Observation. Available from http://www.wmo.int/pages/prog/www/IMOP/publications/CIMO-Guide/CIMO_Guide-7th_Edition-2008.html (accessed 15 June 2009).
World Water Day webpage (http://www.worldwaterday.org/ (accessed 22 June 2009)).World Water Week. Available from http://www.worldwaterweek.org/worldwaterweek/
about.asp. WWAP, 2006, Second World Water Development Report: “Water: a shared responsibility”. Avail-
able from http://www.unesco.org/water/wwap/wwdr/index.shtml (accessed 22 June 2009).
WWAP, 2003, World Water Development Report: Water for People, Water for Life. Available from http://unesdoc.unesco.org/images/0012/001295/129556e.pdf (accessed 17 June 2009).
WWAP, 2009, World Water Development Report: Water in a Changing World (WWDR-3). Avail-able from http://www.unesco.org/water/wwap/wwdr/wwdr3/ (accessed 17 June 2009).